Hardin County, OH
Hardin County Map
Hardin County Overview
30,622
TOTAL POPULATION
15,312
MALE POPULATION
15,310
FEMALE POPULATION
100.01
MALES / 100 FEMALES
99.99
FEMALES / 100 MALES
35.6
MEDIAN AGE
3.0
AVG FAMILY SIZE
2.5
AVG HOUSEHOLD SIZE
$27,566
PER CAPITA INCOME
$69,626
AVG FAMILY INCOME
$55,876
AVG HOUSEHOLD INCOME
48.6%
WAGE / INCOME GAP [ % ]
51.4¢/ $1
WAGE / INCOME GAP [ $ ]
$13,168
FAMILY INCOME DEFICIT
0.42
INEQUALITY / GINI INDEX
14,584
LABOR FORCE [ PEOPLE ]
59.7%
PERCENT IN LABOR FORCE
4.7%
UNEMPLOYMENT RATE
Race in Hardin County
The most populous races in Hardin County are White / Caucasian (28,818 | 94.1%), Two or more Races (854 | 2.8%), and Hispanic or Latino (654 | 2.1%).

| Race | # Population | % Population |
| Asian | 260 | 0.9% |
| Black / African American | 363 | 1.2% |
| Hawaiian / Pacific | 11 | 0.0% |
| Hispanic or Latino | 654 | 2.1% |
| Native / Alaskan | 20 | 0.1% |
| White / Caucasian | 28,818 | 94.1% |
| Two or more Races | 854 | 2.8% |
| Some other Race | 296 | 1.0% |
| Total | 30,622 | 100.0% |
Ancestry in Hardin County
The most populous ancestries reported in Hardin County are German (7,857 | 25.7%), English (3,631 | 11.9%), Irish (3,365 | 11.0%), American (3,165 | 10.3%), and Italian (763 | 2.5%), together accounting for 61.3% of all Hardin County residents.

| Ancestry | # Population | % Population |
| African | 28 | 0.1% |
| American | 3,165 | 10.3% |
| Apache | 7 | 0.0% |
| Arab | 155 | 0.5% |
| Austrian | 11 | 0.0% |
| Belgian | 22 | 0.1% |
| Bhutanese | 12 | 0.0% |
| Blackfeet | 11 | 0.0% |
| British | 91 | 0.3% |
| Canadian | 4 | 0.0% |
| Central American | 21 | 0.1% |
| Central American Indian | 111 | 0.4% |
| Cherokee | 95 | 0.3% |
| Chippewa | 6 | 0.0% |
| Creek | 2 | 0.0% |
| Crow | 4 | 0.0% |
| Cuban | 24 | 0.1% |
| Czech | 45 | 0.2% |
| Czechoslovakian | 14 | 0.1% |
| Danish | 56 | 0.2% |
| Dutch | 729 | 2.4% |
| Eastern European | 66 | 0.2% |
| Ecuadorian | 7 | 0.0% |
| English | 3,631 | 11.9% |
| European | 350 | 1.1% |
| Filipino | 8 | 0.0% |
| Finnish | 27 | 0.1% |
| French | 400 | 1.3% |
| French Canadian | 55 | 0.2% |
| German | 7,857 | 25.7% |
| Greek | 13 | 0.0% |
| Hungarian | 92 | 0.3% |
| Indian (Asian) | 105 | 0.3% |
| Irish | 3,365 | 11.0% |
| Italian | 763 | 2.5% |
| Korean | 95 | 0.3% |
| Lebanese | 24 | 0.1% |
| Malaysian | 23 | 0.1% |
| Mexican | 444 | 1.5% |
| Mexican American Indian | 16 | 0.1% |
| Native Hawaiian | 16 | 0.1% |
| Northern European | 26 | 0.1% |
| Norwegian | 178 | 0.6% |
| Pakistani | 1 | 0.0% |
| Pennsylvania German | 62 | 0.2% |
| Peruvian | 29 | 0.1% |
| Polish | 173 | 0.6% |
| Potawatomi | 30 | 0.1% |
| Puerto Rican | 14 | 0.1% |
| Romanian | 50 | 0.2% |
| Russian | 46 | 0.2% |
| Salvadoran | 21 | 0.1% |
| Samoan | 5 | 0.0% |
| Scandinavian | 52 | 0.2% |
| Scotch-Irish | 250 | 0.8% |
| Scottish | 644 | 2.1% |
| Slavic | 7 | 0.0% |
| Slovak | 21 | 0.1% |
| Slovene | 16 | 0.1% |
| South American | 43 | 0.1% |
| Spaniard | 25 | 0.1% |
| Spanish | 40 | 0.1% |
| Sri Lankan | 12 | 0.0% |
| Subsaharan African | 28 | 0.1% |
| Swedish | 135 | 0.4% |
| Swiss | 245 | 0.8% |
| Thai | 88 | 0.3% |
| Trinidadian and Tobagonian | 5 | 0.0% |
| Turkish | 8 | 0.0% |
| Ukrainian | 57 | 0.2% |
| Venezuelan | 7 | 0.0% |
| Welsh | 540 | 1.8% | View All 72 Rows |
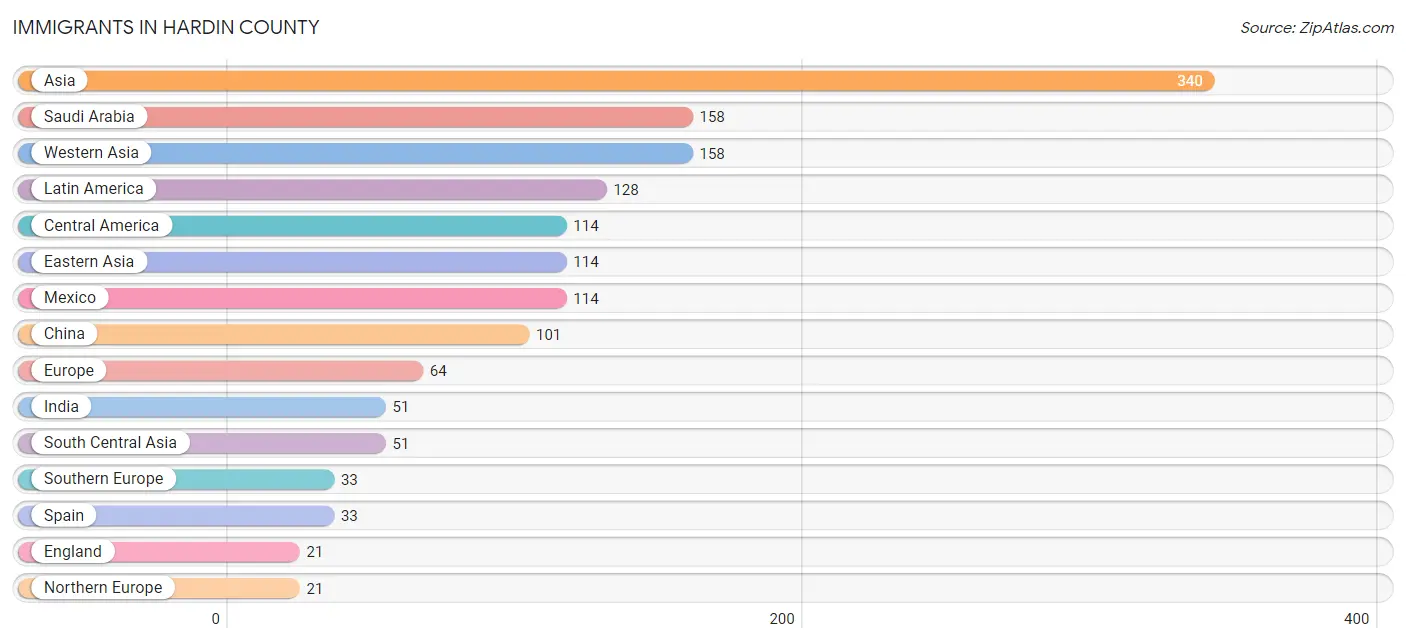
Immigrants in Hardin County
The most numerous immigrant groups reported in Hardin County came from Asia (340 | 1.1%), Saudi Arabia (158 | 0.5%), Western Asia (158 | 0.5%), Latin America (128 | 0.4%), and Central America (114 | 0.4%), together accounting for 2.9% of all Hardin County residents.
| Immigration Origin | # Population | % Population |
| Asia | 340 | 1.1% |
| Brazil | 1 | 0.0% |
| Canada | 5 | 0.0% |
| Caribbean | 5 | 0.0% |
| Central America | 114 | 0.4% |
| China | 101 | 0.3% |
| Eastern Asia | 114 | 0.4% |
| England | 21 | 0.1% |
| Europe | 64 | 0.2% |
| Germany | 10 | 0.0% |
| India | 51 | 0.2% |
| Japan | 13 | 0.0% |
| Latin America | 128 | 0.4% |
| Mexico | 114 | 0.4% |
| Northern Europe | 21 | 0.1% |
| Peru | 8 | 0.0% |
| Philippines | 16 | 0.1% |
| Saudi Arabia | 158 | 0.5% |
| South America | 9 | 0.0% |
| South Central Asia | 51 | 0.2% |
| South Eastern Asia | 17 | 0.1% |
| Southern Europe | 33 | 0.1% |
| Spain | 33 | 0.1% |
| Thailand | 1 | 0.0% |
| Trinidad and Tobago | 5 | 0.0% |
| Western Asia | 158 | 0.5% |
| Western Europe | 10 | 0.0% | View All 27 Rows |
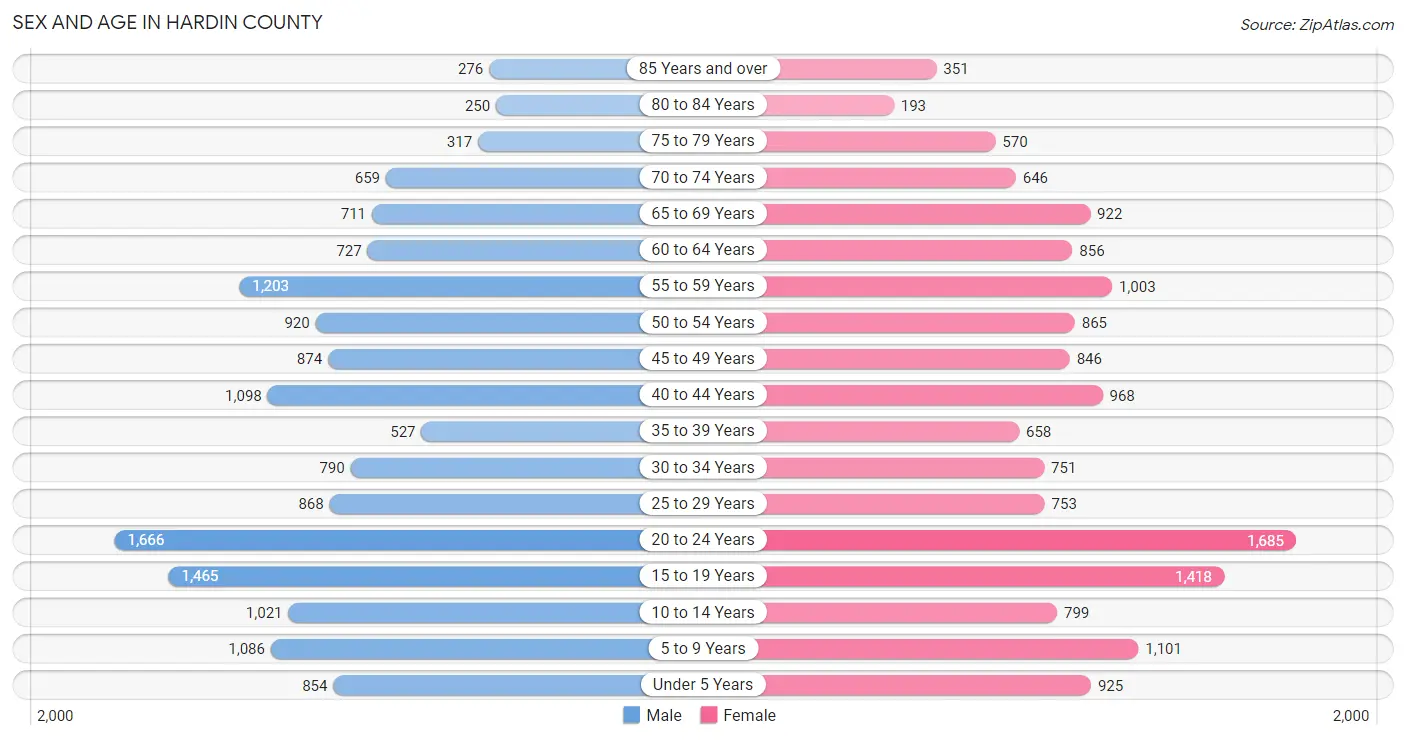
Sex and Age in Hardin County
Sex and Age in Hardin County
The most populous age groups in Hardin County are 20 to 24 Years (1,666 | 10.9%) for men and 20 to 24 Years (1,685 | 11.0%) for women.
| Age Bracket | Male | Female |
| Under 5 Years | 854 (5.6%) | 925 (6.0%) |
| 5 to 9 Years | 1,086 (7.1%) | 1,101 (7.2%) |
| 10 to 14 Years | 1,021 (6.7%) | 799 (5.2%) |
| 15 to 19 Years | 1,465 (9.6%) | 1,418 (9.3%) |
| 20 to 24 Years | 1,666 (10.9%) | 1,685 (11.0%) |
| 25 to 29 Years | 868 (5.7%) | 753 (4.9%) |
| 30 to 34 Years | 790 (5.2%) | 751 (4.9%) |
| 35 to 39 Years | 527 (3.4%) | 658 (4.3%) |
| 40 to 44 Years | 1,098 (7.2%) | 968 (6.3%) |
| 45 to 49 Years | 874 (5.7%) | 846 (5.5%) |
| 50 to 54 Years | 920 (6.0%) | 865 (5.7%) |
| 55 to 59 Years | 1,203 (7.9%) | 1,003 (6.6%) |
| 60 to 64 Years | 727 (4.8%) | 856 (5.6%) |
| 65 to 69 Years | 711 (4.6%) | 922 (6.0%) |
| 70 to 74 Years | 659 (4.3%) | 646 (4.2%) |
| 75 to 79 Years | 317 (2.1%) | 570 (3.7%) |
| 80 to 84 Years | 250 (1.6%) | 193 (1.3%) |
| 85 Years and over | 276 (1.8%) | 351 (2.3%) |
| Total | 15,312 (100.0%) | 15,310 (100.0%) |
Families and Households in Hardin County
Median Family Size in Hardin County
The median family size in Hardin County is 3.01 persons per family, with married-couple families (5,990 | 78.4%) accounting for the largest median family size of 3.1 persons per family. On the other hand, single male/father families (633 | 8.3%) represent the smallest median family size with 2.40 persons per family.

| Family Type | # Families | Family Size |
| Married-Couple | 5,990 (78.4%) | 3.10 |
| Single Male/Father | 633 (8.3%) | 2.40 |
| Single Female/Mother | 1,016 (13.3%) | 2.83 |
| Total Families | 7,639 (100.0%) | 3.01 |
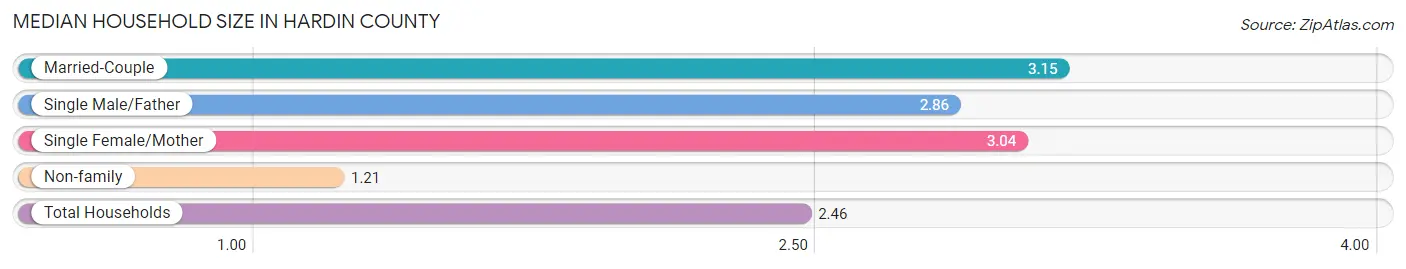
Median Household Size in Hardin County
The median household size in Hardin County is 2.46 persons per household, with married-couple households (5,990 | 51.5%) accounting for the largest median household size of 3.15 persons per household. non-family households (4,001 | 34.4%) represent the smallest median household size with 1.21 persons per household.
| Household Type | # Households | Household Size |
| Married-Couple | 5,990 (51.5%) | 3.15 |
| Single Male/Father | 633 (5.4%) | 2.86 |
| Single Female/Mother | 1,016 (8.7%) | 3.04 |
| Non-family | 4,001 (34.4%) | 1.21 |
| Total Households | 11,640 (100.0%) | 2.46 |
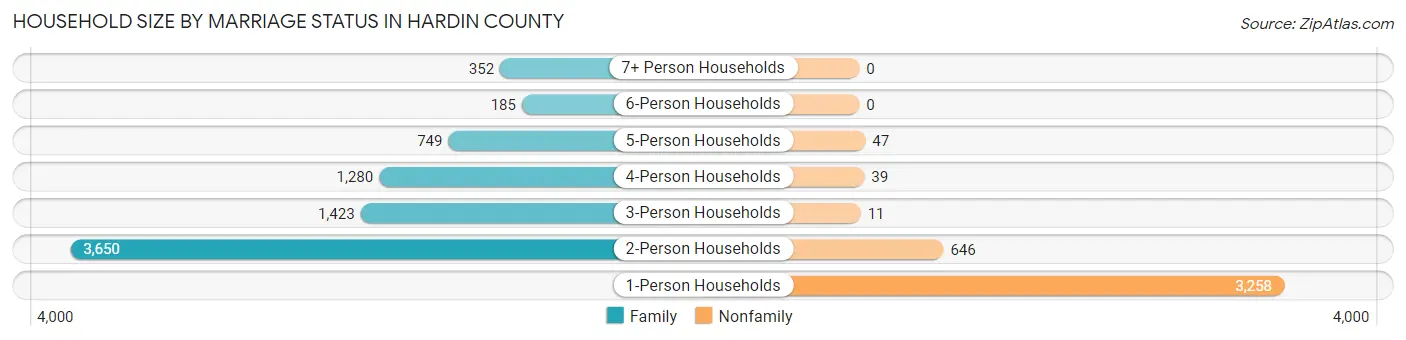
Household Size by Marriage Status in Hardin County
Out of a total of 11,640 households in Hardin County, 7,639 (65.6%) are family households, while 4,001 (34.4%) are nonfamily households. The most numerous type of family households are 2-person households, comprising 3,650, and the most common type of nonfamily households are 1-person households, comprising 3,258.
| Household Size | Family Households | Nonfamily Households |
| 1-Person Households | - | 3,258 (28.0%) |
| 2-Person Households | 3,650 (31.4%) | 646 (5.6%) |
| 3-Person Households | 1,423 (12.2%) | 11 (0.1%) |
| 4-Person Households | 1,280 (11.0%) | 39 (0.3%) |
| 5-Person Households | 749 (6.4%) | 47 (0.4%) |
| 6-Person Households | 185 (1.6%) | 0 (0.0%) |
| 7+ Person Households | 352 (3.0%) | 0 (0.0%) |
| Total | 7,639 (65.6%) | 4,001 (34.4%) |
Female Fertility in Hardin County
Fertility by Age in Hardin County
Average fertility rate in Hardin County is 63.0 births per 1,000 women. Women in the age bracket of 20 to 34 years have the highest fertility rate with 143.0 births per 1,000 women. Women in the age bracket of 20 to 34 years acount for 99.6% of all women with births.

| Age Bracket | Women with Births | Births / 1,000 Women |
| 15 to 19 years | 1 (0.2%) | 1.0 |
| 20 to 34 years | 457 (99.6%) | 143.0 |
| 35 to 50 years | 1 (0.2%) | 0.0 |
| Total | 459 (100.0%) | 63.0 |
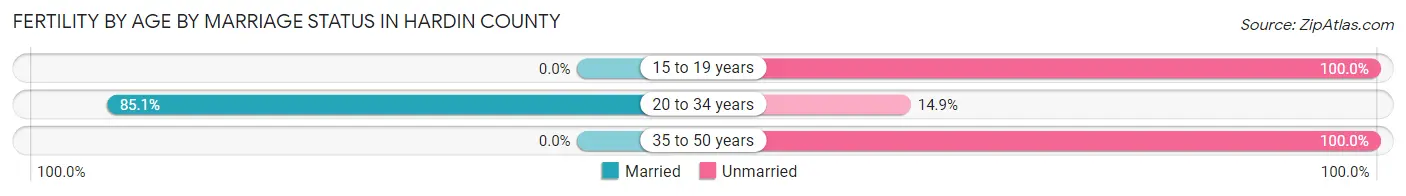
Fertility by Age by Marriage Status in Hardin County
84.7% of women with births (459) in Hardin County are married. The highest percentage of unmarried women with births falls into 15 to 19 years age bracket with 100.0% of them unmarried at the time of birth, while the lowest percentage of unmarried women with births belong to 20 to 34 years age bracket with 14.9% of them unmarried.
| Age Bracket | Married | Unmarried |
| 15 to 19 years | 0 (0.0%) | 1 (100.0%) |
| 20 to 34 years | 389 (85.1%) | 68 (14.9%) |
| 35 to 50 years | 0 (0.0%) | 1 (100.0%) |
| Total | 389 (84.8%) | 70 (15.2%) |
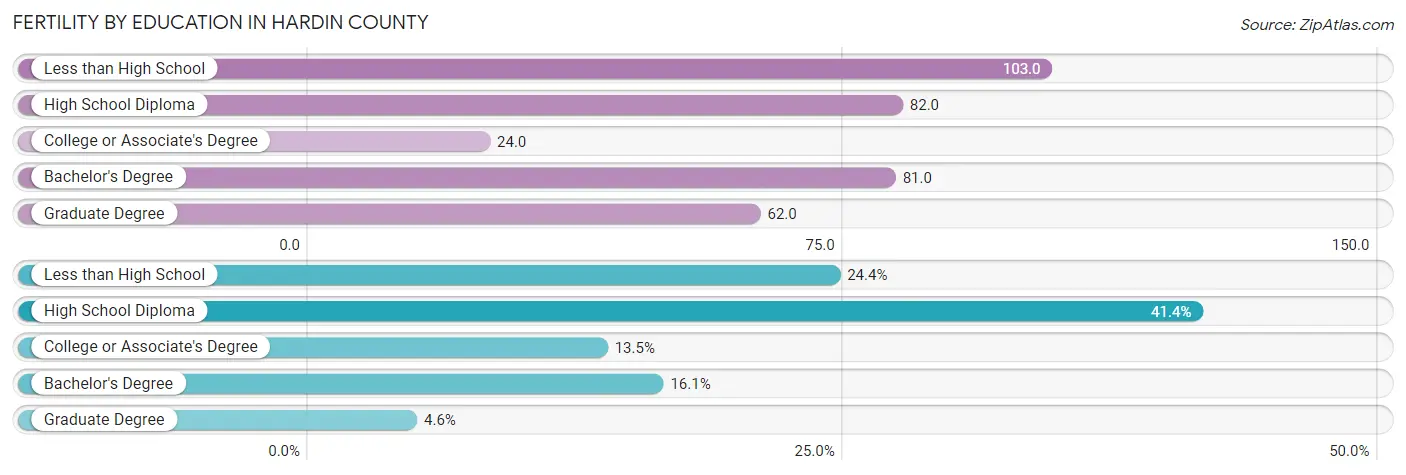
Fertility by Education in Hardin County
Average fertility rate in Hardin County is 63.0 births per 1,000 women. Women with the education attainment of less than high school have the highest fertility rate of 103.0 births per 1,000 women, while women with the education attainment of college or associate's degree have the lowest fertility at 24.0 births per 1,000 women. Women with the education attainment of high school diploma represent 41.4% of all women with births.
| Educational Attainment | Women with Births | Births / 1,000 Women |
| Less than High School | 112 (24.4%) | 103.0 |
| High School Diploma | 190 (41.4%) | 82.0 |
| College or Associate's Degree | 62 (13.5%) | 24.0 |
| Bachelor's Degree | 74 (16.1%) | 81.0 |
| Graduate Degree | 21 (4.6%) | 62.0 |
| Total | 459 (100.0%) | 63.0 |
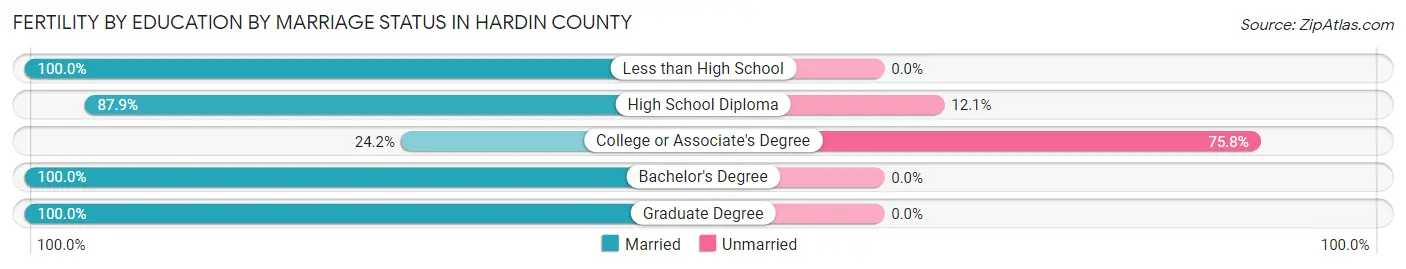
Fertility by Education by Marriage Status in Hardin County
15.2% of women with births in Hardin County are unmarried. Women with the educational attainment of less than high school are most likely to be married with 100.0% of them married at childbirth, while women with the educational attainment of college or associate's degree are least likely to be married with 75.8% of them unmarried at childbirth.
| Educational Attainment | Married | Unmarried |
| Less than High School | 112 (100.0%) | 0 (0.0%) |
| High School Diploma | 167 (87.9%) | 23 (12.1%) |
| College or Associate's Degree | 15 (24.2%) | 47 (75.8%) |
| Bachelor's Degree | 74 (100.0%) | 0 (0.0%) |
| Graduate Degree | 21 (100.0%) | 0 (0.0%) |
| Total | 389 (84.8%) | 70 (15.2%) |
Income in Hardin County
Income Overview in Hardin County
Per Capita Income in Hardin County is $27,566, while median incomes of families and households are $69,626 and $55,876 respectively.
| Characteristic | Number | Measure |
| Per Capita Income | 30,622 | $27,566 |
| Median Family Income | 7,639 | $69,626 |
| Mean Family Income | 7,639 | $82,613 |
| Median Household Income | 11,640 | $55,876 |
| Mean Household Income | 11,640 | $70,948 |
| Income Deficit | 7,639 | $13,168 |
| Wage / Income Gap (%) | 30,622 | 48.59% |
| Wage / Income Gap ($) | 30,622 | 51.41¢ per $1 |
| Gini / Inequality Index | 30,622 | 0.42 |
Earnings by Sex in Hardin County
Average Earnings in Hardin County are $33,088, $43,955 for men and $22,596 for women, a difference of 48.6%.
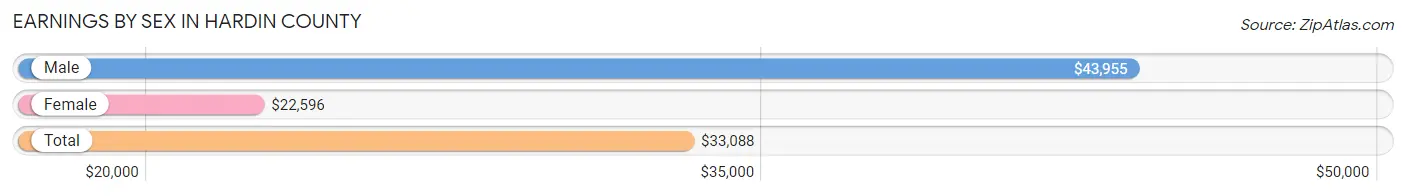
| Sex | Number | Average Earnings |
| Male | 8,531 (53.5%) | $43,955 |
| Female | 7,419 (46.5%) | $22,596 |
| Total | 15,950 (100.0%) | $33,088 |
Earnings by Sex by Income Bracket in Hardin County
The most common earnings brackets in Hardin County are $75,000 to $99,999 for men (1,075 | 12.6%) and $2,499 or less for women (752 | 10.1%).
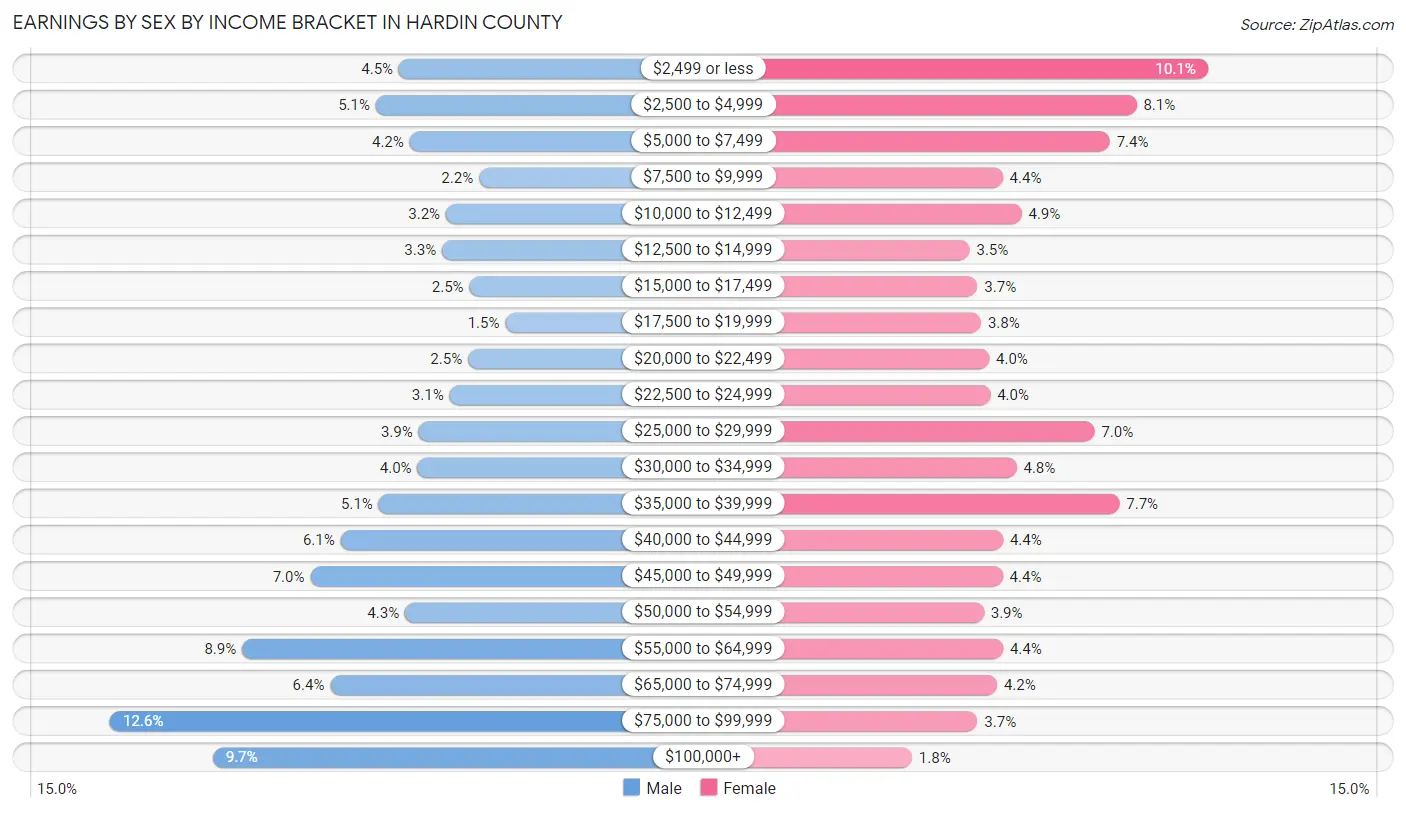
| Income | Male | Female |
| $2,499 or less | 382 (4.5%) | 752 (10.1%) |
| $2,500 to $4,999 | 438 (5.1%) | 604 (8.1%) |
| $5,000 to $7,499 | 357 (4.2%) | 548 (7.4%) |
| $7,500 to $9,999 | 190 (2.2%) | 325 (4.4%) |
| $10,000 to $12,499 | 270 (3.2%) | 364 (4.9%) |
| $12,500 to $14,999 | 279 (3.3%) | 256 (3.5%) |
| $15,000 to $17,499 | 213 (2.5%) | 272 (3.7%) |
| $17,500 to $19,999 | 127 (1.5%) | 280 (3.8%) |
| $20,000 to $22,499 | 217 (2.5%) | 297 (4.0%) |
| $22,500 to $24,999 | 261 (3.1%) | 299 (4.0%) |
| $25,000 to $29,999 | 335 (3.9%) | 516 (7.0%) |
| $30,000 to $34,999 | 338 (4.0%) | 354 (4.8%) |
| $35,000 to $39,999 | 431 (5.1%) | 568 (7.7%) |
| $40,000 to $44,999 | 522 (6.1%) | 326 (4.4%) |
| $45,000 to $49,999 | 595 (7.0%) | 325 (4.4%) |
| $50,000 to $54,999 | 368 (4.3%) | 286 (3.8%) |
| $55,000 to $64,999 | 758 (8.9%) | 326 (4.4%) |
| $65,000 to $74,999 | 547 (6.4%) | 313 (4.2%) |
| $75,000 to $99,999 | 1,075 (12.6%) | 272 (3.7%) |
| $100,000+ | 828 (9.7%) | 136 (1.8%) |
| Total | 8,531 (100.0%) | 7,419 (100.0%) |
Earnings by Sex by Educational Attainment in Hardin County
Average earnings in Hardin County are $50,287 for men and $29,910 for women, a difference of 40.5%. Men with an educational attainment of bachelor's degree enjoy the highest average annual earnings of $76,671, while those with less than high school education earn the least with $33,720. Women with an educational attainment of graduate degree earn the most with the average annual earnings of $66,048, while those with less than high school education have the smallest earnings of $24,167.
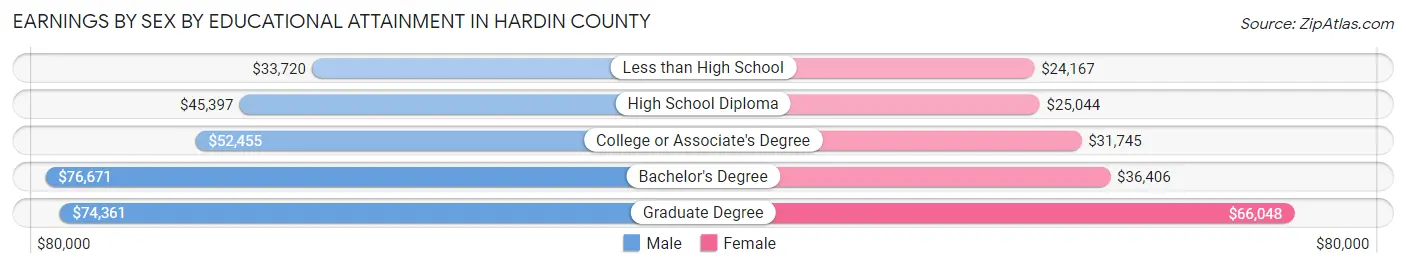
| Educational Attainment | Male Income | Female Income |
| Less than High School | $33,720 | $24,167 |
| High School Diploma | $45,397 | $25,044 |
| College or Associate's Degree | $52,455 | $31,745 |
| Bachelor's Degree | $76,671 | $36,406 |
| Graduate Degree | $74,361 | $66,048 |
| Total | $50,287 | $29,910 |
Family Income in Hardin County
Family Income Brackets in Hardin County
According to the Hardin County family income data, there are 1,597 families falling into the $50,000 to $74,999 income range, which is the most common income bracket and makes up 20.9% of all families. Conversely, the $10,000 to $14,999 income bracket is the least frequent group with only 122 families (1.6%) belonging to this category.

| Income Bracket | # Families | % Families |
| Less than $10,000 | 458 | 6.0% |
| $10,000 to $14,999 | 122 | 1.6% |
| $15,000 to $24,999 | 374 | 4.9% |
| $25,000 to $34,999 | 382 | 5.0% |
| $35,000 to $49,999 | 1,115 | 14.6% |
| $50,000 to $74,999 | 1,597 | 20.9% |
| $75,000 to $99,999 | 1,245 | 16.3% |
| $100,000 to $149,999 | 1,451 | 19.0% |
| $150,000 to $199,999 | 542 | 7.1% |
| $200,000+ | 359 | 4.7% |
Family Income by Famaliy Size in Hardin County
6-person families (124 | 1.6%) account for the highest median family income in Hardin County with $150,417 per family, while 3-person families (1,374 | 18.0%) have the highest median income of $30,577 per family member.
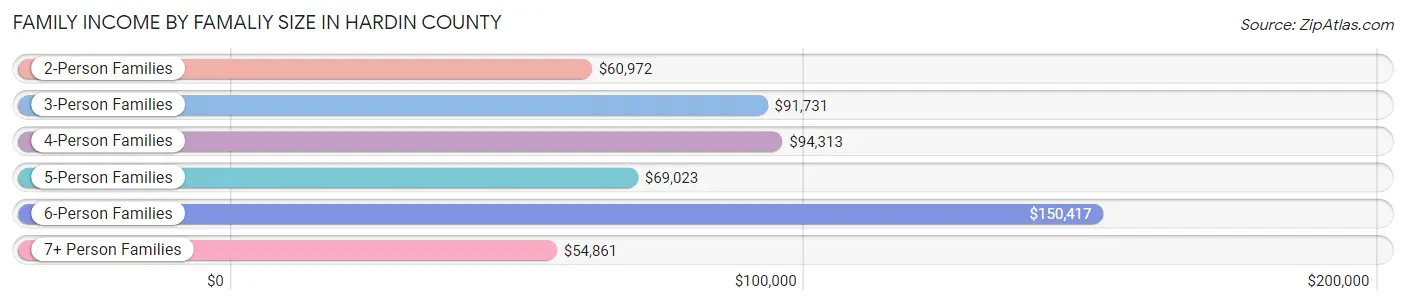
| Income Bracket | # Families | Median Income |
| 2-Person Families | 3,891 (50.9%) | $60,972 |
| 3-Person Families | 1,374 (18.0%) | $91,731 |
| 4-Person Families | 1,249 (16.4%) | $94,313 |
| 5-Person Families | 701 (9.2%) | $69,023 |
| 6-Person Families | 124 (1.6%) | $150,417 |
| 7+ Person Families | 300 (3.9%) | $54,861 |
| Total | 7,639 (100.0%) | $69,626 |
Family Income by Number of Earners in Hardin County
The median family income in Hardin County is $69,626, with families comprising 3+ earners (921) having the highest median family income of $129,281, while families with no earners (1,479) have the lowest median family income of $43,187, accounting for 12.1% and 19.4% of families, respectively.
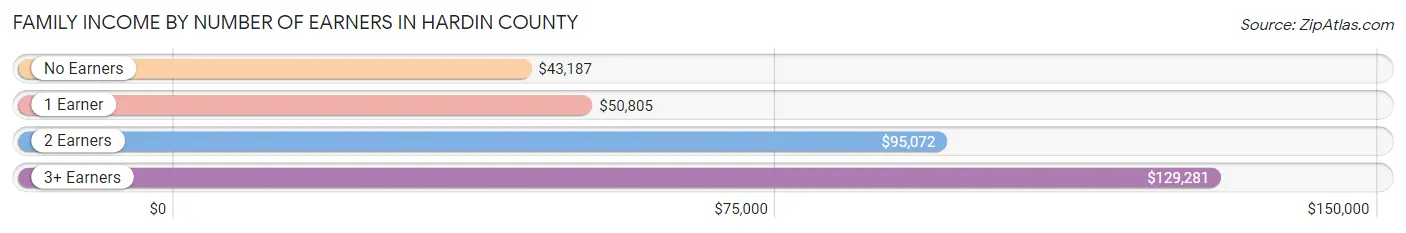
| Number of Earners | # Families | Median Income |
| No Earners | 1,479 (19.4%) | $43,187 |
| 1 Earner | 2,214 (29.0%) | $50,805 |
| 2 Earners | 3,025 (39.6%) | $95,072 |
| 3+ Earners | 921 (12.1%) | $129,281 |
| Total | 7,639 (100.0%) | $69,626 |
Household Income in Hardin County
Household Income Brackets in Hardin County
With 2,375 households falling in the category, the $50,000 to $74,999 income range is the most frequent in Hardin County, accounting for 20.4% of all households. In contrast, only 314 households (2.7%) fall into the $10,000 to $14,999 income bracket, making it the least populous group.

| Income Bracket | # Households | % Households |
| Less than $10,000 | 943 | 8.1% |
| $10,000 to $14,999 | 314 | 2.7% |
| $15,000 to $24,999 | 954 | 8.2% |
| $25,000 to $34,999 | 978 | 8.4% |
| $35,000 to $49,999 | 1,886 | 16.2% |
| $50,000 to $74,999 | 2,375 | 20.4% |
| $75,000 to $99,999 | 1,502 | 12.9% |
| $100,000 to $149,999 | 1,665 | 14.3% |
| $150,000 to $199,999 | 582 | 5.0% |
| $200,000+ | 442 | 3.8% |
Household Income by Householder Age in Hardin County
The median household income in Hardin County is $55,876, with the highest median household income of $68,648 found in the 45 to 64 years age bracket for the primary householder. A total of 4,181 households (35.9%) fall into this category. Meanwhile, the 65+ years age bracket for the primary householder has the lowest median household income of $43,215, with 3,201 households (27.5%) in this group.
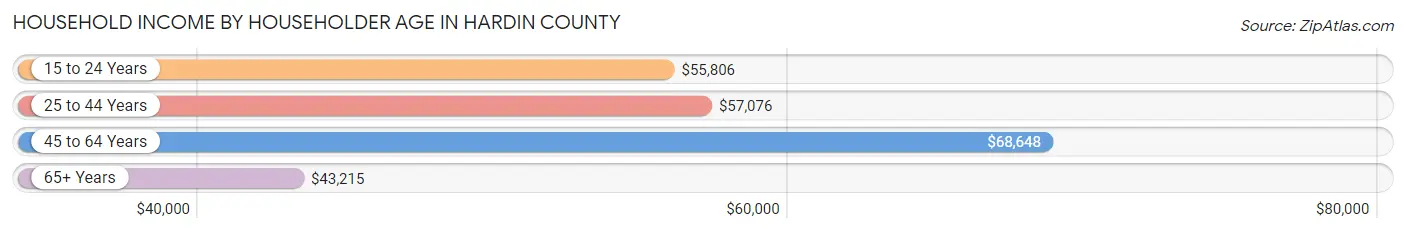
| Income Bracket | # Households | Median Income |
| 15 to 24 Years | 869 (7.5%) | $55,806 |
| 25 to 44 Years | 3,389 (29.1%) | $57,076 |
| 45 to 64 Years | 4,181 (35.9%) | $68,648 |
| 65+ Years | 3,201 (27.5%) | $43,215 |
| Total | 11,640 (100.0%) | $55,876 |
Poverty in Hardin County
Income Below Poverty by Sex and Age in Hardin County
With 14.4% poverty level for males and 22.0% for females among the residents of Hardin County, 6 to 11 year old males and under 5 year old females are the most vulnerable to poverty, with 319 males (28.7%) and 483 females (52.2%) in their respective age groups living below the poverty level.
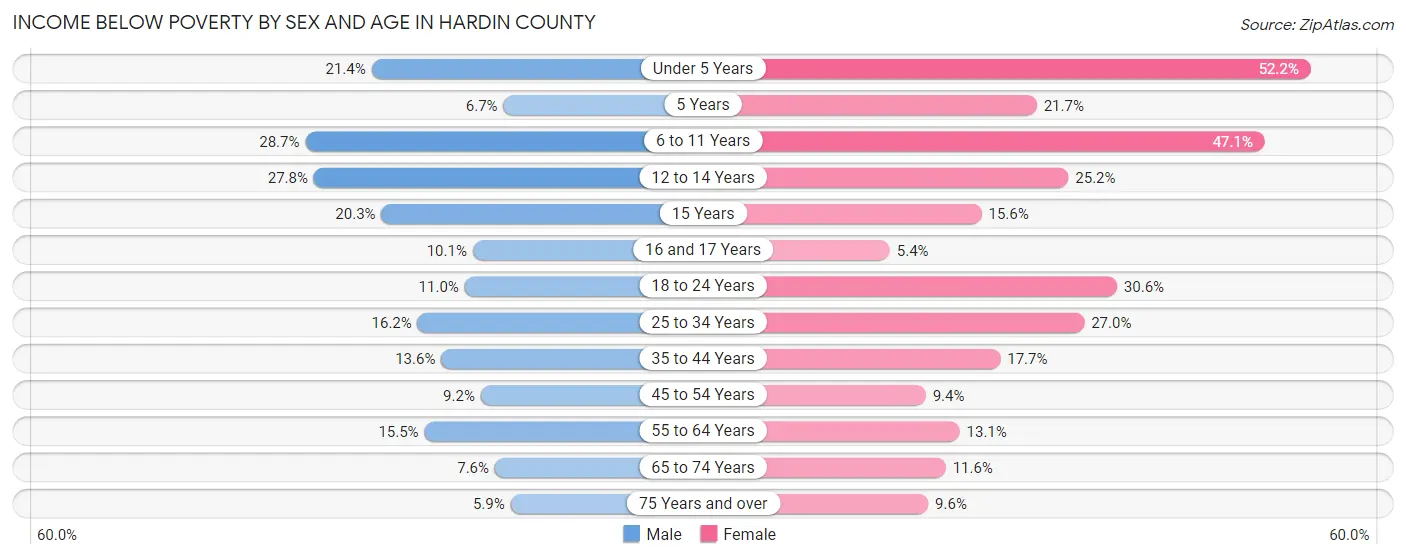
| Age Bracket | Male | Female |
| Under 5 Years | 182 (21.4%) | 483 (52.2%) |
| 5 Years | 13 (6.7%) | 33 (21.7%) |
| 6 to 11 Years | 319 (28.7%) | 592 (47.1%) |
| 12 to 14 Years | 167 (27.8%) | 81 (25.2%) |
| 15 Years | 46 (20.3%) | 28 (15.6%) |
| 16 and 17 Years | 46 (10.1%) | 19 (5.3%) |
| 18 to 24 Years | 190 (11.0%) | 467 (30.6%) |
| 25 to 34 Years | 267 (16.2%) | 402 (27.0%) |
| 35 to 44 Years | 221 (13.6%) | 287 (17.6%) |
| 45 to 54 Years | 165 (9.2%) | 160 (9.3%) |
| 55 to 64 Years | 296 (15.5%) | 239 (13.1%) |
| 65 to 74 Years | 103 (7.6%) | 179 (11.6%) |
| 75 Years and over | 49 (5.9%) | 100 (9.6%) |
| Total | 2,064 (14.4%) | 3,070 (22.0%) |
Income Above Poverty by Sex and Age in Hardin County
According to the poverty statistics in Hardin County, males aged 75 years and over and females aged 16 and 17 years are the age groups that are most secure financially, with 94.1% of males and 94.7% of females in these age groups living above the poverty line.
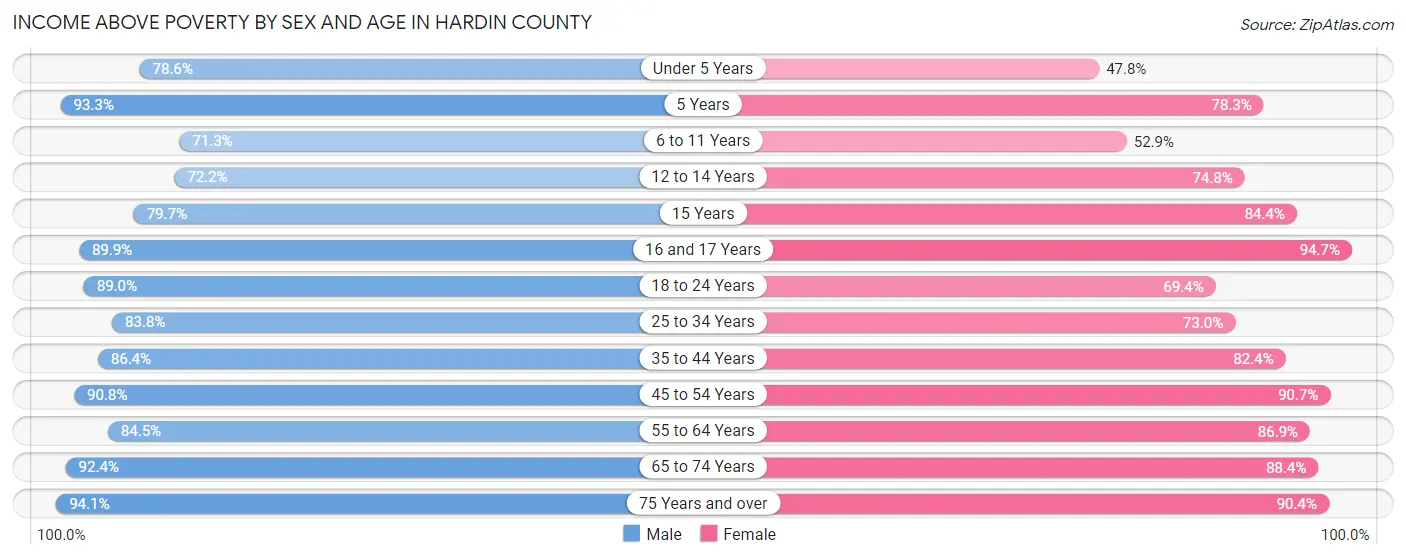
| Age Bracket | Male | Female |
| Under 5 Years | 670 (78.6%) | 442 (47.8%) |
| 5 Years | 182 (93.3%) | 119 (78.3%) |
| 6 to 11 Years | 791 (71.3%) | 665 (52.9%) |
| 12 to 14 Years | 434 (72.2%) | 240 (74.8%) |
| 15 Years | 181 (79.7%) | 152 (84.4%) |
| 16 and 17 Years | 410 (89.9%) | 336 (94.7%) |
| 18 to 24 Years | 1,539 (89.0%) | 1,057 (69.4%) |
| 25 to 34 Years | 1,378 (83.8%) | 1,087 (73.0%) |
| 35 to 44 Years | 1,404 (86.4%) | 1,339 (82.4%) |
| 45 to 54 Years | 1,629 (90.8%) | 1,551 (90.6%) |
| 55 to 64 Years | 1,617 (84.5%) | 1,583 (86.9%) |
| 65 to 74 Years | 1,247 (92.4%) | 1,368 (88.4%) |
| 75 Years and over | 784 (94.1%) | 939 (90.4%) |
| Total | 12,266 (85.6%) | 10,878 (78.0%) |
Income Below Poverty Among Married-Couple Families in Hardin County
The poverty statistics for married-couple families in Hardin County show that 7.3% or 435 of the total 5,990 families live below the poverty line. Families with 5 or more children have the highest poverty rate of 61.9%, comprising of 135 families. On the other hand, families with 1 or 2 children have the lowest poverty rate of 1.6%, which includes 24 families.
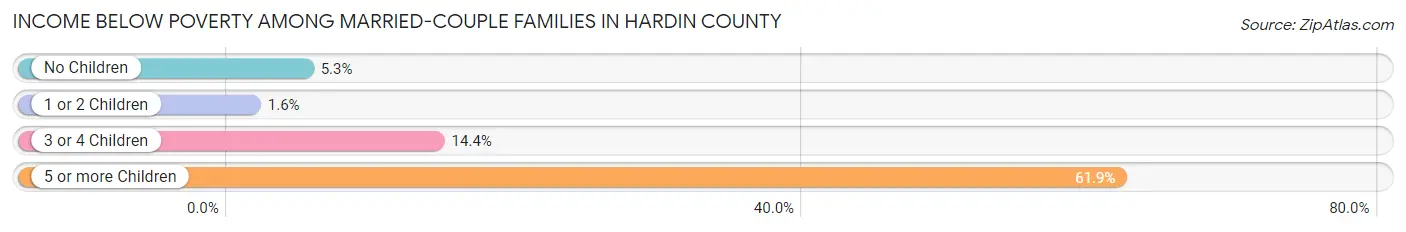
| Children | Above Poverty | Below Poverty |
| No Children | 3,506 (94.7%) | 195 (5.3%) |
| 1 or 2 Children | 1,484 (98.4%) | 24 (1.6%) |
| 3 or 4 Children | 482 (85.6%) | 81 (14.4%) |
| 5 or more Children | 83 (38.1%) | 135 (61.9%) |
| Total | 5,555 (92.7%) | 435 (7.3%) |
Income Below Poverty Among Single-Parent Households in Hardin County
According to the poverty data in Hardin County, 30.0% or 190 single-father households and 30.9% or 314 single-mother households are living below the poverty line. Among single-father households, those with no children have the highest poverty rate, with 89 households (50.6%) experiencing poverty. Likewise, among single-mother households, those with 3 or 4 children have the highest poverty rate, with 151 households (94.4%) falling below the poverty line.
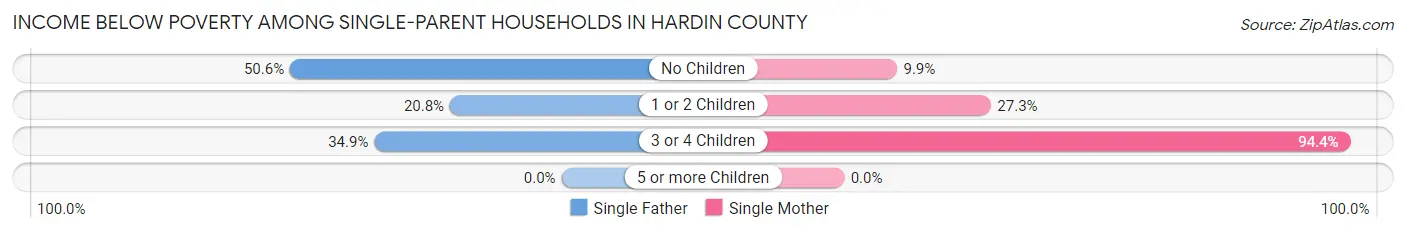
| Children | Single Father | Single Mother |
| No Children | 89 (50.6%) | 40 (9.9%) |
| 1 or 2 Children | 86 (20.8%) | 123 (27.3%) |
| 3 or 4 Children | 15 (34.9%) | 151 (94.4%) |
| 5 or more Children | 0 (0.0%) | 0 (0.0%) |
| Total | 190 (30.0%) | 314 (30.9%) |
Income Below Poverty Among Married-Couple vs Single-Parent Households in Hardin County
The poverty data for Hardin County shows that 435 of the married-couple family households (7.3%) and 504 of the single-parent households (30.6%) are living below the poverty level. Within the married-couple family households, those with 5 or more children have the highest poverty rate, with 135 households (61.9%) falling below the poverty line. Among the single-parent households, those with 3 or 4 children have the highest poverty rate, with 166 household (81.8%) living below poverty.
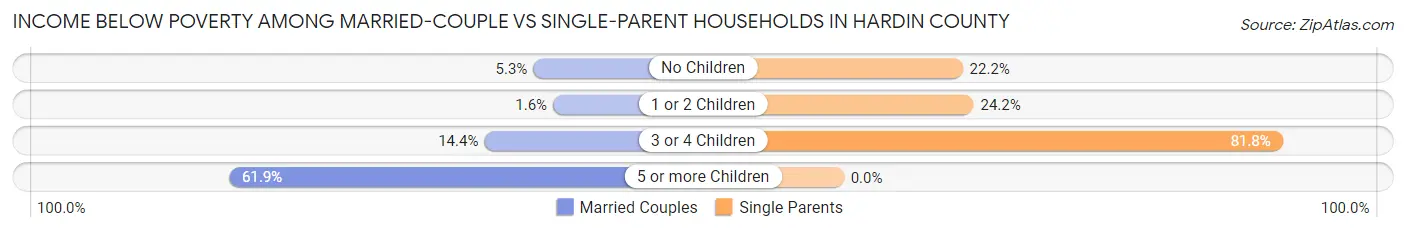
| Children | Married-Couple Families | Single-Parent Households |
| No Children | 195 (5.3%) | 129 (22.2%) |
| 1 or 2 Children | 24 (1.6%) | 209 (24.2%) |
| 3 or 4 Children | 81 (14.4%) | 166 (81.8%) |
| 5 or more Children | 135 (61.9%) | 0 (0.0%) |
| Total | 435 (7.3%) | 504 (30.6%) |
Employment Characteristics in Hardin County
Employment by Class of Employer in Hardin County
Among the 13,593 employed individuals in Hardin County, private company employees (8,793 | 64.7%), local government employees (1,382 | 10.2%), and not-for-profit organizations (1,128 | 8.3%) make up the most common classes of employment.
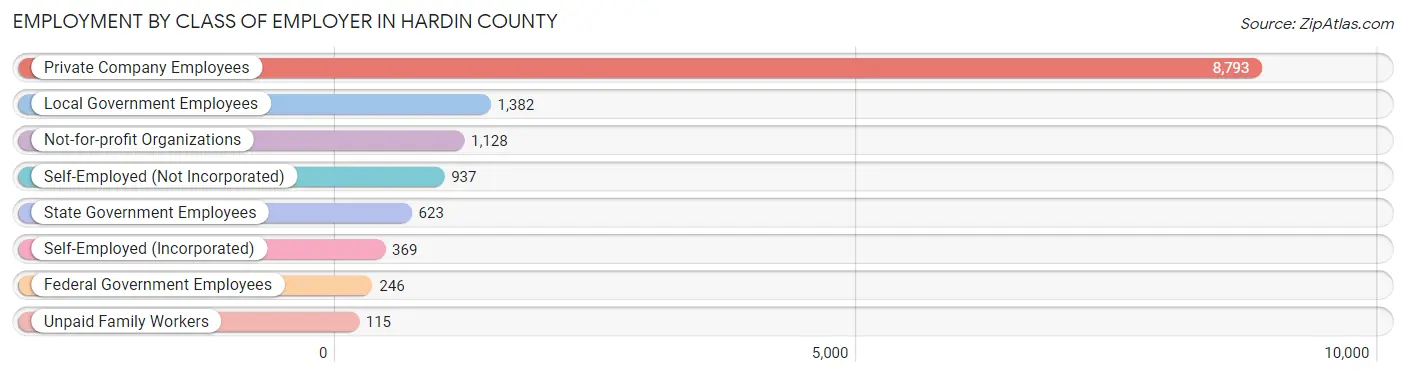
| Employer Class | # Employees | % Employees |
| Private Company Employees | 8,793 | 64.7% |
| Self-Employed (Incorporated) | 369 | 2.7% |
| Self-Employed (Not Incorporated) | 937 | 6.9% |
| Not-for-profit Organizations | 1,128 | 8.3% |
| Local Government Employees | 1,382 | 10.2% |
| State Government Employees | 623 | 4.6% |
| Federal Government Employees | 246 | 1.8% |
| Unpaid Family Workers | 115 | 0.9% |
| Total | 13,593 | 100.0% |
Employment Status by Age in Hardin County
According to the labor force statistics for Hardin County, out of the total population over 16 years of age (24,429), 59.7% or 14,584 individuals are in the labor force, with 4.7% or 685 of them unemployed. The age group with the highest labor force participation rate is 35 to 44 years, with 82.4% or 2,679 individuals in the labor force. Within the labor force, the 16 to 19 years age range has the highest percentage of unemployed individuals, with 17.6% or 191 of them being unemployed.
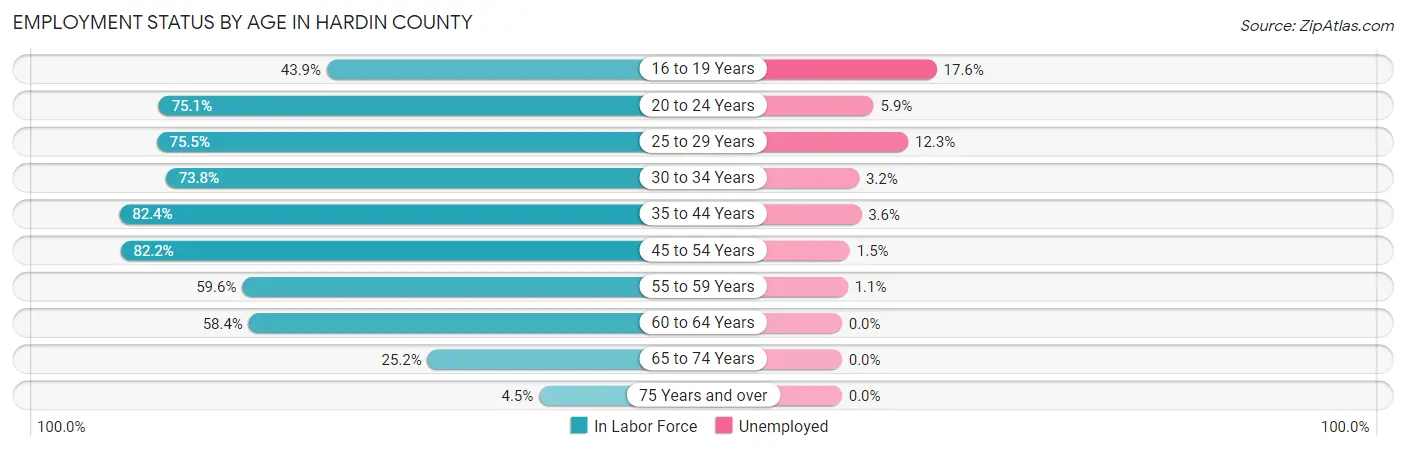
| Age Bracket | In Labor Force | Unemployed |
| 16 to 19 Years | 1,087 (43.9%) | 191 (17.6%) |
| 20 to 24 Years | 2,517 (75.1%) | 149 (5.9%) |
| 25 to 29 Years | 1,224 (75.5%) | 151 (12.3%) |
| 30 to 34 Years | 1,137 (73.8%) | 36 (3.2%) |
| 35 to 44 Years | 2,679 (82.4%) | 96 (3.6%) |
| 45 to 54 Years | 2,881 (82.2%) | 43 (1.5%) |
| 55 to 59 Years | 1,315 (59.6%) | 14 (1.1%) |
| 60 to 64 Years | 924 (58.4%) | 0 (0.0%) |
| 65 to 74 Years | 740 (25.2%) | 0 (0.0%) |
| 75 Years and over | 88 (4.5%) | 0 (0.0%) |
| Total | 14,584 (59.7%) | 685 (4.7%) |
Employment Status by Educational Attainment in Hardin County
According to labor force statistics for Hardin County, 74.1% of individuals (10,157) out of the total population between 25 and 64 years of age (13,707) are in the labor force, with 3.4% or 345 of them being unemployed. The group with the highest labor force participation rate are those with the educational attainment of college / associate degree, with 83.1% or 3,076 individuals in the labor force. Within the labor force, individuals with less than high school education have the highest percentage of unemployment, with 8.3% or 50 of them being unemployed.
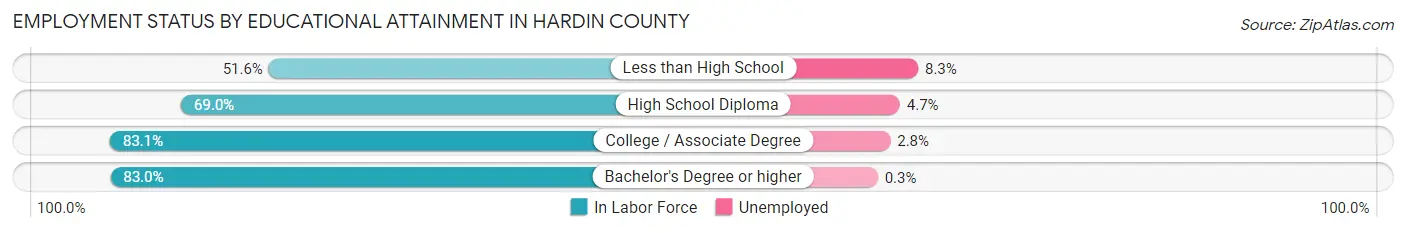
| Educational Attainment | In Labor Force | Unemployed |
| Less than High School | 599 (51.6%) | 96 (8.3%) |
| High School Diploma | 4,208 (69.0%) | 287 (4.7%) |
| College / Associate Degree | 3,076 (83.1%) | 104 (2.8%) |
| Bachelor's Degree or higher | 2,278 (83.0%) | 8 (0.3%) |
| Total | 10,157 (74.1%) | 466 (3.4%) |
Employment Occupations by Sex in Hardin County
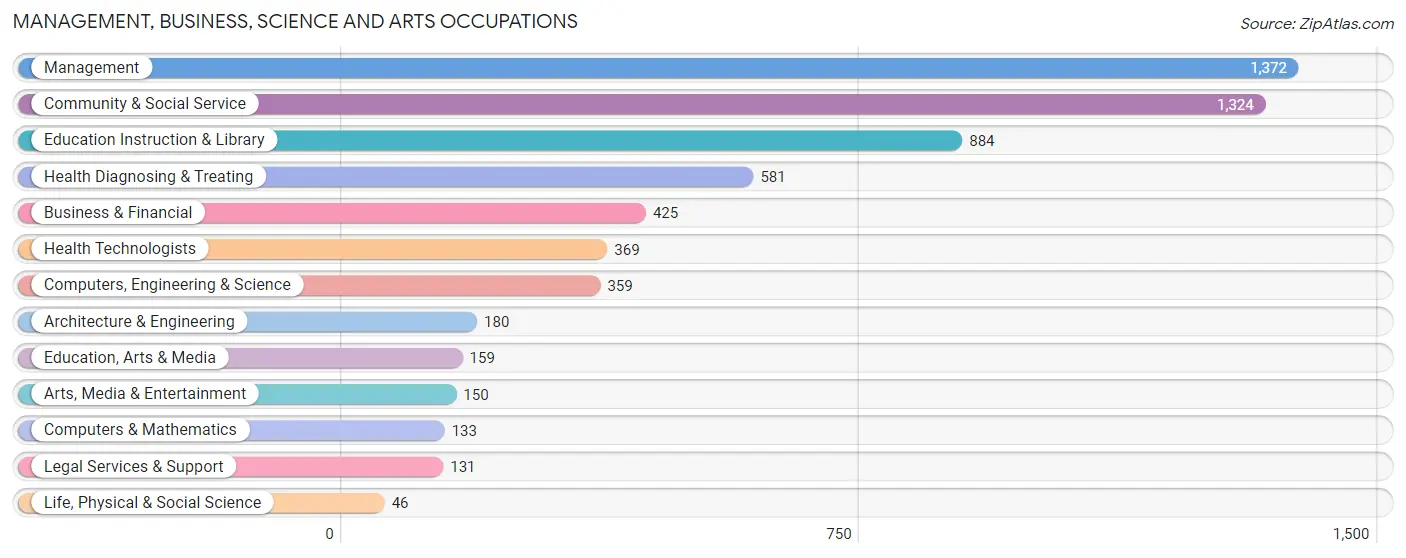
Management, Business, Science and Arts Occupations
The most common Management, Business, Science and Arts occupations in Hardin County are Management (1,372 | 9.9%), Community & Social Service (1,324 | 9.5%), Education Instruction & Library (884 | 6.4%), Health Diagnosing & Treating (581 | 4.2%), and Business & Financial (425 | 3.1%).
Management, Business, Science and Arts Occupations by Sex
Within the Management, Business, Science and Arts occupations in Hardin County, the most male-oriented occupations are Computers & Mathematics (91.0%), Architecture & Engineering (88.9%), and Computers, Engineering & Science (88.6%), while the most female-oriented occupations are Health Diagnosing & Treating (96.9%), Health Technologists (95.7%), and Education Instruction & Library (70.3%).
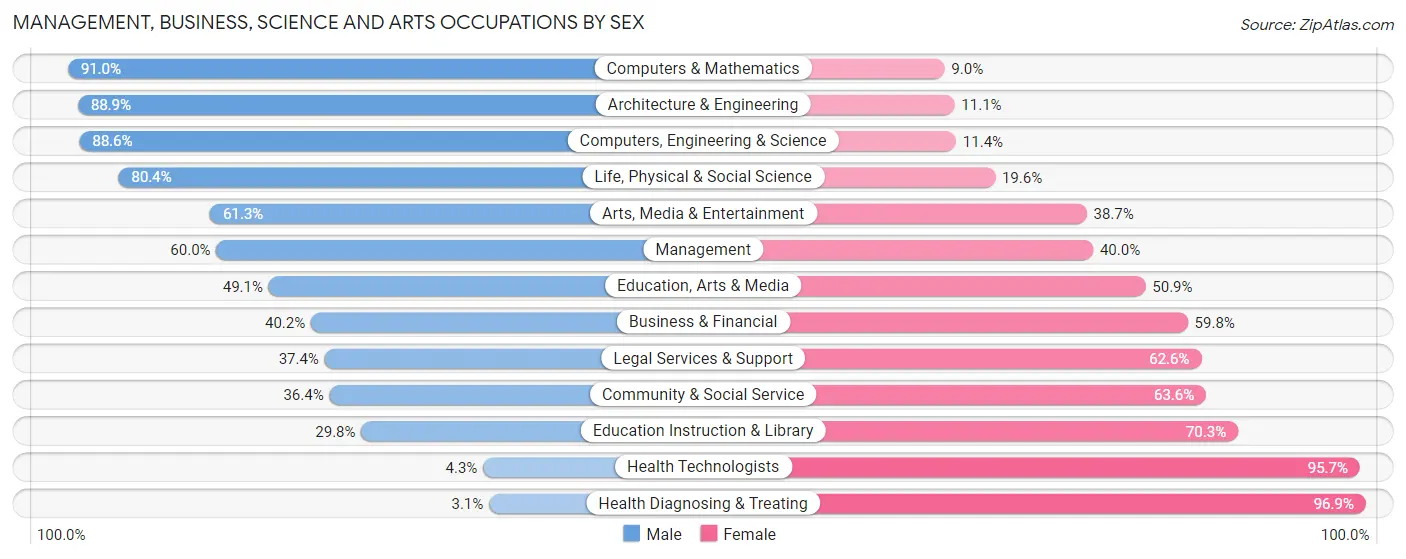
| Occupation | Male | Female |
| Management | 823 (60.0%) | 549 (40.0%) |
| Business & Financial | 171 (40.2%) | 254 (59.8%) |
| Computers, Engineering & Science | 318 (88.6%) | 41 (11.4%) |
| Computers & Mathematics | 121 (91.0%) | 12 (9.0%) |
| Architecture & Engineering | 160 (88.9%) | 20 (11.1%) |
| Life, Physical & Social Science | 37 (80.4%) | 9 (19.6%) |
| Community & Social Service | 482 (36.4%) | 842 (63.6%) |
| Education, Arts & Media | 78 (49.1%) | 81 (50.9%) |
| Legal Services & Support | 49 (37.4%) | 82 (62.6%) |
| Education Instruction & Library | 263 (29.7%) | 621 (70.3%) |
| Arts, Media & Entertainment | 92 (61.3%) | 58 (38.7%) |
| Health Diagnosing & Treating | 18 (3.1%) | 563 (96.9%) |
| Health Technologists | 16 (4.3%) | 353 (95.7%) |
| Total (Category) | 1,812 (44.6%) | 2,249 (55.4%) |
| Total (Overall) | 7,562 (54.4%) | 6,349 (45.6%) |
Services Occupations
The most common Services occupations in Hardin County are Food Preparation & Serving (860 | 6.2%), Healthcare Support (471 | 3.4%), Cleaning & Maintenance (422 | 3.0%), Personal Care & Service (294 | 2.1%), and Security & Protection (158 | 1.1%).
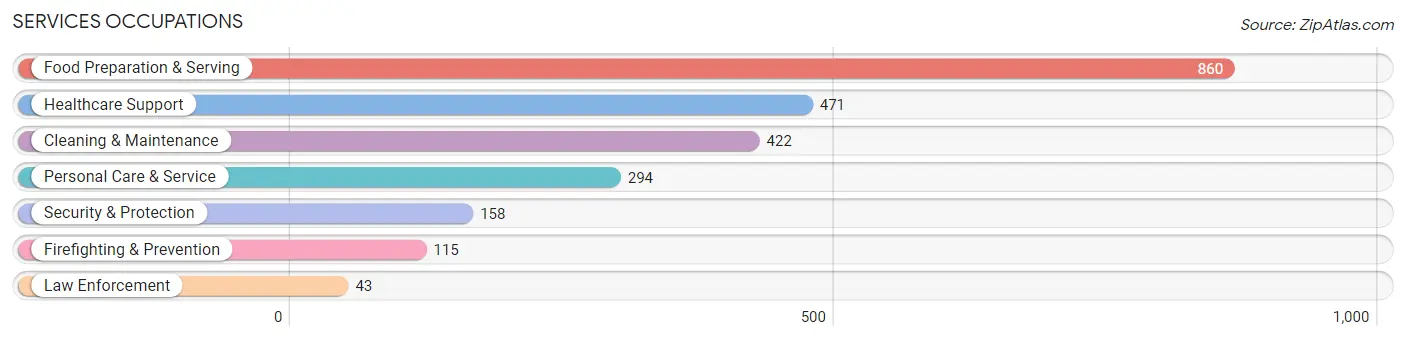
Services Occupations by Sex
Within the Services occupations in Hardin County, the most male-oriented occupations are Law Enforcement (93.0%), Security & Protection (75.9%), and Firefighting & Prevention (69.6%), while the most female-oriented occupations are Healthcare Support (83.9%), Personal Care & Service (73.8%), and Food Preparation & Serving (54.2%).

| Occupation | Male | Female |
| Healthcare Support | 76 (16.1%) | 395 (83.9%) |
| Security & Protection | 120 (75.9%) | 38 (24.0%) |
| Firefighting & Prevention | 80 (69.6%) | 35 (30.4%) |
| Law Enforcement | 40 (93.0%) | 3 (7.0%) |
| Food Preparation & Serving | 394 (45.8%) | 466 (54.2%) |
| Cleaning & Maintenance | 215 (50.9%) | 207 (49.0%) |
| Personal Care & Service | 77 (26.2%) | 217 (73.8%) |
| Total (Category) | 882 (40.0%) | 1,323 (60.0%) |
| Total (Overall) | 7,562 (54.4%) | 6,349 (45.6%) |
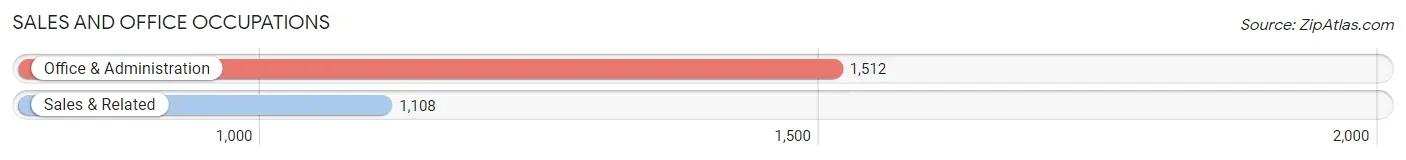
Sales and Office Occupations
The most common Sales and Office occupations in Hardin County are Office & Administration (1,512 | 10.9%), and Sales & Related (1,108 | 8.0%).
Sales and Office Occupations by Sex
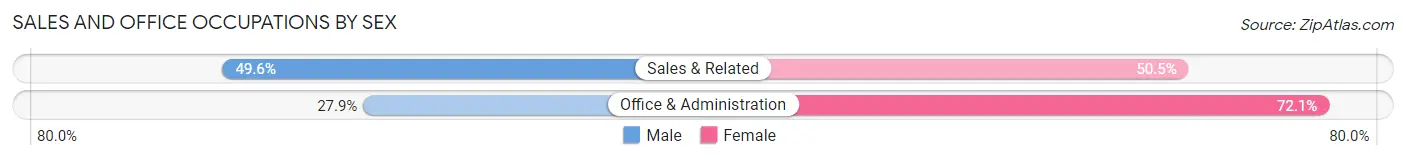
| Occupation | Male | Female |
| Sales & Related | 549 (49.5%) | 559 (50.4%) |
| Office & Administration | 422 (27.9%) | 1,090 (72.1%) |
| Total (Category) | 971 (37.1%) | 1,649 (62.9%) |
| Total (Overall) | 7,562 (54.4%) | 6,349 (45.6%) |
Natural Resources, Construction and Maintenance Occupations
The most common Natural Resources, Construction and Maintenance occupations in Hardin County are Installation, Maintenance & Repair (699 | 5.0%), Construction & Extraction (694 | 5.0%), and Farming, Fishing & Forestry (170 | 1.2%).
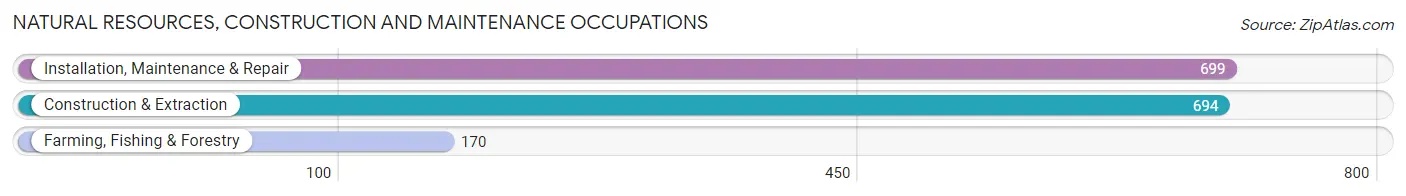
Natural Resources, Construction and Maintenance Occupations by Sex
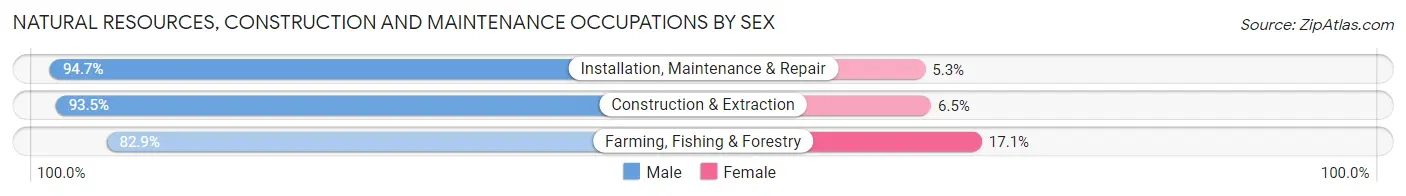
| Occupation | Male | Female |
| Farming, Fishing & Forestry | 141 (82.9%) | 29 (17.1%) |
| Construction & Extraction | 649 (93.5%) | 45 (6.5%) |
| Installation, Maintenance & Repair | 662 (94.7%) | 37 (5.3%) |
| Total (Category) | 1,452 (92.9%) | 111 (7.1%) |
| Total (Overall) | 7,562 (54.4%) | 6,349 (45.6%) |
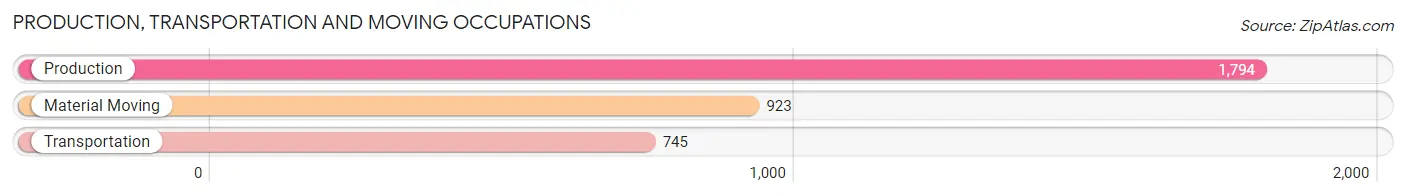
Production, Transportation and Moving Occupations
The most common Production, Transportation and Moving occupations in Hardin County are Production (1,794 | 12.9%), Material Moving (923 | 6.6%), and Transportation (745 | 5.4%).
Production, Transportation and Moving Occupations by Sex
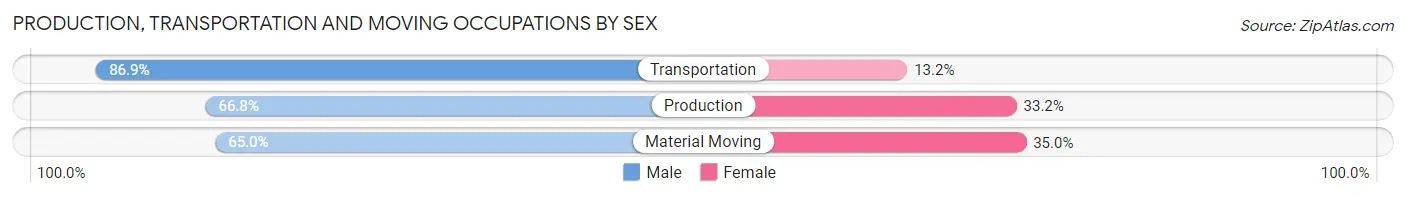
| Occupation | Male | Female |
| Production | 1,198 (66.8%) | 596 (33.2%) |
| Transportation | 647 (86.9%) | 98 (13.2%) |
| Material Moving | 600 (65.0%) | 323 (35.0%) |
| Total (Category) | 2,445 (70.6%) | 1,017 (29.4%) |
| Total (Overall) | 7,562 (54.4%) | 6,349 (45.6%) |
Employment Industries by Sex in Hardin County
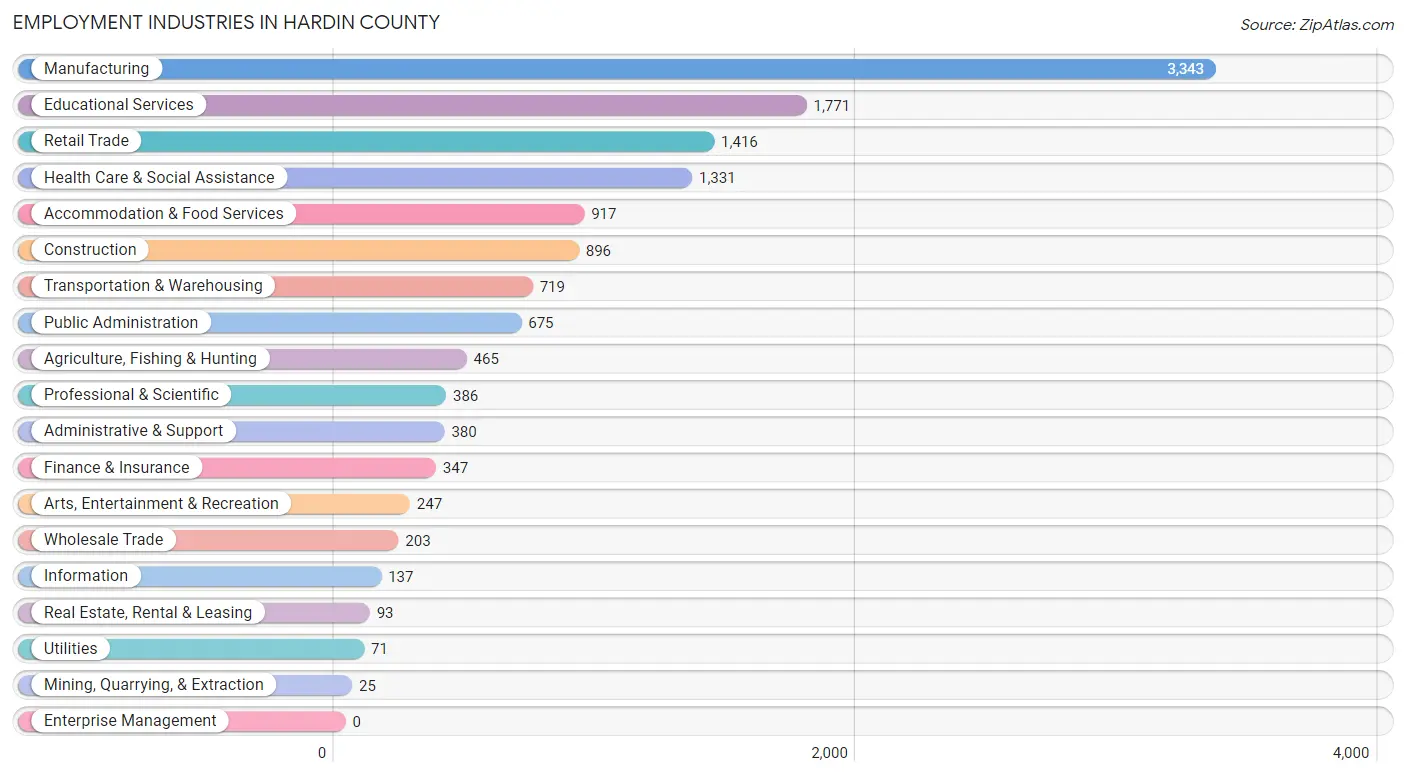
Employment Industries in Hardin County
The major employment industries in Hardin County include Manufacturing (3,343 | 24.0%), Educational Services (1,771 | 12.7%), Retail Trade (1,416 | 10.2%), Health Care & Social Assistance (1,331 | 9.6%), and Accommodation & Food Services (917 | 6.6%).
Employment Industries by Sex in Hardin County
The Hardin County industries that see more men than women are Construction (92.9%), Agriculture, Fishing & Hunting (89.7%), and Transportation & Warehousing (76.5%), whereas the industries that tend to have a higher number of women are Health Care & Social Assistance (91.8%), Finance & Insurance (77.5%), and Educational Services (64.9%).

| Industry | Male | Female |
| Agriculture, Fishing & Hunting | 417 (89.7%) | 48 (10.3%) |
| Mining, Quarrying, & Extraction | 14 (56.0%) | 11 (44.0%) |
| Construction | 832 (92.9%) | 64 (7.1%) |
| Manufacturing | 2,476 (74.1%) | 867 (25.9%) |
| Wholesale Trade | 138 (68.0%) | 65 (32.0%) |
| Retail Trade | 650 (45.9%) | 766 (54.1%) |
| Transportation & Warehousing | 550 (76.5%) | 169 (23.5%) |
| Utilities | 41 (57.8%) | 30 (42.2%) |
| Information | 89 (65.0%) | 48 (35.0%) |
| Finance & Insurance | 78 (22.5%) | 269 (77.5%) |
| Real Estate, Rental & Leasing | 53 (57.0%) | 40 (43.0%) |
| Professional & Scientific | 165 (42.7%) | 221 (57.3%) |
| Enterprise Management | 0 (0.0%) | 0 (0.0%) |
| Administrative & Support | 232 (61.1%) | 148 (39.0%) |
| Educational Services | 622 (35.1%) | 1,149 (64.9%) |
| Health Care & Social Assistance | 109 (8.2%) | 1,222 (91.8%) |
| Arts, Entertainment & Recreation | 130 (52.6%) | 117 (47.4%) |
| Accommodation & Food Services | 407 (44.4%) | 510 (55.6%) |
| Public Administration | 316 (46.8%) | 359 (53.2%) |
| Total | 7,562 (54.4%) | 6,349 (45.6%) |
Education in Hardin County
School Enrollment in Hardin County
The most common levels of schooling among the 8,704 students in Hardin County are college / undergraduate (3,050 | 35.0%), elementary school (1,714 | 19.7%), and middle school (1,421 | 16.3%).
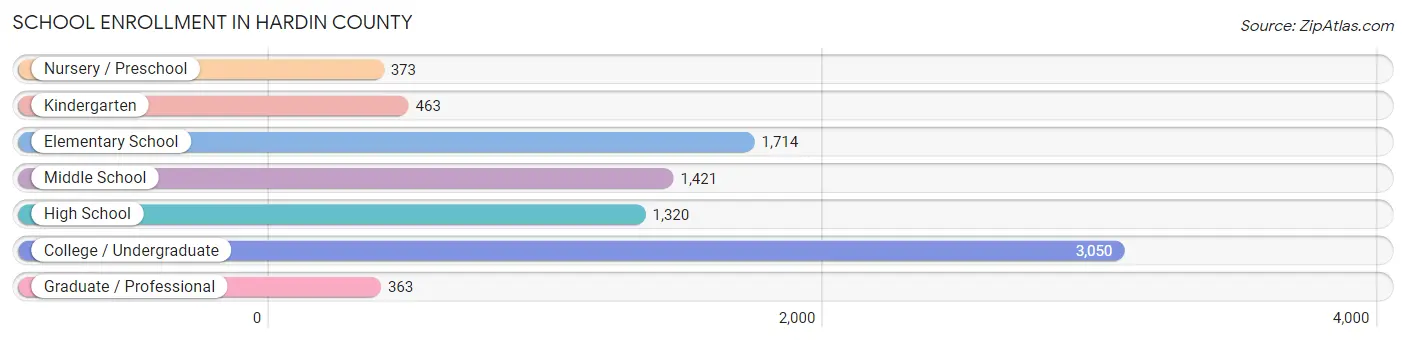
| School Level | # Students | % Students |
| Nursery / Preschool | 373 | 4.3% |
| Kindergarten | 463 | 5.3% |
| Elementary School | 1,714 | 19.7% |
| Middle School | 1,421 | 16.3% |
| High School | 1,320 | 15.2% |
| College / Undergraduate | 3,050 | 35.0% |
| Graduate / Professional | 363 | 4.2% |
| Total | 8,704 | 100.0% |
School Enrollment by Age by Funding Source in Hardin County
Out of a total of 8,704 students who are enrolled in schools in Hardin County, 2,211 (25.4%) attend a private institution, while the remaining 6,493 (74.6%) are enrolled in public schools. The age group of 20 to 24 year olds has the highest likelihood of being enrolled in private schools, with 961 (61.5% in the age bracket) enrolled. Conversely, the age group of 15 to 17 year olds has the lowest likelihood of being enrolled in a private school, with 1,035 (93.6% in the age bracket) attending a public institution.
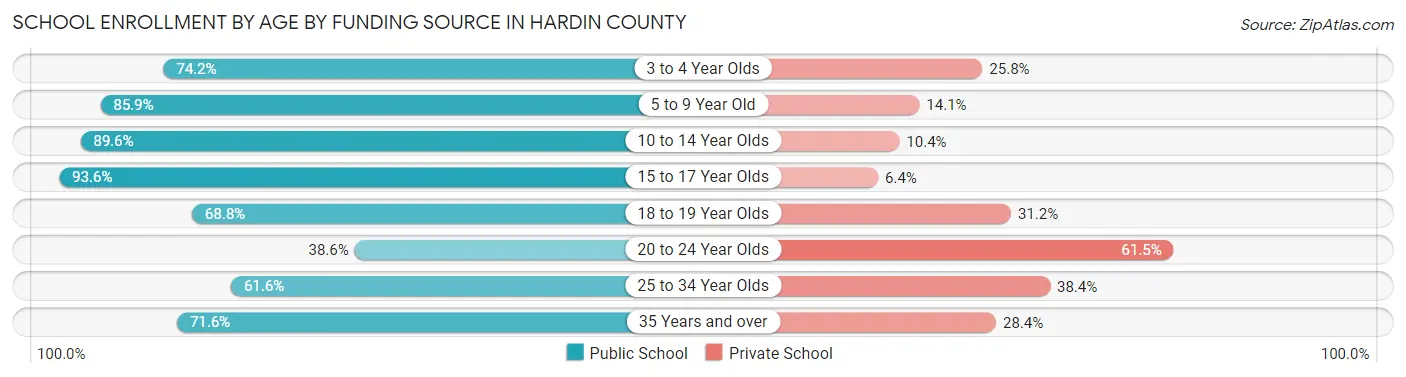
| Age Bracket | Public School | Private School |
| 3 to 4 Year Olds | 155 (74.2%) | 54 (25.8%) |
| 5 to 9 Year Old | 1,710 (85.9%) | 281 (14.1%) |
| 10 to 14 Year Olds | 1,615 (89.6%) | 187 (10.4%) |
| 15 to 17 Year Olds | 1,035 (93.6%) | 71 (6.4%) |
| 18 to 19 Year Olds | 996 (68.8%) | 451 (31.2%) |
| 20 to 24 Year Olds | 603 (38.6%) | 961 (61.5%) |
| 25 to 34 Year Olds | 269 (61.6%) | 168 (38.4%) |
| 35 Years and over | 106 (71.6%) | 42 (28.4%) |
| Total | 6,493 (74.6%) | 2,211 (25.4%) |
Educational Attainment by Field of Study in Hardin County
Education (938 | 25.2%), business (673 | 18.1%), science & technology (370 | 9.9%), bio, nature & agricultural (289 | 7.8%), and liberal arts & history (270 | 7.3%) are the most common fields of study among 3,721 individuals in Hardin County who have obtained a bachelor's degree or higher.
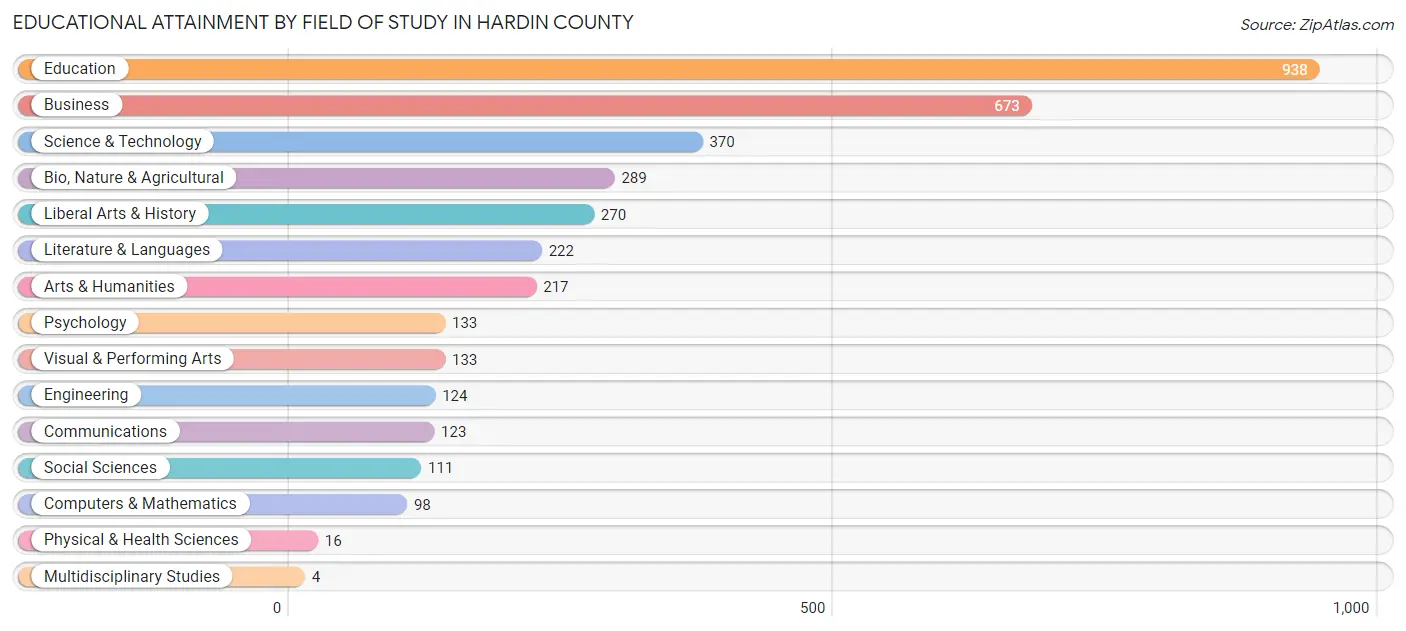
| Field of Study | # Graduates | % Graduates |
| Computers & Mathematics | 98 | 2.6% |
| Bio, Nature & Agricultural | 289 | 7.8% |
| Physical & Health Sciences | 16 | 0.4% |
| Psychology | 133 | 3.6% |
| Social Sciences | 111 | 3.0% |
| Engineering | 124 | 3.3% |
| Multidisciplinary Studies | 4 | 0.1% |
| Science & Technology | 370 | 9.9% |
| Business | 673 | 18.1% |
| Education | 938 | 25.2% |
| Literature & Languages | 222 | 6.0% |
| Liberal Arts & History | 270 | 7.3% |
| Visual & Performing Arts | 133 | 3.6% |
| Communications | 123 | 3.3% |
| Arts & Humanities | 217 | 5.8% |
| Total | 3,721 | 100.0% |
Transportation & Commute in Hardin County
Vehicle Availability by Sex in Hardin County
The most prevalent vehicle ownership categories in Hardin County are males with 2 vehicles (2,595, accounting for 35.9%) and females with 2 vehicles (1,828, making up 45.2%).
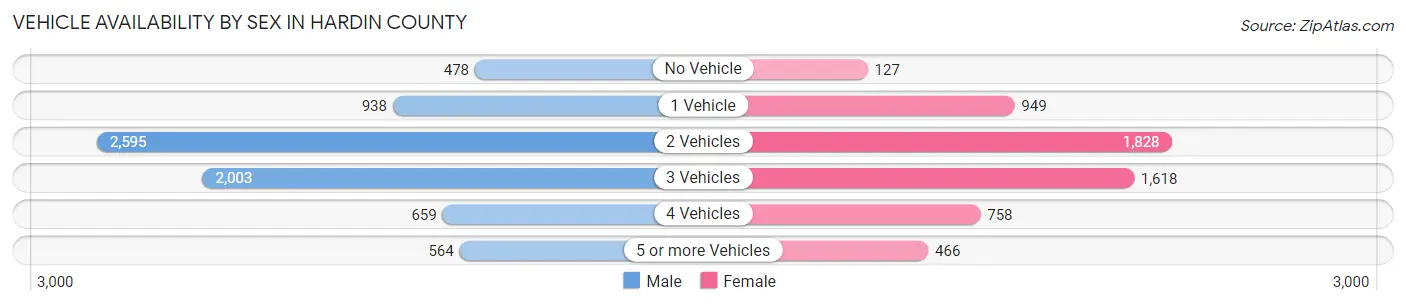
| Vehicles Available | Male | Female |
| No Vehicle | 478 (6.6%) | 127 (2.2%) |
| 1 Vehicle | 938 (13.0%) | 949 (16.5%) |
| 2 Vehicles | 2,595 (35.9%) | 1,828 (31.8%) |
| 3 Vehicles | 2,003 (27.7%) | 1,618 (28.2%) |
| 4 Vehicles | 659 (9.1%) | 758 (13.2%) |
| 5 or more Vehicles | 564 (7.8%) | 466 (8.1%) |
| Total | 7,237 (100.0%) | 5,746 (100.0%) |
Commute Time in Hardin County
The most frequently occuring commute durations in Hardin County are 5 to 9 minutes (2,175 commuters, 16.9%), 10 to 14 minutes (1,758 commuters, 13.6%), and 30 to 34 minutes (1,503 commuters, 11.7%).
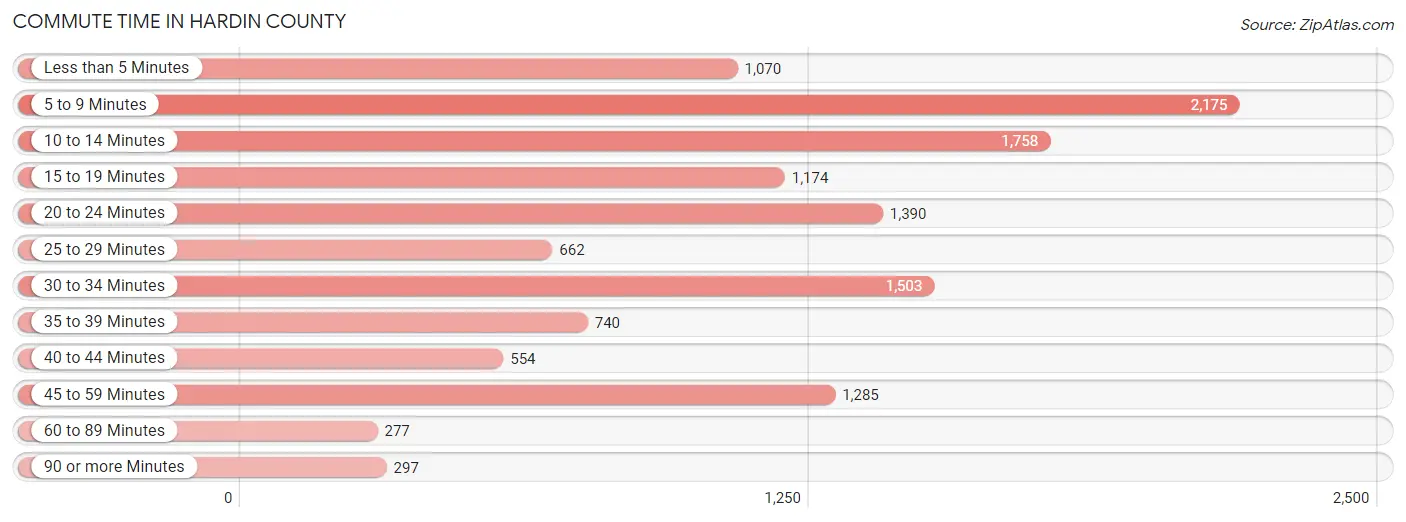
| Commute Time | # Commuters | % Commuters |
| Less than 5 Minutes | 1,070 | 8.3% |
| 5 to 9 Minutes | 2,175 | 16.9% |
| 10 to 14 Minutes | 1,758 | 13.6% |
| 15 to 19 Minutes | 1,174 | 9.1% |
| 20 to 24 Minutes | 1,390 | 10.8% |
| 25 to 29 Minutes | 662 | 5.1% |
| 30 to 34 Minutes | 1,503 | 11.7% |
| 35 to 39 Minutes | 740 | 5.7% |
| 40 to 44 Minutes | 554 | 4.3% |
| 45 to 59 Minutes | 1,285 | 10.0% |
| 60 to 89 Minutes | 277 | 2.1% |
| 90 or more Minutes | 297 | 2.3% |
Commute Time by Sex in Hardin County
The most common commute times in Hardin County are 5 to 9 minutes (1,101 commuters, 15.5%) for males and 5 to 9 minutes (1,074 commuters, 18.5%) for females.
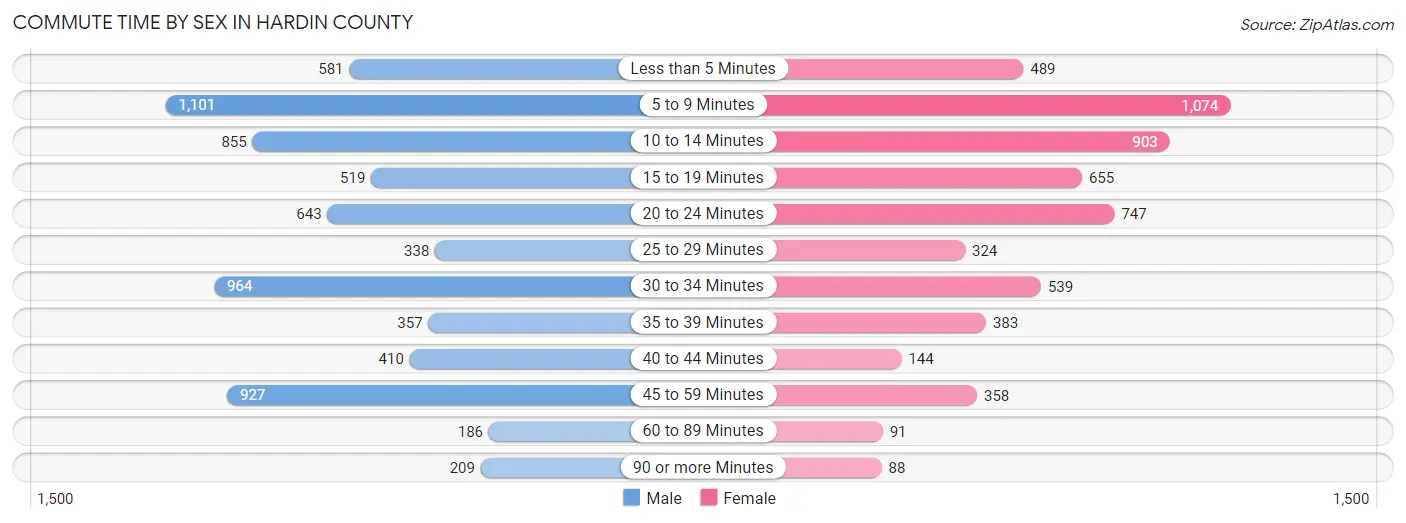
| Commute Time | Male | Female |
| Less than 5 Minutes | 581 (8.2%) | 489 (8.4%) |
| 5 to 9 Minutes | 1,101 (15.5%) | 1,074 (18.5%) |
| 10 to 14 Minutes | 855 (12.1%) | 903 (15.6%) |
| 15 to 19 Minutes | 519 (7.3%) | 655 (11.3%) |
| 20 to 24 Minutes | 643 (9.1%) | 747 (12.9%) |
| 25 to 29 Minutes | 338 (4.8%) | 324 (5.6%) |
| 30 to 34 Minutes | 964 (13.6%) | 539 (9.3%) |
| 35 to 39 Minutes | 357 (5.0%) | 383 (6.6%) |
| 40 to 44 Minutes | 410 (5.8%) | 144 (2.5%) |
| 45 to 59 Minutes | 927 (13.1%) | 358 (6.2%) |
| 60 to 89 Minutes | 186 (2.6%) | 91 (1.6%) |
| 90 or more Minutes | 209 (2.9%) | 88 (1.5%) |
Time of Departure to Work by Sex in Hardin County
The most frequent times of departure to work in Hardin County are 5:30 AM to 5:59 AM (906, 12.8%) for males and 7:30 AM to 7:59 AM (991, 17.1%) for females.
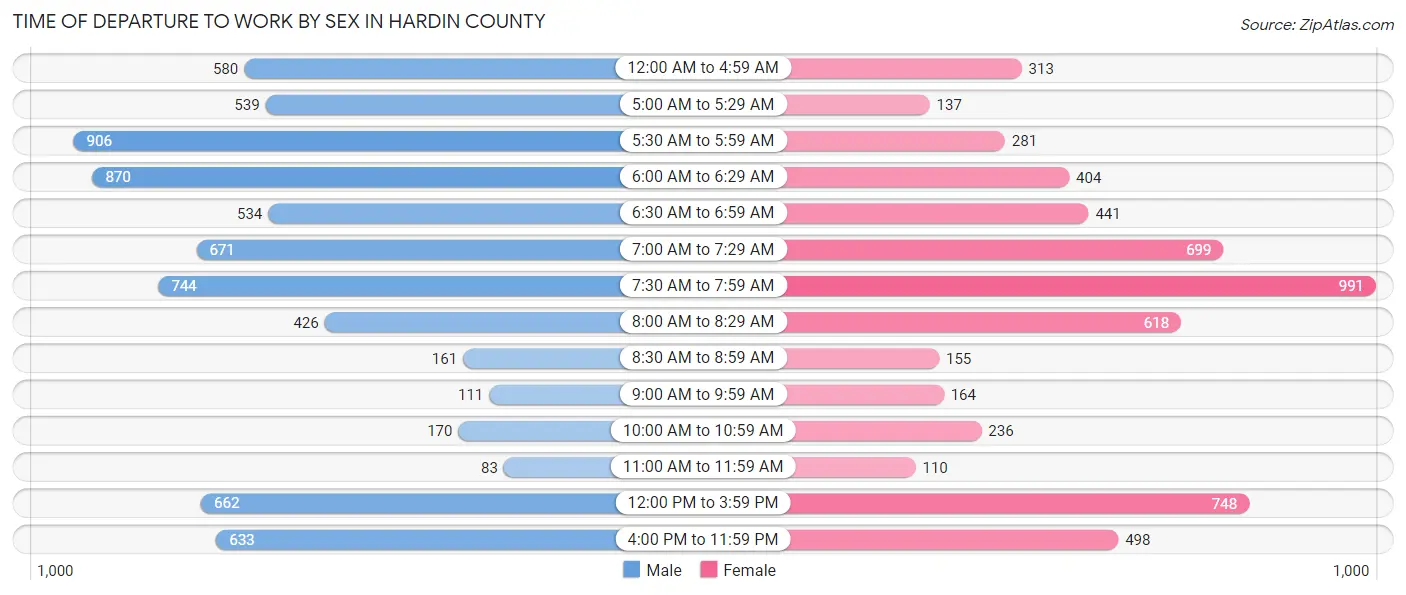
| Time of Departure | Male | Female |
| 12:00 AM to 4:59 AM | 580 (8.2%) | 313 (5.4%) |
| 5:00 AM to 5:29 AM | 539 (7.6%) | 137 (2.4%) |
| 5:30 AM to 5:59 AM | 906 (12.8%) | 281 (4.9%) |
| 6:00 AM to 6:29 AM | 870 (12.3%) | 404 (7.0%) |
| 6:30 AM to 6:59 AM | 534 (7.5%) | 441 (7.6%) |
| 7:00 AM to 7:29 AM | 671 (9.5%) | 699 (12.1%) |
| 7:30 AM to 7:59 AM | 744 (10.5%) | 991 (17.1%) |
| 8:00 AM to 8:29 AM | 426 (6.0%) | 618 (10.7%) |
| 8:30 AM to 8:59 AM | 161 (2.3%) | 155 (2.7%) |
| 9:00 AM to 9:59 AM | 111 (1.6%) | 164 (2.8%) |
| 10:00 AM to 10:59 AM | 170 (2.4%) | 236 (4.1%) |
| 11:00 AM to 11:59 AM | 83 (1.2%) | 110 (1.9%) |
| 12:00 PM to 3:59 PM | 662 (9.3%) | 748 (12.9%) |
| 4:00 PM to 11:59 PM | 633 (8.9%) | 498 (8.6%) |
| Total | 7,090 (100.0%) | 5,795 (100.0%) |
Housing Occupancy in Hardin County
Occupancy by Ownership in Hardin County
Of the total 11,640 dwellings in Hardin County, owner-occupied units account for 8,660 (74.4%), while renter-occupied units make up 2,980 (25.6%).

| Occupancy | # Housing Units | % Housing Units |
| Owner Occupied Housing Units | 8,660 | 74.4% |
| Renter-Occupied Housing Units | 2,980 | 25.6% |
| Total Occupied Housing Units | 11,640 | 100.0% |
Occupancy by Household Size in Hardin County
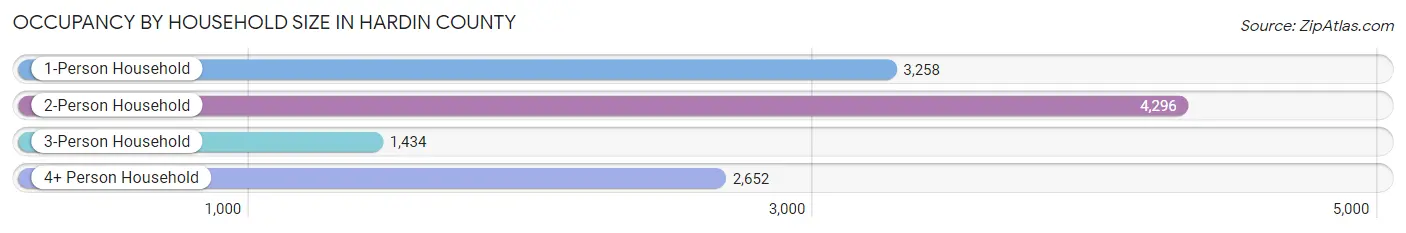
| Household Size | # Housing Units | % Housing Units |
| 1-Person Household | 3,258 | 28.0% |
| 2-Person Household | 4,296 | 36.9% |
| 3-Person Household | 1,434 | 12.3% |
| 4+ Person Household | 2,652 | 22.8% |
| Total Housing Units | 11,640 | 100.0% |
Occupancy by Ownership by Household Size in Hardin County
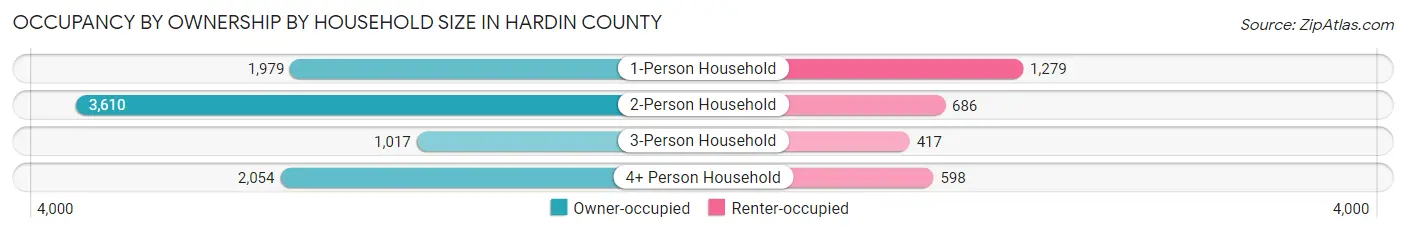
| Household Size | Owner-occupied | Renter-occupied |
| 1-Person Household | 1,979 (60.7%) | 1,279 (39.3%) |
| 2-Person Household | 3,610 (84.0%) | 686 (16.0%) |
| 3-Person Household | 1,017 (70.9%) | 417 (29.1%) |
| 4+ Person Household | 2,054 (77.4%) | 598 (22.6%) |
| Total Housing Units | 8,660 (74.4%) | 2,980 (25.6%) |
Occupancy by Educational Attainment in Hardin County
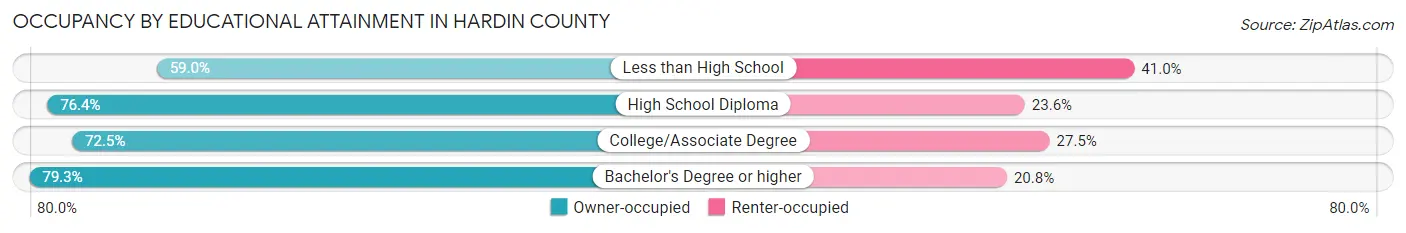
| Household Size | Owner-occupied | Renter-occupied |
| Less than High School | 578 (59.0%) | 401 (41.0%) |
| High School Diploma | 3,946 (76.4%) | 1,218 (23.6%) |
| College/Associate Degree | 2,360 (72.5%) | 896 (27.5%) |
| Bachelor's Degree or higher | 1,776 (79.2%) | 465 (20.7%) |
Occupancy by Age of Householder in Hardin County
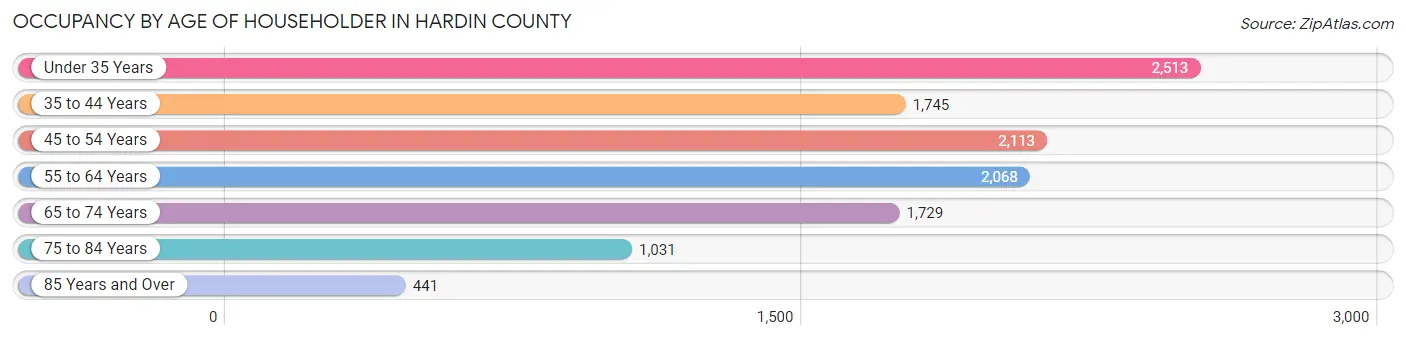
| Age Bracket | # Households | % Households |
| Under 35 Years | 2,513 | 21.6% |
| 35 to 44 Years | 1,745 | 15.0% |
| 45 to 54 Years | 2,113 | 18.1% |
| 55 to 64 Years | 2,068 | 17.8% |
| 65 to 74 Years | 1,729 | 14.8% |
| 75 to 84 Years | 1,031 | 8.9% |
| 85 Years and Over | 441 | 3.8% |
| Total | 11,640 | 100.0% |
Housing Finances in Hardin County
Median Income by Occupancy in Hardin County

| Occupancy Type | # Households | Median Income |
| Owner-Occupied | 8,660 (74.4%) | $65,756 |
| Renter-Occupied | 2,980 (25.6%) | $35,101 |
| Average | 11,640 (100.0%) | $55,876 |
Occupancy by Householder Income Bracket in Hardin County

| Income Bracket | Owner-occupied | Renter-occupied |
| Less than $5,000 | 235 (2.7%) | 410 (13.8%) |
| $5,000 to $9,999 | 253 (2.9%) | 44 (1.5%) |
| $10,000 to $14,999 | 159 (1.8%) | 158 (5.3%) |
| $15,000 to $19,999 | 128 (1.5%) | 248 (8.3%) |
| $20,000 to $24,999 | 364 (4.2%) | 219 (7.3%) |
| $25,000 to $34,999 | 569 (6.6%) | 407 (13.7%) |
| $35,000 to $49,999 | 1,426 (16.5%) | 462 (15.5%) |
| $50,000 to $74,999 | 1,801 (20.8%) | 568 (19.1%) |
| $75,000 to $99,999 | 1,229 (14.2%) | 278 (9.3%) |
| $100,000 to $149,999 | 1,573 (18.2%) | 86 (2.9%) |
| $150,000 or more | 923 (10.7%) | 100 (3.4%) |
| Total | 8,660 (100.0%) | 2,980 (100.0%) |
Monthly Housing Cost Tiers in Hardin County
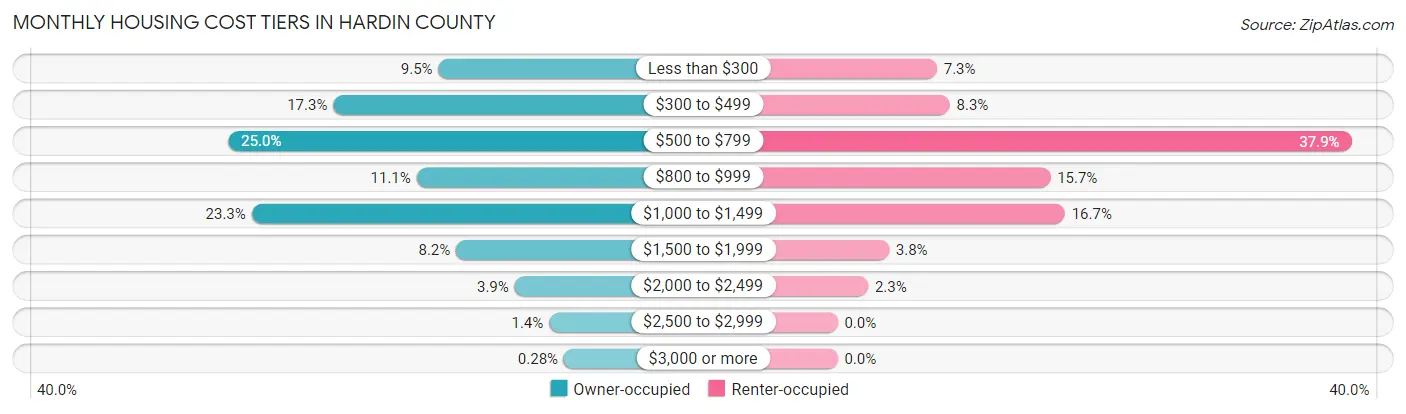
| Monthly Cost | Owner-occupied | Renter-occupied |
| Less than $300 | 824 (9.5%) | 218 (7.3%) |
| $300 to $499 | 1,496 (17.3%) | 246 (8.3%) |
| $500 to $799 | 2,166 (25.0%) | 1,128 (37.9%) |
| $800 to $999 | 964 (11.1%) | 467 (15.7%) |
| $1,000 to $1,499 | 2,016 (23.3%) | 499 (16.7%) |
| $1,500 to $1,999 | 712 (8.2%) | 113 (3.8%) |
| $2,000 to $2,499 | 339 (3.9%) | 67 (2.2%) |
| $2,500 to $2,999 | 119 (1.4%) | 0 (0.0%) |
| $3,000 or more | 24 (0.3%) | 0 (0.0%) |
| Total | 8,660 (100.0%) | 2,980 (100.0%) |
Physical Housing Characteristics in Hardin County
Housing Structures in Hardin County

| Structure Type | # Housing Units | % Housing Units |
| Single Unit, Detached | 9,263 | 79.6% |
| Single Unit, Attached | 71 | 0.6% |
| 2 Unit Apartments | 239 | 2.1% |
| 3 or 4 Unit Apartments | 187 | 1.6% |
| 5 to 9 Unit Apartments | 413 | 3.5% |
| 10 or more Apartments | 321 | 2.8% |
| Mobile Home / Other | 1,146 | 9.9% |
| Total | 11,640 | 100.0% |
Housing Structures by Occupancy in Hardin County
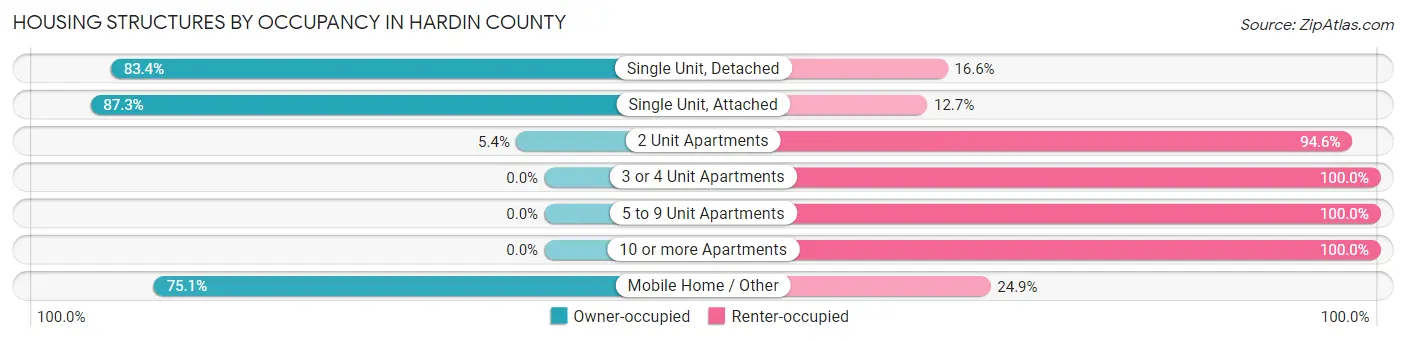
| Structure Type | Owner-occupied | Renter-occupied |
| Single Unit, Detached | 7,724 (83.4%) | 1,539 (16.6%) |
| Single Unit, Attached | 62 (87.3%) | 9 (12.7%) |
| 2 Unit Apartments | 13 (5.4%) | 226 (94.6%) |
| 3 or 4 Unit Apartments | 0 (0.0%) | 187 (100.0%) |
| 5 to 9 Unit Apartments | 0 (0.0%) | 413 (100.0%) |
| 10 or more Apartments | 0 (0.0%) | 321 (100.0%) |
| Mobile Home / Other | 861 (75.1%) | 285 (24.9%) |
| Total | 8,660 (74.4%) | 2,980 (25.6%) |
Housing Structures by Number of Rooms in Hardin County

| Number of Rooms | Owner-occupied | Renter-occupied |
| 1 Room | 3 (0.0%) | 104 (3.5%) |
| 2 or 3 Rooms | 144 (1.7%) | 578 (19.4%) |
| 4 or 5 Rooms | 1,958 (22.6%) | 1,001 (33.6%) |
| 6 or 7 Rooms | 3,676 (42.4%) | 809 (27.2%) |
| 8 or more Rooms | 2,879 (33.2%) | 488 (16.4%) |
| Total | 8,660 (100.0%) | 2,980 (100.0%) |
Housing Structure by Heating Type in Hardin County
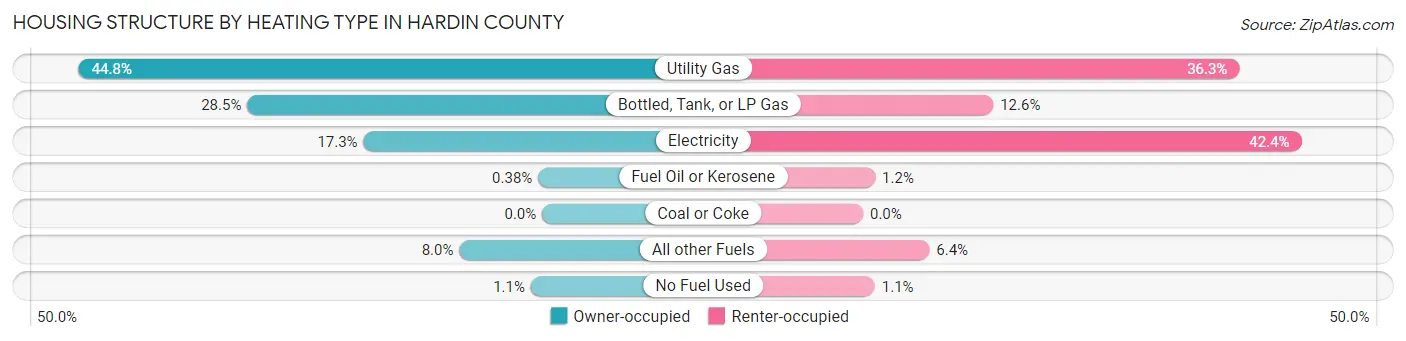
| Heating Type | Owner-occupied | Renter-occupied |
| Utility Gas | 3,878 (44.8%) | 1,083 (36.3%) |
| Bottled, Tank, or LP Gas | 2,467 (28.5%) | 375 (12.6%) |
| Electricity | 1,495 (17.3%) | 1,262 (42.3%) |
| Fuel Oil or Kerosene | 33 (0.4%) | 35 (1.2%) |
| Coal or Coke | 0 (0.0%) | 0 (0.0%) |
| All other Fuels | 693 (8.0%) | 191 (6.4%) |
| No Fuel Used | 94 (1.1%) | 34 (1.1%) |
| Total | 8,660 (100.0%) | 2,980 (100.0%) |
Household Vehicle Usage in Hardin County

| Vehicles per Household | Owner-occupied | Renter-occupied |
| No Vehicle | 461 (5.3%) | 491 (16.5%) |
| 1 Vehicle | 1,810 (20.9%) | 1,217 (40.8%) |
| 2 Vehicles | 3,473 (40.1%) | 789 (26.5%) |
| 3 or more Vehicles | 2,916 (33.7%) | 483 (16.2%) |
| Total | 8,660 (100.0%) | 2,980 (100.0%) |
Real Estate & Mortgages in Hardin County
Real Estate and Mortgage Overview in Hardin County
| Characteristic | Without Mortgage | With Mortgage |
| Housing Units | 3,789 | 4,871 |
| Median Property Value | $109,500 | $141,900 |
| Median Household Income | $51,427 | $678 |
| Monthly Housing Costs | $453 | $21 |
| Real Estate Taxes | $1,185 | $170 |
Property Value by Mortgage Status in Hardin County
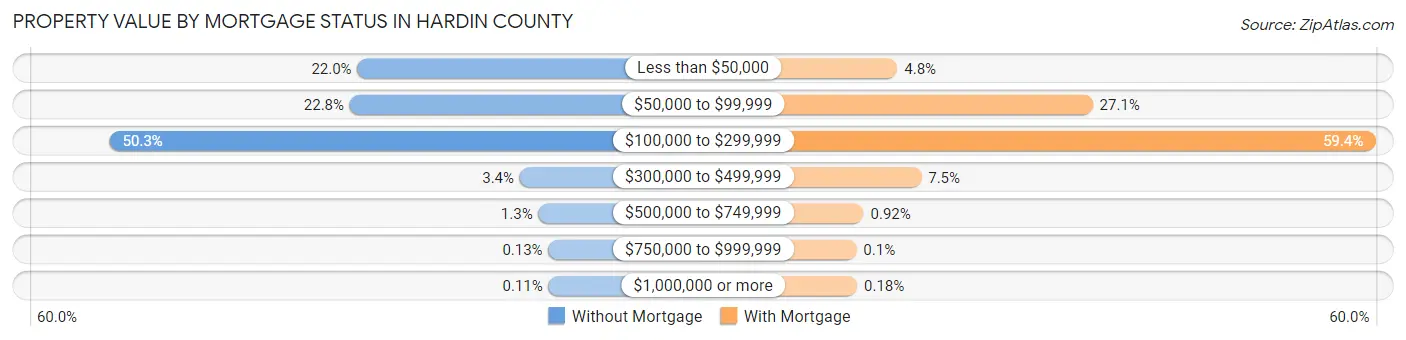
| Property Value | Without Mortgage | With Mortgage |
| Less than $50,000 | 832 (22.0%) | 233 (4.8%) |
| $50,000 to $99,999 | 865 (22.8%) | 1,320 (27.1%) |
| $100,000 to $299,999 | 1,906 (50.3%) | 2,893 (59.4%) |
| $300,000 to $499,999 | 129 (3.4%) | 366 (7.5%) |
| $500,000 to $749,999 | 48 (1.3%) | 45 (0.9%) |
| $750,000 to $999,999 | 5 (0.1%) | 5 (0.1%) |
| $1,000,000 or more | 4 (0.1%) | 9 (0.2%) |
| Total | 3,789 (100.0%) | 4,871 (100.0%) |
Household Income by Mortgage Status in Hardin County
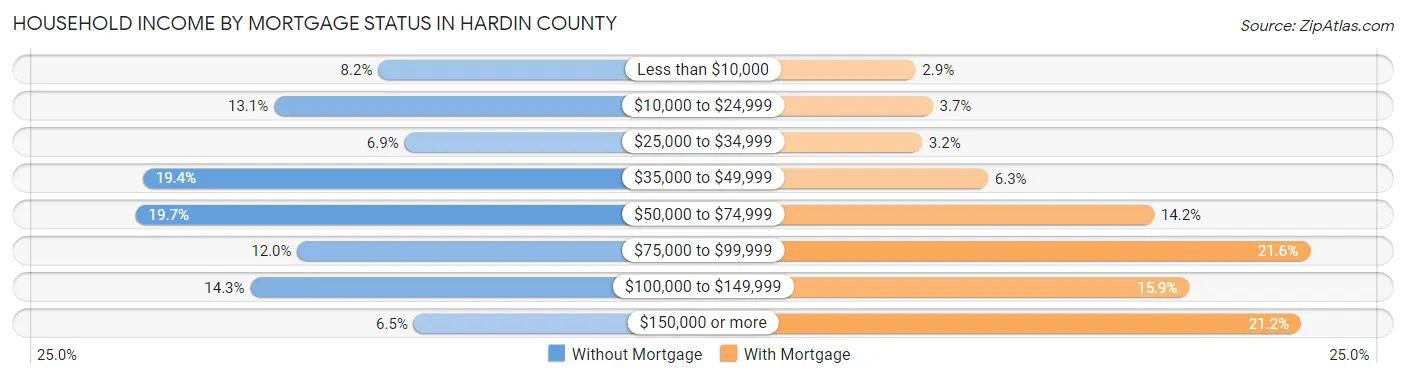
| Household Income | Without Mortgage | With Mortgage |
| Less than $10,000 | 309 (8.2%) | 139 (2.9%) |
| $10,000 to $24,999 | 497 (13.1%) | 179 (3.7%) |
| $25,000 to $34,999 | 262 (6.9%) | 154 (3.2%) |
| $35,000 to $49,999 | 734 (19.4%) | 307 (6.3%) |
| $50,000 to $74,999 | 747 (19.7%) | 692 (14.2%) |
| $75,000 to $99,999 | 455 (12.0%) | 1,054 (21.6%) |
| $100,000 to $149,999 | 540 (14.2%) | 774 (15.9%) |
| $150,000 or more | 245 (6.5%) | 1,033 (21.2%) |
| Total | 3,789 (100.0%) | 4,871 (100.0%) |
Property Value to Household Income Ratio in Hardin County
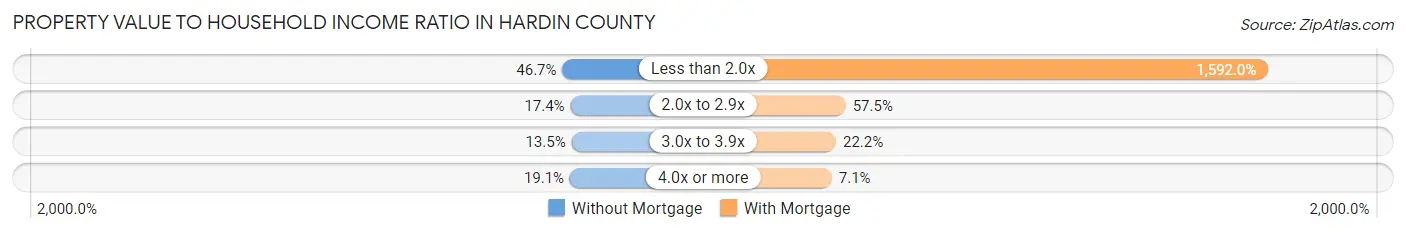
| Value-to-Income Ratio | Without Mortgage | With Mortgage |
| Less than 2.0x | 1,770 (46.7%) | 77,547 (1,592.0%) |
| 2.0x to 2.9x | 660 (17.4%) | 2,801 (57.5%) |
| 3.0x to 3.9x | 511 (13.5%) | 1,082 (22.2%) |
| 4.0x or more | 725 (19.1%) | 347 (7.1%) |
| Total | 3,789 (100.0%) | 4,871 (100.0%) |
Real Estate Taxes by Mortgage Status in Hardin County
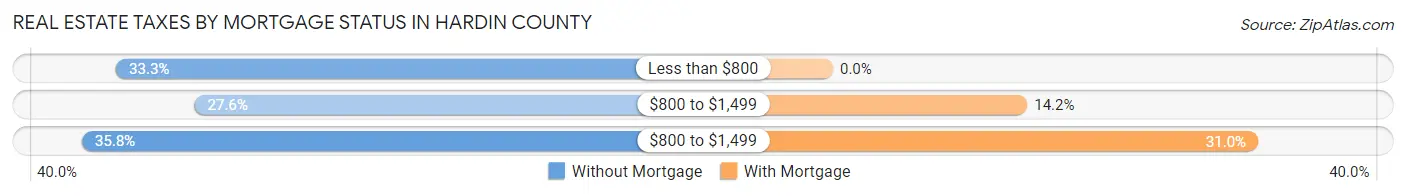
| Property Taxes | Without Mortgage | With Mortgage |
| Less than $800 | 1,262 (33.3%) | 0 (0.0%) |
| $800 to $1,499 | 1,045 (27.6%) | 691 (14.2%) |
| $800 to $1,499 | 1,357 (35.8%) | 1,512 (31.0%) |
| Total | 3,789 (100.0%) | 4,871 (100.0%) |
Health & Disability in Hardin County
Health Insurance Coverage by Age in Hardin County

| Age Bracket | With Coverage | Without Coverage |
| Under 6 Years | 1,562 (73.5%) | 564 (26.5%) |
| 6 to 18 Years | 4,524 (80.8%) | 1,073 (19.2%) |
| 19 to 25 Years | 4,020 (88.3%) | 531 (11.7%) |
| 26 to 34 Years | 2,364 (81.5%) | 538 (18.5%) |
| 35 to 44 Years | 2,716 (83.5%) | 535 (16.5%) |
| 45 to 54 Years | 3,342 (95.4%) | 163 (4.6%) |
| 55 to 64 Years | 3,395 (90.9%) | 340 (9.1%) |
| 65 to 74 Years | 2,862 (98.8%) | 35 (1.2%) |
| 75 Years and older | 1,872 (100.0%) | 0 (0.0%) |
| Total | 26,657 (87.6%) | 3,779 (12.4%) |
Health Insurance Coverage by Citizenship Status in Hardin County

| Citizenship Status | With Coverage | Without Coverage |
| Native Born | 1,562 (73.5%) | 564 (26.5%) |
| Foreign Born, Citizen | 4,524 (80.8%) | 1,073 (19.2%) |
| Foreign Born, not a Citizen | 4,020 (88.3%) | 531 (11.7%) |
Health Insurance Coverage by Household Income in Hardin County

| Household Income | With Coverage | Without Coverage |
| Under $25,000 | 3,013 (83.0%) | 619 (17.0%) |
| $25,000 to $49,999 | 5,172 (79.8%) | 1,308 (20.2%) |
| $50,000 to $74,999 | 5,343 (88.5%) | 696 (11.5%) |
| $75,000 to $99,999 | 3,585 (89.5%) | 420 (10.5%) |
| $100,000 and over | 7,755 (92.0%) | 677 (8.0%) |
Public vs Private Health Insurance Coverage by Age in Hardin County
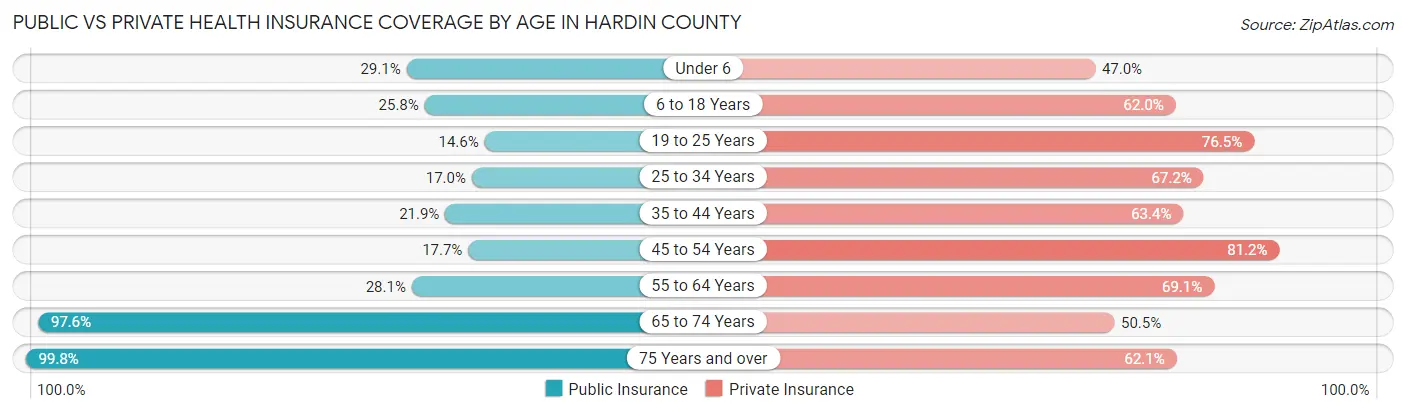
| Age Bracket | Public Insurance | Private Insurance |
| Under 6 | 619 (29.1%) | 999 (47.0%) |
| 6 to 18 Years | 1,441 (25.8%) | 3,468 (62.0%) |
| 19 to 25 Years | 666 (14.6%) | 3,482 (76.5%) |
| 25 to 34 Years | 493 (17.0%) | 1,949 (67.2%) |
| 35 to 44 Years | 713 (21.9%) | 2,060 (63.4%) |
| 45 to 54 Years | 619 (17.7%) | 2,846 (81.2%) |
| 55 to 64 Years | 1,051 (28.1%) | 2,580 (69.1%) |
| 65 to 74 Years | 2,826 (97.6%) | 1,464 (50.5%) |
| 75 Years and over | 1,869 (99.8%) | 1,163 (62.1%) |
| Total | 10,297 (33.8%) | 20,011 (65.7%) |
Disability Status by Sex by Age in Hardin County
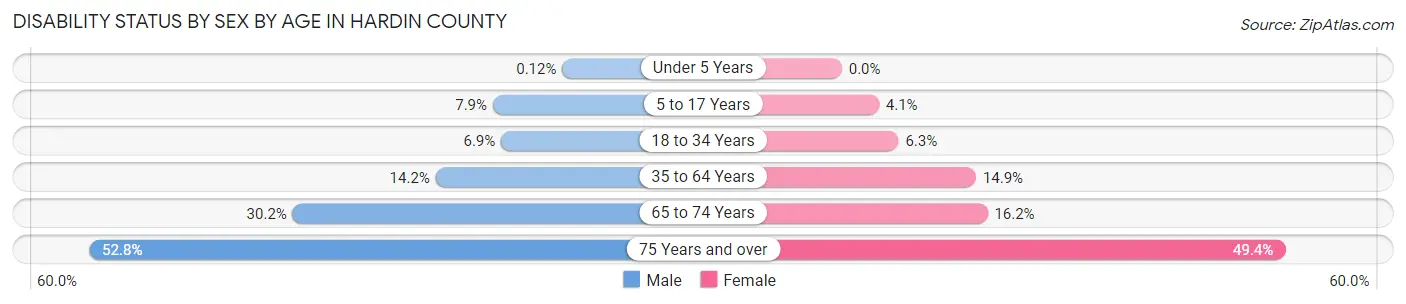
| Age Bracket | Male | Female |
| Under 5 Years | 1 (0.1%) | 0 (0.0%) |
| 5 to 17 Years | 219 (7.9%) | 102 (4.1%) |
| 18 to 34 Years | 284 (6.9%) | 255 (6.3%) |
| 35 to 64 Years | 758 (14.2%) | 771 (14.9%) |
| 65 to 74 Years | 407 (30.1%) | 251 (16.2%) |
| 75 Years and over | 440 (52.8%) | 513 (49.4%) |
Disability Class by Sex by Age in Hardin County
Disability Class: Hearing Difficulty
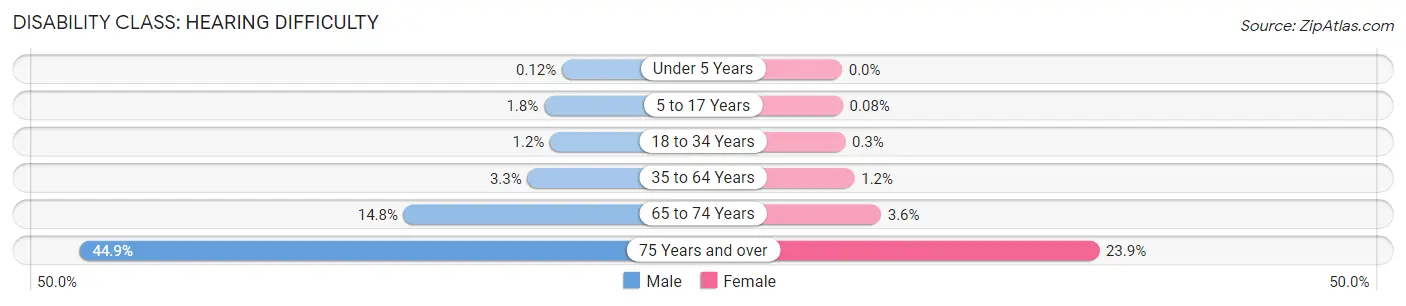
| Age Bracket | Male | Female |
| Under 5 Years | 1 (0.1%) | 0 (0.0%) |
| 5 to 17 Years | 50 (1.8%) | 2 (0.1%) |
| 18 to 34 Years | 50 (1.2%) | 12 (0.3%) |
| 35 to 64 Years | 177 (3.3%) | 60 (1.2%) |
| 65 to 74 Years | 200 (14.8%) | 56 (3.6%) |
| 75 Years and over | 374 (44.9%) | 248 (23.9%) |
Disability Class: Vision Difficulty
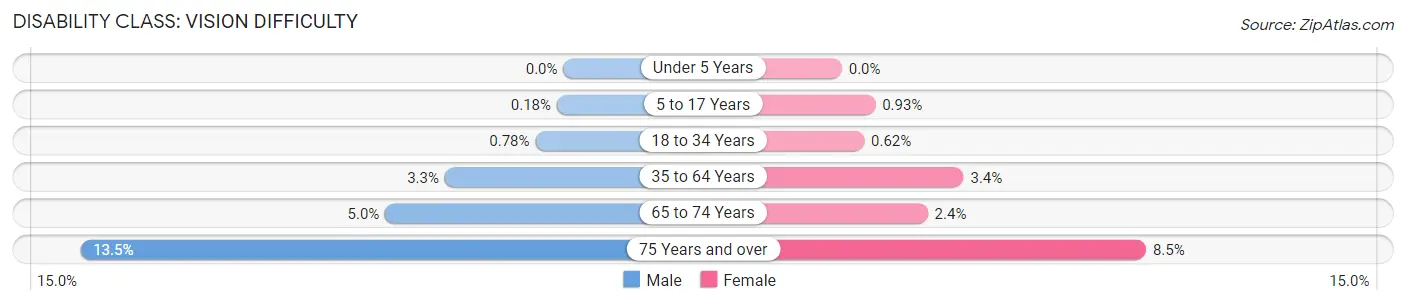
| Age Bracket | Male | Female |
| Under 5 Years | 0 (0.0%) | 0 (0.0%) |
| 5 to 17 Years | 5 (0.2%) | 23 (0.9%) |
| 18 to 34 Years | 32 (0.8%) | 25 (0.6%) |
| 35 to 64 Years | 176 (3.3%) | 175 (3.4%) |
| 65 to 74 Years | 67 (5.0%) | 37 (2.4%) |
| 75 Years and over | 112 (13.5%) | 88 (8.5%) |
Disability Class: Cognitive Difficulty
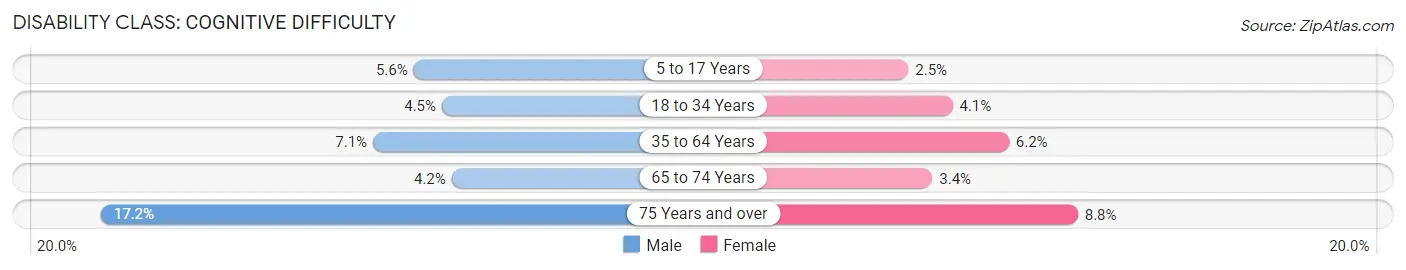
| Age Bracket | Male | Female |
| 5 to 17 Years | 155 (5.6%) | 61 (2.5%) |
| 18 to 34 Years | 185 (4.5%) | 166 (4.1%) |
| 35 to 64 Years | 377 (7.1%) | 320 (6.2%) |
| 65 to 74 Years | 56 (4.2%) | 52 (3.4%) |
| 75 Years and over | 143 (17.2%) | 91 (8.8%) |
Disability Class: Ambulatory Difficulty
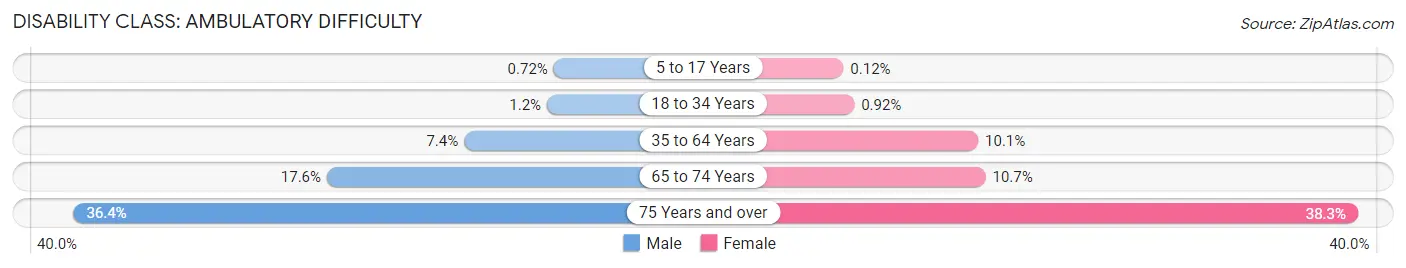
| Age Bracket | Male | Female |
| 5 to 17 Years | 20 (0.7%) | 3 (0.1%) |
| 18 to 34 Years | 50 (1.2%) | 37 (0.9%) |
| 35 to 64 Years | 393 (7.4%) | 522 (10.1%) |
| 65 to 74 Years | 237 (17.6%) | 165 (10.7%) |
| 75 Years and over | 303 (36.4%) | 398 (38.3%) |
Disability Class: Self-Care Difficulty
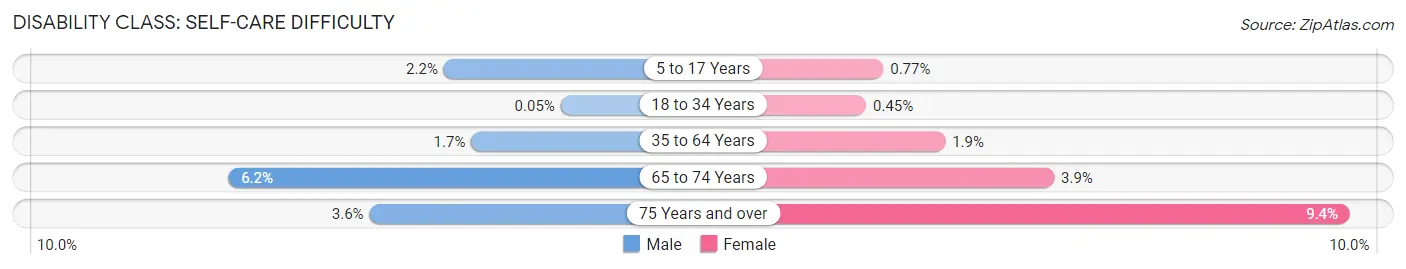
| Age Bracket | Male | Female |
| 5 to 17 Years | 62 (2.2%) | 19 (0.8%) |
| 18 to 34 Years | 2 (0.1%) | 18 (0.4%) |
| 35 to 64 Years | 91 (1.7%) | 99 (1.9%) |
| 65 to 74 Years | 84 (6.2%) | 61 (3.9%) |
| 75 Years and over | 30 (3.6%) | 98 (9.4%) |
Technology Access in Hardin County
Computing Device Access in Hardin County
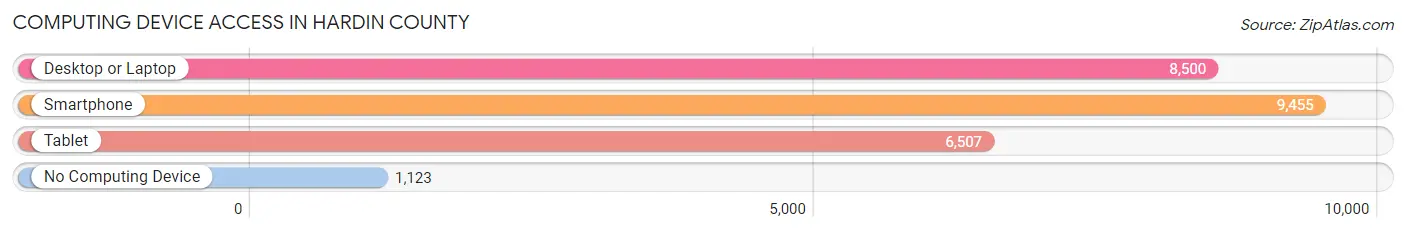
| Device Type | # Households | % Households |
| Desktop or Laptop | 8,500 | 73.0% |
| Smartphone | 9,455 | 81.2% |
| Tablet | 6,507 | 55.9% |
| No Computing Device | 1,123 | 9.7% |
| Total | 11,640 | 100.0% |
Internet Access in Hardin County
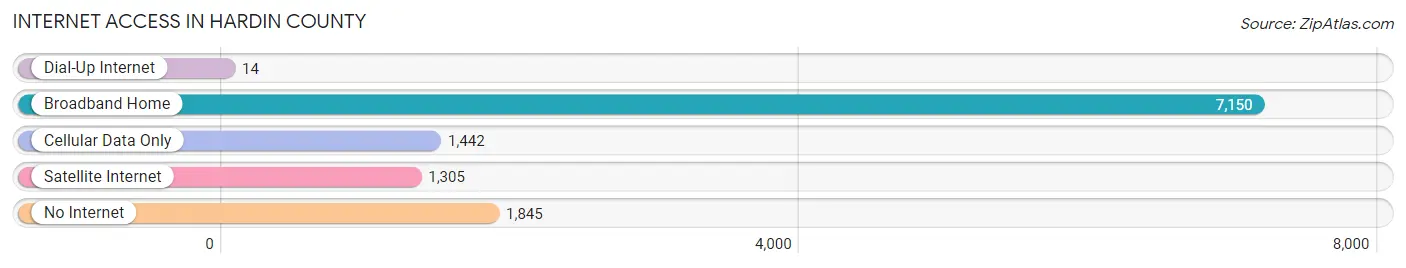
| Internet Type | # Households | % Households |
| Dial-Up Internet | 14 | 0.1% |
| Broadband Home | 7,150 | 61.4% |
| Cellular Data Only | 1,442 | 12.4% |
| Satellite Internet | 1,305 | 11.2% |
| No Internet | 1,845 | 15.9% |
| Total | 11,640 | 100.0% |
Hardin County Summary
Hardin County is located in the northwestern part of the state of Ohio, and is part of the Toledo Metropolitan Statistical Area. The county was established in 1820 and named after John Hardin, a Revolutionary War soldier. The county seat is located in the city of Kenton.
Geography
Hardin County is located in the northwestern part of Ohio, and is bordered by Allen County to the north, Logan County to the east, Union County to the south, and Auglaize and Mercer counties to the west. The county has a total area of 437 square miles, of which 433 square miles is land and 4.2 square miles is water. The county is mostly flat, with some rolling hills in the northern and western parts. The highest point in the county is located in the northwest corner, at an elevation of 1,093 feet.
The county is drained by the Blanchard River, which flows through the center of the county from north to south. Other major waterways in the county include the Scioto River, which forms the western border of the county, and the Auglaize River, which forms the eastern border.
Demographics
As of the 2010 census, Hardin County had a population of 32,380. The racial makeup of the county was 95.2% White, 1.3% African American, 0.3% Native American, 0.5% Asian, 0.1% Pacific Islander, 1.2% from other races, and 1.4% from two or more races. Hispanic or Latino of any race were 2.7% of the population.
The median household income in the county was $45,845, and the median family income was $54,845. The per capita income was $21,845. About 11.2% of the population was below the poverty line.
Economy
Agriculture is the main economic activity in Hardin County. The county is home to a variety of crops, including corn, soybeans, wheat, hay, and oats. Livestock production is also important, with beef cattle, dairy cattle, and hogs being the main types of livestock raised in the county.
Manufacturing is also an important part of the economy. The county is home to several manufacturing companies, including a steel mill, a paper mill, and a plastics plant.
The county is also home to several tourist attractions, including the Hardin County Historical Museum, the Hardin County Fairgrounds, and the Hardin County Speedway.
Conclusion
Hardin County is a rural county located in the northwestern part of Ohio. The county is home to a variety of agricultural and manufacturing activities, as well as several tourist attractions. The county has a population of 32,380, and the median household income is $45,845. Hardin County is an important part of the state of Ohio, and its economy is an important contributor to the state’s overall economy.
Common Questions
What is the Total Population of Hardin County?
Total Population of Hardin County is 30,622.
What is the Total Male Population of Hardin County?
Total Male Population of Hardin County is 15,312.
What is the Total Female Population of Hardin County?
Total Female Population of Hardin County is 15,310.
What is the Ratio of Males per 100 Females in Hardin County?
There are 100.01 Males per 100 Females in Hardin County.
What is the Ratio of Females per 100 Males in Hardin County?
There are 99.99 Females per 100 Males in Hardin County.
What is the Median Population Age in Hardin County?
Median Population Age in Hardin County is 35.6 Years.
What is the Average Family Size in Hardin County
Average Family Size in Hardin County is 3.0 People.
What is the Average Household Size in Hardin County
Average Household Size in Hardin County is 2.5 People.
What is Per Capita Income in Hardin County?
Per Capita income in Hardin County is $27,566.
What is the Median Family Income in Hardin County?
Median Family Income in Hardin County is $69,626.
What is the Median Household income in Hardin County?
Median Household Income in Hardin County is $55,876.
What is Income or Wage Gap in Hardin County?
Income or Wage Gap in Hardin County is 48.6%.
Women in Hardin County earn 51.4 cents for every dollar earned by a man.
What is Family Income Deficit in Hardin County?
Family Income Deficit in Hardin County is $13,168.
Families that are below poverty line in Hardin County earn $13,168 less on average than the poverty threshold level.
What is Inequality or Gini Index in Hardin County?
Inequality or Gini Index in Hardin County is 0.42.
How Large is the Labor Force in Hardin County?
There are 14,584 People in the Labor Forcein in Hardin County.
What is the Percentage of People in the Labor Force in Hardin County?
59.7% of People are in the Labor Force in Hardin County.
What is the Unemployment Rate in Hardin County?
Unemployment Rate in Hardin County is 4.7%.