Guernsey County, OH
Guernsey County Map
Guernsey County Overview
38,409
TOTAL POPULATION
19,218
MALE POPULATION
19,191
FEMALE POPULATION
100.14
MALES / 100 FEMALES
99.86
FEMALES / 100 MALES
42.6
MEDIAN AGE
2.9
AVG FAMILY SIZE
2.3
AVG HOUSEHOLD SIZE
$29,642
PER CAPITA INCOME
$67,480
AVG FAMILY INCOME
$53,901
AVG HOUSEHOLD INCOME
32.7%
WAGE / INCOME GAP [ % ]
67.3¢/ $1
WAGE / INCOME GAP [ $ ]
$12,937
FAMILY INCOME DEFICIT
0.43
INEQUALITY / GINI INDEX
17,566
LABOR FORCE [ PEOPLE ]
56.7%
PERCENT IN LABOR FORCE
4.6%
UNEMPLOYMENT RATE
Guernsey County Area Codes
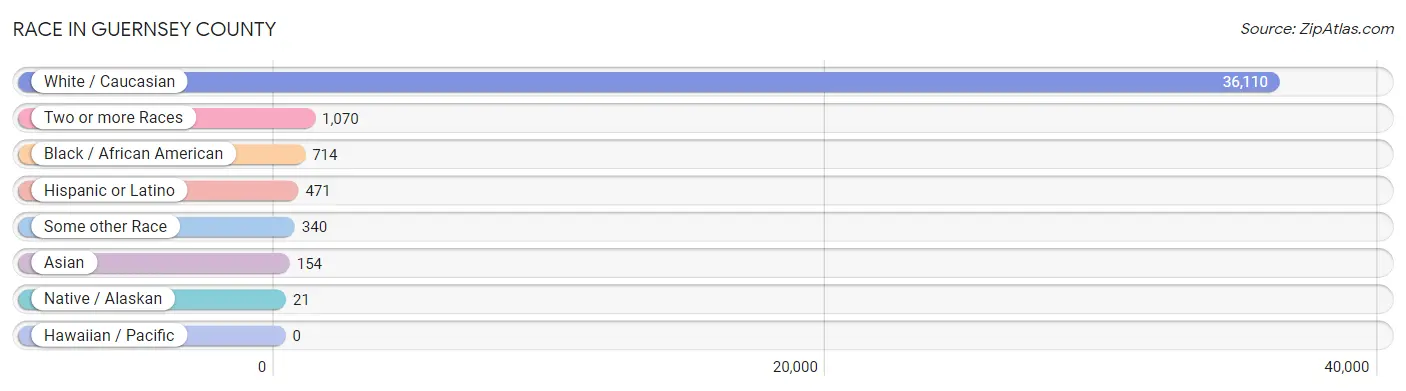
Race in Guernsey County
The most populous races in Guernsey County are White / Caucasian (36,110 | 94.0%), Two or more Races (1,070 | 2.8%), and Black / African American (714 | 1.9%).
| Race | # Population | % Population |
| Asian | 154 | 0.4% |
| Black / African American | 714 | 1.9% |
| Hawaiian / Pacific | 0 | 0.0% |
| Hispanic or Latino | 471 | 1.2% |
| Native / Alaskan | 21 | 0.1% |
| White / Caucasian | 36,110 | 94.0% |
| Two or more Races | 1,070 | 2.8% |
| Some other Race | 340 | 0.9% |
| Total | 38,409 | 100.0% |
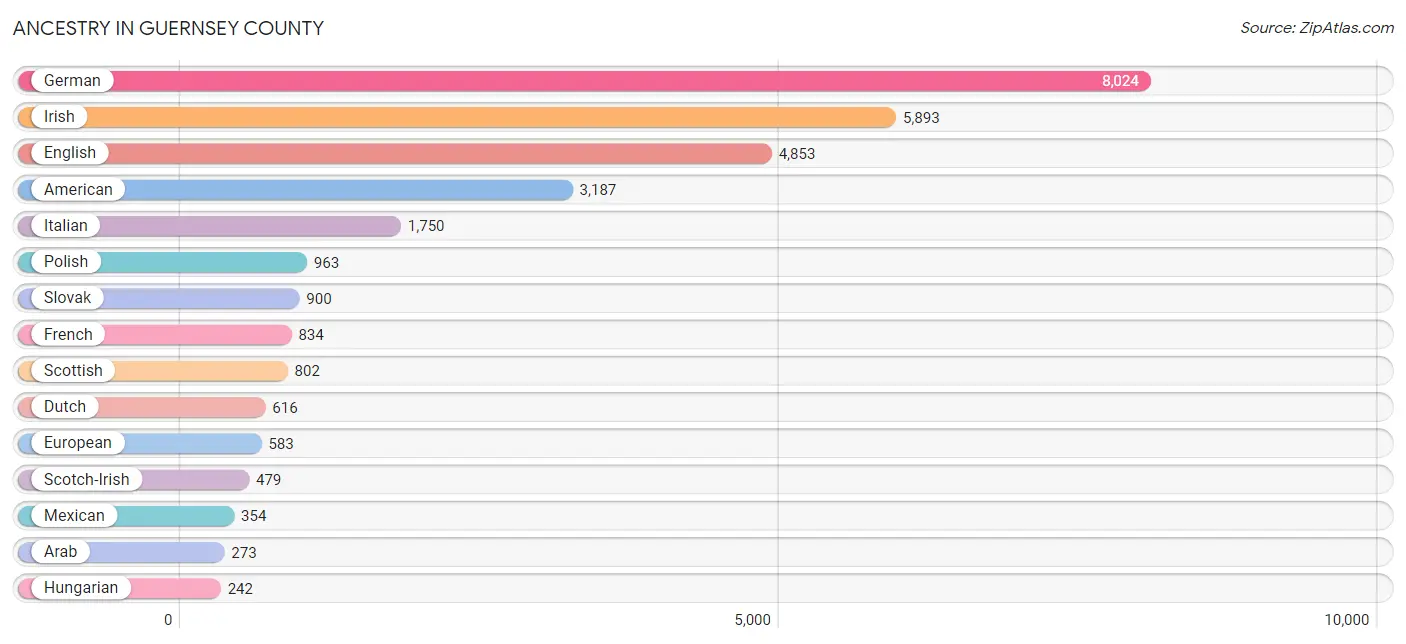
Ancestry in Guernsey County
The most populous ancestries reported in Guernsey County are German (8,024 | 20.9%), Irish (5,893 | 15.3%), English (4,853 | 12.6%), American (3,187 | 8.3%), and Italian (1,750 | 4.6%), together accounting for 61.7% of all Guernsey County residents.
| Ancestry | # Population | % Population |
| African | 117 | 0.3% |
| American | 3,187 | 8.3% |
| Arab | 273 | 0.7% |
| Austrian | 91 | 0.2% |
| Belgian | 23 | 0.1% |
| Bhutanese | 23 | 0.1% |
| Blackfeet | 12 | 0.0% |
| British | 147 | 0.4% |
| Burmese | 38 | 0.1% |
| Canadian | 7 | 0.0% |
| Carpatho Rusyn | 17 | 0.0% |
| Central American | 3 | 0.0% |
| Cherokee | 109 | 0.3% |
| Chippewa | 4 | 0.0% |
| Czech | 195 | 0.5% |
| Czechoslovakian | 95 | 0.3% |
| Danish | 5 | 0.0% |
| Dutch | 616 | 1.6% |
| Eastern European | 51 | 0.1% |
| Ecuadorian | 14 | 0.0% |
| Egyptian | 17 | 0.0% |
| English | 4,853 | 12.6% |
| European | 583 | 1.5% |
| Finnish | 10 | 0.0% |
| French | 834 | 2.2% |
| French Canadian | 142 | 0.4% |
| German | 8,024 | 20.9% |
| Greek | 31 | 0.1% |
| Hungarian | 242 | 0.6% |
| Indian (Asian) | 58 | 0.2% |
| Iraqi | 1 | 0.0% |
| Irish | 5,893 | 15.3% |
| Iroquois | 1 | 0.0% |
| Italian | 1,750 | 4.6% |
| Jamaican | 20 | 0.1% |
| Korean | 10 | 0.0% |
| Lebanese | 219 | 0.6% |
| Lithuanian | 4 | 0.0% |
| Malaysian | 5 | 0.0% |
| Mexican | 354 | 0.9% |
| Native Hawaiian | 10 | 0.0% |
| Northern European | 8 | 0.0% |
| Norwegian | 52 | 0.1% |
| Pakistani | 17 | 0.0% |
| Pennsylvania German | 38 | 0.1% |
| Polish | 963 | 2.5% |
| Puerto Rican | 20 | 0.1% |
| Romanian | 19 | 0.1% |
| Russian | 179 | 0.5% |
| Salvadoran | 3 | 0.0% |
| Scandinavian | 30 | 0.1% |
| Scotch-Irish | 479 | 1.3% |
| Scottish | 802 | 2.1% |
| Serbian | 32 | 0.1% |
| Slovak | 900 | 2.3% |
| Slovene | 12 | 0.0% |
| South American | 14 | 0.0% |
| Spaniard | 7 | 0.0% |
| Spanish | 18 | 0.1% |
| Sri Lankan | 43 | 0.1% |
| Subsaharan African | 118 | 0.3% |
| Swedish | 58 | 0.2% |
| Swiss | 231 | 0.6% |
| Syrian | 35 | 0.1% |
| Thai | 69 | 0.2% |
| Ukrainian | 63 | 0.2% |
| Welsh | 212 | 0.5% | View All 67 Rows |
Immigrants in Guernsey County
The most numerous immigrant groups reported in Guernsey County came from Asia (188 | 0.5%), Latin America (101 | 0.3%), Central America (87 | 0.2%), Mexico (87 | 0.2%), and Europe (64 | 0.2%), together accounting for 1.4% of all Guernsey County residents.

| Immigration Origin | # Population | % Population |
| Asia | 188 | 0.5% |
| Canada | 20 | 0.1% |
| Central America | 87 | 0.2% |
| China | 58 | 0.2% |
| Eastern Asia | 58 | 0.2% |
| Eastern Europe | 38 | 0.1% |
| Ecuador | 14 | 0.0% |
| Europe | 64 | 0.2% |
| India | 42 | 0.1% |
| Iraq | 2 | 0.0% |
| Latin America | 101 | 0.3% |
| Lebanon | 24 | 0.1% |
| Mexico | 87 | 0.2% |
| Netherlands | 19 | 0.1% |
| Pakistan | 3 | 0.0% |
| Philippines | 3 | 0.0% |
| Poland | 19 | 0.1% |
| Romania | 19 | 0.1% |
| South America | 14 | 0.0% |
| South Central Asia | 45 | 0.1% |
| South Eastern Asia | 42 | 0.1% |
| Southern Europe | 7 | 0.0% |
| Spain | 7 | 0.0% |
| Thailand | 17 | 0.0% |
| Vietnam | 22 | 0.1% |
| Western Asia | 26 | 0.1% |
| Western Europe | 19 | 0.1% | View All 27 Rows |
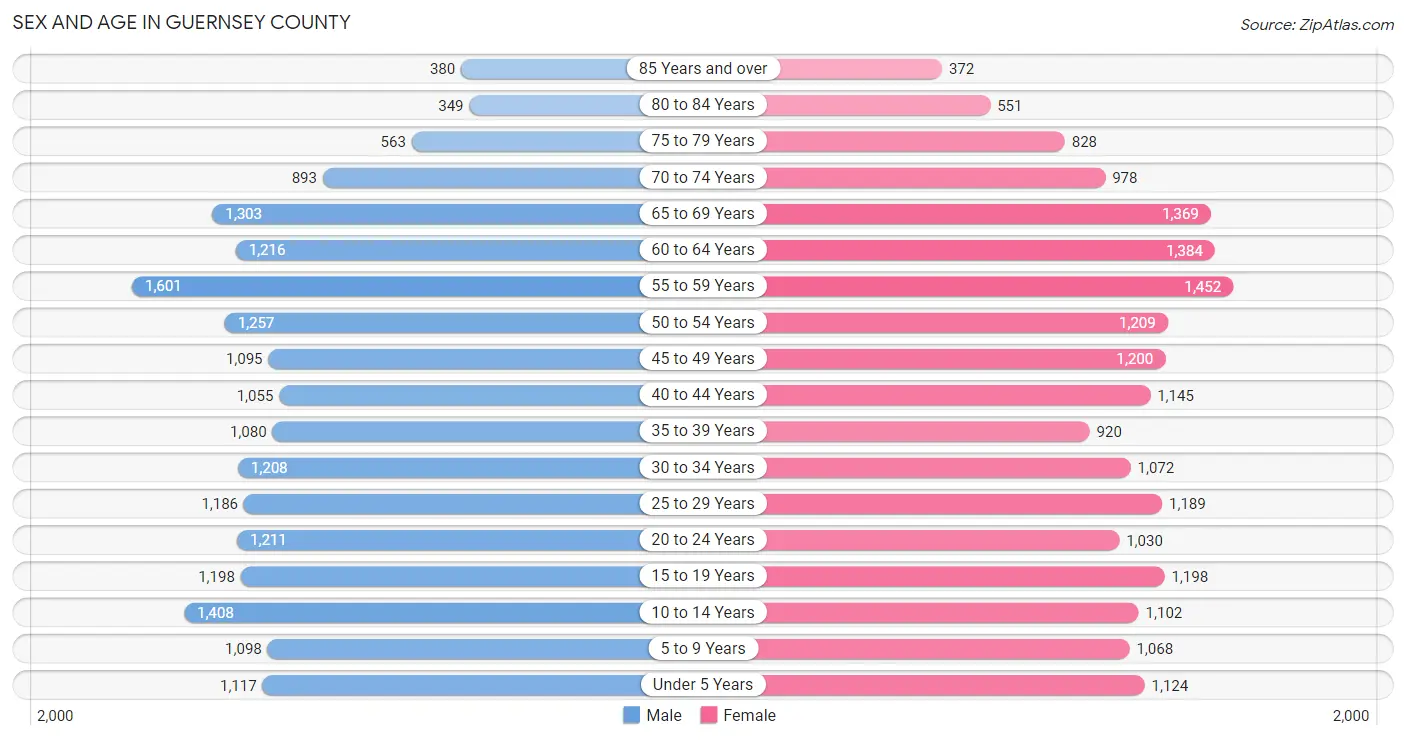
Sex and Age in Guernsey County
Sex and Age in Guernsey County
The most populous age groups in Guernsey County are 55 to 59 Years (1,601 | 8.3%) for men and 55 to 59 Years (1,452 | 7.6%) for women.
| Age Bracket | Male | Female |
| Under 5 Years | 1,117 (5.8%) | 1,124 (5.9%) |
| 5 to 9 Years | 1,098 (5.7%) | 1,068 (5.6%) |
| 10 to 14 Years | 1,408 (7.3%) | 1,102 (5.7%) |
| 15 to 19 Years | 1,198 (6.2%) | 1,198 (6.2%) |
| 20 to 24 Years | 1,211 (6.3%) | 1,030 (5.4%) |
| 25 to 29 Years | 1,186 (6.2%) | 1,189 (6.2%) |
| 30 to 34 Years | 1,208 (6.3%) | 1,072 (5.6%) |
| 35 to 39 Years | 1,080 (5.6%) | 920 (4.8%) |
| 40 to 44 Years | 1,055 (5.5%) | 1,145 (6.0%) |
| 45 to 49 Years | 1,095 (5.7%) | 1,200 (6.2%) |
| 50 to 54 Years | 1,257 (6.5%) | 1,209 (6.3%) |
| 55 to 59 Years | 1,601 (8.3%) | 1,452 (7.6%) |
| 60 to 64 Years | 1,216 (6.3%) | 1,384 (7.2%) |
| 65 to 69 Years | 1,303 (6.8%) | 1,369 (7.1%) |
| 70 to 74 Years | 893 (4.6%) | 978 (5.1%) |
| 75 to 79 Years | 563 (2.9%) | 828 (4.3%) |
| 80 to 84 Years | 349 (1.8%) | 551 (2.9%) |
| 85 Years and over | 380 (2.0%) | 372 (1.9%) |
| Total | 19,218 (100.0%) | 19,191 (100.0%) |
Families and Households in Guernsey County
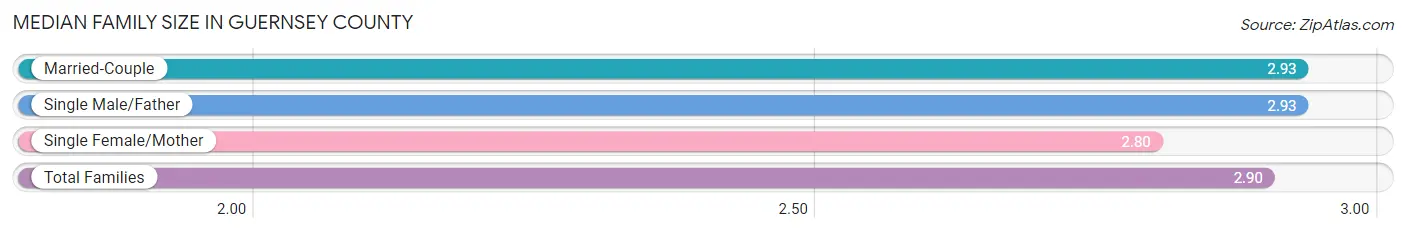
Median Family Size in Guernsey County
The median family size in Guernsey County is 2.90 persons per family, with married-couple families (7,211 | 71.2%) accounting for the largest median family size of 2.93 persons per family. On the other hand, single female/mother families (1,988 | 19.6%) represent the smallest median family size with 2.80 persons per family.
| Family Type | # Families | Family Size |
| Married-Couple | 7,211 (71.2%) | 2.93 |
| Single Male/Father | 935 (9.2%) | 2.93 |
| Single Female/Mother | 1,988 (19.6%) | 2.80 |
| Total Families | 10,134 (100.0%) | 2.90 |
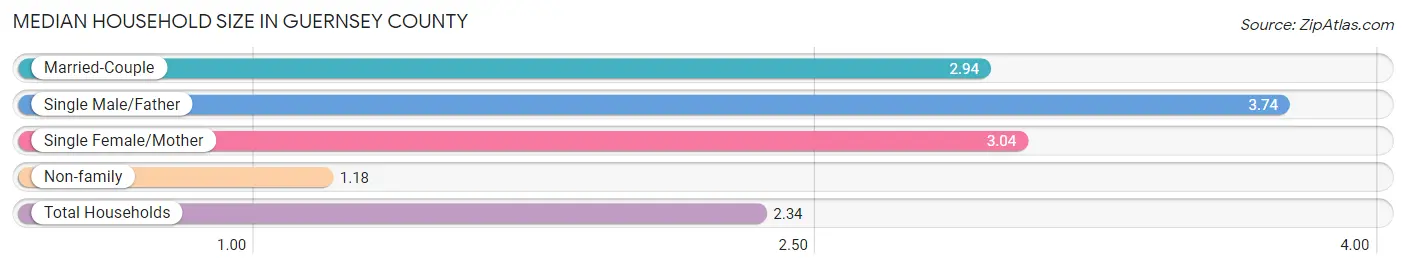
Median Household Size in Guernsey County
The median household size in Guernsey County is 2.34 persons per household, with single male/father households (935 | 5.8%) accounting for the largest median household size of 3.74 persons per household. non-family households (6,031 | 37.3%) represent the smallest median household size with 1.18 persons per household.
| Household Type | # Households | Household Size |
| Married-Couple | 7,211 (44.6%) | 2.94 |
| Single Male/Father | 935 (5.8%) | 3.74 |
| Single Female/Mother | 1,988 (12.3%) | 3.04 |
| Non-family | 6,031 (37.3%) | 1.18 |
| Total Households | 16,165 (100.0%) | 2.34 |
Household Size by Marriage Status in Guernsey County
Out of a total of 16,165 households in Guernsey County, 10,134 (62.7%) are family households, while 6,031 (37.3%) are nonfamily households. The most numerous type of family households are 2-person households, comprising 4,875, and the most common type of nonfamily households are 1-person households, comprising 5,160.

| Household Size | Family Households | Nonfamily Households |
| 1-Person Households | - | 5,160 (31.9%) |
| 2-Person Households | 4,875 (30.2%) | 799 (4.9%) |
| 3-Person Households | 1,955 (12.1%) | 33 (0.2%) |
| 4-Person Households | 2,057 (12.7%) | 13 (0.1%) |
| 5-Person Households | 719 (4.4%) | 26 (0.2%) |
| 6-Person Households | 322 (2.0%) | 0 (0.0%) |
| 7+ Person Households | 206 (1.3%) | 0 (0.0%) |
| Total | 10,134 (62.7%) | 6,031 (37.3%) |
Female Fertility in Guernsey County
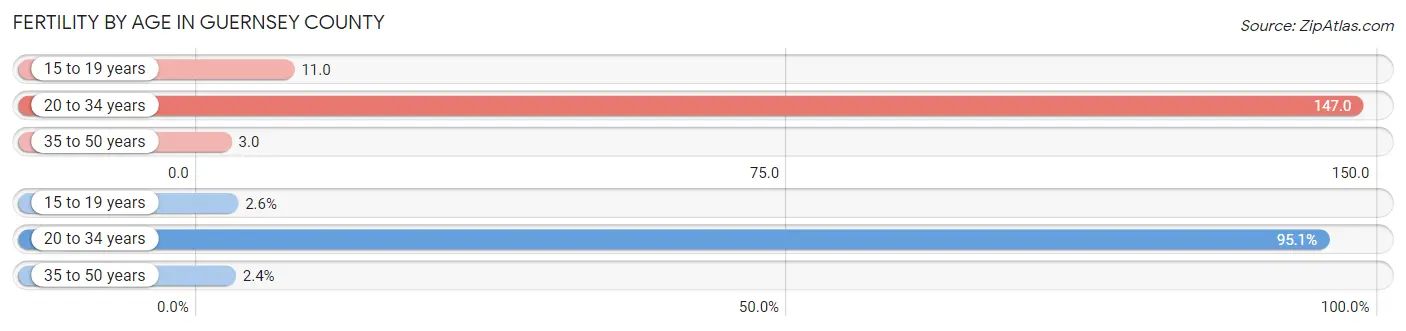
Fertility by Age in Guernsey County
Average fertility rate in Guernsey County is 64.0 births per 1,000 women. Women in the age bracket of 20 to 34 years have the highest fertility rate with 147.0 births per 1,000 women. Women in the age bracket of 20 to 34 years acount for 95.1% of all women with births.
| Age Bracket | Women with Births | Births / 1,000 Women |
| 15 to 19 years | 13 (2.6%) | 11.0 |
| 20 to 34 years | 483 (95.1%) | 147.0 |
| 35 to 50 years | 12 (2.4%) | 3.0 |
| Total | 508 (100.0%) | 64.0 |
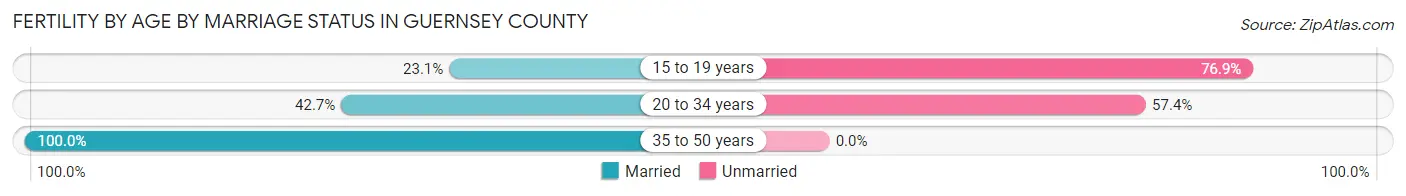
Fertility by Age by Marriage Status in Guernsey County
43.5% of women with births (508) in Guernsey County are married. The highest percentage of unmarried women with births falls into 15 to 19 years age bracket with 76.9% of them unmarried at the time of birth, while the lowest percentage of unmarried women with births belong to 35 to 50 years age bracket with 0.0% of them unmarried.
| Age Bracket | Married | Unmarried |
| 15 to 19 years | 3 (23.1%) | 10 (76.9%) |
| 20 to 34 years | 206 (42.6%) | 277 (57.4%) |
| 35 to 50 years | 12 (100.0%) | 0 (0.0%) |
| Total | 221 (43.5%) | 287 (56.5%) |
Fertility by Education in Guernsey County
Average fertility rate in Guernsey County is 64.0 births per 1,000 women. Women with the education attainment of college or associate's degree have the highest fertility rate of 76.0 births per 1,000 women, while women with the education attainment of graduate degree have the lowest fertility at 15.0 births per 1,000 women. Women with the education attainment of college or associate's degree represent 37.6% of all women with births.

| Educational Attainment | Women with Births | Births / 1,000 Women |
| Less than High School | 136 (26.8%) | 74.0 |
| High School Diploma | 134 (26.4%) | 55.0 |
| College or Associate's Degree | 191 (37.6%) | 76.0 |
| Bachelor's Degree | 41 (8.1%) | 52.0 |
| Graduate Degree | 6 (1.2%) | 15.0 |
| Total | 508 (100.0%) | 64.0 |
Fertility by Education by Marriage Status in Guernsey County
56.5% of women with births in Guernsey County are unmarried. Women with the educational attainment of bachelor's degree are most likely to be married with 100.0% of them married at childbirth, while women with the educational attainment of college or associate's degree are least likely to be married with 67.5% of them unmarried at childbirth.
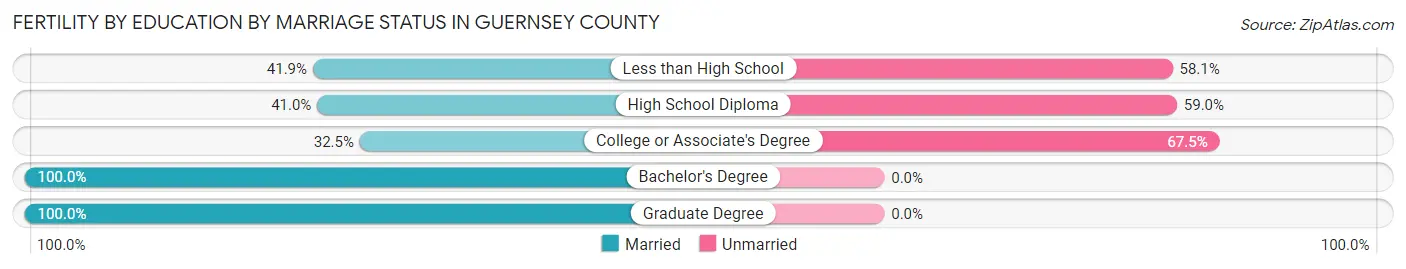
| Educational Attainment | Married | Unmarried |
| Less than High School | 57 (41.9%) | 79 (58.1%) |
| High School Diploma | 55 (41.0%) | 79 (59.0%) |
| College or Associate's Degree | 62 (32.5%) | 129 (67.5%) |
| Bachelor's Degree | 41 (100.0%) | 0 (0.0%) |
| Graduate Degree | 6 (100.0%) | 0 (0.0%) |
| Total | 221 (43.5%) | 287 (56.5%) |
Income in Guernsey County
Income Overview in Guernsey County
Per Capita Income in Guernsey County is $29,642, while median incomes of families and households are $67,480 and $53,901 respectively.
| Characteristic | Number | Measure |
| Per Capita Income | 38,409 | $29,642 |
| Median Family Income | 10,134 | $67,480 |
| Mean Family Income | 10,134 | $79,332 |
| Median Household Income | 16,165 | $53,901 |
| Mean Household Income | 16,165 | $69,452 |
| Income Deficit | 10,134 | $12,937 |
| Wage / Income Gap (%) | 38,409 | 32.66% |
| Wage / Income Gap ($) | 38,409 | 67.34¢ per $1 |
| Gini / Inequality Index | 38,409 | 0.43 |
Earnings by Sex in Guernsey County
Average Earnings in Guernsey County are $34,202, $41,134 for men and $27,701 for women, a difference of 32.7%.
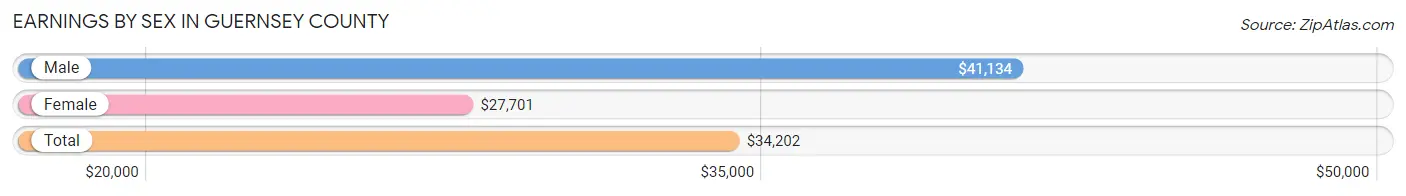
| Sex | Number | Average Earnings |
| Male | 10,076 (53.0%) | $41,134 |
| Female | 8,944 (47.0%) | $27,701 |
| Total | 19,020 (100.0%) | $34,202 |
Earnings by Sex by Income Bracket in Guernsey County
The most common earnings brackets in Guernsey County are $55,000 to $64,999 for men (1,016 | 10.1%) and $2,499 or less for women (823 | 9.2%).
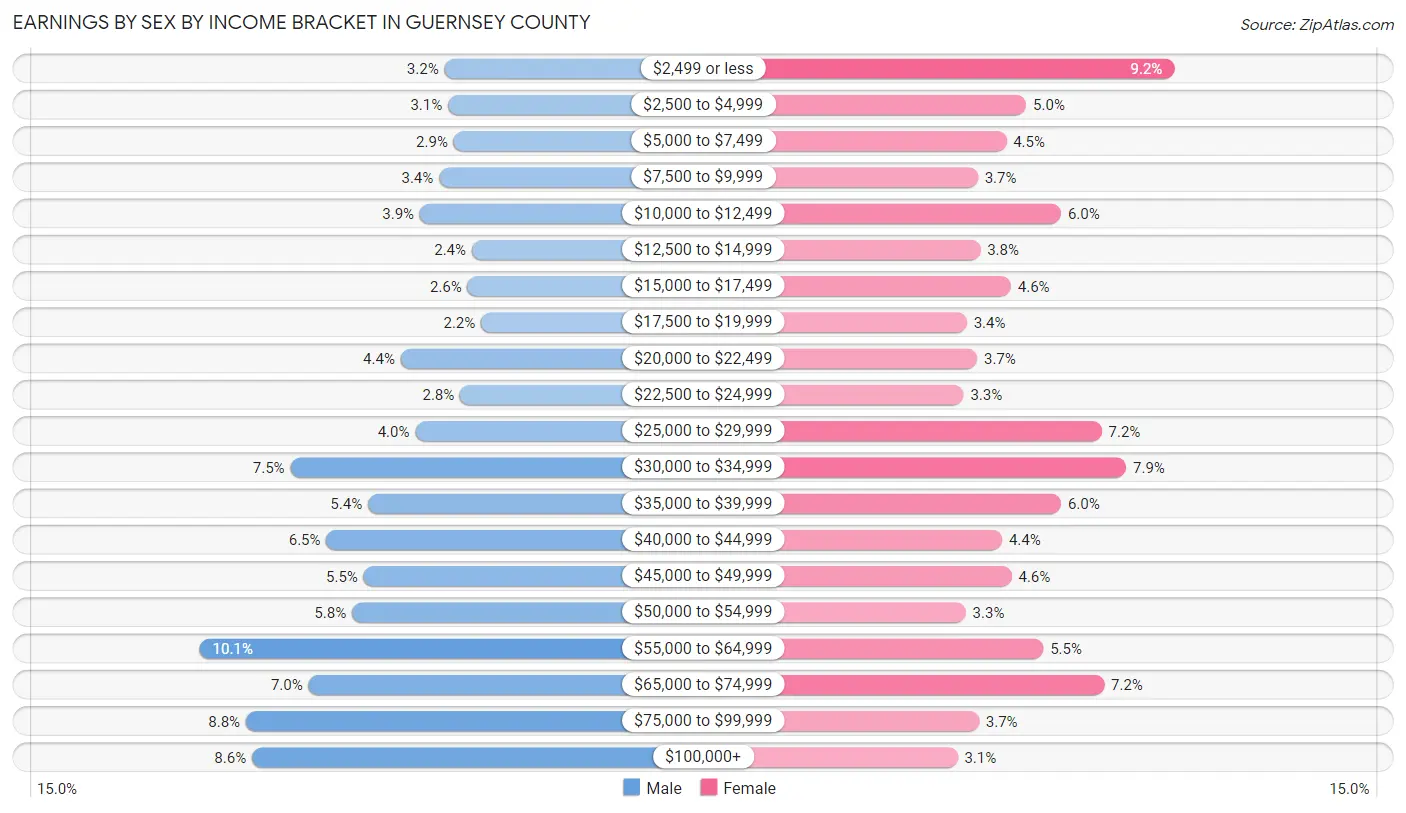
| Income | Male | Female |
| $2,499 or less | 322 (3.2%) | 823 (9.2%) |
| $2,500 to $4,999 | 312 (3.1%) | 451 (5.0%) |
| $5,000 to $7,499 | 296 (2.9%) | 401 (4.5%) |
| $7,500 to $9,999 | 338 (3.4%) | 329 (3.7%) |
| $10,000 to $12,499 | 392 (3.9%) | 538 (6.0%) |
| $12,500 to $14,999 | 245 (2.4%) | 335 (3.7%) |
| $15,000 to $17,499 | 257 (2.5%) | 412 (4.6%) |
| $17,500 to $19,999 | 219 (2.2%) | 301 (3.4%) |
| $20,000 to $22,499 | 446 (4.4%) | 327 (3.7%) |
| $22,500 to $24,999 | 278 (2.8%) | 293 (3.3%) |
| $25,000 to $29,999 | 405 (4.0%) | 640 (7.2%) |
| $30,000 to $34,999 | 759 (7.5%) | 702 (7.9%) |
| $35,000 to $39,999 | 539 (5.3%) | 538 (6.0%) |
| $40,000 to $44,999 | 657 (6.5%) | 390 (4.4%) |
| $45,000 to $49,999 | 551 (5.5%) | 414 (4.6%) |
| $50,000 to $54,999 | 584 (5.8%) | 299 (3.3%) |
| $55,000 to $64,999 | 1,016 (10.1%) | 494 (5.5%) |
| $65,000 to $74,999 | 707 (7.0%) | 647 (7.2%) |
| $75,000 to $99,999 | 885 (8.8%) | 332 (3.7%) |
| $100,000+ | 868 (8.6%) | 278 (3.1%) |
| Total | 10,076 (100.0%) | 8,944 (100.0%) |
Earnings by Sex by Educational Attainment in Guernsey County
Average earnings in Guernsey County are $46,260 for men and $32,819 for women, a difference of 29.1%. Men with an educational attainment of graduate degree enjoy the highest average annual earnings of $79,167, while those with less than high school education earn the least with $34,720. Women with an educational attainment of graduate degree earn the most with the average annual earnings of $67,617, while those with less than high school education have the smallest earnings of $10,169.

| Educational Attainment | Male Income | Female Income |
| Less than High School | $34,720 | $10,169 |
| High School Diploma | $42,937 | $28,798 |
| College or Associate's Degree | $47,474 | $32,728 |
| Bachelor's Degree | $58,792 | $49,333 |
| Graduate Degree | $79,167 | $67,617 |
| Total | $46,260 | $32,819 |
Family Income in Guernsey County
Family Income Brackets in Guernsey County
According to the Guernsey County family income data, there are 2,057 families falling into the $50,000 to $74,999 income range, which is the most common income bracket and makes up 20.3% of all families. Conversely, the $10,000 to $14,999 income bracket is the least frequent group with only 294 families (2.9%) belonging to this category.
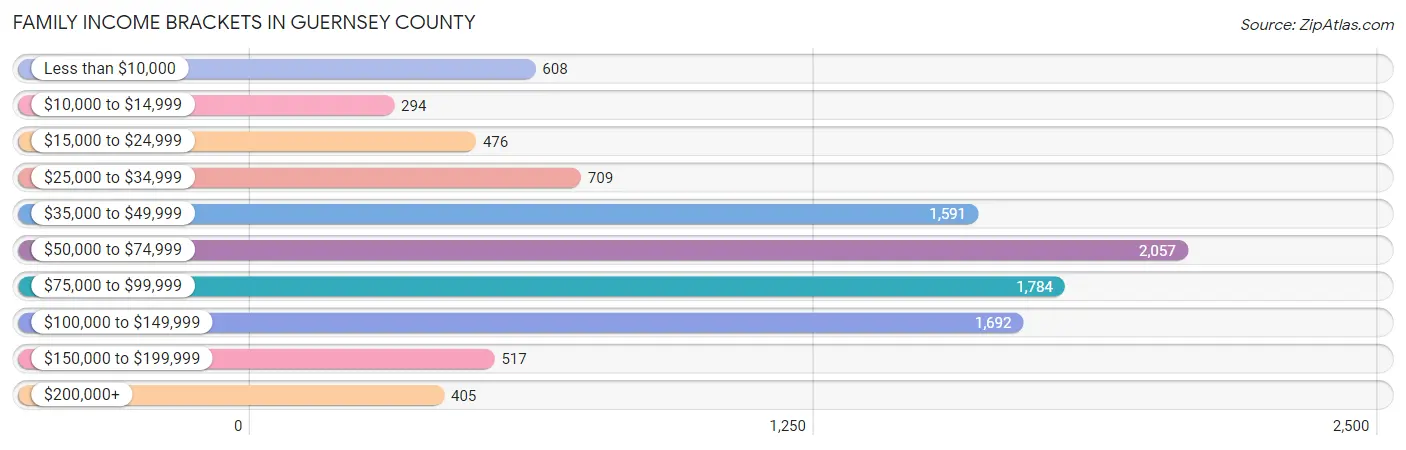
| Income Bracket | # Families | % Families |
| Less than $10,000 | 608 | 6.0% |
| $10,000 to $14,999 | 294 | 2.9% |
| $15,000 to $24,999 | 476 | 4.7% |
| $25,000 to $34,999 | 709 | 7.0% |
| $35,000 to $49,999 | 1,591 | 15.7% |
| $50,000 to $74,999 | 2,057 | 20.3% |
| $75,000 to $99,999 | 1,784 | 17.6% |
| $100,000 to $149,999 | 1,692 | 16.7% |
| $150,000 to $199,999 | 517 | 5.1% |
| $200,000+ | 405 | 4.0% |
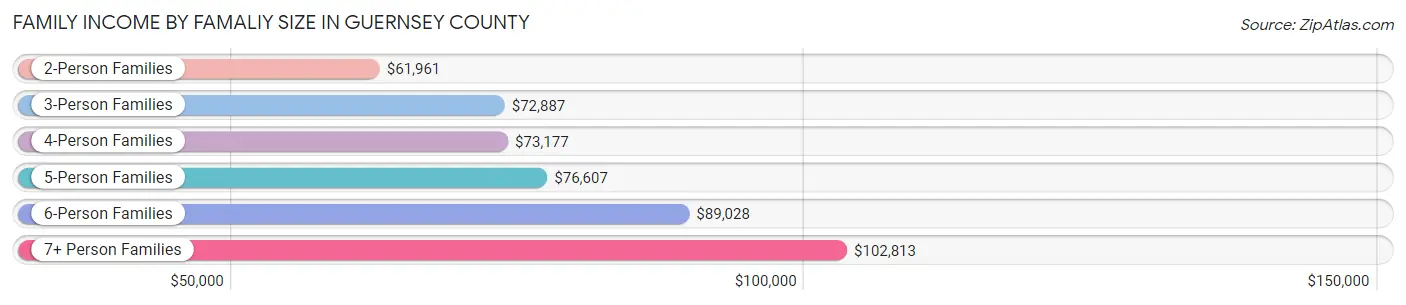
Family Income by Famaliy Size in Guernsey County
7+ person families (109 | 1.1%) account for the highest median family income in Guernsey County with $102,813 per family, while 2-person families (5,173 | 51.0%) have the highest median income of $30,980 per family member.
| Income Bracket | # Families | Median Income |
| 2-Person Families | 5,173 (51.0%) | $61,961 |
| 3-Person Families | 2,206 (21.8%) | $72,887 |
| 4-Person Families | 1,663 (16.4%) | $73,177 |
| 5-Person Families | 736 (7.3%) | $76,607 |
| 6-Person Families | 247 (2.4%) | $89,028 |
| 7+ Person Families | 109 (1.1%) | $102,813 |
| Total | 10,134 (100.0%) | $67,480 |
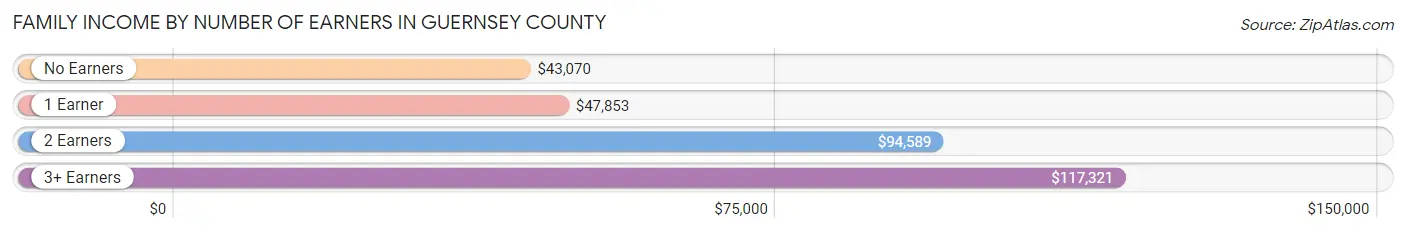
Family Income by Number of Earners in Guernsey County
The median family income in Guernsey County is $67,480, with families comprising 3+ earners (969) having the highest median family income of $117,321, while families with no earners (2,046) have the lowest median family income of $43,070, accounting for 9.6% and 20.2% of families, respectively.
| Number of Earners | # Families | Median Income |
| No Earners | 2,046 (20.2%) | $43,070 |
| 1 Earner | 3,763 (37.1%) | $47,853 |
| 2 Earners | 3,356 (33.1%) | $94,589 |
| 3+ Earners | 969 (9.6%) | $117,321 |
| Total | 10,134 (100.0%) | $67,480 |
Household Income in Guernsey County
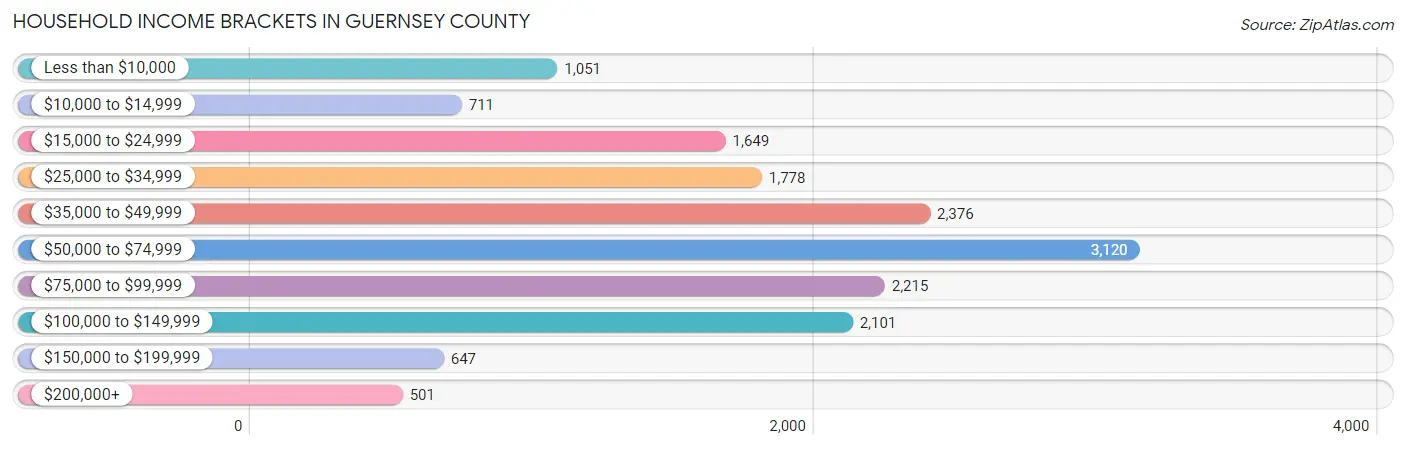
Household Income Brackets in Guernsey County
With 3,120 households falling in the category, the $50,000 to $74,999 income range is the most frequent in Guernsey County, accounting for 19.3% of all households. In contrast, only 501 households (3.1%) fall into the $200,000+ income bracket, making it the least populous group.
| Income Bracket | # Households | % Households |
| Less than $10,000 | 1,051 | 6.5% |
| $10,000 to $14,999 | 711 | 4.4% |
| $15,000 to $24,999 | 1,649 | 10.2% |
| $25,000 to $34,999 | 1,778 | 11.0% |
| $35,000 to $49,999 | 2,376 | 14.7% |
| $50,000 to $74,999 | 3,120 | 19.3% |
| $75,000 to $99,999 | 2,215 | 13.7% |
| $100,000 to $149,999 | 2,101 | 13.0% |
| $150,000 to $199,999 | 647 | 4.0% |
| $200,000+ | 501 | 3.1% |
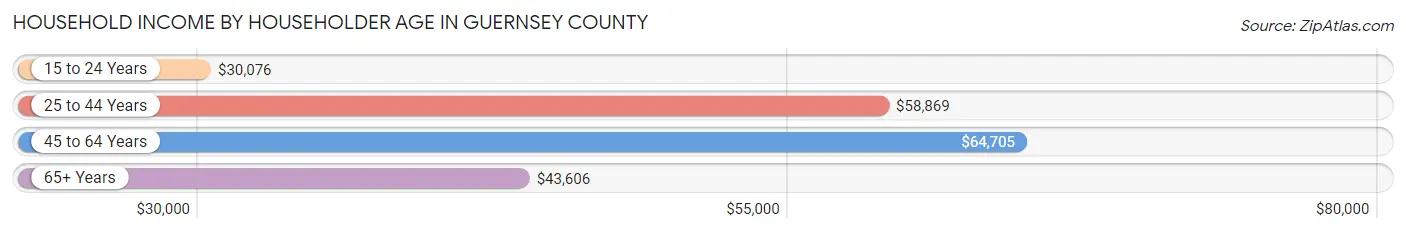
Household Income by Householder Age in Guernsey County
The median household income in Guernsey County is $53,901, with the highest median household income of $64,705 found in the 45 to 64 years age bracket for the primary householder. A total of 6,185 households (38.3%) fall into this category. Meanwhile, the 15 to 24 years age bracket for the primary householder has the lowest median household income of $30,076, with 618 households (3.8%) in this group.
| Income Bracket | # Households | Median Income |
| 15 to 24 Years | 618 (3.8%) | $30,076 |
| 25 to 44 Years | 4,466 (27.6%) | $58,869 |
| 45 to 64 Years | 6,185 (38.3%) | $64,705 |
| 65+ Years | 4,896 (30.3%) | $43,606 |
| Total | 16,165 (100.0%) | $53,901 |
Poverty in Guernsey County
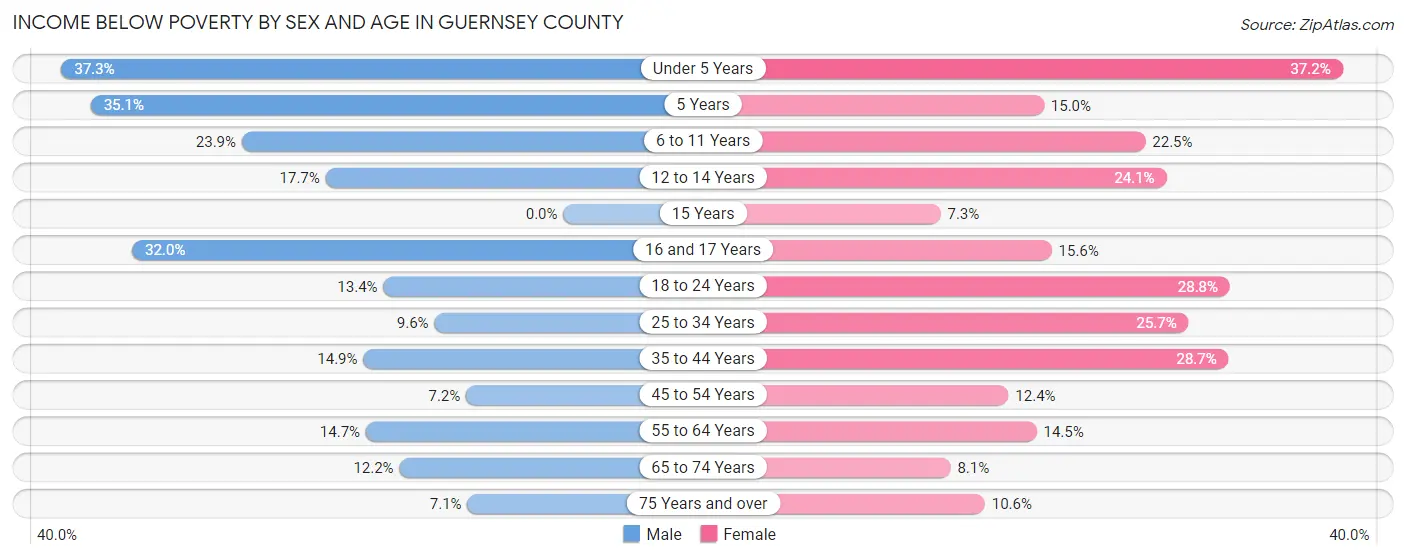
Income Below Poverty by Sex and Age in Guernsey County
With 14.8% poverty level for males and 19.2% for females among the residents of Guernsey County, under 5 year old males and under 5 year old females are the most vulnerable to poverty, with 407 males (37.3%) and 410 females (37.2%) in their respective age groups living below the poverty level.
| Age Bracket | Male | Female |
| Under 5 Years | 407 (37.3%) | 410 (37.2%) |
| 5 Years | 40 (35.1%) | 33 (15.0%) |
| 6 to 11 Years | 408 (23.9%) | 298 (22.5%) |
| 12 to 14 Years | 114 (17.6%) | 148 (24.1%) |
| 15 Years | 0 (0.0%) | 17 (7.3%) |
| 16 and 17 Years | 146 (32.0%) | 91 (15.6%) |
| 18 to 24 Years | 220 (13.4%) | 405 (28.8%) |
| 25 to 34 Years | 227 (9.6%) | 579 (25.7%) |
| 35 to 44 Years | 315 (14.8%) | 590 (28.7%) |
| 45 to 54 Years | 169 (7.2%) | 298 (12.4%) |
| 55 to 64 Years | 410 (14.7%) | 407 (14.5%) |
| 65 to 74 Years | 264 (12.2%) | 187 (8.1%) |
| 75 Years and over | 87 (7.1%) | 178 (10.6%) |
| Total | 2,807 (14.8%) | 3,641 (19.2%) |
Income Above Poverty by Sex and Age in Guernsey County
According to the poverty statistics in Guernsey County, males aged 15 years and females aged 15 years are the age groups that are most secure financially, with 100.0% of males and 92.7% of females in these age groups living above the poverty line.

| Age Bracket | Male | Female |
| Under 5 Years | 685 (62.7%) | 693 (62.8%) |
| 5 Years | 74 (64.9%) | 187 (85.0%) |
| 6 to 11 Years | 1,301 (76.1%) | 1,024 (77.5%) |
| 12 to 14 Years | 532 (82.4%) | 466 (75.9%) |
| 15 Years | 280 (100.0%) | 215 (92.7%) |
| 16 and 17 Years | 310 (68.0%) | 493 (84.4%) |
| 18 to 24 Years | 1,427 (86.6%) | 1,001 (71.2%) |
| 25 to 34 Years | 2,145 (90.4%) | 1,670 (74.3%) |
| 35 to 44 Years | 1,806 (85.2%) | 1,465 (71.3%) |
| 45 to 54 Years | 2,173 (92.8%) | 2,111 (87.6%) |
| 55 to 64 Years | 2,387 (85.3%) | 2,408 (85.5%) |
| 65 to 74 Years | 1,906 (87.8%) | 2,129 (91.9%) |
| 75 Years and over | 1,135 (92.9%) | 1,498 (89.4%) |
| Total | 16,161 (85.2%) | 15,360 (80.8%) |
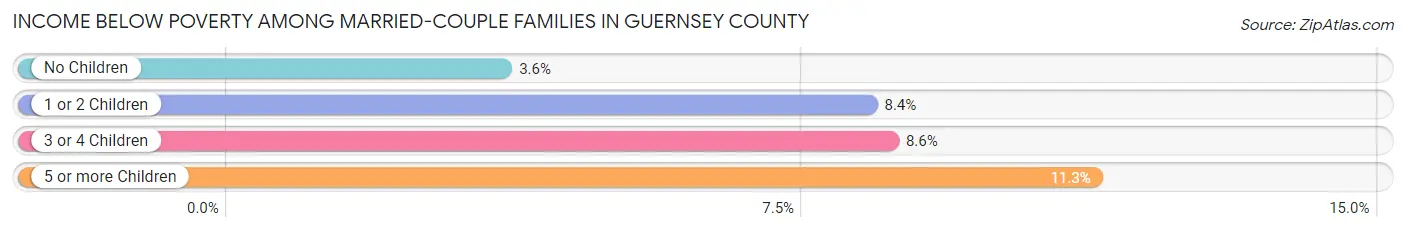
Income Below Poverty Among Married-Couple Families in Guernsey County
The poverty statistics for married-couple families in Guernsey County show that 5.2% or 378 of the total 7,211 families live below the poverty line. Families with 5 or more children have the highest poverty rate of 11.3%, comprising of 7 families. On the other hand, families with no children have the lowest poverty rate of 3.6%, which includes 171 families.
| Children | Above Poverty | Below Poverty |
| No Children | 4,599 (96.4%) | 171 (3.6%) |
| 1 or 2 Children | 1,745 (91.6%) | 159 (8.4%) |
| 3 or 4 Children | 434 (91.4%) | 41 (8.6%) |
| 5 or more Children | 55 (88.7%) | 7 (11.3%) |
| Total | 6,833 (94.8%) | 378 (5.2%) |
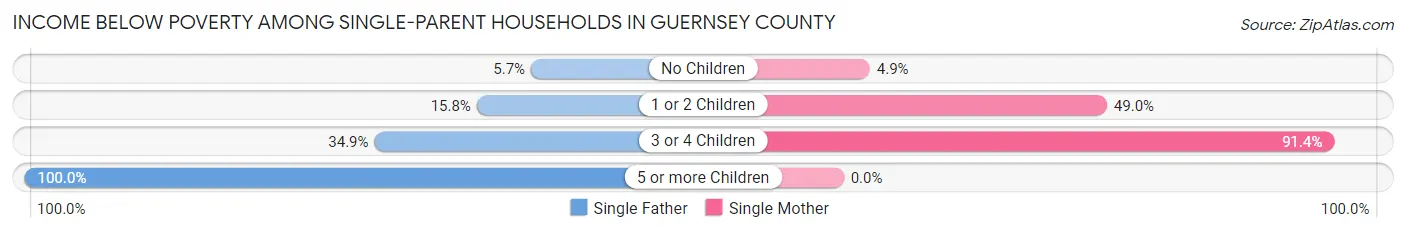
Income Below Poverty Among Single-Parent Households in Guernsey County
According to the poverty data in Guernsey County, 15.9% or 149 single-father households and 40.1% or 797 single-mother households are living below the poverty line. Among single-father households, those with 5 or more children have the highest poverty rate, with 16 households (100.0%) experiencing poverty. Likewise, among single-mother households, those with 3 or 4 children have the highest poverty rate, with 233 households (91.4%) falling below the poverty line.
| Children | Single Father | Single Mother |
| No Children | 21 (5.7%) | 31 (4.9%) |
| 1 or 2 Children | 66 (15.8%) | 533 (49.0%) |
| 3 or 4 Children | 46 (34.8%) | 233 (91.4%) |
| 5 or more Children | 16 (100.0%) | 0 (0.0%) |
| Total | 149 (15.9%) | 797 (40.1%) |
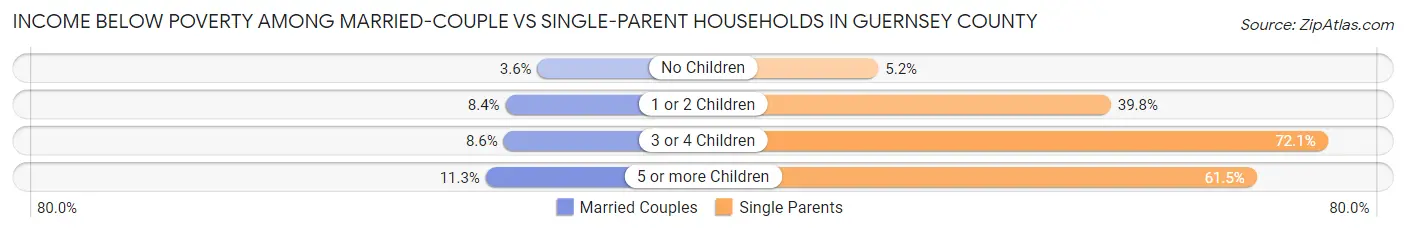
Income Below Poverty Among Married-Couple vs Single-Parent Households in Guernsey County
The poverty data for Guernsey County shows that 378 of the married-couple family households (5.2%) and 946 of the single-parent households (32.4%) are living below the poverty level. Within the married-couple family households, those with 5 or more children have the highest poverty rate, with 7 households (11.3%) falling below the poverty line. Among the single-parent households, those with 3 or 4 children have the highest poverty rate, with 279 household (72.1%) living below poverty.
| Children | Married-Couple Families | Single-Parent Households |
| No Children | 171 (3.6%) | 52 (5.2%) |
| 1 or 2 Children | 159 (8.4%) | 599 (39.8%) |
| 3 or 4 Children | 41 (8.6%) | 279 (72.1%) |
| 5 or more Children | 7 (11.3%) | 16 (61.5%) |
| Total | 378 (5.2%) | 946 (32.4%) |
Employment Characteristics in Guernsey County
Employment by Class of Employer in Guernsey County
Among the 16,560 employed individuals in Guernsey County, private company employees (11,481 | 69.3%), local government employees (1,297 | 7.8%), and not-for-profit organizations (1,163 | 7.0%) make up the most common classes of employment.
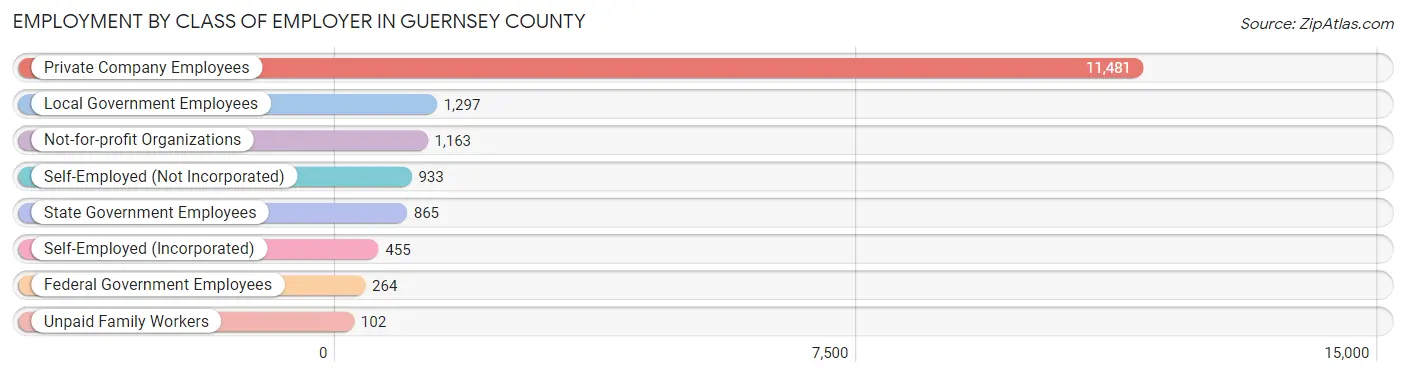
| Employer Class | # Employees | % Employees |
| Private Company Employees | 11,481 | 69.3% |
| Self-Employed (Incorporated) | 455 | 2.8% |
| Self-Employed (Not Incorporated) | 933 | 5.6% |
| Not-for-profit Organizations | 1,163 | 7.0% |
| Local Government Employees | 1,297 | 7.8% |
| State Government Employees | 865 | 5.2% |
| Federal Government Employees | 264 | 1.6% |
| Unpaid Family Workers | 102 | 0.6% |
| Total | 16,560 | 100.0% |
Employment Status by Age in Guernsey County
According to the labor force statistics for Guernsey County, out of the total population over 16 years of age (30,980), 56.7% or 17,566 individuals are in the labor force, with 4.6% or 808 of them unemployed. The age group with the highest labor force participation rate is 25 to 29 years, with 81.1% or 1,926 individuals in the labor force. Within the labor force, the 55 to 59 years age range has the highest percentage of unemployed individuals, with 11.5% or 212 of them being unemployed.

| Age Bracket | In Labor Force | Unemployed |
| 16 to 19 Years | 999 (53.0%) | 36 (3.6%) |
| 20 to 24 Years | 1,602 (71.5%) | 163 (10.2%) |
| 25 to 29 Years | 1,926 (81.1%) | 23 (1.2%) |
| 30 to 34 Years | 1,733 (76.0%) | 107 (6.2%) |
| 35 to 44 Years | 3,289 (78.3%) | 49 (1.5%) |
| 45 to 54 Years | 3,809 (80.0%) | 168 (4.4%) |
| 55 to 59 Years | 1,844 (60.4%) | 212 (11.5%) |
| 60 to 64 Years | 1,305 (50.2%) | 33 (2.5%) |
| 65 to 74 Years | 881 (19.4%) | 5 (0.6%) |
| 75 Years and over | 167 (5.5%) | 0 (0.0%) |
| Total | 17,566 (56.7%) | 808 (4.6%) |
Employment Status by Educational Attainment in Guernsey County
According to labor force statistics for Guernsey County, 72.2% of individuals (13,912) out of the total population between 25 and 64 years of age (19,269) are in the labor force, with 4.3% or 598 of them being unemployed. The group with the highest labor force participation rate are those with the educational attainment of bachelor's degree or higher, with 85.4% or 2,693 individuals in the labor force. Within the labor force, individuals with less than high school education have the highest percentage of unemployment, with 11.3% or 135 of them being unemployed.
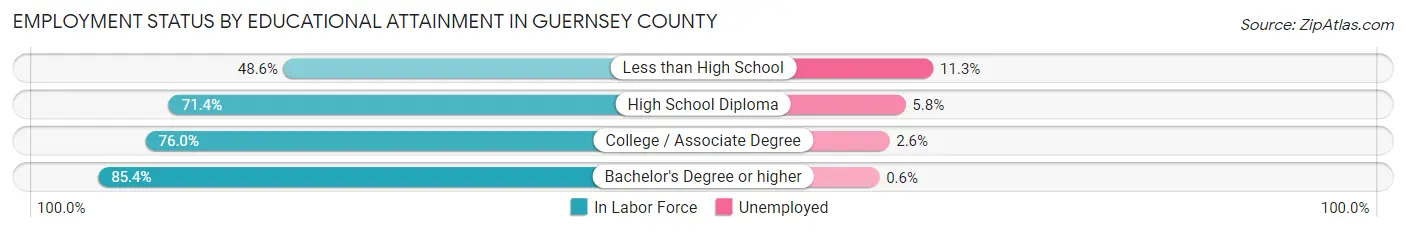
| Educational Attainment | In Labor Force | Unemployed |
| Less than High School | 1,195 (48.6%) | 278 (11.3%) |
| High School Diploma | 5,583 (71.4%) | 454 (5.8%) |
| College / Associate Degree | 4,437 (76.0%) | 152 (2.6%) |
| Bachelor's Degree or higher | 2,693 (85.4%) | 19 (0.6%) |
| Total | 13,912 (72.2%) | 829 (4.3%) |
Employment Occupations by Sex in Guernsey County
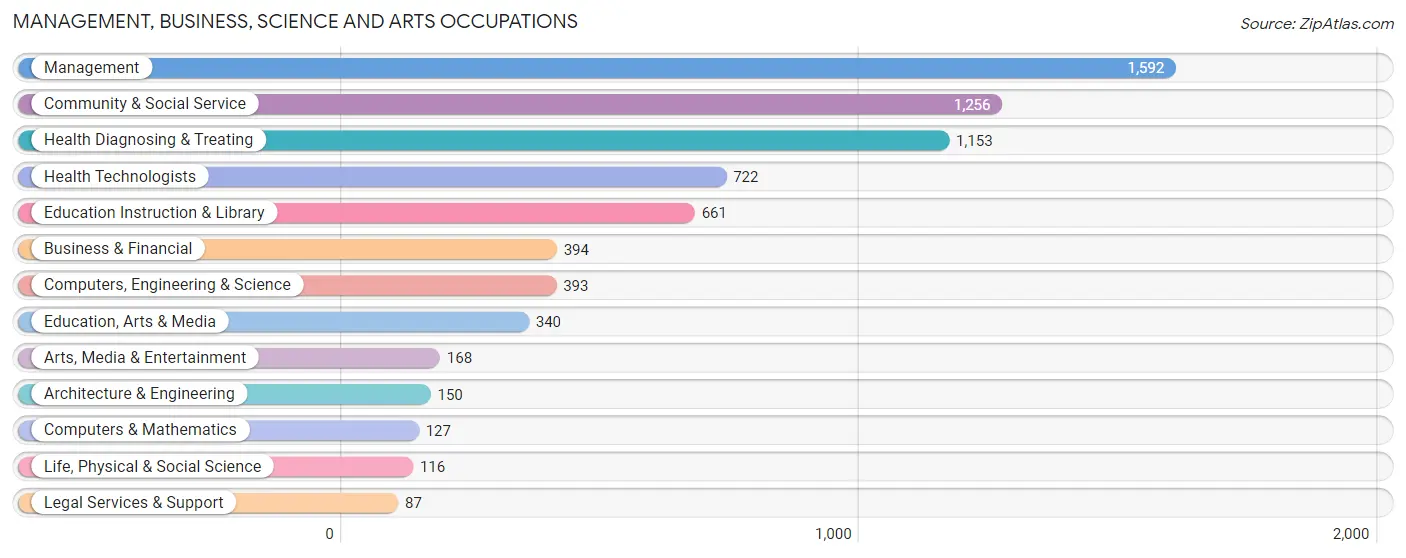
Management, Business, Science and Arts Occupations
The most common Management, Business, Science and Arts occupations in Guernsey County are Management (1,592 | 9.5%), Community & Social Service (1,256 | 7.5%), Health Diagnosing & Treating (1,153 | 6.9%), Health Technologists (722 | 4.3%), and Education Instruction & Library (661 | 4.0%).
Management, Business, Science and Arts Occupations by Sex
Within the Management, Business, Science and Arts occupations in Guernsey County, the most male-oriented occupations are Life, Physical & Social Science (80.2%), Computers, Engineering & Science (77.1%), and Architecture & Engineering (76.0%), while the most female-oriented occupations are Health Diagnosing & Treating (84.4%), Health Technologists (81.7%), and Arts, Media & Entertainment (80.4%).
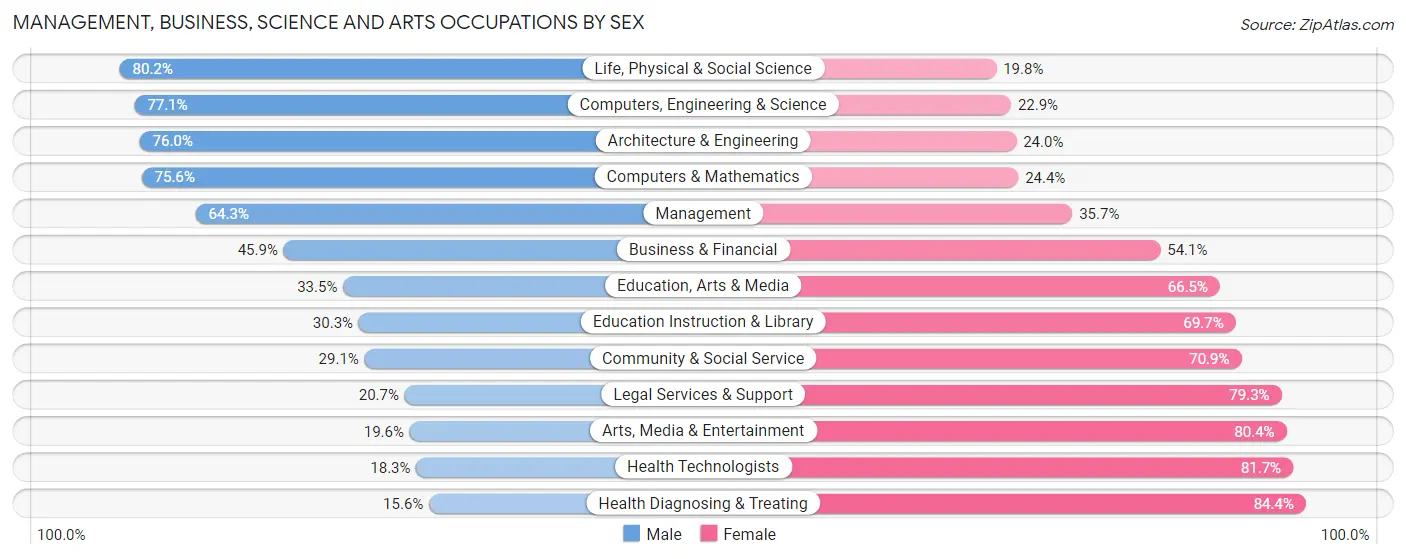
| Occupation | Male | Female |
| Management | 1,024 (64.3%) | 568 (35.7%) |
| Business & Financial | 181 (45.9%) | 213 (54.1%) |
| Computers, Engineering & Science | 303 (77.1%) | 90 (22.9%) |
| Computers & Mathematics | 96 (75.6%) | 31 (24.4%) |
| Architecture & Engineering | 114 (76.0%) | 36 (24.0%) |
| Life, Physical & Social Science | 93 (80.2%) | 23 (19.8%) |
| Community & Social Service | 365 (29.1%) | 891 (70.9%) |
| Education, Arts & Media | 114 (33.5%) | 226 (66.5%) |
| Legal Services & Support | 18 (20.7%) | 69 (79.3%) |
| Education Instruction & Library | 200 (30.3%) | 461 (69.7%) |
| Arts, Media & Entertainment | 33 (19.6%) | 135 (80.4%) |
| Health Diagnosing & Treating | 180 (15.6%) | 973 (84.4%) |
| Health Technologists | 132 (18.3%) | 590 (81.7%) |
| Total (Category) | 2,053 (42.9%) | 2,735 (57.1%) |
| Total (Overall) | 8,838 (52.8%) | 7,887 (47.2%) |
Services Occupations
The most common Services occupations in Guernsey County are Food Preparation & Serving (937 | 5.6%), Healthcare Support (752 | 4.5%), Cleaning & Maintenance (715 | 4.3%), Security & Protection (397 | 2.4%), and Firefighting & Prevention (200 | 1.2%).

Services Occupations by Sex
Within the Services occupations in Guernsey County, the most male-oriented occupations are Law Enforcement (82.7%), Security & Protection (81.9%), and Firefighting & Prevention (81.0%), while the most female-oriented occupations are Personal Care & Service (85.5%), Healthcare Support (84.3%), and Food Preparation & Serving (78.1%).
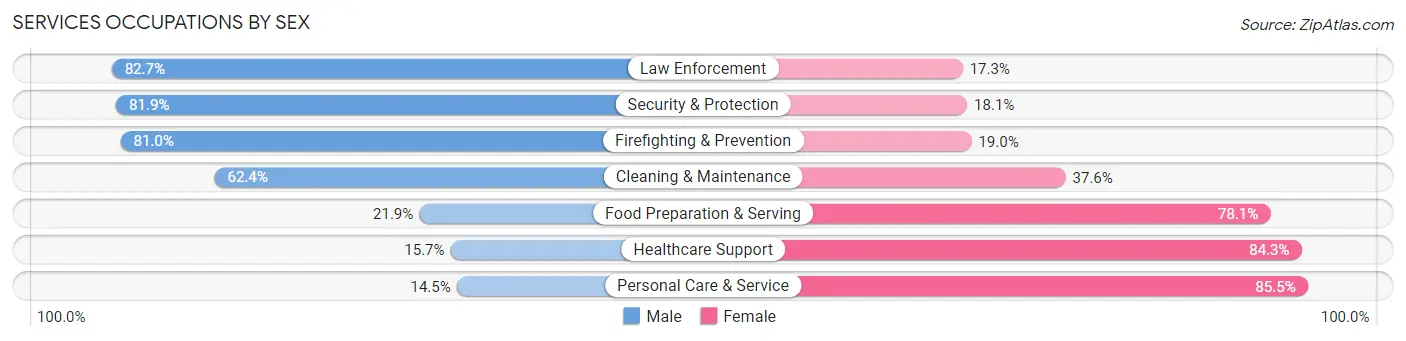
| Occupation | Male | Female |
| Healthcare Support | 118 (15.7%) | 634 (84.3%) |
| Security & Protection | 325 (81.9%) | 72 (18.1%) |
| Firefighting & Prevention | 162 (81.0%) | 38 (19.0%) |
| Law Enforcement | 163 (82.7%) | 34 (17.3%) |
| Food Preparation & Serving | 205 (21.9%) | 732 (78.1%) |
| Cleaning & Maintenance | 446 (62.4%) | 269 (37.6%) |
| Personal Care & Service | 23 (14.5%) | 136 (85.5%) |
| Total (Category) | 1,117 (37.7%) | 1,843 (62.3%) |
| Total (Overall) | 8,838 (52.8%) | 7,887 (47.2%) |
Sales and Office Occupations
The most common Sales and Office occupations in Guernsey County are Office & Administration (1,958 | 11.7%), and Sales & Related (1,521 | 9.1%).

Sales and Office Occupations by Sex
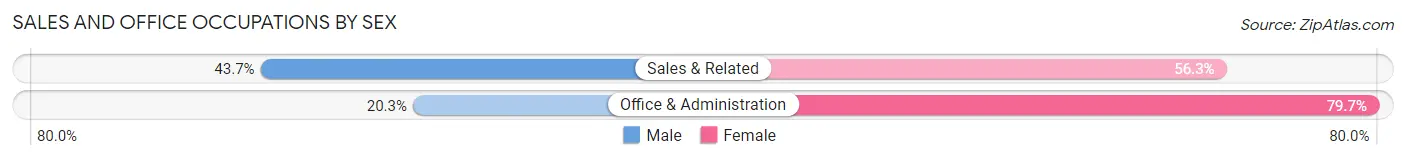
| Occupation | Male | Female |
| Sales & Related | 665 (43.7%) | 856 (56.3%) |
| Office & Administration | 397 (20.3%) | 1,561 (79.7%) |
| Total (Category) | 1,062 (30.5%) | 2,417 (69.5%) |
| Total (Overall) | 8,838 (52.8%) | 7,887 (47.2%) |
Natural Resources, Construction and Maintenance Occupations
The most common Natural Resources, Construction and Maintenance occupations in Guernsey County are Construction & Extraction (1,134 | 6.8%), Installation, Maintenance & Repair (713 | 4.3%), and Farming, Fishing & Forestry (90 | 0.5%).

Natural Resources, Construction and Maintenance Occupations by Sex
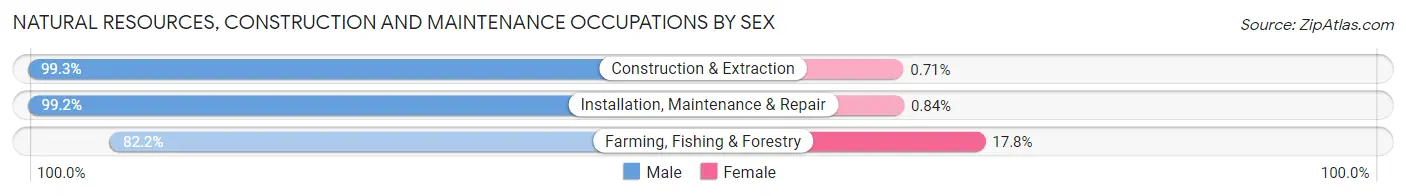
| Occupation | Male | Female |
| Farming, Fishing & Forestry | 74 (82.2%) | 16 (17.8%) |
| Construction & Extraction | 1,126 (99.3%) | 8 (0.7%) |
| Installation, Maintenance & Repair | 707 (99.2%) | 6 (0.8%) |
| Total (Category) | 1,907 (98.5%) | 30 (1.5%) |
| Total (Overall) | 8,838 (52.8%) | 7,887 (47.2%) |
Production, Transportation and Moving Occupations
The most common Production, Transportation and Moving occupations in Guernsey County are Production (1,463 | 8.7%), Material Moving (1,111 | 6.6%), and Transportation (987 | 5.9%).

Production, Transportation and Moving Occupations by Sex
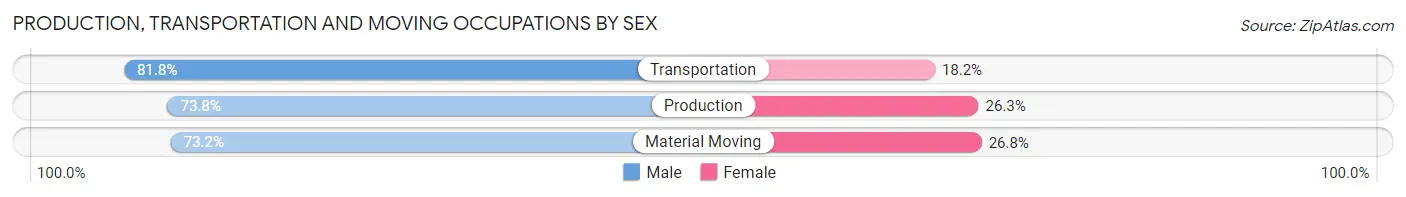
| Occupation | Male | Female |
| Production | 1,079 (73.8%) | 384 (26.3%) |
| Transportation | 807 (81.8%) | 180 (18.2%) |
| Material Moving | 813 (73.2%) | 298 (26.8%) |
| Total (Category) | 2,699 (75.8%) | 862 (24.2%) |
| Total (Overall) | 8,838 (52.8%) | 7,887 (47.2%) |
Employment Industries by Sex in Guernsey County
Employment Industries in Guernsey County
The major employment industries in Guernsey County include Health Care & Social Assistance (2,751 | 16.5%), Retail Trade (2,225 | 13.3%), Manufacturing (2,199 | 13.2%), Construction (1,346 | 8.1%), and Accommodation & Food Services (1,273 | 7.6%).

Employment Industries by Sex in Guernsey County
The Guernsey County industries that see more men than women are Utilities (100.0%), Enterprise Management (100.0%), and Agriculture, Fishing & Hunting (93.4%), whereas the industries that tend to have a higher number of women are Finance & Insurance (85.8%), Health Care & Social Assistance (79.7%), and Educational Services (71.1%).
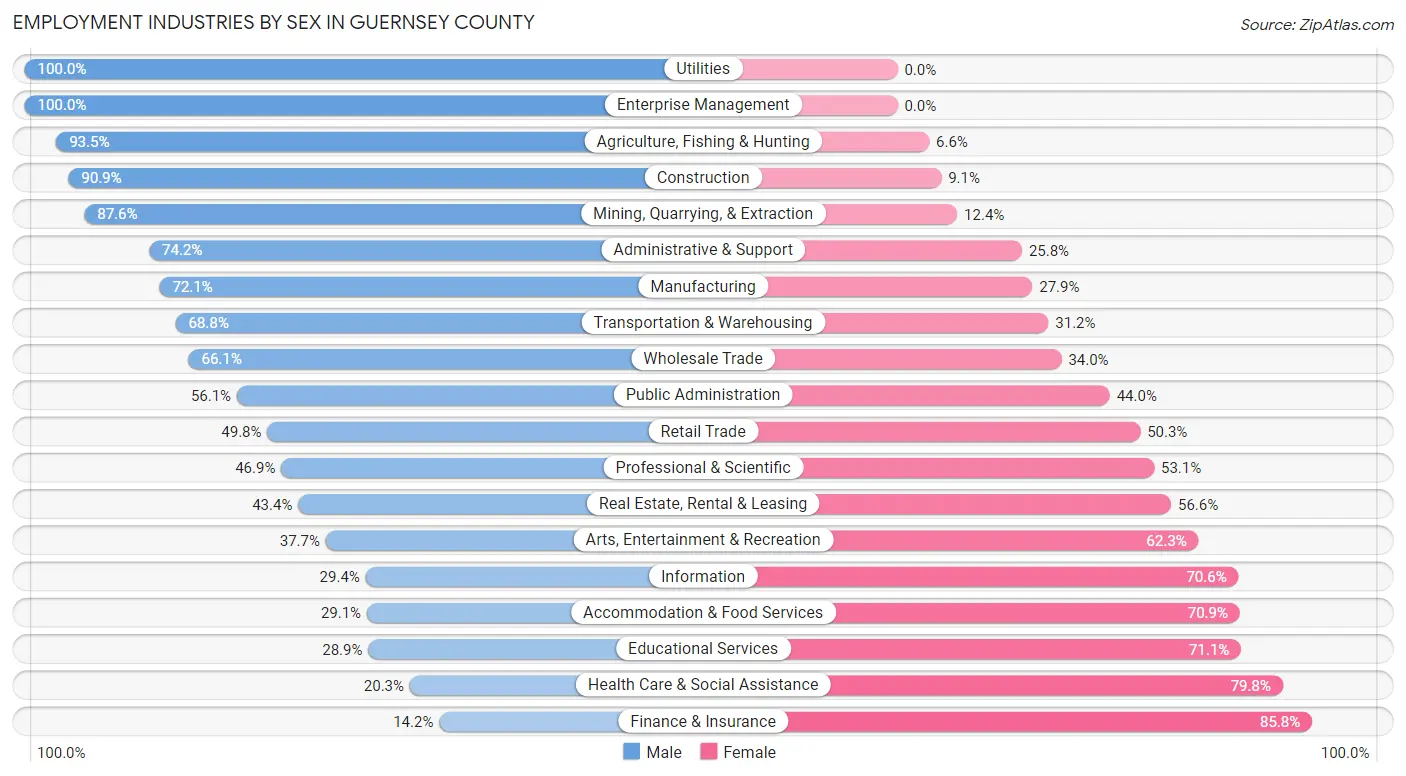
| Industry | Male | Female |
| Agriculture, Fishing & Hunting | 314 (93.4%) | 22 (6.6%) |
| Mining, Quarrying, & Extraction | 574 (87.6%) | 81 (12.4%) |
| Construction | 1,224 (90.9%) | 122 (9.1%) |
| Manufacturing | 1,585 (72.1%) | 614 (27.9%) |
| Wholesale Trade | 249 (66.0%) | 128 (34.0%) |
| Retail Trade | 1,107 (49.7%) | 1,118 (50.2%) |
| Transportation & Warehousing | 625 (68.8%) | 284 (31.2%) |
| Utilities | 197 (100.0%) | 0 (0.0%) |
| Information | 30 (29.4%) | 72 (70.6%) |
| Finance & Insurance | 39 (14.2%) | 236 (85.8%) |
| Real Estate, Rental & Leasing | 62 (43.4%) | 81 (56.6%) |
| Professional & Scientific | 188 (46.9%) | 213 (53.1%) |
| Enterprise Management | 6 (100.0%) | 0 (0.0%) |
| Administrative & Support | 521 (74.2%) | 181 (25.8%) |
| Educational Services | 333 (28.9%) | 821 (71.1%) |
| Health Care & Social Assistance | 557 (20.3%) | 2,194 (79.7%) |
| Arts, Entertainment & Recreation | 148 (37.7%) | 245 (62.3%) |
| Accommodation & Food Services | 371 (29.1%) | 902 (70.9%) |
| Public Administration | 403 (56.0%) | 316 (44.0%) |
| Total | 8,838 (52.8%) | 7,887 (47.2%) |
Education in Guernsey County
School Enrollment in Guernsey County
The most common levels of schooling among the 7,878 students in Guernsey County are high school (1,983 | 25.2%), elementary school (1,968 | 25.0%), and middle school (1,807 | 22.9%).

| School Level | # Students | % Students |
| Nursery / Preschool | 648 | 8.2% |
| Kindergarten | 472 | 6.0% |
| Elementary School | 1,968 | 25.0% |
| Middle School | 1,807 | 22.9% |
| High School | 1,983 | 25.2% |
| College / Undergraduate | 843 | 10.7% |
| Graduate / Professional | 157 | 2.0% |
| Total | 7,878 | 100.0% |
School Enrollment by Age by Funding Source in Guernsey County
Out of a total of 7,878 students who are enrolled in schools in Guernsey County, 1,253 (15.9%) attend a private institution, while the remaining 6,625 (84.1%) are enrolled in public schools. The age group of 20 to 24 year olds has the highest likelihood of being enrolled in private schools, with 178 (35.4% in the age bracket) enrolled. Conversely, the age group of 10 to 14 year olds has the lowest likelihood of being enrolled in a private school, with 2,299 (92.3% in the age bracket) attending a public institution.

| Age Bracket | Public School | Private School |
| 3 to 4 Year Olds | 386 (75.8%) | 123 (24.2%) |
| 5 to 9 Year Old | 1,647 (79.9%) | 414 (20.1%) |
| 10 to 14 Year Olds | 2,299 (92.3%) | 191 (7.7%) |
| 15 to 17 Year Olds | 1,294 (87.5%) | 185 (12.5%) |
| 18 to 19 Year Olds | 394 (81.1%) | 92 (18.9%) |
| 20 to 24 Year Olds | 325 (64.6%) | 178 (35.4%) |
| 25 to 34 Year Olds | 167 (82.7%) | 35 (17.3%) |
| 35 Years and over | 110 (74.3%) | 38 (25.7%) |
| Total | 6,625 (84.1%) | 1,253 (15.9%) |
Educational Attainment by Field of Study in Guernsey County
Education (1,172 | 27.8%), business (575 | 13.6%), science & technology (561 | 13.3%), literature & languages (296 | 7.0%), and arts & humanities (268 | 6.4%) are the most common fields of study among 4,215 individuals in Guernsey County who have obtained a bachelor's degree or higher.

| Field of Study | # Graduates | % Graduates |
| Computers & Mathematics | 87 | 2.1% |
| Bio, Nature & Agricultural | 202 | 4.8% |
| Physical & Health Sciences | 115 | 2.7% |
| Psychology | 171 | 4.1% |
| Social Sciences | 227 | 5.4% |
| Engineering | 225 | 5.3% |
| Multidisciplinary Studies | 7 | 0.2% |
| Science & Technology | 561 | 13.3% |
| Business | 575 | 13.6% |
| Education | 1,172 | 27.8% |
| Literature & Languages | 296 | 7.0% |
| Liberal Arts & History | 173 | 4.1% |
| Visual & Performing Arts | 31 | 0.7% |
| Communications | 105 | 2.5% |
| Arts & Humanities | 268 | 6.4% |
| Total | 4,215 | 100.0% |
Transportation & Commute in Guernsey County
Vehicle Availability by Sex in Guernsey County
The most prevalent vehicle ownership categories in Guernsey County are males with 2 vehicles (3,226, accounting for 36.6%) and females with 2 vehicles (2,550, making up 41.8%).

| Vehicles Available | Male | Female |
| No Vehicle | 359 (4.1%) | 219 (2.8%) |
| 1 Vehicle | 1,375 (15.6%) | 1,562 (20.2%) |
| 2 Vehicles | 3,226 (36.6%) | 2,550 (33.0%) |
| 3 Vehicles | 2,263 (25.7%) | 2,059 (26.7%) |
| 4 Vehicles | 886 (10.1%) | 938 (12.1%) |
| 5 or more Vehicles | 704 (8.0%) | 395 (5.1%) |
| Total | 8,813 (100.0%) | 7,723 (100.0%) |
Commute Time in Guernsey County
The most frequently occuring commute durations in Guernsey County are 10 to 14 minutes (3,270 commuters, 20.4%), 15 to 19 minutes (2,937 commuters, 18.3%), and 5 to 9 minutes (2,148 commuters, 13.4%).

| Commute Time | # Commuters | % Commuters |
| Less than 5 Minutes | 712 | 4.4% |
| 5 to 9 Minutes | 2,148 | 13.4% |
| 10 to 14 Minutes | 3,270 | 20.4% |
| 15 to 19 Minutes | 2,937 | 18.3% |
| 20 to 24 Minutes | 1,874 | 11.7% |
| 25 to 29 Minutes | 966 | 6.0% |
| 30 to 34 Minutes | 1,518 | 9.5% |
| 35 to 39 Minutes | 276 | 1.7% |
| 40 to 44 Minutes | 320 | 2.0% |
| 45 to 59 Minutes | 862 | 5.4% |
| 60 to 89 Minutes | 638 | 4.0% |
| 90 or more Minutes | 528 | 3.3% |
Commute Time by Sex in Guernsey County
The most common commute times in Guernsey County are 10 to 14 minutes (1,807 commuters, 20.9%) for males and 15 to 19 minutes (1,565 commuters, 21.1%) for females.
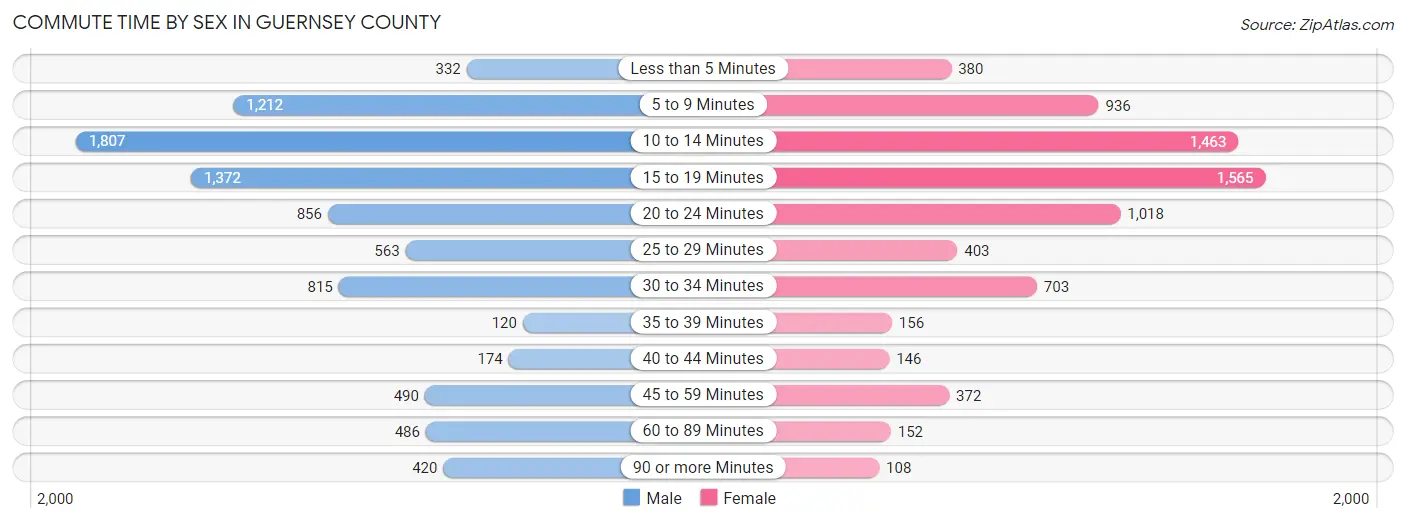
| Commute Time | Male | Female |
| Less than 5 Minutes | 332 (3.8%) | 380 (5.1%) |
| 5 to 9 Minutes | 1,212 (14.0%) | 936 (12.7%) |
| 10 to 14 Minutes | 1,807 (20.9%) | 1,463 (19.8%) |
| 15 to 19 Minutes | 1,372 (15.9%) | 1,565 (21.1%) |
| 20 to 24 Minutes | 856 (9.9%) | 1,018 (13.8%) |
| 25 to 29 Minutes | 563 (6.5%) | 403 (5.4%) |
| 30 to 34 Minutes | 815 (9.4%) | 703 (9.5%) |
| 35 to 39 Minutes | 120 (1.4%) | 156 (2.1%) |
| 40 to 44 Minutes | 174 (2.0%) | 146 (2.0%) |
| 45 to 59 Minutes | 490 (5.7%) | 372 (5.0%) |
| 60 to 89 Minutes | 486 (5.6%) | 152 (2.1%) |
| 90 or more Minutes | 420 (4.9%) | 108 (1.5%) |
Time of Departure to Work by Sex in Guernsey County
The most frequent times of departure to work in Guernsey County are 6:30 AM to 6:59 AM (1,237, 14.3%) for males and 7:30 AM to 7:59 AM (1,101, 14.9%) for females.
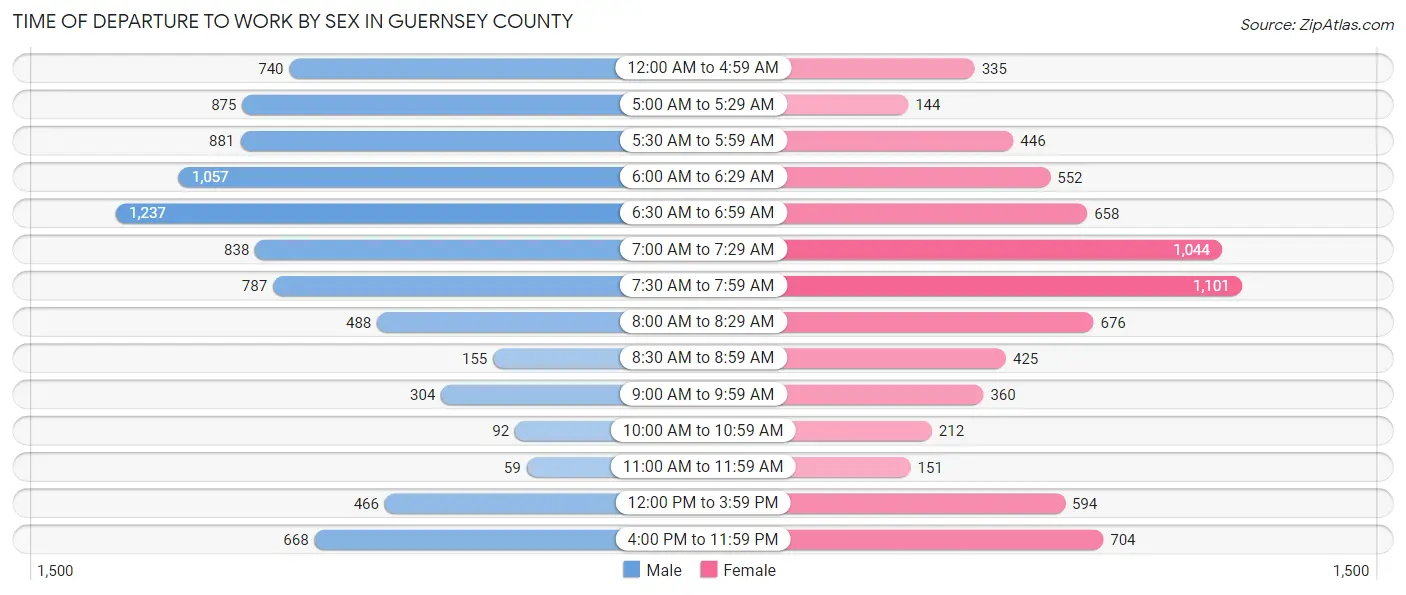
| Time of Departure | Male | Female |
| 12:00 AM to 4:59 AM | 740 (8.6%) | 335 (4.5%) |
| 5:00 AM to 5:29 AM | 875 (10.1%) | 144 (1.9%) |
| 5:30 AM to 5:59 AM | 881 (10.2%) | 446 (6.0%) |
| 6:00 AM to 6:29 AM | 1,057 (12.2%) | 552 (7.5%) |
| 6:30 AM to 6:59 AM | 1,237 (14.3%) | 658 (8.9%) |
| 7:00 AM to 7:29 AM | 838 (9.7%) | 1,044 (14.1%) |
| 7:30 AM to 7:59 AM | 787 (9.1%) | 1,101 (14.9%) |
| 8:00 AM to 8:29 AM | 488 (5.6%) | 676 (9.1%) |
| 8:30 AM to 8:59 AM | 155 (1.8%) | 425 (5.7%) |
| 9:00 AM to 9:59 AM | 304 (3.5%) | 360 (4.9%) |
| 10:00 AM to 10:59 AM | 92 (1.1%) | 212 (2.9%) |
| 11:00 AM to 11:59 AM | 59 (0.7%) | 151 (2.0%) |
| 12:00 PM to 3:59 PM | 466 (5.4%) | 594 (8.0%) |
| 4:00 PM to 11:59 PM | 668 (7.7%) | 704 (9.5%) |
| Total | 8,647 (100.0%) | 7,402 (100.0%) |
Housing Occupancy in Guernsey County
Occupancy by Ownership in Guernsey County
Of the total 16,165 dwellings in Guernsey County, owner-occupied units account for 11,737 (72.6%), while renter-occupied units make up 4,428 (27.4%).
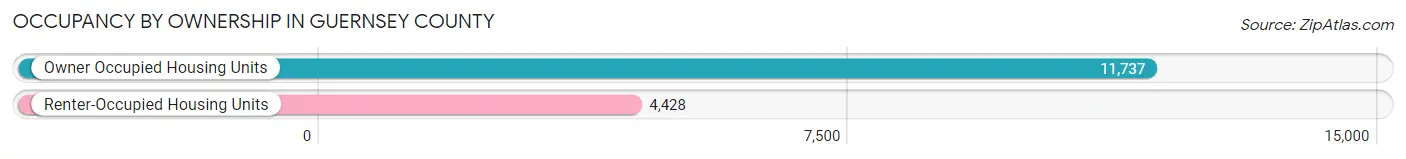
| Occupancy | # Housing Units | % Housing Units |
| Owner Occupied Housing Units | 11,737 | 72.6% |
| Renter-Occupied Housing Units | 4,428 | 27.4% |
| Total Occupied Housing Units | 16,165 | 100.0% |
Occupancy by Household Size in Guernsey County
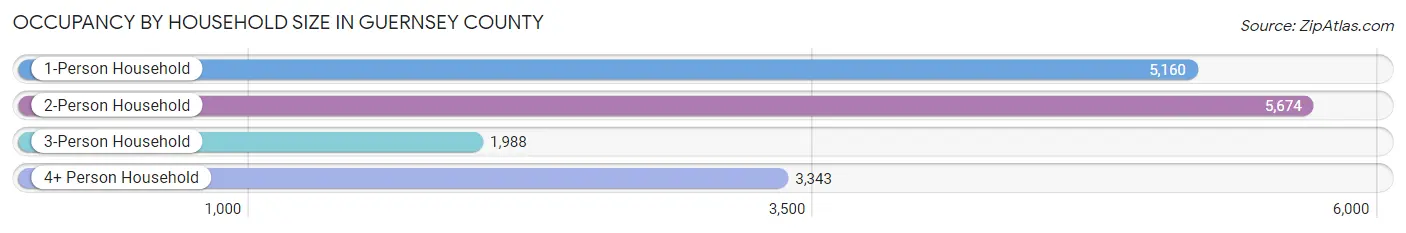
| Household Size | # Housing Units | % Housing Units |
| 1-Person Household | 5,160 | 31.9% |
| 2-Person Household | 5,674 | 35.1% |
| 3-Person Household | 1,988 | 12.3% |
| 4+ Person Household | 3,343 | 20.7% |
| Total Housing Units | 16,165 | 100.0% |
Occupancy by Ownership by Household Size in Guernsey County

| Household Size | Owner-occupied | Renter-occupied |
| 1-Person Household | 3,354 (65.0%) | 1,806 (35.0%) |
| 2-Person Household | 4,591 (80.9%) | 1,083 (19.1%) |
| 3-Person Household | 1,410 (70.9%) | 578 (29.1%) |
| 4+ Person Household | 2,382 (71.3%) | 961 (28.7%) |
| Total Housing Units | 11,737 (72.6%) | 4,428 (27.4%) |
Occupancy by Educational Attainment in Guernsey County
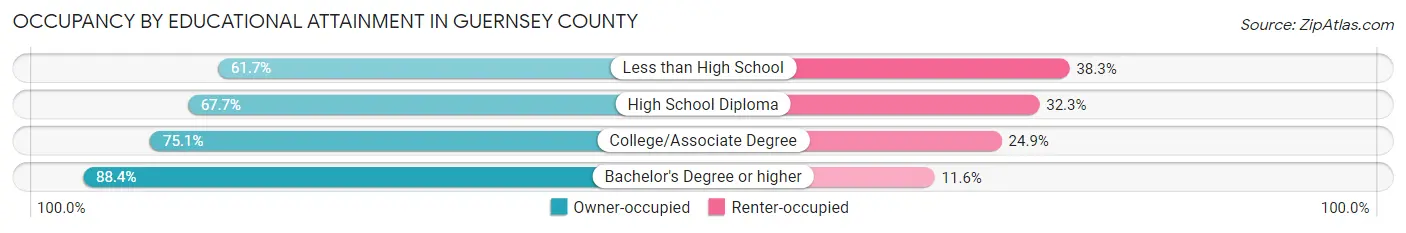
| Household Size | Owner-occupied | Renter-occupied |
| Less than High School | 1,221 (61.7%) | 759 (38.3%) |
| High School Diploma | 4,459 (67.7%) | 2,131 (32.3%) |
| College/Associate Degree | 3,716 (75.1%) | 1,231 (24.9%) |
| Bachelor's Degree or higher | 2,341 (88.4%) | 307 (11.6%) |
Occupancy by Age of Householder in Guernsey County
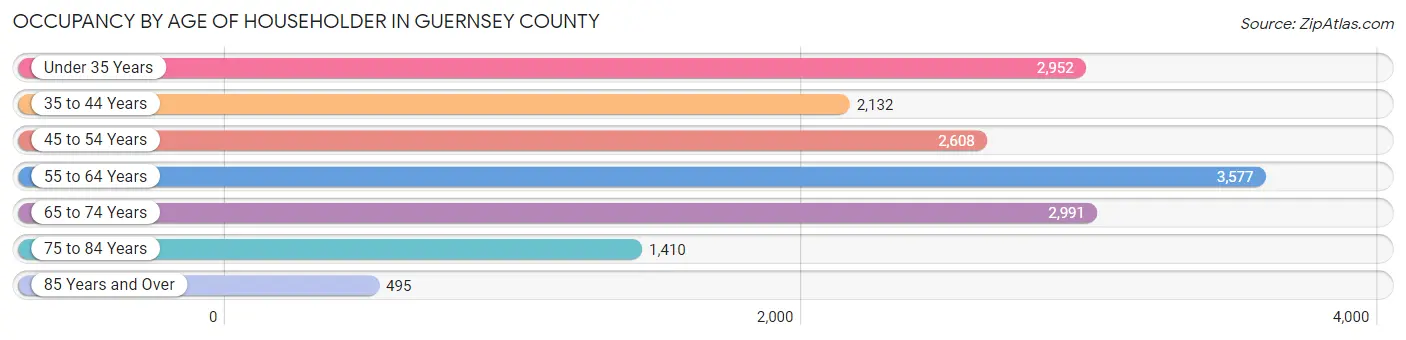
| Age Bracket | # Households | % Households |
| Under 35 Years | 2,952 | 18.3% |
| 35 to 44 Years | 2,132 | 13.2% |
| 45 to 54 Years | 2,608 | 16.1% |
| 55 to 64 Years | 3,577 | 22.1% |
| 65 to 74 Years | 2,991 | 18.5% |
| 75 to 84 Years | 1,410 | 8.7% |
| 85 Years and Over | 495 | 3.1% |
| Total | 16,165 | 100.0% |
Housing Finances in Guernsey County
Median Income by Occupancy in Guernsey County
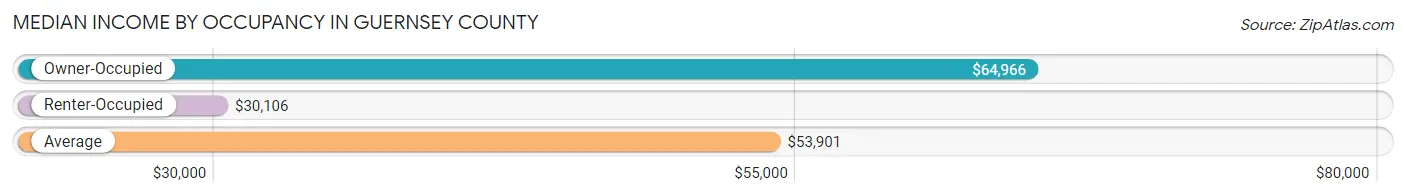
| Occupancy Type | # Households | Median Income |
| Owner-Occupied | 11,737 (72.6%) | $64,966 |
| Renter-Occupied | 4,428 (27.4%) | $30,106 |
| Average | 16,165 (100.0%) | $53,901 |
Occupancy by Householder Income Bracket in Guernsey County
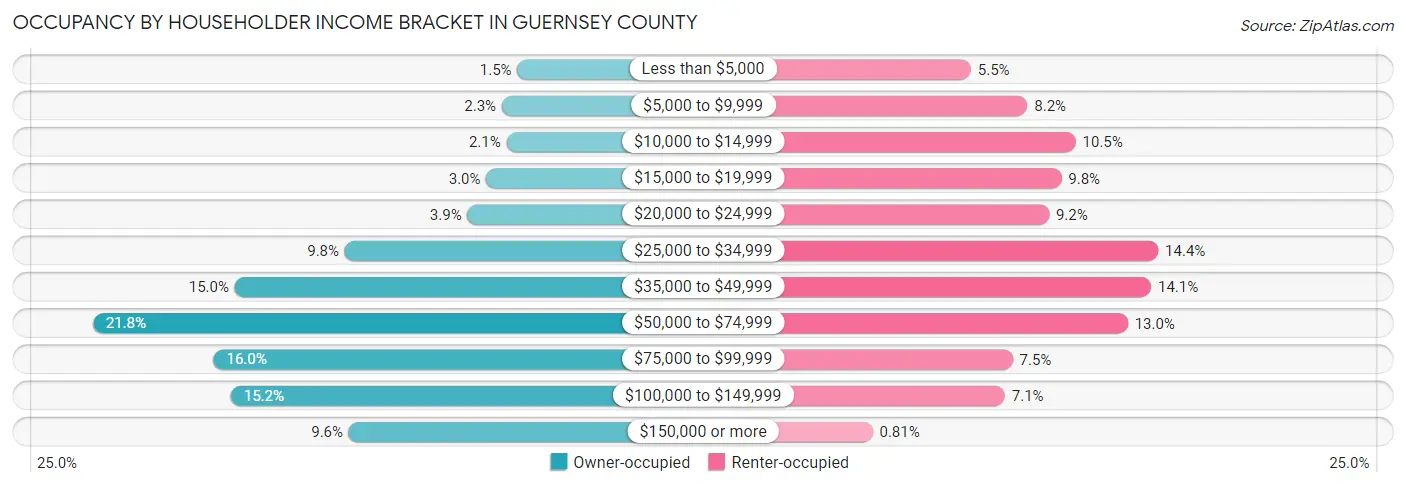
| Income Bracket | Owner-occupied | Renter-occupied |
| Less than $5,000 | 180 (1.5%) | 243 (5.5%) |
| $5,000 to $9,999 | 266 (2.3%) | 362 (8.2%) |
| $10,000 to $14,999 | 241 (2.1%) | 464 (10.5%) |
| $15,000 to $19,999 | 353 (3.0%) | 434 (9.8%) |
| $20,000 to $24,999 | 459 (3.9%) | 408 (9.2%) |
| $25,000 to $34,999 | 1,144 (9.8%) | 638 (14.4%) |
| $35,000 to $49,999 | 1,759 (15.0%) | 623 (14.1%) |
| $50,000 to $74,999 | 2,553 (21.7%) | 574 (13.0%) |
| $75,000 to $99,999 | 1,878 (16.0%) | 331 (7.5%) |
| $100,000 to $149,999 | 1,782 (15.2%) | 315 (7.1%) |
| $150,000 or more | 1,122 (9.6%) | 36 (0.8%) |
| Total | 11,737 (100.0%) | 4,428 (100.0%) |
Monthly Housing Cost Tiers in Guernsey County
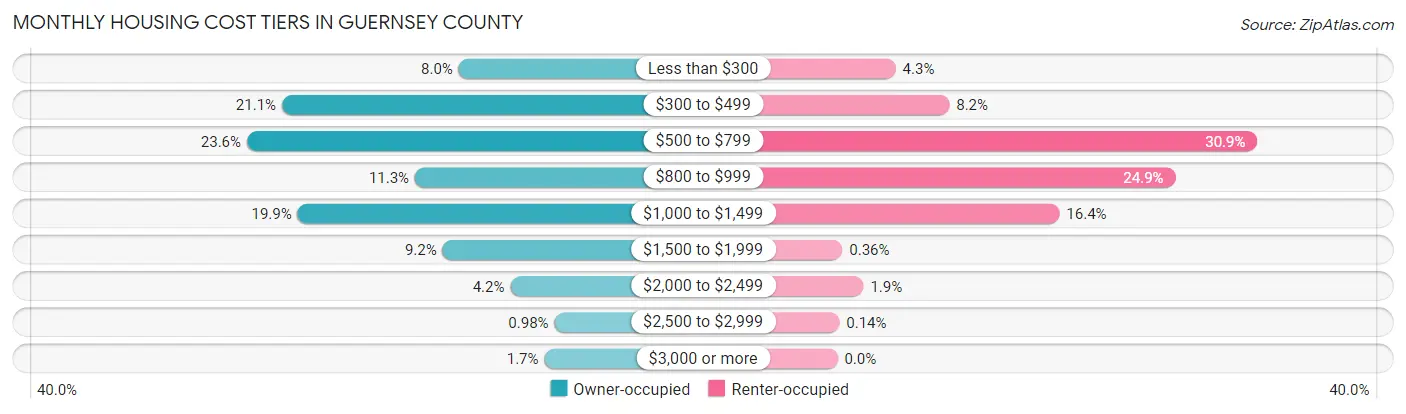
| Monthly Cost | Owner-occupied | Renter-occupied |
| Less than $300 | 942 (8.0%) | 190 (4.3%) |
| $300 to $499 | 2,471 (21.0%) | 365 (8.2%) |
| $500 to $799 | 2,773 (23.6%) | 1,369 (30.9%) |
| $800 to $999 | 1,320 (11.3%) | 1,102 (24.9%) |
| $1,000 to $1,499 | 2,336 (19.9%) | 724 (16.4%) |
| $1,500 to $1,999 | 1,082 (9.2%) | 16 (0.4%) |
| $2,000 to $2,499 | 496 (4.2%) | 85 (1.9%) |
| $2,500 to $2,999 | 115 (1.0%) | 6 (0.1%) |
| $3,000 or more | 202 (1.7%) | 0 (0.0%) |
| Total | 11,737 (100.0%) | 4,428 (100.0%) |
Physical Housing Characteristics in Guernsey County
Housing Structures in Guernsey County
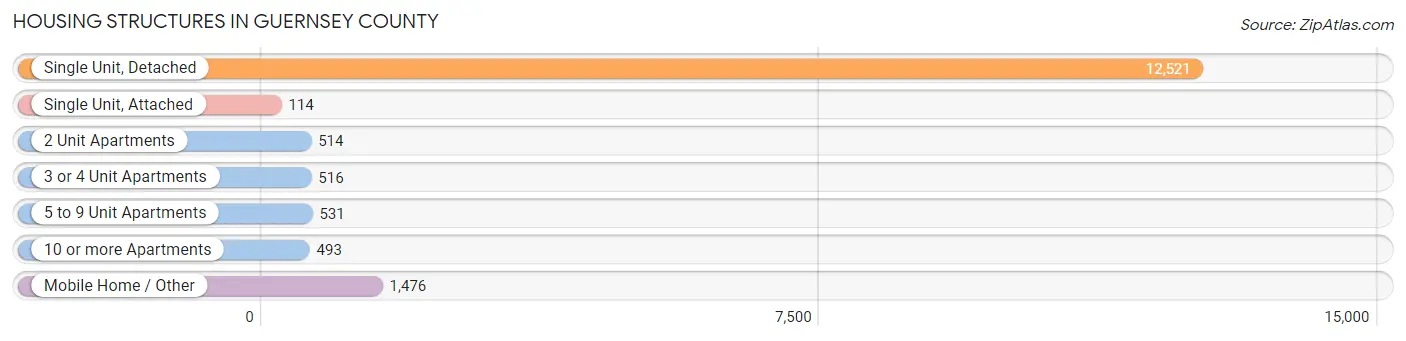
| Structure Type | # Housing Units | % Housing Units |
| Single Unit, Detached | 12,521 | 77.5% |
| Single Unit, Attached | 114 | 0.7% |
| 2 Unit Apartments | 514 | 3.2% |
| 3 or 4 Unit Apartments | 516 | 3.2% |
| 5 to 9 Unit Apartments | 531 | 3.3% |
| 10 or more Apartments | 493 | 3.0% |
| Mobile Home / Other | 1,476 | 9.1% |
| Total | 16,165 | 100.0% |
Housing Structures by Occupancy in Guernsey County

| Structure Type | Owner-occupied | Renter-occupied |
| Single Unit, Detached | 10,534 (84.1%) | 1,987 (15.9%) |
| Single Unit, Attached | 79 (69.3%) | 35 (30.7%) |
| 2 Unit Apartments | 13 (2.5%) | 501 (97.5%) |
| 3 or 4 Unit Apartments | 8 (1.5%) | 508 (98.5%) |
| 5 to 9 Unit Apartments | 3 (0.6%) | 528 (99.4%) |
| 10 or more Apartments | 0 (0.0%) | 493 (100.0%) |
| Mobile Home / Other | 1,100 (74.5%) | 376 (25.5%) |
| Total | 11,737 (72.6%) | 4,428 (27.4%) |
Housing Structures by Number of Rooms in Guernsey County

| Number of Rooms | Owner-occupied | Renter-occupied |
| 1 Room | 0 (0.0%) | 138 (3.1%) |
| 2 or 3 Rooms | 375 (3.2%) | 605 (13.7%) |
| 4 or 5 Rooms | 2,932 (25.0%) | 2,073 (46.8%) |
| 6 or 7 Rooms | 5,011 (42.7%) | 1,285 (29.0%) |
| 8 or more Rooms | 3,419 (29.1%) | 327 (7.4%) |
| Total | 11,737 (100.0%) | 4,428 (100.0%) |
Housing Structure by Heating Type in Guernsey County

| Heating Type | Owner-occupied | Renter-occupied |
| Utility Gas | 4,761 (40.6%) | 1,988 (44.9%) |
| Bottled, Tank, or LP Gas | 2,556 (21.8%) | 212 (4.8%) |
| Electricity | 2,747 (23.4%) | 1,924 (43.4%) |
| Fuel Oil or Kerosene | 604 (5.1%) | 170 (3.8%) |
| Coal or Coke | 1 (0.0%) | 0 (0.0%) |
| All other Fuels | 1,068 (9.1%) | 98 (2.2%) |
| No Fuel Used | 0 (0.0%) | 36 (0.8%) |
| Total | 11,737 (100.0%) | 4,428 (100.0%) |
Household Vehicle Usage in Guernsey County

| Vehicles per Household | Owner-occupied | Renter-occupied |
| No Vehicle | 422 (3.6%) | 697 (15.7%) |
| 1 Vehicle | 2,696 (23.0%) | 2,016 (45.5%) |
| 2 Vehicles | 4,416 (37.6%) | 1,206 (27.2%) |
| 3 or more Vehicles | 4,203 (35.8%) | 509 (11.5%) |
| Total | 11,737 (100.0%) | 4,428 (100.0%) |
Real Estate & Mortgages in Guernsey County
Real Estate and Mortgage Overview in Guernsey County
| Characteristic | Without Mortgage | With Mortgage |
| Housing Units | 5,428 | 6,309 |
| Median Property Value | $124,300 | $159,600 |
| Median Household Income | $53,256 | $765 |
| Monthly Housing Costs | $457 | $202 |
| Real Estate Taxes | $1,378 | $185 |
Property Value by Mortgage Status in Guernsey County
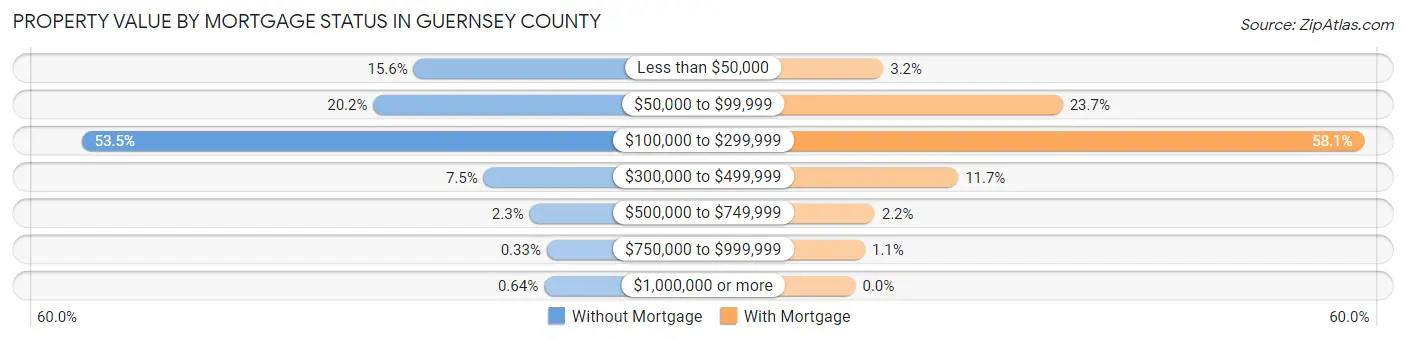
| Property Value | Without Mortgage | With Mortgage |
| Less than $50,000 | 844 (15.5%) | 200 (3.2%) |
| $50,000 to $99,999 | 1,094 (20.2%) | 1,494 (23.7%) |
| $100,000 to $299,999 | 2,903 (53.5%) | 3,668 (58.1%) |
| $300,000 to $499,999 | 409 (7.5%) | 740 (11.7%) |
| $500,000 to $749,999 | 125 (2.3%) | 139 (2.2%) |
| $750,000 to $999,999 | 18 (0.3%) | 68 (1.1%) |
| $1,000,000 or more | 35 (0.6%) | 0 (0.0%) |
| Total | 5,428 (100.0%) | 6,309 (100.0%) |
Household Income by Mortgage Status in Guernsey County
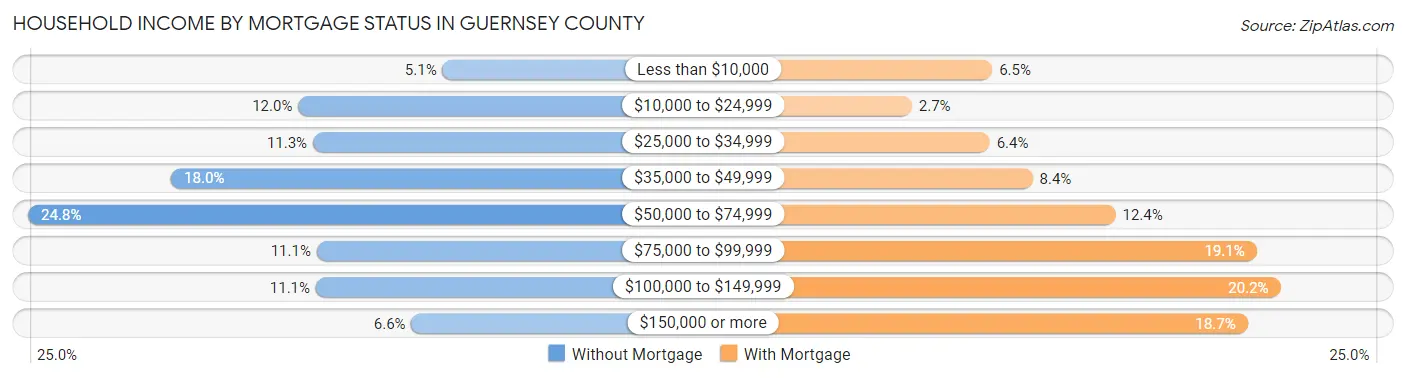
| Household Income | Without Mortgage | With Mortgage |
| Less than $10,000 | 277 (5.1%) | 411 (6.5%) |
| $10,000 to $24,999 | 650 (12.0%) | 169 (2.7%) |
| $25,000 to $34,999 | 612 (11.3%) | 403 (6.4%) |
| $35,000 to $49,999 | 978 (18.0%) | 532 (8.4%) |
| $50,000 to $74,999 | 1,348 (24.8%) | 781 (12.4%) |
| $75,000 to $99,999 | 602 (11.1%) | 1,205 (19.1%) |
| $100,000 to $149,999 | 604 (11.1%) | 1,276 (20.2%) |
| $150,000 or more | 357 (6.6%) | 1,178 (18.7%) |
| Total | 5,428 (100.0%) | 6,309 (100.0%) |
Property Value to Household Income Ratio in Guernsey County
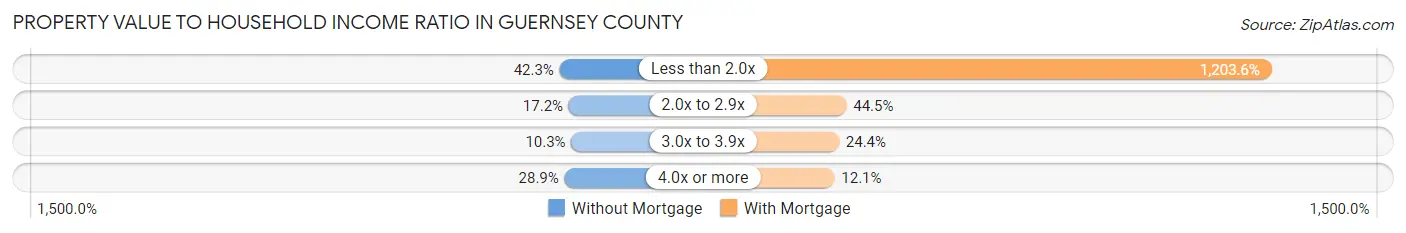
| Value-to-Income Ratio | Without Mortgage | With Mortgage |
| Less than 2.0x | 2,296 (42.3%) | 75,932 (1,203.6%) |
| 2.0x to 2.9x | 935 (17.2%) | 2,810 (44.5%) |
| 3.0x to 3.9x | 560 (10.3%) | 1,538 (24.4%) |
| 4.0x or more | 1,570 (28.9%) | 763 (12.1%) |
| Total | 5,428 (100.0%) | 6,309 (100.0%) |
Real Estate Taxes by Mortgage Status in Guernsey County
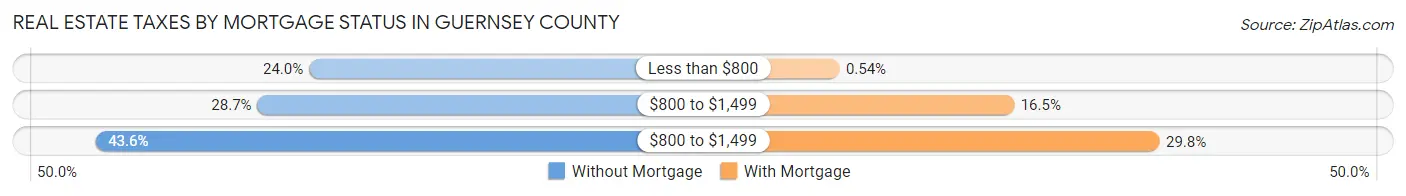
| Property Taxes | Without Mortgage | With Mortgage |
| Less than $800 | 1,304 (24.0%) | 34 (0.5%) |
| $800 to $1,499 | 1,560 (28.7%) | 1,041 (16.5%) |
| $800 to $1,499 | 2,364 (43.5%) | 1,878 (29.8%) |
| Total | 5,428 (100.0%) | 6,309 (100.0%) |
Health & Disability in Guernsey County
Health Insurance Coverage by Age in Guernsey County
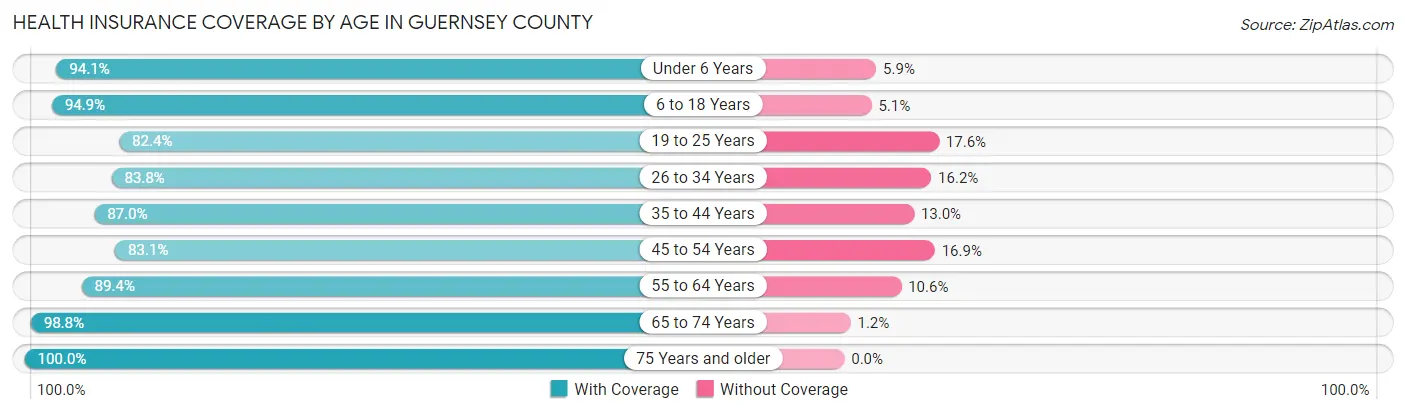
| Age Bracket | With Coverage | Without Coverage |
| Under 6 Years | 2,423 (94.1%) | 153 (5.9%) |
| 6 to 18 Years | 6,035 (94.9%) | 322 (5.1%) |
| 19 to 25 Years | 2,475 (82.4%) | 530 (17.6%) |
| 26 to 34 Years | 3,524 (83.8%) | 681 (16.2%) |
| 35 to 44 Years | 3,604 (87.0%) | 538 (13.0%) |
| 45 to 54 Years | 3,950 (83.1%) | 801 (16.9%) |
| 55 to 64 Years | 5,016 (89.4%) | 596 (10.6%) |
| 65 to 74 Years | 4,434 (98.8%) | 52 (1.2%) |
| 75 Years and older | 2,898 (100.0%) | 0 (0.0%) |
| Total | 34,359 (90.3%) | 3,673 (9.7%) |
Health Insurance Coverage by Citizenship Status in Guernsey County
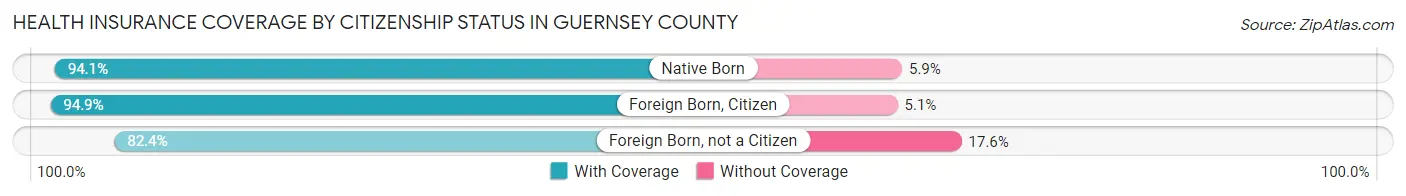
| Citizenship Status | With Coverage | Without Coverage |
| Native Born | 2,423 (94.1%) | 153 (5.9%) |
| Foreign Born, Citizen | 6,035 (94.9%) | 322 (5.1%) |
| Foreign Born, not a Citizen | 2,475 (82.4%) | 530 (17.6%) |
Health Insurance Coverage by Household Income in Guernsey County
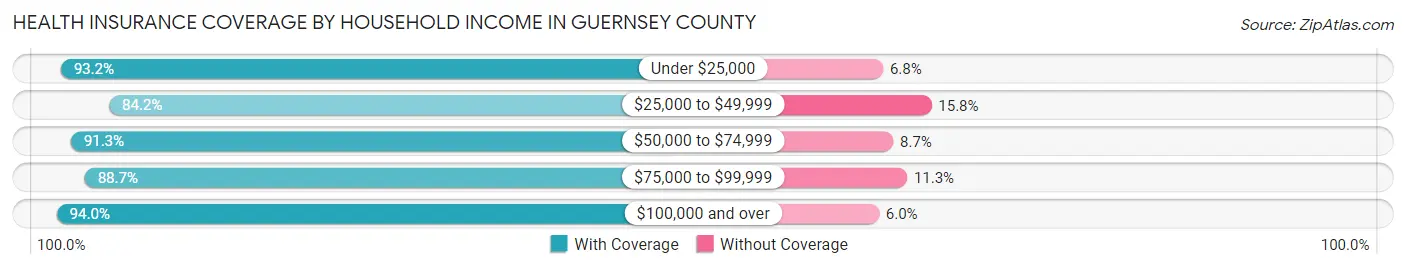
| Household Income | With Coverage | Without Coverage |
| Under $25,000 | 5,401 (93.2%) | 393 (6.8%) |
| $25,000 to $49,999 | 7,262 (84.2%) | 1,367 (15.8%) |
| $50,000 to $74,999 | 6,396 (91.3%) | 607 (8.7%) |
| $75,000 to $99,999 | 5,202 (88.7%) | 661 (11.3%) |
| $100,000 and over | 9,940 (94.0%) | 636 (6.0%) |
Public vs Private Health Insurance Coverage by Age in Guernsey County

| Age Bracket | Public Insurance | Private Insurance |
| Under 6 | 1,510 (58.6%) | 1,174 (45.6%) |
| 6 to 18 Years | 2,856 (44.9%) | 3,680 (57.9%) |
| 19 to 25 Years | 967 (32.2%) | 1,580 (52.6%) |
| 25 to 34 Years | 1,262 (30.0%) | 2,402 (57.1%) |
| 35 to 44 Years | 1,266 (30.6%) | 2,551 (61.6%) |
| 45 to 54 Years | 1,091 (23.0%) | 3,071 (64.6%) |
| 55 to 64 Years | 1,491 (26.6%) | 3,730 (66.5%) |
| 65 to 74 Years | 4,318 (96.3%) | 2,647 (59.0%) |
| 75 Years and over | 2,888 (99.7%) | 1,810 (62.5%) |
| Total | 17,649 (46.4%) | 22,645 (59.5%) |
Disability Status by Sex by Age in Guernsey County

| Age Bracket | Male | Female |
| Under 5 Years | 0 (0.0%) | 0 (0.0%) |
| 5 to 17 Years | 355 (11.0%) | 211 (7.1%) |
| 18 to 34 Years | 269 (6.7%) | 293 (8.0%) |
| 35 to 64 Years | 1,300 (18.0%) | 1,484 (20.4%) |
| 65 to 74 Years | 699 (32.2%) | 694 (30.0%) |
| 75 Years and over | 662 (54.2%) | 701 (41.8%) |
Disability Class by Sex by Age in Guernsey County
Disability Class: Hearing Difficulty
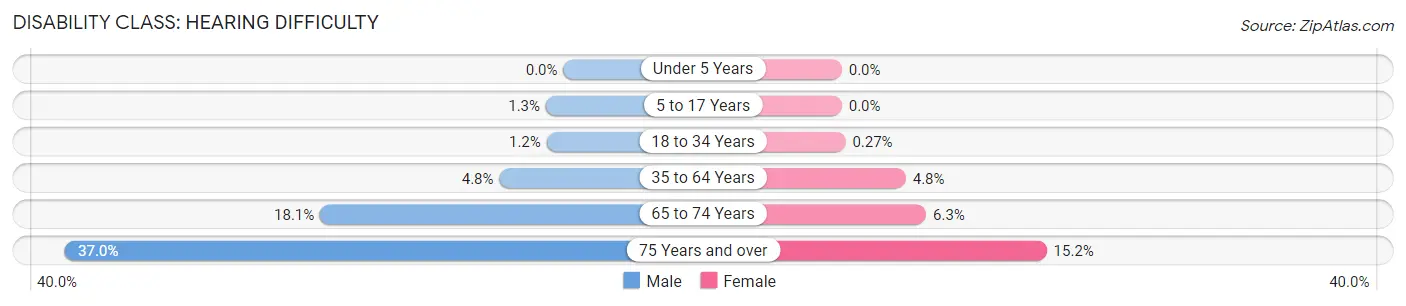
| Age Bracket | Male | Female |
| Under 5 Years | 0 (0.0%) | 0 (0.0%) |
| 5 to 17 Years | 42 (1.3%) | 0 (0.0%) |
| 18 to 34 Years | 50 (1.2%) | 10 (0.3%) |
| 35 to 64 Years | 343 (4.8%) | 346 (4.8%) |
| 65 to 74 Years | 392 (18.1%) | 145 (6.3%) |
| 75 Years and over | 452 (37.0%) | 255 (15.2%) |
Disability Class: Vision Difficulty
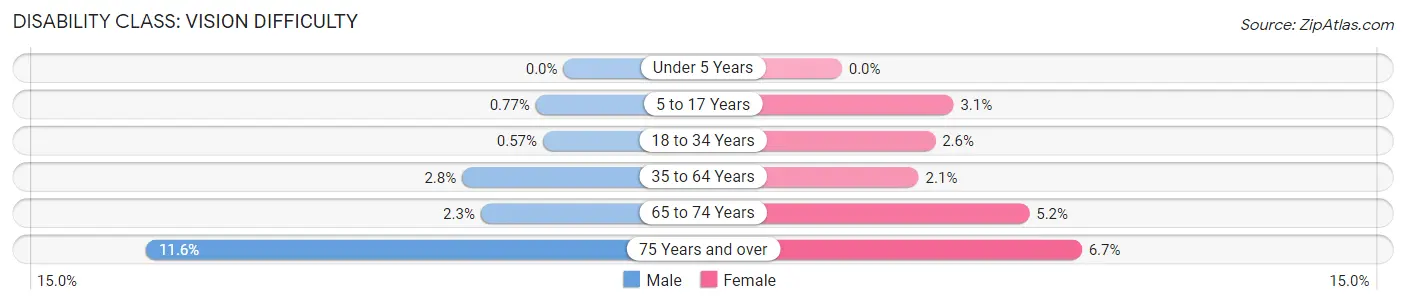
| Age Bracket | Male | Female |
| Under 5 Years | 0 (0.0%) | 0 (0.0%) |
| 5 to 17 Years | 25 (0.8%) | 93 (3.1%) |
| 18 to 34 Years | 23 (0.6%) | 95 (2.6%) |
| 35 to 64 Years | 204 (2.8%) | 156 (2.1%) |
| 65 to 74 Years | 50 (2.3%) | 121 (5.2%) |
| 75 Years and over | 142 (11.6%) | 112 (6.7%) |
Disability Class: Cognitive Difficulty

| Age Bracket | Male | Female |
| 5 to 17 Years | 304 (9.4%) | 125 (4.2%) |
| 18 to 34 Years | 195 (4.9%) | 169 (4.6%) |
| 35 to 64 Years | 521 (7.2%) | 858 (11.8%) |
| 65 to 74 Years | 103 (4.8%) | 115 (5.0%) |
| 75 Years and over | 173 (14.2%) | 287 (17.1%) |
Disability Class: Ambulatory Difficulty
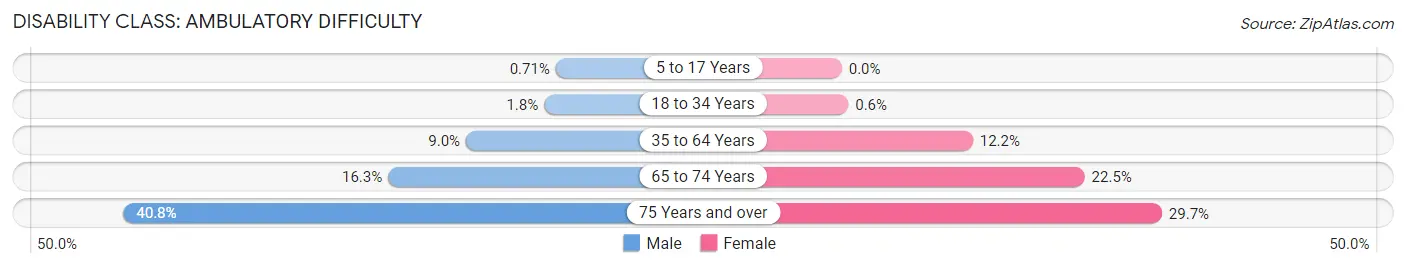
| Age Bracket | Male | Female |
| 5 to 17 Years | 23 (0.7%) | 0 (0.0%) |
| 18 to 34 Years | 72 (1.8%) | 22 (0.6%) |
| 35 to 64 Years | 653 (9.0%) | 885 (12.2%) |
| 65 to 74 Years | 353 (16.3%) | 522 (22.5%) |
| 75 Years and over | 499 (40.8%) | 498 (29.7%) |
Disability Class: Self-Care Difficulty
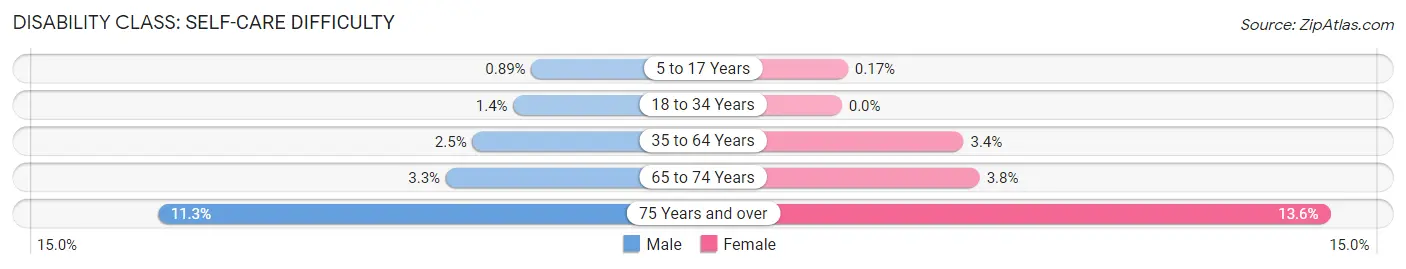
| Age Bracket | Male | Female |
| 5 to 17 Years | 29 (0.9%) | 5 (0.2%) |
| 18 to 34 Years | 56 (1.4%) | 0 (0.0%) |
| 35 to 64 Years | 183 (2.5%) | 247 (3.4%) |
| 65 to 74 Years | 71 (3.3%) | 89 (3.8%) |
| 75 Years and over | 138 (11.3%) | 228 (13.6%) |
Technology Access in Guernsey County
Computing Device Access in Guernsey County
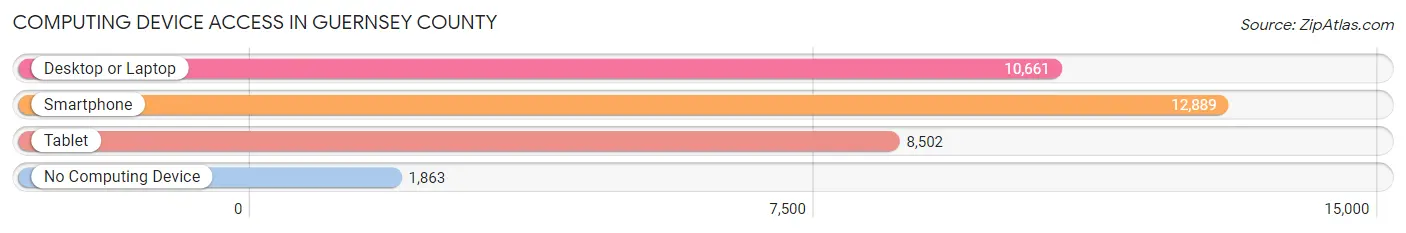
| Device Type | # Households | % Households |
| Desktop or Laptop | 10,661 | 65.9% |
| Smartphone | 12,889 | 79.7% |
| Tablet | 8,502 | 52.6% |
| No Computing Device | 1,863 | 11.5% |
| Total | 16,165 | 100.0% |
Internet Access in Guernsey County
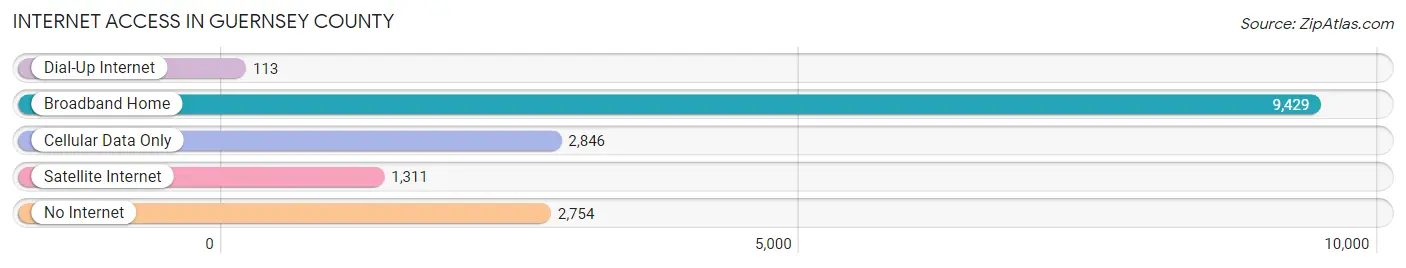
| Internet Type | # Households | % Households |
| Dial-Up Internet | 113 | 0.7% |
| Broadband Home | 9,429 | 58.3% |
| Cellular Data Only | 2,846 | 17.6% |
| Satellite Internet | 1,311 | 8.1% |
| No Internet | 2,754 | 17.0% |
| Total | 16,165 | 100.0% |
Guernsey County Summary
Guernsey County is located in the east-central region of Ohio, and is part of the Appalachian Plateau. It is bordered by Muskingum County to the north, Noble County to the east, Belmont County to the south, and Tuscarawas County to the west. The county seat is Cambridge, and the largest city is Byesville. The county was established in 1810 and named after the Isle of Guernsey in the English Channel.
Geography
Guernsey County is located in the Appalachian Plateau region of Ohio. The county is mostly rural, with rolling hills and valleys. The highest point in the county is located in the western part of the county, at an elevation of 1,092 feet. The county is drained by the Muskingum River, which flows through the northern part of the county. The county is also home to several state parks, including Seneca Lake State Park, Salt Fork State Park, and Wolf Run State Park.
Climate
Guernsey County has a humid continental climate, with cold winters and hot, humid summers. The average annual temperature is 50°F, and the average annual precipitation is 40 inches.
Demographics
As of the 2010 census, the population of Guernsey County was 40,087. The population density was 79.3 people per square mile. The racial makeup of the county was 95.3% White, 1.7% African American, 0.3% Native American, 0.4% Asian, 0.1% Pacific Islander, 0.7% from other races, and 1.5% from two or more races. Hispanic or Latino of any race were 1.9% of the population.
Economy
Guernsey County is largely rural, and the economy is largely based on agriculture. The county is home to several large farms, and the main crops grown in the county are corn, soybeans, and wheat. The county is also home to several manufacturing companies, including a steel mill, a paper mill, and a glass factory. The county is also home to several oil and gas wells, and the county is a major producer of natural gas.
The county is also home to several tourist attractions, including the National Road/Zane Grey Museum, the Salt Fork State Park, and the Seneca Lake State Park. The county is also home to several wineries, and the county is a popular destination for wine enthusiasts.
Conclusion
Guernsey County is a rural county located in the Appalachian Plateau region of Ohio. The county is home to several state parks, and the economy is largely based on agriculture and manufacturing. The county is also home to several tourist attractions, and is a popular destination for wine enthusiasts.
Common Questions
What is the Total Population of Guernsey County?
Total Population of Guernsey County is 38,409.
What is the Total Male Population of Guernsey County?
Total Male Population of Guernsey County is 19,218.
What is the Total Female Population of Guernsey County?
Total Female Population of Guernsey County is 19,191.
What is the Ratio of Males per 100 Females in Guernsey County?
There are 100.14 Males per 100 Females in Guernsey County.
What is the Ratio of Females per 100 Males in Guernsey County?
There are 99.86 Females per 100 Males in Guernsey County.
What is the Median Population Age in Guernsey County?
Median Population Age in Guernsey County is 42.6 Years.
What is the Average Family Size in Guernsey County
Average Family Size in Guernsey County is 2.9 People.
What is the Average Household Size in Guernsey County
Average Household Size in Guernsey County is 2.3 People.
What is Per Capita Income in Guernsey County?
Per Capita income in Guernsey County is $29,642.
What is the Median Family Income in Guernsey County?
Median Family Income in Guernsey County is $67,480.
What is the Median Household income in Guernsey County?
Median Household Income in Guernsey County is $53,901.
What is Income or Wage Gap in Guernsey County?
Income or Wage Gap in Guernsey County is 32.7%.
Women in Guernsey County earn 67.3 cents for every dollar earned by a man.
What is Family Income Deficit in Guernsey County?
Family Income Deficit in Guernsey County is $12,937.
Families that are below poverty line in Guernsey County earn $12,937 less on average than the poverty threshold level.
What is Inequality or Gini Index in Guernsey County?
Inequality or Gini Index in Guernsey County is 0.43.
How Large is the Labor Force in Guernsey County?
There are 17,566 People in the Labor Forcein in Guernsey County.
What is the Percentage of People in the Labor Force in Guernsey County?
56.7% of People are in the Labor Force in Guernsey County.
What is the Unemployment Rate in Guernsey County?
Unemployment Rate in Guernsey County is 4.6%.