Greene County, OH
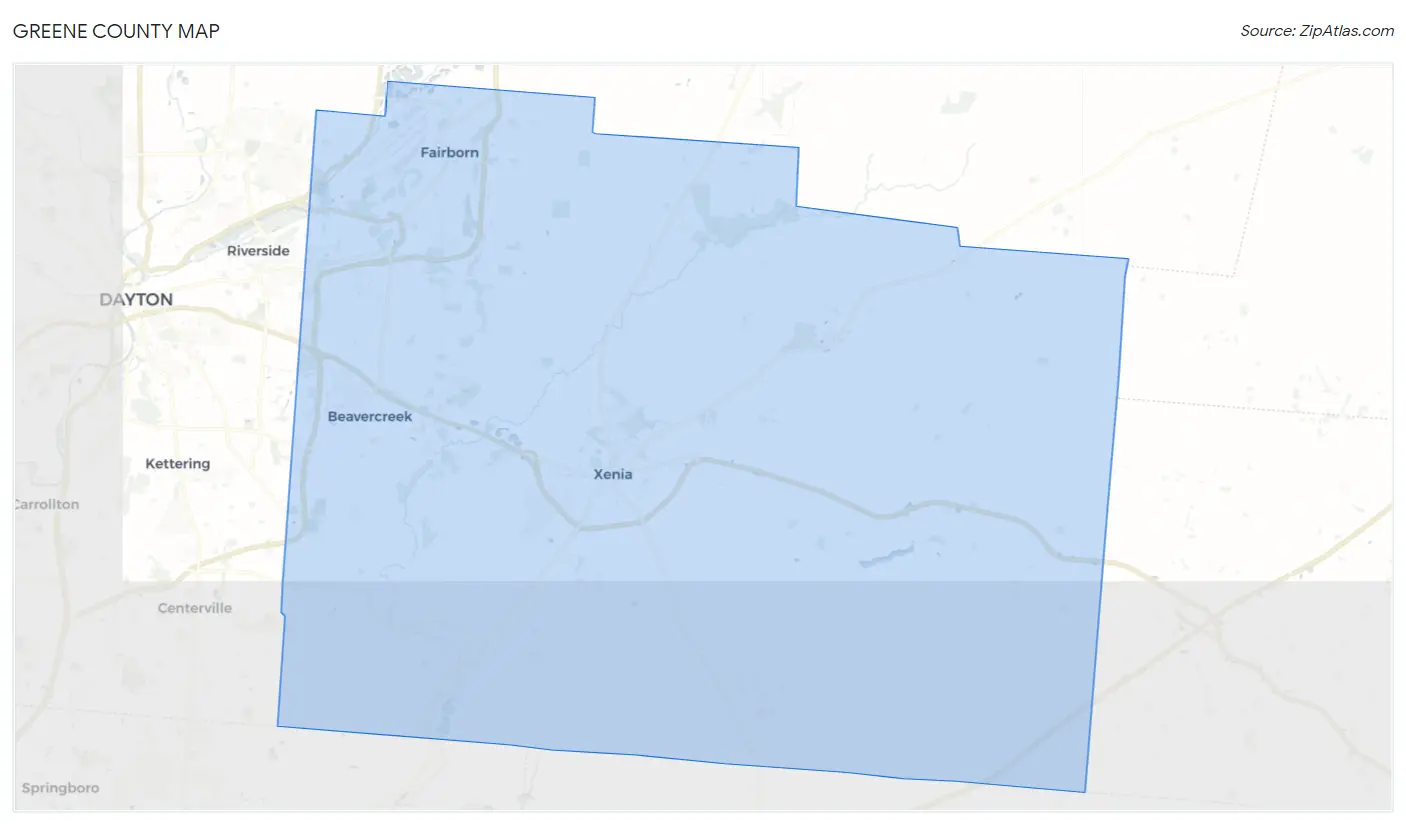
Greene County Map
Greene County Overview
167,567
TOTAL POPULATION
83,333
MALE POPULATION
84,234
FEMALE POPULATION
98.93
MALES / 100 FEMALES
101.08
FEMALES / 100 MALES
38.6
MEDIAN AGE
3.0
AVG FAMILY SIZE
2.4
AVG HOUSEHOLD SIZE
$42,862
PER CAPITA INCOME
$106,369
AVG FAMILY INCOME
$81,243
AVG HOUSEHOLD INCOME
38.9%
WAGE / INCOME GAP [ % ]
61.1¢/ $1
WAGE / INCOME GAP [ $ ]
$9,565
FAMILY INCOME DEFICIT
0.44
INEQUALITY / GINI INDEX
86,085
LABOR FORCE [ PEOPLE ]
62.8%
PERCENT IN LABOR FORCE
4.6%
UNEMPLOYMENT RATE
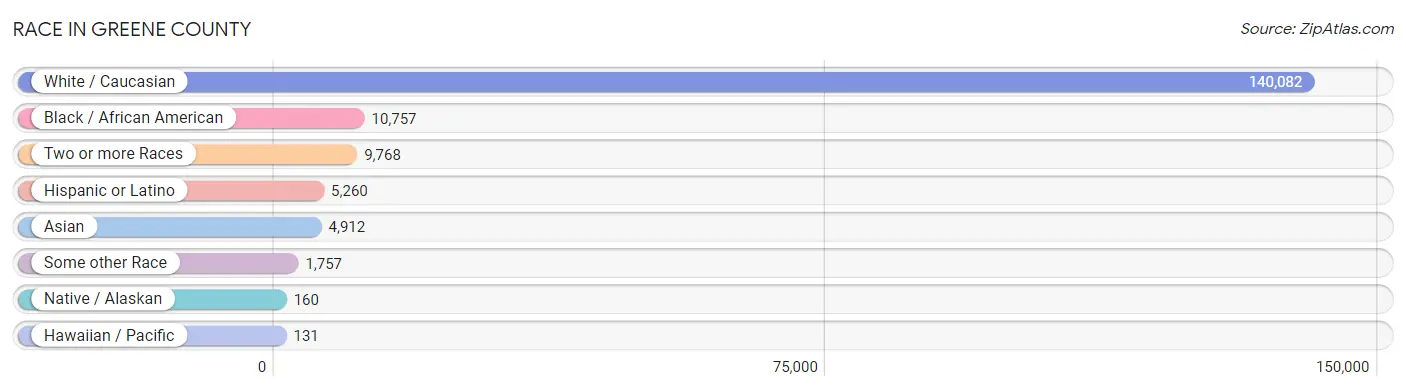
Race in Greene County
The most populous races in Greene County are White / Caucasian (140,082 | 83.6%), Black / African American (10,757 | 6.4%), and Two or more Races (9,768 | 5.8%).
| Race | # Population | % Population |
| Asian | 4,912 | 2.9% |
| Black / African American | 10,757 | 6.4% |
| Hawaiian / Pacific | 131 | 0.1% |
| Hispanic or Latino | 5,260 | 3.1% |
| Native / Alaskan | 160 | 0.1% |
| White / Caucasian | 140,082 | 83.6% |
| Two or more Races | 9,768 | 5.8% |
| Some other Race | 1,757 | 1.1% |
| Total | 167,567 | 100.0% |
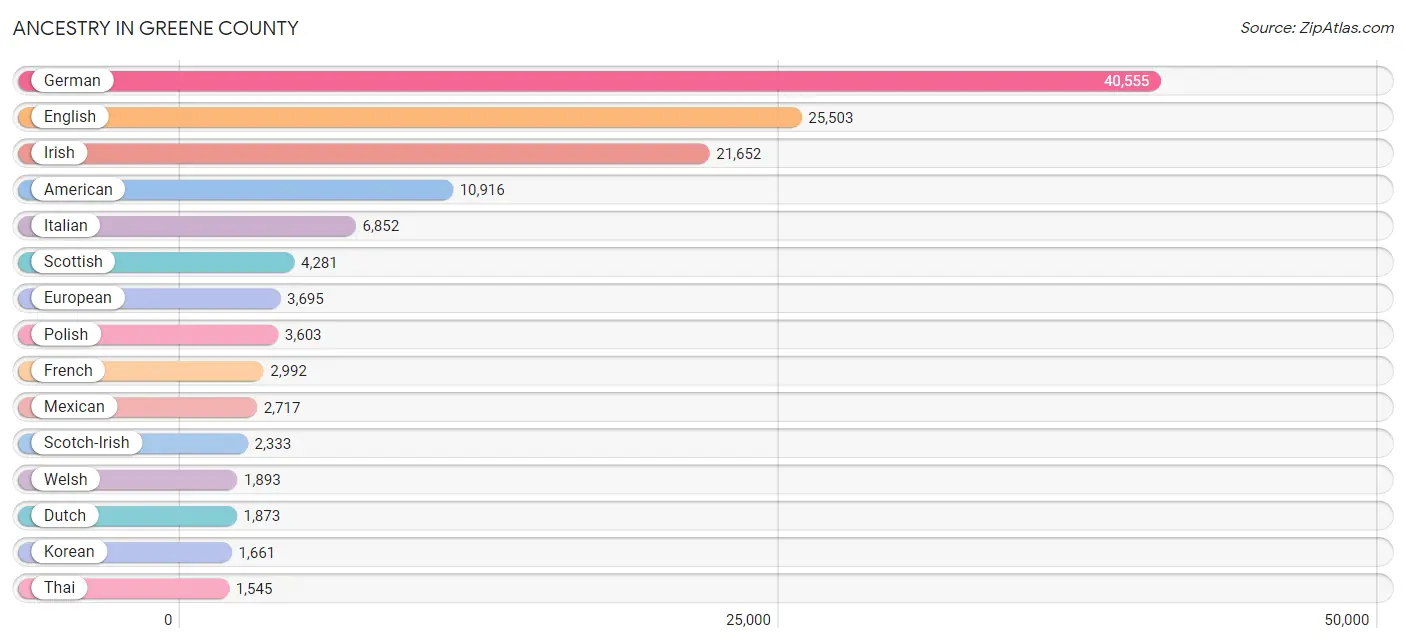
Ancestry in Greene County
The most populous ancestries reported in Greene County are German (40,555 | 24.2%), English (25,503 | 15.2%), Irish (21,652 | 12.9%), American (10,916 | 6.5%), and Italian (6,852 | 4.1%), together accounting for 62.9% of all Greene County residents.
| Ancestry | # Population | % Population |
| African | 664 | 0.4% |
| Alaska Native | 54 | 0.0% |
| Albanian | 6 | 0.0% |
| American | 10,916 | 6.5% |
| Apache | 25 | 0.0% |
| Arab | 1,055 | 0.6% |
| Arapaho | 22 | 0.0% |
| Argentinean | 31 | 0.0% |
| Armenian | 86 | 0.1% |
| Australian | 126 | 0.1% |
| Austrian | 451 | 0.3% |
| Bahamian | 127 | 0.1% |
| Barbadian | 9 | 0.0% |
| Basque | 7 | 0.0% |
| Belgian | 95 | 0.1% |
| Belizean | 153 | 0.1% |
| Bhutanese | 662 | 0.4% |
| Blackfeet | 74 | 0.0% |
| Brazilian | 119 | 0.1% |
| British | 1,342 | 0.8% |
| Bulgarian | 18 | 0.0% |
| Burmese | 770 | 0.5% |
| Cajun | 7 | 0.0% |
| Canadian | 204 | 0.1% |
| Cape Verdean | 50 | 0.0% |
| Celtic | 85 | 0.1% |
| Central American | 230 | 0.1% |
| Cherokee | 509 | 0.3% |
| Chickasaw | 36 | 0.0% |
| Chilean | 62 | 0.0% |
| Chinese | 9 | 0.0% |
| Chippewa | 115 | 0.1% |
| Choctaw | 19 | 0.0% |
| Colombian | 156 | 0.1% |
| Costa Rican | 19 | 0.0% |
| Croatian | 187 | 0.1% |
| Crow | 8 | 0.0% |
| Cuban | 229 | 0.1% |
| Czech | 679 | 0.4% |
| Czechoslovakian | 352 | 0.2% |
| Danish | 311 | 0.2% |
| Delaware | 61 | 0.0% |
| Dominican | 50 | 0.0% |
| Dutch | 1,873 | 1.1% |
| Dutch West Indian | 14 | 0.0% |
| Eastern European | 248 | 0.2% |
| Ecuadorian | 43 | 0.0% |
| Egyptian | 124 | 0.1% |
| English | 25,503 | 15.2% |
| Estonian | 75 | 0.0% |
| European | 3,695 | 2.2% |
| Filipino | 89 | 0.1% |
| Finnish | 373 | 0.2% |
| French | 2,992 | 1.8% |
| French American Indian | 3 | 0.0% |
| French Canadian | 545 | 0.3% |
| German | 40,555 | 24.2% |
| Ghanaian | 104 | 0.1% |
| Greek | 686 | 0.4% |
| Guatemalan | 75 | 0.0% |
| Haitian | 63 | 0.0% |
| Honduran | 9 | 0.0% |
| Hungarian | 826 | 0.5% |
| Icelander | 16 | 0.0% |
| Indian (Asian) | 803 | 0.5% |
| Iranian | 102 | 0.1% |
| Irish | 21,652 | 12.9% |
| Iroquois | 57 | 0.0% |
| Israeli | 15 | 0.0% |
| Italian | 6,852 | 4.1% |
| Jamaican | 41 | 0.0% |
| Japanese | 7 | 0.0% |
| Kenyan | 98 | 0.1% |
| Korean | 1,661 | 1.0% |
| Latvian | 42 | 0.0% |
| Lebanese | 353 | 0.2% |
| Lithuanian | 363 | 0.2% |
| Luxembourger | 12 | 0.0% |
| Maltese | 49 | 0.0% |
| Mexican | 2,717 | 1.6% |
| Mexican American Indian | 20 | 0.0% |
| Mongolian | 31 | 0.0% |
| Moroccan | 15 | 0.0% |
| Native Hawaiian | 240 | 0.1% |
| Navajo | 21 | 0.0% |
| Nicaraguan | 89 | 0.1% |
| Nigerian | 241 | 0.1% |
| Northern European | 408 | 0.2% |
| Norwegian | 1,510 | 0.9% |
| Okinawan | 18 | 0.0% |
| Ottawa | 6 | 0.0% |
| Pakistani | 109 | 0.1% |
| Palestinian | 62 | 0.0% |
| Panamanian | 27 | 0.0% |
| Paraguayan | 11 | 0.0% |
| Pennsylvania German | 33 | 0.0% |
| Peruvian | 68 | 0.0% |
| Polish | 3,603 | 2.1% |
| Portuguese | 189 | 0.1% |
| Potawatomi | 43 | 0.0% |
| Puerto Rican | 858 | 0.5% |
| Romanian | 48 | 0.0% |
| Russian | 589 | 0.4% |
| Salvadoran | 11 | 0.0% |
| Samoan | 107 | 0.1% |
| Scandinavian | 414 | 0.3% |
| Scotch-Irish | 2,333 | 1.4% |
| Scottish | 4,281 | 2.5% |
| Serbian | 62 | 0.0% |
| Sioux | 73 | 0.0% |
| Slavic | 69 | 0.0% |
| Slovak | 477 | 0.3% |
| Slovene | 62 | 0.0% |
| South American | 380 | 0.2% |
| Spaniard | 290 | 0.2% |
| Spanish | 333 | 0.2% |
| Sri Lankan | 686 | 0.4% |
| Subsaharan African | 1,178 | 0.7% |
| Sudanese | 5 | 0.0% |
| Swedish | 1,527 | 0.9% |
| Swiss | 727 | 0.4% |
| Syrian | 73 | 0.0% |
| Thai | 1,545 | 0.9% |
| Trinidadian and Tobagonian | 17 | 0.0% |
| Turkish | 31 | 0.0% |
| Ukrainian | 133 | 0.1% |
| Venezuelan | 9 | 0.0% |
| Vietnamese | 265 | 0.2% |
| Welsh | 1,893 | 1.1% |
| West Indian | 42 | 0.0% |
| Yugoslavian | 40 | 0.0% |
| Yup'ik | 9 | 0.0% | View All 132 Rows |
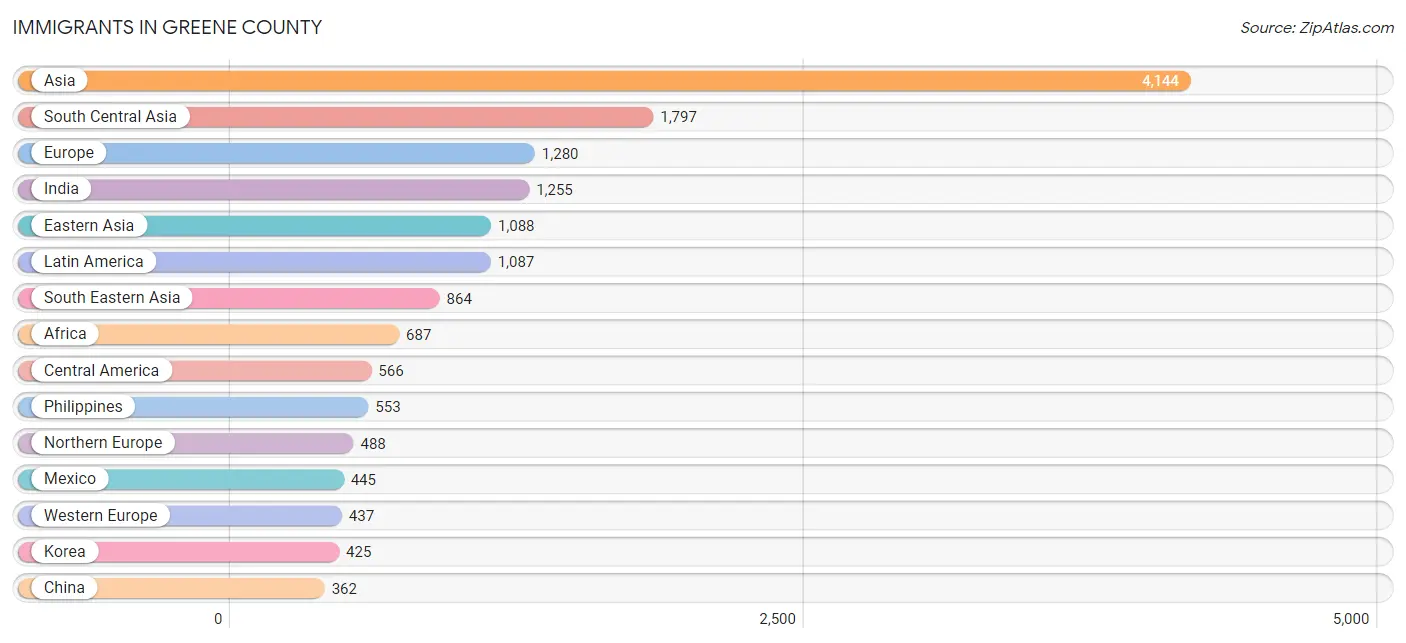
Immigrants in Greene County
The most numerous immigrant groups reported in Greene County came from Asia (4,144 | 2.5%), South Central Asia (1,797 | 1.1%), Europe (1,280 | 0.8%), India (1,255 | 0.7%), and Eastern Asia (1,088 | 0.6%), together accounting for 5.7% of all Greene County residents.
| Immigration Origin | # Population | % Population |
| Africa | 687 | 0.4% |
| Argentina | 9 | 0.0% |
| Asia | 4,144 | 2.5% |
| Australia | 157 | 0.1% |
| Austria | 34 | 0.0% |
| Bahamas | 127 | 0.1% |
| Bangladesh | 173 | 0.1% |
| Belarus | 16 | 0.0% |
| Belgium | 16 | 0.0% |
| Bosnia and Herzegovina | 19 | 0.0% |
| Brazil | 127 | 0.1% |
| Bulgaria | 18 | 0.0% |
| Cambodia | 2 | 0.0% |
| Canada | 171 | 0.1% |
| Caribbean | 238 | 0.1% |
| Central America | 566 | 0.3% |
| China | 362 | 0.2% |
| Colombia | 50 | 0.0% |
| Congo | 1 | 0.0% |
| Costa Rica | 10 | 0.0% |
| Czechoslovakia | 21 | 0.0% |
| Denmark | 5 | 0.0% |
| Dominican Republic | 16 | 0.0% |
| Eastern Africa | 238 | 0.1% |
| Eastern Asia | 1,088 | 0.6% |
| Eastern Europe | 293 | 0.2% |
| Ecuador | 37 | 0.0% |
| Egypt | 14 | 0.0% |
| England | 341 | 0.2% |
| Europe | 1,280 | 0.8% |
| France | 130 | 0.1% |
| Germany | 226 | 0.1% |
| Ghana | 80 | 0.1% |
| Guatemala | 43 | 0.0% |
| Haiti | 58 | 0.0% |
| Honduras | 9 | 0.0% |
| India | 1,255 | 0.7% |
| Iran | 18 | 0.0% |
| Iraq | 25 | 0.0% |
| Ireland | 10 | 0.0% |
| Israel | 15 | 0.0% |
| Jamaica | 19 | 0.0% |
| Japan | 301 | 0.2% |
| Kenya | 127 | 0.1% |
| Korea | 425 | 0.3% |
| Kuwait | 36 | 0.0% |
| Latin America | 1,087 | 0.6% |
| Lebanon | 10 | 0.0% |
| Malaysia | 38 | 0.0% |
| Mexico | 445 | 0.3% |
| Middle Africa | 1 | 0.0% |
| Morocco | 24 | 0.0% |
| Nepal | 14 | 0.0% |
| Nicaragua | 24 | 0.0% |
| Nigeria | 174 | 0.1% |
| Northern Africa | 159 | 0.1% |
| Northern Europe | 488 | 0.3% |
| Oceania | 213 | 0.1% |
| Pakistan | 316 | 0.2% |
| Panama | 19 | 0.0% |
| Peru | 49 | 0.0% |
| Philippines | 553 | 0.3% |
| Russia | 122 | 0.1% |
| Saudi Arabia | 152 | 0.1% |
| Scotland | 80 | 0.1% |
| Singapore | 5 | 0.0% |
| South America | 283 | 0.2% |
| South Central Asia | 1,797 | 1.1% |
| South Eastern Asia | 864 | 0.5% |
| Southern Europe | 57 | 0.0% |
| Spain | 57 | 0.0% |
| Switzerland | 31 | 0.0% |
| Syria | 39 | 0.0% |
| Taiwan | 49 | 0.0% |
| Thailand | 46 | 0.0% |
| Trinidad and Tobago | 18 | 0.0% |
| Turkey | 19 | 0.0% |
| Ukraine | 40 | 0.0% |
| Uzbekistan | 14 | 0.0% |
| Vietnam | 220 | 0.1% |
| Western Africa | 289 | 0.2% |
| Western Asia | 354 | 0.2% |
| Western Europe | 437 | 0.3% |
| Zimbabwe | 5 | 0.0% | View All 84 Rows |
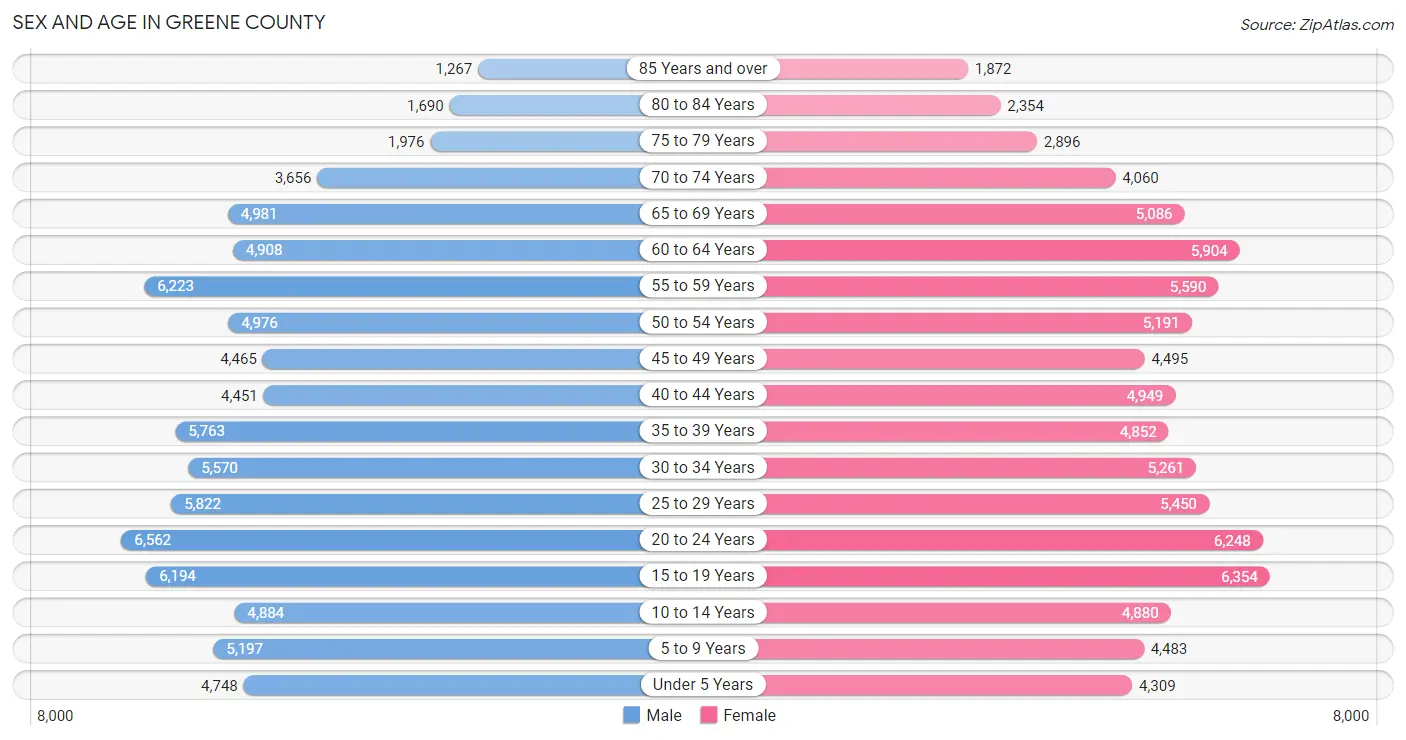
Sex and Age in Greene County
Sex and Age in Greene County
The most populous age groups in Greene County are 20 to 24 Years (6,562 | 7.9%) for men and 15 to 19 Years (6,354 | 7.5%) for women.
| Age Bracket | Male | Female |
| Under 5 Years | 4,748 (5.7%) | 4,309 (5.1%) |
| 5 to 9 Years | 5,197 (6.2%) | 4,483 (5.3%) |
| 10 to 14 Years | 4,884 (5.9%) | 4,880 (5.8%) |
| 15 to 19 Years | 6,194 (7.4%) | 6,354 (7.5%) |
| 20 to 24 Years | 6,562 (7.9%) | 6,248 (7.4%) |
| 25 to 29 Years | 5,822 (7.0%) | 5,450 (6.5%) |
| 30 to 34 Years | 5,570 (6.7%) | 5,261 (6.2%) |
| 35 to 39 Years | 5,763 (6.9%) | 4,852 (5.8%) |
| 40 to 44 Years | 4,451 (5.3%) | 4,949 (5.9%) |
| 45 to 49 Years | 4,465 (5.4%) | 4,495 (5.3%) |
| 50 to 54 Years | 4,976 (6.0%) | 5,191 (6.2%) |
| 55 to 59 Years | 6,223 (7.5%) | 5,590 (6.6%) |
| 60 to 64 Years | 4,908 (5.9%) | 5,904 (7.0%) |
| 65 to 69 Years | 4,981 (6.0%) | 5,086 (6.0%) |
| 70 to 74 Years | 3,656 (4.4%) | 4,060 (4.8%) |
| 75 to 79 Years | 1,976 (2.4%) | 2,896 (3.4%) |
| 80 to 84 Years | 1,690 (2.0%) | 2,354 (2.8%) |
| 85 Years and over | 1,267 (1.5%) | 1,872 (2.2%) |
| Total | 83,333 (100.0%) | 84,234 (100.0%) |
Families and Households in Greene County
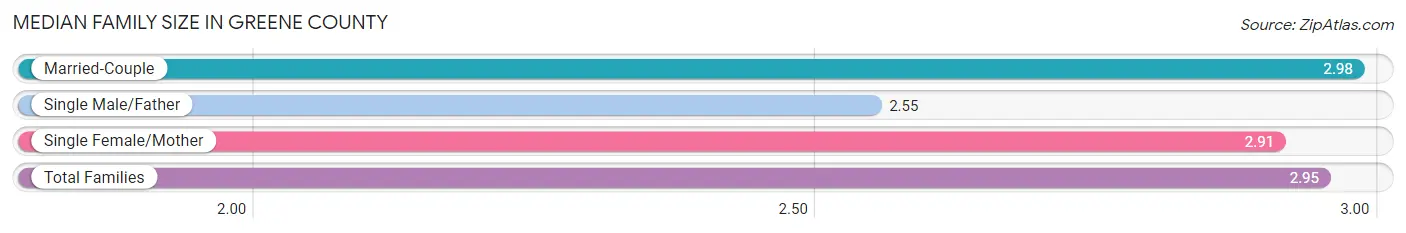
Median Family Size in Greene County
The median family size in Greene County is 2.95 persons per family, with married-couple families (34,279 | 80.2%) accounting for the largest median family size of 2.98 persons per family. On the other hand, single male/father families (2,598 | 6.1%) represent the smallest median family size with 2.55 persons per family.
| Family Type | # Families | Family Size |
| Married-Couple | 34,279 (80.2%) | 2.98 |
| Single Male/Father | 2,598 (6.1%) | 2.55 |
| Single Female/Mother | 5,887 (13.8%) | 2.91 |
| Total Families | 42,764 (100.0%) | 2.95 |
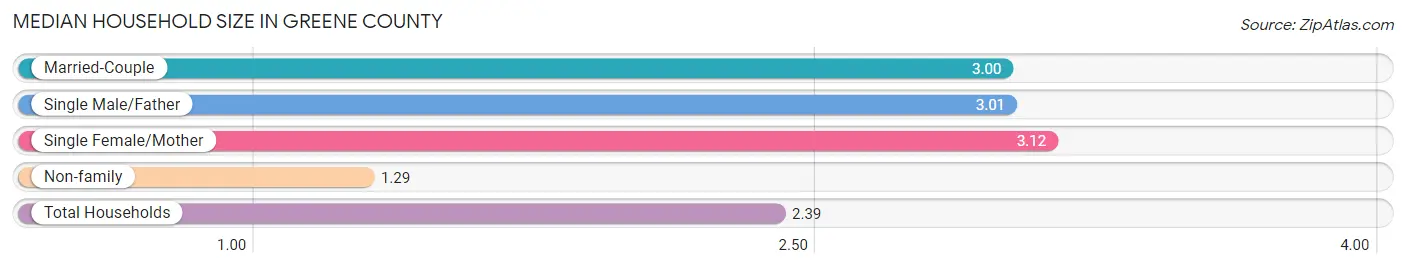
Median Household Size in Greene County
The median household size in Greene County is 2.39 persons per household, with single female/mother households (5,887 | 8.8%) accounting for the largest median household size of 3.12 persons per household. non-family households (24,092 | 36.0%) represent the smallest median household size with 1.29 persons per household.
| Household Type | # Households | Household Size |
| Married-Couple | 34,279 (51.3%) | 3.00 |
| Single Male/Father | 2,598 (3.9%) | 3.01 |
| Single Female/Mother | 5,887 (8.8%) | 3.12 |
| Non-family | 24,092 (36.0%) | 1.29 |
| Total Households | 66,856 (100.0%) | 2.39 |
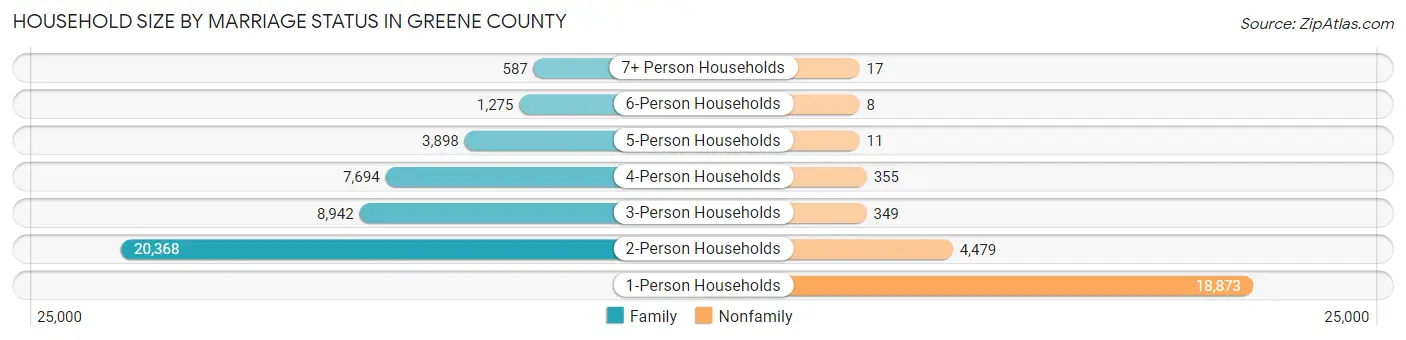
Household Size by Marriage Status in Greene County
Out of a total of 66,856 households in Greene County, 42,764 (64.0%) are family households, while 24,092 (36.0%) are nonfamily households. The most numerous type of family households are 2-person households, comprising 20,368, and the most common type of nonfamily households are 1-person households, comprising 18,873.
| Household Size | Family Households | Nonfamily Households |
| 1-Person Households | - | 18,873 (28.2%) |
| 2-Person Households | 20,368 (30.5%) | 4,479 (6.7%) |
| 3-Person Households | 8,942 (13.4%) | 349 (0.5%) |
| 4-Person Households | 7,694 (11.5%) | 355 (0.5%) |
| 5-Person Households | 3,898 (5.8%) | 11 (0.0%) |
| 6-Person Households | 1,275 (1.9%) | 8 (0.0%) |
| 7+ Person Households | 587 (0.9%) | 17 (0.0%) |
| Total | 42,764 (64.0%) | 24,092 (36.0%) |
Female Fertility in Greene County
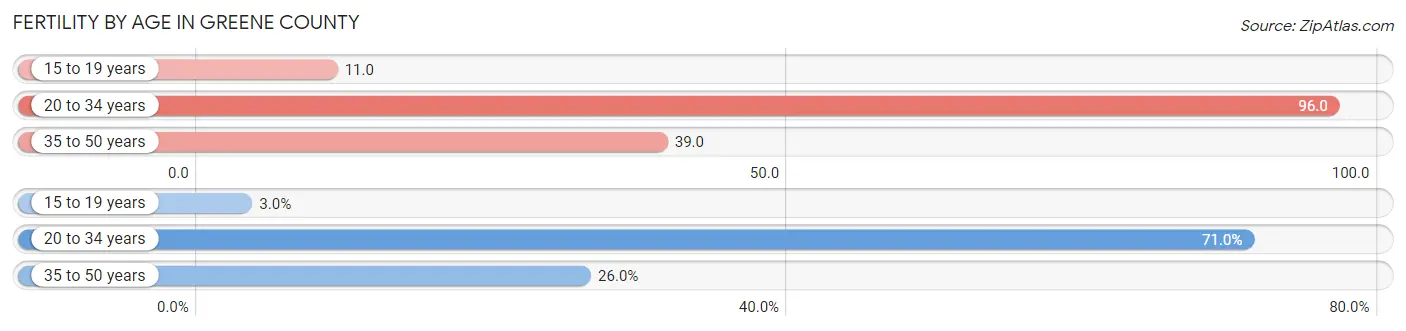
Fertility by Age in Greene County
Average fertility rate in Greene County is 59.0 births per 1,000 women. Women in the age bracket of 20 to 34 years have the highest fertility rate with 96.0 births per 1,000 women. Women in the age bracket of 20 to 34 years acount for 71.0% of all women with births.
| Age Bracket | Women with Births | Births / 1,000 Women |
| 15 to 19 years | 69 (3.0%) | 11.0 |
| 20 to 34 years | 1,627 (71.0%) | 96.0 |
| 35 to 50 years | 596 (26.0%) | 39.0 |
| Total | 2,292 (100.0%) | 59.0 |
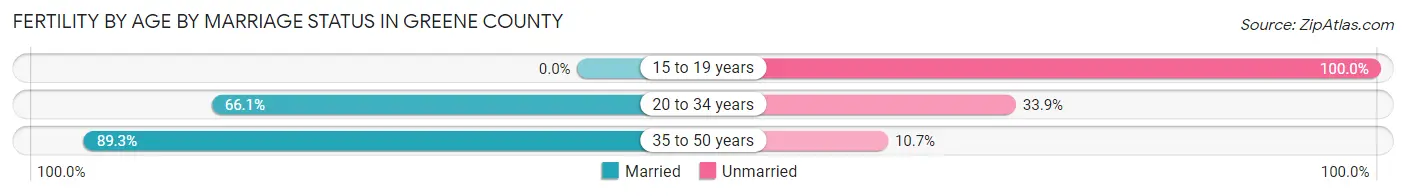
Fertility by Age by Marriage Status in Greene County
70.2% of women with births (2,292) in Greene County are married. The highest percentage of unmarried women with births falls into 15 to 19 years age bracket with 100.0% of them unmarried at the time of birth, while the lowest percentage of unmarried women with births belong to 35 to 50 years age bracket with 10.7% of them unmarried.
| Age Bracket | Married | Unmarried |
| 15 to 19 years | 0 (0.0%) | 69 (100.0%) |
| 20 to 34 years | 1,075 (66.1%) | 552 (33.9%) |
| 35 to 50 years | 532 (89.3%) | 64 (10.7%) |
| Total | 1,609 (70.2%) | 683 (29.8%) |
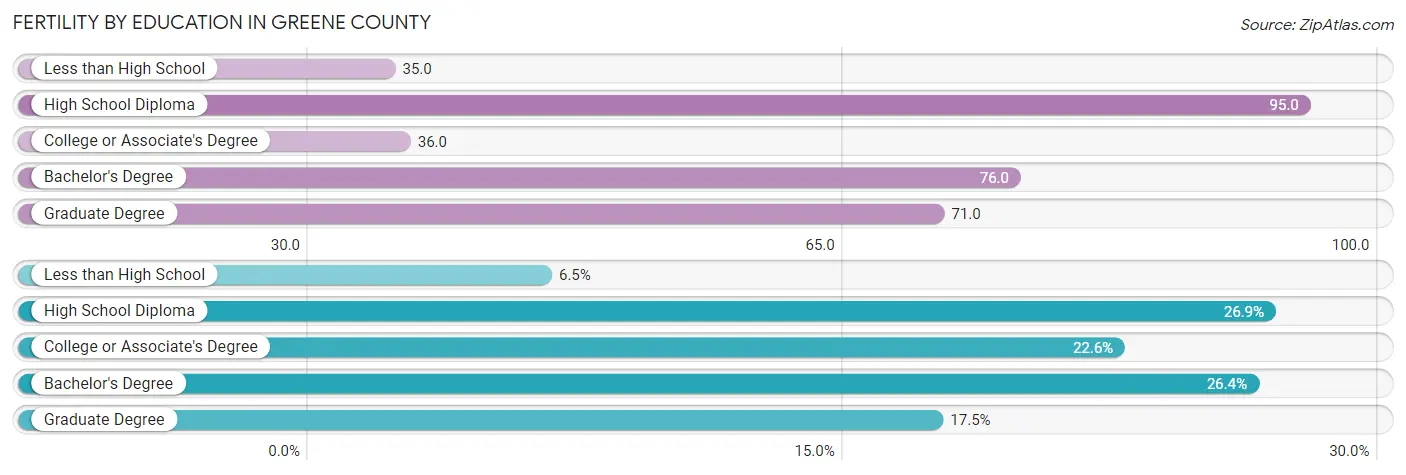
Fertility by Education in Greene County
Average fertility rate in Greene County is 59.0 births per 1,000 women. Women with the education attainment of high school diploma have the highest fertility rate of 95.0 births per 1,000 women, while women with the education attainment of less than high school have the lowest fertility at 35.0 births per 1,000 women. Women with the education attainment of high school diploma represent 26.9% of all women with births.
| Educational Attainment | Women with Births | Births / 1,000 Women |
| Less than High School | 150 (6.5%) | 35.0 |
| High School Diploma | 616 (26.9%) | 95.0 |
| College or Associate's Degree | 519 (22.6%) | 36.0 |
| Bachelor's Degree | 605 (26.4%) | 76.0 |
| Graduate Degree | 402 (17.5%) | 71.0 |
| Total | 2,292 (100.0%) | 59.0 |
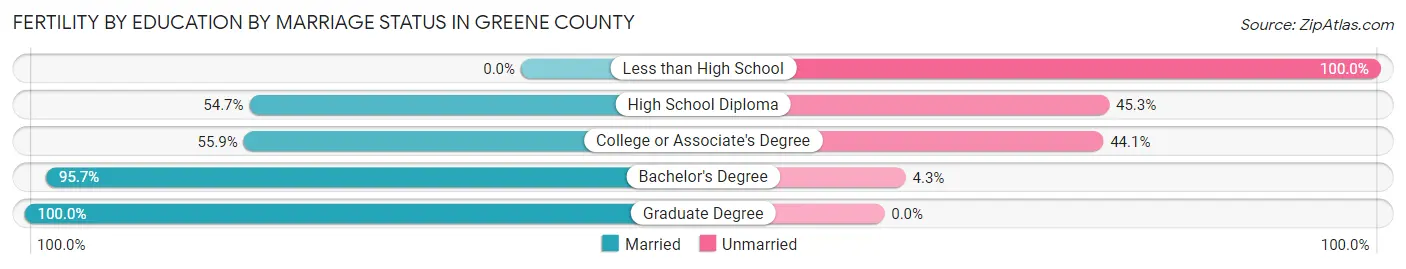
Fertility by Education by Marriage Status in Greene County
29.8% of women with births in Greene County are unmarried. Women with the educational attainment of graduate degree are most likely to be married with 100.0% of them married at childbirth, while women with the educational attainment of less than high school are least likely to be married with 100.0% of them unmarried at childbirth.
| Educational Attainment | Married | Unmarried |
| Less than High School | 0 (0.0%) | 150 (100.0%) |
| High School Diploma | 337 (54.7%) | 279 (45.3%) |
| College or Associate's Degree | 290 (55.9%) | 229 (44.1%) |
| Bachelor's Degree | 579 (95.7%) | 26 (4.3%) |
| Graduate Degree | 402 (100.0%) | 0 (0.0%) |
| Total | 1,609 (70.2%) | 683 (29.8%) |
Income in Greene County
Income Overview in Greene County
Per Capita Income in Greene County is $42,862, while median incomes of families and households are $106,369 and $81,243 respectively.
| Characteristic | Number | Measure |
| Per Capita Income | 167,567 | $42,862 |
| Median Family Income | 42,764 | $106,369 |
| Mean Family Income | 42,764 | $129,226 |
| Median Household Income | 66,856 | $81,243 |
| Mean Household Income | 66,856 | $105,348 |
| Income Deficit | 42,764 | $9,565 |
| Wage / Income Gap (%) | 167,567 | 38.91% |
| Wage / Income Gap ($) | 167,567 | 61.09¢ per $1 |
| Gini / Inequality Index | 167,567 | 0.44 |
Earnings by Sex in Greene County
Average Earnings in Greene County are $42,758, $54,031 for men and $33,006 for women, a difference of 38.9%.
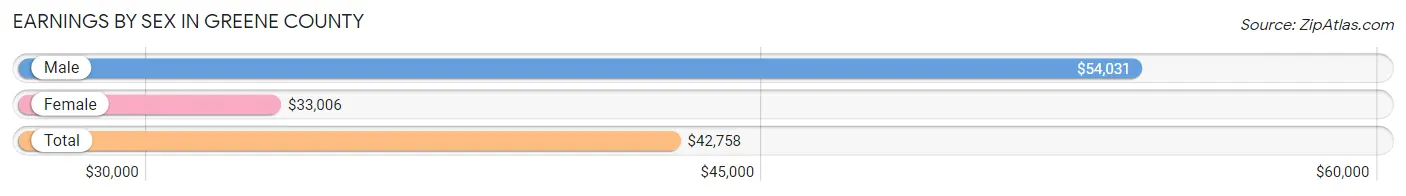
| Sex | Number | Average Earnings |
| Male | 49,643 (53.3%) | $54,031 |
| Female | 43,493 (46.7%) | $33,006 |
| Total | 93,136 (100.0%) | $42,758 |
Earnings by Sex by Income Bracket in Greene County
The most common earnings brackets in Greene County are $100,000+ for men (10,772 | 21.7%) and $100,000+ for women (4,041 | 9.3%).
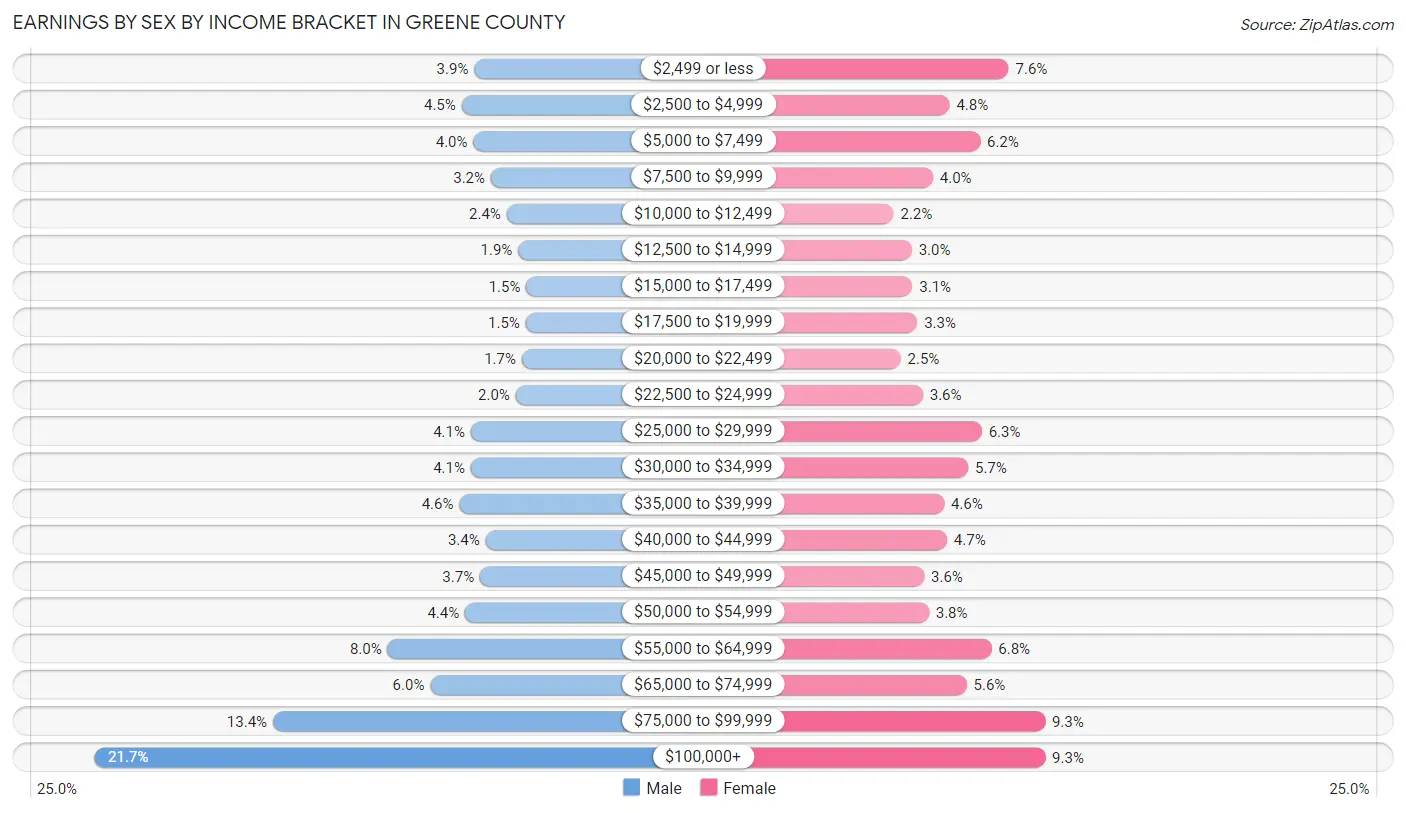
| Income | Male | Female |
| $2,499 or less | 1,954 (3.9%) | 3,298 (7.6%) |
| $2,500 to $4,999 | 2,249 (4.5%) | 2,091 (4.8%) |
| $5,000 to $7,499 | 1,976 (4.0%) | 2,714 (6.2%) |
| $7,500 to $9,999 | 1,568 (3.2%) | 1,751 (4.0%) |
| $10,000 to $12,499 | 1,199 (2.4%) | 953 (2.2%) |
| $12,500 to $14,999 | 935 (1.9%) | 1,321 (3.0%) |
| $15,000 to $17,499 | 745 (1.5%) | 1,336 (3.1%) |
| $17,500 to $19,999 | 761 (1.5%) | 1,434 (3.3%) |
| $20,000 to $22,499 | 850 (1.7%) | 1,096 (2.5%) |
| $22,500 to $24,999 | 994 (2.0%) | 1,548 (3.6%) |
| $25,000 to $29,999 | 2,036 (4.1%) | 2,747 (6.3%) |
| $30,000 to $34,999 | 2,033 (4.1%) | 2,469 (5.7%) |
| $35,000 to $39,999 | 2,304 (4.6%) | 1,981 (4.5%) |
| $40,000 to $44,999 | 1,694 (3.4%) | 2,041 (4.7%) |
| $45,000 to $49,999 | 1,820 (3.7%) | 1,575 (3.6%) |
| $50,000 to $54,999 | 2,168 (4.4%) | 1,671 (3.8%) |
| $55,000 to $64,999 | 3,969 (8.0%) | 2,946 (6.8%) |
| $65,000 to $74,999 | 2,981 (6.0%) | 2,442 (5.6%) |
| $75,000 to $99,999 | 6,635 (13.4%) | 4,038 (9.3%) |
| $100,000+ | 10,772 (21.7%) | 4,041 (9.3%) |
| Total | 49,643 (100.0%) | 43,493 (100.0%) |
Earnings by Sex by Educational Attainment in Greene County
Average earnings in Greene County are $64,833 for men and $42,085 for women, a difference of 35.1%. Men with an educational attainment of graduate degree enjoy the highest average annual earnings of $111,143, while those with less than high school education earn the least with $38,000. Women with an educational attainment of graduate degree earn the most with the average annual earnings of $75,752, while those with less than high school education have the smallest earnings of $20,270.
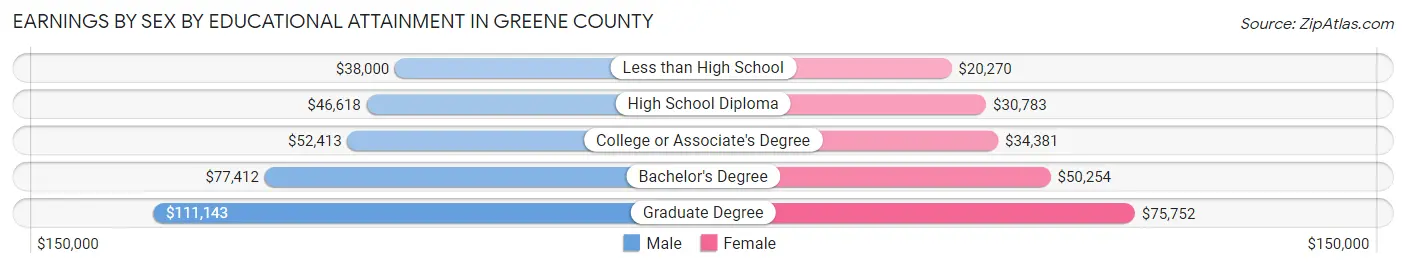
| Educational Attainment | Male Income | Female Income |
| Less than High School | $38,000 | $20,270 |
| High School Diploma | $46,618 | $30,783 |
| College or Associate's Degree | $52,413 | $34,381 |
| Bachelor's Degree | $77,412 | $50,254 |
| Graduate Degree | $111,143 | $75,752 |
| Total | $64,833 | $42,085 |
Family Income in Greene County
Family Income Brackets in Greene County
According to the Greene County family income data, there are 9,665 families falling into the $100,000 to $149,999 income range, which is the most common income bracket and makes up 22.6% of all families. Conversely, the $10,000 to $14,999 income bracket is the least frequent group with only 684 families (1.6%) belonging to this category.
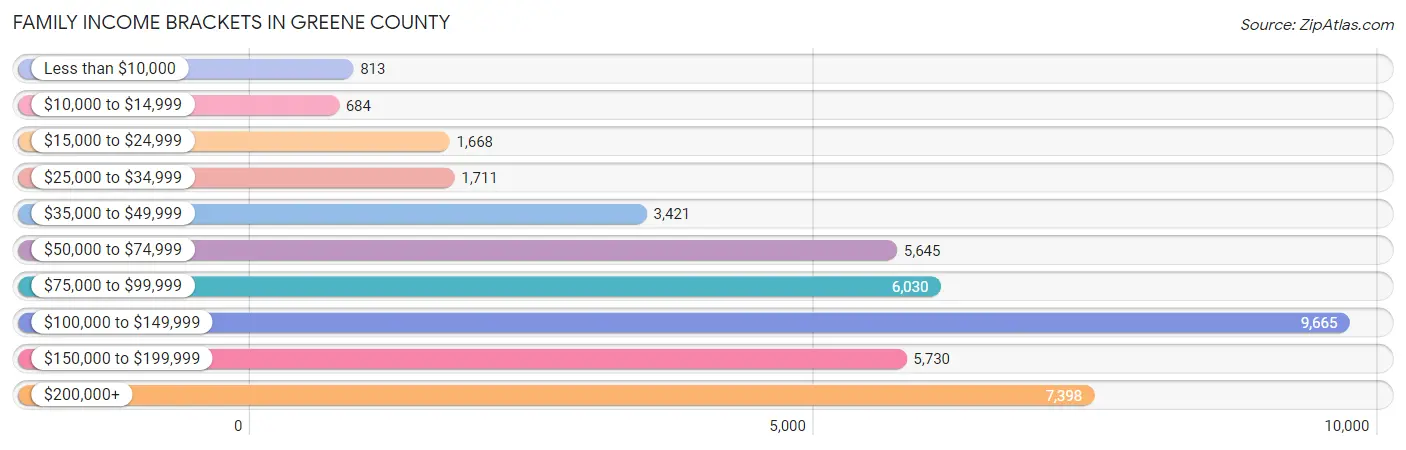
| Income Bracket | # Families | % Families |
| Less than $10,000 | 813 | 1.9% |
| $10,000 to $14,999 | 684 | 1.6% |
| $15,000 to $24,999 | 1,668 | 3.9% |
| $25,000 to $34,999 | 1,711 | 4.0% |
| $35,000 to $49,999 | 3,421 | 8.0% |
| $50,000 to $74,999 | 5,645 | 13.2% |
| $75,000 to $99,999 | 6,030 | 14.1% |
| $100,000 to $149,999 | 9,665 | 22.6% |
| $150,000 to $199,999 | 5,730 | 13.4% |
| $200,000+ | 7,398 | 17.3% |
Family Income by Famaliy Size in Greene County
7+ person families (475 | 1.1%) account for the highest median family income in Greene County with $172,026 per family, while 2-person families (21,366 | 50.0%) have the highest median income of $46,610 per family member.
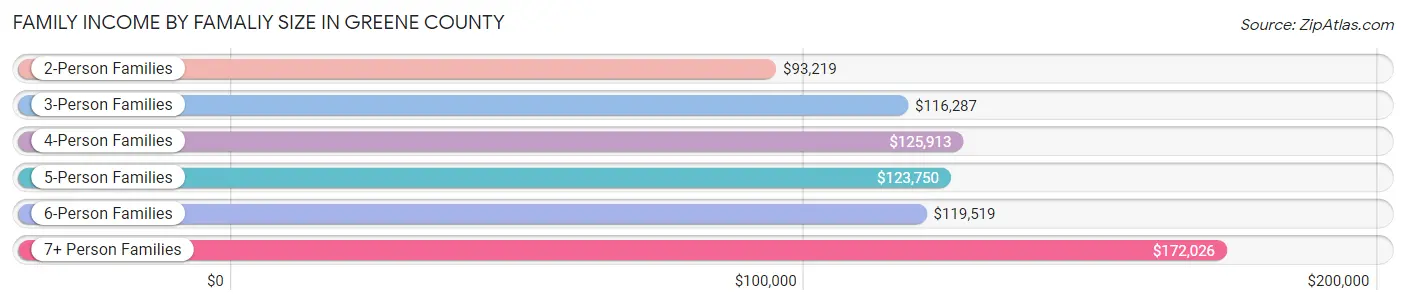
| Income Bracket | # Families | Median Income |
| 2-Person Families | 21,366 (50.0%) | $93,219 |
| 3-Person Families | 8,693 (20.3%) | $116,287 |
| 4-Person Families | 7,551 (17.7%) | $125,913 |
| 5-Person Families | 3,417 (8.0%) | $123,750 |
| 6-Person Families | 1,262 (2.9%) | $119,519 |
| 7+ Person Families | 475 (1.1%) | $172,026 |
| Total | 42,764 (100.0%) | $106,369 |
Family Income by Number of Earners in Greene County
The median family income in Greene County is $106,369, with families comprising 3+ earners (4,639) having the highest median family income of $167,083, while families with no earners (6,781) have the lowest median family income of $66,656, accounting for 10.8% and 15.9% of families, respectively.
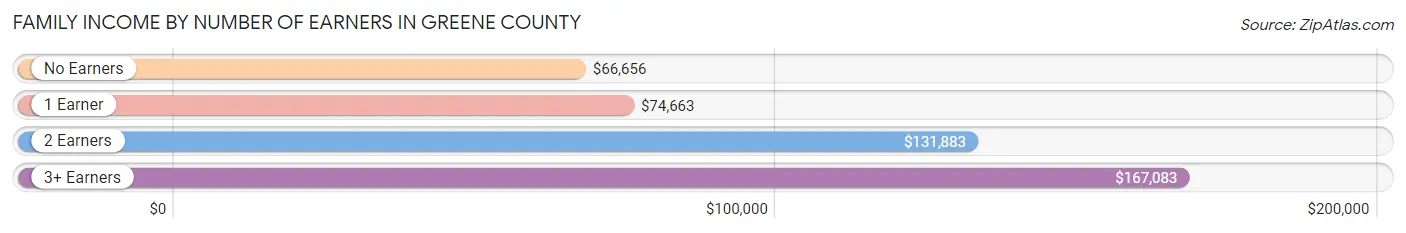
| Number of Earners | # Families | Median Income |
| No Earners | 6,781 (15.9%) | $66,656 |
| 1 Earner | 13,139 (30.7%) | $74,663 |
| 2 Earners | 18,205 (42.6%) | $131,883 |
| 3+ Earners | 4,639 (10.8%) | $167,083 |
| Total | 42,764 (100.0%) | $106,369 |
Household Income in Greene County
Household Income Brackets in Greene County
With 12,235 households falling in the category, the $100,000 to $149,999 income range is the most frequent in Greene County, accounting for 18.3% of all households. In contrast, only 1,805 households (2.7%) fall into the $10,000 to $14,999 income bracket, making it the least populous group.
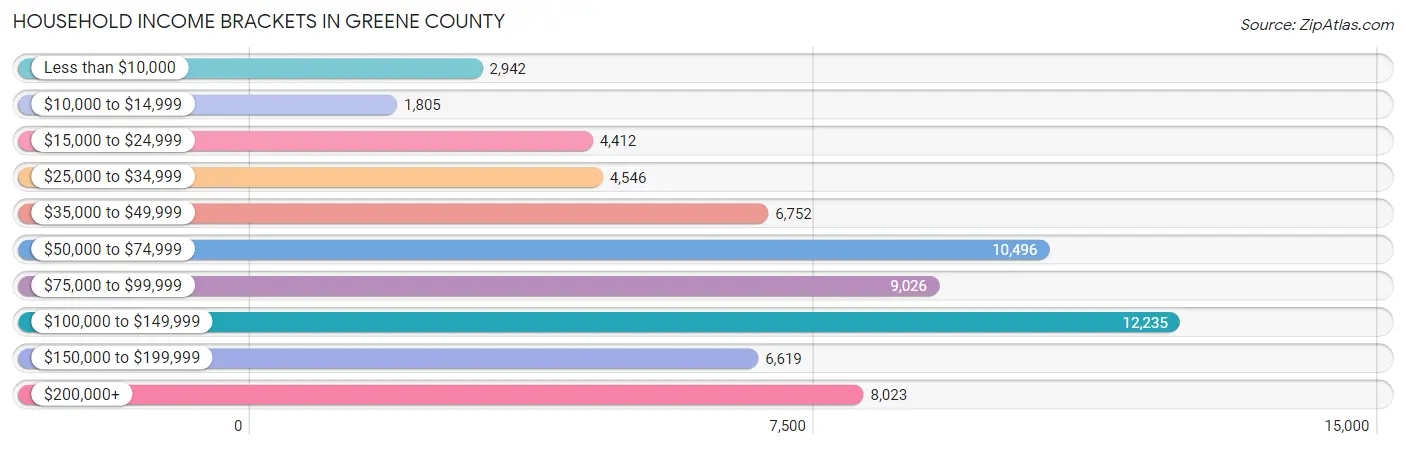
| Income Bracket | # Households | % Households |
| Less than $10,000 | 2,942 | 4.4% |
| $10,000 to $14,999 | 1,805 | 2.7% |
| $15,000 to $24,999 | 4,412 | 6.6% |
| $25,000 to $34,999 | 4,546 | 6.8% |
| $35,000 to $49,999 | 6,752 | 10.1% |
| $50,000 to $74,999 | 10,496 | 15.7% |
| $75,000 to $99,999 | 9,026 | 13.5% |
| $100,000 to $149,999 | 12,235 | 18.3% |
| $150,000 to $199,999 | 6,619 | 9.9% |
| $200,000+ | 8,023 | 12.0% |
Household Income by Householder Age in Greene County
The median household income in Greene County is $81,243, with the highest median household income of $105,367 found in the 45 to 64 years age bracket for the primary householder. A total of 23,364 households (34.9%) fall into this category. Meanwhile, the 15 to 24 years age bracket for the primary householder has the lowest median household income of $38,750, with 4,009 households (6.0%) in this group.
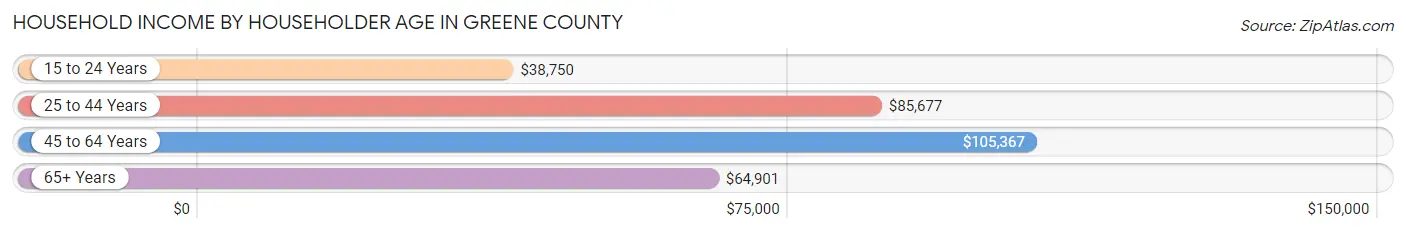
| Income Bracket | # Households | Median Income |
| 15 to 24 Years | 4,009 (6.0%) | $38,750 |
| 25 to 44 Years | 21,115 (31.6%) | $85,677 |
| 45 to 64 Years | 23,364 (34.9%) | $105,367 |
| 65+ Years | 18,368 (27.5%) | $64,901 |
| Total | 66,856 (100.0%) | $81,243 |
Poverty in Greene County
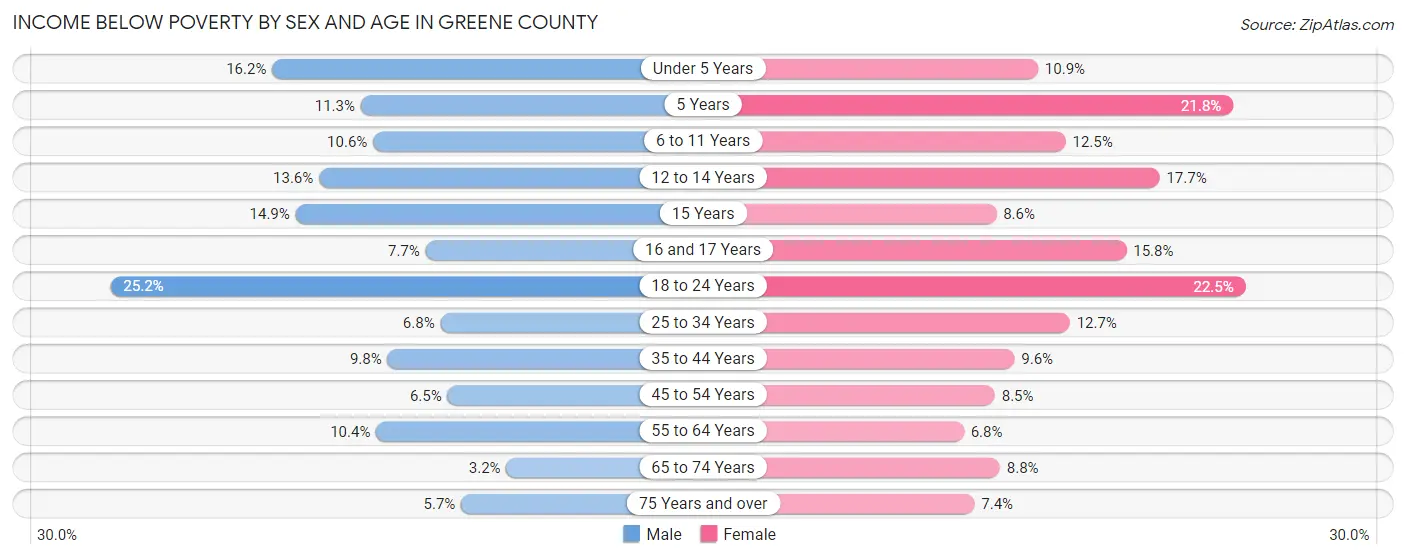
Income Below Poverty by Sex and Age in Greene County
With 10.1% poverty level for males and 11.1% for females among the residents of Greene County, 18 to 24 year old males and 18 to 24 year old females are the most vulnerable to poverty, with 1,751 males (25.2%) and 1,526 females (22.5%) in their respective age groups living below the poverty level.
| Age Bracket | Male | Female |
| Under 5 Years | 750 (16.2%) | 464 (10.9%) |
| 5 Years | 120 (11.3%) | 187 (21.8%) |
| 6 to 11 Years | 610 (10.6%) | 666 (12.5%) |
| 12 to 14 Years | 404 (13.6%) | 522 (17.7%) |
| 15 Years | 154 (14.9%) | 82 (8.6%) |
| 16 and 17 Years | 158 (7.7%) | 302 (15.8%) |
| 18 to 24 Years | 1,751 (25.2%) | 1,526 (22.5%) |
| 25 to 34 Years | 768 (6.8%) | 1,349 (12.7%) |
| 35 to 44 Years | 992 (9.8%) | 937 (9.6%) |
| 45 to 54 Years | 602 (6.5%) | 819 (8.5%) |
| 55 to 64 Years | 1,157 (10.4%) | 776 (6.8%) |
| 65 to 74 Years | 270 (3.2%) | 795 (8.8%) |
| 75 Years and over | 270 (5.7%) | 498 (7.4%) |
| Total | 8,006 (10.1%) | 8,923 (11.1%) |
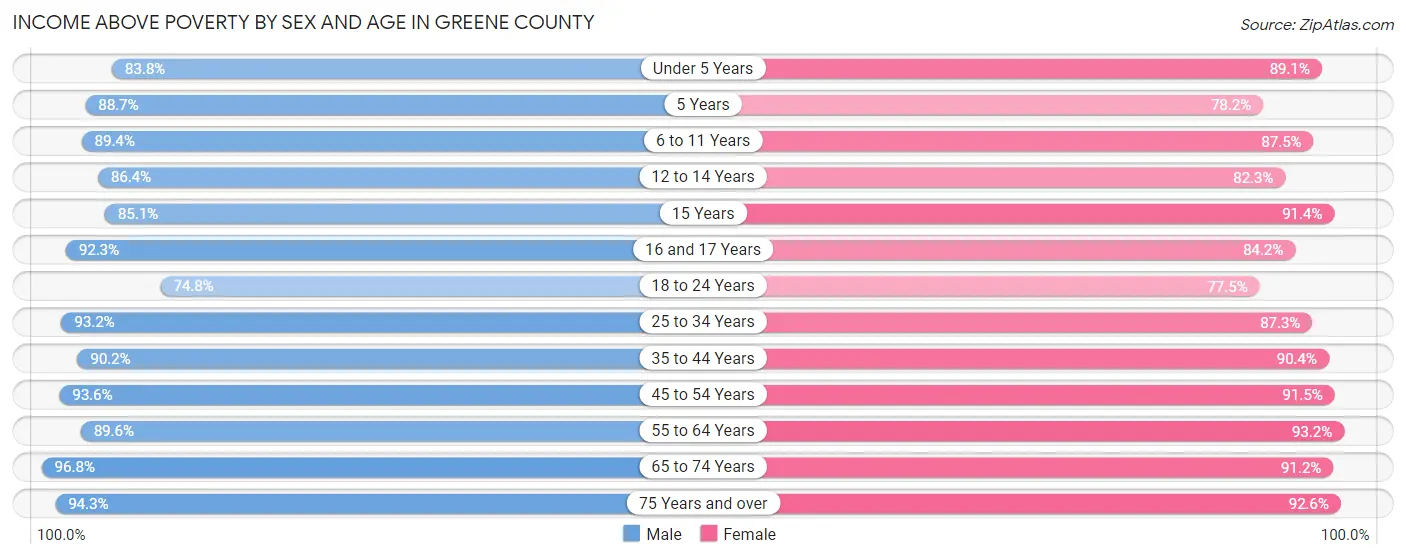
Income Above Poverty by Sex and Age in Greene County
According to the poverty statistics in Greene County, males aged 65 to 74 years and females aged 55 to 64 years are the age groups that are most secure financially, with 96.8% of males and 93.2% of females in these age groups living above the poverty line.
| Age Bracket | Male | Female |
| Under 5 Years | 3,876 (83.8%) | 3,785 (89.1%) |
| 5 Years | 944 (88.7%) | 671 (78.2%) |
| 6 to 11 Years | 5,149 (89.4%) | 4,677 (87.5%) |
| 12 to 14 Years | 2,566 (86.4%) | 2,428 (82.3%) |
| 15 Years | 879 (85.1%) | 871 (91.4%) |
| 16 and 17 Years | 1,903 (92.3%) | 1,604 (84.2%) |
| 18 to 24 Years | 5,192 (74.8%) | 5,261 (77.5%) |
| 25 to 34 Years | 10,461 (93.2%) | 9,284 (87.3%) |
| 35 to 44 Years | 9,137 (90.2%) | 8,812 (90.4%) |
| 45 to 54 Years | 8,737 (93.5%) | 8,792 (91.5%) |
| 55 to 64 Years | 9,948 (89.6%) | 10,654 (93.2%) |
| 65 to 74 Years | 8,255 (96.8%) | 8,243 (91.2%) |
| 75 Years and over | 4,474 (94.3%) | 6,250 (92.6%) |
| Total | 71,521 (89.9%) | 71,332 (88.9%) |
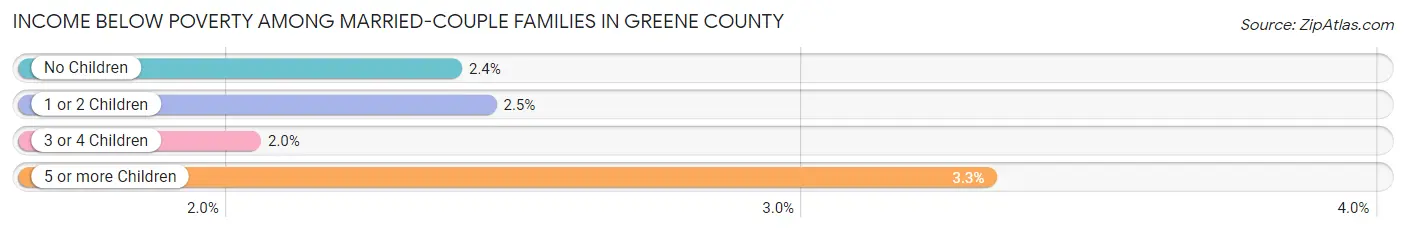
Income Below Poverty Among Married-Couple Families in Greene County
The poverty statistics for married-couple families in Greene County show that 2.4% or 817 of the total 34,279 families live below the poverty line. Families with 5 or more children have the highest poverty rate of 3.3%, comprising of 11 families. On the other hand, families with 3 or 4 children have the lowest poverty rate of 2.0%, which includes 62 families.
| Children | Above Poverty | Below Poverty |
| No Children | 20,524 (97.6%) | 502 (2.4%) |
| 1 or 2 Children | 9,644 (97.6%) | 242 (2.5%) |
| 3 or 4 Children | 2,974 (98.0%) | 62 (2.0%) |
| 5 or more Children | 320 (96.7%) | 11 (3.3%) |
| Total | 33,462 (97.6%) | 817 (2.4%) |
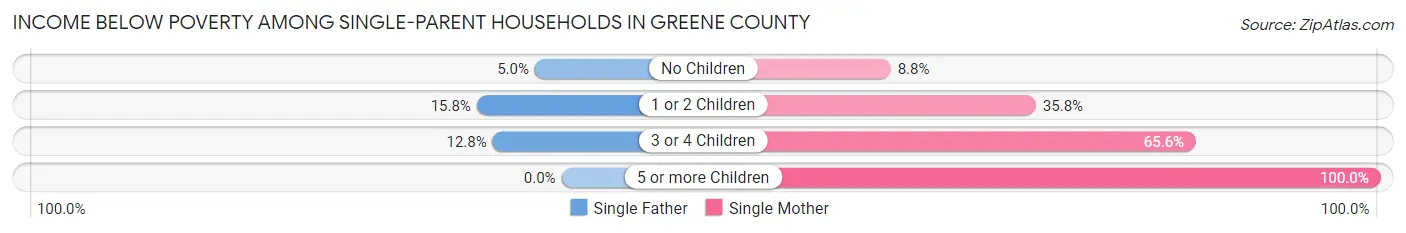
Income Below Poverty Among Single-Parent Households in Greene County
According to the poverty data in Greene County, 11.5% or 298 single-father households and 29.8% or 1,757 single-mother households are living below the poverty line. Among single-father households, those with 1 or 2 children have the highest poverty rate, with 231 households (15.8%) experiencing poverty. Likewise, among single-mother households, those with 5 or more children have the highest poverty rate, with 46 households (100.0%) falling below the poverty line.
| Children | Single Father | Single Mother |
| No Children | 48 (5.0%) | 190 (8.8%) |
| 1 or 2 Children | 231 (15.8%) | 1,069 (35.8%) |
| 3 or 4 Children | 19 (12.8%) | 452 (65.6%) |
| 5 or more Children | 0 (0.0%) | 46 (100.0%) |
| Total | 298 (11.5%) | 1,757 (29.8%) |
Income Below Poverty Among Married-Couple vs Single-Parent Households in Greene County
The poverty data for Greene County shows that 817 of the married-couple family households (2.4%) and 2,055 of the single-parent households (24.2%) are living below the poverty level. Within the married-couple family households, those with 5 or more children have the highest poverty rate, with 11 households (3.3%) falling below the poverty line. Among the single-parent households, those with 5 or more children have the highest poverty rate, with 46 household (68.7%) living below poverty.
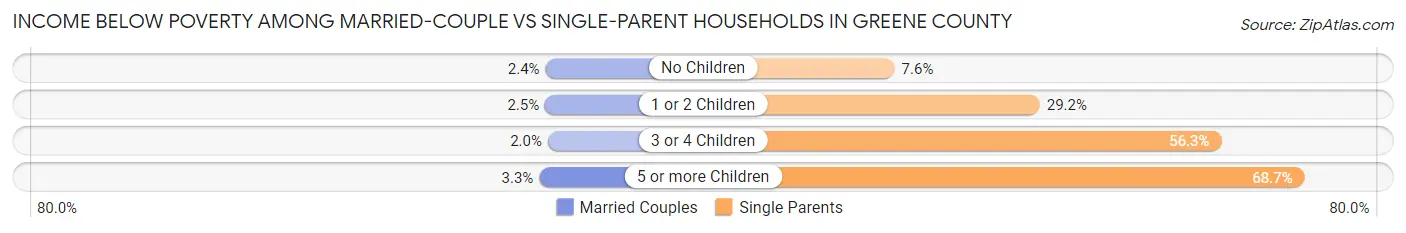
| Children | Married-Couple Families | Single-Parent Households |
| No Children | 502 (2.4%) | 238 (7.6%) |
| 1 or 2 Children | 242 (2.5%) | 1,300 (29.2%) |
| 3 or 4 Children | 62 (2.0%) | 471 (56.3%) |
| 5 or more Children | 11 (3.3%) | 46 (68.7%) |
| Total | 817 (2.4%) | 2,055 (24.2%) |
Employment Characteristics in Greene County
Employment by Class of Employer in Greene County
Among the 80,299 employed individuals in Greene County, private company employees (46,982 | 58.5%), federal government employees (10,344 | 12.9%), and not-for-profit organizations (9,194 | 11.5%) make up the most common classes of employment.
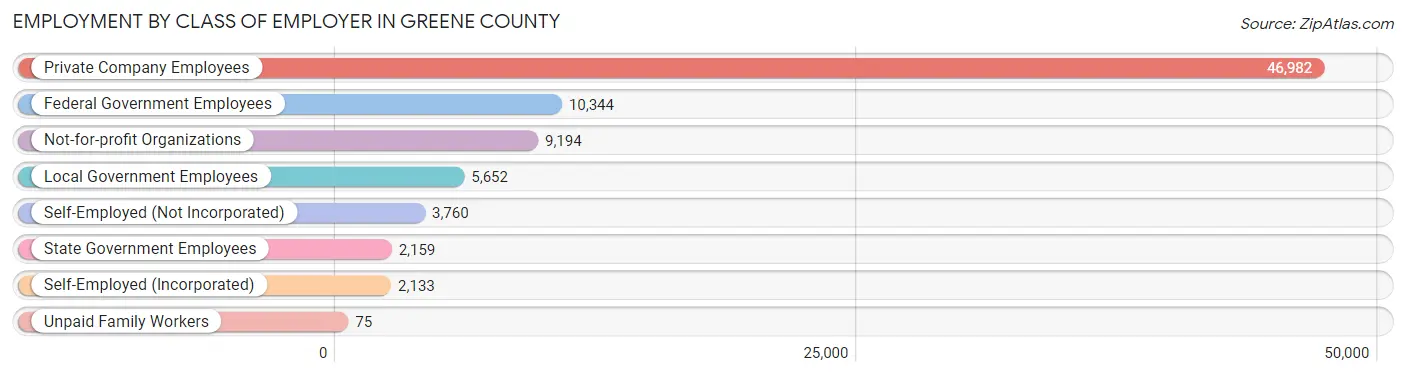
| Employer Class | # Employees | % Employees |
| Private Company Employees | 46,982 | 58.5% |
| Self-Employed (Incorporated) | 2,133 | 2.7% |
| Self-Employed (Not Incorporated) | 3,760 | 4.7% |
| Not-for-profit Organizations | 9,194 | 11.5% |
| Local Government Employees | 5,652 | 7.0% |
| State Government Employees | 2,159 | 2.7% |
| Federal Government Employees | 10,344 | 12.9% |
| Unpaid Family Workers | 75 | 0.1% |
| Total | 80,299 | 100.0% |
Employment Status by Age in Greene County
According to the labor force statistics for Greene County, out of the total population over 16 years of age (137,078), 62.8% or 86,085 individuals are in the labor force, with 4.6% or 3,960 of them unemployed. The age group with the highest labor force participation rate is 25 to 29 years, with 86.4% or 9,739 individuals in the labor force. Within the labor force, the 16 to 19 years age range has the highest percentage of unemployed individuals, with 12.1% or 593 of them being unemployed.
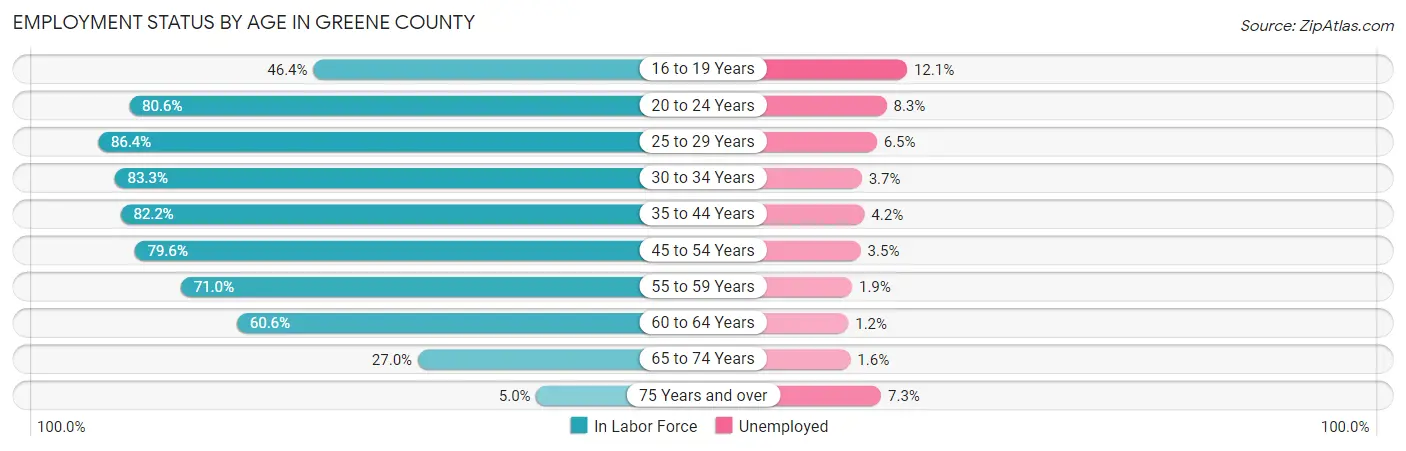
| Age Bracket | In Labor Force | Unemployed |
| 16 to 19 Years | 4,900 (46.4%) | 593 (12.1%) |
| 20 to 24 Years | 10,325 (80.6%) | 857 (8.3%) |
| 25 to 29 Years | 9,739 (86.4%) | 633 (6.5%) |
| 30 to 34 Years | 9,022 (83.3%) | 334 (3.7%) |
| 35 to 44 Years | 16,452 (82.2%) | 691 (4.2%) |
| 45 to 54 Years | 15,225 (79.6%) | 533 (3.5%) |
| 55 to 59 Years | 8,387 (71.0%) | 159 (1.9%) |
| 60 to 64 Years | 6,552 (60.6%) | 79 (1.2%) |
| 65 to 74 Years | 4,801 (27.0%) | 77 (1.6%) |
| 75 Years and over | 603 (5.0%) | 44 (7.3%) |
| Total | 86,085 (62.8%) | 3,960 (4.6%) |
Employment Status by Educational Attainment in Greene County
According to labor force statistics for Greene County, 78.0% of individuals (65,419) out of the total population between 25 and 64 years of age (83,870) are in the labor force, with 3.7% or 2,421 of them being unemployed. The group with the highest labor force participation rate are those with the educational attainment of bachelor's degree or higher, with 84.4% or 30,801 individuals in the labor force. Within the labor force, individuals with less than high school education have the highest percentage of unemployment, with 14.4% or 285 of them being unemployed.
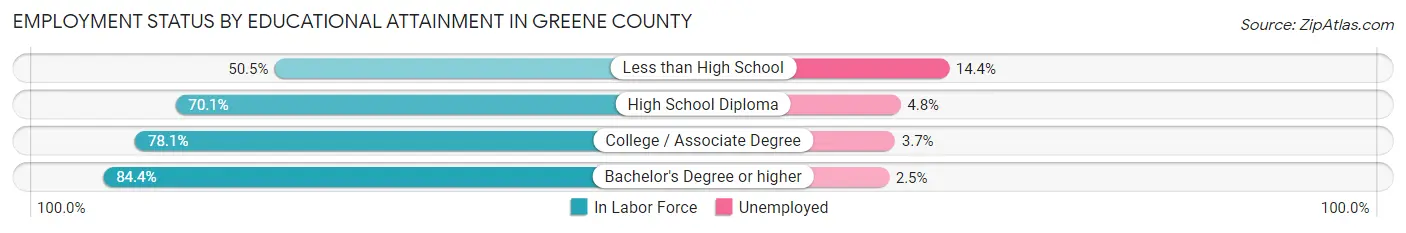
| Educational Attainment | In Labor Force | Unemployed |
| Less than High School | 1,976 (50.5%) | 563 (14.4%) |
| High School Diploma | 11,649 (70.1%) | 798 (4.8%) |
| College / Associate Degree | 20,967 (78.1%) | 993 (3.7%) |
| Bachelor's Degree or higher | 30,801 (84.4%) | 912 (2.5%) |
| Total | 65,419 (78.0%) | 3,103 (3.7%) |
Employment Occupations by Sex in Greene County
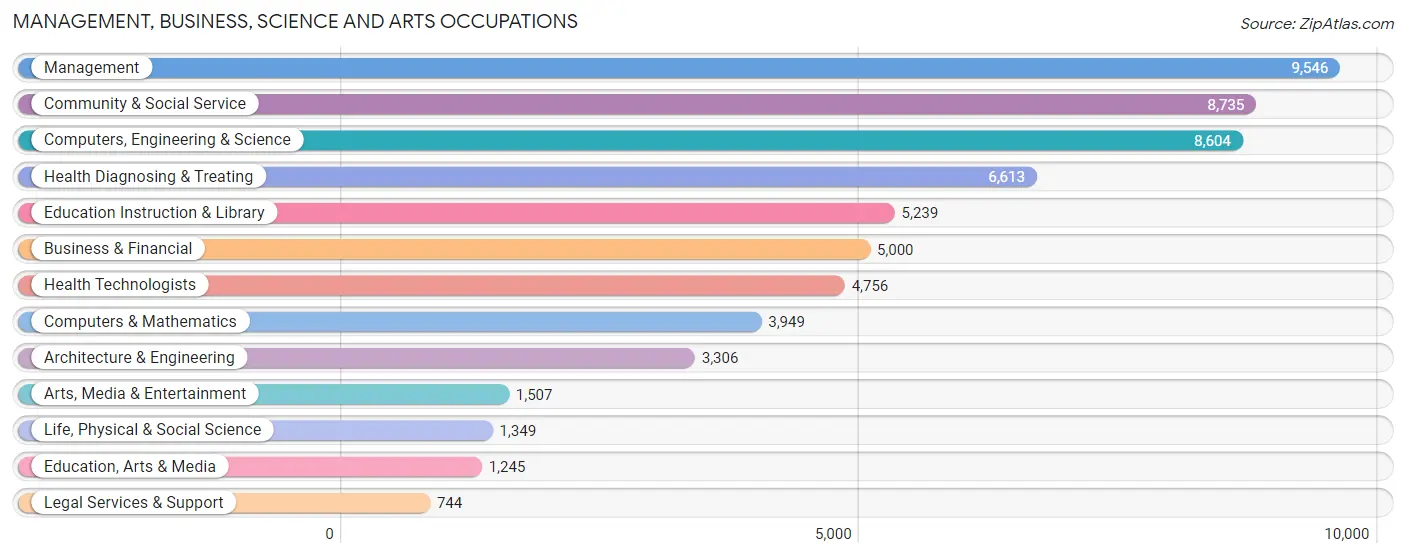
Management, Business, Science and Arts Occupations
The most common Management, Business, Science and Arts occupations in Greene County are Management (9,546 | 12.0%), Community & Social Service (8,735 | 11.0%), Computers, Engineering & Science (8,604 | 10.8%), Health Diagnosing & Treating (6,613 | 8.3%), and Education Instruction & Library (5,239 | 6.6%).
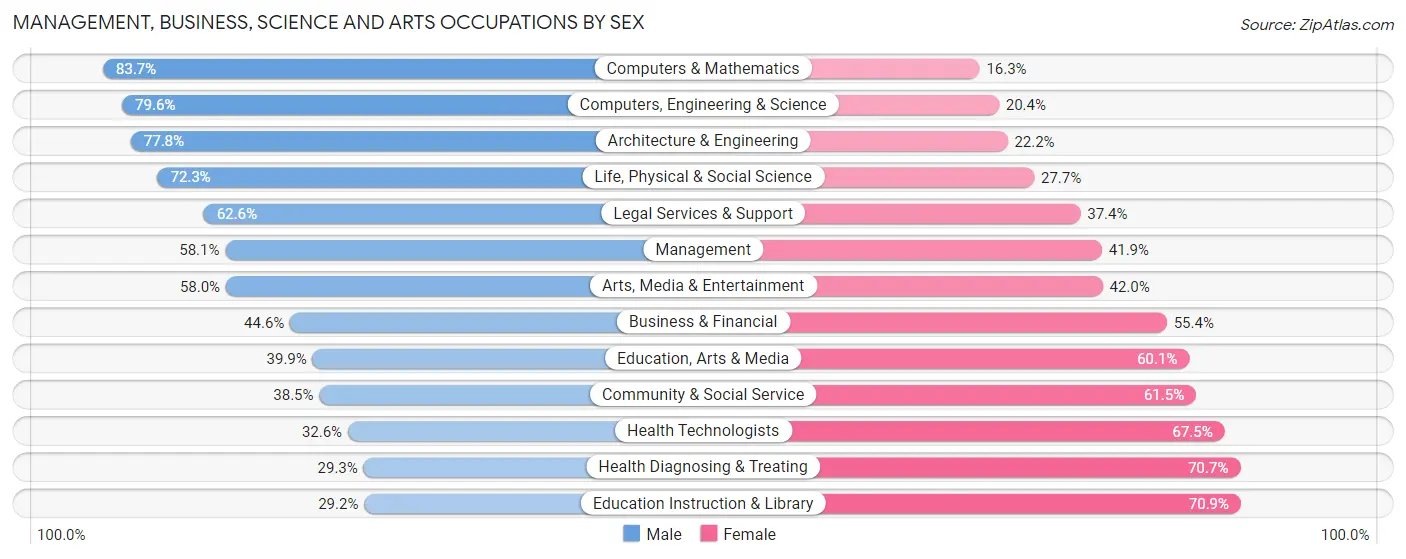
Management, Business, Science and Arts Occupations by Sex
Within the Management, Business, Science and Arts occupations in Greene County, the most male-oriented occupations are Computers & Mathematics (83.7%), Computers, Engineering & Science (79.6%), and Architecture & Engineering (77.8%), while the most female-oriented occupations are Education Instruction & Library (70.9%), Health Diagnosing & Treating (70.7%), and Health Technologists (67.4%).
| Occupation | Male | Female |
| Management | 5,550 (58.1%) | 3,996 (41.9%) |
| Business & Financial | 2,230 (44.6%) | 2,770 (55.4%) |
| Computers, Engineering & Science | 6,852 (79.6%) | 1,752 (20.4%) |
| Computers & Mathematics | 3,304 (83.7%) | 645 (16.3%) |
| Architecture & Engineering | 2,573 (77.8%) | 733 (22.2%) |
| Life, Physical & Social Science | 975 (72.3%) | 374 (27.7%) |
| Community & Social Service | 3,364 (38.5%) | 5,371 (61.5%) |
| Education, Arts & Media | 497 (39.9%) | 748 (60.1%) |
| Legal Services & Support | 466 (62.6%) | 278 (37.4%) |
| Education Instruction & Library | 1,527 (29.1%) | 3,712 (70.9%) |
| Arts, Media & Entertainment | 874 (58.0%) | 633 (42.0%) |
| Health Diagnosing & Treating | 1,936 (29.3%) | 4,677 (70.7%) |
| Health Technologists | 1,548 (32.6%) | 3,208 (67.4%) |
| Total (Category) | 19,932 (51.8%) | 18,566 (48.2%) |
| Total (Overall) | 42,296 (53.0%) | 37,496 (47.0%) |
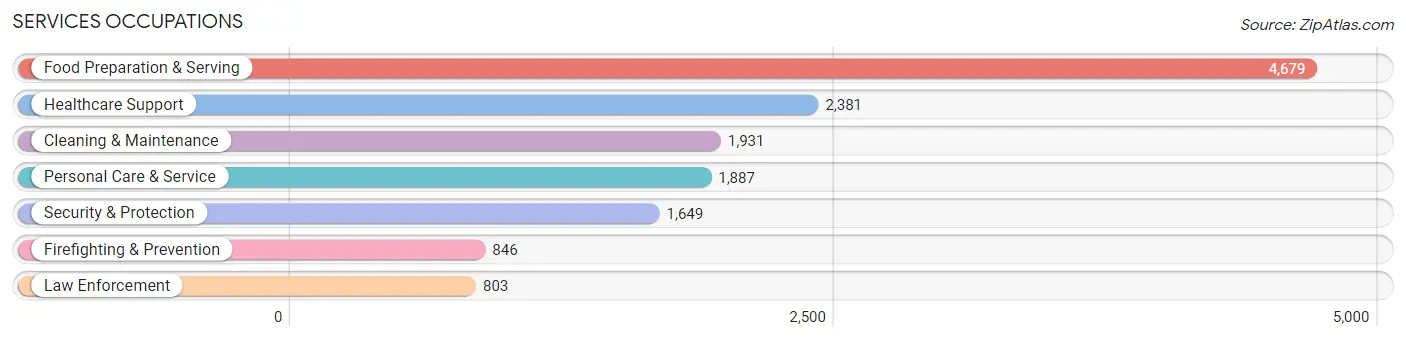
Services Occupations
The most common Services occupations in Greene County are Food Preparation & Serving (4,679 | 5.9%), Healthcare Support (2,381 | 3.0%), Cleaning & Maintenance (1,931 | 2.4%), Personal Care & Service (1,887 | 2.4%), and Security & Protection (1,649 | 2.1%).
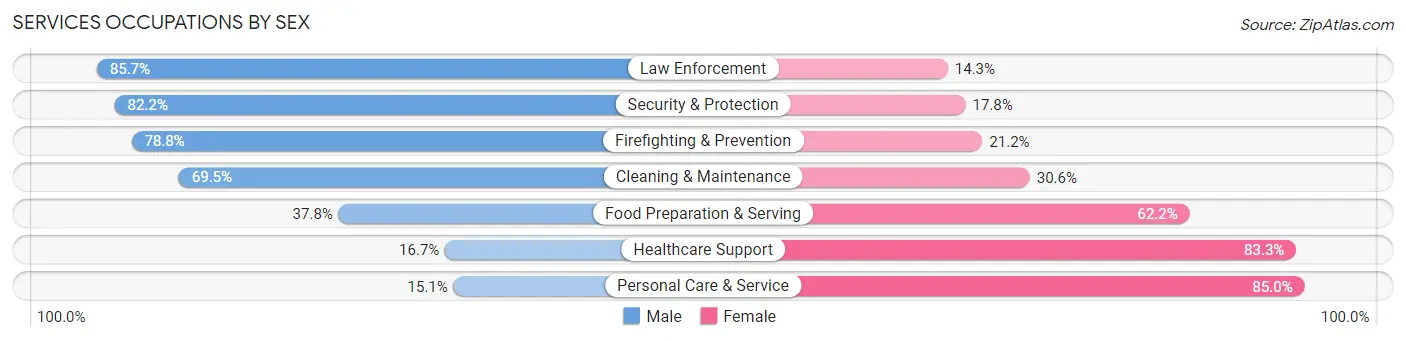
Services Occupations by Sex
Within the Services occupations in Greene County, the most male-oriented occupations are Law Enforcement (85.7%), Security & Protection (82.2%), and Firefighting & Prevention (78.8%), while the most female-oriented occupations are Personal Care & Service (85.0%), Healthcare Support (83.3%), and Food Preparation & Serving (62.2%).
| Occupation | Male | Female |
| Healthcare Support | 398 (16.7%) | 1,983 (83.3%) |
| Security & Protection | 1,355 (82.2%) | 294 (17.8%) |
| Firefighting & Prevention | 667 (78.8%) | 179 (21.2%) |
| Law Enforcement | 688 (85.7%) | 115 (14.3%) |
| Food Preparation & Serving | 1,769 (37.8%) | 2,910 (62.2%) |
| Cleaning & Maintenance | 1,341 (69.5%) | 590 (30.5%) |
| Personal Care & Service | 284 (15.0%) | 1,603 (85.0%) |
| Total (Category) | 5,147 (41.1%) | 7,380 (58.9%) |
| Total (Overall) | 42,296 (53.0%) | 37,496 (47.0%) |
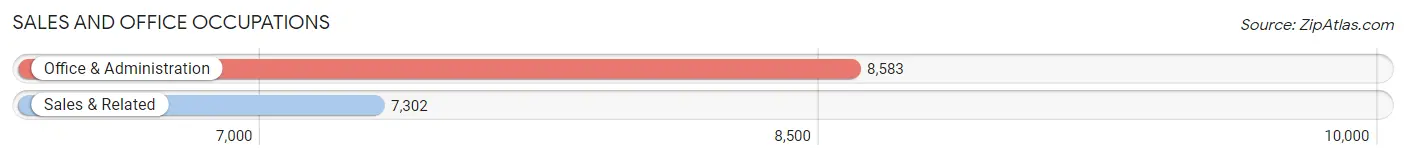
Sales and Office Occupations
The most common Sales and Office occupations in Greene County are Office & Administration (8,583 | 10.8%), and Sales & Related (7,302 | 9.1%).
Sales and Office Occupations by Sex
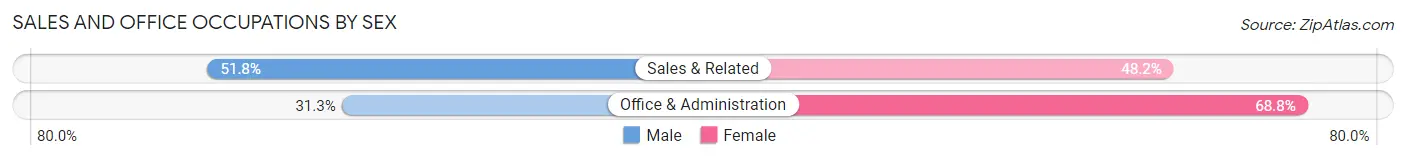
| Occupation | Male | Female |
| Sales & Related | 3,785 (51.8%) | 3,517 (48.2%) |
| Office & Administration | 2,682 (31.2%) | 5,901 (68.8%) |
| Total (Category) | 6,467 (40.7%) | 9,418 (59.3%) |
| Total (Overall) | 42,296 (53.0%) | 37,496 (47.0%) |
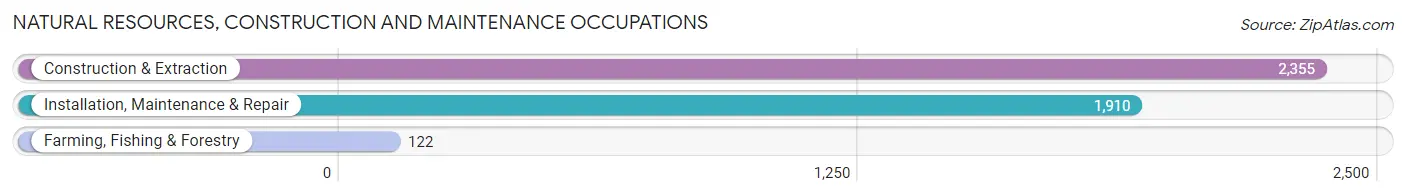
Natural Resources, Construction and Maintenance Occupations
The most common Natural Resources, Construction and Maintenance occupations in Greene County are Construction & Extraction (2,355 | 2.9%), Installation, Maintenance & Repair (1,910 | 2.4%), and Farming, Fishing & Forestry (122 | 0.2%).
Natural Resources, Construction and Maintenance Occupations by Sex
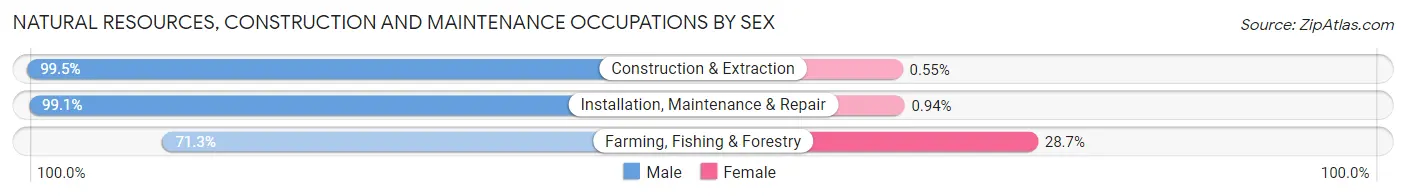
| Occupation | Male | Female |
| Farming, Fishing & Forestry | 87 (71.3%) | 35 (28.7%) |
| Construction & Extraction | 2,342 (99.5%) | 13 (0.5%) |
| Installation, Maintenance & Repair | 1,892 (99.1%) | 18 (0.9%) |
| Total (Category) | 4,321 (98.5%) | 66 (1.5%) |
| Total (Overall) | 42,296 (53.0%) | 37,496 (47.0%) |
Production, Transportation and Moving Occupations
The most common Production, Transportation and Moving occupations in Greene County are Production (4,094 | 5.1%), Transportation (2,293 | 2.9%), and Material Moving (2,108 | 2.6%).

Production, Transportation and Moving Occupations by Sex
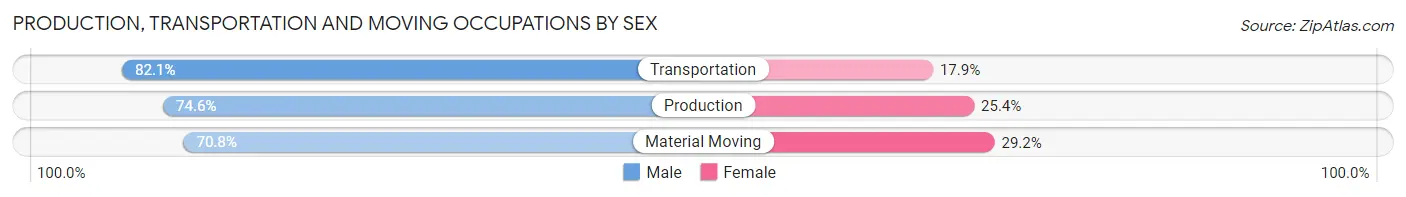
| Occupation | Male | Female |
| Production | 3,053 (74.6%) | 1,041 (25.4%) |
| Transportation | 1,883 (82.1%) | 410 (17.9%) |
| Material Moving | 1,493 (70.8%) | 615 (29.2%) |
| Total (Category) | 6,429 (75.7%) | 2,066 (24.3%) |
| Total (Overall) | 42,296 (53.0%) | 37,496 (47.0%) |
Employment Industries by Sex in Greene County
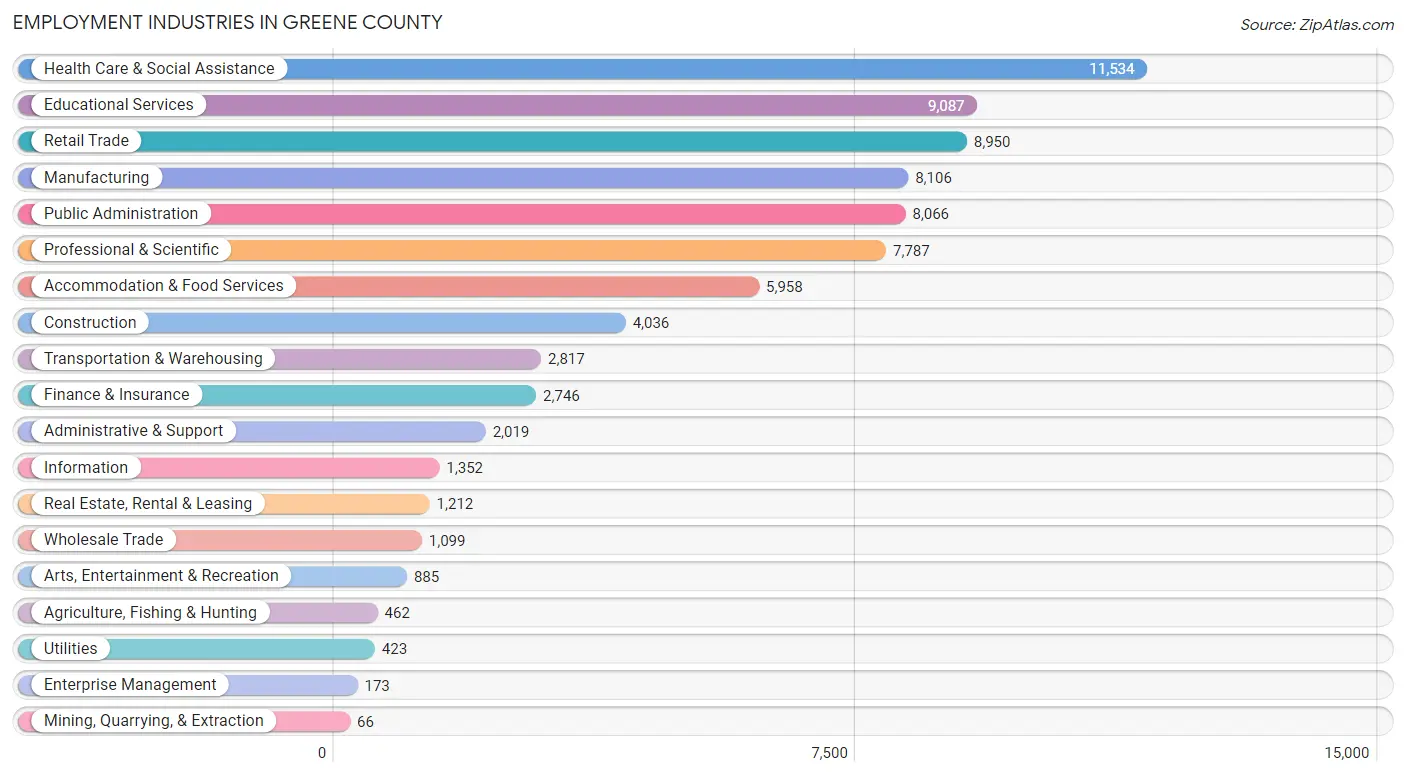
Employment Industries in Greene County
The major employment industries in Greene County include Health Care & Social Assistance (11,534 | 14.5%), Educational Services (9,087 | 11.4%), Retail Trade (8,950 | 11.2%), Manufacturing (8,106 | 10.2%), and Public Administration (8,066 | 10.1%).
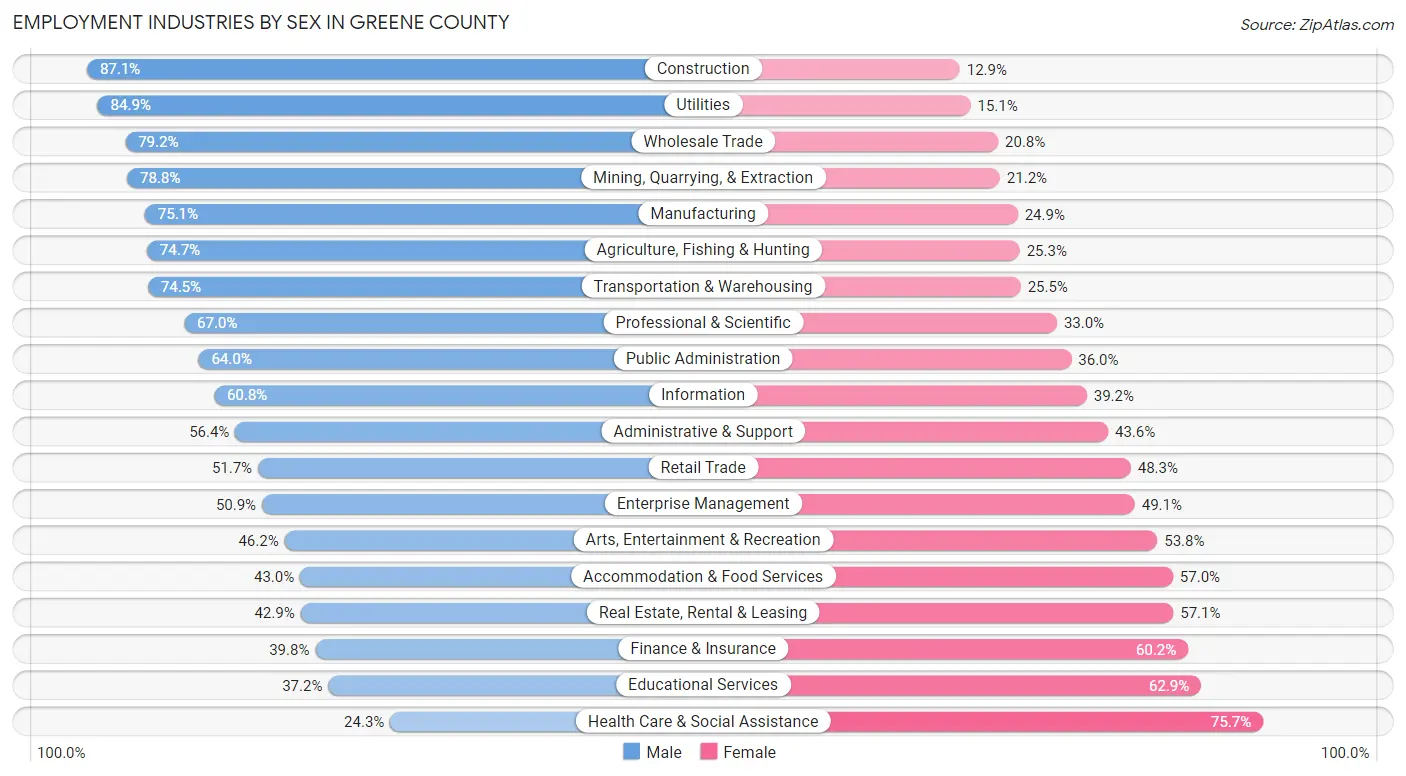
Employment Industries by Sex in Greene County
The Greene County industries that see more men than women are Construction (87.1%), Utilities (84.9%), and Wholesale Trade (79.2%), whereas the industries that tend to have a higher number of women are Health Care & Social Assistance (75.7%), Educational Services (62.8%), and Finance & Insurance (60.2%).
| Industry | Male | Female |
| Agriculture, Fishing & Hunting | 345 (74.7%) | 117 (25.3%) |
| Mining, Quarrying, & Extraction | 52 (78.8%) | 14 (21.2%) |
| Construction | 3,515 (87.1%) | 521 (12.9%) |
| Manufacturing | 6,088 (75.1%) | 2,018 (24.9%) |
| Wholesale Trade | 870 (79.2%) | 229 (20.8%) |
| Retail Trade | 4,627 (51.7%) | 4,323 (48.3%) |
| Transportation & Warehousing | 2,098 (74.5%) | 719 (25.5%) |
| Utilities | 359 (84.9%) | 64 (15.1%) |
| Information | 822 (60.8%) | 530 (39.2%) |
| Finance & Insurance | 1,094 (39.8%) | 1,652 (60.2%) |
| Real Estate, Rental & Leasing | 520 (42.9%) | 692 (57.1%) |
| Professional & Scientific | 5,216 (67.0%) | 2,571 (33.0%) |
| Enterprise Management | 88 (50.9%) | 85 (49.1%) |
| Administrative & Support | 1,139 (56.4%) | 880 (43.6%) |
| Educational Services | 3,376 (37.1%) | 5,711 (62.8%) |
| Health Care & Social Assistance | 2,806 (24.3%) | 8,728 (75.7%) |
| Arts, Entertainment & Recreation | 409 (46.2%) | 476 (53.8%) |
| Accommodation & Food Services | 2,561 (43.0%) | 3,397 (57.0%) |
| Public Administration | 5,162 (64.0%) | 2,904 (36.0%) |
| Total | 42,296 (53.0%) | 37,496 (47.0%) |
Education in Greene County
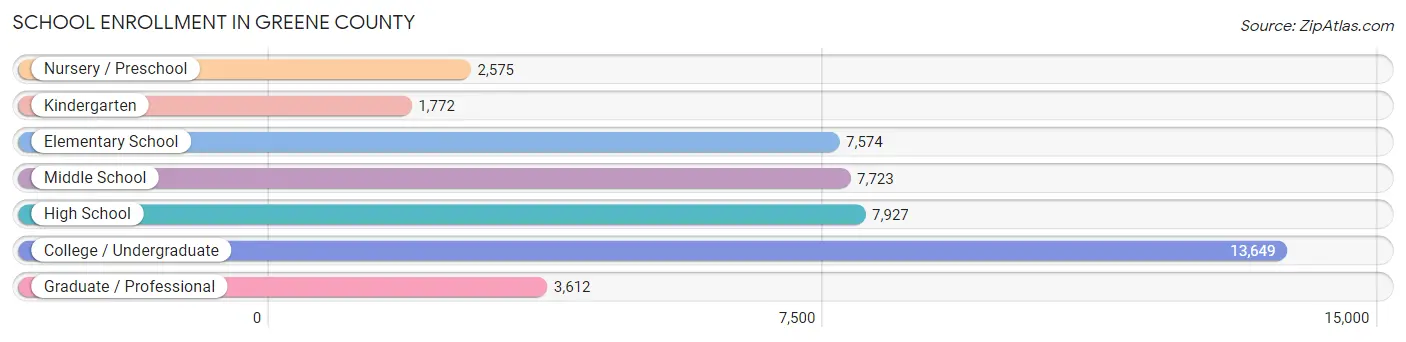
School Enrollment in Greene County
The most common levels of schooling among the 44,832 students in Greene County are college / undergraduate (13,649 | 30.4%), high school (7,927 | 17.7%), and middle school (7,723 | 17.2%).
| School Level | # Students | % Students |
| Nursery / Preschool | 2,575 | 5.7% |
| Kindergarten | 1,772 | 4.0% |
| Elementary School | 7,574 | 16.9% |
| Middle School | 7,723 | 17.2% |
| High School | 7,927 | 17.7% |
| College / Undergraduate | 13,649 | 30.4% |
| Graduate / Professional | 3,612 | 8.1% |
| Total | 44,832 | 100.0% |
School Enrollment by Age by Funding Source in Greene County
Out of a total of 44,832 students who are enrolled in schools in Greene County, 10,446 (23.3%) attend a private institution, while the remaining 34,386 (76.7%) are enrolled in public schools. The age group of 3 to 4 year olds has the highest likelihood of being enrolled in private schools, with 758 (43.5% in the age bracket) enrolled. Conversely, the age group of 15 to 17 year olds has the lowest likelihood of being enrolled in a private school, with 5,018 (85.0% in the age bracket) attending a public institution.
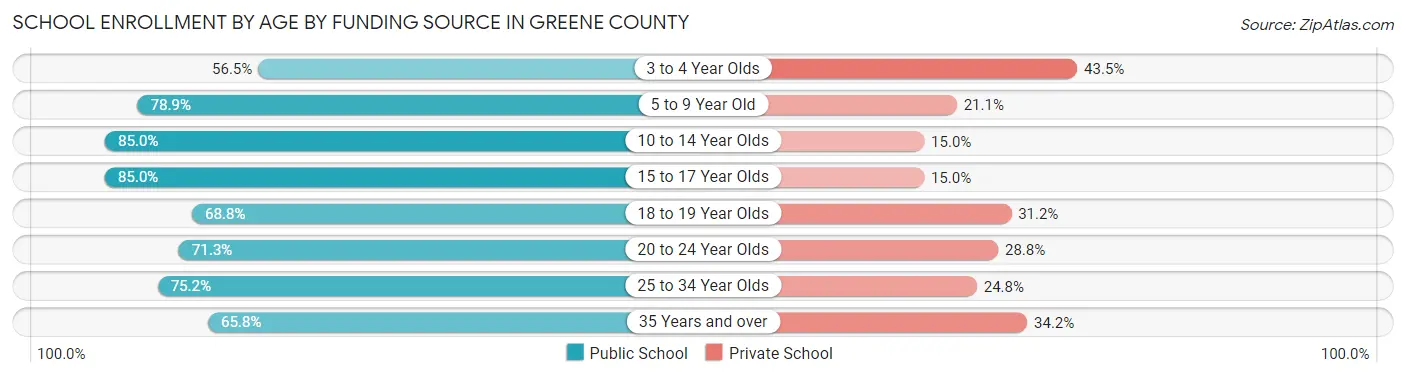
| Age Bracket | Public School | Private School |
| 3 to 4 Year Olds | 985 (56.5%) | 758 (43.5%) |
| 5 to 9 Year Old | 7,147 (78.9%) | 1,907 (21.1%) |
| 10 to 14 Year Olds | 8,093 (85.0%) | 1,427 (15.0%) |
| 15 to 17 Year Olds | 5,018 (85.0%) | 883 (15.0%) |
| 18 to 19 Year Olds | 3,886 (68.8%) | 1,762 (31.2%) |
| 20 to 24 Year Olds | 4,918 (71.3%) | 1,984 (28.7%) |
| 25 to 34 Year Olds | 2,672 (75.2%) | 881 (24.8%) |
| 35 Years and over | 1,653 (65.8%) | 858 (34.2%) |
| Total | 34,386 (76.7%) | 10,446 (23.3%) |
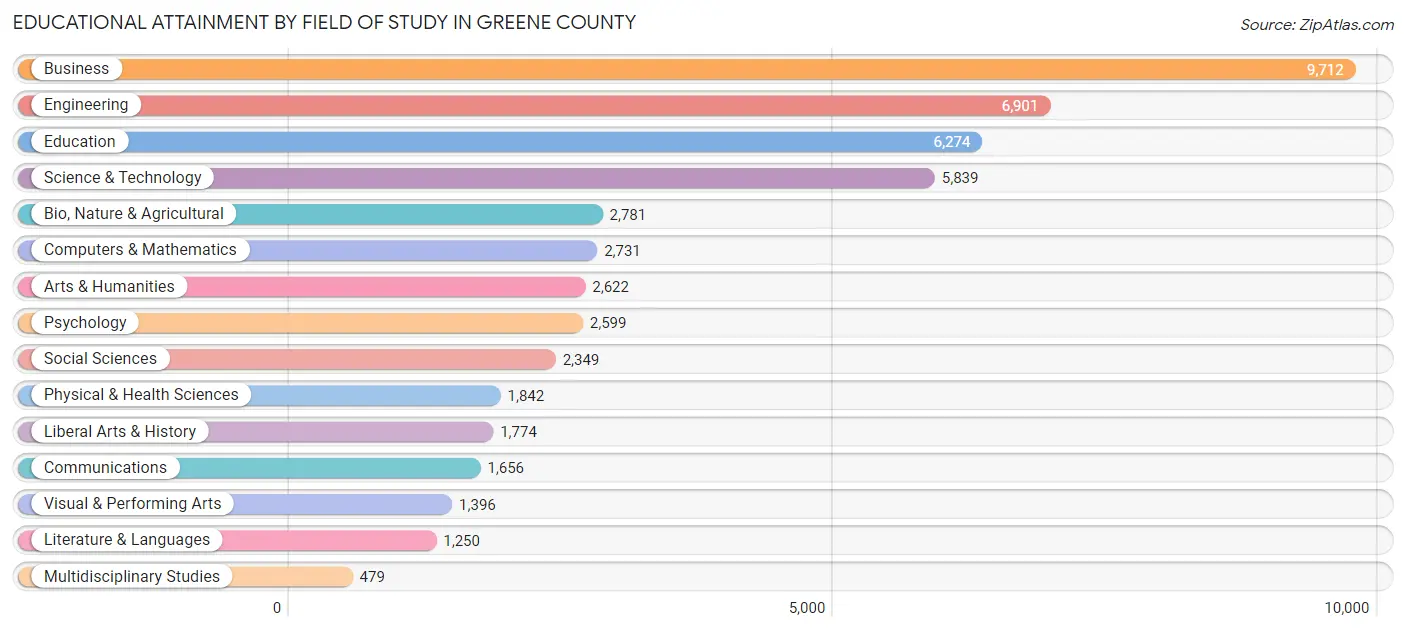
Educational Attainment by Field of Study in Greene County
Business (9,712 | 19.3%), engineering (6,901 | 13.8%), education (6,274 | 12.5%), science & technology (5,839 | 11.6%), and bio, nature & agricultural (2,781 | 5.5%) are the most common fields of study among 50,205 individuals in Greene County who have obtained a bachelor's degree or higher.
| Field of Study | # Graduates | % Graduates |
| Computers & Mathematics | 2,731 | 5.4% |
| Bio, Nature & Agricultural | 2,781 | 5.5% |
| Physical & Health Sciences | 1,842 | 3.7% |
| Psychology | 2,599 | 5.2% |
| Social Sciences | 2,349 | 4.7% |
| Engineering | 6,901 | 13.8% |
| Multidisciplinary Studies | 479 | 0.9% |
| Science & Technology | 5,839 | 11.6% |
| Business | 9,712 | 19.3% |
| Education | 6,274 | 12.5% |
| Literature & Languages | 1,250 | 2.5% |
| Liberal Arts & History | 1,774 | 3.5% |
| Visual & Performing Arts | 1,396 | 2.8% |
| Communications | 1,656 | 3.3% |
| Arts & Humanities | 2,622 | 5.2% |
| Total | 50,205 | 100.0% |
Transportation & Commute in Greene County
Vehicle Availability by Sex in Greene County
The most prevalent vehicle ownership categories in Greene County are males with 2 vehicles (18,628, accounting for 44.5%) and females with 2 vehicles (15,257, making up 52.1%).
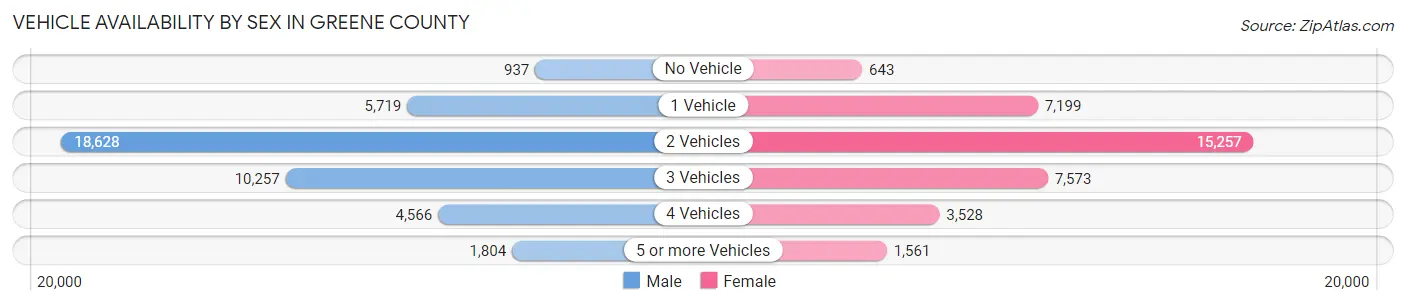
| Vehicles Available | Male | Female |
| No Vehicle | 937 (2.2%) | 643 (1.8%) |
| 1 Vehicle | 5,719 (13.7%) | 7,199 (20.1%) |
| 2 Vehicles | 18,628 (44.5%) | 15,257 (42.7%) |
| 3 Vehicles | 10,257 (24.5%) | 7,573 (21.2%) |
| 4 Vehicles | 4,566 (10.9%) | 3,528 (9.9%) |
| 5 or more Vehicles | 1,804 (4.3%) | 1,561 (4.4%) |
| Total | 41,911 (100.0%) | 35,761 (100.0%) |
Commute Time in Greene County
The most frequently occuring commute durations in Greene County are 15 to 19 minutes (13,298 commuters, 18.4%), 20 to 24 minutes (12,892 commuters, 17.9%), and 10 to 14 minutes (11,311 commuters, 15.7%).
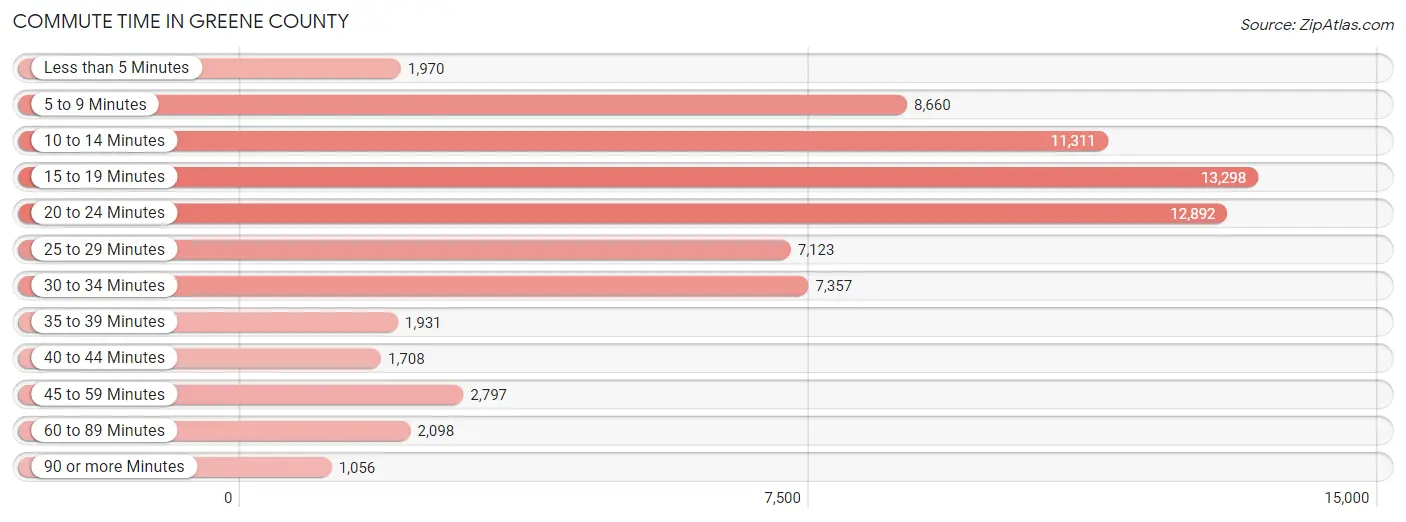
| Commute Time | # Commuters | % Commuters |
| Less than 5 Minutes | 1,970 | 2.7% |
| 5 to 9 Minutes | 8,660 | 12.0% |
| 10 to 14 Minutes | 11,311 | 15.7% |
| 15 to 19 Minutes | 13,298 | 18.4% |
| 20 to 24 Minutes | 12,892 | 17.9% |
| 25 to 29 Minutes | 7,123 | 9.9% |
| 30 to 34 Minutes | 7,357 | 10.2% |
| 35 to 39 Minutes | 1,931 | 2.7% |
| 40 to 44 Minutes | 1,708 | 2.4% |
| 45 to 59 Minutes | 2,797 | 3.9% |
| 60 to 89 Minutes | 2,098 | 2.9% |
| 90 or more Minutes | 1,056 | 1.5% |
Commute Time by Sex in Greene County
The most common commute times in Greene County are 15 to 19 minutes (7,117 commuters, 18.2%) for males and 15 to 19 minutes (6,181 commuters, 18.7%) for females.
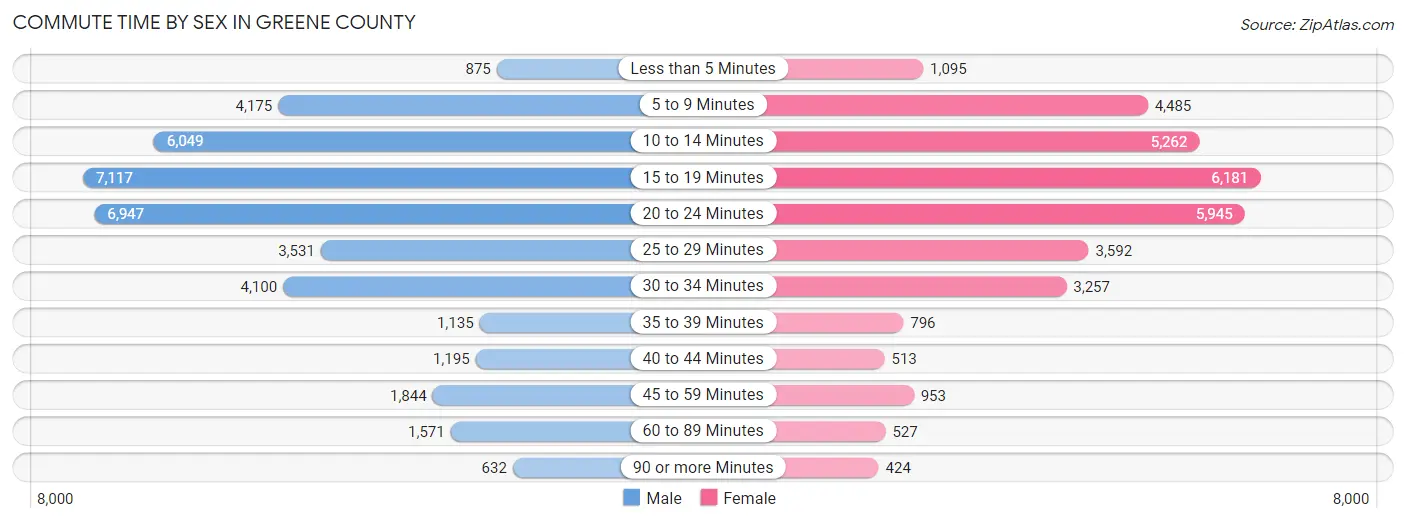
| Commute Time | Male | Female |
| Less than 5 Minutes | 875 (2.2%) | 1,095 (3.3%) |
| 5 to 9 Minutes | 4,175 (10.7%) | 4,485 (13.6%) |
| 10 to 14 Minutes | 6,049 (15.4%) | 5,262 (15.9%) |
| 15 to 19 Minutes | 7,117 (18.2%) | 6,181 (18.7%) |
| 20 to 24 Minutes | 6,947 (17.7%) | 5,945 (18.0%) |
| 25 to 29 Minutes | 3,531 (9.0%) | 3,592 (10.9%) |
| 30 to 34 Minutes | 4,100 (10.5%) | 3,257 (9.9%) |
| 35 to 39 Minutes | 1,135 (2.9%) | 796 (2.4%) |
| 40 to 44 Minutes | 1,195 (3.0%) | 513 (1.5%) |
| 45 to 59 Minutes | 1,844 (4.7%) | 953 (2.9%) |
| 60 to 89 Minutes | 1,571 (4.0%) | 527 (1.6%) |
| 90 or more Minutes | 632 (1.6%) | 424 (1.3%) |
Time of Departure to Work by Sex in Greene County
The most frequent times of departure to work in Greene County are 7:00 AM to 7:29 AM (6,296, 16.1%) for males and 7:00 AM to 7:29 AM (5,155, 15.6%) for females.
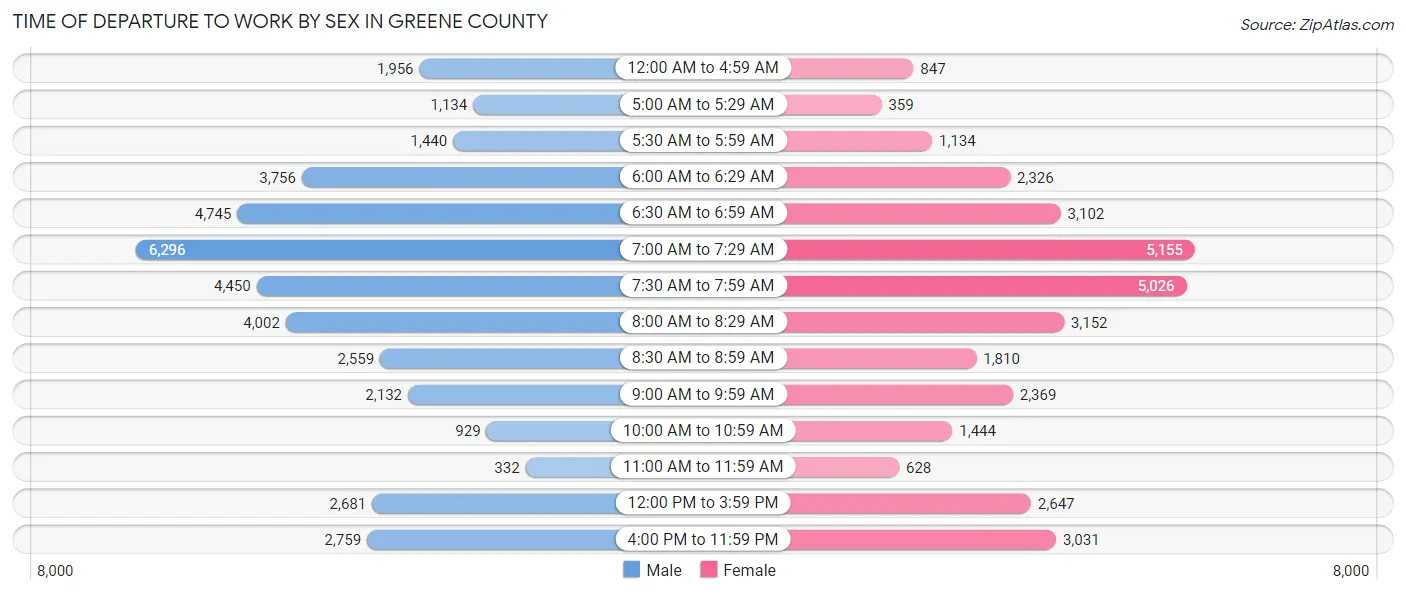
| Time of Departure | Male | Female |
| 12:00 AM to 4:59 AM | 1,956 (5.0%) | 847 (2.6%) |
| 5:00 AM to 5:29 AM | 1,134 (2.9%) | 359 (1.1%) |
| 5:30 AM to 5:59 AM | 1,440 (3.7%) | 1,134 (3.4%) |
| 6:00 AM to 6:29 AM | 3,756 (9.6%) | 2,326 (7.0%) |
| 6:30 AM to 6:59 AM | 4,745 (12.1%) | 3,102 (9.4%) |
| 7:00 AM to 7:29 AM | 6,296 (16.1%) | 5,155 (15.6%) |
| 7:30 AM to 7:59 AM | 4,450 (11.4%) | 5,026 (15.2%) |
| 8:00 AM to 8:29 AM | 4,002 (10.2%) | 3,152 (9.5%) |
| 8:30 AM to 8:59 AM | 2,559 (6.5%) | 1,810 (5.5%) |
| 9:00 AM to 9:59 AM | 2,132 (5.4%) | 2,369 (7.2%) |
| 10:00 AM to 10:59 AM | 929 (2.4%) | 1,444 (4.4%) |
| 11:00 AM to 11:59 AM | 332 (0.9%) | 628 (1.9%) |
| 12:00 PM to 3:59 PM | 2,681 (6.8%) | 2,647 (8.0%) |
| 4:00 PM to 11:59 PM | 2,759 (7.0%) | 3,031 (9.2%) |
| Total | 39,171 (100.0%) | 33,030 (100.0%) |
Housing Occupancy in Greene County
Occupancy by Ownership in Greene County
Of the total 66,856 dwellings in Greene County, owner-occupied units account for 44,819 (67.0%), while renter-occupied units make up 22,037 (33.0%).
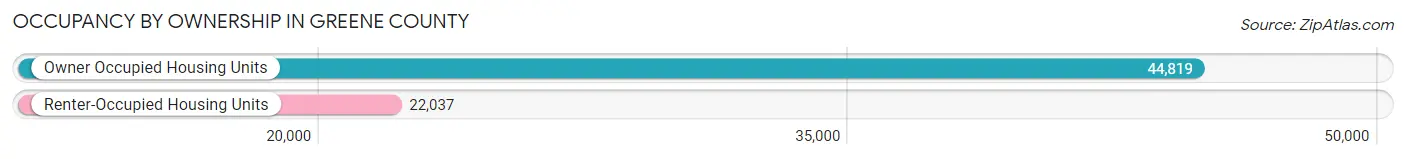
| Occupancy | # Housing Units | % Housing Units |
| Owner Occupied Housing Units | 44,819 | 67.0% |
| Renter-Occupied Housing Units | 22,037 | 33.0% |
| Total Occupied Housing Units | 66,856 | 100.0% |
Occupancy by Household Size in Greene County
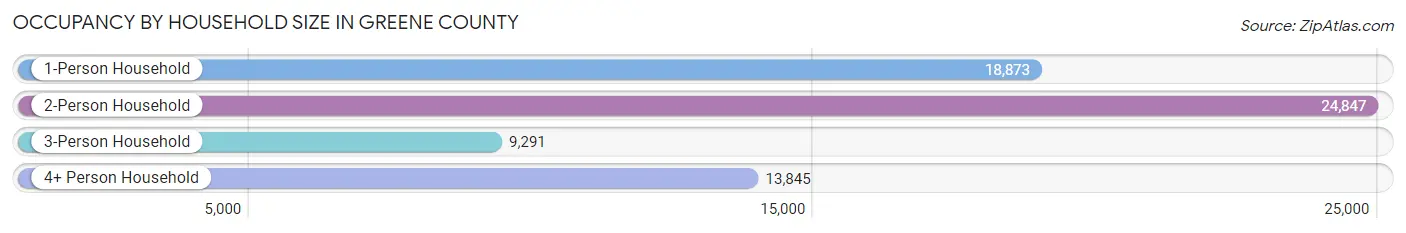
| Household Size | # Housing Units | % Housing Units |
| 1-Person Household | 18,873 | 28.2% |
| 2-Person Household | 24,847 | 37.2% |
| 3-Person Household | 9,291 | 13.9% |
| 4+ Person Household | 13,845 | 20.7% |
| Total Housing Units | 66,856 | 100.0% |
Occupancy by Ownership by Household Size in Greene County
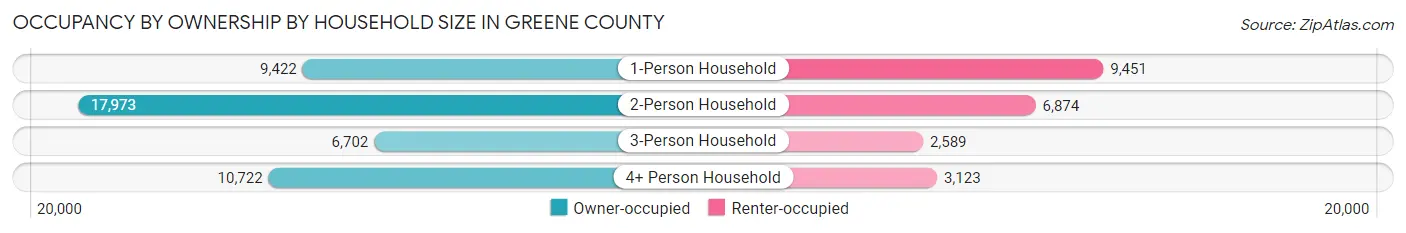
| Household Size | Owner-occupied | Renter-occupied |
| 1-Person Household | 9,422 (49.9%) | 9,451 (50.1%) |
| 2-Person Household | 17,973 (72.3%) | 6,874 (27.7%) |
| 3-Person Household | 6,702 (72.1%) | 2,589 (27.9%) |
| 4+ Person Household | 10,722 (77.4%) | 3,123 (22.6%) |
| Total Housing Units | 44,819 (67.0%) | 22,037 (33.0%) |
Occupancy by Educational Attainment in Greene County
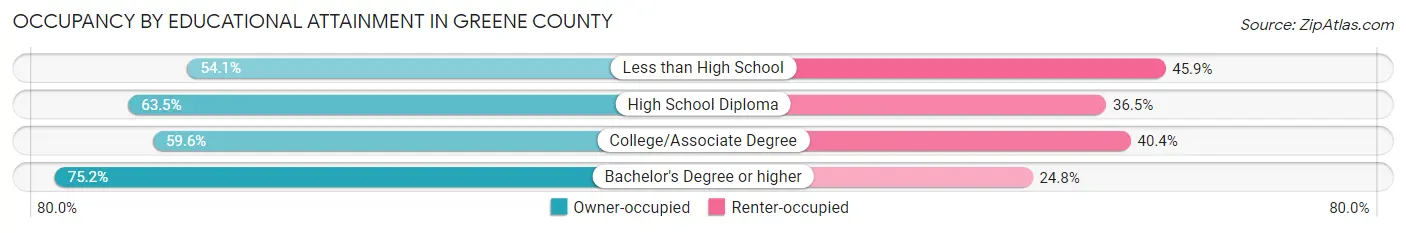
| Household Size | Owner-occupied | Renter-occupied |
| Less than High School | 1,816 (54.1%) | 1,538 (45.9%) |
| High School Diploma | 8,845 (63.5%) | 5,075 (36.5%) |
| College/Associate Degree | 11,994 (59.6%) | 8,117 (40.4%) |
| Bachelor's Degree or higher | 22,164 (75.2%) | 7,307 (24.8%) |
Occupancy by Age of Householder in Greene County

| Age Bracket | # Households | % Households |
| Under 35 Years | 14,825 | 22.2% |
| 35 to 44 Years | 10,299 | 15.4% |
| 45 to 54 Years | 10,269 | 15.4% |
| 55 to 64 Years | 13,095 | 19.6% |
| 65 to 74 Years | 10,580 | 15.8% |
| 75 to 84 Years | 5,716 | 8.6% |
| 85 Years and Over | 2,072 | 3.1% |
| Total | 66,856 | 100.0% |
Housing Finances in Greene County
Median Income by Occupancy in Greene County
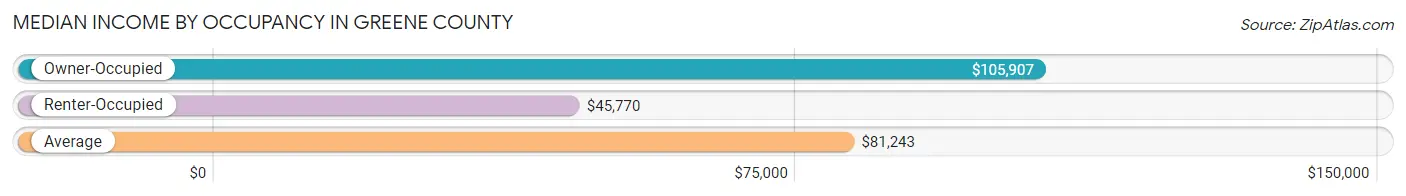
| Occupancy Type | # Households | Median Income |
| Owner-Occupied | 44,819 (67.0%) | $105,907 |
| Renter-Occupied | 22,037 (33.0%) | $45,770 |
| Average | 66,856 (100.0%) | $81,243 |
Occupancy by Householder Income Bracket in Greene County
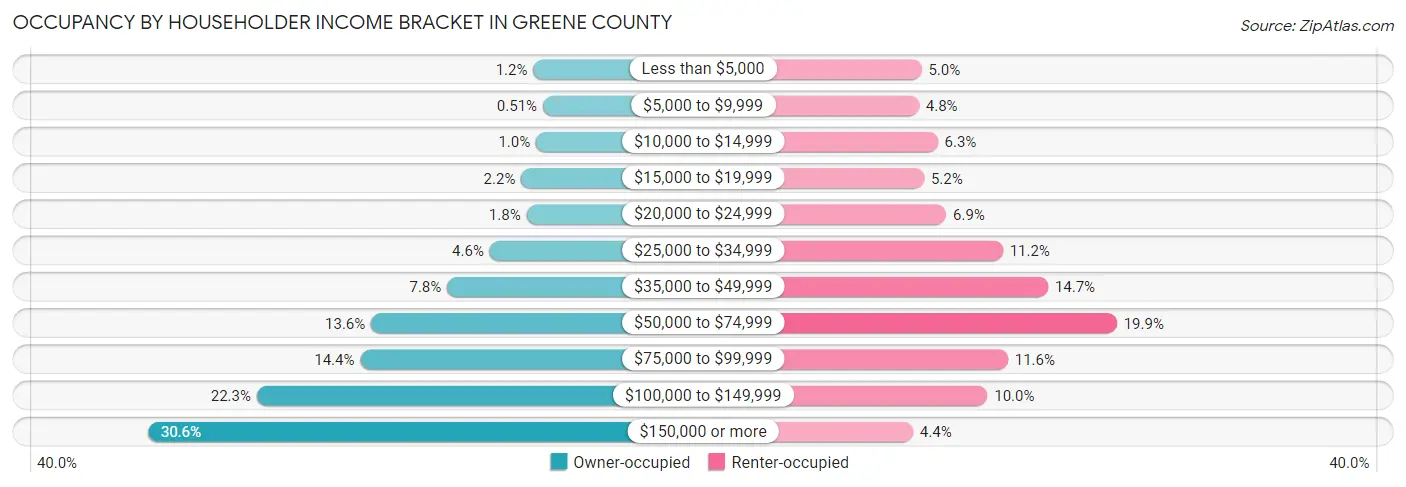
| Income Bracket | Owner-occupied | Renter-occupied |
| Less than $5,000 | 554 (1.2%) | 1,107 (5.0%) |
| $5,000 to $9,999 | 229 (0.5%) | 1,062 (4.8%) |
| $10,000 to $14,999 | 461 (1.0%) | 1,377 (6.2%) |
| $15,000 to $19,999 | 969 (2.2%) | 1,149 (5.2%) |
| $20,000 to $24,999 | 788 (1.8%) | 1,521 (6.9%) |
| $25,000 to $34,999 | 2,044 (4.6%) | 2,471 (11.2%) |
| $35,000 to $49,999 | 3,501 (7.8%) | 3,231 (14.7%) |
| $50,000 to $74,999 | 6,095 (13.6%) | 4,386 (19.9%) |
| $75,000 to $99,999 | 6,461 (14.4%) | 2,557 (11.6%) |
| $100,000 to $149,999 | 9,998 (22.3%) | 2,212 (10.0%) |
| $150,000 or more | 13,719 (30.6%) | 964 (4.4%) |
| Total | 44,819 (100.0%) | 22,037 (100.0%) |
Monthly Housing Cost Tiers in Greene County
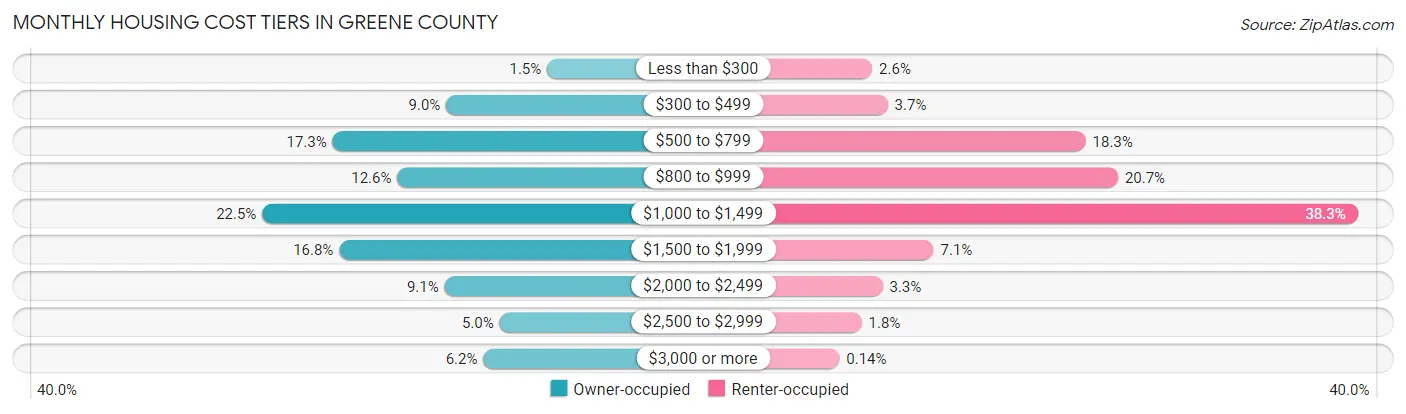
| Monthly Cost | Owner-occupied | Renter-occupied |
| Less than $300 | 680 (1.5%) | 565 (2.6%) |
| $300 to $499 | 4,013 (8.9%) | 816 (3.7%) |
| $500 to $799 | 7,764 (17.3%) | 4,029 (18.3%) |
| $800 to $999 | 5,627 (12.6%) | 4,553 (20.7%) |
| $1,000 to $1,499 | 10,084 (22.5%) | 8,440 (38.3%) |
| $1,500 to $1,999 | 7,545 (16.8%) | 1,560 (7.1%) |
| $2,000 to $2,499 | 4,065 (9.1%) | 731 (3.3%) |
| $2,500 to $2,999 | 2,252 (5.0%) | 392 (1.8%) |
| $3,000 or more | 2,789 (6.2%) | 30 (0.1%) |
| Total | 44,819 (100.0%) | 22,037 (100.0%) |
Physical Housing Characteristics in Greene County
Housing Structures in Greene County
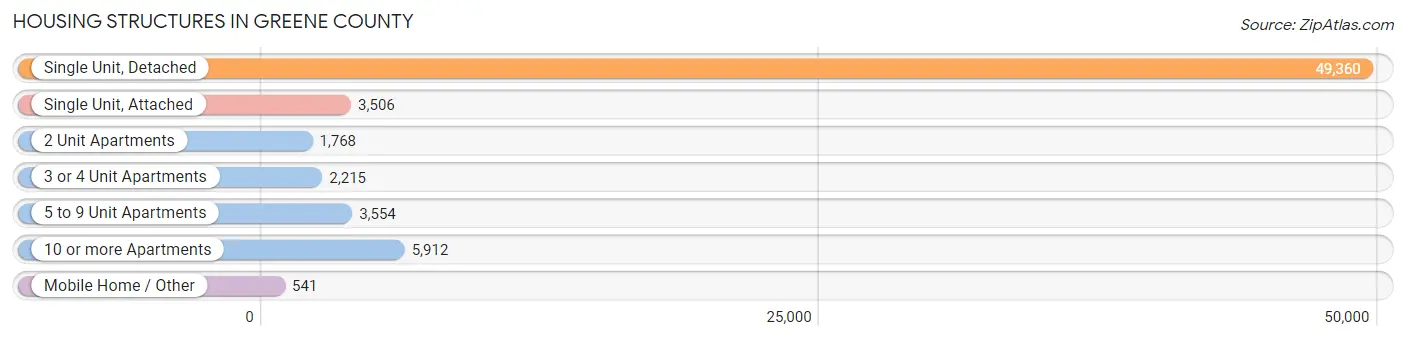
| Structure Type | # Housing Units | % Housing Units |
| Single Unit, Detached | 49,360 | 73.8% |
| Single Unit, Attached | 3,506 | 5.2% |
| 2 Unit Apartments | 1,768 | 2.6% |
| 3 or 4 Unit Apartments | 2,215 | 3.3% |
| 5 to 9 Unit Apartments | 3,554 | 5.3% |
| 10 or more Apartments | 5,912 | 8.8% |
| Mobile Home / Other | 541 | 0.8% |
| Total | 66,856 | 100.0% |
Housing Structures by Occupancy in Greene County
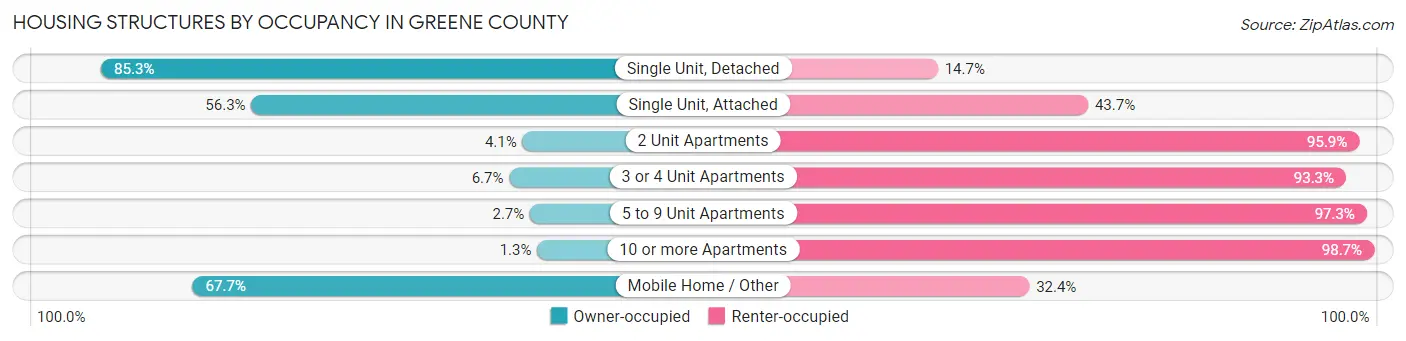
| Structure Type | Owner-occupied | Renter-occupied |
| Single Unit, Detached | 42,086 (85.3%) | 7,274 (14.7%) |
| Single Unit, Attached | 1,975 (56.3%) | 1,531 (43.7%) |
| 2 Unit Apartments | 73 (4.1%) | 1,695 (95.9%) |
| 3 or 4 Unit Apartments | 148 (6.7%) | 2,067 (93.3%) |
| 5 to 9 Unit Apartments | 95 (2.7%) | 3,459 (97.3%) |
| 10 or more Apartments | 76 (1.3%) | 5,836 (98.7%) |
| Mobile Home / Other | 366 (67.6%) | 175 (32.4%) |
| Total | 44,819 (67.0%) | 22,037 (33.0%) |
Housing Structures by Number of Rooms in Greene County
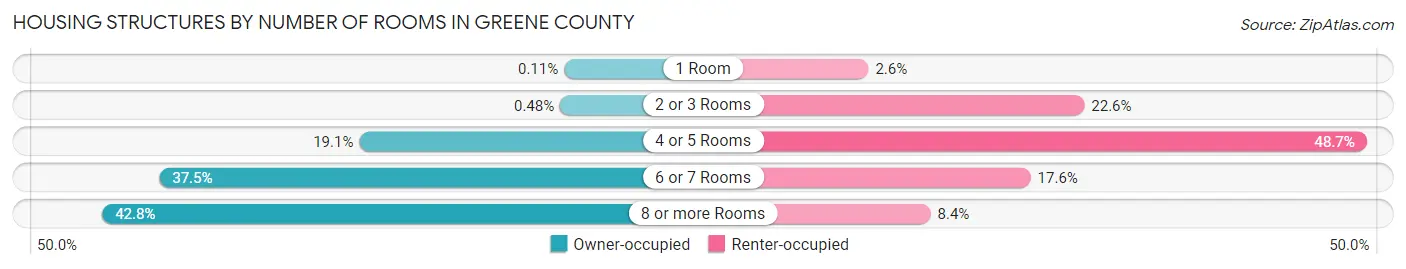
| Number of Rooms | Owner-occupied | Renter-occupied |
| 1 Room | 48 (0.1%) | 582 (2.6%) |
| 2 or 3 Rooms | 215 (0.5%) | 4,982 (22.6%) |
| 4 or 5 Rooms | 8,538 (19.1%) | 10,735 (48.7%) |
| 6 or 7 Rooms | 16,825 (37.5%) | 3,888 (17.6%) |
| 8 or more Rooms | 19,193 (42.8%) | 1,850 (8.4%) |
| Total | 44,819 (100.0%) | 22,037 (100.0%) |
Housing Structure by Heating Type in Greene County
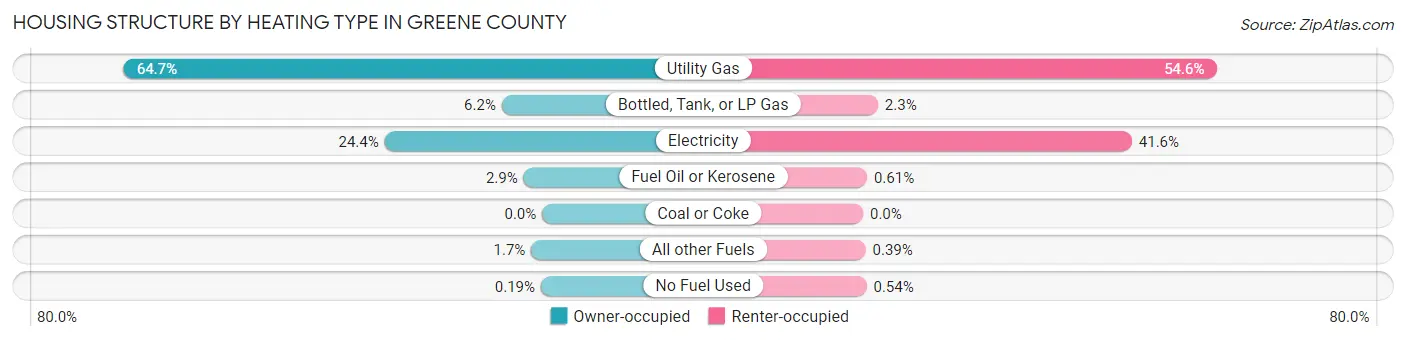
| Heating Type | Owner-occupied | Renter-occupied |
| Utility Gas | 28,978 (64.7%) | 12,031 (54.6%) |
| Bottled, Tank, or LP Gas | 2,797 (6.2%) | 506 (2.3%) |
| Electricity | 10,917 (24.4%) | 9,159 (41.6%) |
| Fuel Oil or Kerosene | 1,285 (2.9%) | 134 (0.6%) |
| Coal or Coke | 0 (0.0%) | 0 (0.0%) |
| All other Fuels | 758 (1.7%) | 87 (0.4%) |
| No Fuel Used | 84 (0.2%) | 120 (0.5%) |
| Total | 44,819 (100.0%) | 22,037 (100.0%) |
Household Vehicle Usage in Greene County
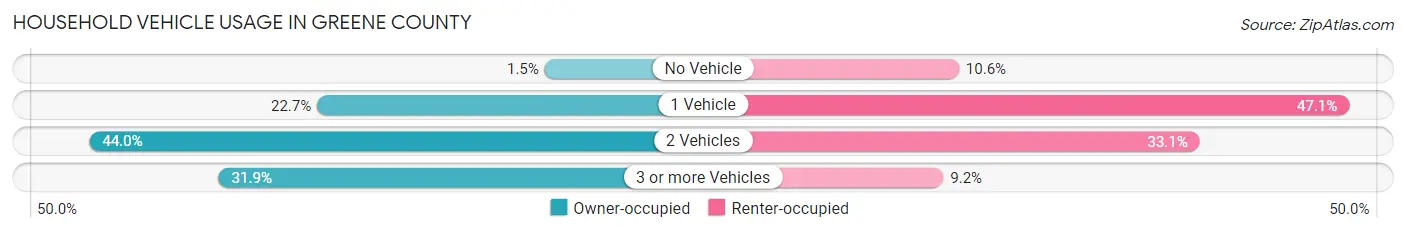
| Vehicles per Household | Owner-occupied | Renter-occupied |
| No Vehicle | 656 (1.5%) | 2,345 (10.6%) |
| 1 Vehicle | 10,172 (22.7%) | 10,371 (47.1%) |
| 2 Vehicles | 19,701 (44.0%) | 7,295 (33.1%) |
| 3 or more Vehicles | 14,290 (31.9%) | 2,026 (9.2%) |
| Total | 44,819 (100.0%) | 22,037 (100.0%) |
Real Estate & Mortgages in Greene County
Real Estate and Mortgage Overview in Greene County
| Characteristic | Without Mortgage | With Mortgage |
| Housing Units | 15,932 | 28,887 |
| Median Property Value | $212,200 | $228,200 |
| Median Household Income | $86,240 | $10,196 |
| Monthly Housing Costs | $637 | $2,789 |
| Real Estate Taxes | $3,697 | $487 |
Property Value by Mortgage Status in Greene County
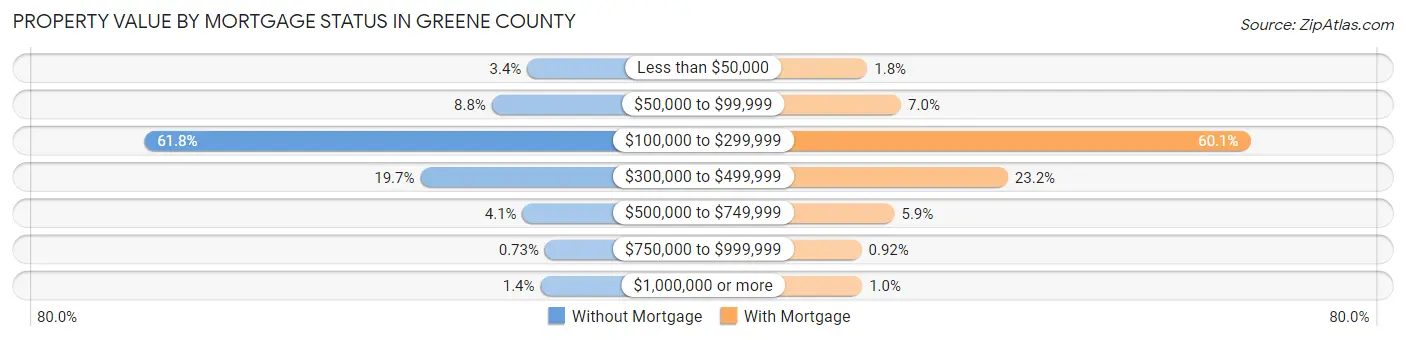
| Property Value | Without Mortgage | With Mortgage |
| Less than $50,000 | 545 (3.4%) | 521 (1.8%) |
| $50,000 to $99,999 | 1,407 (8.8%) | 2,008 (7.0%) |
| $100,000 to $299,999 | 9,841 (61.8%) | 17,374 (60.1%) |
| $300,000 to $499,999 | 3,138 (19.7%) | 6,708 (23.2%) |
| $500,000 to $749,999 | 659 (4.1%) | 1,715 (5.9%) |
| $750,000 to $999,999 | 117 (0.7%) | 266 (0.9%) |
| $1,000,000 or more | 225 (1.4%) | 295 (1.0%) |
| Total | 15,932 (100.0%) | 28,887 (100.0%) |
Household Income by Mortgage Status in Greene County
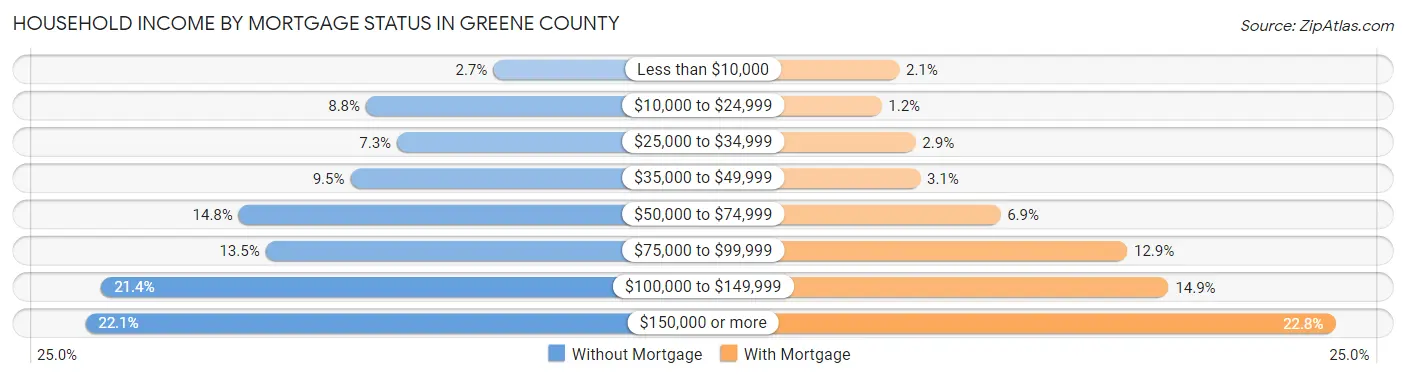
| Household Income | Without Mortgage | With Mortgage |
| Less than $10,000 | 428 (2.7%) | 599 (2.1%) |
| $10,000 to $24,999 | 1,394 (8.7%) | 355 (1.2%) |
| $25,000 to $34,999 | 1,158 (7.3%) | 824 (2.9%) |
| $35,000 to $49,999 | 1,512 (9.5%) | 886 (3.1%) |
| $50,000 to $74,999 | 2,360 (14.8%) | 1,989 (6.9%) |
| $75,000 to $99,999 | 2,156 (13.5%) | 3,735 (12.9%) |
| $100,000 to $149,999 | 3,401 (21.3%) | 4,305 (14.9%) |
| $150,000 or more | 3,523 (22.1%) | 6,597 (22.8%) |
| Total | 15,932 (100.0%) | 28,887 (100.0%) |
Property Value to Household Income Ratio in Greene County
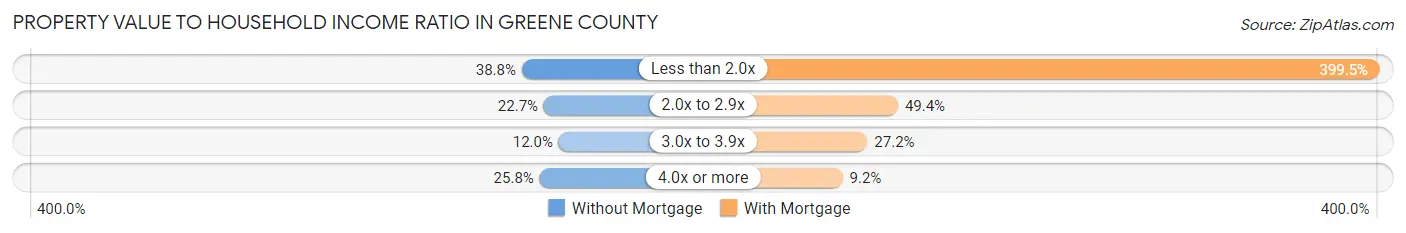
| Value-to-Income Ratio | Without Mortgage | With Mortgage |
| Less than 2.0x | 6,185 (38.8%) | 115,409 (399.5%) |
| 2.0x to 2.9x | 3,623 (22.7%) | 14,280 (49.4%) |
| 3.0x to 3.9x | 1,905 (12.0%) | 7,869 (27.2%) |
| 4.0x or more | 4,116 (25.8%) | 2,655 (9.2%) |
| Total | 15,932 (100.0%) | 28,887 (100.0%) |
Real Estate Taxes by Mortgage Status in Greene County
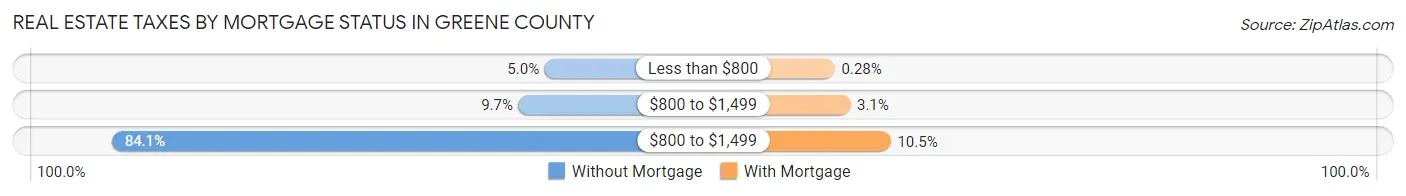
| Property Taxes | Without Mortgage | With Mortgage |
| Less than $800 | 788 (5.0%) | 82 (0.3%) |
| $800 to $1,499 | 1,551 (9.7%) | 896 (3.1%) |
| $800 to $1,499 | 13,394 (84.1%) | 3,031 (10.5%) |
| Total | 15,932 (100.0%) | 28,887 (100.0%) |
Health & Disability in Greene County
Health Insurance Coverage by Age in Greene County
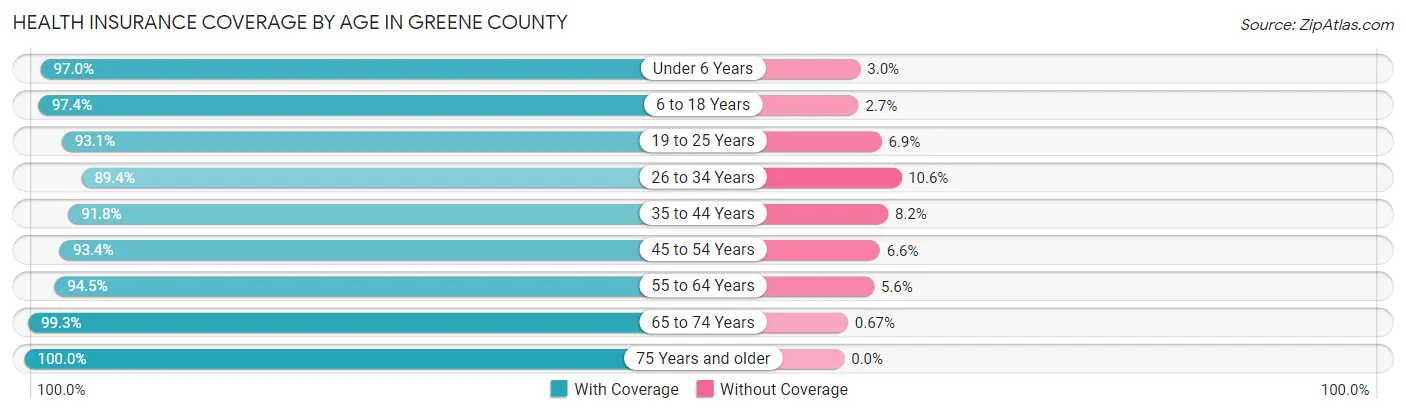
| Age Bracket | With Coverage | Without Coverage |
| Under 6 Years | 10,683 (97.0%) | 330 (3.0%) |
| 6 to 18 Years | 25,929 (97.4%) | 706 (2.6%) |
| 19 to 25 Years | 16,679 (93.1%) | 1,244 (6.9%) |
| 26 to 34 Years | 16,855 (89.4%) | 2,000 (10.6%) |
| 35 to 44 Years | 17,589 (91.8%) | 1,562 (8.2%) |
| 45 to 54 Years | 17,482 (93.4%) | 1,240 (6.6%) |
| 55 to 64 Years | 21,269 (94.5%) | 1,249 (5.6%) |
| 65 to 74 Years | 17,446 (99.3%) | 117 (0.7%) |
| 75 Years and older | 11,492 (100.0%) | 0 (0.0%) |
| Total | 155,424 (94.8%) | 8,448 (5.2%) |
Health Insurance Coverage by Citizenship Status in Greene County
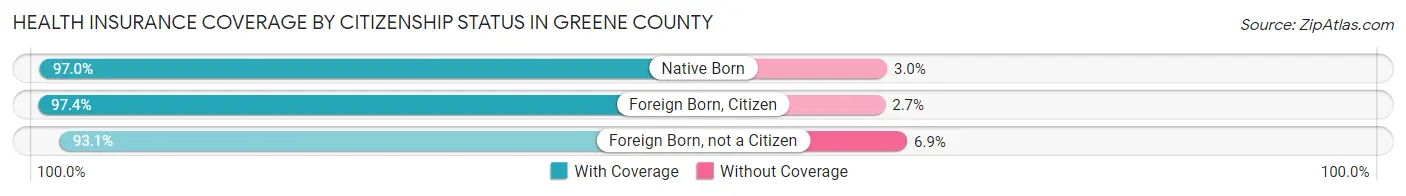
| Citizenship Status | With Coverage | Without Coverage |
| Native Born | 10,683 (97.0%) | 330 (3.0%) |
| Foreign Born, Citizen | 25,929 (97.4%) | 706 (2.6%) |
| Foreign Born, not a Citizen | 16,679 (93.1%) | 1,244 (6.9%) |
Health Insurance Coverage by Household Income in Greene County
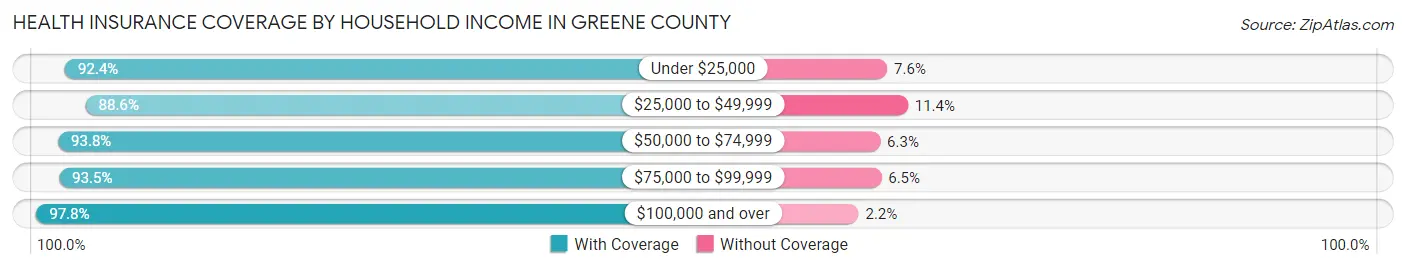
| Household Income | With Coverage | Without Coverage |
| Under $25,000 | 14,508 (92.4%) | 1,187 (7.6%) |
| $25,000 to $49,999 | 17,737 (88.6%) | 2,290 (11.4%) |
| $50,000 to $74,999 | 21,193 (93.8%) | 1,412 (6.2%) |
| $75,000 to $99,999 | 21,300 (93.5%) | 1,471 (6.5%) |
| $100,000 and over | 75,149 (97.8%) | 1,691 (2.2%) |
Public vs Private Health Insurance Coverage by Age in Greene County
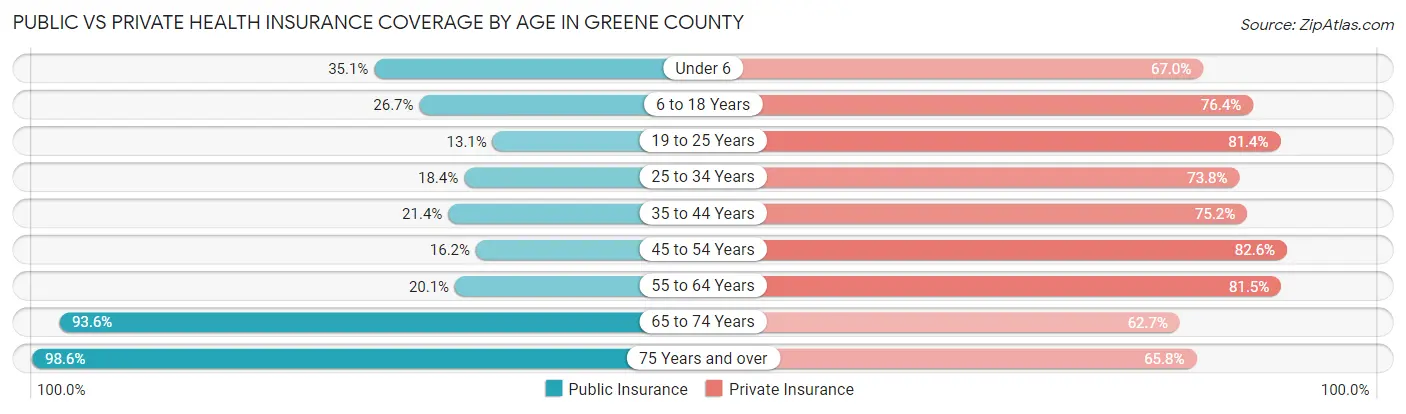
| Age Bracket | Public Insurance | Private Insurance |
| Under 6 | 3,867 (35.1%) | 7,383 (67.0%) |
| 6 to 18 Years | 7,120 (26.7%) | 20,335 (76.3%) |
| 19 to 25 Years | 2,353 (13.1%) | 14,587 (81.4%) |
| 25 to 34 Years | 3,475 (18.4%) | 13,913 (73.8%) |
| 35 to 44 Years | 4,094 (21.4%) | 14,407 (75.2%) |
| 45 to 54 Years | 3,041 (16.2%) | 15,466 (82.6%) |
| 55 to 64 Years | 4,531 (20.1%) | 18,362 (81.5%) |
| 65 to 74 Years | 16,443 (93.6%) | 11,015 (62.7%) |
| 75 Years and over | 11,332 (98.6%) | 7,559 (65.8%) |
| Total | 56,256 (34.3%) | 123,027 (75.1%) |
Disability Status by Sex by Age in Greene County
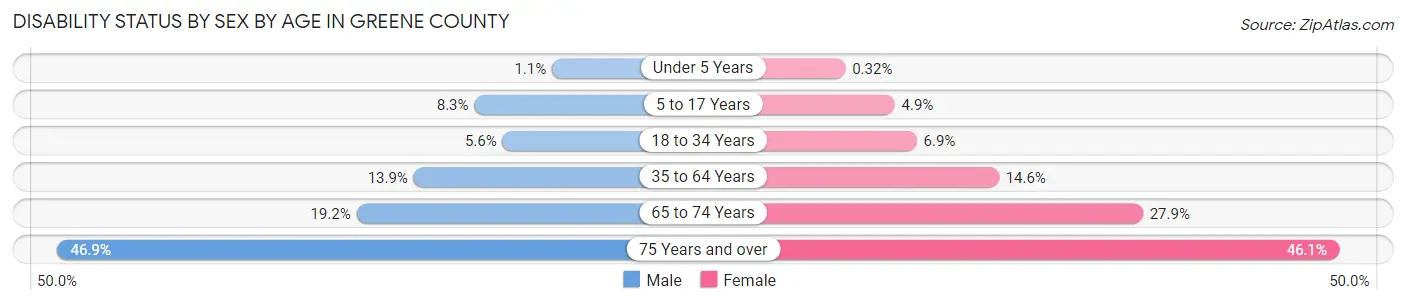
| Age Bracket | Male | Female |
| Under 5 Years | 50 (1.1%) | 14 (0.3%) |
| 5 to 17 Years | 1,088 (8.3%) | 602 (4.9%) |
| 18 to 34 Years | 1,132 (5.6%) | 1,376 (6.9%) |
| 35 to 64 Years | 4,136 (13.9%) | 4,457 (14.6%) |
| 65 to 74 Years | 1,637 (19.2%) | 2,524 (27.9%) |
| 75 Years and over | 2,227 (46.9%) | 3,112 (46.1%) |
Disability Class by Sex by Age in Greene County
Disability Class: Hearing Difficulty
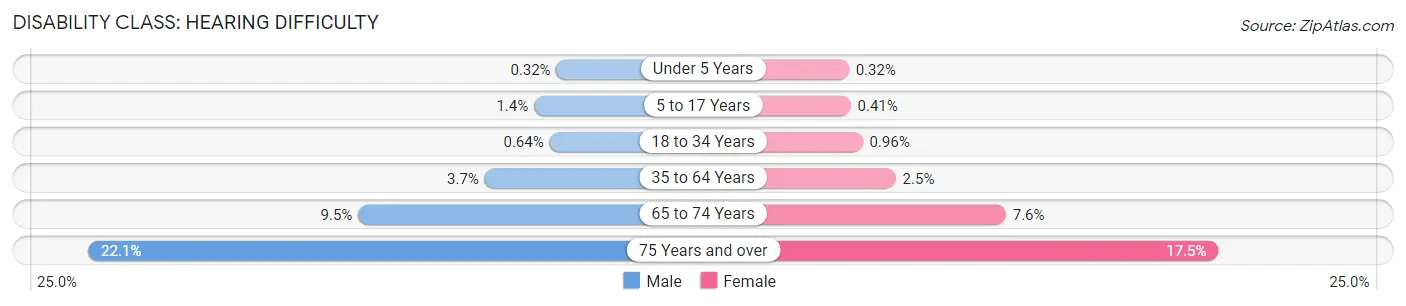
| Age Bracket | Male | Female |
| Under 5 Years | 15 (0.3%) | 14 (0.3%) |
| 5 to 17 Years | 179 (1.4%) | 51 (0.4%) |
| 18 to 34 Years | 129 (0.6%) | 190 (1.0%) |
| 35 to 64 Years | 1,087 (3.6%) | 766 (2.5%) |
| 65 to 74 Years | 812 (9.5%) | 688 (7.6%) |
| 75 Years and over | 1,046 (22.1%) | 1,179 (17.5%) |
Disability Class: Vision Difficulty
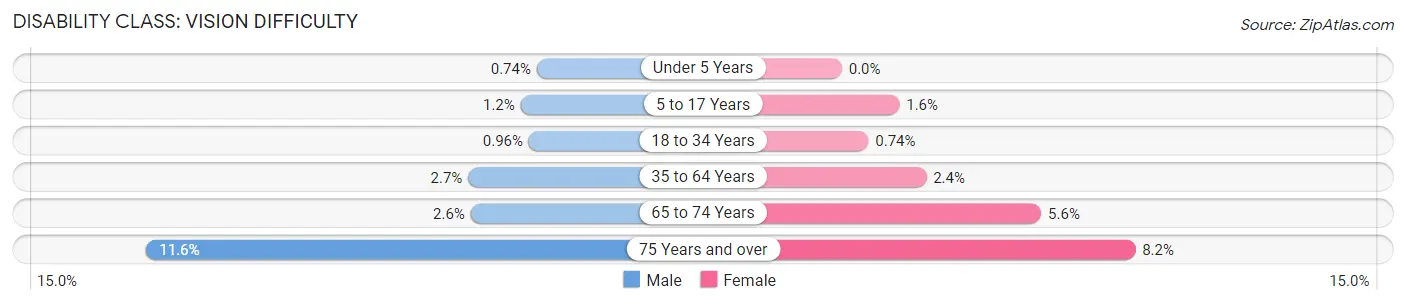
| Age Bracket | Male | Female |
| Under 5 Years | 35 (0.7%) | 0 (0.0%) |
| 5 to 17 Years | 157 (1.2%) | 197 (1.6%) |
| 18 to 34 Years | 192 (1.0%) | 146 (0.7%) |
| 35 to 64 Years | 790 (2.6%) | 719 (2.4%) |
| 65 to 74 Years | 220 (2.6%) | 502 (5.6%) |
| 75 Years and over | 551 (11.6%) | 551 (8.2%) |
Disability Class: Cognitive Difficulty
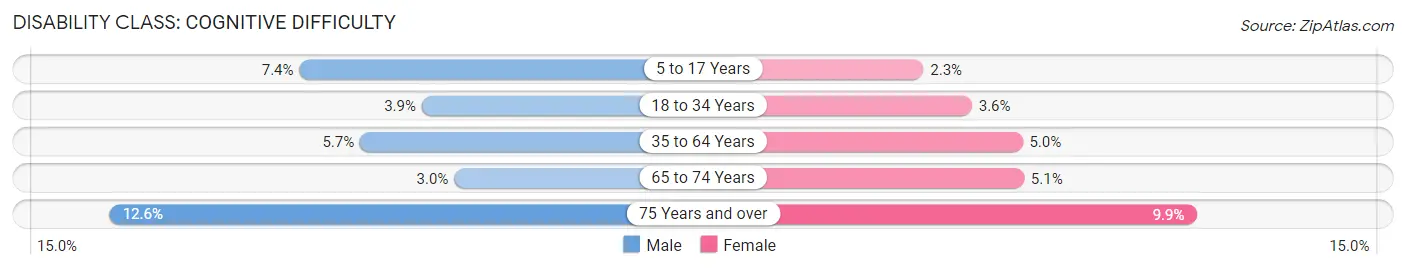
| Age Bracket | Male | Female |
| 5 to 17 Years | 968 (7.3%) | 279 (2.3%) |
| 18 to 34 Years | 792 (3.9%) | 718 (3.6%) |
| 35 to 64 Years | 1,685 (5.7%) | 1,539 (5.0%) |
| 65 to 74 Years | 259 (3.0%) | 458 (5.1%) |
| 75 Years and over | 599 (12.6%) | 666 (9.9%) |
Disability Class: Ambulatory Difficulty
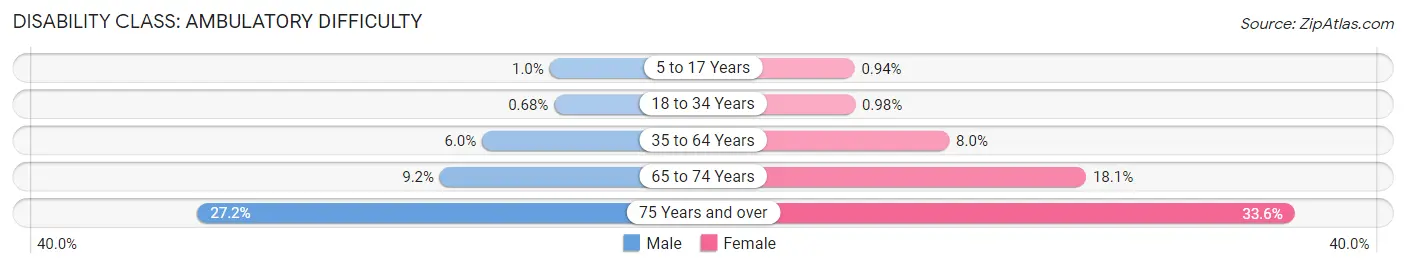
| Age Bracket | Male | Female |
| 5 to 17 Years | 134 (1.0%) | 115 (0.9%) |
| 18 to 34 Years | 136 (0.7%) | 195 (1.0%) |
| 35 to 64 Years | 1,796 (6.0%) | 2,439 (8.0%) |
| 65 to 74 Years | 782 (9.2%) | 1,639 (18.1%) |
| 75 Years and over | 1,289 (27.2%) | 2,268 (33.6%) |
Disability Class: Self-Care Difficulty
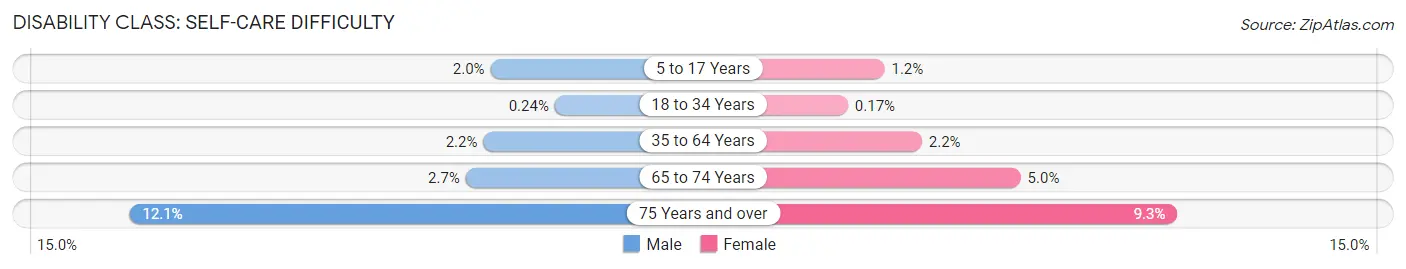
| Age Bracket | Male | Female |
| 5 to 17 Years | 267 (2.0%) | 146 (1.2%) |
| 18 to 34 Years | 49 (0.2%) | 34 (0.2%) |
| 35 to 64 Years | 664 (2.2%) | 681 (2.2%) |
| 65 to 74 Years | 232 (2.7%) | 450 (5.0%) |
| 75 Years and over | 573 (12.1%) | 630 (9.3%) |
Technology Access in Greene County
Computing Device Access in Greene County
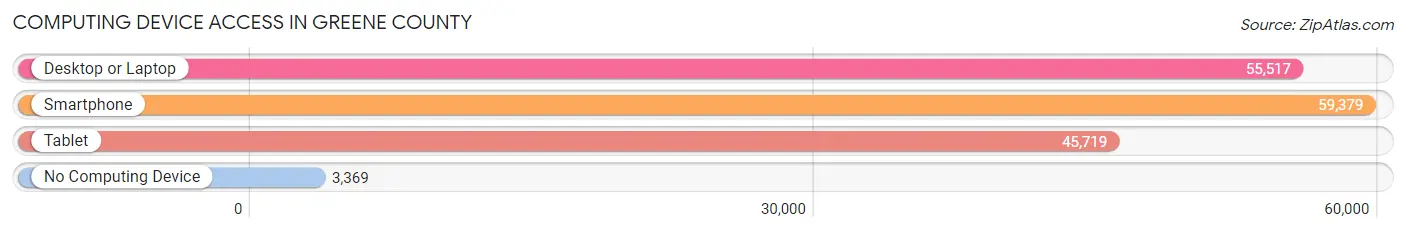
| Device Type | # Households | % Households |
| Desktop or Laptop | 55,517 | 83.0% |
| Smartphone | 59,379 | 88.8% |
| Tablet | 45,719 | 68.4% |
| No Computing Device | 3,369 | 5.0% |
| Total | 66,856 | 100.0% |
Internet Access in Greene County
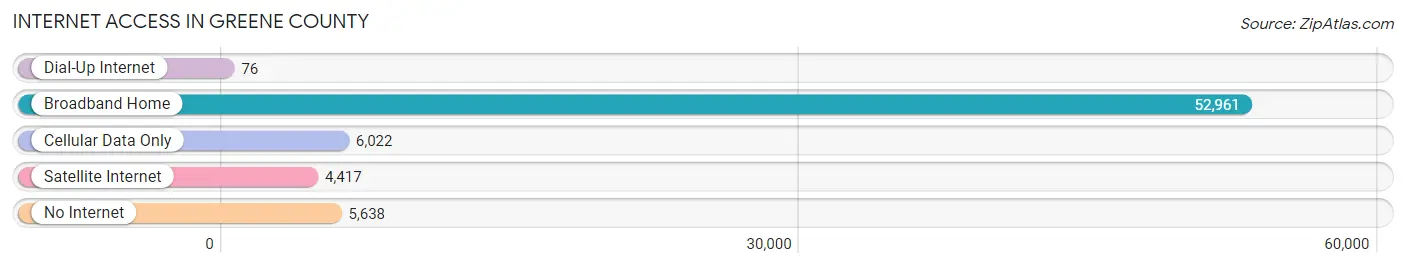
| Internet Type | # Households | % Households |
| Dial-Up Internet | 76 | 0.1% |
| Broadband Home | 52,961 | 79.2% |
| Cellular Data Only | 6,022 | 9.0% |
| Satellite Internet | 4,417 | 6.6% |
| No Internet | 5,638 | 8.4% |
| Total | 66,856 | 100.0% |
Greene County Summary
Greene County is located in the southwestern part of the state of Ohio, and is part of the Dayton metropolitan area. It is bordered by Clark County to the north, Montgomery County to the east, Warren County to the south, and Clinton County to the west. The county seat is Xenia, and the largest city is Beavercreek. The county was established in 1803 and named for General Nathanael Greene, a hero of the American Revolution.
Geography
Greene County covers an area of 437 square miles, of which 434 square miles is land and 3 square miles is water. The county is located in the Miami Valley region of Ohio, and is part of the Appalachian Plateau. The terrain is mostly rolling hills, with some flat areas in the northern and eastern parts of the county. The highest point in the county is 1,068 feet above sea level, located in the southwestern corner of the county. The county is drained by the Little Miami River, which flows through the county from north to south.
The county is home to several state parks and wildlife areas, including John Bryan State Park, Clifton Gorge State Nature Preserve, and Caesar Creek State Park. The county also contains several protected areas, including the Greene County Nature Preserve, the Greene County Wildlife Area, and the Greene County Wetlands.
Demographics
As of the 2010 census, Greene County had a population of 161,573, making it the fourth most populous county in Ohio. The population density was 368 people per square mile. The racial makeup of the county was 87.3% White, 8.2% African American, 0.5% Native American, 1.7% Asian, 0.1% Pacific Islander, 0.7% from other races, and 1.5% from two or more races. Hispanic or Latino of any race were 2.3% of the population.
The median income for a household in the county was $50,945, and the median income for a family was $62,945. The per capita income for the county was $25,845. About 6.3% of families and 8.7% of the population were below the poverty line, including 11.2% of those under age 18 and 6.2% of those age 65 or over.
Economy
Greene County is home to several major employers, including Wright-Patterson Air Force Base, the largest single-site employer in Ohio. Other major employers include the Greene County Board of Education, the Greene County Public Library, and the Greene County Sheriff's Office.
The county is also home to several major industries, including manufacturing, healthcare, and retail. The largest employers in the manufacturing sector are Honda of America, which produces engines and transmissions, and the Greene County Career Center, which produces automotive parts. The largest employers in the healthcare sector are Greene Memorial Hospital and Soin Medical Center. The largest employers in the retail sector are Walmart, Kroger, and Meijer.
The county is also home to several major tourist attractions, including the National Museum of the United States Air Force, the Dayton Art Institute, and the Boonshoft Museum of Discovery.
Conclusion
Greene County is a vibrant and diverse county located in the southwestern part of Ohio. It is home to several major employers, industries, and tourist attractions, and has a population of over 161,000 people. The county is home to several state parks and wildlife areas, and is part of the Dayton metropolitan area. The county has a median income of $50,945 and a per capita income of $25,845.
Common Questions
What is the Total Population of Greene County?
Total Population of Greene County is 167,567.
What is the Total Male Population of Greene County?
Total Male Population of Greene County is 83,333.
What is the Total Female Population of Greene County?
Total Female Population of Greene County is 84,234.
What is the Ratio of Males per 100 Females in Greene County?
There are 98.93 Males per 100 Females in Greene County.
What is the Ratio of Females per 100 Males in Greene County?
There are 101.08 Females per 100 Males in Greene County.
What is the Median Population Age in Greene County?
Median Population Age in Greene County is 38.6 Years.
What is the Average Family Size in Greene County
Average Family Size in Greene County is 3.0 People.
What is the Average Household Size in Greene County
Average Household Size in Greene County is 2.4 People.
What is Per Capita Income in Greene County?
Per Capita income in Greene County is $42,862.
What is the Median Family Income in Greene County?
Median Family Income in Greene County is $106,369.
What is the Median Household income in Greene County?
Median Household Income in Greene County is $81,243.
What is Income or Wage Gap in Greene County?
Income or Wage Gap in Greene County is 38.9%.
Women in Greene County earn 61.1 cents for every dollar earned by a man.
What is Family Income Deficit in Greene County?
Family Income Deficit in Greene County is $9,565.
Families that are below poverty line in Greene County earn $9,565 less on average than the poverty threshold level.
What is Inequality or Gini Index in Greene County?
Inequality or Gini Index in Greene County is 0.44.
How Large is the Labor Force in Greene County?
There are 86,085 People in the Labor Forcein in Greene County.
What is the Percentage of People in the Labor Force in Greene County?
62.8% of People are in the Labor Force in Greene County.
What is the Unemployment Rate in Greene County?
Unemployment Rate in Greene County is 4.6%.