Geauga County, OH
Geauga County Map

Geauga County Overview
95,455
TOTAL POPULATION
47,836
MALE POPULATION
47,619
FEMALE POPULATION
100.46
MALES / 100 FEMALES
99.55
FEMALES / 100 MALES
44.6
MEDIAN AGE
3.1
AVG FAMILY SIZE
2.7
AVG HOUSEHOLD SIZE
$48,582
PER CAPITA INCOME
$116,764
AVG FAMILY INCOME
$97,162
AVG HOUSEHOLD INCOME
41.3%
WAGE / INCOME GAP [ % ]
58.7¢/ $1
WAGE / INCOME GAP [ $ ]
$10,170
FAMILY INCOME DEFICIT
0.45
INEQUALITY / GINI INDEX
49,651
LABOR FORCE [ PEOPLE ]
64.5%
PERCENT IN LABOR FORCE
3.1%
UNEMPLOYMENT RATE
Geauga County Area Codes
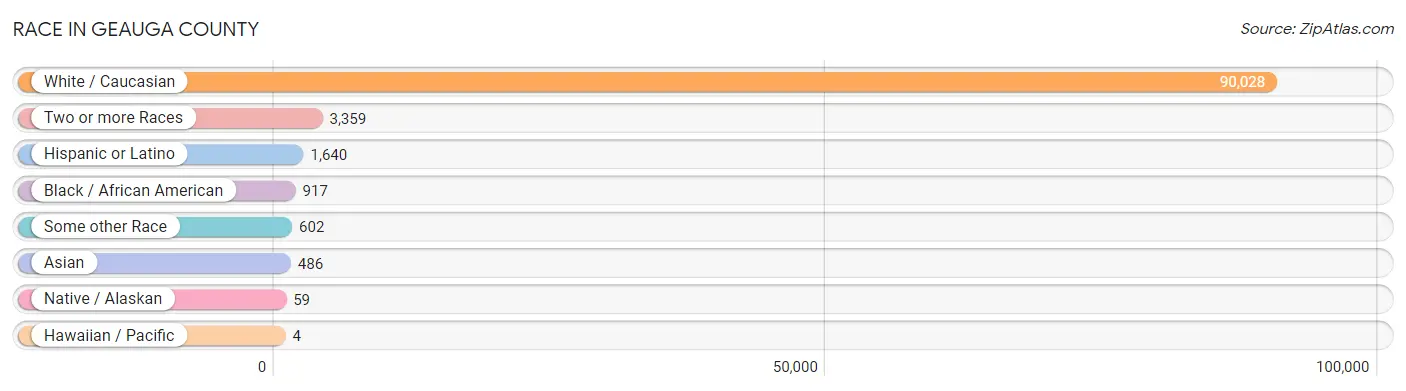
Race in Geauga County
The most populous races in Geauga County are White / Caucasian (90,028 | 94.3%), Two or more Races (3,359 | 3.5%), and Hispanic or Latino (1,640 | 1.7%).
| Race | # Population | % Population |
| Asian | 486 | 0.5% |
| Black / African American | 917 | 1.0% |
| Hawaiian / Pacific | 4 | 0.0% |
| Hispanic or Latino | 1,640 | 1.7% |
| Native / Alaskan | 59 | 0.1% |
| White / Caucasian | 90,028 | 94.3% |
| Two or more Races | 3,359 | 3.5% |
| Some other Race | 602 | 0.6% |
| Total | 95,455 | 100.0% |
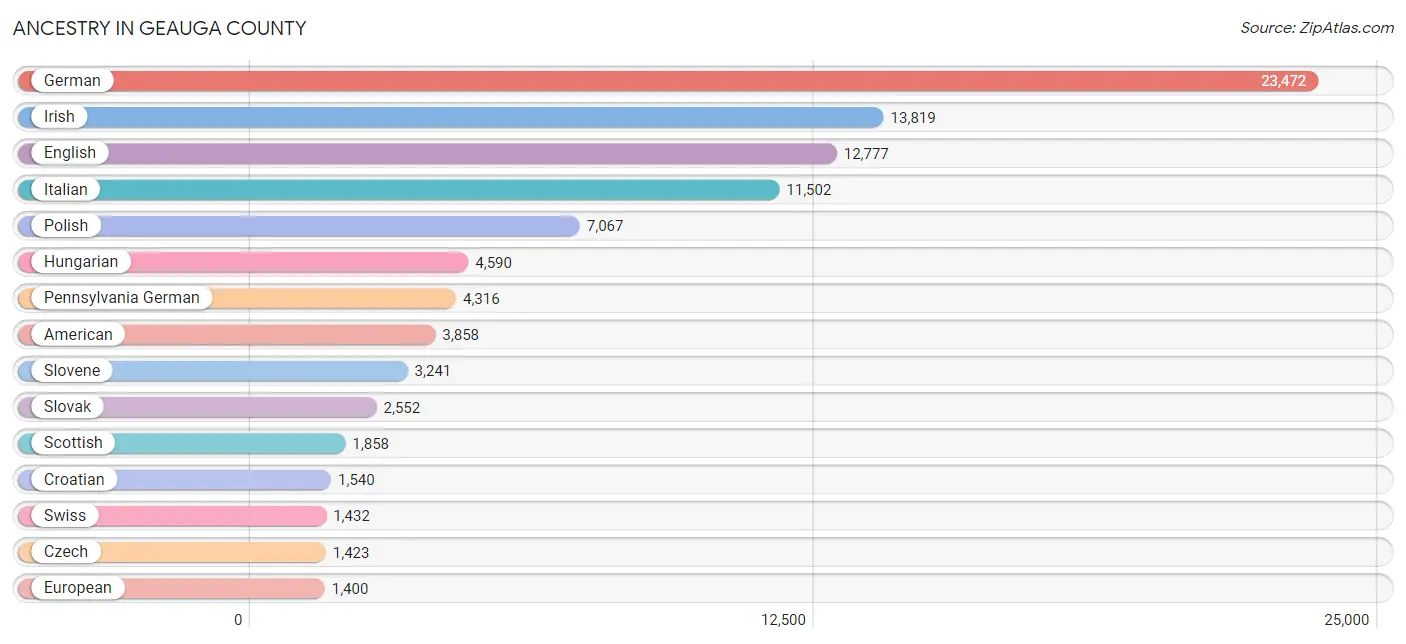
Ancestry in Geauga County
The most populous ancestries reported in Geauga County are German (23,472 | 24.6%), Irish (13,819 | 14.5%), English (12,777 | 13.4%), Italian (11,502 | 12.0%), and Polish (7,067 | 7.4%), together accounting for 71.9% of all Geauga County residents.
| Ancestry | # Population | % Population |
| African | 92 | 0.1% |
| Albanian | 69 | 0.1% |
| American | 3,858 | 4.0% |
| Arab | 292 | 0.3% |
| Argentinean | 5 | 0.0% |
| Armenian | 149 | 0.2% |
| Australian | 41 | 0.0% |
| Austrian | 442 | 0.5% |
| Belgian | 70 | 0.1% |
| Bhutanese | 237 | 0.3% |
| Blackfeet | 8 | 0.0% |
| Brazilian | 4 | 0.0% |
| British | 369 | 0.4% |
| Bulgarian | 7 | 0.0% |
| Burmese | 109 | 0.1% |
| Canadian | 246 | 0.3% |
| Carpatho Rusyn | 16 | 0.0% |
| Central American | 371 | 0.4% |
| Central American Indian | 7 | 0.0% |
| Cherokee | 198 | 0.2% |
| Chilean | 21 | 0.0% |
| Colombian | 69 | 0.1% |
| Croatian | 1,540 | 1.6% |
| Cuban | 11 | 0.0% |
| Czech | 1,423 | 1.5% |
| Czechoslovakian | 439 | 0.5% |
| Danish | 196 | 0.2% |
| Dutch | 798 | 0.8% |
| Eastern European | 691 | 0.7% |
| Ecuadorian | 114 | 0.1% |
| Egyptian | 32 | 0.0% |
| English | 12,777 | 13.4% |
| European | 1,400 | 1.5% |
| Filipino | 10 | 0.0% |
| Finnish | 332 | 0.4% |
| French | 1,377 | 1.4% |
| French Canadian | 395 | 0.4% |
| German | 23,472 | 24.6% |
| Greek | 390 | 0.4% |
| Guamanian / Chamorro | 4 | 0.0% |
| Guatemalan | 29 | 0.0% |
| Guyanese | 5 | 0.0% |
| Haitian | 18 | 0.0% |
| Honduran | 27 | 0.0% |
| Hungarian | 4,590 | 4.8% |
| Icelander | 8 | 0.0% |
| Indian (Asian) | 83 | 0.1% |
| Iranian | 36 | 0.0% |
| Irish | 13,819 | 14.5% |
| Israeli | 15 | 0.0% |
| Italian | 11,502 | 12.0% |
| Korean | 209 | 0.2% |
| Laotian | 4 | 0.0% |
| Latvian | 7 | 0.0% |
| Lebanese | 216 | 0.2% |
| Lithuanian | 543 | 0.6% |
| Lumbee | 5 | 0.0% |
| Macedonian | 11 | 0.0% |
| Mexican | 708 | 0.7% |
| Navajo | 6 | 0.0% |
| Nicaraguan | 247 | 0.3% |
| Northern European | 66 | 0.1% |
| Norwegian | 500 | 0.5% |
| Pakistani | 7 | 0.0% |
| Panamanian | 53 | 0.1% |
| Pennsylvania German | 4,316 | 4.5% |
| Peruvian | 5 | 0.0% |
| Polish | 7,067 | 7.4% |
| Portuguese | 122 | 0.1% |
| Puerto Rican | 188 | 0.2% |
| Romanian | 148 | 0.2% |
| Russian | 892 | 0.9% |
| Salvadoran | 15 | 0.0% |
| Samoan | 63 | 0.1% |
| Scandinavian | 406 | 0.4% |
| Scotch-Irish | 565 | 0.6% |
| Scottish | 1,858 | 1.9% |
| Serbian | 80 | 0.1% |
| Sioux | 13 | 0.0% |
| Slavic | 102 | 0.1% |
| Slovak | 2,552 | 2.7% |
| Slovene | 3,241 | 3.4% |
| Somali | 63 | 0.1% |
| South African | 71 | 0.1% |
| South American | 241 | 0.3% |
| Spaniard | 52 | 0.1% |
| Spanish | 21 | 0.0% |
| Sri Lankan | 25 | 0.0% |
| Subsaharan African | 232 | 0.2% |
| Sudanese | 6 | 0.0% |
| Swedish | 1,093 | 1.1% |
| Swiss | 1,432 | 1.5% |
| Thai | 226 | 0.2% |
| Turkish | 8 | 0.0% |
| Ukrainian | 450 | 0.5% |
| Venezuelan | 27 | 0.0% |
| Welsh | 948 | 1.0% |
| Yugoslavian | 60 | 0.1% | View All 98 Rows |
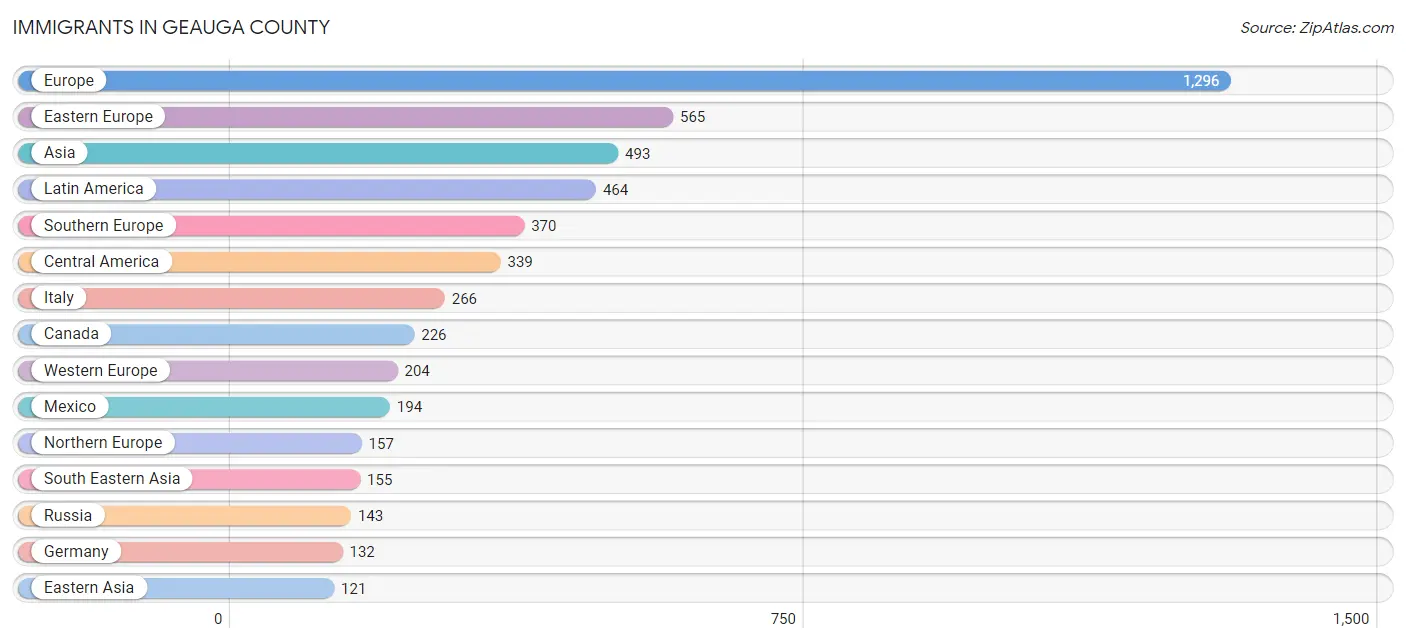
Immigrants in Geauga County
The most numerous immigrant groups reported in Geauga County came from Europe (1,296 | 1.4%), Eastern Europe (565 | 0.6%), Asia (493 | 0.5%), Latin America (464 | 0.5%), and Southern Europe (370 | 0.4%), together accounting for 3.4% of all Geauga County residents.
| Immigration Origin | # Population | % Population |
| Africa | 66 | 0.1% |
| Argentina | 5 | 0.0% |
| Asia | 493 | 0.5% |
| Australia | 13 | 0.0% |
| Belarus | 7 | 0.0% |
| Belgium | 8 | 0.0% |
| Brazil | 4 | 0.0% |
| Bulgaria | 7 | 0.0% |
| Canada | 226 | 0.2% |
| Caribbean | 11 | 0.0% |
| Central America | 339 | 0.4% |
| Chile | 21 | 0.0% |
| China | 40 | 0.0% |
| Colombia | 40 | 0.0% |
| Croatia | 119 | 0.1% |
| Cuba | 11 | 0.0% |
| Czechoslovakia | 15 | 0.0% |
| Eastern Africa | 13 | 0.0% |
| Eastern Asia | 121 | 0.1% |
| Eastern Europe | 565 | 0.6% |
| Ecuador | 19 | 0.0% |
| Egypt | 32 | 0.0% |
| England | 72 | 0.1% |
| Europe | 1,296 | 1.4% |
| France | 64 | 0.1% |
| Germany | 132 | 0.1% |
| Greece | 7 | 0.0% |
| Guatemala | 3 | 0.0% |
| Guyana | 5 | 0.0% |
| Honduras | 27 | 0.0% |
| Hungary | 73 | 0.1% |
| India | 92 | 0.1% |
| Indonesia | 4 | 0.0% |
| Israel | 25 | 0.0% |
| Italy | 266 | 0.3% |
| Japan | 2 | 0.0% |
| Jordan | 33 | 0.0% |
| Kazakhstan | 27 | 0.0% |
| Korea | 79 | 0.1% |
| Latin America | 464 | 0.5% |
| Lebanon | 20 | 0.0% |
| Lithuania | 23 | 0.0% |
| Mexico | 194 | 0.2% |
| Nicaragua | 66 | 0.1% |
| Northern Africa | 32 | 0.0% |
| Northern Europe | 157 | 0.2% |
| Oceania | 13 | 0.0% |
| Panama | 49 | 0.1% |
| Philippines | 68 | 0.1% |
| Poland | 34 | 0.0% |
| Russia | 143 | 0.2% |
| Scotland | 14 | 0.0% |
| South Africa | 21 | 0.0% |
| South America | 114 | 0.1% |
| South Central Asia | 119 | 0.1% |
| South Eastern Asia | 155 | 0.2% |
| Southern Europe | 370 | 0.4% |
| Spain | 97 | 0.1% |
| Syria | 20 | 0.0% |
| Taiwan | 22 | 0.0% |
| Thailand | 17 | 0.0% |
| Ukraine | 67 | 0.1% |
| Venezuela | 20 | 0.0% |
| Vietnam | 66 | 0.1% |
| Western Asia | 98 | 0.1% |
| Western Europe | 204 | 0.2% | View All 66 Rows |
Sex and Age in Geauga County
Sex and Age in Geauga County
The most populous age groups in Geauga County are 55 to 59 Years (3,880 | 8.1%) for men and 60 to 64 Years (3,797 | 8.0%) for women.

| Age Bracket | Male | Female |
| Under 5 Years | 2,538 (5.3%) | 2,436 (5.1%) |
| 5 to 9 Years | 2,783 (5.8%) | 2,704 (5.7%) |
| 10 to 14 Years | 3,405 (7.1%) | 3,180 (6.7%) |
| 15 to 19 Years | 3,489 (7.3%) | 3,177 (6.7%) |
| 20 to 24 Years | 2,956 (6.2%) | 2,661 (5.6%) |
| 25 to 29 Years | 2,244 (4.7%) | 2,134 (4.5%) |
| 30 to 34 Years | 2,252 (4.7%) | 2,044 (4.3%) |
| 35 to 39 Years | 2,609 (5.4%) | 2,249 (4.7%) |
| 40 to 44 Years | 2,474 (5.2%) | 2,673 (5.6%) |
| 45 to 49 Years | 2,974 (6.2%) | 2,773 (5.8%) |
| 50 to 54 Years | 3,388 (7.1%) | 3,390 (7.1%) |
| 55 to 59 Years | 3,880 (8.1%) | 3,503 (7.4%) |
| 60 to 64 Years | 3,388 (7.1%) | 3,797 (8.0%) |
| 65 to 69 Years | 3,172 (6.6%) | 3,055 (6.4%) |
| 70 to 74 Years | 2,579 (5.4%) | 2,795 (5.9%) |
| 75 to 79 Years | 1,792 (3.7%) | 2,012 (4.2%) |
| 80 to 84 Years | 893 (1.9%) | 1,517 (3.2%) |
| 85 Years and over | 1,020 (2.1%) | 1,519 (3.2%) |
| Total | 47,836 (100.0%) | 47,619 (100.0%) |
Families and Households in Geauga County
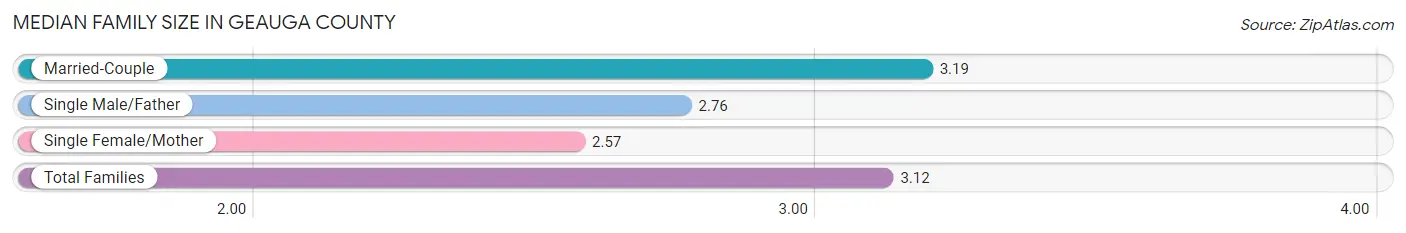
Median Family Size in Geauga County
The median family size in Geauga County is 3.12 persons per family, with married-couple families (22,862 | 87.8%) accounting for the largest median family size of 3.19 persons per family. On the other hand, single female/mother families (2,068 | 8.0%) represent the smallest median family size with 2.57 persons per family.
| Family Type | # Families | Family Size |
| Married-Couple | 22,862 (87.8%) | 3.19 |
| Single Male/Father | 1,096 (4.2%) | 2.76 |
| Single Female/Mother | 2,068 (8.0%) | 2.57 |
| Total Families | 26,026 (100.0%) | 3.12 |
Median Household Size in Geauga County
The median household size in Geauga County is 2.67 persons per household, with single male/father households (1,096 | 3.1%) accounting for the largest median household size of 3.24 persons per household. non-family households (9,295 | 26.3%) represent the smallest median household size with 1.26 persons per household.

| Household Type | # Households | Household Size |
| Married-Couple | 22,862 (64.7%) | 3.21 |
| Single Male/Father | 1,096 (3.1%) | 3.24 |
| Single Female/Mother | 2,068 (5.9%) | 2.83 |
| Non-family | 9,295 (26.3%) | 1.26 |
| Total Households | 35,321 (100.0%) | 2.67 |
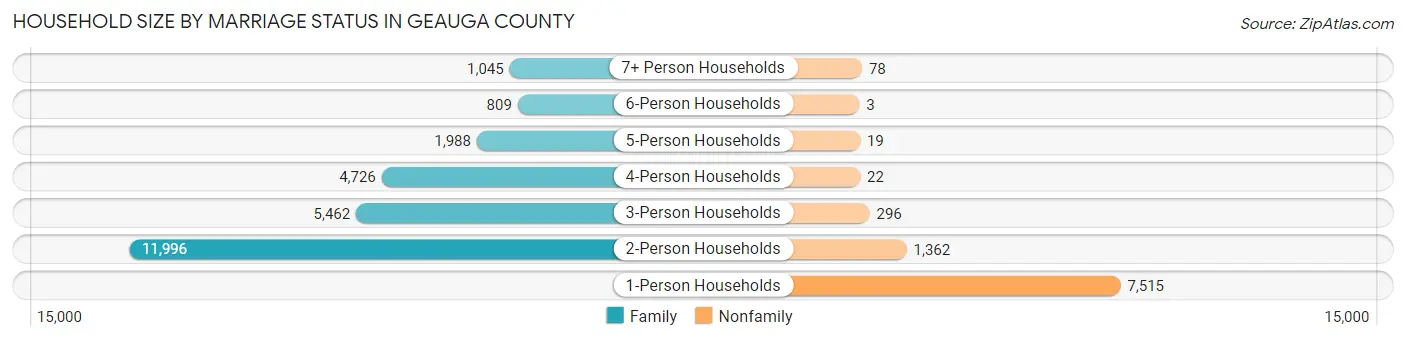
Household Size by Marriage Status in Geauga County
Out of a total of 35,321 households in Geauga County, 26,026 (73.7%) are family households, while 9,295 (26.3%) are nonfamily households. The most numerous type of family households are 2-person households, comprising 11,996, and the most common type of nonfamily households are 1-person households, comprising 7,515.
| Household Size | Family Households | Nonfamily Households |
| 1-Person Households | - | 7,515 (21.3%) |
| 2-Person Households | 11,996 (34.0%) | 1,362 (3.9%) |
| 3-Person Households | 5,462 (15.5%) | 296 (0.8%) |
| 4-Person Households | 4,726 (13.4%) | 22 (0.1%) |
| 5-Person Households | 1,988 (5.6%) | 19 (0.1%) |
| 6-Person Households | 809 (2.3%) | 3 (0.0%) |
| 7+ Person Households | 1,045 (3.0%) | 78 (0.2%) |
| Total | 26,026 (73.7%) | 9,295 (26.3%) |
Female Fertility in Geauga County
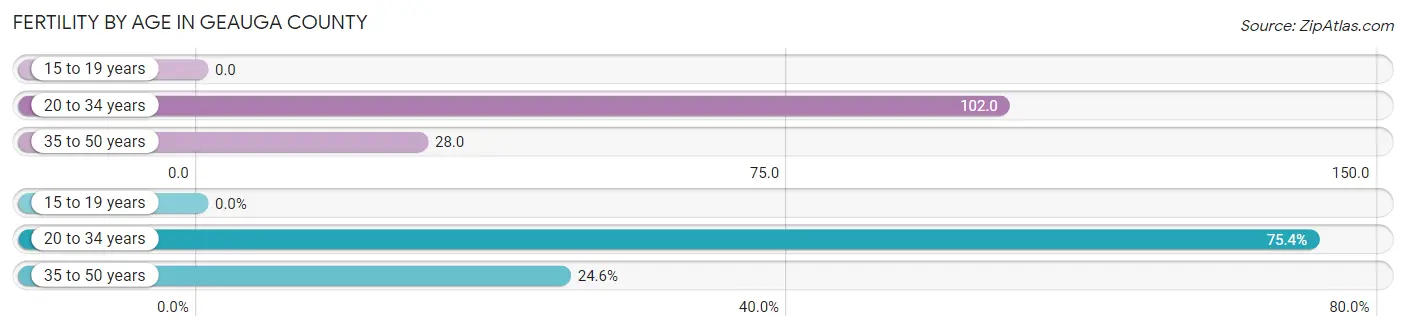
Fertility by Age in Geauga County
Average fertility rate in Geauga County is 50.0 births per 1,000 women. Women in the age bracket of 20 to 34 years have the highest fertility rate with 102.0 births per 1,000 women. Women in the age bracket of 20 to 34 years acount for 75.4% of all women with births.
| Age Bracket | Women with Births | Births / 1,000 Women |
| 15 to 19 years | 0 (0.0%) | 0.0 |
| 20 to 34 years | 695 (75.4%) | 102.0 |
| 35 to 50 years | 227 (24.6%) | 28.0 |
| Total | 922 (100.0%) | 50.0 |
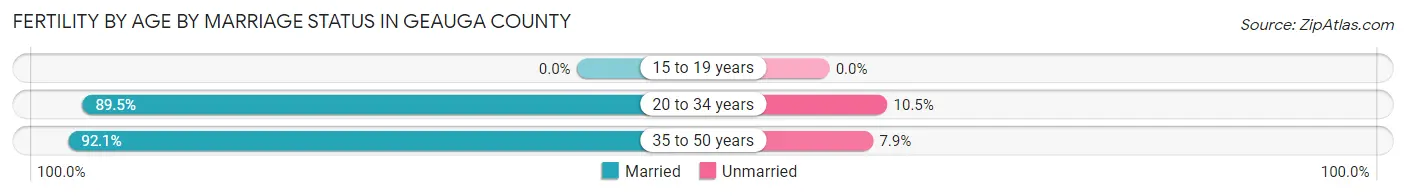
Fertility by Age by Marriage Status in Geauga County
90.1% of women with births (922) in Geauga County are married. The highest percentage of unmarried women with births falls into 20 to 34 years age bracket with 10.5% of them unmarried at the time of birth, while the lowest percentage of unmarried women with births belong to 35 to 50 years age bracket with 7.9% of them unmarried.
| Age Bracket | Married | Unmarried |
| 15 to 19 years | 0 (0.0%) | 0 (0.0%) |
| 20 to 34 years | 622 (89.5%) | 73 (10.5%) |
| 35 to 50 years | 209 (92.1%) | 18 (7.9%) |
| Total | 831 (90.1%) | 91 (9.9%) |
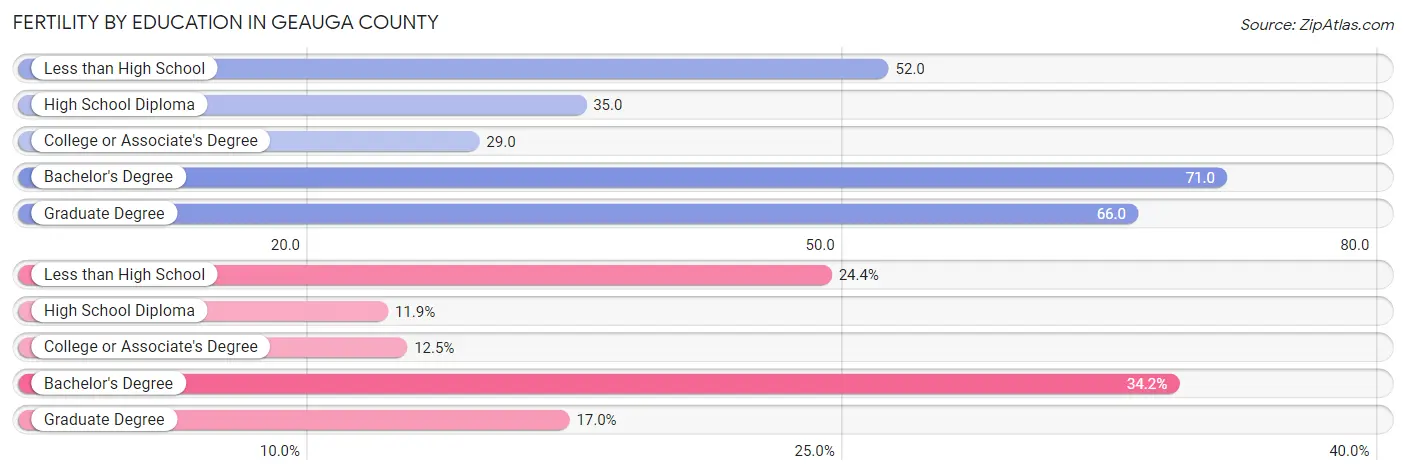
Fertility by Education in Geauga County
Average fertility rate in Geauga County is 50.0 births per 1,000 women. Women with the education attainment of bachelor's degree have the highest fertility rate of 71.0 births per 1,000 women, while women with the education attainment of college or associate's degree have the lowest fertility at 29.0 births per 1,000 women. Women with the education attainment of bachelor's degree represent 34.2% of all women with births.
| Educational Attainment | Women with Births | Births / 1,000 Women |
| Less than High School | 225 (24.4%) | 52.0 |
| High School Diploma | 110 (11.9%) | 35.0 |
| College or Associate's Degree | 115 (12.5%) | 29.0 |
| Bachelor's Degree | 315 (34.2%) | 71.0 |
| Graduate Degree | 157 (17.0%) | 66.0 |
| Total | 922 (100.0%) | 50.0 |
Fertility by Education by Marriage Status in Geauga County
9.9% of women with births in Geauga County are unmarried. Women with the educational attainment of less than high school are most likely to be married with 100.0% of them married at childbirth, while women with the educational attainment of high school diploma are least likely to be married with 35.4% of them unmarried at childbirth.
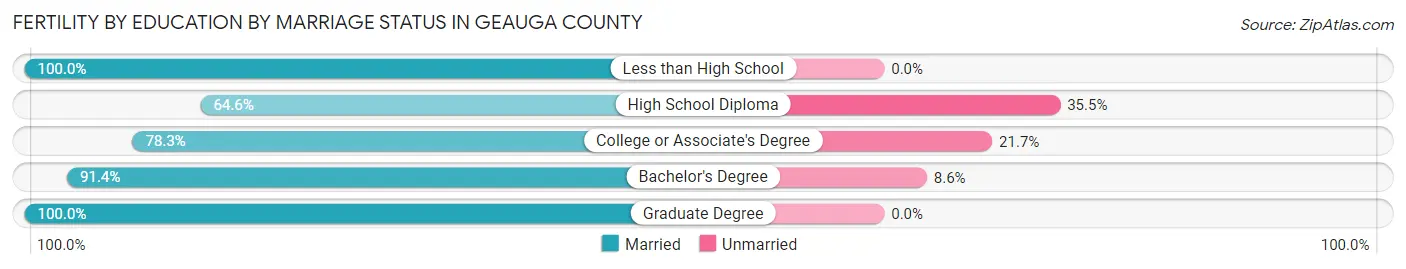
| Educational Attainment | Married | Unmarried |
| Less than High School | 225 (100.0%) | 0 (0.0%) |
| High School Diploma | 71 (64.5%) | 39 (35.4%) |
| College or Associate's Degree | 90 (78.3%) | 25 (21.7%) |
| Bachelor's Degree | 288 (91.4%) | 27 (8.6%) |
| Graduate Degree | 157 (100.0%) | 0 (0.0%) |
| Total | 831 (90.1%) | 91 (9.9%) |
Income in Geauga County
Income Overview in Geauga County
Per Capita Income in Geauga County is $48,582, while median incomes of families and households are $116,764 and $97,162 respectively.
| Characteristic | Number | Measure |
| Per Capita Income | 95,455 | $48,582 |
| Median Family Income | 26,026 | $116,764 |
| Mean Family Income | 26,026 | $149,172 |
| Median Household Income | 35,321 | $97,162 |
| Mean Household Income | 35,321 | $131,432 |
| Income Deficit | 26,026 | $10,170 |
| Wage / Income Gap (%) | 95,455 | 41.33% |
| Wage / Income Gap ($) | 95,455 | 58.67¢ per $1 |
| Gini / Inequality Index | 95,455 | 0.45 |
Earnings by Sex in Geauga County
Average Earnings in Geauga County are $47,584, $57,867 for men and $33,952 for women, a difference of 41.3%.
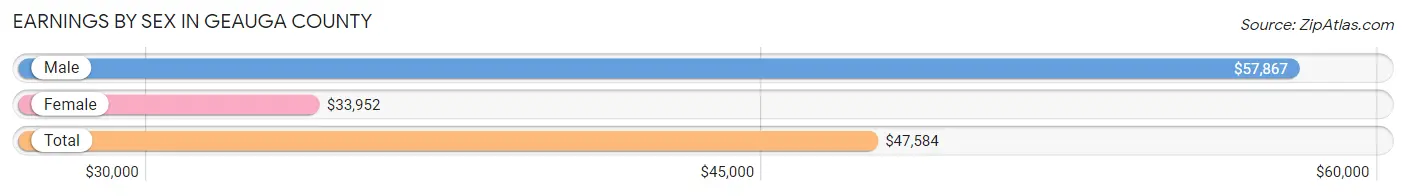
| Sex | Number | Average Earnings |
| Male | 28,661 (55.1%) | $57,867 |
| Female | 23,317 (44.9%) | $33,952 |
| Total | 51,978 (100.0%) | $47,584 |
Earnings by Sex by Income Bracket in Geauga County
The most common earnings brackets in Geauga County are $100,000+ for men (7,430 | 25.9%) and $100,000+ for women (3,025 | 13.0%).
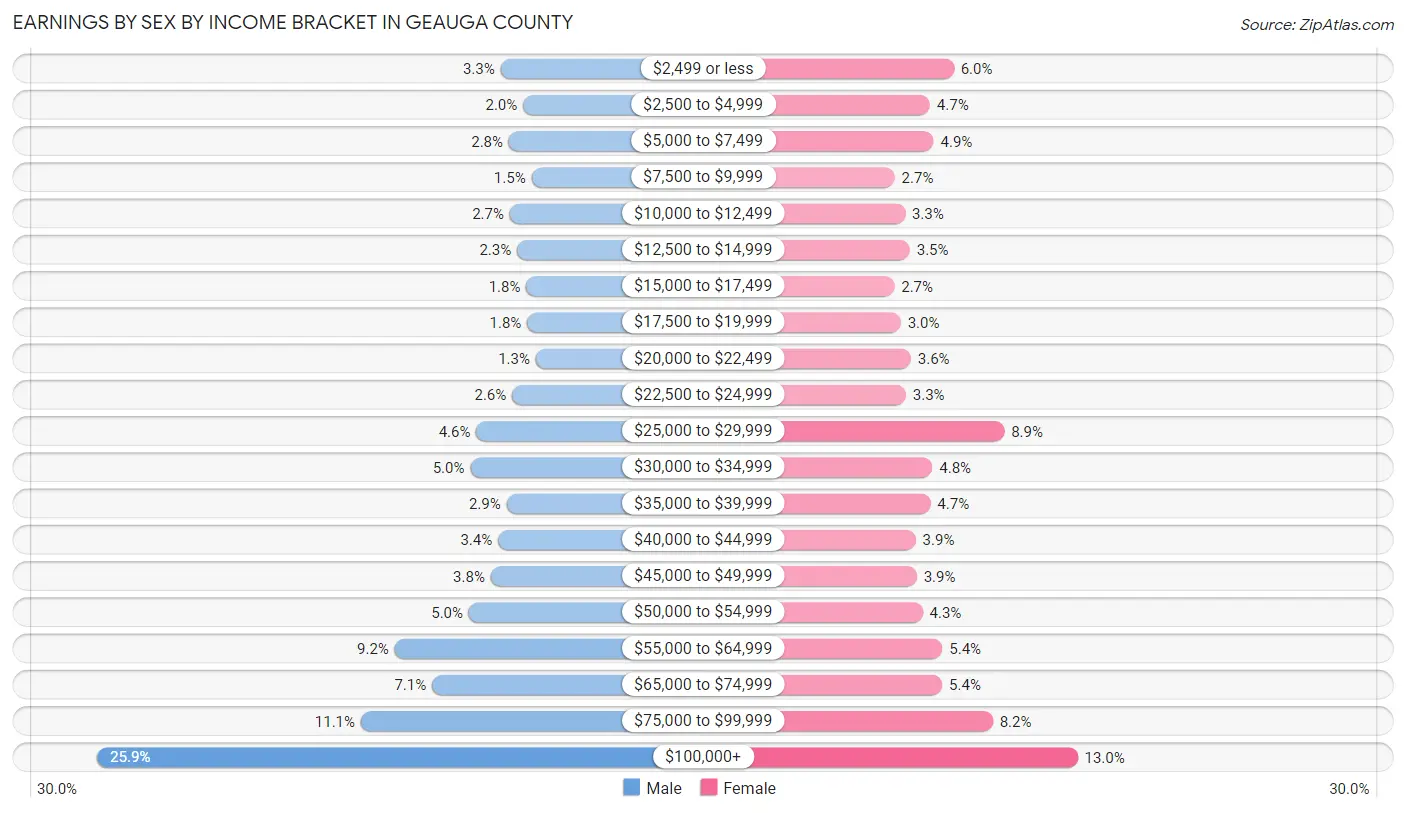
| Income | Male | Female |
| $2,499 or less | 932 (3.3%) | 1,401 (6.0%) |
| $2,500 to $4,999 | 567 (2.0%) | 1,089 (4.7%) |
| $5,000 to $7,499 | 797 (2.8%) | 1,138 (4.9%) |
| $7,500 to $9,999 | 434 (1.5%) | 627 (2.7%) |
| $10,000 to $12,499 | 782 (2.7%) | 763 (3.3%) |
| $12,500 to $14,999 | 664 (2.3%) | 825 (3.5%) |
| $15,000 to $17,499 | 515 (1.8%) | 622 (2.7%) |
| $17,500 to $19,999 | 502 (1.8%) | 706 (3.0%) |
| $20,000 to $22,499 | 363 (1.3%) | 840 (3.6%) |
| $22,500 to $24,999 | 744 (2.6%) | 774 (3.3%) |
| $25,000 to $29,999 | 1,320 (4.6%) | 2,064 (8.8%) |
| $30,000 to $34,999 | 1,419 (5.0%) | 1,121 (4.8%) |
| $35,000 to $39,999 | 834 (2.9%) | 1,096 (4.7%) |
| $40,000 to $44,999 | 972 (3.4%) | 903 (3.9%) |
| $45,000 to $49,999 | 1,090 (3.8%) | 916 (3.9%) |
| $50,000 to $54,999 | 1,442 (5.0%) | 993 (4.3%) |
| $55,000 to $64,999 | 2,636 (9.2%) | 1,253 (5.4%) |
| $65,000 to $74,999 | 2,036 (7.1%) | 1,250 (5.4%) |
| $75,000 to $99,999 | 3,182 (11.1%) | 1,911 (8.2%) |
| $100,000+ | 7,430 (25.9%) | 3,025 (13.0%) |
| Total | 28,661 (100.0%) | 23,317 (100.0%) |
Earnings by Sex by Educational Attainment in Geauga County
Average earnings in Geauga County are $68,540 for men and $41,636 for women, a difference of 39.3%. Men with an educational attainment of graduate degree enjoy the highest average annual earnings of $115,536, while those with less than high school education earn the least with $51,235. Women with an educational attainment of graduate degree earn the most with the average annual earnings of $80,941, while those with less than high school education have the smallest earnings of $22,361.
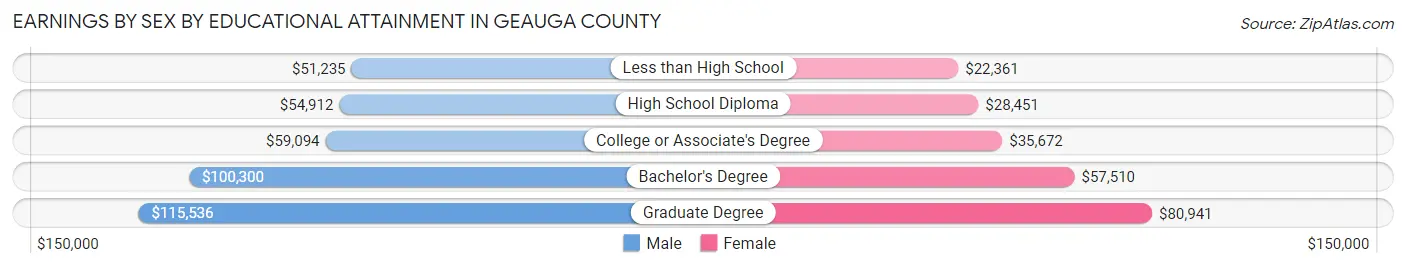
| Educational Attainment | Male Income | Female Income |
| Less than High School | $51,235 | $22,361 |
| High School Diploma | $54,912 | $28,451 |
| College or Associate's Degree | $59,094 | $35,672 |
| Bachelor's Degree | $100,300 | $57,510 |
| Graduate Degree | $115,536 | $80,941 |
| Total | $68,540 | $41,636 |
Family Income in Geauga County
Family Income Brackets in Geauga County
According to the Geauga County family income data, there are 6,116 families falling into the $100,000 to $149,999 income range, which is the most common income bracket and makes up 23.5% of all families. Conversely, the $10,000 to $14,999 income bracket is the least frequent group with only 130 families (0.5%) belonging to this category.
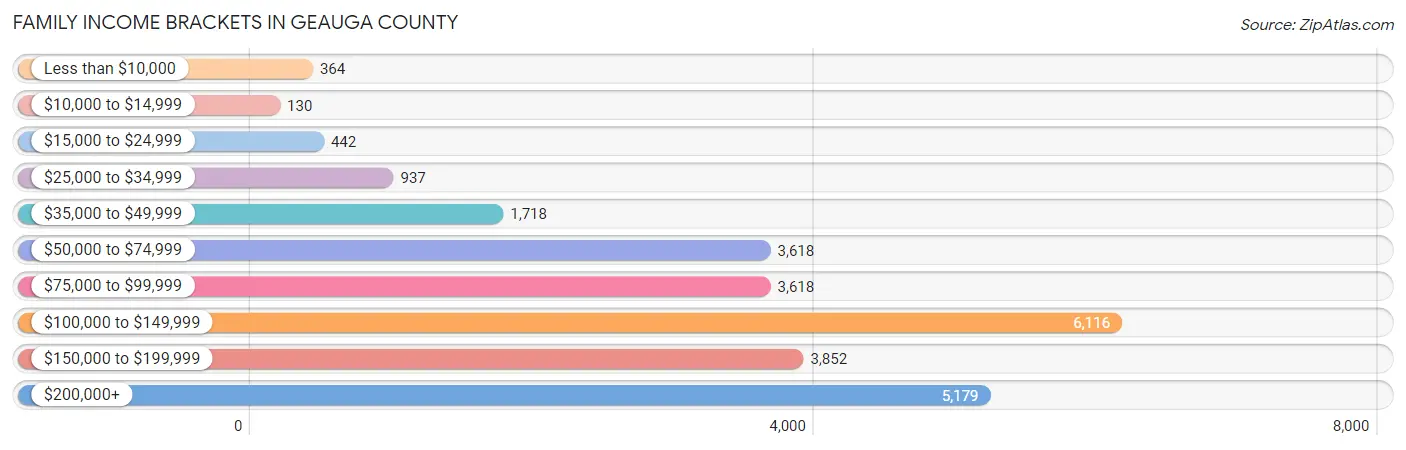
| Income Bracket | # Families | % Families |
| Less than $10,000 | 364 | 1.4% |
| $10,000 to $14,999 | 130 | 0.5% |
| $15,000 to $24,999 | 442 | 1.7% |
| $25,000 to $34,999 | 937 | 3.6% |
| $35,000 to $49,999 | 1,718 | 6.6% |
| $50,000 to $74,999 | 3,618 | 13.9% |
| $75,000 to $99,999 | 3,618 | 13.9% |
| $100,000 to $149,999 | 6,116 | 23.5% |
| $150,000 to $199,999 | 3,852 | 14.8% |
| $200,000+ | 5,179 | 19.9% |
Family Income by Famaliy Size in Geauga County
4-person families (4,575 | 17.6%) account for the highest median family income in Geauga County with $162,409 per family, while 2-person families (12,466 | 47.9%) have the highest median income of $48,344 per family member.
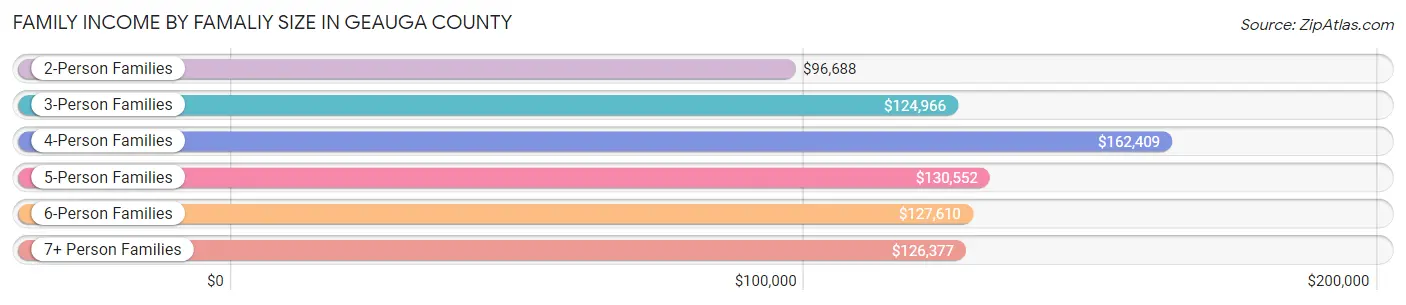
| Income Bracket | # Families | Median Income |
| 2-Person Families | 12,466 (47.9%) | $96,688 |
| 3-Person Families | 5,356 (20.6%) | $124,966 |
| 4-Person Families | 4,575 (17.6%) | $162,409 |
| 5-Person Families | 1,957 (7.5%) | $130,552 |
| 6-Person Families | 741 (2.9%) | $127,610 |
| 7+ Person Families | 931 (3.6%) | $126,377 |
| Total | 26,026 (100.0%) | $116,764 |
Family Income by Number of Earners in Geauga County
The median family income in Geauga County is $116,764, with families comprising 3+ earners (4,141) having the highest median family income of $163,750, while families with no earners (3,722) have the lowest median family income of $65,548, accounting for 15.9% and 14.3% of families, respectively.
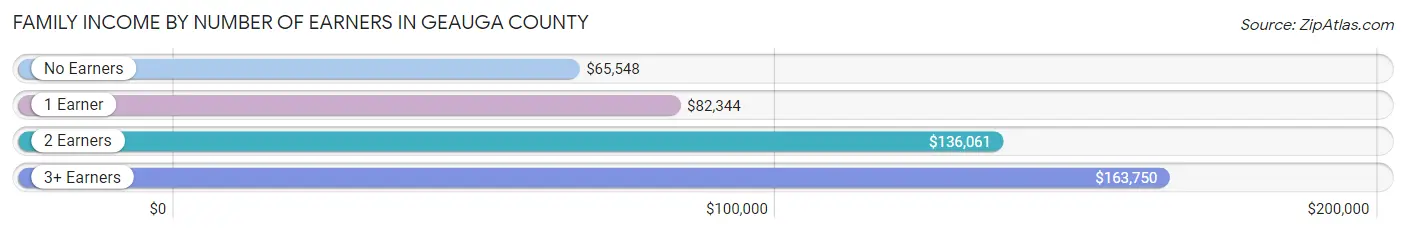
| Number of Earners | # Families | Median Income |
| No Earners | 3,722 (14.3%) | $65,548 |
| 1 Earner | 7,268 (27.9%) | $82,344 |
| 2 Earners | 10,895 (41.9%) | $136,061 |
| 3+ Earners | 4,141 (15.9%) | $163,750 |
| Total | 26,026 (100.0%) | $116,764 |
Household Income in Geauga County
Household Income Brackets in Geauga County
With 7,135 households falling in the category, the $100,000 to $149,999 income range is the most frequent in Geauga County, accounting for 20.2% of all households. In contrast, only 636 households (1.8%) fall into the $10,000 to $14,999 income bracket, making it the least populous group.
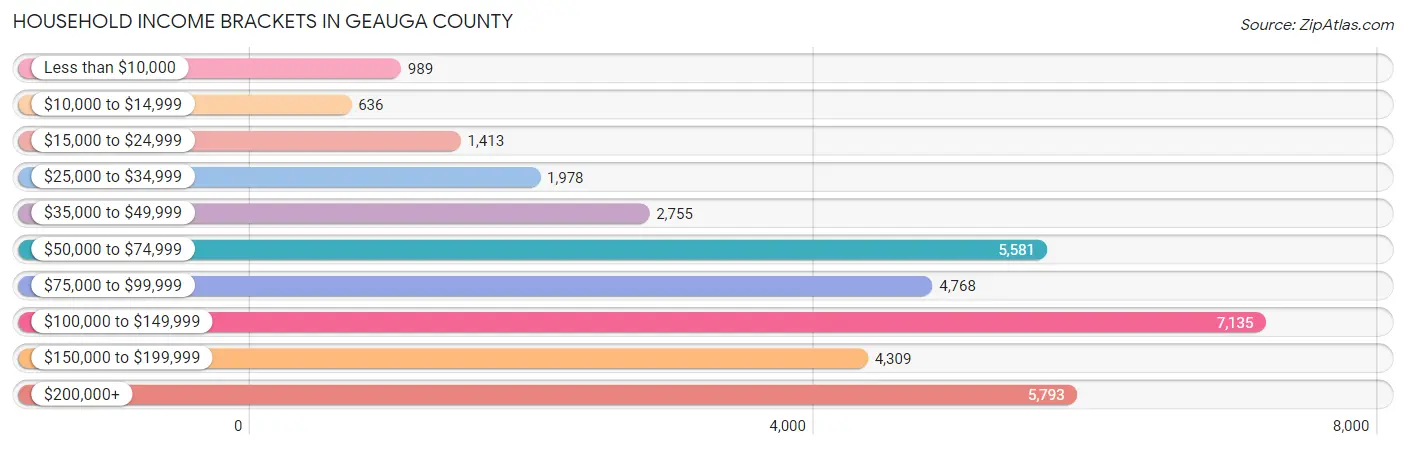
| Income Bracket | # Households | % Households |
| Less than $10,000 | 989 | 2.8% |
| $10,000 to $14,999 | 636 | 1.8% |
| $15,000 to $24,999 | 1,413 | 4.0% |
| $25,000 to $34,999 | 1,978 | 5.6% |
| $35,000 to $49,999 | 2,755 | 7.8% |
| $50,000 to $74,999 | 5,581 | 15.8% |
| $75,000 to $99,999 | 4,768 | 13.5% |
| $100,000 to $149,999 | 7,135 | 20.2% |
| $150,000 to $199,999 | 4,309 | 12.2% |
| $200,000+ | 5,793 | 16.4% |
Household Income by Householder Age in Geauga County
The median household income in Geauga County is $97,162, with the highest median household income of $122,982 found in the 45 to 64 years age bracket for the primary householder. A total of 14,419 households (40.8%) fall into this category. Meanwhile, the 15 to 24 years age bracket for the primary householder has the lowest median household income of $57,887, with 501 households (1.4%) in this group.
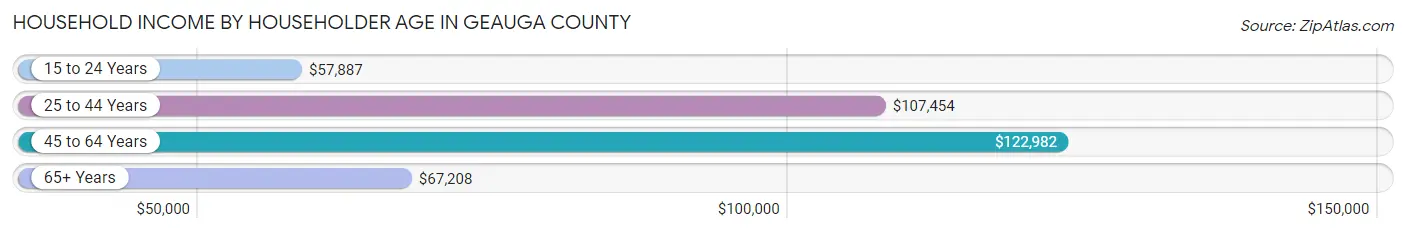
| Income Bracket | # Households | Median Income |
| 15 to 24 Years | 501 (1.4%) | $57,887 |
| 25 to 44 Years | 8,497 (24.1%) | $107,454 |
| 45 to 64 Years | 14,419 (40.8%) | $122,982 |
| 65+ Years | 11,904 (33.7%) | $67,208 |
| Total | 35,321 (100.0%) | $97,162 |
Poverty in Geauga County
Income Below Poverty by Sex and Age in Geauga County
With 5.5% poverty level for males and 6.2% for females among the residents of Geauga County, 75 year old and over males and 15 year old females are the most vulnerable to poverty, with 405 males (11.2%) and 94 females (17.1%) in their respective age groups living below the poverty level.
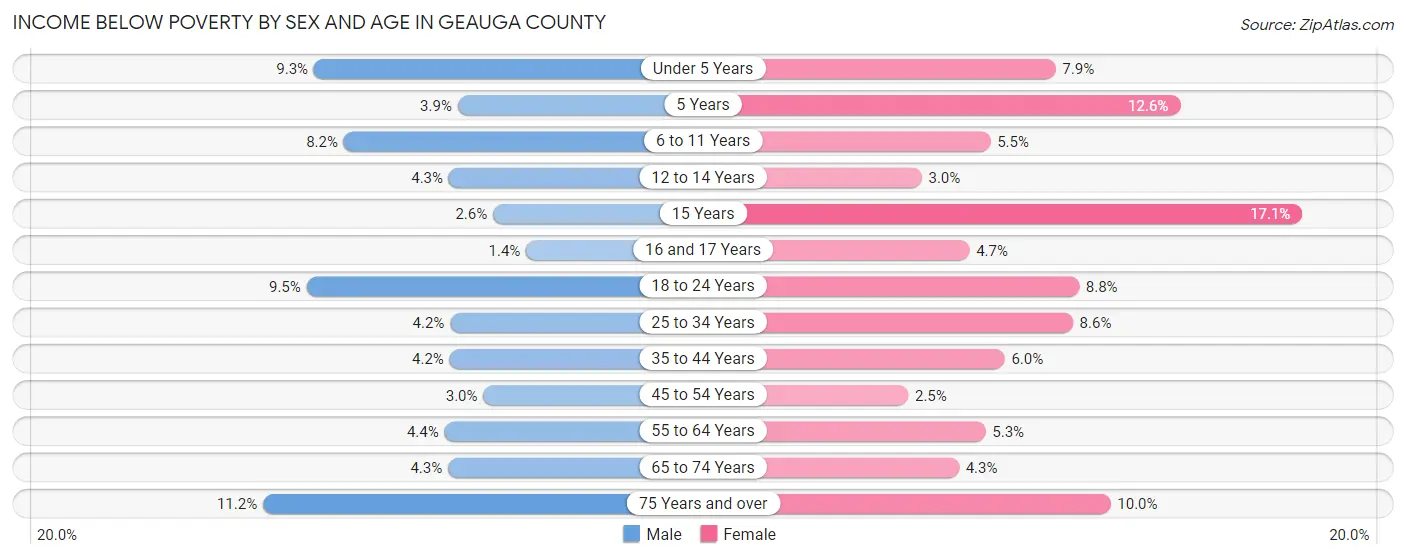
| Age Bracket | Male | Female |
| Under 5 Years | 225 (9.3%) | 189 (7.9%) |
| 5 Years | 17 (3.9%) | 57 (12.6%) |
| 6 to 11 Years | 295 (8.2%) | 188 (5.5%) |
| 12 to 14 Years | 85 (4.3%) | 59 (3.0%) |
| 15 Years | 23 (2.6%) | 94 (17.1%) |
| 16 and 17 Years | 19 (1.4%) | 73 (4.7%) |
| 18 to 24 Years | 398 (9.5%) | 329 (8.8%) |
| 25 to 34 Years | 188 (4.2%) | 357 (8.6%) |
| 35 to 44 Years | 214 (4.2%) | 297 (6.0%) |
| 45 to 54 Years | 189 (3.0%) | 151 (2.5%) |
| 55 to 64 Years | 318 (4.4%) | 389 (5.3%) |
| 65 to 74 Years | 244 (4.3%) | 248 (4.3%) |
| 75 Years and over | 405 (11.2%) | 467 (10.0%) |
| Total | 2,620 (5.5%) | 2,898 (6.2%) |
Income Above Poverty by Sex and Age in Geauga County
According to the poverty statistics in Geauga County, males aged 16 and 17 years and females aged 45 to 54 years are the age groups that are most secure financially, with 98.6% of males and 97.5% of females in these age groups living above the poverty line.
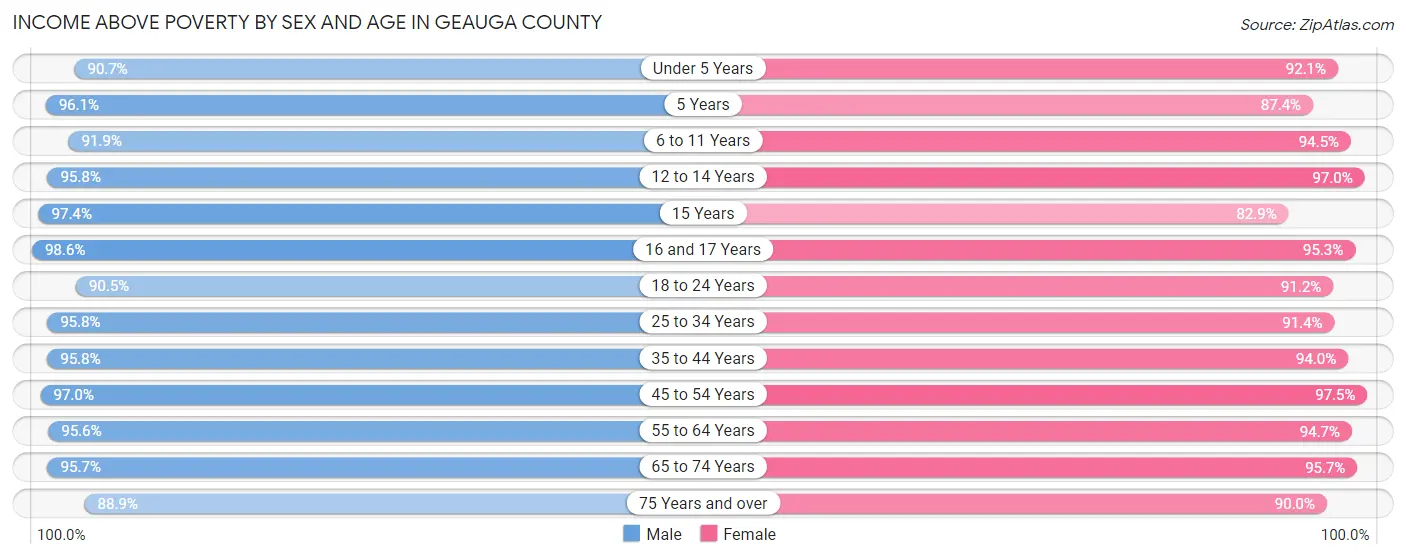
| Age Bracket | Male | Female |
| Under 5 Years | 2,206 (90.7%) | 2,193 (92.1%) |
| 5 Years | 417 (96.1%) | 397 (87.4%) |
| 6 to 11 Years | 3,323 (91.8%) | 3,225 (94.5%) |
| 12 to 14 Years | 1,914 (95.8%) | 1,932 (97.0%) |
| 15 Years | 858 (97.4%) | 456 (82.9%) |
| 16 and 17 Years | 1,356 (98.6%) | 1,471 (95.3%) |
| 18 to 24 Years | 3,779 (90.5%) | 3,410 (91.2%) |
| 25 to 34 Years | 4,291 (95.8%) | 3,808 (91.4%) |
| 35 to 44 Years | 4,853 (95.8%) | 4,623 (94.0%) |
| 45 to 54 Years | 6,166 (97.0%) | 5,997 (97.5%) |
| 55 to 64 Years | 6,891 (95.6%) | 6,906 (94.7%) |
| 65 to 74 Years | 5,461 (95.7%) | 5,471 (95.7%) |
| 75 Years and over | 3,228 (88.8%) | 4,218 (90.0%) |
| Total | 44,743 (94.5%) | 44,107 (93.8%) |
Income Below Poverty Among Married-Couple Families in Geauga County
The poverty statistics for married-couple families in Geauga County show that 2.6% or 591 of the total 22,862 families live below the poverty line. Families with 5 or more children have the highest poverty rate of 14.5%, comprising of 72 families. On the other hand, families with 1 or 2 children have the lowest poverty rate of 1.4%, which includes 87 families.
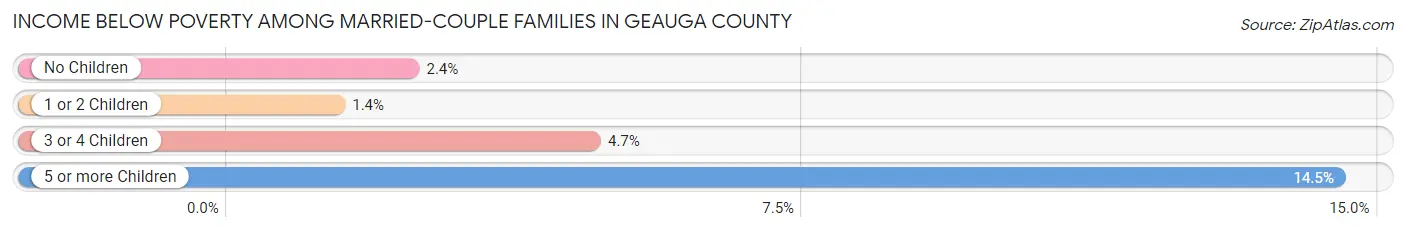
| Children | Above Poverty | Below Poverty |
| No Children | 13,739 (97.6%) | 333 (2.4%) |
| 1 or 2 Children | 6,117 (98.6%) | 87 (1.4%) |
| 3 or 4 Children | 1,989 (95.3%) | 99 (4.7%) |
| 5 or more Children | 426 (85.5%) | 72 (14.5%) |
| Total | 22,271 (97.4%) | 591 (2.6%) |
Income Below Poverty Among Single-Parent Households in Geauga County
According to the poverty data in Geauga County, 6.8% or 75 single-father households and 12.1% or 251 single-mother households are living below the poverty line. Among single-father households, those with 1 or 2 children have the highest poverty rate, with 57 households (14.8%) experiencing poverty. Likewise, among single-mother households, those with 1 or 2 children have the highest poverty rate, with 179 households (24.0%) falling below the poverty line.
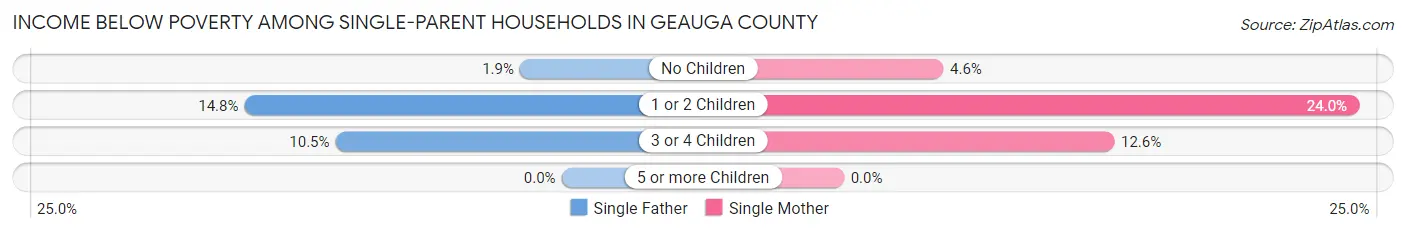
| Children | Single Father | Single Mother |
| No Children | 12 (1.9%) | 55 (4.6%) |
| 1 or 2 Children | 57 (14.8%) | 179 (24.0%) |
| 3 or 4 Children | 6 (10.5%) | 17 (12.6%) |
| 5 or more Children | 0 (0.0%) | 0 (0.0%) |
| Total | 75 (6.8%) | 251 (12.1%) |
Income Below Poverty Among Married-Couple vs Single-Parent Households in Geauga County
The poverty data for Geauga County shows that 591 of the married-couple family households (2.6%) and 326 of the single-parent households (10.3%) are living below the poverty level. Within the married-couple family households, those with 5 or more children have the highest poverty rate, with 72 households (14.5%) falling below the poverty line. Among the single-parent households, those with 1 or 2 children have the highest poverty rate, with 236 household (20.8%) living below poverty.
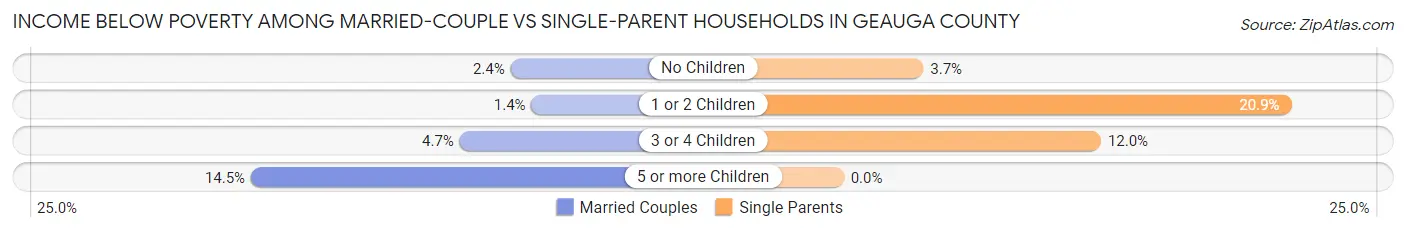
| Children | Married-Couple Families | Single-Parent Households |
| No Children | 333 (2.4%) | 67 (3.7%) |
| 1 or 2 Children | 87 (1.4%) | 236 (20.8%) |
| 3 or 4 Children | 99 (4.7%) | 23 (12.0%) |
| 5 or more Children | 72 (14.5%) | 0 (0.0%) |
| Total | 591 (2.6%) | 326 (10.3%) |
Employment Characteristics in Geauga County
Employment by Class of Employer in Geauga County
Among the 47,198 employed individuals in Geauga County, private company employees (30,812 | 65.3%), not-for-profit organizations (4,477 | 9.5%), and self-employed (not incorporated) (3,703 | 7.9%) make up the most common classes of employment.
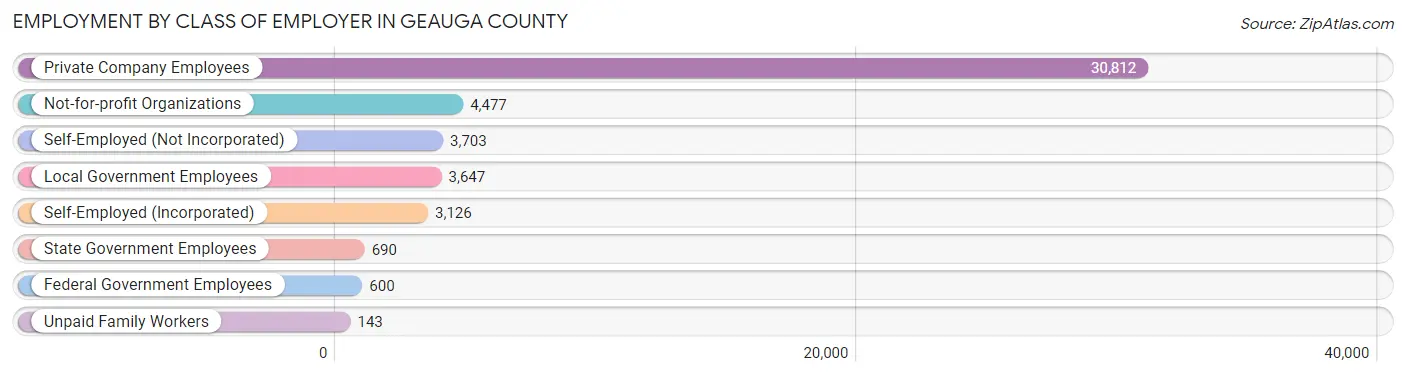
| Employer Class | # Employees | % Employees |
| Private Company Employees | 30,812 | 65.3% |
| Self-Employed (Incorporated) | 3,126 | 6.6% |
| Self-Employed (Not Incorporated) | 3,703 | 7.9% |
| Not-for-profit Organizations | 4,477 | 9.5% |
| Local Government Employees | 3,647 | 7.7% |
| State Government Employees | 690 | 1.5% |
| Federal Government Employees | 600 | 1.3% |
| Unpaid Family Workers | 143 | 0.3% |
| Total | 47,198 | 100.0% |
Employment Status by Age in Geauga County
According to the labor force statistics for Geauga County, out of the total population over 16 years of age (76,978), 64.5% or 49,651 individuals are in the labor force, with 3.1% or 1,539 of them unemployed. The age group with the highest labor force participation rate is 35 to 44 years, with 85.3% or 8,534 individuals in the labor force. Within the labor force, the 75 years and over age range has the highest percentage of unemployed individuals, with 11.4% or 109 of them being unemployed.
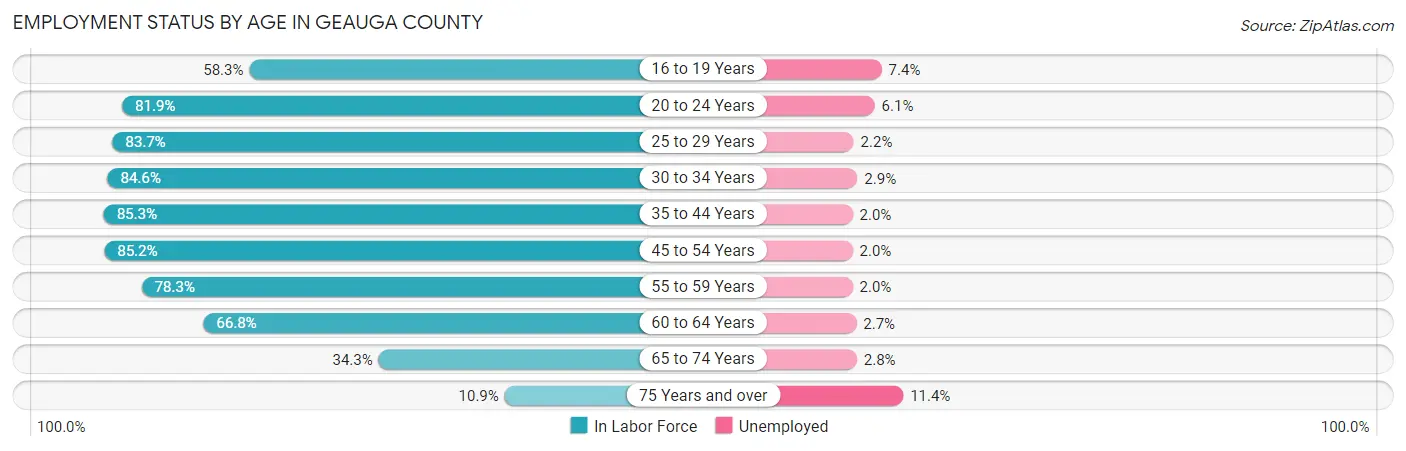
| Age Bracket | In Labor Force | Unemployed |
| 16 to 19 Years | 3,052 (58.3%) | 226 (7.4%) |
| 20 to 24 Years | 4,600 (81.9%) | 281 (6.1%) |
| 25 to 29 Years | 3,664 (83.7%) | 81 (2.2%) |
| 30 to 34 Years | 3,634 (84.6%) | 105 (2.9%) |
| 35 to 44 Years | 8,534 (85.3%) | 171 (2.0%) |
| 45 to 54 Years | 10,671 (85.2%) | 213 (2.0%) |
| 55 to 59 Years | 5,781 (78.3%) | 116 (2.0%) |
| 60 to 64 Years | 4,800 (66.8%) | 130 (2.7%) |
| 65 to 74 Years | 3,979 (34.3%) | 111 (2.8%) |
| 75 Years and over | 954 (10.9%) | 109 (11.4%) |
| Total | 49,651 (64.5%) | 1,539 (3.1%) |
Employment Status by Educational Attainment in Geauga County
According to labor force statistics for Geauga County, 81.0% of individuals (37,075) out of the total population between 25 and 64 years of age (45,772) are in the labor force, with 2.2% or 816 of them being unemployed. The group with the highest labor force participation rate are those with the educational attainment of bachelor's degree or higher, with 85.9% or 16,856 individuals in the labor force. Within the labor force, individuals with bachelor's degree or higher education have the highest percentage of unemployment, with 2.3% or 388 of them being unemployed.

| Educational Attainment | In Labor Force | Unemployed |
| Less than High School | 2,666 (63.2%) | 63 (1.5%) |
| High School Diploma | 7,913 (76.7%) | 227 (2.2%) |
| College / Associate Degree | 9,651 (83.1%) | 256 (2.2%) |
| Bachelor's Degree or higher | 16,856 (85.9%) | 451 (2.3%) |
| Total | 37,075 (81.0%) | 1,007 (2.2%) |
Employment Occupations by Sex in Geauga County
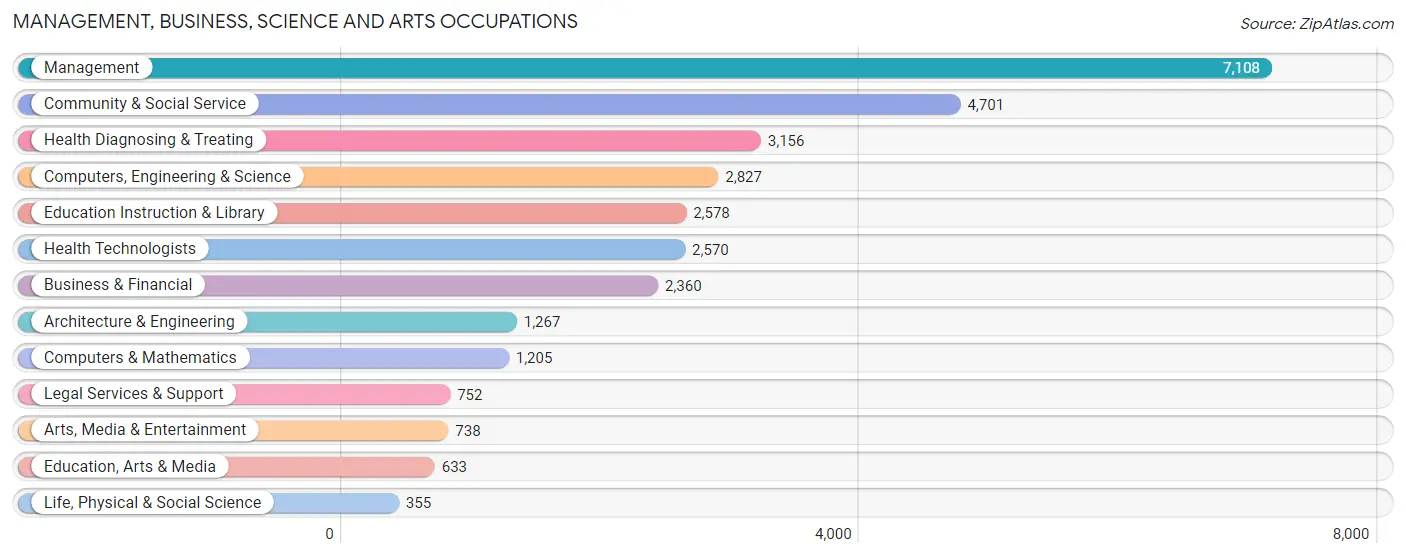
Management, Business, Science and Arts Occupations
The most common Management, Business, Science and Arts occupations in Geauga County are Management (7,108 | 14.8%), Community & Social Service (4,701 | 9.8%), Health Diagnosing & Treating (3,156 | 6.6%), Computers, Engineering & Science (2,827 | 5.9%), and Education Instruction & Library (2,578 | 5.4%).
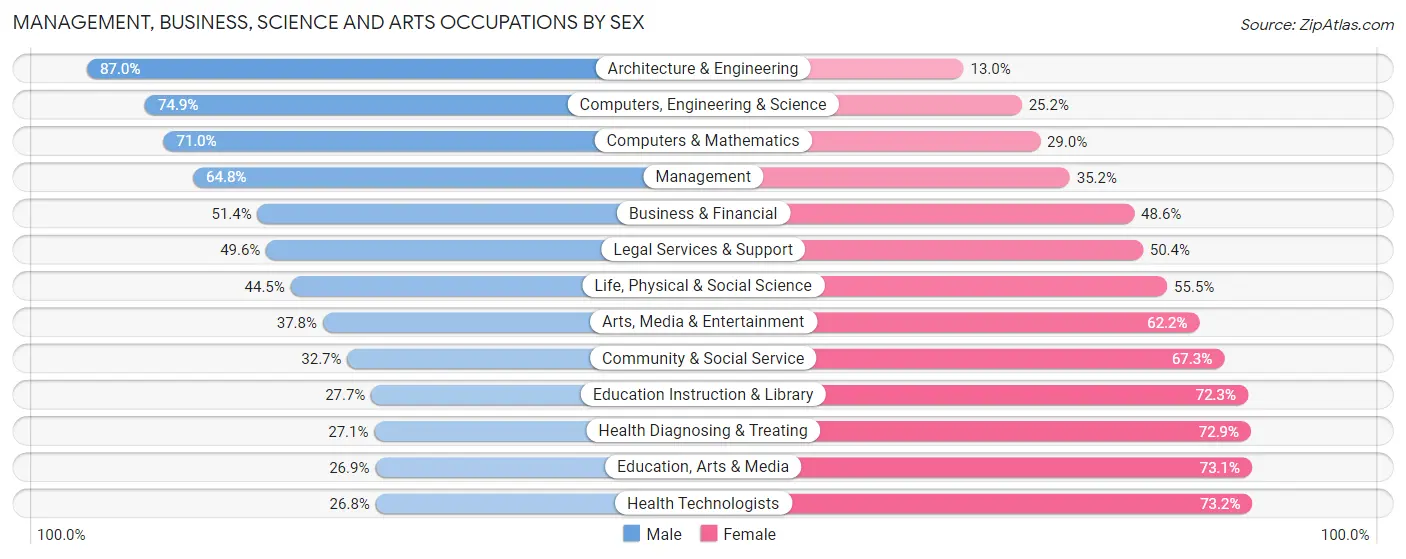
Management, Business, Science and Arts Occupations by Sex
Within the Management, Business, Science and Arts occupations in Geauga County, the most male-oriented occupations are Architecture & Engineering (87.0%), Computers, Engineering & Science (74.9%), and Computers & Mathematics (71.0%), while the most female-oriented occupations are Health Technologists (73.2%), Education, Arts & Media (73.1%), and Health Diagnosing & Treating (72.9%).
| Occupation | Male | Female |
| Management | 4,608 (64.8%) | 2,500 (35.2%) |
| Business & Financial | 1,213 (51.4%) | 1,147 (48.6%) |
| Computers, Engineering & Science | 2,116 (74.9%) | 711 (25.2%) |
| Computers & Mathematics | 856 (71.0%) | 349 (29.0%) |
| Architecture & Engineering | 1,102 (87.0%) | 165 (13.0%) |
| Life, Physical & Social Science | 158 (44.5%) | 197 (55.5%) |
| Community & Social Service | 1,536 (32.7%) | 3,165 (67.3%) |
| Education, Arts & Media | 170 (26.9%) | 463 (73.1%) |
| Legal Services & Support | 373 (49.6%) | 379 (50.4%) |
| Education Instruction & Library | 714 (27.7%) | 1,864 (72.3%) |
| Arts, Media & Entertainment | 279 (37.8%) | 459 (62.2%) |
| Health Diagnosing & Treating | 854 (27.1%) | 2,302 (72.9%) |
| Health Technologists | 688 (26.8%) | 1,882 (73.2%) |
| Total (Category) | 10,327 (51.2%) | 9,825 (48.7%) |
| Total (Overall) | 26,789 (55.7%) | 21,305 (44.3%) |
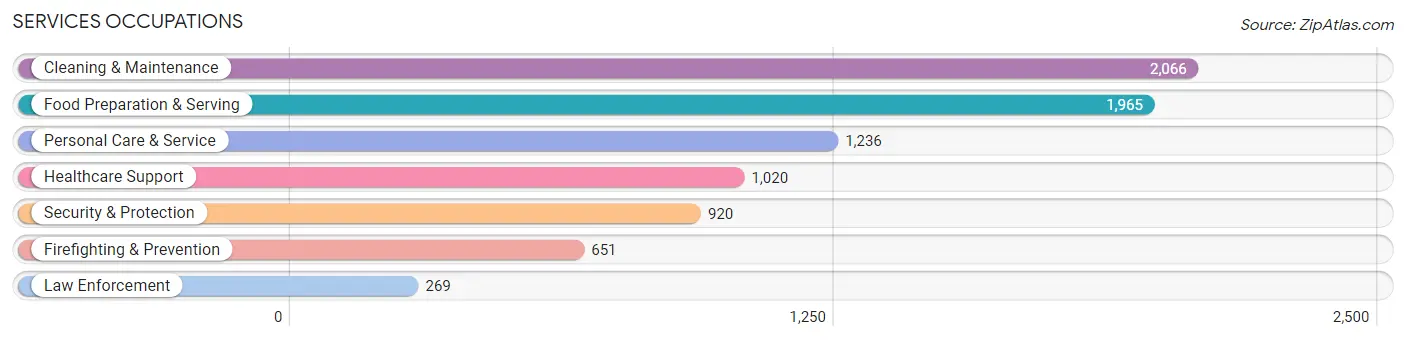
Services Occupations
The most common Services occupations in Geauga County are Cleaning & Maintenance (2,066 | 4.3%), Food Preparation & Serving (1,965 | 4.1%), Personal Care & Service (1,236 | 2.6%), Healthcare Support (1,020 | 2.1%), and Security & Protection (920 | 1.9%).
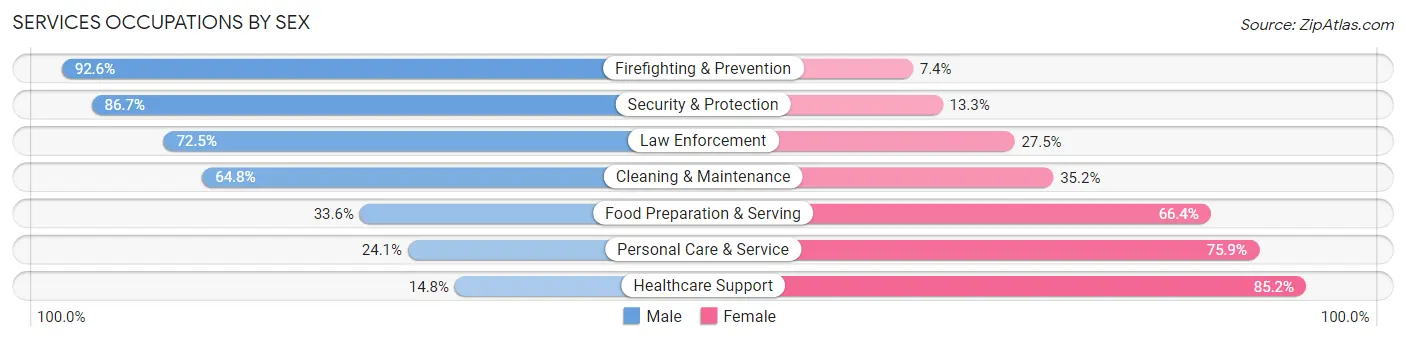
Services Occupations by Sex
Within the Services occupations in Geauga County, the most male-oriented occupations are Firefighting & Prevention (92.6%), Security & Protection (86.7%), and Law Enforcement (72.5%), while the most female-oriented occupations are Healthcare Support (85.2%), Personal Care & Service (75.9%), and Food Preparation & Serving (66.4%).
| Occupation | Male | Female |
| Healthcare Support | 151 (14.8%) | 869 (85.2%) |
| Security & Protection | 798 (86.7%) | 122 (13.3%) |
| Firefighting & Prevention | 603 (92.6%) | 48 (7.4%) |
| Law Enforcement | 195 (72.5%) | 74 (27.5%) |
| Food Preparation & Serving | 661 (33.6%) | 1,304 (66.4%) |
| Cleaning & Maintenance | 1,339 (64.8%) | 727 (35.2%) |
| Personal Care & Service | 298 (24.1%) | 938 (75.9%) |
| Total (Category) | 3,247 (45.1%) | 3,960 (54.9%) |
| Total (Overall) | 26,789 (55.7%) | 21,305 (44.3%) |
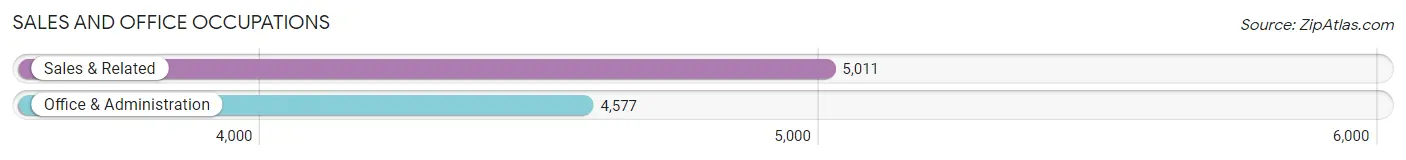
Sales and Office Occupations
The most common Sales and Office occupations in Geauga County are Sales & Related (5,011 | 10.4%), and Office & Administration (4,577 | 9.5%).
Sales and Office Occupations by Sex
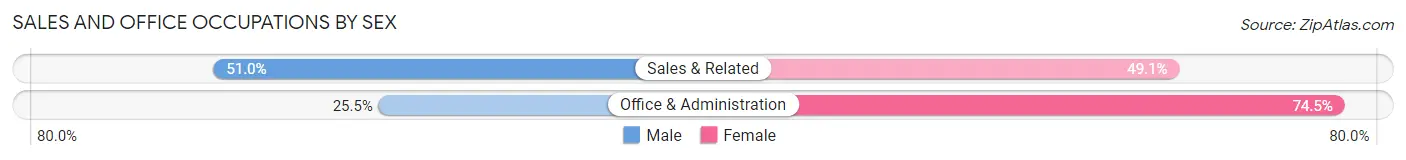
| Occupation | Male | Female |
| Sales & Related | 2,553 (50.9%) | 2,458 (49.0%) |
| Office & Administration | 1,168 (25.5%) | 3,409 (74.5%) |
| Total (Category) | 3,721 (38.8%) | 5,867 (61.2%) |
| Total (Overall) | 26,789 (55.7%) | 21,305 (44.3%) |
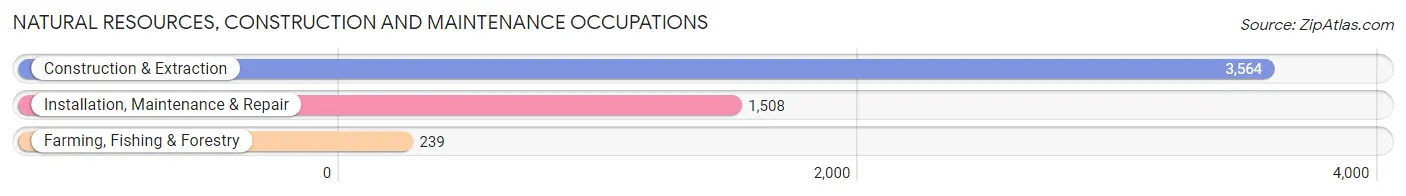
Natural Resources, Construction and Maintenance Occupations
The most common Natural Resources, Construction and Maintenance occupations in Geauga County are Construction & Extraction (3,564 | 7.4%), Installation, Maintenance & Repair (1,508 | 3.1%), and Farming, Fishing & Forestry (239 | 0.5%).
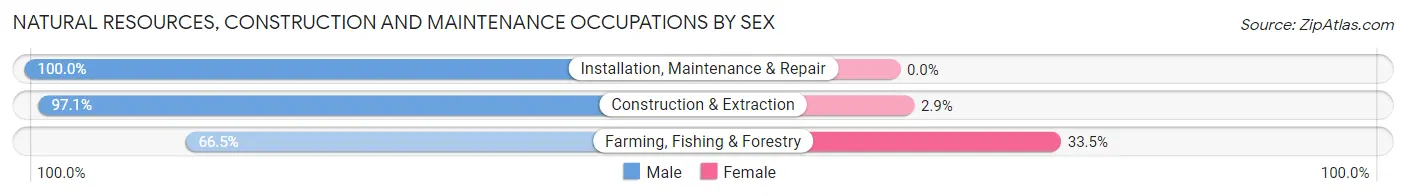
Natural Resources, Construction and Maintenance Occupations by Sex
| Occupation | Male | Female |
| Farming, Fishing & Forestry | 159 (66.5%) | 80 (33.5%) |
| Construction & Extraction | 3,460 (97.1%) | 104 (2.9%) |
| Installation, Maintenance & Repair | 1,508 (100.0%) | 0 (0.0%) |
| Total (Category) | 5,127 (96.5%) | 184 (3.5%) |
| Total (Overall) | 26,789 (55.7%) | 21,305 (44.3%) |
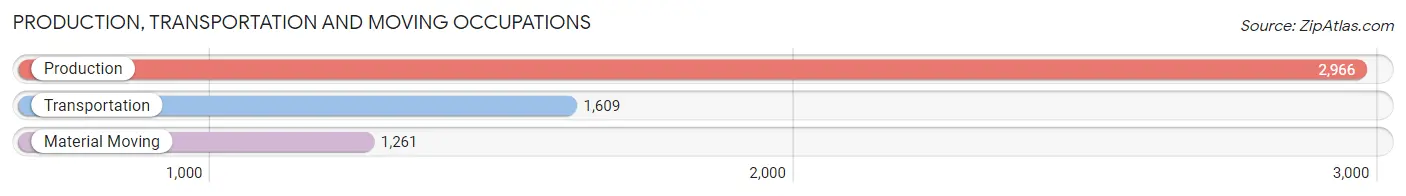
Production, Transportation and Moving Occupations
The most common Production, Transportation and Moving occupations in Geauga County are Production (2,966 | 6.2%), Transportation (1,609 | 3.4%), and Material Moving (1,261 | 2.6%).
Production, Transportation and Moving Occupations by Sex
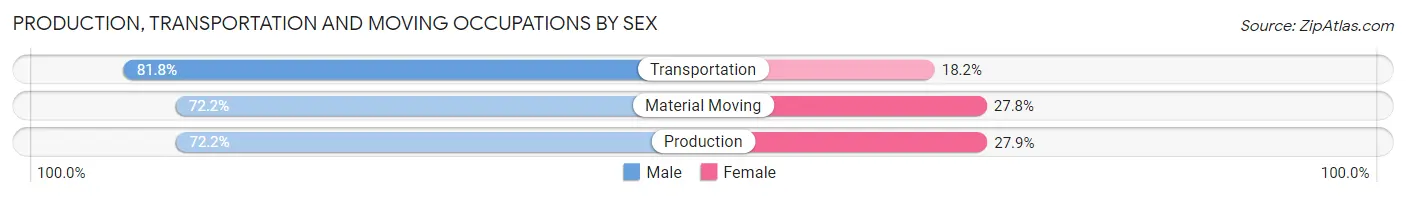
| Occupation | Male | Female |
| Production | 2,140 (72.2%) | 826 (27.9%) |
| Transportation | 1,316 (81.8%) | 293 (18.2%) |
| Material Moving | 911 (72.2%) | 350 (27.8%) |
| Total (Category) | 4,367 (74.8%) | 1,469 (25.2%) |
| Total (Overall) | 26,789 (55.7%) | 21,305 (44.3%) |
Employment Industries by Sex in Geauga County
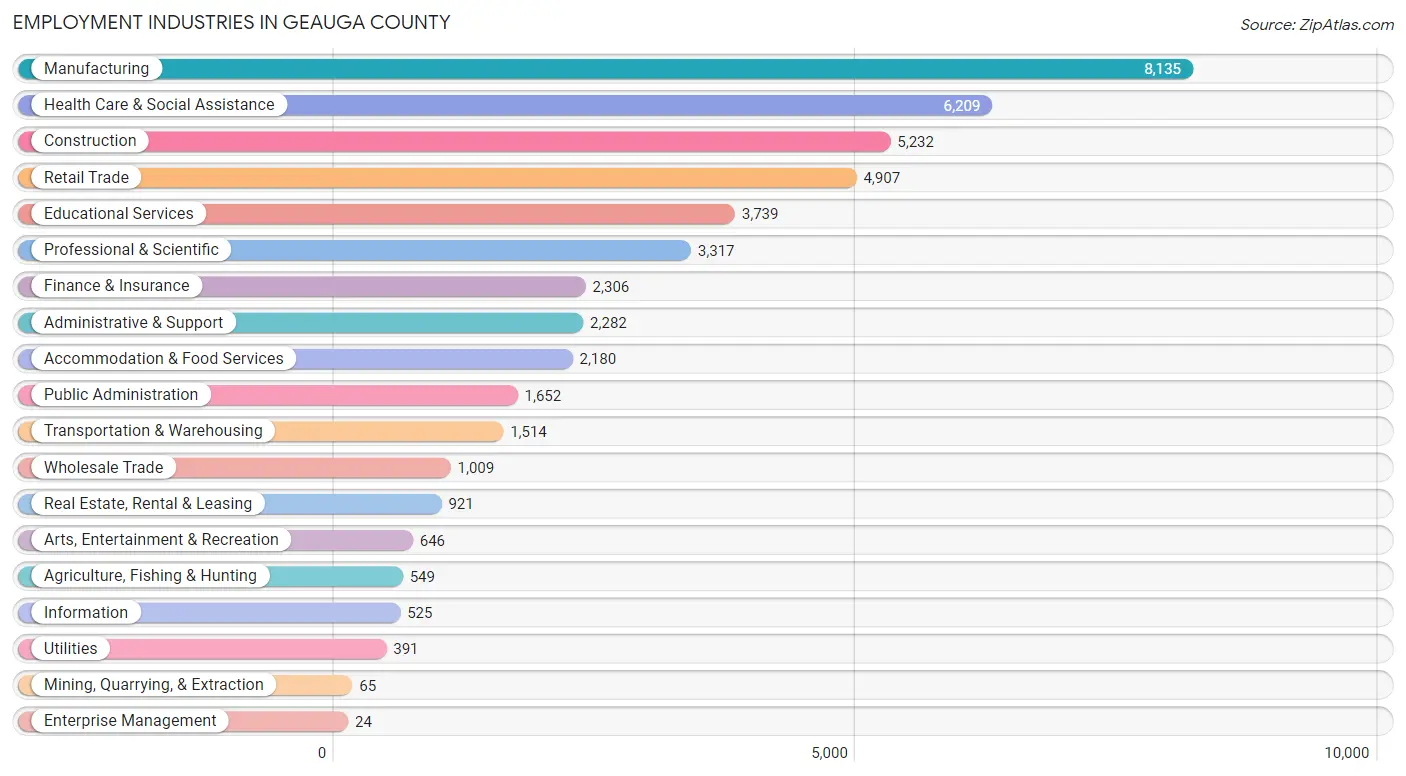
Employment Industries in Geauga County
The major employment industries in Geauga County include Manufacturing (8,135 | 16.9%), Health Care & Social Assistance (6,209 | 12.9%), Construction (5,232 | 10.9%), Retail Trade (4,907 | 10.2%), and Educational Services (3,739 | 7.8%).
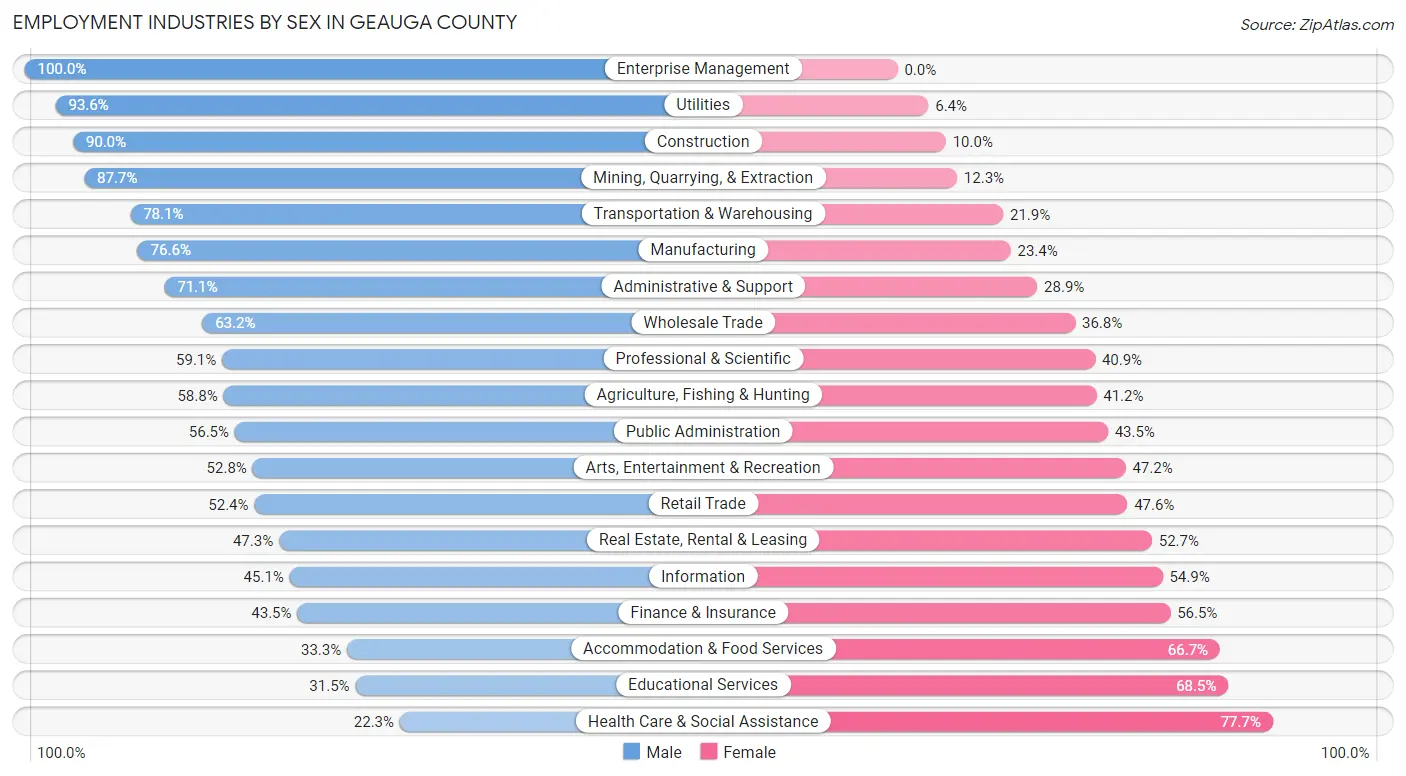
Employment Industries by Sex in Geauga County
The Geauga County industries that see more men than women are Enterprise Management (100.0%), Utilities (93.6%), and Construction (90.0%), whereas the industries that tend to have a higher number of women are Health Care & Social Assistance (77.7%), Educational Services (68.5%), and Accommodation & Food Services (66.7%).
| Industry | Male | Female |
| Agriculture, Fishing & Hunting | 323 (58.8%) | 226 (41.2%) |
| Mining, Quarrying, & Extraction | 57 (87.7%) | 8 (12.3%) |
| Construction | 4,709 (90.0%) | 523 (10.0%) |
| Manufacturing | 6,231 (76.6%) | 1,904 (23.4%) |
| Wholesale Trade | 638 (63.2%) | 371 (36.8%) |
| Retail Trade | 2,573 (52.4%) | 2,334 (47.6%) |
| Transportation & Warehousing | 1,183 (78.1%) | 331 (21.9%) |
| Utilities | 366 (93.6%) | 25 (6.4%) |
| Information | 237 (45.1%) | 288 (54.9%) |
| Finance & Insurance | 1,004 (43.5%) | 1,302 (56.5%) |
| Real Estate, Rental & Leasing | 436 (47.3%) | 485 (52.7%) |
| Professional & Scientific | 1,961 (59.1%) | 1,356 (40.9%) |
| Enterprise Management | 24 (100.0%) | 0 (0.0%) |
| Administrative & Support | 1,622 (71.1%) | 660 (28.9%) |
| Educational Services | 1,179 (31.5%) | 2,560 (68.5%) |
| Health Care & Social Assistance | 1,386 (22.3%) | 4,823 (77.7%) |
| Arts, Entertainment & Recreation | 341 (52.8%) | 305 (47.2%) |
| Accommodation & Food Services | 725 (33.3%) | 1,455 (66.7%) |
| Public Administration | 933 (56.5%) | 719 (43.5%) |
| Total | 26,789 (55.7%) | 21,305 (44.3%) |
Education in Geauga County
School Enrollment in Geauga County
The most common levels of schooling among the 20,444 students in Geauga County are high school (5,081 | 24.8%), middle school (5,080 | 24.8%), and elementary school (4,525 | 22.1%).
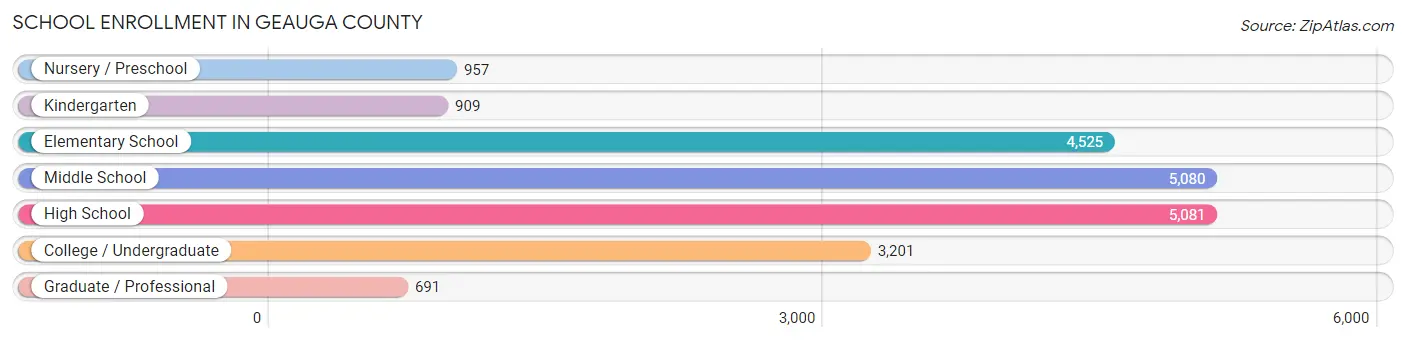
| School Level | # Students | % Students |
| Nursery / Preschool | 957 | 4.7% |
| Kindergarten | 909 | 4.4% |
| Elementary School | 4,525 | 22.1% |
| Middle School | 5,080 | 24.8% |
| High School | 5,081 | 24.8% |
| College / Undergraduate | 3,201 | 15.7% |
| Graduate / Professional | 691 | 3.4% |
| Total | 20,444 | 100.0% |
School Enrollment by Age by Funding Source in Geauga County
Out of a total of 20,444 students who are enrolled in schools in Geauga County, 5,050 (24.7%) attend a private institution, while the remaining 15,394 (75.3%) are enrolled in public schools. The age group of 3 to 4 year olds has the highest likelihood of being enrolled in private schools, with 314 (53.8% in the age bracket) enrolled. Conversely, the age group of 18 to 19 year olds has the lowest likelihood of being enrolled in a private school, with 1,019 (83.9% in the age bracket) attending a public institution.
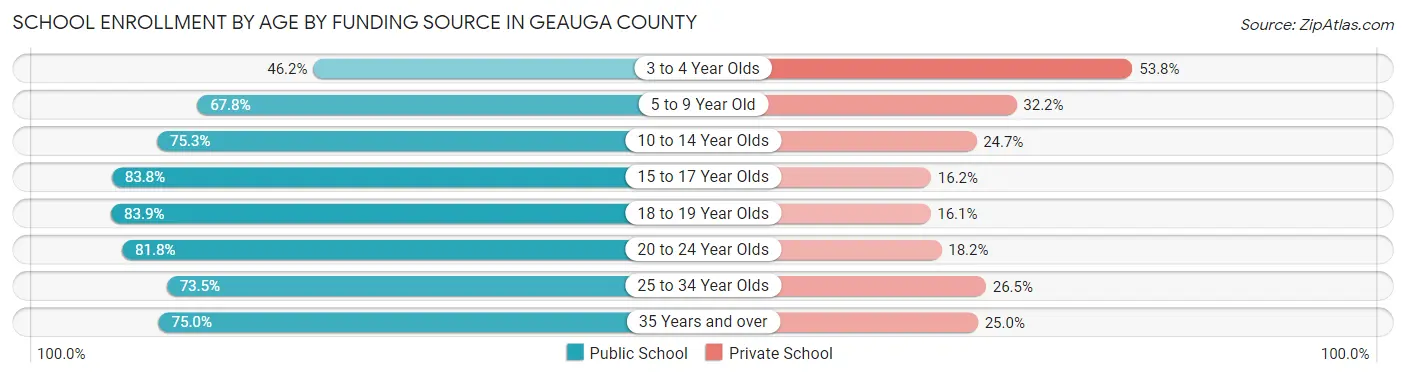
| Age Bracket | Public School | Private School |
| 3 to 4 Year Olds | 270 (46.2%) | 314 (53.8%) |
| 5 to 9 Year Old | 3,399 (67.8%) | 1,611 (32.2%) |
| 10 to 14 Year Olds | 4,830 (75.3%) | 1,583 (24.7%) |
| 15 to 17 Year Olds | 3,204 (83.8%) | 621 (16.2%) |
| 18 to 19 Year Olds | 1,019 (83.9%) | 196 (16.1%) |
| 20 to 24 Year Olds | 1,566 (81.8%) | 348 (18.2%) |
| 25 to 34 Year Olds | 375 (73.5%) | 135 (26.5%) |
| 35 Years and over | 730 (75.0%) | 243 (25.0%) |
| Total | 15,394 (75.3%) | 5,050 (24.7%) |
Educational Attainment by Field of Study in Geauga County
Business (5,492 | 19.5%), education (3,724 | 13.2%), science & technology (3,580 | 12.7%), engineering (2,650 | 9.4%), and bio, nature & agricultural (2,044 | 7.3%) are the most common fields of study among 28,133 individuals in Geauga County who have obtained a bachelor's degree or higher.
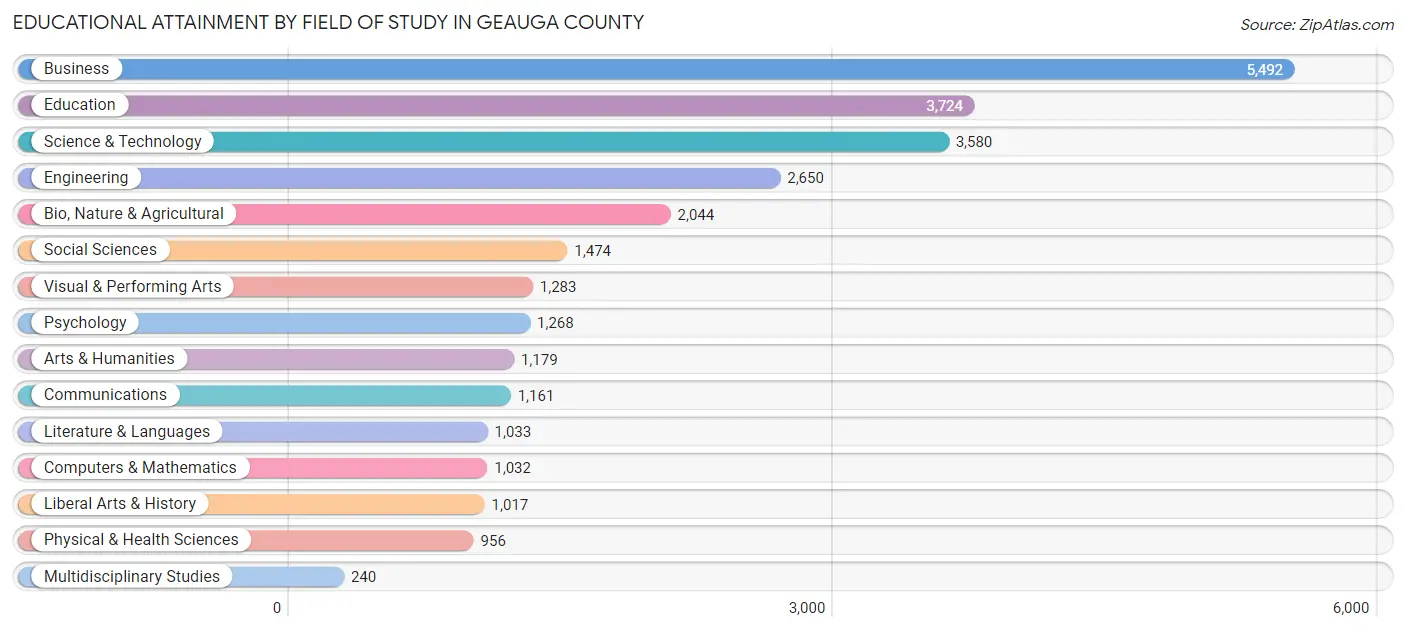
| Field of Study | # Graduates | % Graduates |
| Computers & Mathematics | 1,032 | 3.7% |
| Bio, Nature & Agricultural | 2,044 | 7.3% |
| Physical & Health Sciences | 956 | 3.4% |
| Psychology | 1,268 | 4.5% |
| Social Sciences | 1,474 | 5.2% |
| Engineering | 2,650 | 9.4% |
| Multidisciplinary Studies | 240 | 0.9% |
| Science & Technology | 3,580 | 12.7% |
| Business | 5,492 | 19.5% |
| Education | 3,724 | 13.2% |
| Literature & Languages | 1,033 | 3.7% |
| Liberal Arts & History | 1,017 | 3.6% |
| Visual & Performing Arts | 1,283 | 4.6% |
| Communications | 1,161 | 4.1% |
| Arts & Humanities | 1,179 | 4.2% |
| Total | 28,133 | 100.0% |
Transportation & Commute in Geauga County
Vehicle Availability by Sex in Geauga County
The most prevalent vehicle ownership categories in Geauga County are males with 2 vehicles (9,647, accounting for 36.5%) and females with 2 vehicles (8,394, making up 46.6%).
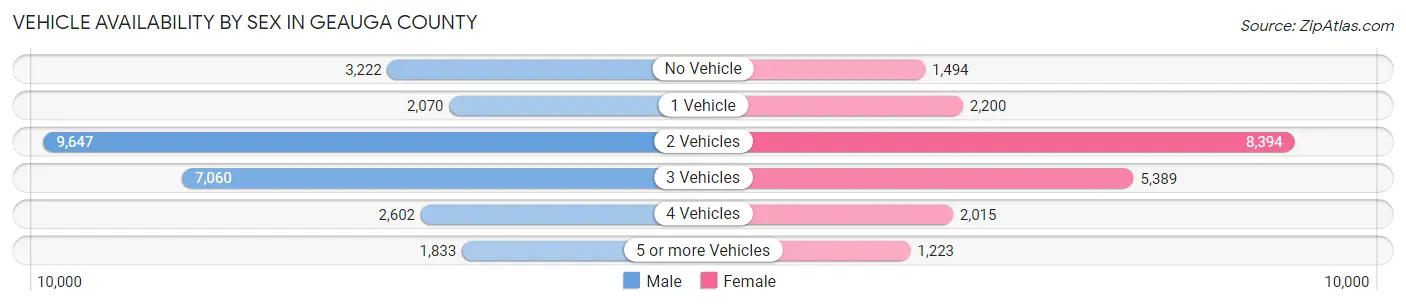
| Vehicles Available | Male | Female |
| No Vehicle | 3,222 (12.2%) | 1,494 (7.2%) |
| 1 Vehicle | 2,070 (7.8%) | 2,200 (10.6%) |
| 2 Vehicles | 9,647 (36.5%) | 8,394 (40.5%) |
| 3 Vehicles | 7,060 (26.7%) | 5,389 (26.0%) |
| 4 Vehicles | 2,602 (9.8%) | 2,015 (9.7%) |
| 5 or more Vehicles | 1,833 (6.9%) | 1,223 (5.9%) |
| Total | 26,434 (100.0%) | 20,715 (100.0%) |
Commute Time in Geauga County
The most frequently occuring commute durations in Geauga County are 30 to 34 minutes (6,331 commuters, 15.3%), 20 to 24 minutes (5,512 commuters, 13.3%), and 15 to 19 minutes (4,636 commuters, 11.2%).
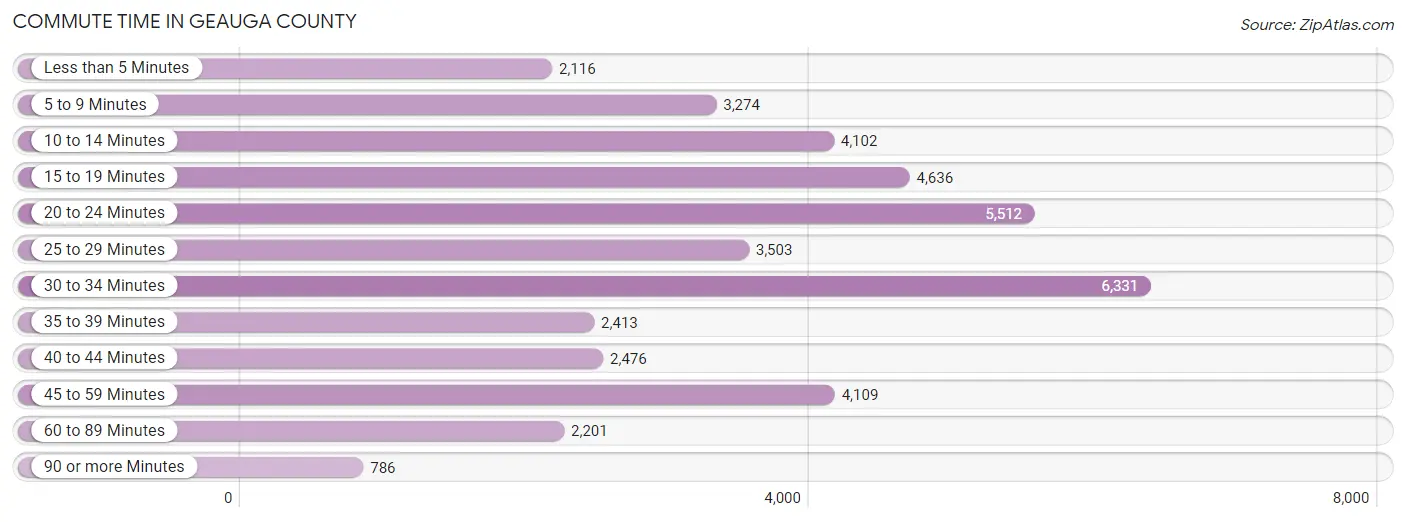
| Commute Time | # Commuters | % Commuters |
| Less than 5 Minutes | 2,116 | 5.1% |
| 5 to 9 Minutes | 3,274 | 7.9% |
| 10 to 14 Minutes | 4,102 | 9.9% |
| 15 to 19 Minutes | 4,636 | 11.2% |
| 20 to 24 Minutes | 5,512 | 13.3% |
| 25 to 29 Minutes | 3,503 | 8.5% |
| 30 to 34 Minutes | 6,331 | 15.3% |
| 35 to 39 Minutes | 2,413 | 5.8% |
| 40 to 44 Minutes | 2,476 | 6.0% |
| 45 to 59 Minutes | 4,109 | 9.9% |
| 60 to 89 Minutes | 2,201 | 5.3% |
| 90 or more Minutes | 786 | 1.9% |
Commute Time by Sex in Geauga County
The most common commute times in Geauga County are 30 to 34 minutes (3,652 commuters, 15.5%) for males and 30 to 34 minutes (2,679 commuters, 15.0%) for females.
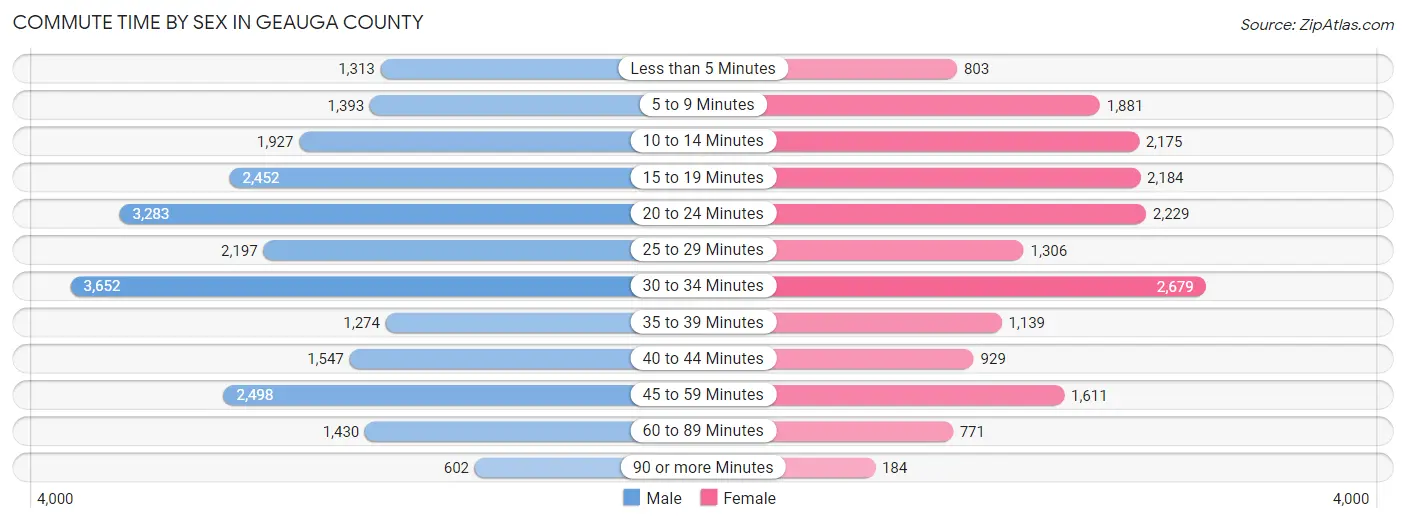
| Commute Time | Male | Female |
| Less than 5 Minutes | 1,313 (5.6%) | 803 (4.5%) |
| 5 to 9 Minutes | 1,393 (5.9%) | 1,881 (10.5%) |
| 10 to 14 Minutes | 1,927 (8.2%) | 2,175 (12.2%) |
| 15 to 19 Minutes | 2,452 (10.4%) | 2,184 (12.2%) |
| 20 to 24 Minutes | 3,283 (13.9%) | 2,229 (12.5%) |
| 25 to 29 Minutes | 2,197 (9.3%) | 1,306 (7.3%) |
| 30 to 34 Minutes | 3,652 (15.5%) | 2,679 (15.0%) |
| 35 to 39 Minutes | 1,274 (5.4%) | 1,139 (6.4%) |
| 40 to 44 Minutes | 1,547 (6.6%) | 929 (5.2%) |
| 45 to 59 Minutes | 2,498 (10.6%) | 1,611 (9.0%) |
| 60 to 89 Minutes | 1,430 (6.1%) | 771 (4.3%) |
| 90 or more Minutes | 602 (2.5%) | 184 (1.0%) |
Time of Departure to Work by Sex in Geauga County
The most frequent times of departure to work in Geauga County are 7:00 AM to 7:29 AM (3,813, 16.2%) for males and 7:00 AM to 7:29 AM (2,852, 15.9%) for females.
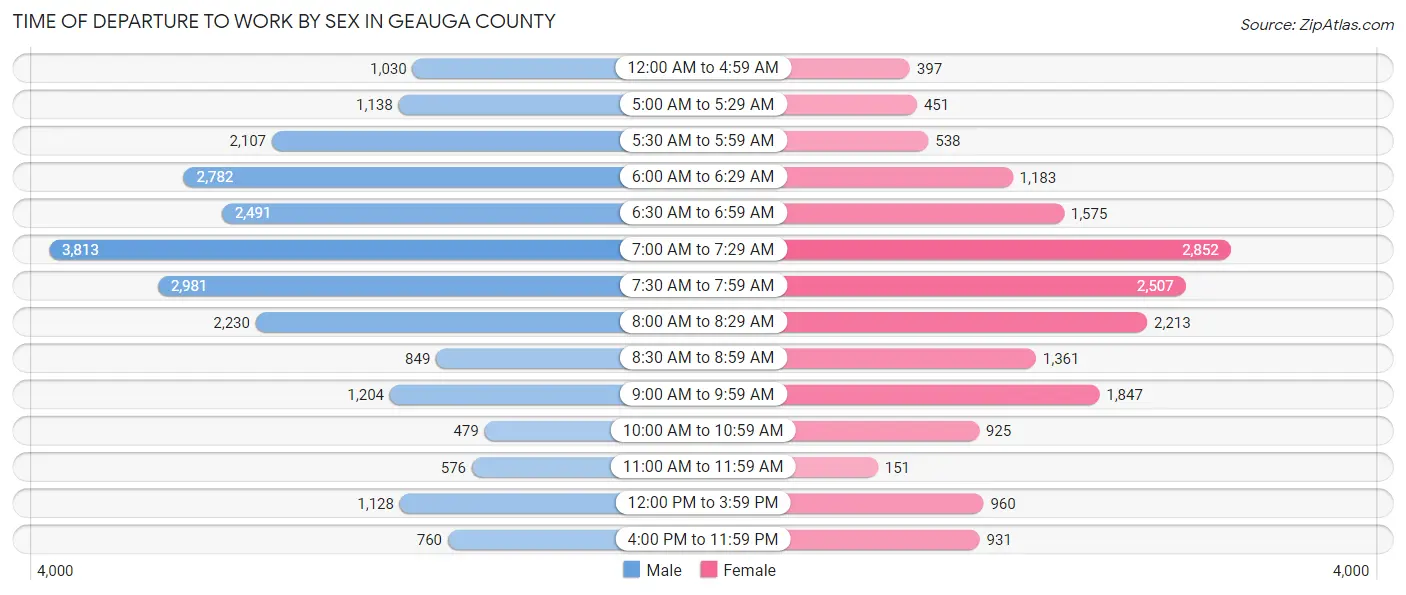
| Time of Departure | Male | Female |
| 12:00 AM to 4:59 AM | 1,030 (4.4%) | 397 (2.2%) |
| 5:00 AM to 5:29 AM | 1,138 (4.8%) | 451 (2.5%) |
| 5:30 AM to 5:59 AM | 2,107 (8.9%) | 538 (3.0%) |
| 6:00 AM to 6:29 AM | 2,782 (11.8%) | 1,183 (6.6%) |
| 6:30 AM to 6:59 AM | 2,491 (10.6%) | 1,575 (8.8%) |
| 7:00 AM to 7:29 AM | 3,813 (16.2%) | 2,852 (15.9%) |
| 7:30 AM to 7:59 AM | 2,981 (12.7%) | 2,507 (14.0%) |
| 8:00 AM to 8:29 AM | 2,230 (9.5%) | 2,213 (12.4%) |
| 8:30 AM to 8:59 AM | 849 (3.6%) | 1,361 (7.6%) |
| 9:00 AM to 9:59 AM | 1,204 (5.1%) | 1,847 (10.3%) |
| 10:00 AM to 10:59 AM | 479 (2.0%) | 925 (5.2%) |
| 11:00 AM to 11:59 AM | 576 (2.4%) | 151 (0.8%) |
| 12:00 PM to 3:59 PM | 1,128 (4.8%) | 960 (5.4%) |
| 4:00 PM to 11:59 PM | 760 (3.2%) | 931 (5.2%) |
| Total | 23,568 (100.0%) | 17,891 (100.0%) |
Housing Occupancy in Geauga County
Occupancy by Ownership in Geauga County
Of the total 35,321 dwellings in Geauga County, owner-occupied units account for 30,754 (87.1%), while renter-occupied units make up 4,567 (12.9%).
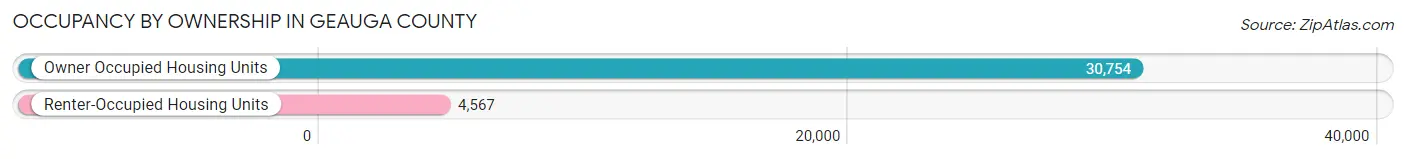
| Occupancy | # Housing Units | % Housing Units |
| Owner Occupied Housing Units | 30,754 | 87.1% |
| Renter-Occupied Housing Units | 4,567 | 12.9% |
| Total Occupied Housing Units | 35,321 | 100.0% |
Occupancy by Household Size in Geauga County

| Household Size | # Housing Units | % Housing Units |
| 1-Person Household | 7,515 | 21.3% |
| 2-Person Household | 13,358 | 37.8% |
| 3-Person Household | 5,758 | 16.3% |
| 4+ Person Household | 8,690 | 24.6% |
| Total Housing Units | 35,321 | 100.0% |
Occupancy by Ownership by Household Size in Geauga County
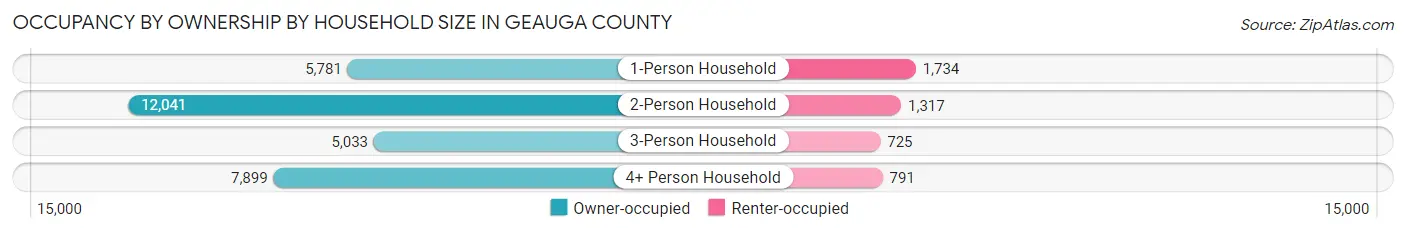
| Household Size | Owner-occupied | Renter-occupied |
| 1-Person Household | 5,781 (76.9%) | 1,734 (23.1%) |
| 2-Person Household | 12,041 (90.1%) | 1,317 (9.9%) |
| 3-Person Household | 5,033 (87.4%) | 725 (12.6%) |
| 4+ Person Household | 7,899 (90.9%) | 791 (9.1%) |
| Total Housing Units | 30,754 (87.1%) | 4,567 (12.9%) |
Occupancy by Educational Attainment in Geauga County
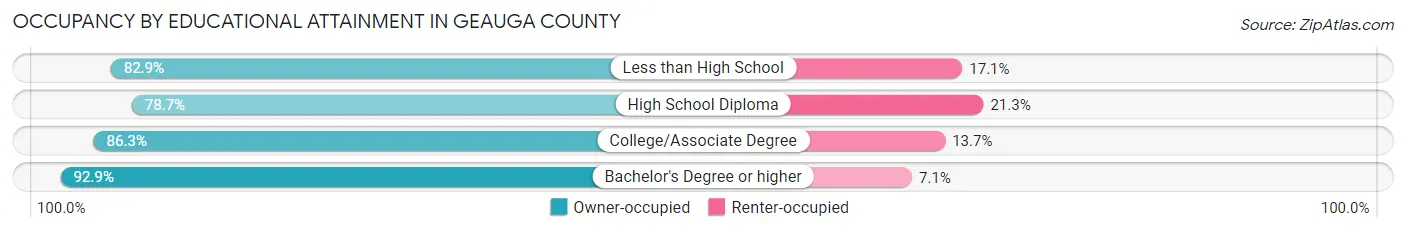
| Household Size | Owner-occupied | Renter-occupied |
| Less than High School | 2,217 (82.9%) | 457 (17.1%) |
| High School Diploma | 6,303 (78.7%) | 1,704 (21.3%) |
| College/Associate Degree | 8,556 (86.3%) | 1,357 (13.7%) |
| Bachelor's Degree or higher | 13,678 (92.9%) | 1,049 (7.1%) |
Occupancy by Age of Householder in Geauga County
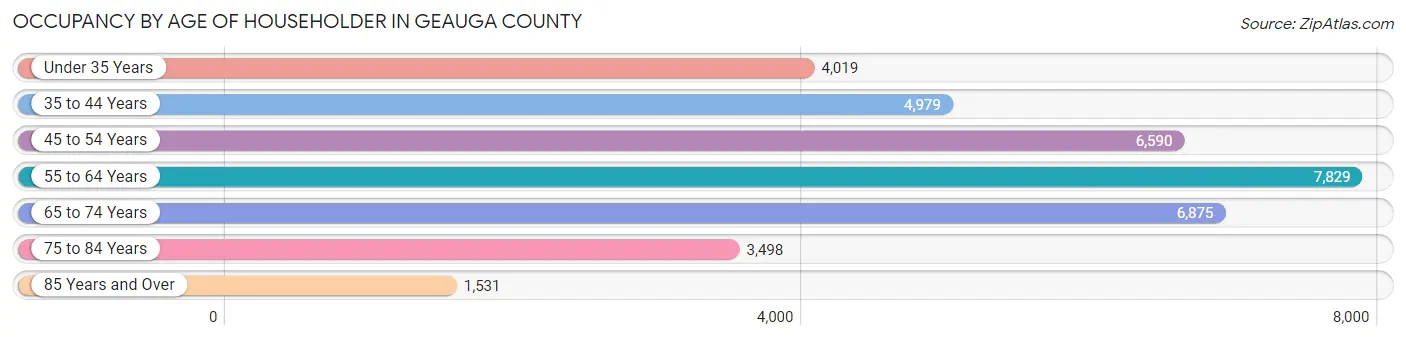
| Age Bracket | # Households | % Households |
| Under 35 Years | 4,019 | 11.4% |
| 35 to 44 Years | 4,979 | 14.1% |
| 45 to 54 Years | 6,590 | 18.7% |
| 55 to 64 Years | 7,829 | 22.2% |
| 65 to 74 Years | 6,875 | 19.5% |
| 75 to 84 Years | 3,498 | 9.9% |
| 85 Years and Over | 1,531 | 4.3% |
| Total | 35,321 | 100.0% |
Housing Finances in Geauga County
Median Income by Occupancy in Geauga County
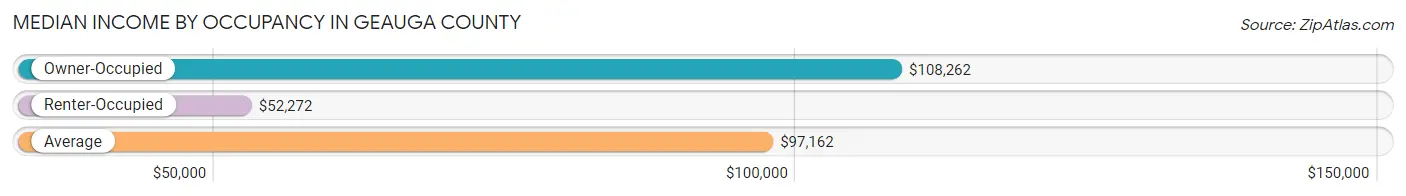
| Occupancy Type | # Households | Median Income |
| Owner-Occupied | 30,754 (87.1%) | $108,262 |
| Renter-Occupied | 4,567 (12.9%) | $52,272 |
| Average | 35,321 (100.0%) | $97,162 |
Occupancy by Householder Income Bracket in Geauga County
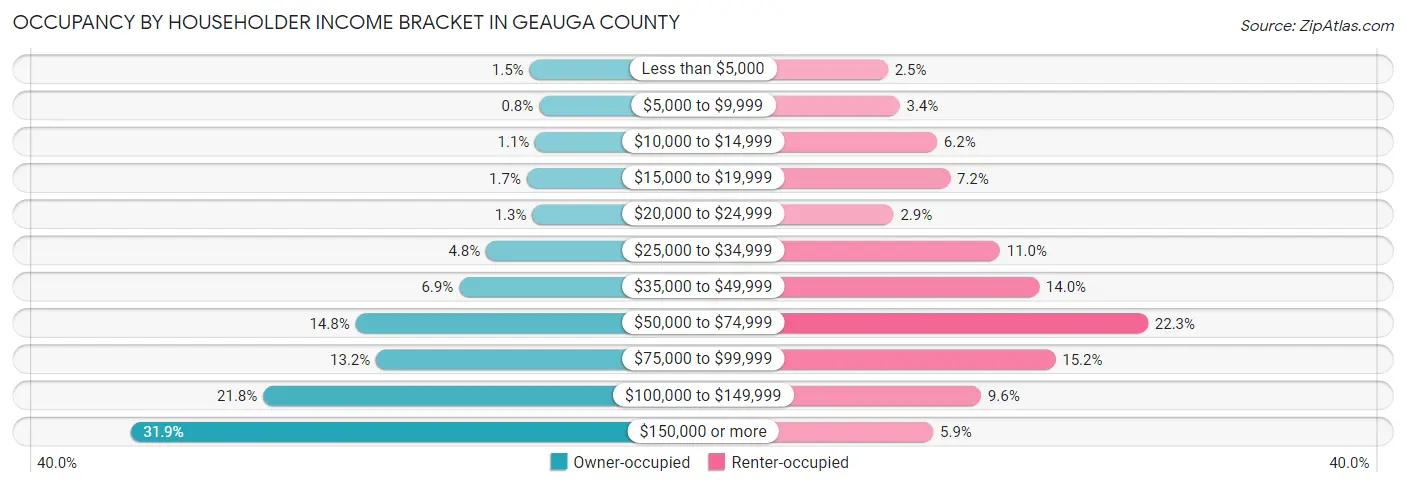
| Income Bracket | Owner-occupied | Renter-occupied |
| Less than $5,000 | 474 (1.5%) | 112 (2.5%) |
| $5,000 to $9,999 | 245 (0.8%) | 153 (3.4%) |
| $10,000 to $14,999 | 337 (1.1%) | 283 (6.2%) |
| $15,000 to $19,999 | 534 (1.7%) | 329 (7.2%) |
| $20,000 to $24,999 | 405 (1.3%) | 132 (2.9%) |
| $25,000 to $34,999 | 1,487 (4.8%) | 502 (11.0%) |
| $35,000 to $49,999 | 2,121 (6.9%) | 638 (14.0%) |
| $50,000 to $74,999 | 4,549 (14.8%) | 1,017 (22.3%) |
| $75,000 to $99,999 | 4,066 (13.2%) | 695 (15.2%) |
| $100,000 to $149,999 | 6,714 (21.8%) | 436 (9.6%) |
| $150,000 or more | 9,822 (31.9%) | 270 (5.9%) |
| Total | 30,754 (100.0%) | 4,567 (100.0%) |
Monthly Housing Cost Tiers in Geauga County
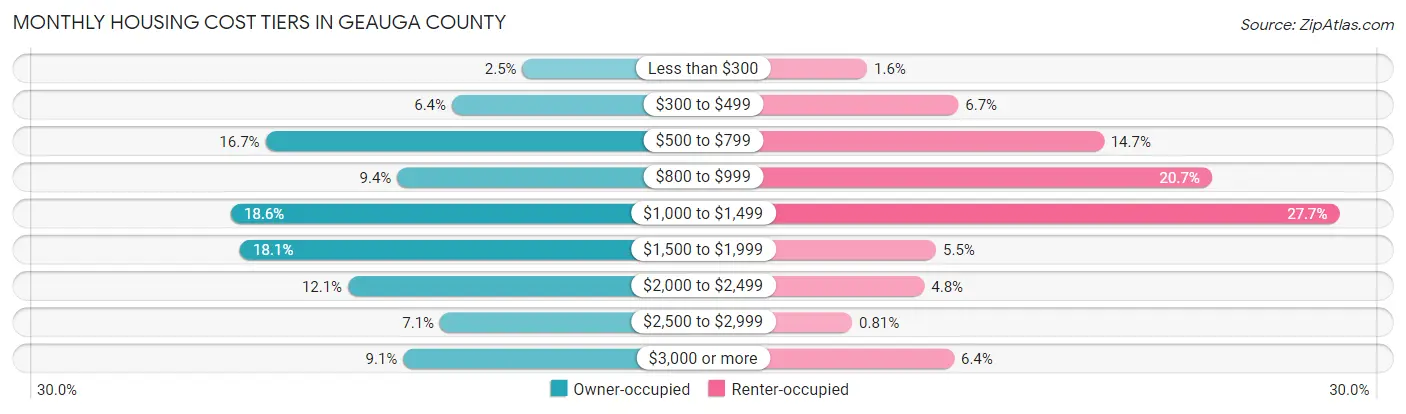
| Monthly Cost | Owner-occupied | Renter-occupied |
| Less than $300 | 769 (2.5%) | 75 (1.6%) |
| $300 to $499 | 1,969 (6.4%) | 305 (6.7%) |
| $500 to $799 | 5,135 (16.7%) | 672 (14.7%) |
| $800 to $999 | 2,896 (9.4%) | 944 (20.7%) |
| $1,000 to $1,499 | 5,720 (18.6%) | 1,266 (27.7%) |
| $1,500 to $1,999 | 5,565 (18.1%) | 249 (5.4%) |
| $2,000 to $2,499 | 3,734 (12.1%) | 219 (4.8%) |
| $2,500 to $2,999 | 2,170 (7.1%) | 37 (0.8%) |
| $3,000 or more | 2,796 (9.1%) | 294 (6.4%) |
| Total | 30,754 (100.0%) | 4,567 (100.0%) |
Physical Housing Characteristics in Geauga County
Housing Structures in Geauga County
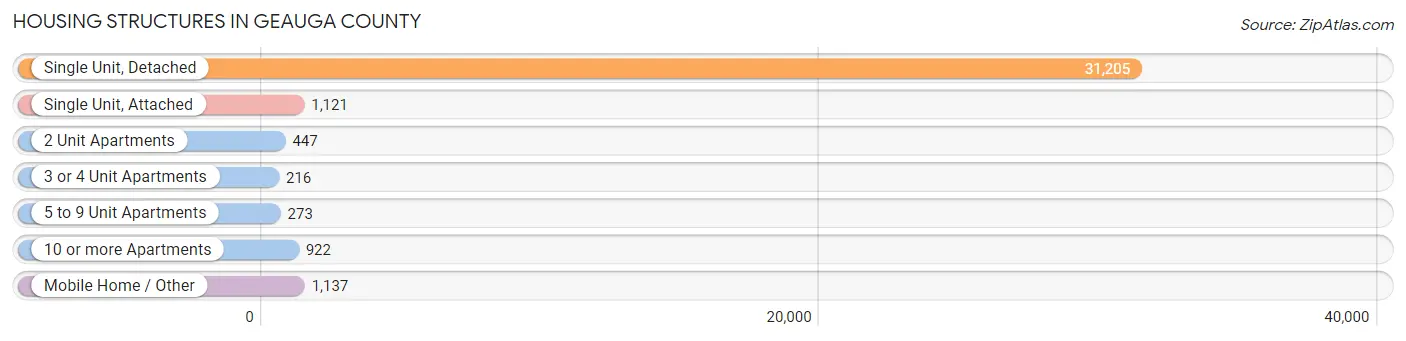
| Structure Type | # Housing Units | % Housing Units |
| Single Unit, Detached | 31,205 | 88.3% |
| Single Unit, Attached | 1,121 | 3.2% |
| 2 Unit Apartments | 447 | 1.3% |
| 3 or 4 Unit Apartments | 216 | 0.6% |
| 5 to 9 Unit Apartments | 273 | 0.8% |
| 10 or more Apartments | 922 | 2.6% |
| Mobile Home / Other | 1,137 | 3.2% |
| Total | 35,321 | 100.0% |
Housing Structures by Occupancy in Geauga County
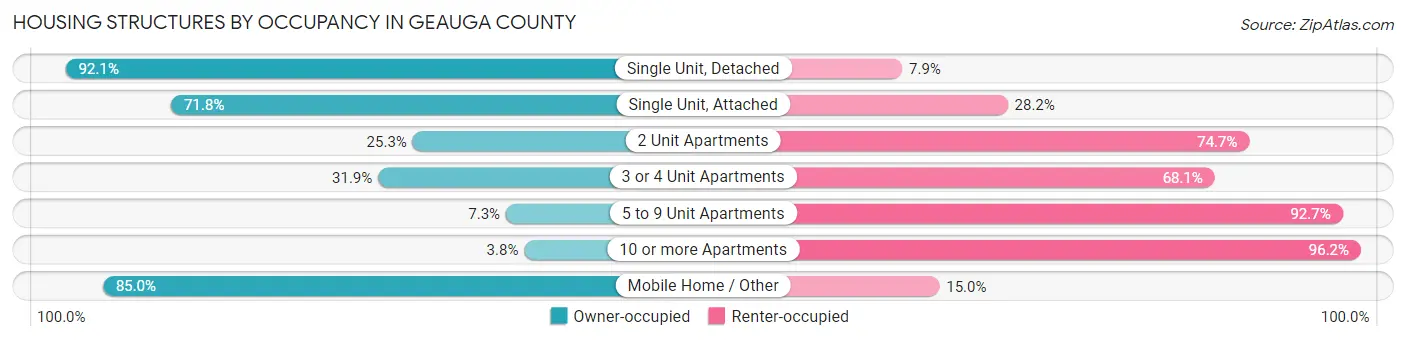
| Structure Type | Owner-occupied | Renter-occupied |
| Single Unit, Detached | 28,746 (92.1%) | 2,459 (7.9%) |
| Single Unit, Attached | 805 (71.8%) | 316 (28.2%) |
| 2 Unit Apartments | 113 (25.3%) | 334 (74.7%) |
| 3 or 4 Unit Apartments | 69 (31.9%) | 147 (68.1%) |
| 5 to 9 Unit Apartments | 20 (7.3%) | 253 (92.7%) |
| 10 or more Apartments | 35 (3.8%) | 887 (96.2%) |
| Mobile Home / Other | 966 (85.0%) | 171 (15.0%) |
| Total | 30,754 (87.1%) | 4,567 (12.9%) |
Housing Structures by Number of Rooms in Geauga County
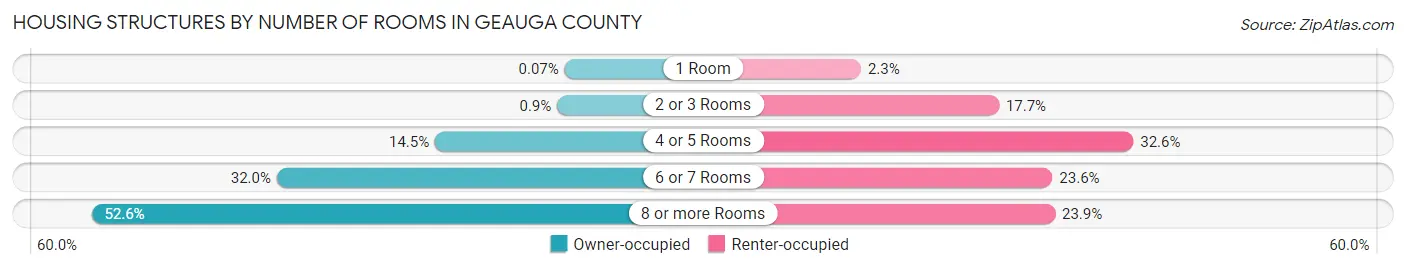
| Number of Rooms | Owner-occupied | Renter-occupied |
| 1 Room | 20 (0.1%) | 107 (2.3%) |
| 2 or 3 Rooms | 277 (0.9%) | 806 (17.6%) |
| 4 or 5 Rooms | 4,444 (14.4%) | 1,487 (32.6%) |
| 6 or 7 Rooms | 9,843 (32.0%) | 1,077 (23.6%) |
| 8 or more Rooms | 16,170 (52.6%) | 1,090 (23.9%) |
| Total | 30,754 (100.0%) | 4,567 (100.0%) |
Housing Structure by Heating Type in Geauga County
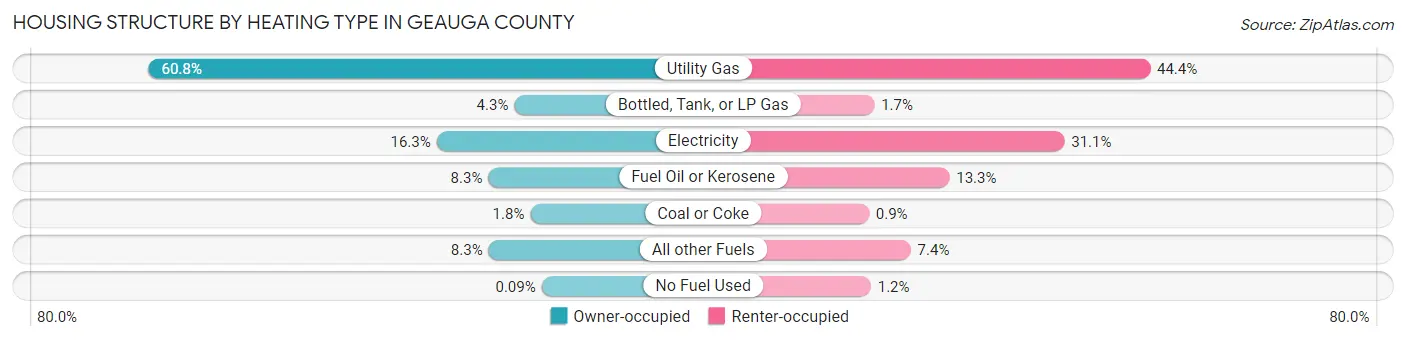
| Heating Type | Owner-occupied | Renter-occupied |
| Utility Gas | 18,708 (60.8%) | 2,026 (44.4%) |
| Bottled, Tank, or LP Gas | 1,325 (4.3%) | 79 (1.7%) |
| Electricity | 5,020 (16.3%) | 1,421 (31.1%) |
| Fuel Oil or Kerosene | 2,561 (8.3%) | 609 (13.3%) |
| Coal or Coke | 562 (1.8%) | 41 (0.9%) |
| All other Fuels | 2,550 (8.3%) | 336 (7.4%) |
| No Fuel Used | 28 (0.1%) | 55 (1.2%) |
| Total | 30,754 (100.0%) | 4,567 (100.0%) |
Household Vehicle Usage in Geauga County
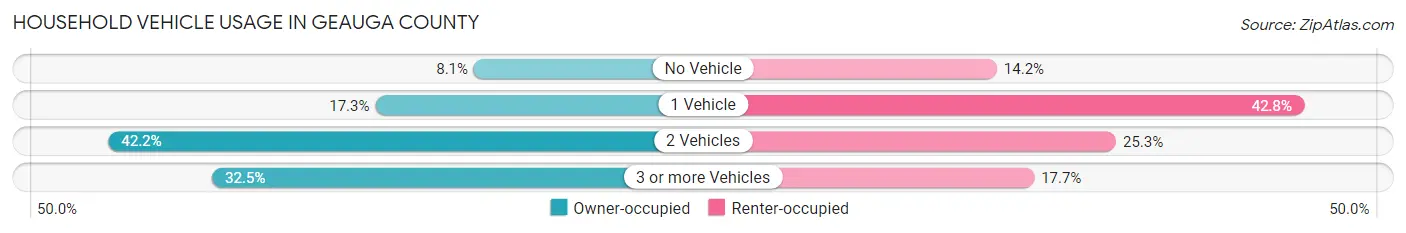
| Vehicles per Household | Owner-occupied | Renter-occupied |
| No Vehicle | 2,479 (8.1%) | 648 (14.2%) |
| 1 Vehicle | 5,307 (17.3%) | 1,956 (42.8%) |
| 2 Vehicles | 12,973 (42.2%) | 1,156 (25.3%) |
| 3 or more Vehicles | 9,995 (32.5%) | 807 (17.7%) |
| Total | 30,754 (100.0%) | 4,567 (100.0%) |
Real Estate & Mortgages in Geauga County
Real Estate and Mortgage Overview in Geauga County
| Characteristic | Without Mortgage | With Mortgage |
| Housing Units | 11,175 | 19,579 |
| Median Property Value | $269,000 | $296,700 |
| Median Household Income | $78,336 | $7,471 |
| Monthly Housing Costs | $699 | $2,726 |
| Real Estate Taxes | $4,069 | $115 |
Property Value by Mortgage Status in Geauga County
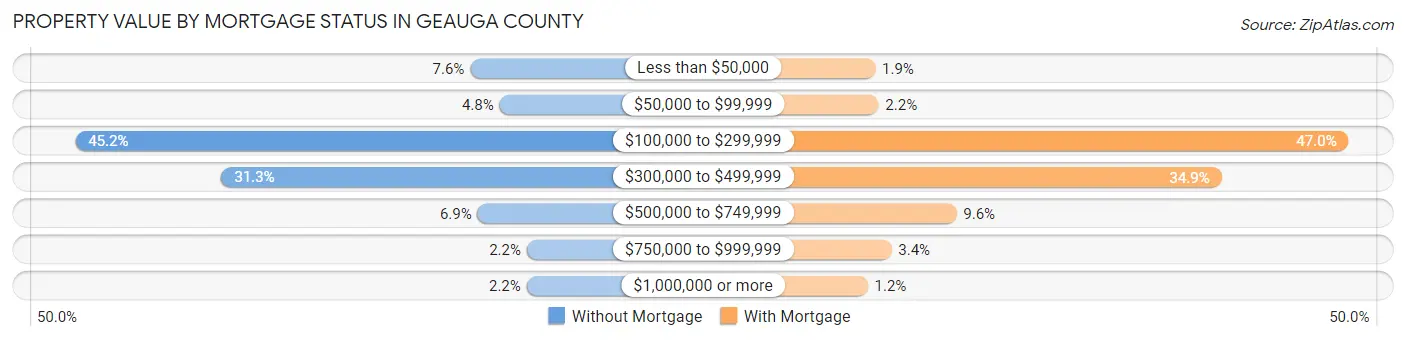
| Property Value | Without Mortgage | With Mortgage |
| Less than $50,000 | 845 (7.6%) | 364 (1.9%) |
| $50,000 to $99,999 | 533 (4.8%) | 426 (2.2%) |
| $100,000 to $299,999 | 5,049 (45.2%) | 9,193 (46.9%) |
| $300,000 to $499,999 | 3,493 (31.3%) | 6,825 (34.9%) |
| $500,000 to $749,999 | 767 (6.9%) | 1,879 (9.6%) |
| $750,000 to $999,999 | 243 (2.2%) | 667 (3.4%) |
| $1,000,000 or more | 245 (2.2%) | 225 (1.1%) |
| Total | 11,175 (100.0%) | 19,579 (100.0%) |
Household Income by Mortgage Status in Geauga County
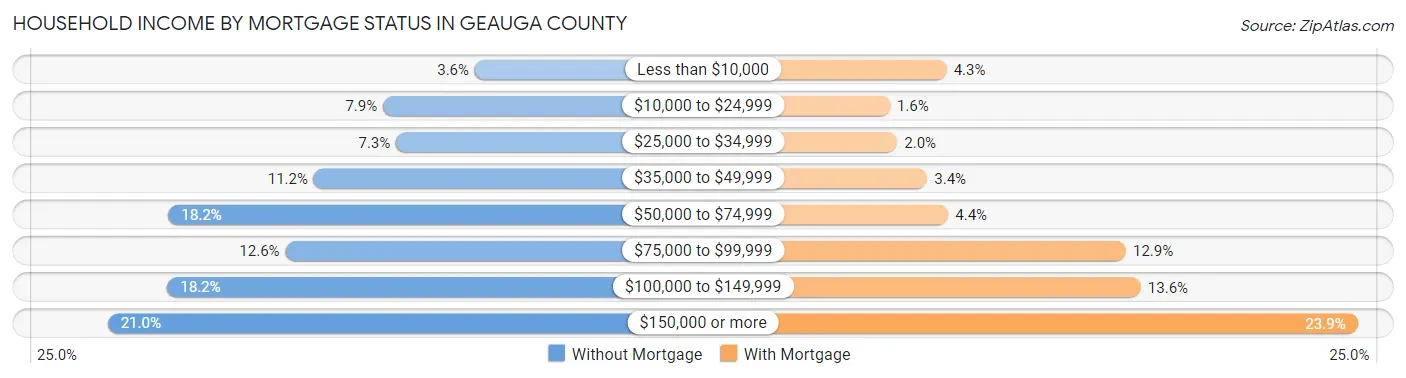
| Household Income | Without Mortgage | With Mortgage |
| Less than $10,000 | 398 (3.6%) | 849 (4.3%) |
| $10,000 to $24,999 | 886 (7.9%) | 321 (1.6%) |
| $25,000 to $34,999 | 817 (7.3%) | 390 (2.0%) |
| $35,000 to $49,999 | 1,255 (11.2%) | 670 (3.4%) |
| $50,000 to $74,999 | 2,028 (18.1%) | 866 (4.4%) |
| $75,000 to $99,999 | 1,406 (12.6%) | 2,521 (12.9%) |
| $100,000 to $149,999 | 2,034 (18.2%) | 2,660 (13.6%) |
| $150,000 or more | 2,351 (21.0%) | 4,680 (23.9%) |
| Total | 11,175 (100.0%) | 19,579 (100.0%) |
Property Value to Household Income Ratio in Geauga County
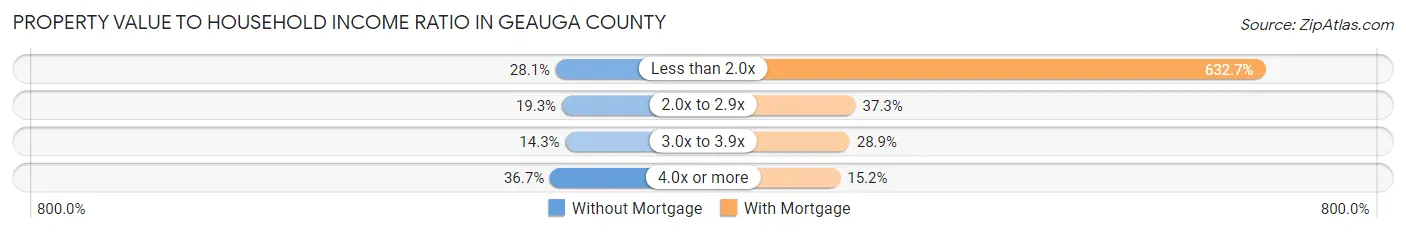
| Value-to-Income Ratio | Without Mortgage | With Mortgage |
| Less than 2.0x | 3,135 (28.1%) | 123,879 (632.7%) |
| 2.0x to 2.9x | 2,153 (19.3%) | 7,301 (37.3%) |
| 3.0x to 3.9x | 1,593 (14.3%) | 5,664 (28.9%) |
| 4.0x or more | 4,097 (36.7%) | 2,975 (15.2%) |
| Total | 11,175 (100.0%) | 19,579 (100.0%) |
Real Estate Taxes by Mortgage Status in Geauga County
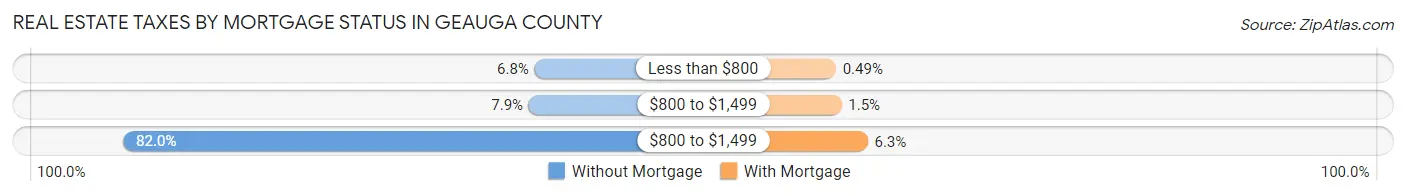
| Property Taxes | Without Mortgage | With Mortgage |
| Less than $800 | 764 (6.8%) | 95 (0.5%) |
| $800 to $1,499 | 882 (7.9%) | 295 (1.5%) |
| $800 to $1,499 | 9,164 (82.0%) | 1,234 (6.3%) |
| Total | 11,175 (100.0%) | 19,579 (100.0%) |
Health & Disability in Geauga County
Health Insurance Coverage by Age in Geauga County
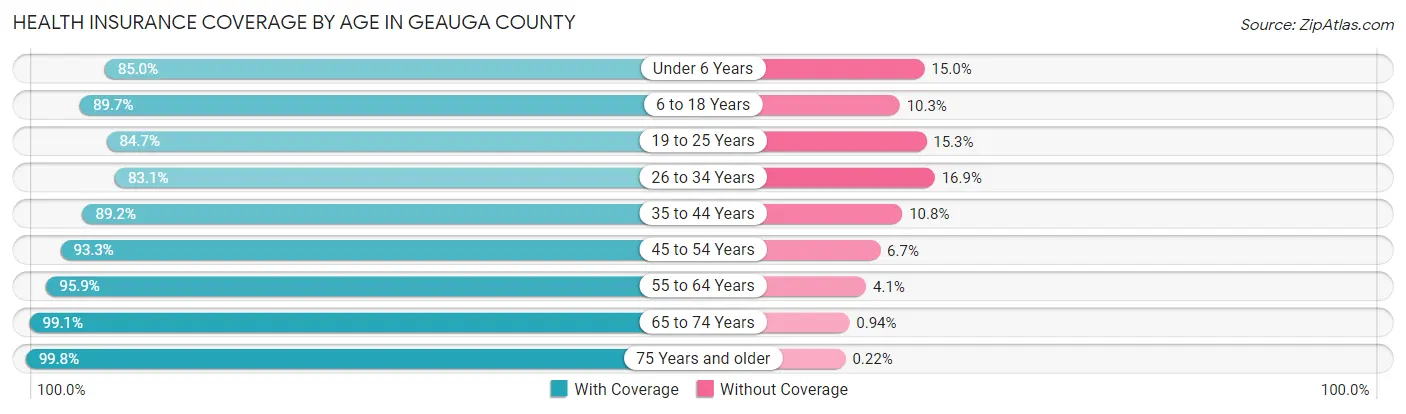
| Age Bracket | With Coverage | Without Coverage |
| Under 6 Years | 4,997 (85.0%) | 880 (15.0%) |
| 6 to 18 Years | 15,085 (89.7%) | 1,737 (10.3%) |
| 19 to 25 Years | 6,255 (84.7%) | 1,129 (15.3%) |
| 26 to 34 Years | 6,512 (83.1%) | 1,321 (16.9%) |
| 35 to 44 Years | 8,907 (89.2%) | 1,080 (10.8%) |
| 45 to 54 Years | 11,667 (93.3%) | 836 (6.7%) |
| 55 to 64 Years | 13,914 (95.9%) | 590 (4.1%) |
| 65 to 74 Years | 11,317 (99.1%) | 107 (0.9%) |
| 75 Years and older | 8,300 (99.8%) | 18 (0.2%) |
| Total | 86,954 (91.9%) | 7,698 (8.1%) |
Health Insurance Coverage by Citizenship Status in Geauga County
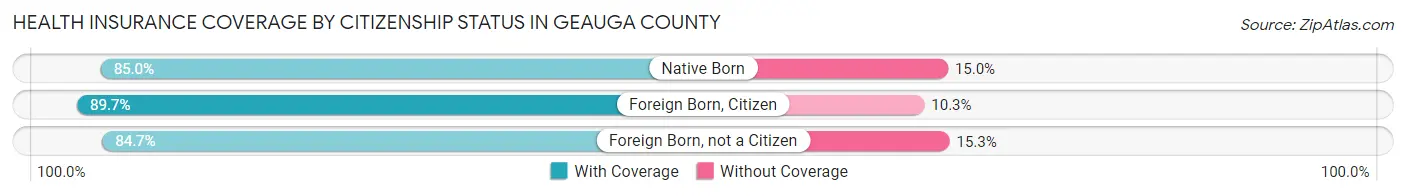
| Citizenship Status | With Coverage | Without Coverage |
| Native Born | 4,997 (85.0%) | 880 (15.0%) |
| Foreign Born, Citizen | 15,085 (89.7%) | 1,737 (10.3%) |
| Foreign Born, not a Citizen | 6,255 (84.7%) | 1,129 (15.3%) |
Health Insurance Coverage by Household Income in Geauga County
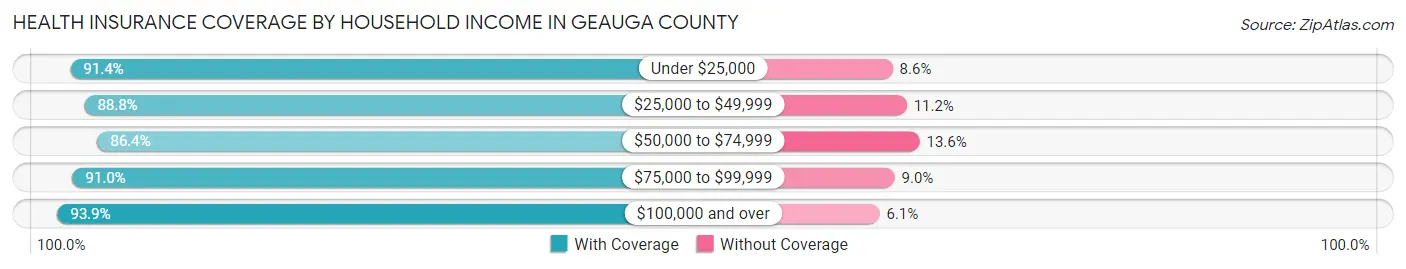
| Household Income | With Coverage | Without Coverage |
| Under $25,000 | 4,109 (91.4%) | 386 (8.6%) |
| $25,000 to $49,999 | 8,215 (88.8%) | 1,038 (11.2%) |
| $50,000 to $74,999 | 10,991 (86.4%) | 1,735 (13.6%) |
| $75,000 to $99,999 | 11,500 (91.0%) | 1,132 (9.0%) |
| $100,000 and over | 51,854 (93.9%) | 3,388 (6.1%) |
Public vs Private Health Insurance Coverage by Age in Geauga County

| Age Bracket | Public Insurance | Private Insurance |
| Under 6 | 1,070 (18.2%) | 3,993 (67.9%) |
| 6 to 18 Years | 2,297 (13.7%) | 13,123 (78.0%) |
| 19 to 25 Years | 862 (11.7%) | 5,476 (74.2%) |
| 25 to 34 Years | 990 (12.6%) | 5,620 (71.8%) |
| 35 to 44 Years | 710 (7.1%) | 8,405 (84.2%) |
| 45 to 54 Years | 754 (6.0%) | 11,189 (89.5%) |
| 55 to 64 Years | 1,827 (12.6%) | 12,468 (86.0%) |
| 65 to 74 Years | 10,704 (93.7%) | 7,203 (63.0%) |
| 75 Years and over | 8,173 (98.3%) | 5,234 (62.9%) |
| Total | 27,387 (28.9%) | 72,711 (76.8%) |
Disability Status by Sex by Age in Geauga County
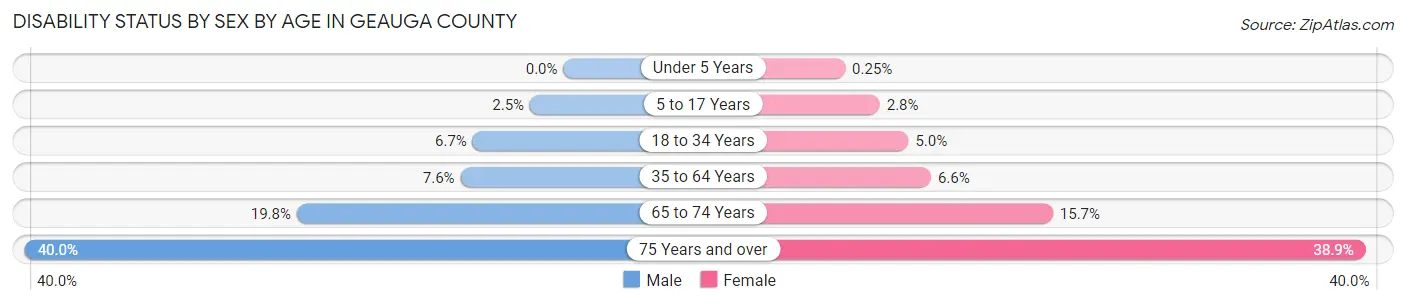
| Age Bracket | Male | Female |
| Under 5 Years | 0 (0.0%) | 6 (0.3%) |
| 5 to 17 Years | 209 (2.5%) | 225 (2.8%) |
| 18 to 34 Years | 580 (6.7%) | 391 (5.0%) |
| 35 to 64 Years | 1,424 (7.6%) | 1,216 (6.6%) |
| 65 to 74 Years | 1,129 (19.8%) | 896 (15.7%) |
| 75 Years and over | 1,453 (40.0%) | 1,822 (38.9%) |
Disability Class by Sex by Age in Geauga County
Disability Class: Hearing Difficulty
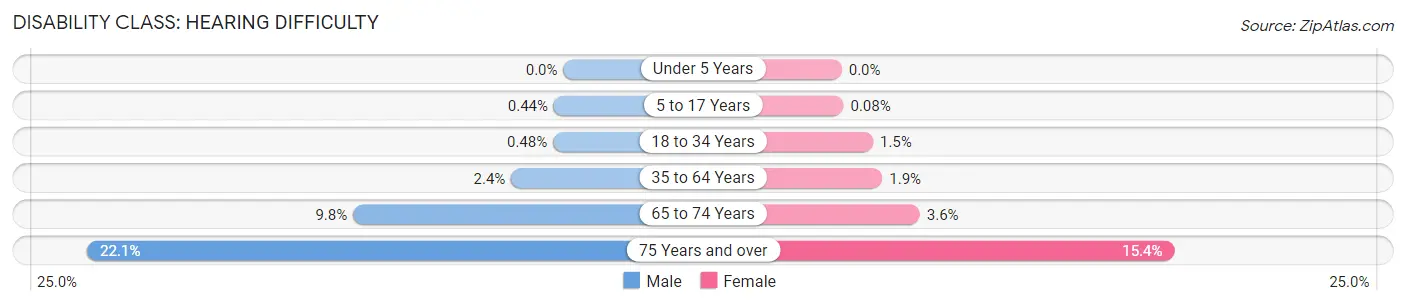
| Age Bracket | Male | Female |
| Under 5 Years | 0 (0.0%) | 0 (0.0%) |
| 5 to 17 Years | 37 (0.4%) | 6 (0.1%) |
| 18 to 34 Years | 41 (0.5%) | 115 (1.5%) |
| 35 to 64 Years | 450 (2.4%) | 346 (1.9%) |
| 65 to 74 Years | 557 (9.8%) | 207 (3.6%) |
| 75 Years and over | 803 (22.1%) | 723 (15.4%) |
Disability Class: Vision Difficulty

| Age Bracket | Male | Female |
| Under 5 Years | 0 (0.0%) | 6 (0.3%) |
| 5 to 17 Years | 0 (0.0%) | 27 (0.3%) |
| 18 to 34 Years | 120 (1.4%) | 120 (1.5%) |
| 35 to 64 Years | 167 (0.9%) | 282 (1.5%) |
| 65 to 74 Years | 73 (1.3%) | 80 (1.4%) |
| 75 Years and over | 254 (7.0%) | 470 (10.0%) |
Disability Class: Cognitive Difficulty
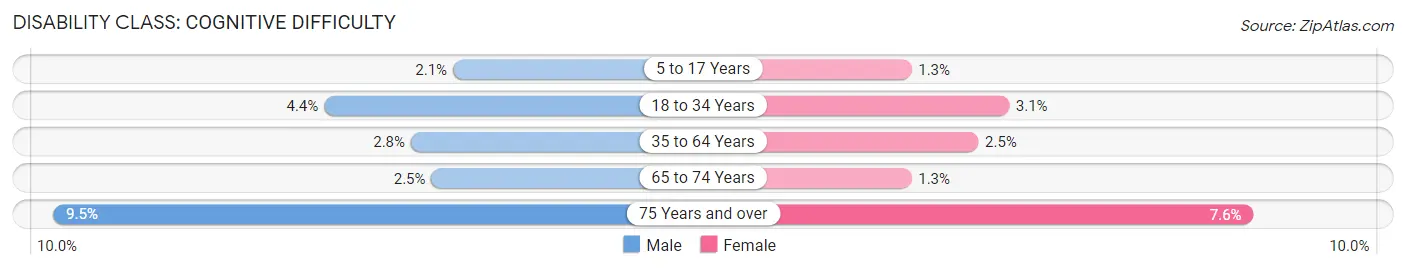
| Age Bracket | Male | Female |
| 5 to 17 Years | 173 (2.1%) | 103 (1.3%) |
| 18 to 34 Years | 383 (4.4%) | 245 (3.1%) |
| 35 to 64 Years | 528 (2.8%) | 465 (2.5%) |
| 65 to 74 Years | 140 (2.5%) | 74 (1.3%) |
| 75 Years and over | 344 (9.5%) | 358 (7.6%) |
Disability Class: Ambulatory Difficulty
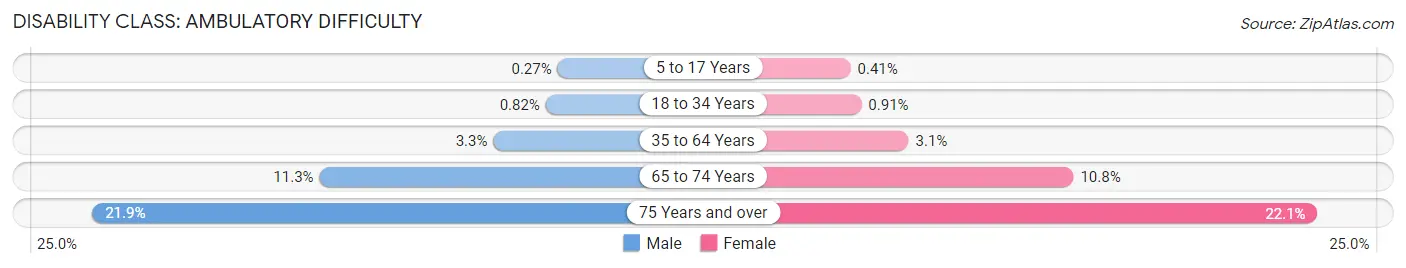
| Age Bracket | Male | Female |
| 5 to 17 Years | 23 (0.3%) | 33 (0.4%) |
| 18 to 34 Years | 71 (0.8%) | 72 (0.9%) |
| 35 to 64 Years | 606 (3.3%) | 569 (3.1%) |
| 65 to 74 Years | 646 (11.3%) | 615 (10.7%) |
| 75 Years and over | 794 (21.9%) | 1,034 (22.1%) |
Disability Class: Self-Care Difficulty
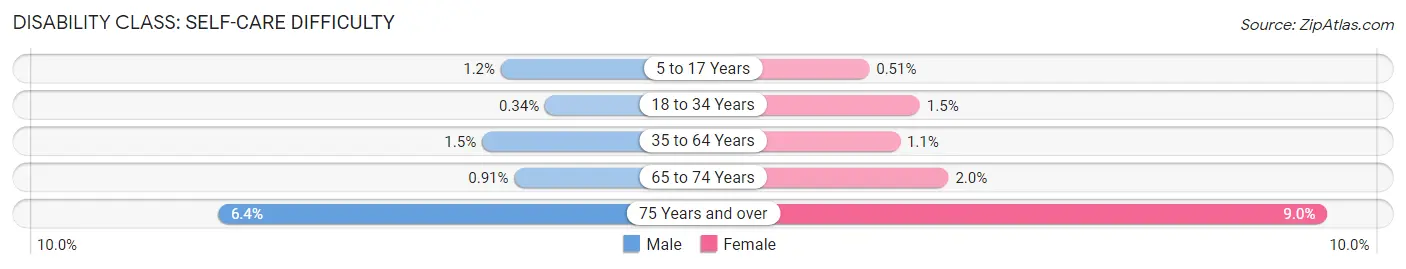
| Age Bracket | Male | Female |
| 5 to 17 Years | 98 (1.2%) | 41 (0.5%) |
| 18 to 34 Years | 29 (0.3%) | 115 (1.5%) |
| 35 to 64 Years | 281 (1.5%) | 199 (1.1%) |
| 65 to 74 Years | 52 (0.9%) | 113 (2.0%) |
| 75 Years and over | 233 (6.4%) | 422 (9.0%) |
Technology Access in Geauga County
Computing Device Access in Geauga County
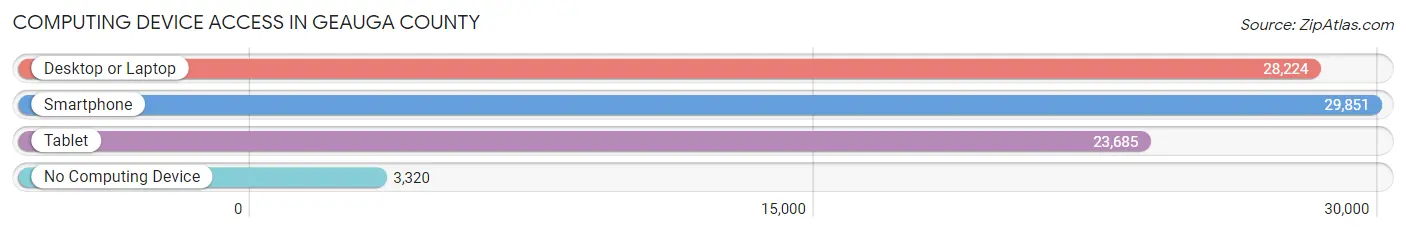
| Device Type | # Households | % Households |
| Desktop or Laptop | 28,224 | 79.9% |
| Smartphone | 29,851 | 84.5% |
| Tablet | 23,685 | 67.1% |
| No Computing Device | 3,320 | 9.4% |
| Total | 35,321 | 100.0% |
Internet Access in Geauga County
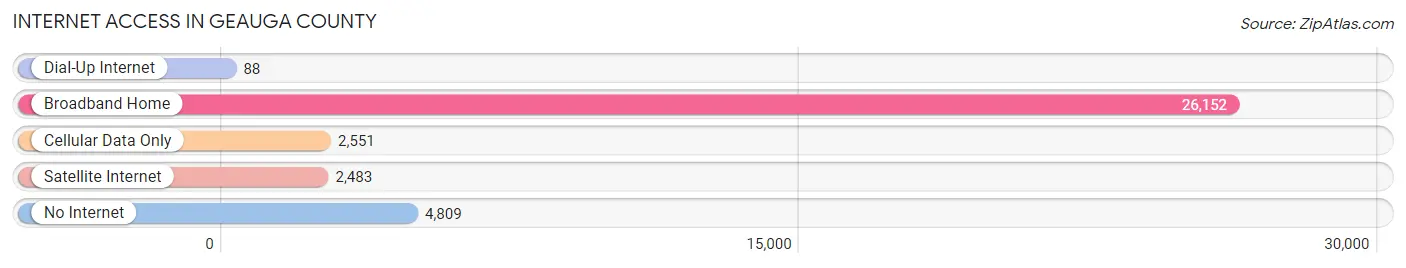
| Internet Type | # Households | % Households |
| Dial-Up Internet | 88 | 0.3% |
| Broadband Home | 26,152 | 74.0% |
| Cellular Data Only | 2,551 | 7.2% |
| Satellite Internet | 2,483 | 7.0% |
| No Internet | 4,809 | 13.6% |
| Total | 35,321 | 100.0% |
Geauga County Summary
Geauga County, Ohio is located in the northeastern part of the state and is part of the Cleveland-Akron-Canton metropolitan area. It is bordered by Lake County to the north, Ashtabula County to the east, Portage County to the south, and Cuyahoga County to the west. Geauga County is home to a population of approximately 93,389 people, according to the 2019 U.S. Census.
Geography
Geauga County is located in the Appalachian Plateau region of Ohio and is part of the Allegheny Plateau. The county is composed of rolling hills and valleys, with the highest point being 1,280 feet above sea level. The county is drained by the Grand River, which flows through the county from north to south. The county is also home to several lakes, including Punderson Lake, which is the largest lake in the county.
The county is home to several state parks, including Punderson State Park, which is located on the shores of Punderson Lake. The park offers camping, fishing, boating, and hiking opportunities. The county is also home to the Geauga Park District, which operates several parks and preserves throughout the county.
History
Geauga County was formed in 1806 from parts of Trumbull and Ashtabula counties. The county was named after a Native American word meaning “raccoon.” The county was originally home to several Native American tribes, including the Iroquois, Wyandot, and Delaware.
The first settlers in the county were Quakers, who arrived in the early 1800s. The county was largely agricultural, with the main crops being wheat, corn, and oats. The county was also home to several small industries, including sawmills, gristmills, and tanneries.
In the late 1800s, the county began to experience a population boom, as people moved to the area to take advantage of the abundant natural resources. The county was also home to several resorts, which attracted visitors from all over the country.
Economy
Geauga County is home to a diverse economy, with the largest industries being manufacturing, healthcare, and retail. The county is home to several large employers, including Nestle USA, which employs over 1,000 people in the county. Other major employers include the Cleveland Clinic, University Hospitals, and the Geauga County Board of Education.
The county is also home to several small businesses, including wineries, breweries, and restaurants. The county is also home to several tourist attractions, including the Geauga County Historical Society Museum and the Geauga County Fairgrounds.
Demographics
Geauga County is home to a population of approximately 93,389 people, according to the 2019 U.S. Census. The population is predominantly white (90.2%), with the remaining population being made up of African Americans (3.2%), Asians (2.2%), and other races (4.4%). The median household income in the county is $68,945, and the median home value is $219,400.
Geauga County is home to several higher education institutions, including Kent State University Geauga Campus, Lakeland Community College, and the University of Akron Geauga Campus. The county is also home to several private schools, including the Geauga Academy and the Geauga Christian School.
Conclusion
Geauga County, Ohio is a rural county located in the northeastern part of the state. The county is home to a population of approximately 93,389 people, and is home to a diverse economy. The county is home to several state parks, tourist attractions, and higher education institutions. Geauga County is a great place to live, work, and play.
Common Questions
What is the Total Population of Geauga County?
Total Population of Geauga County is 95,455.
What is the Total Male Population of Geauga County?
Total Male Population of Geauga County is 47,836.
What is the Total Female Population of Geauga County?
Total Female Population of Geauga County is 47,619.
What is the Ratio of Males per 100 Females in Geauga County?
There are 100.46 Males per 100 Females in Geauga County.
What is the Ratio of Females per 100 Males in Geauga County?
There are 99.55 Females per 100 Males in Geauga County.
What is the Median Population Age in Geauga County?
Median Population Age in Geauga County is 44.6 Years.
What is the Average Family Size in Geauga County
Average Family Size in Geauga County is 3.1 People.
What is the Average Household Size in Geauga County
Average Household Size in Geauga County is 2.7 People.
What is Per Capita Income in Geauga County?
Per Capita income in Geauga County is $48,582.
What is the Median Family Income in Geauga County?
Median Family Income in Geauga County is $116,764.
What is the Median Household income in Geauga County?
Median Household Income in Geauga County is $97,162.
What is Income or Wage Gap in Geauga County?
Income or Wage Gap in Geauga County is 41.3%.
Women in Geauga County earn 58.7 cents for every dollar earned by a man.
What is Family Income Deficit in Geauga County?
Family Income Deficit in Geauga County is $10,170.
Families that are below poverty line in Geauga County earn $10,170 less on average than the poverty threshold level.
What is Inequality or Gini Index in Geauga County?
Inequality or Gini Index in Geauga County is 0.45.
How Large is the Labor Force in Geauga County?
There are 49,651 People in the Labor Forcein in Geauga County.
What is the Percentage of People in the Labor Force in Geauga County?
64.5% of People are in the Labor Force in Geauga County.
What is the Unemployment Rate in Geauga County?
Unemployment Rate in Geauga County is 3.1%.