Fulton County, OH
Fulton County Map

Fulton County Overview
42,602
TOTAL POPULATION
21,385
MALE POPULATION
21,217
FEMALE POPULATION
100.79
MALES / 100 FEMALES
99.21
FEMALES / 100 MALES
41.4
MEDIAN AGE
3.0
AVG FAMILY SIZE
2.5
AVG HOUSEHOLD SIZE
$35,230
PER CAPITA INCOME
$83,935
AVG FAMILY INCOME
$71,453
AVG HOUSEHOLD INCOME
41.9%
WAGE / INCOME GAP [ % ]
58.1¢/ $1
WAGE / INCOME GAP [ $ ]
$10,359
FAMILY INCOME DEFICIT
0.41
INEQUALITY / GINI INDEX
21,362
LABOR FORCE [ PEOPLE ]
63.2%
PERCENT IN LABOR FORCE
3.5%
UNEMPLOYMENT RATE
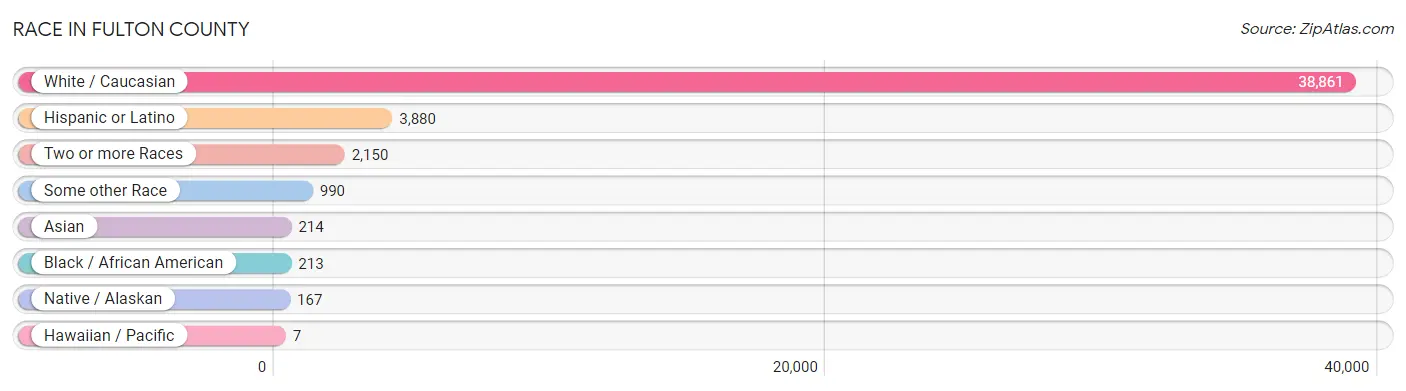
Race in Fulton County
The most populous races in Fulton County are White / Caucasian (38,861 | 91.2%), Hispanic or Latino (3,880 | 9.1%), and Two or more Races (2,150 | 5.1%).
| Race | # Population | % Population |
| Asian | 214 | 0.5% |
| Black / African American | 213 | 0.5% |
| Hawaiian / Pacific | 7 | 0.0% |
| Hispanic or Latino | 3,880 | 9.1% |
| Native / Alaskan | 167 | 0.4% |
| White / Caucasian | 38,861 | 91.2% |
| Two or more Races | 2,150 | 5.1% |
| Some other Race | 990 | 2.3% |
| Total | 42,602 | 100.0% |
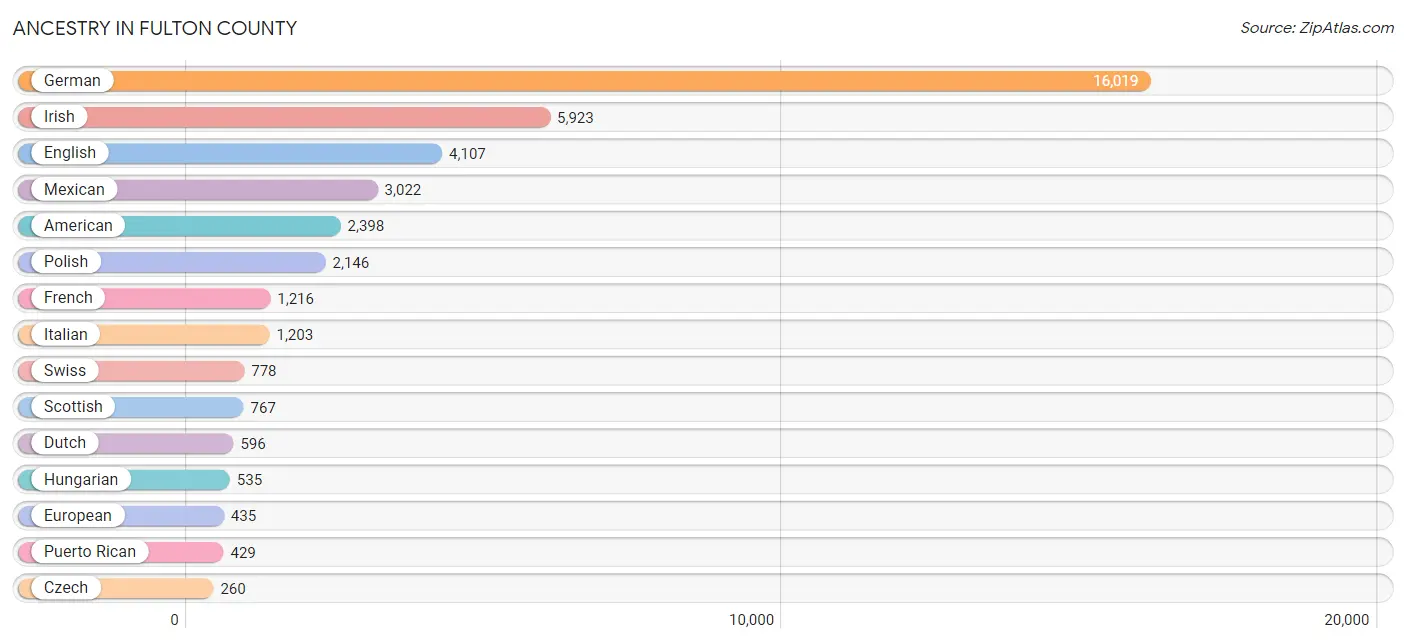
Ancestry in Fulton County
The most populous ancestries reported in Fulton County are German (16,019 | 37.6%), Irish (5,923 | 13.9%), English (4,107 | 9.6%), Mexican (3,022 | 7.1%), and American (2,398 | 5.6%), together accounting for 73.9% of all Fulton County residents.
| Ancestry | # Population | % Population |
| African | 23 | 0.1% |
| Alsatian | 10 | 0.0% |
| American | 2,398 | 5.6% |
| Apache | 6 | 0.0% |
| Arab | 74 | 0.2% |
| Armenian | 9 | 0.0% |
| Austrian | 169 | 0.4% |
| Bangladeshi | 5 | 0.0% |
| Belgian | 109 | 0.3% |
| Bhutanese | 6 | 0.0% |
| Blackfeet | 22 | 0.1% |
| British | 206 | 0.5% |
| Bulgarian | 8 | 0.0% |
| Burmese | 18 | 0.0% |
| Canadian | 53 | 0.1% |
| Celtic | 5 | 0.0% |
| Central American | 72 | 0.2% |
| Central American Indian | 2 | 0.0% |
| Cherokee | 112 | 0.3% |
| Chippewa | 95 | 0.2% |
| Colombian | 25 | 0.1% |
| Croatian | 19 | 0.0% |
| Cuban | 43 | 0.1% |
| Czech | 260 | 0.6% |
| Czechoslovakian | 65 | 0.2% |
| Danish | 19 | 0.0% |
| Dutch | 596 | 1.4% |
| Eastern European | 233 | 0.5% |
| English | 4,107 | 9.6% |
| Estonian | 12 | 0.0% |
| European | 435 | 1.0% |
| Finnish | 12 | 0.0% |
| French | 1,216 | 2.9% |
| French American Indian | 17 | 0.0% |
| French Canadian | 171 | 0.4% |
| German | 16,019 | 37.6% |
| Greek | 155 | 0.4% |
| Guatemalan | 2 | 0.0% |
| Haitian | 1 | 0.0% |
| Honduran | 27 | 0.1% |
| Hungarian | 535 | 1.3% |
| Indian (Asian) | 122 | 0.3% |
| Irish | 5,923 | 13.9% |
| Iroquois | 11 | 0.0% |
| Italian | 1,203 | 2.8% |
| Jamaican | 8 | 0.0% |
| Korean | 136 | 0.3% |
| Lebanese | 44 | 0.1% |
| Luxembourger | 13 | 0.0% |
| Macedonian | 8 | 0.0% |
| Malaysian | 18 | 0.0% |
| Mexican | 3,022 | 7.1% |
| Mexican American Indian | 7 | 0.0% |
| Northern European | 8 | 0.0% |
| Norwegian | 83 | 0.2% |
| Panamanian | 43 | 0.1% |
| Pennsylvania German | 153 | 0.4% |
| Polish | 2,146 | 5.0% |
| Portuguese | 6 | 0.0% |
| Potawatomi | 9 | 0.0% |
| Puerto Rican | 429 | 1.0% |
| Romanian | 61 | 0.1% |
| Russian | 79 | 0.2% |
| Samoan | 7 | 0.0% |
| Scandinavian | 32 | 0.1% |
| Scotch-Irish | 222 | 0.5% |
| Scottish | 767 | 1.8% |
| Slavic | 2 | 0.0% |
| Slovak | 148 | 0.4% |
| Slovene | 11 | 0.0% |
| South American | 53 | 0.1% |
| Spaniard | 17 | 0.0% |
| Spanish | 97 | 0.2% |
| Subsaharan African | 23 | 0.1% |
| Swedish | 183 | 0.4% |
| Swiss | 778 | 1.8% |
| Ukrainian | 28 | 0.1% |
| Uruguayan | 28 | 0.1% |
| Welsh | 256 | 0.6% |
| Yugoslavian | 24 | 0.1% | View All 80 Rows |
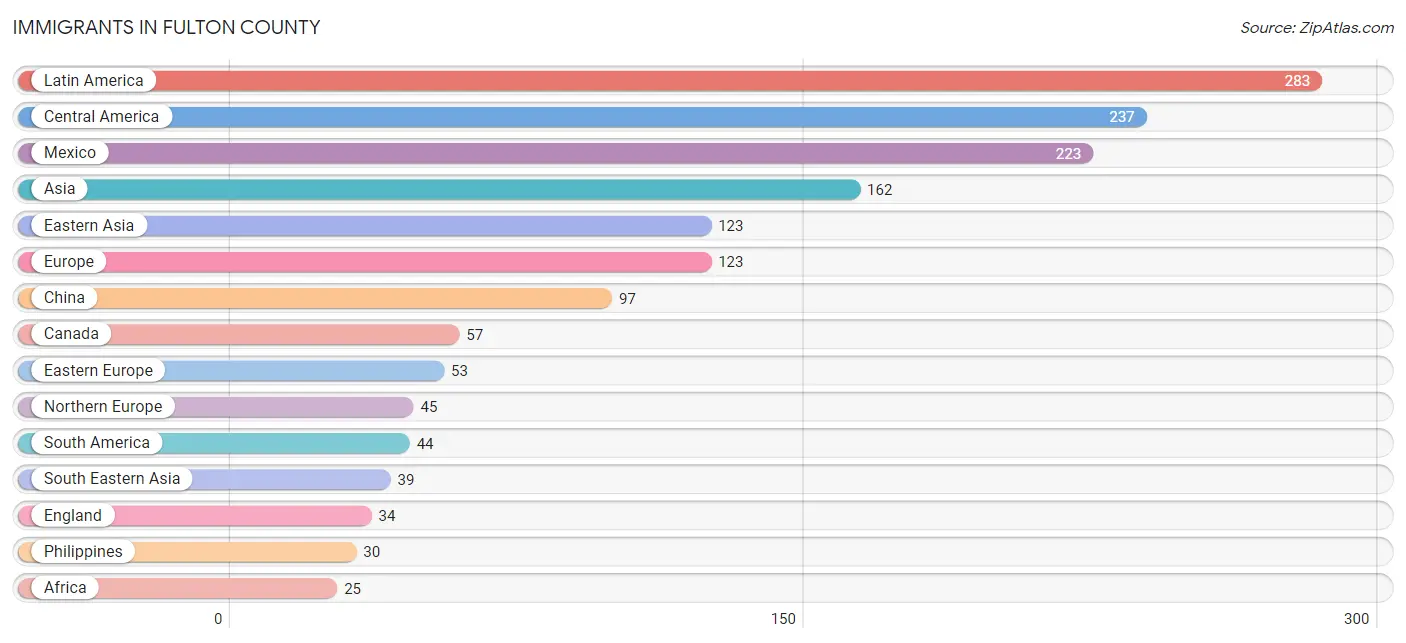
Immigrants in Fulton County
The most numerous immigrant groups reported in Fulton County came from Latin America (283 | 0.7%), Central America (237 | 0.6%), Mexico (223 | 0.5%), Asia (162 | 0.4%), and Eastern Asia (123 | 0.3%), together accounting for 2.4% of all Fulton County residents.
| Immigration Origin | # Population | % Population |
| Africa | 25 | 0.1% |
| Asia | 162 | 0.4% |
| Canada | 57 | 0.1% |
| Caribbean | 2 | 0.0% |
| Central America | 237 | 0.6% |
| China | 97 | 0.2% |
| Colombia | 21 | 0.1% |
| Costa Rica | 12 | 0.0% |
| Eastern Africa | 3 | 0.0% |
| Eastern Asia | 123 | 0.3% |
| Eastern Europe | 53 | 0.1% |
| England | 34 | 0.1% |
| Europe | 123 | 0.3% |
| Germany | 25 | 0.1% |
| Guatemala | 2 | 0.0% |
| Haiti | 1 | 0.0% |
| Hong Kong | 3 | 0.0% |
| Jamaica | 1 | 0.0% |
| Japan | 8 | 0.0% |
| Korea | 9 | 0.0% |
| Latin America | 283 | 0.7% |
| Mexico | 223 | 0.5% |
| Middle Africa | 22 | 0.1% |
| Northern Europe | 45 | 0.1% |
| Philippines | 30 | 0.1% |
| Russia | 18 | 0.0% |
| South America | 44 | 0.1% |
| South Eastern Asia | 39 | 0.1% |
| Taiwan | 23 | 0.1% |
| Uganda | 3 | 0.0% |
| Ukraine | 24 | 0.1% |
| Uruguay | 15 | 0.0% |
| Vietnam | 9 | 0.0% |
| Western Europe | 25 | 0.1% |
| Zaire | 22 | 0.1% | View All 35 Rows |
Sex and Age in Fulton County
Sex and Age in Fulton County
The most populous age groups in Fulton County are 60 to 64 Years (1,668 | 7.8%) for men and 55 to 59 Years (1,545 | 7.3%) for women.

| Age Bracket | Male | Female |
| Under 5 Years | 1,295 (6.1%) | 1,121 (5.3%) |
| 5 to 9 Years | 1,514 (7.1%) | 1,298 (6.1%) |
| 10 to 14 Years | 1,500 (7.0%) | 1,405 (6.6%) |
| 15 to 19 Years | 1,459 (6.8%) | 1,375 (6.5%) |
| 20 to 24 Years | 1,283 (6.0%) | 1,140 (5.4%) |
| 25 to 29 Years | 1,219 (5.7%) | 1,145 (5.4%) |
| 30 to 34 Years | 1,127 (5.3%) | 1,111 (5.2%) |
| 35 to 39 Years | 1,235 (5.8%) | 1,276 (6.0%) |
| 40 to 44 Years | 1,334 (6.2%) | 1,414 (6.7%) |
| 45 to 49 Years | 1,304 (6.1%) | 1,185 (5.6%) |
| 50 to 54 Years | 1,437 (6.7%) | 1,371 (6.5%) |
| 55 to 59 Years | 1,431 (6.7%) | 1,545 (7.3%) |
| 60 to 64 Years | 1,668 (7.8%) | 1,529 (7.2%) |
| 65 to 69 Years | 1,421 (6.6%) | 1,302 (6.1%) |
| 70 to 74 Years | 865 (4.0%) | 1,151 (5.4%) |
| 75 to 79 Years | 517 (2.4%) | 740 (3.5%) |
| 80 to 84 Years | 422 (2.0%) | 544 (2.6%) |
| 85 Years and over | 354 (1.7%) | 565 (2.7%) |
| Total | 21,385 (100.0%) | 21,217 (100.0%) |
Families and Households in Fulton County
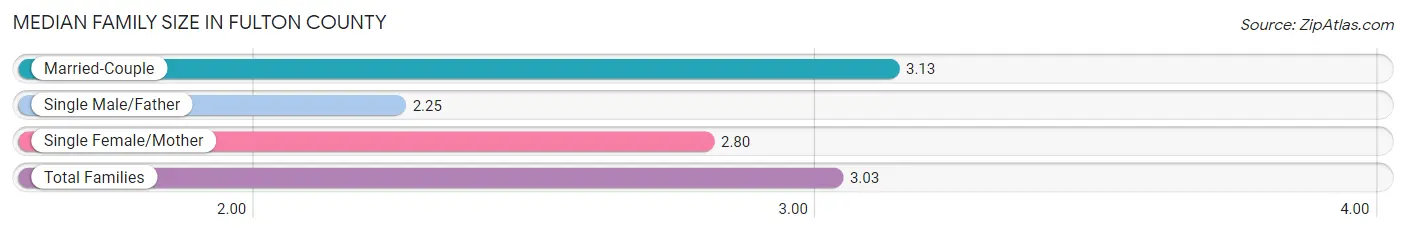
Median Family Size in Fulton County
The median family size in Fulton County is 3.03 persons per family, with married-couple families (9,285 | 80.3%) accounting for the largest median family size of 3.13 persons per family. On the other hand, single male/father families (786 | 6.8%) represent the smallest median family size with 2.25 persons per family.
| Family Type | # Families | Family Size |
| Married-Couple | 9,285 (80.3%) | 3.13 |
| Single Male/Father | 786 (6.8%) | 2.25 |
| Single Female/Mother | 1,487 (12.9%) | 2.80 |
| Total Families | 11,558 (100.0%) | 3.03 |
Median Household Size in Fulton County
The median household size in Fulton County is 2.50 persons per household, with married-couple households (9,285 | 55.0%) accounting for the largest median household size of 3.15 persons per household. non-family households (5,311 | 31.5%) represent the smallest median household size with 1.19 persons per household.
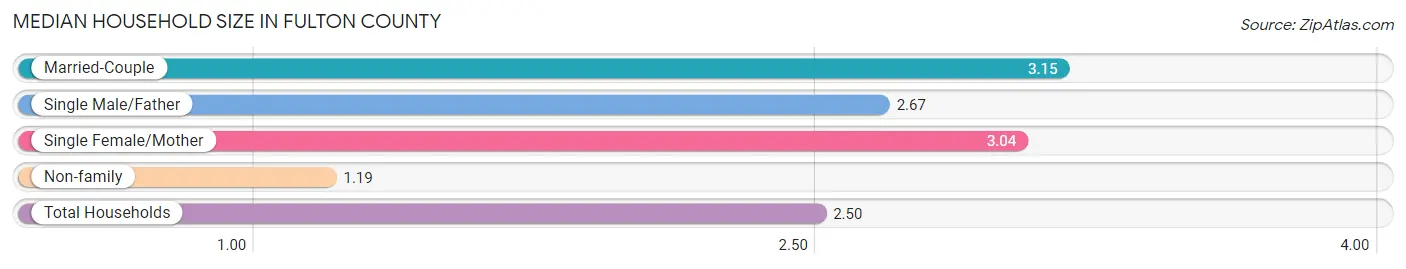
| Household Type | # Households | Household Size |
| Married-Couple | 9,285 (55.0%) | 3.15 |
| Single Male/Father | 786 (4.7%) | 2.67 |
| Single Female/Mother | 1,487 (8.8%) | 3.04 |
| Non-family | 5,311 (31.5%) | 1.19 |
| Total Households | 16,869 (100.0%) | 2.50 |
Household Size by Marriage Status in Fulton County
Out of a total of 16,869 households in Fulton County, 11,558 (68.5%) are family households, while 5,311 (31.5%) are nonfamily households. The most numerous type of family households are 2-person households, comprising 5,341, and the most common type of nonfamily households are 1-person households, comprising 4,418.
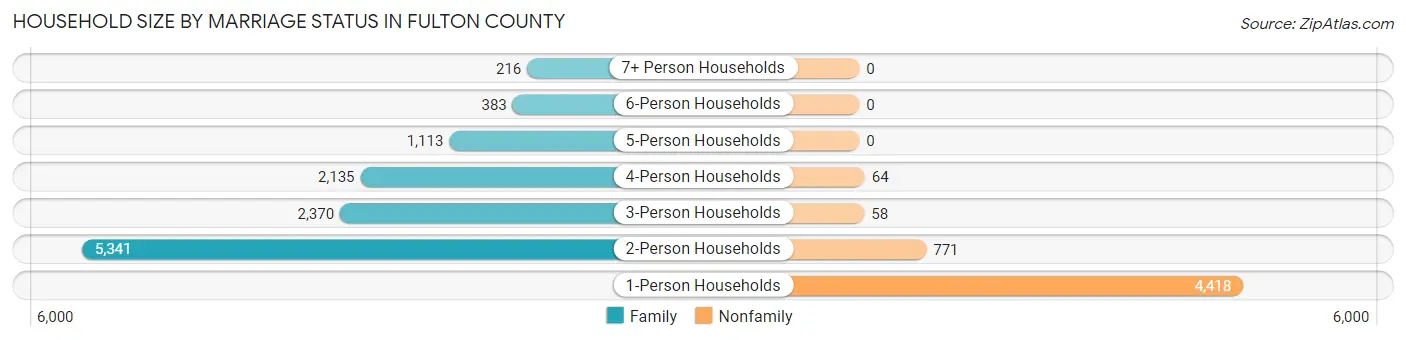
| Household Size | Family Households | Nonfamily Households |
| 1-Person Households | - | 4,418 (26.2%) |
| 2-Person Households | 5,341 (31.7%) | 771 (4.6%) |
| 3-Person Households | 2,370 (14.1%) | 58 (0.3%) |
| 4-Person Households | 2,135 (12.7%) | 64 (0.4%) |
| 5-Person Households | 1,113 (6.6%) | 0 (0.0%) |
| 6-Person Households | 383 (2.3%) | 0 (0.0%) |
| 7+ Person Households | 216 (1.3%) | 0 (0.0%) |
| Total | 11,558 (68.5%) | 5,311 (31.5%) |
Female Fertility in Fulton County
Fertility by Age in Fulton County
Average fertility rate in Fulton County is 54.0 births per 1,000 women. Women in the age bracket of 20 to 34 years have the highest fertility rate with 99.0 births per 1,000 women. Women in the age bracket of 20 to 34 years acount for 69.5% of all women with births.
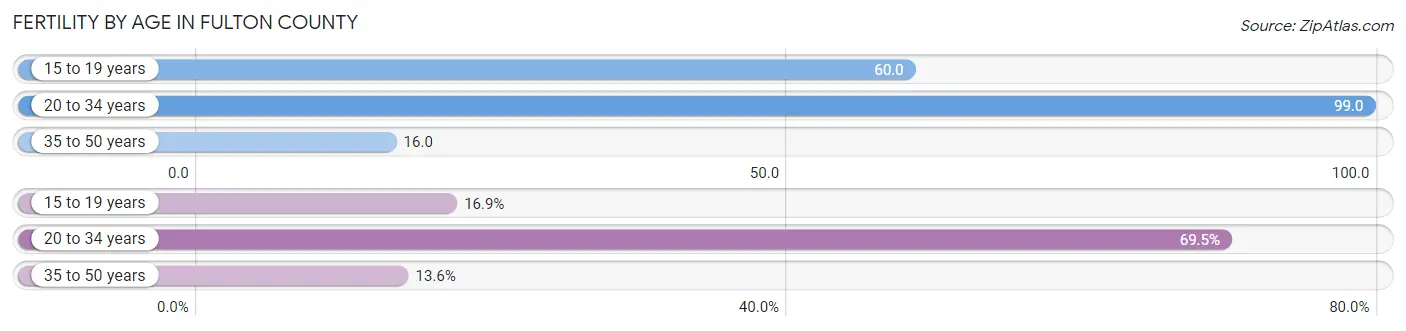
| Age Bracket | Women with Births | Births / 1,000 Women |
| 15 to 19 years | 82 (16.9%) | 60.0 |
| 20 to 34 years | 337 (69.5%) | 99.0 |
| 35 to 50 years | 66 (13.6%) | 16.0 |
| Total | 485 (100.0%) | 54.0 |
Fertility by Age by Marriage Status in Fulton County
58.4% of women with births (485) in Fulton County are married. The highest percentage of unmarried women with births falls into 15 to 19 years age bracket with 86.6% of them unmarried at the time of birth, while the lowest percentage of unmarried women with births belong to 35 to 50 years age bracket with 0.0% of them unmarried.

| Age Bracket | Married | Unmarried |
| 15 to 19 years | 11 (13.4%) | 71 (86.6%) |
| 20 to 34 years | 206 (61.1%) | 131 (38.9%) |
| 35 to 50 years | 66 (100.0%) | 0 (0.0%) |
| Total | 283 (58.4%) | 202 (41.6%) |
Fertility by Education in Fulton County
Average fertility rate in Fulton County is 54.0 births per 1,000 women. Women with the education attainment of bachelor's degree have the highest fertility rate of 115.0 births per 1,000 women, while women with the education attainment of graduate degree have the lowest fertility at 15.0 births per 1,000 women. Women with the education attainment of bachelor's degree represent 30.1% of all women with births.
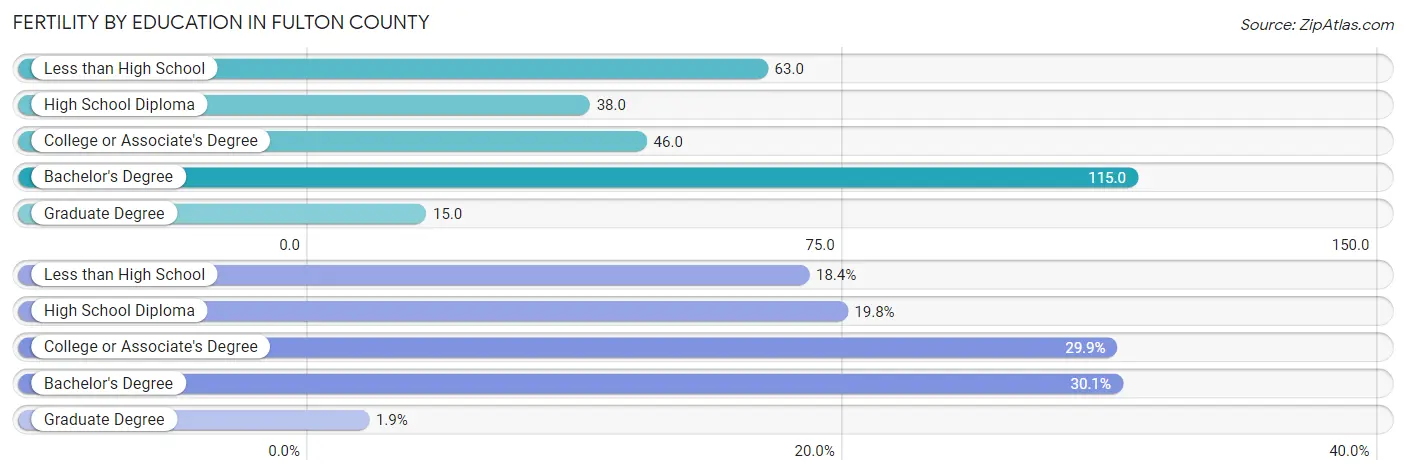
| Educational Attainment | Women with Births | Births / 1,000 Women |
| Less than High School | 89 (18.3%) | 63.0 |
| High School Diploma | 96 (19.8%) | 38.0 |
| College or Associate's Degree | 145 (29.9%) | 46.0 |
| Bachelor's Degree | 146 (30.1%) | 115.0 |
| Graduate Degree | 9 (1.9%) | 15.0 |
| Total | 485 (100.0%) | 54.0 |
Fertility by Education by Marriage Status in Fulton County
41.6% of women with births in Fulton County are unmarried. Women with the educational attainment of graduate degree are most likely to be married with 100.0% of them married at childbirth, while women with the educational attainment of less than high school are least likely to be married with 86.5% of them unmarried at childbirth.
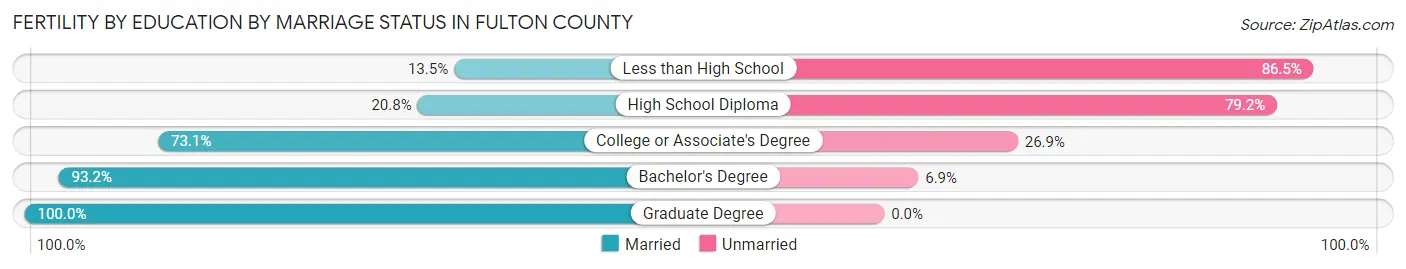
| Educational Attainment | Married | Unmarried |
| Less than High School | 12 (13.5%) | 77 (86.5%) |
| High School Diploma | 20 (20.8%) | 76 (79.2%) |
| College or Associate's Degree | 106 (73.1%) | 39 (26.9%) |
| Bachelor's Degree | 136 (93.1%) | 10 (6.9%) |
| Graduate Degree | 9 (100.0%) | 0 (0.0%) |
| Total | 283 (58.4%) | 202 (41.6%) |
Income in Fulton County
Income Overview in Fulton County
Per Capita Income in Fulton County is $35,230, while median incomes of families and households are $83,935 and $71,453 respectively.
| Characteristic | Number | Measure |
| Per Capita Income | 42,602 | $35,230 |
| Median Family Income | 11,558 | $83,935 |
| Mean Family Income | 11,558 | $101,787 |
| Median Household Income | 16,869 | $71,453 |
| Mean Household Income | 16,869 | $88,950 |
| Income Deficit | 11,558 | $10,359 |
| Wage / Income Gap (%) | 42,602 | 41.91% |
| Wage / Income Gap ($) | 42,602 | 58.09¢ per $1 |
| Gini / Inequality Index | 42,602 | 0.41 |
Earnings by Sex in Fulton County
Average Earnings in Fulton County are $41,420, $52,655 for men and $30,587 for women, a difference of 41.9%.
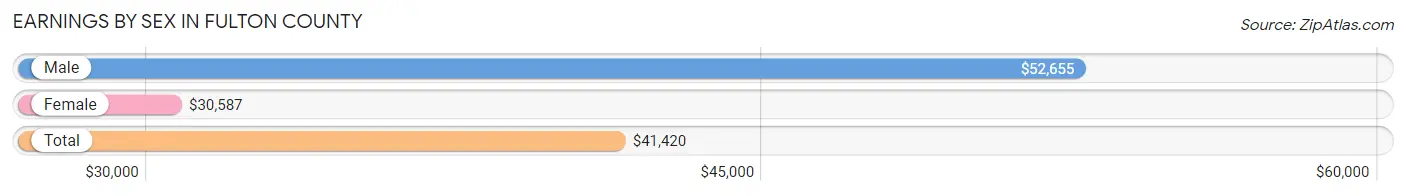
| Sex | Number | Average Earnings |
| Male | 12,134 (53.4%) | $52,655 |
| Female | 10,566 (46.6%) | $30,587 |
| Total | 22,700 (100.0%) | $41,420 |
Earnings by Sex by Income Bracket in Fulton County
The most common earnings brackets in Fulton County are $75,000 to $99,999 for men (1,707 | 14.1%) and $25,000 to $29,999 for women (1,033 | 9.8%).
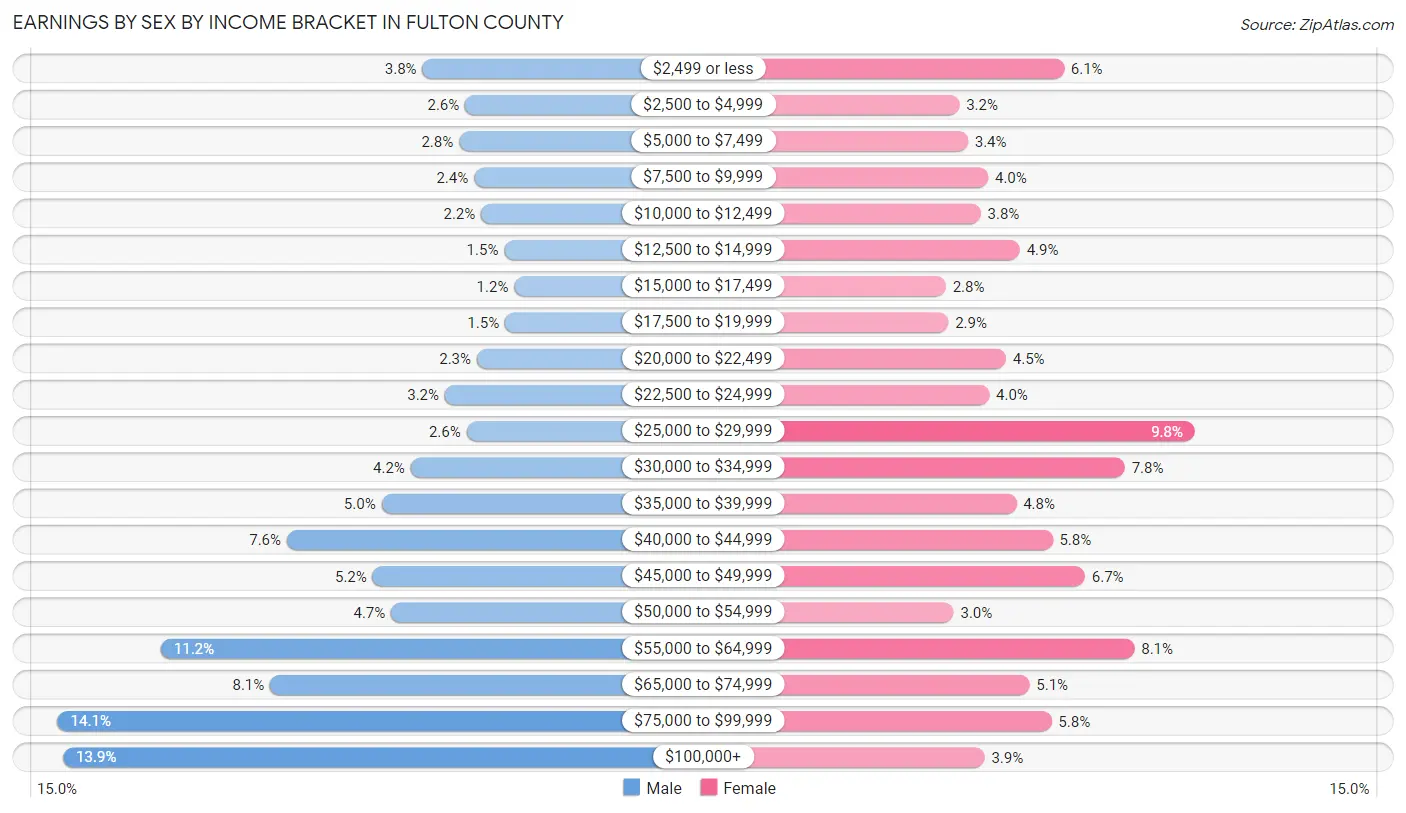
| Income | Male | Female |
| $2,499 or less | 464 (3.8%) | 645 (6.1%) |
| $2,500 to $4,999 | 318 (2.6%) | 334 (3.2%) |
| $5,000 to $7,499 | 338 (2.8%) | 359 (3.4%) |
| $7,500 to $9,999 | 287 (2.4%) | 419 (4.0%) |
| $10,000 to $12,499 | 263 (2.2%) | 397 (3.8%) |
| $12,500 to $14,999 | 185 (1.5%) | 513 (4.9%) |
| $15,000 to $17,499 | 150 (1.2%) | 294 (2.8%) |
| $17,500 to $19,999 | 182 (1.5%) | 301 (2.9%) |
| $20,000 to $22,499 | 278 (2.3%) | 472 (4.5%) |
| $22,500 to $24,999 | 387 (3.2%) | 423 (4.0%) |
| $25,000 to $29,999 | 313 (2.6%) | 1,033 (9.8%) |
| $30,000 to $34,999 | 503 (4.2%) | 825 (7.8%) |
| $35,000 to $39,999 | 603 (5.0%) | 503 (4.8%) |
| $40,000 to $44,999 | 926 (7.6%) | 611 (5.8%) |
| $45,000 to $49,999 | 633 (5.2%) | 707 (6.7%) |
| $50,000 to $54,999 | 570 (4.7%) | 317 (3.0%) |
| $55,000 to $64,999 | 1,355 (11.2%) | 854 (8.1%) |
| $65,000 to $74,999 | 983 (8.1%) | 542 (5.1%) |
| $75,000 to $99,999 | 1,707 (14.1%) | 608 (5.8%) |
| $100,000+ | 1,689 (13.9%) | 409 (3.9%) |
| Total | 12,134 (100.0%) | 10,566 (100.0%) |
Earnings by Sex by Educational Attainment in Fulton County
Average earnings in Fulton County are $58,644 for men and $33,724 for women, a difference of 42.5%. Men with an educational attainment of graduate degree enjoy the highest average annual earnings of $81,912, while those with less than high school education earn the least with $30,337. Women with an educational attainment of graduate degree earn the most with the average annual earnings of $72,660, while those with less than high school education have the smallest earnings of $23,077.
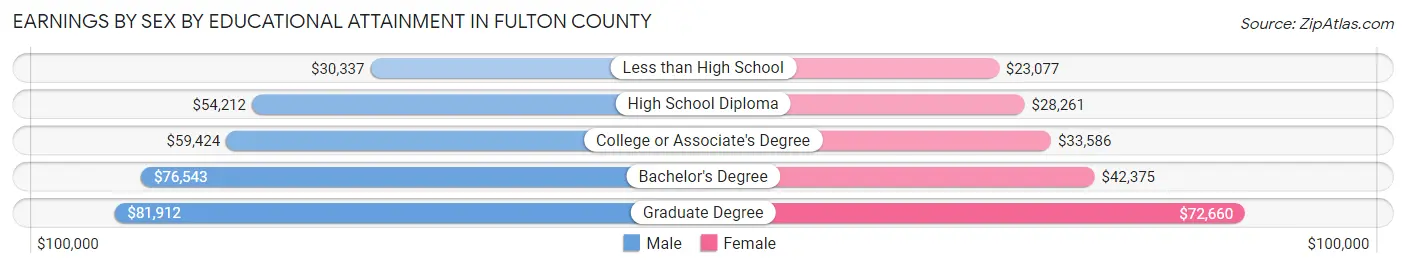
| Educational Attainment | Male Income | Female Income |
| Less than High School | $30,337 | $23,077 |
| High School Diploma | $54,212 | $28,261 |
| College or Associate's Degree | $59,424 | $33,586 |
| Bachelor's Degree | $76,543 | $42,375 |
| Graduate Degree | $81,912 | $72,660 |
| Total | $58,644 | $33,724 |
Family Income in Fulton County
Family Income Brackets in Fulton County
According to the Fulton County family income data, there are 2,693 families falling into the $100,000 to $149,999 income range, which is the most common income bracket and makes up 23.3% of all families. Conversely, the less than $10,000 income bracket is the least frequent group with only 231 families (2.0%) belonging to this category.
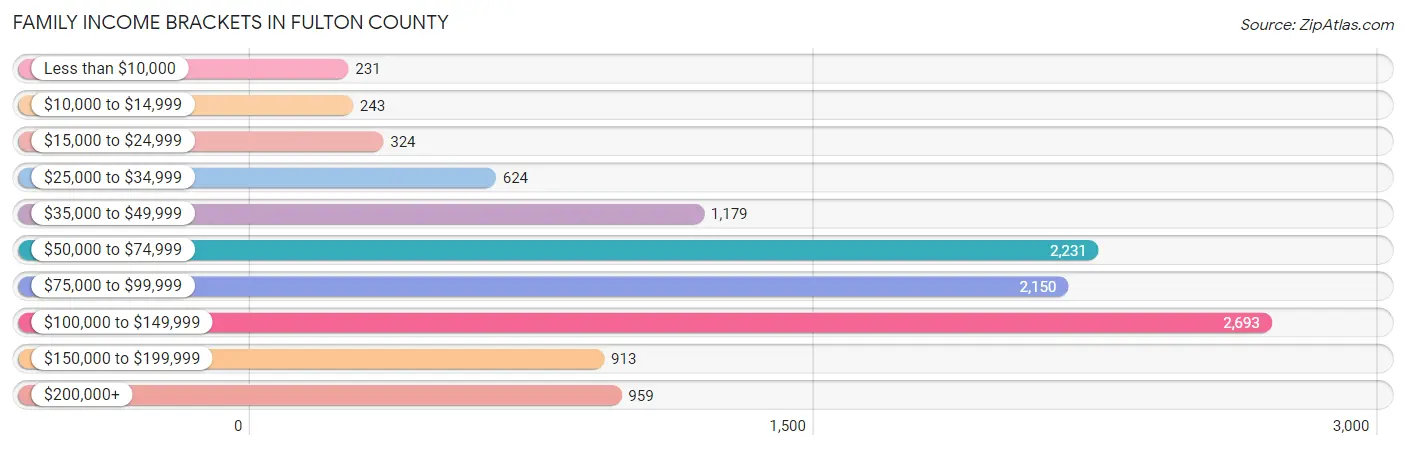
| Income Bracket | # Families | % Families |
| Less than $10,000 | 231 | 2.0% |
| $10,000 to $14,999 | 243 | 2.1% |
| $15,000 to $24,999 | 324 | 2.8% |
| $25,000 to $34,999 | 624 | 5.4% |
| $35,000 to $49,999 | 1,179 | 10.2% |
| $50,000 to $74,999 | 2,231 | 19.3% |
| $75,000 to $99,999 | 2,150 | 18.6% |
| $100,000 to $149,999 | 2,693 | 23.3% |
| $150,000 to $199,999 | 913 | 7.9% |
| $200,000+ | 959 | 8.3% |
Family Income by Famaliy Size in Fulton County
4-person families (2,004 | 17.3%) account for the highest median family income in Fulton County with $106,143 per family, while 2-person families (5,657 | 48.9%) have the highest median income of $36,090 per family member.
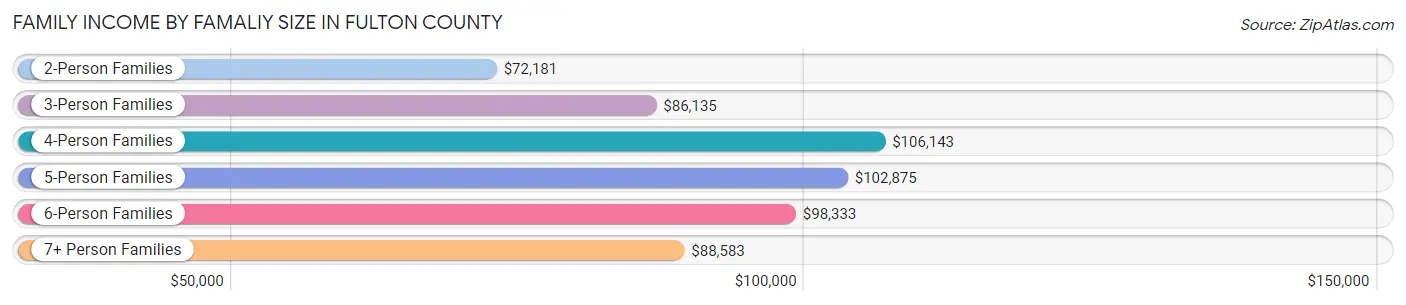
| Income Bracket | # Families | Median Income |
| 2-Person Families | 5,657 (48.9%) | $72,181 |
| 3-Person Families | 2,350 (20.3%) | $86,135 |
| 4-Person Families | 2,004 (17.3%) | $106,143 |
| 5-Person Families | 1,024 (8.9%) | $102,875 |
| 6-Person Families | 308 (2.7%) | $98,333 |
| 7+ Person Families | 215 (1.9%) | $88,583 |
| Total | 11,558 (100.0%) | $83,935 |
Family Income by Number of Earners in Fulton County
The median family income in Fulton County is $83,935, with families comprising 3+ earners (1,594) having the highest median family income of $136,898, while families with no earners (1,632) have the lowest median family income of $38,288, accounting for 13.8% and 14.1% of families, respectively.
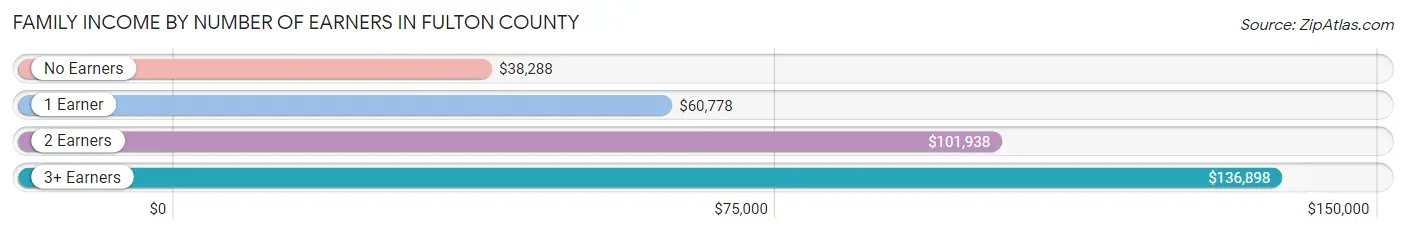
| Number of Earners | # Families | Median Income |
| No Earners | 1,632 (14.1%) | $38,288 |
| 1 Earner | 3,708 (32.1%) | $60,778 |
| 2 Earners | 4,624 (40.0%) | $101,938 |
| 3+ Earners | 1,594 (13.8%) | $136,898 |
| Total | 11,558 (100.0%) | $83,935 |
Household Income in Fulton County
Household Income Brackets in Fulton County
With 3,458 households falling in the category, the $50,000 to $74,999 income range is the most frequent in Fulton County, accounting for 20.5% of all households. In contrast, only 455 households (2.7%) fall into the less than $10,000 income bracket, making it the least populous group.

| Income Bracket | # Households | % Households |
| Less than $10,000 | 455 | 2.7% |
| $10,000 to $14,999 | 692 | 4.1% |
| $15,000 to $24,999 | 1,029 | 6.1% |
| $25,000 to $34,999 | 1,215 | 7.2% |
| $35,000 to $49,999 | 1,940 | 11.5% |
| $50,000 to $74,999 | 3,458 | 20.5% |
| $75,000 to $99,999 | 2,783 | 16.5% |
| $100,000 to $149,999 | 3,104 | 18.4% |
| $150,000 to $199,999 | 1,080 | 6.4% |
| $200,000+ | 1,147 | 6.8% |
Household Income by Householder Age in Fulton County
The median household income in Fulton County is $71,453, with the highest median household income of $83,463 found in the 45 to 64 years age bracket for the primary householder. A total of 6,535 households (38.7%) fall into this category. Meanwhile, the 65+ years age bracket for the primary householder has the lowest median household income of $50,716, with 4,842 households (28.7%) in this group.
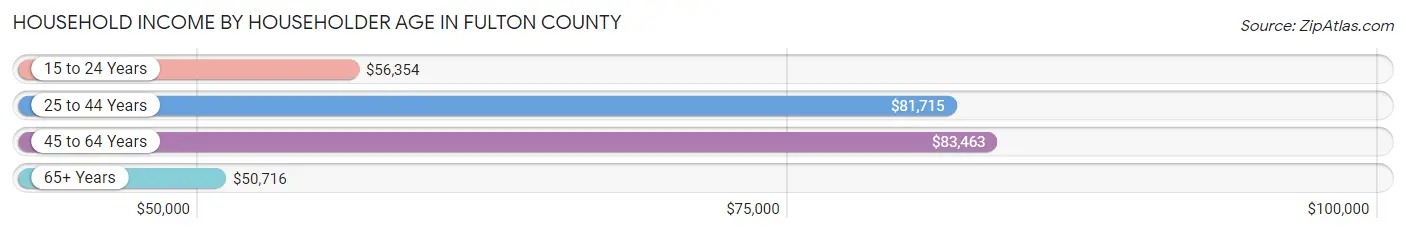
| Income Bracket | # Households | Median Income |
| 15 to 24 Years | 527 (3.1%) | $56,354 |
| 25 to 44 Years | 4,965 (29.4%) | $81,715 |
| 45 to 64 Years | 6,535 (38.7%) | $83,463 |
| 65+ Years | 4,842 (28.7%) | $50,716 |
| Total | 16,869 (100.0%) | $71,453 |
Poverty in Fulton County
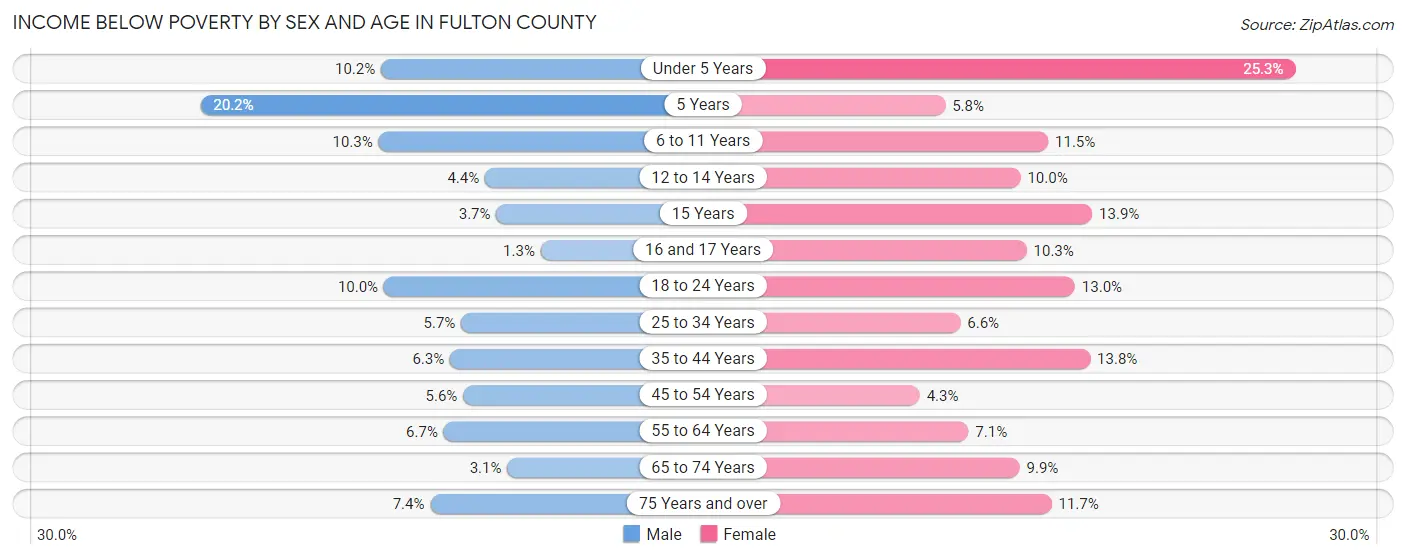
Income Below Poverty by Sex and Age in Fulton County
With 6.7% poverty level for males and 10.3% for females among the residents of Fulton County, 5 year old males and under 5 year old females are the most vulnerable to poverty, with 58 males (20.2%) and 283 females (25.3%) in their respective age groups living below the poverty level.
| Age Bracket | Male | Female |
| Under 5 Years | 131 (10.2%) | 283 (25.3%) |
| 5 Years | 58 (20.2%) | 17 (5.8%) |
| 6 to 11 Years | 179 (10.3%) | 172 (11.5%) |
| 12 to 14 Years | 40 (4.4%) | 87 (10.0%) |
| 15 Years | 11 (3.7%) | 52 (13.9%) |
| 16 and 17 Years | 8 (1.3%) | 50 (10.3%) |
| 18 to 24 Years | 181 (10.0%) | 215 (13.0%) |
| 25 to 34 Years | 133 (5.7%) | 149 (6.6%) |
| 35 to 44 Years | 162 (6.3%) | 372 (13.8%) |
| 45 to 54 Years | 152 (5.6%) | 111 (4.3%) |
| 55 to 64 Years | 206 (6.7%) | 215 (7.0%) |
| 65 to 74 Years | 71 (3.1%) | 241 (9.9%) |
| 75 Years and over | 88 (7.4%) | 193 (11.7%) |
| Total | 1,420 (6.7%) | 2,157 (10.3%) |
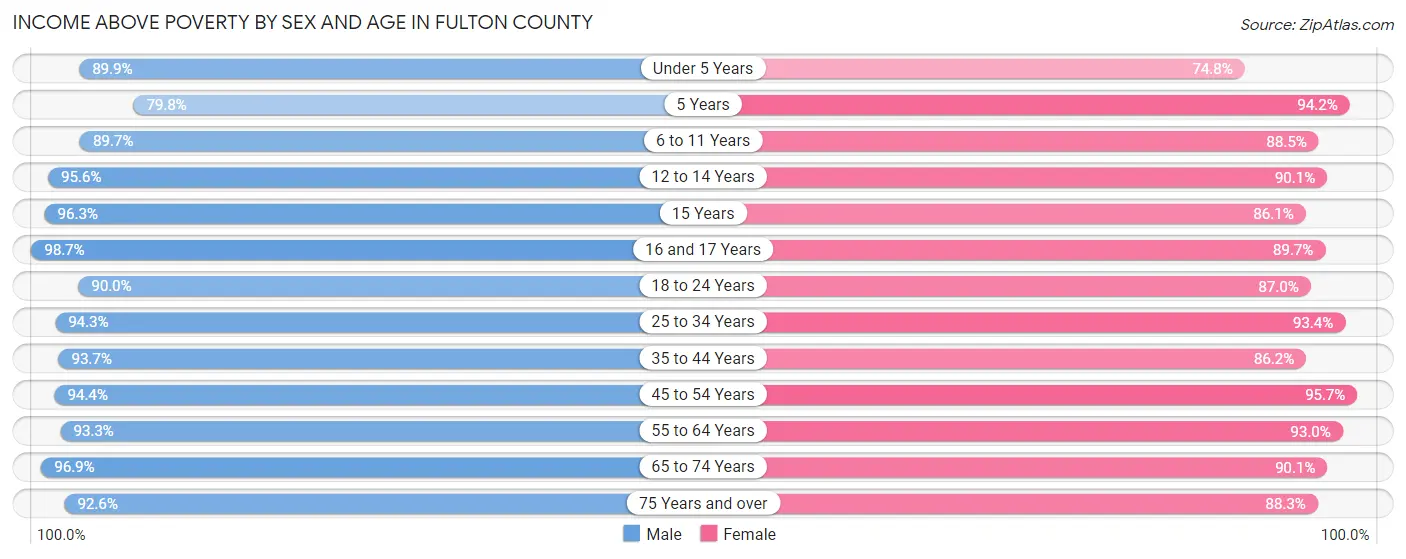
Income Above Poverty by Sex and Age in Fulton County
According to the poverty statistics in Fulton County, males aged 16 and 17 years and females aged 45 to 54 years are the age groups that are most secure financially, with 98.7% of males and 95.7% of females in these age groups living above the poverty line.
| Age Bracket | Male | Female |
| Under 5 Years | 1,160 (89.8%) | 838 (74.8%) |
| 5 Years | 229 (79.8%) | 278 (94.2%) |
| 6 to 11 Years | 1,561 (89.7%) | 1,325 (88.5%) |
| 12 to 14 Years | 878 (95.6%) | 787 (90.0%) |
| 15 Years | 284 (96.3%) | 321 (86.1%) |
| 16 and 17 Years | 627 (98.7%) | 436 (89.7%) |
| 18 to 24 Years | 1,631 (90.0%) | 1,441 (87.0%) |
| 25 to 34 Years | 2,204 (94.3%) | 2,107 (93.4%) |
| 35 to 44 Years | 2,407 (93.7%) | 2,318 (86.2%) |
| 45 to 54 Years | 2,574 (94.4%) | 2,445 (95.7%) |
| 55 to 64 Years | 2,888 (93.3%) | 2,835 (92.9%) |
| 65 to 74 Years | 2,204 (96.9%) | 2,193 (90.1%) |
| 75 Years and over | 1,100 (92.6%) | 1,460 (88.3%) |
| Total | 19,747 (93.3%) | 18,784 (89.7%) |
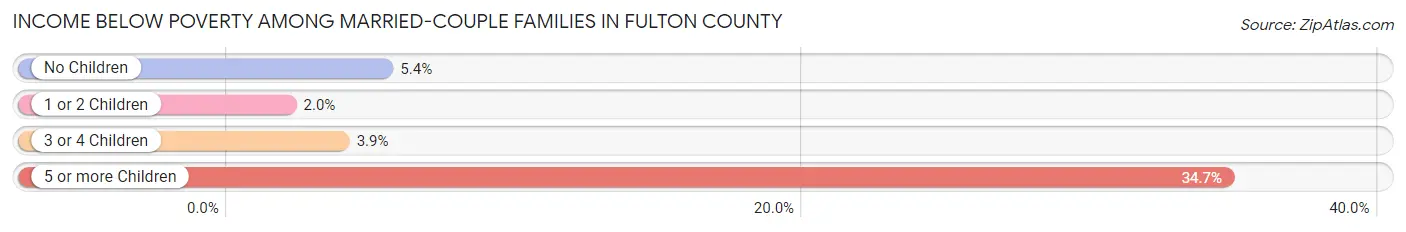
Income Below Poverty Among Married-Couple Families in Fulton County
The poverty statistics for married-couple families in Fulton County show that 4.7% or 440 of the total 9,285 families live below the poverty line. Families with 5 or more children have the highest poverty rate of 34.7%, comprising of 52 families. On the other hand, families with 1 or 2 children have the lowest poverty rate of 2.0%, which includes 57 families.
| Children | Above Poverty | Below Poverty |
| No Children | 5,244 (94.6%) | 300 (5.4%) |
| 1 or 2 Children | 2,737 (98.0%) | 57 (2.0%) |
| 3 or 4 Children | 766 (96.1%) | 31 (3.9%) |
| 5 or more Children | 98 (65.3%) | 52 (34.7%) |
| Total | 8,845 (95.3%) | 440 (4.7%) |
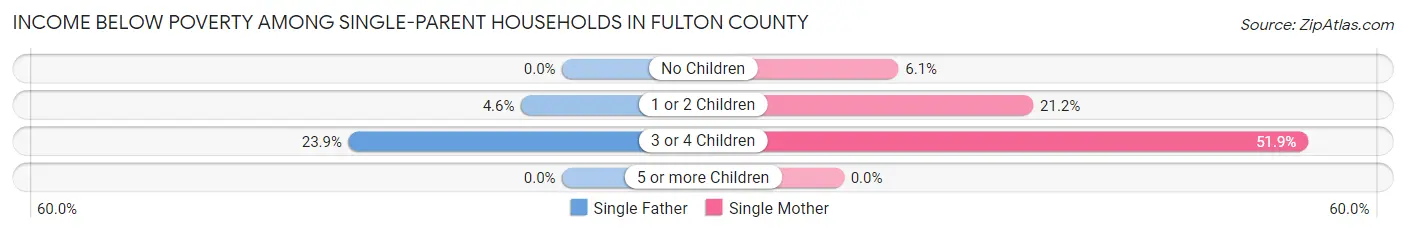
Income Below Poverty Among Single-Parent Households in Fulton County
According to the poverty data in Fulton County, 3.9% or 31 single-father households and 17.5% or 261 single-mother households are living below the poverty line. Among single-father households, those with 3 or 4 children have the highest poverty rate, with 16 households (23.9%) experiencing poverty. Likewise, among single-mother households, those with 3 or 4 children have the highest poverty rate, with 68 households (51.9%) falling below the poverty line.
| Children | Single Father | Single Mother |
| No Children | 0 (0.0%) | 38 (6.1%) |
| 1 or 2 Children | 15 (4.6%) | 155 (21.2%) |
| 3 or 4 Children | 16 (23.9%) | 68 (51.9%) |
| 5 or more Children | 0 (0.0%) | 0 (0.0%) |
| Total | 31 (3.9%) | 261 (17.5%) |
Income Below Poverty Among Married-Couple vs Single-Parent Households in Fulton County
The poverty data for Fulton County shows that 440 of the married-couple family households (4.7%) and 292 of the single-parent households (12.9%) are living below the poverty level. Within the married-couple family households, those with 5 or more children have the highest poverty rate, with 52 households (34.7%) falling below the poverty line. Among the single-parent households, those with 3 or 4 children have the highest poverty rate, with 84 household (42.4%) living below poverty.
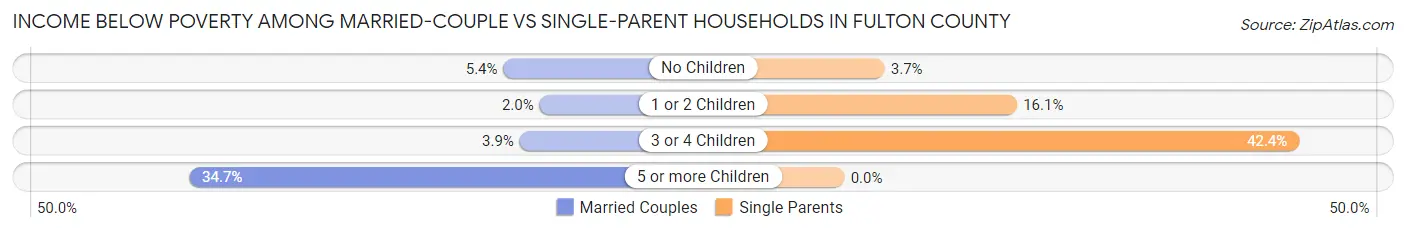
| Children | Married-Couple Families | Single-Parent Households |
| No Children | 300 (5.4%) | 38 (3.7%) |
| 1 or 2 Children | 57 (2.0%) | 170 (16.1%) |
| 3 or 4 Children | 31 (3.9%) | 84 (42.4%) |
| 5 or more Children | 52 (34.7%) | 0 (0.0%) |
| Total | 440 (4.7%) | 292 (12.9%) |
Employment Characteristics in Fulton County
Employment by Class of Employer in Fulton County
Among the 20,337 employed individuals in Fulton County, private company employees (14,028 | 69.0%), not-for-profit organizations (1,926 | 9.5%), and local government employees (1,869 | 9.2%) make up the most common classes of employment.
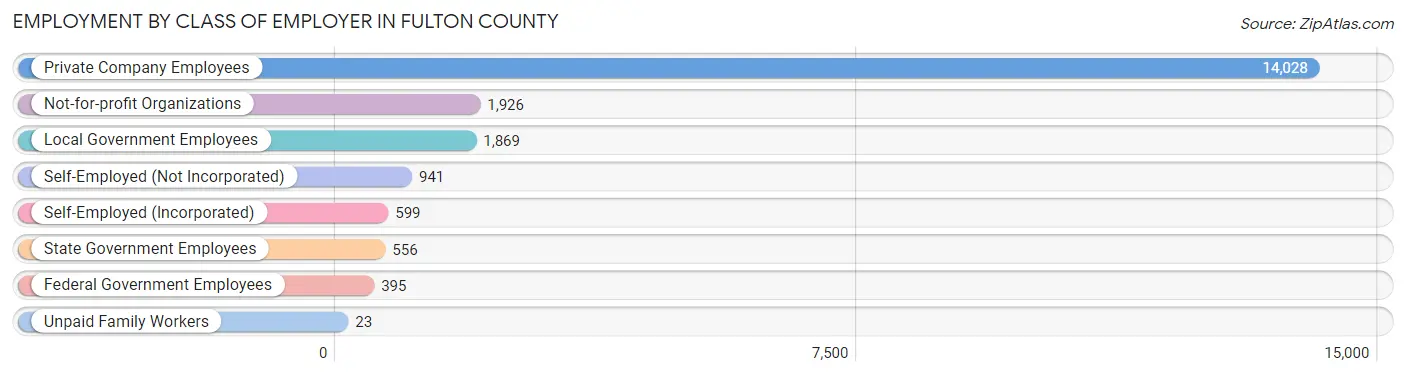
| Employer Class | # Employees | % Employees |
| Private Company Employees | 14,028 | 69.0% |
| Self-Employed (Incorporated) | 599 | 2.9% |
| Self-Employed (Not Incorporated) | 941 | 4.6% |
| Not-for-profit Organizations | 1,926 | 9.5% |
| Local Government Employees | 1,869 | 9.2% |
| State Government Employees | 556 | 2.7% |
| Federal Government Employees | 395 | 1.9% |
| Unpaid Family Workers | 23 | 0.1% |
| Total | 20,337 | 100.0% |
Employment Status by Age in Fulton County
According to the labor force statistics for Fulton County, out of the total population over 16 years of age (33,801), 63.2% or 21,362 individuals are in the labor force, with 3.5% or 748 of them unemployed. The age group with the highest labor force participation rate is 30 to 34 years, with 87.4% or 1,956 individuals in the labor force. Within the labor force, the 16 to 19 years age range has the highest percentage of unemployed individuals, with 21.6% or 219 of them being unemployed.
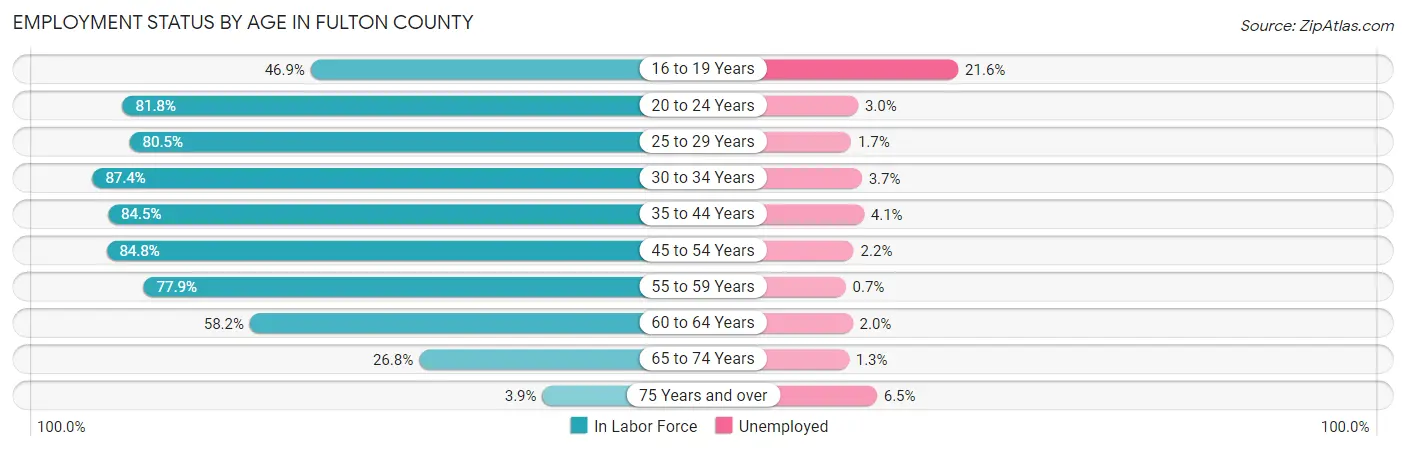
| Age Bracket | In Labor Force | Unemployed |
| 16 to 19 Years | 1,016 (46.9%) | 219 (21.6%) |
| 20 to 24 Years | 1,982 (81.8%) | 59 (3.0%) |
| 25 to 29 Years | 1,903 (80.5%) | 32 (1.7%) |
| 30 to 34 Years | 1,956 (87.4%) | 72 (3.7%) |
| 35 to 44 Years | 4,444 (84.5%) | 182 (4.1%) |
| 45 to 54 Years | 4,492 (84.8%) | 99 (2.2%) |
| 55 to 59 Years | 2,318 (77.9%) | 16 (0.7%) |
| 60 to 64 Years | 1,861 (58.2%) | 37 (2.0%) |
| 65 to 74 Years | 1,270 (26.8%) | 17 (1.3%) |
| 75 Years and over | 123 (3.9%) | 8 (6.5%) |
| Total | 21,362 (63.2%) | 748 (3.5%) |
Employment Status by Educational Attainment in Fulton County
According to labor force statistics for Fulton County, 79.6% of individuals (16,979) out of the total population between 25 and 64 years of age (21,331) are in the labor force, with 2.6% or 441 of them being unemployed. The group with the highest labor force participation rate are those with the educational attainment of bachelor's degree or higher, with 88.3% or 3,763 individuals in the labor force. Within the labor force, individuals with less than high school education have the highest percentage of unemployment, with 10.4% or 78 of them being unemployed.
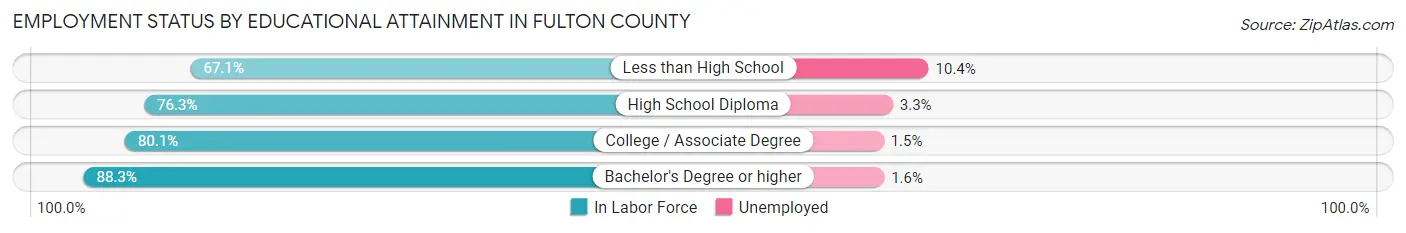
| Educational Attainment | In Labor Force | Unemployed |
| Less than High School | 748 (67.1%) | 116 (10.4%) |
| High School Diploma | 6,361 (76.3%) | 275 (3.3%) |
| College / Associate Degree | 6,101 (80.1%) | 114 (1.5%) |
| Bachelor's Degree or higher | 3,763 (88.3%) | 68 (1.6%) |
| Total | 16,979 (79.6%) | 555 (2.6%) |
Employment Occupations by Sex in Fulton County
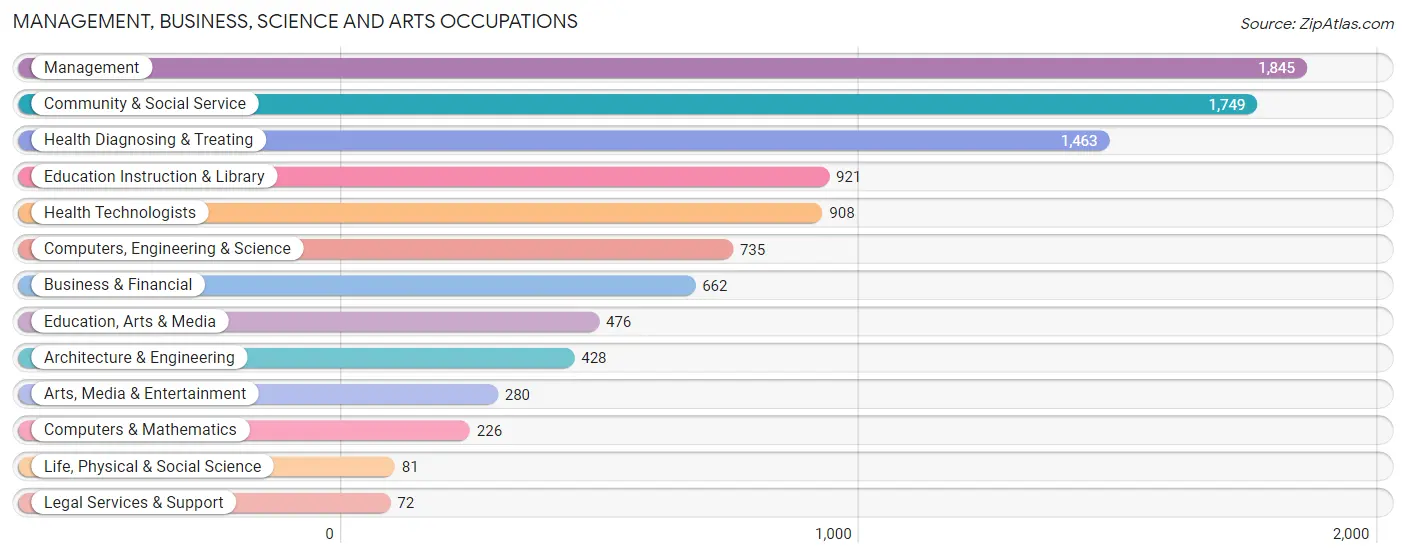
Management, Business, Science and Arts Occupations
The most common Management, Business, Science and Arts occupations in Fulton County are Management (1,845 | 9.0%), Community & Social Service (1,749 | 8.5%), Health Diagnosing & Treating (1,463 | 7.1%), Education Instruction & Library (921 | 4.5%), and Health Technologists (908 | 4.4%).
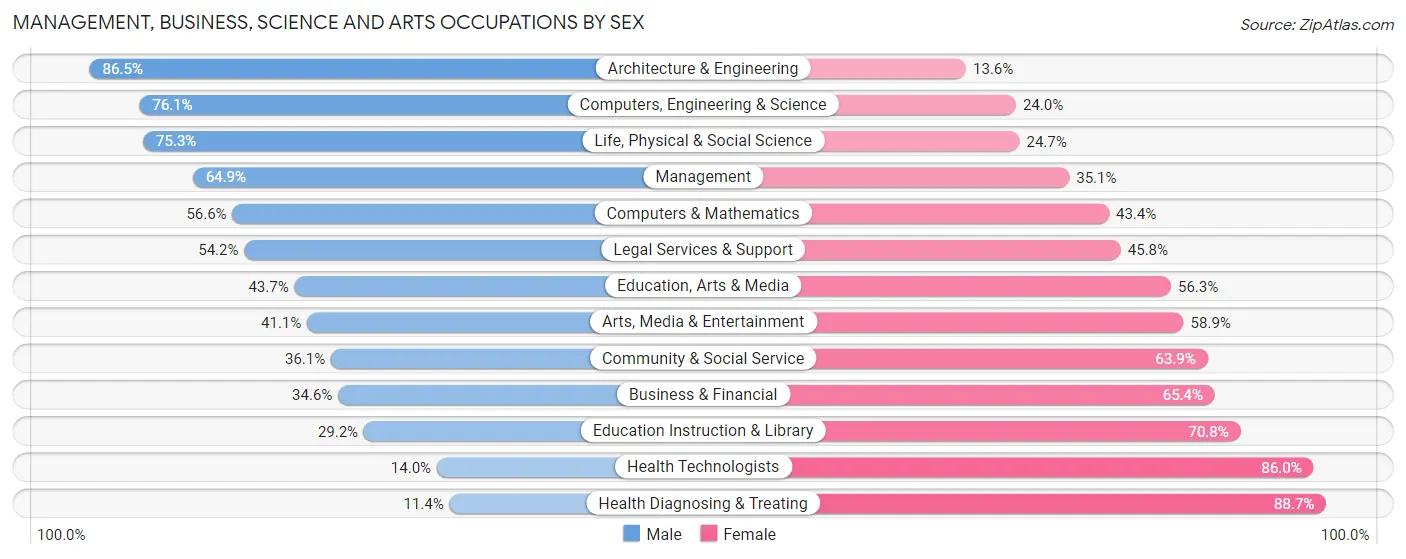
Management, Business, Science and Arts Occupations by Sex
Within the Management, Business, Science and Arts occupations in Fulton County, the most male-oriented occupations are Architecture & Engineering (86.5%), Computers, Engineering & Science (76.0%), and Life, Physical & Social Science (75.3%), while the most female-oriented occupations are Health Diagnosing & Treating (88.6%), Health Technologists (86.0%), and Education Instruction & Library (70.8%).
| Occupation | Male | Female |
| Management | 1,198 (64.9%) | 647 (35.1%) |
| Business & Financial | 229 (34.6%) | 433 (65.4%) |
| Computers, Engineering & Science | 559 (76.0%) | 176 (23.9%) |
| Computers & Mathematics | 128 (56.6%) | 98 (43.4%) |
| Architecture & Engineering | 370 (86.5%) | 58 (13.6%) |
| Life, Physical & Social Science | 61 (75.3%) | 20 (24.7%) |
| Community & Social Service | 631 (36.1%) | 1,118 (63.9%) |
| Education, Arts & Media | 208 (43.7%) | 268 (56.3%) |
| Legal Services & Support | 39 (54.2%) | 33 (45.8%) |
| Education Instruction & Library | 269 (29.2%) | 652 (70.8%) |
| Arts, Media & Entertainment | 115 (41.1%) | 165 (58.9%) |
| Health Diagnosing & Treating | 166 (11.4%) | 1,297 (88.6%) |
| Health Technologists | 127 (14.0%) | 781 (86.0%) |
| Total (Category) | 2,783 (43.1%) | 3,671 (56.9%) |
| Total (Overall) | 11,057 (53.7%) | 9,546 (46.3%) |
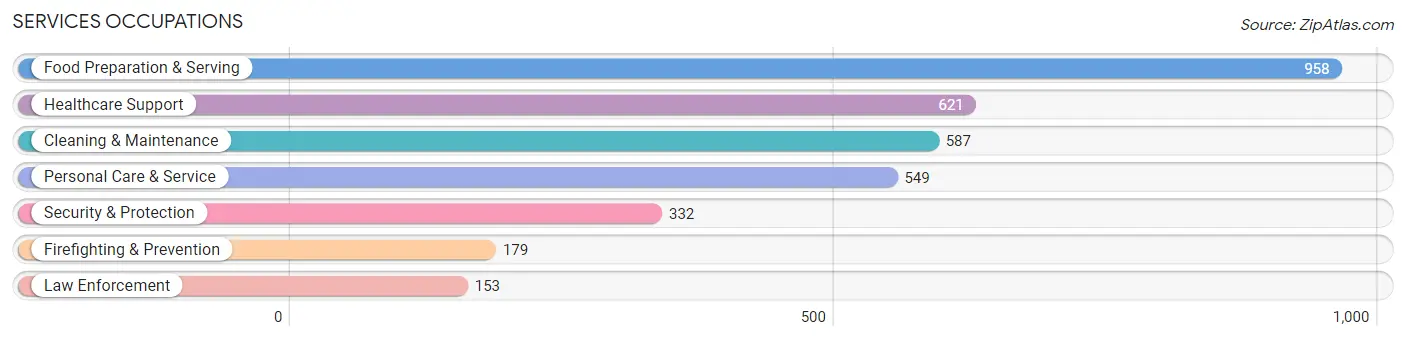
Services Occupations
The most common Services occupations in Fulton County are Food Preparation & Serving (958 | 4.6%), Healthcare Support (621 | 3.0%), Cleaning & Maintenance (587 | 2.9%), Personal Care & Service (549 | 2.7%), and Security & Protection (332 | 1.6%).
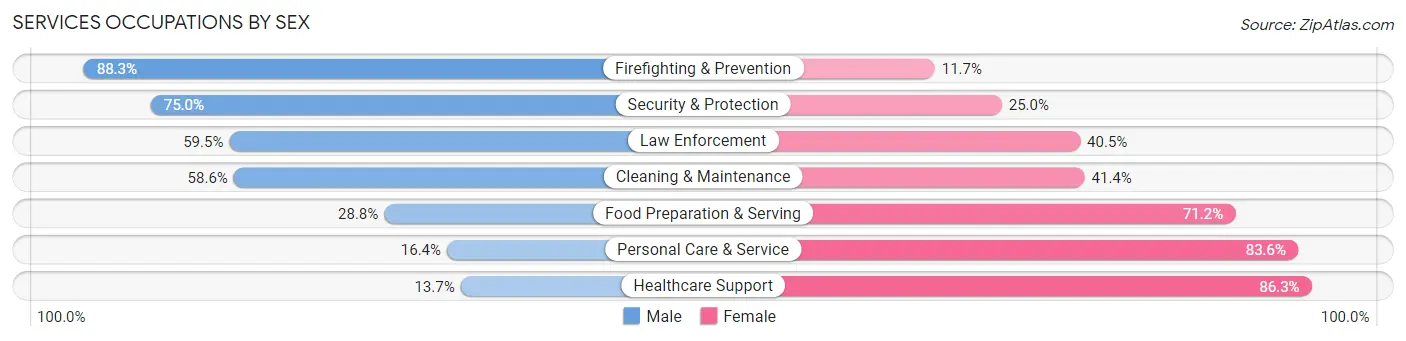
Services Occupations by Sex
Within the Services occupations in Fulton County, the most male-oriented occupations are Firefighting & Prevention (88.3%), Security & Protection (75.0%), and Law Enforcement (59.5%), while the most female-oriented occupations are Healthcare Support (86.3%), Personal Care & Service (83.6%), and Food Preparation & Serving (71.2%).
| Occupation | Male | Female |
| Healthcare Support | 85 (13.7%) | 536 (86.3%) |
| Security & Protection | 249 (75.0%) | 83 (25.0%) |
| Firefighting & Prevention | 158 (88.3%) | 21 (11.7%) |
| Law Enforcement | 91 (59.5%) | 62 (40.5%) |
| Food Preparation & Serving | 276 (28.8%) | 682 (71.2%) |
| Cleaning & Maintenance | 344 (58.6%) | 243 (41.4%) |
| Personal Care & Service | 90 (16.4%) | 459 (83.6%) |
| Total (Category) | 1,044 (34.3%) | 2,003 (65.7%) |
| Total (Overall) | 11,057 (53.7%) | 9,546 (46.3%) |
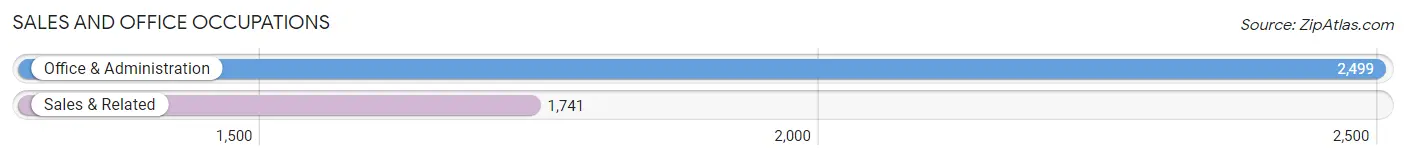
Sales and Office Occupations
The most common Sales and Office occupations in Fulton County are Office & Administration (2,499 | 12.1%), and Sales & Related (1,741 | 8.5%).
Sales and Office Occupations by Sex
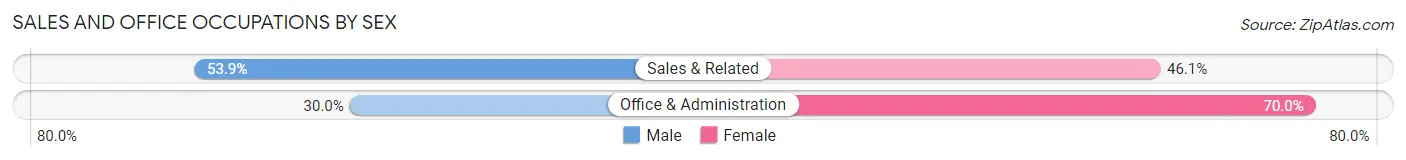
| Occupation | Male | Female |
| Sales & Related | 939 (53.9%) | 802 (46.1%) |
| Office & Administration | 750 (30.0%) | 1,749 (70.0%) |
| Total (Category) | 1,689 (39.8%) | 2,551 (60.2%) |
| Total (Overall) | 11,057 (53.7%) | 9,546 (46.3%) |
Natural Resources, Construction and Maintenance Occupations
The most common Natural Resources, Construction and Maintenance occupations in Fulton County are Construction & Extraction (1,288 | 6.2%), Installation, Maintenance & Repair (976 | 4.7%), and Farming, Fishing & Forestry (157 | 0.8%).

Natural Resources, Construction and Maintenance Occupations by Sex
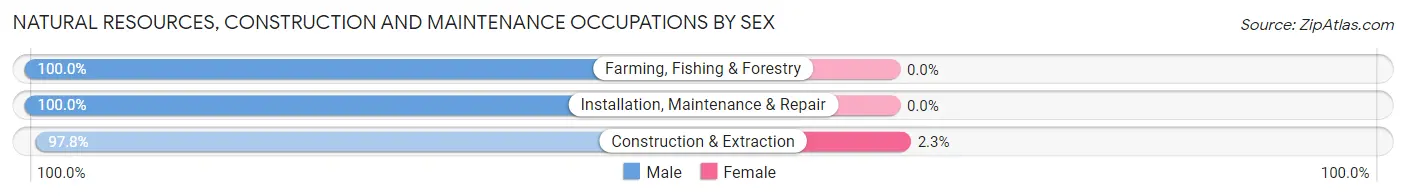
| Occupation | Male | Female |
| Farming, Fishing & Forestry | 157 (100.0%) | 0 (0.0%) |
| Construction & Extraction | 1,259 (97.8%) | 29 (2.2%) |
| Installation, Maintenance & Repair | 976 (100.0%) | 0 (0.0%) |
| Total (Category) | 2,392 (98.8%) | 29 (1.2%) |
| Total (Overall) | 11,057 (53.7%) | 9,546 (46.3%) |
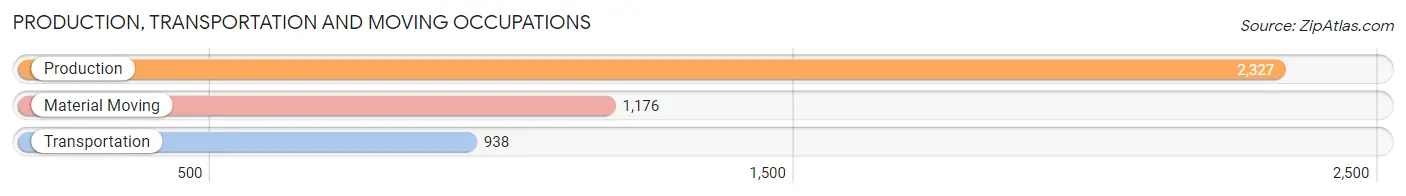
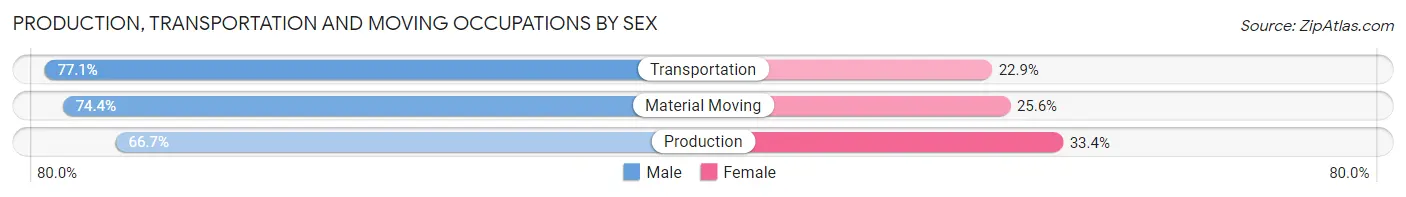
Production, Transportation and Moving Occupations
The most common Production, Transportation and Moving occupations in Fulton County are Production (2,327 | 11.3%), Material Moving (1,176 | 5.7%), and Transportation (938 | 4.5%).
Production, Transportation and Moving Occupations by Sex
| Occupation | Male | Female |
| Production | 1,551 (66.6%) | 776 (33.4%) |
| Transportation | 723 (77.1%) | 215 (22.9%) |
| Material Moving | 875 (74.4%) | 301 (25.6%) |
| Total (Category) | 3,149 (70.9%) | 1,292 (29.1%) |
| Total (Overall) | 11,057 (53.7%) | 9,546 (46.3%) |
Employment Industries by Sex in Fulton County
Employment Industries in Fulton County
The major employment industries in Fulton County include Manufacturing (4,823 | 23.4%), Health Care & Social Assistance (3,114 | 15.1%), Retail Trade (2,076 | 10.1%), Construction (1,515 | 7.3%), and Educational Services (1,391 | 6.8%).

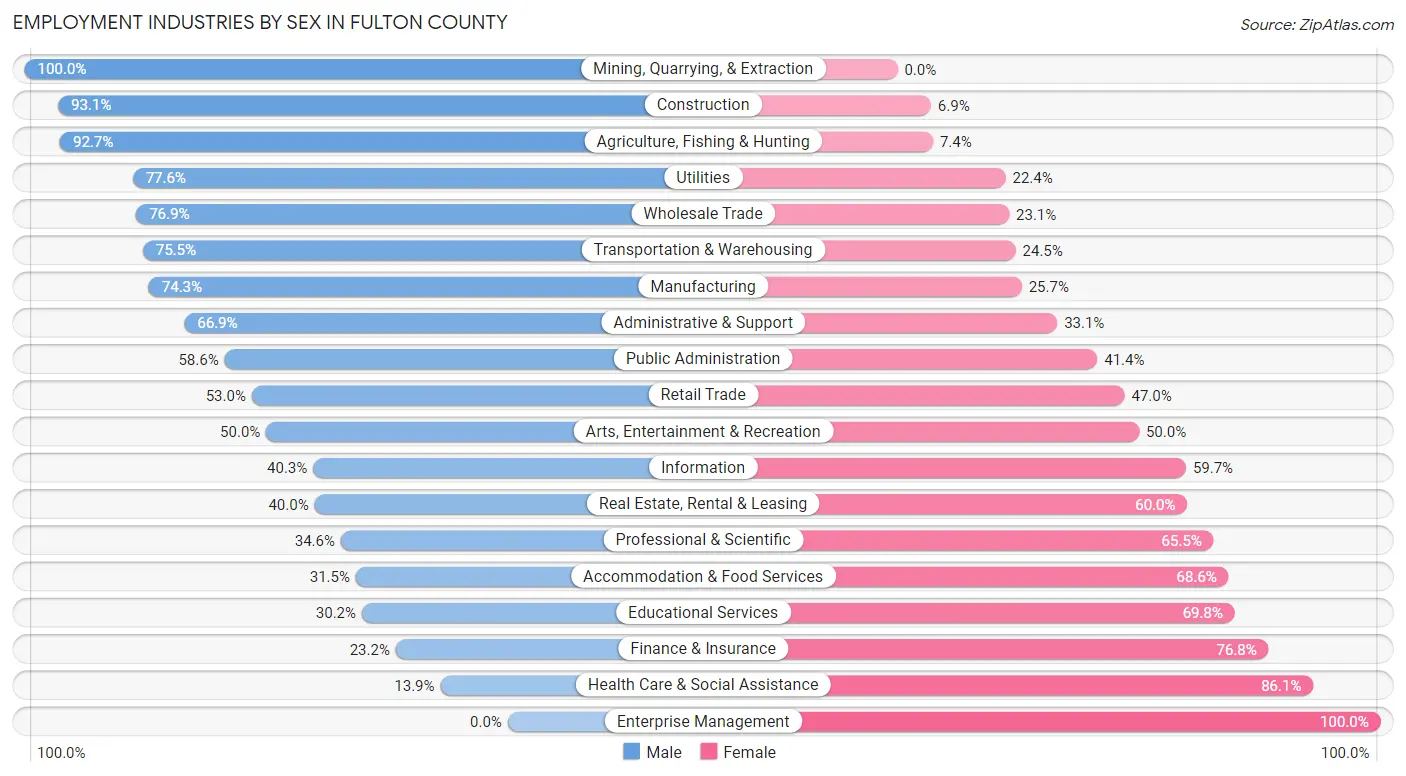
Employment Industries by Sex in Fulton County
The Fulton County industries that see more men than women are Mining, Quarrying, & Extraction (100.0%), Construction (93.1%), and Agriculture, Fishing & Hunting (92.6%), whereas the industries that tend to have a higher number of women are Enterprise Management (100.0%), Health Care & Social Assistance (86.1%), and Finance & Insurance (76.8%).
| Industry | Male | Female |
| Agriculture, Fishing & Hunting | 479 (92.6%) | 38 (7.3%) |
| Mining, Quarrying, & Extraction | 32 (100.0%) | 0 (0.0%) |
| Construction | 1,410 (93.1%) | 105 (6.9%) |
| Manufacturing | 3,582 (74.3%) | 1,241 (25.7%) |
| Wholesale Trade | 492 (76.9%) | 148 (23.1%) |
| Retail Trade | 1,100 (53.0%) | 976 (47.0%) |
| Transportation & Warehousing | 818 (75.5%) | 265 (24.5%) |
| Utilities | 111 (77.6%) | 32 (22.4%) |
| Information | 87 (40.3%) | 129 (59.7%) |
| Finance & Insurance | 105 (23.2%) | 348 (76.8%) |
| Real Estate, Rental & Leasing | 70 (40.0%) | 105 (60.0%) |
| Professional & Scientific | 190 (34.5%) | 360 (65.4%) |
| Enterprise Management | 0 (0.0%) | 2 (100.0%) |
| Administrative & Support | 344 (66.9%) | 170 (33.1%) |
| Educational Services | 420 (30.2%) | 971 (69.8%) |
| Health Care & Social Assistance | 434 (13.9%) | 2,680 (86.1%) |
| Arts, Entertainment & Recreation | 86 (50.0%) | 86 (50.0%) |
| Accommodation & Food Services | 390 (31.5%) | 850 (68.5%) |
| Public Administration | 455 (58.6%) | 321 (41.4%) |
| Total | 11,057 (53.7%) | 9,546 (46.3%) |
Education in Fulton County
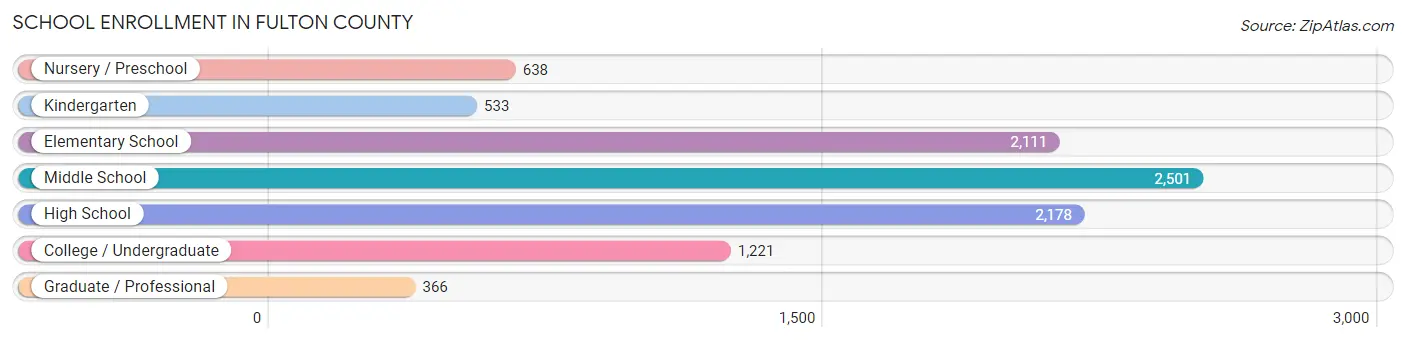
School Enrollment in Fulton County
The most common levels of schooling among the 9,548 students in Fulton County are middle school (2,501 | 26.2%), high school (2,178 | 22.8%), and elementary school (2,111 | 22.1%).
| School Level | # Students | % Students |
| Nursery / Preschool | 638 | 6.7% |
| Kindergarten | 533 | 5.6% |
| Elementary School | 2,111 | 22.1% |
| Middle School | 2,501 | 26.2% |
| High School | 2,178 | 22.8% |
| College / Undergraduate | 1,221 | 12.8% |
| Graduate / Professional | 366 | 3.8% |
| Total | 9,548 | 100.0% |
School Enrollment by Age by Funding Source in Fulton County
Out of a total of 9,548 students who are enrolled in schools in Fulton County, 1,184 (12.4%) attend a private institution, while the remaining 8,364 (87.6%) are enrolled in public schools. The age group of 35 years and over has the highest likelihood of being enrolled in private schools, with 99 (26.0% in the age bracket) enrolled. Conversely, the age group of 15 to 17 year olds has the lowest likelihood of being enrolled in a private school, with 1,541 (92.1% in the age bracket) attending a public institution.

| Age Bracket | Public School | Private School |
| 3 to 4 Year Olds | 289 (81.9%) | 64 (18.1%) |
| 5 to 9 Year Old | 2,423 (90.5%) | 255 (9.5%) |
| 10 to 14 Year Olds | 2,498 (87.5%) | 358 (12.5%) |
| 15 to 17 Year Olds | 1,541 (92.1%) | 132 (7.9%) |
| 18 to 19 Year Olds | 565 (79.1%) | 149 (20.9%) |
| 20 to 24 Year Olds | 509 (91.7%) | 46 (8.3%) |
| 25 to 34 Year Olds | 254 (75.1%) | 84 (24.8%) |
| 35 Years and over | 282 (74.0%) | 99 (26.0%) |
| Total | 8,364 (87.6%) | 1,184 (12.4%) |
Educational Attainment by Field of Study in Fulton County
Education (1,206 | 21.7%), business (1,099 | 19.8%), science & technology (1,008 | 18.1%), arts & humanities (442 | 8.0%), and bio, nature & agricultural (416 | 7.5%) are the most common fields of study among 5,553 individuals in Fulton County who have obtained a bachelor's degree or higher.

| Field of Study | # Graduates | % Graduates |
| Computers & Mathematics | 119 | 2.1% |
| Bio, Nature & Agricultural | 416 | 7.5% |
| Physical & Health Sciences | 175 | 3.2% |
| Psychology | 82 | 1.5% |
| Social Sciences | 133 | 2.4% |
| Engineering | 277 | 5.0% |
| Multidisciplinary Studies | 18 | 0.3% |
| Science & Technology | 1,008 | 18.1% |
| Business | 1,099 | 19.8% |
| Education | 1,206 | 21.7% |
| Literature & Languages | 89 | 1.6% |
| Liberal Arts & History | 187 | 3.4% |
| Visual & Performing Arts | 170 | 3.1% |
| Communications | 132 | 2.4% |
| Arts & Humanities | 442 | 8.0% |
| Total | 5,553 | 100.0% |
Transportation & Commute in Fulton County
Vehicle Availability by Sex in Fulton County
The most prevalent vehicle ownership categories in Fulton County are males with 2 vehicles (4,479, accounting for 41.1%) and females with 2 vehicles (3,508, making up 47.5%).

| Vehicles Available | Male | Female |
| No Vehicle | 150 (1.4%) | 152 (1.6%) |
| 1 Vehicle | 956 (8.8%) | 1,435 (15.2%) |
| 2 Vehicles | 4,479 (41.1%) | 3,508 (37.2%) |
| 3 Vehicles | 2,664 (24.4%) | 1,986 (21.1%) |
| 4 Vehicles | 1,563 (14.3%) | 1,518 (16.1%) |
| 5 or more Vehicles | 1,090 (10.0%) | 827 (8.8%) |
| Total | 10,902 (100.0%) | 9,426 (100.0%) |
Commute Time in Fulton County
The most frequently occuring commute durations in Fulton County are 5 to 9 minutes (3,196 commuters, 16.3%), 15 to 19 minutes (2,481 commuters, 12.7%), and 20 to 24 minutes (2,452 commuters, 12.5%).

| Commute Time | # Commuters | % Commuters |
| Less than 5 Minutes | 1,496 | 7.6% |
| 5 to 9 Minutes | 3,196 | 16.3% |
| 10 to 14 Minutes | 2,314 | 11.8% |
| 15 to 19 Minutes | 2,481 | 12.7% |
| 20 to 24 Minutes | 2,452 | 12.5% |
| 25 to 29 Minutes | 1,431 | 7.3% |
| 30 to 34 Minutes | 2,020 | 10.3% |
| 35 to 39 Minutes | 612 | 3.1% |
| 40 to 44 Minutes | 917 | 4.7% |
| 45 to 59 Minutes | 1,473 | 7.5% |
| 60 to 89 Minutes | 677 | 3.5% |
| 90 or more Minutes | 501 | 2.6% |
Commute Time by Sex in Fulton County
The most common commute times in Fulton County are 5 to 9 minutes (1,748 commuters, 16.7%) for males and 5 to 9 minutes (1,448 commuters, 16.0%) for females.

| Commute Time | Male | Female |
| Less than 5 Minutes | 895 (8.5%) | 601 (6.6%) |
| 5 to 9 Minutes | 1,748 (16.7%) | 1,448 (16.0%) |
| 10 to 14 Minutes | 1,035 (9.9%) | 1,279 (14.1%) |
| 15 to 19 Minutes | 1,256 (12.0%) | 1,225 (13.5%) |
| 20 to 24 Minutes | 1,409 (13.4%) | 1,043 (11.5%) |
| 25 to 29 Minutes | 700 (6.7%) | 731 (8.1%) |
| 30 to 34 Minutes | 1,100 (10.5%) | 920 (10.1%) |
| 35 to 39 Minutes | 360 (3.4%) | 252 (2.8%) |
| 40 to 44 Minutes | 466 (4.4%) | 451 (5.0%) |
| 45 to 59 Minutes | 829 (7.9%) | 644 (7.1%) |
| 60 to 89 Minutes | 379 (3.6%) | 298 (3.3%) |
| 90 or more Minutes | 314 (3.0%) | 187 (2.1%) |
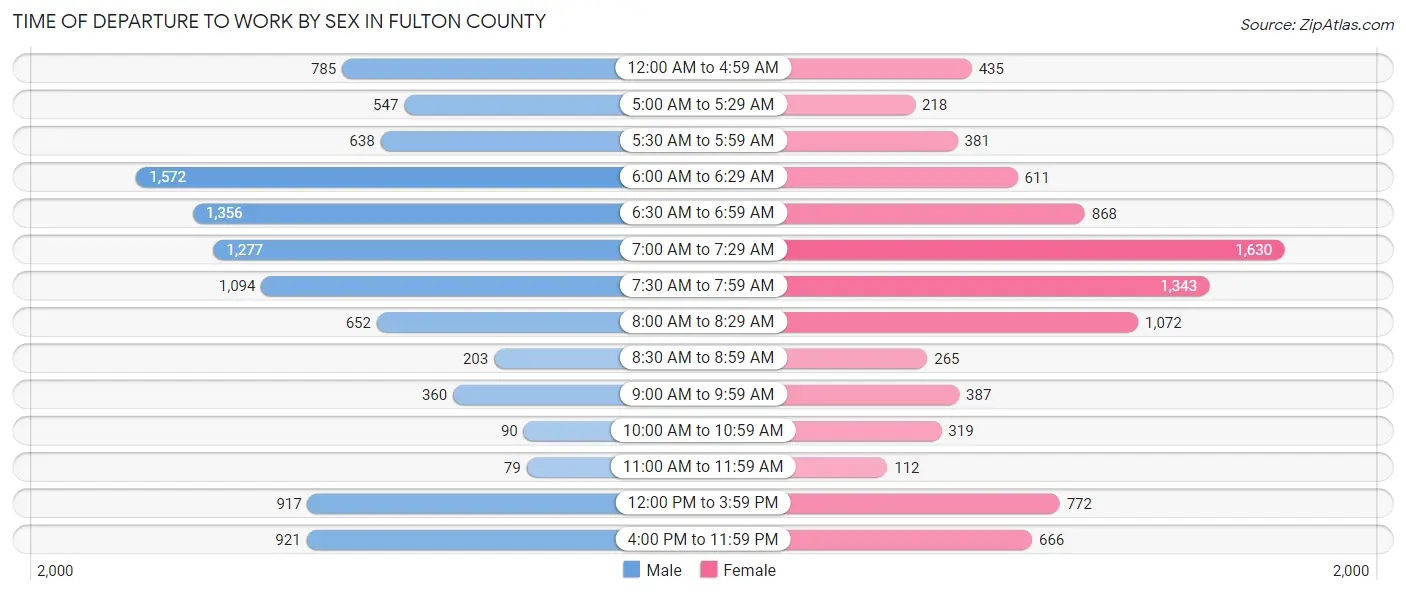
Time of Departure to Work by Sex in Fulton County
The most frequent times of departure to work in Fulton County are 6:00 AM to 6:29 AM (1,572, 15.0%) for males and 7:00 AM to 7:29 AM (1,630, 17.9%) for females.
| Time of Departure | Male | Female |
| 12:00 AM to 4:59 AM | 785 (7.5%) | 435 (4.8%) |
| 5:00 AM to 5:29 AM | 547 (5.2%) | 218 (2.4%) |
| 5:30 AM to 5:59 AM | 638 (6.1%) | 381 (4.2%) |
| 6:00 AM to 6:29 AM | 1,572 (15.0%) | 611 (6.7%) |
| 6:30 AM to 6:59 AM | 1,356 (12.9%) | 868 (9.6%) |
| 7:00 AM to 7:29 AM | 1,277 (12.2%) | 1,630 (17.9%) |
| 7:30 AM to 7:59 AM | 1,094 (10.4%) | 1,343 (14.8%) |
| 8:00 AM to 8:29 AM | 652 (6.2%) | 1,072 (11.8%) |
| 8:30 AM to 8:59 AM | 203 (1.9%) | 265 (2.9%) |
| 9:00 AM to 9:59 AM | 360 (3.4%) | 387 (4.3%) |
| 10:00 AM to 10:59 AM | 90 (0.9%) | 319 (3.5%) |
| 11:00 AM to 11:59 AM | 79 (0.7%) | 112 (1.2%) |
| 12:00 PM to 3:59 PM | 917 (8.7%) | 772 (8.5%) |
| 4:00 PM to 11:59 PM | 921 (8.8%) | 666 (7.3%) |
| Total | 10,491 (100.0%) | 9,079 (100.0%) |
Housing Occupancy in Fulton County
Occupancy by Ownership in Fulton County
Of the total 16,869 dwellings in Fulton County, owner-occupied units account for 13,781 (81.7%), while renter-occupied units make up 3,088 (18.3%).
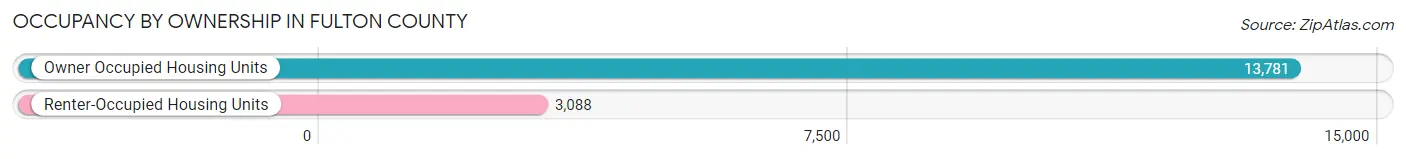
| Occupancy | # Housing Units | % Housing Units |
| Owner Occupied Housing Units | 13,781 | 81.7% |
| Renter-Occupied Housing Units | 3,088 | 18.3% |
| Total Occupied Housing Units | 16,869 | 100.0% |
Occupancy by Household Size in Fulton County
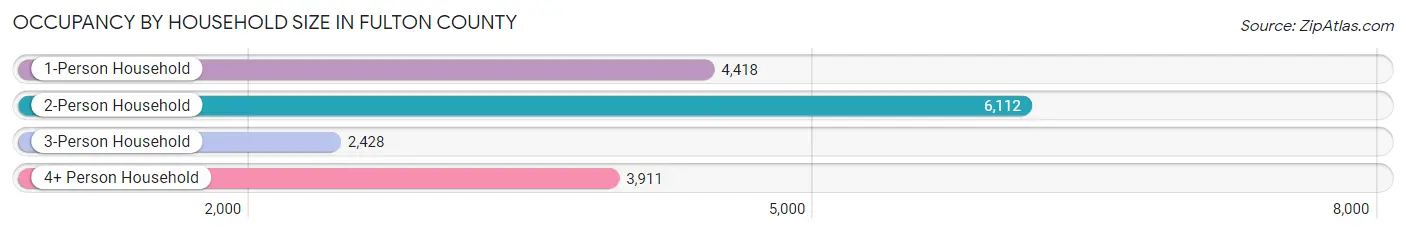
| Household Size | # Housing Units | % Housing Units |
| 1-Person Household | 4,418 | 26.2% |
| 2-Person Household | 6,112 | 36.2% |
| 3-Person Household | 2,428 | 14.4% |
| 4+ Person Household | 3,911 | 23.2% |
| Total Housing Units | 16,869 | 100.0% |
Occupancy by Ownership by Household Size in Fulton County
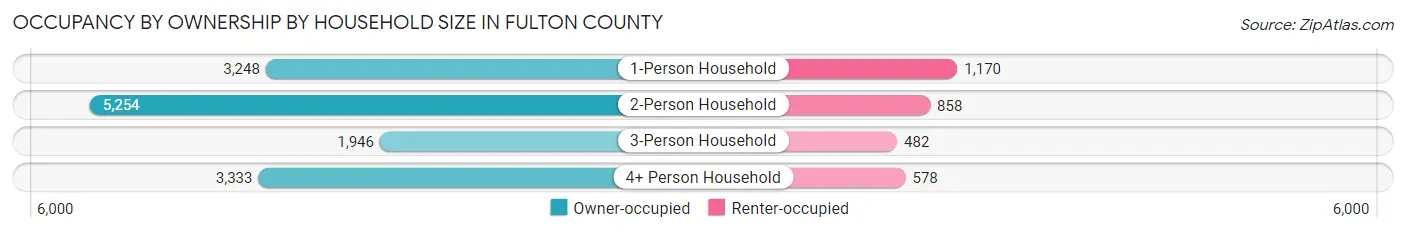
| Household Size | Owner-occupied | Renter-occupied |
| 1-Person Household | 3,248 (73.5%) | 1,170 (26.5%) |
| 2-Person Household | 5,254 (86.0%) | 858 (14.0%) |
| 3-Person Household | 1,946 (80.1%) | 482 (19.9%) |
| 4+ Person Household | 3,333 (85.2%) | 578 (14.8%) |
| Total Housing Units | 13,781 (81.7%) | 3,088 (18.3%) |
Occupancy by Educational Attainment in Fulton County
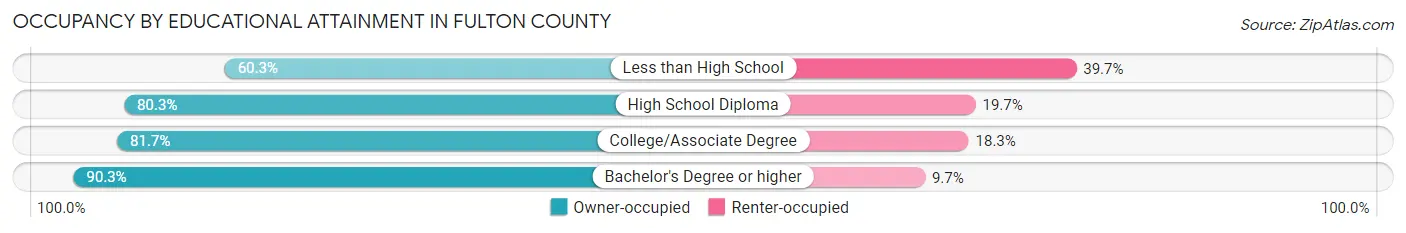
| Household Size | Owner-occupied | Renter-occupied |
| Less than High School | 535 (60.3%) | 352 (39.7%) |
| High School Diploma | 5,400 (80.3%) | 1,326 (19.7%) |
| College/Associate Degree | 4,852 (81.7%) | 1,089 (18.3%) |
| Bachelor's Degree or higher | 2,994 (90.3%) | 321 (9.7%) |
Occupancy by Age of Householder in Fulton County
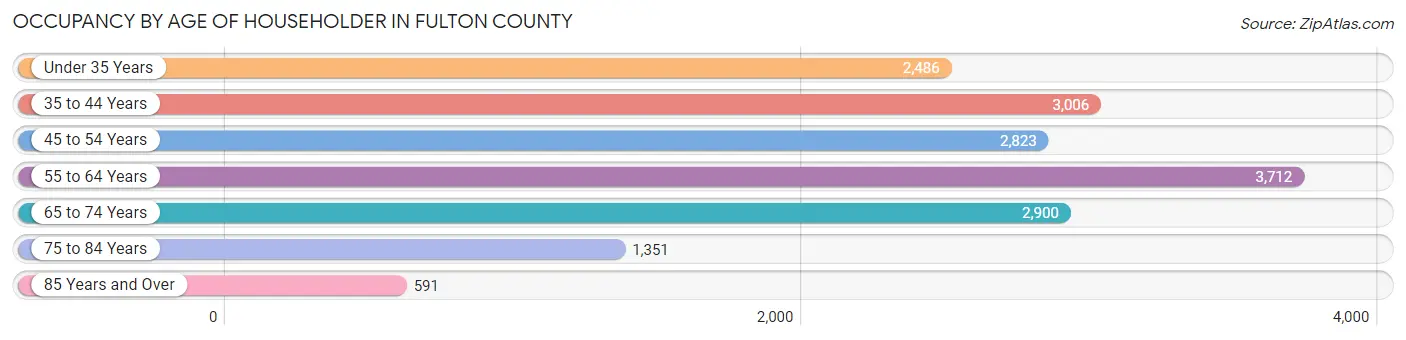
| Age Bracket | # Households | % Households |
| Under 35 Years | 2,486 | 14.7% |
| 35 to 44 Years | 3,006 | 17.8% |
| 45 to 54 Years | 2,823 | 16.7% |
| 55 to 64 Years | 3,712 | 22.0% |
| 65 to 74 Years | 2,900 | 17.2% |
| 75 to 84 Years | 1,351 | 8.0% |
| 85 Years and Over | 591 | 3.5% |
| Total | 16,869 | 100.0% |
Housing Finances in Fulton County
Median Income by Occupancy in Fulton County

| Occupancy Type | # Households | Median Income |
| Owner-Occupied | 13,781 (81.7%) | $78,842 |
| Renter-Occupied | 3,088 (18.3%) | $47,024 |
| Average | 16,869 (100.0%) | $71,453 |
Occupancy by Householder Income Bracket in Fulton County
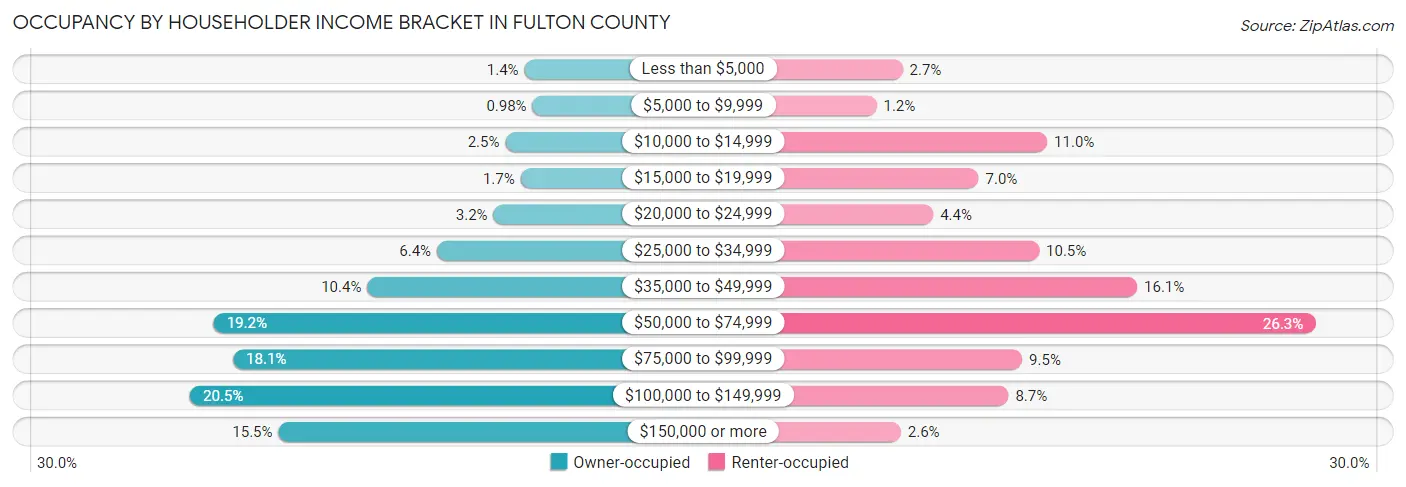
| Income Bracket | Owner-occupied | Renter-occupied |
| Less than $5,000 | 199 (1.4%) | 83 (2.7%) |
| $5,000 to $9,999 | 135 (1.0%) | 37 (1.2%) |
| $10,000 to $14,999 | 349 (2.5%) | 338 (11.0%) |
| $15,000 to $19,999 | 229 (1.7%) | 217 (7.0%) |
| $20,000 to $24,999 | 443 (3.2%) | 137 (4.4%) |
| $25,000 to $34,999 | 888 (6.4%) | 324 (10.5%) |
| $35,000 to $49,999 | 1,436 (10.4%) | 497 (16.1%) |
| $50,000 to $74,999 | 2,644 (19.2%) | 811 (26.3%) |
| $75,000 to $99,999 | 2,492 (18.1%) | 294 (9.5%) |
| $100,000 to $149,999 | 2,830 (20.5%) | 270 (8.7%) |
| $150,000 or more | 2,136 (15.5%) | 80 (2.6%) |
| Total | 13,781 (100.0%) | 3,088 (100.0%) |
Monthly Housing Cost Tiers in Fulton County
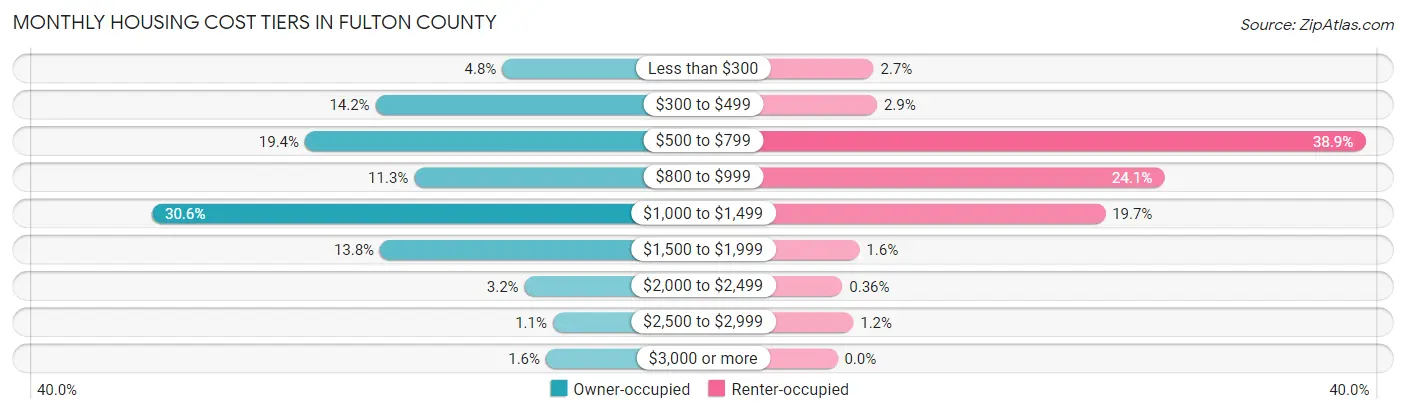
| Monthly Cost | Owner-occupied | Renter-occupied |
| Less than $300 | 665 (4.8%) | 82 (2.7%) |
| $300 to $499 | 1,951 (14.2%) | 90 (2.9%) |
| $500 to $799 | 2,668 (19.4%) | 1,200 (38.9%) |
| $800 to $999 | 1,559 (11.3%) | 743 (24.1%) |
| $1,000 to $1,499 | 4,219 (30.6%) | 609 (19.7%) |
| $1,500 to $1,999 | 1,906 (13.8%) | 50 (1.6%) |
| $2,000 to $2,499 | 439 (3.2%) | 11 (0.4%) |
| $2,500 to $2,999 | 152 (1.1%) | 36 (1.2%) |
| $3,000 or more | 222 (1.6%) | 0 (0.0%) |
| Total | 13,781 (100.0%) | 3,088 (100.0%) |
Physical Housing Characteristics in Fulton County
Housing Structures in Fulton County
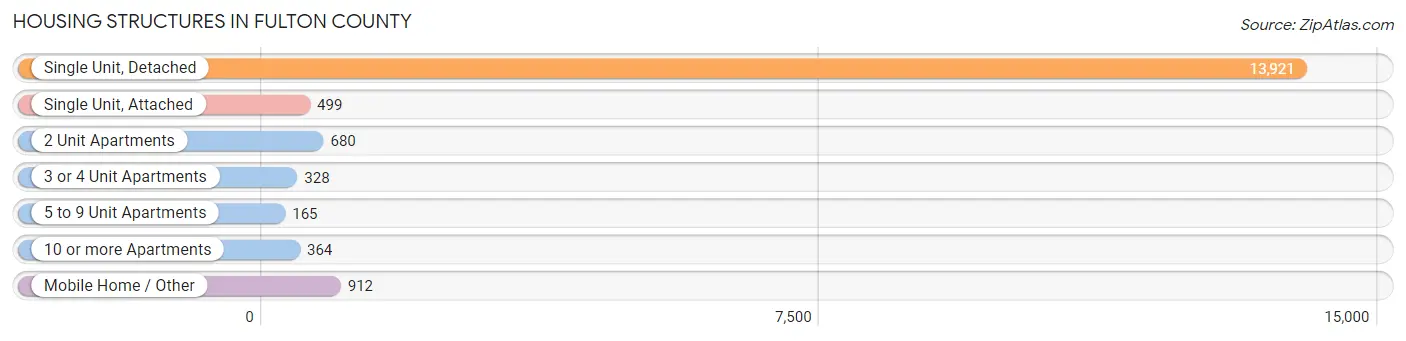
| Structure Type | # Housing Units | % Housing Units |
| Single Unit, Detached | 13,921 | 82.5% |
| Single Unit, Attached | 499 | 3.0% |
| 2 Unit Apartments | 680 | 4.0% |
| 3 or 4 Unit Apartments | 328 | 1.9% |
| 5 to 9 Unit Apartments | 165 | 1.0% |
| 10 or more Apartments | 364 | 2.2% |
| Mobile Home / Other | 912 | 5.4% |
| Total | 16,869 | 100.0% |
Housing Structures by Occupancy in Fulton County
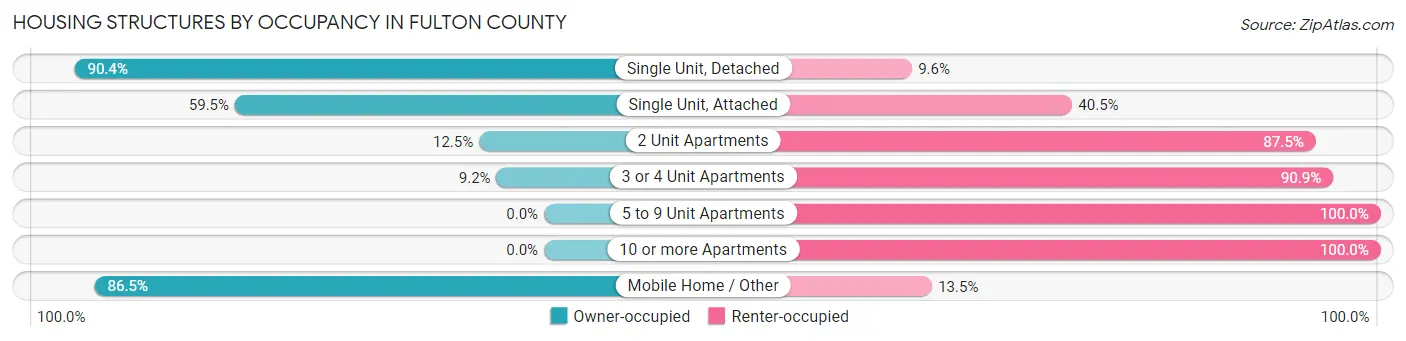
| Structure Type | Owner-occupied | Renter-occupied |
| Single Unit, Detached | 12,580 (90.4%) | 1,341 (9.6%) |
| Single Unit, Attached | 297 (59.5%) | 202 (40.5%) |
| 2 Unit Apartments | 85 (12.5%) | 595 (87.5%) |
| 3 or 4 Unit Apartments | 30 (9.1%) | 298 (90.8%) |
| 5 to 9 Unit Apartments | 0 (0.0%) | 165 (100.0%) |
| 10 or more Apartments | 0 (0.0%) | 364 (100.0%) |
| Mobile Home / Other | 789 (86.5%) | 123 (13.5%) |
| Total | 13,781 (81.7%) | 3,088 (18.3%) |
Housing Structures by Number of Rooms in Fulton County
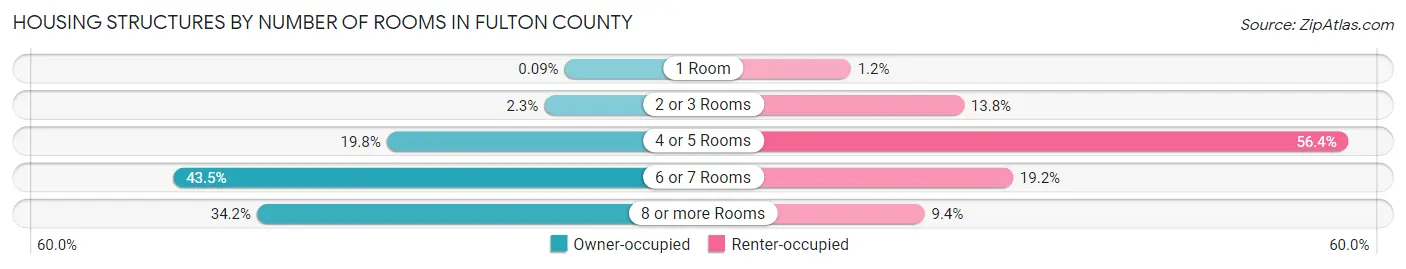
| Number of Rooms | Owner-occupied | Renter-occupied |
| 1 Room | 13 (0.1%) | 37 (1.2%) |
| 2 or 3 Rooms | 323 (2.3%) | 425 (13.8%) |
| 4 or 5 Rooms | 2,733 (19.8%) | 1,743 (56.4%) |
| 6 or 7 Rooms | 5,995 (43.5%) | 593 (19.2%) |
| 8 or more Rooms | 4,717 (34.2%) | 290 (9.4%) |
| Total | 13,781 (100.0%) | 3,088 (100.0%) |
Housing Structure by Heating Type in Fulton County
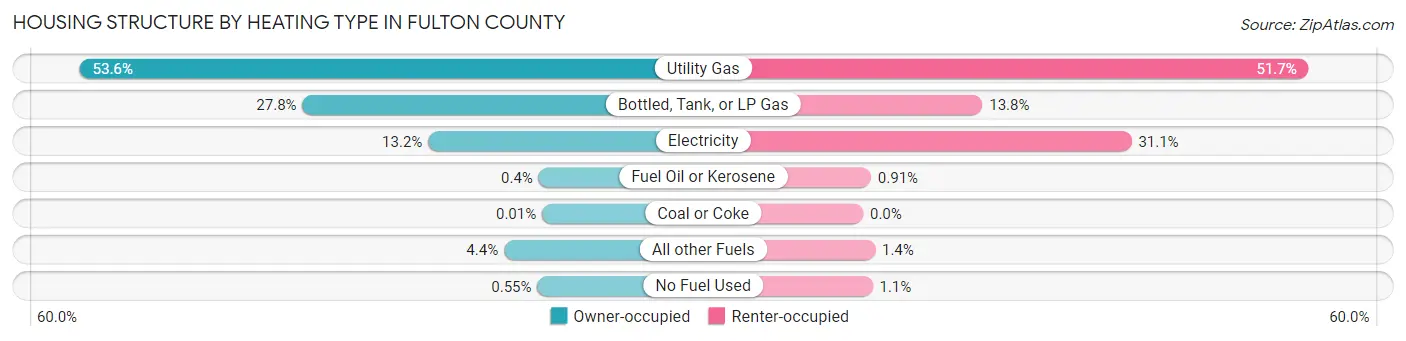
| Heating Type | Owner-occupied | Renter-occupied |
| Utility Gas | 7,390 (53.6%) | 1,595 (51.6%) |
| Bottled, Tank, or LP Gas | 3,830 (27.8%) | 427 (13.8%) |
| Electricity | 1,820 (13.2%) | 961 (31.1%) |
| Fuel Oil or Kerosene | 55 (0.4%) | 28 (0.9%) |
| Coal or Coke | 1 (0.0%) | 0 (0.0%) |
| All other Fuels | 609 (4.4%) | 43 (1.4%) |
| No Fuel Used | 76 (0.5%) | 34 (1.1%) |
| Total | 13,781 (100.0%) | 3,088 (100.0%) |
Household Vehicle Usage in Fulton County

| Vehicles per Household | Owner-occupied | Renter-occupied |
| No Vehicle | 200 (1.5%) | 222 (7.2%) |
| 1 Vehicle | 2,638 (19.1%) | 1,605 (52.0%) |
| 2 Vehicles | 5,934 (43.1%) | 891 (28.8%) |
| 3 or more Vehicles | 5,009 (36.3%) | 370 (12.0%) |
| Total | 13,781 (100.0%) | 3,088 (100.0%) |
Real Estate & Mortgages in Fulton County
Real Estate and Mortgage Overview in Fulton County
| Characteristic | Without Mortgage | With Mortgage |
| Housing Units | 5,286 | 8,495 |
| Median Property Value | $151,700 | $166,800 |
| Median Household Income | $56,924 | $1,525 |
| Monthly Housing Costs | $510 | $210 |
| Real Estate Taxes | $2,178 | $120 |
Property Value by Mortgage Status in Fulton County
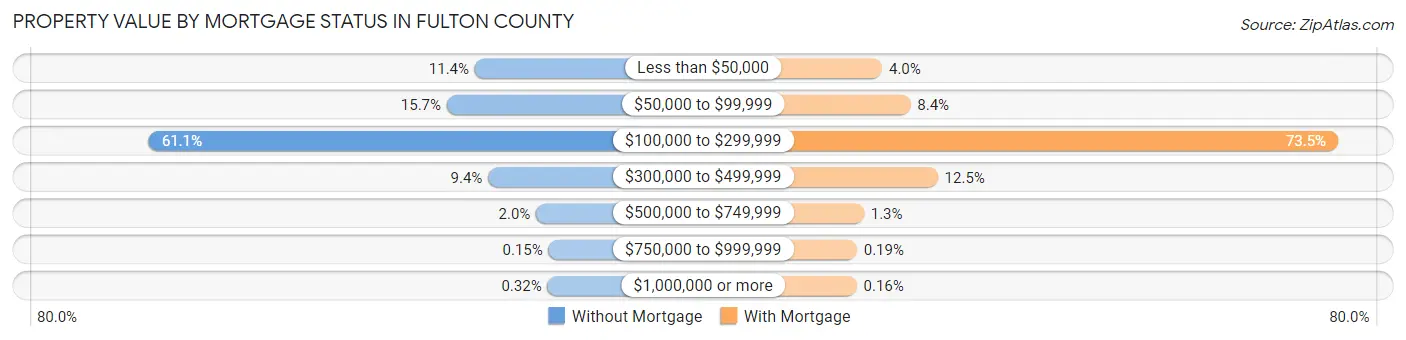
| Property Value | Without Mortgage | With Mortgage |
| Less than $50,000 | 602 (11.4%) | 343 (4.0%) |
| $50,000 to $99,999 | 828 (15.7%) | 709 (8.4%) |
| $100,000 to $299,999 | 3,228 (61.1%) | 6,244 (73.5%) |
| $300,000 to $499,999 | 495 (9.4%) | 1,063 (12.5%) |
| $500,000 to $749,999 | 108 (2.0%) | 106 (1.3%) |
| $750,000 to $999,999 | 8 (0.2%) | 16 (0.2%) |
| $1,000,000 or more | 17 (0.3%) | 14 (0.2%) |
| Total | 5,286 (100.0%) | 8,495 (100.0%) |
Household Income by Mortgage Status in Fulton County

| Household Income | Without Mortgage | With Mortgage |
| Less than $10,000 | 230 (4.3%) | 300 (3.5%) |
| $10,000 to $24,999 | 716 (13.6%) | 104 (1.2%) |
| $25,000 to $34,999 | 620 (11.7%) | 305 (3.6%) |
| $35,000 to $49,999 | 766 (14.5%) | 268 (3.2%) |
| $50,000 to $74,999 | 1,035 (19.6%) | 670 (7.9%) |
| $75,000 to $99,999 | 667 (12.6%) | 1,609 (18.9%) |
| $100,000 to $149,999 | 641 (12.1%) | 1,825 (21.5%) |
| $150,000 or more | 611 (11.6%) | 2,189 (25.8%) |
| Total | 5,286 (100.0%) | 8,495 (100.0%) |
Property Value to Household Income Ratio in Fulton County
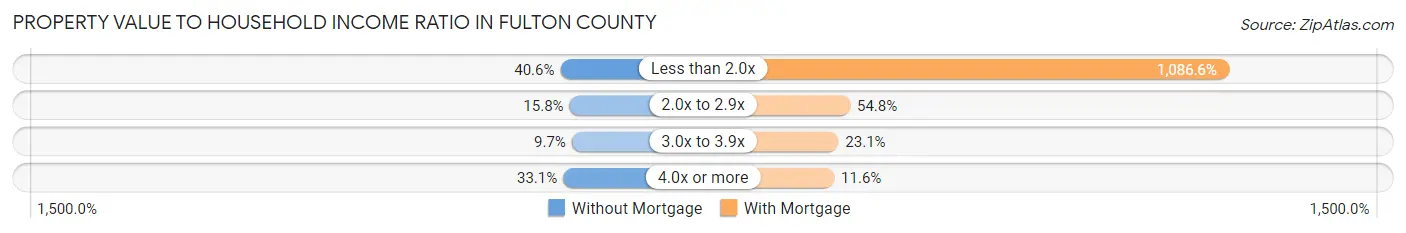
| Value-to-Income Ratio | Without Mortgage | With Mortgage |
| Less than 2.0x | 2,145 (40.6%) | 92,310 (1,086.6%) |
| 2.0x to 2.9x | 836 (15.8%) | 4,656 (54.8%) |
| 3.0x to 3.9x | 514 (9.7%) | 1,963 (23.1%) |
| 4.0x or more | 1,750 (33.1%) | 983 (11.6%) |
| Total | 5,286 (100.0%) | 8,495 (100.0%) |
Real Estate Taxes by Mortgage Status in Fulton County
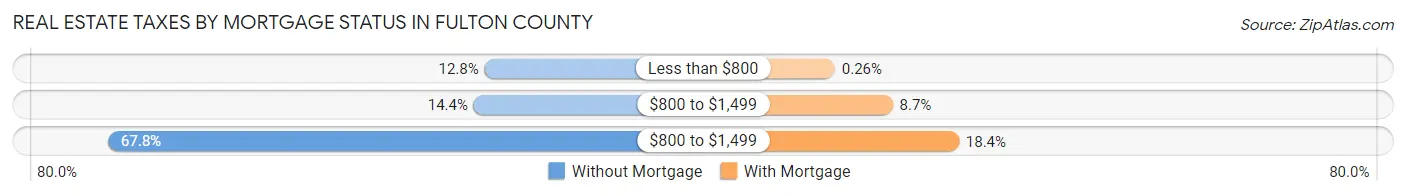
| Property Taxes | Without Mortgage | With Mortgage |
| Less than $800 | 676 (12.8%) | 22 (0.3%) |
| $800 to $1,499 | 759 (14.4%) | 739 (8.7%) |
| $800 to $1,499 | 3,585 (67.8%) | 1,561 (18.4%) |
| Total | 5,286 (100.0%) | 8,495 (100.0%) |
Health & Disability in Fulton County
Health Insurance Coverage by Age in Fulton County
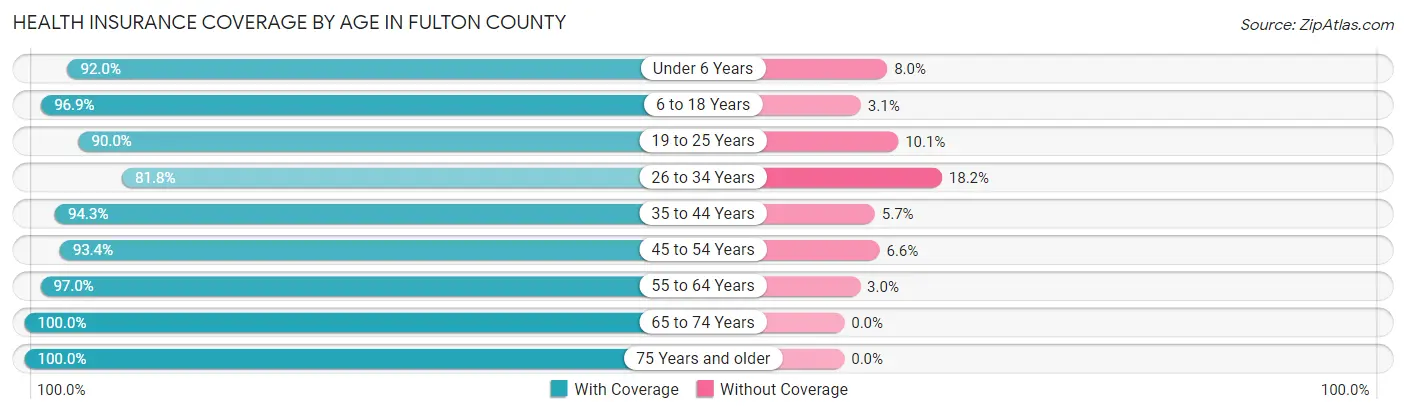
| Age Bracket | With Coverage | Without Coverage |
| Under 6 Years | 2,761 (92.0%) | 240 (8.0%) |
| 6 to 18 Years | 7,252 (96.9%) | 232 (3.1%) |
| 19 to 25 Years | 2,937 (89.9%) | 328 (10.1%) |
| 26 to 34 Years | 3,463 (81.8%) | 770 (18.2%) |
| 35 to 44 Years | 4,943 (94.3%) | 298 (5.7%) |
| 45 to 54 Years | 4,935 (93.4%) | 347 (6.6%) |
| 55 to 64 Years | 5,962 (97.0%) | 182 (3.0%) |
| 65 to 74 Years | 4,709 (100.0%) | 0 (0.0%) |
| 75 Years and older | 2,841 (100.0%) | 0 (0.0%) |
| Total | 39,803 (94.3%) | 2,397 (5.7%) |
Health Insurance Coverage by Citizenship Status in Fulton County
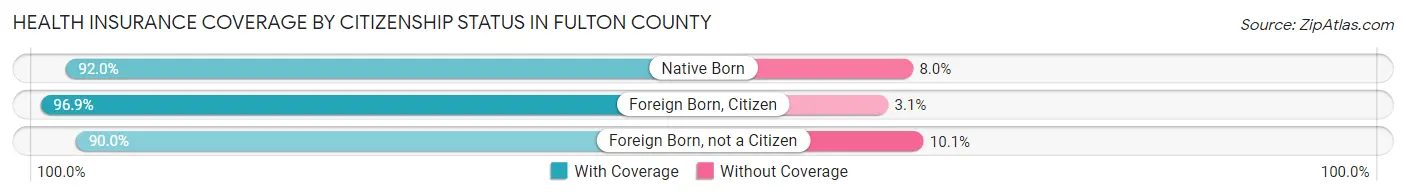
| Citizenship Status | With Coverage | Without Coverage |
| Native Born | 2,761 (92.0%) | 240 (8.0%) |
| Foreign Born, Citizen | 7,252 (96.9%) | 232 (3.1%) |
| Foreign Born, not a Citizen | 2,937 (89.9%) | 328 (10.1%) |
Health Insurance Coverage by Household Income in Fulton County
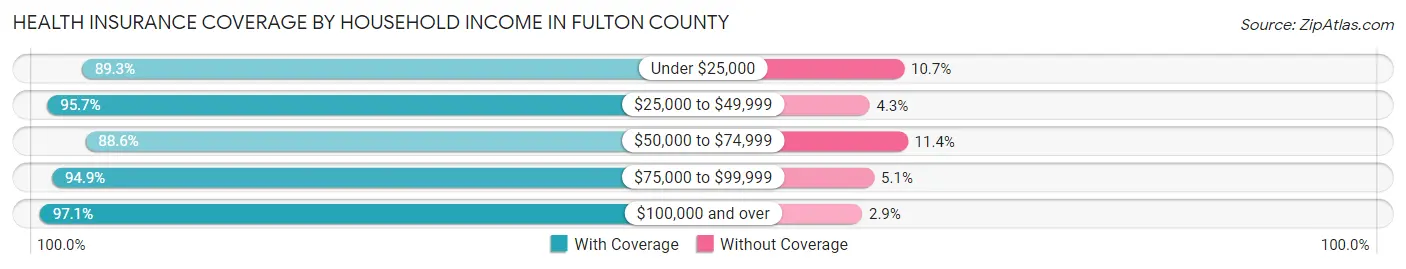
| Household Income | With Coverage | Without Coverage |
| Under $25,000 | 3,215 (89.3%) | 386 (10.7%) |
| $25,000 to $49,999 | 5,886 (95.7%) | 262 (4.3%) |
| $50,000 to $74,999 | 6,714 (88.6%) | 864 (11.4%) |
| $75,000 to $99,999 | 7,207 (94.9%) | 390 (5.1%) |
| $100,000 and over | 16,726 (97.1%) | 492 (2.9%) |
Public vs Private Health Insurance Coverage by Age in Fulton County
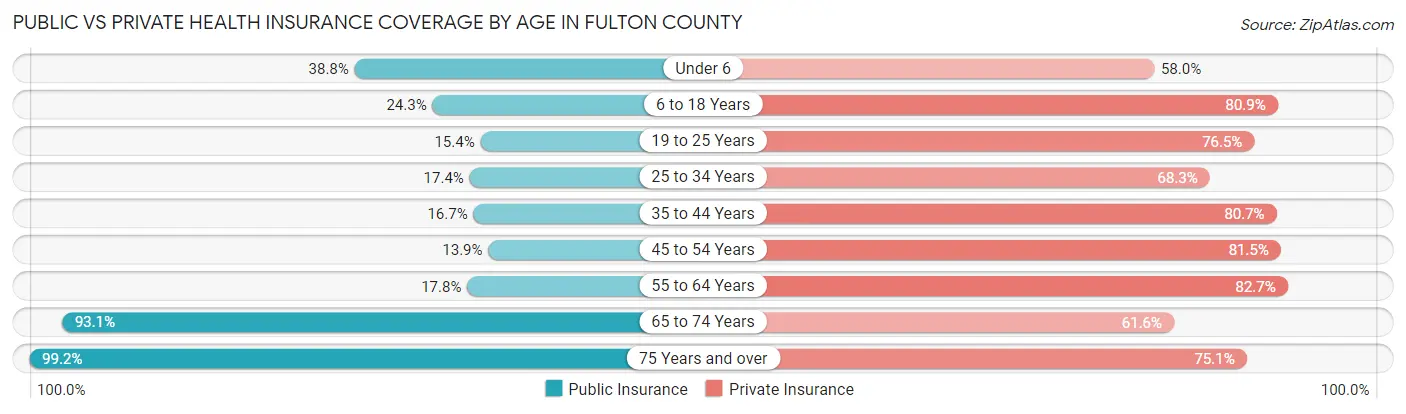
| Age Bracket | Public Insurance | Private Insurance |
| Under 6 | 1,163 (38.8%) | 1,739 (58.0%) |
| 6 to 18 Years | 1,818 (24.3%) | 6,052 (80.9%) |
| 19 to 25 Years | 502 (15.4%) | 2,499 (76.5%) |
| 25 to 34 Years | 736 (17.4%) | 2,890 (68.3%) |
| 35 to 44 Years | 874 (16.7%) | 4,228 (80.7%) |
| 45 to 54 Years | 735 (13.9%) | 4,303 (81.5%) |
| 55 to 64 Years | 1,096 (17.8%) | 5,083 (82.7%) |
| 65 to 74 Years | 4,384 (93.1%) | 2,902 (61.6%) |
| 75 Years and over | 2,817 (99.2%) | 2,134 (75.1%) |
| Total | 14,125 (33.5%) | 31,830 (75.4%) |
Disability Status by Sex by Age in Fulton County
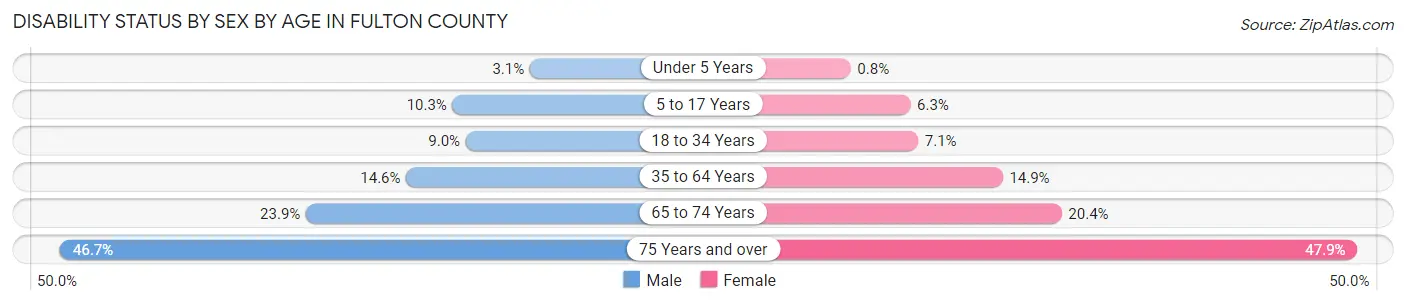
| Age Bracket | Male | Female |
| Under 5 Years | 40 (3.1%) | 9 (0.8%) |
| 5 to 17 Years | 405 (10.3%) | 226 (6.3%) |
| 18 to 34 Years | 375 (9.0%) | 276 (7.1%) |
| 35 to 64 Years | 1,220 (14.6%) | 1,237 (14.9%) |
| 65 to 74 Years | 543 (23.9%) | 496 (20.4%) |
| 75 Years and over | 555 (46.7%) | 791 (47.8%) |
Disability Class by Sex by Age in Fulton County
Disability Class: Hearing Difficulty
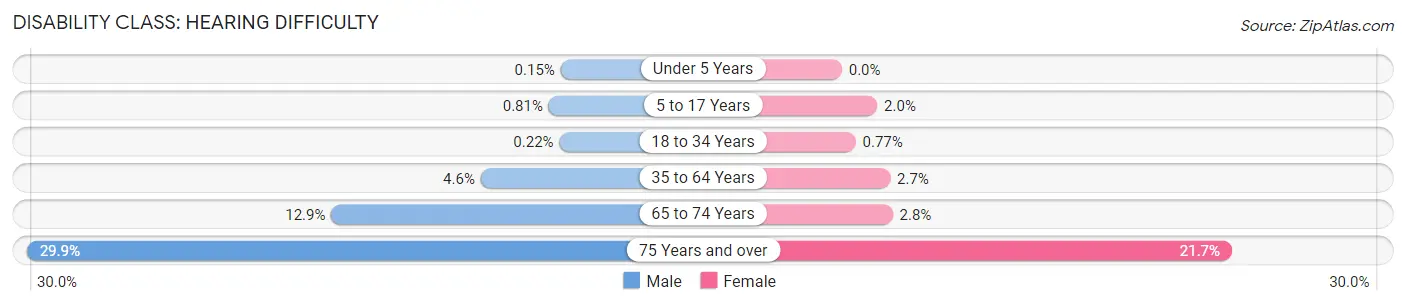
| Age Bracket | Male | Female |
| Under 5 Years | 2 (0.2%) | 0 (0.0%) |
| 5 to 17 Years | 32 (0.8%) | 70 (2.0%) |
| 18 to 34 Years | 9 (0.2%) | 30 (0.8%) |
| 35 to 64 Years | 385 (4.6%) | 223 (2.7%) |
| 65 to 74 Years | 294 (12.9%) | 69 (2.8%) |
| 75 Years and over | 355 (29.9%) | 359 (21.7%) |
Disability Class: Vision Difficulty
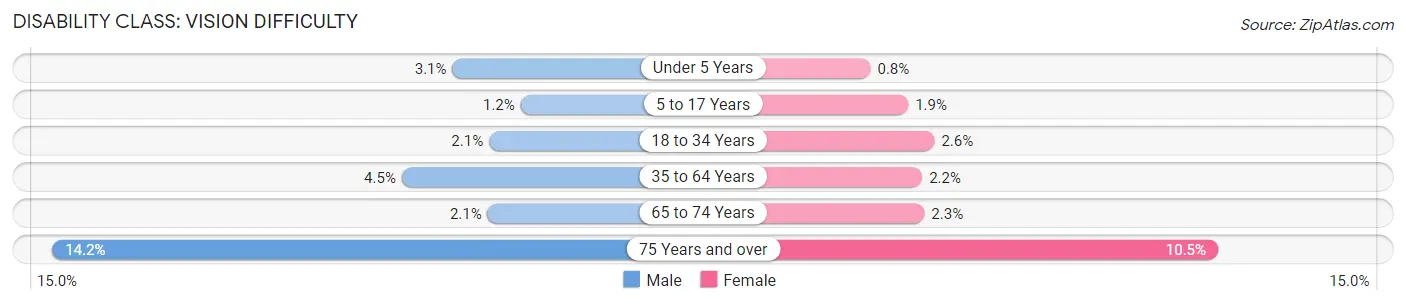
| Age Bracket | Male | Female |
| Under 5 Years | 40 (3.1%) | 9 (0.8%) |
| 5 to 17 Years | 47 (1.2%) | 66 (1.8%) |
| 18 to 34 Years | 86 (2.1%) | 101 (2.6%) |
| 35 to 64 Years | 377 (4.5%) | 186 (2.2%) |
| 65 to 74 Years | 48 (2.1%) | 56 (2.3%) |
| 75 Years and over | 169 (14.2%) | 173 (10.5%) |
Disability Class: Cognitive Difficulty

| Age Bracket | Male | Female |
| 5 to 17 Years | 330 (8.4%) | 210 (5.9%) |
| 18 to 34 Years | 275 (6.6%) | 152 (3.9%) |
| 35 to 64 Years | 563 (6.7%) | 587 (7.1%) |
| 65 to 74 Years | 103 (4.5%) | 96 (3.9%) |
| 75 Years and over | 100 (8.4%) | 154 (9.3%) |
Disability Class: Ambulatory Difficulty

| Age Bracket | Male | Female |
| 5 to 17 Years | 106 (2.7%) | 69 (1.9%) |
| 18 to 34 Years | 30 (0.7%) | 34 (0.9%) |
| 35 to 64 Years | 708 (8.5%) | 755 (9.1%) |
| 65 to 74 Years | 296 (13.0%) | 328 (13.5%) |
| 75 Years and over | 297 (25.0%) | 603 (36.5%) |
Disability Class: Self-Care Difficulty
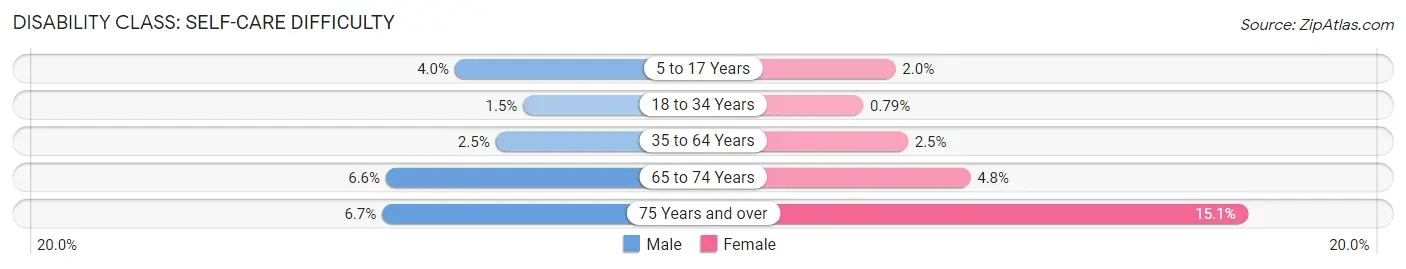
| Age Bracket | Male | Female |
| 5 to 17 Years | 159 (4.0%) | 71 (2.0%) |
| 18 to 34 Years | 62 (1.5%) | 31 (0.8%) |
| 35 to 64 Years | 211 (2.5%) | 203 (2.5%) |
| 65 to 74 Years | 150 (6.6%) | 116 (4.8%) |
| 75 Years and over | 80 (6.7%) | 249 (15.1%) |
Technology Access in Fulton County
Computing Device Access in Fulton County
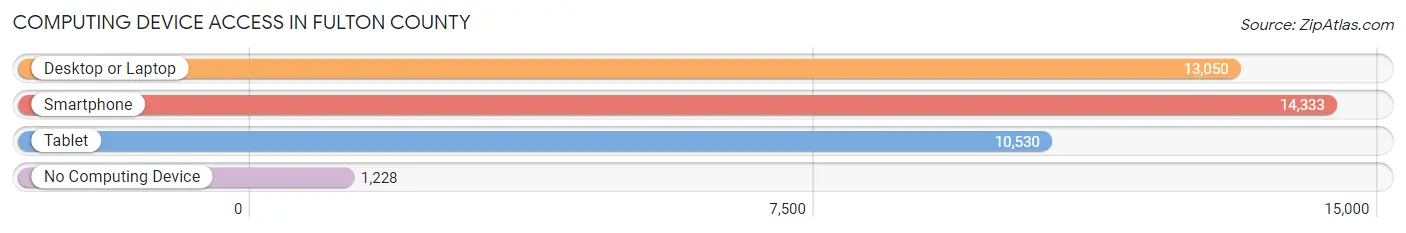
| Device Type | # Households | % Households |
| Desktop or Laptop | 13,050 | 77.4% |
| Smartphone | 14,333 | 85.0% |
| Tablet | 10,530 | 62.4% |
| No Computing Device | 1,228 | 7.3% |
| Total | 16,869 | 100.0% |
Internet Access in Fulton County
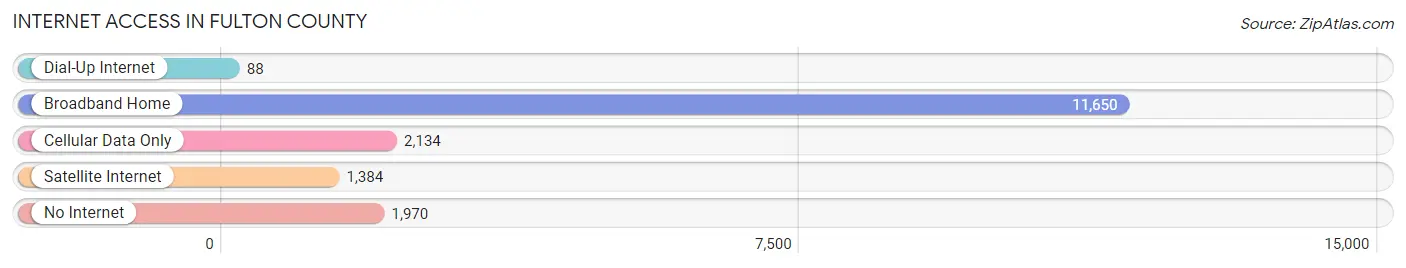
| Internet Type | # Households | % Households |
| Dial-Up Internet | 88 | 0.5% |
| Broadband Home | 11,650 | 69.1% |
| Cellular Data Only | 2,134 | 12.7% |
| Satellite Internet | 1,384 | 8.2% |
| No Internet | 1,970 | 11.7% |
| Total | 16,869 | 100.0% |
Fulton County Summary
Fulton County, Ohio is located in the northwest corner of the state and is part of the Toledo Metropolitan Statistical Area. It is bordered by Michigan to the north, Indiana to the west, and Lucas County to the south. The county seat is Wauseon, and the largest city is Delta. The county was established in 1835 and named after Robert Fulton, the inventor of the steamboat.
Geography
Fulton County covers an area of 437 square miles and is mostly flat, with some rolling hills in the northern part of the county. The county is drained by the Maumee River, which forms the northern border of the county. The county is also home to several small lakes, including Lake Olander, Lake Luckey, and Lake Township. The county is mostly rural, with the majority of the population living in small towns and villages.
Demographics
As of the 2010 census, the population of Fulton County was 42,698. The population is predominantly white (94.2%), with small percentages of African American (2.2%), Hispanic (1.7%), and Asian (0.7%) residents. The median household income is $48,845, and the median home value is $118,400.
Economy
Fulton County is home to a variety of industries, including manufacturing, agriculture, and tourism. The county is home to several large manufacturing companies, including the Wauseon Machine and Tool Company, the Delta Foundry, and the Delta Plastics Company. Agriculture is also an important part of the county’s economy, with corn, soybeans, and wheat being the primary crops. Tourism is also an important part of the county’s economy, with several popular attractions, including the Fulton County Fairgrounds, the Fulton County Historical Society Museum, and the Fulton County Speedway.
History
Fulton County was established in 1835 and named after Robert Fulton, the inventor of the steamboat. The county was originally part of Lucas County, and was created to provide better access to the Maumee River. The county seat was originally located in Swanton, but was moved to Wauseon in 1845.
The county was largely agricultural in the 19th century, with corn, wheat, and oats being the primary crops. The county also had several small manufacturing companies, including the Wauseon Machine and Tool Company, which was established in 1867.
In the 20th century, the county’s economy shifted to manufacturing, with several large companies, including the Delta Foundry and the Delta Plastics Company, being established in the county. The county also saw an increase in tourism, with several popular attractions, including the Fulton County Fairgrounds, the Fulton County Historical Society Museum, and the Fulton County Speedway.
Today, Fulton County is a largely rural county, with a diverse economy. The county is home to several large manufacturing companies, as well as a variety of agricultural and tourism-related businesses. The county is also home to several small towns and villages, as well as several popular attractions.
Common Questions
What is the Total Population of Fulton County?
Total Population of Fulton County is 42,602.
What is the Total Male Population of Fulton County?
Total Male Population of Fulton County is 21,385.
What is the Total Female Population of Fulton County?
Total Female Population of Fulton County is 21,217.
What is the Ratio of Males per 100 Females in Fulton County?
There are 100.79 Males per 100 Females in Fulton County.
What is the Ratio of Females per 100 Males in Fulton County?
There are 99.21 Females per 100 Males in Fulton County.
What is the Median Population Age in Fulton County?
Median Population Age in Fulton County is 41.4 Years.
What is the Average Family Size in Fulton County
Average Family Size in Fulton County is 3.0 People.
What is the Average Household Size in Fulton County
Average Household Size in Fulton County is 2.5 People.
What is Per Capita Income in Fulton County?
Per Capita income in Fulton County is $35,230.
What is the Median Family Income in Fulton County?
Median Family Income in Fulton County is $83,935.
What is the Median Household income in Fulton County?
Median Household Income in Fulton County is $71,453.
What is Income or Wage Gap in Fulton County?
Income or Wage Gap in Fulton County is 41.9%.
Women in Fulton County earn 58.1 cents for every dollar earned by a man.
What is Family Income Deficit in Fulton County?
Family Income Deficit in Fulton County is $10,359.
Families that are below poverty line in Fulton County earn $10,359 less on average than the poverty threshold level.
What is Inequality or Gini Index in Fulton County?
Inequality or Gini Index in Fulton County is 0.41.
How Large is the Labor Force in Fulton County?
There are 21,362 People in the Labor Forcein in Fulton County.
What is the Percentage of People in the Labor Force in Fulton County?
63.2% of People are in the Labor Force in Fulton County.
What is the Unemployment Rate in Fulton County?
Unemployment Rate in Fulton County is 3.5%.