Fairfield County, OH
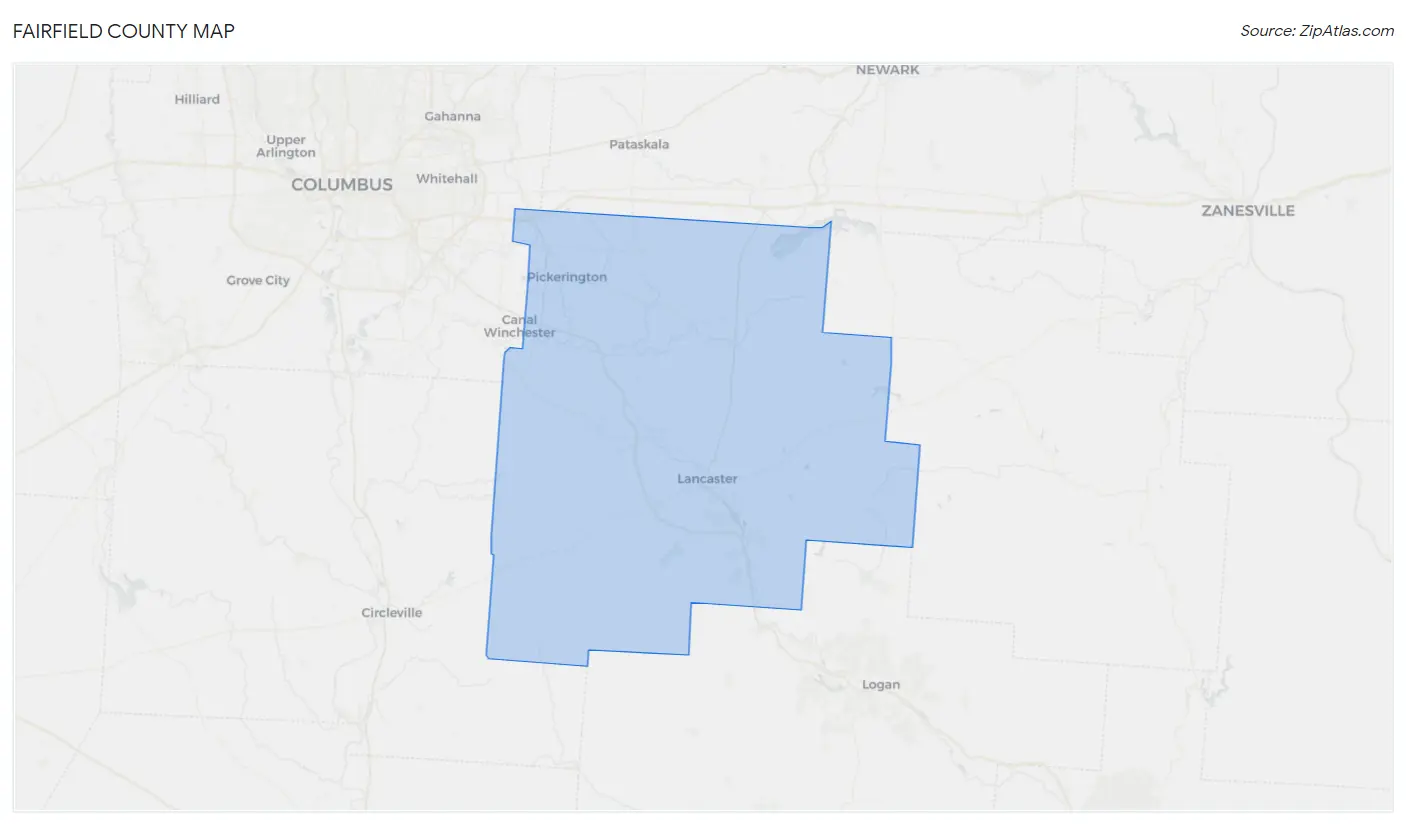
Fairfield County Map
Fairfield County Overview
159,371
TOTAL POPULATION
79,759
MALE POPULATION
79,612
FEMALE POPULATION
100.18
MALES / 100 FEMALES
99.82
FEMALES / 100 MALES
39.5
MEDIAN AGE
3.1
AVG FAMILY SIZE
2.7
AVG HOUSEHOLD SIZE
$38,783
PER CAPITA INCOME
$101,069
AVG FAMILY INCOME
$82,969
AVG HOUSEHOLD INCOME
28.9%
WAGE / INCOME GAP [ % ]
71.1¢/ $1
WAGE / INCOME GAP [ $ ]
$9,612
FAMILY INCOME DEFICIT
0.42
INEQUALITY / GINI INDEX
81,791
LABOR FORCE [ PEOPLE ]
64.8%
PERCENT IN LABOR FORCE
3.7%
UNEMPLOYMENT RATE
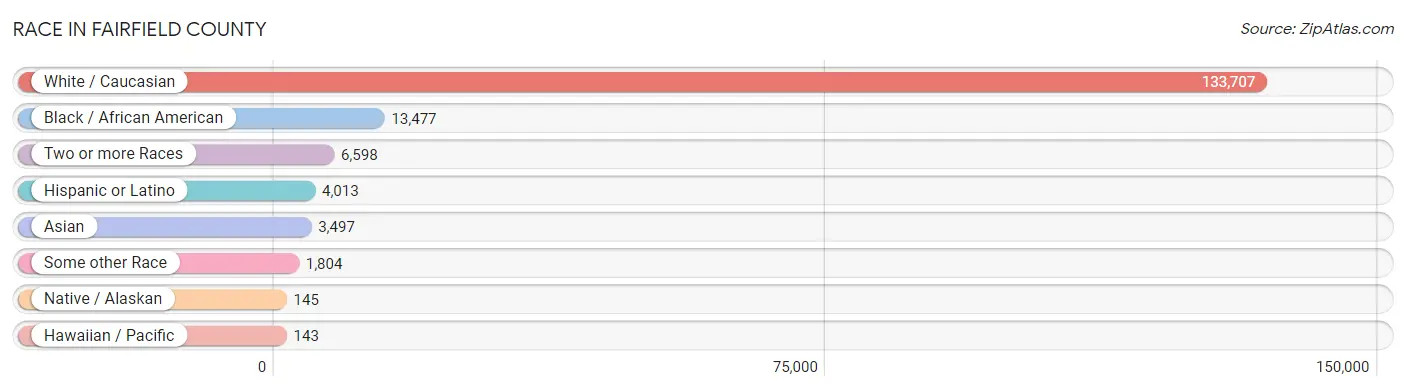
Race in Fairfield County
The most populous races in Fairfield County are White / Caucasian (133,707 | 83.9%), Black / African American (13,477 | 8.5%), and Two or more Races (6,598 | 4.1%).
| Race | # Population | % Population |
| Asian | 3,497 | 2.2% |
| Black / African American | 13,477 | 8.5% |
| Hawaiian / Pacific | 143 | 0.1% |
| Hispanic or Latino | 4,013 | 2.5% |
| Native / Alaskan | 145 | 0.1% |
| White / Caucasian | 133,707 | 83.9% |
| Two or more Races | 6,598 | 4.1% |
| Some other Race | 1,804 | 1.1% |
| Total | 159,371 | 100.0% |
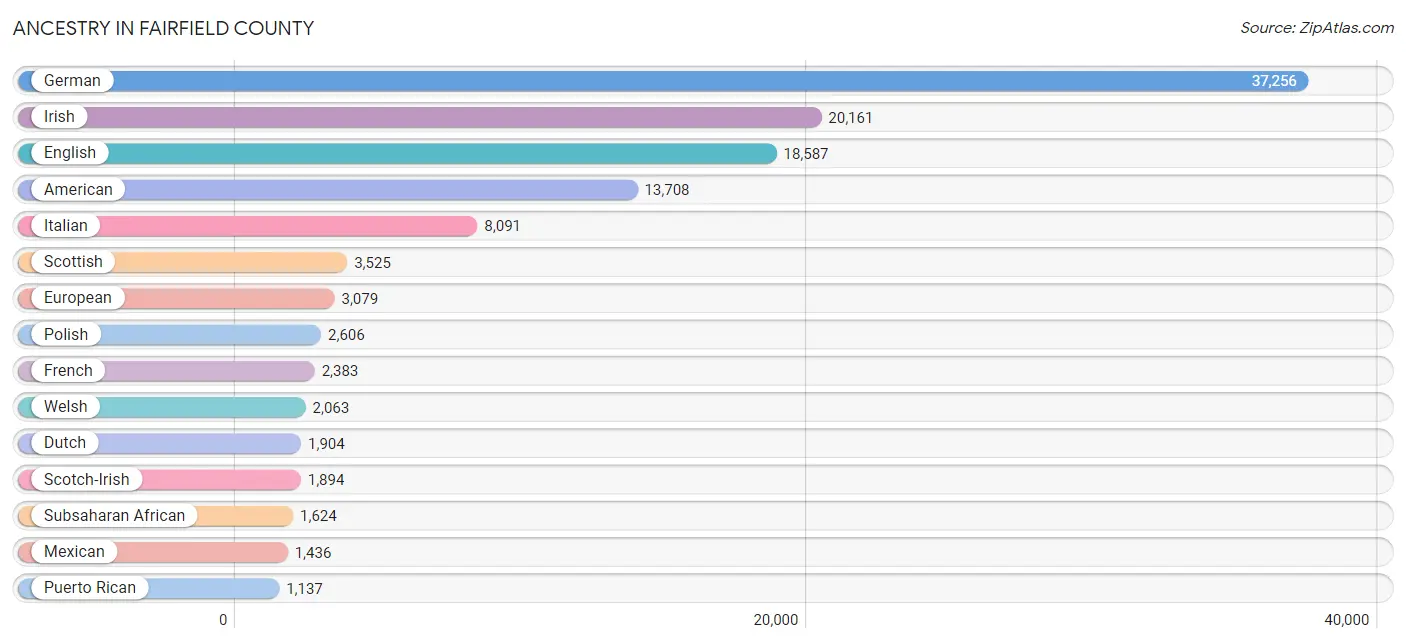
Ancestry in Fairfield County
The most populous ancestries reported in Fairfield County are German (37,256 | 23.4%), Irish (20,161 | 12.7%), English (18,587 | 11.7%), American (13,708 | 8.6%), and Italian (8,091 | 5.1%), together accounting for 61.4% of all Fairfield County residents.
| Ancestry | # Population | % Population |
| African | 287 | 0.2% |
| Aleut | 20 | 0.0% |
| Alsatian | 5 | 0.0% |
| American | 13,708 | 8.6% |
| Apache | 18 | 0.0% |
| Arab | 467 | 0.3% |
| Armenian | 17 | 0.0% |
| Austrian | 216 | 0.1% |
| Belgian | 71 | 0.0% |
| Bhutanese | 202 | 0.1% |
| Blackfeet | 133 | 0.1% |
| British | 873 | 0.5% |
| Bulgarian | 67 | 0.0% |
| Burmese | 138 | 0.1% |
| Canadian | 167 | 0.1% |
| Central American | 620 | 0.4% |
| Cherokee | 399 | 0.3% |
| Cheyenne | 57 | 0.0% |
| Chippewa | 6 | 0.0% |
| Choctaw | 5 | 0.0% |
| Colombian | 94 | 0.1% |
| Comanche | 3 | 0.0% |
| Croatian | 162 | 0.1% |
| Cuban | 232 | 0.2% |
| Czech | 354 | 0.2% |
| Czechoslovakian | 153 | 0.1% |
| Danish | 364 | 0.2% |
| Dominican | 305 | 0.2% |
| Dutch | 1,904 | 1.2% |
| Eastern European | 551 | 0.4% |
| Egyptian | 50 | 0.0% |
| English | 18,587 | 11.7% |
| Estonian | 13 | 0.0% |
| Ethiopian | 859 | 0.5% |
| European | 3,079 | 1.9% |
| Filipino | 17 | 0.0% |
| Finnish | 171 | 0.1% |
| French | 2,383 | 1.5% |
| French Canadian | 373 | 0.2% |
| German | 37,256 | 23.4% |
| Ghanaian | 33 | 0.0% |
| Greek | 769 | 0.5% |
| Guamanian / Chamorro | 3 | 0.0% |
| Guatemalan | 284 | 0.2% |
| Guyanese | 205 | 0.1% |
| Haitian | 165 | 0.1% |
| Honduran | 73 | 0.1% |
| Hopi | 3 | 0.0% |
| Hungarian | 967 | 0.6% |
| Indian (Asian) | 501 | 0.3% |
| Irish | 20,161 | 12.7% |
| Iroquois | 9 | 0.0% |
| Italian | 8,091 | 5.1% |
| Jamaican | 149 | 0.1% |
| Japanese | 553 | 0.4% |
| Kenyan | 81 | 0.1% |
| Korean | 274 | 0.2% |
| Laotian | 17 | 0.0% |
| Latvian | 18 | 0.0% |
| Lebanese | 132 | 0.1% |
| Liberian | 46 | 0.0% |
| Lithuanian | 69 | 0.0% |
| Lumbee | 9 | 0.0% |
| Luxembourger | 14 | 0.0% |
| Macedonian | 253 | 0.2% |
| Malaysian | 111 | 0.1% |
| Mexican | 1,436 | 0.9% |
| Moroccan | 49 | 0.0% |
| Native Hawaiian | 55 | 0.0% |
| Nigerian | 238 | 0.2% |
| Northern European | 82 | 0.1% |
| Norwegian | 774 | 0.5% |
| Pakistani | 53 | 0.0% |
| Palestinian | 134 | 0.1% |
| Panamanian | 53 | 0.0% |
| Pennsylvania German | 54 | 0.0% |
| Peruvian | 14 | 0.0% |
| Polish | 2,606 | 1.6% |
| Portuguese | 16 | 0.0% |
| Puerto Rican | 1,137 | 0.7% |
| Romanian | 61 | 0.0% |
| Russian | 760 | 0.5% |
| Salvadoran | 210 | 0.1% |
| Samoan | 3 | 0.0% |
| Scandinavian | 497 | 0.3% |
| Scotch-Irish | 1,894 | 1.2% |
| Scottish | 3,525 | 2.2% |
| Serbian | 48 | 0.0% |
| Shoshone | 25 | 0.0% |
| Sioux | 38 | 0.0% |
| Slavic | 49 | 0.0% |
| Slovak | 201 | 0.1% |
| Slovene | 142 | 0.1% |
| South American | 108 | 0.1% |
| Spaniard | 64 | 0.0% |
| Spanish | 3 | 0.0% |
| Sri Lankan | 212 | 0.1% |
| Subsaharan African | 1,624 | 1.0% |
| Swedish | 655 | 0.4% |
| Swiss | 731 | 0.5% |
| Syrian | 64 | 0.0% |
| Thai | 768 | 0.5% |
| Trinidadian and Tobagonian | 10 | 0.0% |
| Turkish | 2 | 0.0% |
| Ukrainian | 192 | 0.1% |
| Vietnamese | 143 | 0.1% |
| Welsh | 2,063 | 1.3% |
| Yugoslavian | 148 | 0.1% | View All 108 Rows |
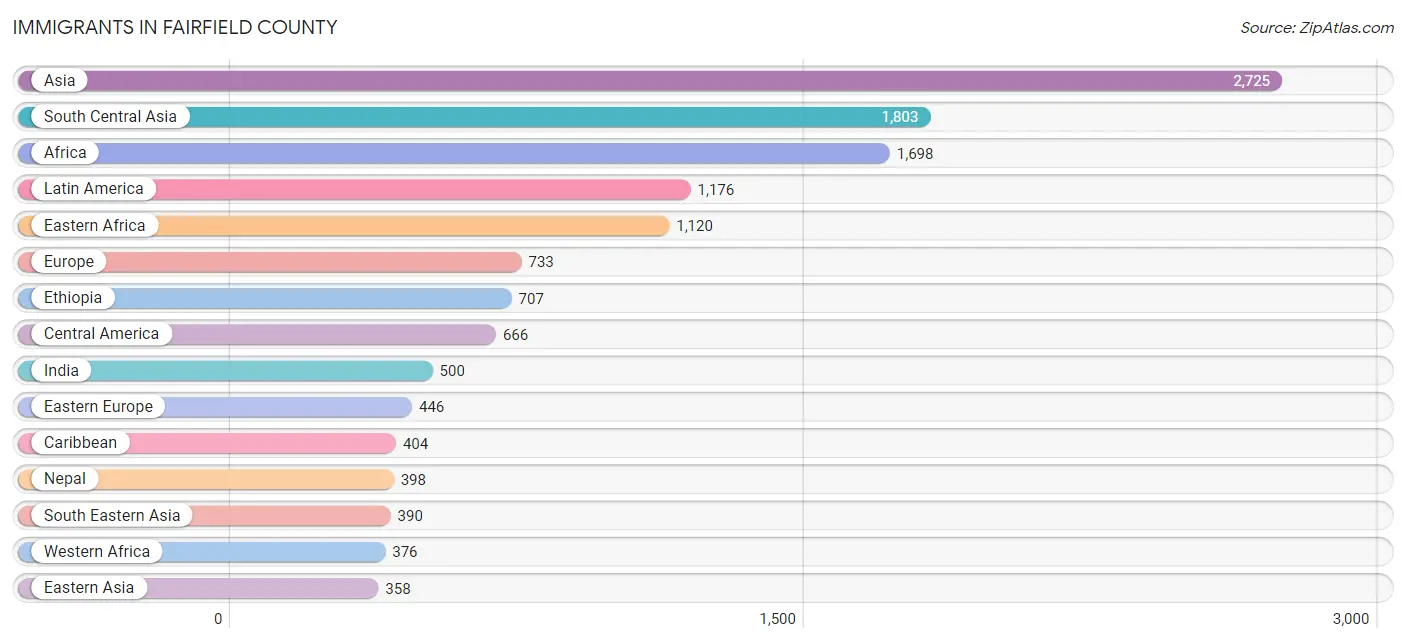
Immigrants in Fairfield County
The most numerous immigrant groups reported in Fairfield County came from Asia (2,725 | 1.7%), South Central Asia (1,803 | 1.1%), Africa (1,698 | 1.1%), Latin America (1,176 | 0.7%), and Eastern Africa (1,120 | 0.7%), together accounting for 5.3% of all Fairfield County residents.
| Immigration Origin | # Population | % Population |
| Africa | 1,698 | 1.1% |
| Asia | 2,725 | 1.7% |
| Bangladesh | 46 | 0.0% |
| Bulgaria | 58 | 0.0% |
| Cambodia | 163 | 0.1% |
| Canada | 147 | 0.1% |
| Caribbean | 404 | 0.3% |
| Central America | 666 | 0.4% |
| China | 311 | 0.2% |
| Colombia | 69 | 0.0% |
| Congo | 3 | 0.0% |
| Croatia | 15 | 0.0% |
| Cuba | 47 | 0.0% |
| Czechoslovakia | 130 | 0.1% |
| Denmark | 15 | 0.0% |
| Dominican Republic | 175 | 0.1% |
| Eastern Africa | 1,120 | 0.7% |
| Eastern Asia | 358 | 0.2% |
| Eastern Europe | 446 | 0.3% |
| Egypt | 23 | 0.0% |
| El Salvador | 93 | 0.1% |
| England | 84 | 0.1% |
| Eritrea | 214 | 0.1% |
| Ethiopia | 707 | 0.4% |
| Europe | 733 | 0.5% |
| France | 6 | 0.0% |
| Germany | 139 | 0.1% |
| Ghana | 94 | 0.1% |
| Guatemala | 164 | 0.1% |
| Guyana | 2 | 0.0% |
| Haiti | 108 | 0.1% |
| Honduras | 33 | 0.0% |
| India | 500 | 0.3% |
| Indonesia | 17 | 0.0% |
| Italy | 1 | 0.0% |
| Jamaica | 74 | 0.1% |
| Japan | 9 | 0.0% |
| Kenya | 199 | 0.1% |
| Korea | 38 | 0.0% |
| Latin America | 1,176 | 0.7% |
| Mexico | 334 | 0.2% |
| Middle Africa | 81 | 0.1% |
| Morocco | 52 | 0.0% |
| Nepal | 398 | 0.3% |
| Nigeria | 238 | 0.2% |
| North Macedonia | 96 | 0.1% |
| Northern Africa | 75 | 0.1% |
| Northern Europe | 129 | 0.1% |
| Pakistan | 144 | 0.1% |
| Panama | 42 | 0.0% |
| Peru | 35 | 0.0% |
| Philippines | 30 | 0.0% |
| Poland | 75 | 0.1% |
| Russia | 68 | 0.0% |
| South America | 106 | 0.1% |
| South Central Asia | 1,803 | 1.1% |
| South Eastern Asia | 390 | 0.2% |
| Southern Europe | 13 | 0.0% |
| Spain | 12 | 0.0% |
| Sri Lanka | 37 | 0.0% |
| Sweden | 23 | 0.0% |
| Syria | 10 | 0.0% |
| Taiwan | 22 | 0.0% |
| Thailand | 8 | 0.0% |
| Turkey | 2 | 0.0% |
| Uzbekistan | 40 | 0.0% |
| Vietnam | 172 | 0.1% |
| Western Africa | 376 | 0.2% |
| Western Asia | 76 | 0.1% |
| Western Europe | 145 | 0.1% |
| Zaire | 69 | 0.0% | View All 71 Rows |
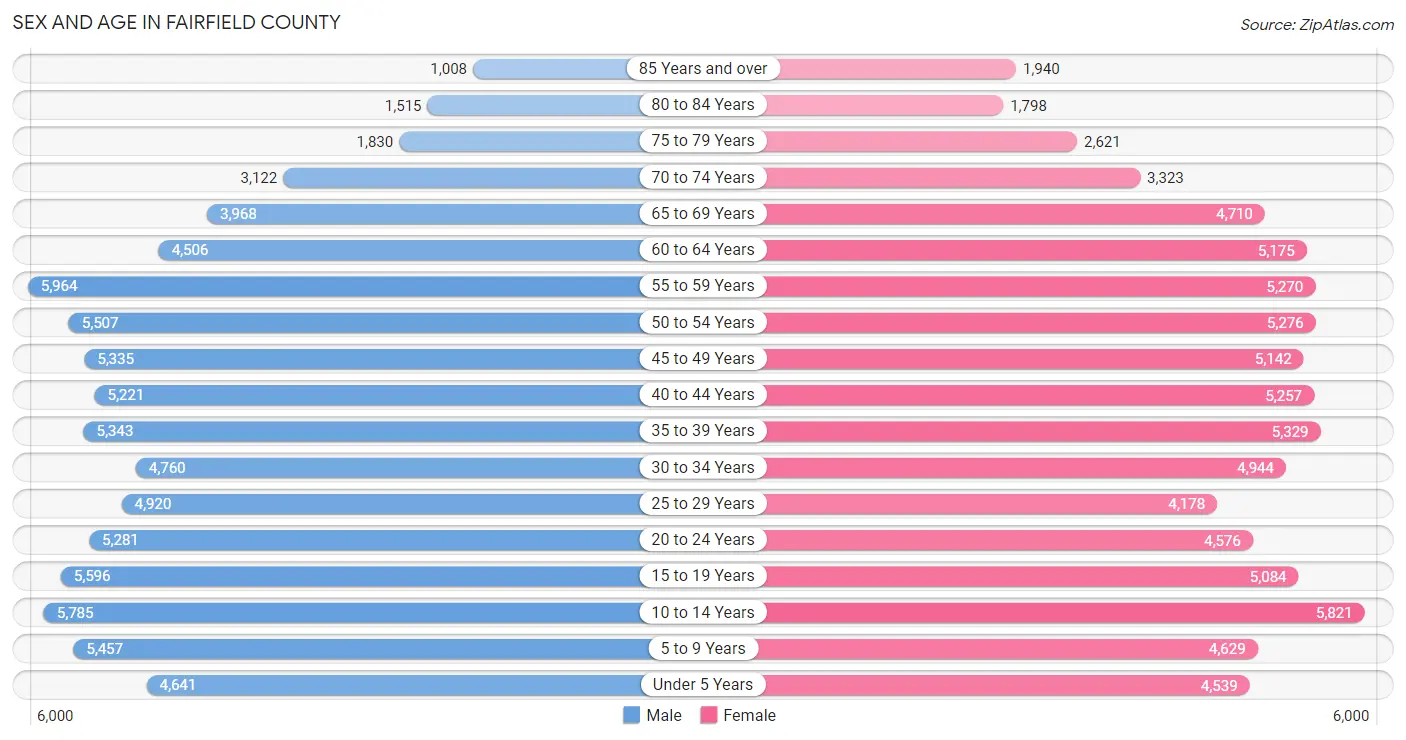
Sex and Age in Fairfield County
Sex and Age in Fairfield County
The most populous age groups in Fairfield County are 55 to 59 Years (5,964 | 7.5%) for men and 10 to 14 Years (5,821 | 7.3%) for women.
| Age Bracket | Male | Female |
| Under 5 Years | 4,641 (5.8%) | 4,539 (5.7%) |
| 5 to 9 Years | 5,457 (6.8%) | 4,629 (5.8%) |
| 10 to 14 Years | 5,785 (7.2%) | 5,821 (7.3%) |
| 15 to 19 Years | 5,596 (7.0%) | 5,084 (6.4%) |
| 20 to 24 Years | 5,281 (6.6%) | 4,576 (5.8%) |
| 25 to 29 Years | 4,920 (6.2%) | 4,178 (5.2%) |
| 30 to 34 Years | 4,760 (6.0%) | 4,944 (6.2%) |
| 35 to 39 Years | 5,343 (6.7%) | 5,329 (6.7%) |
| 40 to 44 Years | 5,221 (6.6%) | 5,257 (6.6%) |
| 45 to 49 Years | 5,335 (6.7%) | 5,142 (6.5%) |
| 50 to 54 Years | 5,507 (6.9%) | 5,276 (6.6%) |
| 55 to 59 Years | 5,964 (7.5%) | 5,270 (6.6%) |
| 60 to 64 Years | 4,506 (5.7%) | 5,175 (6.5%) |
| 65 to 69 Years | 3,968 (5.0%) | 4,710 (5.9%) |
| 70 to 74 Years | 3,122 (3.9%) | 3,323 (4.2%) |
| 75 to 79 Years | 1,830 (2.3%) | 2,621 (3.3%) |
| 80 to 84 Years | 1,515 (1.9%) | 1,798 (2.3%) |
| 85 Years and over | 1,008 (1.3%) | 1,940 (2.4%) |
| Total | 79,759 (100.0%) | 79,612 (100.0%) |
Families and Households in Fairfield County
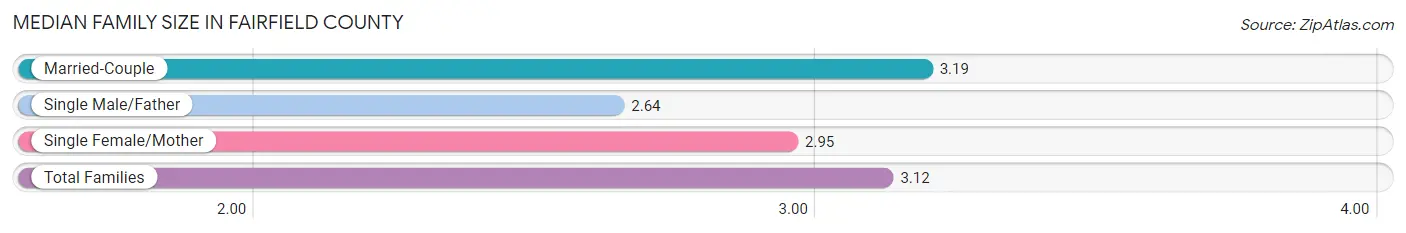
Median Family Size in Fairfield County
The median family size in Fairfield County is 3.12 persons per family, with married-couple families (32,848 | 78.1%) accounting for the largest median family size of 3.19 persons per family. On the other hand, single male/father families (2,762 | 6.6%) represent the smallest median family size with 2.64 persons per family.
| Family Type | # Families | Family Size |
| Married-Couple | 32,848 (78.1%) | 3.19 |
| Single Male/Father | 2,762 (6.6%) | 2.64 |
| Single Female/Mother | 6,435 (15.3%) | 2.95 |
| Total Families | 42,045 (100.0%) | 3.12 |
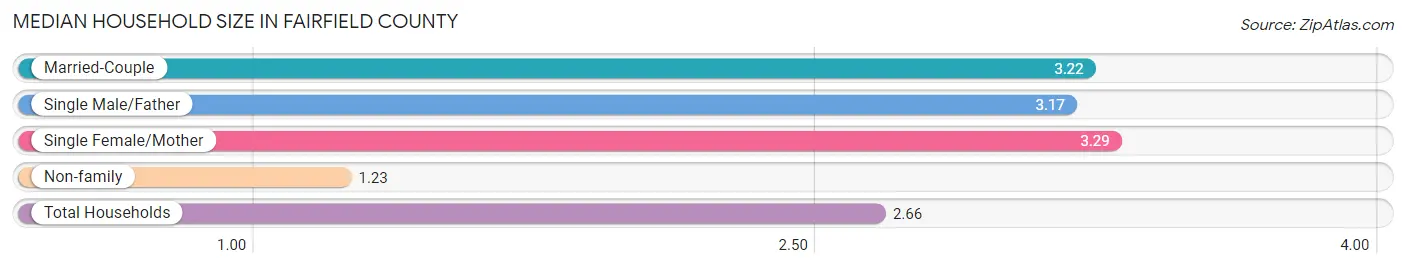
Median Household Size in Fairfield County
The median household size in Fairfield County is 2.66 persons per household, with single female/mother households (6,435 | 11.0%) accounting for the largest median household size of 3.29 persons per household. non-family households (16,678 | 28.4%) represent the smallest median household size with 1.23 persons per household.
| Household Type | # Households | Household Size |
| Married-Couple | 32,848 (55.9%) | 3.22 |
| Single Male/Father | 2,762 (4.7%) | 3.17 |
| Single Female/Mother | 6,435 (11.0%) | 3.29 |
| Non-family | 16,678 (28.4%) | 1.23 |
| Total Households | 58,723 (100.0%) | 2.66 |
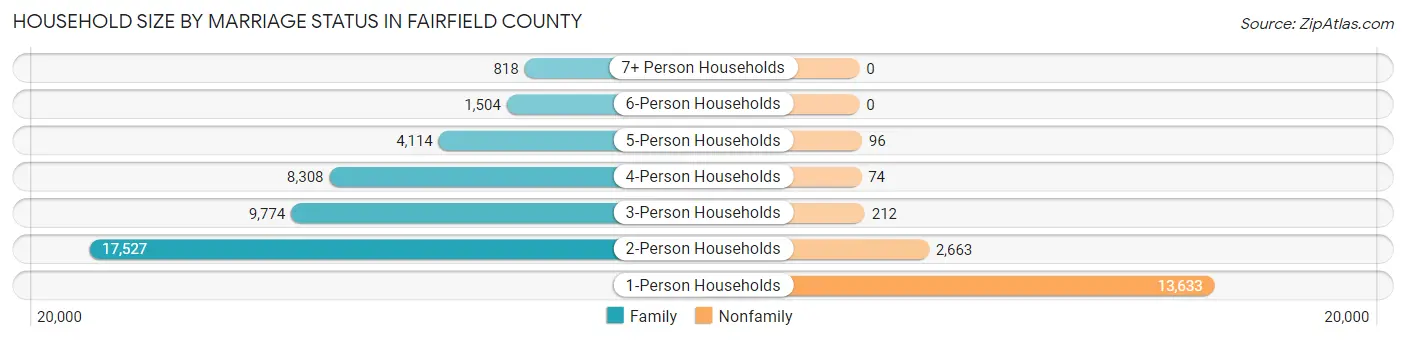
Household Size by Marriage Status in Fairfield County
Out of a total of 58,723 households in Fairfield County, 42,045 (71.6%) are family households, while 16,678 (28.4%) are nonfamily households. The most numerous type of family households are 2-person households, comprising 17,527, and the most common type of nonfamily households are 1-person households, comprising 13,633.
| Household Size | Family Households | Nonfamily Households |
| 1-Person Households | - | 13,633 (23.2%) |
| 2-Person Households | 17,527 (29.8%) | 2,663 (4.5%) |
| 3-Person Households | 9,774 (16.6%) | 212 (0.4%) |
| 4-Person Households | 8,308 (14.1%) | 74 (0.1%) |
| 5-Person Households | 4,114 (7.0%) | 96 (0.2%) |
| 6-Person Households | 1,504 (2.6%) | 0 (0.0%) |
| 7+ Person Households | 818 (1.4%) | 0 (0.0%) |
| Total | 42,045 (71.6%) | 16,678 (28.4%) |
Female Fertility in Fairfield County
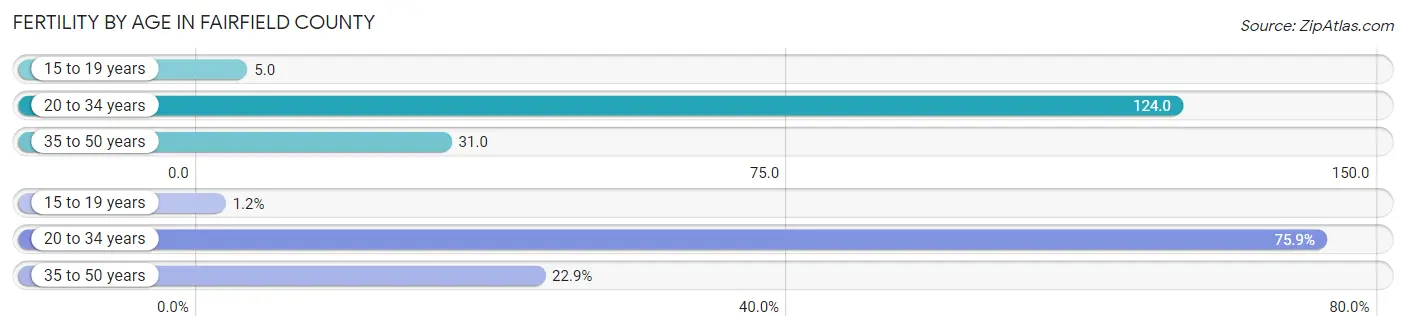
Fertility by Age in Fairfield County
Average fertility rate in Fairfield County is 63.0 births per 1,000 women. Women in the age bracket of 20 to 34 years have the highest fertility rate with 124.0 births per 1,000 women. Women in the age bracket of 20 to 34 years acount for 75.9% of all women with births.
| Age Bracket | Women with Births | Births / 1,000 Women |
| 15 to 19 years | 27 (1.2%) | 5.0 |
| 20 to 34 years | 1,702 (75.9%) | 124.0 |
| 35 to 50 years | 513 (22.9%) | 31.0 |
| Total | 2,242 (100.0%) | 63.0 |
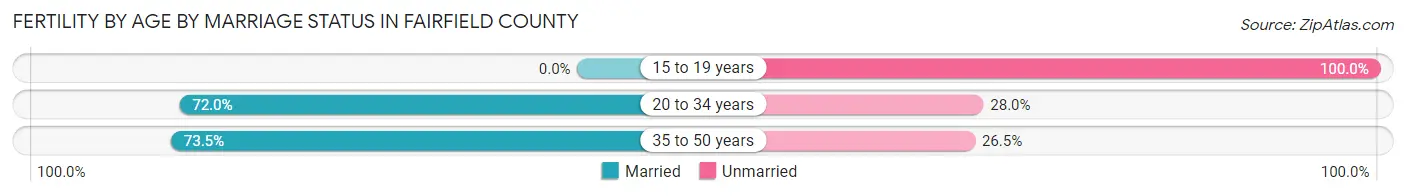
Fertility by Age by Marriage Status in Fairfield County
71.5% of women with births (2,242) in Fairfield County are married. The highest percentage of unmarried women with births falls into 15 to 19 years age bracket with 100.0% of them unmarried at the time of birth, while the lowest percentage of unmarried women with births belong to 35 to 50 years age bracket with 26.5% of them unmarried.
| Age Bracket | Married | Unmarried |
| 15 to 19 years | 0 (0.0%) | 27 (100.0%) |
| 20 to 34 years | 1,225 (72.0%) | 477 (28.0%) |
| 35 to 50 years | 377 (73.5%) | 136 (26.5%) |
| Total | 1,603 (71.5%) | 639 (28.5%) |
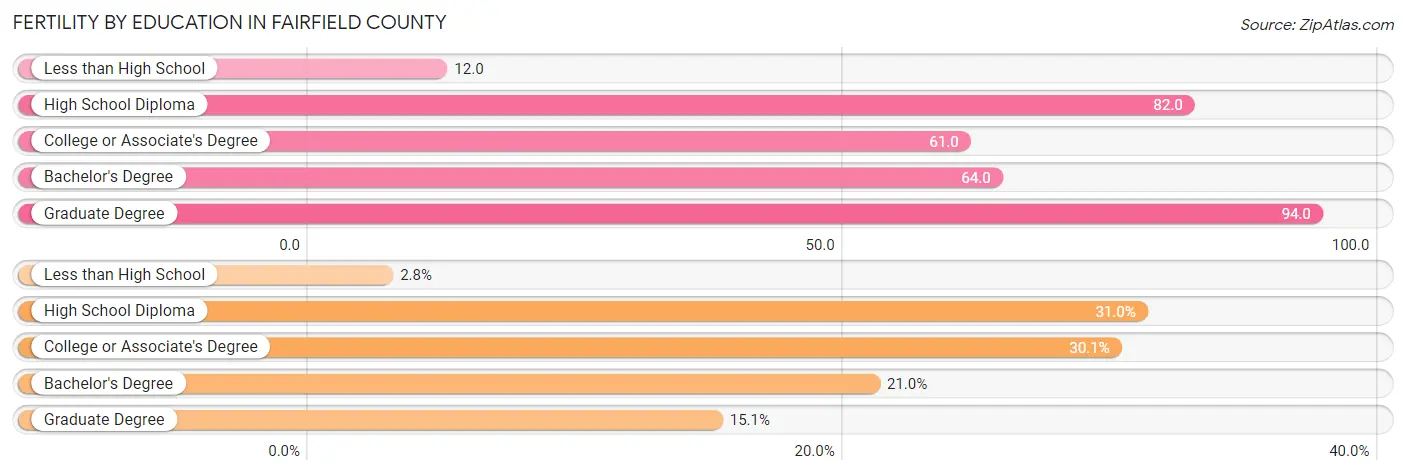
Fertility by Education in Fairfield County
Average fertility rate in Fairfield County is 63.0 births per 1,000 women. Women with the education attainment of graduate degree have the highest fertility rate of 94.0 births per 1,000 women, while women with the education attainment of less than high school have the lowest fertility at 12.0 births per 1,000 women. Women with the education attainment of high school diploma represent 31.0% of all women with births.
| Educational Attainment | Women with Births | Births / 1,000 Women |
| Less than High School | 62 (2.8%) | 12.0 |
| High School Diploma | 696 (31.0%) | 82.0 |
| College or Associate's Degree | 674 (30.1%) | 61.0 |
| Bachelor's Degree | 471 (21.0%) | 64.0 |
| Graduate Degree | 339 (15.1%) | 94.0 |
| Total | 2,242 (100.0%) | 63.0 |
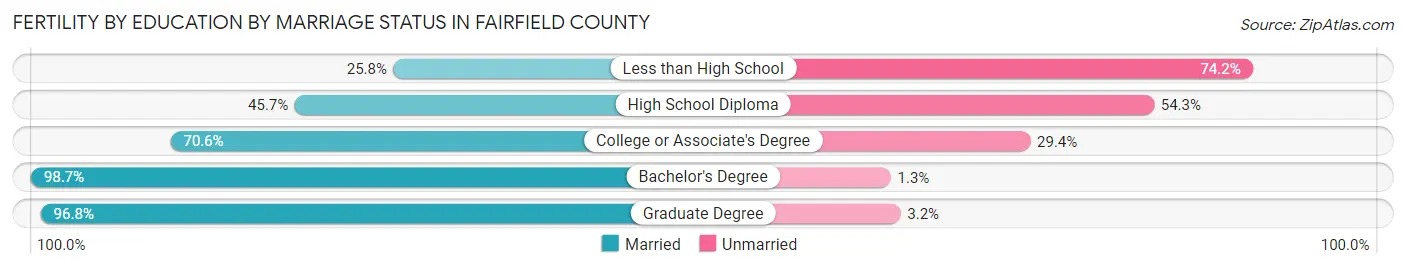
Fertility by Education by Marriage Status in Fairfield County
28.5% of women with births in Fairfield County are unmarried. Women with the educational attainment of bachelor's degree are most likely to be married with 98.7% of them married at childbirth, while women with the educational attainment of less than high school are least likely to be married with 74.2% of them unmarried at childbirth.
| Educational Attainment | Married | Unmarried |
| Less than High School | 16 (25.8%) | 46 (74.2%) |
| High School Diploma | 318 (45.7%) | 378 (54.3%) |
| College or Associate's Degree | 476 (70.6%) | 198 (29.4%) |
| Bachelor's Degree | 465 (98.7%) | 6 (1.3%) |
| Graduate Degree | 328 (96.8%) | 11 (3.2%) |
| Total | 1,603 (71.5%) | 639 (28.5%) |
Income in Fairfield County
Income Overview in Fairfield County
Per Capita Income in Fairfield County is $38,783, while median incomes of families and households are $101,069 and $82,969 respectively.
| Characteristic | Number | Measure |
| Per Capita Income | 159,371 | $38,783 |
| Median Family Income | 42,045 | $101,069 |
| Mean Family Income | 42,045 | $118,324 |
| Median Household Income | 58,723 | $82,969 |
| Mean Household Income | 58,723 | $102,535 |
| Income Deficit | 42,045 | $9,612 |
| Wage / Income Gap (%) | 159,371 | 28.93% |
| Wage / Income Gap ($) | 159,371 | 71.07¢ per $1 |
| Gini / Inequality Index | 159,371 | 0.42 |
Earnings by Sex in Fairfield County
Average Earnings in Fairfield County are $45,430, $54,334 for men and $38,615 for women, a difference of 28.9%.
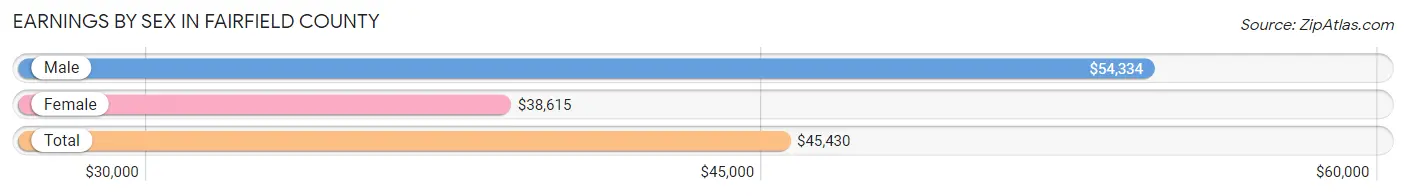
| Sex | Number | Average Earnings |
| Male | 44,414 (52.3%) | $54,334 |
| Female | 40,566 (47.7%) | $38,615 |
| Total | 84,980 (100.0%) | $45,430 |
Earnings by Sex by Income Bracket in Fairfield County
The most common earnings brackets in Fairfield County are $100,000+ for men (9,061 | 20.4%) and $75,000 to $99,999 for women (4,598 | 11.3%).
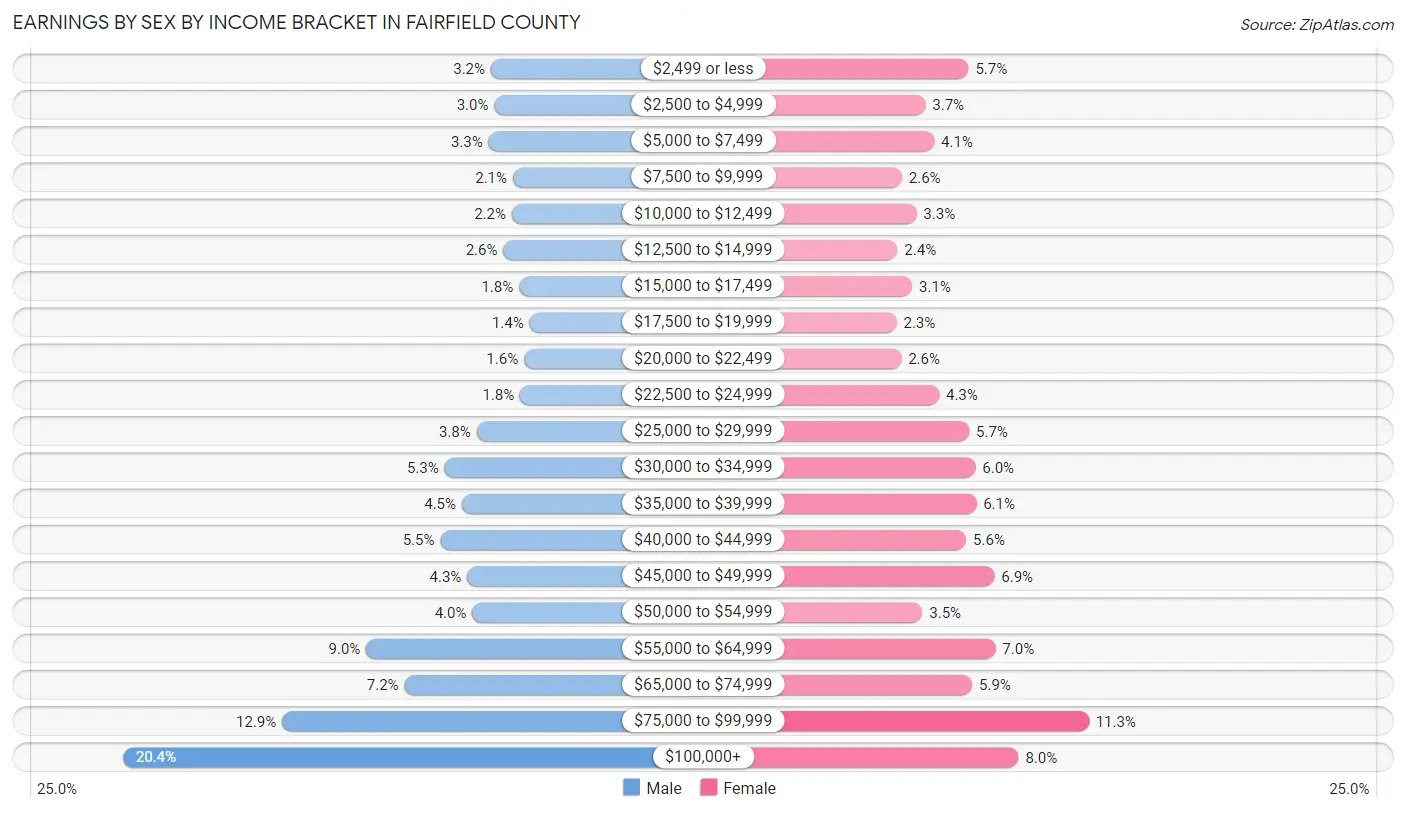
| Income | Male | Female |
| $2,499 or less | 1,405 (3.2%) | 2,313 (5.7%) |
| $2,500 to $4,999 | 1,334 (3.0%) | 1,493 (3.7%) |
| $5,000 to $7,499 | 1,452 (3.3%) | 1,661 (4.1%) |
| $7,500 to $9,999 | 946 (2.1%) | 1,045 (2.6%) |
| $10,000 to $12,499 | 968 (2.2%) | 1,323 (3.3%) |
| $12,500 to $14,999 | 1,148 (2.6%) | 961 (2.4%) |
| $15,000 to $17,499 | 818 (1.8%) | 1,243 (3.1%) |
| $17,500 to $19,999 | 601 (1.3%) | 944 (2.3%) |
| $20,000 to $22,499 | 715 (1.6%) | 1,033 (2.5%) |
| $22,500 to $24,999 | 797 (1.8%) | 1,754 (4.3%) |
| $25,000 to $29,999 | 1,702 (3.8%) | 2,324 (5.7%) |
| $30,000 to $34,999 | 2,367 (5.3%) | 2,444 (6.0%) |
| $35,000 to $39,999 | 2,008 (4.5%) | 2,458 (6.1%) |
| $40,000 to $44,999 | 2,456 (5.5%) | 2,269 (5.6%) |
| $45,000 to $49,999 | 1,898 (4.3%) | 2,803 (6.9%) |
| $50,000 to $54,999 | 1,790 (4.0%) | 1,435 (3.5%) |
| $55,000 to $64,999 | 3,996 (9.0%) | 2,823 (7.0%) |
| $65,000 to $74,999 | 3,203 (7.2%) | 2,382 (5.9%) |
| $75,000 to $99,999 | 5,749 (12.9%) | 4,598 (11.3%) |
| $100,000+ | 9,061 (20.4%) | 3,260 (8.0%) |
| Total | 44,414 (100.0%) | 40,566 (100.0%) |
Earnings by Sex by Educational Attainment in Fairfield County
Average earnings in Fairfield County are $61,572 for men and $44,219 for women, a difference of 28.2%. Men with an educational attainment of graduate degree enjoy the highest average annual earnings of $101,233, while those with less than high school education earn the least with $31,464. Women with an educational attainment of graduate degree earn the most with the average annual earnings of $81,318, while those with less than high school education have the smallest earnings of $21,916.
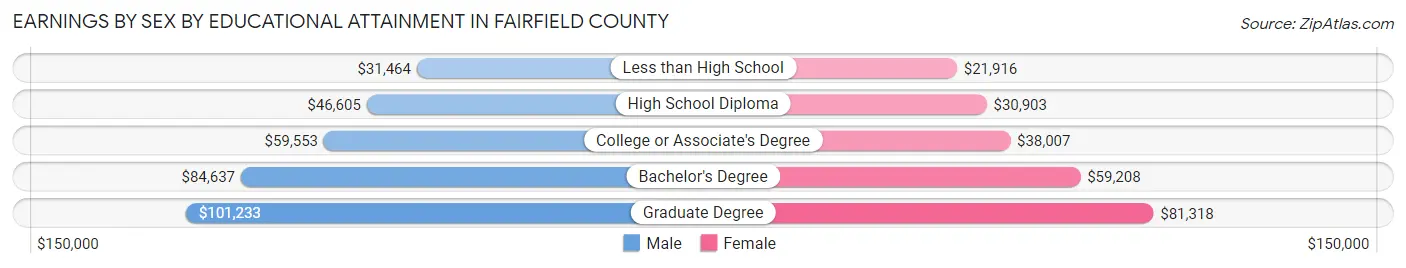
| Educational Attainment | Male Income | Female Income |
| Less than High School | $31,464 | $21,916 |
| High School Diploma | $46,605 | $30,903 |
| College or Associate's Degree | $59,553 | $38,007 |
| Bachelor's Degree | $84,637 | $59,208 |
| Graduate Degree | $101,233 | $81,318 |
| Total | $61,572 | $44,219 |
Family Income in Fairfield County
Family Income Brackets in Fairfield County
According to the Fairfield County family income data, there are 10,806 families falling into the $100,000 to $149,999 income range, which is the most common income bracket and makes up 25.7% of all families. Conversely, the $10,000 to $14,999 income bracket is the least frequent group with only 505 families (1.2%) belonging to this category.
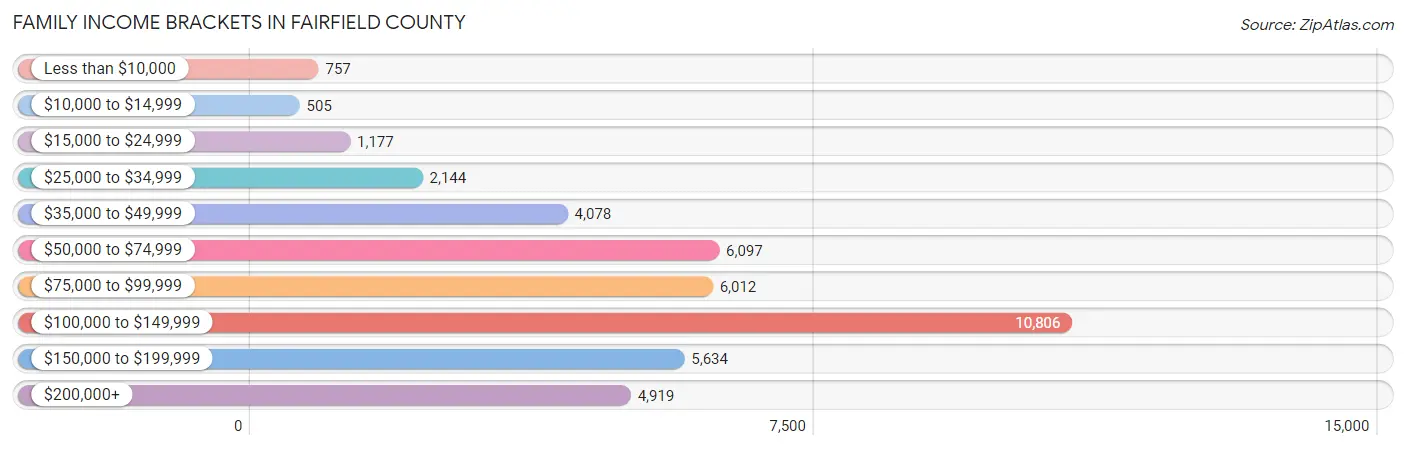
| Income Bracket | # Families | % Families |
| Less than $10,000 | 757 | 1.8% |
| $10,000 to $14,999 | 505 | 1.2% |
| $15,000 to $24,999 | 1,177 | 2.8% |
| $25,000 to $34,999 | 2,144 | 5.1% |
| $35,000 to $49,999 | 4,078 | 9.7% |
| $50,000 to $74,999 | 6,097 | 14.5% |
| $75,000 to $99,999 | 6,012 | 14.3% |
| $100,000 to $149,999 | 10,806 | 25.7% |
| $150,000 to $199,999 | 5,634 | 13.4% |
| $200,000+ | 4,919 | 11.7% |
Family Income by Famaliy Size in Fairfield County
6-person families (1,293 | 3.1%) account for the highest median family income in Fairfield County with $124,544 per family, while 2-person families (19,186 | 45.6%) have the highest median income of $40,710 per family member.
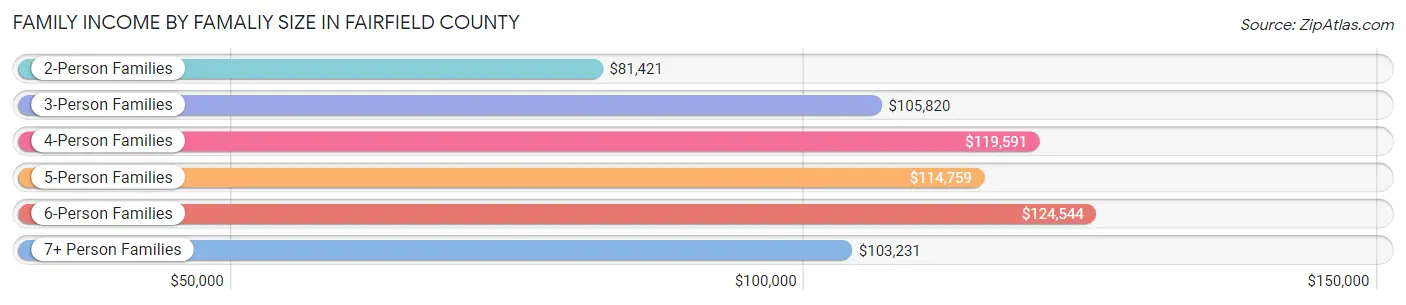
| Income Bracket | # Families | Median Income |
| 2-Person Families | 19,186 (45.6%) | $81,421 |
| 3-Person Families | 9,179 (21.8%) | $105,820 |
| 4-Person Families | 8,015 (19.1%) | $119,591 |
| 5-Person Families | 3,787 (9.0%) | $114,759 |
| 6-Person Families | 1,293 (3.1%) | $124,544 |
| 7+ Person Families | 585 (1.4%) | $103,231 |
| Total | 42,045 (100.0%) | $101,069 |
Family Income by Number of Earners in Fairfield County
The median family income in Fairfield County is $101,069, with families comprising 3+ earners (4,743) having the highest median family income of $156,847, while families with no earners (5,898) have the lowest median family income of $52,420, accounting for 11.3% and 14.0% of families, respectively.
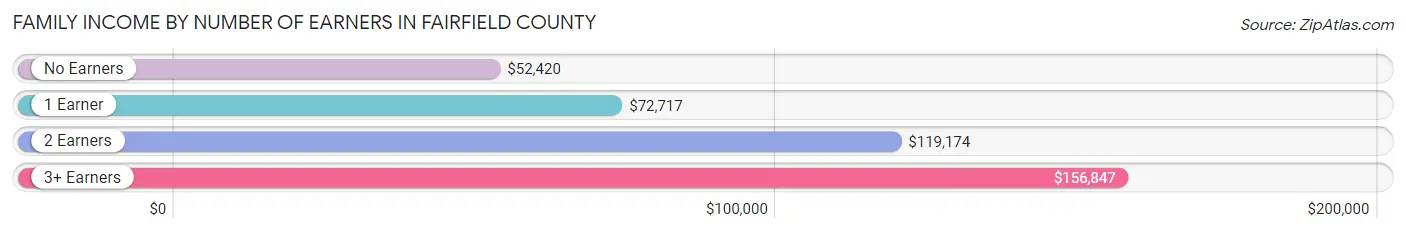
| Number of Earners | # Families | Median Income |
| No Earners | 5,898 (14.0%) | $52,420 |
| 1 Earner | 11,713 (27.9%) | $72,717 |
| 2 Earners | 19,691 (46.8%) | $119,174 |
| 3+ Earners | 4,743 (11.3%) | $156,847 |
| Total | 42,045 (100.0%) | $101,069 |
Household Income in Fairfield County
Household Income Brackets in Fairfield County
With 12,332 households falling in the category, the $100,000 to $149,999 income range is the most frequent in Fairfield County, accounting for 21.0% of all households. In contrast, only 1,644 households (2.8%) fall into the less than $10,000 income bracket, making it the least populous group.
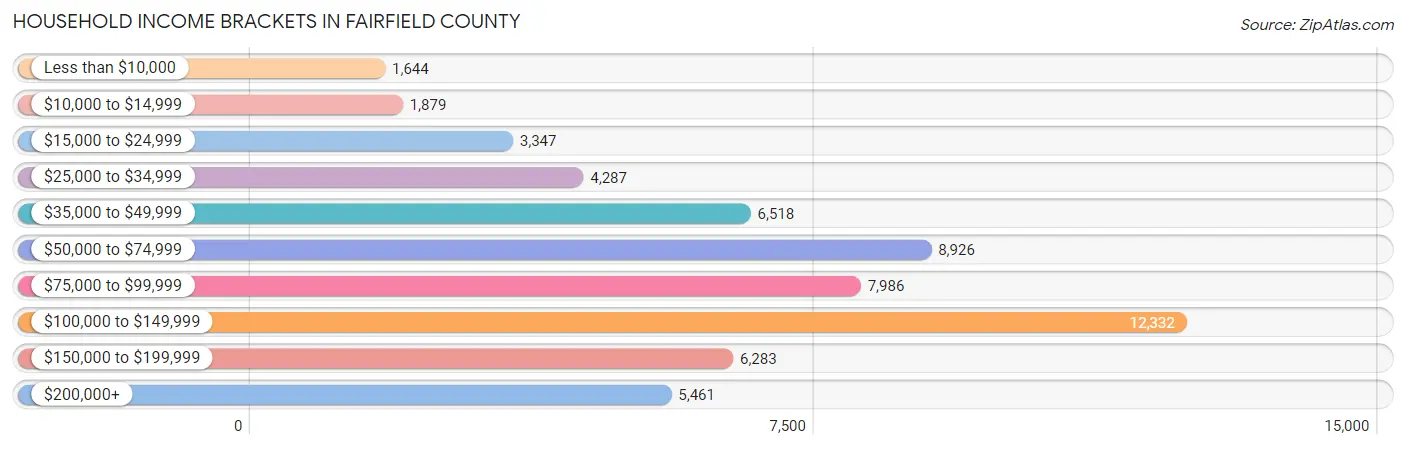
| Income Bracket | # Households | % Households |
| Less than $10,000 | 1,644 | 2.8% |
| $10,000 to $14,999 | 1,879 | 3.2% |
| $15,000 to $24,999 | 3,347 | 5.7% |
| $25,000 to $34,999 | 4,287 | 7.3% |
| $35,000 to $49,999 | 6,518 | 11.1% |
| $50,000 to $74,999 | 8,926 | 15.2% |
| $75,000 to $99,999 | 7,986 | 13.6% |
| $100,000 to $149,999 | 12,332 | 21.0% |
| $150,000 to $199,999 | 6,283 | 10.7% |
| $200,000+ | 5,461 | 9.3% |
Household Income by Householder Age in Fairfield County
The median household income in Fairfield County is $82,969, with the highest median household income of $100,325 found in the 45 to 64 years age bracket for the primary householder. A total of 23,320 households (39.7%) fall into this category. Meanwhile, the 15 to 24 years age bracket for the primary householder has the lowest median household income of $37,299, with 1,819 households (3.1%) in this group.
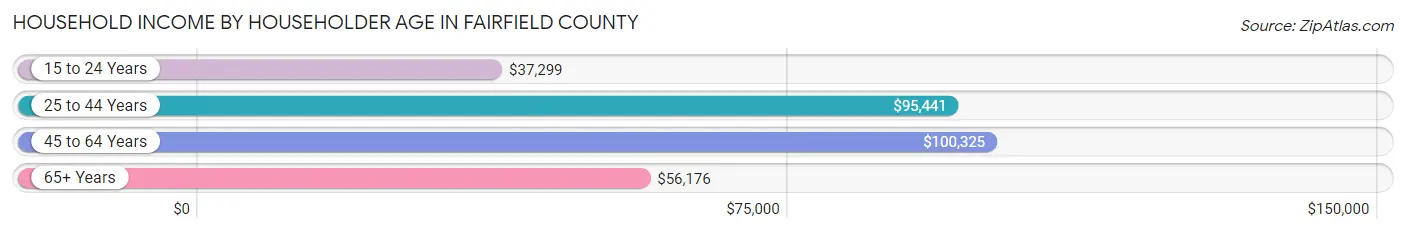
| Income Bracket | # Households | Median Income |
| 15 to 24 Years | 1,819 (3.1%) | $37,299 |
| 25 to 44 Years | 17,987 (30.6%) | $95,441 |
| 45 to 64 Years | 23,320 (39.7%) | $100,325 |
| 65+ Years | 15,597 (26.6%) | $56,176 |
| Total | 58,723 (100.0%) | $82,969 |
Poverty in Fairfield County
Income Below Poverty by Sex and Age in Fairfield County
With 7.8% poverty level for males and 9.6% for females among the residents of Fairfield County, 5 year old males and 16 and 17 year old females are the most vulnerable to poverty, with 176 males (19.2%) and 480 females (19.7%) in their respective age groups living below the poverty level.
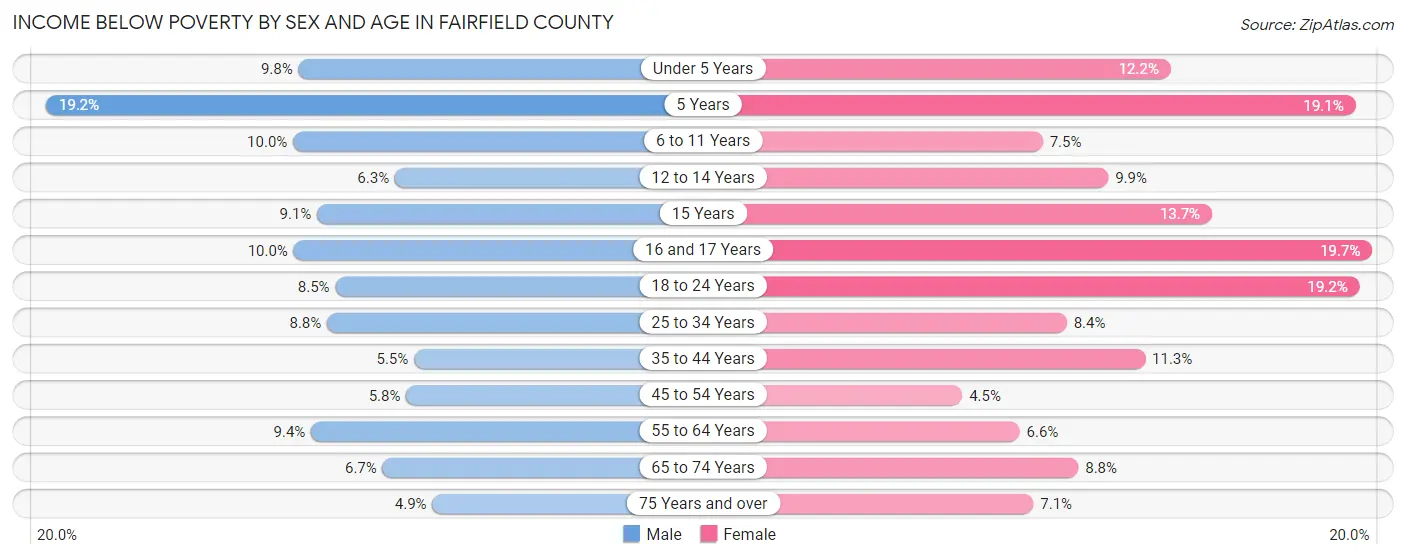
| Age Bracket | Male | Female |
| Under 5 Years | 447 (9.8%) | 532 (12.2%) |
| 5 Years | 176 (19.2%) | 197 (19.1%) |
| 6 to 11 Years | 675 (10.0%) | 436 (7.5%) |
| 12 to 14 Years | 202 (6.2%) | 334 (9.9%) |
| 15 Years | 119 (9.1%) | 134 (13.7%) |
| 16 and 17 Years | 225 (10.0%) | 480 (19.7%) |
| 18 to 24 Years | 596 (8.5%) | 1,199 (19.2%) |
| 25 to 34 Years | 798 (8.8%) | 760 (8.4%) |
| 35 to 44 Years | 562 (5.5%) | 1,191 (11.3%) |
| 45 to 54 Years | 616 (5.8%) | 464 (4.5%) |
| 55 to 64 Years | 970 (9.4%) | 688 (6.6%) |
| 65 to 74 Years | 464 (6.7%) | 692 (8.8%) |
| 75 Years and over | 203 (4.9%) | 419 (7.1%) |
| Total | 6,053 (7.8%) | 7,526 (9.6%) |
Income Above Poverty by Sex and Age in Fairfield County
According to the poverty statistics in Fairfield County, males aged 75 years and over and females aged 45 to 54 years are the age groups that are most secure financially, with 95.1% of males and 95.5% of females in these age groups living above the poverty line.
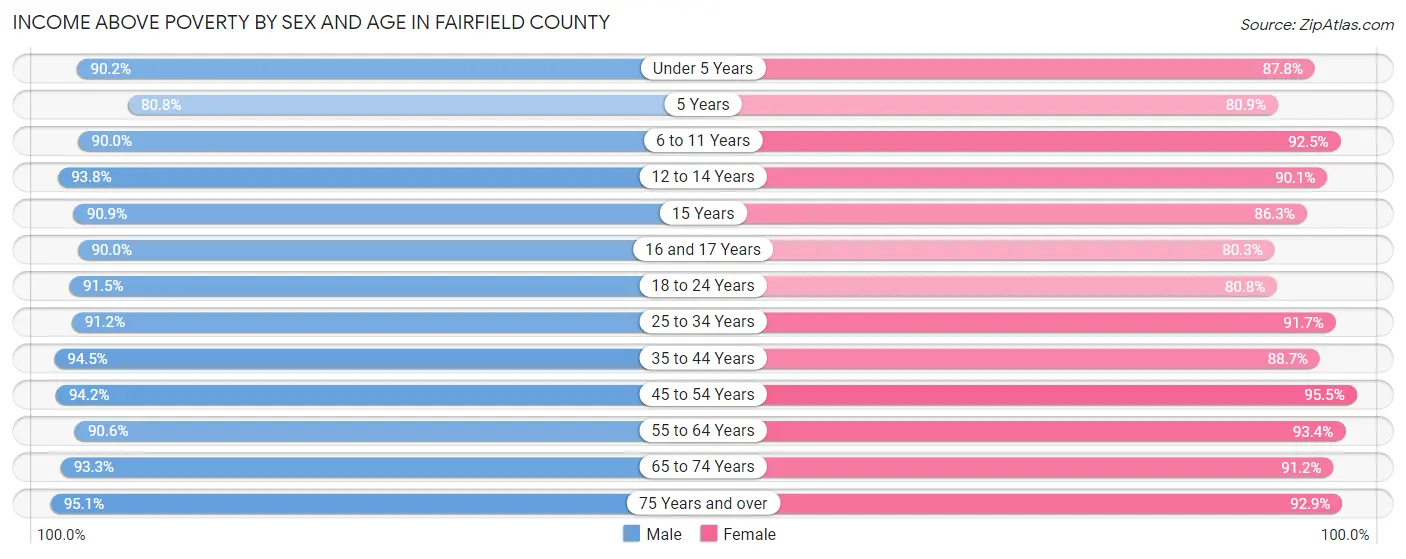
| Age Bracket | Male | Female |
| Under 5 Years | 4,098 (90.2%) | 3,824 (87.8%) |
| 5 Years | 740 (80.8%) | 836 (80.9%) |
| 6 to 11 Years | 6,054 (90.0%) | 5,407 (92.5%) |
| 12 to 14 Years | 3,028 (93.8%) | 3,043 (90.1%) |
| 15 Years | 1,183 (90.9%) | 841 (86.3%) |
| 16 and 17 Years | 2,023 (90.0%) | 1,958 (80.3%) |
| 18 to 24 Years | 6,447 (91.5%) | 5,038 (80.8%) |
| 25 to 34 Years | 8,299 (91.2%) | 8,347 (91.6%) |
| 35 to 44 Years | 9,590 (94.5%) | 9,389 (88.7%) |
| 45 to 54 Years | 9,956 (94.2%) | 9,927 (95.5%) |
| 55 to 64 Years | 9,389 (90.6%) | 9,731 (93.4%) |
| 65 to 74 Years | 6,448 (93.3%) | 7,191 (91.2%) |
| 75 Years and over | 3,970 (95.1%) | 5,478 (92.9%) |
| Total | 71,225 (92.2%) | 71,010 (90.4%) |
Income Below Poverty Among Married-Couple Families in Fairfield County
The poverty statistics for married-couple families in Fairfield County show that 2.0% or 669 of the total 32,848 families live below the poverty line. Families with 5 or more children have the highest poverty rate of 12.6%, comprising of 55 families. On the other hand, families with 1 or 2 children have the lowest poverty rate of 1.4%, which includes 155 families.
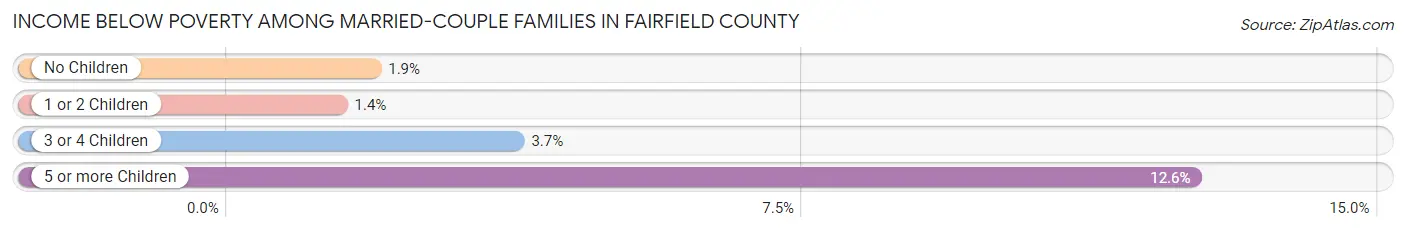
| Children | Above Poverty | Below Poverty |
| No Children | 18,238 (98.1%) | 347 (1.9%) |
| 1 or 2 Children | 10,679 (98.6%) | 155 (1.4%) |
| 3 or 4 Children | 2,880 (96.3%) | 112 (3.7%) |
| 5 or more Children | 382 (87.4%) | 55 (12.6%) |
| Total | 32,179 (98.0%) | 669 (2.0%) |
Income Below Poverty Among Single-Parent Households in Fairfield County
According to the poverty data in Fairfield County, 13.3% or 367 single-father households and 20.0% or 1,287 single-mother households are living below the poverty line. Among single-father households, those with 1 or 2 children have the highest poverty rate, with 316 households (20.5%) experiencing poverty. Likewise, among single-mother households, those with 3 or 4 children have the highest poverty rate, with 282 households (44.0%) falling below the poverty line.
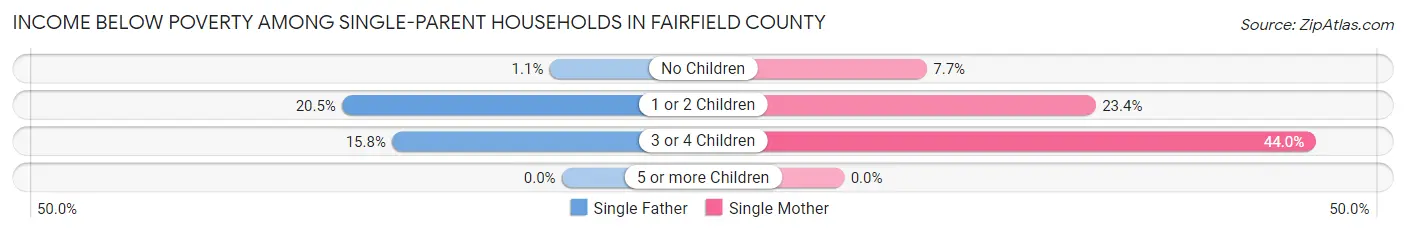
| Children | Single Father | Single Mother |
| No Children | 11 (1.1%) | 172 (7.7%) |
| 1 or 2 Children | 316 (20.5%) | 833 (23.4%) |
| 3 or 4 Children | 40 (15.8%) | 282 (44.0%) |
| 5 or more Children | 0 (0.0%) | 0 (0.0%) |
| Total | 367 (13.3%) | 1,287 (20.0%) |
Income Below Poverty Among Married-Couple vs Single-Parent Households in Fairfield County
The poverty data for Fairfield County shows that 669 of the married-couple family households (2.0%) and 1,654 of the single-parent households (18.0%) are living below the poverty level. Within the married-couple family households, those with 5 or more children have the highest poverty rate, with 55 households (12.6%) falling below the poverty line. Among the single-parent households, those with 3 or 4 children have the highest poverty rate, with 322 household (36.0%) living below poverty.
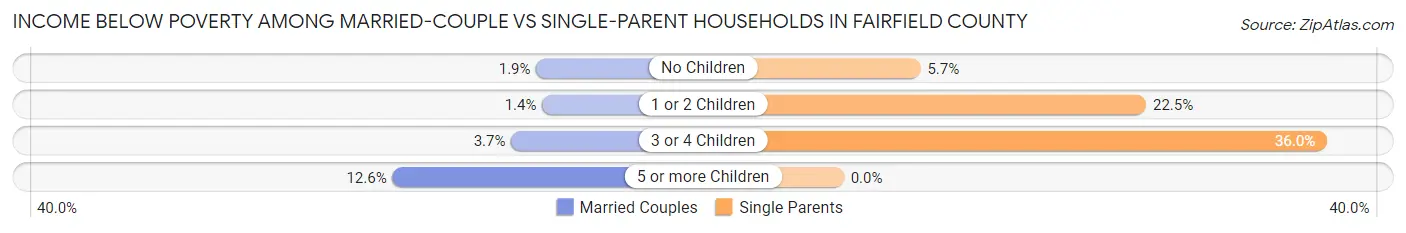
| Children | Married-Couple Families | Single-Parent Households |
| No Children | 347 (1.9%) | 183 (5.7%) |
| 1 or 2 Children | 155 (1.4%) | 1,149 (22.5%) |
| 3 or 4 Children | 112 (3.7%) | 322 (36.0%) |
| 5 or more Children | 55 (12.6%) | 0 (0.0%) |
| Total | 669 (2.0%) | 1,654 (18.0%) |
Employment Characteristics in Fairfield County
Employment by Class of Employer in Fairfield County
Among the 77,254 employed individuals in Fairfield County, private company employees (52,066 | 67.4%), local government employees (7,234 | 9.4%), and not-for-profit organizations (6,368 | 8.2%) make up the most common classes of employment.
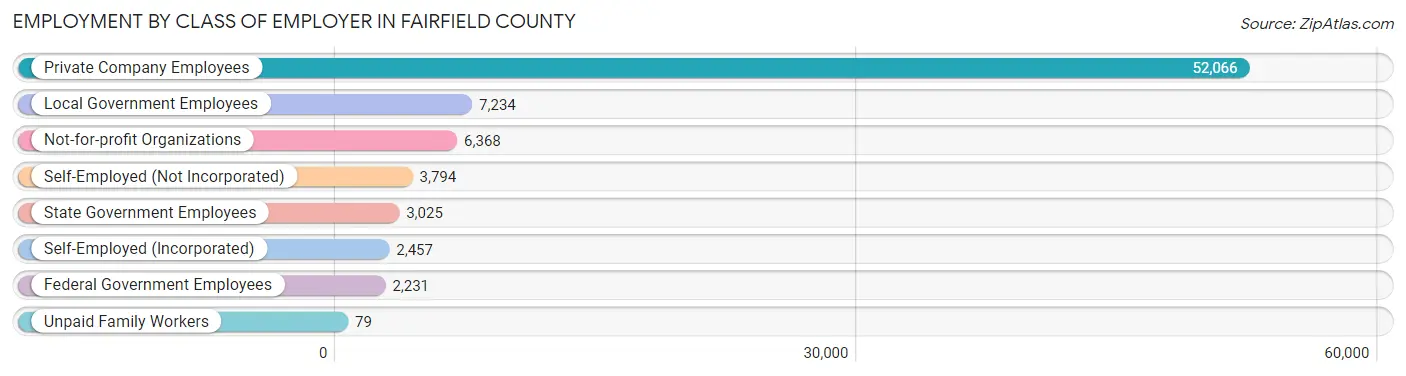
| Employer Class | # Employees | % Employees |
| Private Company Employees | 52,066 | 67.4% |
| Self-Employed (Incorporated) | 2,457 | 3.2% |
| Self-Employed (Not Incorporated) | 3,794 | 4.9% |
| Not-for-profit Organizations | 6,368 | 8.2% |
| Local Government Employees | 7,234 | 9.4% |
| State Government Employees | 3,025 | 3.9% |
| Federal Government Employees | 2,231 | 2.9% |
| Unpaid Family Workers | 79 | 0.1% |
| Total | 77,254 | 100.0% |
Employment Status by Age in Fairfield County
According to the labor force statistics for Fairfield County, out of the total population over 16 years of age (126,221), 64.8% or 81,791 individuals are in the labor force, with 3.7% or 3,026 of them unemployed. The age group with the highest labor force participation rate is 45 to 54 years, with 86.1% or 18,305 individuals in the labor force. Within the labor force, the 16 to 19 years age range has the highest percentage of unemployed individuals, with 15.0% or 542 of them being unemployed.
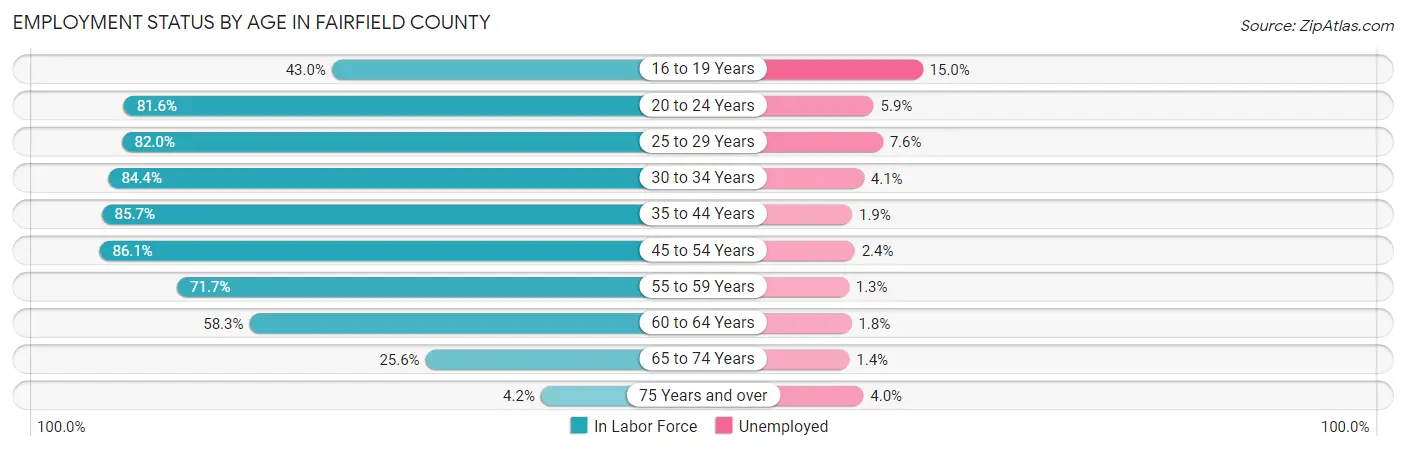
| Age Bracket | In Labor Force | Unemployed |
| 16 to 19 Years | 3,613 (43.0%) | 542 (15.0%) |
| 20 to 24 Years | 8,043 (81.6%) | 475 (5.9%) |
| 25 to 29 Years | 7,460 (82.0%) | 567 (7.6%) |
| 30 to 34 Years | 8,190 (84.4%) | 336 (4.1%) |
| 35 to 44 Years | 18,126 (85.7%) | 344 (1.9%) |
| 45 to 54 Years | 18,305 (86.1%) | 439 (2.4%) |
| 55 to 59 Years | 8,055 (71.7%) | 105 (1.3%) |
| 60 to 64 Years | 5,644 (58.3%) | 102 (1.8%) |
| 65 to 74 Years | 3,871 (25.6%) | 54 (1.4%) |
| 75 Years and over | 450 (4.2%) | 18 (4.0%) |
| Total | 81,791 (64.8%) | 3,026 (3.7%) |
Employment Status by Educational Attainment in Fairfield County
According to labor force statistics for Fairfield County, 80.1% of individuals (65,784) out of the total population between 25 and 64 years of age (82,127) are in the labor force, with 2.9% or 1,908 of them being unemployed. The group with the highest labor force participation rate are those with the educational attainment of bachelor's degree or higher, with 89.5% or 25,094 individuals in the labor force. Within the labor force, individuals with less than high school education have the highest percentage of unemployment, with 6.9% or 134 of them being unemployed.
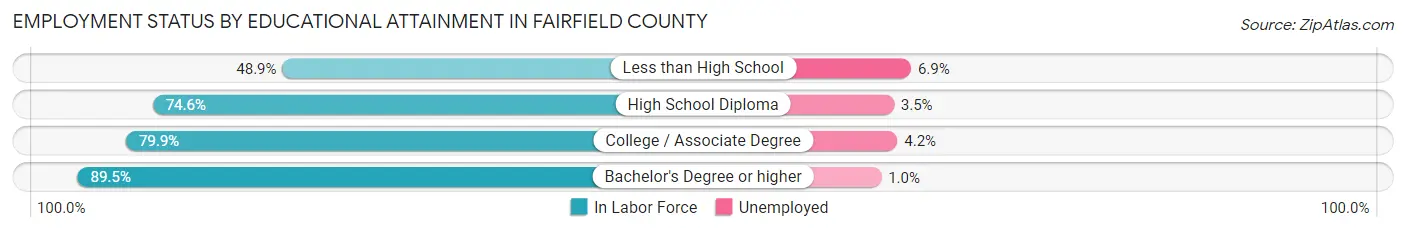
| Educational Attainment | In Labor Force | Unemployed |
| Less than High School | 1,947 (48.9%) | 275 (6.9%) |
| High School Diploma | 18,202 (74.6%) | 854 (3.5%) |
| College / Associate Degree | 20,540 (79.9%) | 1,080 (4.2%) |
| Bachelor's Degree or higher | 25,094 (89.5%) | 280 (1.0%) |
| Total | 65,784 (80.1%) | 2,382 (2.9%) |
Employment Occupations by Sex in Fairfield County
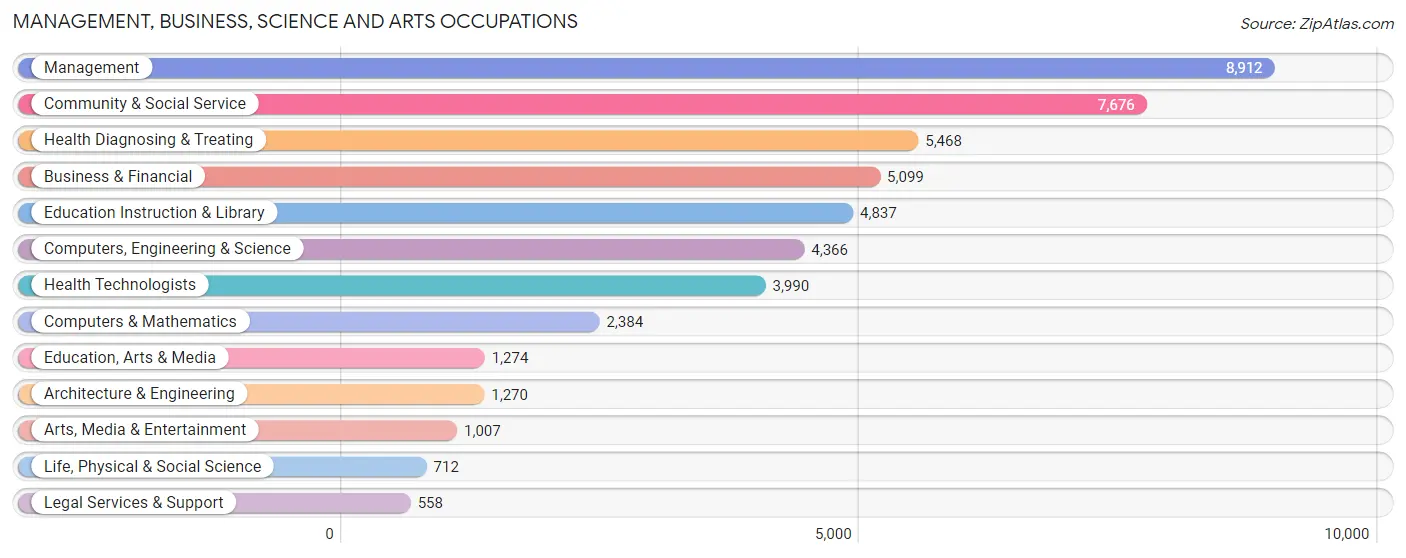
Management, Business, Science and Arts Occupations
The most common Management, Business, Science and Arts occupations in Fairfield County are Management (8,912 | 11.4%), Community & Social Service (7,676 | 9.8%), Health Diagnosing & Treating (5,468 | 7.0%), Business & Financial (5,099 | 6.5%), and Education Instruction & Library (4,837 | 6.2%).
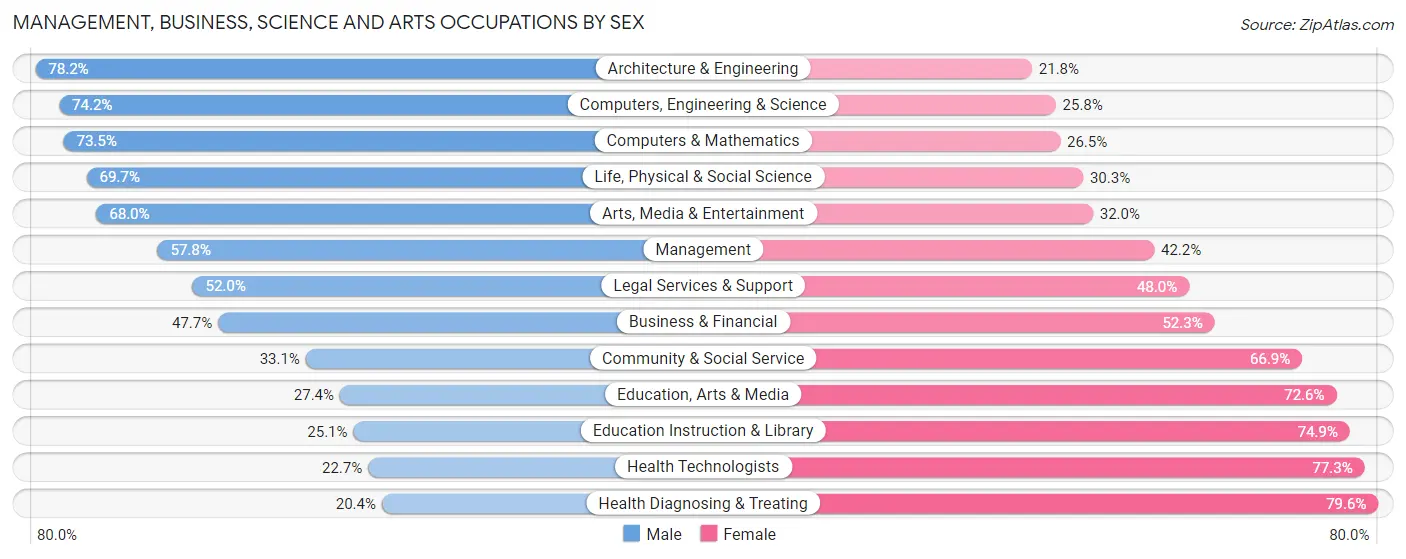
Management, Business, Science and Arts Occupations by Sex
Within the Management, Business, Science and Arts occupations in Fairfield County, the most male-oriented occupations are Architecture & Engineering (78.2%), Computers, Engineering & Science (74.2%), and Computers & Mathematics (73.5%), while the most female-oriented occupations are Health Diagnosing & Treating (79.6%), Health Technologists (77.3%), and Education Instruction & Library (74.9%).
| Occupation | Male | Female |
| Management | 5,151 (57.8%) | 3,761 (42.2%) |
| Business & Financial | 2,433 (47.7%) | 2,666 (52.3%) |
| Computers, Engineering & Science | 3,241 (74.2%) | 1,125 (25.8%) |
| Computers & Mathematics | 1,752 (73.5%) | 632 (26.5%) |
| Architecture & Engineering | 993 (78.2%) | 277 (21.8%) |
| Life, Physical & Social Science | 496 (69.7%) | 216 (30.3%) |
| Community & Social Service | 2,540 (33.1%) | 5,136 (66.9%) |
| Education, Arts & Media | 349 (27.4%) | 925 (72.6%) |
| Legal Services & Support | 290 (52.0%) | 268 (48.0%) |
| Education Instruction & Library | 1,216 (25.1%) | 3,621 (74.9%) |
| Arts, Media & Entertainment | 685 (68.0%) | 322 (32.0%) |
| Health Diagnosing & Treating | 1,115 (20.4%) | 4,353 (79.6%) |
| Health Technologists | 905 (22.7%) | 3,085 (77.3%) |
| Total (Category) | 14,480 (45.9%) | 17,041 (54.1%) |
| Total (Overall) | 41,115 (52.5%) | 37,202 (47.5%) |
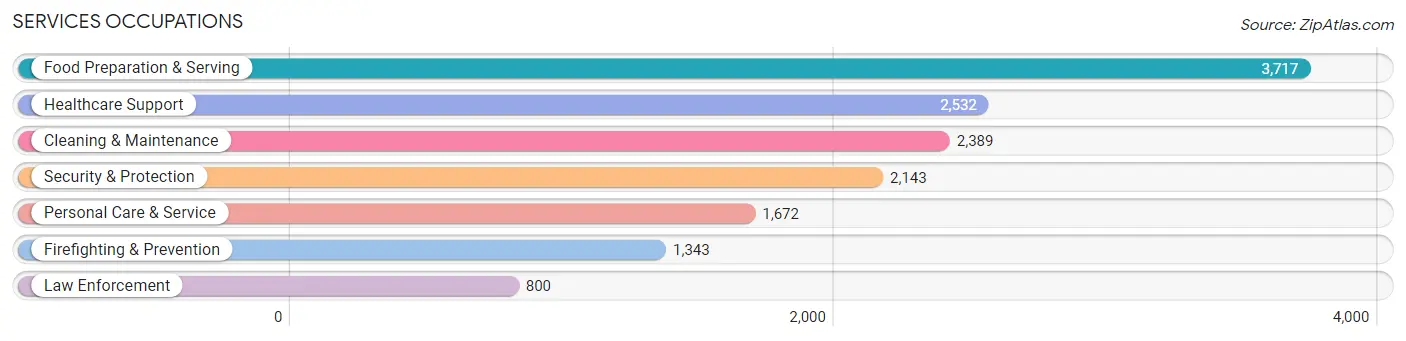
Services Occupations
The most common Services occupations in Fairfield County are Food Preparation & Serving (3,717 | 4.8%), Healthcare Support (2,532 | 3.2%), Cleaning & Maintenance (2,389 | 3.0%), Security & Protection (2,143 | 2.7%), and Personal Care & Service (1,672 | 2.1%).
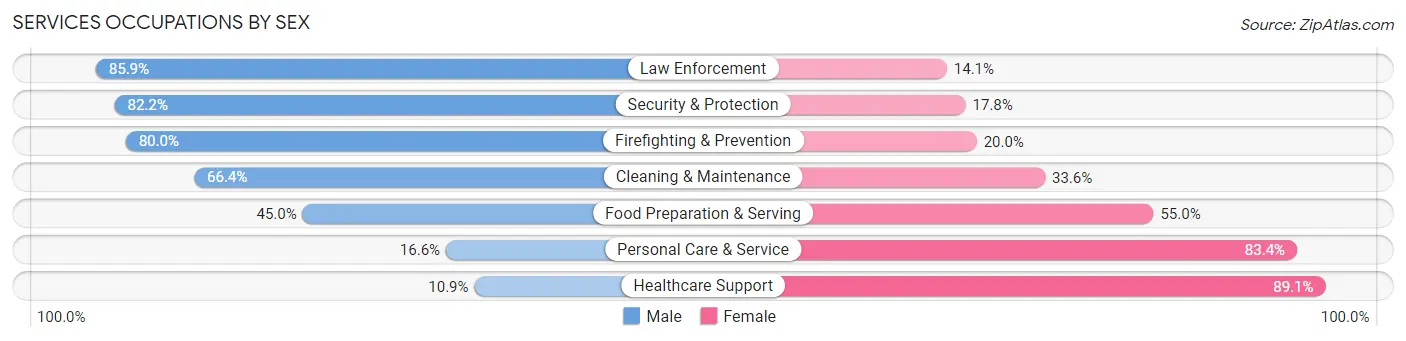
Services Occupations by Sex
Within the Services occupations in Fairfield County, the most male-oriented occupations are Law Enforcement (85.9%), Security & Protection (82.2%), and Firefighting & Prevention (80.0%), while the most female-oriented occupations are Healthcare Support (89.1%), Personal Care & Service (83.4%), and Food Preparation & Serving (55.0%).
| Occupation | Male | Female |
| Healthcare Support | 277 (10.9%) | 2,255 (89.1%) |
| Security & Protection | 1,761 (82.2%) | 382 (17.8%) |
| Firefighting & Prevention | 1,074 (80.0%) | 269 (20.0%) |
| Law Enforcement | 687 (85.9%) | 113 (14.1%) |
| Food Preparation & Serving | 1,671 (45.0%) | 2,046 (55.0%) |
| Cleaning & Maintenance | 1,587 (66.4%) | 802 (33.6%) |
| Personal Care & Service | 277 (16.6%) | 1,395 (83.4%) |
| Total (Category) | 5,573 (44.8%) | 6,880 (55.2%) |
| Total (Overall) | 41,115 (52.5%) | 37,202 (47.5%) |
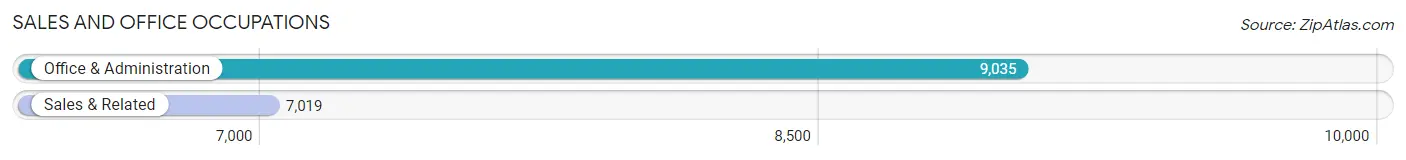
Sales and Office Occupations
The most common Sales and Office occupations in Fairfield County are Office & Administration (9,035 | 11.5%), and Sales & Related (7,019 | 9.0%).
Sales and Office Occupations by Sex
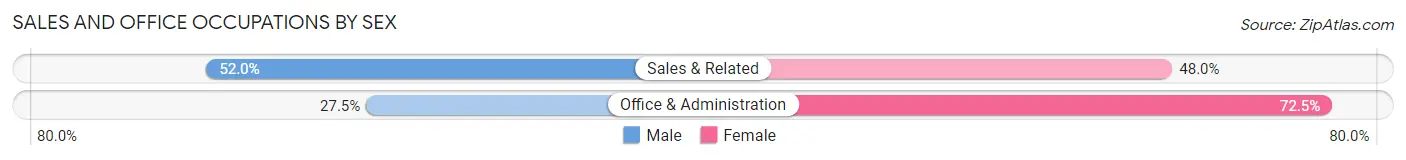
| Occupation | Male | Female |
| Sales & Related | 3,652 (52.0%) | 3,367 (48.0%) |
| Office & Administration | 2,481 (27.5%) | 6,554 (72.5%) |
| Total (Category) | 6,133 (38.2%) | 9,921 (61.8%) |
| Total (Overall) | 41,115 (52.5%) | 37,202 (47.5%) |
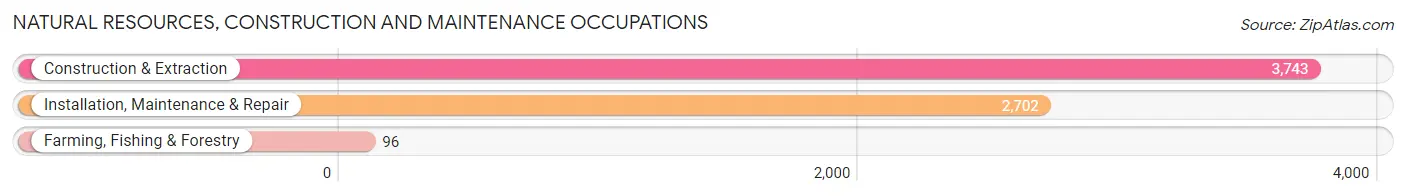
Natural Resources, Construction and Maintenance Occupations
The most common Natural Resources, Construction and Maintenance occupations in Fairfield County are Construction & Extraction (3,743 | 4.8%), Installation, Maintenance & Repair (2,702 | 3.5%), and Farming, Fishing & Forestry (96 | 0.1%).
Natural Resources, Construction and Maintenance Occupations by Sex
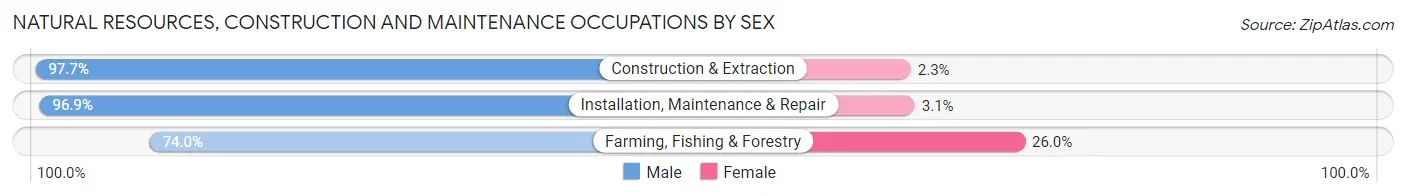
| Occupation | Male | Female |
| Farming, Fishing & Forestry | 71 (74.0%) | 25 (26.0%) |
| Construction & Extraction | 3,658 (97.7%) | 85 (2.3%) |
| Installation, Maintenance & Repair | 2,618 (96.9%) | 84 (3.1%) |
| Total (Category) | 6,347 (97.0%) | 194 (3.0%) |
| Total (Overall) | 41,115 (52.5%) | 37,202 (47.5%) |
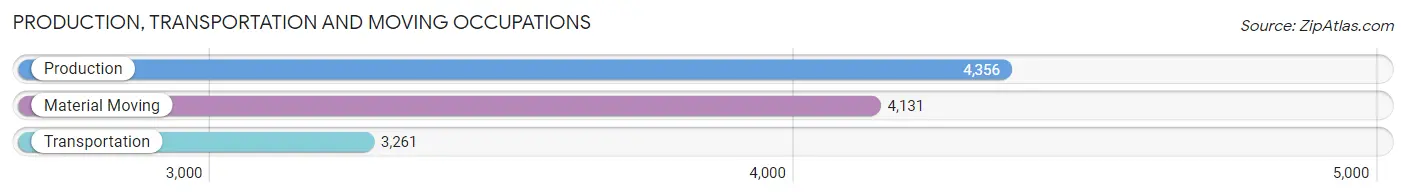
Production, Transportation and Moving Occupations
The most common Production, Transportation and Moving occupations in Fairfield County are Production (4,356 | 5.6%), Material Moving (4,131 | 5.3%), and Transportation (3,261 | 4.2%).
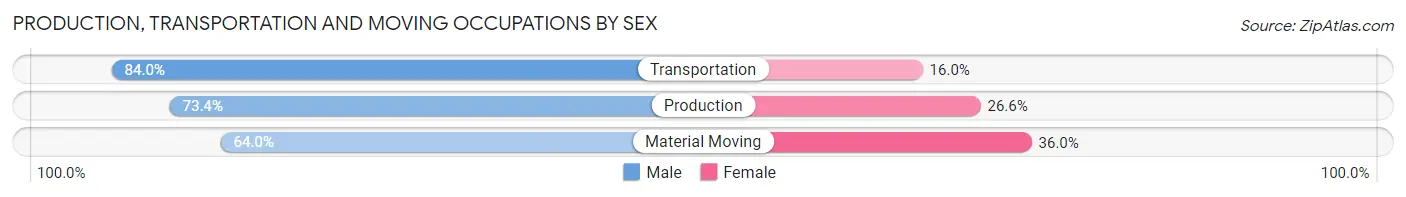
Production, Transportation and Moving Occupations by Sex
| Occupation | Male | Female |
| Production | 3,197 (73.4%) | 1,159 (26.6%) |
| Transportation | 2,740 (84.0%) | 521 (16.0%) |
| Material Moving | 2,645 (64.0%) | 1,486 (36.0%) |
| Total (Category) | 8,582 (73.1%) | 3,166 (27.0%) |
| Total (Overall) | 41,115 (52.5%) | 37,202 (47.5%) |
Employment Industries by Sex in Fairfield County
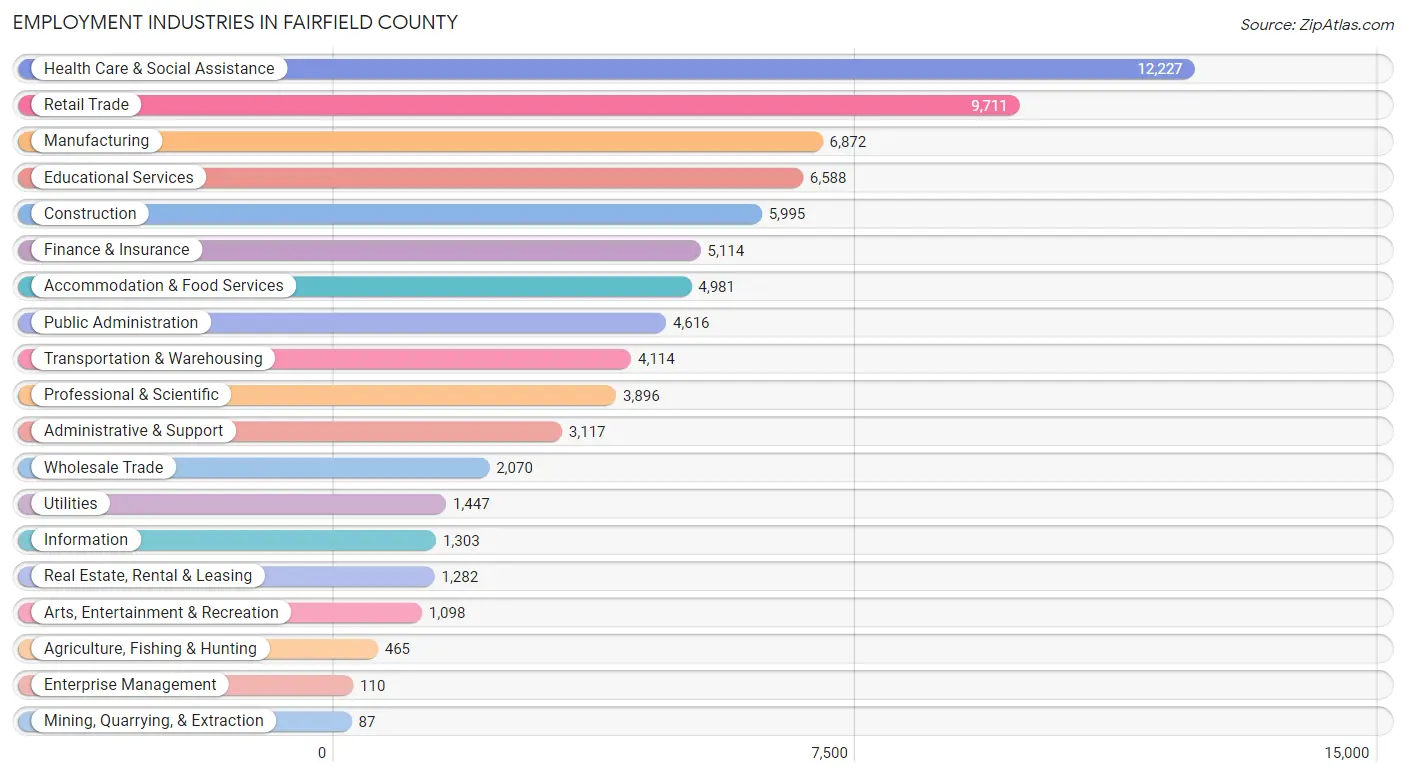
Employment Industries in Fairfield County
The major employment industries in Fairfield County include Health Care & Social Assistance (12,227 | 15.6%), Retail Trade (9,711 | 12.4%), Manufacturing (6,872 | 8.8%), Educational Services (6,588 | 8.4%), and Construction (5,995 | 7.6%).
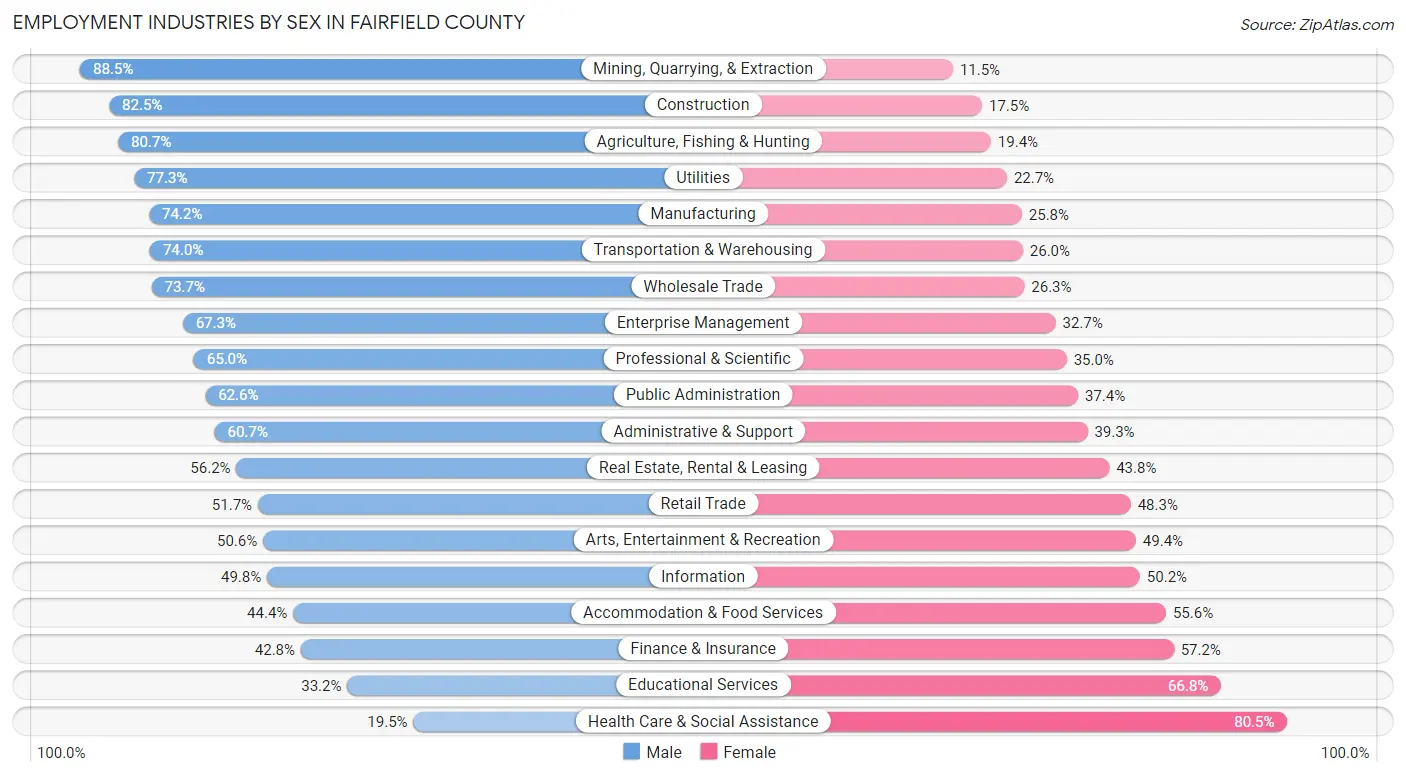
Employment Industries by Sex in Fairfield County
The Fairfield County industries that see more men than women are Mining, Quarrying, & Extraction (88.5%), Construction (82.5%), and Agriculture, Fishing & Hunting (80.6%), whereas the industries that tend to have a higher number of women are Health Care & Social Assistance (80.5%), Educational Services (66.8%), and Finance & Insurance (57.2%).
| Industry | Male | Female |
| Agriculture, Fishing & Hunting | 375 (80.6%) | 90 (19.4%) |
| Mining, Quarrying, & Extraction | 77 (88.5%) | 10 (11.5%) |
| Construction | 4,945 (82.5%) | 1,050 (17.5%) |
| Manufacturing | 5,102 (74.2%) | 1,770 (25.8%) |
| Wholesale Trade | 1,526 (73.7%) | 544 (26.3%) |
| Retail Trade | 5,022 (51.7%) | 4,689 (48.3%) |
| Transportation & Warehousing | 3,046 (74.0%) | 1,068 (26.0%) |
| Utilities | 1,119 (77.3%) | 328 (22.7%) |
| Information | 649 (49.8%) | 654 (50.2%) |
| Finance & Insurance | 2,190 (42.8%) | 2,924 (57.2%) |
| Real Estate, Rental & Leasing | 720 (56.2%) | 562 (43.8%) |
| Professional & Scientific | 2,531 (65.0%) | 1,365 (35.0%) |
| Enterprise Management | 74 (67.3%) | 36 (32.7%) |
| Administrative & Support | 1,891 (60.7%) | 1,226 (39.3%) |
| Educational Services | 2,188 (33.2%) | 4,400 (66.8%) |
| Health Care & Social Assistance | 2,387 (19.5%) | 9,840 (80.5%) |
| Arts, Entertainment & Recreation | 556 (50.6%) | 542 (49.4%) |
| Accommodation & Food Services | 2,212 (44.4%) | 2,769 (55.6%) |
| Public Administration | 2,890 (62.6%) | 1,726 (37.4%) |
| Total | 41,115 (52.5%) | 37,202 (47.5%) |
Education in Fairfield County
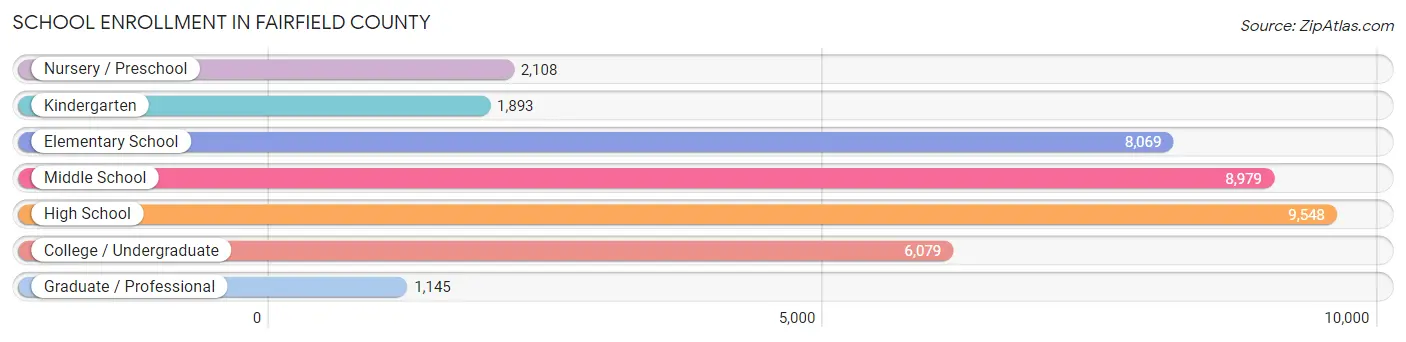
School Enrollment in Fairfield County
The most common levels of schooling among the 37,821 students in Fairfield County are high school (9,548 | 25.3%), middle school (8,979 | 23.7%), and elementary school (8,069 | 21.3%).
| School Level | # Students | % Students |
| Nursery / Preschool | 2,108 | 5.6% |
| Kindergarten | 1,893 | 5.0% |
| Elementary School | 8,069 | 21.3% |
| Middle School | 8,979 | 23.7% |
| High School | 9,548 | 25.3% |
| College / Undergraduate | 6,079 | 16.1% |
| Graduate / Professional | 1,145 | 3.0% |
| Total | 37,821 | 100.0% |
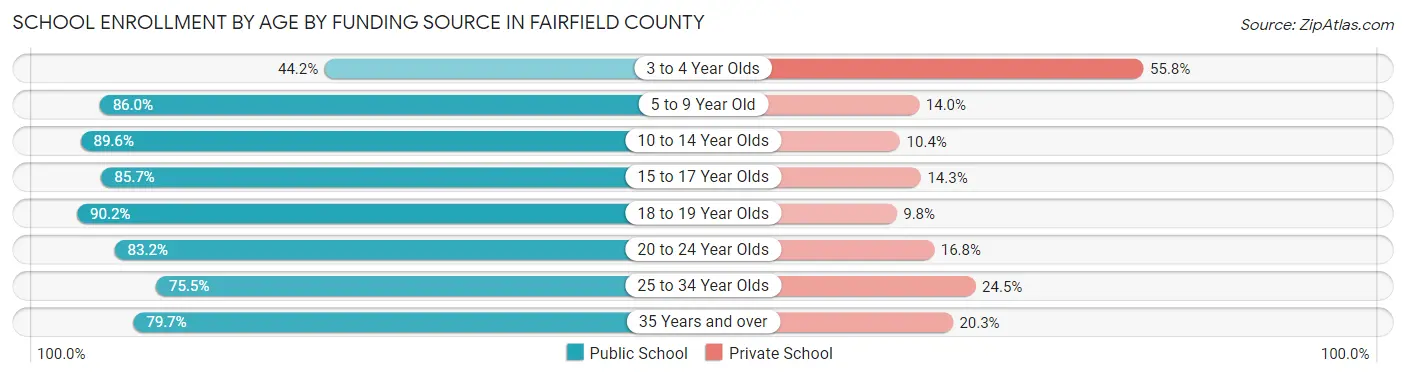
School Enrollment by Age by Funding Source in Fairfield County
Out of a total of 37,821 students who are enrolled in schools in Fairfield County, 5,711 (15.1%) attend a private institution, while the remaining 32,110 (84.9%) are enrolled in public schools. The age group of 3 to 4 year olds has the highest likelihood of being enrolled in private schools, with 734 (55.8% in the age bracket) enrolled. Conversely, the age group of 18 to 19 year olds has the lowest likelihood of being enrolled in a private school, with 2,402 (90.2% in the age bracket) attending a public institution.
| Age Bracket | Public School | Private School |
| 3 to 4 Year Olds | 582 (44.2%) | 734 (55.8%) |
| 5 to 9 Year Old | 8,031 (86.0%) | 1,307 (14.0%) |
| 10 to 14 Year Olds | 10,079 (89.6%) | 1,174 (10.4%) |
| 15 to 17 Year Olds | 5,864 (85.7%) | 979 (14.3%) |
| 18 to 19 Year Olds | 2,402 (90.2%) | 261 (9.8%) |
| 20 to 24 Year Olds | 2,683 (83.2%) | 541 (16.8%) |
| 25 to 34 Year Olds | 1,301 (75.5%) | 422 (24.5%) |
| 35 Years and over | 1,165 (79.7%) | 296 (20.3%) |
| Total | 32,110 (84.9%) | 5,711 (15.1%) |
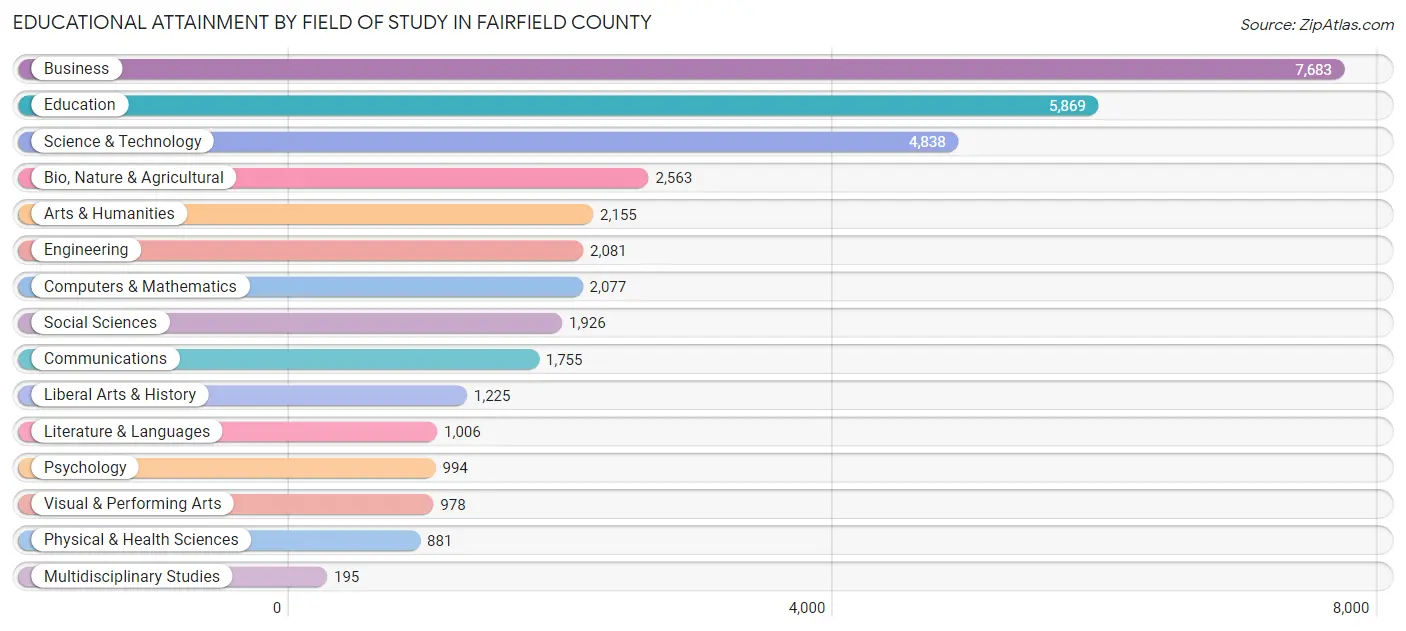
Educational Attainment by Field of Study in Fairfield County
Business (7,683 | 21.2%), education (5,869 | 16.2%), science & technology (4,838 | 13.4%), bio, nature & agricultural (2,563 | 7.1%), and arts & humanities (2,155 | 5.9%) are the most common fields of study among 36,226 individuals in Fairfield County who have obtained a bachelor's degree or higher.
| Field of Study | # Graduates | % Graduates |
| Computers & Mathematics | 2,077 | 5.7% |
| Bio, Nature & Agricultural | 2,563 | 7.1% |
| Physical & Health Sciences | 881 | 2.4% |
| Psychology | 994 | 2.7% |
| Social Sciences | 1,926 | 5.3% |
| Engineering | 2,081 | 5.7% |
| Multidisciplinary Studies | 195 | 0.5% |
| Science & Technology | 4,838 | 13.4% |
| Business | 7,683 | 21.2% |
| Education | 5,869 | 16.2% |
| Literature & Languages | 1,006 | 2.8% |
| Liberal Arts & History | 1,225 | 3.4% |
| Visual & Performing Arts | 978 | 2.7% |
| Communications | 1,755 | 4.8% |
| Arts & Humanities | 2,155 | 5.9% |
| Total | 36,226 | 100.0% |
Transportation & Commute in Fairfield County
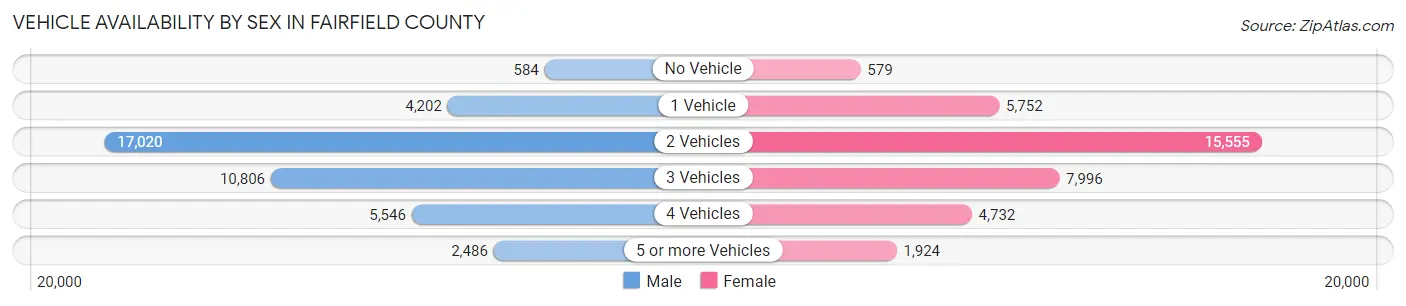
Vehicle Availability by Sex in Fairfield County
The most prevalent vehicle ownership categories in Fairfield County are males with 2 vehicles (17,020, accounting for 41.9%) and females with 2 vehicles (15,555, making up 46.6%).
| Vehicles Available | Male | Female |
| No Vehicle | 584 (1.4%) | 579 (1.6%) |
| 1 Vehicle | 4,202 (10.3%) | 5,752 (15.7%) |
| 2 Vehicles | 17,020 (41.9%) | 15,555 (42.6%) |
| 3 Vehicles | 10,806 (26.6%) | 7,996 (21.9%) |
| 4 Vehicles | 5,546 (13.7%) | 4,732 (13.0%) |
| 5 or more Vehicles | 2,486 (6.1%) | 1,924 (5.3%) |
| Total | 40,644 (100.0%) | 36,538 (100.0%) |
Commute Time in Fairfield County
The most frequently occuring commute durations in Fairfield County are 30 to 34 minutes (10,462 commuters, 15.2%), 20 to 24 minutes (8,495 commuters, 12.3%), and 10 to 14 minutes (8,023 commuters, 11.6%).
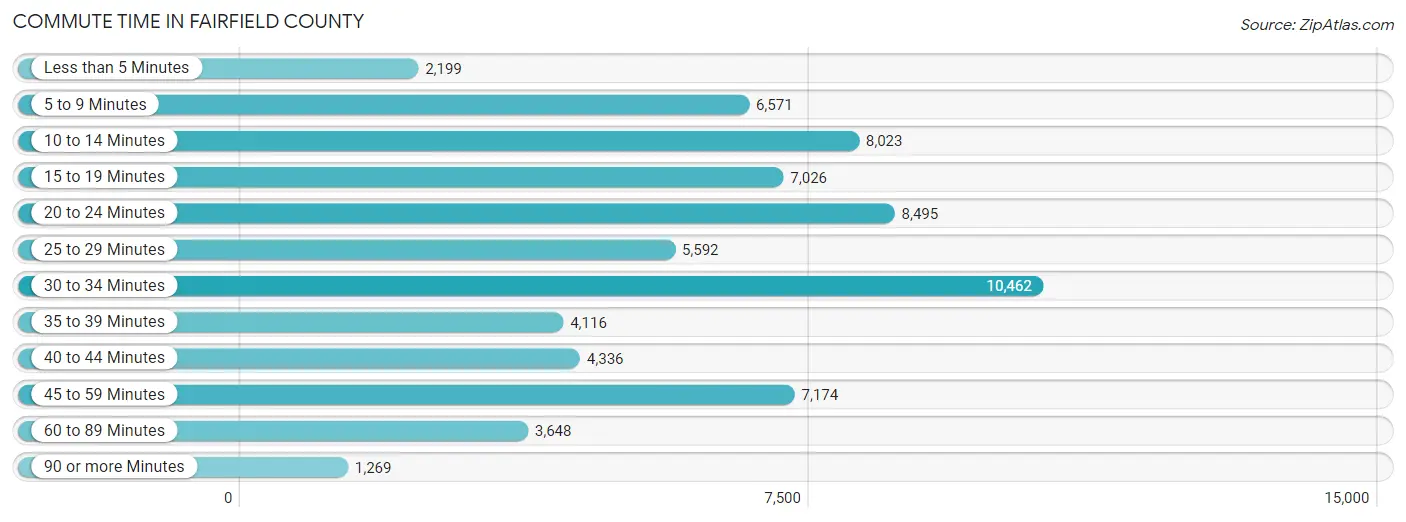
| Commute Time | # Commuters | % Commuters |
| Less than 5 Minutes | 2,199 | 3.2% |
| 5 to 9 Minutes | 6,571 | 9.5% |
| 10 to 14 Minutes | 8,023 | 11.6% |
| 15 to 19 Minutes | 7,026 | 10.2% |
| 20 to 24 Minutes | 8,495 | 12.3% |
| 25 to 29 Minutes | 5,592 | 8.1% |
| 30 to 34 Minutes | 10,462 | 15.2% |
| 35 to 39 Minutes | 4,116 | 6.0% |
| 40 to 44 Minutes | 4,336 | 6.3% |
| 45 to 59 Minutes | 7,174 | 10.4% |
| 60 to 89 Minutes | 3,648 | 5.3% |
| 90 or more Minutes | 1,269 | 1.8% |
Commute Time by Sex in Fairfield County
The most common commute times in Fairfield County are 30 to 34 minutes (5,628 commuters, 15.4%) for males and 30 to 34 minutes (4,834 commuters, 14.9%) for females.
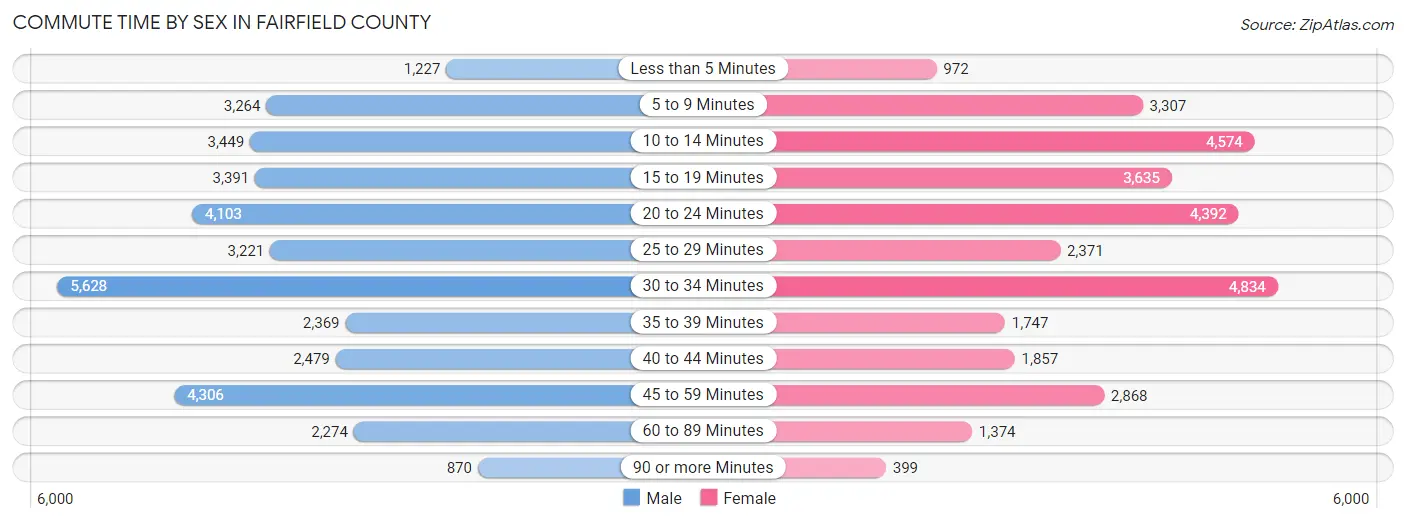
| Commute Time | Male | Female |
| Less than 5 Minutes | 1,227 (3.4%) | 972 (3.0%) |
| 5 to 9 Minutes | 3,264 (8.9%) | 3,307 (10.2%) |
| 10 to 14 Minutes | 3,449 (9.4%) | 4,574 (14.1%) |
| 15 to 19 Minutes | 3,391 (9.3%) | 3,635 (11.2%) |
| 20 to 24 Minutes | 4,103 (11.2%) | 4,392 (13.6%) |
| 25 to 29 Minutes | 3,221 (8.8%) | 2,371 (7.3%) |
| 30 to 34 Minutes | 5,628 (15.4%) | 4,834 (14.9%) |
| 35 to 39 Minutes | 2,369 (6.5%) | 1,747 (5.4%) |
| 40 to 44 Minutes | 2,479 (6.8%) | 1,857 (5.7%) |
| 45 to 59 Minutes | 4,306 (11.8%) | 2,868 (8.9%) |
| 60 to 89 Minutes | 2,274 (6.2%) | 1,374 (4.3%) |
| 90 or more Minutes | 870 (2.4%) | 399 (1.2%) |
Time of Departure to Work by Sex in Fairfield County
The most frequent times of departure to work in Fairfield County are 6:00 AM to 6:29 AM (5,206, 14.2%) for males and 7:00 AM to 7:29 AM (4,760, 14.7%) for females.
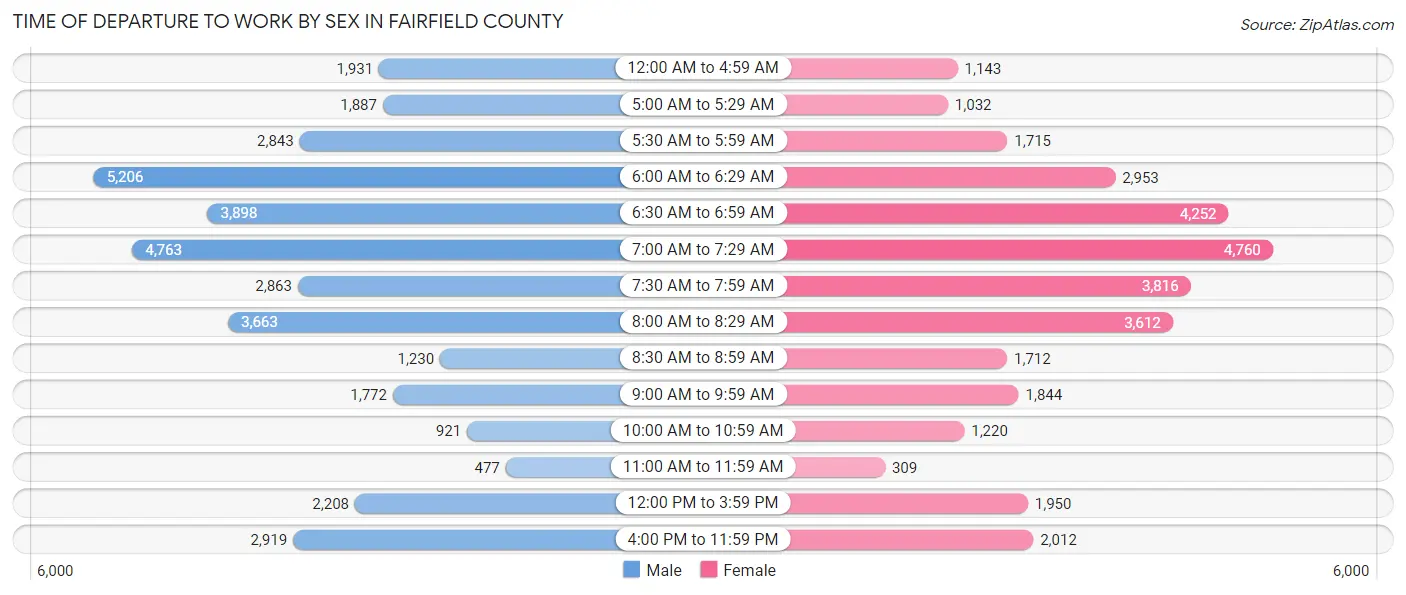
| Time of Departure | Male | Female |
| 12:00 AM to 4:59 AM | 1,931 (5.3%) | 1,143 (3.5%) |
| 5:00 AM to 5:29 AM | 1,887 (5.2%) | 1,032 (3.2%) |
| 5:30 AM to 5:59 AM | 2,843 (7.8%) | 1,715 (5.3%) |
| 6:00 AM to 6:29 AM | 5,206 (14.2%) | 2,953 (9.1%) |
| 6:30 AM to 6:59 AM | 3,898 (10.7%) | 4,252 (13.2%) |
| 7:00 AM to 7:29 AM | 4,763 (13.0%) | 4,760 (14.7%) |
| 7:30 AM to 7:59 AM | 2,863 (7.8%) | 3,816 (11.8%) |
| 8:00 AM to 8:29 AM | 3,663 (10.0%) | 3,612 (11.2%) |
| 8:30 AM to 8:59 AM | 1,230 (3.4%) | 1,712 (5.3%) |
| 9:00 AM to 9:59 AM | 1,772 (4.8%) | 1,844 (5.7%) |
| 10:00 AM to 10:59 AM | 921 (2.5%) | 1,220 (3.8%) |
| 11:00 AM to 11:59 AM | 477 (1.3%) | 309 (1.0%) |
| 12:00 PM to 3:59 PM | 2,208 (6.0%) | 1,950 (6.0%) |
| 4:00 PM to 11:59 PM | 2,919 (8.0%) | 2,012 (6.2%) |
| Total | 36,581 (100.0%) | 32,330 (100.0%) |
Housing Occupancy in Fairfield County
Occupancy by Ownership in Fairfield County
Of the total 58,723 dwellings in Fairfield County, owner-occupied units account for 43,974 (74.9%), while renter-occupied units make up 14,749 (25.1%).
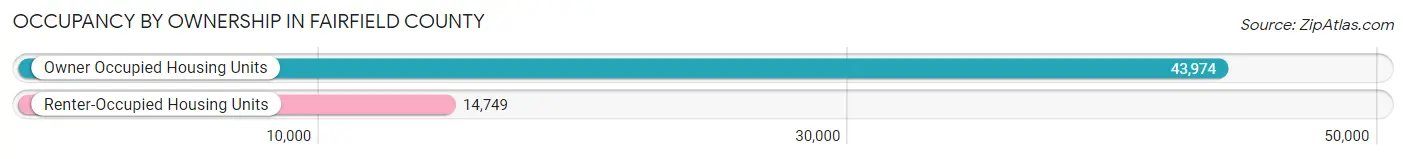
| Occupancy | # Housing Units | % Housing Units |
| Owner Occupied Housing Units | 43,974 | 74.9% |
| Renter-Occupied Housing Units | 14,749 | 25.1% |
| Total Occupied Housing Units | 58,723 | 100.0% |
Occupancy by Household Size in Fairfield County
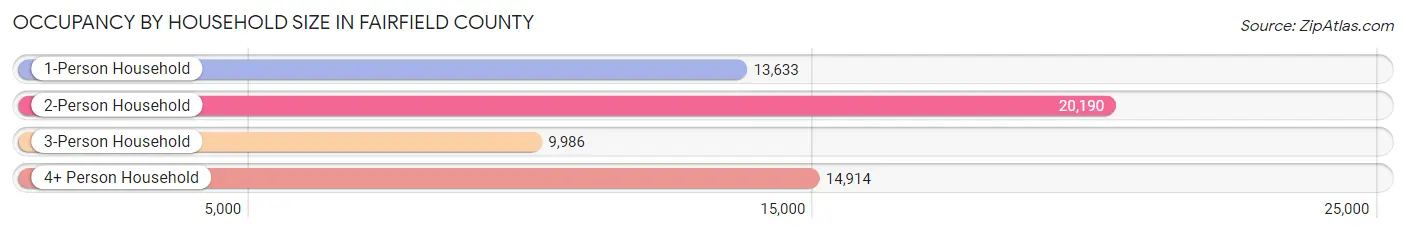
| Household Size | # Housing Units | % Housing Units |
| 1-Person Household | 13,633 | 23.2% |
| 2-Person Household | 20,190 | 34.4% |
| 3-Person Household | 9,986 | 17.0% |
| 4+ Person Household | 14,914 | 25.4% |
| Total Housing Units | 58,723 | 100.0% |
Occupancy by Ownership by Household Size in Fairfield County
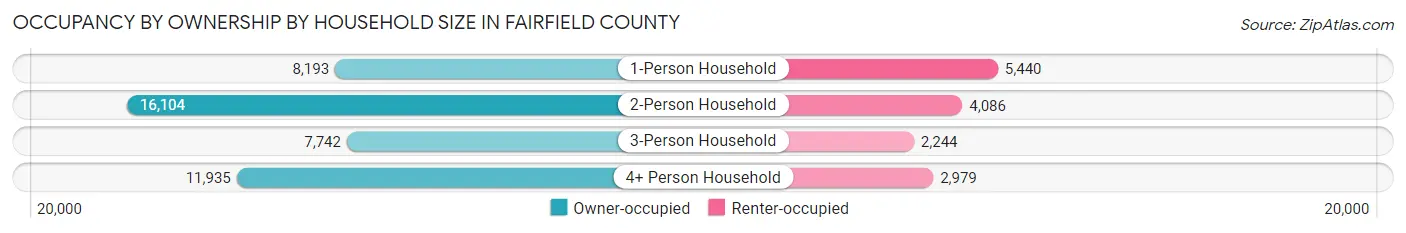
| Household Size | Owner-occupied | Renter-occupied |
| 1-Person Household | 8,193 (60.1%) | 5,440 (39.9%) |
| 2-Person Household | 16,104 (79.8%) | 4,086 (20.2%) |
| 3-Person Household | 7,742 (77.5%) | 2,244 (22.5%) |
| 4+ Person Household | 11,935 (80.0%) | 2,979 (20.0%) |
| Total Housing Units | 43,974 (74.9%) | 14,749 (25.1%) |
Occupancy by Educational Attainment in Fairfield County
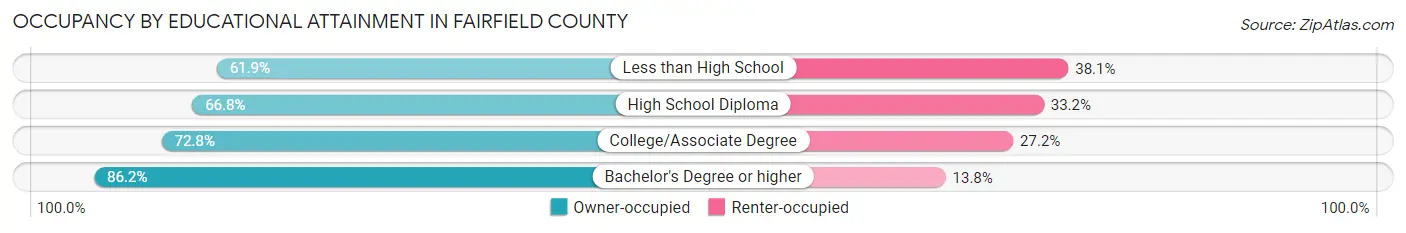
| Household Size | Owner-occupied | Renter-occupied |
| Less than High School | 1,818 (61.9%) | 1,119 (38.1%) |
| High School Diploma | 12,135 (66.8%) | 6,042 (33.2%) |
| College/Associate Degree | 13,099 (72.8%) | 4,885 (27.2%) |
| Bachelor's Degree or higher | 16,922 (86.2%) | 2,703 (13.8%) |
Occupancy by Age of Householder in Fairfield County
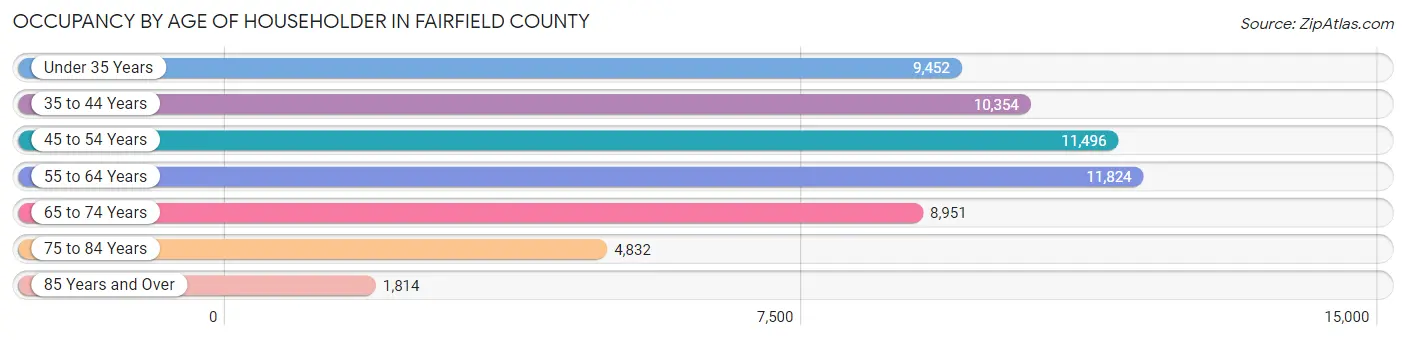
| Age Bracket | # Households | % Households |
| Under 35 Years | 9,452 | 16.1% |
| 35 to 44 Years | 10,354 | 17.6% |
| 45 to 54 Years | 11,496 | 19.6% |
| 55 to 64 Years | 11,824 | 20.1% |
| 65 to 74 Years | 8,951 | 15.2% |
| 75 to 84 Years | 4,832 | 8.2% |
| 85 Years and Over | 1,814 | 3.1% |
| Total | 58,723 | 100.0% |
Housing Finances in Fairfield County
Median Income by Occupancy in Fairfield County
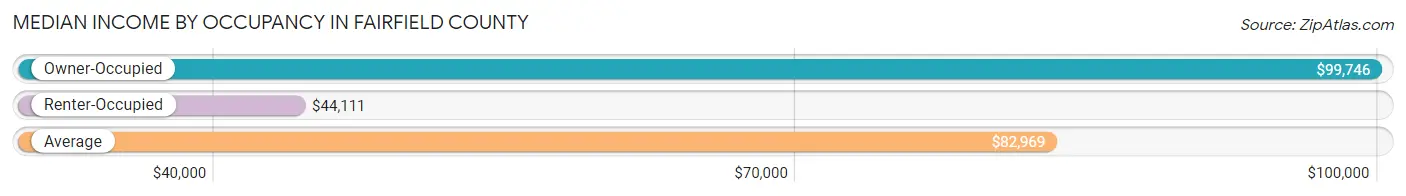
| Occupancy Type | # Households | Median Income |
| Owner-Occupied | 43,974 (74.9%) | $99,746 |
| Renter-Occupied | 14,749 (25.1%) | $44,111 |
| Average | 58,723 (100.0%) | $82,969 |
Occupancy by Householder Income Bracket in Fairfield County
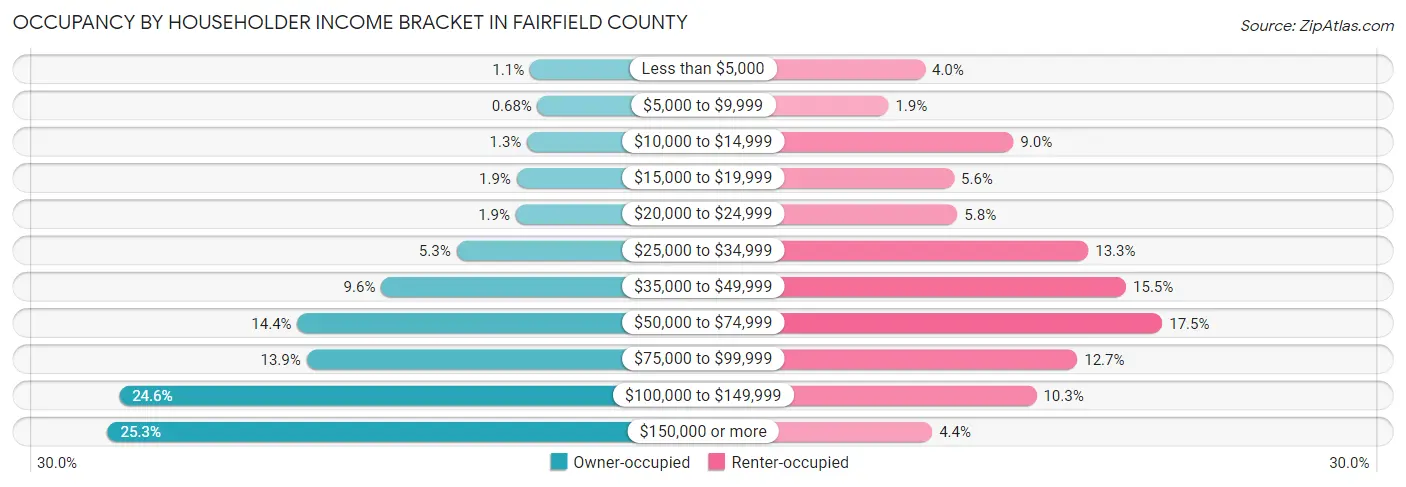
| Income Bracket | Owner-occupied | Renter-occupied |
| Less than $5,000 | 494 (1.1%) | 585 (4.0%) |
| $5,000 to $9,999 | 300 (0.7%) | 278 (1.9%) |
| $10,000 to $14,999 | 563 (1.3%) | 1,330 (9.0%) |
| $15,000 to $19,999 | 828 (1.9%) | 830 (5.6%) |
| $20,000 to $24,999 | 850 (1.9%) | 859 (5.8%) |
| $25,000 to $34,999 | 2,340 (5.3%) | 1,962 (13.3%) |
| $35,000 to $49,999 | 4,232 (9.6%) | 2,280 (15.5%) |
| $50,000 to $74,999 | 6,336 (14.4%) | 2,586 (17.5%) |
| $75,000 to $99,999 | 6,107 (13.9%) | 1,868 (12.7%) |
| $100,000 to $149,999 | 10,815 (24.6%) | 1,525 (10.3%) |
| $150,000 or more | 11,109 (25.3%) | 646 (4.4%) |
| Total | 43,974 (100.0%) | 14,749 (100.0%) |
Monthly Housing Cost Tiers in Fairfield County
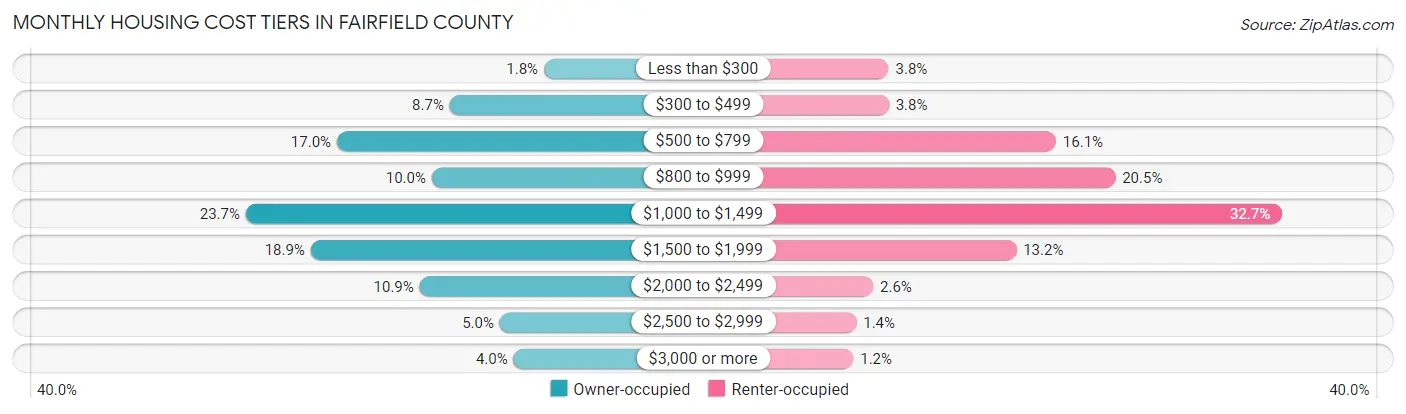
| Monthly Cost | Owner-occupied | Renter-occupied |
| Less than $300 | 771 (1.8%) | 556 (3.8%) |
| $300 to $499 | 3,823 (8.7%) | 557 (3.8%) |
| $500 to $799 | 7,476 (17.0%) | 2,373 (16.1%) |
| $800 to $999 | 4,403 (10.0%) | 3,018 (20.5%) |
| $1,000 to $1,499 | 10,427 (23.7%) | 4,829 (32.7%) |
| $1,500 to $1,999 | 8,325 (18.9%) | 1,943 (13.2%) |
| $2,000 to $2,499 | 4,796 (10.9%) | 388 (2.6%) |
| $2,500 to $2,999 | 2,199 (5.0%) | 205 (1.4%) |
| $3,000 or more | 1,754 (4.0%) | 173 (1.2%) |
| Total | 43,974 (100.0%) | 14,749 (100.0%) |
Physical Housing Characteristics in Fairfield County
Housing Structures in Fairfield County
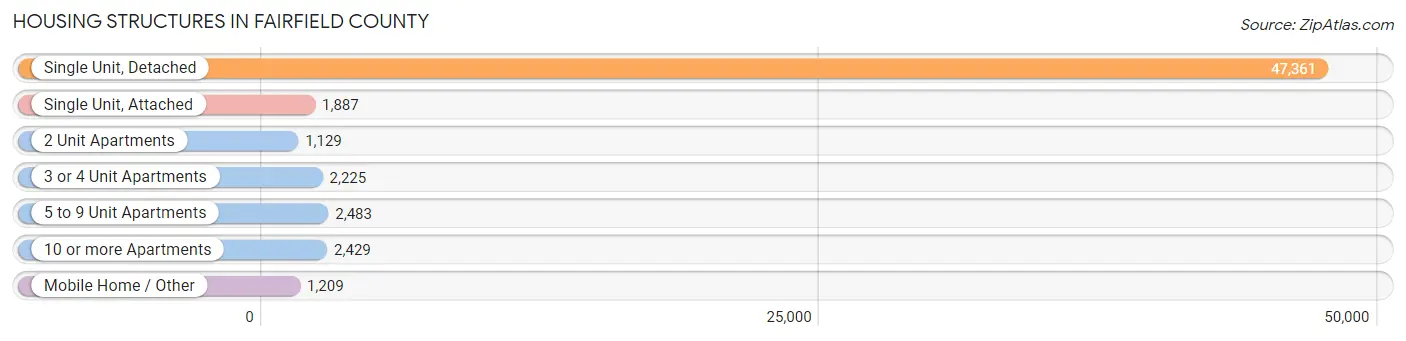
| Structure Type | # Housing Units | % Housing Units |
| Single Unit, Detached | 47,361 | 80.6% |
| Single Unit, Attached | 1,887 | 3.2% |
| 2 Unit Apartments | 1,129 | 1.9% |
| 3 or 4 Unit Apartments | 2,225 | 3.8% |
| 5 to 9 Unit Apartments | 2,483 | 4.2% |
| 10 or more Apartments | 2,429 | 4.1% |
| Mobile Home / Other | 1,209 | 2.1% |
| Total | 58,723 | 100.0% |
Housing Structures by Occupancy in Fairfield County
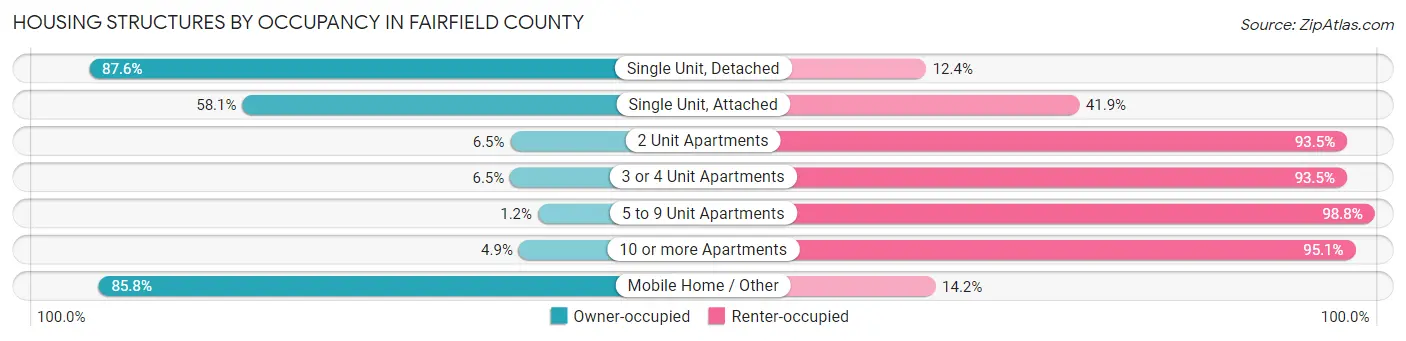
| Structure Type | Owner-occupied | Renter-occupied |
| Single Unit, Detached | 41,476 (87.6%) | 5,885 (12.4%) |
| Single Unit, Attached | 1,096 (58.1%) | 791 (41.9%) |
| 2 Unit Apartments | 73 (6.5%) | 1,056 (93.5%) |
| 3 or 4 Unit Apartments | 145 (6.5%) | 2,080 (93.5%) |
| 5 to 9 Unit Apartments | 29 (1.2%) | 2,454 (98.8%) |
| 10 or more Apartments | 118 (4.9%) | 2,311 (95.1%) |
| Mobile Home / Other | 1,037 (85.8%) | 172 (14.2%) |
| Total | 43,974 (74.9%) | 14,749 (25.1%) |
Housing Structures by Number of Rooms in Fairfield County
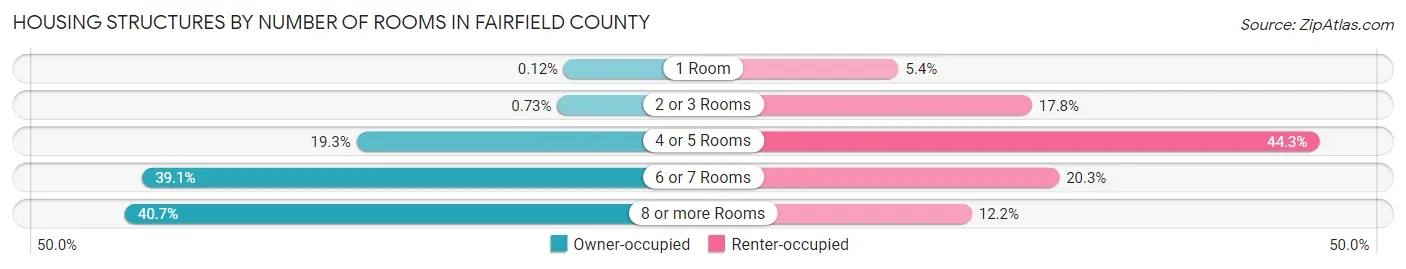
| Number of Rooms | Owner-occupied | Renter-occupied |
| 1 Room | 53 (0.1%) | 800 (5.4%) |
| 2 or 3 Rooms | 320 (0.7%) | 2,618 (17.7%) |
| 4 or 5 Rooms | 8,488 (19.3%) | 6,540 (44.3%) |
| 6 or 7 Rooms | 17,204 (39.1%) | 2,991 (20.3%) |
| 8 or more Rooms | 17,909 (40.7%) | 1,800 (12.2%) |
| Total | 43,974 (100.0%) | 14,749 (100.0%) |
Housing Structure by Heating Type in Fairfield County
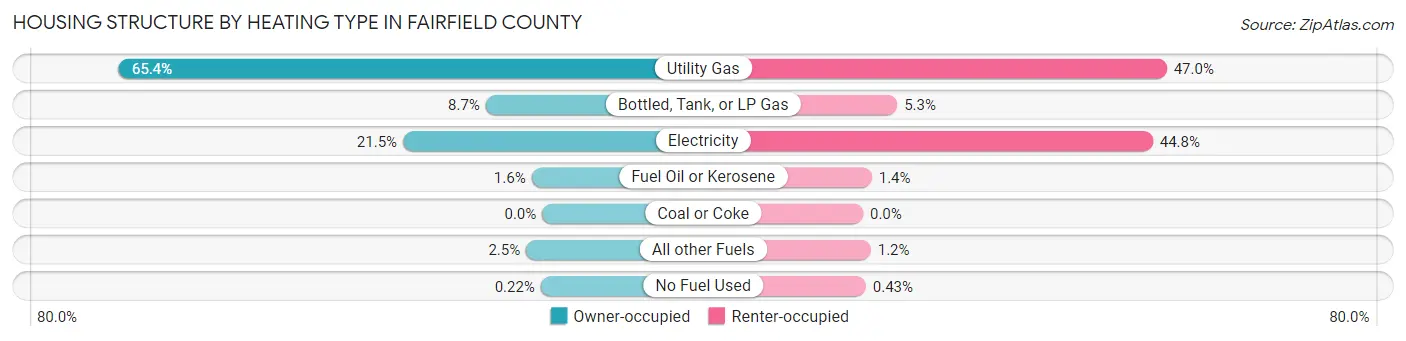
| Heating Type | Owner-occupied | Renter-occupied |
| Utility Gas | 28,769 (65.4%) | 6,925 (46.9%) |
| Bottled, Tank, or LP Gas | 3,835 (8.7%) | 779 (5.3%) |
| Electricity | 9,463 (21.5%) | 6,606 (44.8%) |
| Fuel Oil or Kerosene | 721 (1.6%) | 199 (1.3%) |
| Coal or Coke | 0 (0.0%) | 0 (0.0%) |
| All other Fuels | 1,090 (2.5%) | 177 (1.2%) |
| No Fuel Used | 96 (0.2%) | 63 (0.4%) |
| Total | 43,974 (100.0%) | 14,749 (100.0%) |
Household Vehicle Usage in Fairfield County
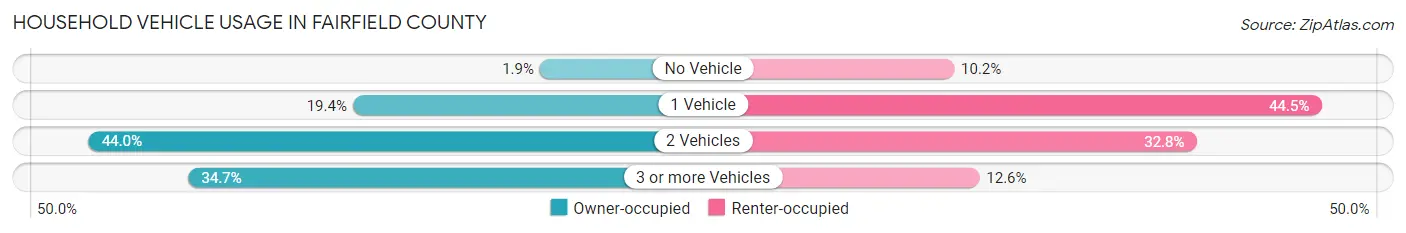
| Vehicles per Household | Owner-occupied | Renter-occupied |
| No Vehicle | 838 (1.9%) | 1,503 (10.2%) |
| 1 Vehicle | 8,517 (19.4%) | 6,558 (44.5%) |
| 2 Vehicles | 19,355 (44.0%) | 4,837 (32.8%) |
| 3 or more Vehicles | 15,264 (34.7%) | 1,851 (12.6%) |
| Total | 43,974 (100.0%) | 14,749 (100.0%) |
Real Estate & Mortgages in Fairfield County
Real Estate and Mortgage Overview in Fairfield County
| Characteristic | Without Mortgage | With Mortgage |
| Housing Units | 13,919 | 30,055 |
| Median Property Value | $228,500 | $255,700 |
| Median Household Income | $72,563 | $8,623 |
| Monthly Housing Costs | $613 | $1,717 |
| Real Estate Taxes | $2,767 | $366 |
Property Value by Mortgage Status in Fairfield County
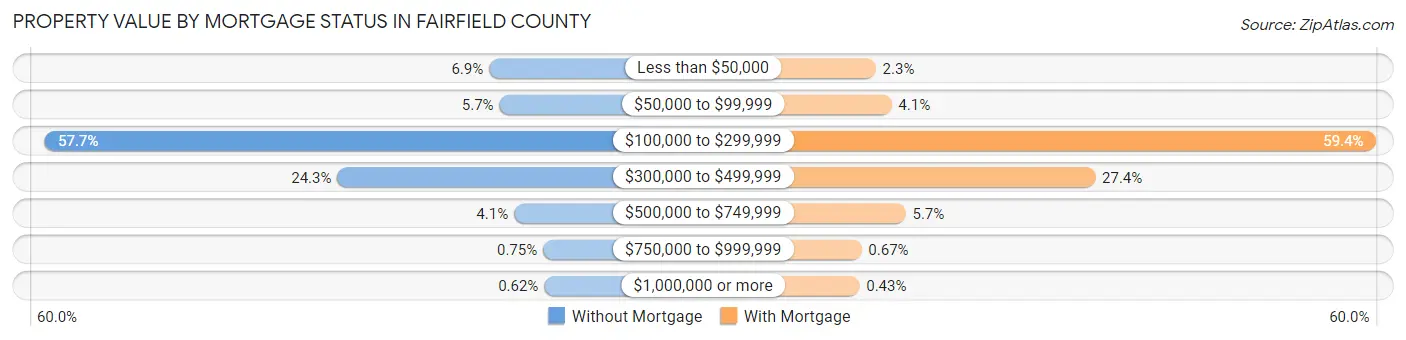
| Property Value | Without Mortgage | With Mortgage |
| Less than $50,000 | 963 (6.9%) | 691 (2.3%) |
| $50,000 to $99,999 | 798 (5.7%) | 1,233 (4.1%) |
| $100,000 to $299,999 | 8,024 (57.7%) | 17,856 (59.4%) |
| $300,000 to $499,999 | 3,377 (24.3%) | 8,229 (27.4%) |
| $500,000 to $749,999 | 567 (4.1%) | 1,716 (5.7%) |
| $750,000 to $999,999 | 104 (0.7%) | 202 (0.7%) |
| $1,000,000 or more | 86 (0.6%) | 128 (0.4%) |
| Total | 13,919 (100.0%) | 30,055 (100.0%) |
Household Income by Mortgage Status in Fairfield County
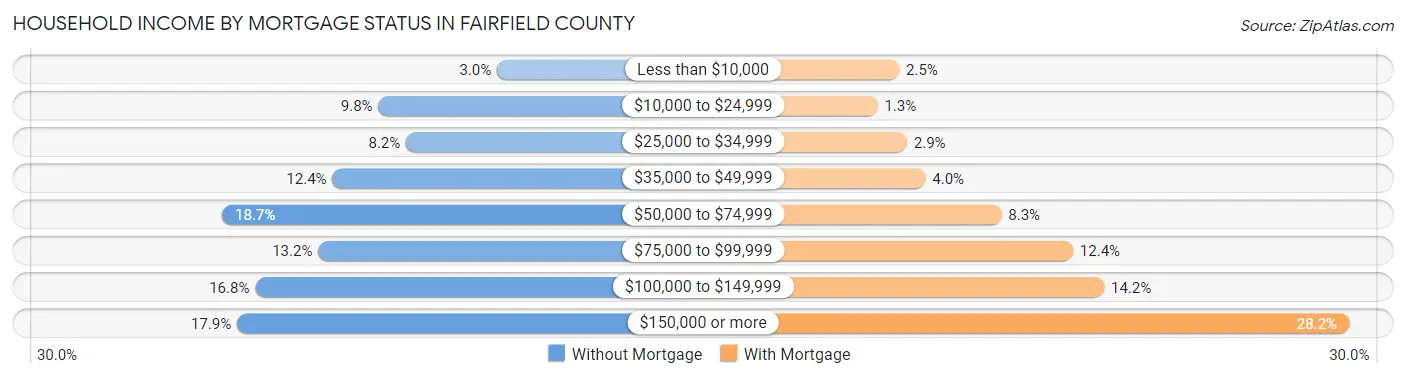
| Household Income | Without Mortgage | With Mortgage |
| Less than $10,000 | 418 (3.0%) | 748 (2.5%) |
| $10,000 to $24,999 | 1,361 (9.8%) | 376 (1.3%) |
| $25,000 to $34,999 | 1,142 (8.2%) | 880 (2.9%) |
| $35,000 to $49,999 | 1,727 (12.4%) | 1,198 (4.0%) |
| $50,000 to $74,999 | 2,604 (18.7%) | 2,505 (8.3%) |
| $75,000 to $99,999 | 1,840 (13.2%) | 3,732 (12.4%) |
| $100,000 to $149,999 | 2,341 (16.8%) | 4,267 (14.2%) |
| $150,000 or more | 2,486 (17.9%) | 8,474 (28.2%) |
| Total | 13,919 (100.0%) | 30,055 (100.0%) |
Property Value to Household Income Ratio in Fairfield County
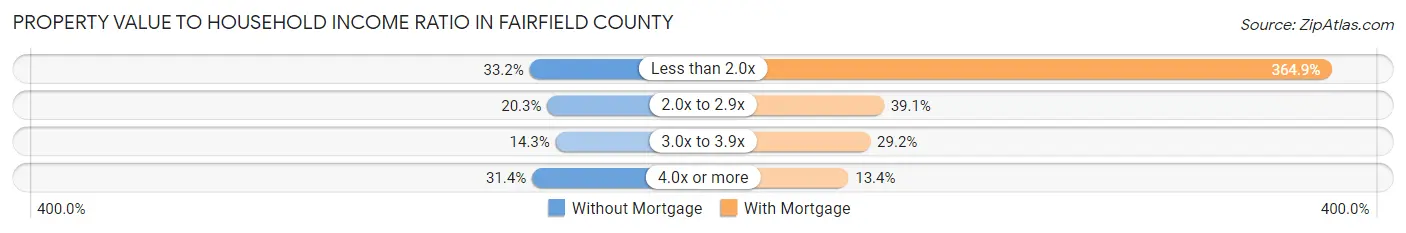
| Value-to-Income Ratio | Without Mortgage | With Mortgage |
| Less than 2.0x | 4,616 (33.2%) | 109,659 (364.9%) |
| 2.0x to 2.9x | 2,823 (20.3%) | 11,736 (39.1%) |
| 3.0x to 3.9x | 1,984 (14.2%) | 8,788 (29.2%) |
| 4.0x or more | 4,367 (31.4%) | 4,018 (13.4%) |
| Total | 13,919 (100.0%) | 30,055 (100.0%) |
Real Estate Taxes by Mortgage Status in Fairfield County
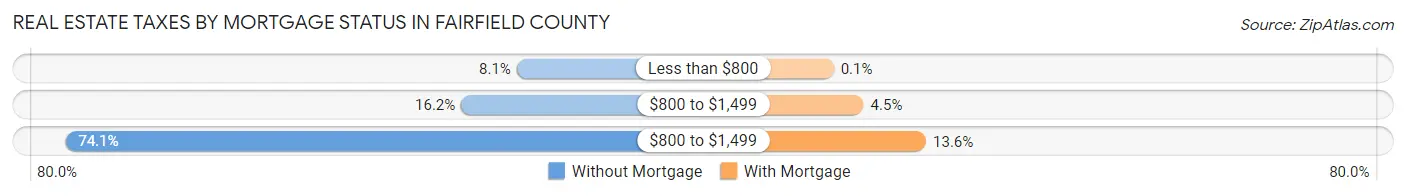
| Property Taxes | Without Mortgage | With Mortgage |
| Less than $800 | 1,128 (8.1%) | 31 (0.1%) |
| $800 to $1,499 | 2,258 (16.2%) | 1,344 (4.5%) |
| $800 to $1,499 | 10,307 (74.1%) | 4,087 (13.6%) |
| Total | 13,919 (100.0%) | 30,055 (100.0%) |
Health & Disability in Fairfield County
Health Insurance Coverage by Age in Fairfield County
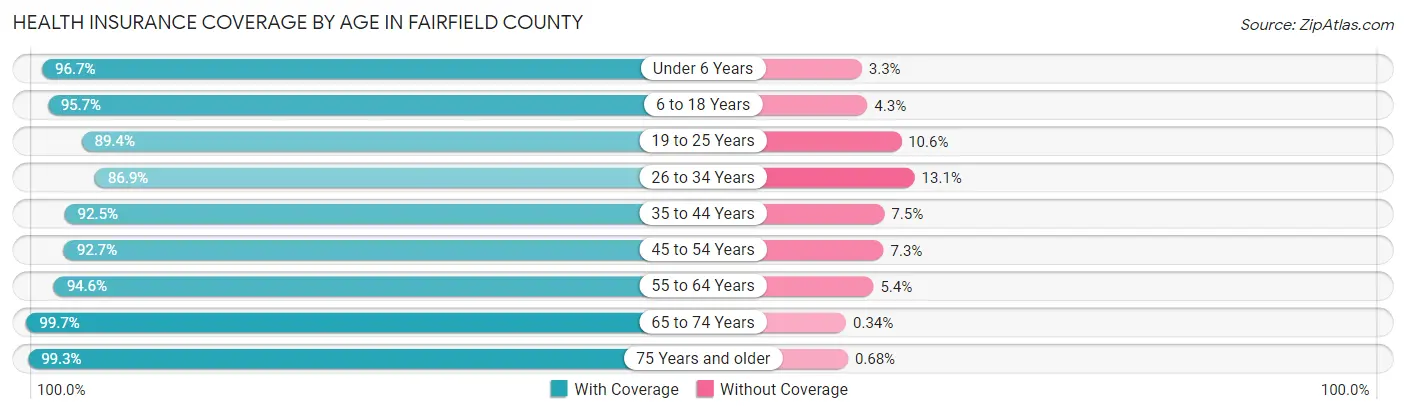
| Age Bracket | With Coverage | Without Coverage |
| Under 6 Years | 10,827 (96.7%) | 367 (3.3%) |
| 6 to 18 Years | 27,601 (95.7%) | 1,244 (4.3%) |
| 19 to 25 Years | 11,486 (89.4%) | 1,365 (10.6%) |
| 26 to 34 Years | 14,038 (86.9%) | 2,119 (13.1%) |
| 35 to 44 Years | 19,008 (92.5%) | 1,537 (7.5%) |
| 45 to 54 Years | 19,417 (92.7%) | 1,535 (7.3%) |
| 55 to 64 Years | 19,648 (94.6%) | 1,130 (5.4%) |
| 65 to 74 Years | 14,744 (99.7%) | 51 (0.3%) |
| 75 Years and older | 10,002 (99.3%) | 68 (0.7%) |
| Total | 146,771 (94.0%) | 9,416 (6.0%) |
Health Insurance Coverage by Citizenship Status in Fairfield County
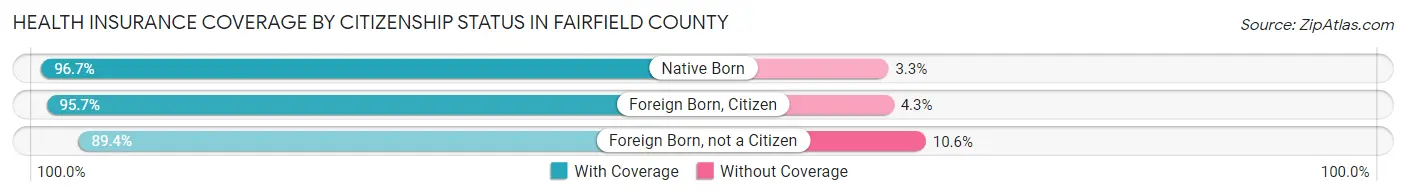
| Citizenship Status | With Coverage | Without Coverage |
| Native Born | 10,827 (96.7%) | 367 (3.3%) |
| Foreign Born, Citizen | 27,601 (95.7%) | 1,244 (4.3%) |
| Foreign Born, not a Citizen | 11,486 (89.4%) | 1,365 (10.6%) |
Health Insurance Coverage by Household Income in Fairfield County
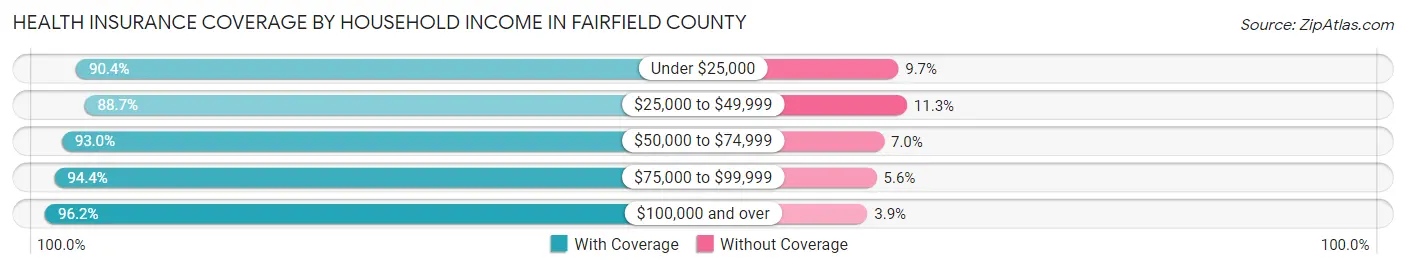
| Household Income | With Coverage | Without Coverage |
| Under $25,000 | 10,053 (90.3%) | 1,074 (9.7%) |
| $25,000 to $49,999 | 19,965 (88.7%) | 2,533 (11.3%) |
| $50,000 to $74,999 | 20,353 (93.0%) | 1,528 (7.0%) |
| $75,000 to $99,999 | 21,156 (94.4%) | 1,252 (5.6%) |
| $100,000 and over | 75,030 (96.2%) | 3,003 (3.8%) |
Public vs Private Health Insurance Coverage by Age in Fairfield County
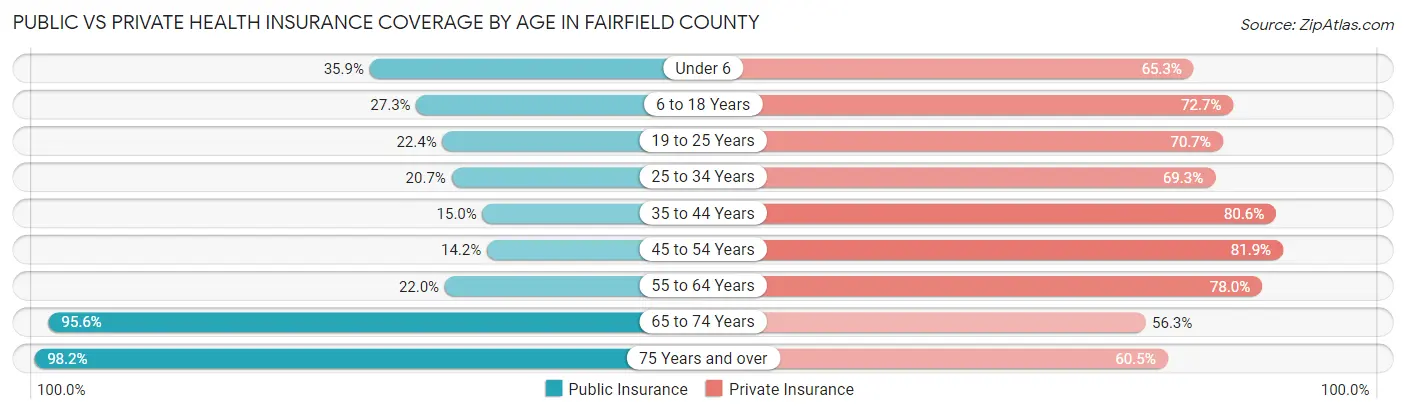
| Age Bracket | Public Insurance | Private Insurance |
| Under 6 | 4,023 (35.9%) | 7,311 (65.3%) |
| 6 to 18 Years | 7,866 (27.3%) | 20,956 (72.7%) |
| 19 to 25 Years | 2,882 (22.4%) | 9,083 (70.7%) |
| 25 to 34 Years | 3,350 (20.7%) | 11,191 (69.3%) |
| 35 to 44 Years | 3,080 (15.0%) | 16,562 (80.6%) |
| 45 to 54 Years | 2,967 (14.2%) | 17,153 (81.9%) |
| 55 to 64 Years | 4,567 (22.0%) | 16,207 (78.0%) |
| 65 to 74 Years | 14,139 (95.6%) | 8,329 (56.3%) |
| 75 Years and over | 9,890 (98.2%) | 6,087 (60.5%) |
| Total | 52,764 (33.8%) | 112,879 (72.3%) |
Disability Status by Sex by Age in Fairfield County
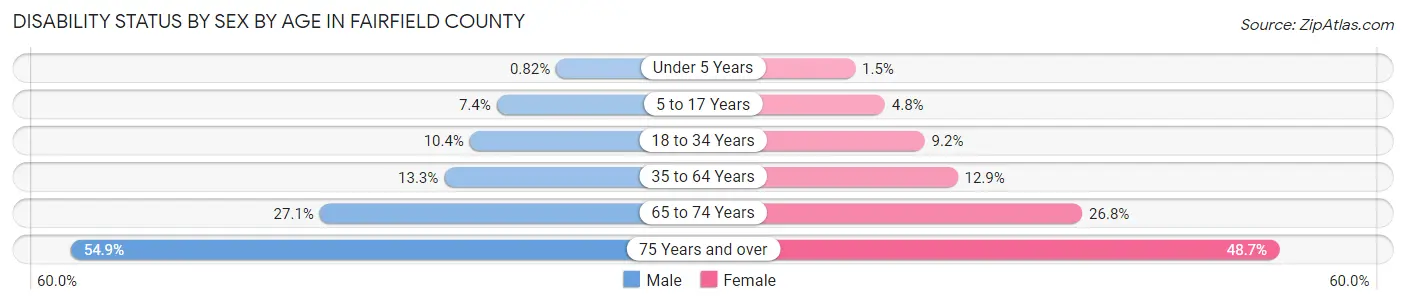
| Age Bracket | Male | Female |
| Under 5 Years | 38 (0.8%) | 67 (1.5%) |
| 5 to 17 Years | 1,100 (7.4%) | 664 (4.8%) |
| 18 to 34 Years | 1,659 (10.4%) | 1,413 (9.2%) |
| 35 to 64 Years | 4,110 (13.3%) | 4,038 (12.9%) |
| 65 to 74 Years | 1,876 (27.1%) | 2,110 (26.8%) |
| 75 Years and over | 2,289 (54.8%) | 2,870 (48.7%) |
Disability Class by Sex by Age in Fairfield County
Disability Class: Hearing Difficulty
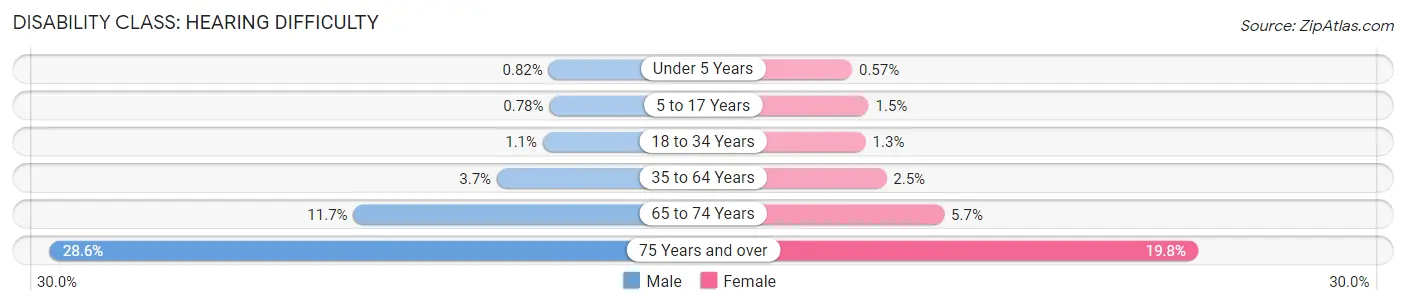
| Age Bracket | Male | Female |
| Under 5 Years | 38 (0.8%) | 26 (0.6%) |
| 5 to 17 Years | 116 (0.8%) | 206 (1.5%) |
| 18 to 34 Years | 181 (1.1%) | 203 (1.3%) |
| 35 to 64 Years | 1,145 (3.7%) | 778 (2.5%) |
| 65 to 74 Years | 808 (11.7%) | 449 (5.7%) |
| 75 Years and over | 1,193 (28.6%) | 1,169 (19.8%) |
Disability Class: Vision Difficulty
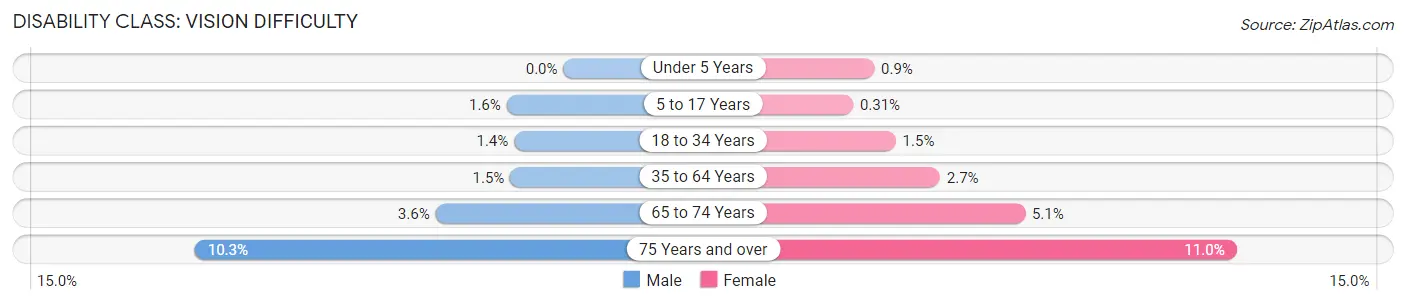
| Age Bracket | Male | Female |
| Under 5 Years | 0 (0.0%) | 41 (0.9%) |
| 5 to 17 Years | 233 (1.6%) | 43 (0.3%) |
| 18 to 34 Years | 218 (1.4%) | 229 (1.5%) |
| 35 to 64 Years | 458 (1.5%) | 854 (2.7%) |
| 65 to 74 Years | 246 (3.6%) | 402 (5.1%) |
| 75 Years and over | 428 (10.3%) | 648 (11.0%) |
Disability Class: Cognitive Difficulty
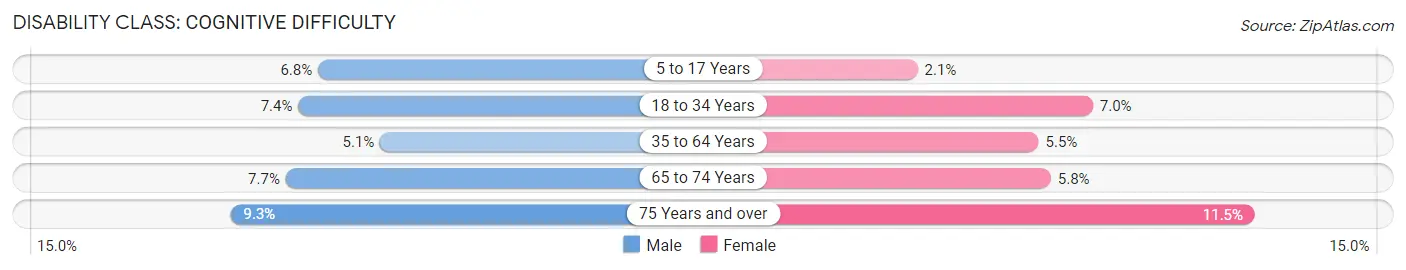
| Age Bracket | Male | Female |
| 5 to 17 Years | 1,009 (6.8%) | 293 (2.1%) |
| 18 to 34 Years | 1,174 (7.4%) | 1,070 (7.0%) |
| 35 to 64 Years | 1,578 (5.1%) | 1,718 (5.5%) |
| 65 to 74 Years | 534 (7.7%) | 459 (5.8%) |
| 75 Years and over | 387 (9.3%) | 678 (11.5%) |
Disability Class: Ambulatory Difficulty
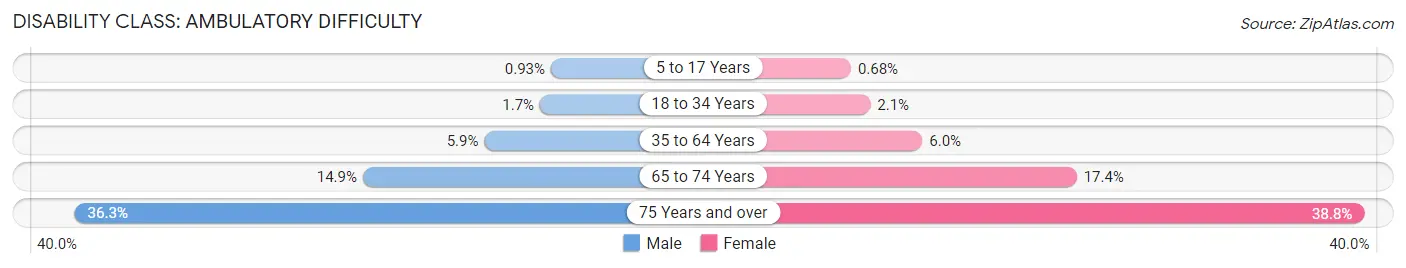
| Age Bracket | Male | Female |
| 5 to 17 Years | 138 (0.9%) | 94 (0.7%) |
| 18 to 34 Years | 277 (1.7%) | 325 (2.1%) |
| 35 to 64 Years | 1,816 (5.9%) | 1,874 (6.0%) |
| 65 to 74 Years | 1,029 (14.9%) | 1,375 (17.4%) |
| 75 Years and over | 1,514 (36.3%) | 2,287 (38.8%) |
Disability Class: Self-Care Difficulty
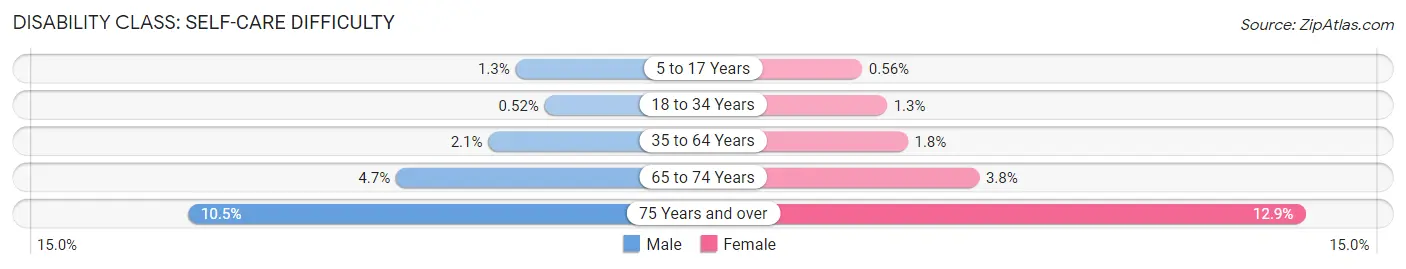
| Age Bracket | Male | Female |
| 5 to 17 Years | 197 (1.3%) | 78 (0.6%) |
| 18 to 34 Years | 82 (0.5%) | 191 (1.3%) |
| 35 to 64 Years | 647 (2.1%) | 573 (1.8%) |
| 65 to 74 Years | 322 (4.7%) | 301 (3.8%) |
| 75 Years and over | 436 (10.4%) | 761 (12.9%) |
Technology Access in Fairfield County
Computing Device Access in Fairfield County
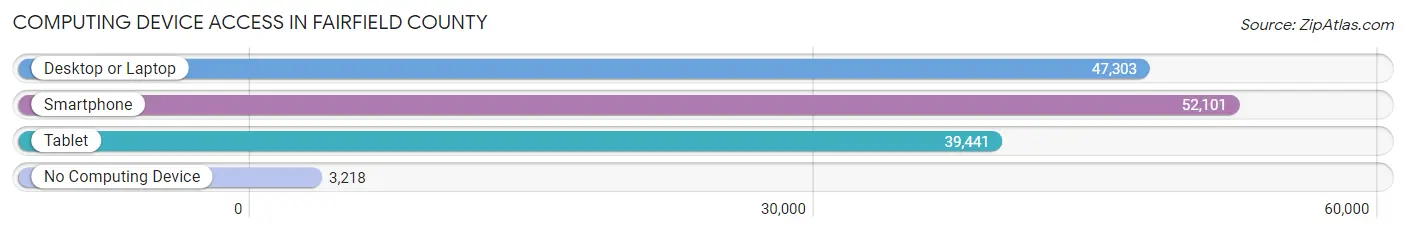
| Device Type | # Households | % Households |
| Desktop or Laptop | 47,303 | 80.5% |
| Smartphone | 52,101 | 88.7% |
| Tablet | 39,441 | 67.2% |
| No Computing Device | 3,218 | 5.5% |
| Total | 58,723 | 100.0% |
Internet Access in Fairfield County
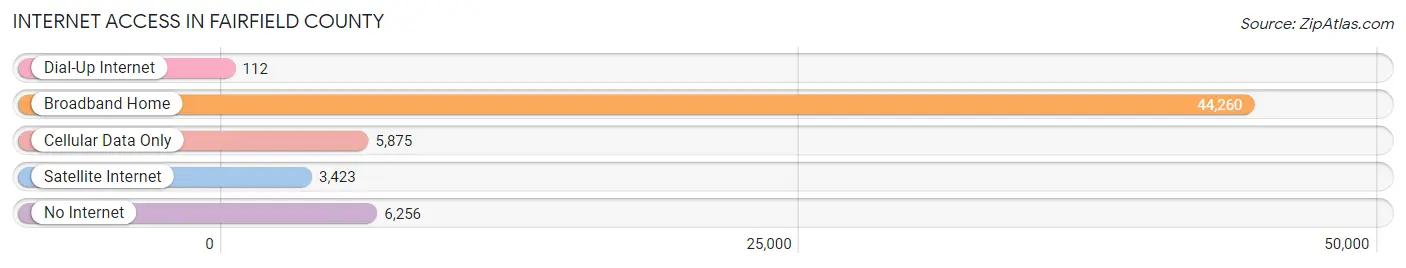
| Internet Type | # Households | % Households |
| Dial-Up Internet | 112 | 0.2% |
| Broadband Home | 44,260 | 75.4% |
| Cellular Data Only | 5,875 | 10.0% |
| Satellite Internet | 3,423 | 5.8% |
| No Internet | 6,256 | 10.6% |
| Total | 58,723 | 100.0% |
Fairfield County Summary
Fairfield County, Ohio is located in the south-central part of the state and is part of the Columbus, Ohio metropolitan area. It is bordered by Franklin, Licking, Perry, Hocking, and Pickaway counties. The county seat is Lancaster, and the largest city is Pickerington. The county was established in 1810 and named after the Revolutionary War hero, General Thomas Fairfield.
Geography
Fairfield County covers an area of 576 square miles and is located in the Appalachian Plateau region of Ohio. The terrain is mostly rolling hills and valleys, with some flat areas in the northern part of the county. The highest point in the county is located in the northern part of the county, at an elevation of 1,068 feet. The county is drained by the Hocking River, which flows through the center of the county. The county is also home to several state parks, including Hocking Hills State Park, Clear Creek Metro Park, and Buckeye Lake State Park.
Demographics
As of the 2010 census, the population of Fairfield County was 146,156. The population density was 253 people per square mile. The racial makeup of the county was 90.2% White, 5.3% African American, 0.4% Native American, 1.7% Asian, 0.2% Pacific Islander, 0.7% from other races, and 1.5% from two or more races. Hispanic or Latino of any race were 2.2% of the population.
The median income for a household in the county was $50,945, and the median income for a family was $60,945. The per capita income for the county was $24,945. About 6.2% of families and 8.3% of the population were below the poverty line, including 10.2% of those under age 18 and 6.2% of those age 65 or over.
Economy
Fairfield County has a diverse economy, with a mix of manufacturing, retail, and service industries. The county is home to several large employers, including Honda of America, which has a manufacturing plant in Marysville, and the Ohio State University, which has a campus in Lancaster. Other major employers include the Fairfield Medical Center, the Fairfield County Board of Education, and the Fairfield County Sheriff's Office.
The county is also home to several small businesses, including restaurants, retail stores, and professional services. Agriculture is also an important part of the county's economy, with corn, soybeans, and wheat being the main crops.
History
Fairfield County was established in 1810 and named after General Thomas Fairfield, a Revolutionary War hero. The county was originally part of Franklin County, but was split off in 1810. The county seat was originally located in Lancaster, but was moved to Pickerington in 1812.
The county was largely agricultural in the early years, with corn, wheat, and livestock being the main crops. The county also had several small manufacturing businesses, including a woolen mill, a sawmill, and a gristmill.
In the late 19th century, the county began to experience rapid growth, due to the arrival of the railroad and the development of the coal industry. The coal industry was especially important to the county, as it provided jobs and revenue for the county.
The county continued to grow in the 20th century, with the development of the automotive industry in Marysville and the growth of the Ohio State University in Lancaster. The county also experienced a population boom in the late 20th century, due to the growth of the Columbus metropolitan area.
Today, Fairfield County is a vibrant and diverse county, with a mix of urban and rural areas. The county is home to several large employers, including Honda of America and the Ohio State University, and is also home to several small businesses. The county is also home to several state parks, including Hocking Hills State Park, Clear Creek Metro Park, and Buckeye Lake State Park.
Common Questions
What is the Total Population of Fairfield County?
Total Population of Fairfield County is 159,371.
What is the Total Male Population of Fairfield County?
Total Male Population of Fairfield County is 79,759.
What is the Total Female Population of Fairfield County?
Total Female Population of Fairfield County is 79,612.
What is the Ratio of Males per 100 Females in Fairfield County?
There are 100.18 Males per 100 Females in Fairfield County.
What is the Ratio of Females per 100 Males in Fairfield County?
There are 99.82 Females per 100 Males in Fairfield County.
What is the Median Population Age in Fairfield County?
Median Population Age in Fairfield County is 39.5 Years.
What is the Average Family Size in Fairfield County
Average Family Size in Fairfield County is 3.1 People.
What is the Average Household Size in Fairfield County
Average Household Size in Fairfield County is 2.7 People.
What is Per Capita Income in Fairfield County?
Per Capita income in Fairfield County is $38,783.
What is the Median Family Income in Fairfield County?
Median Family Income in Fairfield County is $101,069.
What is the Median Household income in Fairfield County?
Median Household Income in Fairfield County is $82,969.
What is Income or Wage Gap in Fairfield County?
Income or Wage Gap in Fairfield County is 28.9%.
Women in Fairfield County earn 71.1 cents for every dollar earned by a man.
What is Family Income Deficit in Fairfield County?
Family Income Deficit in Fairfield County is $9,612.
Families that are below poverty line in Fairfield County earn $9,612 less on average than the poverty threshold level.
What is Inequality or Gini Index in Fairfield County?
Inequality or Gini Index in Fairfield County is 0.42.
How Large is the Labor Force in Fairfield County?
There are 81,791 People in the Labor Forcein in Fairfield County.
What is the Percentage of People in the Labor Force in Fairfield County?
64.8% of People are in the Labor Force in Fairfield County.
What is the Unemployment Rate in Fairfield County?
Unemployment Rate in Fairfield County is 3.7%.