Erie County, OH
Erie County Map
Erie County Overview
75,299
TOTAL POPULATION
37,056
MALE POPULATION
38,243
FEMALE POPULATION
96.90
MALES / 100 FEMALES
103.20
FEMALES / 100 MALES
44.8
MEDIAN AGE
2.9
AVG FAMILY SIZE
2.3
AVG HOUSEHOLD SIZE
$38,158
PER CAPITA INCOME
$82,540
AVG FAMILY INCOME
$65,171
AVG HOUSEHOLD INCOME
34.3%
WAGE / INCOME GAP [ % ]
65.7¢/ $1
WAGE / INCOME GAP [ $ ]
$11,618
FAMILY INCOME DEFICIT
0.46
INEQUALITY / GINI INDEX
38,081
LABOR FORCE [ PEOPLE ]
61.5%
PERCENT IN LABOR FORCE
6.1%
UNEMPLOYMENT RATE
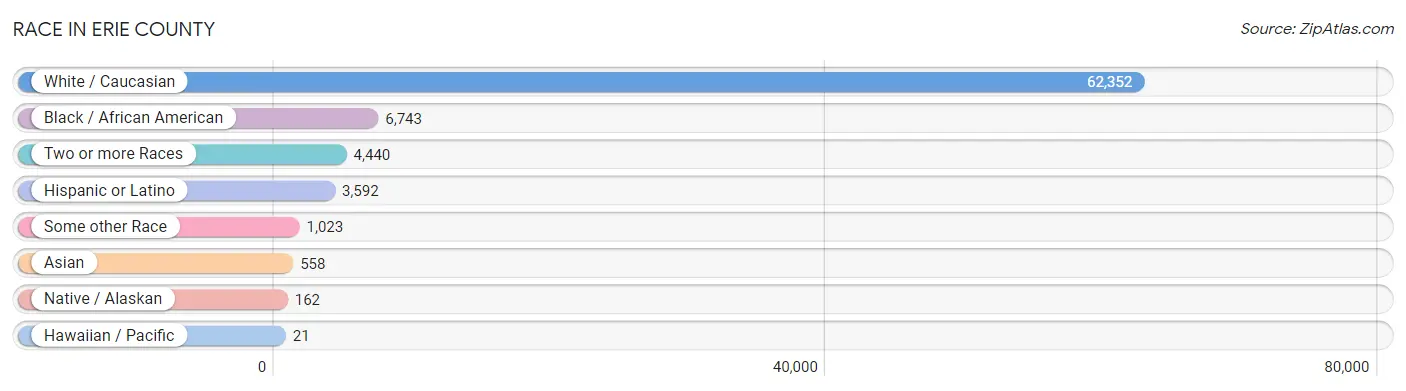
Race in Erie County
The most populous races in Erie County are White / Caucasian (62,352 | 82.8%), Black / African American (6,743 | 8.9%), and Two or more Races (4,440 | 5.9%).
| Race | # Population | % Population |
| Asian | 558 | 0.7% |
| Black / African American | 6,743 | 8.9% |
| Hawaiian / Pacific | 21 | 0.0% |
| Hispanic or Latino | 3,592 | 4.8% |
| Native / Alaskan | 162 | 0.2% |
| White / Caucasian | 62,352 | 82.8% |
| Two or more Races | 4,440 | 5.9% |
| Some other Race | 1,023 | 1.4% |
| Total | 75,299 | 100.0% |
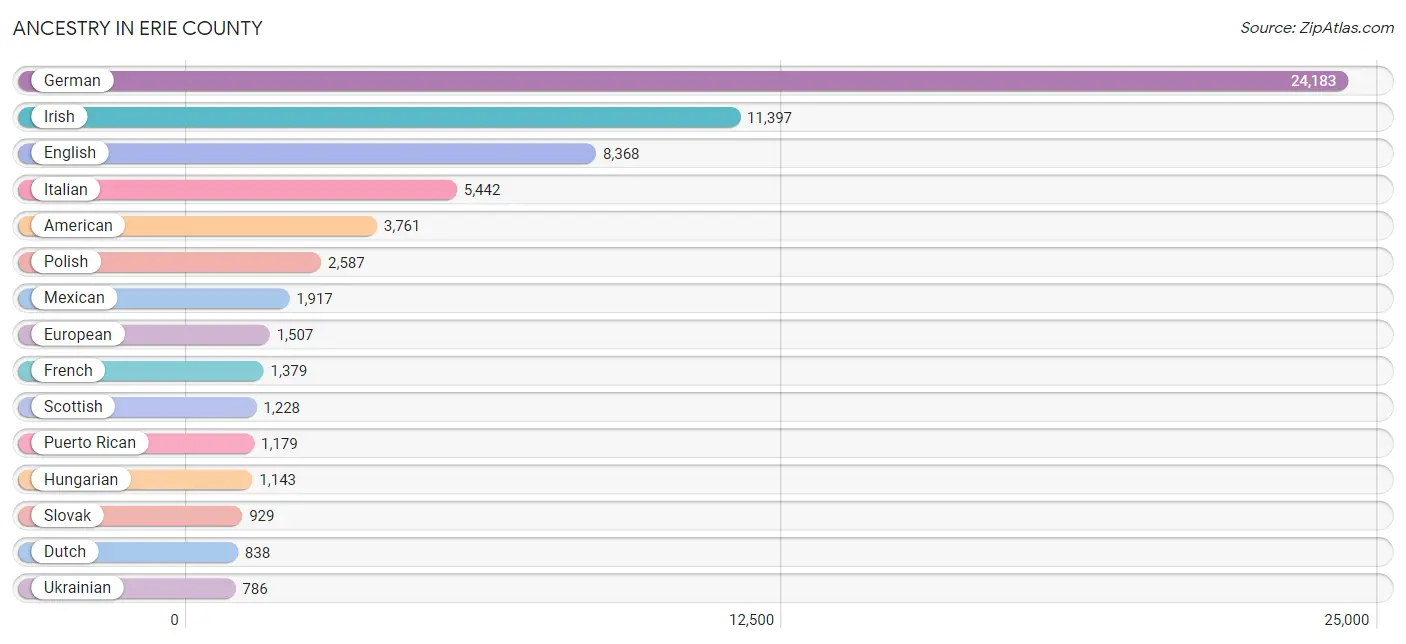
Ancestry in Erie County
The most populous ancestries reported in Erie County are German (24,183 | 32.1%), Irish (11,397 | 15.1%), English (8,368 | 11.1%), Italian (5,442 | 7.2%), and American (3,761 | 5.0%), together accounting for 70.6% of all Erie County residents.
| Ancestry | # Population | % Population |
| African | 49 | 0.1% |
| Alsatian | 20 | 0.0% |
| American | 3,761 | 5.0% |
| Arab | 172 | 0.2% |
| Austrian | 146 | 0.2% |
| Belgian | 77 | 0.1% |
| Bhutanese | 3 | 0.0% |
| Blackfeet | 143 | 0.2% |
| Brazilian | 14 | 0.0% |
| British | 368 | 0.5% |
| Bulgarian | 1 | 0.0% |
| Burmese | 344 | 0.5% |
| Canadian | 125 | 0.2% |
| Central American | 100 | 0.1% |
| Central American Indian | 26 | 0.0% |
| Cherokee | 338 | 0.4% |
| Chickasaw | 30 | 0.0% |
| Chippewa | 10 | 0.0% |
| Choctaw | 40 | 0.1% |
| Colombian | 72 | 0.1% |
| Costa Rican | 22 | 0.0% |
| Croatian | 175 | 0.2% |
| Cuban | 47 | 0.1% |
| Czech | 387 | 0.5% |
| Czechoslovakian | 136 | 0.2% |
| Danish | 223 | 0.3% |
| Dutch | 838 | 1.1% |
| Eastern European | 312 | 0.4% |
| English | 8,368 | 11.1% |
| Ethiopian | 5 | 0.0% |
| European | 1,507 | 2.0% |
| Finnish | 16 | 0.0% |
| French | 1,379 | 1.8% |
| French Canadian | 327 | 0.4% |
| German | 24,183 | 32.1% |
| Ghanaian | 10 | 0.0% |
| Greek | 406 | 0.5% |
| Guamanian / Chamorro | 10 | 0.0% |
| Honduran | 78 | 0.1% |
| Hungarian | 1,143 | 1.5% |
| Indian (Asian) | 152 | 0.2% |
| Irish | 11,397 | 15.1% |
| Iroquois | 13 | 0.0% |
| Italian | 5,442 | 7.2% |
| Korean | 70 | 0.1% |
| Latvian | 29 | 0.0% |
| Lebanese | 78 | 0.1% |
| Lithuanian | 57 | 0.1% |
| Luxembourger | 30 | 0.0% |
| Macedonian | 51 | 0.1% |
| Malaysian | 30 | 0.0% |
| Mexican | 1,917 | 2.5% |
| Mexican American Indian | 3 | 0.0% |
| Native Hawaiian | 25 | 0.0% |
| Nigerian | 52 | 0.1% |
| Northern European | 94 | 0.1% |
| Norwegian | 268 | 0.4% |
| Ottawa | 11 | 0.0% |
| Pakistani | 23 | 0.0% |
| Palestinian | 6 | 0.0% |
| Pennsylvania German | 50 | 0.1% |
| Peruvian | 15 | 0.0% |
| Polish | 2,587 | 3.4% |
| Portuguese | 42 | 0.1% |
| Puerto Rican | 1,179 | 1.6% |
| Romanian | 87 | 0.1% |
| Russian | 113 | 0.2% |
| Scandinavian | 152 | 0.2% |
| Scotch-Irish | 564 | 0.7% |
| Scottish | 1,228 | 1.6% |
| Serbian | 24 | 0.0% |
| Slavic | 34 | 0.1% |
| Slovak | 929 | 1.2% |
| Slovene | 183 | 0.2% |
| South African | 59 | 0.1% |
| South American | 179 | 0.2% |
| Spaniard | 28 | 0.0% |
| Spanish | 74 | 0.1% |
| Sri Lankan | 150 | 0.2% |
| Subsaharan African | 225 | 0.3% |
| Swedish | 256 | 0.3% |
| Swiss | 341 | 0.4% |
| Syrian | 66 | 0.1% |
| Thai | 80 | 0.1% |
| Ukrainian | 786 | 1.0% |
| Venezuelan | 92 | 0.1% |
| Welsh | 578 | 0.8% |
| West Indian | 25 | 0.0% |
| Yugoslavian | 83 | 0.1% | View All 89 Rows |
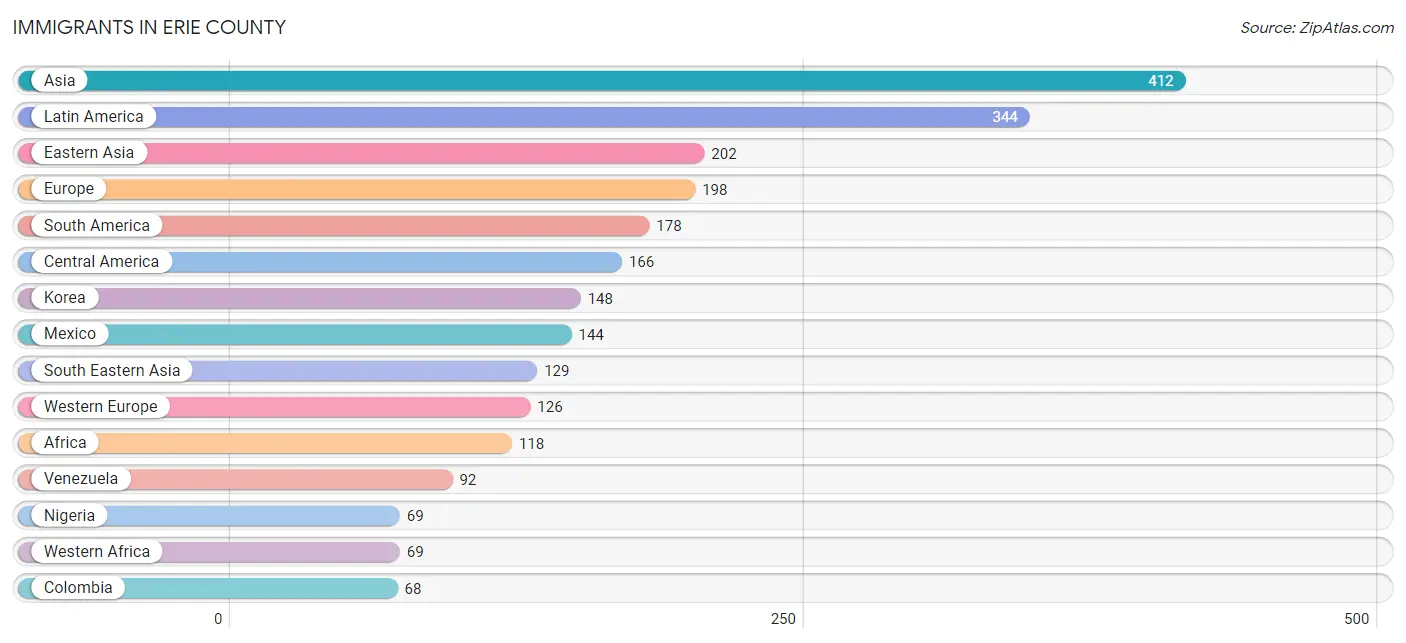
Immigrants in Erie County
The most numerous immigrant groups reported in Erie County came from Asia (412 | 0.5%), Latin America (344 | 0.5%), Eastern Asia (202 | 0.3%), Europe (198 | 0.3%), and South America (178 | 0.2%), together accounting for 1.8% of all Erie County residents.
| Immigration Origin | # Population | % Population |
| Africa | 118 | 0.2% |
| Asia | 412 | 0.5% |
| Austria | 5 | 0.0% |
| Brazil | 14 | 0.0% |
| Cambodia | 30 | 0.0% |
| Canada | 49 | 0.1% |
| Central America | 166 | 0.2% |
| China | 54 | 0.1% |
| Colombia | 68 | 0.1% |
| Costa Rica | 22 | 0.0% |
| Croatia | 11 | 0.0% |
| Czechoslovakia | 10 | 0.0% |
| Eastern Africa | 49 | 0.1% |
| Eastern Asia | 202 | 0.3% |
| Eastern Europe | 42 | 0.1% |
| England | 5 | 0.0% |
| Ethiopia | 5 | 0.0% |
| Europe | 198 | 0.3% |
| Germany | 58 | 0.1% |
| Hong Kong | 1 | 0.0% |
| India | 45 | 0.1% |
| Iraq | 6 | 0.0% |
| Israel | 7 | 0.0% |
| Italy | 11 | 0.0% |
| Kenya | 14 | 0.0% |
| Korea | 148 | 0.2% |
| Latin America | 344 | 0.5% |
| Malaysia | 19 | 0.0% |
| Mexico | 144 | 0.2% |
| Netherlands | 43 | 0.1% |
| Nigeria | 69 | 0.1% |
| Northern Europe | 5 | 0.0% |
| Pakistan | 23 | 0.0% |
| Peru | 4 | 0.0% |
| Russia | 21 | 0.0% |
| South America | 178 | 0.2% |
| South Central Asia | 68 | 0.1% |
| South Eastern Asia | 129 | 0.2% |
| Southern Europe | 25 | 0.0% |
| Switzerland | 20 | 0.0% |
| Thailand | 23 | 0.0% |
| Venezuela | 92 | 0.1% |
| Vietnam | 57 | 0.1% |
| Western Africa | 69 | 0.1% |
| Western Asia | 13 | 0.0% |
| Western Europe | 126 | 0.2% | View All 46 Rows |
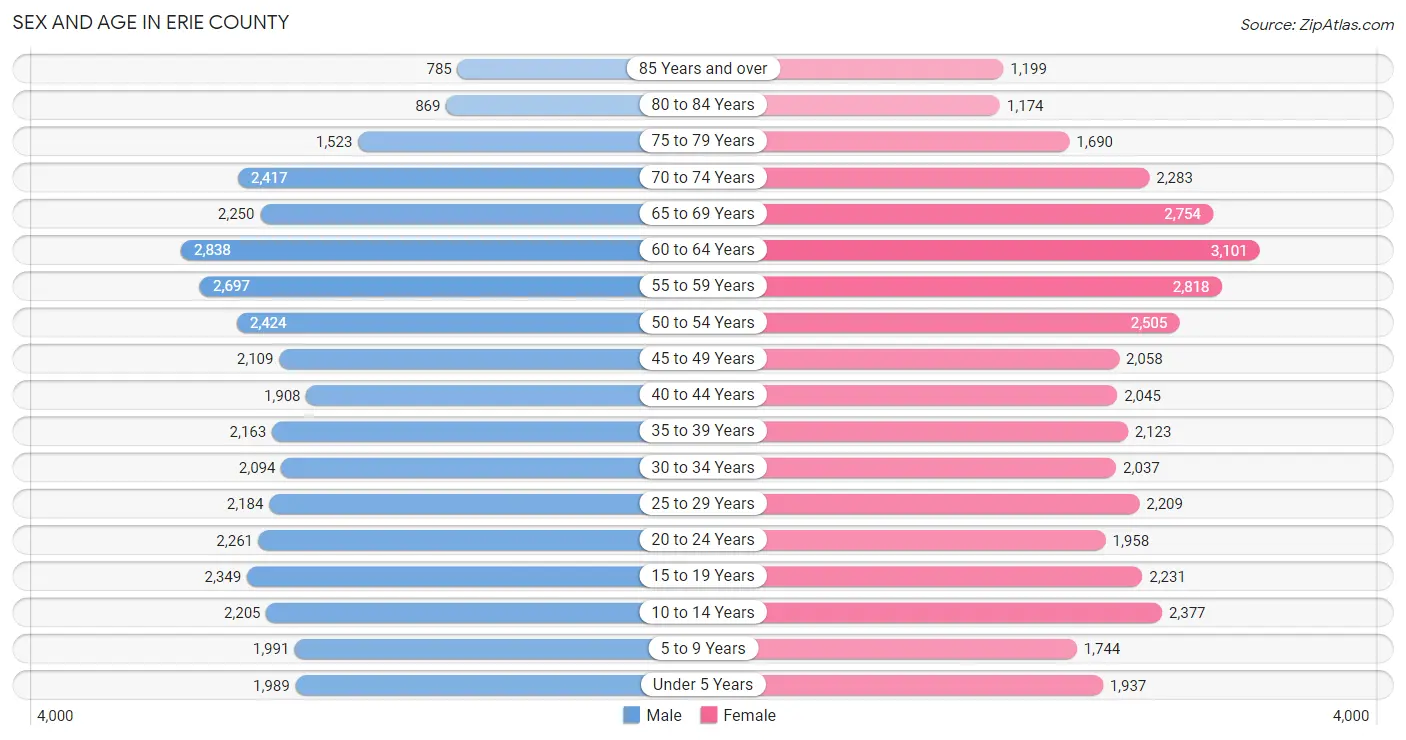
Sex and Age in Erie County
Sex and Age in Erie County
The most populous age groups in Erie County are 60 to 64 Years (2,838 | 7.7%) for men and 60 to 64 Years (3,101 | 8.1%) for women.
| Age Bracket | Male | Female |
| Under 5 Years | 1,989 (5.4%) | 1,937 (5.1%) |
| 5 to 9 Years | 1,991 (5.4%) | 1,744 (4.6%) |
| 10 to 14 Years | 2,205 (5.9%) | 2,377 (6.2%) |
| 15 to 19 Years | 2,349 (6.3%) | 2,231 (5.8%) |
| 20 to 24 Years | 2,261 (6.1%) | 1,958 (5.1%) |
| 25 to 29 Years | 2,184 (5.9%) | 2,209 (5.8%) |
| 30 to 34 Years | 2,094 (5.7%) | 2,037 (5.3%) |
| 35 to 39 Years | 2,163 (5.8%) | 2,123 (5.6%) |
| 40 to 44 Years | 1,908 (5.1%) | 2,045 (5.3%) |
| 45 to 49 Years | 2,109 (5.7%) | 2,058 (5.4%) |
| 50 to 54 Years | 2,424 (6.5%) | 2,505 (6.6%) |
| 55 to 59 Years | 2,697 (7.3%) | 2,818 (7.4%) |
| 60 to 64 Years | 2,838 (7.7%) | 3,101 (8.1%) |
| 65 to 69 Years | 2,250 (6.1%) | 2,754 (7.2%) |
| 70 to 74 Years | 2,417 (6.5%) | 2,283 (6.0%) |
| 75 to 79 Years | 1,523 (4.1%) | 1,690 (4.4%) |
| 80 to 84 Years | 869 (2.4%) | 1,174 (3.1%) |
| 85 Years and over | 785 (2.1%) | 1,199 (3.1%) |
| Total | 37,056 (100.0%) | 38,243 (100.0%) |
Families and Households in Erie County
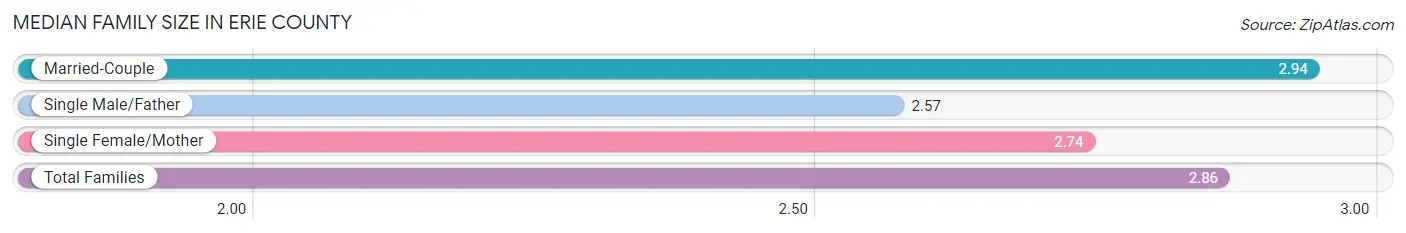
Median Family Size in Erie County
The median family size in Erie County is 2.86 persons per family, with married-couple families (14,342 | 70.2%) accounting for the largest median family size of 2.94 persons per family. On the other hand, single male/father families (1,678 | 8.2%) represent the smallest median family size with 2.57 persons per family.
| Family Type | # Families | Family Size |
| Married-Couple | 14,342 (70.2%) | 2.94 |
| Single Male/Father | 1,678 (8.2%) | 2.57 |
| Single Female/Mother | 4,416 (21.6%) | 2.74 |
| Total Families | 20,436 (100.0%) | 2.86 |
Median Household Size in Erie County
The median household size in Erie County is 2.29 persons per household, with single female/mother households (4,416 | 13.8%) accounting for the largest median household size of 2.96 persons per household. non-family households (11,667 | 36.3%) represent the smallest median household size with 1.15 persons per household.

| Household Type | # Households | Household Size |
| Married-Couple | 14,342 (44.7%) | 2.95 |
| Single Male/Father | 1,678 (5.2%) | 2.87 |
| Single Female/Mother | 4,416 (13.8%) | 2.96 |
| Non-family | 11,667 (36.3%) | 1.15 |
| Total Households | 32,103 (100.0%) | 2.29 |
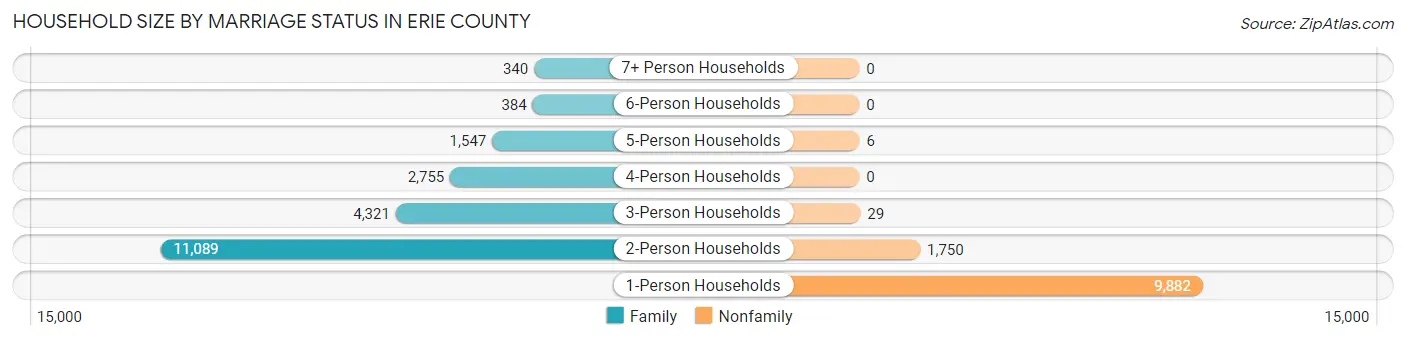
Household Size by Marriage Status in Erie County
Out of a total of 32,103 households in Erie County, 20,436 (63.7%) are family households, while 11,667 (36.3%) are nonfamily households. The most numerous type of family households are 2-person households, comprising 11,089, and the most common type of nonfamily households are 1-person households, comprising 9,882.
| Household Size | Family Households | Nonfamily Households |
| 1-Person Households | - | 9,882 (30.8%) |
| 2-Person Households | 11,089 (34.5%) | 1,750 (5.4%) |
| 3-Person Households | 4,321 (13.5%) | 29 (0.1%) |
| 4-Person Households | 2,755 (8.6%) | 0 (0.0%) |
| 5-Person Households | 1,547 (4.8%) | 6 (0.0%) |
| 6-Person Households | 384 (1.2%) | 0 (0.0%) |
| 7+ Person Households | 340 (1.1%) | 0 (0.0%) |
| Total | 20,436 (63.7%) | 11,667 (36.3%) |
Female Fertility in Erie County
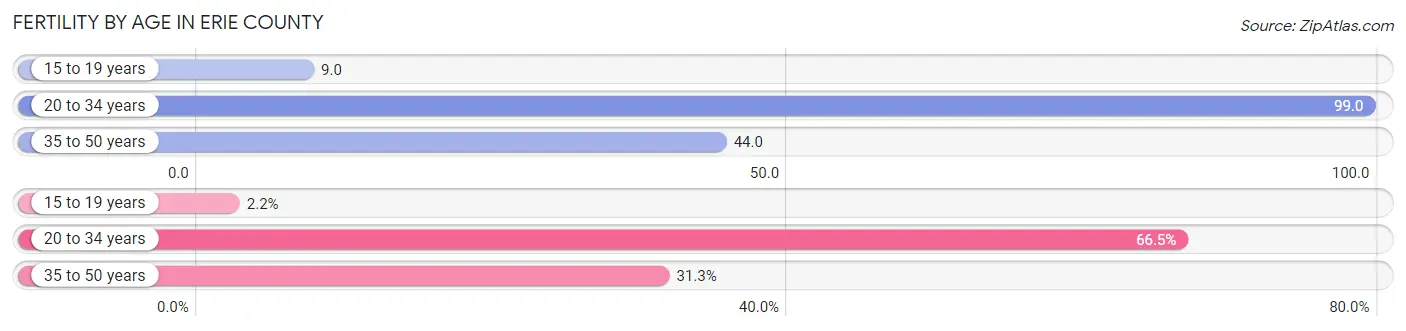
Fertility by Age in Erie County
Average fertility rate in Erie County is 61.0 births per 1,000 women. Women in the age bracket of 20 to 34 years have the highest fertility rate with 99.0 births per 1,000 women. Women in the age bracket of 20 to 34 years acount for 66.5% of all women with births.
| Age Bracket | Women with Births | Births / 1,000 Women |
| 15 to 19 years | 20 (2.2%) | 9.0 |
| 20 to 34 years | 616 (66.5%) | 99.0 |
| 35 to 50 years | 290 (31.3%) | 44.0 |
| Total | 926 (100.0%) | 61.0 |
Fertility by Age by Marriage Status in Erie County
55.1% of women with births (926) in Erie County are married. The highest percentage of unmarried women with births falls into 15 to 19 years age bracket with 100.0% of them unmarried at the time of birth, while the lowest percentage of unmarried women with births belong to 35 to 50 years age bracket with 22.1% of them unmarried.
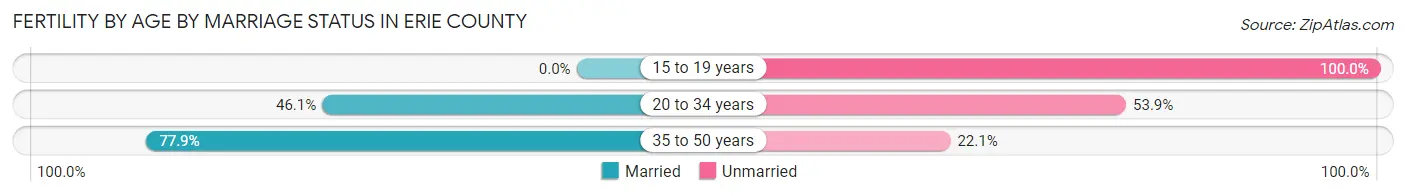
| Age Bracket | Married | Unmarried |
| 15 to 19 years | 0 (0.0%) | 20 (100.0%) |
| 20 to 34 years | 284 (46.1%) | 332 (53.9%) |
| 35 to 50 years | 226 (77.9%) | 64 (22.1%) |
| Total | 510 (55.1%) | 416 (44.9%) |
Fertility by Education in Erie County
Average fertility rate in Erie County is 61.0 births per 1,000 women. Women with the education attainment of graduate degree have the highest fertility rate of 91.0 births per 1,000 women, while women with the education attainment of college or associate's degree have the lowest fertility at 55.0 births per 1,000 women. Women with the education attainment of college or associate's degree represent 28.1% of all women with births.
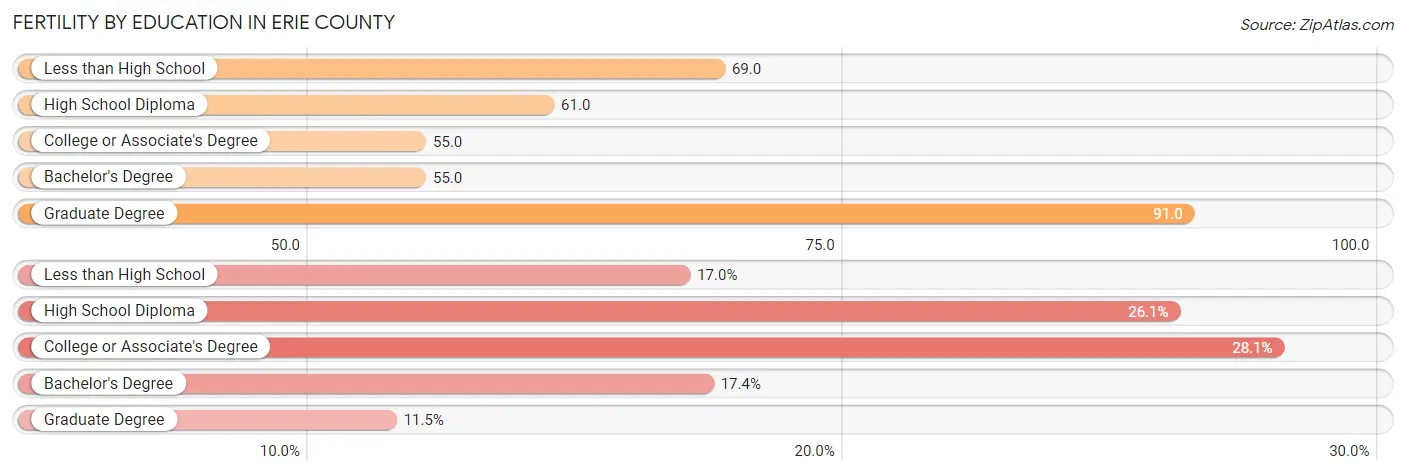
| Educational Attainment | Women with Births | Births / 1,000 Women |
| Less than High School | 157 (17.0%) | 69.0 |
| High School Diploma | 242 (26.1%) | 61.0 |
| College or Associate's Degree | 260 (28.1%) | 55.0 |
| Bachelor's Degree | 161 (17.4%) | 55.0 |
| Graduate Degree | 106 (11.5%) | 91.0 |
| Total | 926 (100.0%) | 61.0 |
Fertility by Education by Marriage Status in Erie County
44.9% of women with births in Erie County are unmarried. Women with the educational attainment of bachelor's degree are most likely to be married with 100.0% of them married at childbirth, while women with the educational attainment of less than high school are least likely to be married with 100.0% of them unmarried at childbirth.
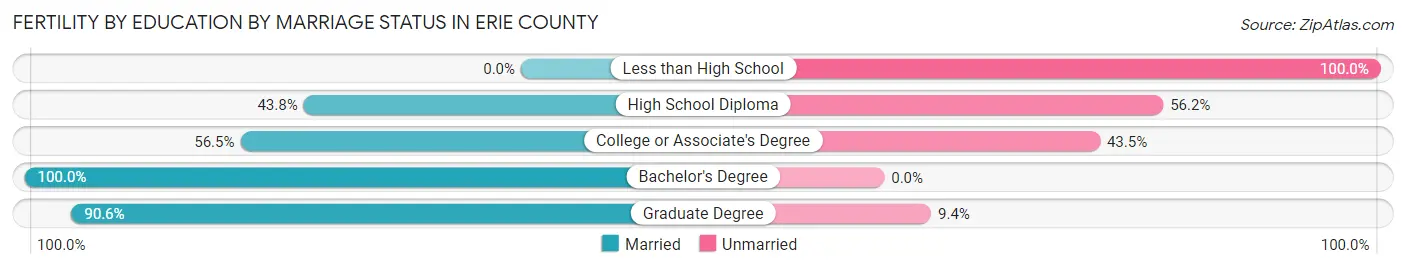
| Educational Attainment | Married | Unmarried |
| Less than High School | 0 (0.0%) | 157 (100.0%) |
| High School Diploma | 106 (43.8%) | 136 (56.2%) |
| College or Associate's Degree | 147 (56.5%) | 113 (43.5%) |
| Bachelor's Degree | 161 (100.0%) | 0 (0.0%) |
| Graduate Degree | 96 (90.6%) | 10 (9.4%) |
| Total | 510 (55.1%) | 416 (44.9%) |
Income in Erie County
Income Overview in Erie County
Per Capita Income in Erie County is $38,158, while median incomes of families and households are $82,540 and $65,171 respectively.
| Characteristic | Number | Measure |
| Per Capita Income | 75,299 | $38,158 |
| Median Family Income | 20,436 | $82,540 |
| Mean Family Income | 20,436 | $104,626 |
| Median Household Income | 32,103 | $65,171 |
| Mean Household Income | 32,103 | $87,691 |
| Income Deficit | 20,436 | $11,618 |
| Wage / Income Gap (%) | 75,299 | 34.25% |
| Wage / Income Gap ($) | 75,299 | 65.75¢ per $1 |
| Gini / Inequality Index | 75,299 | 0.46 |
Earnings by Sex in Erie County
Average Earnings in Erie County are $38,693, $47,500 for men and $31,231 for women, a difference of 34.3%.
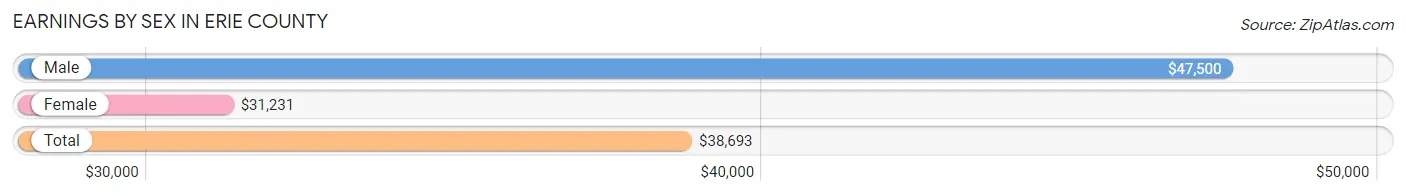
| Sex | Number | Average Earnings |
| Male | 20,672 (51.1%) | $47,500 |
| Female | 19,767 (48.9%) | $31,231 |
| Total | 40,439 (100.0%) | $38,693 |
Earnings by Sex by Income Bracket in Erie County
The most common earnings brackets in Erie County are $100,000+ for men (2,948 | 14.3%) and $2,499 or less for women (1,687 | 8.5%).
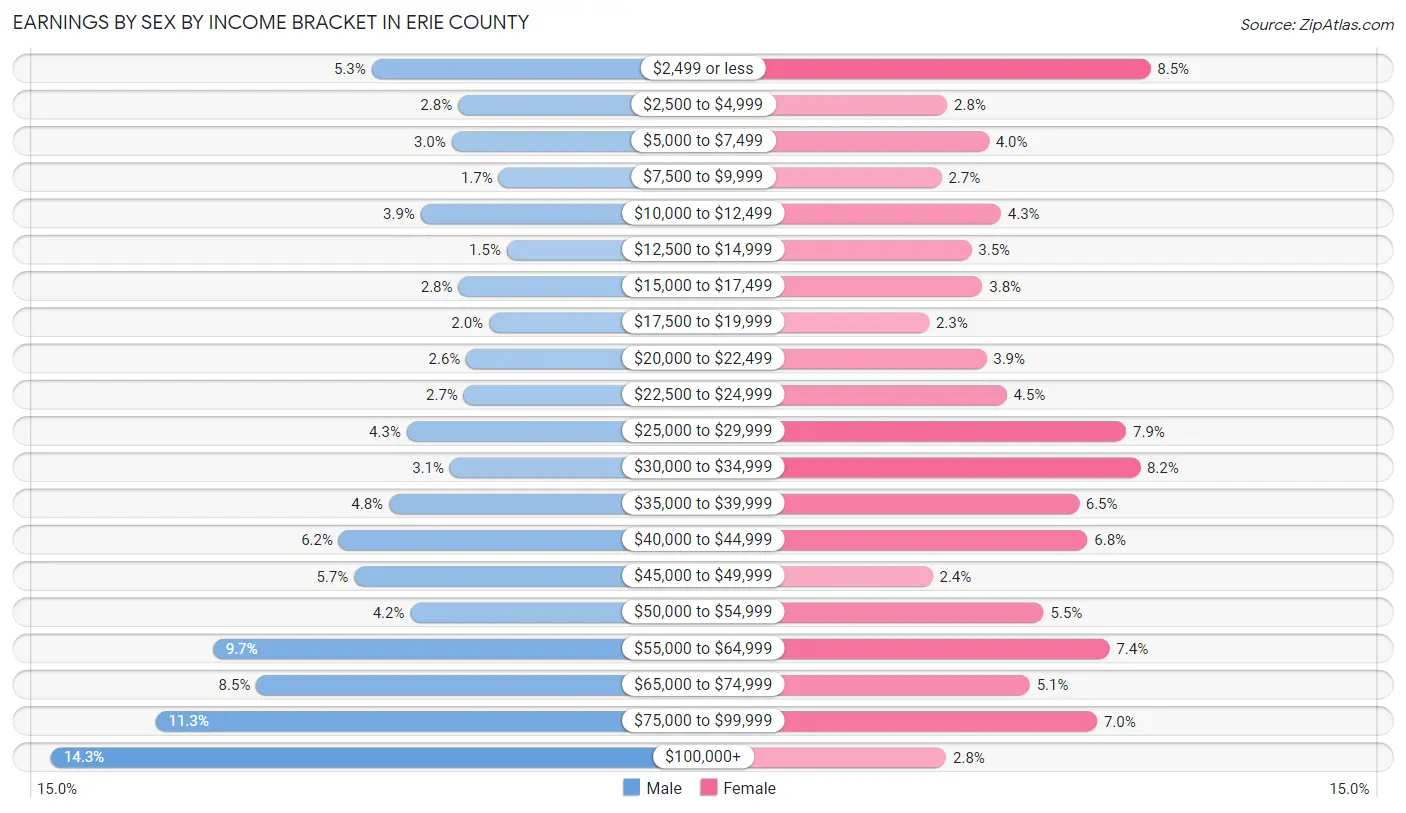
| Income | Male | Female |
| $2,499 or less | 1,086 (5.2%) | 1,687 (8.5%) |
| $2,500 to $4,999 | 583 (2.8%) | 557 (2.8%) |
| $5,000 to $7,499 | 620 (3.0%) | 788 (4.0%) |
| $7,500 to $9,999 | 347 (1.7%) | 526 (2.7%) |
| $10,000 to $12,499 | 800 (3.9%) | 856 (4.3%) |
| $12,500 to $14,999 | 299 (1.5%) | 691 (3.5%) |
| $15,000 to $17,499 | 581 (2.8%) | 754 (3.8%) |
| $17,500 to $19,999 | 404 (1.9%) | 456 (2.3%) |
| $20,000 to $22,499 | 535 (2.6%) | 775 (3.9%) |
| $22,500 to $24,999 | 550 (2.7%) | 887 (4.5%) |
| $25,000 to $29,999 | 880 (4.3%) | 1,551 (7.9%) |
| $30,000 to $34,999 | 630 (3.0%) | 1,628 (8.2%) |
| $35,000 to $39,999 | 984 (4.8%) | 1,289 (6.5%) |
| $40,000 to $44,999 | 1,276 (6.2%) | 1,337 (6.8%) |
| $45,000 to $49,999 | 1,186 (5.7%) | 477 (2.4%) |
| $50,000 to $54,999 | 859 (4.2%) | 1,093 (5.5%) |
| $55,000 to $64,999 | 2,008 (9.7%) | 1,459 (7.4%) |
| $65,000 to $74,999 | 1,755 (8.5%) | 1,016 (5.1%) |
| $75,000 to $99,999 | 2,341 (11.3%) | 1,389 (7.0%) |
| $100,000+ | 2,948 (14.3%) | 551 (2.8%) |
| Total | 20,672 (100.0%) | 19,767 (100.0%) |
Earnings by Sex by Educational Attainment in Erie County
Average earnings in Erie County are $54,828 for men and $35,055 for women, a difference of 36.1%. Men with an educational attainment of graduate degree enjoy the highest average annual earnings of $79,357, while those with less than high school education earn the least with $41,121. Women with an educational attainment of graduate degree earn the most with the average annual earnings of $59,500, while those with less than high school education have the smallest earnings of $22,477.
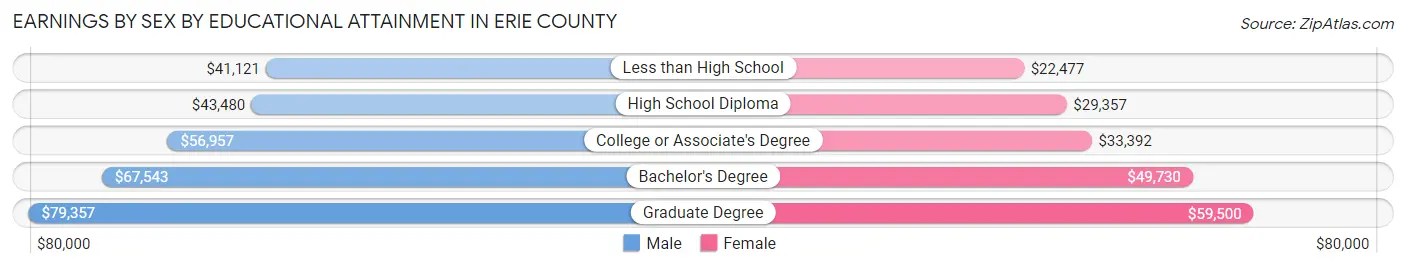
| Educational Attainment | Male Income | Female Income |
| Less than High School | $41,121 | $22,477 |
| High School Diploma | $43,480 | $29,357 |
| College or Associate's Degree | $56,957 | $33,392 |
| Bachelor's Degree | $67,543 | $49,730 |
| Graduate Degree | $79,357 | $59,500 |
| Total | $54,828 | $35,055 |
Family Income in Erie County
Family Income Brackets in Erie County
According to the Erie County family income data, there are 4,312 families falling into the $100,000 to $149,999 income range, which is the most common income bracket and makes up 21.1% of all families. Conversely, the $10,000 to $14,999 income bracket is the least frequent group with only 368 families (1.8%) belonging to this category.
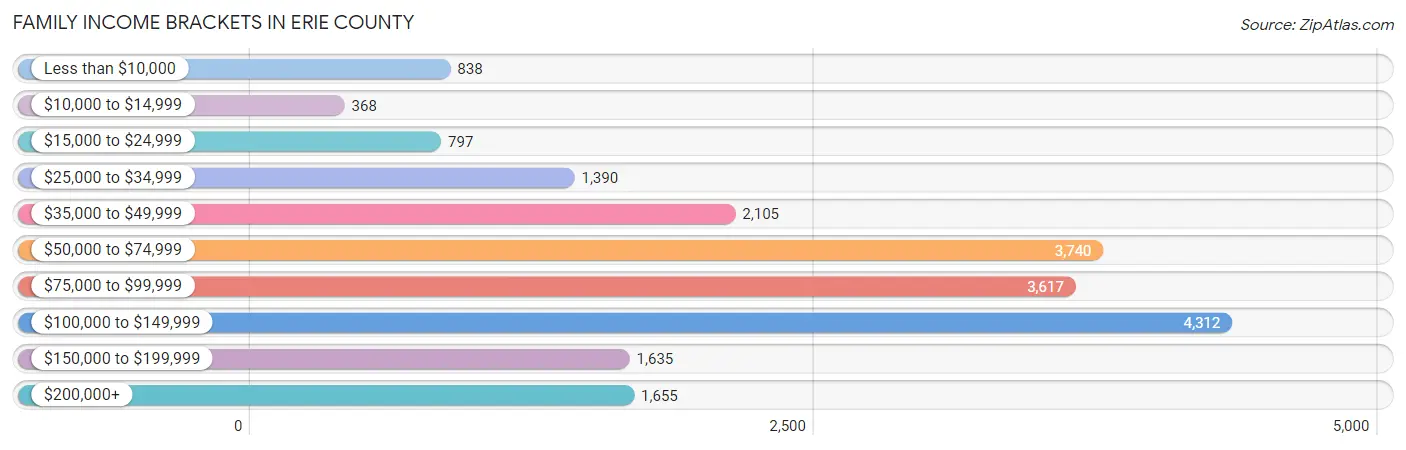
| Income Bracket | # Families | % Families |
| Less than $10,000 | 838 | 4.1% |
| $10,000 to $14,999 | 368 | 1.8% |
| $15,000 to $24,999 | 797 | 3.9% |
| $25,000 to $34,999 | 1,390 | 6.8% |
| $35,000 to $49,999 | 2,105 | 10.3% |
| $50,000 to $74,999 | 3,740 | 18.3% |
| $75,000 to $99,999 | 3,617 | 17.7% |
| $100,000 to $149,999 | 4,312 | 21.1% |
| $150,000 to $199,999 | 1,635 | 8.0% |
| $200,000+ | 1,655 | 8.1% |
Family Income by Famaliy Size in Erie County
5-person families (1,290 | 6.3%) account for the highest median family income in Erie County with $123,084 per family, while 2-person families (11,932 | 58.4%) have the highest median income of $36,840 per family member.

| Income Bracket | # Families | Median Income |
| 2-Person Families | 11,932 (58.4%) | $73,680 |
| 3-Person Families | 3,981 (19.5%) | $87,726 |
| 4-Person Families | 2,523 (12.3%) | $104,448 |
| 5-Person Families | 1,290 (6.3%) | $123,084 |
| 6-Person Families | 374 (1.8%) | $76,324 |
| 7+ Person Families | 336 (1.6%) | $92,201 |
| Total | 20,436 (100.0%) | $82,540 |
Family Income by Number of Earners in Erie County
The median family income in Erie County is $82,540, with families comprising 3+ earners (1,978) having the highest median family income of $140,530, while families with no earners (3,327) have the lowest median family income of $49,538, accounting for 9.7% and 16.3% of families, respectively.
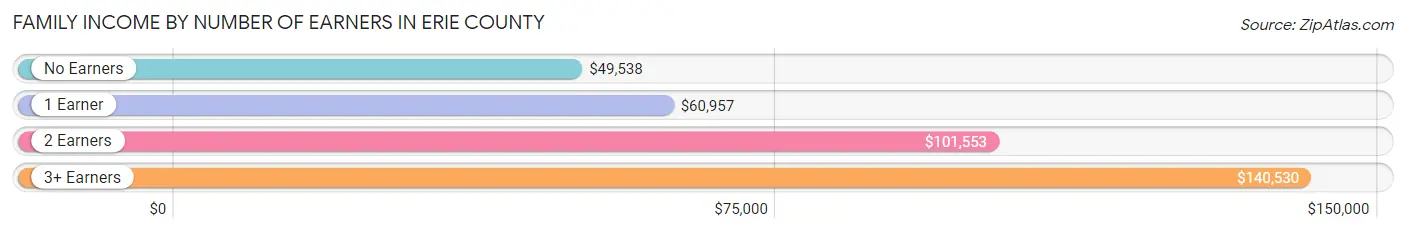
| Number of Earners | # Families | Median Income |
| No Earners | 3,327 (16.3%) | $49,538 |
| 1 Earner | 7,189 (35.2%) | $60,957 |
| 2 Earners | 7,942 (38.9%) | $101,553 |
| 3+ Earners | 1,978 (9.7%) | $140,530 |
| Total | 20,436 (100.0%) | $82,540 |
Household Income in Erie County
Household Income Brackets in Erie County
With 5,875 households falling in the category, the $50,000 to $74,999 income range is the most frequent in Erie County, accounting for 18.3% of all households. In contrast, only 1,092 households (3.4%) fall into the $10,000 to $14,999 income bracket, making it the least populous group.
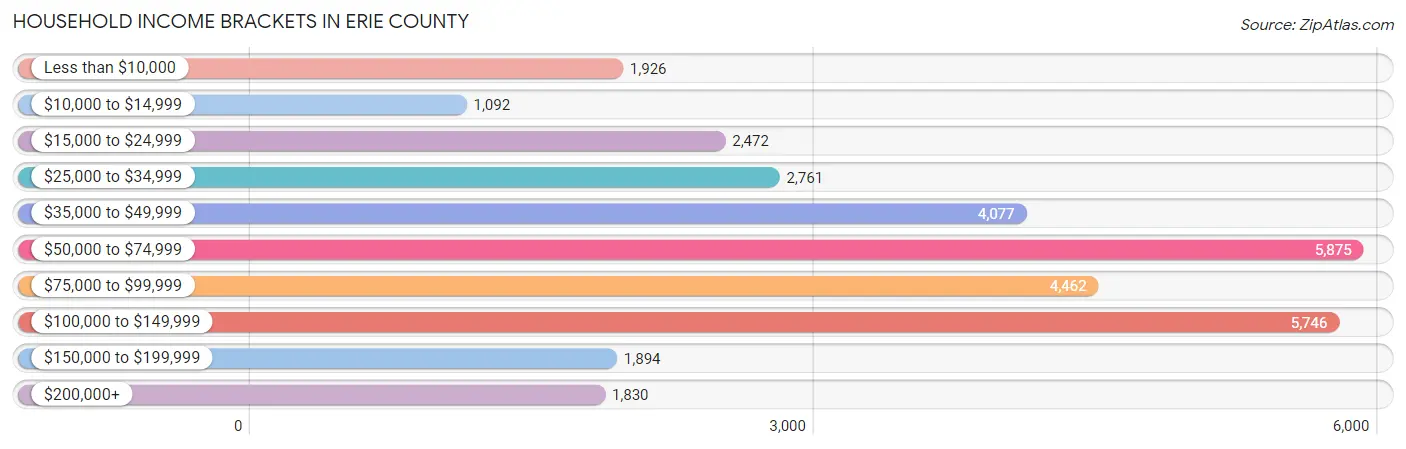
| Income Bracket | # Households | % Households |
| Less than $10,000 | 1,926 | 6.0% |
| $10,000 to $14,999 | 1,092 | 3.4% |
| $15,000 to $24,999 | 2,472 | 7.7% |
| $25,000 to $34,999 | 2,761 | 8.6% |
| $35,000 to $49,999 | 4,077 | 12.7% |
| $50,000 to $74,999 | 5,875 | 18.3% |
| $75,000 to $99,999 | 4,462 | 13.9% |
| $100,000 to $149,999 | 5,746 | 17.9% |
| $150,000 to $199,999 | 1,894 | 5.9% |
| $200,000+ | 1,830 | 5.7% |
Household Income by Householder Age in Erie County
The median household income in Erie County is $65,171, with the highest median household income of $83,840 found in the 45 to 64 years age bracket for the primary householder. A total of 12,385 households (38.6%) fall into this category. Meanwhile, the 15 to 24 years age bracket for the primary householder has the lowest median household income of $36,172, with 1,178 households (3.7%) in this group.
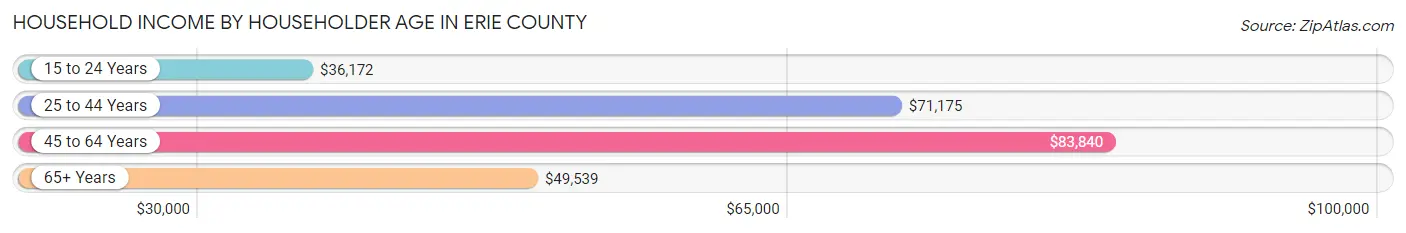
| Income Bracket | # Households | Median Income |
| 15 to 24 Years | 1,178 (3.7%) | $36,172 |
| 25 to 44 Years | 8,331 (26.0%) | $71,175 |
| 45 to 64 Years | 12,385 (38.6%) | $83,840 |
| 65+ Years | 10,209 (31.8%) | $49,539 |
| Total | 32,103 (100.0%) | $65,171 |
Poverty in Erie County
Income Below Poverty by Sex and Age in Erie County
With 10.3% poverty level for males and 12.6% for females among the residents of Erie County, 5 year old males and 15 year old females are the most vulnerable to poverty, with 263 males (56.4%) and 163 females (29.4%) in their respective age groups living below the poverty level.
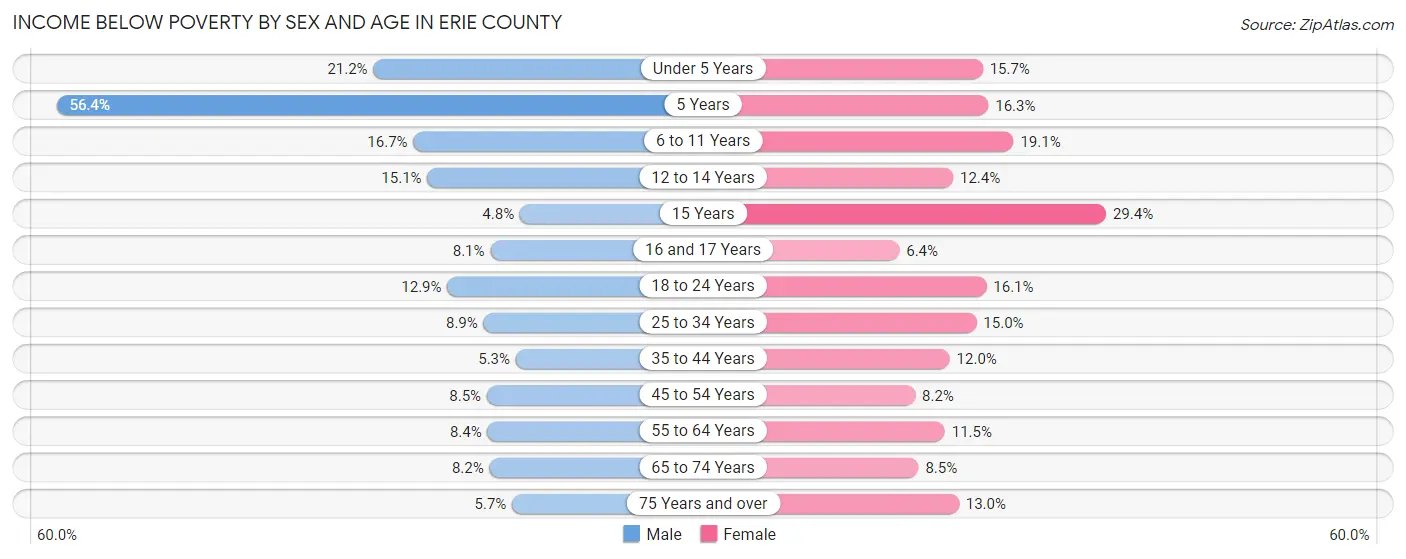
| Age Bracket | Male | Female |
| Under 5 Years | 417 (21.1%) | 304 (15.7%) |
| 5 Years | 263 (56.4%) | 47 (16.3%) |
| 6 to 11 Years | 382 (16.7%) | 488 (19.1%) |
| 12 to 14 Years | 210 (15.1%) | 154 (12.4%) |
| 15 Years | 28 (4.8%) | 163 (29.4%) |
| 16 and 17 Years | 71 (8.1%) | 52 (6.4%) |
| 18 to 24 Years | 404 (12.9%) | 453 (16.1%) |
| 25 to 34 Years | 376 (8.9%) | 636 (15.0%) |
| 35 to 44 Years | 214 (5.3%) | 500 (12.0%) |
| 45 to 54 Years | 382 (8.5%) | 370 (8.2%) |
| 55 to 64 Years | 462 (8.4%) | 674 (11.5%) |
| 65 to 74 Years | 368 (8.2%) | 419 (8.5%) |
| 75 Years and over | 170 (5.7%) | 494 (13.0%) |
| Total | 3,747 (10.3%) | 4,754 (12.6%) |
Income Above Poverty by Sex and Age in Erie County
According to the poverty statistics in Erie County, males aged 15 years and females aged 16 and 17 years are the age groups that are most secure financially, with 95.2% of males and 93.6% of females in these age groups living above the poverty line.

| Age Bracket | Male | Female |
| Under 5 Years | 1,555 (78.8%) | 1,633 (84.3%) |
| 5 Years | 203 (43.6%) | 241 (83.7%) |
| 6 to 11 Years | 1,906 (83.3%) | 2,064 (80.9%) |
| 12 to 14 Years | 1,177 (84.9%) | 1,089 (87.6%) |
| 15 Years | 552 (95.2%) | 391 (70.6%) |
| 16 and 17 Years | 802 (91.9%) | 761 (93.6%) |
| 18 to 24 Years | 2,723 (87.1%) | 2,360 (83.9%) |
| 25 to 34 Years | 3,857 (91.1%) | 3,607 (85.0%) |
| 35 to 44 Years | 3,830 (94.7%) | 3,663 (88.0%) |
| 45 to 54 Years | 4,105 (91.5%) | 4,165 (91.8%) |
| 55 to 64 Years | 5,010 (91.6%) | 5,200 (88.5%) |
| 65 to 74 Years | 4,110 (91.8%) | 4,488 (91.5%) |
| 75 Years and over | 2,810 (94.3%) | 3,297 (87.0%) |
| Total | 32,640 (89.7%) | 32,959 (87.4%) |
Income Below Poverty Among Married-Couple Families in Erie County
The poverty statistics for married-couple families in Erie County show that 2.7% or 389 of the total 14,342 families live below the poverty line. Families with 3 or 4 children have the highest poverty rate of 6.0%, comprising of 65 families. On the other hand, families with 5 or more children have the lowest poverty rate of 0.0%, which includes 0 families.

| Children | Above Poverty | Below Poverty |
| No Children | 9,857 (97.6%) | 243 (2.4%) |
| 1 or 2 Children | 2,931 (97.3%) | 81 (2.7%) |
| 3 or 4 Children | 1,021 (94.0%) | 65 (6.0%) |
| 5 or more Children | 144 (100.0%) | 0 (0.0%) |
| Total | 13,953 (97.3%) | 389 (2.7%) |
Income Below Poverty Among Single-Parent Households in Erie County
According to the poverty data in Erie County, 8.9% or 149 single-father households and 26.9% or 1,186 single-mother households are living below the poverty line. Among single-father households, those with 3 or 4 children have the highest poverty rate, with 26 households (33.3%) experiencing poverty. Likewise, among single-mother households, those with 5 or more children have the highest poverty rate, with 90 households (100.0%) falling below the poverty line.

| Children | Single Father | Single Mother |
| No Children | 65 (8.5%) | 109 (6.9%) |
| 1 or 2 Children | 58 (7.0%) | 837 (34.7%) |
| 3 or 4 Children | 26 (33.3%) | 150 (45.3%) |
| 5 or more Children | 0 (0.0%) | 90 (100.0%) |
| Total | 149 (8.9%) | 1,186 (26.9%) |
Income Below Poverty Among Married-Couple vs Single-Parent Households in Erie County
The poverty data for Erie County shows that 389 of the married-couple family households (2.7%) and 1,335 of the single-parent households (21.9%) are living below the poverty level. Within the married-couple family households, those with 3 or 4 children have the highest poverty rate, with 65 households (6.0%) falling below the poverty line. Among the single-parent households, those with 5 or more children have the highest poverty rate, with 90 household (90.0%) living below poverty.
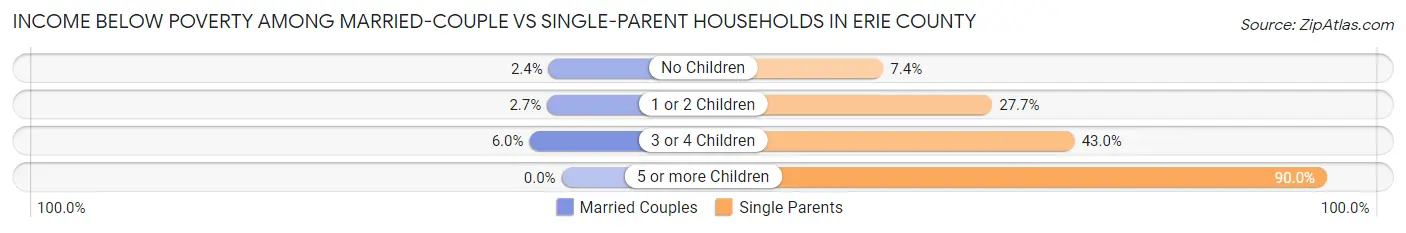
| Children | Married-Couple Families | Single-Parent Households |
| No Children | 243 (2.4%) | 174 (7.4%) |
| 1 or 2 Children | 81 (2.7%) | 895 (27.7%) |
| 3 or 4 Children | 65 (6.0%) | 176 (43.0%) |
| 5 or more Children | 0 (0.0%) | 90 (90.0%) |
| Total | 389 (2.7%) | 1,335 (21.9%) |
Employment Characteristics in Erie County
Employment by Class of Employer in Erie County
Among the 35,164 employed individuals in Erie County, private company employees (24,358 | 69.3%), local government employees (3,353 | 9.5%), and not-for-profit organizations (2,845 | 8.1%) make up the most common classes of employment.
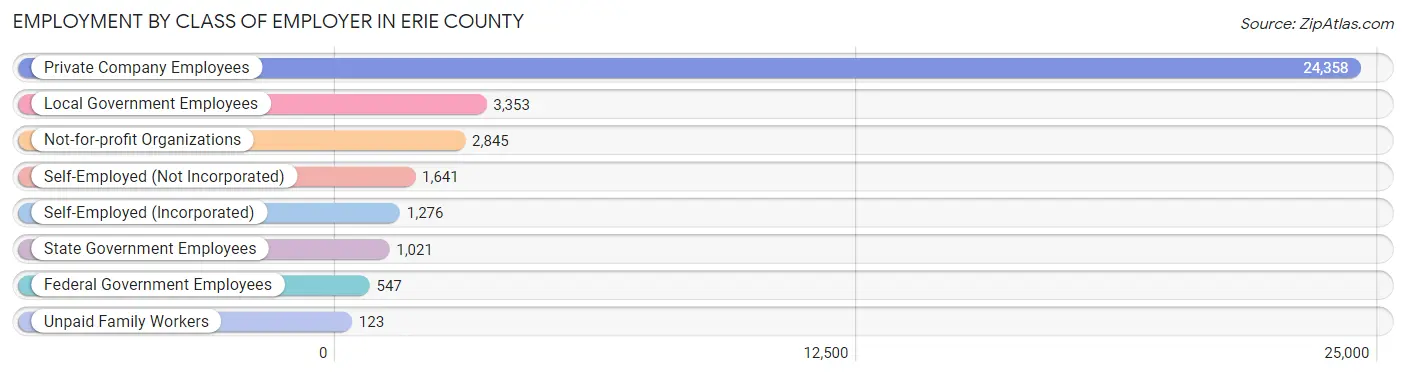
| Employer Class | # Employees | % Employees |
| Private Company Employees | 24,358 | 69.3% |
| Self-Employed (Incorporated) | 1,276 | 3.6% |
| Self-Employed (Not Incorporated) | 1,641 | 4.7% |
| Not-for-profit Organizations | 2,845 | 8.1% |
| Local Government Employees | 3,353 | 9.5% |
| State Government Employees | 1,021 | 2.9% |
| Federal Government Employees | 547 | 1.6% |
| Unpaid Family Workers | 123 | 0.4% |
| Total | 35,164 | 100.0% |
Employment Status by Age in Erie County
According to the labor force statistics for Erie County, out of the total population over 16 years of age (61,921), 61.5% or 38,081 individuals are in the labor force, with 6.1% or 2,323 of them unemployed. The age group with the highest labor force participation rate is 30 to 34 years, with 91.0% or 3,759 individuals in the labor force. Within the labor force, the 20 to 24 years age range has the highest percentage of unemployed individuals, with 18.4% or 620 of them being unemployed.

| Age Bracket | In Labor Force | Unemployed |
| 16 to 19 Years | 1,736 (50.4%) | 222 (12.8%) |
| 20 to 24 Years | 3,371 (79.9%) | 620 (18.4%) |
| 25 to 29 Years | 3,782 (86.1%) | 246 (6.5%) |
| 30 to 34 Years | 3,759 (91.0%) | 180 (4.8%) |
| 35 to 44 Years | 6,805 (82.6%) | 163 (2.4%) |
| 45 to 54 Years | 7,759 (85.3%) | 411 (5.3%) |
| 55 to 59 Years | 3,976 (72.1%) | 119 (3.0%) |
| 60 to 64 Years | 3,587 (60.4%) | 122 (3.4%) |
| 65 to 74 Years | 2,581 (26.6%) | 191 (7.4%) |
| 75 Years and over | 731 (10.1%) | 36 (4.9%) |
| Total | 38,081 (61.5%) | 2,323 (6.1%) |
Employment Status by Educational Attainment in Erie County
According to labor force statistics for Erie County, 79.5% of individuals (29,664) out of the total population between 25 and 64 years of age (37,313) are in the labor force, with 4.2% or 1,246 of them being unemployed. The group with the highest labor force participation rate are those with the educational attainment of bachelor's degree or higher, with 87.3% or 8,921 individuals in the labor force. Within the labor force, individuals with less than high school education have the highest percentage of unemployment, with 6.5% or 113 of them being unemployed.
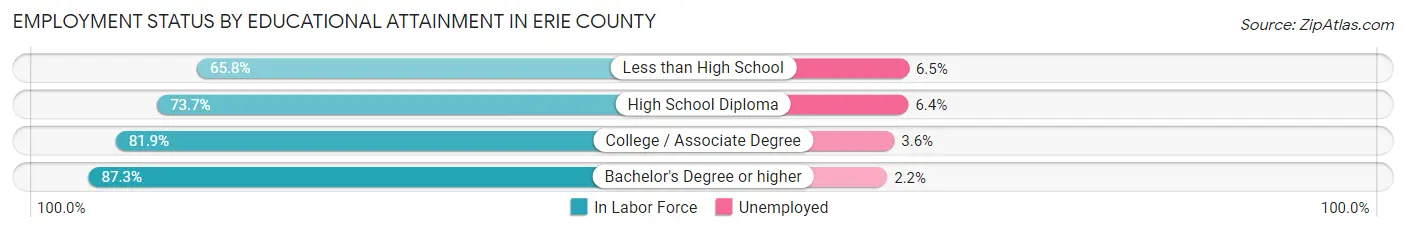
| Educational Attainment | In Labor Force | Unemployed |
| Less than High School | 1,742 (65.8%) | 172 (6.5%) |
| High School Diploma | 9,098 (73.7%) | 790 (6.4%) |
| College / Associate Degree | 9,912 (81.9%) | 436 (3.6%) |
| Bachelor's Degree or higher | 8,921 (87.3%) | 225 (2.2%) |
| Total | 29,664 (79.5%) | 1,567 (4.2%) |
Employment Occupations by Sex in Erie County
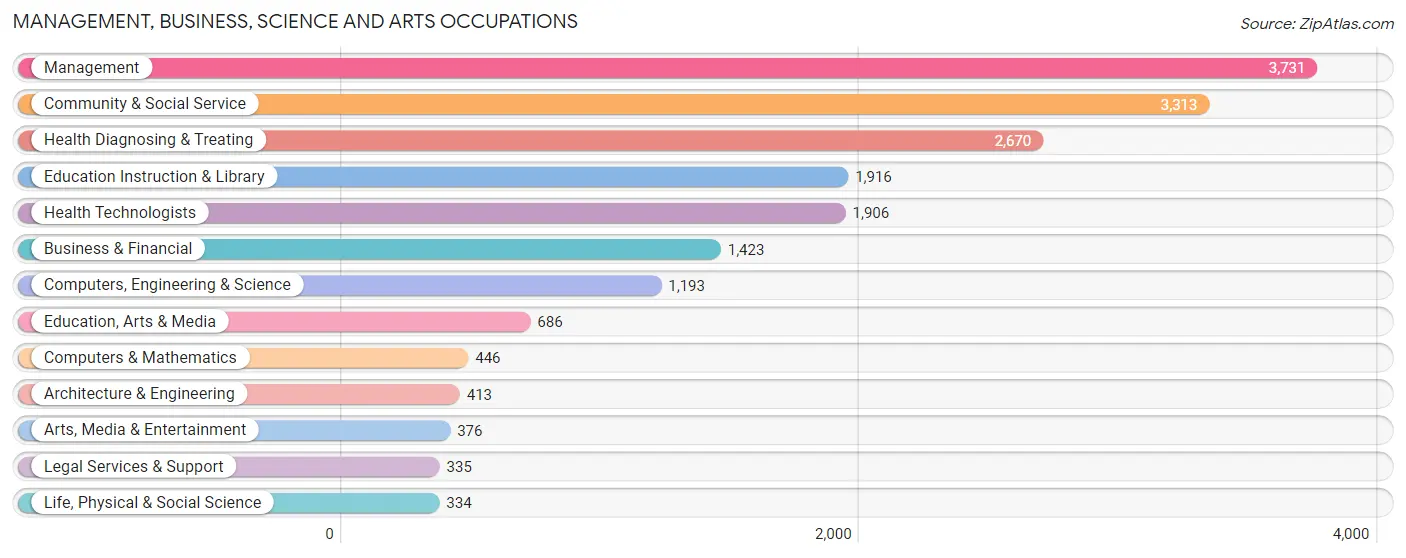
Management, Business, Science and Arts Occupations
The most common Management, Business, Science and Arts occupations in Erie County are Management (3,731 | 10.4%), Community & Social Service (3,313 | 9.3%), Health Diagnosing & Treating (2,670 | 7.5%), Education Instruction & Library (1,916 | 5.4%), and Health Technologists (1,906 | 5.3%).
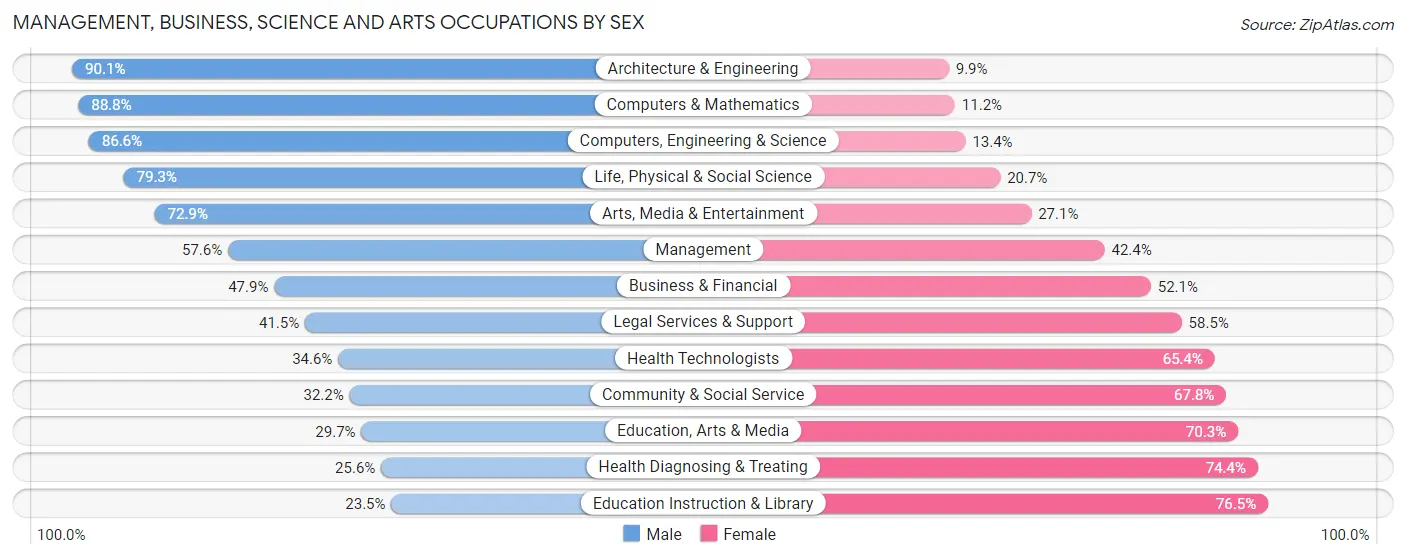
Management, Business, Science and Arts Occupations by Sex
Within the Management, Business, Science and Arts occupations in Erie County, the most male-oriented occupations are Architecture & Engineering (90.1%), Computers & Mathematics (88.8%), and Computers, Engineering & Science (86.6%), while the most female-oriented occupations are Education Instruction & Library (76.5%), Health Diagnosing & Treating (74.4%), and Education, Arts & Media (70.3%).
| Occupation | Male | Female |
| Management | 2,148 (57.6%) | 1,583 (42.4%) |
| Business & Financial | 682 (47.9%) | 741 (52.1%) |
| Computers, Engineering & Science | 1,033 (86.6%) | 160 (13.4%) |
| Computers & Mathematics | 396 (88.8%) | 50 (11.2%) |
| Architecture & Engineering | 372 (90.1%) | 41 (9.9%) |
| Life, Physical & Social Science | 265 (79.3%) | 69 (20.7%) |
| Community & Social Service | 1,067 (32.2%) | 2,246 (67.8%) |
| Education, Arts & Media | 204 (29.7%) | 482 (70.3%) |
| Legal Services & Support | 139 (41.5%) | 196 (58.5%) |
| Education Instruction & Library | 450 (23.5%) | 1,466 (76.5%) |
| Arts, Media & Entertainment | 274 (72.9%) | 102 (27.1%) |
| Health Diagnosing & Treating | 684 (25.6%) | 1,986 (74.4%) |
| Health Technologists | 659 (34.6%) | 1,247 (65.4%) |
| Total (Category) | 5,614 (45.5%) | 6,716 (54.5%) |
| Total (Overall) | 18,303 (51.2%) | 17,452 (48.8%) |
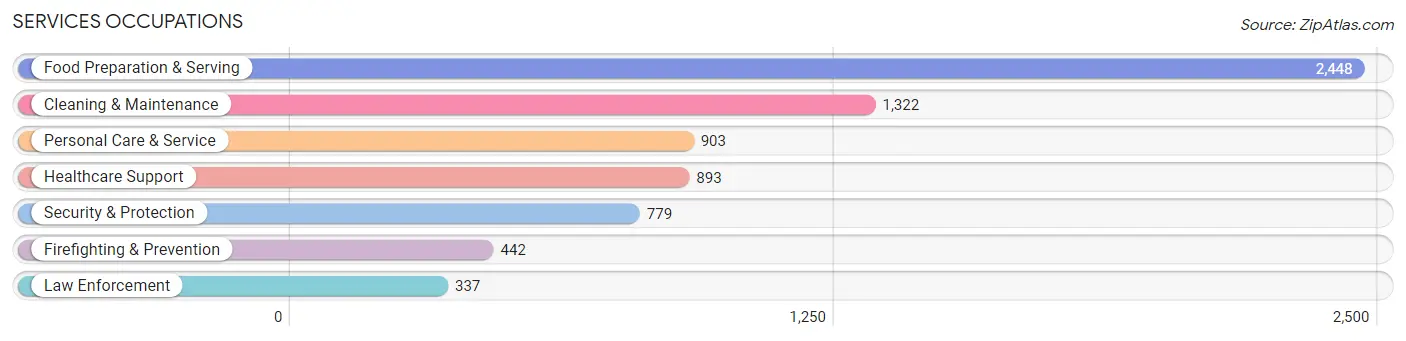
Services Occupations
The most common Services occupations in Erie County are Food Preparation & Serving (2,448 | 6.9%), Cleaning & Maintenance (1,322 | 3.7%), Personal Care & Service (903 | 2.5%), Healthcare Support (893 | 2.5%), and Security & Protection (779 | 2.2%).
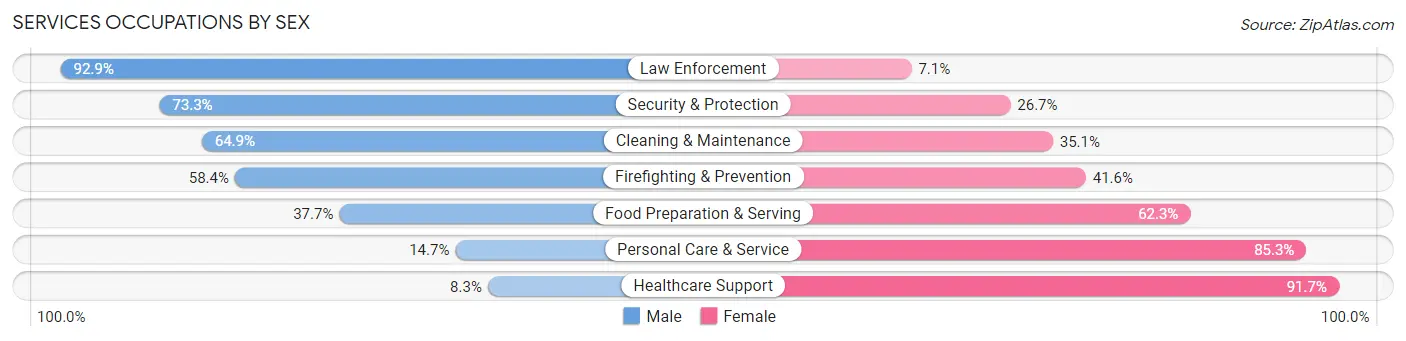
Services Occupations by Sex
Within the Services occupations in Erie County, the most male-oriented occupations are Law Enforcement (92.9%), Security & Protection (73.3%), and Cleaning & Maintenance (64.9%), while the most female-oriented occupations are Healthcare Support (91.7%), Personal Care & Service (85.3%), and Food Preparation & Serving (62.3%).
| Occupation | Male | Female |
| Healthcare Support | 74 (8.3%) | 819 (91.7%) |
| Security & Protection | 571 (73.3%) | 208 (26.7%) |
| Firefighting & Prevention | 258 (58.4%) | 184 (41.6%) |
| Law Enforcement | 313 (92.9%) | 24 (7.1%) |
| Food Preparation & Serving | 923 (37.7%) | 1,525 (62.3%) |
| Cleaning & Maintenance | 858 (64.9%) | 464 (35.1%) |
| Personal Care & Service | 133 (14.7%) | 770 (85.3%) |
| Total (Category) | 2,559 (40.3%) | 3,786 (59.7%) |
| Total (Overall) | 18,303 (51.2%) | 17,452 (48.8%) |
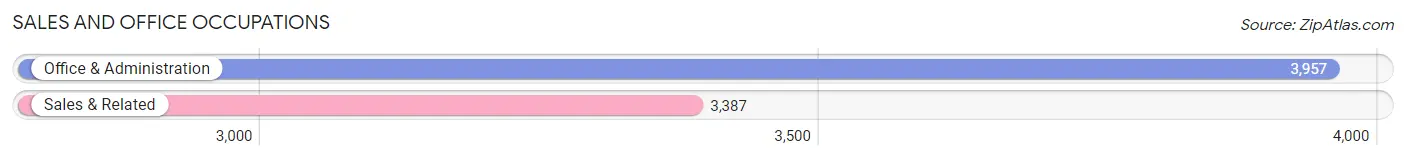
Sales and Office Occupations
The most common Sales and Office occupations in Erie County are Office & Administration (3,957 | 11.1%), and Sales & Related (3,387 | 9.5%).
Sales and Office Occupations by Sex
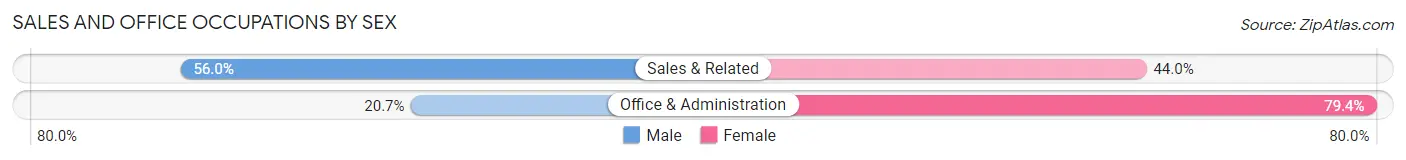
| Occupation | Male | Female |
| Sales & Related | 1,897 (56.0%) | 1,490 (44.0%) |
| Office & Administration | 817 (20.6%) | 3,140 (79.3%) |
| Total (Category) | 2,714 (37.0%) | 4,630 (63.0%) |
| Total (Overall) | 18,303 (51.2%) | 17,452 (48.8%) |
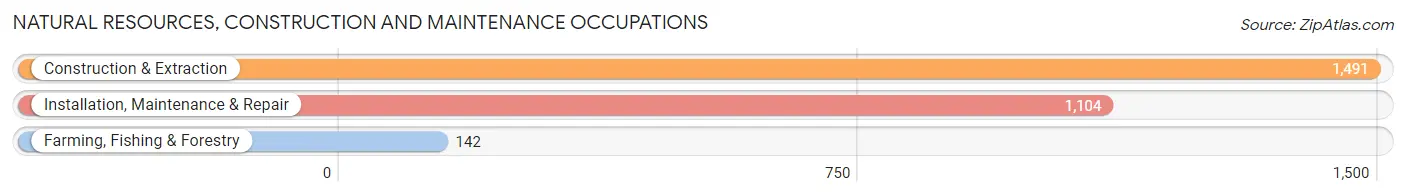
Natural Resources, Construction and Maintenance Occupations
The most common Natural Resources, Construction and Maintenance occupations in Erie County are Construction & Extraction (1,491 | 4.2%), Installation, Maintenance & Repair (1,104 | 3.1%), and Farming, Fishing & Forestry (142 | 0.4%).
Natural Resources, Construction and Maintenance Occupations by Sex
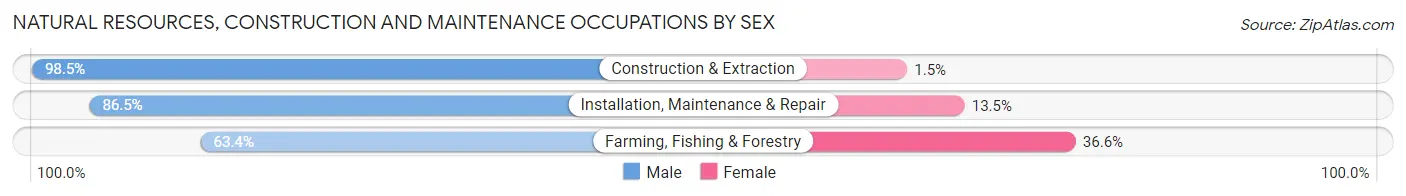
| Occupation | Male | Female |
| Farming, Fishing & Forestry | 90 (63.4%) | 52 (36.6%) |
| Construction & Extraction | 1,468 (98.5%) | 23 (1.5%) |
| Installation, Maintenance & Repair | 955 (86.5%) | 149 (13.5%) |
| Total (Category) | 2,513 (91.8%) | 224 (8.2%) |
| Total (Overall) | 18,303 (51.2%) | 17,452 (48.8%) |
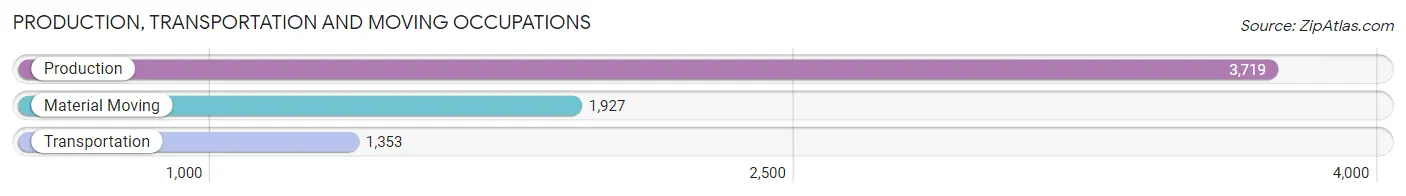
Production, Transportation and Moving Occupations
The most common Production, Transportation and Moving occupations in Erie County are Production (3,719 | 10.4%), Material Moving (1,927 | 5.4%), and Transportation (1,353 | 3.8%).
Production, Transportation and Moving Occupations by Sex
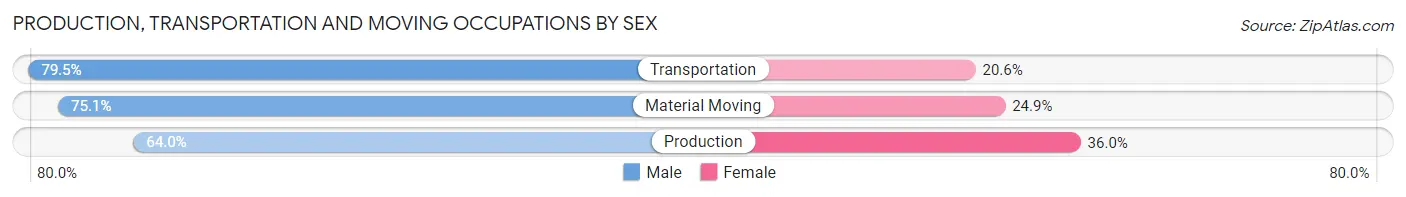
| Occupation | Male | Female |
| Production | 2,381 (64.0%) | 1,338 (36.0%) |
| Transportation | 1,075 (79.4%) | 278 (20.5%) |
| Material Moving | 1,447 (75.1%) | 480 (24.9%) |
| Total (Category) | 4,903 (70.1%) | 2,096 (29.9%) |
| Total (Overall) | 18,303 (51.2%) | 17,452 (48.8%) |
Employment Industries by Sex in Erie County
Employment Industries in Erie County
The major employment industries in Erie County include Manufacturing (6,310 | 17.6%), Health Care & Social Assistance (5,611 | 15.7%), Retail Trade (3,907 | 10.9%), Accommodation & Food Services (2,966 | 8.3%), and Educational Services (2,744 | 7.7%).

Employment Industries by Sex in Erie County
The Erie County industries that see more men than women are Construction (94.3%), Utilities (93.5%), and Administrative & Support (75.8%), whereas the industries that tend to have a higher number of women are Enterprise Management (100.0%), Health Care & Social Assistance (79.3%), and Educational Services (72.4%).
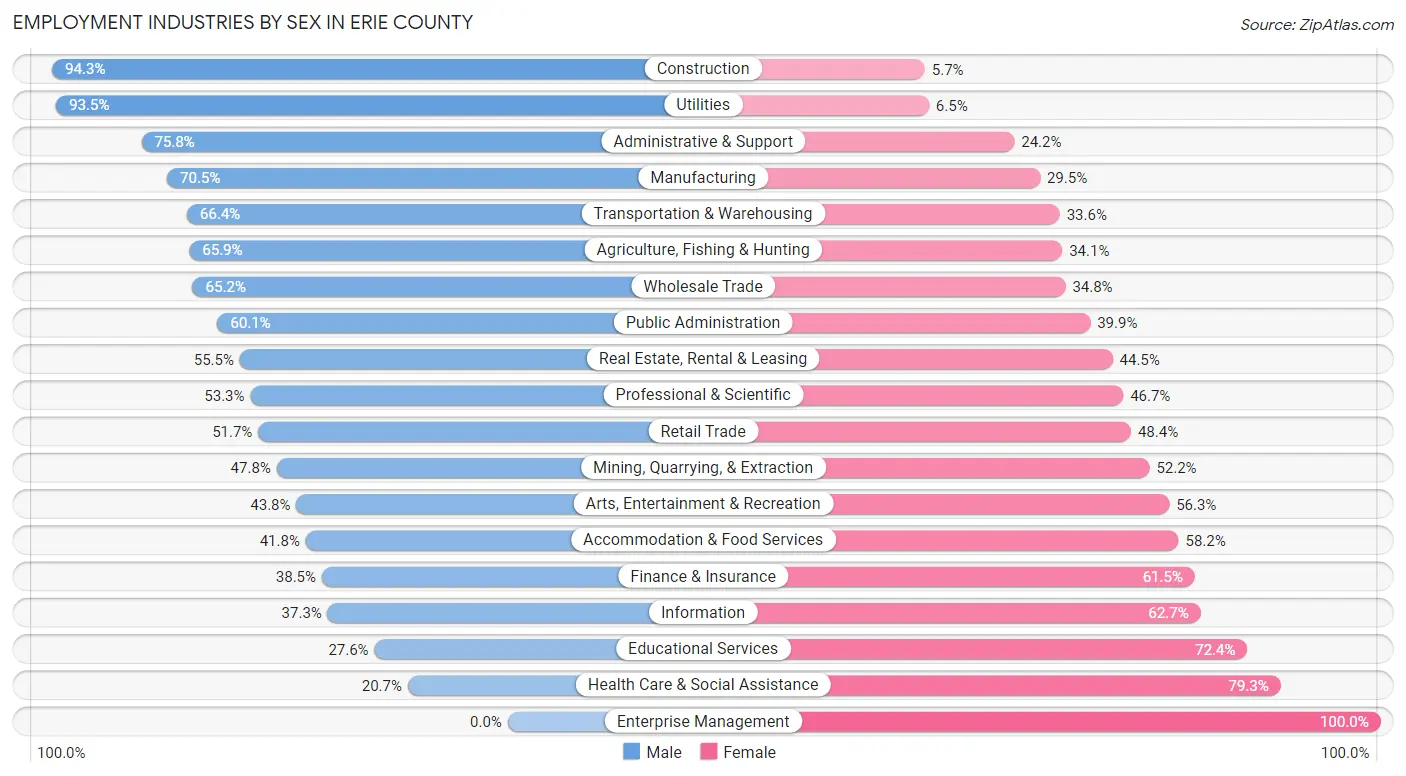
| Industry | Male | Female |
| Agriculture, Fishing & Hunting | 311 (65.9%) | 161 (34.1%) |
| Mining, Quarrying, & Extraction | 33 (47.8%) | 36 (52.2%) |
| Construction | 1,778 (94.3%) | 107 (5.7%) |
| Manufacturing | 4,448 (70.5%) | 1,862 (29.5%) |
| Wholesale Trade | 467 (65.2%) | 249 (34.8%) |
| Retail Trade | 2,018 (51.6%) | 1,889 (48.3%) |
| Transportation & Warehousing | 1,146 (66.4%) | 580 (33.6%) |
| Utilities | 430 (93.5%) | 30 (6.5%) |
| Information | 246 (37.3%) | 414 (62.7%) |
| Finance & Insurance | 362 (38.5%) | 579 (61.5%) |
| Real Estate, Rental & Leasing | 371 (55.5%) | 298 (44.5%) |
| Professional & Scientific | 725 (53.3%) | 636 (46.7%) |
| Enterprise Management | 0 (0.0%) | 26 (100.0%) |
| Administrative & Support | 583 (75.8%) | 186 (24.2%) |
| Educational Services | 757 (27.6%) | 1,987 (72.4%) |
| Health Care & Social Assistance | 1,161 (20.7%) | 4,450 (79.3%) |
| Arts, Entertainment & Recreation | 606 (43.8%) | 779 (56.2%) |
| Accommodation & Food Services | 1,240 (41.8%) | 1,726 (58.2%) |
| Public Administration | 768 (60.1%) | 510 (39.9%) |
| Total | 18,303 (51.2%) | 17,452 (48.8%) |
Education in Erie County
School Enrollment in Erie County
The most common levels of schooling among the 15,322 students in Erie County are high school (3,939 | 25.7%), middle school (3,320 | 21.7%), and elementary school (3,058 | 20.0%).
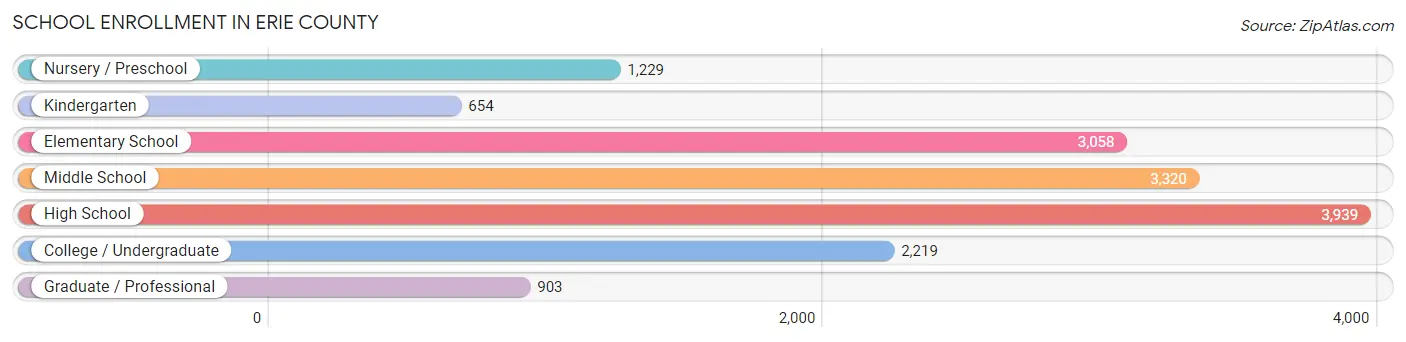
| School Level | # Students | % Students |
| Nursery / Preschool | 1,229 | 8.0% |
| Kindergarten | 654 | 4.3% |
| Elementary School | 3,058 | 20.0% |
| Middle School | 3,320 | 21.7% |
| High School | 3,939 | 25.7% |
| College / Undergraduate | 2,219 | 14.5% |
| Graduate / Professional | 903 | 5.9% |
| Total | 15,322 | 100.0% |
School Enrollment by Age by Funding Source in Erie County
Out of a total of 15,322 students who are enrolled in schools in Erie County, 2,574 (16.8%) attend a private institution, while the remaining 12,748 (83.2%) are enrolled in public schools. The age group of 35 years and over has the highest likelihood of being enrolled in private schools, with 239 (31.2% in the age bracket) enrolled. Conversely, the age group of 15 to 17 year olds has the lowest likelihood of being enrolled in a private school, with 2,489 (92.1% in the age bracket) attending a public institution.
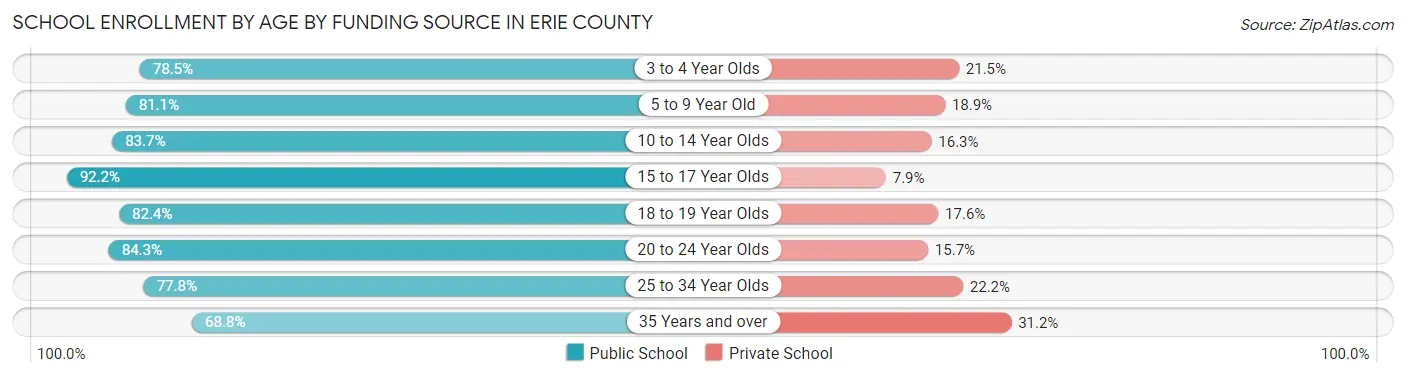
| Age Bracket | Public School | Private School |
| 3 to 4 Year Olds | 816 (78.5%) | 223 (21.5%) |
| 5 to 9 Year Old | 2,633 (81.1%) | 612 (18.9%) |
| 10 to 14 Year Olds | 3,653 (83.7%) | 713 (16.3%) |
| 15 to 17 Year Olds | 2,489 (92.1%) | 212 (7.9%) |
| 18 to 19 Year Olds | 941 (82.4%) | 201 (17.6%) |
| 20 to 24 Year Olds | 1,010 (84.3%) | 188 (15.7%) |
| 25 to 34 Year Olds | 673 (77.8%) | 192 (22.2%) |
| 35 Years and over | 527 (68.8%) | 239 (31.2%) |
| Total | 12,748 (83.2%) | 2,574 (16.8%) |
Educational Attainment by Field of Study in Erie County
Business (3,611 | 23.3%), education (3,406 | 22.0%), science & technology (1,625 | 10.5%), bio, nature & agricultural (1,052 | 6.8%), and arts & humanities (875 | 5.6%) are the most common fields of study among 15,516 individuals in Erie County who have obtained a bachelor's degree or higher.

| Field of Study | # Graduates | % Graduates |
| Computers & Mathematics | 215 | 1.4% |
| Bio, Nature & Agricultural | 1,052 | 6.8% |
| Physical & Health Sciences | 543 | 3.5% |
| Psychology | 806 | 5.2% |
| Social Sciences | 622 | 4.0% |
| Engineering | 785 | 5.1% |
| Multidisciplinary Studies | 68 | 0.4% |
| Science & Technology | 1,625 | 10.5% |
| Business | 3,611 | 23.3% |
| Education | 3,406 | 22.0% |
| Literature & Languages | 404 | 2.6% |
| Liberal Arts & History | 508 | 3.3% |
| Visual & Performing Arts | 454 | 2.9% |
| Communications | 542 | 3.5% |
| Arts & Humanities | 875 | 5.6% |
| Total | 15,516 | 100.0% |
Transportation & Commute in Erie County
Vehicle Availability by Sex in Erie County
The most prevalent vehicle ownership categories in Erie County are males with 2 vehicles (7,732, accounting for 43.4%) and females with 2 vehicles (6,753, making up 45.0%).
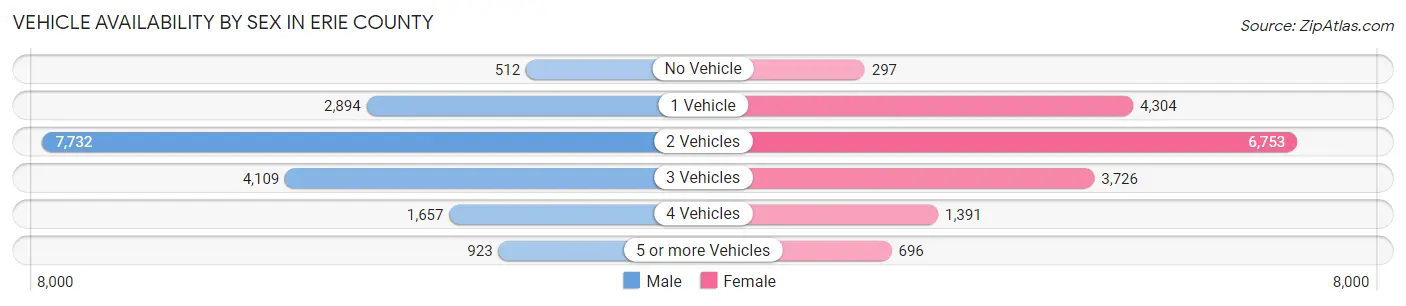
| Vehicles Available | Male | Female |
| No Vehicle | 512 (2.9%) | 297 (1.7%) |
| 1 Vehicle | 2,894 (16.2%) | 4,304 (25.1%) |
| 2 Vehicles | 7,732 (43.4%) | 6,753 (39.3%) |
| 3 Vehicles | 4,109 (23.1%) | 3,726 (21.7%) |
| 4 Vehicles | 1,657 (9.3%) | 1,391 (8.1%) |
| 5 or more Vehicles | 923 (5.2%) | 696 (4.1%) |
| Total | 17,827 (100.0%) | 17,167 (100.0%) |
Commute Time in Erie County
The most frequently occuring commute durations in Erie County are 10 to 14 minutes (6,315 commuters, 18.7%), 15 to 19 minutes (5,803 commuters, 17.2%), and 5 to 9 minutes (5,525 commuters, 16.4%).
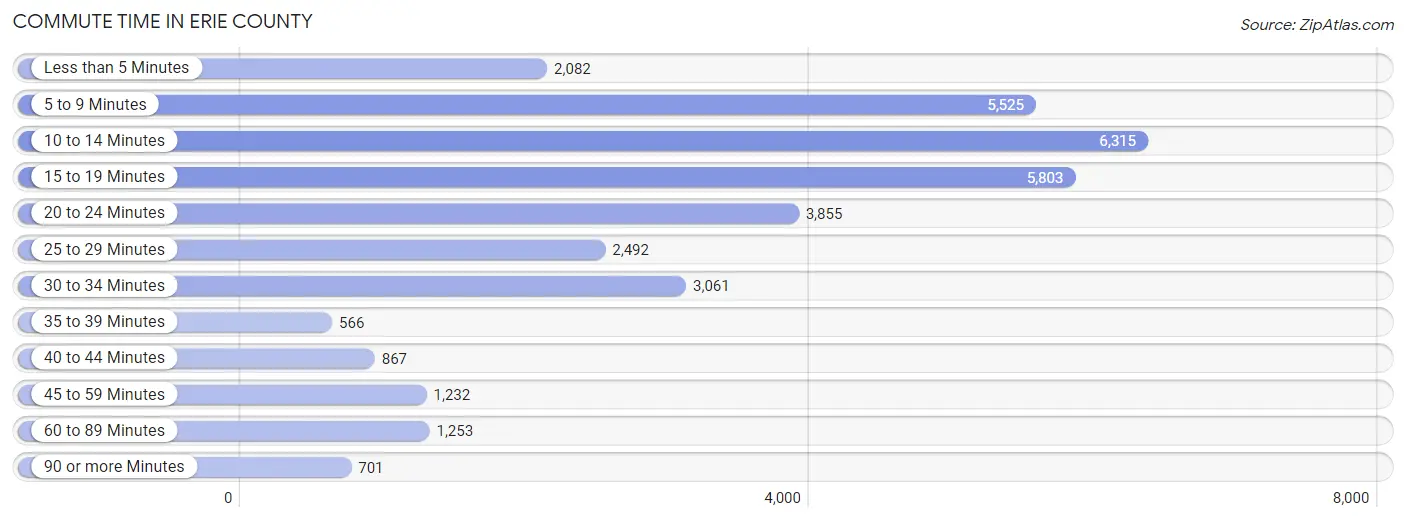
| Commute Time | # Commuters | % Commuters |
| Less than 5 Minutes | 2,082 | 6.2% |
| 5 to 9 Minutes | 5,525 | 16.4% |
| 10 to 14 Minutes | 6,315 | 18.7% |
| 15 to 19 Minutes | 5,803 | 17.2% |
| 20 to 24 Minutes | 3,855 | 11.4% |
| 25 to 29 Minutes | 2,492 | 7.4% |
| 30 to 34 Minutes | 3,061 | 9.1% |
| 35 to 39 Minutes | 566 | 1.7% |
| 40 to 44 Minutes | 867 | 2.6% |
| 45 to 59 Minutes | 1,232 | 3.6% |
| 60 to 89 Minutes | 1,253 | 3.7% |
| 90 or more Minutes | 701 | 2.1% |
Commute Time by Sex in Erie County
The most common commute times in Erie County are 15 to 19 minutes (3,214 commuters, 18.6%) for males and 10 to 14 minutes (3,662 commuters, 22.3%) for females.
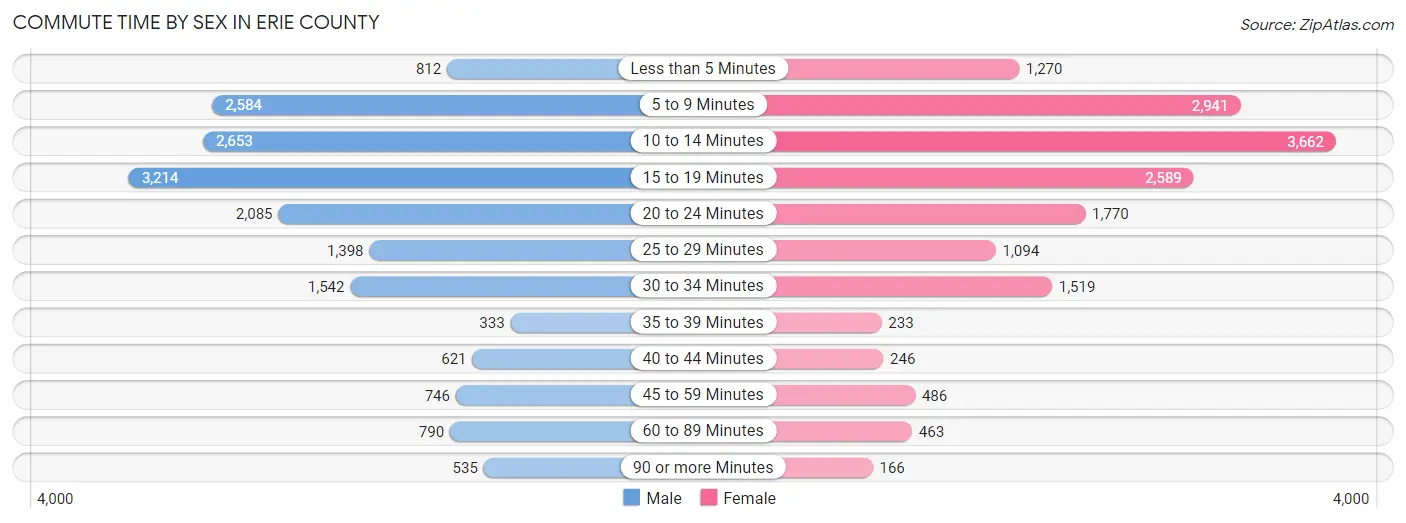
| Commute Time | Male | Female |
| Less than 5 Minutes | 812 (4.7%) | 1,270 (7.7%) |
| 5 to 9 Minutes | 2,584 (14.9%) | 2,941 (17.9%) |
| 10 to 14 Minutes | 2,653 (15.3%) | 3,662 (22.3%) |
| 15 to 19 Minutes | 3,214 (18.6%) | 2,589 (15.8%) |
| 20 to 24 Minutes | 2,085 (12.0%) | 1,770 (10.8%) |
| 25 to 29 Minutes | 1,398 (8.1%) | 1,094 (6.7%) |
| 30 to 34 Minutes | 1,542 (8.9%) | 1,519 (9.2%) |
| 35 to 39 Minutes | 333 (1.9%) | 233 (1.4%) |
| 40 to 44 Minutes | 621 (3.6%) | 246 (1.5%) |
| 45 to 59 Minutes | 746 (4.3%) | 486 (3.0%) |
| 60 to 89 Minutes | 790 (4.6%) | 463 (2.8%) |
| 90 or more Minutes | 535 (3.1%) | 166 (1.0%) |
Time of Departure to Work by Sex in Erie County
The most frequent times of departure to work in Erie County are 7:00 AM to 7:29 AM (2,709, 15.7%) for males and 7:30 AM to 7:59 AM (2,411, 14.7%) for females.
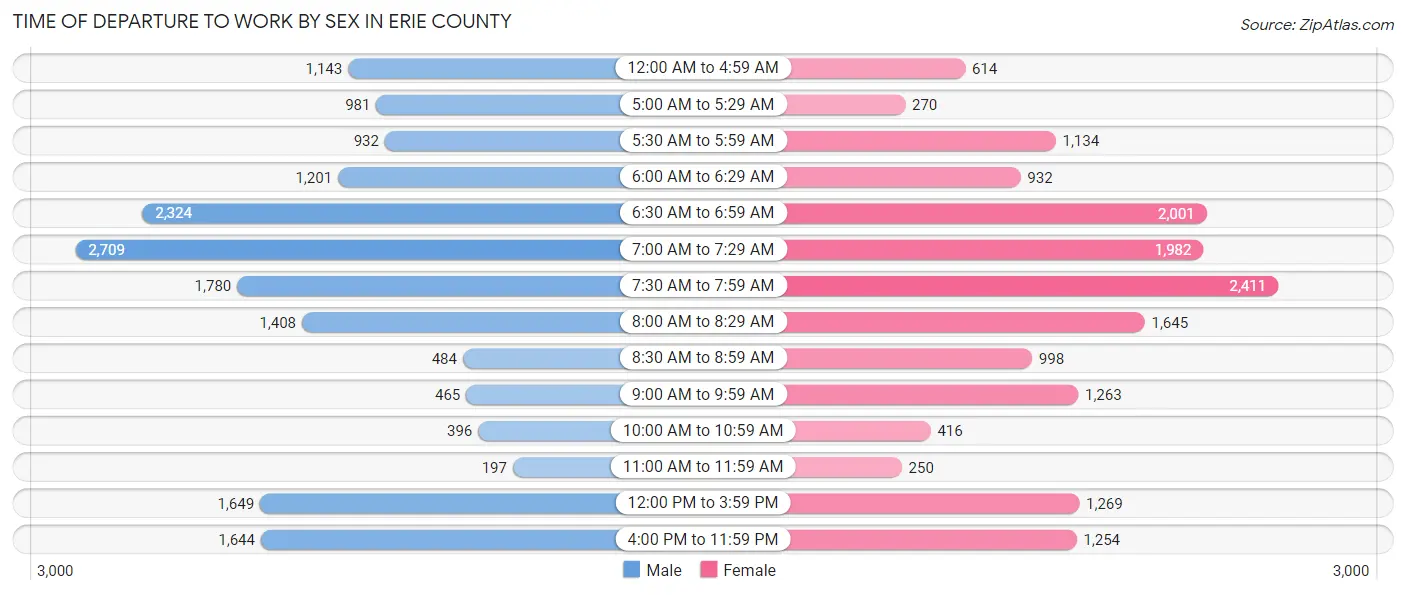
| Time of Departure | Male | Female |
| 12:00 AM to 4:59 AM | 1,143 (6.6%) | 614 (3.7%) |
| 5:00 AM to 5:29 AM | 981 (5.7%) | 270 (1.6%) |
| 5:30 AM to 5:59 AM | 932 (5.4%) | 1,134 (6.9%) |
| 6:00 AM to 6:29 AM | 1,201 (6.9%) | 932 (5.7%) |
| 6:30 AM to 6:59 AM | 2,324 (13.4%) | 2,001 (12.2%) |
| 7:00 AM to 7:29 AM | 2,709 (15.7%) | 1,982 (12.1%) |
| 7:30 AM to 7:59 AM | 1,780 (10.3%) | 2,411 (14.7%) |
| 8:00 AM to 8:29 AM | 1,408 (8.1%) | 1,645 (10.0%) |
| 8:30 AM to 8:59 AM | 484 (2.8%) | 998 (6.1%) |
| 9:00 AM to 9:59 AM | 465 (2.7%) | 1,263 (7.7%) |
| 10:00 AM to 10:59 AM | 396 (2.3%) | 416 (2.5%) |
| 11:00 AM to 11:59 AM | 197 (1.1%) | 250 (1.5%) |
| 12:00 PM to 3:59 PM | 1,649 (9.5%) | 1,269 (7.7%) |
| 4:00 PM to 11:59 PM | 1,644 (9.5%) | 1,254 (7.6%) |
| Total | 17,313 (100.0%) | 16,439 (100.0%) |
Housing Occupancy in Erie County
Occupancy by Ownership in Erie County
Of the total 32,103 dwellings in Erie County, owner-occupied units account for 22,916 (71.4%), while renter-occupied units make up 9,187 (28.6%).
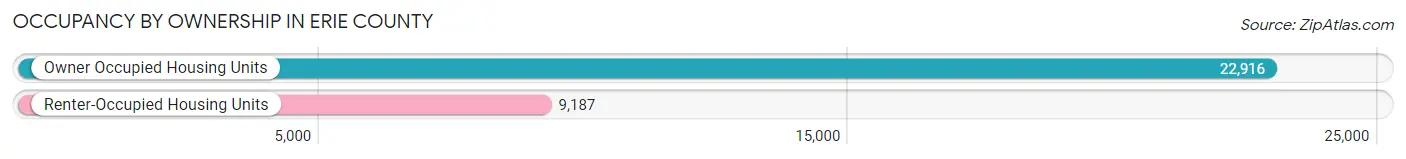
| Occupancy | # Housing Units | % Housing Units |
| Owner Occupied Housing Units | 22,916 | 71.4% |
| Renter-Occupied Housing Units | 9,187 | 28.6% |
| Total Occupied Housing Units | 32,103 | 100.0% |
Occupancy by Household Size in Erie County
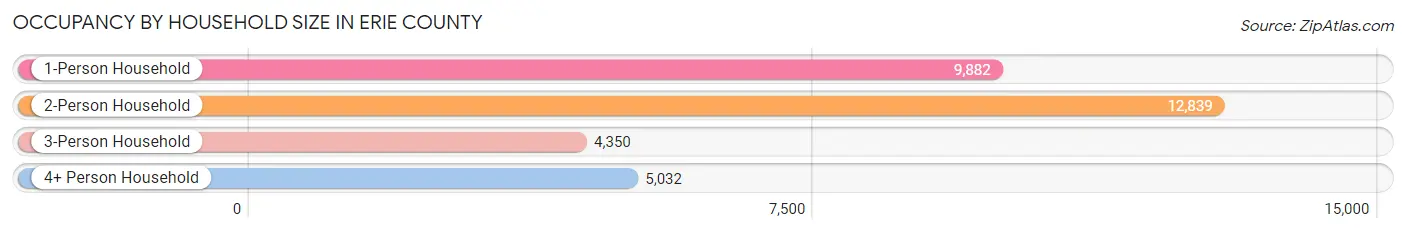
| Household Size | # Housing Units | % Housing Units |
| 1-Person Household | 9,882 | 30.8% |
| 2-Person Household | 12,839 | 40.0% |
| 3-Person Household | 4,350 | 13.6% |
| 4+ Person Household | 5,032 | 15.7% |
| Total Housing Units | 32,103 | 100.0% |
Occupancy by Ownership by Household Size in Erie County

| Household Size | Owner-occupied | Renter-occupied |
| 1-Person Household | 5,967 (60.4%) | 3,915 (39.6%) |
| 2-Person Household | 10,065 (78.4%) | 2,774 (21.6%) |
| 3-Person Household | 3,127 (71.9%) | 1,223 (28.1%) |
| 4+ Person Household | 3,757 (74.7%) | 1,275 (25.3%) |
| Total Housing Units | 22,916 (71.4%) | 9,187 (28.6%) |
Occupancy by Educational Attainment in Erie County
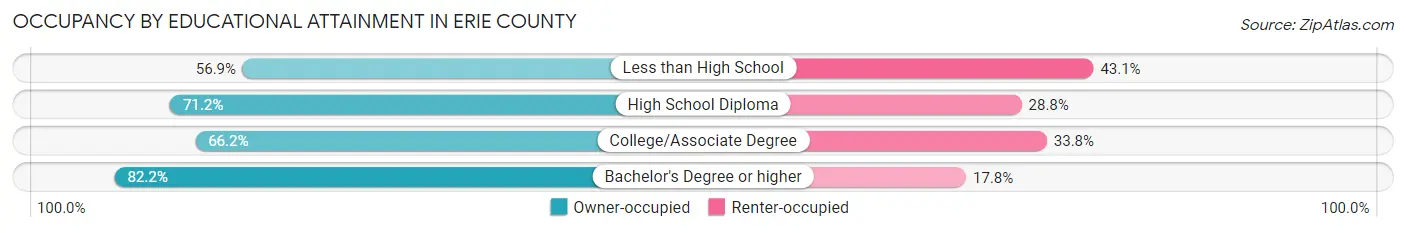
| Household Size | Owner-occupied | Renter-occupied |
| Less than High School | 1,377 (56.9%) | 1,042 (43.1%) |
| High School Diploma | 7,234 (71.2%) | 2,931 (28.8%) |
| College/Associate Degree | 7,162 (66.2%) | 3,664 (33.8%) |
| Bachelor's Degree or higher | 7,143 (82.2%) | 1,550 (17.8%) |
Occupancy by Age of Householder in Erie County

| Age Bracket | # Households | % Households |
| Under 35 Years | 5,258 | 16.4% |
| 35 to 44 Years | 4,251 | 13.2% |
| 45 to 54 Years | 5,341 | 16.6% |
| 55 to 64 Years | 7,044 | 21.9% |
| 65 to 74 Years | 5,660 | 17.6% |
| 75 to 84 Years | 3,227 | 10.1% |
| 85 Years and Over | 1,322 | 4.1% |
| Total | 32,103 | 100.0% |
Housing Finances in Erie County
Median Income by Occupancy in Erie County

| Occupancy Type | # Households | Median Income |
| Owner-Occupied | 22,916 (71.4%) | $79,700 |
| Renter-Occupied | 9,187 (28.6%) | $39,992 |
| Average | 32,103 (100.0%) | $65,171 |
Occupancy by Householder Income Bracket in Erie County

| Income Bracket | Owner-occupied | Renter-occupied |
| Less than $5,000 | 465 (2.0%) | 877 (9.6%) |
| $5,000 to $9,999 | 306 (1.3%) | 284 (3.1%) |
| $10,000 to $14,999 | 584 (2.5%) | 496 (5.4%) |
| $15,000 to $19,999 | 373 (1.6%) | 554 (6.0%) |
| $20,000 to $24,999 | 759 (3.3%) | 772 (8.4%) |
| $25,000 to $34,999 | 1,621 (7.1%) | 1,143 (12.4%) |
| $35,000 to $49,999 | 2,625 (11.5%) | 1,465 (16.0%) |
| $50,000 to $74,999 | 3,982 (17.4%) | 1,879 (20.4%) |
| $75,000 to $99,999 | 3,781 (16.5%) | 675 (7.3%) |
| $100,000 to $149,999 | 4,926 (21.5%) | 822 (8.9%) |
| $150,000 or more | 3,494 (15.2%) | 220 (2.4%) |
| Total | 22,916 (100.0%) | 9,187 (100.0%) |
Monthly Housing Cost Tiers in Erie County
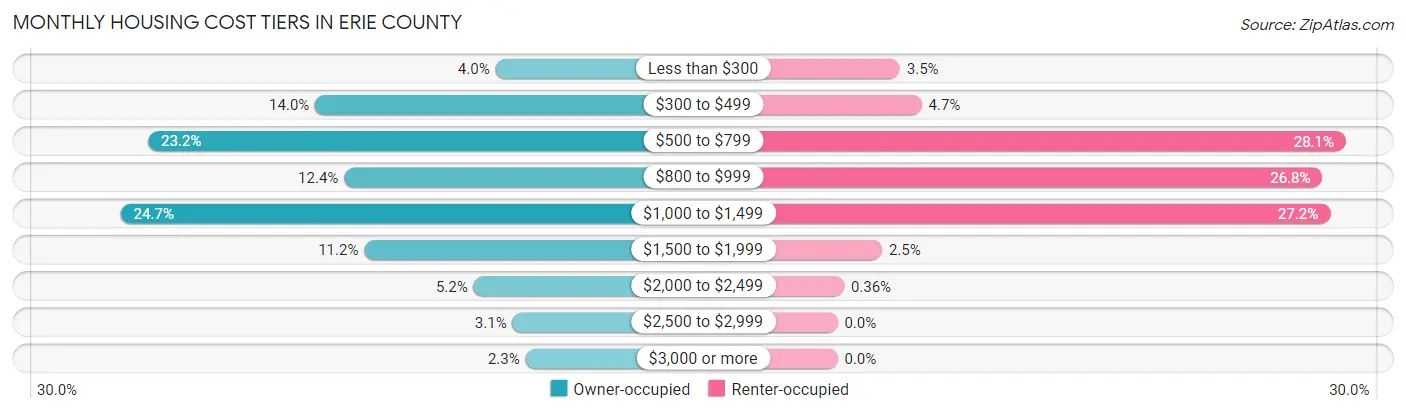
| Monthly Cost | Owner-occupied | Renter-occupied |
| Less than $300 | 915 (4.0%) | 317 (3.5%) |
| $300 to $499 | 3,196 (14.0%) | 427 (4.6%) |
| $500 to $799 | 5,312 (23.2%) | 2,580 (28.1%) |
| $800 to $999 | 2,830 (12.3%) | 2,460 (26.8%) |
| $1,000 to $1,499 | 5,661 (24.7%) | 2,500 (27.2%) |
| $1,500 to $1,999 | 2,575 (11.2%) | 226 (2.5%) |
| $2,000 to $2,499 | 1,192 (5.2%) | 33 (0.4%) |
| $2,500 to $2,999 | 700 (3.0%) | 0 (0.0%) |
| $3,000 or more | 535 (2.3%) | 0 (0.0%) |
| Total | 22,916 (100.0%) | 9,187 (100.0%) |
Physical Housing Characteristics in Erie County
Housing Structures in Erie County
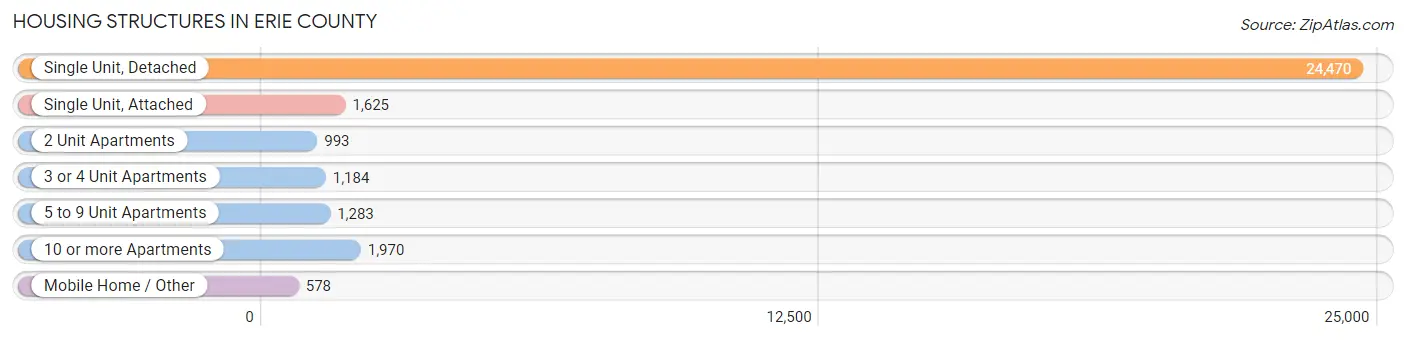
| Structure Type | # Housing Units | % Housing Units |
| Single Unit, Detached | 24,470 | 76.2% |
| Single Unit, Attached | 1,625 | 5.1% |
| 2 Unit Apartments | 993 | 3.1% |
| 3 or 4 Unit Apartments | 1,184 | 3.7% |
| 5 to 9 Unit Apartments | 1,283 | 4.0% |
| 10 or more Apartments | 1,970 | 6.1% |
| Mobile Home / Other | 578 | 1.8% |
| Total | 32,103 | 100.0% |
Housing Structures by Occupancy in Erie County
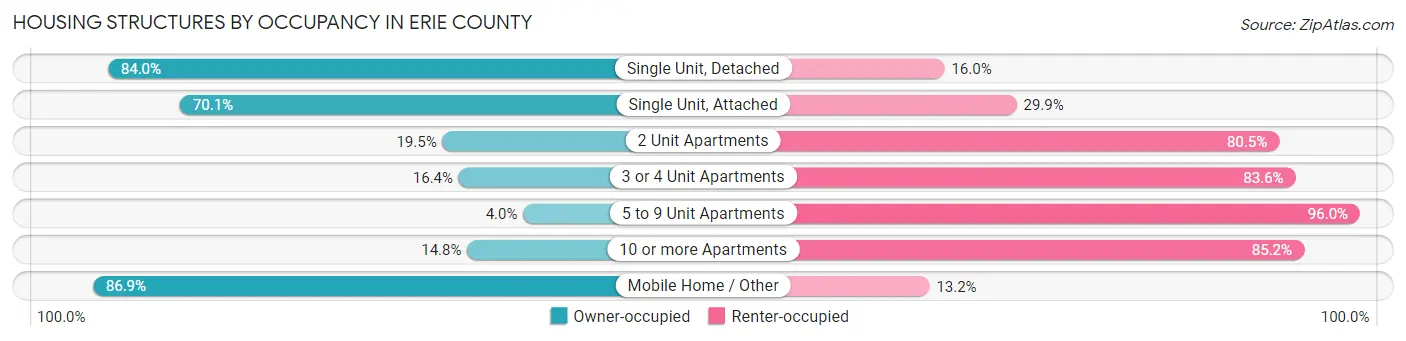
| Structure Type | Owner-occupied | Renter-occupied |
| Single Unit, Detached | 20,545 (84.0%) | 3,925 (16.0%) |
| Single Unit, Attached | 1,139 (70.1%) | 486 (29.9%) |
| 2 Unit Apartments | 194 (19.5%) | 799 (80.5%) |
| 3 or 4 Unit Apartments | 194 (16.4%) | 990 (83.6%) |
| 5 to 9 Unit Apartments | 51 (4.0%) | 1,232 (96.0%) |
| 10 or more Apartments | 291 (14.8%) | 1,679 (85.2%) |
| Mobile Home / Other | 502 (86.9%) | 76 (13.2%) |
| Total | 22,916 (71.4%) | 9,187 (28.6%) |
Housing Structures by Number of Rooms in Erie County

| Number of Rooms | Owner-occupied | Renter-occupied |
| 1 Room | 43 (0.2%) | 317 (3.5%) |
| 2 or 3 Rooms | 355 (1.5%) | 1,912 (20.8%) |
| 4 or 5 Rooms | 5,152 (22.5%) | 3,786 (41.2%) |
| 6 or 7 Rooms | 10,241 (44.7%) | 2,329 (25.4%) |
| 8 or more Rooms | 7,125 (31.1%) | 843 (9.2%) |
| Total | 22,916 (100.0%) | 9,187 (100.0%) |
Housing Structure by Heating Type in Erie County
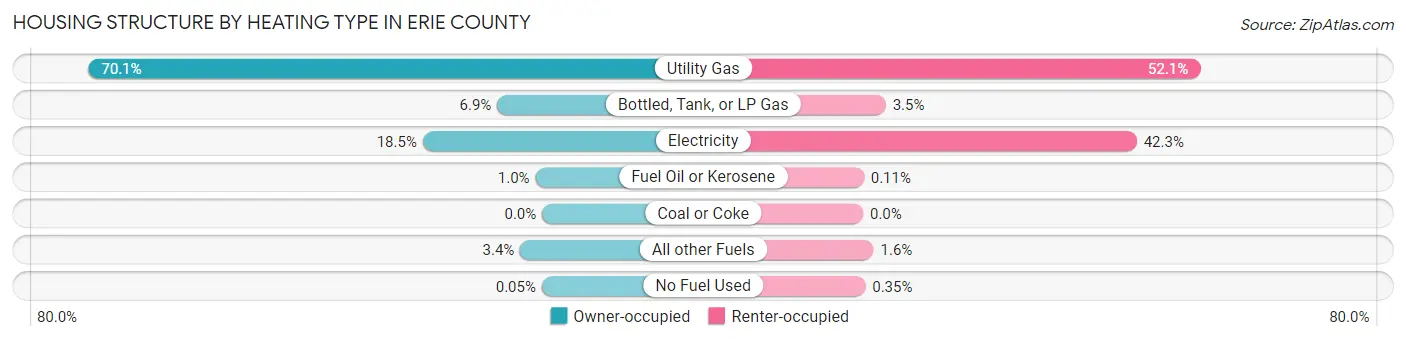
| Heating Type | Owner-occupied | Renter-occupied |
| Utility Gas | 16,073 (70.1%) | 4,786 (52.1%) |
| Bottled, Tank, or LP Gas | 1,591 (6.9%) | 322 (3.5%) |
| Electricity | 4,228 (18.4%) | 3,887 (42.3%) |
| Fuel Oil or Kerosene | 237 (1.0%) | 10 (0.1%) |
| Coal or Coke | 0 (0.0%) | 0 (0.0%) |
| All other Fuels | 776 (3.4%) | 150 (1.6%) |
| No Fuel Used | 11 (0.1%) | 32 (0.4%) |
| Total | 22,916 (100.0%) | 9,187 (100.0%) |
Household Vehicle Usage in Erie County

| Vehicles per Household | Owner-occupied | Renter-occupied |
| No Vehicle | 740 (3.2%) | 1,163 (12.7%) |
| 1 Vehicle | 6,379 (27.8%) | 4,902 (53.4%) |
| 2 Vehicles | 9,442 (41.2%) | 2,488 (27.1%) |
| 3 or more Vehicles | 6,355 (27.7%) | 634 (6.9%) |
| Total | 22,916 (100.0%) | 9,187 (100.0%) |
Real Estate & Mortgages in Erie County
Real Estate and Mortgage Overview in Erie County
| Characteristic | Without Mortgage | With Mortgage |
| Housing Units | 9,715 | 13,201 |
| Median Property Value | $166,400 | $171,400 |
| Median Household Income | $61,146 | $2,505 |
| Monthly Housing Costs | $547 | $495 |
| Real Estate Taxes | $2,150 | $286 |
Property Value by Mortgage Status in Erie County

| Property Value | Without Mortgage | With Mortgage |
| Less than $50,000 | 837 (8.6%) | 382 (2.9%) |
| $50,000 to $99,999 | 1,573 (16.2%) | 1,852 (14.0%) |
| $100,000 to $299,999 | 5,490 (56.5%) | 8,647 (65.5%) |
| $300,000 to $499,999 | 1,296 (13.3%) | 1,739 (13.2%) |
| $500,000 to $749,999 | 325 (3.4%) | 404 (3.1%) |
| $750,000 to $999,999 | 48 (0.5%) | 114 (0.9%) |
| $1,000,000 or more | 146 (1.5%) | 63 (0.5%) |
| Total | 9,715 (100.0%) | 13,201 (100.0%) |
Household Income by Mortgage Status in Erie County
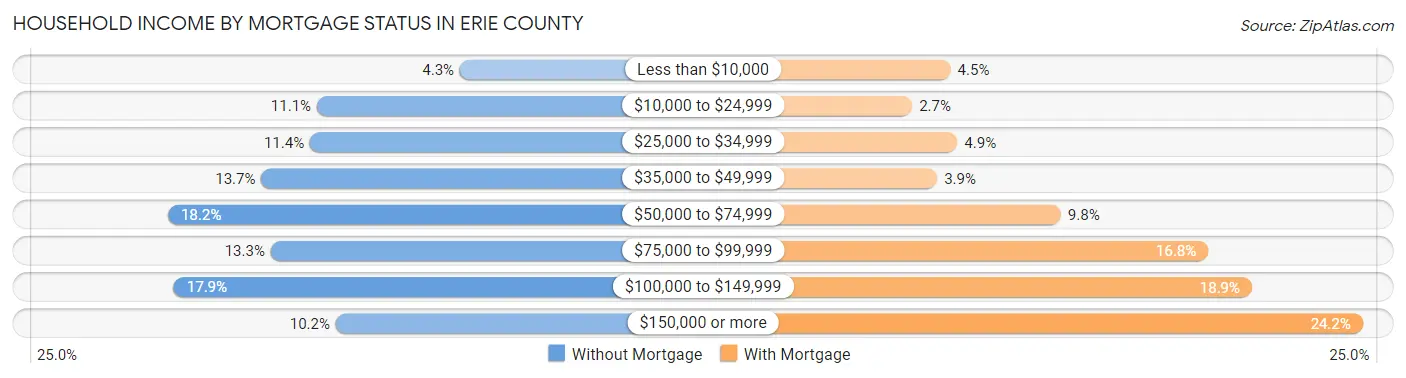
| Household Income | Without Mortgage | With Mortgage |
| Less than $10,000 | 415 (4.3%) | 598 (4.5%) |
| $10,000 to $24,999 | 1,076 (11.1%) | 356 (2.7%) |
| $25,000 to $34,999 | 1,108 (11.4%) | 640 (4.9%) |
| $35,000 to $49,999 | 1,334 (13.7%) | 513 (3.9%) |
| $50,000 to $74,999 | 1,765 (18.2%) | 1,291 (9.8%) |
| $75,000 to $99,999 | 1,290 (13.3%) | 2,217 (16.8%) |
| $100,000 to $149,999 | 1,738 (17.9%) | 2,491 (18.9%) |
| $150,000 or more | 989 (10.2%) | 3,188 (24.1%) |
| Total | 9,715 (100.0%) | 13,201 (100.0%) |
Property Value to Household Income Ratio in Erie County
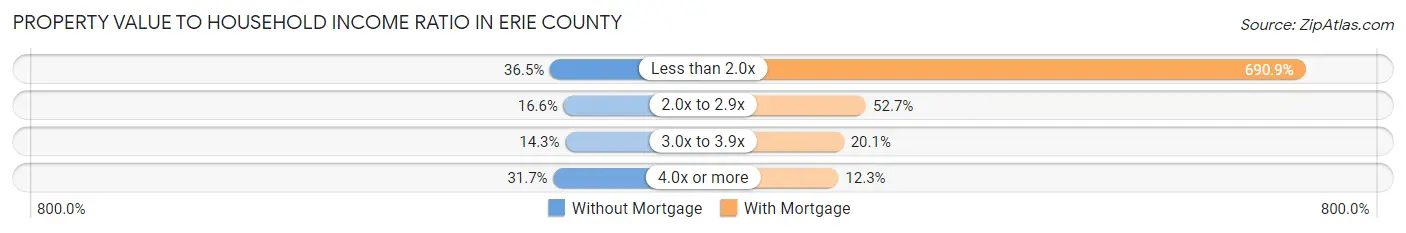
| Value-to-Income Ratio | Without Mortgage | With Mortgage |
| Less than 2.0x | 3,542 (36.5%) | 91,209 (690.9%) |
| 2.0x to 2.9x | 1,617 (16.6%) | 6,951 (52.7%) |
| 3.0x to 3.9x | 1,391 (14.3%) | 2,649 (20.1%) |
| 4.0x or more | 3,075 (31.7%) | 1,628 (12.3%) |
| Total | 9,715 (100.0%) | 13,201 (100.0%) |
Real Estate Taxes by Mortgage Status in Erie County
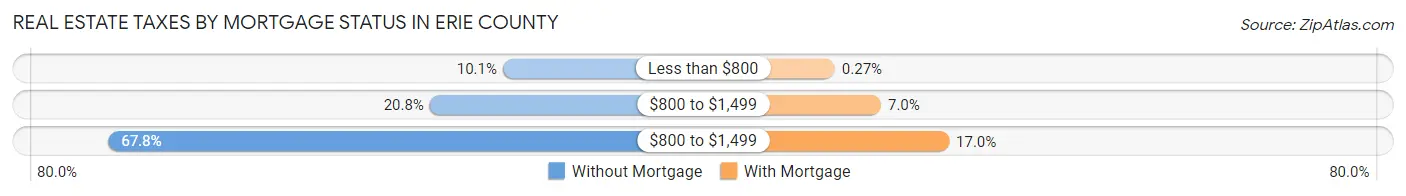
| Property Taxes | Without Mortgage | With Mortgage |
| Less than $800 | 984 (10.1%) | 36 (0.3%) |
| $800 to $1,499 | 2,022 (20.8%) | 925 (7.0%) |
| $800 to $1,499 | 6,583 (67.8%) | 2,239 (17.0%) |
| Total | 9,715 (100.0%) | 13,201 (100.0%) |
Health & Disability in Erie County
Health Insurance Coverage by Age in Erie County
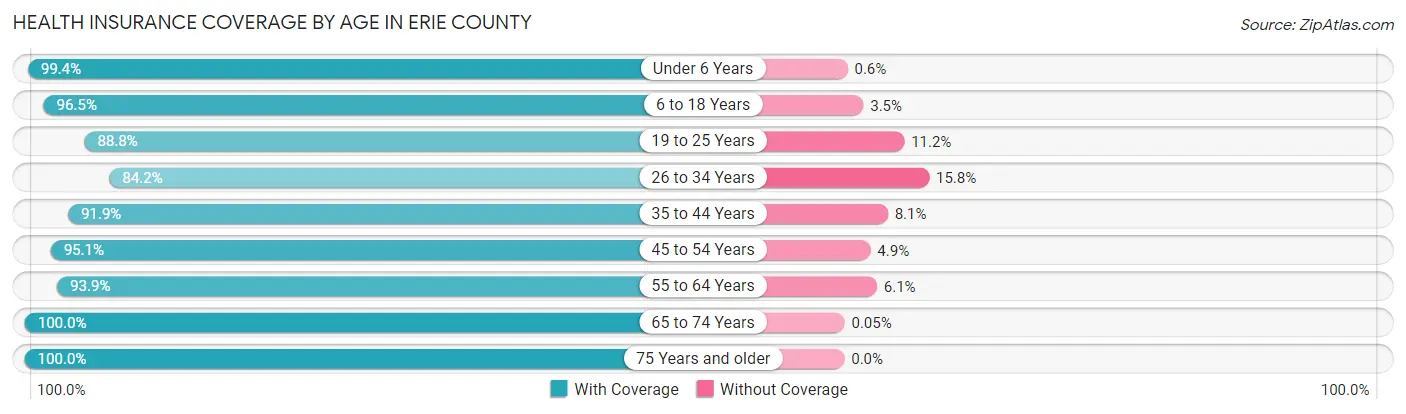
| Age Bracket | With Coverage | Without Coverage |
| Under 6 Years | 4,662 (99.4%) | 28 (0.6%) |
| 6 to 18 Years | 11,169 (96.5%) | 410 (3.5%) |
| 19 to 25 Years | 4,809 (88.8%) | 605 (11.2%) |
| 26 to 34 Years | 6,567 (84.2%) | 1,232 (15.8%) |
| 35 to 44 Years | 7,521 (91.9%) | 662 (8.1%) |
| 45 to 54 Years | 8,573 (95.1%) | 439 (4.9%) |
| 55 to 64 Years | 10,657 (93.9%) | 689 (6.1%) |
| 65 to 74 Years | 9,380 (100.0%) | 5 (0.1%) |
| 75 Years and older | 6,771 (100.0%) | 0 (0.0%) |
| Total | 70,109 (94.5%) | 4,070 (5.5%) |
Health Insurance Coverage by Citizenship Status in Erie County
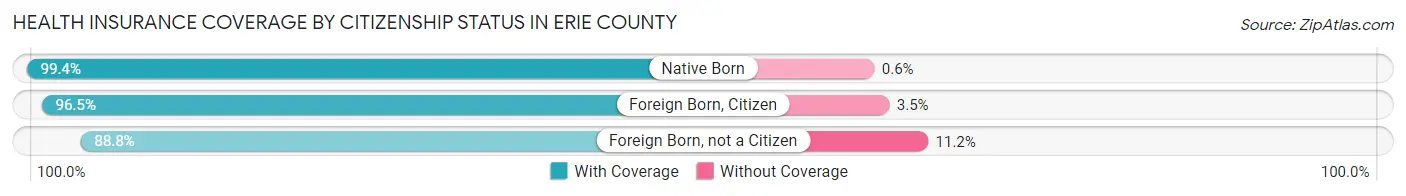
| Citizenship Status | With Coverage | Without Coverage |
| Native Born | 4,662 (99.4%) | 28 (0.6%) |
| Foreign Born, Citizen | 11,169 (96.5%) | 410 (3.5%) |
| Foreign Born, not a Citizen | 4,809 (88.8%) | 605 (11.2%) |
Health Insurance Coverage by Household Income in Erie County
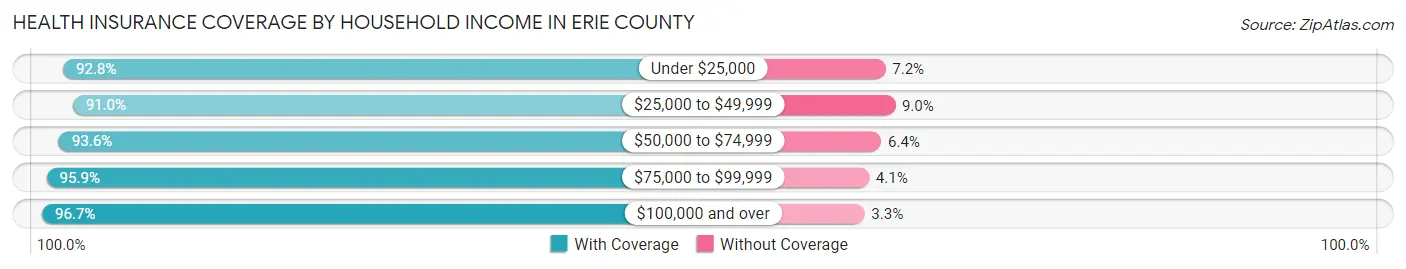
| Household Income | With Coverage | Without Coverage |
| Under $25,000 | 8,211 (92.8%) | 639 (7.2%) |
| $25,000 to $49,999 | 11,863 (91.0%) | 1,177 (9.0%) |
| $50,000 to $74,999 | 11,762 (93.6%) | 808 (6.4%) |
| $75,000 to $99,999 | 11,064 (95.9%) | 478 (4.1%) |
| $100,000 and over | 26,635 (96.7%) | 908 (3.3%) |
Public vs Private Health Insurance Coverage by Age in Erie County
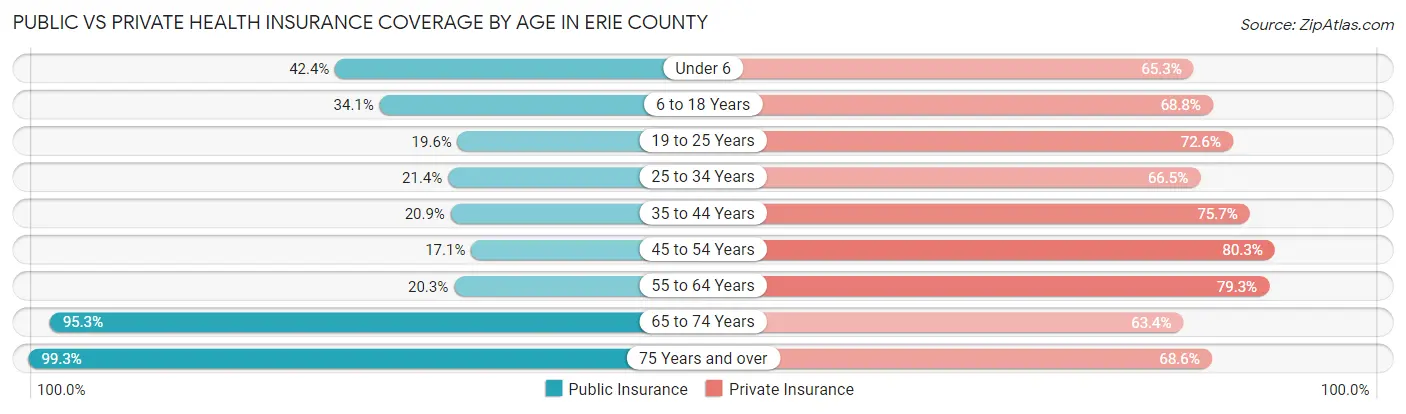
| Age Bracket | Public Insurance | Private Insurance |
| Under 6 | 1,986 (42.3%) | 3,061 (65.3%) |
| 6 to 18 Years | 3,950 (34.1%) | 7,971 (68.8%) |
| 19 to 25 Years | 1,062 (19.6%) | 3,929 (72.6%) |
| 25 to 34 Years | 1,668 (21.4%) | 5,185 (66.5%) |
| 35 to 44 Years | 1,711 (20.9%) | 6,192 (75.7%) |
| 45 to 54 Years | 1,541 (17.1%) | 7,240 (80.3%) |
| 55 to 64 Years | 2,302 (20.3%) | 8,995 (79.3%) |
| 65 to 74 Years | 8,947 (95.3%) | 5,949 (63.4%) |
| 75 Years and over | 6,722 (99.3%) | 4,647 (68.6%) |
| Total | 29,889 (40.3%) | 53,169 (71.7%) |
Disability Status by Sex by Age in Erie County
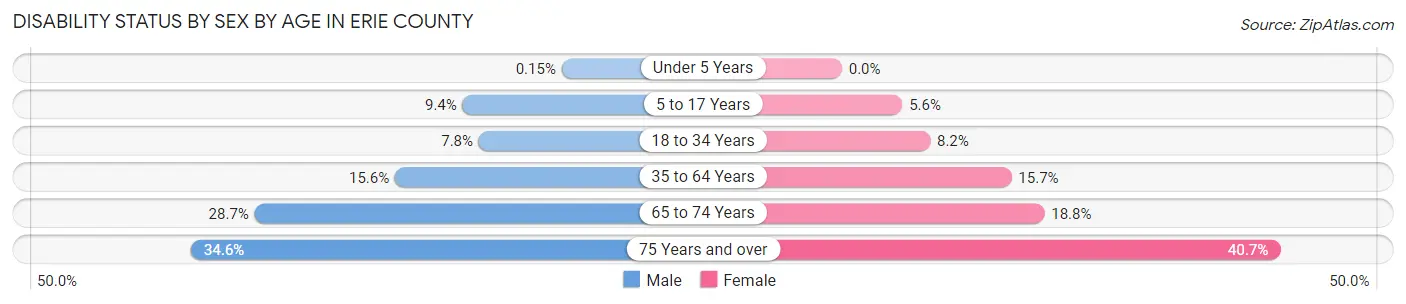
| Age Bracket | Male | Female |
| Under 5 Years | 3 (0.2%) | 0 (0.0%) |
| 5 to 17 Years | 528 (9.3%) | 308 (5.6%) |
| 18 to 34 Years | 577 (7.8%) | 578 (8.2%) |
| 35 to 64 Years | 2,182 (15.6%) | 2,293 (15.7%) |
| 65 to 74 Years | 1,283 (28.6%) | 922 (18.8%) |
| 75 Years and over | 1,030 (34.6%) | 1,542 (40.7%) |
Disability Class by Sex by Age in Erie County
Disability Class: Hearing Difficulty

| Age Bracket | Male | Female |
| Under 5 Years | 0 (0.0%) | 0 (0.0%) |
| 5 to 17 Years | 36 (0.6%) | 3 (0.1%) |
| 18 to 34 Years | 47 (0.6%) | 22 (0.3%) |
| 35 to 64 Years | 570 (4.1%) | 138 (0.9%) |
| 65 to 74 Years | 630 (14.1%) | 193 (3.9%) |
| 75 Years and over | 563 (18.9%) | 612 (16.1%) |
Disability Class: Vision Difficulty
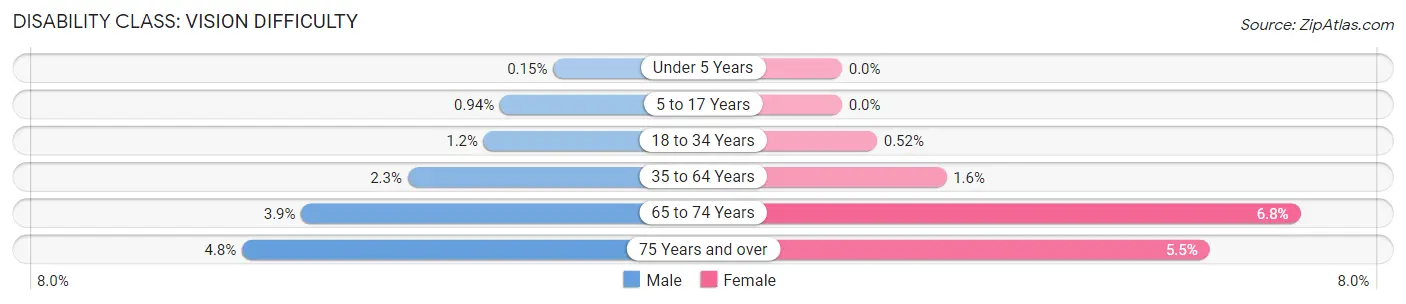
| Age Bracket | Male | Female |
| Under 5 Years | 3 (0.2%) | 0 (0.0%) |
| 5 to 17 Years | 53 (0.9%) | 0 (0.0%) |
| 18 to 34 Years | 87 (1.2%) | 37 (0.5%) |
| 35 to 64 Years | 322 (2.3%) | 226 (1.5%) |
| 65 to 74 Years | 174 (3.9%) | 334 (6.8%) |
| 75 Years and over | 142 (4.8%) | 207 (5.5%) |
Disability Class: Cognitive Difficulty

| Age Bracket | Male | Female |
| 5 to 17 Years | 517 (9.1%) | 305 (5.6%) |
| 18 to 34 Years | 307 (4.2%) | 491 (7.0%) |
| 35 to 64 Years | 1,032 (7.4%) | 936 (6.4%) |
| 65 to 74 Years | 153 (3.4%) | 139 (2.8%) |
| 75 Years and over | 119 (4.0%) | 320 (8.4%) |
Disability Class: Ambulatory Difficulty
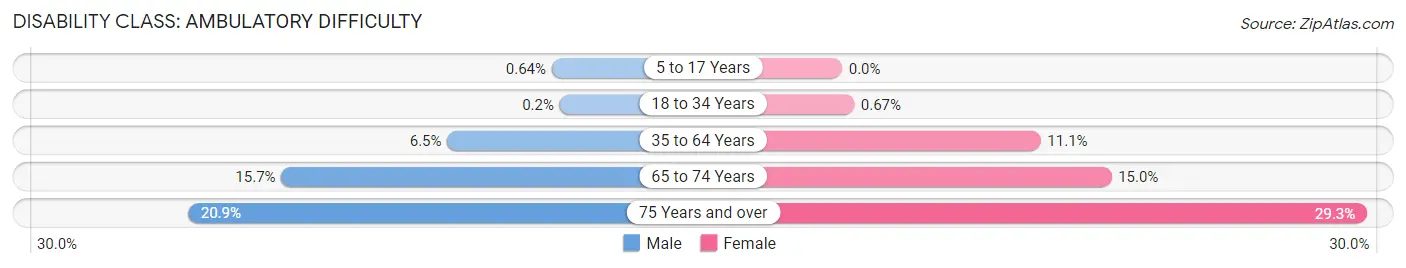
| Age Bracket | Male | Female |
| 5 to 17 Years | 36 (0.6%) | 0 (0.0%) |
| 18 to 34 Years | 15 (0.2%) | 47 (0.7%) |
| 35 to 64 Years | 903 (6.5%) | 1,612 (11.1%) |
| 65 to 74 Years | 703 (15.7%) | 736 (15.0%) |
| 75 Years and over | 623 (20.9%) | 1,109 (29.2%) |
Disability Class: Self-Care Difficulty
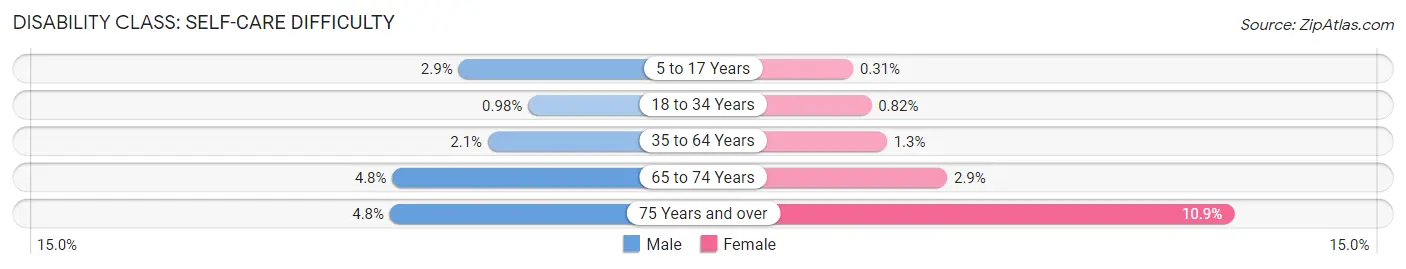
| Age Bracket | Male | Female |
| 5 to 17 Years | 165 (2.9%) | 17 (0.3%) |
| 18 to 34 Years | 72 (1.0%) | 58 (0.8%) |
| 35 to 64 Years | 293 (2.1%) | 182 (1.3%) |
| 65 to 74 Years | 213 (4.8%) | 144 (2.9%) |
| 75 Years and over | 144 (4.8%) | 414 (10.9%) |
Technology Access in Erie County
Computing Device Access in Erie County

| Device Type | # Households | % Households |
| Desktop or Laptop | 24,338 | 75.8% |
| Smartphone | 26,850 | 83.6% |
| Tablet | 19,712 | 61.4% |
| No Computing Device | 2,451 | 7.6% |
| Total | 32,103 | 100.0% |
Internet Access in Erie County

| Internet Type | # Households | % Households |
| Dial-Up Internet | 134 | 0.4% |
| Broadband Home | 22,764 | 70.9% |
| Cellular Data Only | 2,851 | 8.9% |
| Satellite Internet | 2,338 | 7.3% |
| No Internet | 4,957 | 15.4% |
| Total | 32,103 | 100.0% |
Erie County Summary
Erie County is located in the northwest corner of the state of Ohio, and is part of the Toledo Metropolitan Statistical Area. It is bordered by Lake Erie to the north, Huron County to the east, Sandusky County to the south, and Ottawa County to the west. The county seat is Sandusky, and the largest city is Huron.
History
Erie County was formed in 1838 from parts of Huron and Sandusky counties. It was named after Lake Erie, which forms its northern border. The county was originally inhabited by Native Americans, including the Erie, Iroquois, and Wyandot tribes. The first European settlers arrived in the area in the late 1700s, and the county was officially organized in 1838.
In the early 19th century, the county was a major center of the Underground Railroad, with many Quaker families providing shelter and assistance to escaped slaves. During the Civil War, the county was home to several Union regiments, and many of its citizens served in the war effort.
Geography
Erie County covers an area of 545 square miles, making it the fourth-largest county in Ohio. It is located in the northwest corner of the state, and is bordered by Lake Erie to the north, Huron County to the east, Sandusky County to the south, and Ottawa County to the west. The county is mostly flat, with some rolling hills in the southern part. The terrain is mostly covered in farmland, with some wooded areas in the northern part.
The county is home to several state parks, including East Harbor State Park, Maumee Bay State Park, and Sheldon Marsh State Nature Preserve. The county also contains several lakes, including Lake Erie, Sandusky Bay, and the Portage River.
Economy
Erie County’s economy is largely based on agriculture and manufacturing. The county is home to several large farms, which produce corn, soybeans, wheat, and other crops. The county is also home to several manufacturing companies, including Whirlpool Corporation, which produces appliances, and the Ford Motor Company, which produces automobiles.
The county is also home to several tourist attractions, including Cedar Point amusement park, the Marblehead Lighthouse, and the African Safari Wildlife Park. These attractions bring in millions of visitors each year, and contribute significantly to the local economy.
Demographics
As of the 2010 census, the population of Erie County was 77,079. The population is largely white (90.2%), with small percentages of African Americans (3.3%), Asians (1.2%), and Native Americans (0.3%). The median household income is $48,845, and the median home value is $133,400.
The county is home to several colleges and universities, including Bowling Green State University, Heidelberg University, and Tiffin University. The county also contains several public school districts, including the Sandusky City Schools, Huron City Schools, and Perkins Local Schools.
Conclusion
Erie County is a large county located in the northwest corner of Ohio. It is bordered by Lake Erie to the north, Huron County to the east, Sandusky County to the south, and Ottawa County to the west. The county is largely rural, with a strong agricultural and manufacturing base. The county is also home to several tourist attractions, which bring in millions of visitors each year. The population of the county is largely white, with small percentages of African Americans, Asians, and Native Americans. The median household income is $48,845, and the median home value is $133,400.
Common Questions
What is the Total Population of Erie County?
Total Population of Erie County is 75,299.
What is the Total Male Population of Erie County?
Total Male Population of Erie County is 37,056.
What is the Total Female Population of Erie County?
Total Female Population of Erie County is 38,243.
What is the Ratio of Males per 100 Females in Erie County?
There are 96.90 Males per 100 Females in Erie County.
What is the Ratio of Females per 100 Males in Erie County?
There are 103.20 Females per 100 Males in Erie County.
What is the Median Population Age in Erie County?
Median Population Age in Erie County is 44.8 Years.
What is the Average Family Size in Erie County
Average Family Size in Erie County is 2.9 People.
What is the Average Household Size in Erie County
Average Household Size in Erie County is 2.3 People.
What is Per Capita Income in Erie County?
Per Capita income in Erie County is $38,158.
What is the Median Family Income in Erie County?
Median Family Income in Erie County is $82,540.
What is the Median Household income in Erie County?
Median Household Income in Erie County is $65,171.
What is Income or Wage Gap in Erie County?
Income or Wage Gap in Erie County is 34.3%.
Women in Erie County earn 65.7 cents for every dollar earned by a man.
What is Family Income Deficit in Erie County?
Family Income Deficit in Erie County is $11,618.
Families that are below poverty line in Erie County earn $11,618 less on average than the poverty threshold level.
What is Inequality or Gini Index in Erie County?
Inequality or Gini Index in Erie County is 0.46.
How Large is the Labor Force in Erie County?
There are 38,081 People in the Labor Forcein in Erie County.
What is the Percentage of People in the Labor Force in Erie County?
61.5% of People are in the Labor Force in Erie County.
What is the Unemployment Rate in Erie County?
Unemployment Rate in Erie County is 6.1%.