Delaware County, OH
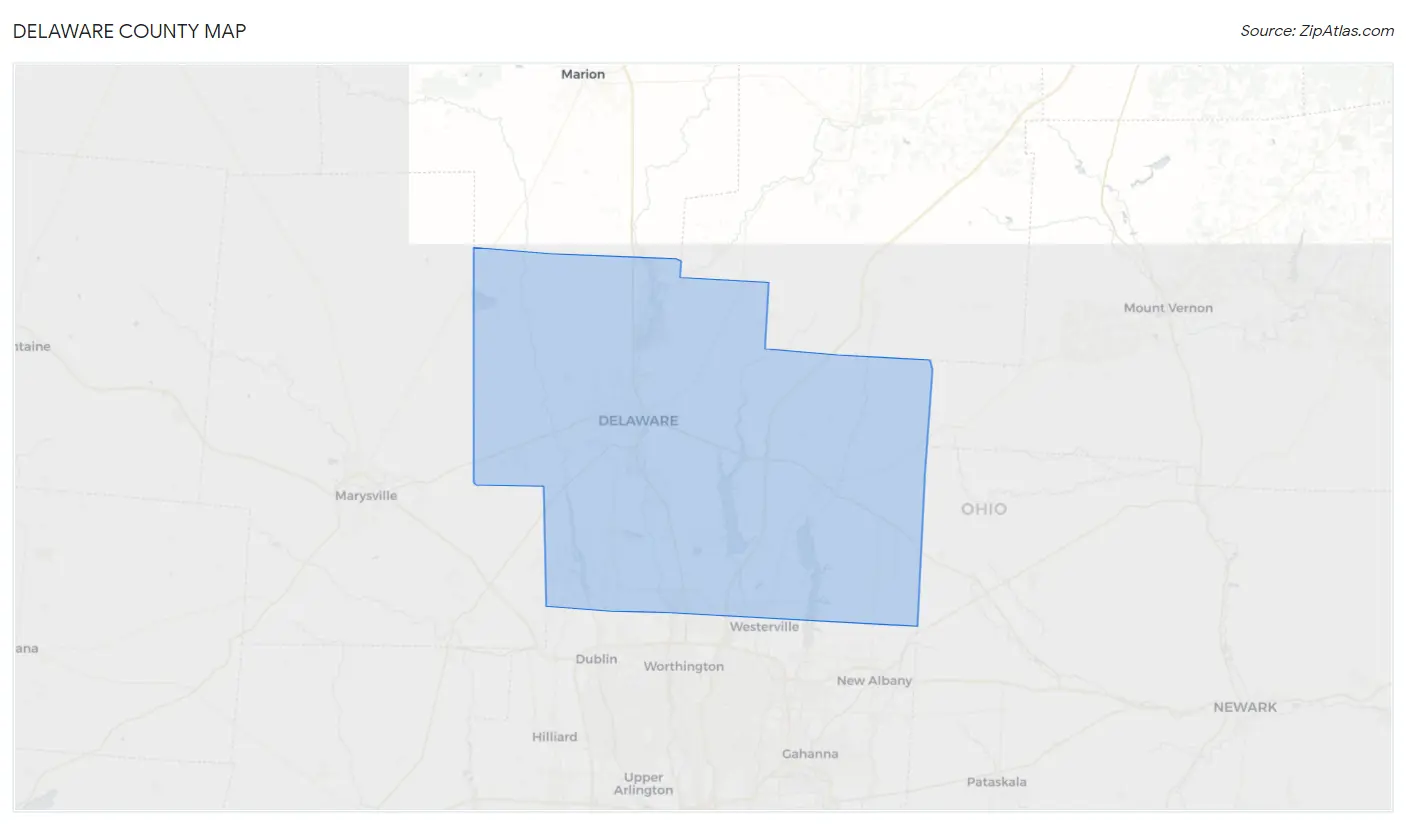
Delaware County Map
Delaware County Overview
216,074
TOTAL POPULATION
108,175
MALE POPULATION
107,899
FEMALE POPULATION
100.26
MALES / 100 FEMALES
99.74
FEMALES / 100 MALES
39.8
MEDIAN AGE
3.1
AVG FAMILY SIZE
2.7
AVG HOUSEHOLD SIZE
$56,963
PER CAPITA INCOME
$146,567
AVG FAMILY INCOME
$123,995
AVG HOUSEHOLD INCOME
39.5%
WAGE / INCOME GAP [ % ]
60.5¢/ $1
WAGE / INCOME GAP [ $ ]
$10,070
FAMILY INCOME DEFICIT
0.41
INEQUALITY / GINI INDEX
118,164
LABOR FORCE [ PEOPLE ]
70.4%
PERCENT IN LABOR FORCE
3.0%
UNEMPLOYMENT RATE
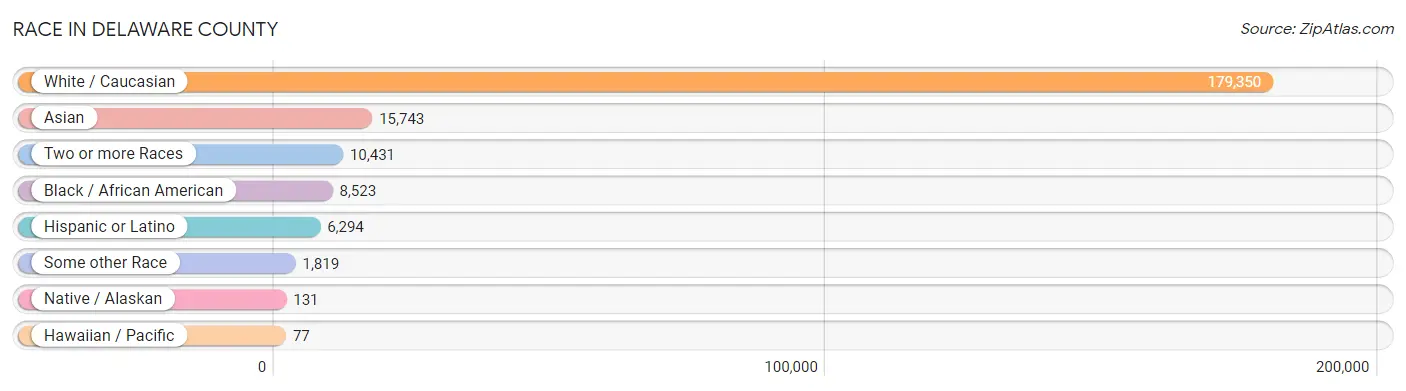
Race in Delaware County
The most populous races in Delaware County are White / Caucasian (179,350 | 83.0%), Asian (15,743 | 7.3%), and Two or more Races (10,431 | 4.8%).
| Race | # Population | % Population |
| Asian | 15,743 | 7.3% |
| Black / African American | 8,523 | 3.9% |
| Hawaiian / Pacific | 77 | 0.0% |
| Hispanic or Latino | 6,294 | 2.9% |
| Native / Alaskan | 131 | 0.1% |
| White / Caucasian | 179,350 | 83.0% |
| Two or more Races | 10,431 | 4.8% |
| Some other Race | 1,819 | 0.8% |
| Total | 216,074 | 100.0% |
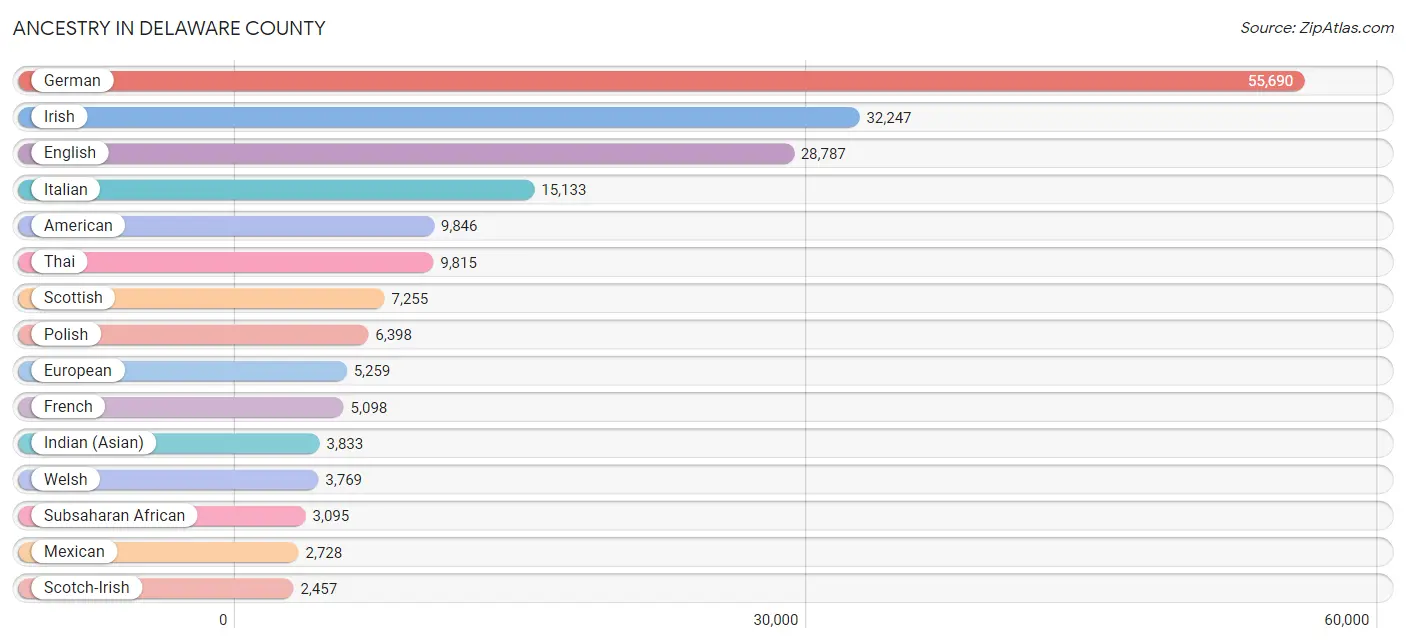
Ancestry in Delaware County
The most populous ancestries reported in Delaware County are German (55,690 | 25.8%), Irish (32,247 | 14.9%), English (28,787 | 13.3%), Italian (15,133 | 7.0%), and American (9,846 | 4.6%), together accounting for 65.6% of all Delaware County residents.
| Ancestry | # Population | % Population |
| African | 713 | 0.3% |
| Alaska Native | 1 | 0.0% |
| Alaskan Athabascan | 6 | 0.0% |
| Albanian | 32 | 0.0% |
| American | 9,846 | 4.6% |
| Apache | 53 | 0.0% |
| Arab | 1,173 | 0.5% |
| Argentinean | 34 | 0.0% |
| Armenian | 67 | 0.0% |
| Australian | 22 | 0.0% |
| Austrian | 466 | 0.2% |
| Belgian | 146 | 0.1% |
| Bhutanese | 937 | 0.4% |
| Blackfeet | 49 | 0.0% |
| Bolivian | 30 | 0.0% |
| Brazilian | 446 | 0.2% |
| British | 1,606 | 0.7% |
| Bulgarian | 121 | 0.1% |
| Burmese | 1,057 | 0.5% |
| Cambodian | 31 | 0.0% |
| Canadian | 767 | 0.4% |
| Celtic | 36 | 0.0% |
| Central American | 597 | 0.3% |
| Central American Indian | 62 | 0.0% |
| Cherokee | 216 | 0.1% |
| Cheyenne | 4 | 0.0% |
| Chilean | 55 | 0.0% |
| Chinese | 10 | 0.0% |
| Chippewa | 21 | 0.0% |
| Colombian | 265 | 0.1% |
| Comanche | 53 | 0.0% |
| Costa Rican | 154 | 0.1% |
| Creek | 2 | 0.0% |
| Croatian | 600 | 0.3% |
| Cuban | 94 | 0.0% |
| Cypriot | 8 | 0.0% |
| Czech | 867 | 0.4% |
| Czechoslovakian | 450 | 0.2% |
| Danish | 289 | 0.1% |
| Dutch | 2,310 | 1.1% |
| Eastern European | 863 | 0.4% |
| Ecuadorian | 73 | 0.0% |
| Egyptian | 137 | 0.1% |
| English | 28,787 | 13.3% |
| Estonian | 7 | 0.0% |
| Ethiopian | 200 | 0.1% |
| European | 5,259 | 2.4% |
| Filipino | 53 | 0.0% |
| Finnish | 354 | 0.2% |
| French | 5,098 | 2.4% |
| French Canadian | 500 | 0.2% |
| German | 55,690 | 25.8% |
| Ghanaian | 282 | 0.1% |
| Greek | 1,767 | 0.8% |
| Guamanian / Chamorro | 24 | 0.0% |
| Guatemalan | 202 | 0.1% |
| Guyanese | 43 | 0.0% |
| Haitian | 12 | 0.0% |
| Honduran | 200 | 0.1% |
| Hungarian | 2,291 | 1.1% |
| Icelander | 158 | 0.1% |
| Indian (Asian) | 3,833 | 1.8% |
| Inupiat | 8 | 0.0% |
| Iranian | 239 | 0.1% |
| Irish | 32,247 | 14.9% |
| Iroquois | 21 | 0.0% |
| Israeli | 19 | 0.0% |
| Italian | 15,133 | 7.0% |
| Jamaican | 75 | 0.0% |
| Japanese | 10 | 0.0% |
| Jordanian | 279 | 0.1% |
| Kenyan | 47 | 0.0% |
| Korean | 1,245 | 0.6% |
| Laotian | 8 | 0.0% |
| Latvian | 58 | 0.0% |
| Lebanese | 261 | 0.1% |
| Lithuanian | 415 | 0.2% |
| Macedonian | 150 | 0.1% |
| Malaysian | 111 | 0.1% |
| Maltese | 27 | 0.0% |
| Mexican | 2,728 | 1.3% |
| Mexican American Indian | 45 | 0.0% |
| Mongolian | 14 | 0.0% |
| Moroccan | 10 | 0.0% |
| Native Hawaiian | 43 | 0.0% |
| Navajo | 3 | 0.0% |
| Nicaraguan | 8 | 0.0% |
| Nigerian | 178 | 0.1% |
| Northern European | 423 | 0.2% |
| Norwegian | 1,628 | 0.7% |
| Pakistani | 40 | 0.0% |
| Palestinian | 84 | 0.0% |
| Panamanian | 24 | 0.0% |
| Pennsylvania German | 56 | 0.0% |
| Peruvian | 306 | 0.1% |
| Polish | 6,398 | 3.0% |
| Portuguese | 123 | 0.1% |
| Puerto Rican | 1,274 | 0.6% |
| Romanian | 449 | 0.2% |
| Russian | 1,118 | 0.5% |
| Salvadoran | 9 | 0.0% |
| Samoan | 45 | 0.0% |
| Scandinavian | 1,249 | 0.6% |
| Scotch-Irish | 2,457 | 1.1% |
| Scottish | 7,255 | 3.4% |
| Seminole | 10 | 0.0% |
| Senegalese | 76 | 0.0% |
| Serbian | 169 | 0.1% |
| Sierra Leonean | 102 | 0.1% |
| Sioux | 14 | 0.0% |
| Slavic | 287 | 0.1% |
| Slovak | 1,589 | 0.7% |
| Slovene | 264 | 0.1% |
| Somali | 719 | 0.3% |
| South African | 6 | 0.0% |
| South American | 971 | 0.4% |
| Spaniard | 167 | 0.1% |
| Spanish | 124 | 0.1% |
| Sri Lankan | 1,168 | 0.5% |
| Subsaharan African | 3,095 | 1.4% |
| Sudanese | 108 | 0.1% |
| Swedish | 2,316 | 1.1% |
| Swiss | 1,597 | 0.7% |
| Syrian | 130 | 0.1% |
| Thai | 9,815 | 4.5% |
| Tongan | 30 | 0.0% |
| Turkish | 236 | 0.1% |
| Ukrainian | 553 | 0.3% |
| Uruguayan | 25 | 0.0% |
| Venezuelan | 183 | 0.1% |
| Vietnamese | 94 | 0.0% |
| Welsh | 3,769 | 1.7% |
| West Indian | 113 | 0.1% |
| Yugoslavian | 232 | 0.1% |
| Zimbabwean | 3 | 0.0% | View All 135 Rows |
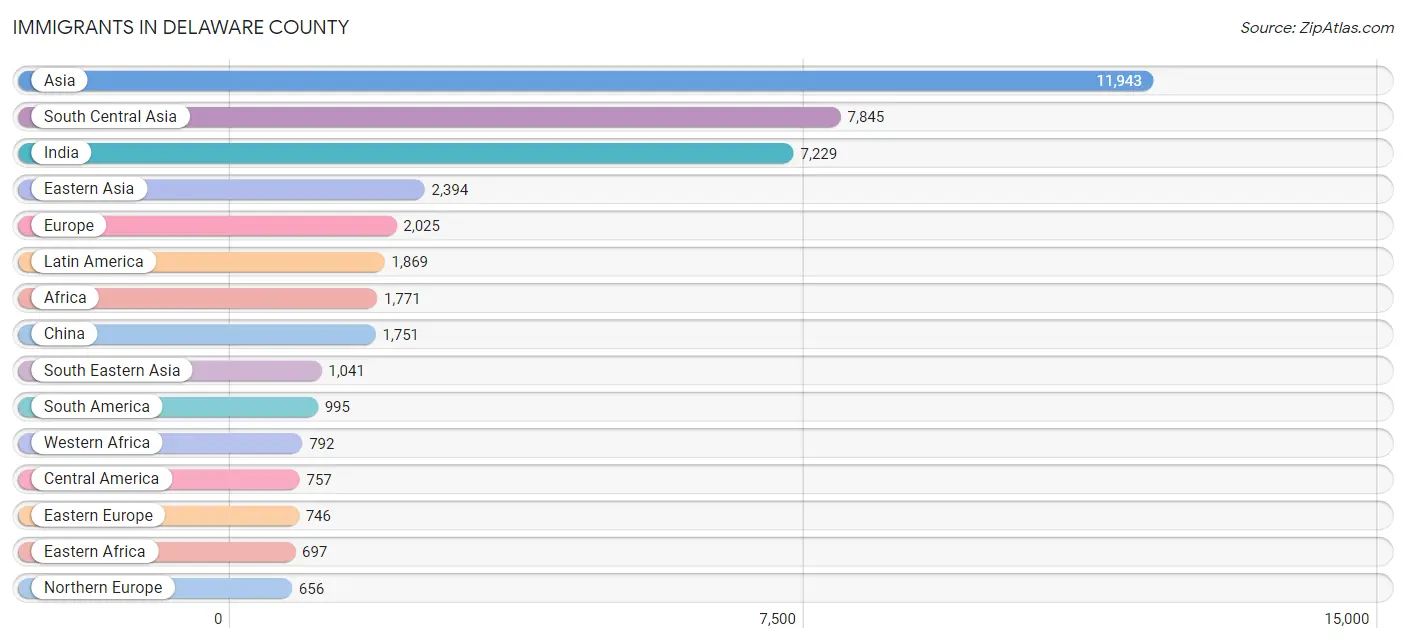
Immigrants in Delaware County
The most numerous immigrant groups reported in Delaware County came from Asia (11,943 | 5.5%), South Central Asia (7,845 | 3.6%), India (7,229 | 3.4%), Eastern Asia (2,394 | 1.1%), and Europe (2,025 | 0.9%), together accounting for 14.6% of all Delaware County residents.
| Immigration Origin | # Population | % Population |
| Africa | 1,771 | 0.8% |
| Albania | 24 | 0.0% |
| Argentina | 22 | 0.0% |
| Armenia | 29 | 0.0% |
| Asia | 11,943 | 5.5% |
| Australia | 11 | 0.0% |
| Austria | 54 | 0.0% |
| Bangladesh | 32 | 0.0% |
| Belarus | 17 | 0.0% |
| Belize | 33 | 0.0% |
| Brazil | 626 | 0.3% |
| Bulgaria | 33 | 0.0% |
| Cambodia | 29 | 0.0% |
| Cameroon | 45 | 0.0% |
| Canada | 604 | 0.3% |
| Caribbean | 117 | 0.1% |
| Central America | 757 | 0.4% |
| China | 1,751 | 0.8% |
| Colombia | 144 | 0.1% |
| Costa Rica | 61 | 0.0% |
| Croatia | 25 | 0.0% |
| Cuba | 39 | 0.0% |
| Czechoslovakia | 44 | 0.0% |
| Dominican Republic | 5 | 0.0% |
| Eastern Africa | 697 | 0.3% |
| Eastern Asia | 2,394 | 1.1% |
| Eastern Europe | 746 | 0.4% |
| Ecuador | 34 | 0.0% |
| Egypt | 77 | 0.0% |
| El Salvador | 16 | 0.0% |
| England | 268 | 0.1% |
| Eritrea | 69 | 0.0% |
| Ethiopia | 44 | 0.0% |
| Europe | 2,025 | 0.9% |
| France | 149 | 0.1% |
| Germany | 190 | 0.1% |
| Ghana | 256 | 0.1% |
| Greece | 66 | 0.0% |
| Guatemala | 73 | 0.0% |
| Honduras | 96 | 0.0% |
| Hong Kong | 143 | 0.1% |
| Hungary | 4 | 0.0% |
| India | 7,229 | 3.4% |
| Indonesia | 52 | 0.0% |
| Iran | 136 | 0.1% |
| Ireland | 97 | 0.0% |
| Israel | 46 | 0.0% |
| Italy | 95 | 0.0% |
| Jamaica | 16 | 0.0% |
| Japan | 213 | 0.1% |
| Jordan | 246 | 0.1% |
| Kenya | 49 | 0.0% |
| Korea | 420 | 0.2% |
| Laos | 57 | 0.0% |
| Latin America | 1,869 | 0.9% |
| Latvia | 10 | 0.0% |
| Liberia | 20 | 0.0% |
| Lithuania | 78 | 0.0% |
| Malaysia | 6 | 0.0% |
| Mexico | 469 | 0.2% |
| Middle Africa | 78 | 0.0% |
| Nepal | 63 | 0.0% |
| Netherlands | 30 | 0.0% |
| Nigeria | 87 | 0.0% |
| North Macedonia | 2 | 0.0% |
| Northern Africa | 185 | 0.1% |
| Northern Europe | 656 | 0.3% |
| Oceania | 66 | 0.0% |
| Pakistan | 285 | 0.1% |
| Panama | 9 | 0.0% |
| Peru | 82 | 0.0% |
| Philippines | 429 | 0.2% |
| Poland | 67 | 0.0% |
| Romania | 111 | 0.1% |
| Russia | 268 | 0.1% |
| Scotland | 26 | 0.0% |
| Senegal | 24 | 0.0% |
| Sierra Leone | 77 | 0.0% |
| Singapore | 9 | 0.0% |
| Somalia | 406 | 0.2% |
| South Africa | 17 | 0.0% |
| South America | 995 | 0.5% |
| South Central Asia | 7,845 | 3.6% |
| South Eastern Asia | 1,041 | 0.5% |
| Southern Europe | 200 | 0.1% |
| Spain | 39 | 0.0% |
| Sri Lanka | 83 | 0.0% |
| Sudan | 108 | 0.1% |
| Sweden | 68 | 0.0% |
| Syria | 8 | 0.0% |
| Taiwan | 40 | 0.0% |
| Thailand | 16 | 0.0% |
| Trinidad and Tobago | 57 | 0.0% |
| Turkey | 211 | 0.1% |
| Ukraine | 31 | 0.0% |
| Uzbekistan | 17 | 0.0% |
| Venezuela | 87 | 0.0% |
| Vietnam | 443 | 0.2% |
| Western Africa | 792 | 0.4% |
| Western Asia | 607 | 0.3% |
| Western Europe | 423 | 0.2% |
| Zaire | 17 | 0.0% |
| Zimbabwe | 15 | 0.0% | View All 103 Rows |
Sex and Age in Delaware County
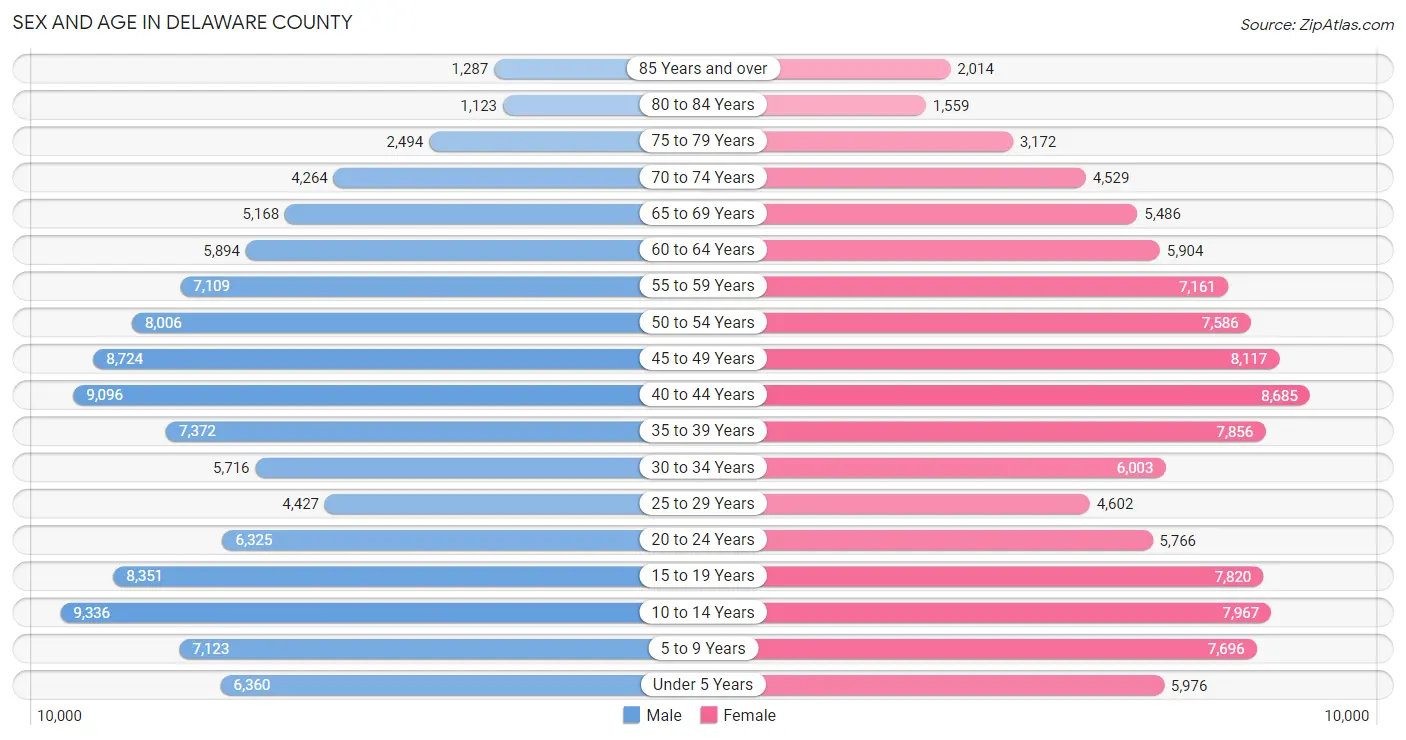
Sex and Age in Delaware County
The most populous age groups in Delaware County are 10 to 14 Years (9,336 | 8.6%) for men and 40 to 44 Years (8,685 | 8.1%) for women.
| Age Bracket | Male | Female |
| Under 5 Years | 6,360 (5.9%) | 5,976 (5.5%) |
| 5 to 9 Years | 7,123 (6.6%) | 7,696 (7.1%) |
| 10 to 14 Years | 9,336 (8.6%) | 7,967 (7.4%) |
| 15 to 19 Years | 8,351 (7.7%) | 7,820 (7.2%) |
| 20 to 24 Years | 6,325 (5.9%) | 5,766 (5.3%) |
| 25 to 29 Years | 4,427 (4.1%) | 4,602 (4.3%) |
| 30 to 34 Years | 5,716 (5.3%) | 6,003 (5.6%) |
| 35 to 39 Years | 7,372 (6.8%) | 7,856 (7.3%) |
| 40 to 44 Years | 9,096 (8.4%) | 8,685 (8.1%) |
| 45 to 49 Years | 8,724 (8.1%) | 8,117 (7.5%) |
| 50 to 54 Years | 8,006 (7.4%) | 7,586 (7.0%) |
| 55 to 59 Years | 7,109 (6.6%) | 7,161 (6.6%) |
| 60 to 64 Years | 5,894 (5.4%) | 5,904 (5.5%) |
| 65 to 69 Years | 5,168 (4.8%) | 5,486 (5.1%) |
| 70 to 74 Years | 4,264 (3.9%) | 4,529 (4.2%) |
| 75 to 79 Years | 2,494 (2.3%) | 3,172 (2.9%) |
| 80 to 84 Years | 1,123 (1.0%) | 1,559 (1.4%) |
| 85 Years and over | 1,287 (1.2%) | 2,014 (1.9%) |
| Total | 108,175 (100.0%) | 107,899 (100.0%) |
Families and Households in Delaware County
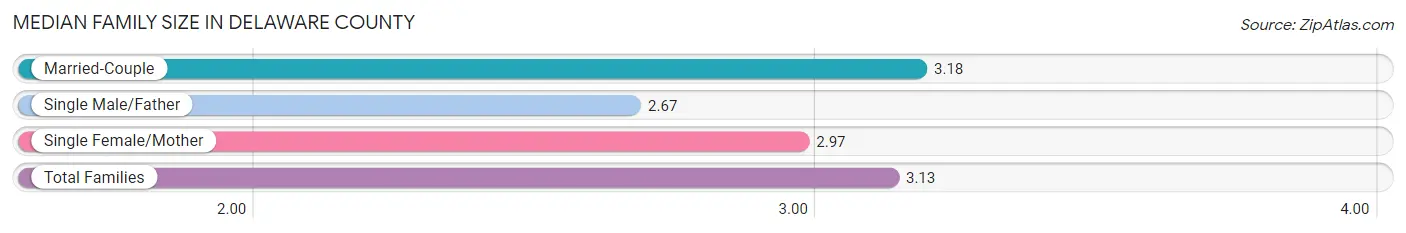
Median Family Size in Delaware County
The median family size in Delaware County is 3.13 persons per family, with married-couple families (50,652 | 84.6%) accounting for the largest median family size of 3.18 persons per family. On the other hand, single male/father families (3,094 | 5.2%) represent the smallest median family size with 2.67 persons per family.
| Family Type | # Families | Family Size |
| Married-Couple | 50,652 (84.6%) | 3.18 |
| Single Male/Father | 3,094 (5.2%) | 2.67 |
| Single Female/Mother | 6,105 (10.2%) | 2.97 |
| Total Families | 59,851 (100.0%) | 3.13 |
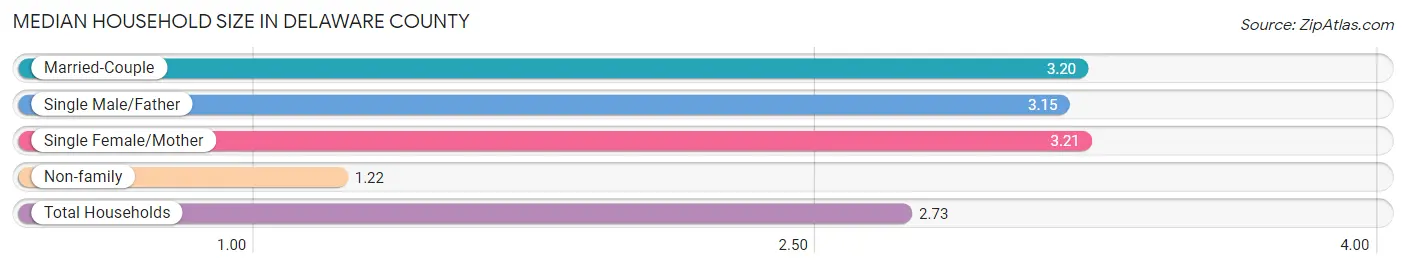
Median Household Size in Delaware County
The median household size in Delaware County is 2.73 persons per household, with single female/mother households (6,105 | 7.8%) accounting for the largest median household size of 3.21 persons per household. non-family households (18,605 | 23.7%) represent the smallest median household size with 1.22 persons per household.
| Household Type | # Households | Household Size |
| Married-Couple | 50,652 (64.6%) | 3.20 |
| Single Male/Father | 3,094 (3.9%) | 3.15 |
| Single Female/Mother | 6,105 (7.8%) | 3.21 |
| Non-family | 18,605 (23.7%) | 1.22 |
| Total Households | 78,456 (100.0%) | 2.73 |
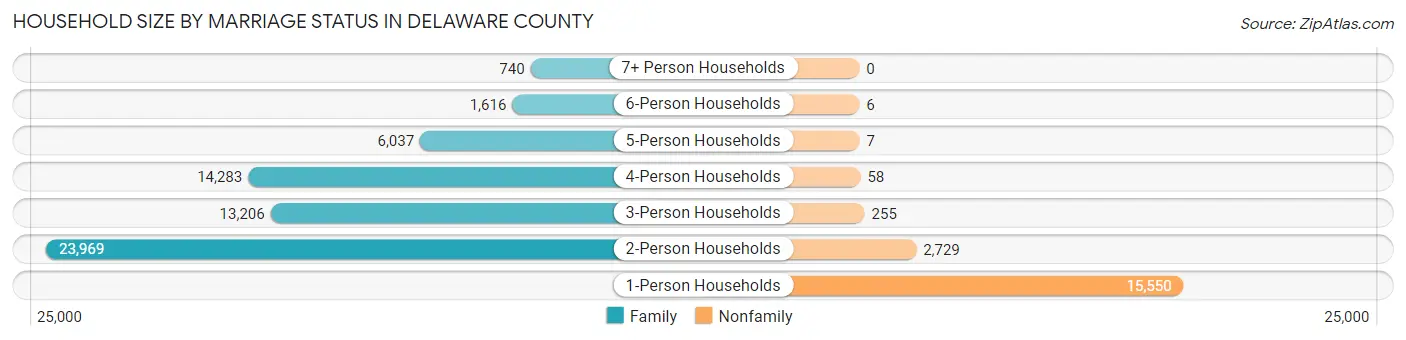
Household Size by Marriage Status in Delaware County
Out of a total of 78,456 households in Delaware County, 59,851 (76.3%) are family households, while 18,605 (23.7%) are nonfamily households. The most numerous type of family households are 2-person households, comprising 23,969, and the most common type of nonfamily households are 1-person households, comprising 15,550.
| Household Size | Family Households | Nonfamily Households |
| 1-Person Households | - | 15,550 (19.8%) |
| 2-Person Households | 23,969 (30.5%) | 2,729 (3.5%) |
| 3-Person Households | 13,206 (16.8%) | 255 (0.3%) |
| 4-Person Households | 14,283 (18.2%) | 58 (0.1%) |
| 5-Person Households | 6,037 (7.7%) | 7 (0.0%) |
| 6-Person Households | 1,616 (2.1%) | 6 (0.0%) |
| 7+ Person Households | 740 (0.9%) | 0 (0.0%) |
| Total | 59,851 (76.3%) | 18,605 (23.7%) |
Female Fertility in Delaware County
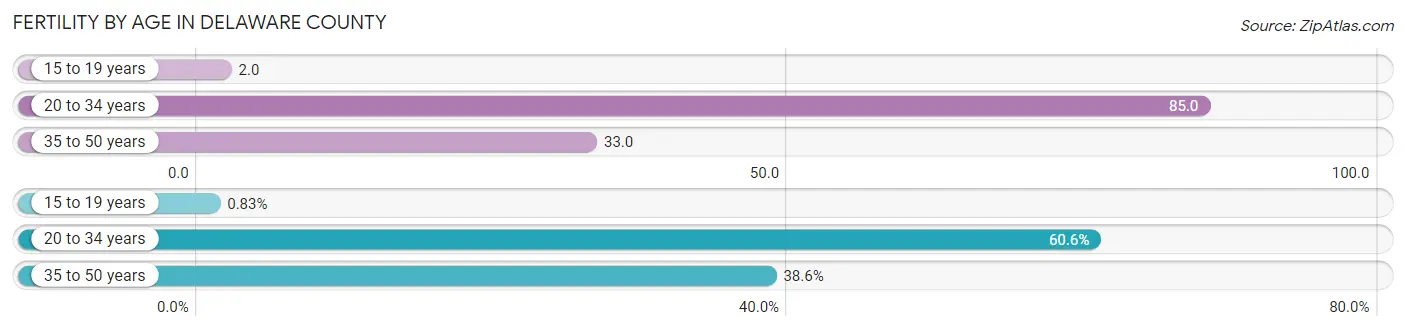
Fertility by Age in Delaware County
Average fertility rate in Delaware County is 45.0 births per 1,000 women. Women in the age bracket of 20 to 34 years have the highest fertility rate with 85.0 births per 1,000 women. Women in the age bracket of 20 to 34 years acount for 60.6% of all women with births.
| Age Bracket | Women with Births | Births / 1,000 Women |
| 15 to 19 years | 19 (0.8%) | 2.0 |
| 20 to 34 years | 1,395 (60.6%) | 85.0 |
| 35 to 50 years | 888 (38.6%) | 33.0 |
| Total | 2,302 (100.0%) | 45.0 |
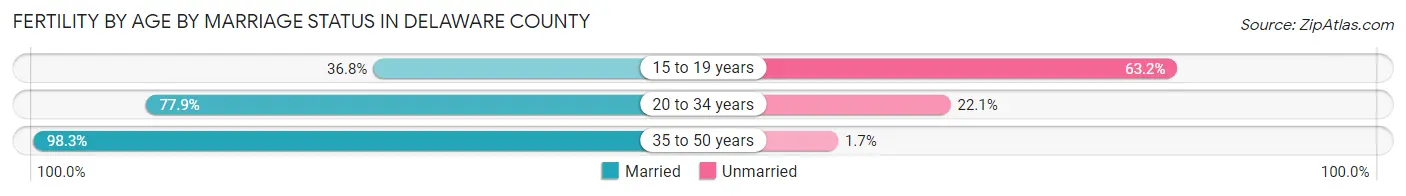
Fertility by Age by Marriage Status in Delaware County
85.4% of women with births (2,302) in Delaware County are married. The highest percentage of unmarried women with births falls into 15 to 19 years age bracket with 63.2% of them unmarried at the time of birth, while the lowest percentage of unmarried women with births belong to 35 to 50 years age bracket with 1.7% of them unmarried.
| Age Bracket | Married | Unmarried |
| 15 to 19 years | 7 (36.8%) | 12 (63.2%) |
| 20 to 34 years | 1,087 (77.9%) | 308 (22.1%) |
| 35 to 50 years | 873 (98.3%) | 15 (1.7%) |
| Total | 1,966 (85.4%) | 336 (14.6%) |
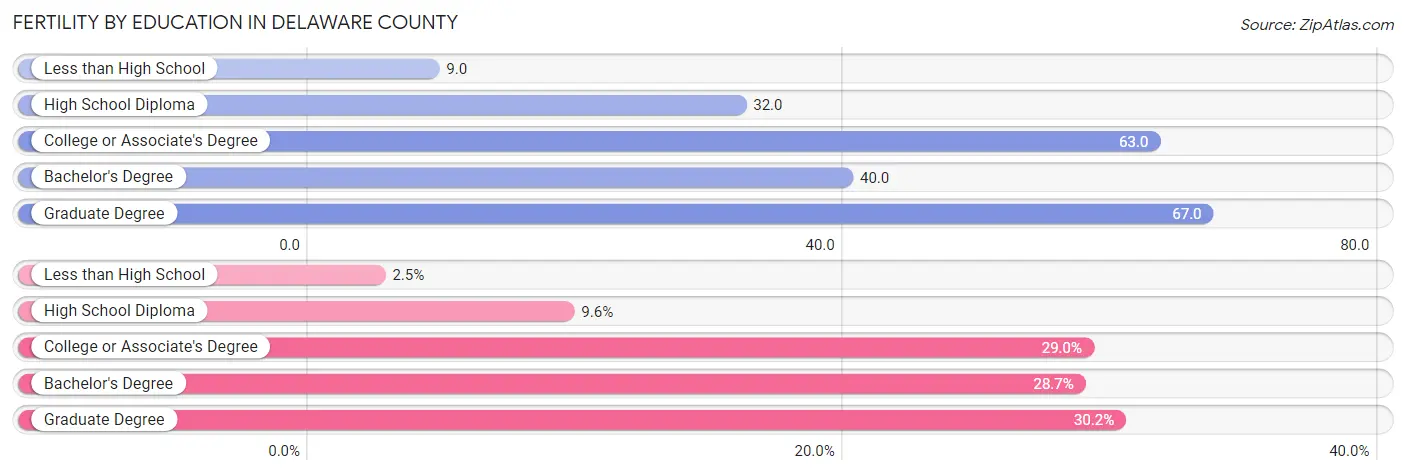
Fertility by Education in Delaware County
Average fertility rate in Delaware County is 45.0 births per 1,000 women. Women with the education attainment of graduate degree have the highest fertility rate of 67.0 births per 1,000 women, while women with the education attainment of less than high school have the lowest fertility at 9.0 births per 1,000 women. Women with the education attainment of graduate degree represent 30.2% of all women with births.
| Educational Attainment | Women with Births | Births / 1,000 Women |
| Less than High School | 57 (2.5%) | 9.0 |
| High School Diploma | 220 (9.6%) | 32.0 |
| College or Associate's Degree | 668 (29.0%) | 63.0 |
| Bachelor's Degree | 661 (28.7%) | 40.0 |
| Graduate Degree | 696 (30.2%) | 67.0 |
| Total | 2,302 (100.0%) | 45.0 |
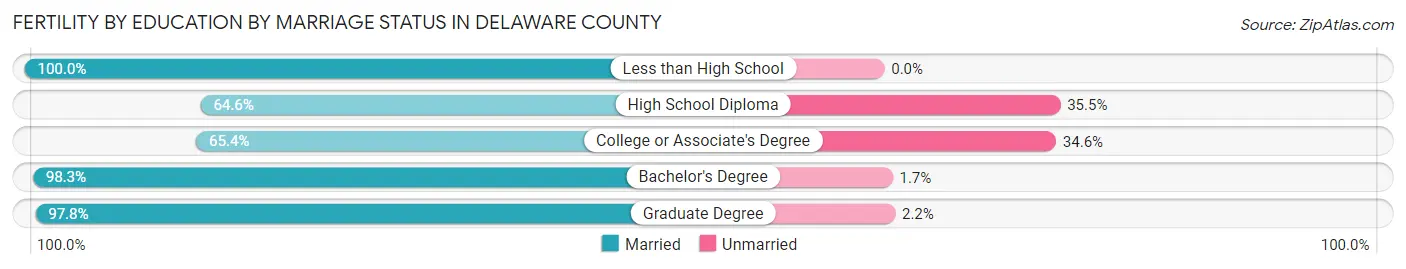
Fertility by Education by Marriage Status in Delaware County
14.6% of women with births in Delaware County are unmarried. Women with the educational attainment of less than high school are most likely to be married with 100.0% of them married at childbirth, while women with the educational attainment of high school diploma are least likely to be married with 35.4% of them unmarried at childbirth.
| Educational Attainment | Married | Unmarried |
| Less than High School | 57 (100.0%) | 0 (0.0%) |
| High School Diploma | 142 (64.5%) | 78 (35.4%) |
| College or Associate's Degree | 437 (65.4%) | 231 (34.6%) |
| Bachelor's Degree | 650 (98.3%) | 11 (1.7%) |
| Graduate Degree | 681 (97.8%) | 15 (2.2%) |
| Total | 1,966 (85.4%) | 336 (14.6%) |
Income in Delaware County
Income Overview in Delaware County
Per Capita Income in Delaware County is $56,963, while median incomes of families and households are $146,567 and $123,995 respectively.
| Characteristic | Number | Measure |
| Per Capita Income | 216,074 | $56,963 |
| Median Family Income | 59,851 | $146,567 |
| Mean Family Income | 59,851 | $174,637 |
| Median Household Income | 78,456 | $123,995 |
| Mean Household Income | 78,456 | $154,569 |
| Income Deficit | 59,851 | $10,070 |
| Wage / Income Gap (%) | 216,074 | 39.49% |
| Wage / Income Gap ($) | 216,074 | 60.51¢ per $1 |
| Gini / Inequality Index | 216,074 | 0.41 |
Earnings by Sex in Delaware County
Average Earnings in Delaware County are $61,903, $77,479 for men and $46,884 for women, a difference of 39.5%.
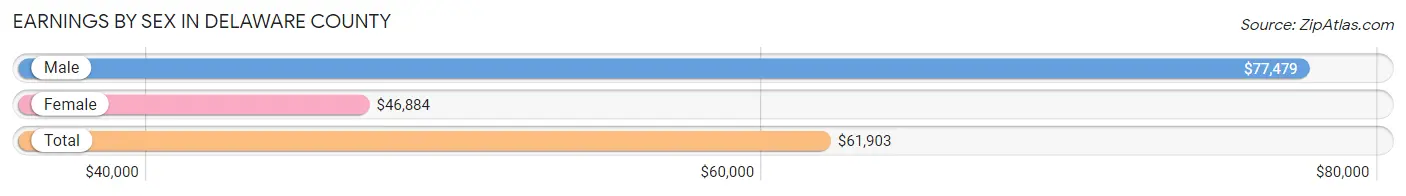
| Sex | Number | Average Earnings |
| Male | 67,191 (53.8%) | $77,479 |
| Female | 57,640 (46.2%) | $46,884 |
| Total | 124,831 (100.0%) | $61,903 |
Earnings by Sex by Income Bracket in Delaware County
The most common earnings brackets in Delaware County are $100,000+ for men (25,725 | 38.3%) and $100,000+ for women (10,949 | 19.0%).
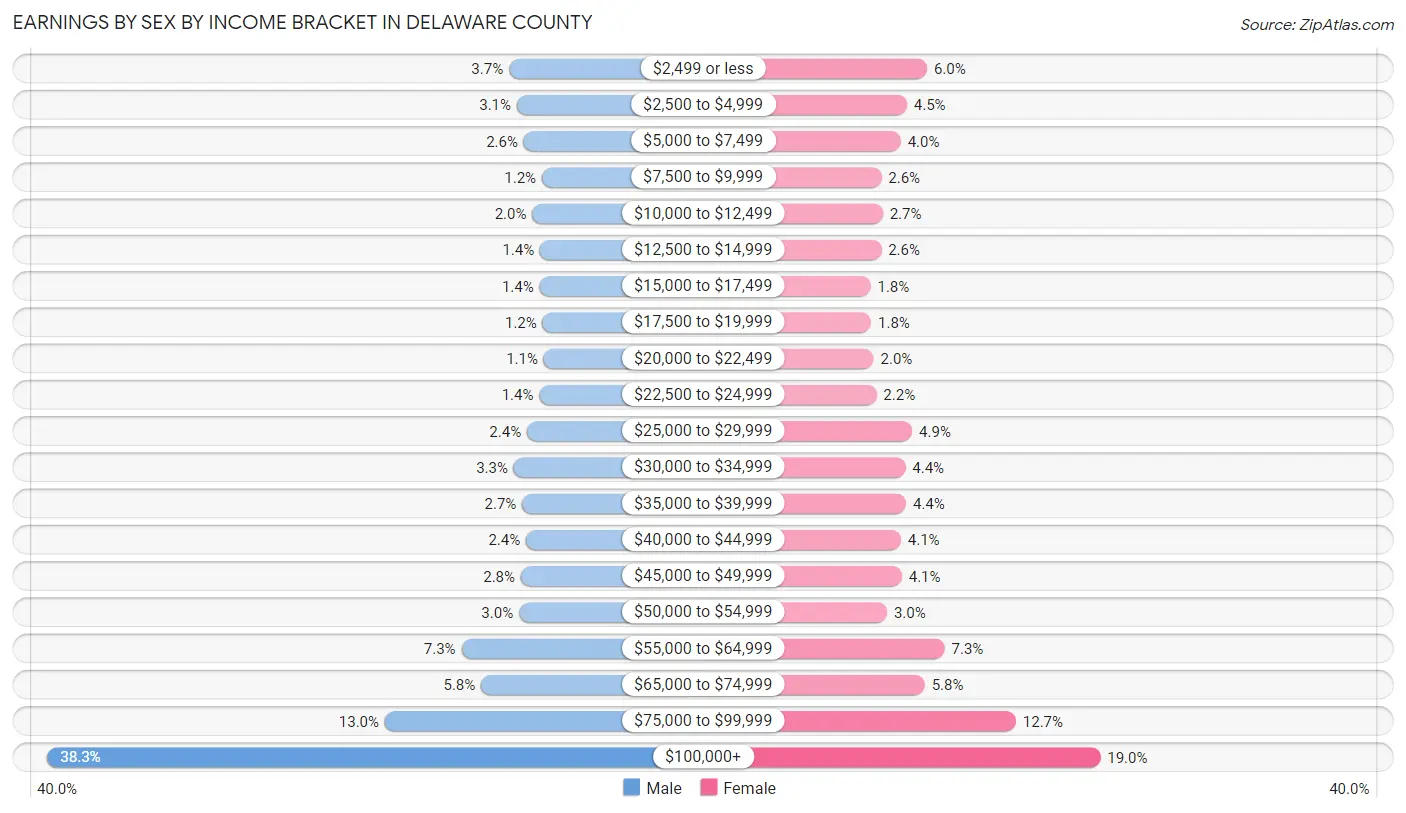
| Income | Male | Female |
| $2,499 or less | 2,483 (3.7%) | 3,466 (6.0%) |
| $2,500 to $4,999 | 2,087 (3.1%) | 2,594 (4.5%) |
| $5,000 to $7,499 | 1,742 (2.6%) | 2,326 (4.0%) |
| $7,500 to $9,999 | 829 (1.2%) | 1,490 (2.6%) |
| $10,000 to $12,499 | 1,311 (1.9%) | 1,550 (2.7%) |
| $12,500 to $14,999 | 922 (1.4%) | 1,487 (2.6%) |
| $15,000 to $17,499 | 945 (1.4%) | 1,028 (1.8%) |
| $17,500 to $19,999 | 795 (1.2%) | 1,051 (1.8%) |
| $20,000 to $22,499 | 730 (1.1%) | 1,160 (2.0%) |
| $22,500 to $24,999 | 964 (1.4%) | 1,278 (2.2%) |
| $25,000 to $29,999 | 1,582 (2.4%) | 2,826 (4.9%) |
| $30,000 to $34,999 | 2,246 (3.3%) | 2,532 (4.4%) |
| $35,000 to $39,999 | 1,822 (2.7%) | 2,560 (4.4%) |
| $40,000 to $44,999 | 1,629 (2.4%) | 2,337 (4.1%) |
| $45,000 to $49,999 | 1,889 (2.8%) | 2,377 (4.1%) |
| $50,000 to $54,999 | 1,985 (2.9%) | 1,734 (3.0%) |
| $55,000 to $64,999 | 4,879 (7.3%) | 4,223 (7.3%) |
| $65,000 to $74,999 | 3,890 (5.8%) | 3,368 (5.8%) |
| $75,000 to $99,999 | 8,736 (13.0%) | 7,304 (12.7%) |
| $100,000+ | 25,725 (38.3%) | 10,949 (19.0%) |
| Total | 67,191 (100.0%) | 57,640 (100.0%) |
Earnings by Sex by Educational Attainment in Delaware County
Average earnings in Delaware County are $91,802 for men and $57,527 for women, a difference of 37.3%. Men with an educational attainment of graduate degree enjoy the highest average annual earnings of $122,070, while those with less than high school education earn the least with $31,473. Women with an educational attainment of graduate degree earn the most with the average annual earnings of $85,831, while those with high school diploma education have the smallest earnings of $34,336.
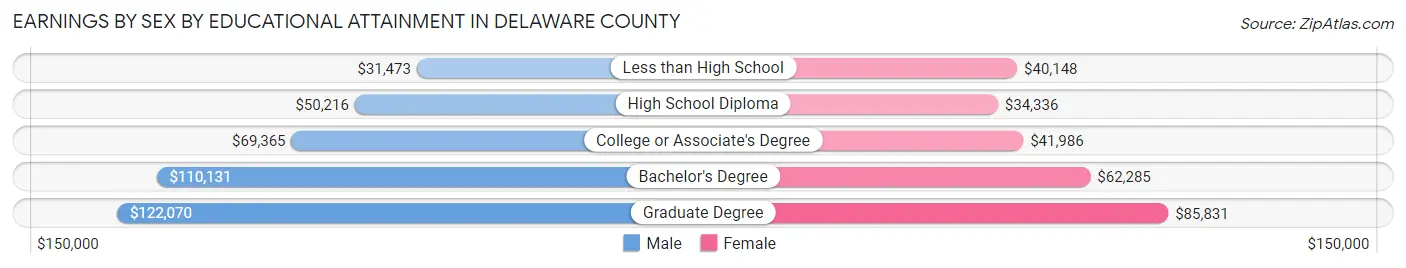
| Educational Attainment | Male Income | Female Income |
| Less than High School | $31,473 | $40,148 |
| High School Diploma | $50,216 | $34,336 |
| College or Associate's Degree | $69,365 | $41,986 |
| Bachelor's Degree | $110,131 | $62,285 |
| Graduate Degree | $122,070 | $85,831 |
| Total | $91,802 | $57,527 |
Family Income in Delaware County
Family Income Brackets in Delaware County
According to the Delaware County family income data, there are 18,015 families falling into the $200,000+ income range, which is the most common income bracket and makes up 30.1% of all families. Conversely, the $10,000 to $14,999 income bracket is the least frequent group with only 299 families (0.5%) belonging to this category.
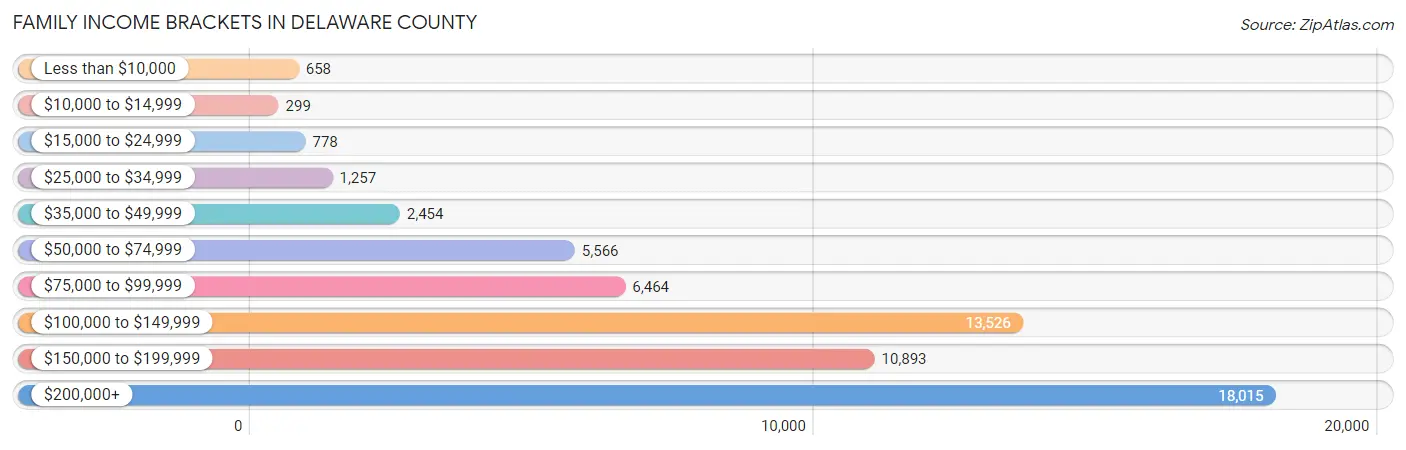
| Income Bracket | # Families | % Families |
| Less than $10,000 | 658 | 1.1% |
| $10,000 to $14,999 | 299 | 0.5% |
| $15,000 to $24,999 | 778 | 1.3% |
| $25,000 to $34,999 | 1,257 | 2.1% |
| $35,000 to $49,999 | 2,454 | 4.1% |
| $50,000 to $74,999 | 5,566 | 9.3% |
| $75,000 to $99,999 | 6,464 | 10.8% |
| $100,000 to $149,999 | 13,526 | 22.6% |
| $150,000 to $199,999 | 10,893 | 18.2% |
| $200,000+ | 18,015 | 30.1% |
Family Income by Famaliy Size in Delaware County
7+ person families (694 | 1.2%) account for the highest median family income in Delaware County with $208,311 per family, while 2-person families (25,277 | 42.2%) have the highest median income of $56,030 per family member.
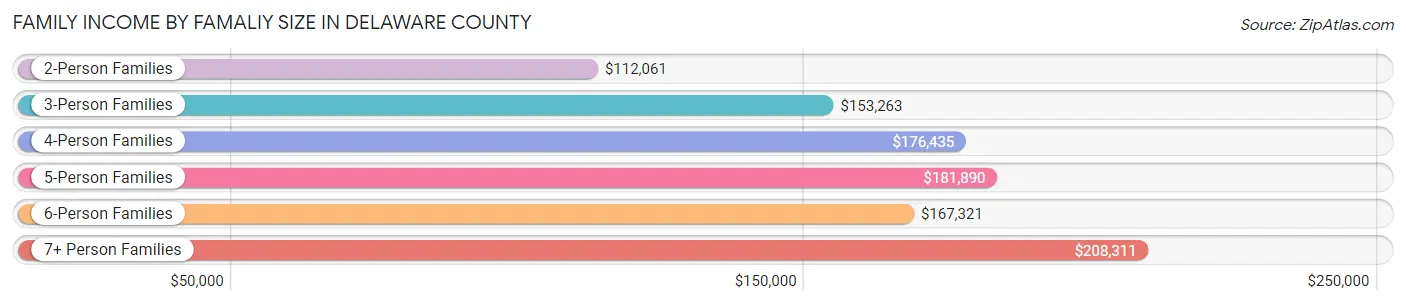
| Income Bracket | # Families | Median Income |
| 2-Person Families | 25,277 (42.2%) | $112,061 |
| 3-Person Families | 12,838 (21.4%) | $153,263 |
| 4-Person Families | 13,978 (23.4%) | $176,435 |
| 5-Person Families | 5,651 (9.4%) | $181,890 |
| 6-Person Families | 1,413 (2.4%) | $167,321 |
| 7+ Person Families | 694 (1.2%) | $208,311 |
| Total | 59,851 (100.0%) | $146,567 |
Family Income by Number of Earners in Delaware County
The median family income in Delaware County is $146,567, with families comprising 3+ earners (7,122) having the highest median family income of $195,056, while families with no earners (6,129) have the lowest median family income of $72,594, accounting for 11.9% and 10.2% of families, respectively.
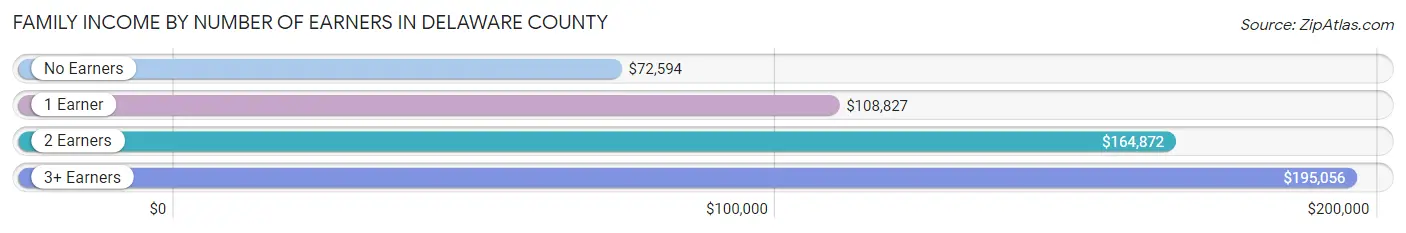
| Number of Earners | # Families | Median Income |
| No Earners | 6,129 (10.2%) | $72,594 |
| 1 Earner | 15,616 (26.1%) | $108,827 |
| 2 Earners | 30,984 (51.8%) | $164,872 |
| 3+ Earners | 7,122 (11.9%) | $195,056 |
| Total | 59,851 (100.0%) | $146,567 |
Household Income in Delaware County
Household Income Brackets in Delaware County
With 19,536 households falling in the category, the $200,000+ income range is the most frequent in Delaware County, accounting for 24.9% of all households. In contrast, only 1,098 households (1.4%) fall into the $10,000 to $14,999 income bracket, making it the least populous group.
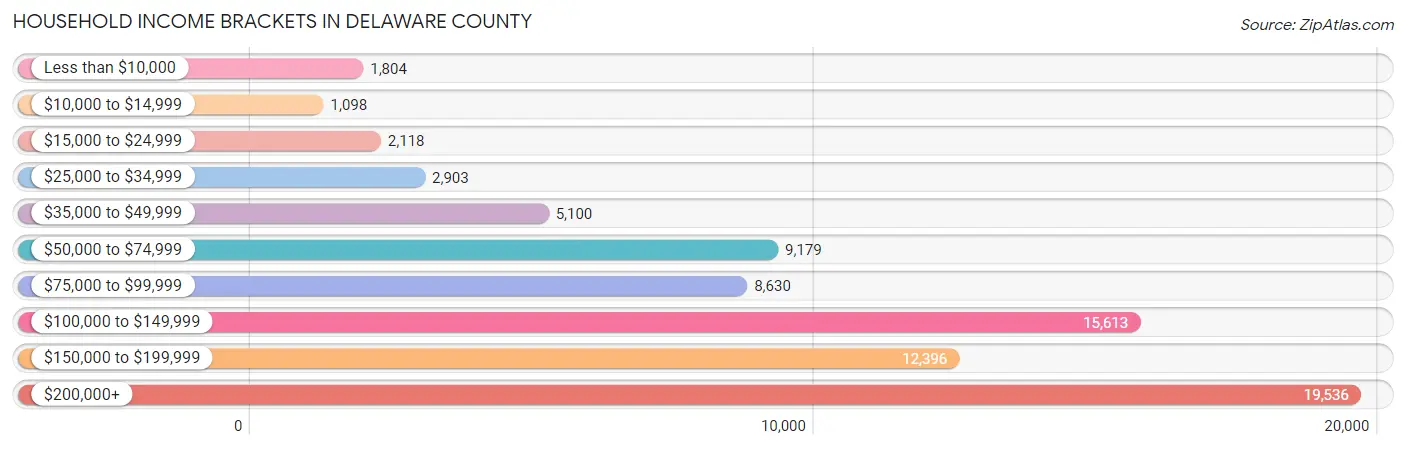
| Income Bracket | # Households | % Households |
| Less than $10,000 | 1,804 | 2.3% |
| $10,000 to $14,999 | 1,098 | 1.4% |
| $15,000 to $24,999 | 2,118 | 2.7% |
| $25,000 to $34,999 | 2,903 | 3.7% |
| $35,000 to $49,999 | 5,100 | 6.5% |
| $50,000 to $74,999 | 9,179 | 11.7% |
| $75,000 to $99,999 | 8,630 | 11.0% |
| $100,000 to $149,999 | 15,613 | 19.9% |
| $150,000 to $199,999 | 12,396 | 15.8% |
| $200,000+ | 19,536 | 24.9% |
Household Income by Householder Age in Delaware County
The median household income in Delaware County is $123,995, with the highest median household income of $152,503 found in the 45 to 64 years age bracket for the primary householder. A total of 32,227 households (41.1%) fall into this category. Meanwhile, the 15 to 24 years age bracket for the primary householder has the lowest median household income of $55,603, with 1,900 households (2.4%) in this group.
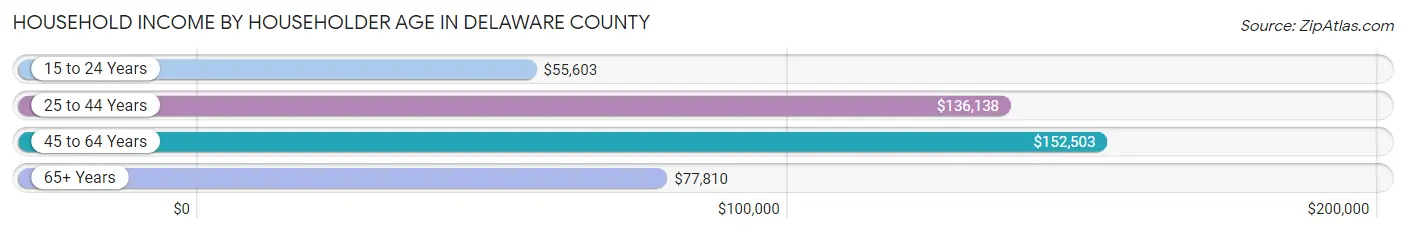
| Income Bracket | # Households | Median Income |
| 15 to 24 Years | 1,900 (2.4%) | $55,603 |
| 25 to 44 Years | 25,682 (32.7%) | $136,138 |
| 45 to 64 Years | 32,227 (41.1%) | $152,503 |
| 65+ Years | 18,647 (23.8%) | $77,810 |
| Total | 78,456 (100.0%) | $123,995 |
Poverty in Delaware County
Income Below Poverty by Sex and Age in Delaware County
With 4.0% poverty level for males and 5.1% for females among the residents of Delaware County, under 5 year old males and 25 to 34 year old females are the most vulnerable to poverty, with 576 males (9.2%) and 996 females (9.4%) in their respective age groups living below the poverty level.
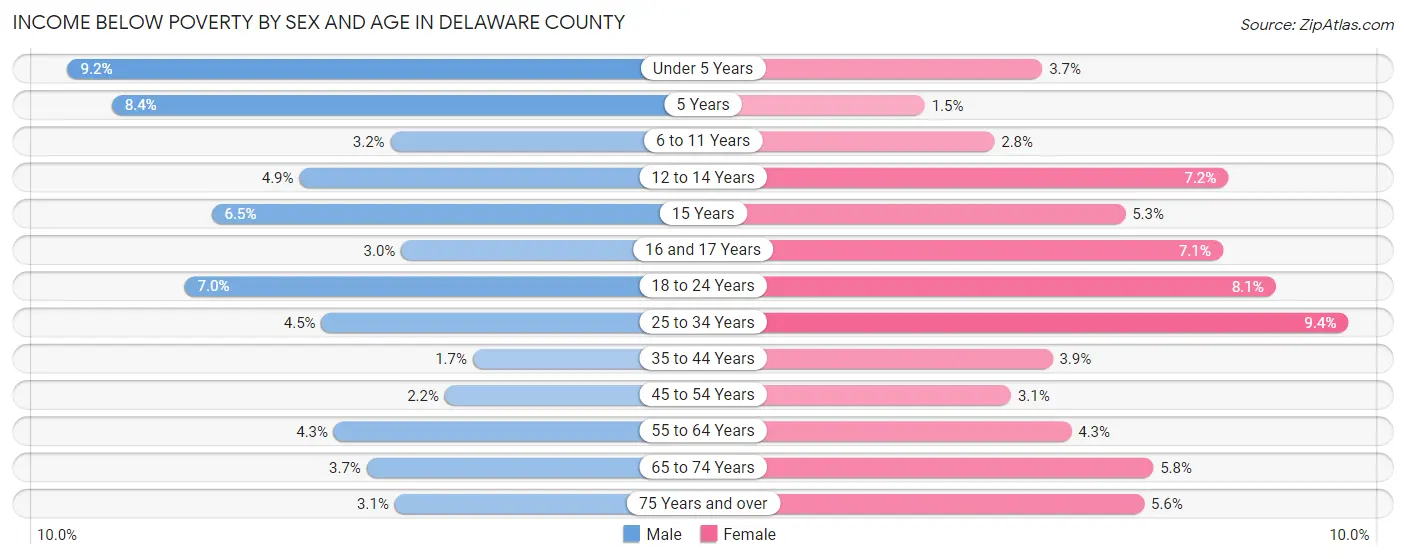
| Age Bracket | Male | Female |
| Under 5 Years | 576 (9.2%) | 220 (3.7%) |
| 5 Years | 104 (8.4%) | 23 (1.5%) |
| 6 to 11 Years | 297 (3.2%) | 261 (2.8%) |
| 12 to 14 Years | 285 (4.9%) | 336 (7.2%) |
| 15 Years | 120 (6.5%) | 101 (5.3%) |
| 16 and 17 Years | 104 (3.0%) | 223 (7.1%) |
| 18 to 24 Years | 608 (7.0%) | 633 (8.1%) |
| 25 to 34 Years | 454 (4.5%) | 996 (9.4%) |
| 35 to 44 Years | 276 (1.7%) | 646 (3.9%) |
| 45 to 54 Years | 368 (2.2%) | 493 (3.1%) |
| 55 to 64 Years | 554 (4.3%) | 555 (4.3%) |
| 65 to 74 Years | 343 (3.6%) | 575 (5.8%) |
| 75 Years and over | 152 (3.1%) | 365 (5.6%) |
| Total | 4,241 (4.0%) | 5,427 (5.1%) |
Income Above Poverty by Sex and Age in Delaware County
According to the poverty statistics in Delaware County, males aged 35 to 44 years and females aged 5 years are the age groups that are most secure financially, with 98.3% of males and 98.5% of females in these age groups living above the poverty line.
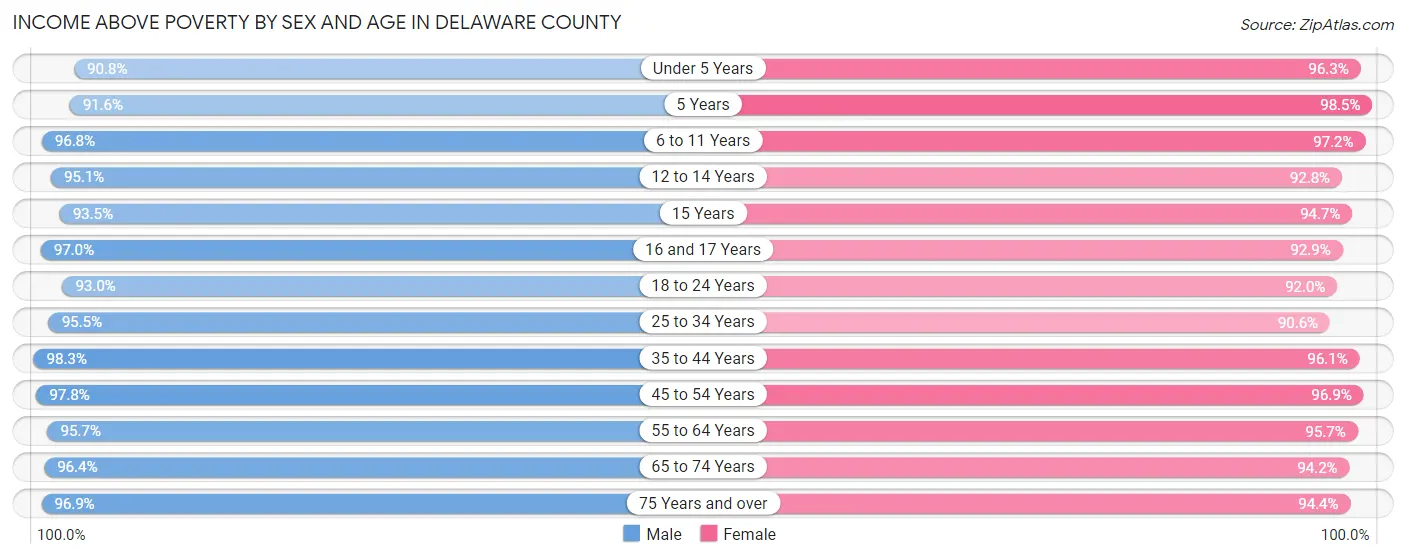
| Age Bracket | Male | Female |
| Under 5 Years | 5,683 (90.8%) | 5,690 (96.3%) |
| 5 Years | 1,137 (91.6%) | 1,473 (98.5%) |
| 6 to 11 Years | 8,964 (96.8%) | 8,949 (97.2%) |
| 12 to 14 Years | 5,536 (95.1%) | 4,353 (92.8%) |
| 15 Years | 1,717 (93.5%) | 1,818 (94.7%) |
| 16 and 17 Years | 3,355 (97.0%) | 2,933 (92.9%) |
| 18 to 24 Years | 8,042 (93.0%) | 7,227 (91.9%) |
| 25 to 34 Years | 9,663 (95.5%) | 9,600 (90.6%) |
| 35 to 44 Years | 16,133 (98.3%) | 15,889 (96.1%) |
| 45 to 54 Years | 16,353 (97.8%) | 15,203 (96.9%) |
| 55 to 64 Years | 12,442 (95.7%) | 12,473 (95.7%) |
| 65 to 74 Years | 9,055 (96.4%) | 9,378 (94.2%) |
| 75 Years and over | 4,706 (96.9%) | 6,142 (94.4%) |
| Total | 102,786 (96.0%) | 101,128 (94.9%) |
Income Below Poverty Among Married-Couple Families in Delaware County
The poverty statistics for married-couple families in Delaware County show that 1.4% or 700 of the total 50,652 families live below the poverty line. Families with 5 or more children have the highest poverty rate of 10.0%, comprising of 25 families. On the other hand, families with 1 or 2 children have the lowest poverty rate of 1.0%, which includes 198 families.
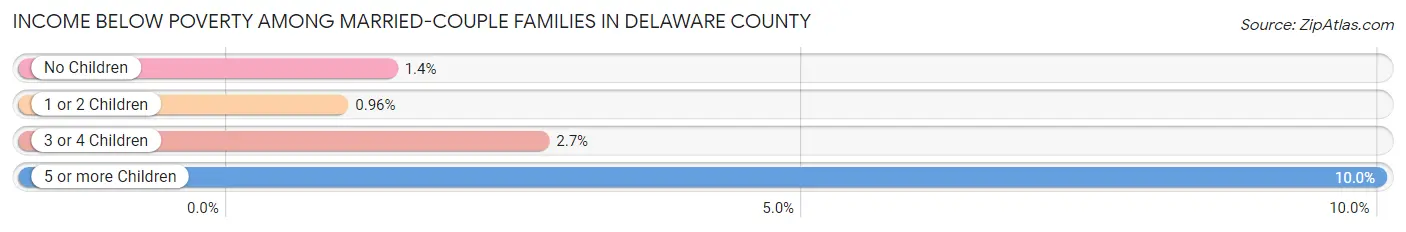
| Children | Above Poverty | Below Poverty |
| No Children | 24,600 (98.6%) | 347 (1.4%) |
| 1 or 2 Children | 20,462 (99.0%) | 198 (1.0%) |
| 3 or 4 Children | 4,665 (97.3%) | 130 (2.7%) |
| 5 or more Children | 225 (90.0%) | 25 (10.0%) |
| Total | 49,952 (98.6%) | 700 (1.4%) |
Income Below Poverty Among Single-Parent Households in Delaware County
According to the poverty data in Delaware County, 4.8% or 149 single-father households and 14.9% or 913 single-mother households are living below the poverty line. Among single-father households, those with 1 or 2 children have the highest poverty rate, with 144 households (8.7%) experiencing poverty. Likewise, among single-mother households, those with 5 or more children have the highest poverty rate, with 68 households (100.0%) falling below the poverty line.
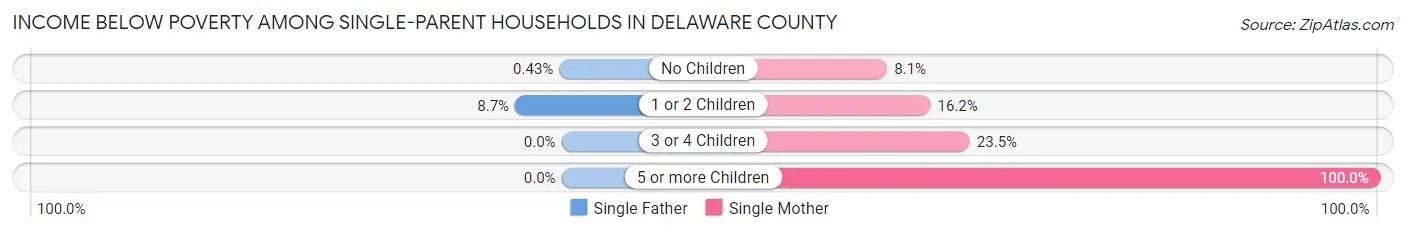
| Children | Single Father | Single Mother |
| No Children | 5 (0.4%) | 180 (8.1%) |
| 1 or 2 Children | 144 (8.7%) | 519 (16.2%) |
| 3 or 4 Children | 0 (0.0%) | 146 (23.5%) |
| 5 or more Children | 0 (0.0%) | 68 (100.0%) |
| Total | 149 (4.8%) | 913 (14.9%) |
Income Below Poverty Among Married-Couple vs Single-Parent Households in Delaware County
The poverty data for Delaware County shows that 700 of the married-couple family households (1.4%) and 1,062 of the single-parent households (11.5%) are living below the poverty level. Within the married-couple family households, those with 5 or more children have the highest poverty rate, with 25 households (10.0%) falling below the poverty line. Among the single-parent households, those with 5 or more children have the highest poverty rate, with 68 household (47.9%) living below poverty.
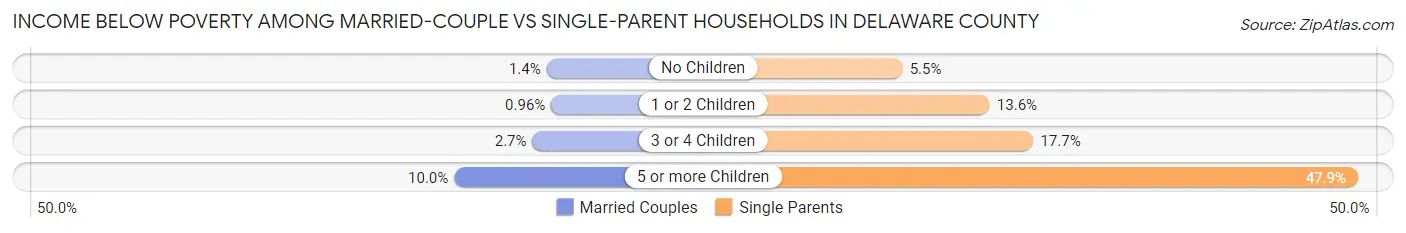
| Children | Married-Couple Families | Single-Parent Households |
| No Children | 347 (1.4%) | 185 (5.5%) |
| 1 or 2 Children | 198 (1.0%) | 663 (13.6%) |
| 3 or 4 Children | 130 (2.7%) | 146 (17.7%) |
| 5 or more Children | 25 (10.0%) | 68 (47.9%) |
| Total | 700 (1.4%) | 1,062 (11.5%) |
Employment Characteristics in Delaware County
Employment by Class of Employer in Delaware County
Among the 112,256 employed individuals in Delaware County, private company employees (75,032 | 66.8%), not-for-profit organizations (10,643 | 9.5%), and local government employees (8,694 | 7.7%) make up the most common classes of employment.
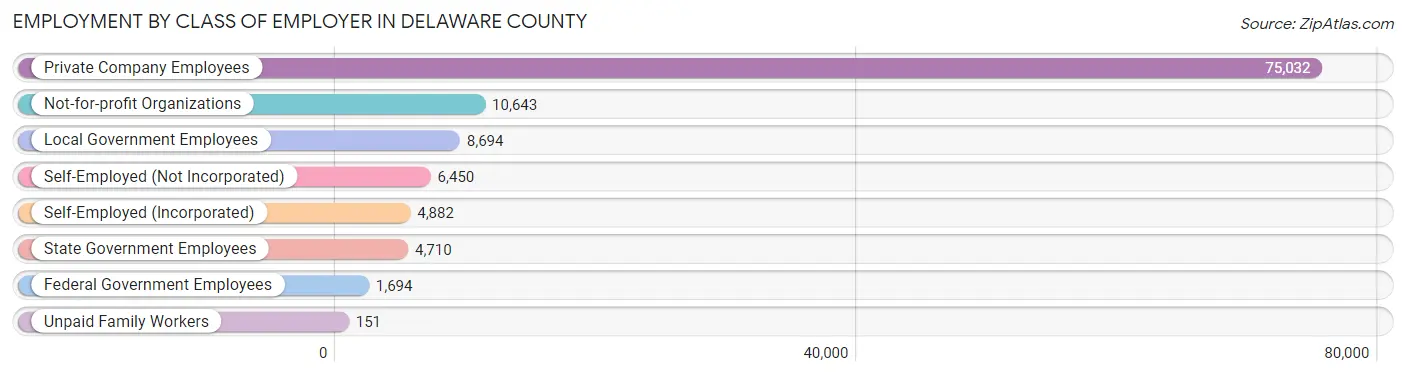
| Employer Class | # Employees | % Employees |
| Private Company Employees | 75,032 | 66.8% |
| Self-Employed (Incorporated) | 4,882 | 4.3% |
| Self-Employed (Not Incorporated) | 6,450 | 5.8% |
| Not-for-profit Organizations | 10,643 | 9.5% |
| Local Government Employees | 8,694 | 7.7% |
| State Government Employees | 4,710 | 4.2% |
| Federal Government Employees | 1,694 | 1.5% |
| Unpaid Family Workers | 151 | 0.1% |
| Total | 112,256 | 100.0% |
Employment Status by Age in Delaware County
According to the labor force statistics for Delaware County, out of the total population over 16 years of age (167,847), 70.4% or 118,164 individuals are in the labor force, with 3.0% or 3,545 of them unemployed. The age group with the highest labor force participation rate is 35 to 44 years, with 90.0% or 29,708 individuals in the labor force. Within the labor force, the 16 to 19 years age range has the highest percentage of unemployed individuals, with 9.9% or 599 of them being unemployed.
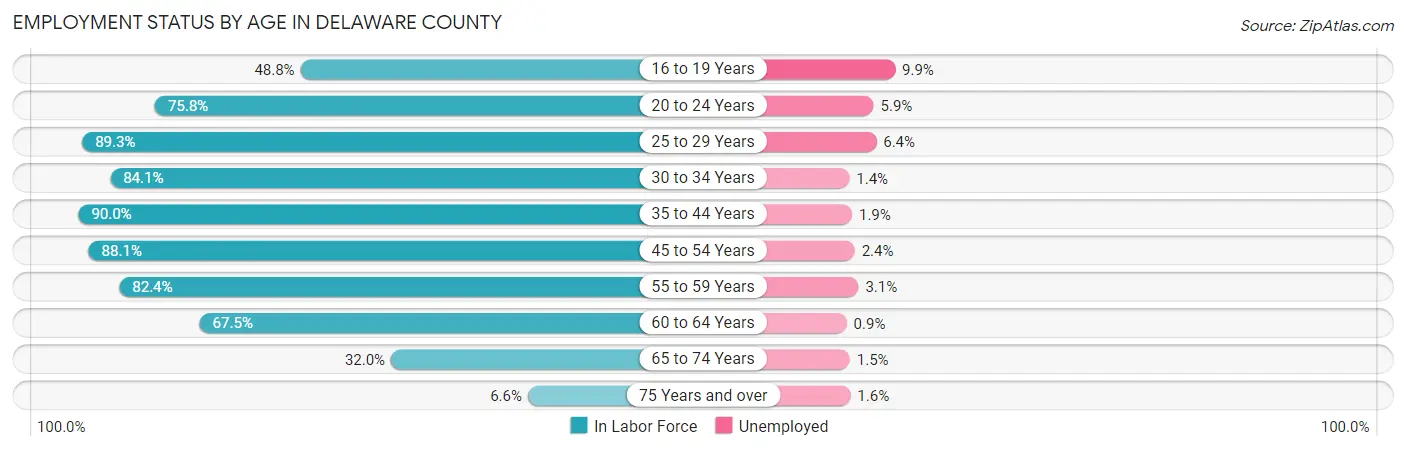
| Age Bracket | In Labor Force | Unemployed |
| 16 to 19 Years | 6,052 (48.8%) | 599 (9.9%) |
| 20 to 24 Years | 9,165 (75.8%) | 541 (5.9%) |
| 25 to 29 Years | 8,063 (89.3%) | 516 (6.4%) |
| 30 to 34 Years | 9,856 (84.1%) | 138 (1.4%) |
| 35 to 44 Years | 29,708 (90.0%) | 564 (1.9%) |
| 45 to 54 Years | 28,573 (88.1%) | 686 (2.4%) |
| 55 to 59 Years | 11,758 (82.4%) | 364 (3.1%) |
| 60 to 64 Years | 7,964 (67.5%) | 72 (0.9%) |
| 65 to 74 Years | 6,223 (32.0%) | 93 (1.5%) |
| 75 Years and over | 769 (6.6%) | 12 (1.6%) |
| Total | 118,164 (70.4%) | 3,545 (3.0%) |
Employment Status by Educational Attainment in Delaware County
According to labor force statistics for Delaware County, 85.4% of individuals (95,868) out of the total population between 25 and 64 years of age (112,258) are in the labor force, with 2.5% or 2,397 of them being unemployed. The group with the highest labor force participation rate are those with the educational attainment of bachelor's degree or higher, with 89.4% or 61,215 individuals in the labor force. Within the labor force, individuals with high school diploma education have the highest percentage of unemployment, with 4.8% or 577 of them being unemployed.
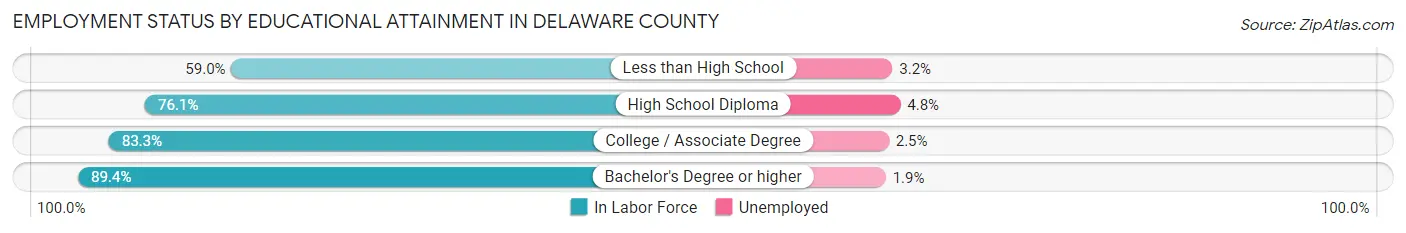
| Educational Attainment | In Labor Force | Unemployed |
| Less than High School | 1,526 (59.0%) | 83 (3.2%) |
| High School Diploma | 12,012 (76.1%) | 758 (4.8%) |
| College / Associate Degree | 21,170 (83.3%) | 635 (2.5%) |
| Bachelor's Degree or higher | 61,215 (89.4%) | 1,301 (1.9%) |
| Total | 95,868 (85.4%) | 2,806 (2.5%) |
Employment Occupations by Sex in Delaware County
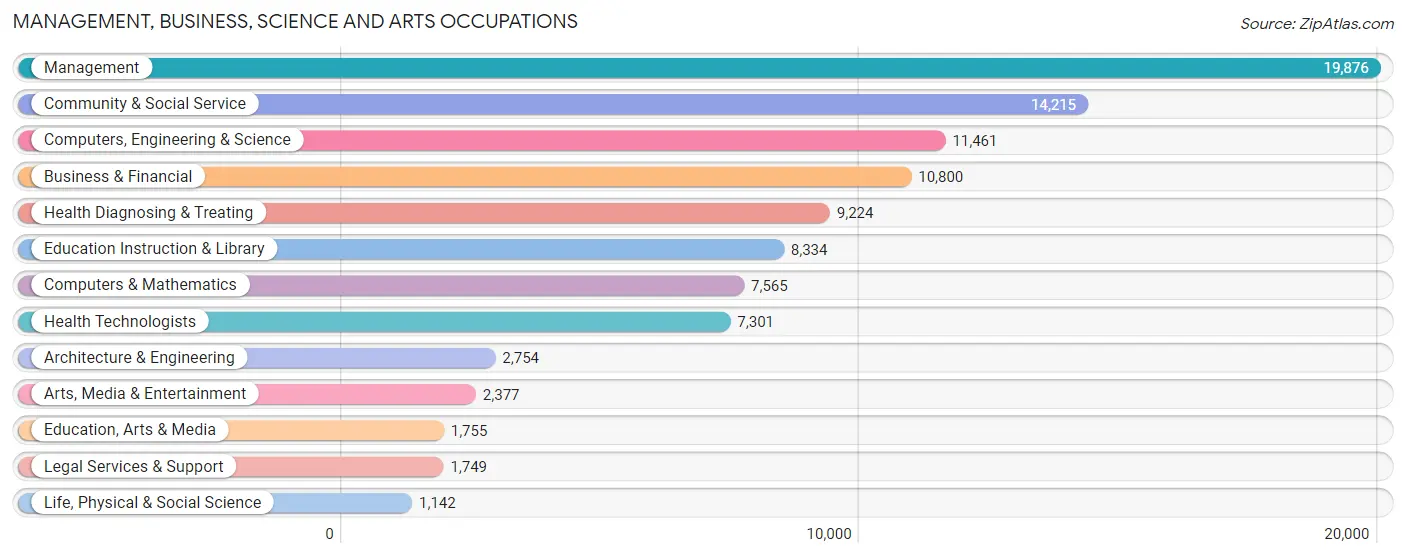
Management, Business, Science and Arts Occupations
The most common Management, Business, Science and Arts occupations in Delaware County are Management (19,876 | 17.4%), Community & Social Service (14,215 | 12.4%), Computers, Engineering & Science (11,461 | 10.0%), Business & Financial (10,800 | 9.5%), and Health Diagnosing & Treating (9,224 | 8.1%).
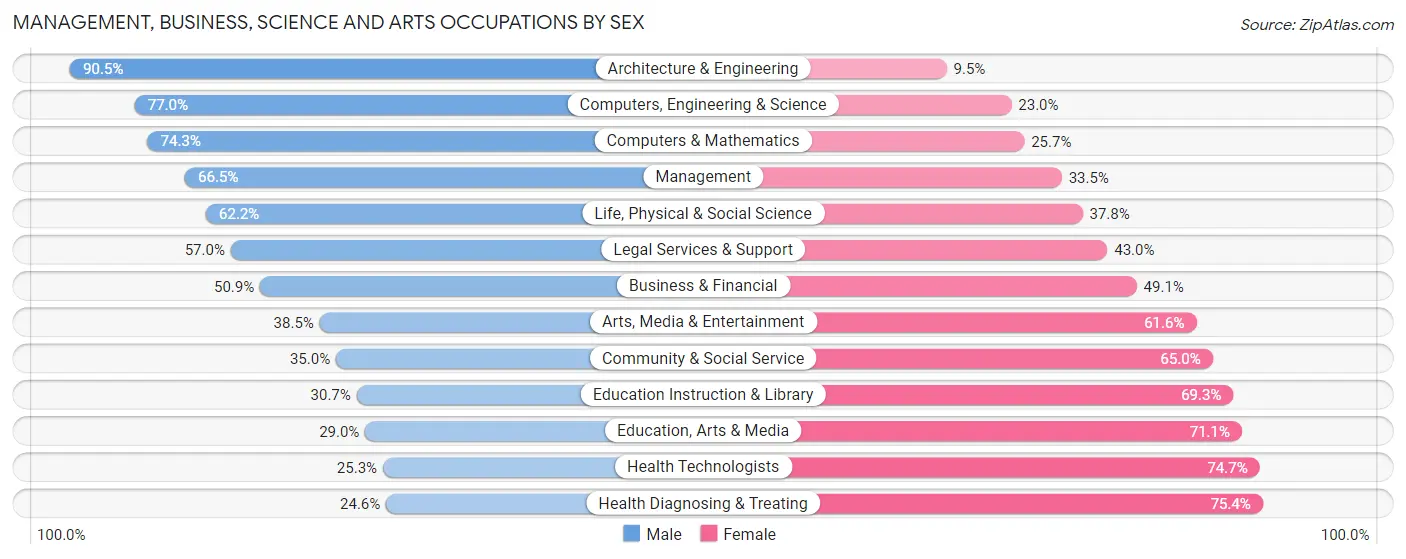
Management, Business, Science and Arts Occupations by Sex
Within the Management, Business, Science and Arts occupations in Delaware County, the most male-oriented occupations are Architecture & Engineering (90.5%), Computers, Engineering & Science (77.0%), and Computers & Mathematics (74.3%), while the most female-oriented occupations are Health Diagnosing & Treating (75.4%), Health Technologists (74.7%), and Education, Arts & Media (71.1%).
| Occupation | Male | Female |
| Management | 13,219 (66.5%) | 6,657 (33.5%) |
| Business & Financial | 5,495 (50.9%) | 5,305 (49.1%) |
| Computers, Engineering & Science | 8,826 (77.0%) | 2,635 (23.0%) |
| Computers & Mathematics | 5,623 (74.3%) | 1,942 (25.7%) |
| Architecture & Engineering | 2,493 (90.5%) | 261 (9.5%) |
| Life, Physical & Social Science | 710 (62.2%) | 432 (37.8%) |
| Community & Social Service | 4,981 (35.0%) | 9,234 (65.0%) |
| Education, Arts & Media | 508 (28.9%) | 1,247 (71.1%) |
| Legal Services & Support | 997 (57.0%) | 752 (43.0%) |
| Education Instruction & Library | 2,562 (30.7%) | 5,772 (69.3%) |
| Arts, Media & Entertainment | 914 (38.5%) | 1,463 (61.6%) |
| Health Diagnosing & Treating | 2,268 (24.6%) | 6,956 (75.4%) |
| Health Technologists | 1,844 (25.3%) | 5,457 (74.7%) |
| Total (Category) | 34,789 (53.0%) | 30,787 (46.9%) |
| Total (Overall) | 61,677 (54.0%) | 52,630 (46.0%) |
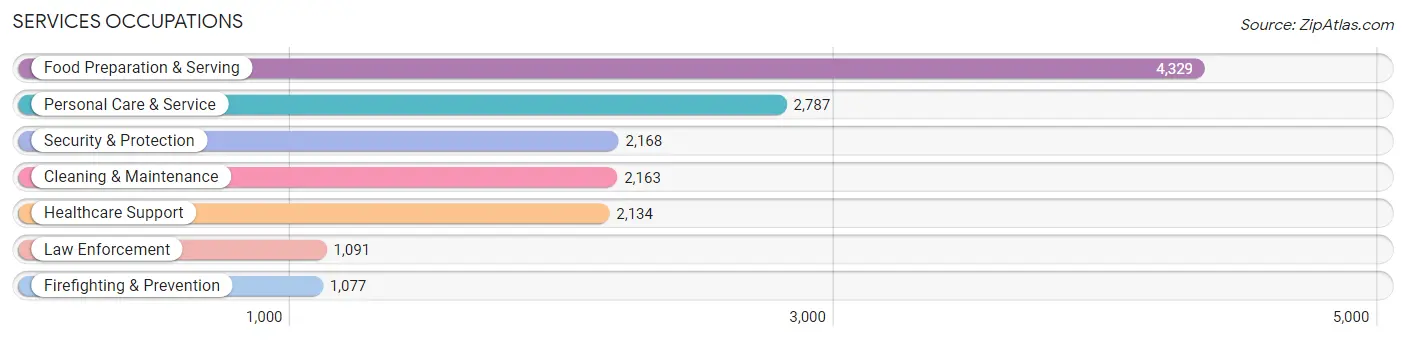
Services Occupations
The most common Services occupations in Delaware County are Food Preparation & Serving (4,329 | 3.8%), Personal Care & Service (2,787 | 2.4%), Security & Protection (2,168 | 1.9%), Cleaning & Maintenance (2,163 | 1.9%), and Healthcare Support (2,134 | 1.9%).
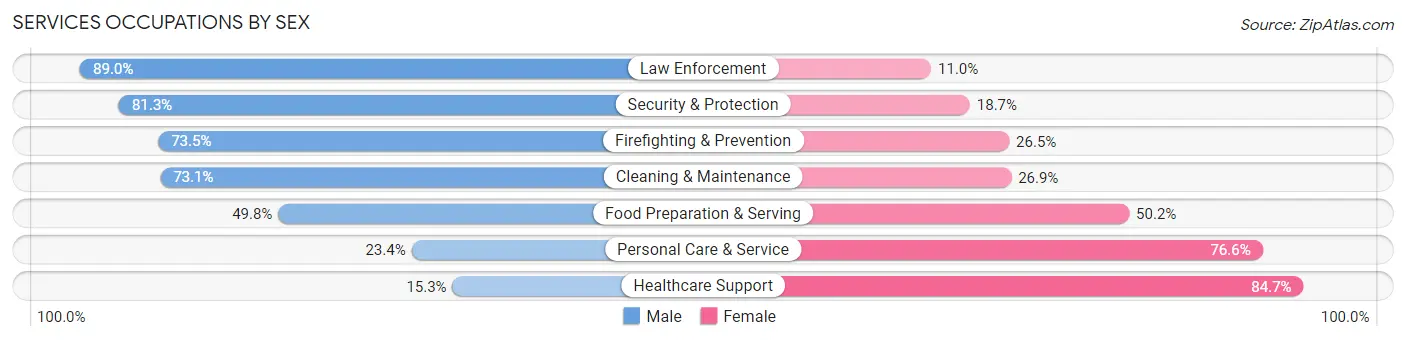
Services Occupations by Sex
Within the Services occupations in Delaware County, the most male-oriented occupations are Law Enforcement (89.0%), Security & Protection (81.3%), and Firefighting & Prevention (73.5%), while the most female-oriented occupations are Healthcare Support (84.7%), Personal Care & Service (76.6%), and Food Preparation & Serving (50.2%).
| Occupation | Male | Female |
| Healthcare Support | 326 (15.3%) | 1,808 (84.7%) |
| Security & Protection | 1,763 (81.3%) | 405 (18.7%) |
| Firefighting & Prevention | 792 (73.5%) | 285 (26.5%) |
| Law Enforcement | 971 (89.0%) | 120 (11.0%) |
| Food Preparation & Serving | 2,155 (49.8%) | 2,174 (50.2%) |
| Cleaning & Maintenance | 1,582 (73.1%) | 581 (26.9%) |
| Personal Care & Service | 652 (23.4%) | 2,135 (76.6%) |
| Total (Category) | 6,478 (47.7%) | 7,103 (52.3%) |
| Total (Overall) | 61,677 (54.0%) | 52,630 (46.0%) |
Sales and Office Occupations
The most common Sales and Office occupations in Delaware County are Sales & Related (11,978 | 10.5%), and Office & Administration (10,031 | 8.8%).

Sales and Office Occupations by Sex

| Occupation | Male | Female |
| Sales & Related | 6,343 (53.0%) | 5,635 (47.0%) |
| Office & Administration | 3,431 (34.2%) | 6,600 (65.8%) |
| Total (Category) | 9,774 (44.4%) | 12,235 (55.6%) |
| Total (Overall) | 61,677 (54.0%) | 52,630 (46.0%) |
Natural Resources, Construction and Maintenance Occupations
The most common Natural Resources, Construction and Maintenance occupations in Delaware County are Construction & Extraction (2,527 | 2.2%), Installation, Maintenance & Repair (1,673 | 1.5%), and Farming, Fishing & Forestry (81 | 0.1%).

Natural Resources, Construction and Maintenance Occupations by Sex
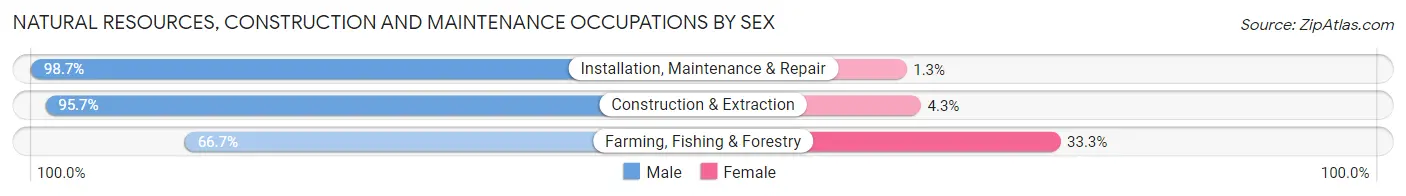
| Occupation | Male | Female |
| Farming, Fishing & Forestry | 54 (66.7%) | 27 (33.3%) |
| Construction & Extraction | 2,418 (95.7%) | 109 (4.3%) |
| Installation, Maintenance & Repair | 1,651 (98.7%) | 22 (1.3%) |
| Total (Category) | 4,123 (96.3%) | 158 (3.7%) |
| Total (Overall) | 61,677 (54.0%) | 52,630 (46.0%) |
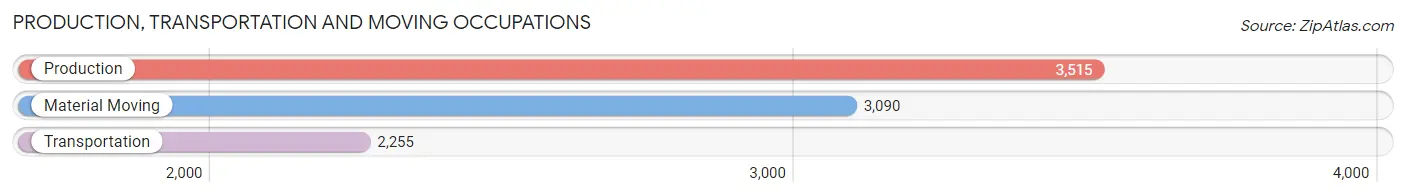
Production, Transportation and Moving Occupations
The most common Production, Transportation and Moving occupations in Delaware County are Production (3,515 | 3.1%), Material Moving (3,090 | 2.7%), and Transportation (2,255 | 2.0%).
Production, Transportation and Moving Occupations by Sex
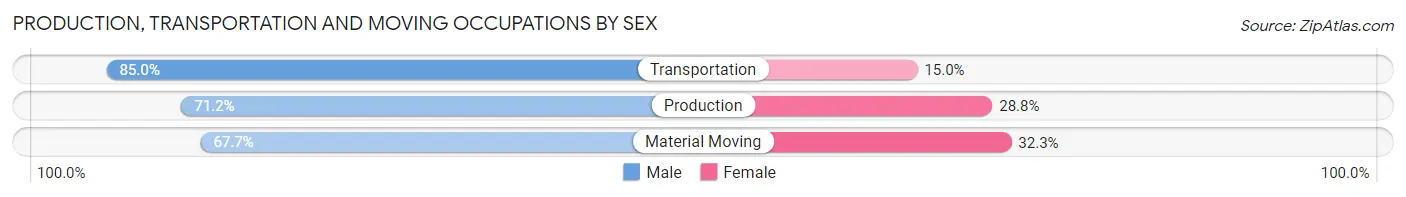
| Occupation | Male | Female |
| Production | 2,504 (71.2%) | 1,011 (28.8%) |
| Transportation | 1,916 (85.0%) | 339 (15.0%) |
| Material Moving | 2,093 (67.7%) | 997 (32.3%) |
| Total (Category) | 6,513 (73.5%) | 2,347 (26.5%) |
| Total (Overall) | 61,677 (54.0%) | 52,630 (46.0%) |
Employment Industries by Sex in Delaware County
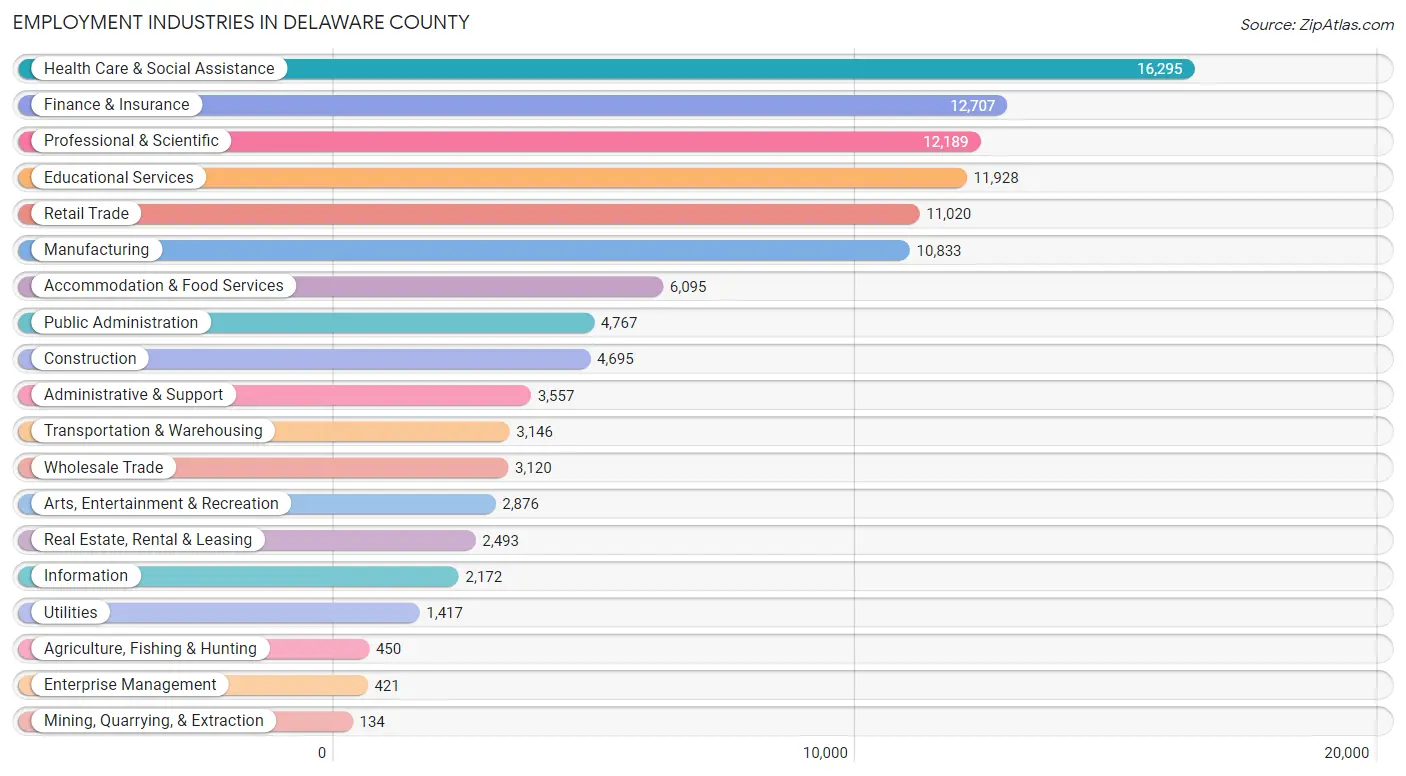
Employment Industries in Delaware County
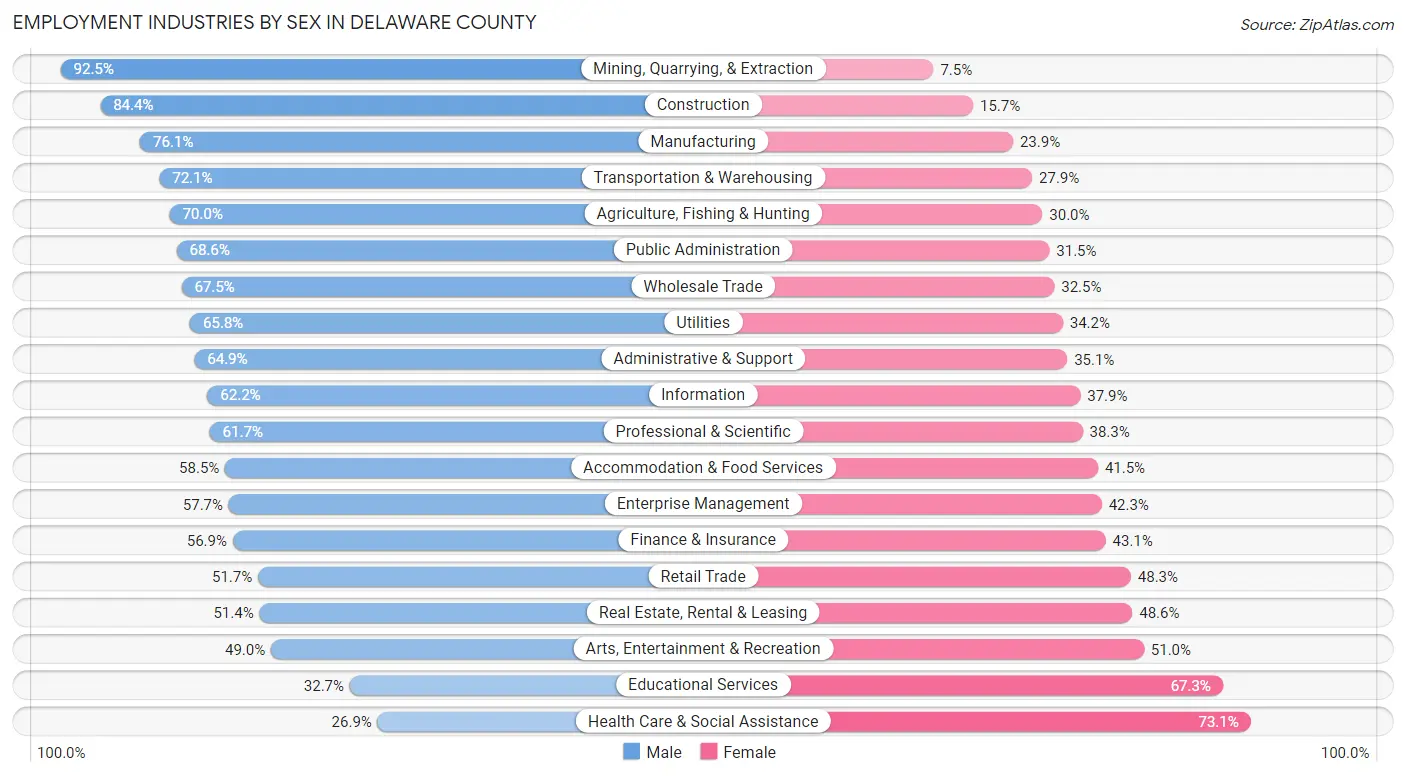
The major employment industries in Delaware County include Health Care & Social Assistance (16,295 | 14.3%), Finance & Insurance (12,707 | 11.1%), Professional & Scientific (12,189 | 10.7%), Educational Services (11,928 | 10.4%), and Retail Trade (11,020 | 9.6%).
Employment Industries by Sex in Delaware County
The Delaware County industries that see more men than women are Mining, Quarrying, & Extraction (92.5%), Construction (84.4%), and Manufacturing (76.1%), whereas the industries that tend to have a higher number of women are Health Care & Social Assistance (73.1%), Educational Services (67.3%), and Arts, Entertainment & Recreation (51.0%).
| Industry | Male | Female |
| Agriculture, Fishing & Hunting | 315 (70.0%) | 135 (30.0%) |
| Mining, Quarrying, & Extraction | 124 (92.5%) | 10 (7.5%) |
| Construction | 3,960 (84.4%) | 735 (15.7%) |
| Manufacturing | 8,242 (76.1%) | 2,591 (23.9%) |
| Wholesale Trade | 2,107 (67.5%) | 1,013 (32.5%) |
| Retail Trade | 5,695 (51.7%) | 5,325 (48.3%) |
| Transportation & Warehousing | 2,269 (72.1%) | 877 (27.9%) |
| Utilities | 932 (65.8%) | 485 (34.2%) |
| Information | 1,350 (62.2%) | 822 (37.9%) |
| Finance & Insurance | 7,231 (56.9%) | 5,476 (43.1%) |
| Real Estate, Rental & Leasing | 1,281 (51.4%) | 1,212 (48.6%) |
| Professional & Scientific | 7,520 (61.7%) | 4,669 (38.3%) |
| Enterprise Management | 243 (57.7%) | 178 (42.3%) |
| Administrative & Support | 2,307 (64.9%) | 1,250 (35.1%) |
| Educational Services | 3,898 (32.7%) | 8,030 (67.3%) |
| Health Care & Social Assistance | 4,386 (26.9%) | 11,909 (73.1%) |
| Arts, Entertainment & Recreation | 1,409 (49.0%) | 1,467 (51.0%) |
| Accommodation & Food Services | 3,565 (58.5%) | 2,530 (41.5%) |
| Public Administration | 3,268 (68.5%) | 1,499 (31.5%) |
| Total | 61,677 (54.0%) | 52,630 (46.0%) |
Education in Delaware County
School Enrollment in Delaware County
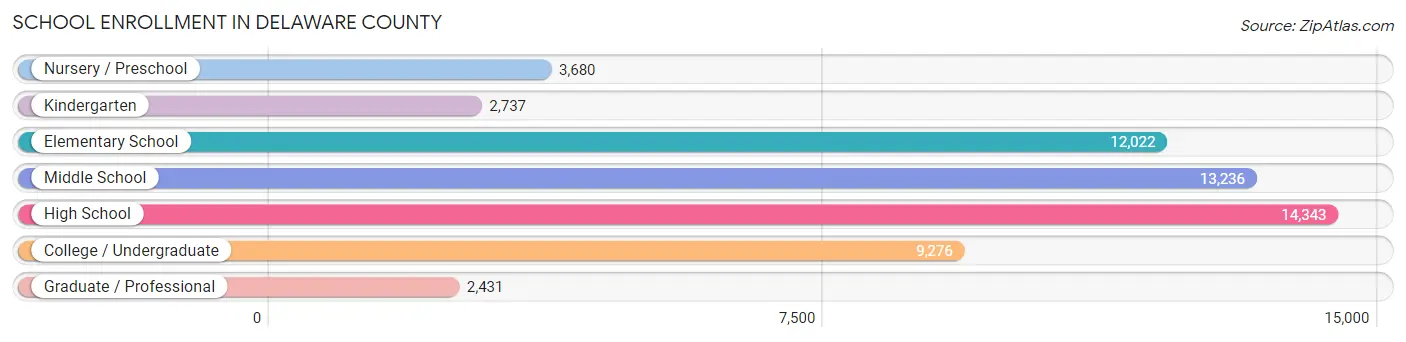
The most common levels of schooling among the 57,725 students in Delaware County are high school (14,343 | 24.8%), middle school (13,236 | 22.9%), and elementary school (12,022 | 20.8%).
| School Level | # Students | % Students |
| Nursery / Preschool | 3,680 | 6.4% |
| Kindergarten | 2,737 | 4.7% |
| Elementary School | 12,022 | 20.8% |
| Middle School | 13,236 | 22.9% |
| High School | 14,343 | 24.8% |
| College / Undergraduate | 9,276 | 16.1% |
| Graduate / Professional | 2,431 | 4.2% |
| Total | 57,725 | 100.0% |
School Enrollment by Age by Funding Source in Delaware County
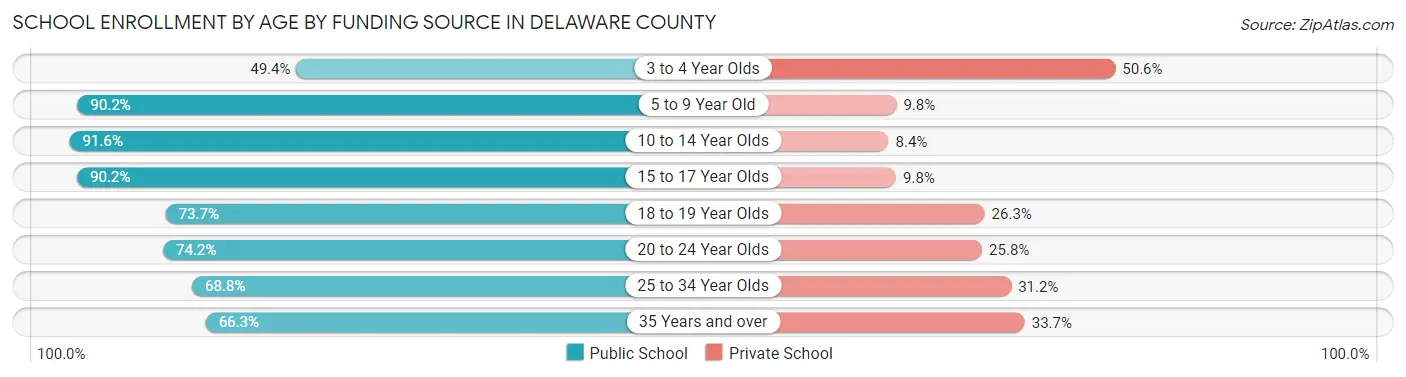
Out of a total of 57,725 students who are enrolled in schools in Delaware County, 9,121 (15.8%) attend a private institution, while the remaining 48,604 (84.2%) are enrolled in public schools. The age group of 3 to 4 year olds has the highest likelihood of being enrolled in private schools, with 1,416 (50.6% in the age bracket) enrolled. Conversely, the age group of 10 to 14 year olds has the lowest likelihood of being enrolled in a private school, with 15,589 (91.6% in the age bracket) attending a public institution.
| Age Bracket | Public School | Private School |
| 3 to 4 Year Olds | 1,382 (49.4%) | 1,416 (50.6%) |
| 5 to 9 Year Old | 12,277 (90.2%) | 1,340 (9.8%) |
| 10 to 14 Year Olds | 15,589 (91.6%) | 1,424 (8.4%) |
| 15 to 17 Year Olds | 9,309 (90.2%) | 1,008 (9.8%) |
| 18 to 19 Year Olds | 3,479 (73.7%) | 1,239 (26.3%) |
| 20 to 24 Year Olds | 3,508 (74.2%) | 1,220 (25.8%) |
| 25 to 34 Year Olds | 1,160 (68.8%) | 526 (31.2%) |
| 35 Years and over | 1,887 (66.3%) | 961 (33.7%) |
| Total | 48,604 (84.2%) | 9,121 (15.8%) |
Educational Attainment by Field of Study in Delaware County
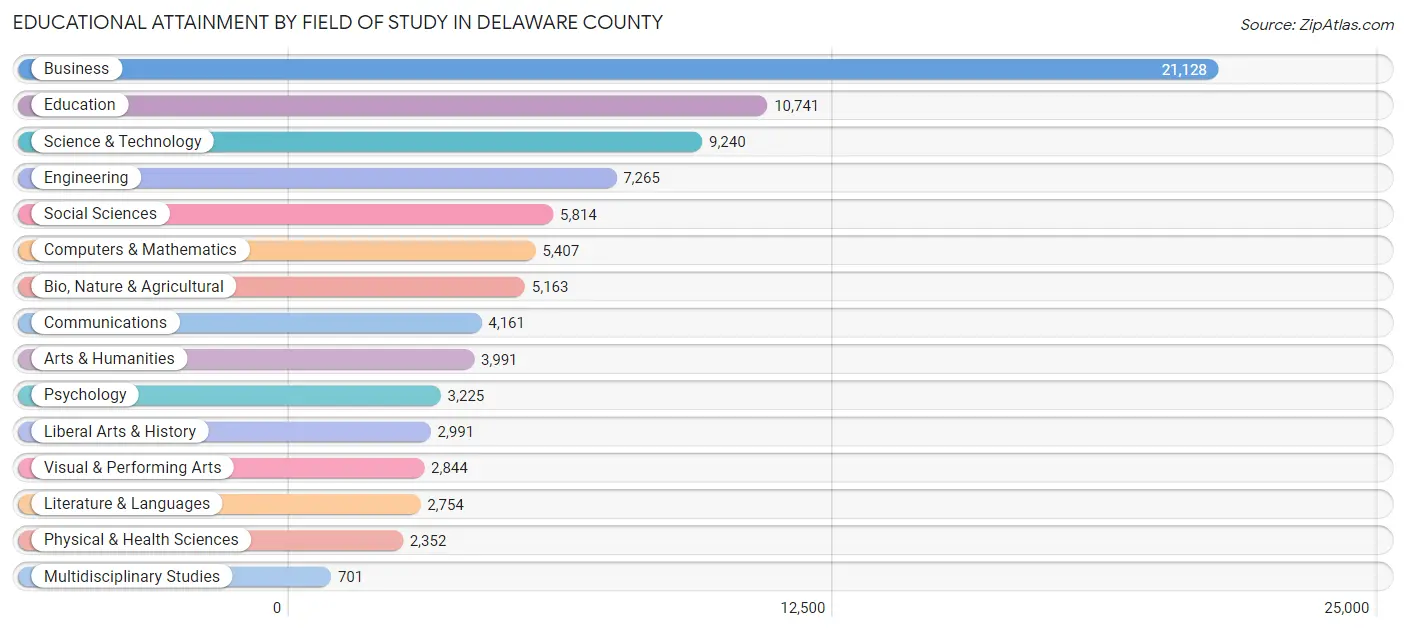
Business (21,128 | 24.1%), education (10,741 | 12.2%), science & technology (9,240 | 10.5%), engineering (7,265 | 8.3%), and social sciences (5,814 | 6.6%) are the most common fields of study among 87,777 individuals in Delaware County who have obtained a bachelor's degree or higher.
| Field of Study | # Graduates | % Graduates |
| Computers & Mathematics | 5,407 | 6.2% |
| Bio, Nature & Agricultural | 5,163 | 5.9% |
| Physical & Health Sciences | 2,352 | 2.7% |
| Psychology | 3,225 | 3.7% |
| Social Sciences | 5,814 | 6.6% |
| Engineering | 7,265 | 8.3% |
| Multidisciplinary Studies | 701 | 0.8% |
| Science & Technology | 9,240 | 10.5% |
| Business | 21,128 | 24.1% |
| Education | 10,741 | 12.2% |
| Literature & Languages | 2,754 | 3.1% |
| Liberal Arts & History | 2,991 | 3.4% |
| Visual & Performing Arts | 2,844 | 3.2% |
| Communications | 4,161 | 4.7% |
| Arts & Humanities | 3,991 | 4.5% |
| Total | 87,777 | 100.0% |
Transportation & Commute in Delaware County
Vehicle Availability by Sex in Delaware County
The most prevalent vehicle ownership categories in Delaware County are males with 2 vehicles (29,948, accounting for 49.3%) and females with 2 vehicles (24,422, making up 59.0%).
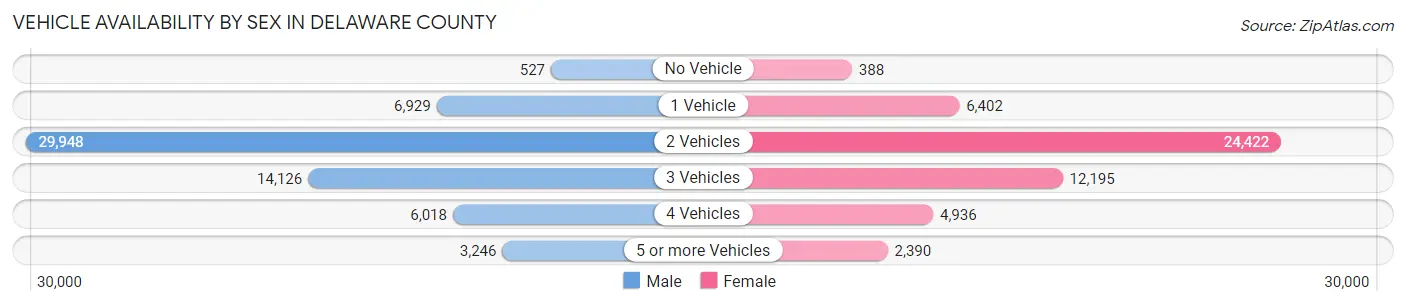
| Vehicles Available | Male | Female |
| No Vehicle | 527 (0.9%) | 388 (0.8%) |
| 1 Vehicle | 6,929 (11.4%) | 6,402 (12.6%) |
| 2 Vehicles | 29,948 (49.3%) | 24,422 (48.1%) |
| 3 Vehicles | 14,126 (23.2%) | 12,195 (24.0%) |
| 4 Vehicles | 6,018 (9.9%) | 4,936 (9.7%) |
| 5 or more Vehicles | 3,246 (5.3%) | 2,390 (4.7%) |
| Total | 60,794 (100.0%) | 50,733 (100.0%) |
Commute Time in Delaware County
The most frequently occuring commute durations in Delaware County are 30 to 34 minutes (13,804 commuters, 15.6%), 20 to 24 minutes (12,287 commuters, 13.9%), and 15 to 19 minutes (11,654 commuters, 13.2%).
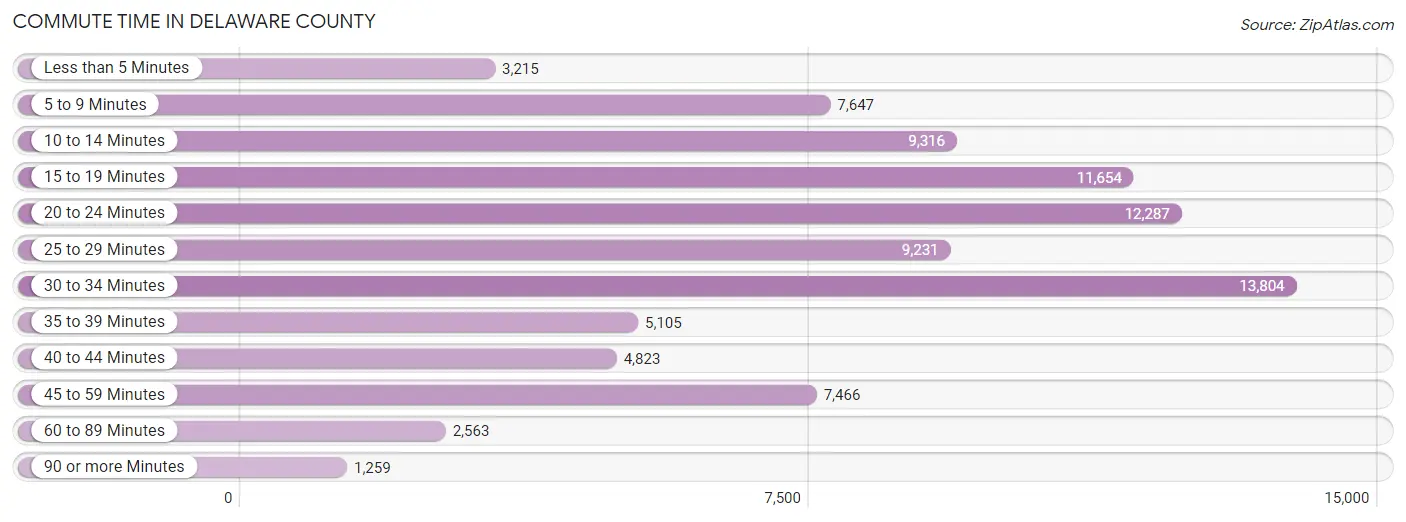
| Commute Time | # Commuters | % Commuters |
| Less than 5 Minutes | 3,215 | 3.6% |
| 5 to 9 Minutes | 7,647 | 8.6% |
| 10 to 14 Minutes | 9,316 | 10.5% |
| 15 to 19 Minutes | 11,654 | 13.2% |
| 20 to 24 Minutes | 12,287 | 13.9% |
| 25 to 29 Minutes | 9,231 | 10.4% |
| 30 to 34 Minutes | 13,804 | 15.6% |
| 35 to 39 Minutes | 5,105 | 5.8% |
| 40 to 44 Minutes | 4,823 | 5.5% |
| 45 to 59 Minutes | 7,466 | 8.5% |
| 60 to 89 Minutes | 2,563 | 2.9% |
| 90 or more Minutes | 1,259 | 1.4% |
Commute Time by Sex in Delaware County
The most common commute times in Delaware County are 30 to 34 minutes (8,329 commuters, 17.0%) for males and 15 to 19 minutes (5,945 commuters, 15.1%) for females.
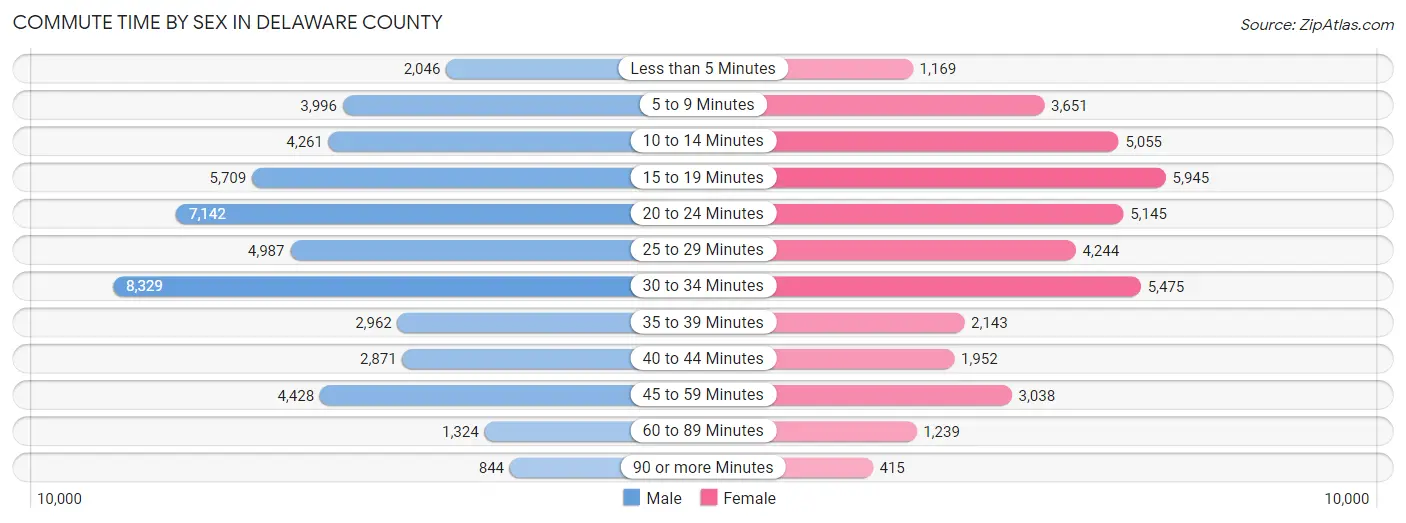
| Commute Time | Male | Female |
| Less than 5 Minutes | 2,046 (4.2%) | 1,169 (3.0%) |
| 5 to 9 Minutes | 3,996 (8.2%) | 3,651 (9.2%) |
| 10 to 14 Minutes | 4,261 (8.7%) | 5,055 (12.8%) |
| 15 to 19 Minutes | 5,709 (11.7%) | 5,945 (15.1%) |
| 20 to 24 Minutes | 7,142 (14.6%) | 5,145 (13.0%) |
| 25 to 29 Minutes | 4,987 (10.2%) | 4,244 (10.7%) |
| 30 to 34 Minutes | 8,329 (17.0%) | 5,475 (13.9%) |
| 35 to 39 Minutes | 2,962 (6.1%) | 2,143 (5.4%) |
| 40 to 44 Minutes | 2,871 (5.9%) | 1,952 (5.0%) |
| 45 to 59 Minutes | 4,428 (9.1%) | 3,038 (7.7%) |
| 60 to 89 Minutes | 1,324 (2.7%) | 1,239 (3.1%) |
| 90 or more Minutes | 844 (1.7%) | 415 (1.1%) |
Time of Departure to Work by Sex in Delaware County
The most frequent times of departure to work in Delaware County are 7:00 AM to 7:29 AM (7,799, 16.0%) for males and 7:00 AM to 7:29 AM (6,169, 15.6%) for females.
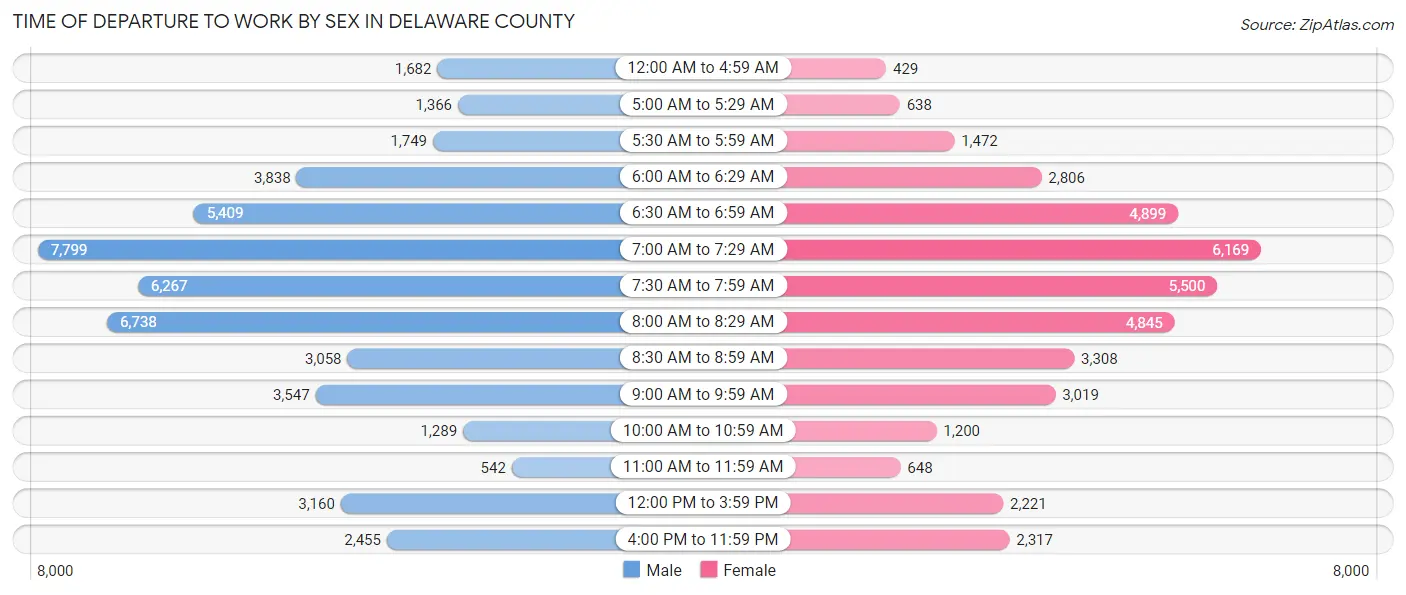
| Time of Departure | Male | Female |
| 12:00 AM to 4:59 AM | 1,682 (3.4%) | 429 (1.1%) |
| 5:00 AM to 5:29 AM | 1,366 (2.8%) | 638 (1.6%) |
| 5:30 AM to 5:59 AM | 1,749 (3.6%) | 1,472 (3.7%) |
| 6:00 AM to 6:29 AM | 3,838 (7.9%) | 2,806 (7.1%) |
| 6:30 AM to 6:59 AM | 5,409 (11.1%) | 4,899 (12.4%) |
| 7:00 AM to 7:29 AM | 7,799 (16.0%) | 6,169 (15.6%) |
| 7:30 AM to 7:59 AM | 6,267 (12.8%) | 5,500 (13.9%) |
| 8:00 AM to 8:29 AM | 6,738 (13.8%) | 4,845 (12.3%) |
| 8:30 AM to 8:59 AM | 3,058 (6.2%) | 3,308 (8.4%) |
| 9:00 AM to 9:59 AM | 3,547 (7.2%) | 3,019 (7.6%) |
| 10:00 AM to 10:59 AM | 1,289 (2.6%) | 1,200 (3.0%) |
| 11:00 AM to 11:59 AM | 542 (1.1%) | 648 (1.6%) |
| 12:00 PM to 3:59 PM | 3,160 (6.5%) | 2,221 (5.6%) |
| 4:00 PM to 11:59 PM | 2,455 (5.0%) | 2,317 (5.9%) |
| Total | 48,899 (100.0%) | 39,471 (100.0%) |
Housing Occupancy in Delaware County
Occupancy by Ownership in Delaware County
Of the total 78,456 dwellings in Delaware County, owner-occupied units account for 61,885 (78.9%), while renter-occupied units make up 16,571 (21.1%).
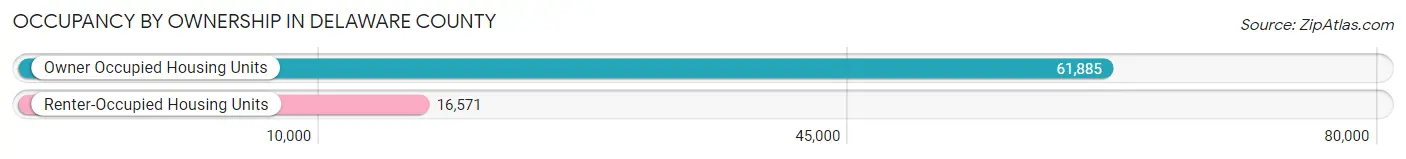
| Occupancy | # Housing Units | % Housing Units |
| Owner Occupied Housing Units | 61,885 | 78.9% |
| Renter-Occupied Housing Units | 16,571 | 21.1% |
| Total Occupied Housing Units | 78,456 | 100.0% |
Occupancy by Household Size in Delaware County
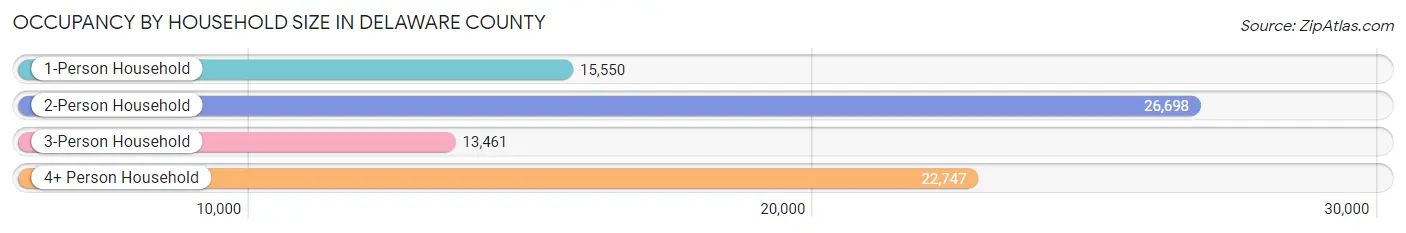
| Household Size | # Housing Units | % Housing Units |
| 1-Person Household | 15,550 | 19.8% |
| 2-Person Household | 26,698 | 34.0% |
| 3-Person Household | 13,461 | 17.2% |
| 4+ Person Household | 22,747 | 29.0% |
| Total Housing Units | 78,456 | 100.0% |
Occupancy by Ownership by Household Size in Delaware County
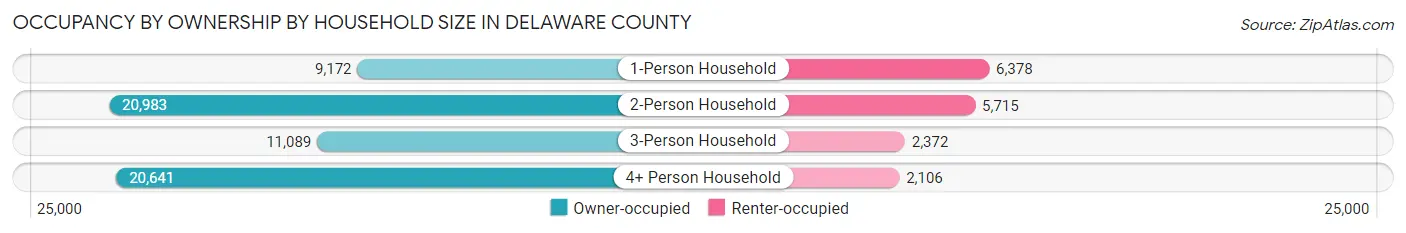
| Household Size | Owner-occupied | Renter-occupied |
| 1-Person Household | 9,172 (59.0%) | 6,378 (41.0%) |
| 2-Person Household | 20,983 (78.6%) | 5,715 (21.4%) |
| 3-Person Household | 11,089 (82.4%) | 2,372 (17.6%) |
| 4+ Person Household | 20,641 (90.7%) | 2,106 (9.3%) |
| Total Housing Units | 61,885 (78.9%) | 16,571 (21.1%) |
Occupancy by Educational Attainment in Delaware County
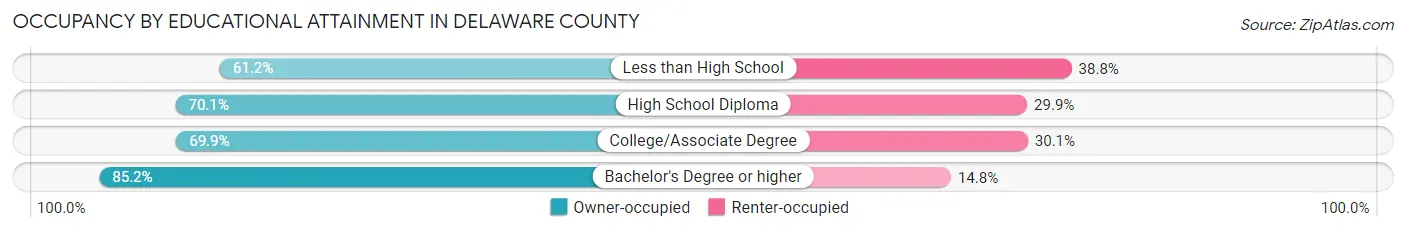
| Household Size | Owner-occupied | Renter-occupied |
| Less than High School | 997 (61.2%) | 631 (38.8%) |
| High School Diploma | 8,324 (70.1%) | 3,557 (29.9%) |
| College/Associate Degree | 12,602 (69.9%) | 5,422 (30.1%) |
| Bachelor's Degree or higher | 39,962 (85.2%) | 6,961 (14.8%) |
Occupancy by Age of Householder in Delaware County
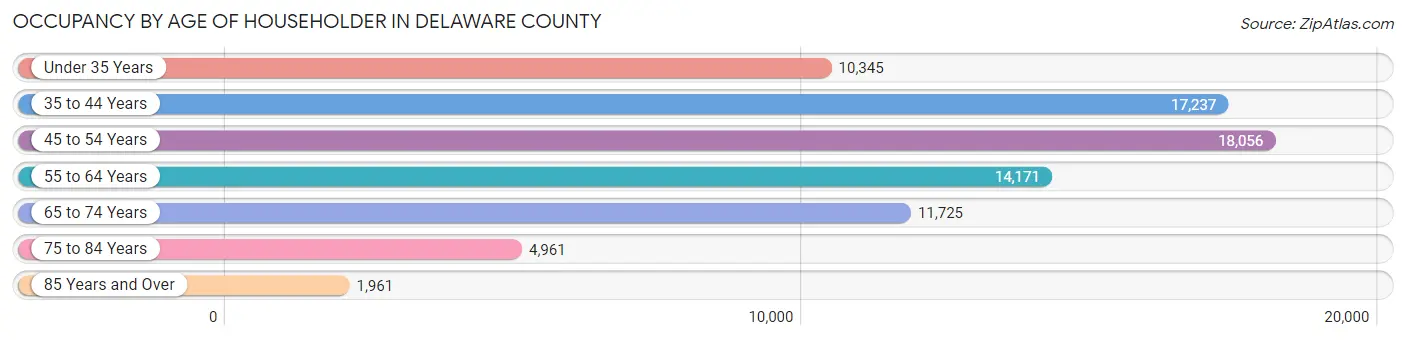
| Age Bracket | # Households | % Households |
| Under 35 Years | 10,345 | 13.2% |
| 35 to 44 Years | 17,237 | 22.0% |
| 45 to 54 Years | 18,056 | 23.0% |
| 55 to 64 Years | 14,171 | 18.1% |
| 65 to 74 Years | 11,725 | 14.9% |
| 75 to 84 Years | 4,961 | 6.3% |
| 85 Years and Over | 1,961 | 2.5% |
| Total | 78,456 | 100.0% |
Housing Finances in Delaware County
Median Income by Occupancy in Delaware County
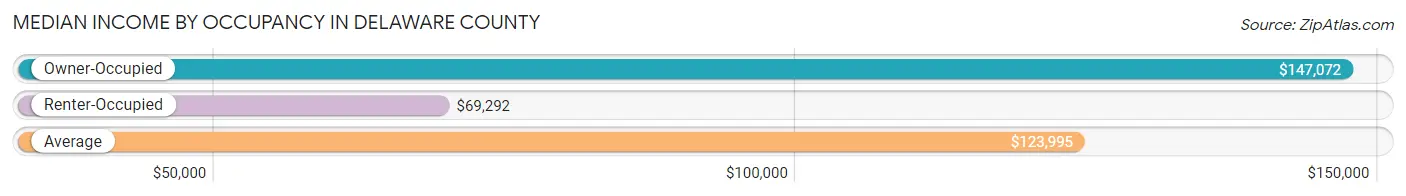
| Occupancy Type | # Households | Median Income |
| Owner-Occupied | 61,885 (78.9%) | $147,072 |
| Renter-Occupied | 16,571 (21.1%) | $69,292 |
| Average | 78,456 (100.0%) | $123,995 |
Occupancy by Householder Income Bracket in Delaware County
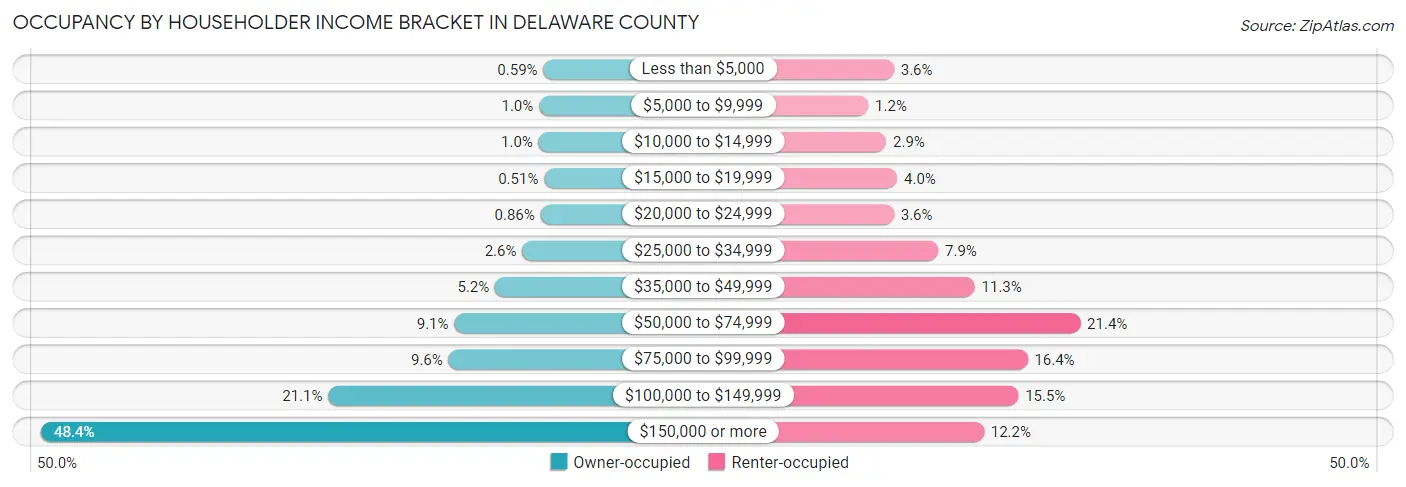
| Income Bracket | Owner-occupied | Renter-occupied |
| Less than $5,000 | 367 (0.6%) | 603 (3.6%) |
| $5,000 to $9,999 | 620 (1.0%) | 199 (1.2%) |
| $10,000 to $14,999 | 643 (1.0%) | 483 (2.9%) |
| $15,000 to $19,999 | 316 (0.5%) | 656 (4.0%) |
| $20,000 to $24,999 | 535 (0.9%) | 603 (3.6%) |
| $25,000 to $34,999 | 1,607 (2.6%) | 1,302 (7.9%) |
| $35,000 to $49,999 | 3,213 (5.2%) | 1,879 (11.3%) |
| $50,000 to $74,999 | 5,613 (9.1%) | 3,544 (21.4%) |
| $75,000 to $99,999 | 5,956 (9.6%) | 2,712 (16.4%) |
| $100,000 to $149,999 | 13,045 (21.1%) | 2,567 (15.5%) |
| $150,000 or more | 29,970 (48.4%) | 2,023 (12.2%) |
| Total | 61,885 (100.0%) | 16,571 (100.0%) |
Monthly Housing Cost Tiers in Delaware County
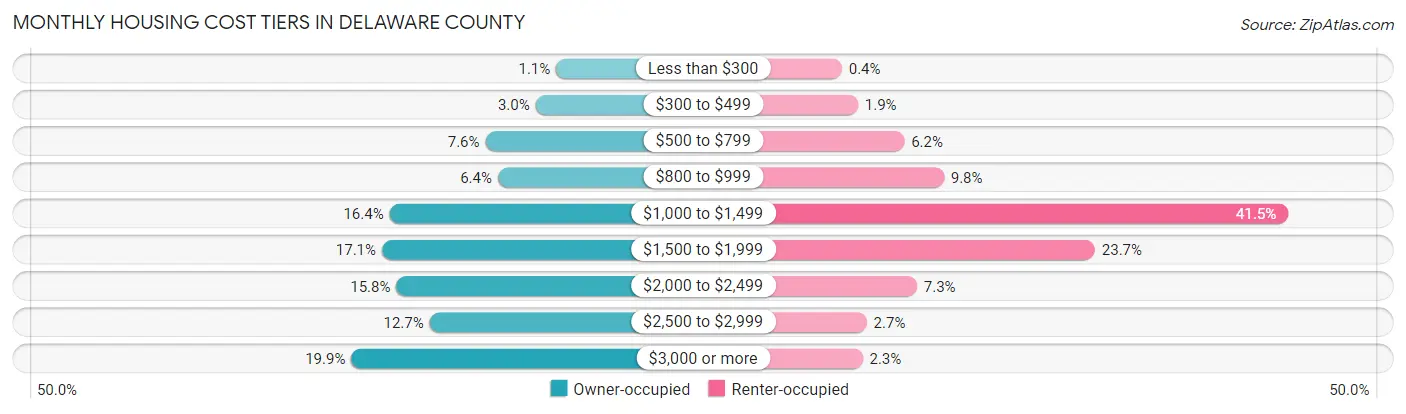
| Monthly Cost | Owner-occupied | Renter-occupied |
| Less than $300 | 661 (1.1%) | 66 (0.4%) |
| $300 to $499 | 1,832 (3.0%) | 312 (1.9%) |
| $500 to $799 | 4,690 (7.6%) | 1,019 (6.1%) |
| $800 to $999 | 3,985 (6.4%) | 1,622 (9.8%) |
| $1,000 to $1,499 | 10,155 (16.4%) | 6,875 (41.5%) |
| $1,500 to $1,999 | 10,588 (17.1%) | 3,928 (23.7%) |
| $2,000 to $2,499 | 9,768 (15.8%) | 1,211 (7.3%) |
| $2,500 to $2,999 | 7,870 (12.7%) | 445 (2.7%) |
| $3,000 or more | 12,336 (19.9%) | 382 (2.3%) |
| Total | 61,885 (100.0%) | 16,571 (100.0%) |
Physical Housing Characteristics in Delaware County
Housing Structures in Delaware County
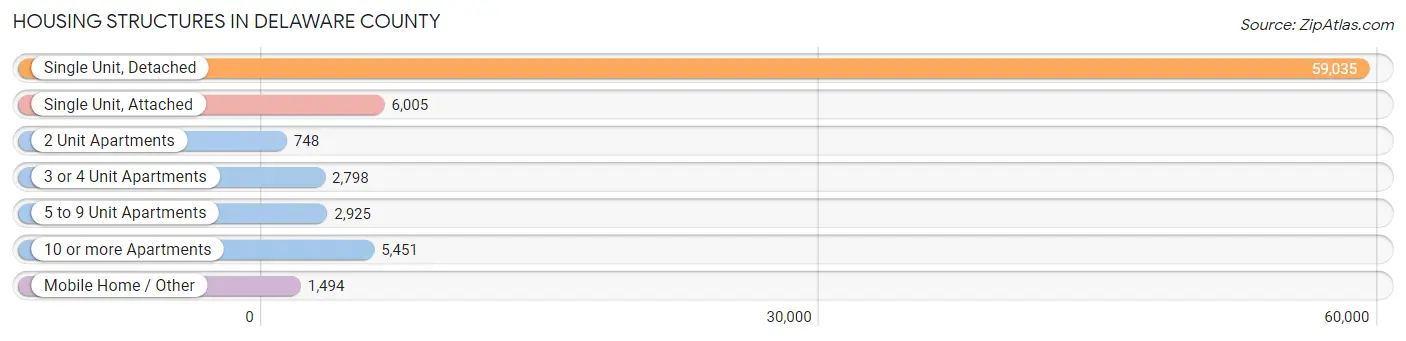
| Structure Type | # Housing Units | % Housing Units |
| Single Unit, Detached | 59,035 | 75.2% |
| Single Unit, Attached | 6,005 | 7.6% |
| 2 Unit Apartments | 748 | 0.9% |
| 3 or 4 Unit Apartments | 2,798 | 3.6% |
| 5 to 9 Unit Apartments | 2,925 | 3.7% |
| 10 or more Apartments | 5,451 | 7.0% |
| Mobile Home / Other | 1,494 | 1.9% |
| Total | 78,456 | 100.0% |
Housing Structures by Occupancy in Delaware County
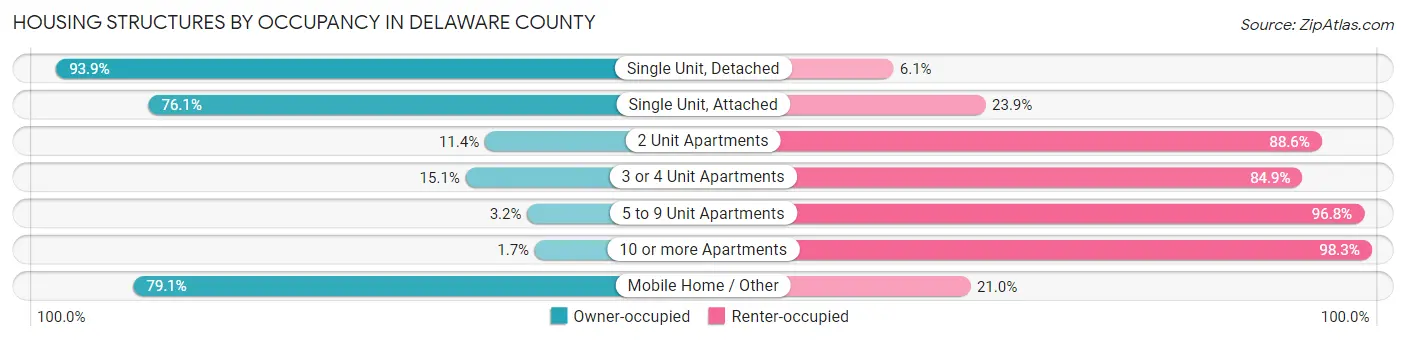
| Structure Type | Owner-occupied | Renter-occupied |
| Single Unit, Detached | 55,436 (93.9%) | 3,599 (6.1%) |
| Single Unit, Attached | 4,572 (76.1%) | 1,433 (23.9%) |
| 2 Unit Apartments | 85 (11.4%) | 663 (88.6%) |
| 3 or 4 Unit Apartments | 422 (15.1%) | 2,376 (84.9%) |
| 5 to 9 Unit Apartments | 94 (3.2%) | 2,831 (96.8%) |
| 10 or more Apartments | 95 (1.7%) | 5,356 (98.3%) |
| Mobile Home / Other | 1,181 (79.0%) | 313 (20.9%) |
| Total | 61,885 (78.9%) | 16,571 (21.1%) |
Housing Structures by Number of Rooms in Delaware County
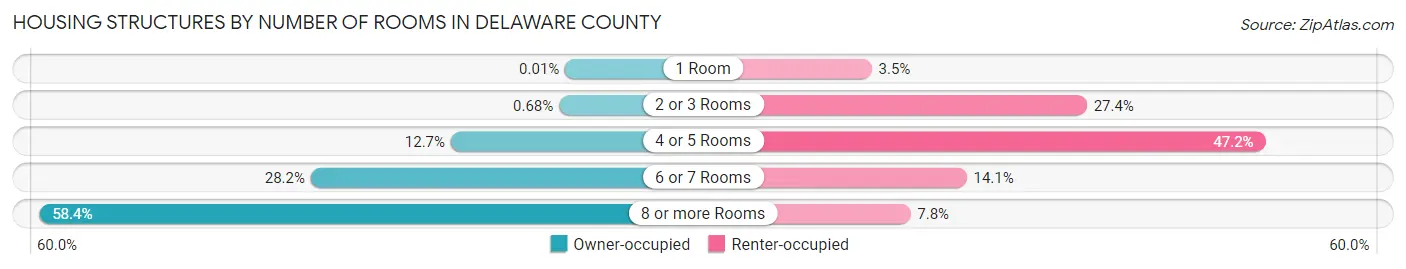
| Number of Rooms | Owner-occupied | Renter-occupied |
| 1 Room | 9 (0.0%) | 584 (3.5%) |
| 2 or 3 Rooms | 420 (0.7%) | 4,538 (27.4%) |
| 4 or 5 Rooms | 7,855 (12.7%) | 7,825 (47.2%) |
| 6 or 7 Rooms | 17,476 (28.2%) | 2,328 (14.1%) |
| 8 or more Rooms | 36,125 (58.4%) | 1,296 (7.8%) |
| Total | 61,885 (100.0%) | 16,571 (100.0%) |
Housing Structure by Heating Type in Delaware County
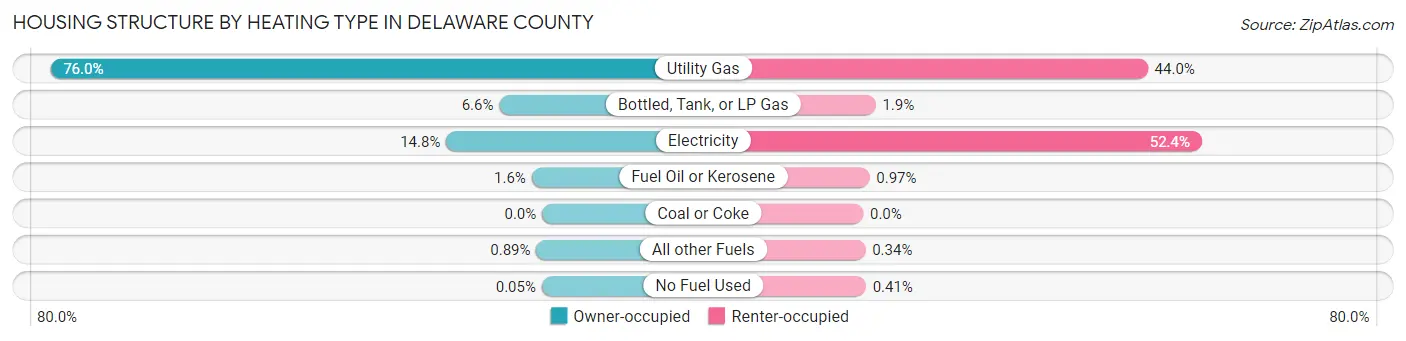
| Heating Type | Owner-occupied | Renter-occupied |
| Utility Gas | 47,050 (76.0%) | 7,291 (44.0%) |
| Bottled, Tank, or LP Gas | 4,090 (6.6%) | 318 (1.9%) |
| Electricity | 9,171 (14.8%) | 8,677 (52.4%) |
| Fuel Oil or Kerosene | 994 (1.6%) | 160 (1.0%) |
| Coal or Coke | 0 (0.0%) | 0 (0.0%) |
| All other Fuels | 548 (0.9%) | 57 (0.3%) |
| No Fuel Used | 32 (0.1%) | 68 (0.4%) |
| Total | 61,885 (100.0%) | 16,571 (100.0%) |
Household Vehicle Usage in Delaware County
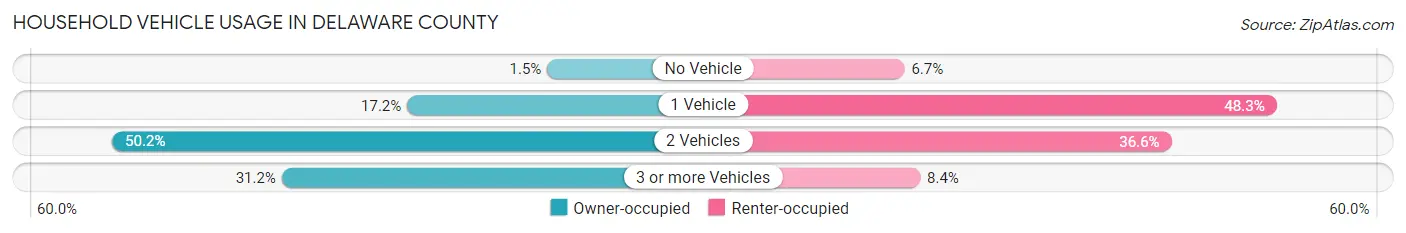
| Vehicles per Household | Owner-occupied | Renter-occupied |
| No Vehicle | 904 (1.5%) | 1,106 (6.7%) |
| 1 Vehicle | 10,613 (17.2%) | 8,010 (48.3%) |
| 2 Vehicles | 31,058 (50.2%) | 6,060 (36.6%) |
| 3 or more Vehicles | 19,310 (31.2%) | 1,395 (8.4%) |
| Total | 61,885 (100.0%) | 16,571 (100.0%) |
Real Estate & Mortgages in Delaware County
Real Estate and Mortgage Overview in Delaware County
| Characteristic | Without Mortgage | With Mortgage |
| Housing Units | 16,625 | 45,260 |
| Median Property Value | $353,400 | $404,500 |
| Median Household Income | $101,739 | $24,471 |
| Monthly Housing Costs | $910 | $12,246 |
| Real Estate Taxes | $5,911 | $303 |
Property Value by Mortgage Status in Delaware County
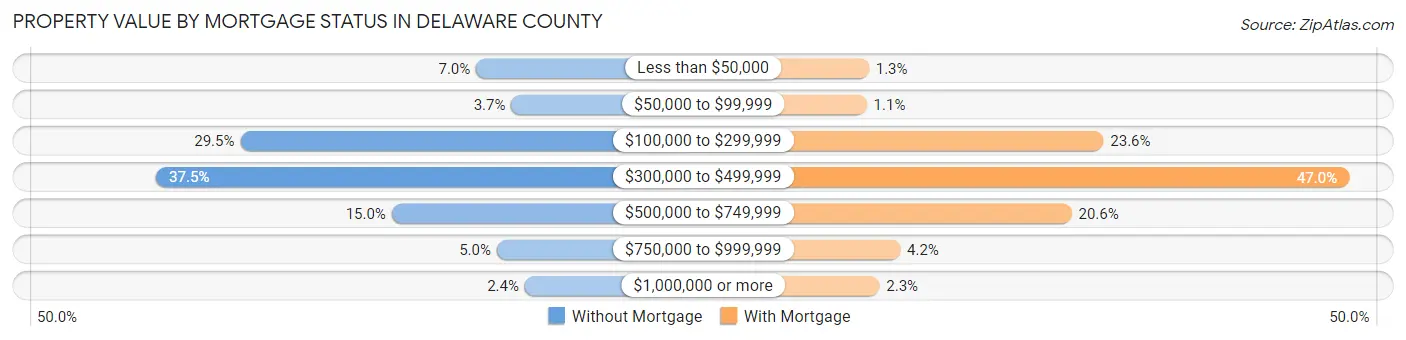
| Property Value | Without Mortgage | With Mortgage |
| Less than $50,000 | 1,164 (7.0%) | 572 (1.3%) |
| $50,000 to $99,999 | 606 (3.6%) | 479 (1.1%) |
| $100,000 to $299,999 | 4,897 (29.5%) | 10,682 (23.6%) |
| $300,000 to $499,999 | 6,229 (37.5%) | 21,269 (47.0%) |
| $500,000 to $749,999 | 2,500 (15.0%) | 9,311 (20.6%) |
| $750,000 to $999,999 | 836 (5.0%) | 1,921 (4.2%) |
| $1,000,000 or more | 393 (2.4%) | 1,026 (2.3%) |
| Total | 16,625 (100.0%) | 45,260 (100.0%) |
Household Income by Mortgage Status in Delaware County
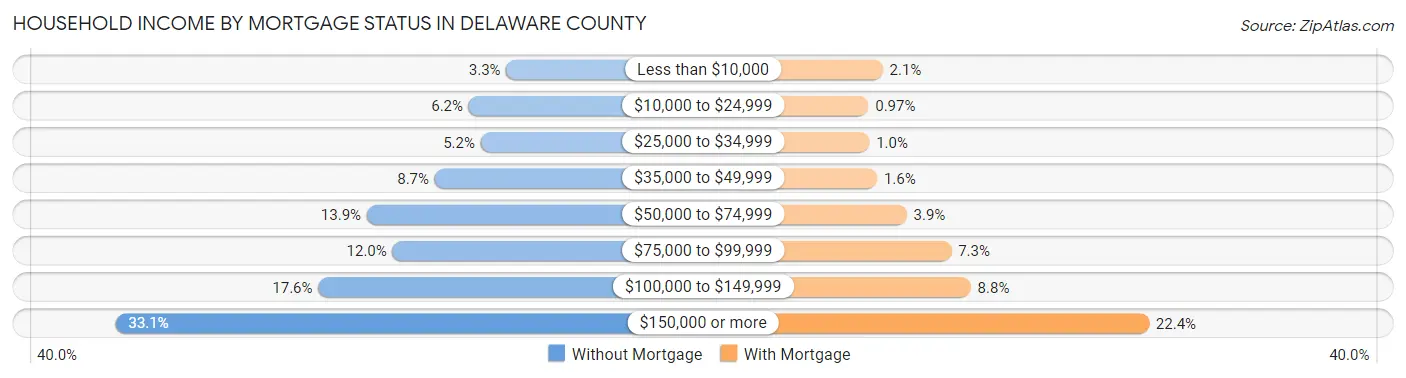
| Household Income | Without Mortgage | With Mortgage |
| Less than $10,000 | 547 (3.3%) | 934 (2.1%) |
| $10,000 to $24,999 | 1,023 (6.1%) | 440 (1.0%) |
| $25,000 to $34,999 | 871 (5.2%) | 471 (1.0%) |
| $35,000 to $49,999 | 1,453 (8.7%) | 736 (1.6%) |
| $50,000 to $74,999 | 2,315 (13.9%) | 1,760 (3.9%) |
| $75,000 to $99,999 | 1,988 (12.0%) | 3,298 (7.3%) |
| $100,000 to $149,999 | 2,929 (17.6%) | 3,968 (8.8%) |
| $150,000 or more | 5,499 (33.1%) | 10,116 (22.4%) |
| Total | 16,625 (100.0%) | 45,260 (100.0%) |
Property Value to Household Income Ratio in Delaware County
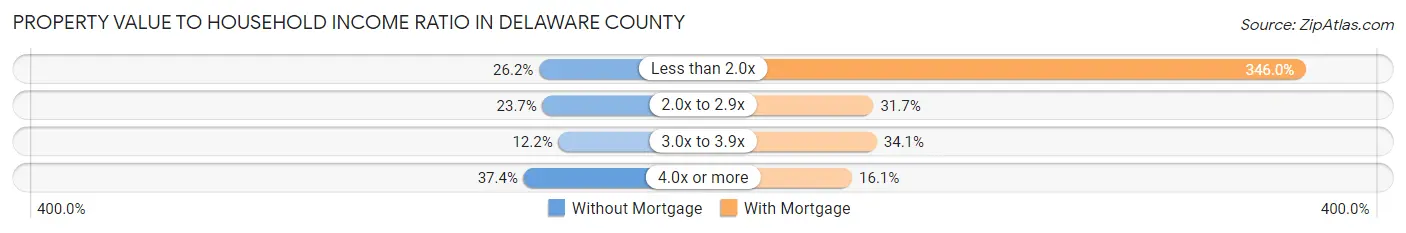
| Value-to-Income Ratio | Without Mortgage | With Mortgage |
| Less than 2.0x | 4,359 (26.2%) | 156,582 (346.0%) |
| 2.0x to 2.9x | 3,939 (23.7%) | 14,324 (31.7%) |
| 3.0x to 3.9x | 2,020 (12.1%) | 15,428 (34.1%) |
| 4.0x or more | 6,219 (37.4%) | 7,300 (16.1%) |
| Total | 16,625 (100.0%) | 45,260 (100.0%) |
Real Estate Taxes by Mortgage Status in Delaware County

| Property Taxes | Without Mortgage | With Mortgage |
| Less than $800 | 1,061 (6.4%) | 34 (0.1%) |
| $800 to $1,499 | 499 (3.0%) | 752 (1.7%) |
| $800 to $1,499 | 14,865 (89.4%) | 1,056 (2.3%) |
| Total | 16,625 (100.0%) | 45,260 (100.0%) |
Health & Disability in Delaware County
Health Insurance Coverage by Age in Delaware County
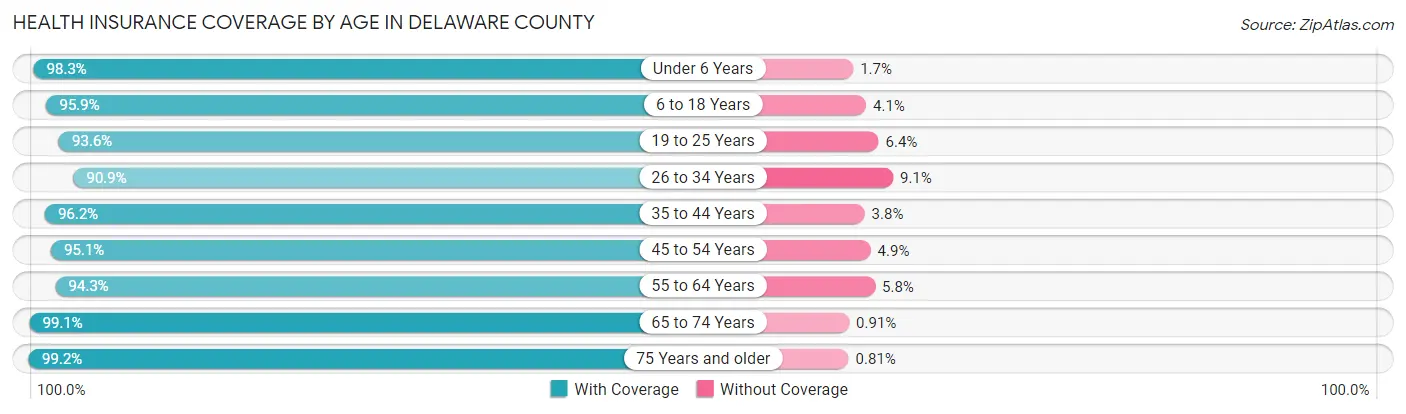
| Age Bracket | With Coverage | Without Coverage |
| Under 6 Years | 14,843 (98.3%) | 250 (1.7%) |
| 6 to 18 Years | 41,212 (95.9%) | 1,745 (4.1%) |
| 19 to 25 Years | 15,235 (93.6%) | 1,042 (6.4%) |
| 26 to 34 Years | 17,218 (90.9%) | 1,721 (9.1%) |
| 35 to 44 Years | 31,598 (96.2%) | 1,249 (3.8%) |
| 45 to 54 Years | 30,777 (95.1%) | 1,593 (4.9%) |
| 55 to 64 Years | 24,522 (94.3%) | 1,496 (5.8%) |
| 65 to 74 Years | 19,174 (99.1%) | 177 (0.9%) |
| 75 Years and older | 11,273 (99.2%) | 92 (0.8%) |
| Total | 205,852 (95.7%) | 9,365 (4.3%) |
Health Insurance Coverage by Citizenship Status in Delaware County
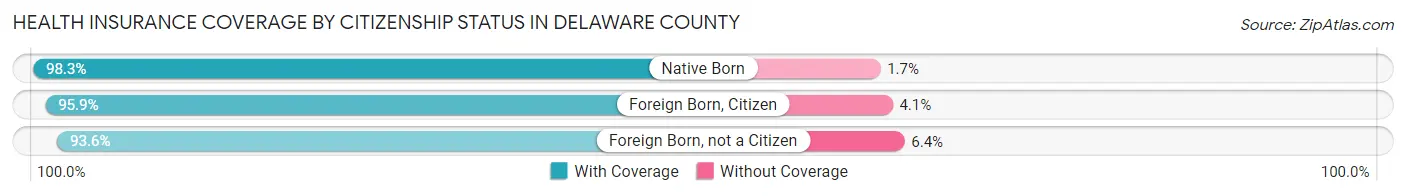
| Citizenship Status | With Coverage | Without Coverage |
| Native Born | 14,843 (98.3%) | 250 (1.7%) |
| Foreign Born, Citizen | 41,212 (95.9%) | 1,745 (4.1%) |
| Foreign Born, not a Citizen | 15,235 (93.6%) | 1,042 (6.4%) |
Health Insurance Coverage by Household Income in Delaware County
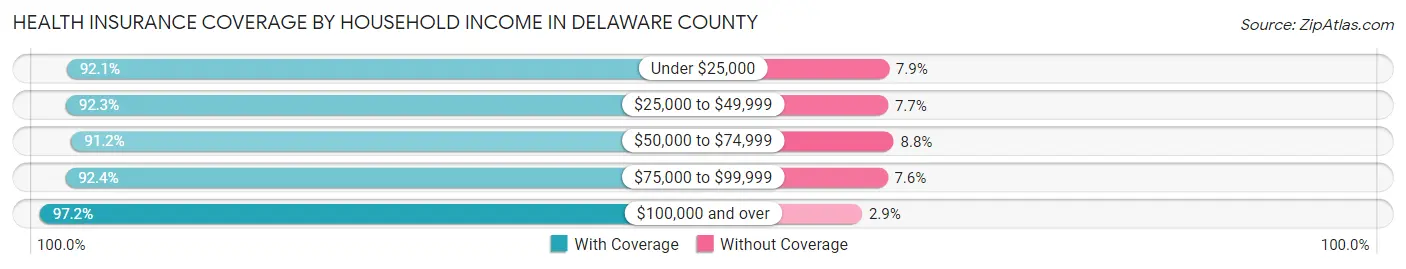
| Household Income | With Coverage | Without Coverage |
| Under $25,000 | 7,108 (92.1%) | 609 (7.9%) |
| $25,000 to $49,999 | 13,420 (92.3%) | 1,122 (7.7%) |
| $50,000 to $74,999 | 17,903 (91.2%) | 1,720 (8.8%) |
| $75,000 to $99,999 | 19,184 (92.4%) | 1,582 (7.6%) |
| $100,000 and over | 146,817 (97.2%) | 4,308 (2.9%) |
Public vs Private Health Insurance Coverage by Age in Delaware County
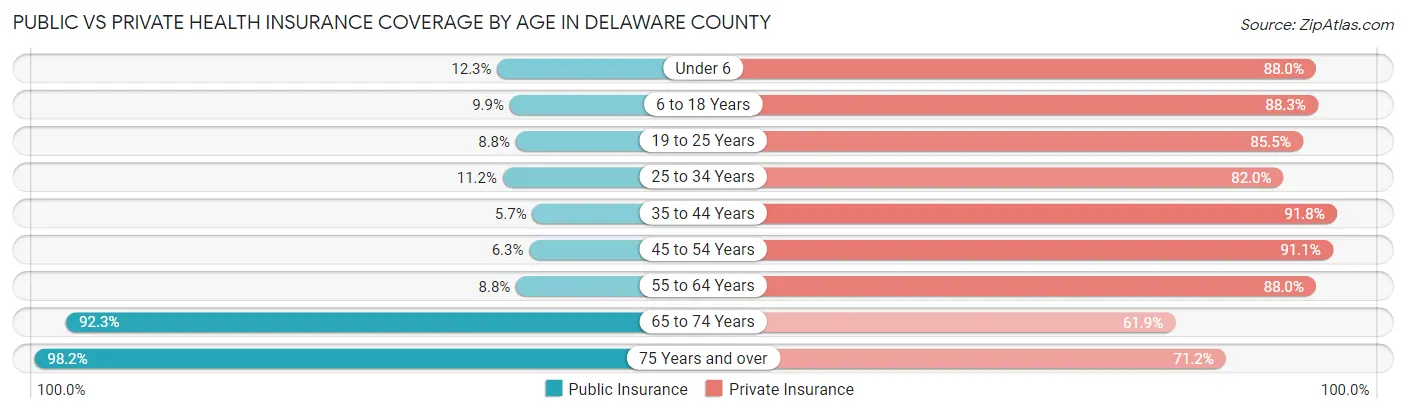
| Age Bracket | Public Insurance | Private Insurance |
| Under 6 | 1,849 (12.2%) | 13,277 (88.0%) |
| 6 to 18 Years | 4,270 (9.9%) | 37,941 (88.3%) |
| 19 to 25 Years | 1,435 (8.8%) | 13,921 (85.5%) |
| 25 to 34 Years | 2,129 (11.2%) | 15,523 (82.0%) |
| 35 to 44 Years | 1,883 (5.7%) | 30,162 (91.8%) |
| 45 to 54 Years | 2,046 (6.3%) | 29,478 (91.1%) |
| 55 to 64 Years | 2,279 (8.8%) | 22,887 (88.0%) |
| 65 to 74 Years | 17,863 (92.3%) | 11,969 (61.9%) |
| 75 Years and over | 11,158 (98.2%) | 8,096 (71.2%) |
| Total | 44,912 (20.9%) | 183,254 (85.2%) |
Disability Status by Sex by Age in Delaware County
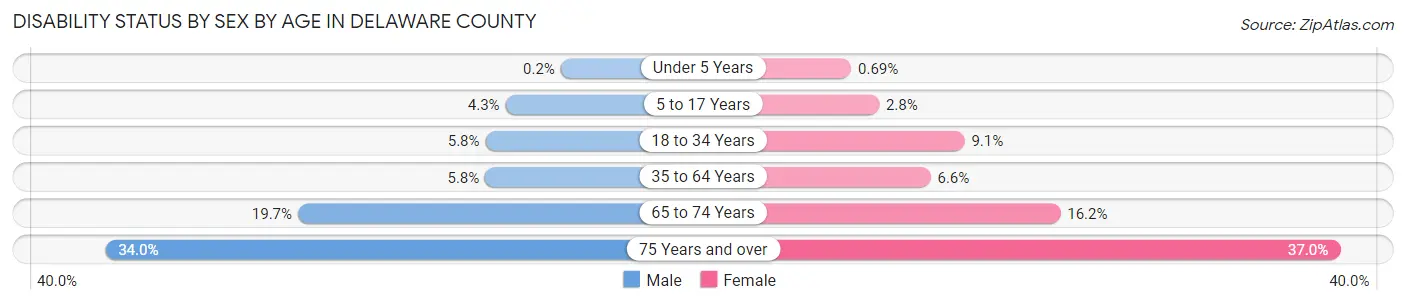
| Age Bracket | Male | Female |
| Under 5 Years | 13 (0.2%) | 41 (0.7%) |
| 5 to 17 Years | 935 (4.3%) | 572 (2.8%) |
| 18 to 34 Years | 1,120 (5.8%) | 1,739 (9.1%) |
| 35 to 64 Years | 2,674 (5.8%) | 2,978 (6.6%) |
| 65 to 74 Years | 1,852 (19.7%) | 1,614 (16.2%) |
| 75 Years and over | 1,652 (34.0%) | 2,407 (37.0%) |
Disability Class by Sex by Age in Delaware County
Disability Class: Hearing Difficulty
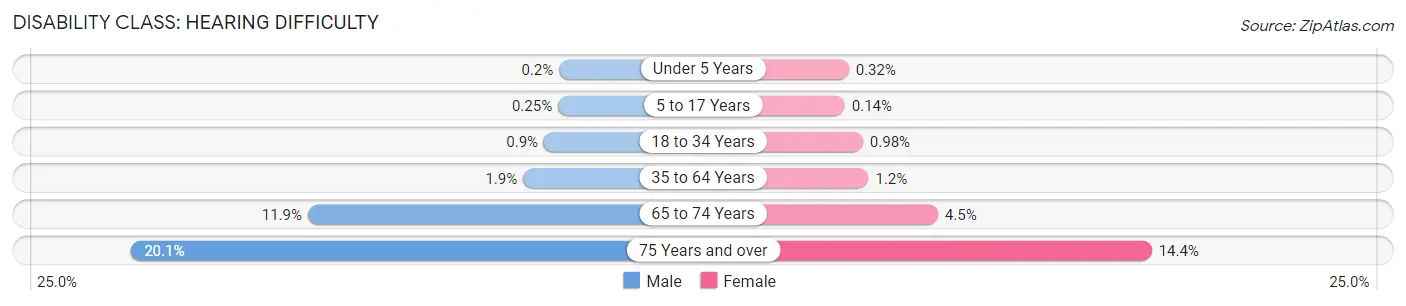
| Age Bracket | Male | Female |
| Under 5 Years | 13 (0.2%) | 19 (0.3%) |
| 5 to 17 Years | 54 (0.3%) | 30 (0.1%) |
| 18 to 34 Years | 174 (0.9%) | 187 (1.0%) |
| 35 to 64 Years | 861 (1.9%) | 560 (1.2%) |
| 65 to 74 Years | 1,115 (11.9%) | 444 (4.5%) |
| 75 Years and over | 974 (20.1%) | 936 (14.4%) |
Disability Class: Vision Difficulty
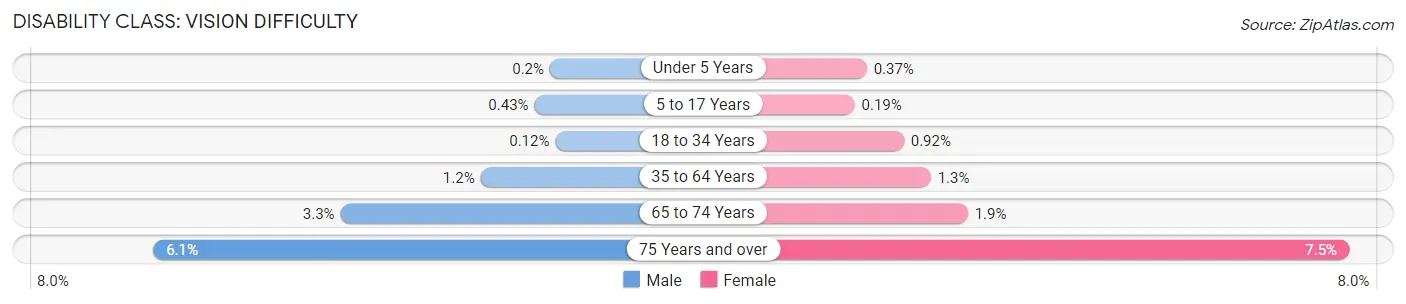
| Age Bracket | Male | Female |
| Under 5 Years | 13 (0.2%) | 22 (0.4%) |
| 5 to 17 Years | 94 (0.4%) | 40 (0.2%) |
| 18 to 34 Years | 23 (0.1%) | 176 (0.9%) |
| 35 to 64 Years | 568 (1.2%) | 597 (1.3%) |
| 65 to 74 Years | 311 (3.3%) | 186 (1.9%) |
| 75 Years and over | 296 (6.1%) | 490 (7.5%) |
Disability Class: Cognitive Difficulty
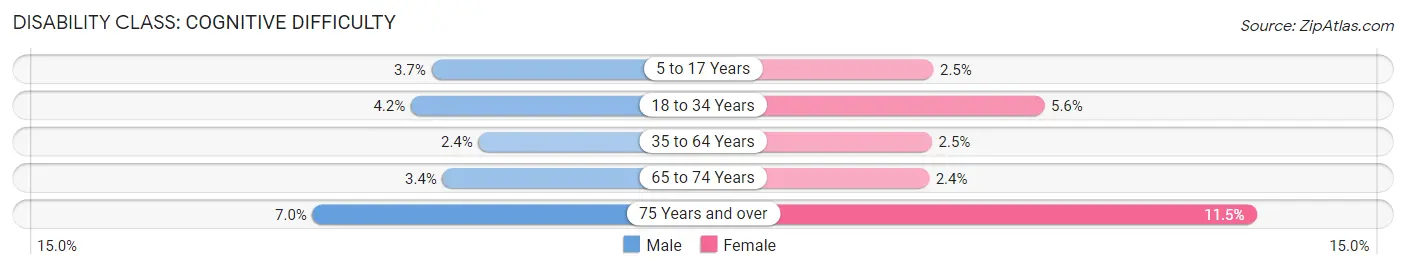
| Age Bracket | Male | Female |
| 5 to 17 Years | 798 (3.7%) | 527 (2.5%) |
| 18 to 34 Years | 821 (4.2%) | 1,074 (5.6%) |
| 35 to 64 Years | 1,086 (2.4%) | 1,132 (2.5%) |
| 65 to 74 Years | 316 (3.4%) | 241 (2.4%) |
| 75 Years and over | 339 (7.0%) | 751 (11.5%) |
Disability Class: Ambulatory Difficulty
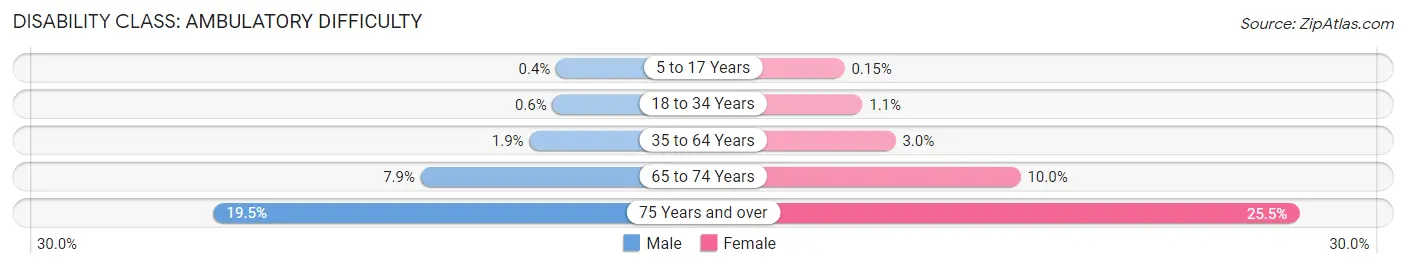
| Age Bracket | Male | Female |
| 5 to 17 Years | 86 (0.4%) | 32 (0.2%) |
| 18 to 34 Years | 117 (0.6%) | 217 (1.1%) |
| 35 to 64 Years | 870 (1.9%) | 1,354 (3.0%) |
| 65 to 74 Years | 746 (7.9%) | 990 (10.0%) |
| 75 Years and over | 946 (19.5%) | 1,657 (25.5%) |
Disability Class: Self-Care Difficulty
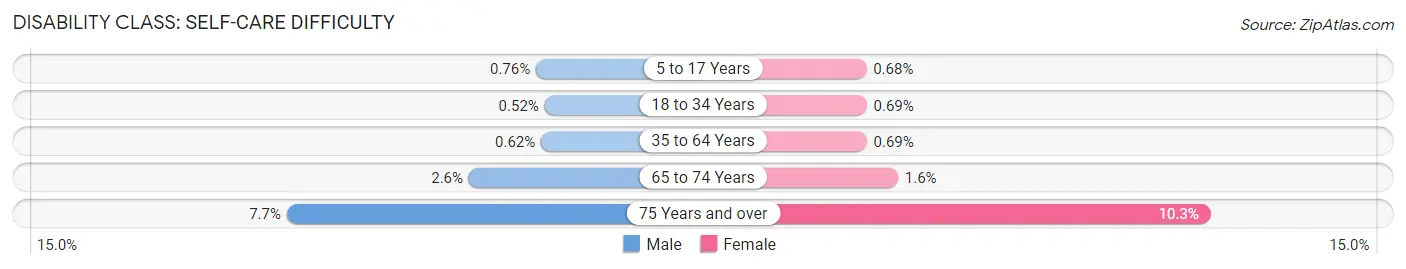
| Age Bracket | Male | Female |
| 5 to 17 Years | 165 (0.8%) | 141 (0.7%) |
| 18 to 34 Years | 101 (0.5%) | 131 (0.7%) |
| 35 to 64 Years | 283 (0.6%) | 311 (0.7%) |
| 65 to 74 Years | 247 (2.6%) | 155 (1.6%) |
| 75 Years and over | 374 (7.7%) | 668 (10.3%) |
Technology Access in Delaware County
Computing Device Access in Delaware County
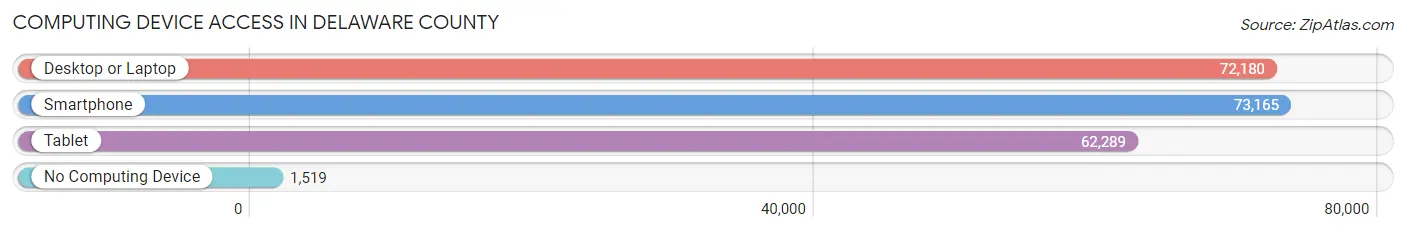
| Device Type | # Households | % Households |
| Desktop or Laptop | 72,180 | 92.0% |
| Smartphone | 73,165 | 93.3% |
| Tablet | 62,289 | 79.4% |
| No Computing Device | 1,519 | 1.9% |
| Total | 78,456 | 100.0% |
Internet Access in Delaware County
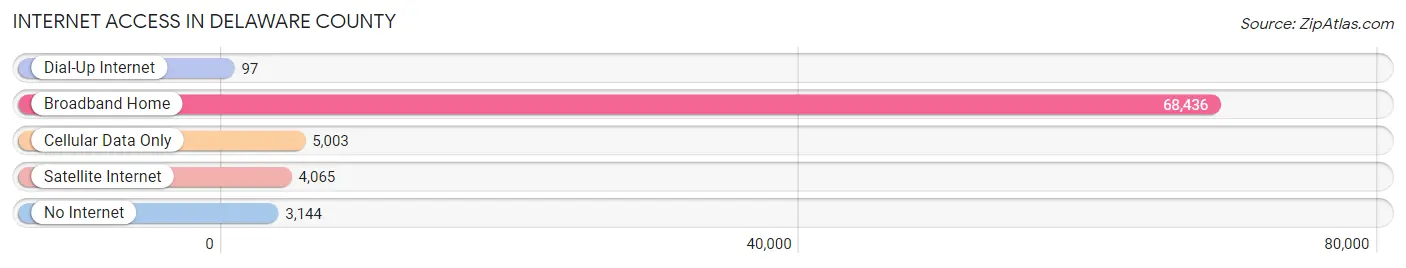
| Internet Type | # Households | % Households |
| Dial-Up Internet | 97 | 0.1% |
| Broadband Home | 68,436 | 87.2% |
| Cellular Data Only | 5,003 | 6.4% |
| Satellite Internet | 4,065 | 5.2% |
| No Internet | 3,144 | 4.0% |
| Total | 78,456 | 100.0% |
Delaware County Summary
Delaware County, Ohio is located in the central part of the state, just north of Columbus. It is bordered by Franklin, Licking, Morrow, Union, and Marion counties. The county seat is Delaware, and the county is home to over 200,000 people.
History
Delaware County was formed in 1808 from Franklin County. It was named after the Delaware Indians, who had inhabited the area for centuries before the arrival of European settlers. The county was originally part of the Northwest Territory, and was part of the Connecticut Western Reserve. The county was divided into townships in 1810, and the first county seat was located in Radnor. In 1816, the county seat was moved to Delaware.
The county was an important part of the Underground Railroad, with many of the county's residents helping to provide shelter and assistance to escaped slaves. The county was also home to several important figures in Ohio's history, including William Henry Harrison, the ninth president of the United States, and Rutherford B. Hayes, the 19th president.
Geography
Delaware County is located in the central part of Ohio, just north of Columbus. It is bordered by Franklin, Licking, Morrow, Union, and Marion counties. The county is mostly flat, with some rolling hills in the northern part of the county. The county is drained by the Olentangy and Scioto rivers. The county is home to several state parks, including Alum Creek State Park, Delaware State Park, and Highbanks Metro Park.
Economy
Delaware County has a diverse economy, with a mix of manufacturing, retail, and service industries. The county is home to several large employers, including Honda of America, Cardinal Health, and Nationwide Insurance. The county is also home to several colleges and universities, including Ohio Wesleyan University, Ohio State University, and Otterbein University.
Demographics
As of the 2010 census, Delaware County had a population of 174,214. The population was spread out, with 24.3% under the age of 18, 10.2% from 18 to 24, 28.2% from 25 to 44, 24.2% from 45 to 64, and 13.1% who were 65 years of age or older. The median age was 36.4 years. The median income for a household in the county was $60,945, and the median income for a family was $76,845. The per capita income for the county was $30,945.
Delaware County is predominantly white, with 87.3% of the population identifying as white. The largest minority group is African American, making up 8.2% of the population. Other minority groups include Asian (2.2%), Hispanic (1.7%), and Native American (0.3%).
Delaware County is a diverse and vibrant community, with a rich history and a strong economy. The county is home to several large employers, and is a popular destination for tourists and outdoor enthusiasts. The county is also home to several colleges and universities, making it an attractive place to live and work.
Common Questions
What is the Total Population of Delaware County?
Total Population of Delaware County is 216,074.
What is the Total Male Population of Delaware County?
Total Male Population of Delaware County is 108,175.
What is the Total Female Population of Delaware County?
Total Female Population of Delaware County is 107,899.
What is the Ratio of Males per 100 Females in Delaware County?
There are 100.26 Males per 100 Females in Delaware County.
What is the Ratio of Females per 100 Males in Delaware County?
There are 99.74 Females per 100 Males in Delaware County.
What is the Median Population Age in Delaware County?
Median Population Age in Delaware County is 39.8 Years.
What is the Average Family Size in Delaware County
Average Family Size in Delaware County is 3.1 People.
What is the Average Household Size in Delaware County
Average Household Size in Delaware County is 2.7 People.
What is Per Capita Income in Delaware County?
Per Capita income in Delaware County is $56,963.
What is the Median Family Income in Delaware County?
Median Family Income in Delaware County is $146,567.
What is the Median Household income in Delaware County?
Median Household Income in Delaware County is $123,995.
What is Income or Wage Gap in Delaware County?
Income or Wage Gap in Delaware County is 39.5%.
Women in Delaware County earn 60.5 cents for every dollar earned by a man.
What is Family Income Deficit in Delaware County?
Family Income Deficit in Delaware County is $10,070.
Families that are below poverty line in Delaware County earn $10,070 less on average than the poverty threshold level.
What is Inequality or Gini Index in Delaware County?
Inequality or Gini Index in Delaware County is 0.41.
How Large is the Labor Force in Delaware County?
There are 118,164 People in the Labor Forcein in Delaware County.
What is the Percentage of People in the Labor Force in Delaware County?
70.4% of People are in the Labor Force in Delaware County.
What is the Unemployment Rate in Delaware County?
Unemployment Rate in Delaware County is 3.0%.