Crawford County, OH
Crawford County Map
Crawford County Overview
41,861
TOTAL POPULATION
20,711
MALE POPULATION
21,150
FEMALE POPULATION
97.92
MALES / 100 FEMALES
102.12
FEMALES / 100 MALES
42.9
MEDIAN AGE
2.8
AVG FAMILY SIZE
2.3
AVG HOUSEHOLD SIZE
$29,566
PER CAPITA INCOME
$65,249
AVG FAMILY INCOME
$52,486
AVG HOUSEHOLD INCOME
35.9%
WAGE / INCOME GAP [ % ]
64.1¢/ $1
WAGE / INCOME GAP [ $ ]
$11,848
FAMILY INCOME DEFICIT
0.42
INEQUALITY / GINI INDEX
20,358
LABOR FORCE [ PEOPLE ]
60.3%
PERCENT IN LABOR FORCE
5.5%
UNEMPLOYMENT RATE
Race in Crawford County
The most populous races in Crawford County are White / Caucasian (40,074 | 95.7%), Two or more Races (1,055 | 2.5%), and Hispanic or Latino (769 | 1.8%).

| Race | # Population | % Population |
| Asian | 274 | 0.6% |
| Black / African American | 369 | 0.9% |
| Hawaiian / Pacific | 3 | 0.0% |
| Hispanic or Latino | 769 | 1.8% |
| Native / Alaskan | 6 | 0.0% |
| White / Caucasian | 40,074 | 95.7% |
| Two or more Races | 1,055 | 2.5% |
| Some other Race | 80 | 0.2% |
| Total | 41,861 | 100.0% |
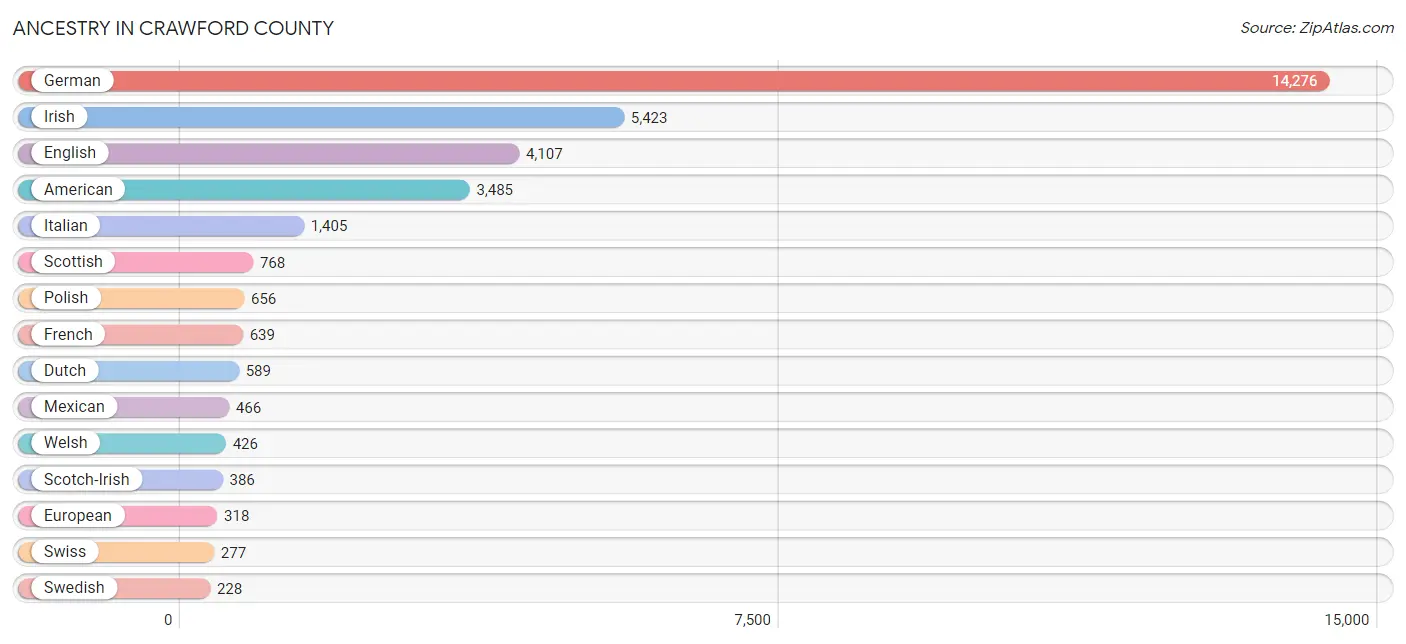
Ancestry in Crawford County
The most populous ancestries reported in Crawford County are German (14,276 | 34.1%), Irish (5,423 | 13.0%), English (4,107 | 9.8%), American (3,485 | 8.3%), and Italian (1,405 | 3.4%), together accounting for 68.5% of all Crawford County residents.
| Ancestry | # Population | % Population |
| African | 17 | 0.0% |
| Albanian | 11 | 0.0% |
| Alsatian | 3 | 0.0% |
| American | 3,485 | 8.3% |
| Arab | 21 | 0.1% |
| Australian | 9 | 0.0% |
| Austrian | 159 | 0.4% |
| Barbadian | 3 | 0.0% |
| Belgian | 14 | 0.0% |
| Bhutanese | 207 | 0.5% |
| Blackfeet | 26 | 0.1% |
| British | 150 | 0.4% |
| Bulgarian | 9 | 0.0% |
| Burmese | 22 | 0.1% |
| Canadian | 76 | 0.2% |
| Celtic | 4 | 0.0% |
| Cherokee | 93 | 0.2% |
| Chickasaw | 2 | 0.0% |
| Colombian | 1 | 0.0% |
| Creek | 2 | 0.0% |
| Croatian | 32 | 0.1% |
| Cuban | 3 | 0.0% |
| Czech | 137 | 0.3% |
| Czechoslovakian | 6 | 0.0% |
| Danish | 46 | 0.1% |
| Dominican | 19 | 0.1% |
| Dutch | 589 | 1.4% |
| Eastern European | 87 | 0.2% |
| English | 4,107 | 9.8% |
| European | 318 | 0.8% |
| Finnish | 16 | 0.0% |
| French | 639 | 1.5% |
| French American Indian | 3 | 0.0% |
| French Canadian | 90 | 0.2% |
| German | 14,276 | 34.1% |
| Greek | 56 | 0.1% |
| Hungarian | 159 | 0.4% |
| Indian (Asian) | 80 | 0.2% |
| Irish | 5,423 | 13.0% |
| Iroquois | 3 | 0.0% |
| Italian | 1,405 | 3.4% |
| Lebanese | 10 | 0.0% |
| Lithuanian | 18 | 0.0% |
| Lumbee | 5 | 0.0% |
| Mexican | 466 | 1.1% |
| Mexican American Indian | 1 | 0.0% |
| Native Hawaiian | 16 | 0.0% |
| Navajo | 2 | 0.0% |
| Nigerian | 20 | 0.1% |
| Northern European | 72 | 0.2% |
| Norwegian | 181 | 0.4% |
| Pennsylvania German | 40 | 0.1% |
| Polish | 656 | 1.6% |
| Portuguese | 46 | 0.1% |
| Puerto Rican | 223 | 0.5% |
| Romanian | 40 | 0.1% |
| Russian | 115 | 0.3% |
| Scandinavian | 31 | 0.1% |
| Scotch-Irish | 386 | 0.9% |
| Scottish | 768 | 1.8% |
| Sioux | 3 | 0.0% |
| Slavic | 5 | 0.0% |
| Slovak | 27 | 0.1% |
| South African | 8 | 0.0% |
| South American | 1 | 0.0% |
| Spaniard | 11 | 0.0% |
| Spanish | 46 | 0.1% |
| Subsaharan African | 50 | 0.1% |
| Swedish | 228 | 0.5% |
| Swiss | 277 | 0.7% |
| Thai | 7 | 0.0% |
| Ugandan | 1 | 0.0% |
| Ukrainian | 23 | 0.1% |
| Welsh | 426 | 1.0% |
| Yugoslavian | 3 | 0.0% | View All 75 Rows |
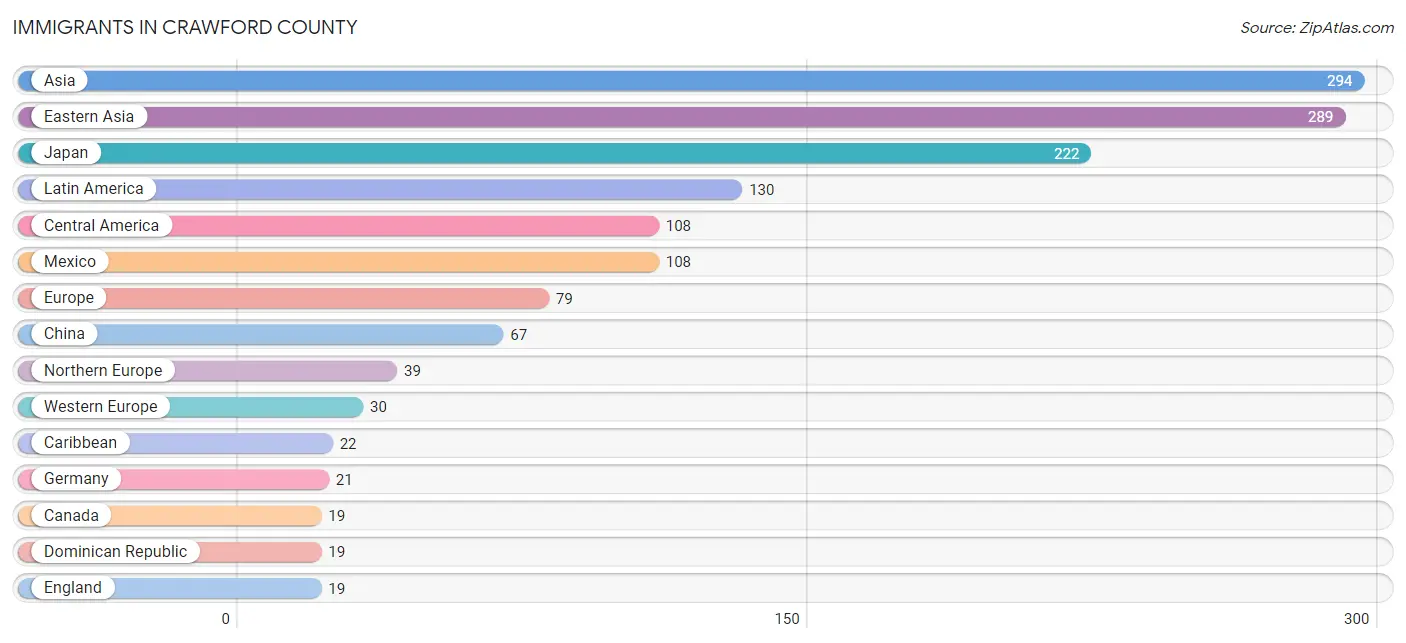
Immigrants in Crawford County
The most numerous immigrant groups reported in Crawford County came from Asia (294 | 0.7%), Eastern Asia (289 | 0.7%), Japan (222 | 0.5%), Latin America (130 | 0.3%), and Central America (108 | 0.3%), together accounting for 2.5% of all Crawford County residents.
| Immigration Origin | # Population | % Population |
| Africa | 9 | 0.0% |
| Asia | 294 | 0.7% |
| Barbados | 3 | 0.0% |
| Canada | 19 | 0.1% |
| Caribbean | 22 | 0.1% |
| Central America | 108 | 0.3% |
| China | 67 | 0.2% |
| Dominican Republic | 19 | 0.1% |
| Eastern Africa | 1 | 0.0% |
| Eastern Asia | 289 | 0.7% |
| England | 19 | 0.1% |
| Europe | 79 | 0.2% |
| Germany | 21 | 0.1% |
| Greece | 10 | 0.0% |
| Japan | 222 | 0.5% |
| Kazakhstan | 5 | 0.0% |
| Latin America | 130 | 0.3% |
| Mexico | 108 | 0.3% |
| Netherlands | 9 | 0.0% |
| Northern Europe | 39 | 0.1% |
| South Africa | 8 | 0.0% |
| South Central Asia | 5 | 0.0% |
| Southern Europe | 10 | 0.0% |
| Taiwan | 15 | 0.0% |
| Uganda | 1 | 0.0% |
| Western Europe | 30 | 0.1% | View All 26 Rows |
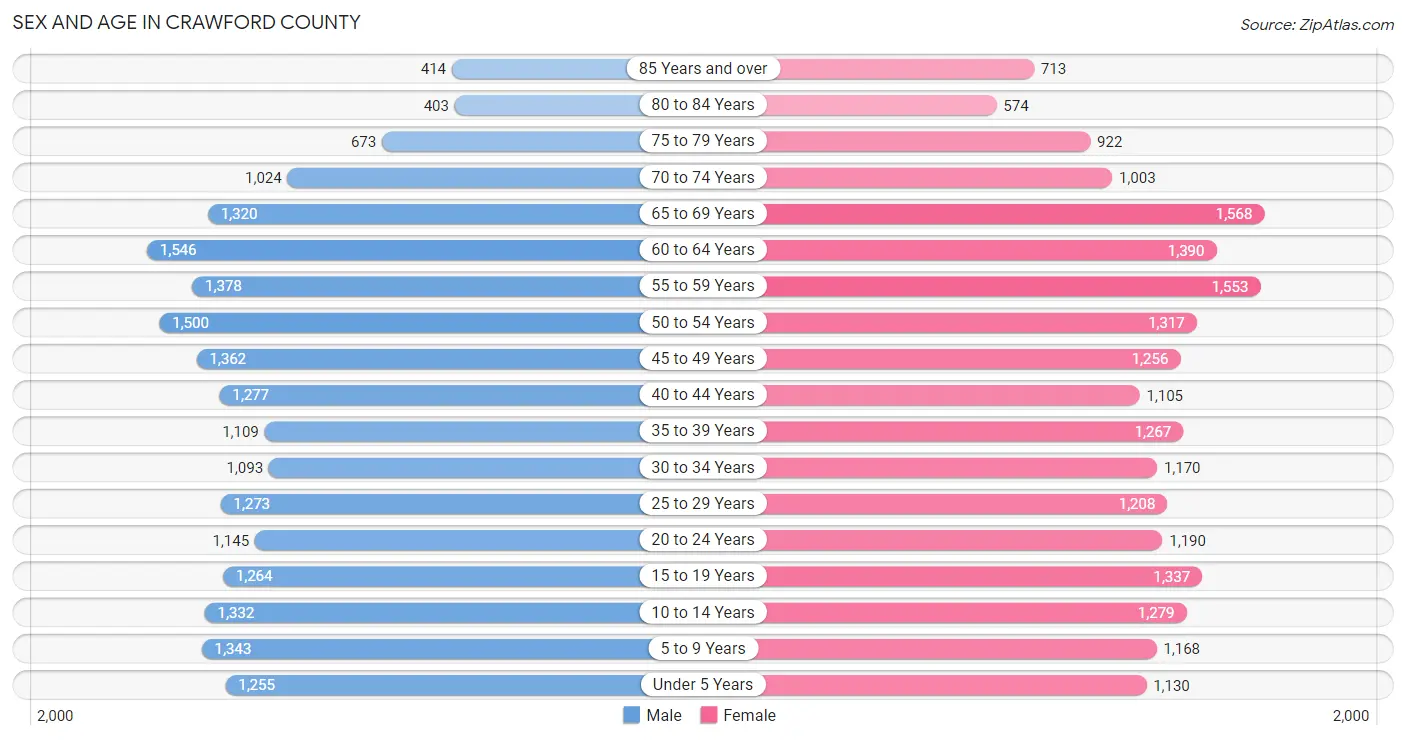
Sex and Age in Crawford County
Sex and Age in Crawford County
The most populous age groups in Crawford County are 60 to 64 Years (1,546 | 7.5%) for men and 65 to 69 Years (1,568 | 7.4%) for women.
| Age Bracket | Male | Female |
| Under 5 Years | 1,255 (6.1%) | 1,130 (5.3%) |
| 5 to 9 Years | 1,343 (6.5%) | 1,168 (5.5%) |
| 10 to 14 Years | 1,332 (6.4%) | 1,279 (6.0%) |
| 15 to 19 Years | 1,264 (6.1%) | 1,337 (6.3%) |
| 20 to 24 Years | 1,145 (5.5%) | 1,190 (5.6%) |
| 25 to 29 Years | 1,273 (6.1%) | 1,208 (5.7%) |
| 30 to 34 Years | 1,093 (5.3%) | 1,170 (5.5%) |
| 35 to 39 Years | 1,109 (5.3%) | 1,267 (6.0%) |
| 40 to 44 Years | 1,277 (6.2%) | 1,105 (5.2%) |
| 45 to 49 Years | 1,362 (6.6%) | 1,256 (5.9%) |
| 50 to 54 Years | 1,500 (7.2%) | 1,317 (6.2%) |
| 55 to 59 Years | 1,378 (6.7%) | 1,553 (7.3%) |
| 60 to 64 Years | 1,546 (7.5%) | 1,390 (6.6%) |
| 65 to 69 Years | 1,320 (6.4%) | 1,568 (7.4%) |
| 70 to 74 Years | 1,024 (4.9%) | 1,003 (4.7%) |
| 75 to 79 Years | 673 (3.3%) | 922 (4.4%) |
| 80 to 84 Years | 403 (1.9%) | 574 (2.7%) |
| 85 Years and over | 414 (2.0%) | 713 (3.4%) |
| Total | 20,711 (100.0%) | 21,150 (100.0%) |
Families and Households in Crawford County
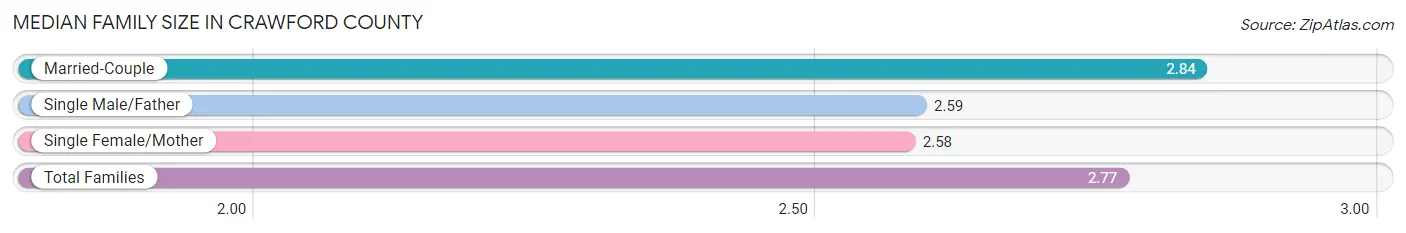
Median Family Size in Crawford County
The median family size in Crawford County is 2.77 persons per family, with married-couple families (8,494 | 73.6%) accounting for the largest median family size of 2.84 persons per family. On the other hand, single female/mother families (2,230 | 19.3%) represent the smallest median family size with 2.58 persons per family.
| Family Type | # Families | Family Size |
| Married-Couple | 8,494 (73.6%) | 2.84 |
| Single Male/Father | 813 (7.0%) | 2.59 |
| Single Female/Mother | 2,230 (19.3%) | 2.58 |
| Total Families | 11,537 (100.0%) | 2.77 |
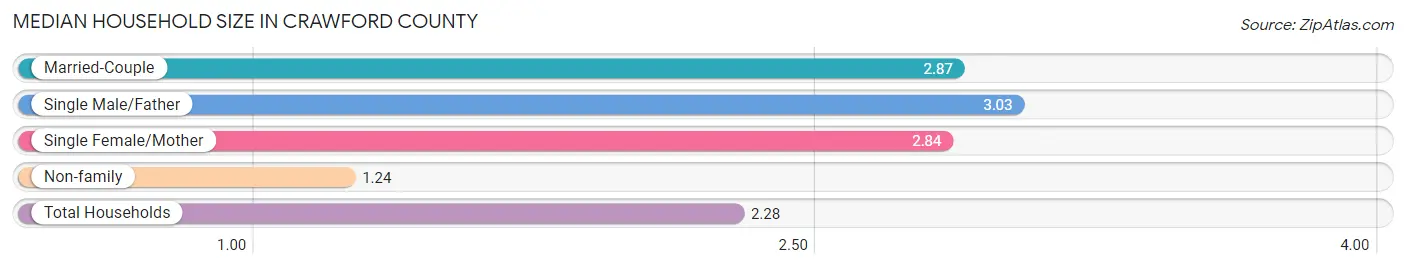
Median Household Size in Crawford County
The median household size in Crawford County is 2.28 persons per household, with single male/father households (813 | 4.5%) accounting for the largest median household size of 3.03 persons per household. non-family households (6,631 | 36.5%) represent the smallest median household size with 1.24 persons per household.
| Household Type | # Households | Household Size |
| Married-Couple | 8,494 (46.8%) | 2.87 |
| Single Male/Father | 813 (4.5%) | 3.03 |
| Single Female/Mother | 2,230 (12.3%) | 2.84 |
| Non-family | 6,631 (36.5%) | 1.24 |
| Total Households | 18,168 (100.0%) | 2.28 |
Household Size by Marriage Status in Crawford County
Out of a total of 18,168 households in Crawford County, 11,537 (63.5%) are family households, while 6,631 (36.5%) are nonfamily households. The most numerous type of family households are 2-person households, comprising 5,576, and the most common type of nonfamily households are 1-person households, comprising 5,413.

| Household Size | Family Households | Nonfamily Households |
| 1-Person Households | - | 5,413 (29.8%) |
| 2-Person Households | 5,576 (30.7%) | 971 (5.3%) |
| 3-Person Households | 2,601 (14.3%) | 110 (0.6%) |
| 4-Person Households | 2,002 (11.0%) | 59 (0.3%) |
| 5-Person Households | 892 (4.9%) | 78 (0.4%) |
| 6-Person Households | 274 (1.5%) | 0 (0.0%) |
| 7+ Person Households | 192 (1.1%) | 0 (0.0%) |
| Total | 11,537 (63.5%) | 6,631 (36.5%) |
Female Fertility in Crawford County
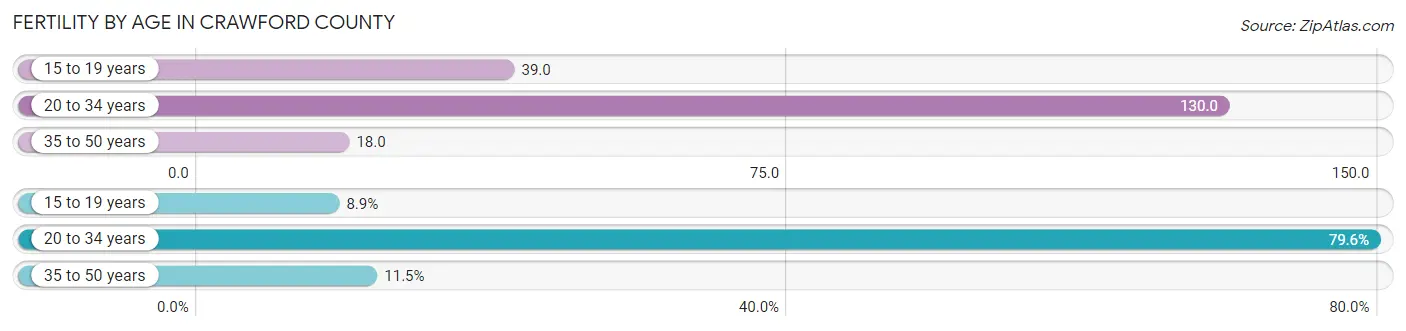
Fertility by Age in Crawford County
Average fertility rate in Crawford County is 67.0 births per 1,000 women. Women in the age bracket of 20 to 34 years have the highest fertility rate with 130.0 births per 1,000 women. Women in the age bracket of 20 to 34 years acount for 79.6% of all women with births.
| Age Bracket | Women with Births | Births / 1,000 Women |
| 15 to 19 years | 52 (8.9%) | 39.0 |
| 20 to 34 years | 464 (79.6%) | 130.0 |
| 35 to 50 years | 67 (11.5%) | 18.0 |
| Total | 583 (100.0%) | 67.0 |
Fertility by Age by Marriage Status in Crawford County
58.1% of women with births (583) in Crawford County are married. The highest percentage of unmarried women with births falls into 15 to 19 years age bracket with 100.0% of them unmarried at the time of birth, while the lowest percentage of unmarried women with births belong to 20 to 34 years age bracket with 35.6% of them unmarried.

| Age Bracket | Married | Unmarried |
| 15 to 19 years | 0 (0.0%) | 52 (100.0%) |
| 20 to 34 years | 299 (64.4%) | 165 (35.6%) |
| 35 to 50 years | 40 (59.7%) | 27 (40.3%) |
| Total | 339 (58.2%) | 244 (41.8%) |
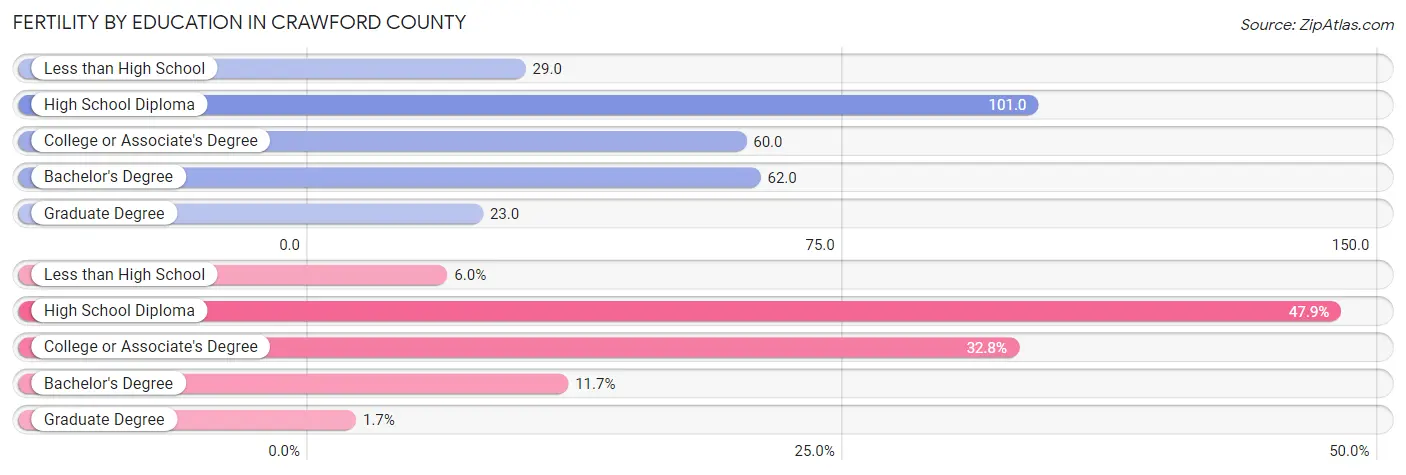
Fertility by Education in Crawford County
Average fertility rate in Crawford County is 67.0 births per 1,000 women. Women with the education attainment of high school diploma have the highest fertility rate of 101.0 births per 1,000 women, while women with the education attainment of graduate degree have the lowest fertility at 23.0 births per 1,000 women. Women with the education attainment of high school diploma represent 47.9% of all women with births.
| Educational Attainment | Women with Births | Births / 1,000 Women |
| Less than High School | 35 (6.0%) | 29.0 |
| High School Diploma | 279 (47.9%) | 101.0 |
| College or Associate's Degree | 191 (32.8%) | 60.0 |
| Bachelor's Degree | 68 (11.7%) | 62.0 |
| Graduate Degree | 10 (1.7%) | 23.0 |
| Total | 583 (100.0%) | 67.0 |
Fertility by Education by Marriage Status in Crawford County
41.8% of women with births in Crawford County are unmarried. Women with the educational attainment of bachelor's degree are most likely to be married with 92.6% of them married at childbirth, while women with the educational attainment of less than high school are least likely to be married with 100.0% of them unmarried at childbirth.
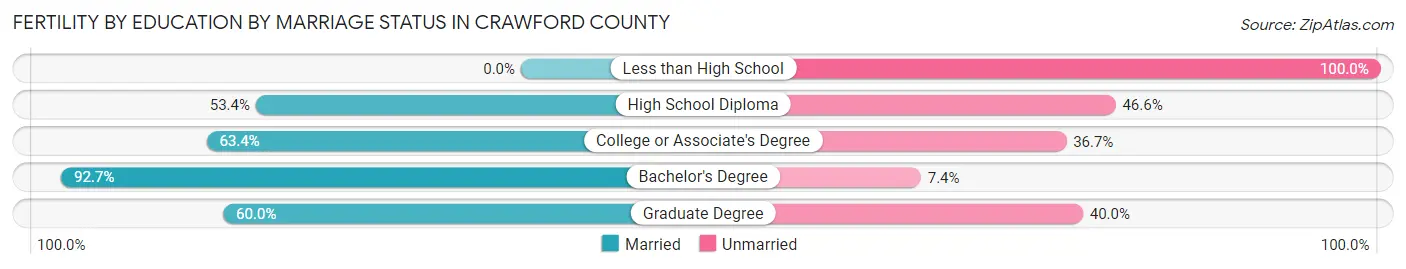
| Educational Attainment | Married | Unmarried |
| Less than High School | 0 (0.0%) | 35 (100.0%) |
| High School Diploma | 149 (53.4%) | 130 (46.6%) |
| College or Associate's Degree | 121 (63.3%) | 70 (36.6%) |
| Bachelor's Degree | 63 (92.6%) | 5 (7.3%) |
| Graduate Degree | 6 (60.0%) | 4 (40.0%) |
| Total | 339 (58.2%) | 244 (41.8%) |
Income in Crawford County
Income Overview in Crawford County
Per Capita Income in Crawford County is $29,566, while median incomes of families and households are $65,249 and $52,486 respectively.
| Characteristic | Number | Measure |
| Per Capita Income | 41,861 | $29,566 |
| Median Family Income | 11,537 | $65,249 |
| Mean Family Income | 11,537 | $79,935 |
| Median Household Income | 18,168 | $52,486 |
| Mean Household Income | 18,168 | $68,161 |
| Income Deficit | 11,537 | $11,848 |
| Wage / Income Gap (%) | 41,861 | 35.91% |
| Wage / Income Gap ($) | 41,861 | 64.09¢ per $1 |
| Gini / Inequality Index | 41,861 | 0.42 |
Earnings by Sex in Crawford County
Average Earnings in Crawford County are $35,739, $42,112 for men and $26,989 for women, a difference of 35.9%.
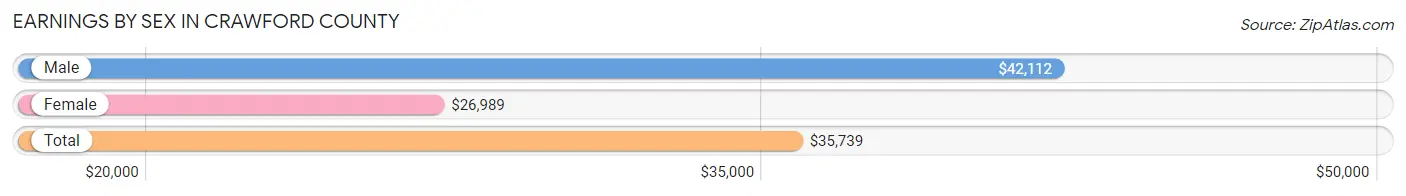
| Sex | Number | Average Earnings |
| Male | 11,138 (52.5%) | $42,112 |
| Female | 10,084 (47.5%) | $26,989 |
| Total | 21,222 (100.0%) | $35,739 |
Earnings by Sex by Income Bracket in Crawford County
The most common earnings brackets in Crawford County are $55,000 to $64,999 for men (1,150 | 10.3%) and $25,000 to $29,999 for women (895 | 8.9%).
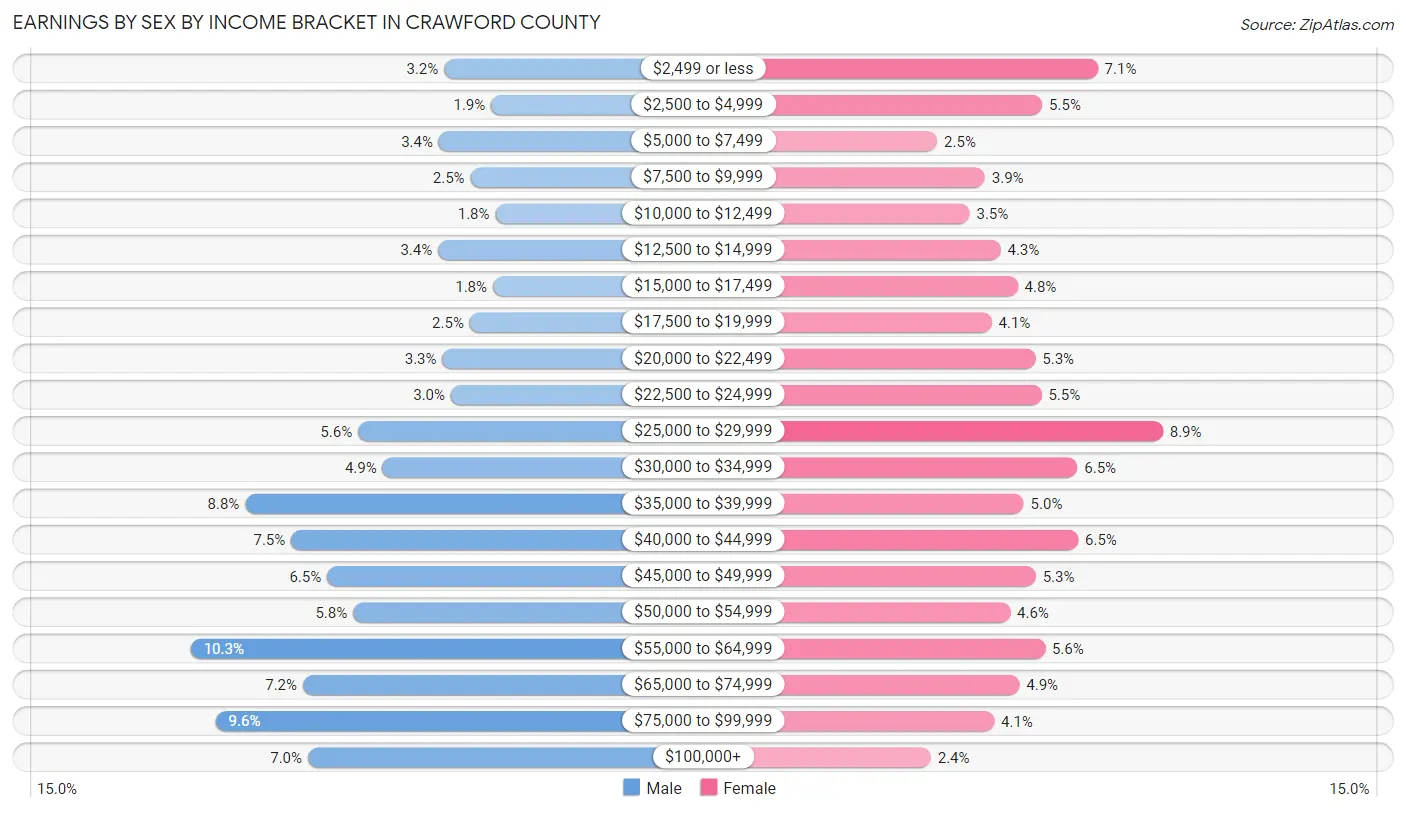
| Income | Male | Female |
| $2,499 or less | 357 (3.2%) | 711 (7.0%) |
| $2,500 to $4,999 | 210 (1.9%) | 554 (5.5%) |
| $5,000 to $7,499 | 374 (3.4%) | 256 (2.5%) |
| $7,500 to $9,999 | 275 (2.5%) | 391 (3.9%) |
| $10,000 to $12,499 | 197 (1.8%) | 348 (3.5%) |
| $12,500 to $14,999 | 377 (3.4%) | 436 (4.3%) |
| $15,000 to $17,499 | 205 (1.8%) | 484 (4.8%) |
| $17,500 to $19,999 | 277 (2.5%) | 410 (4.1%) |
| $20,000 to $22,499 | 363 (3.3%) | 534 (5.3%) |
| $22,500 to $24,999 | 336 (3.0%) | 552 (5.5%) |
| $25,000 to $29,999 | 627 (5.6%) | 895 (8.9%) |
| $30,000 to $34,999 | 550 (4.9%) | 653 (6.5%) |
| $35,000 to $39,999 | 980 (8.8%) | 501 (5.0%) |
| $40,000 to $44,999 | 836 (7.5%) | 655 (6.5%) |
| $45,000 to $49,999 | 724 (6.5%) | 535 (5.3%) |
| $50,000 to $54,999 | 643 (5.8%) | 463 (4.6%) |
| $55,000 to $64,999 | 1,150 (10.3%) | 562 (5.6%) |
| $65,000 to $74,999 | 800 (7.2%) | 489 (4.9%) |
| $75,000 to $99,999 | 1,073 (9.6%) | 417 (4.1%) |
| $100,000+ | 784 (7.0%) | 238 (2.4%) |
| Total | 11,138 (100.0%) | 10,084 (100.0%) |
Earnings by Sex by Educational Attainment in Crawford County
Average earnings in Crawford County are $45,437 for men and $30,818 for women, a difference of 32.2%. Men with an educational attainment of graduate degree enjoy the highest average annual earnings of $73,068, while those with less than high school education earn the least with $34,627. Women with an educational attainment of graduate degree earn the most with the average annual earnings of $59,706, while those with high school diploma education have the smallest earnings of $25,071.

| Educational Attainment | Male Income | Female Income |
| Less than High School | $34,627 | $26,141 |
| High School Diploma | $41,449 | $25,071 |
| College or Associate's Degree | $52,325 | $28,849 |
| Bachelor's Degree | $52,188 | $41,846 |
| Graduate Degree | $73,068 | $59,706 |
| Total | $45,437 | $30,818 |
Family Income in Crawford County
Family Income Brackets in Crawford County
According to the Crawford County family income data, there are 2,607 families falling into the $50,000 to $74,999 income range, which is the most common income bracket and makes up 22.6% of all families. Conversely, the $10,000 to $14,999 income bracket is the least frequent group with only 150 families (1.3%) belonging to this category.
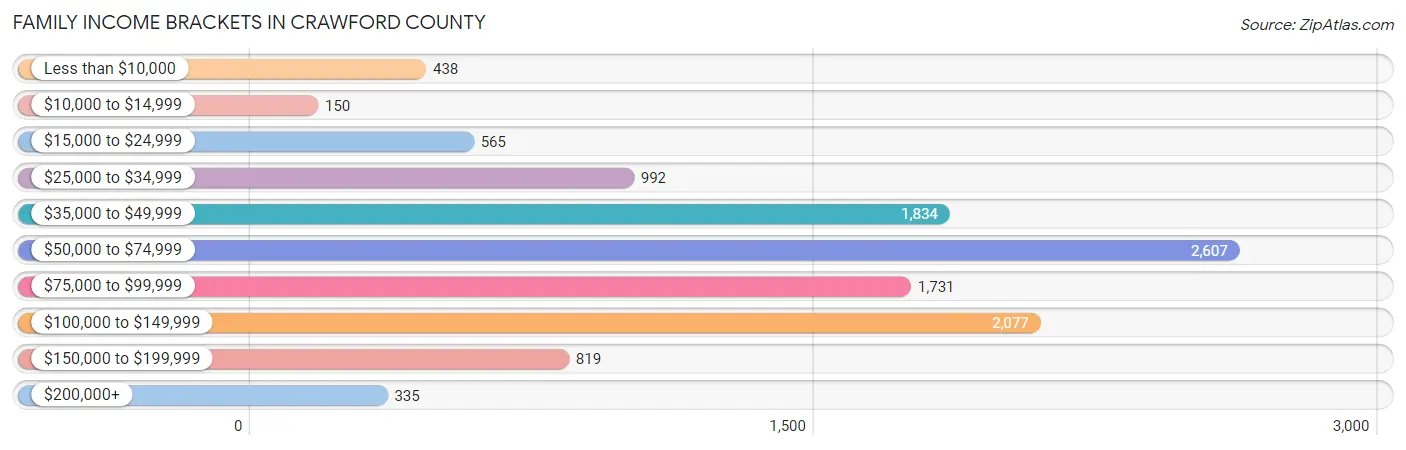
| Income Bracket | # Families | % Families |
| Less than $10,000 | 438 | 3.8% |
| $10,000 to $14,999 | 150 | 1.3% |
| $15,000 to $24,999 | 565 | 4.9% |
| $25,000 to $34,999 | 992 | 8.6% |
| $35,000 to $49,999 | 1,834 | 15.9% |
| $50,000 to $74,999 | 2,607 | 22.6% |
| $75,000 to $99,999 | 1,731 | 15.0% |
| $100,000 to $149,999 | 2,077 | 18.0% |
| $150,000 to $199,999 | 819 | 7.1% |
| $200,000+ | 335 | 2.9% |
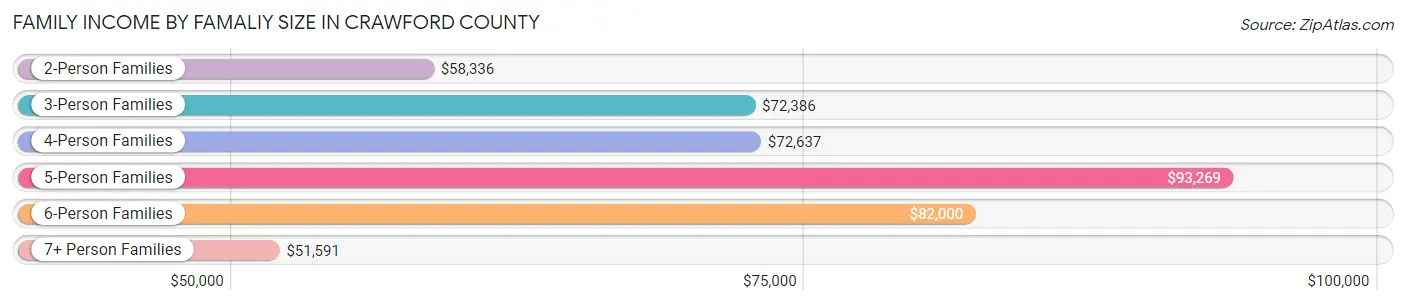
Family Income by Famaliy Size in Crawford County
5-person families (858 | 7.4%) account for the highest median family income in Crawford County with $93,269 per family, while 2-person families (6,027 | 52.2%) have the highest median income of $29,168 per family member.
| Income Bracket | # Families | Median Income |
| 2-Person Families | 6,027 (52.2%) | $58,336 |
| 3-Person Families | 2,405 (20.8%) | $72,386 |
| 4-Person Families | 1,909 (16.6%) | $72,637 |
| 5-Person Families | 858 (7.4%) | $93,269 |
| 6-Person Families | 192 (1.7%) | $82,000 |
| 7+ Person Families | 146 (1.3%) | $51,591 |
| Total | 11,537 (100.0%) | $65,249 |
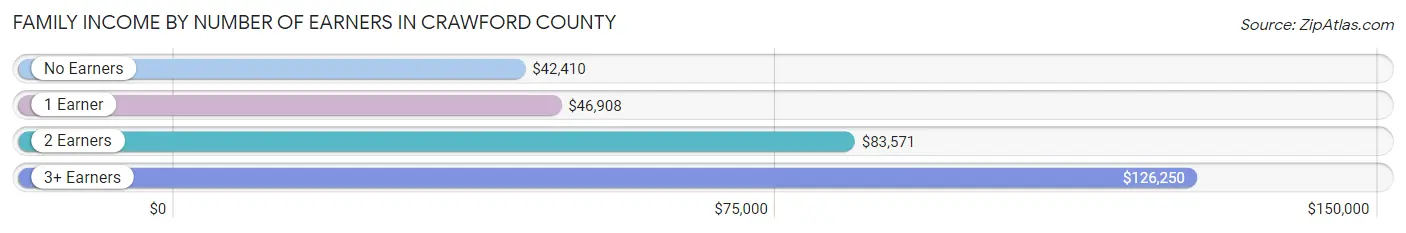
Family Income by Number of Earners in Crawford County
The median family income in Crawford County is $65,249, with families comprising 3+ earners (1,115) having the highest median family income of $126,250, while families with no earners (2,131) have the lowest median family income of $42,410, accounting for 9.7% and 18.5% of families, respectively.
| Number of Earners | # Families | Median Income |
| No Earners | 2,131 (18.5%) | $42,410 |
| 1 Earner | 3,663 (31.8%) | $46,908 |
| 2 Earners | 4,628 (40.1%) | $83,571 |
| 3+ Earners | 1,115 (9.7%) | $126,250 |
| Total | 11,537 (100.0%) | $65,249 |
Household Income in Crawford County
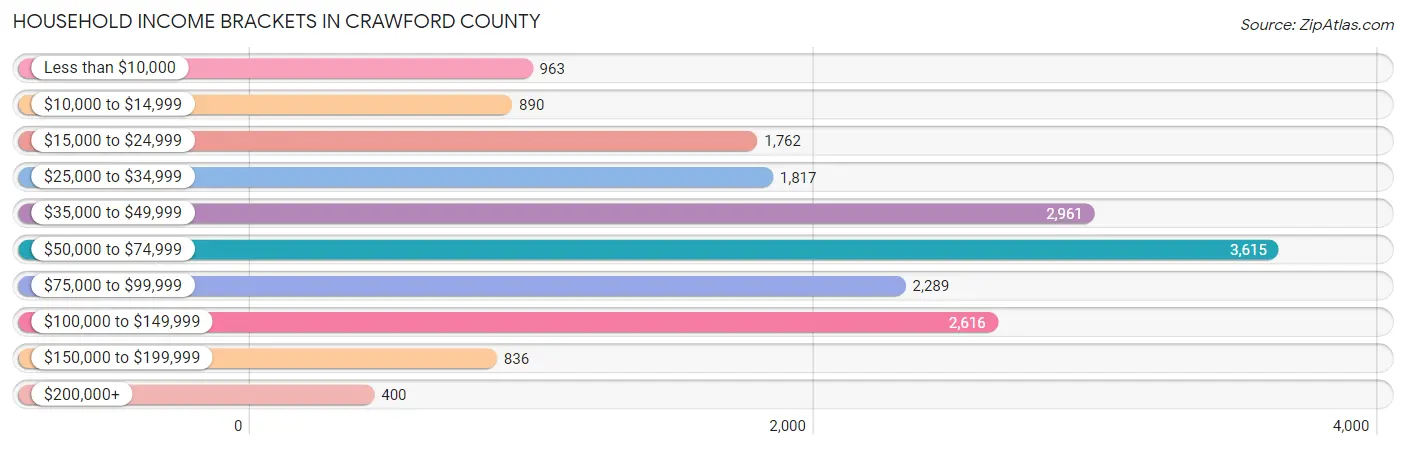
Household Income Brackets in Crawford County
With 3,615 households falling in the category, the $50,000 to $74,999 income range is the most frequent in Crawford County, accounting for 19.9% of all households. In contrast, only 400 households (2.2%) fall into the $200,000+ income bracket, making it the least populous group.
| Income Bracket | # Households | % Households |
| Less than $10,000 | 963 | 5.3% |
| $10,000 to $14,999 | 890 | 4.9% |
| $15,000 to $24,999 | 1,762 | 9.7% |
| $25,000 to $34,999 | 1,817 | 10.0% |
| $35,000 to $49,999 | 2,961 | 16.3% |
| $50,000 to $74,999 | 3,615 | 19.9% |
| $75,000 to $99,999 | 2,289 | 12.6% |
| $100,000 to $149,999 | 2,616 | 14.4% |
| $150,000 to $199,999 | 836 | 4.6% |
| $200,000+ | 400 | 2.2% |
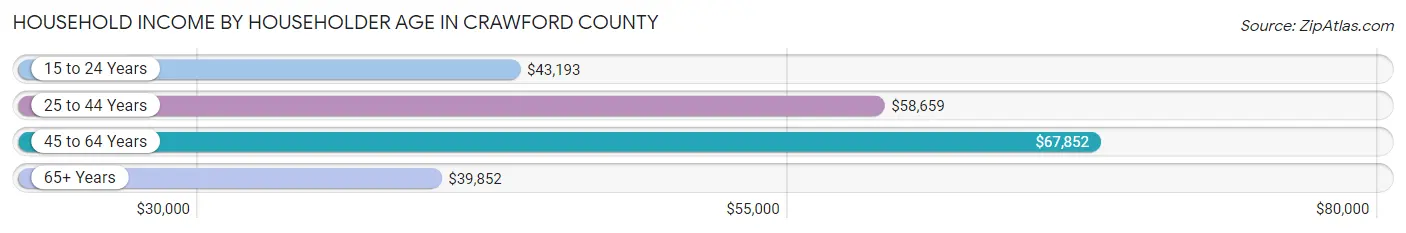
Household Income by Householder Age in Crawford County
The median household income in Crawford County is $52,486, with the highest median household income of $67,852 found in the 45 to 64 years age bracket for the primary householder. A total of 6,542 households (36.0%) fall into this category. Meanwhile, the 65+ years age bracket for the primary householder has the lowest median household income of $39,852, with 5,805 households (32.0%) in this group.
| Income Bracket | # Households | Median Income |
| 15 to 24 Years | 779 (4.3%) | $43,193 |
| 25 to 44 Years | 5,042 (27.8%) | $58,659 |
| 45 to 64 Years | 6,542 (36.0%) | $67,852 |
| 65+ Years | 5,805 (32.0%) | $39,852 |
| Total | 18,168 (100.0%) | $52,486 |
Poverty in Crawford County
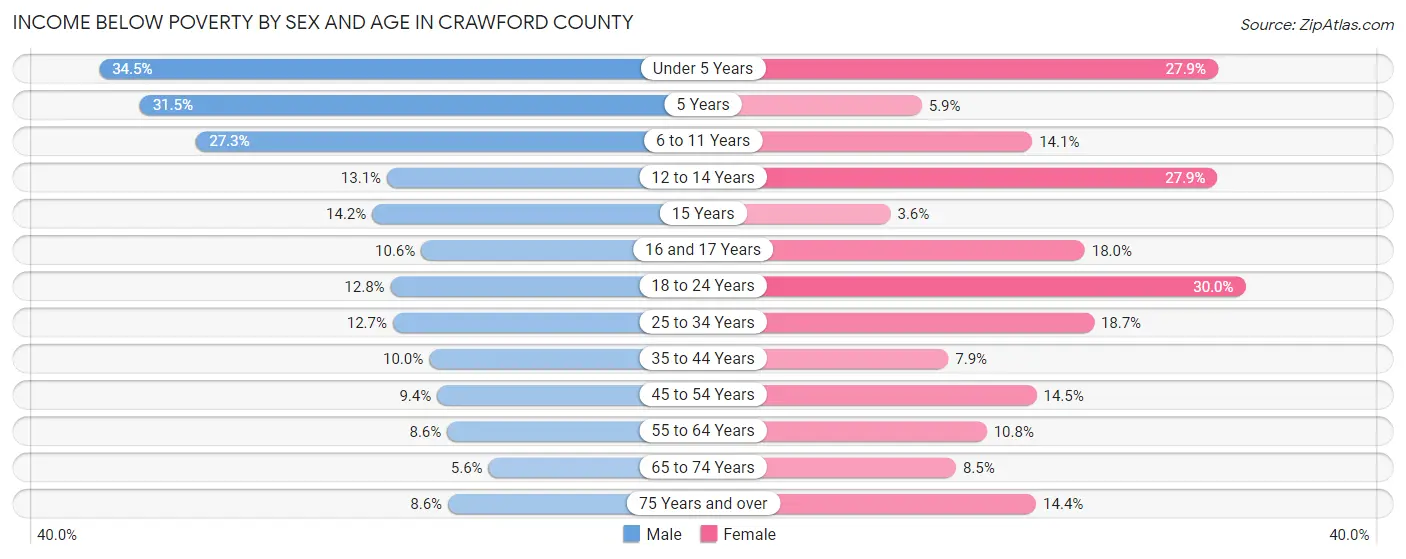
Income Below Poverty by Sex and Age in Crawford County
With 12.9% poverty level for males and 15.2% for females among the residents of Crawford County, under 5 year old males and 18 to 24 year old females are the most vulnerable to poverty, with 418 males (34.5%) and 506 females (30.0%) in their respective age groups living below the poverty level.
| Age Bracket | Male | Female |
| Under 5 Years | 418 (34.5%) | 299 (27.9%) |
| 5 Years | 106 (31.5%) | 12 (5.9%) |
| 6 to 11 Years | 405 (27.3%) | 209 (14.1%) |
| 12 to 14 Years | 85 (13.1%) | 184 (27.9%) |
| 15 Years | 45 (14.2%) | 10 (3.6%) |
| 16 and 17 Years | 53 (10.6%) | 101 (18.0%) |
| 18 to 24 Years | 201 (12.8%) | 506 (30.0%) |
| 25 to 34 Years | 297 (12.7%) | 443 (18.7%) |
| 35 to 44 Years | 236 (10.0%) | 187 (7.9%) |
| 45 to 54 Years | 268 (9.4%) | 372 (14.5%) |
| 55 to 64 Years | 251 (8.6%) | 311 (10.8%) |
| 65 to 74 Years | 126 (5.6%) | 214 (8.5%) |
| 75 Years and over | 125 (8.6%) | 295 (14.4%) |
| Total | 2,616 (12.9%) | 3,143 (15.2%) |
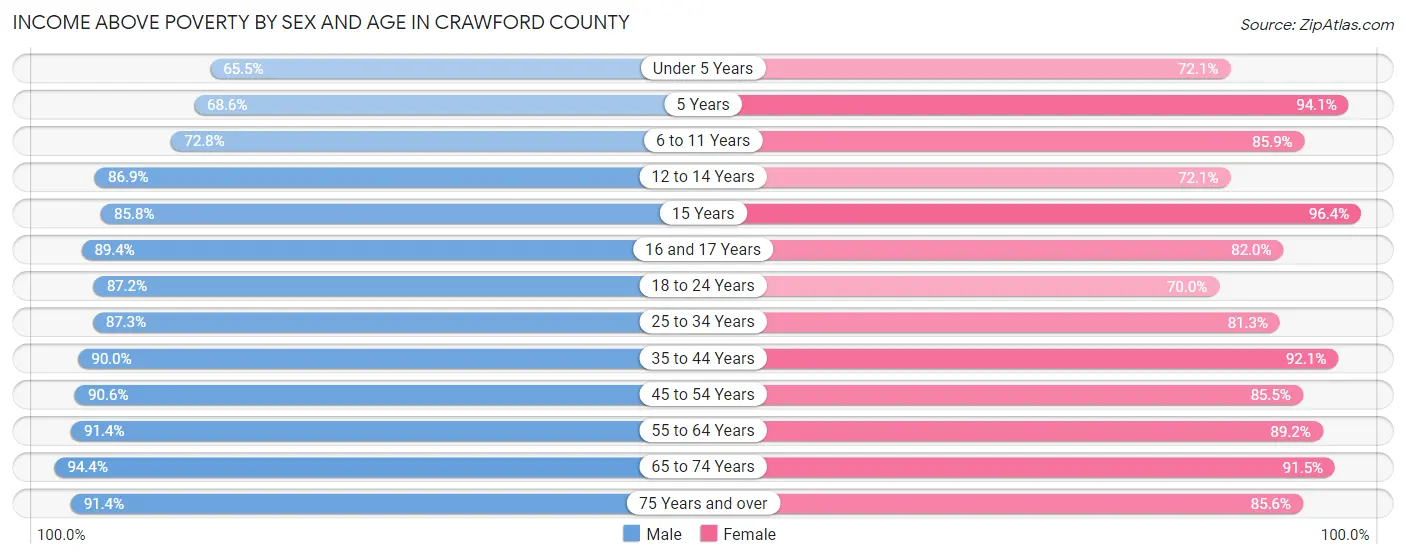
Income Above Poverty by Sex and Age in Crawford County
According to the poverty statistics in Crawford County, males aged 65 to 74 years and females aged 15 years are the age groups that are most secure financially, with 94.4% of males and 96.4% of females in these age groups living above the poverty line.
| Age Bracket | Male | Female |
| Under 5 Years | 795 (65.5%) | 772 (72.1%) |
| 5 Years | 231 (68.5%) | 190 (94.1%) |
| 6 to 11 Years | 1,081 (72.8%) | 1,269 (85.9%) |
| 12 to 14 Years | 564 (86.9%) | 476 (72.1%) |
| 15 Years | 272 (85.8%) | 266 (96.4%) |
| 16 and 17 Years | 449 (89.4%) | 459 (82.0%) |
| 18 to 24 Years | 1,365 (87.2%) | 1,183 (70.0%) |
| 25 to 34 Years | 2,049 (87.3%) | 1,923 (81.3%) |
| 35 to 44 Years | 2,132 (90.0%) | 2,177 (92.1%) |
| 45 to 54 Years | 2,589 (90.6%) | 2,200 (85.5%) |
| 55 to 64 Years | 2,658 (91.4%) | 2,579 (89.2%) |
| 65 to 74 Years | 2,139 (94.4%) | 2,310 (91.5%) |
| 75 Years and over | 1,334 (91.4%) | 1,749 (85.6%) |
| Total | 17,658 (87.1%) | 17,553 (84.8%) |
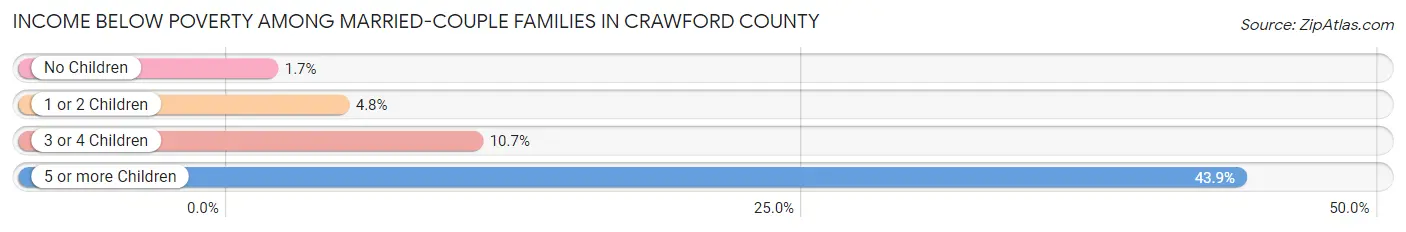
Income Below Poverty Among Married-Couple Families in Crawford County
The poverty statistics for married-couple families in Crawford County show that 3.8% or 321 of the total 8,494 families live below the poverty line. Families with 5 or more children have the highest poverty rate of 43.9%, comprising of 54 families. On the other hand, families with no children have the lowest poverty rate of 1.7%, which includes 93 families.
| Children | Above Poverty | Below Poverty |
| No Children | 5,282 (98.3%) | 93 (1.7%) |
| 1 or 2 Children | 2,369 (95.2%) | 120 (4.8%) |
| 3 or 4 Children | 453 (89.3%) | 54 (10.6%) |
| 5 or more Children | 69 (56.1%) | 54 (43.9%) |
| Total | 8,173 (96.2%) | 321 (3.8%) |
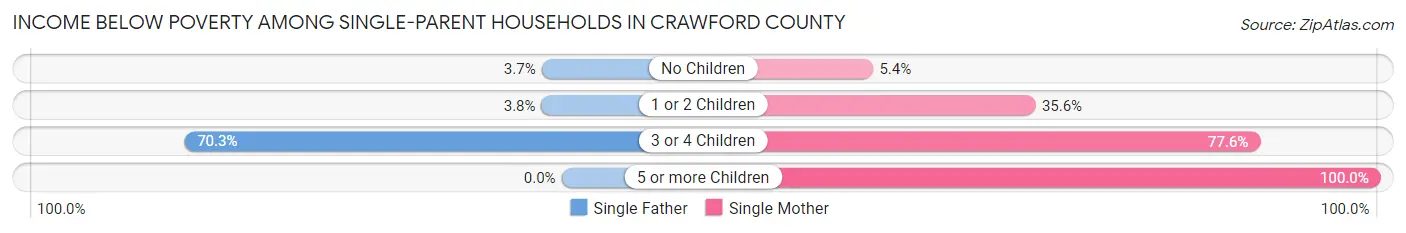
Income Below Poverty Among Single-Parent Households in Crawford County
According to the poverty data in Crawford County, 6.8% or 55 single-father households and 30.8% or 686 single-mother households are living below the poverty line. Among single-father households, those with 3 or 4 children have the highest poverty rate, with 26 households (70.3%) experiencing poverty. Likewise, among single-mother households, those with 5 or more children have the highest poverty rate, with 5 households (100.0%) falling below the poverty line.
| Children | Single Father | Single Mother |
| No Children | 10 (3.7%) | 40 (5.4%) |
| 1 or 2 Children | 19 (3.7%) | 430 (35.6%) |
| 3 or 4 Children | 26 (70.3%) | 211 (77.6%) |
| 5 or more Children | 0 (0.0%) | 5 (100.0%) |
| Total | 55 (6.8%) | 686 (30.8%) |
Income Below Poverty Among Married-Couple vs Single-Parent Households in Crawford County
The poverty data for Crawford County shows that 321 of the married-couple family households (3.8%) and 741 of the single-parent households (24.3%) are living below the poverty level. Within the married-couple family households, those with 5 or more children have the highest poverty rate, with 54 households (43.9%) falling below the poverty line. Among the single-parent households, those with 5 or more children have the highest poverty rate, with 5 household (100.0%) living below poverty.

| Children | Married-Couple Families | Single-Parent Households |
| No Children | 93 (1.7%) | 50 (4.9%) |
| 1 or 2 Children | 120 (4.8%) | 449 (26.2%) |
| 3 or 4 Children | 54 (10.6%) | 237 (76.7%) |
| 5 or more Children | 54 (43.9%) | 5 (100.0%) |
| Total | 321 (3.8%) | 741 (24.3%) |
Employment Characteristics in Crawford County
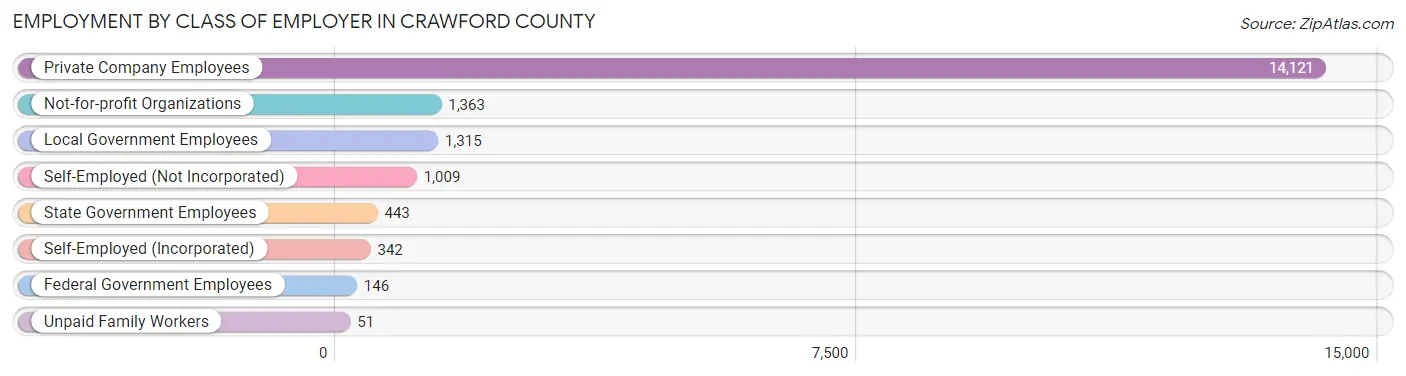
Employment by Class of Employer in Crawford County
Among the 18,790 employed individuals in Crawford County, private company employees (14,121 | 75.1%), not-for-profit organizations (1,363 | 7.2%), and local government employees (1,315 | 7.0%) make up the most common classes of employment.
| Employer Class | # Employees | % Employees |
| Private Company Employees | 14,121 | 75.1% |
| Self-Employed (Incorporated) | 342 | 1.8% |
| Self-Employed (Not Incorporated) | 1,009 | 5.4% |
| Not-for-profit Organizations | 1,363 | 7.2% |
| Local Government Employees | 1,315 | 7.0% |
| State Government Employees | 443 | 2.4% |
| Federal Government Employees | 146 | 0.8% |
| Unpaid Family Workers | 51 | 0.3% |
| Total | 18,790 | 100.0% |
Employment Status by Age in Crawford County
According to the labor force statistics for Crawford County, out of the total population over 16 years of age (33,761), 60.3% or 20,358 individuals are in the labor force, with 5.5% or 1,120 of them unemployed. The age group with the highest labor force participation rate is 25 to 29 years, with 84.1% or 2,087 individuals in the labor force. Within the labor force, the 16 to 19 years age range has the highest percentage of unemployed individuals, with 18.9% or 182 of them being unemployed.

| Age Bracket | In Labor Force | Unemployed |
| 16 to 19 Years | 964 (48.0%) | 182 (18.9%) |
| 20 to 24 Years | 1,868 (80.0%) | 271 (14.5%) |
| 25 to 29 Years | 2,087 (84.1%) | 100 (4.8%) |
| 30 to 34 Years | 1,858 (82.1%) | 110 (5.9%) |
| 35 to 44 Years | 3,973 (83.5%) | 151 (3.8%) |
| 45 to 54 Years | 4,424 (81.4%) | 261 (5.9%) |
| 55 to 59 Years | 2,213 (75.5%) | 11 (0.5%) |
| 60 to 64 Years | 1,647 (56.1%) | 26 (1.6%) |
| 65 to 74 Years | 1,052 (21.4%) | 11 (1.0%) |
| 75 Years and over | 255 (6.9%) | 0 (0.0%) |
| Total | 20,358 (60.3%) | 1,120 (5.5%) |
Employment Status by Educational Attainment in Crawford County
According to labor force statistics for Crawford County, 77.9% of individuals (16,206) out of the total population between 25 and 64 years of age (20,804) are in the labor force, with 4.1% or 664 of them being unemployed. The group with the highest labor force participation rate are those with the educational attainment of bachelor's degree or higher, with 86.9% or 2,741 individuals in the labor force. Within the labor force, individuals with less than high school education have the highest percentage of unemployment, with 13.9% or 129 of them being unemployed.

| Educational Attainment | In Labor Force | Unemployed |
| Less than High School | 928 (50.7%) | 254 (13.9%) |
| High School Diploma | 6,935 (75.9%) | 365 (4.0%) |
| College / Associate Degree | 5,600 (83.8%) | 261 (3.9%) |
| Bachelor's Degree or higher | 2,741 (86.9%) | 44 (1.4%) |
| Total | 16,206 (77.9%) | 853 (4.1%) |
Employment Occupations by Sex in Crawford County
Management, Business, Science and Arts Occupations
The most common Management, Business, Science and Arts occupations in Crawford County are Management (1,640 | 8.5%), Community & Social Service (1,416 | 7.4%), Health Diagnosing & Treating (1,028 | 5.3%), Education Instruction & Library (838 | 4.4%), and Business & Financial (614 | 3.2%).

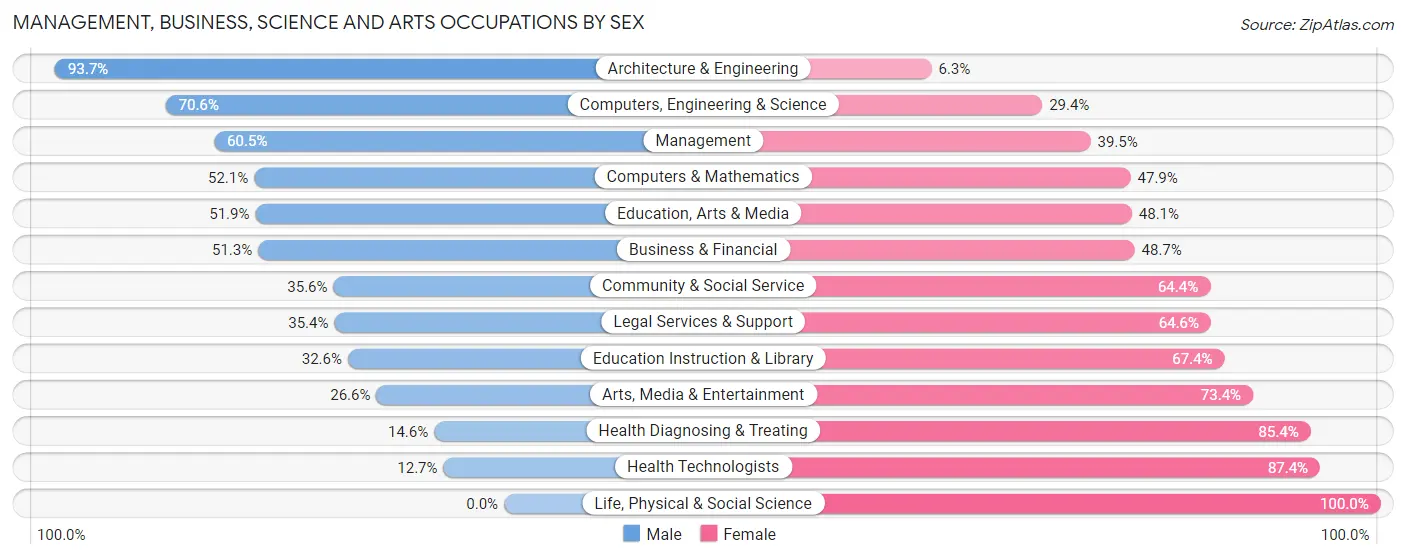
Management, Business, Science and Arts Occupations by Sex
Within the Management, Business, Science and Arts occupations in Crawford County, the most male-oriented occupations are Architecture & Engineering (93.7%), Computers, Engineering & Science (70.6%), and Management (60.5%), while the most female-oriented occupations are Life, Physical & Social Science (100.0%), Health Technologists (87.4%), and Health Diagnosing & Treating (85.4%).
| Occupation | Male | Female |
| Management | 992 (60.5%) | 648 (39.5%) |
| Business & Financial | 315 (51.3%) | 299 (48.7%) |
| Computers, Engineering & Science | 403 (70.6%) | 168 (29.4%) |
| Computers & Mathematics | 122 (52.1%) | 112 (47.9%) |
| Architecture & Engineering | 281 (93.7%) | 19 (6.3%) |
| Life, Physical & Social Science | 0 (0.0%) | 37 (100.0%) |
| Community & Social Service | 504 (35.6%) | 912 (64.4%) |
| Education, Arts & Media | 138 (51.9%) | 128 (48.1%) |
| Legal Services & Support | 40 (35.4%) | 73 (64.6%) |
| Education Instruction & Library | 273 (32.6%) | 565 (67.4%) |
| Arts, Media & Entertainment | 53 (26.6%) | 146 (73.4%) |
| Health Diagnosing & Treating | 150 (14.6%) | 878 (85.4%) |
| Health Technologists | 73 (12.7%) | 504 (87.4%) |
| Total (Category) | 2,364 (44.9%) | 2,905 (55.1%) |
| Total (Overall) | 10,212 (53.2%) | 8,987 (46.8%) |
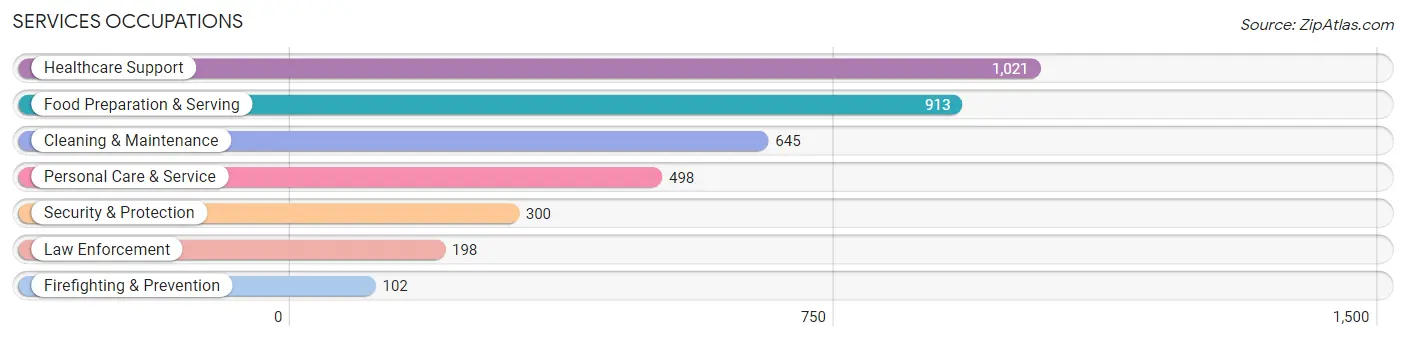
Services Occupations
The most common Services occupations in Crawford County are Healthcare Support (1,021 | 5.3%), Food Preparation & Serving (913 | 4.8%), Cleaning & Maintenance (645 | 3.4%), Personal Care & Service (498 | 2.6%), and Security & Protection (300 | 1.6%).
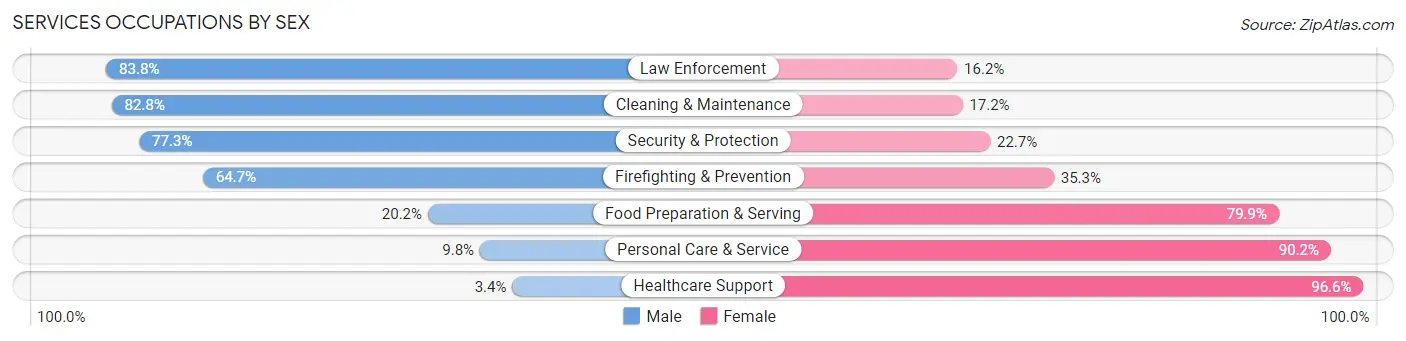
Services Occupations by Sex
Within the Services occupations in Crawford County, the most male-oriented occupations are Law Enforcement (83.8%), Cleaning & Maintenance (82.8%), and Security & Protection (77.3%), while the most female-oriented occupations are Healthcare Support (96.6%), Personal Care & Service (90.2%), and Food Preparation & Serving (79.8%).
| Occupation | Male | Female |
| Healthcare Support | 35 (3.4%) | 986 (96.6%) |
| Security & Protection | 232 (77.3%) | 68 (22.7%) |
| Firefighting & Prevention | 66 (64.7%) | 36 (35.3%) |
| Law Enforcement | 166 (83.8%) | 32 (16.2%) |
| Food Preparation & Serving | 184 (20.2%) | 729 (79.8%) |
| Cleaning & Maintenance | 534 (82.8%) | 111 (17.2%) |
| Personal Care & Service | 49 (9.8%) | 449 (90.2%) |
| Total (Category) | 1,034 (30.6%) | 2,343 (69.4%) |
| Total (Overall) | 10,212 (53.2%) | 8,987 (46.8%) |
Sales and Office Occupations
The most common Sales and Office occupations in Crawford County are Office & Administration (1,817 | 9.5%), and Sales & Related (1,518 | 7.9%).
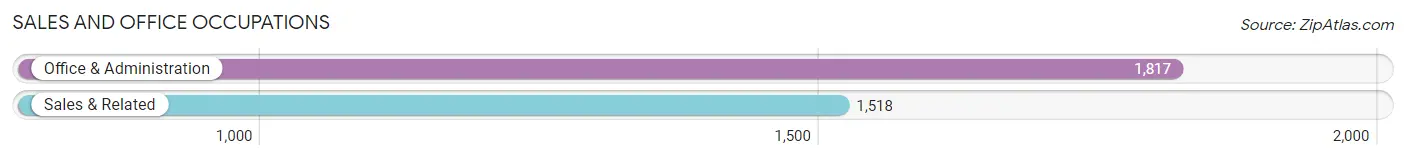
Sales and Office Occupations by Sex
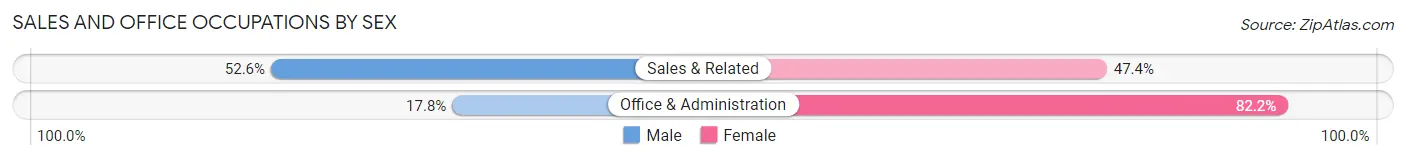
| Occupation | Male | Female |
| Sales & Related | 799 (52.6%) | 719 (47.4%) |
| Office & Administration | 323 (17.8%) | 1,494 (82.2%) |
| Total (Category) | 1,122 (33.6%) | 2,213 (66.4%) |
| Total (Overall) | 10,212 (53.2%) | 8,987 (46.8%) |
Natural Resources, Construction and Maintenance Occupations
The most common Natural Resources, Construction and Maintenance occupations in Crawford County are Construction & Extraction (931 | 4.9%), Installation, Maintenance & Repair (830 | 4.3%), and Farming, Fishing & Forestry (324 | 1.7%).

Natural Resources, Construction and Maintenance Occupations by Sex
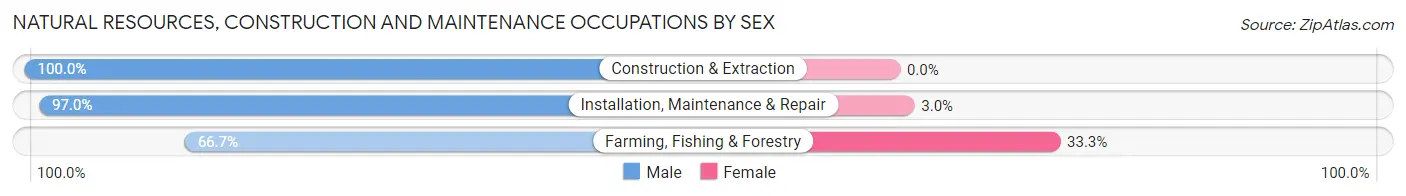
| Occupation | Male | Female |
| Farming, Fishing & Forestry | 216 (66.7%) | 108 (33.3%) |
| Construction & Extraction | 931 (100.0%) | 0 (0.0%) |
| Installation, Maintenance & Repair | 805 (97.0%) | 25 (3.0%) |
| Total (Category) | 1,952 (93.6%) | 133 (6.4%) |
| Total (Overall) | 10,212 (53.2%) | 8,987 (46.8%) |
Production, Transportation and Moving Occupations
The most common Production, Transportation and Moving occupations in Crawford County are Production (3,351 | 17.4%), Material Moving (1,084 | 5.7%), and Transportation (698 | 3.6%).
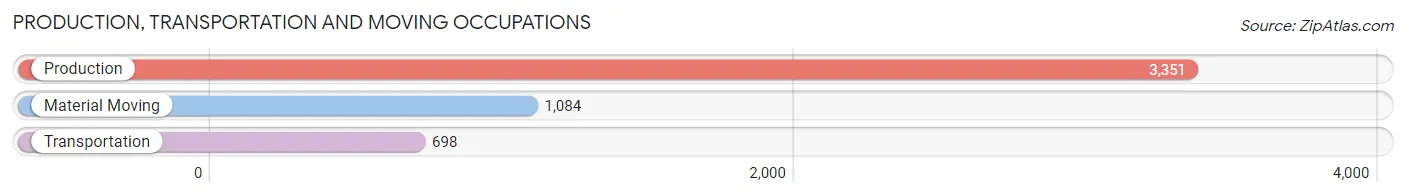
Production, Transportation and Moving Occupations by Sex
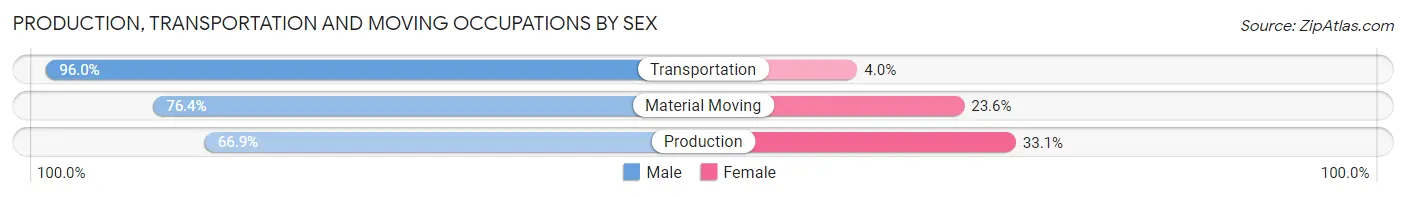
| Occupation | Male | Female |
| Production | 2,242 (66.9%) | 1,109 (33.1%) |
| Transportation | 670 (96.0%) | 28 (4.0%) |
| Material Moving | 828 (76.4%) | 256 (23.6%) |
| Total (Category) | 3,740 (72.9%) | 1,393 (27.1%) |
| Total (Overall) | 10,212 (53.2%) | 8,987 (46.8%) |
Employment Industries by Sex in Crawford County
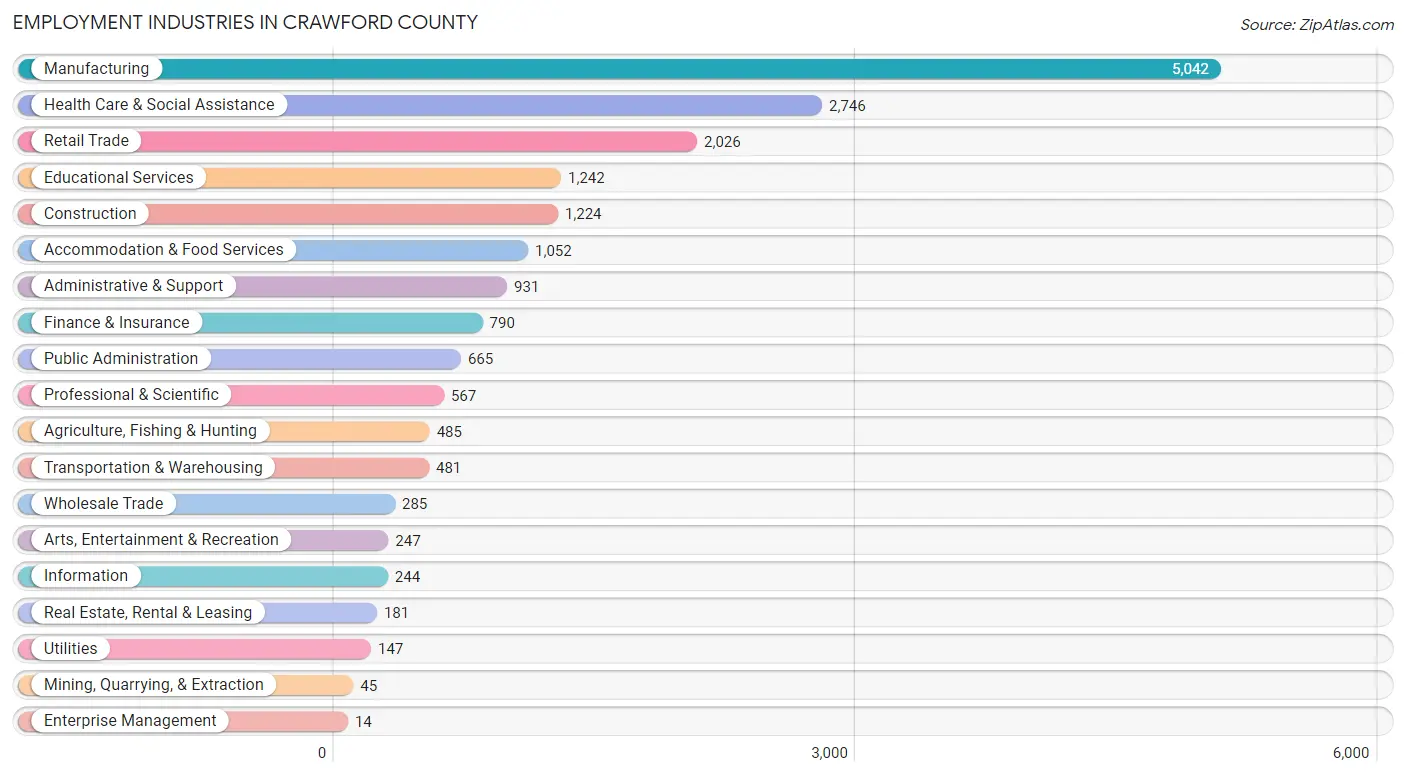
Employment Industries in Crawford County
The major employment industries in Crawford County include Manufacturing (5,042 | 26.3%), Health Care & Social Assistance (2,746 | 14.3%), Retail Trade (2,026 | 10.5%), Educational Services (1,242 | 6.5%), and Construction (1,224 | 6.4%).
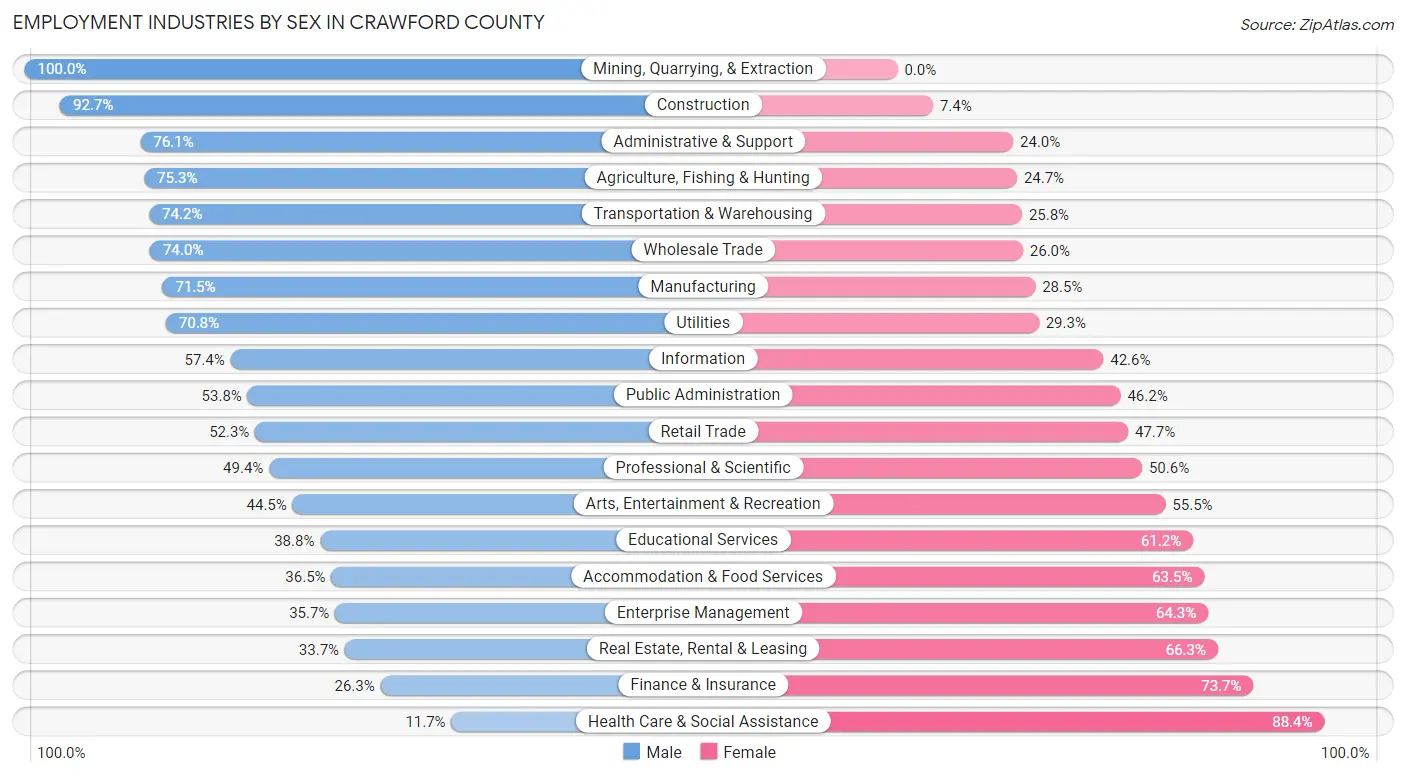
Employment Industries by Sex in Crawford County
The Crawford County industries that see more men than women are Mining, Quarrying, & Extraction (100.0%), Construction (92.6%), and Administrative & Support (76.0%), whereas the industries that tend to have a higher number of women are Health Care & Social Assistance (88.3%), Finance & Insurance (73.7%), and Real Estate, Rental & Leasing (66.3%).
| Industry | Male | Female |
| Agriculture, Fishing & Hunting | 365 (75.3%) | 120 (24.7%) |
| Mining, Quarrying, & Extraction | 45 (100.0%) | 0 (0.0%) |
| Construction | 1,134 (92.6%) | 90 (7.3%) |
| Manufacturing | 3,604 (71.5%) | 1,438 (28.5%) |
| Wholesale Trade | 211 (74.0%) | 74 (26.0%) |
| Retail Trade | 1,059 (52.3%) | 967 (47.7%) |
| Transportation & Warehousing | 357 (74.2%) | 124 (25.8%) |
| Utilities | 104 (70.8%) | 43 (29.2%) |
| Information | 140 (57.4%) | 104 (42.6%) |
| Finance & Insurance | 208 (26.3%) | 582 (73.7%) |
| Real Estate, Rental & Leasing | 61 (33.7%) | 120 (66.3%) |
| Professional & Scientific | 280 (49.4%) | 287 (50.6%) |
| Enterprise Management | 5 (35.7%) | 9 (64.3%) |
| Administrative & Support | 708 (76.0%) | 223 (23.9%) |
| Educational Services | 482 (38.8%) | 760 (61.2%) |
| Health Care & Social Assistance | 320 (11.7%) | 2,426 (88.3%) |
| Arts, Entertainment & Recreation | 110 (44.5%) | 137 (55.5%) |
| Accommodation & Food Services | 384 (36.5%) | 668 (63.5%) |
| Public Administration | 358 (53.8%) | 307 (46.2%) |
| Total | 10,212 (53.2%) | 8,987 (46.8%) |
Education in Crawford County
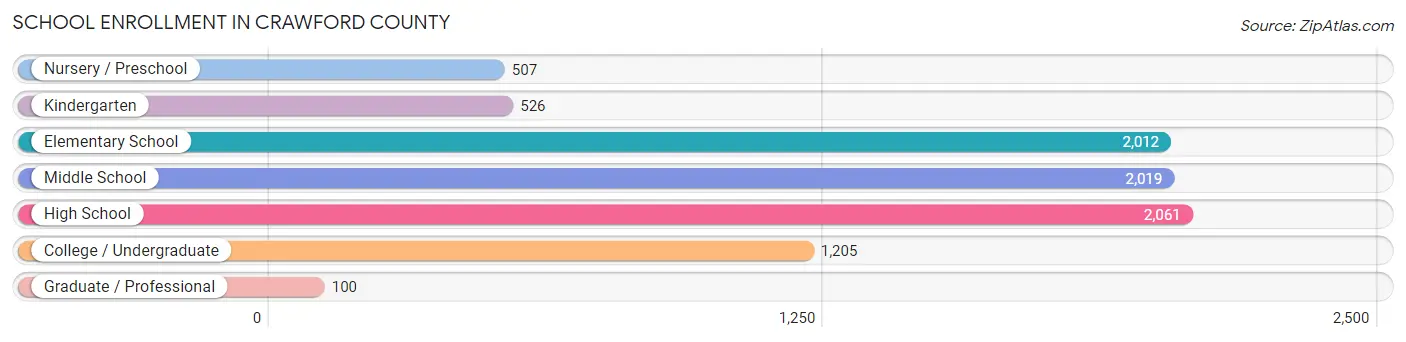
School Enrollment in Crawford County
The most common levels of schooling among the 8,430 students in Crawford County are high school (2,061 | 24.4%), middle school (2,019 | 23.9%), and elementary school (2,012 | 23.9%).
| School Level | # Students | % Students |
| Nursery / Preschool | 507 | 6.0% |
| Kindergarten | 526 | 6.2% |
| Elementary School | 2,012 | 23.9% |
| Middle School | 2,019 | 23.9% |
| High School | 2,061 | 24.4% |
| College / Undergraduate | 1,205 | 14.3% |
| Graduate / Professional | 100 | 1.2% |
| Total | 8,430 | 100.0% |
School Enrollment by Age by Funding Source in Crawford County
Out of a total of 8,430 students who are enrolled in schools in Crawford County, 1,130 (13.4%) attend a private institution, while the remaining 7,300 (86.6%) are enrolled in public schools. The age group of 18 to 19 year olds has the highest likelihood of being enrolled in private schools, with 113 (21.4% in the age bracket) enrolled. Conversely, the age group of 15 to 17 year olds has the lowest likelihood of being enrolled in a private school, with 1,526 (93.2% in the age bracket) attending a public institution.

| Age Bracket | Public School | Private School |
| 3 to 4 Year Olds | 268 (84.8%) | 48 (15.2%) |
| 5 to 9 Year Old | 1,965 (83.4%) | 390 (16.6%) |
| 10 to 14 Year Olds | 2,228 (86.7%) | 341 (13.3%) |
| 15 to 17 Year Olds | 1,526 (93.2%) | 111 (6.8%) |
| 18 to 19 Year Olds | 415 (78.6%) | 113 (21.4%) |
| 20 to 24 Year Olds | 309 (88.0%) | 42 (12.0%) |
| 25 to 34 Year Olds | 253 (86.6%) | 39 (13.4%) |
| 35 Years and over | 335 (87.7%) | 47 (12.3%) |
| Total | 7,300 (86.6%) | 1,130 (13.4%) |
Educational Attainment by Field of Study in Crawford County
Education (1,310 | 27.8%), business (952 | 20.2%), science & technology (436 | 9.2%), bio, nature & agricultural (408 | 8.7%), and arts & humanities (271 | 5.8%) are the most common fields of study among 4,711 individuals in Crawford County who have obtained a bachelor's degree or higher.
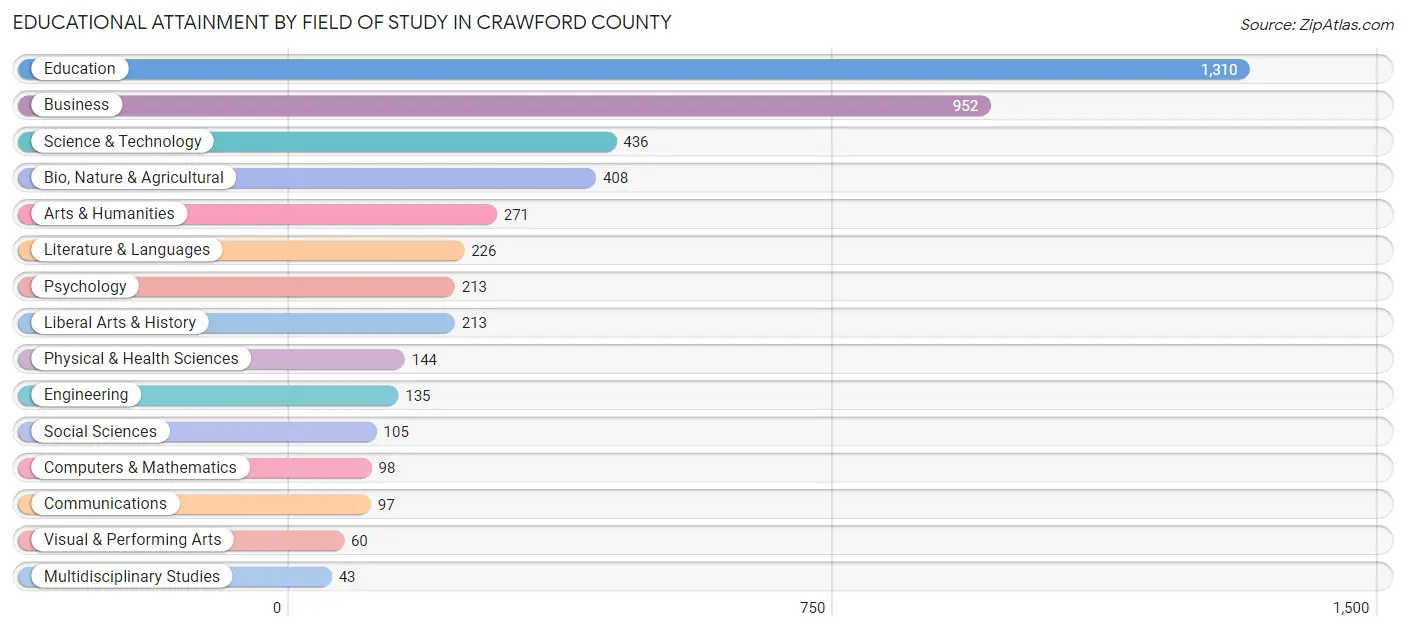
| Field of Study | # Graduates | % Graduates |
| Computers & Mathematics | 98 | 2.1% |
| Bio, Nature & Agricultural | 408 | 8.7% |
| Physical & Health Sciences | 144 | 3.1% |
| Psychology | 213 | 4.5% |
| Social Sciences | 105 | 2.2% |
| Engineering | 135 | 2.9% |
| Multidisciplinary Studies | 43 | 0.9% |
| Science & Technology | 436 | 9.2% |
| Business | 952 | 20.2% |
| Education | 1,310 | 27.8% |
| Literature & Languages | 226 | 4.8% |
| Liberal Arts & History | 213 | 4.5% |
| Visual & Performing Arts | 60 | 1.3% |
| Communications | 97 | 2.1% |
| Arts & Humanities | 271 | 5.8% |
| Total | 4,711 | 100.0% |
Transportation & Commute in Crawford County
Vehicle Availability by Sex in Crawford County
The most prevalent vehicle ownership categories in Crawford County are males with 2 vehicles (4,016, accounting for 40.1%) and females with 2 vehicles (3,231, making up 45.9%).
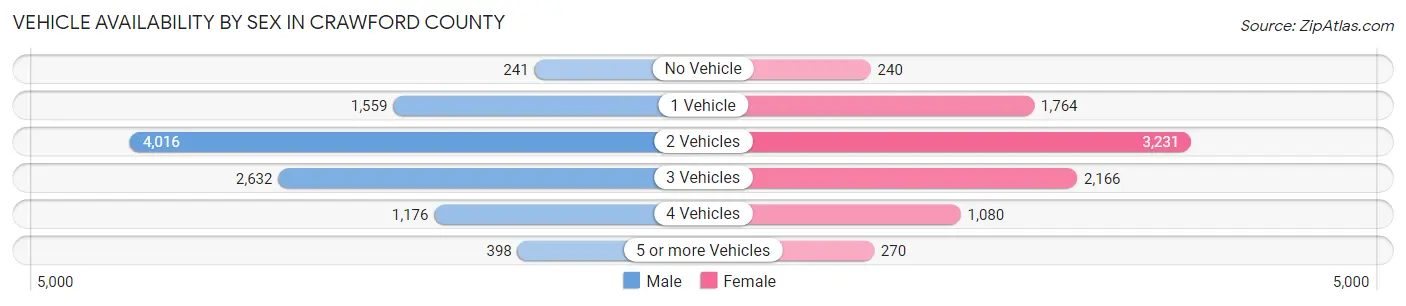
| Vehicles Available | Male | Female |
| No Vehicle | 241 (2.4%) | 240 (2.7%) |
| 1 Vehicle | 1,559 (15.6%) | 1,764 (20.2%) |
| 2 Vehicles | 4,016 (40.1%) | 3,231 (36.9%) |
| 3 Vehicles | 2,632 (26.3%) | 2,166 (24.7%) |
| 4 Vehicles | 1,176 (11.7%) | 1,080 (12.3%) |
| 5 or more Vehicles | 398 (4.0%) | 270 (3.1%) |
| Total | 10,022 (100.0%) | 8,751 (100.0%) |
Commute Time in Crawford County
The most frequently occuring commute durations in Crawford County are 5 to 9 minutes (3,002 commuters, 16.8%), 15 to 19 minutes (2,972 commuters, 16.6%), and 20 to 24 minutes (2,454 commuters, 13.7%).

| Commute Time | # Commuters | % Commuters |
| Less than 5 Minutes | 1,434 | 8.0% |
| 5 to 9 Minutes | 3,002 | 16.8% |
| 10 to 14 Minutes | 1,874 | 10.5% |
| 15 to 19 Minutes | 2,972 | 16.6% |
| 20 to 24 Minutes | 2,454 | 13.7% |
| 25 to 29 Minutes | 1,137 | 6.3% |
| 30 to 34 Minutes | 1,432 | 8.0% |
| 35 to 39 Minutes | 698 | 3.9% |
| 40 to 44 Minutes | 475 | 2.6% |
| 45 to 59 Minutes | 849 | 4.7% |
| 60 to 89 Minutes | 1,030 | 5.8% |
| 90 or more Minutes | 563 | 3.1% |
Commute Time by Sex in Crawford County
The most common commute times in Crawford County are 15 to 19 minutes (1,651 commuters, 17.0%) for males and 5 to 9 minutes (1,786 commuters, 21.7%) for females.

| Commute Time | Male | Female |
| Less than 5 Minutes | 811 (8.4%) | 623 (7.6%) |
| 5 to 9 Minutes | 1,216 (12.6%) | 1,786 (21.7%) |
| 10 to 14 Minutes | 956 (9.9%) | 918 (11.2%) |
| 15 to 19 Minutes | 1,651 (17.0%) | 1,321 (16.1%) |
| 20 to 24 Minutes | 1,253 (12.9%) | 1,201 (14.6%) |
| 25 to 29 Minutes | 592 (6.1%) | 545 (6.6%) |
| 30 to 34 Minutes | 850 (8.8%) | 582 (7.1%) |
| 35 to 39 Minutes | 411 (4.2%) | 287 (3.5%) |
| 40 to 44 Minutes | 319 (3.3%) | 156 (1.9%) |
| 45 to 59 Minutes | 461 (4.8%) | 388 (4.7%) |
| 60 to 89 Minutes | 762 (7.9%) | 268 (3.3%) |
| 90 or more Minutes | 406 (4.2%) | 157 (1.9%) |
Time of Departure to Work by Sex in Crawford County
The most frequent times of departure to work in Crawford County are 7:00 AM to 7:29 AM (1,218, 12.6%) for males and 7:30 AM to 7:59 AM (1,406, 17.1%) for females.
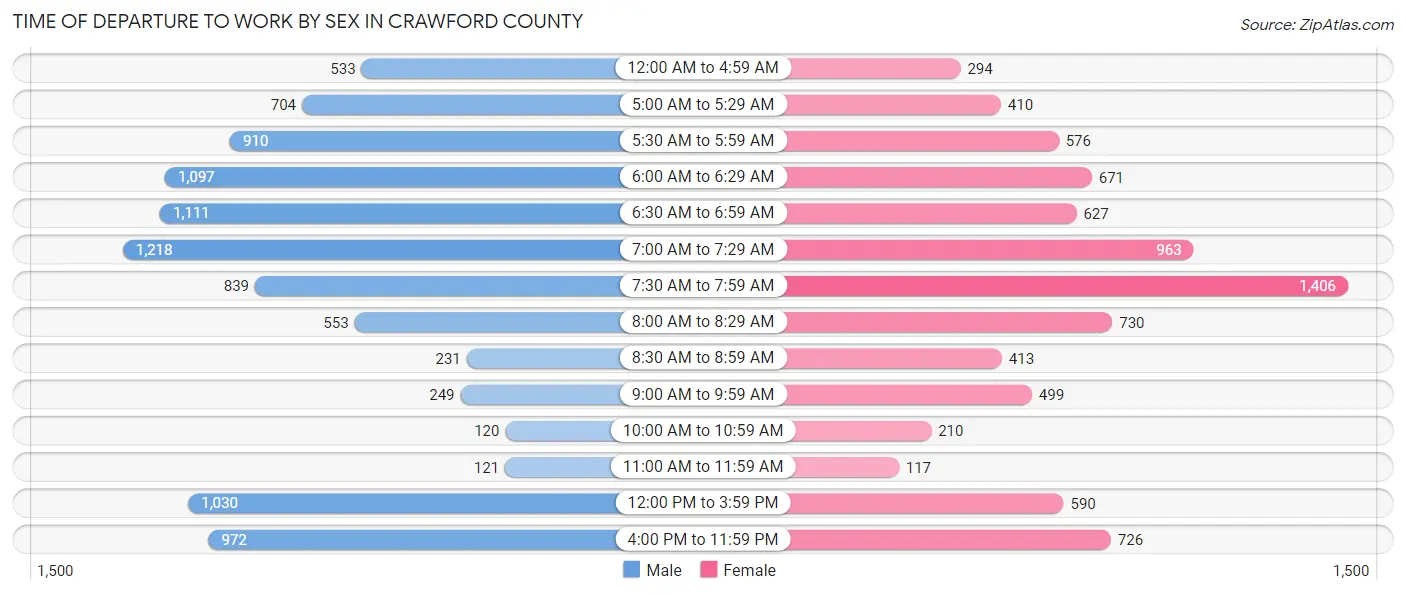
| Time of Departure | Male | Female |
| 12:00 AM to 4:59 AM | 533 (5.5%) | 294 (3.6%) |
| 5:00 AM to 5:29 AM | 704 (7.3%) | 410 (5.0%) |
| 5:30 AM to 5:59 AM | 910 (9.4%) | 576 (7.0%) |
| 6:00 AM to 6:29 AM | 1,097 (11.3%) | 671 (8.2%) |
| 6:30 AM to 6:59 AM | 1,111 (11.5%) | 627 (7.6%) |
| 7:00 AM to 7:29 AM | 1,218 (12.6%) | 963 (11.7%) |
| 7:30 AM to 7:59 AM | 839 (8.7%) | 1,406 (17.1%) |
| 8:00 AM to 8:29 AM | 553 (5.7%) | 730 (8.9%) |
| 8:30 AM to 8:59 AM | 231 (2.4%) | 413 (5.0%) |
| 9:00 AM to 9:59 AM | 249 (2.6%) | 499 (6.1%) |
| 10:00 AM to 10:59 AM | 120 (1.2%) | 210 (2.5%) |
| 11:00 AM to 11:59 AM | 121 (1.3%) | 117 (1.4%) |
| 12:00 PM to 3:59 PM | 1,030 (10.6%) | 590 (7.2%) |
| 4:00 PM to 11:59 PM | 972 (10.0%) | 726 (8.8%) |
| Total | 9,688 (100.0%) | 8,232 (100.0%) |
Housing Occupancy in Crawford County
Occupancy by Ownership in Crawford County
Of the total 18,168 dwellings in Crawford County, owner-occupied units account for 12,614 (69.4%), while renter-occupied units make up 5,554 (30.6%).

| Occupancy | # Housing Units | % Housing Units |
| Owner Occupied Housing Units | 12,614 | 69.4% |
| Renter-Occupied Housing Units | 5,554 | 30.6% |
| Total Occupied Housing Units | 18,168 | 100.0% |
Occupancy by Household Size in Crawford County
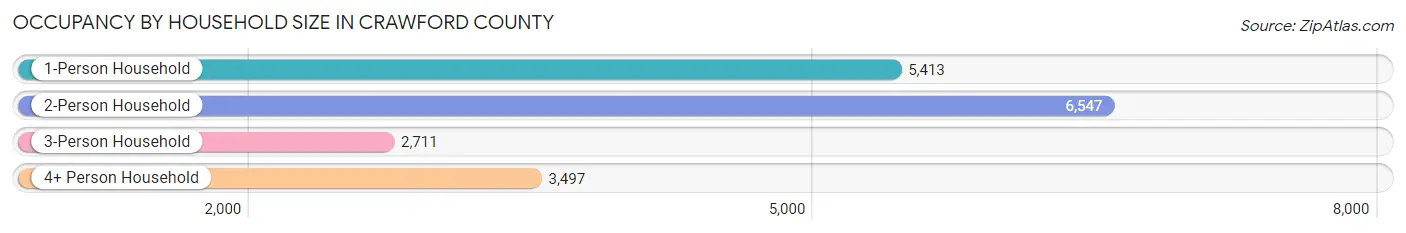
| Household Size | # Housing Units | % Housing Units |
| 1-Person Household | 5,413 | 29.8% |
| 2-Person Household | 6,547 | 36.0% |
| 3-Person Household | 2,711 | 14.9% |
| 4+ Person Household | 3,497 | 19.3% |
| Total Housing Units | 18,168 | 100.0% |
Occupancy by Ownership by Household Size in Crawford County
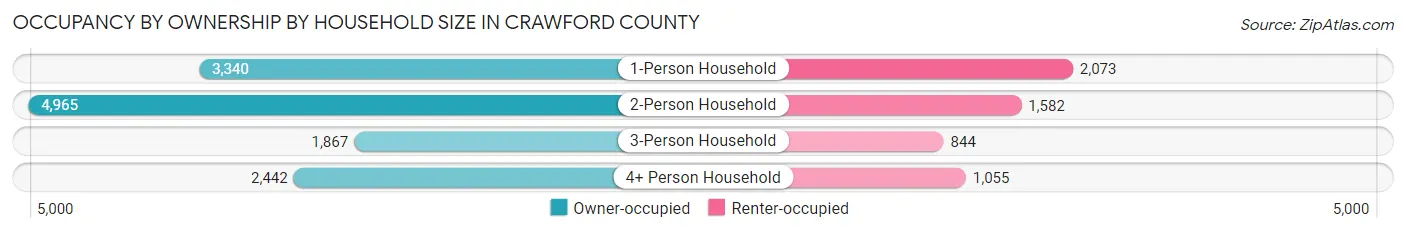
| Household Size | Owner-occupied | Renter-occupied |
| 1-Person Household | 3,340 (61.7%) | 2,073 (38.3%) |
| 2-Person Household | 4,965 (75.8%) | 1,582 (24.2%) |
| 3-Person Household | 1,867 (68.9%) | 844 (31.1%) |
| 4+ Person Household | 2,442 (69.8%) | 1,055 (30.2%) |
| Total Housing Units | 12,614 (69.4%) | 5,554 (30.6%) |
Occupancy by Educational Attainment in Crawford County
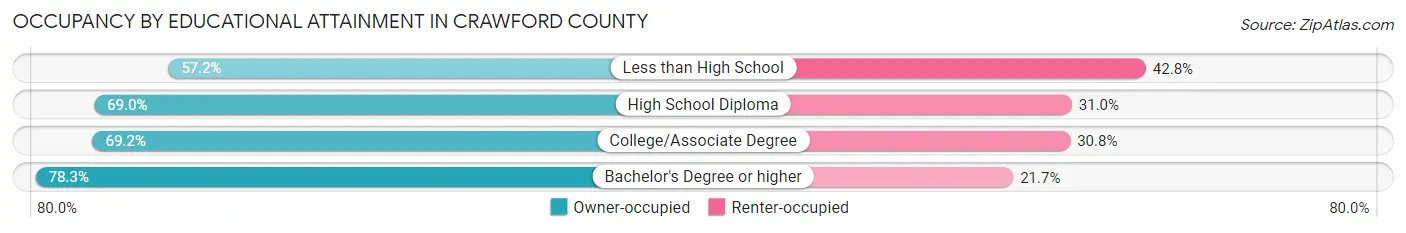
| Household Size | Owner-occupied | Renter-occupied |
| Less than High School | 900 (57.2%) | 673 (42.8%) |
| High School Diploma | 5,626 (69.0%) | 2,532 (31.0%) |
| College/Associate Degree | 3,942 (69.2%) | 1,753 (30.8%) |
| Bachelor's Degree or higher | 2,146 (78.3%) | 596 (21.7%) |
Occupancy by Age of Householder in Crawford County
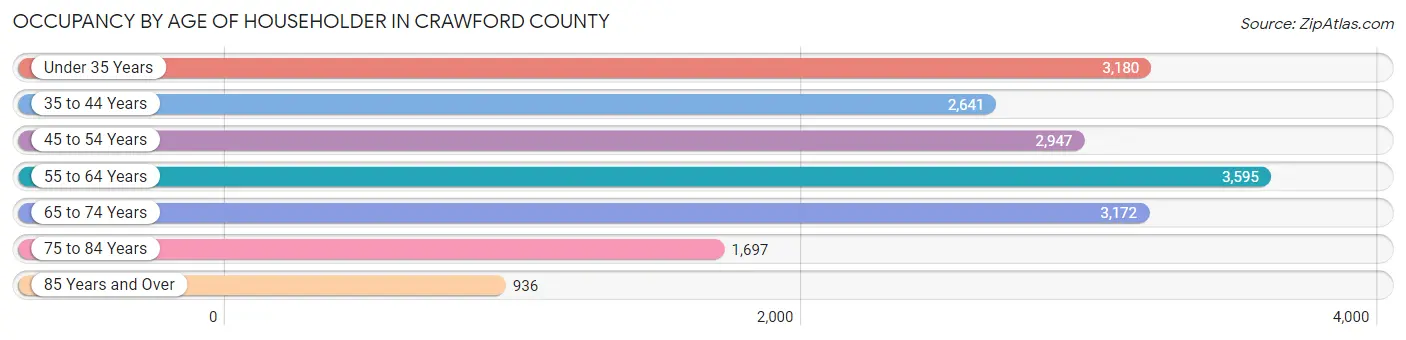
| Age Bracket | # Households | % Households |
| Under 35 Years | 3,180 | 17.5% |
| 35 to 44 Years | 2,641 | 14.5% |
| 45 to 54 Years | 2,947 | 16.2% |
| 55 to 64 Years | 3,595 | 19.8% |
| 65 to 74 Years | 3,172 | 17.5% |
| 75 to 84 Years | 1,697 | 9.3% |
| 85 Years and Over | 936 | 5.1% |
| Total | 18,168 | 100.0% |
Housing Finances in Crawford County
Median Income by Occupancy in Crawford County

| Occupancy Type | # Households | Median Income |
| Owner-Occupied | 12,614 (69.4%) | $64,849 |
| Renter-Occupied | 5,554 (30.6%) | $34,057 |
| Average | 18,168 (100.0%) | $52,486 |
Occupancy by Householder Income Bracket in Crawford County
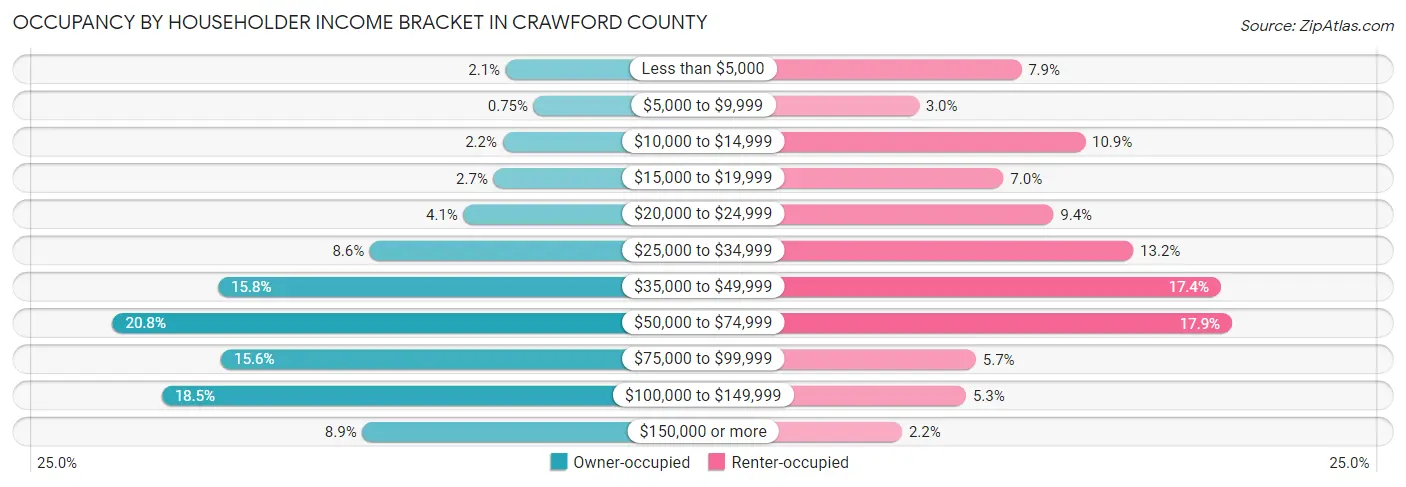
| Income Bracket | Owner-occupied | Renter-occupied |
| Less than $5,000 | 263 (2.1%) | 438 (7.9%) |
| $5,000 to $9,999 | 95 (0.7%) | 167 (3.0%) |
| $10,000 to $14,999 | 281 (2.2%) | 607 (10.9%) |
| $15,000 to $19,999 | 336 (2.7%) | 391 (7.0%) |
| $20,000 to $24,999 | 516 (4.1%) | 523 (9.4%) |
| $25,000 to $34,999 | 1,079 (8.6%) | 734 (13.2%) |
| $35,000 to $49,999 | 1,992 (15.8%) | 966 (17.4%) |
| $50,000 to $74,999 | 2,625 (20.8%) | 995 (17.9%) |
| $75,000 to $99,999 | 1,973 (15.6%) | 318 (5.7%) |
| $100,000 to $149,999 | 2,330 (18.5%) | 292 (5.3%) |
| $150,000 or more | 1,124 (8.9%) | 123 (2.2%) |
| Total | 12,614 (100.0%) | 5,554 (100.0%) |
Monthly Housing Cost Tiers in Crawford County
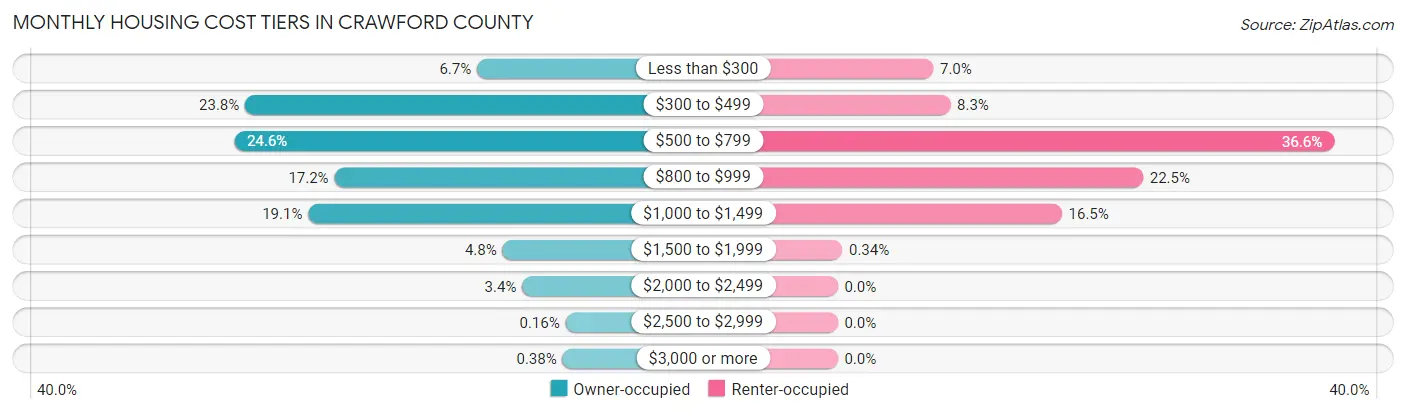
| Monthly Cost | Owner-occupied | Renter-occupied |
| Less than $300 | 842 (6.7%) | 391 (7.0%) |
| $300 to $499 | 2,997 (23.8%) | 461 (8.3%) |
| $500 to $799 | 3,100 (24.6%) | 2,031 (36.6%) |
| $800 to $999 | 2,167 (17.2%) | 1,249 (22.5%) |
| $1,000 to $1,499 | 2,411 (19.1%) | 917 (16.5%) |
| $1,500 to $1,999 | 606 (4.8%) | 19 (0.3%) |
| $2,000 to $2,499 | 423 (3.4%) | 0 (0.0%) |
| $2,500 to $2,999 | 20 (0.2%) | 0 (0.0%) |
| $3,000 or more | 48 (0.4%) | 0 (0.0%) |
| Total | 12,614 (100.0%) | 5,554 (100.0%) |
Physical Housing Characteristics in Crawford County
Housing Structures in Crawford County
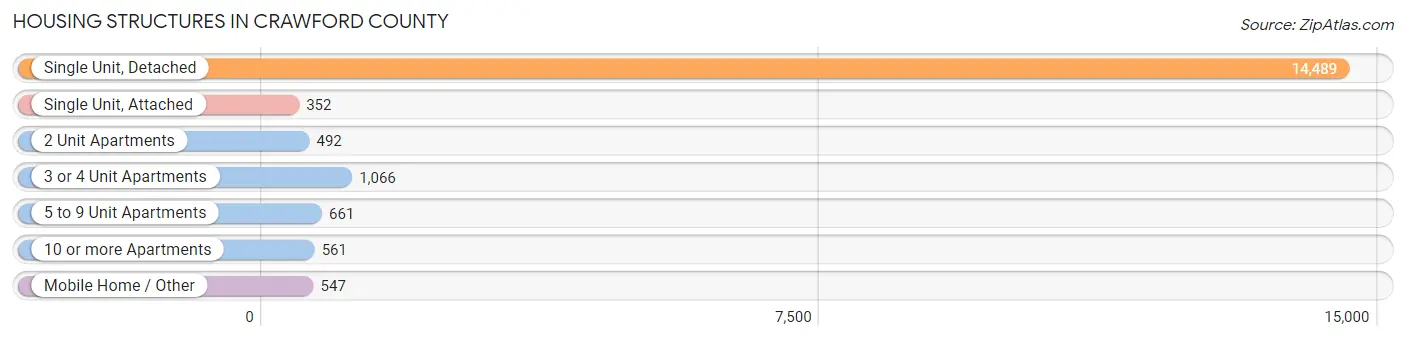
| Structure Type | # Housing Units | % Housing Units |
| Single Unit, Detached | 14,489 | 79.7% |
| Single Unit, Attached | 352 | 1.9% |
| 2 Unit Apartments | 492 | 2.7% |
| 3 or 4 Unit Apartments | 1,066 | 5.9% |
| 5 to 9 Unit Apartments | 661 | 3.6% |
| 10 or more Apartments | 561 | 3.1% |
| Mobile Home / Other | 547 | 3.0% |
| Total | 18,168 | 100.0% |
Housing Structures by Occupancy in Crawford County
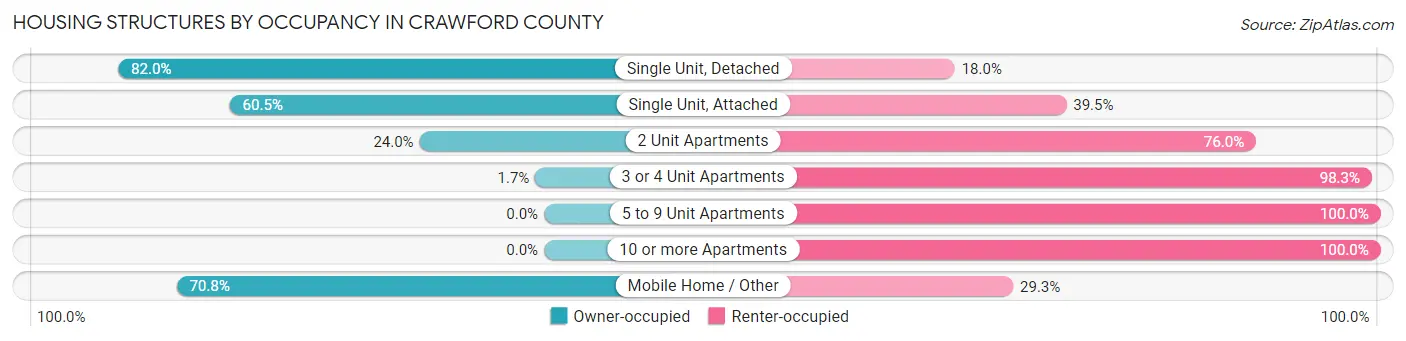
| Structure Type | Owner-occupied | Renter-occupied |
| Single Unit, Detached | 11,878 (82.0%) | 2,611 (18.0%) |
| Single Unit, Attached | 213 (60.5%) | 139 (39.5%) |
| 2 Unit Apartments | 118 (24.0%) | 374 (76.0%) |
| 3 or 4 Unit Apartments | 18 (1.7%) | 1,048 (98.3%) |
| 5 to 9 Unit Apartments | 0 (0.0%) | 661 (100.0%) |
| 10 or more Apartments | 0 (0.0%) | 561 (100.0%) |
| Mobile Home / Other | 387 (70.8%) | 160 (29.2%) |
| Total | 12,614 (69.4%) | 5,554 (30.6%) |
Housing Structures by Number of Rooms in Crawford County
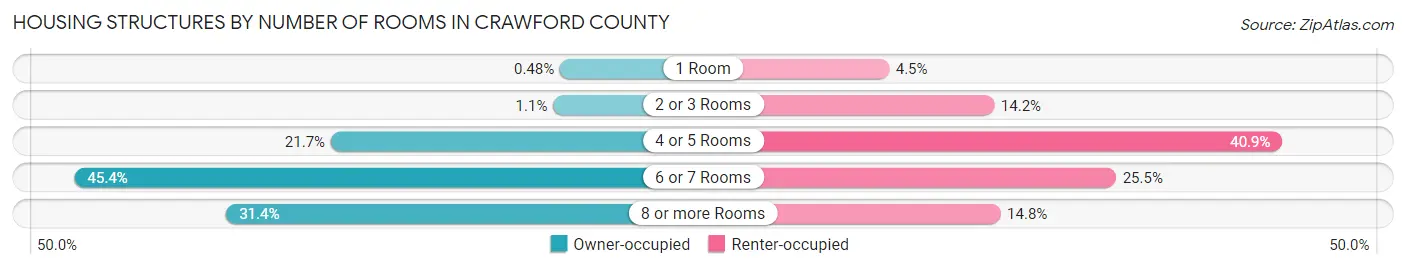
| Number of Rooms | Owner-occupied | Renter-occupied |
| 1 Room | 60 (0.5%) | 251 (4.5%) |
| 2 or 3 Rooms | 140 (1.1%) | 791 (14.2%) |
| 4 or 5 Rooms | 2,734 (21.7%) | 2,272 (40.9%) |
| 6 or 7 Rooms | 5,726 (45.4%) | 1,417 (25.5%) |
| 8 or more Rooms | 3,954 (31.4%) | 823 (14.8%) |
| Total | 12,614 (100.0%) | 5,554 (100.0%) |
Housing Structure by Heating Type in Crawford County
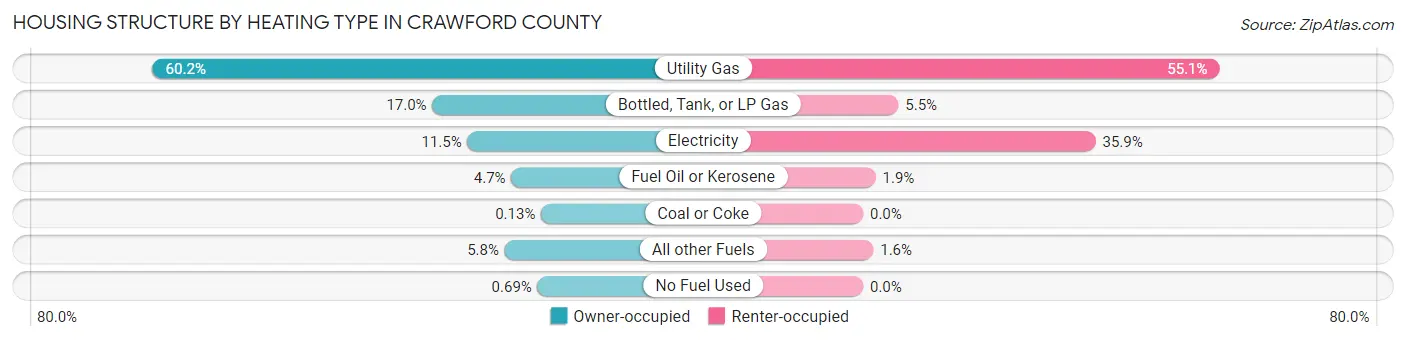
| Heating Type | Owner-occupied | Renter-occupied |
| Utility Gas | 7,594 (60.2%) | 3,059 (55.1%) |
| Bottled, Tank, or LP Gas | 2,138 (17.0%) | 303 (5.5%) |
| Electricity | 1,453 (11.5%) | 1,996 (35.9%) |
| Fuel Oil or Kerosene | 598 (4.7%) | 108 (1.9%) |
| Coal or Coke | 16 (0.1%) | 0 (0.0%) |
| All other Fuels | 728 (5.8%) | 88 (1.6%) |
| No Fuel Used | 87 (0.7%) | 0 (0.0%) |
| Total | 12,614 (100.0%) | 5,554 (100.0%) |
Household Vehicle Usage in Crawford County
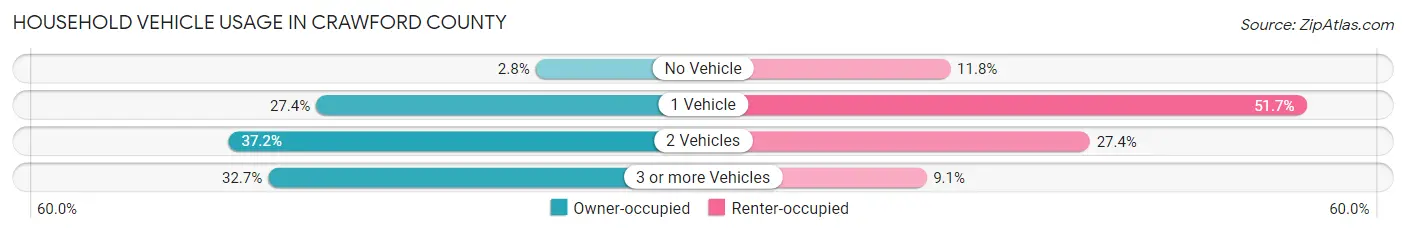
| Vehicles per Household | Owner-occupied | Renter-occupied |
| No Vehicle | 349 (2.8%) | 655 (11.8%) |
| 1 Vehicle | 3,450 (27.4%) | 2,870 (51.7%) |
| 2 Vehicles | 4,686 (37.1%) | 1,523 (27.4%) |
| 3 or more Vehicles | 4,129 (32.7%) | 506 (9.1%) |
| Total | 12,614 (100.0%) | 5,554 (100.0%) |
Real Estate & Mortgages in Crawford County
Real Estate and Mortgage Overview in Crawford County
| Characteristic | Without Mortgage | With Mortgage |
| Housing Units | 5,705 | 6,909 |
| Median Property Value | $111,400 | $120,700 |
| Median Household Income | $52,109 | $832 |
| Monthly Housing Costs | $444 | $38 |
| Real Estate Taxes | $1,278 | $151 |
Property Value by Mortgage Status in Crawford County

| Property Value | Without Mortgage | With Mortgage |
| Less than $50,000 | 751 (13.2%) | 321 (4.6%) |
| $50,000 to $99,999 | 1,773 (31.1%) | 2,231 (32.3%) |
| $100,000 to $299,999 | 2,932 (51.4%) | 3,835 (55.5%) |
| $300,000 to $499,999 | 217 (3.8%) | 474 (6.9%) |
| $500,000 to $749,999 | 9 (0.2%) | 39 (0.6%) |
| $750,000 to $999,999 | 6 (0.1%) | 0 (0.0%) |
| $1,000,000 or more | 17 (0.3%) | 9 (0.1%) |
| Total | 5,705 (100.0%) | 6,909 (100.0%) |
Household Income by Mortgage Status in Crawford County
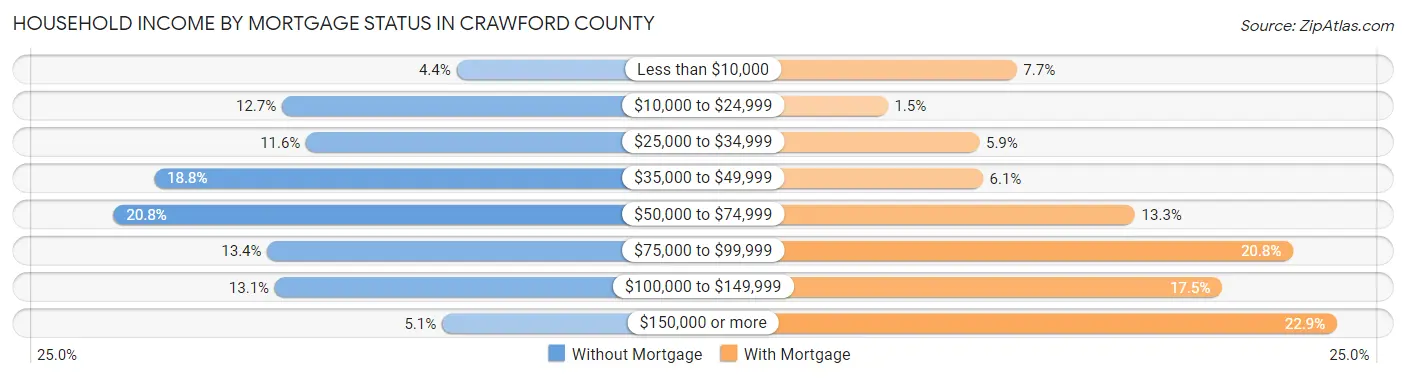
| Household Income | Without Mortgage | With Mortgage |
| Less than $10,000 | 253 (4.4%) | 529 (7.7%) |
| $10,000 to $24,999 | 727 (12.7%) | 105 (1.5%) |
| $25,000 to $34,999 | 661 (11.6%) | 406 (5.9%) |
| $35,000 to $49,999 | 1,074 (18.8%) | 418 (6.0%) |
| $50,000 to $74,999 | 1,185 (20.8%) | 918 (13.3%) |
| $75,000 to $99,999 | 767 (13.4%) | 1,440 (20.8%) |
| $100,000 to $149,999 | 746 (13.1%) | 1,206 (17.5%) |
| $150,000 or more | 292 (5.1%) | 1,584 (22.9%) |
| Total | 5,705 (100.0%) | 6,909 (100.0%) |
Property Value to Household Income Ratio in Crawford County
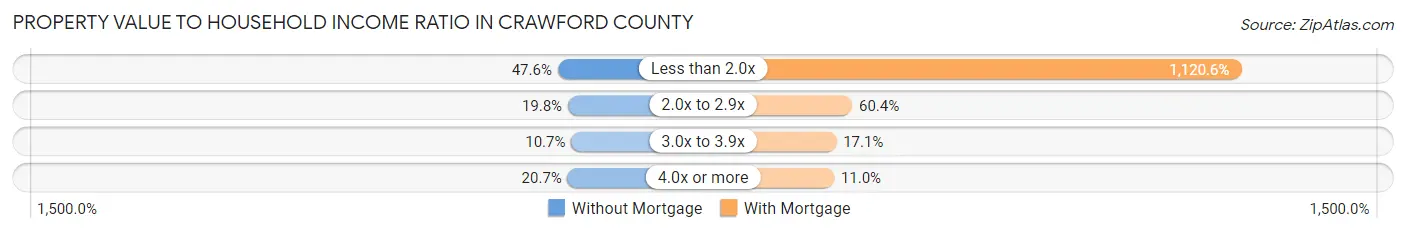
| Value-to-Income Ratio | Without Mortgage | With Mortgage |
| Less than 2.0x | 2,718 (47.6%) | 77,421 (1,120.6%) |
| 2.0x to 2.9x | 1,131 (19.8%) | 4,170 (60.4%) |
| 3.0x to 3.9x | 613 (10.7%) | 1,181 (17.1%) |
| 4.0x or more | 1,180 (20.7%) | 758 (11.0%) |
| Total | 5,705 (100.0%) | 6,909 (100.0%) |
Real Estate Taxes by Mortgage Status in Crawford County
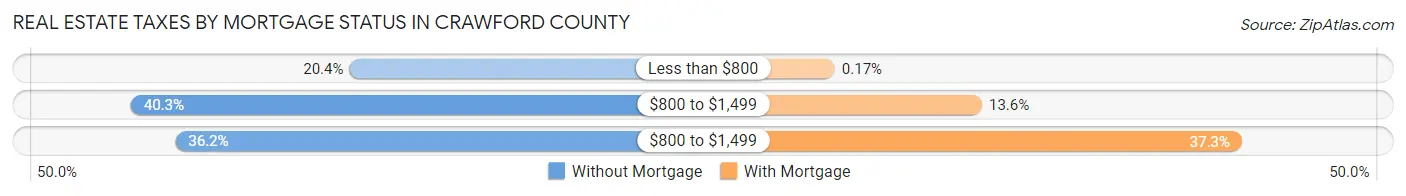
| Property Taxes | Without Mortgage | With Mortgage |
| Less than $800 | 1,161 (20.3%) | 12 (0.2%) |
| $800 to $1,499 | 2,299 (40.3%) | 940 (13.6%) |
| $800 to $1,499 | 2,067 (36.2%) | 2,579 (37.3%) |
| Total | 5,705 (100.0%) | 6,909 (100.0%) |
Health & Disability in Crawford County
Health Insurance Coverage by Age in Crawford County
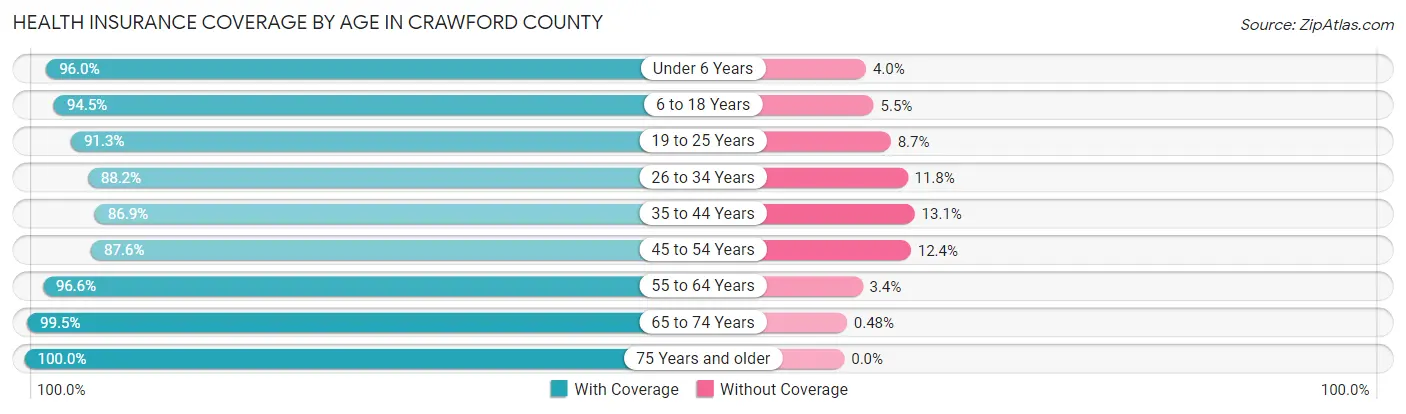
| Age Bracket | With Coverage | Without Coverage |
| Under 6 Years | 2,877 (96.0%) | 121 (4.0%) |
| 6 to 18 Years | 6,156 (94.5%) | 356 (5.5%) |
| 19 to 25 Years | 2,965 (91.3%) | 281 (8.7%) |
| 26 to 34 Years | 3,858 (88.2%) | 516 (11.8%) |
| 35 to 44 Years | 4,094 (86.9%) | 618 (13.1%) |
| 45 to 54 Years | 4,756 (87.6%) | 673 (12.4%) |
| 55 to 64 Years | 5,602 (96.6%) | 197 (3.4%) |
| 65 to 74 Years | 4,766 (99.5%) | 23 (0.5%) |
| 75 Years and older | 3,503 (100.0%) | 0 (0.0%) |
| Total | 38,577 (93.3%) | 2,785 (6.7%) |
Health Insurance Coverage by Citizenship Status in Crawford County
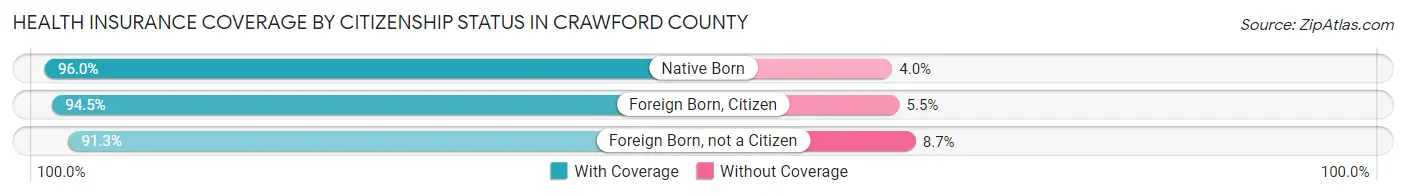
| Citizenship Status | With Coverage | Without Coverage |
| Native Born | 2,877 (96.0%) | 121 (4.0%) |
| Foreign Born, Citizen | 6,156 (94.5%) | 356 (5.5%) |
| Foreign Born, not a Citizen | 2,965 (91.3%) | 281 (8.7%) |
Health Insurance Coverage by Household Income in Crawford County
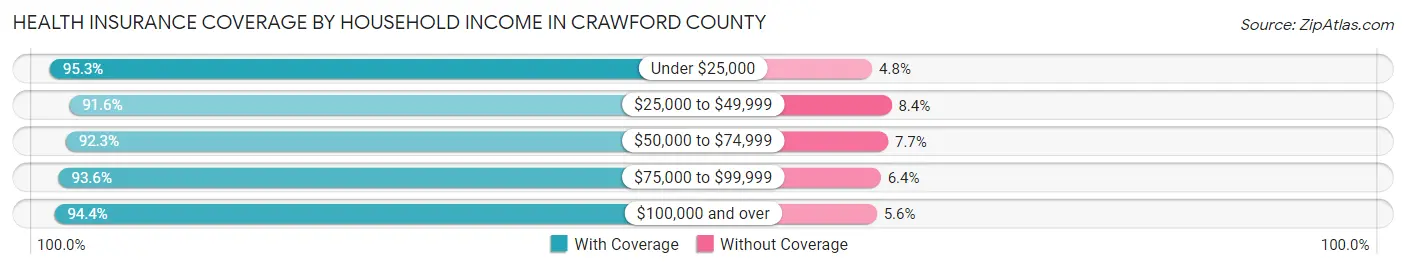
| Household Income | With Coverage | Without Coverage |
| Under $25,000 | 5,214 (95.3%) | 260 (4.8%) |
| $25,000 to $49,999 | 9,410 (91.6%) | 860 (8.4%) |
| $50,000 to $74,999 | 8,210 (92.3%) | 688 (7.7%) |
| $75,000 to $99,999 | 5,112 (93.6%) | 347 (6.4%) |
| $100,000 and over | 10,598 (94.4%) | 629 (5.6%) |
Public vs Private Health Insurance Coverage by Age in Crawford County
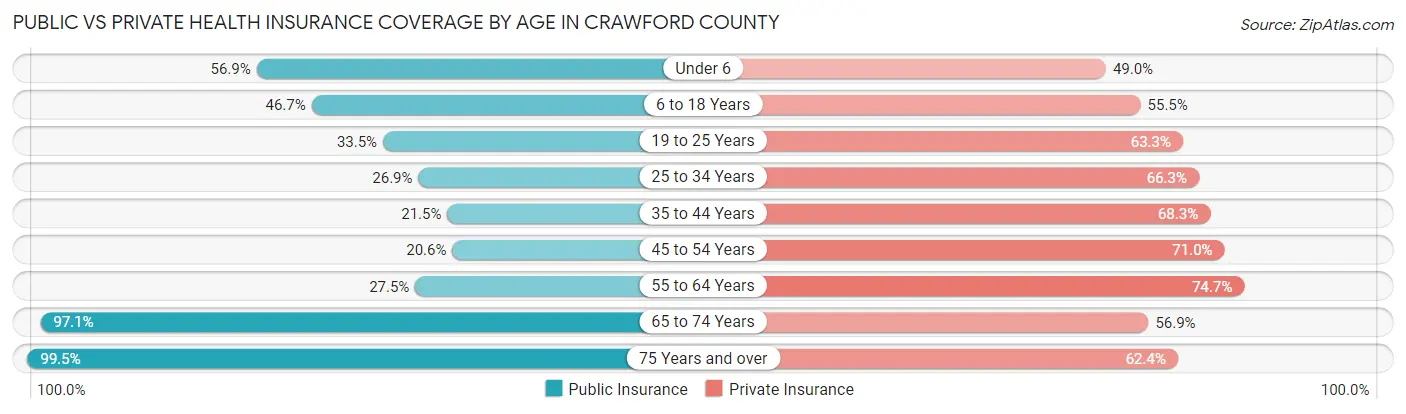
| Age Bracket | Public Insurance | Private Insurance |
| Under 6 | 1,707 (56.9%) | 1,470 (49.0%) |
| 6 to 18 Years | 3,044 (46.7%) | 3,612 (55.5%) |
| 19 to 25 Years | 1,087 (33.5%) | 2,054 (63.3%) |
| 25 to 34 Years | 1,177 (26.9%) | 2,898 (66.3%) |
| 35 to 44 Years | 1,015 (21.5%) | 3,220 (68.3%) |
| 45 to 54 Years | 1,119 (20.6%) | 3,855 (71.0%) |
| 55 to 64 Years | 1,595 (27.5%) | 4,331 (74.7%) |
| 65 to 74 Years | 4,649 (97.1%) | 2,726 (56.9%) |
| 75 Years and over | 3,485 (99.5%) | 2,184 (62.4%) |
| Total | 18,878 (45.6%) | 26,350 (63.7%) |
Disability Status by Sex by Age in Crawford County
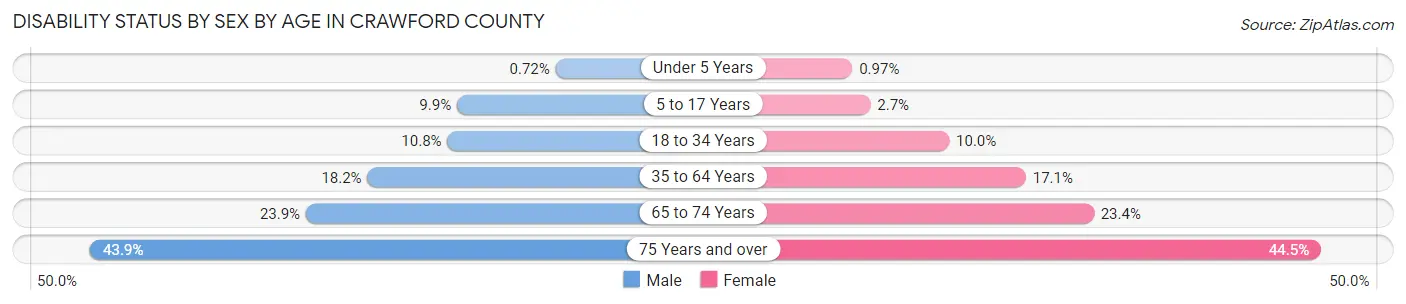
| Age Bracket | Male | Female |
| Under 5 Years | 9 (0.7%) | 11 (1.0%) |
| 5 to 17 Years | 345 (9.9%) | 87 (2.6%) |
| 18 to 34 Years | 421 (10.8%) | 404 (10.0%) |
| 35 to 64 Years | 1,475 (18.2%) | 1,337 (17.1%) |
| 65 to 74 Years | 541 (23.9%) | 590 (23.4%) |
| 75 Years and over | 641 (43.9%) | 909 (44.5%) |
Disability Class by Sex by Age in Crawford County
Disability Class: Hearing Difficulty
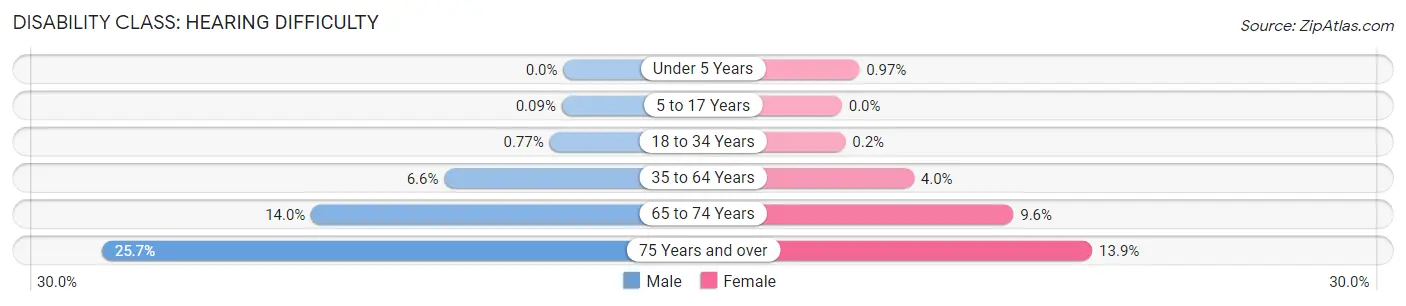
| Age Bracket | Male | Female |
| Under 5 Years | 0 (0.0%) | 11 (1.0%) |
| 5 to 17 Years | 3 (0.1%) | 0 (0.0%) |
| 18 to 34 Years | 30 (0.8%) | 8 (0.2%) |
| 35 to 64 Years | 538 (6.6%) | 314 (4.0%) |
| 65 to 74 Years | 318 (14.0%) | 241 (9.6%) |
| 75 Years and over | 375 (25.7%) | 285 (13.9%) |
Disability Class: Vision Difficulty
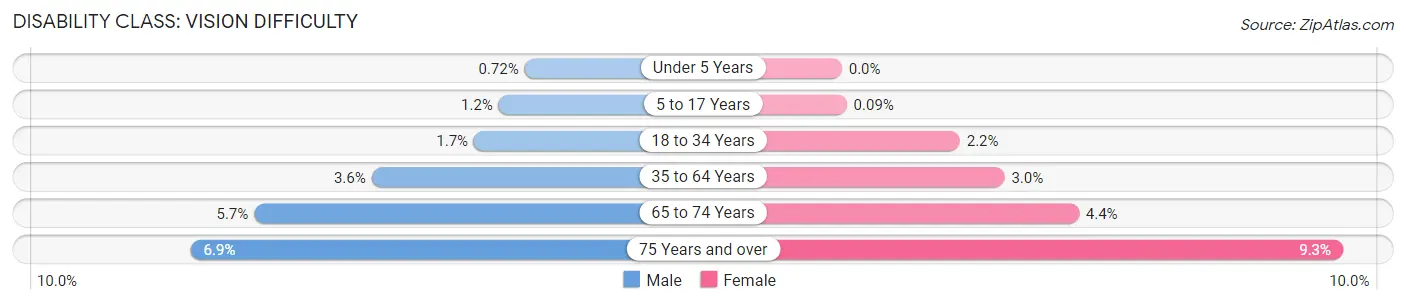
| Age Bracket | Male | Female |
| Under 5 Years | 9 (0.7%) | 0 (0.0%) |
| 5 to 17 Years | 42 (1.2%) | 3 (0.1%) |
| 18 to 34 Years | 65 (1.7%) | 89 (2.2%) |
| 35 to 64 Years | 289 (3.6%) | 236 (3.0%) |
| 65 to 74 Years | 130 (5.7%) | 111 (4.4%) |
| 75 Years and over | 101 (6.9%) | 190 (9.3%) |
Disability Class: Cognitive Difficulty
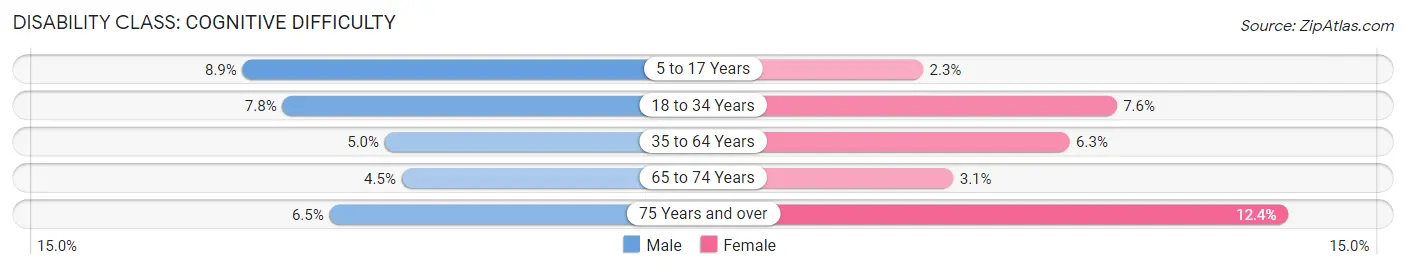
| Age Bracket | Male | Female |
| 5 to 17 Years | 312 (8.9%) | 74 (2.2%) |
| 18 to 34 Years | 306 (7.8%) | 310 (7.6%) |
| 35 to 64 Years | 403 (5.0%) | 495 (6.3%) |
| 65 to 74 Years | 102 (4.5%) | 78 (3.1%) |
| 75 Years and over | 95 (6.5%) | 254 (12.4%) |
Disability Class: Ambulatory Difficulty

| Age Bracket | Male | Female |
| 5 to 17 Years | 0 (0.0%) | 9 (0.3%) |
| 18 to 34 Years | 89 (2.3%) | 80 (2.0%) |
| 35 to 64 Years | 689 (8.5%) | 854 (10.9%) |
| 65 to 74 Years | 276 (12.2%) | 291 (11.5%) |
| 75 Years and over | 300 (20.6%) | 598 (29.3%) |
Disability Class: Self-Care Difficulty
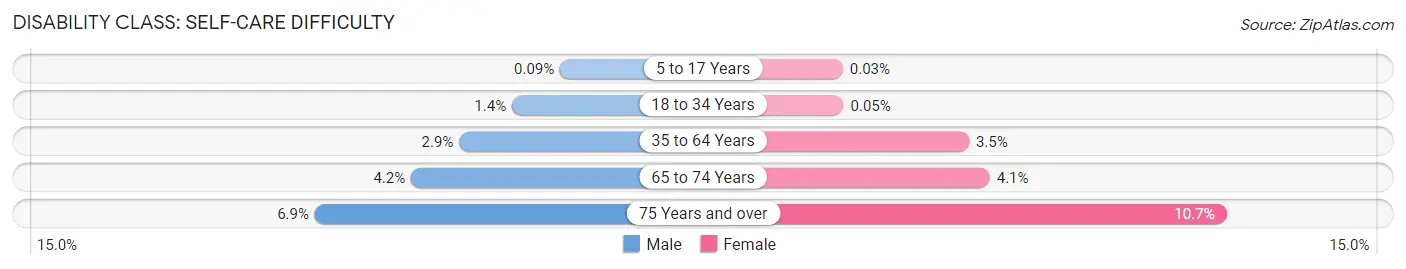
| Age Bracket | Male | Female |
| 5 to 17 Years | 3 (0.1%) | 1 (0.0%) |
| 18 to 34 Years | 56 (1.4%) | 2 (0.1%) |
| 35 to 64 Years | 235 (2.9%) | 277 (3.5%) |
| 65 to 74 Years | 96 (4.2%) | 104 (4.1%) |
| 75 Years and over | 101 (6.9%) | 219 (10.7%) |
Technology Access in Crawford County
Computing Device Access in Crawford County
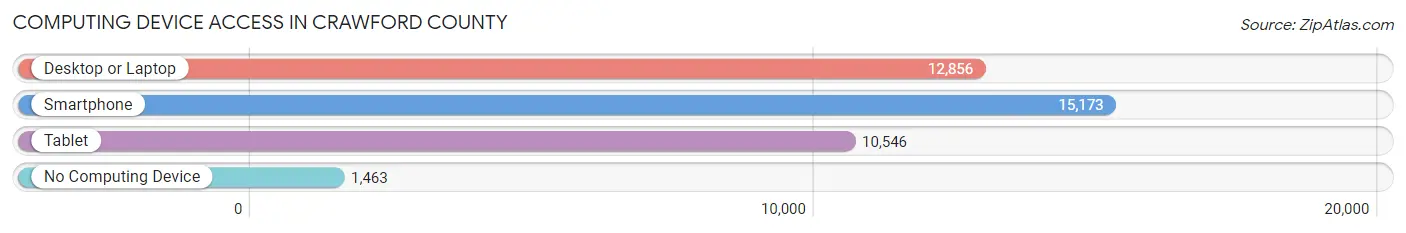
| Device Type | # Households | % Households |
| Desktop or Laptop | 12,856 | 70.8% |
| Smartphone | 15,173 | 83.5% |
| Tablet | 10,546 | 58.1% |
| No Computing Device | 1,463 | 8.1% |
| Total | 18,168 | 100.0% |
Internet Access in Crawford County

| Internet Type | # Households | % Households |
| Dial-Up Internet | 113 | 0.6% |
| Broadband Home | 11,834 | 65.1% |
| Cellular Data Only | 2,405 | 13.2% |
| Satellite Internet | 1,633 | 9.0% |
| No Internet | 2,506 | 13.8% |
| Total | 18,168 | 100.0% |
Crawford County Summary
Crawford County, Ohio is located in the north central part of the state, and is bordered by Richland, Morrow, Marion, Wyandot, Seneca, Huron, and Erie counties. The county seat is Bucyrus, and the county was established in 1820. The county has a total area of 412 square miles, and a population of 43,784 as of the 2010 census.
History
Crawford County was formed in 1820 from parts of Richland, Marion, and Wyandot counties. It was named after Colonel William Crawford, who was a Revolutionary War soldier and an early settler in the area. The county was originally part of the Northwest Territory, and was part of the Connecticut Western Reserve. The first settlers in the area were mostly of German and English descent.
The county was an important part of the Underground Railroad, and many of the county's residents were involved in helping escaped slaves make their way to freedom. The county was also home to several important battles during the Civil War, including the Battle of Bucyrus and the Battle of Sandusky.
Geography
Crawford County is located in the north central part of Ohio, and is bordered by Richland, Morrow, Marion, Wyandot, Seneca, Huron, and Erie counties. The county has a total area of 412 square miles, and is mostly flat with some rolling hills. The county is drained by the Sandusky River, which flows through the county from north to south.
The county is home to several state parks, including Mohican State Park, which is located in the northern part of the county. The park is home to a variety of wildlife, including deer, wild turkeys, and bald eagles. The county is also home to several lakes, including Charles Mill Lake, which is located in the southern part of the county.
Economy
Crawford County has a diverse economy, with a mix of manufacturing, agriculture, and services. The county is home to several large employers, including Whirlpool Corporation, which has a manufacturing plant in the county. The county is also home to several smaller businesses, including several wineries and breweries.
Agriculture is an important part of the county's economy, and the county is home to several large farms. The county is also home to several small businesses, including several restaurants, retail stores, and other services.
Demographics
As of the 2010 census, Crawford County had a population of 43,784. The population was spread out, with 24.3% under the age of 18, 8.2% from 18 to 24, 25.2% from 25 to 44, 25.7% from 45 to 64, and 16.6% who were 65 years of age or older. The median age was 39.4 years.
The racial makeup of the county was 95.2% White, 1.3% African American, 0.3% Native American, 0.5% Asian, 0.1% Pacific Islander, 1.2% from other races, and 1.4% from two or more races. Hispanic or Latino of any race were 2.7% of the population.
The median income for a household in the county was $41,945, and the median income for a family was $50,945. The per capita income for the county was $20,945. About 11.2% of families and 14.2% of the population were below the poverty line, including 19.2% of those under age 18 and 8.2% of those age 65 or over.
Common Questions
What is the Total Population of Crawford County?
Total Population of Crawford County is 41,861.
What is the Total Male Population of Crawford County?
Total Male Population of Crawford County is 20,711.
What is the Total Female Population of Crawford County?
Total Female Population of Crawford County is 21,150.
What is the Ratio of Males per 100 Females in Crawford County?
There are 97.92 Males per 100 Females in Crawford County.
What is the Ratio of Females per 100 Males in Crawford County?
There are 102.12 Females per 100 Males in Crawford County.
What is the Median Population Age in Crawford County?
Median Population Age in Crawford County is 42.9 Years.
What is the Average Family Size in Crawford County
Average Family Size in Crawford County is 2.8 People.
What is the Average Household Size in Crawford County
Average Household Size in Crawford County is 2.3 People.
What is Per Capita Income in Crawford County?
Per Capita income in Crawford County is $29,566.
What is the Median Family Income in Crawford County?
Median Family Income in Crawford County is $65,249.
What is the Median Household income in Crawford County?
Median Household Income in Crawford County is $52,486.
What is Income or Wage Gap in Crawford County?
Income or Wage Gap in Crawford County is 35.9%.
Women in Crawford County earn 64.1 cents for every dollar earned by a man.
What is Family Income Deficit in Crawford County?
Family Income Deficit in Crawford County is $11,848.
Families that are below poverty line in Crawford County earn $11,848 less on average than the poverty threshold level.
What is Inequality or Gini Index in Crawford County?
Inequality or Gini Index in Crawford County is 0.42.
How Large is the Labor Force in Crawford County?
There are 20,358 People in the Labor Forcein in Crawford County.
What is the Percentage of People in the Labor Force in Crawford County?
60.3% of People are in the Labor Force in Crawford County.
What is the Unemployment Rate in Crawford County?
Unemployment Rate in Crawford County is 5.5%.