Columbiana County, OH
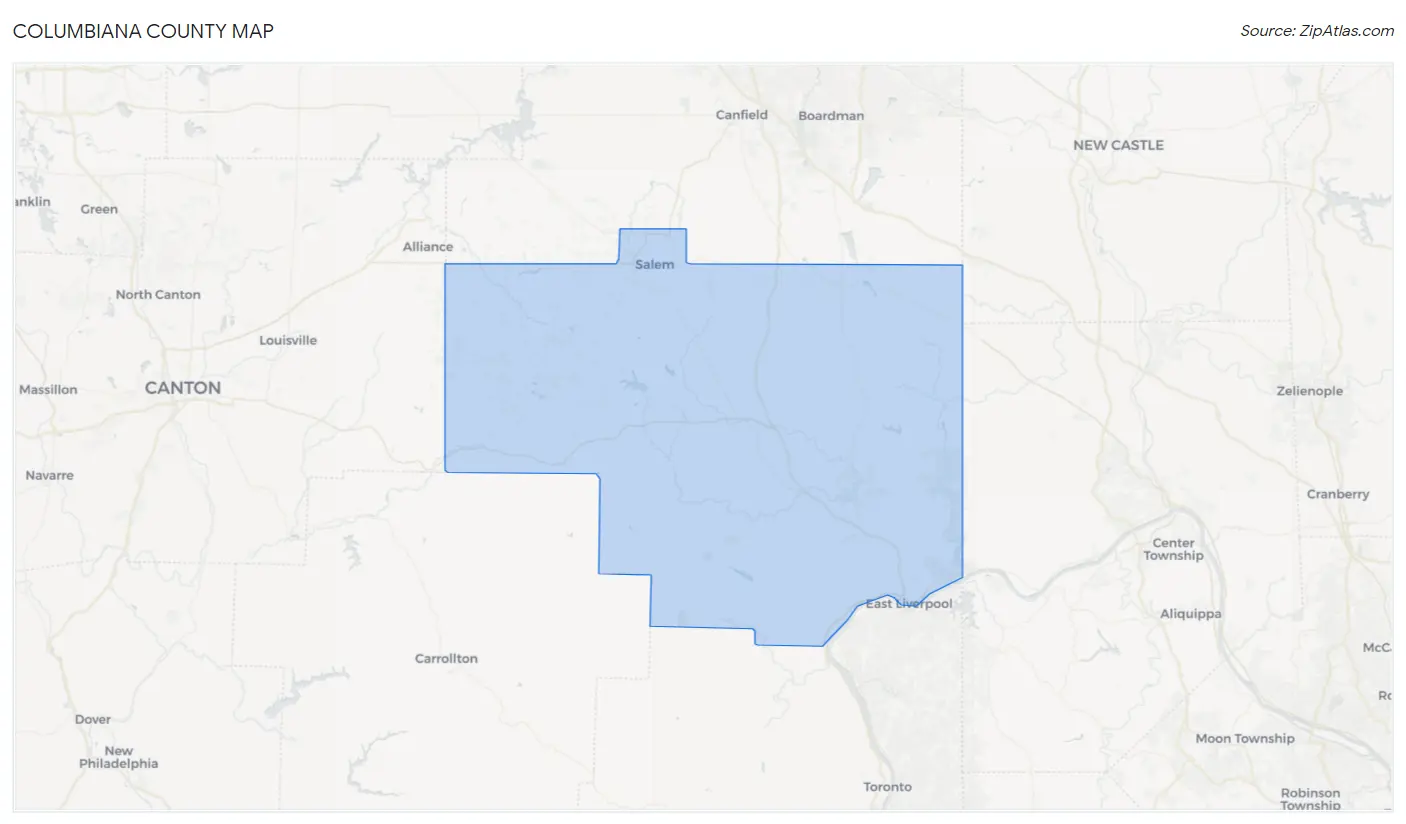
Columbiana County Map
Columbiana County Overview
101,723
TOTAL POPULATION
51,455
MALE POPULATION
50,268
FEMALE POPULATION
102.36
MALES / 100 FEMALES
97.69
FEMALES / 100 MALES
44.5
MEDIAN AGE
3.0
AVG FAMILY SIZE
2.4
AVG HOUSEHOLD SIZE
$30,553
PER CAPITA INCOME
$75,945
AVG FAMILY INCOME
$55,473
AVG HOUSEHOLD INCOME
36.7%
WAGE / INCOME GAP [ % ]
63.3¢/ $1
WAGE / INCOME GAP [ $ ]
$10,620
FAMILY INCOME DEFICIT
0.44
INEQUALITY / GINI INDEX
48,792
LABOR FORCE [ PEOPLE ]
58.1%
PERCENT IN LABOR FORCE
4.9%
UNEMPLOYMENT RATE
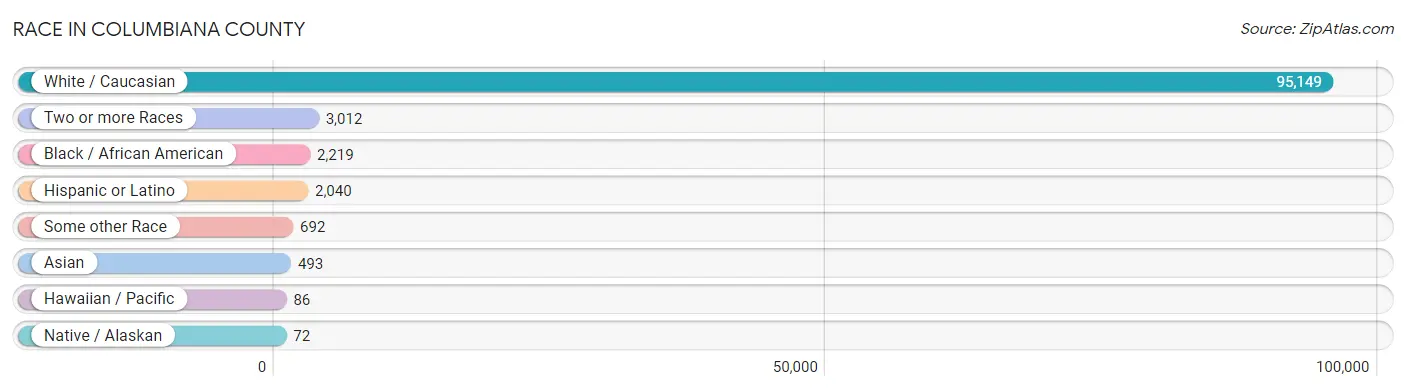
Race in Columbiana County
The most populous races in Columbiana County are White / Caucasian (95,149 | 93.5%), Two or more Races (3,012 | 3.0%), and Black / African American (2,219 | 2.2%).
| Race | # Population | % Population |
| Asian | 493 | 0.5% |
| Black / African American | 2,219 | 2.2% |
| Hawaiian / Pacific | 86 | 0.1% |
| Hispanic or Latino | 2,040 | 2.0% |
| Native / Alaskan | 72 | 0.1% |
| White / Caucasian | 95,149 | 93.5% |
| Two or more Races | 3,012 | 3.0% |
| Some other Race | 692 | 0.7% |
| Total | 101,723 | 100.0% |
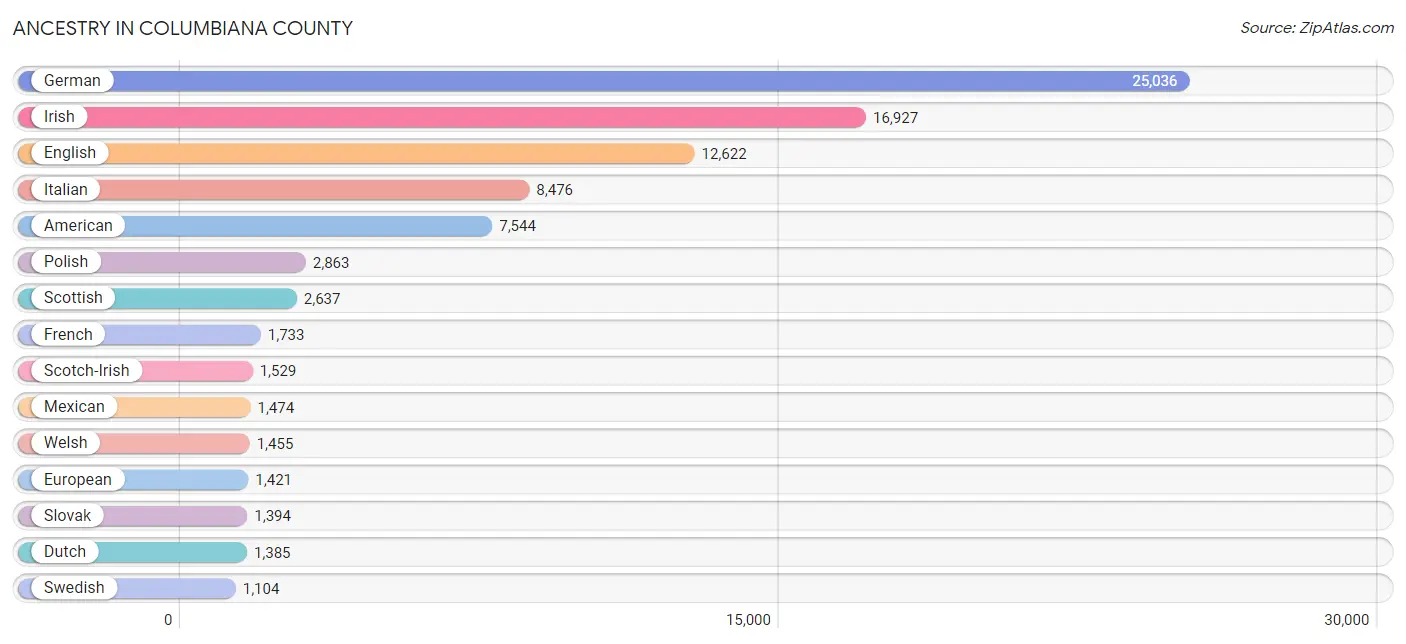
Ancestry in Columbiana County
The most populous ancestries reported in Columbiana County are German (25,036 | 24.6%), Irish (16,927 | 16.6%), English (12,622 | 12.4%), Italian (8,476 | 8.3%), and American (7,544 | 7.4%), together accounting for 69.4% of all Columbiana County residents.
| Ancestry | # Population | % Population |
| African | 201 | 0.2% |
| American | 7,544 | 7.4% |
| Apache | 7 | 0.0% |
| Arab | 181 | 0.2% |
| Arapaho | 10 | 0.0% |
| Austrian | 245 | 0.2% |
| Belgian | 107 | 0.1% |
| Bhutanese | 169 | 0.2% |
| Blackfeet | 74 | 0.1% |
| Brazilian | 40 | 0.0% |
| British | 350 | 0.3% |
| Burmese | 18 | 0.0% |
| Canadian | 22 | 0.0% |
| Carpatho Rusyn | 9 | 0.0% |
| Central American | 15 | 0.0% |
| Central American Indian | 122 | 0.1% |
| Cherokee | 150 | 0.2% |
| Chilean | 44 | 0.0% |
| Chippewa | 15 | 0.0% |
| Choctaw | 21 | 0.0% |
| Colombian | 62 | 0.1% |
| Croatian | 303 | 0.3% |
| Cuban | 65 | 0.1% |
| Czech | 351 | 0.4% |
| Czechoslovakian | 269 | 0.3% |
| Danish | 38 | 0.0% |
| Dutch | 1,385 | 1.4% |
| Eastern European | 342 | 0.3% |
| English | 12,622 | 12.4% |
| European | 1,421 | 1.4% |
| Finnish | 30 | 0.0% |
| French | 1,733 | 1.7% |
| French Canadian | 113 | 0.1% |
| German | 25,036 | 24.6% |
| Greek | 83 | 0.1% |
| Guamanian / Chamorro | 14 | 0.0% |
| Hungarian | 899 | 0.9% |
| Indian (Asian) | 73 | 0.1% |
| Irish | 16,927 | 16.6% |
| Iroquois | 6 | 0.0% |
| Italian | 8,476 | 8.3% |
| Japanese | 89 | 0.1% |
| Korean | 43 | 0.0% |
| Laotian | 44 | 0.0% |
| Latvian | 76 | 0.1% |
| Lebanese | 117 | 0.1% |
| Lithuanian | 24 | 0.0% |
| Lumbee | 43 | 0.0% |
| Mexican | 1,474 | 1.5% |
| Nigerian | 11 | 0.0% |
| Northern European | 34 | 0.0% |
| Norwegian | 197 | 0.2% |
| Panamanian | 15 | 0.0% |
| Pennsylvania German | 222 | 0.2% |
| Polish | 2,863 | 2.8% |
| Portuguese | 14 | 0.0% |
| Puerto Rican | 71 | 0.1% |
| Romanian | 301 | 0.3% |
| Russian | 329 | 0.3% |
| Scandinavian | 121 | 0.1% |
| Scotch-Irish | 1,529 | 1.5% |
| Scottish | 2,637 | 2.6% |
| Serbian | 171 | 0.2% |
| Sioux | 21 | 0.0% |
| Slavic | 17 | 0.0% |
| Slovak | 1,394 | 1.4% |
| Slovene | 79 | 0.1% |
| South American | 106 | 0.1% |
| Spaniard | 61 | 0.1% |
| Sri Lankan | 153 | 0.2% |
| Subsaharan African | 219 | 0.2% |
| Swedish | 1,104 | 1.1% |
| Swiss | 820 | 0.8% |
| Thai | 46 | 0.1% |
| Ukrainian | 203 | 0.2% |
| Welsh | 1,455 | 1.4% |
| Yaqui | 12 | 0.0% |
| Yugoslavian | 18 | 0.0% | View All 78 Rows |
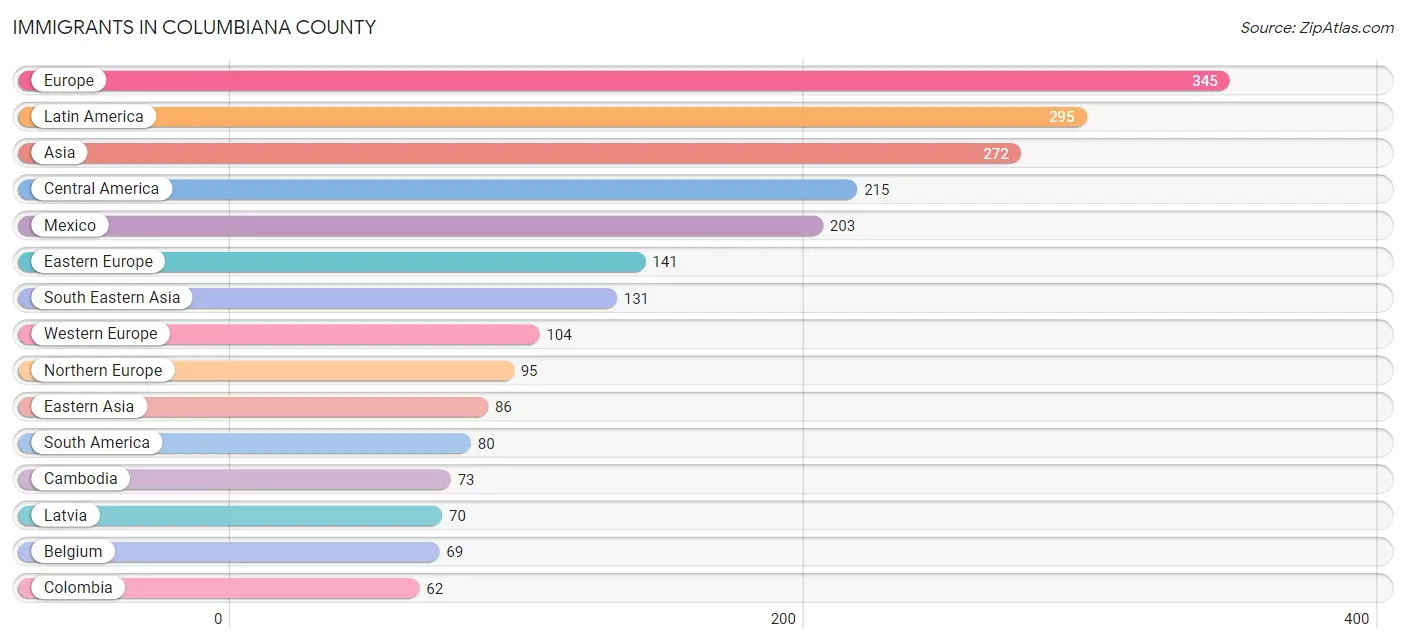
Immigrants in Columbiana County
The most numerous immigrant groups reported in Columbiana County came from Europe (345 | 0.3%), Latin America (295 | 0.3%), Asia (272 | 0.3%), Central America (215 | 0.2%), and Mexico (203 | 0.2%), together accounting for 1.3% of all Columbiana County residents.
| Immigration Origin | # Population | % Population |
| Asia | 272 | 0.3% |
| Austria | 6 | 0.0% |
| Belgium | 69 | 0.1% |
| Brazil | 11 | 0.0% |
| Cambodia | 73 | 0.1% |
| Canada | 46 | 0.1% |
| Central America | 215 | 0.2% |
| China | 59 | 0.1% |
| Colombia | 62 | 0.1% |
| Croatia | 12 | 0.0% |
| Czechoslovakia | 5 | 0.0% |
| Eastern Asia | 86 | 0.1% |
| Eastern Europe | 141 | 0.1% |
| Ecuador | 7 | 0.0% |
| El Salvador | 12 | 0.0% |
| England | 25 | 0.0% |
| Europe | 345 | 0.3% |
| Germany | 29 | 0.0% |
| Hong Kong | 42 | 0.0% |
| Hungary | 19 | 0.0% |
| India | 30 | 0.0% |
| Indonesia | 26 | 0.0% |
| Ireland | 12 | 0.0% |
| Italy | 5 | 0.0% |
| Japan | 27 | 0.0% |
| Laos | 7 | 0.0% |
| Latin America | 295 | 0.3% |
| Latvia | 70 | 0.1% |
| Mexico | 203 | 0.2% |
| Micronesia | 2 | 0.0% |
| Moldova | 24 | 0.0% |
| Northern Europe | 95 | 0.1% |
| Oceania | 2 | 0.0% |
| Philippines | 25 | 0.0% |
| Russia | 6 | 0.0% |
| Saudi Arabia | 16 | 0.0% |
| South America | 80 | 0.1% |
| South Central Asia | 30 | 0.0% |
| South Eastern Asia | 131 | 0.1% |
| Southern Europe | 5 | 0.0% |
| Taiwan | 11 | 0.0% |
| Ukraine | 5 | 0.0% |
| Western Asia | 16 | 0.0% |
| Western Europe | 104 | 0.1% | View All 44 Rows |
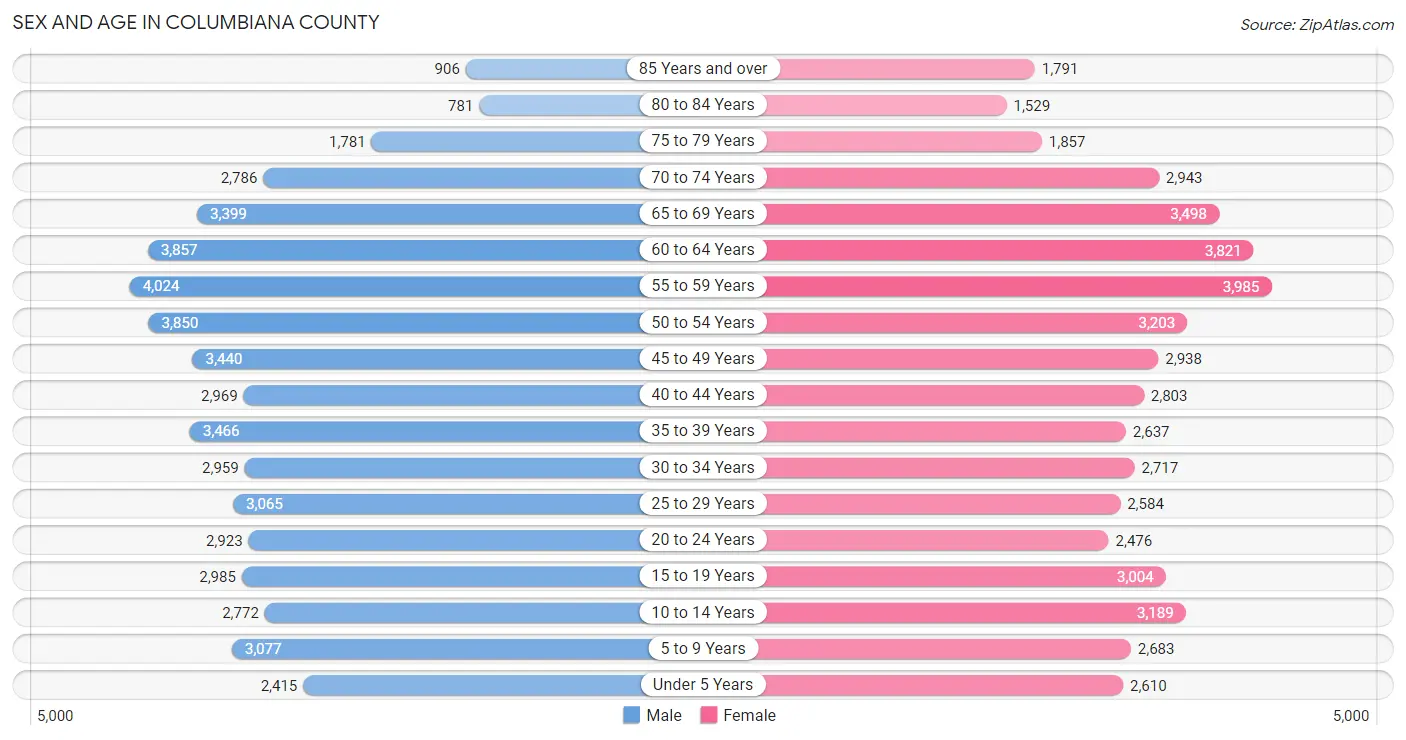
Sex and Age in Columbiana County
Sex and Age in Columbiana County
The most populous age groups in Columbiana County are 55 to 59 Years (4,024 | 7.8%) for men and 55 to 59 Years (3,985 | 7.9%) for women.
| Age Bracket | Male | Female |
| Under 5 Years | 2,415 (4.7%) | 2,610 (5.2%) |
| 5 to 9 Years | 3,077 (6.0%) | 2,683 (5.3%) |
| 10 to 14 Years | 2,772 (5.4%) | 3,189 (6.3%) |
| 15 to 19 Years | 2,985 (5.8%) | 3,004 (6.0%) |
| 20 to 24 Years | 2,923 (5.7%) | 2,476 (4.9%) |
| 25 to 29 Years | 3,065 (6.0%) | 2,584 (5.1%) |
| 30 to 34 Years | 2,959 (5.8%) | 2,717 (5.4%) |
| 35 to 39 Years | 3,466 (6.7%) | 2,637 (5.2%) |
| 40 to 44 Years | 2,969 (5.8%) | 2,803 (5.6%) |
| 45 to 49 Years | 3,440 (6.7%) | 2,938 (5.8%) |
| 50 to 54 Years | 3,850 (7.5%) | 3,203 (6.4%) |
| 55 to 59 Years | 4,024 (7.8%) | 3,985 (7.9%) |
| 60 to 64 Years | 3,857 (7.5%) | 3,821 (7.6%) |
| 65 to 69 Years | 3,399 (6.6%) | 3,498 (7.0%) |
| 70 to 74 Years | 2,786 (5.4%) | 2,943 (5.9%) |
| 75 to 79 Years | 1,781 (3.5%) | 1,857 (3.7%) |
| 80 to 84 Years | 781 (1.5%) | 1,529 (3.0%) |
| 85 Years and over | 906 (1.8%) | 1,791 (3.6%) |
| Total | 51,455 (100.0%) | 50,268 (100.0%) |
Families and Households in Columbiana County
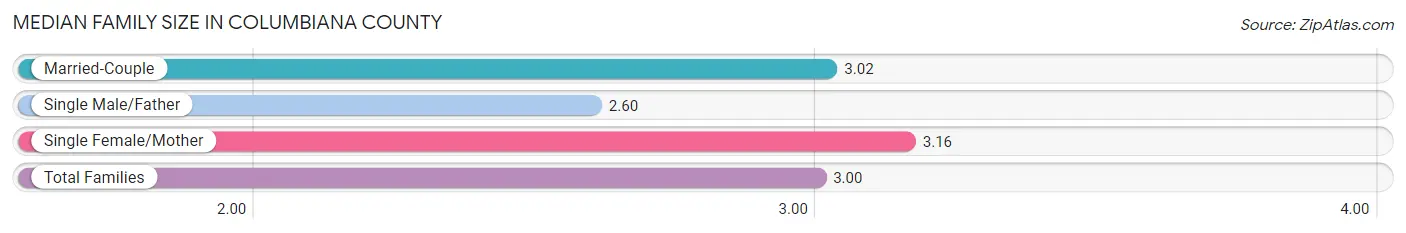
Median Family Size in Columbiana County
The median family size in Columbiana County is 3.00 persons per family, with single female/mother families (4,141 | 16.1%) accounting for the largest median family size of 3.16 persons per family. On the other hand, single male/father families (2,587 | 10.0%) represent the smallest median family size with 2.60 persons per family.
| Family Type | # Families | Family Size |
| Married-Couple | 19,073 (73.9%) | 3.02 |
| Single Male/Father | 2,587 (10.0%) | 2.60 |
| Single Female/Mother | 4,141 (16.1%) | 3.16 |
| Total Families | 25,801 (100.0%) | 3.00 |
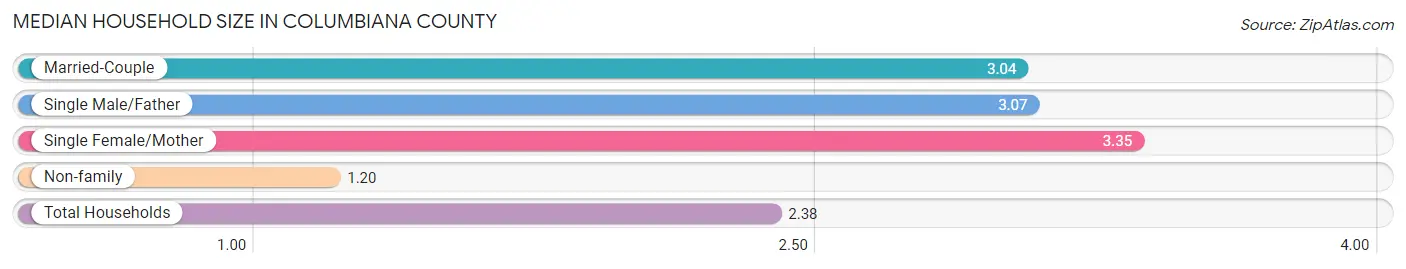
Median Household Size in Columbiana County
The median household size in Columbiana County is 2.38 persons per household, with single female/mother households (4,141 | 10.0%) accounting for the largest median household size of 3.35 persons per household. non-family households (15,450 | 37.4%) represent the smallest median household size with 1.20 persons per household.
| Household Type | # Households | Household Size |
| Married-Couple | 19,073 (46.2%) | 3.04 |
| Single Male/Father | 2,587 (6.3%) | 3.07 |
| Single Female/Mother | 4,141 (10.0%) | 3.35 |
| Non-family | 15,450 (37.4%) | 1.20 |
| Total Households | 41,251 (100.0%) | 2.38 |
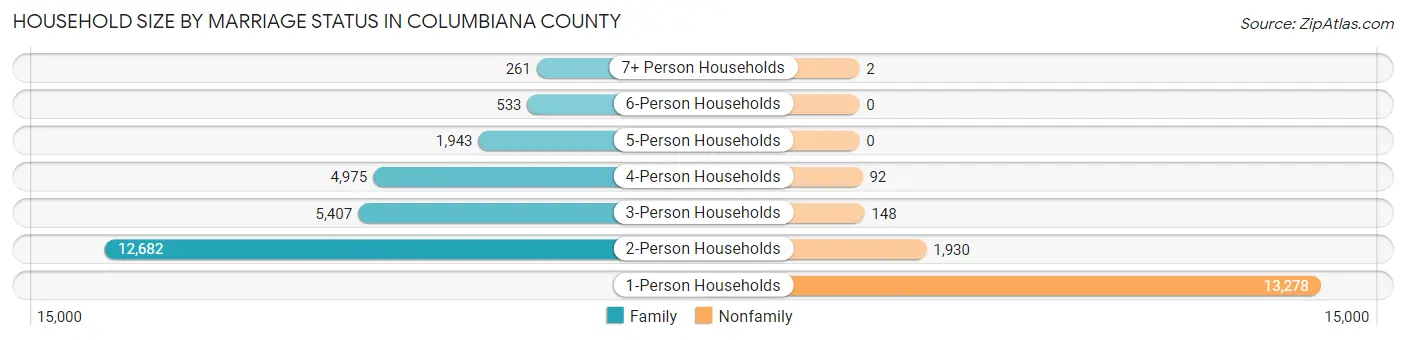
Household Size by Marriage Status in Columbiana County
Out of a total of 41,251 households in Columbiana County, 25,801 (62.5%) are family households, while 15,450 (37.4%) are nonfamily households. The most numerous type of family households are 2-person households, comprising 12,682, and the most common type of nonfamily households are 1-person households, comprising 13,278.
| Household Size | Family Households | Nonfamily Households |
| 1-Person Households | - | 13,278 (32.2%) |
| 2-Person Households | 12,682 (30.7%) | 1,930 (4.7%) |
| 3-Person Households | 5,407 (13.1%) | 148 (0.4%) |
| 4-Person Households | 4,975 (12.1%) | 92 (0.2%) |
| 5-Person Households | 1,943 (4.7%) | 0 (0.0%) |
| 6-Person Households | 533 (1.3%) | 0 (0.0%) |
| 7+ Person Households | 261 (0.6%) | 2 (0.0%) |
| Total | 25,801 (62.5%) | 15,450 (37.4%) |
Female Fertility in Columbiana County
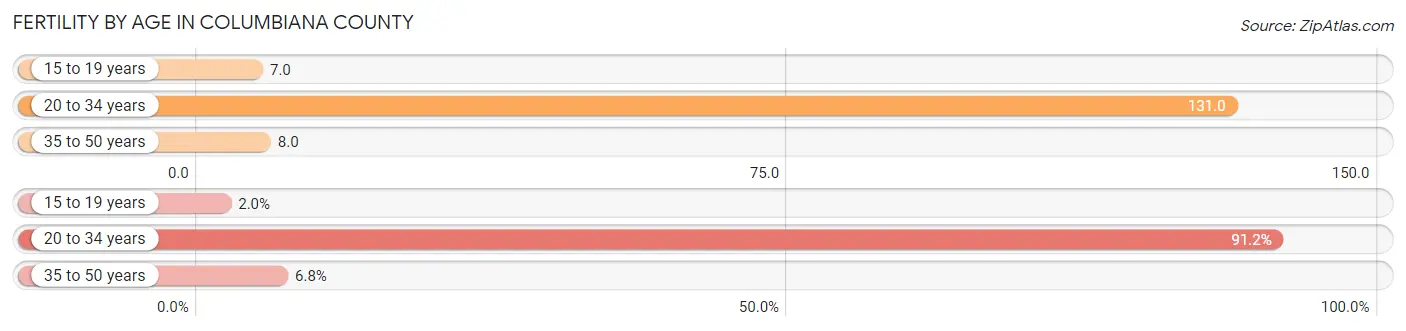
Fertility by Age in Columbiana County
Average fertility rate in Columbiana County is 56.0 births per 1,000 women. Women in the age bracket of 20 to 34 years have the highest fertility rate with 131.0 births per 1,000 women. Women in the age bracket of 20 to 34 years acount for 91.2% of all women with births.
| Age Bracket | Women with Births | Births / 1,000 Women |
| 15 to 19 years | 22 (2.0%) | 7.0 |
| 20 to 34 years | 1,021 (91.2%) | 131.0 |
| 35 to 50 years | 76 (6.8%) | 8.0 |
| Total | 1,119 (100.0%) | 56.0 |
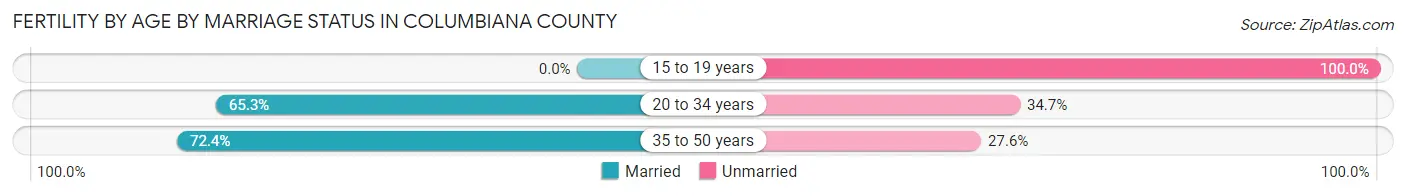
Fertility by Age by Marriage Status in Columbiana County
64.5% of women with births (1,119) in Columbiana County are married. The highest percentage of unmarried women with births falls into 15 to 19 years age bracket with 100.0% of them unmarried at the time of birth, while the lowest percentage of unmarried women with births belong to 35 to 50 years age bracket with 27.6% of them unmarried.
| Age Bracket | Married | Unmarried |
| 15 to 19 years | 0 (0.0%) | 22 (100.0%) |
| 20 to 34 years | 667 (65.3%) | 354 (34.7%) |
| 35 to 50 years | 55 (72.4%) | 21 (27.6%) |
| Total | 722 (64.5%) | 397 (35.5%) |
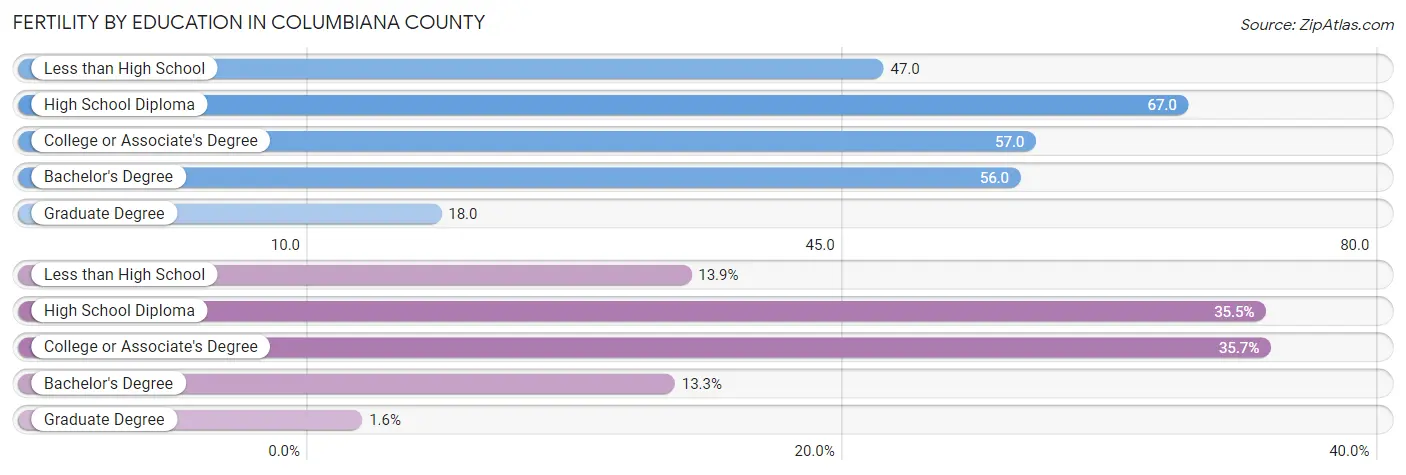
Fertility by Education in Columbiana County
Average fertility rate in Columbiana County is 56.0 births per 1,000 women. Women with the education attainment of high school diploma have the highest fertility rate of 67.0 births per 1,000 women, while women with the education attainment of graduate degree have the lowest fertility at 18.0 births per 1,000 women. Women with the education attainment of college or associate's degree represent 35.7% of all women with births.
| Educational Attainment | Women with Births | Births / 1,000 Women |
| Less than High School | 156 (13.9%) | 47.0 |
| High School Diploma | 397 (35.5%) | 67.0 |
| College or Associate's Degree | 399 (35.7%) | 57.0 |
| Bachelor's Degree | 149 (13.3%) | 56.0 |
| Graduate Degree | 18 (1.6%) | 18.0 |
| Total | 1,119 (100.0%) | 56.0 |
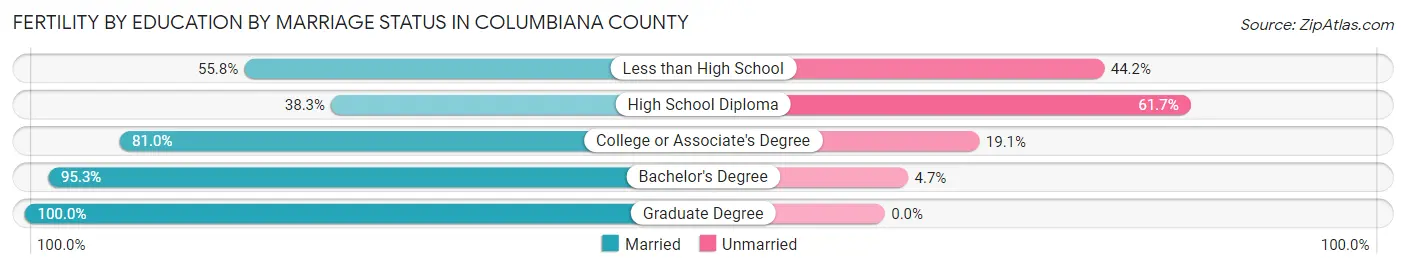
Fertility by Education by Marriage Status in Columbiana County
35.5% of women with births in Columbiana County are unmarried. Women with the educational attainment of graduate degree are most likely to be married with 100.0% of them married at childbirth, while women with the educational attainment of high school diploma are least likely to be married with 61.7% of them unmarried at childbirth.
| Educational Attainment | Married | Unmarried |
| Less than High School | 87 (55.8%) | 69 (44.2%) |
| High School Diploma | 152 (38.3%) | 245 (61.7%) |
| College or Associate's Degree | 323 (80.9%) | 76 (19.1%) |
| Bachelor's Degree | 142 (95.3%) | 7 (4.7%) |
| Graduate Degree | 18 (100.0%) | 0 (0.0%) |
| Total | 722 (64.5%) | 397 (35.5%) |
Income in Columbiana County
Income Overview in Columbiana County
Per Capita Income in Columbiana County is $30,553, while median incomes of families and households are $75,945 and $55,473 respectively.
| Characteristic | Number | Measure |
| Per Capita Income | 101,723 | $30,553 |
| Median Family Income | 25,801 | $75,945 |
| Mean Family Income | 25,801 | $87,509 |
| Median Household Income | 41,251 | $55,473 |
| Mean Household Income | 41,251 | $72,493 |
| Income Deficit | 25,801 | $10,620 |
| Wage / Income Gap (%) | 101,723 | 36.73% |
| Wage / Income Gap ($) | 101,723 | 63.27¢ per $1 |
| Gini / Inequality Index | 101,723 | 0.44 |
Earnings by Sex in Columbiana County
Average Earnings in Columbiana County are $33,774, $42,104 for men and $26,641 for women, a difference of 36.7%.
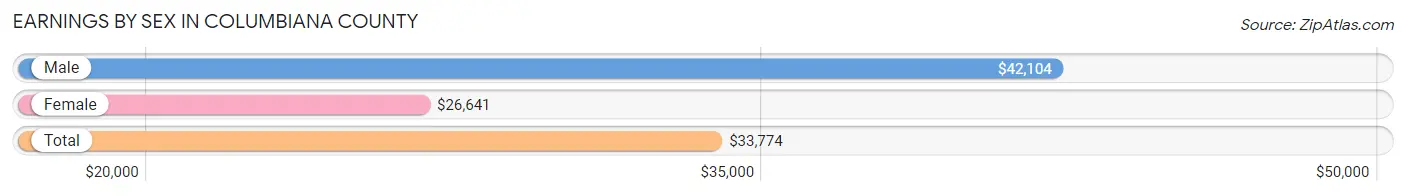
| Sex | Number | Average Earnings |
| Male | 28,687 (55.1%) | $42,104 |
| Female | 23,336 (44.9%) | $26,641 |
| Total | 52,023 (100.0%) | $33,774 |
Earnings by Sex by Income Bracket in Columbiana County
The most common earnings brackets in Columbiana County are $75,000 to $99,999 for men (3,071 | 10.7%) and $30,000 to $34,999 for women (2,005 | 8.6%).
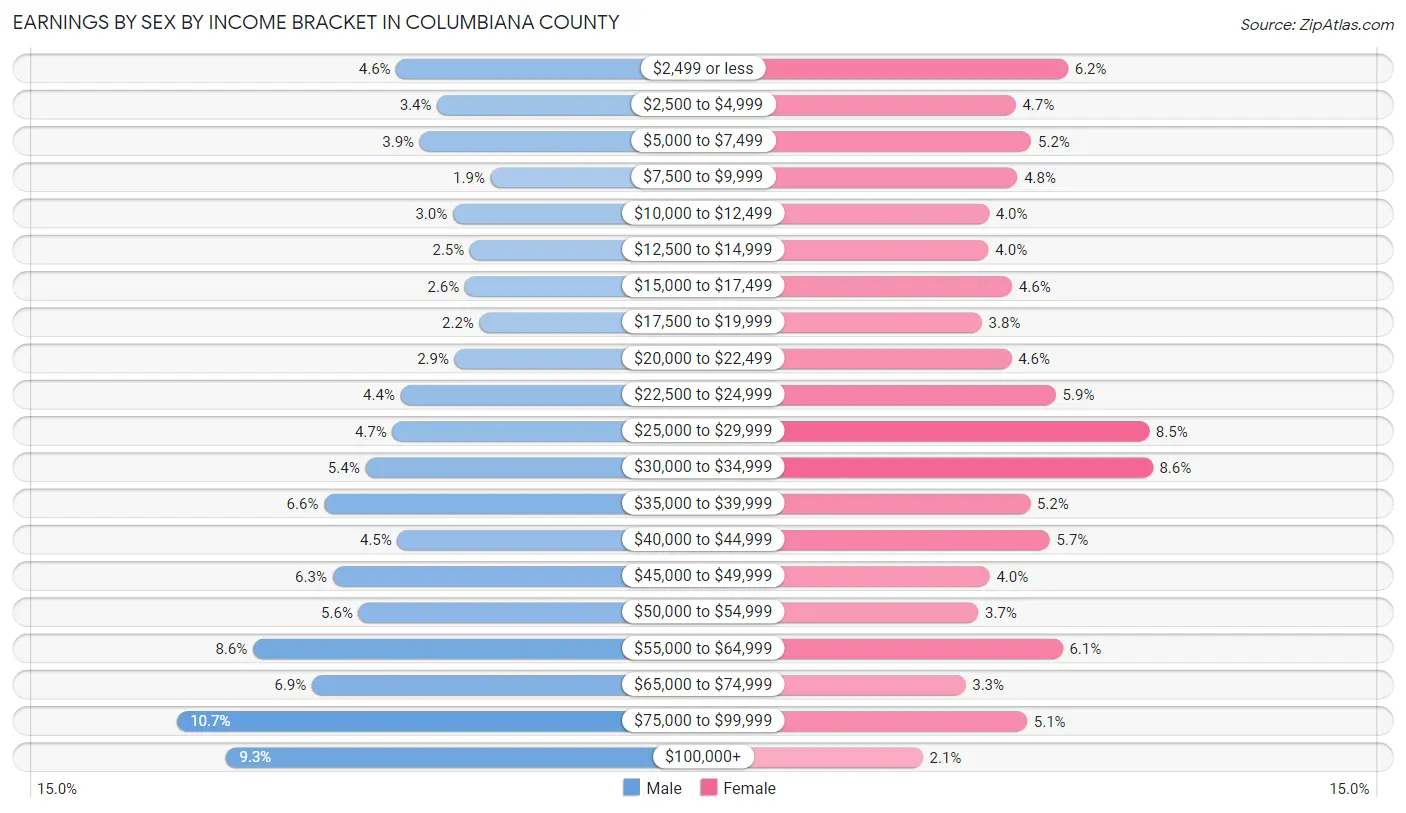
| Income | Male | Female |
| $2,499 or less | 1,305 (4.5%) | 1,448 (6.2%) |
| $2,500 to $4,999 | 975 (3.4%) | 1,107 (4.7%) |
| $5,000 to $7,499 | 1,117 (3.9%) | 1,208 (5.2%) |
| $7,500 to $9,999 | 545 (1.9%) | 1,117 (4.8%) |
| $10,000 to $12,499 | 849 (3.0%) | 930 (4.0%) |
| $12,500 to $14,999 | 712 (2.5%) | 929 (4.0%) |
| $15,000 to $17,499 | 751 (2.6%) | 1,082 (4.6%) |
| $17,500 to $19,999 | 633 (2.2%) | 884 (3.8%) |
| $20,000 to $22,499 | 835 (2.9%) | 1,079 (4.6%) |
| $22,500 to $24,999 | 1,270 (4.4%) | 1,370 (5.9%) |
| $25,000 to $29,999 | 1,336 (4.7%) | 1,981 (8.5%) |
| $30,000 to $34,999 | 1,556 (5.4%) | 2,005 (8.6%) |
| $35,000 to $39,999 | 1,888 (6.6%) | 1,201 (5.1%) |
| $40,000 to $44,999 | 1,296 (4.5%) | 1,330 (5.7%) |
| $45,000 to $49,999 | 1,818 (6.3%) | 936 (4.0%) |
| $50,000 to $54,999 | 1,608 (5.6%) | 862 (3.7%) |
| $55,000 to $64,999 | 2,461 (8.6%) | 1,414 (6.1%) |
| $65,000 to $74,999 | 1,985 (6.9%) | 776 (3.3%) |
| $75,000 to $99,999 | 3,071 (10.7%) | 1,181 (5.1%) |
| $100,000+ | 2,676 (9.3%) | 496 (2.1%) |
| Total | 28,687 (100.0%) | 23,336 (100.0%) |
Earnings by Sex by Educational Attainment in Columbiana County
Average earnings in Columbiana County are $46,622 for men and $29,704 for women, a difference of 36.3%. Men with an educational attainment of graduate degree enjoy the highest average annual earnings of $70,588, while those with less than high school education earn the least with $33,059. Women with an educational attainment of graduate degree earn the most with the average annual earnings of $69,343, while those with high school diploma education have the smallest earnings of $24,488.
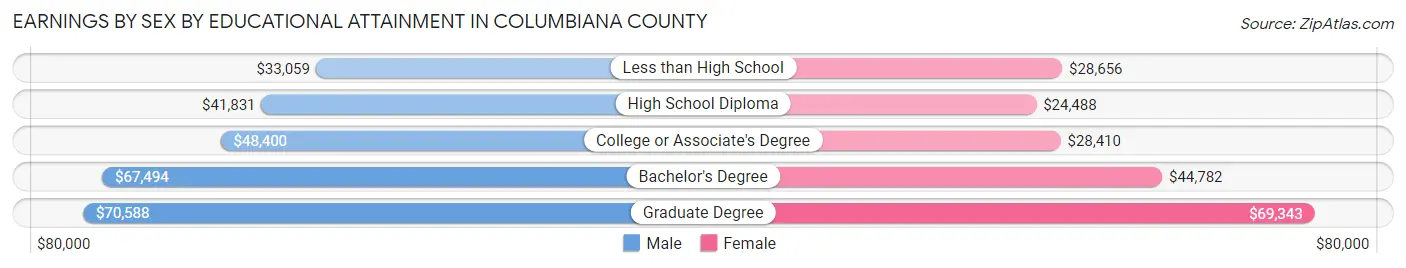
| Educational Attainment | Male Income | Female Income |
| Less than High School | $33,059 | $28,656 |
| High School Diploma | $41,831 | $24,488 |
| College or Associate's Degree | $48,400 | $28,410 |
| Bachelor's Degree | $67,494 | $44,782 |
| Graduate Degree | $70,588 | $69,343 |
| Total | $46,622 | $29,704 |
Family Income in Columbiana County
Family Income Brackets in Columbiana County
According to the Columbiana County family income data, there are 5,212 families falling into the $75,000 to $99,999 income range, which is the most common income bracket and makes up 20.2% of all families. Conversely, the $10,000 to $14,999 income bracket is the least frequent group with only 697 families (2.7%) belonging to this category.
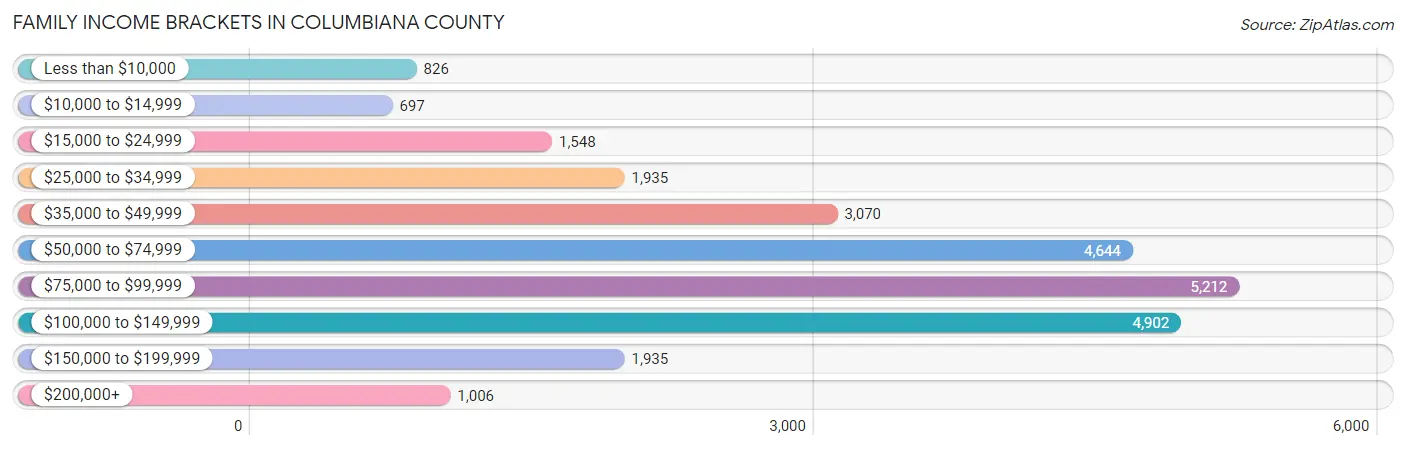
| Income Bracket | # Families | % Families |
| Less than $10,000 | 826 | 3.2% |
| $10,000 to $14,999 | 697 | 2.7% |
| $15,000 to $24,999 | 1,548 | 6.0% |
| $25,000 to $34,999 | 1,935 | 7.5% |
| $35,000 to $49,999 | 3,070 | 11.9% |
| $50,000 to $74,999 | 4,644 | 18.0% |
| $75,000 to $99,999 | 5,212 | 20.2% |
| $100,000 to $149,999 | 4,902 | 19.0% |
| $150,000 to $199,999 | 1,935 | 7.5% |
| $200,000+ | 1,006 | 3.9% |
Family Income by Famaliy Size in Columbiana County
7+ person families (222 | 0.9%) account for the highest median family income in Columbiana County with $121,154 per family, while 2-person families (13,664 | 53.0%) have the highest median income of $33,471 per family member.
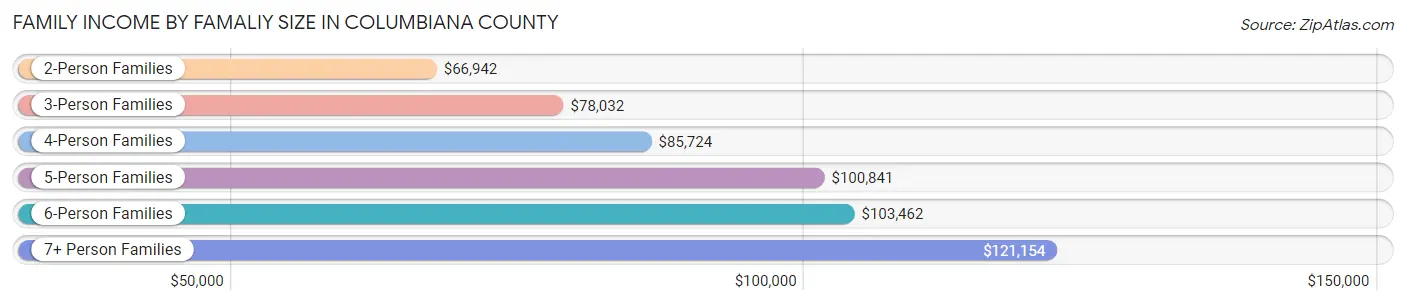
| Income Bracket | # Families | Median Income |
| 2-Person Families | 13,664 (53.0%) | $66,942 |
| 3-Person Families | 5,241 (20.3%) | $78,032 |
| 4-Person Families | 4,589 (17.8%) | $85,724 |
| 5-Person Families | 1,583 (6.1%) | $100,841 |
| 6-Person Families | 502 (1.9%) | $103,462 |
| 7+ Person Families | 222 (0.9%) | $121,154 |
| Total | 25,801 (100.0%) | $75,945 |
Family Income by Number of Earners in Columbiana County
The median family income in Columbiana County is $75,945, with families comprising 3+ earners (2,747) having the highest median family income of $118,172, while families with no earners (4,802) have the lowest median family income of $38,716, accounting for 10.6% and 18.6% of families, respectively.
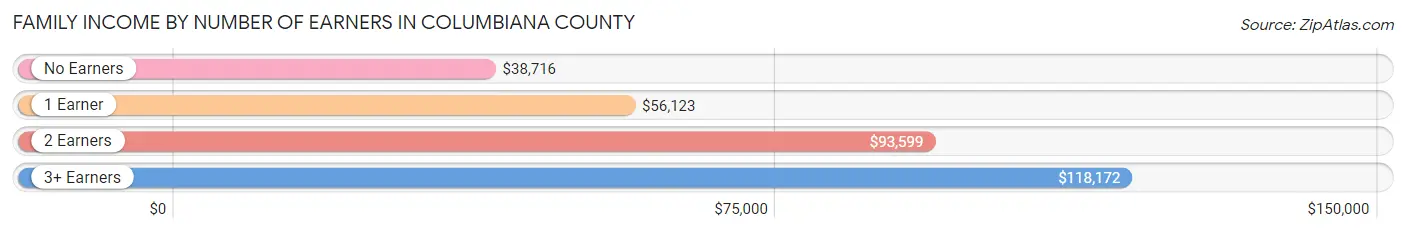
| Number of Earners | # Families | Median Income |
| No Earners | 4,802 (18.6%) | $38,716 |
| 1 Earner | 7,833 (30.4%) | $56,123 |
| 2 Earners | 10,419 (40.4%) | $93,599 |
| 3+ Earners | 2,747 (10.6%) | $118,172 |
| Total | 25,801 (100.0%) | $75,945 |
Household Income in Columbiana County
Household Income Brackets in Columbiana County
With 7,136 households falling in the category, the $50,000 to $74,999 income range is the most frequent in Columbiana County, accounting for 17.3% of all households. In contrast, only 1,196 households (2.9%) fall into the $200,000+ income bracket, making it the least populous group.
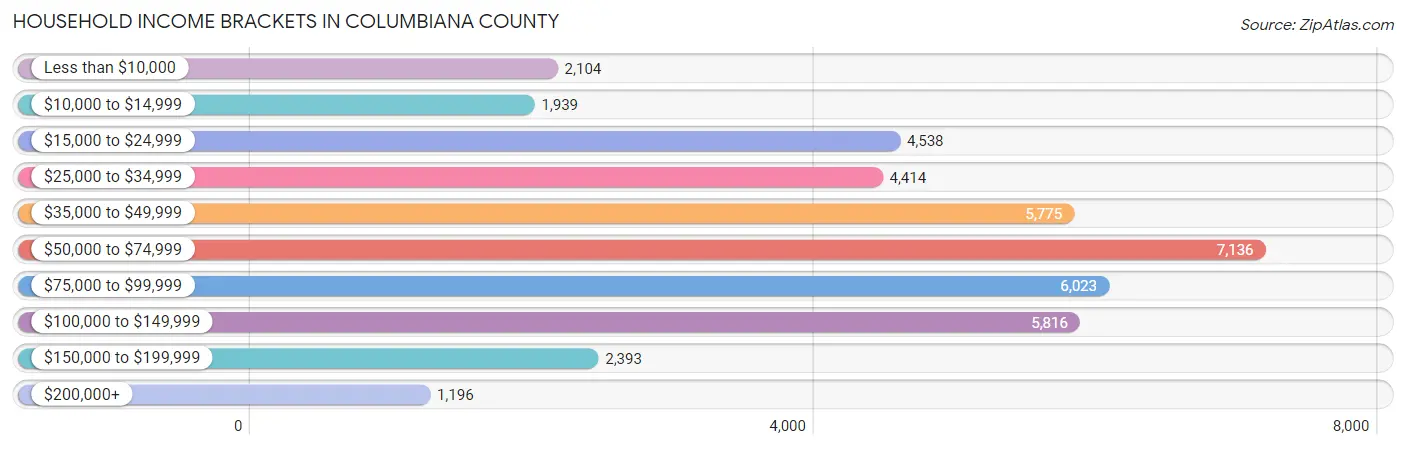
| Income Bracket | # Households | % Households |
| Less than $10,000 | 2,104 | 5.1% |
| $10,000 to $14,999 | 1,939 | 4.7% |
| $15,000 to $24,999 | 4,538 | 11.0% |
| $25,000 to $34,999 | 4,414 | 10.7% |
| $35,000 to $49,999 | 5,775 | 14.0% |
| $50,000 to $74,999 | 7,136 | 17.3% |
| $75,000 to $99,999 | 6,023 | 14.6% |
| $100,000 to $149,999 | 5,816 | 14.1% |
| $150,000 to $199,999 | 2,393 | 5.8% |
| $200,000+ | 1,196 | 2.9% |
Household Income by Householder Age in Columbiana County
The median household income in Columbiana County is $55,473, with the highest median household income of $67,018 found in the 45 to 64 years age bracket for the primary householder. A total of 16,072 households (39.0%) fall into this category. Meanwhile, the 15 to 24 years age bracket for the primary householder has the lowest median household income of $36,005, with 1,003 households (2.4%) in this group.
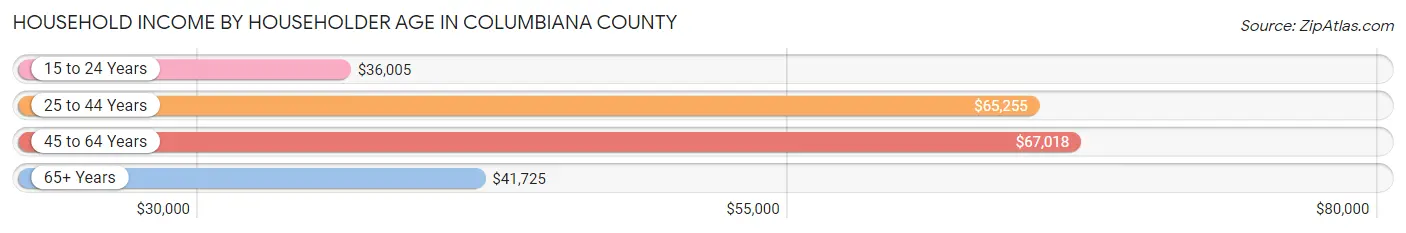
| Income Bracket | # Households | Median Income |
| 15 to 24 Years | 1,003 (2.4%) | $36,005 |
| 25 to 44 Years | 10,781 (26.1%) | $65,255 |
| 45 to 64 Years | 16,072 (39.0%) | $67,018 |
| 65+ Years | 13,395 (32.5%) | $41,725 |
| Total | 41,251 (100.0%) | $55,473 |
Poverty in Columbiana County
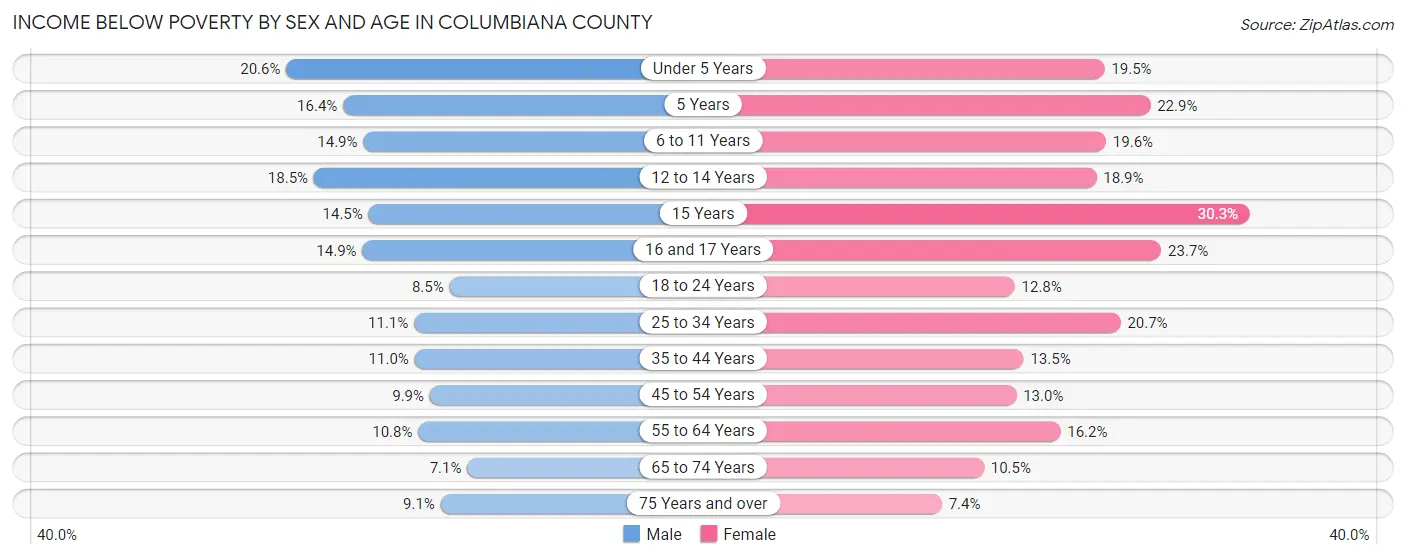
Income Below Poverty by Sex and Age in Columbiana County
With 11.2% poverty level for males and 15.1% for females among the residents of Columbiana County, under 5 year old males and 15 year old females are the most vulnerable to poverty, with 494 males (20.6%) and 153 females (30.3%) in their respective age groups living below the poverty level.
| Age Bracket | Male | Female |
| Under 5 Years | 494 (20.6%) | 491 (19.5%) |
| 5 Years | 78 (16.4%) | 158 (22.9%) |
| 6 to 11 Years | 540 (14.8%) | 596 (19.6%) |
| 12 to 14 Years | 286 (18.5%) | 402 (18.9%) |
| 15 Years | 71 (14.5%) | 153 (30.3%) |
| 16 and 17 Years | 203 (14.9%) | 331 (23.7%) |
| 18 to 24 Years | 336 (8.5%) | 457 (12.8%) |
| 25 to 34 Years | 620 (11.1%) | 1,097 (20.7%) |
| 35 to 44 Years | 632 (11.0%) | 734 (13.5%) |
| 45 to 54 Years | 668 (9.9%) | 795 (13.0%) |
| 55 to 64 Years | 815 (10.8%) | 1,260 (16.2%) |
| 65 to 74 Years | 430 (7.1%) | 652 (10.5%) |
| 75 Years and over | 307 (9.1%) | 342 (7.4%) |
| Total | 5,480 (11.2%) | 7,468 (15.1%) |
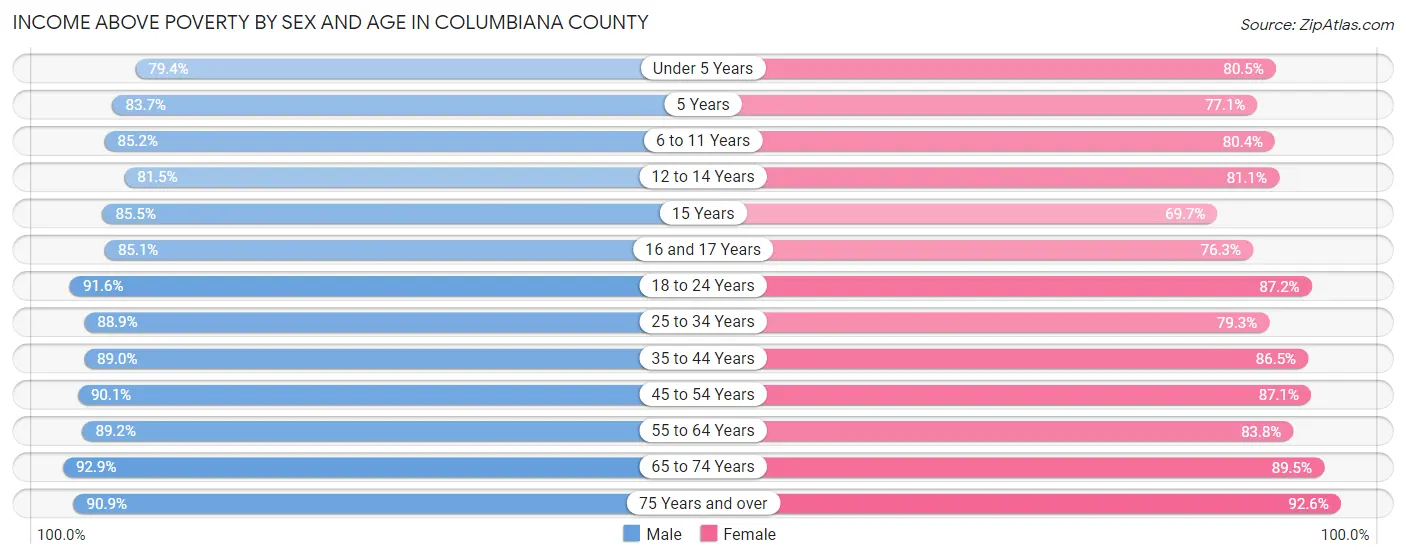
Income Above Poverty by Sex and Age in Columbiana County
According to the poverty statistics in Columbiana County, males aged 65 to 74 years and females aged 75 years and over are the age groups that are most secure financially, with 92.9% of males and 92.6% of females in these age groups living above the poverty line.
| Age Bracket | Male | Female |
| Under 5 Years | 1,908 (79.4%) | 2,027 (80.5%) |
| 5 Years | 399 (83.7%) | 532 (77.1%) |
| 6 to 11 Years | 3,096 (85.2%) | 2,444 (80.4%) |
| 12 to 14 Years | 1,258 (81.5%) | 1,725 (81.1%) |
| 15 Years | 420 (85.5%) | 352 (69.7%) |
| 16 and 17 Years | 1,158 (85.1%) | 1,065 (76.3%) |
| 18 to 24 Years | 3,640 (91.5%) | 3,104 (87.2%) |
| 25 to 34 Years | 4,976 (88.9%) | 4,204 (79.3%) |
| 35 to 44 Years | 5,094 (89.0%) | 4,706 (86.5%) |
| 45 to 54 Years | 6,076 (90.1%) | 5,346 (87.1%) |
| 55 to 64 Years | 6,755 (89.2%) | 6,508 (83.8%) |
| 65 to 74 Years | 5,604 (92.9%) | 5,533 (89.5%) |
| 75 Years and over | 3,064 (90.9%) | 4,270 (92.6%) |
| Total | 43,448 (88.8%) | 41,816 (84.9%) |
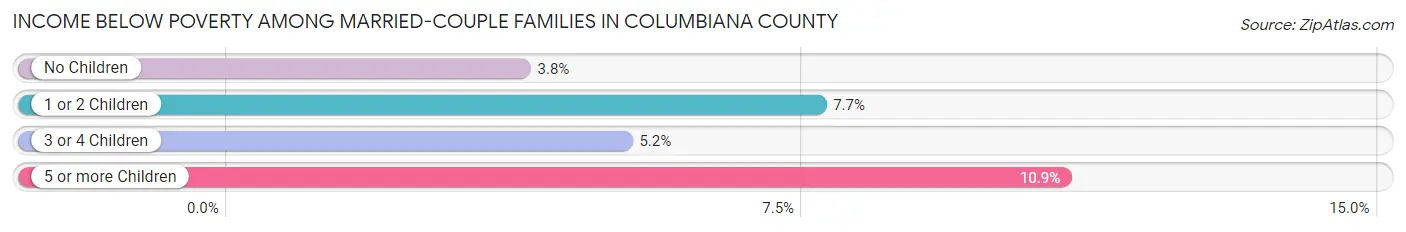
Income Below Poverty Among Married-Couple Families in Columbiana County
The poverty statistics for married-couple families in Columbiana County show that 5.1% or 965 of the total 19,073 families live below the poverty line. Families with 5 or more children have the highest poverty rate of 10.9%, comprising of 11 families. On the other hand, families with no children have the lowest poverty rate of 3.8%, which includes 471 families.
| Children | Above Poverty | Below Poverty |
| No Children | 11,875 (96.2%) | 471 (3.8%) |
| 1 or 2 Children | 5,167 (92.3%) | 430 (7.7%) |
| 3 or 4 Children | 976 (94.9%) | 53 (5.1%) |
| 5 or more Children | 90 (89.1%) | 11 (10.9%) |
| Total | 18,108 (94.9%) | 965 (5.1%) |
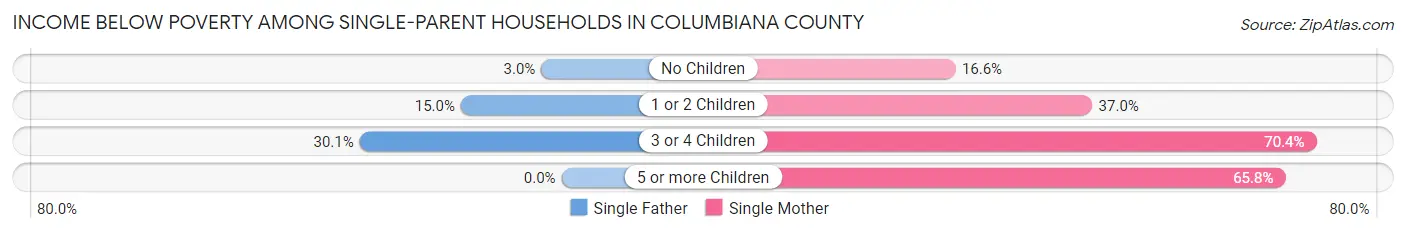
Income Below Poverty Among Single-Parent Households in Columbiana County
According to the poverty data in Columbiana County, 11.0% or 285 single-father households and 32.3% or 1,338 single-mother households are living below the poverty line. Among single-father households, those with 3 or 4 children have the highest poverty rate, with 34 households (30.1%) experiencing poverty. Likewise, among single-mother households, those with 3 or 4 children have the highest poverty rate, with 312 households (70.4%) falling below the poverty line.
| Children | Single Father | Single Mother |
| No Children | 30 (3.0%) | 286 (16.6%) |
| 1 or 2 Children | 221 (15.0%) | 715 (36.9%) |
| 3 or 4 Children | 34 (30.1%) | 312 (70.4%) |
| 5 or more Children | 0 (0.0%) | 25 (65.8%) |
| Total | 285 (11.0%) | 1,338 (32.3%) |
Income Below Poverty Among Married-Couple vs Single-Parent Households in Columbiana County
The poverty data for Columbiana County shows that 965 of the married-couple family households (5.1%) and 1,623 of the single-parent households (24.1%) are living below the poverty level. Within the married-couple family households, those with 5 or more children have the highest poverty rate, with 11 households (10.9%) falling below the poverty line. Among the single-parent households, those with 3 or 4 children have the highest poverty rate, with 346 household (62.2%) living below poverty.
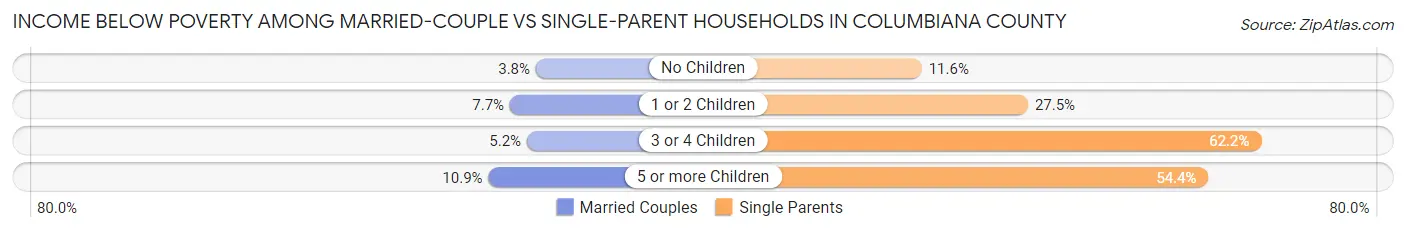
| Children | Married-Couple Families | Single-Parent Households |
| No Children | 471 (3.8%) | 316 (11.6%) |
| 1 or 2 Children | 430 (7.7%) | 936 (27.5%) |
| 3 or 4 Children | 53 (5.1%) | 346 (62.2%) |
| 5 or more Children | 11 (10.9%) | 25 (54.3%) |
| Total | 965 (5.1%) | 1,623 (24.1%) |
Employment Characteristics in Columbiana County
Employment by Class of Employer in Columbiana County
Among the 45,689 employed individuals in Columbiana County, private company employees (33,582 | 73.5%), not-for-profit organizations (3,718 | 8.1%), and local government employees (2,859 | 6.3%) make up the most common classes of employment.
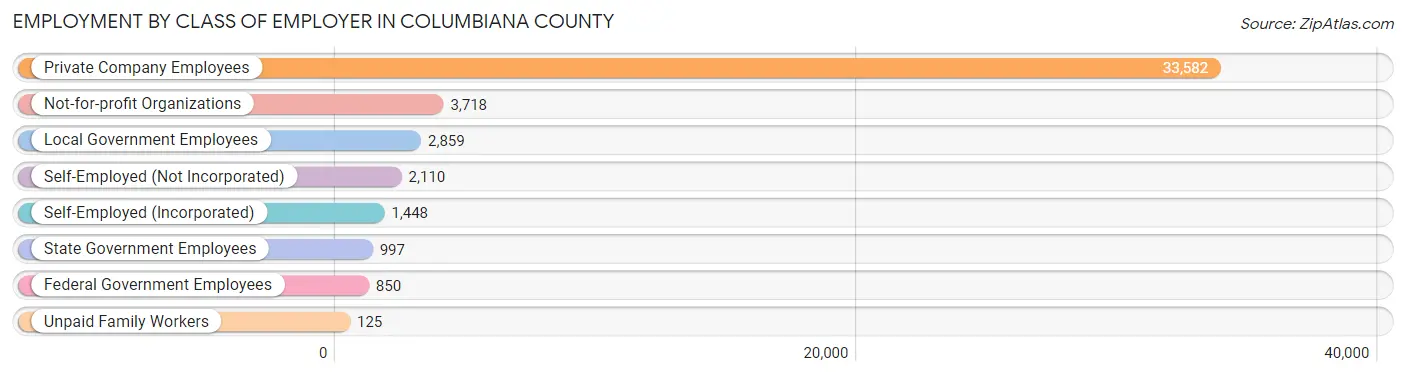
| Employer Class | # Employees | % Employees |
| Private Company Employees | 33,582 | 73.5% |
| Self-Employed (Incorporated) | 1,448 | 3.2% |
| Self-Employed (Not Incorporated) | 2,110 | 4.6% |
| Not-for-profit Organizations | 3,718 | 8.1% |
| Local Government Employees | 2,859 | 6.3% |
| State Government Employees | 997 | 2.2% |
| Federal Government Employees | 850 | 1.9% |
| Unpaid Family Workers | 125 | 0.3% |
| Total | 45,689 | 100.0% |
Employment Status by Age in Columbiana County
According to the labor force statistics for Columbiana County, out of the total population over 16 years of age (83,979), 58.1% or 48,792 individuals are in the labor force, with 4.9% or 2,391 of them unemployed. The age group with the highest labor force participation rate is 30 to 34 years, with 82.5% or 4,683 individuals in the labor force. Within the labor force, the 16 to 19 years age range has the highest percentage of unemployed individuals, with 9.5% or 230 of them being unemployed.
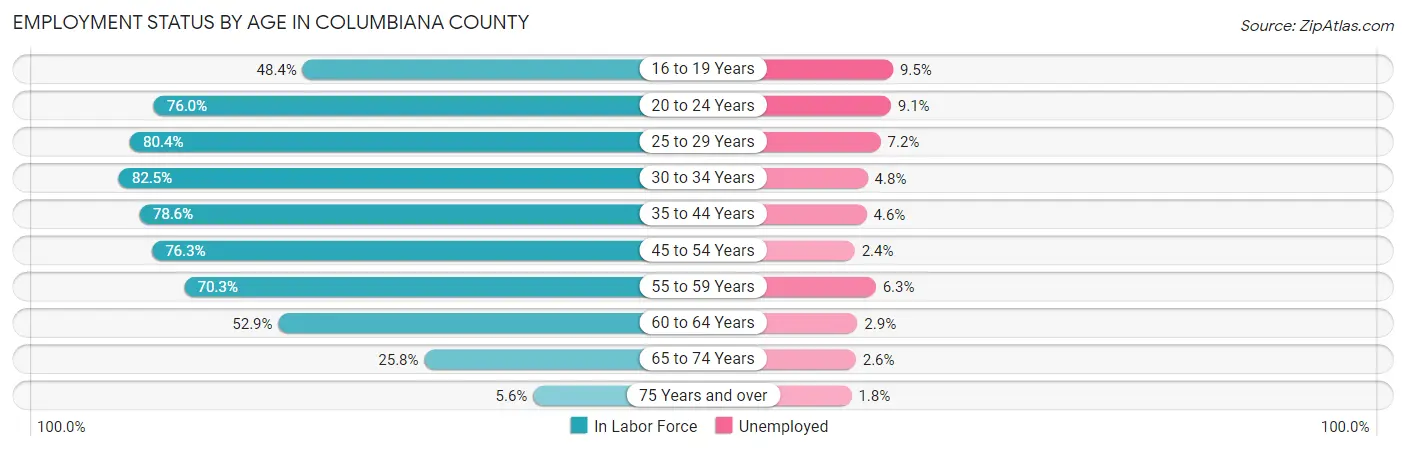
| Age Bracket | In Labor Force | Unemployed |
| 16 to 19 Years | 2,416 (48.4%) | 230 (9.5%) |
| 20 to 24 Years | 4,103 (76.0%) | 373 (9.1%) |
| 25 to 29 Years | 4,542 (80.4%) | 327 (7.2%) |
| 30 to 34 Years | 4,683 (82.5%) | 225 (4.8%) |
| 35 to 44 Years | 9,334 (78.6%) | 429 (4.6%) |
| 45 to 54 Years | 10,248 (76.3%) | 246 (2.4%) |
| 55 to 59 Years | 5,630 (70.3%) | 355 (6.3%) |
| 60 to 64 Years | 4,062 (52.9%) | 118 (2.9%) |
| 65 to 74 Years | 3,258 (25.8%) | 85 (2.6%) |
| 75 Years and over | 484 (5.6%) | 9 (1.8%) |
| Total | 48,792 (58.1%) | 2,391 (4.9%) |
Employment Status by Educational Attainment in Columbiana County
According to labor force statistics for Columbiana County, 73.6% of individuals (38,506) out of the total population between 25 and 64 years of age (52,318) are in the labor force, with 4.4% or 1,694 of them being unemployed. The group with the highest labor force participation rate are those with the educational attainment of bachelor's degree or higher, with 84.0% or 7,394 individuals in the labor force. Within the labor force, individuals with college / associate degree education have the highest percentage of unemployment, with 6.9% or 878 of them being unemployed.
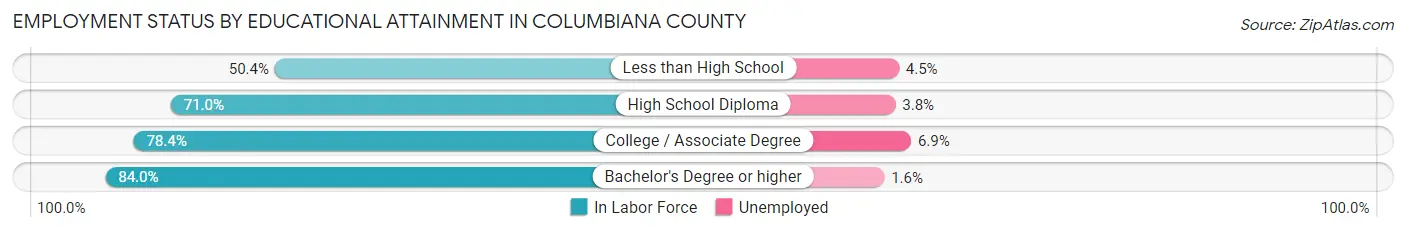
| Educational Attainment | In Labor Force | Unemployed |
| Less than High School | 2,422 (50.4%) | 216 (4.5%) |
| High School Diploma | 15,959 (71.0%) | 854 (3.8%) |
| College / Associate Degree | 12,726 (78.4%) | 1,120 (6.9%) |
| Bachelor's Degree or higher | 7,394 (84.0%) | 141 (1.6%) |
| Total | 38,506 (73.6%) | 2,302 (4.4%) |
Employment Occupations by Sex in Columbiana County
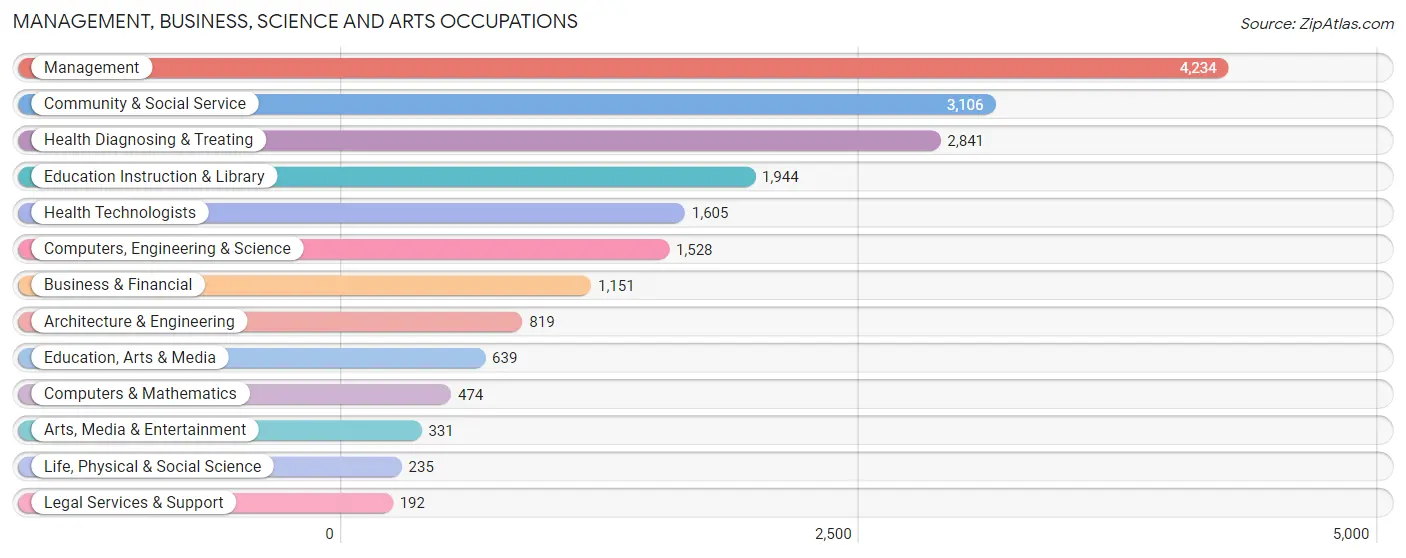
Management, Business, Science and Arts Occupations
The most common Management, Business, Science and Arts occupations in Columbiana County are Management (4,234 | 9.1%), Community & Social Service (3,106 | 6.7%), Health Diagnosing & Treating (2,841 | 6.1%), Education Instruction & Library (1,944 | 4.2%), and Health Technologists (1,605 | 3.5%).
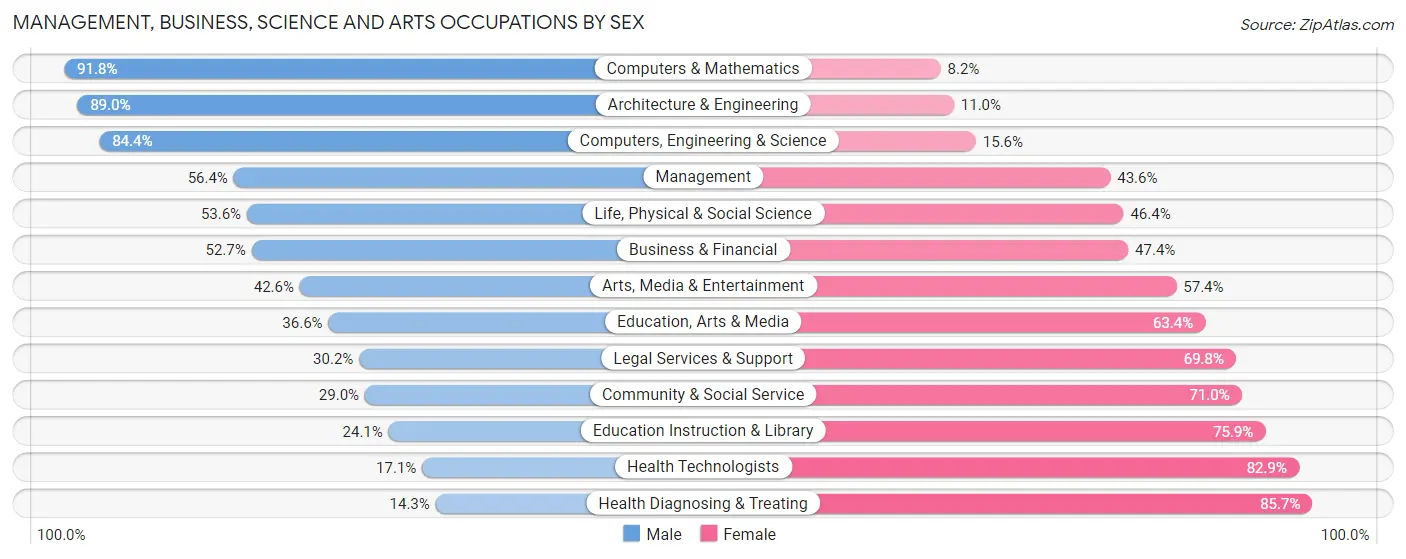
Management, Business, Science and Arts Occupations by Sex
Within the Management, Business, Science and Arts occupations in Columbiana County, the most male-oriented occupations are Computers & Mathematics (91.8%), Architecture & Engineering (89.0%), and Computers, Engineering & Science (84.4%), while the most female-oriented occupations are Health Diagnosing & Treating (85.7%), Health Technologists (82.9%), and Education Instruction & Library (75.9%).
| Occupation | Male | Female |
| Management | 2,387 (56.4%) | 1,847 (43.6%) |
| Business & Financial | 606 (52.6%) | 545 (47.3%) |
| Computers, Engineering & Science | 1,290 (84.4%) | 238 (15.6%) |
| Computers & Mathematics | 435 (91.8%) | 39 (8.2%) |
| Architecture & Engineering | 729 (89.0%) | 90 (11.0%) |
| Life, Physical & Social Science | 126 (53.6%) | 109 (46.4%) |
| Community & Social Service | 901 (29.0%) | 2,205 (71.0%) |
| Education, Arts & Media | 234 (36.6%) | 405 (63.4%) |
| Legal Services & Support | 58 (30.2%) | 134 (69.8%) |
| Education Instruction & Library | 468 (24.1%) | 1,476 (75.9%) |
| Arts, Media & Entertainment | 141 (42.6%) | 190 (57.4%) |
| Health Diagnosing & Treating | 405 (14.3%) | 2,436 (85.7%) |
| Health Technologists | 274 (17.1%) | 1,331 (82.9%) |
| Total (Category) | 5,589 (43.5%) | 7,271 (56.5%) |
| Total (Overall) | 24,986 (53.9%) | 21,365 (46.1%) |
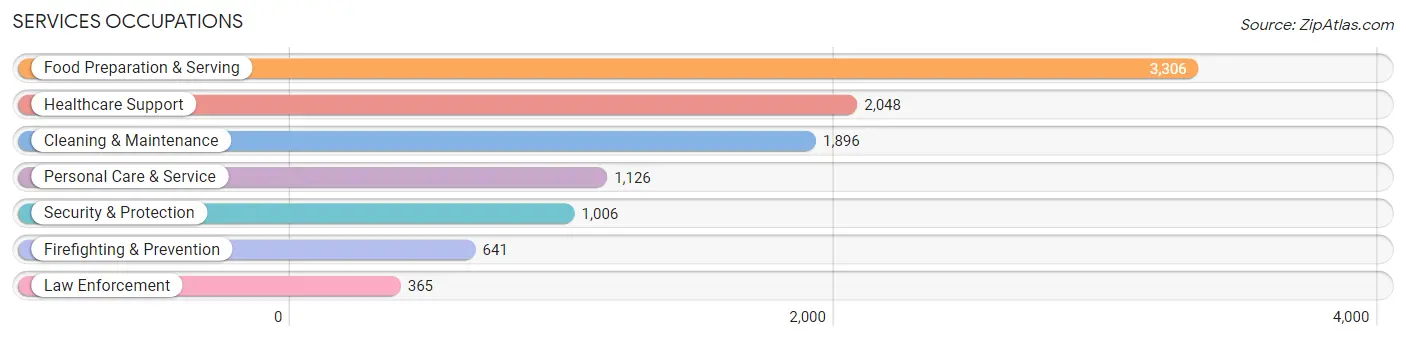
Services Occupations
The most common Services occupations in Columbiana County are Food Preparation & Serving (3,306 | 7.1%), Healthcare Support (2,048 | 4.4%), Cleaning & Maintenance (1,896 | 4.1%), Personal Care & Service (1,126 | 2.4%), and Security & Protection (1,006 | 2.2%).
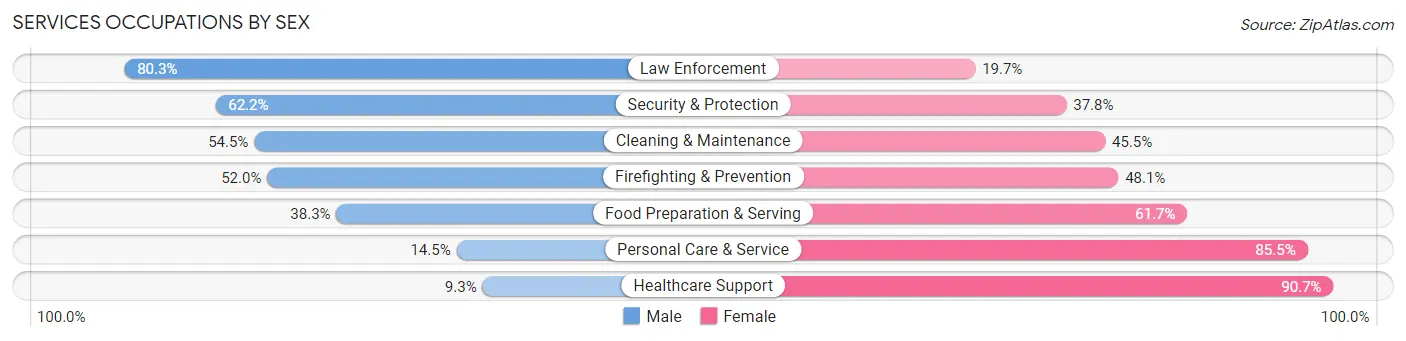
Services Occupations by Sex
Within the Services occupations in Columbiana County, the most male-oriented occupations are Law Enforcement (80.3%), Security & Protection (62.2%), and Cleaning & Maintenance (54.5%), while the most female-oriented occupations are Healthcare Support (90.7%), Personal Care & Service (85.5%), and Food Preparation & Serving (61.7%).
| Occupation | Male | Female |
| Healthcare Support | 191 (9.3%) | 1,857 (90.7%) |
| Security & Protection | 626 (62.2%) | 380 (37.8%) |
| Firefighting & Prevention | 333 (51.9%) | 308 (48.0%) |
| Law Enforcement | 293 (80.3%) | 72 (19.7%) |
| Food Preparation & Serving | 1,265 (38.3%) | 2,041 (61.7%) |
| Cleaning & Maintenance | 1,034 (54.5%) | 862 (45.5%) |
| Personal Care & Service | 163 (14.5%) | 963 (85.5%) |
| Total (Category) | 3,279 (34.9%) | 6,103 (65.0%) |
| Total (Overall) | 24,986 (53.9%) | 21,365 (46.1%) |
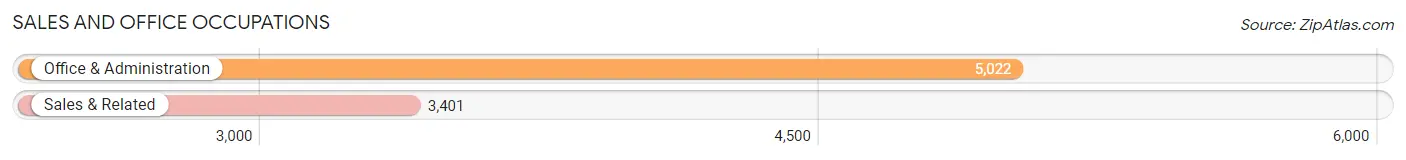
Sales and Office Occupations
The most common Sales and Office occupations in Columbiana County are Office & Administration (5,022 | 10.8%), and Sales & Related (3,401 | 7.3%).
Sales and Office Occupations by Sex
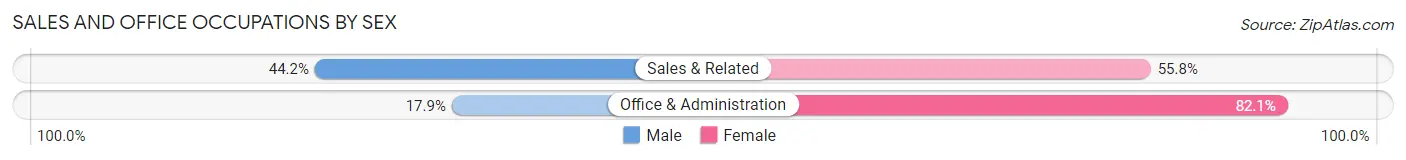
| Occupation | Male | Female |
| Sales & Related | 1,503 (44.2%) | 1,898 (55.8%) |
| Office & Administration | 897 (17.9%) | 4,125 (82.1%) |
| Total (Category) | 2,400 (28.5%) | 6,023 (71.5%) |
| Total (Overall) | 24,986 (53.9%) | 21,365 (46.1%) |
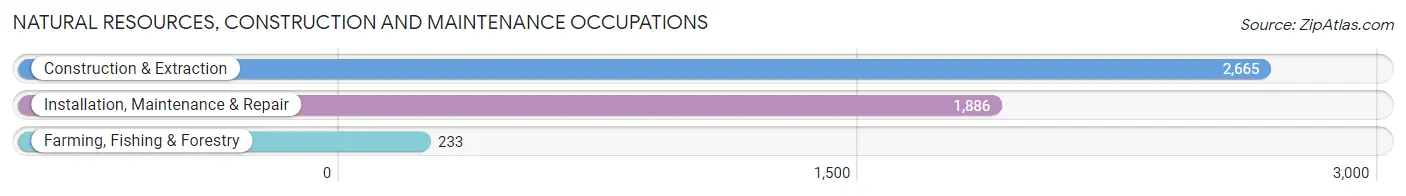
Natural Resources, Construction and Maintenance Occupations
The most common Natural Resources, Construction and Maintenance occupations in Columbiana County are Construction & Extraction (2,665 | 5.8%), Installation, Maintenance & Repair (1,886 | 4.1%), and Farming, Fishing & Forestry (233 | 0.5%).
Natural Resources, Construction and Maintenance Occupations by Sex
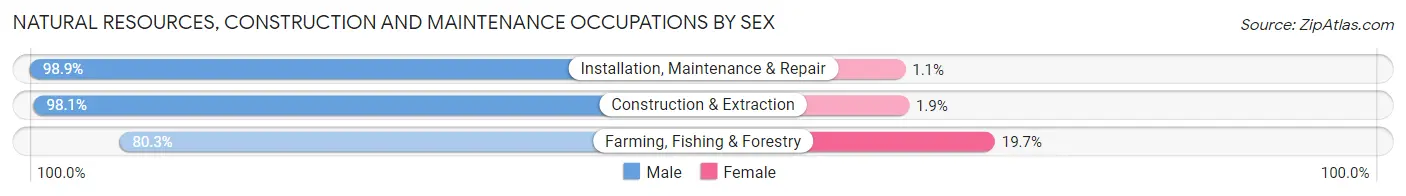
| Occupation | Male | Female |
| Farming, Fishing & Forestry | 187 (80.3%) | 46 (19.7%) |
| Construction & Extraction | 2,615 (98.1%) | 50 (1.9%) |
| Installation, Maintenance & Repair | 1,865 (98.9%) | 21 (1.1%) |
| Total (Category) | 4,667 (97.6%) | 117 (2.5%) |
| Total (Overall) | 24,986 (53.9%) | 21,365 (46.1%) |
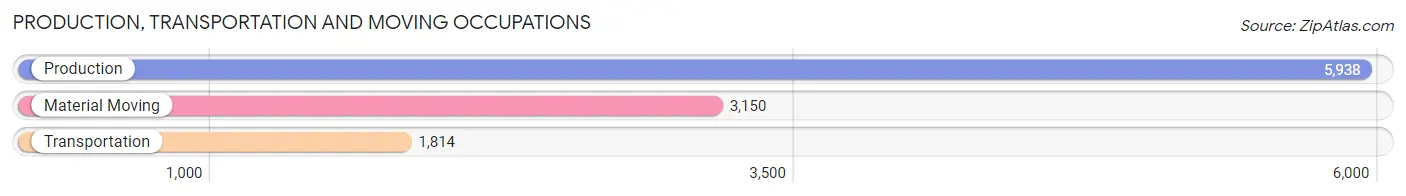
Production, Transportation and Moving Occupations
The most common Production, Transportation and Moving occupations in Columbiana County are Production (5,938 | 12.8%), Material Moving (3,150 | 6.8%), and Transportation (1,814 | 3.9%).
Production, Transportation and Moving Occupations by Sex
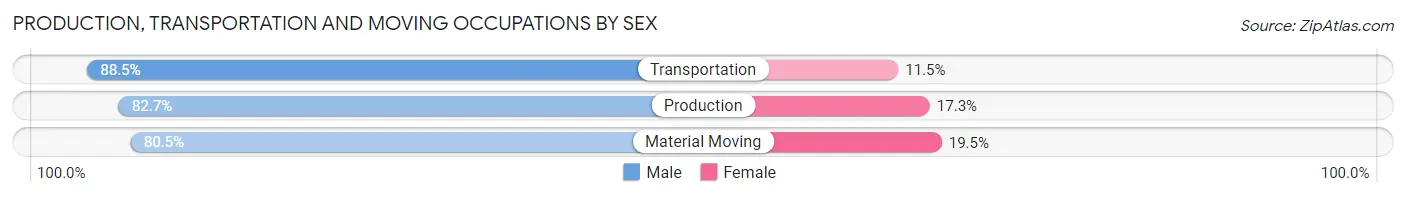
| Occupation | Male | Female |
| Production | 4,910 (82.7%) | 1,028 (17.3%) |
| Transportation | 1,605 (88.5%) | 209 (11.5%) |
| Material Moving | 2,536 (80.5%) | 614 (19.5%) |
| Total (Category) | 9,051 (83.0%) | 1,851 (17.0%) |
| Total (Overall) | 24,986 (53.9%) | 21,365 (46.1%) |
Employment Industries by Sex in Columbiana County
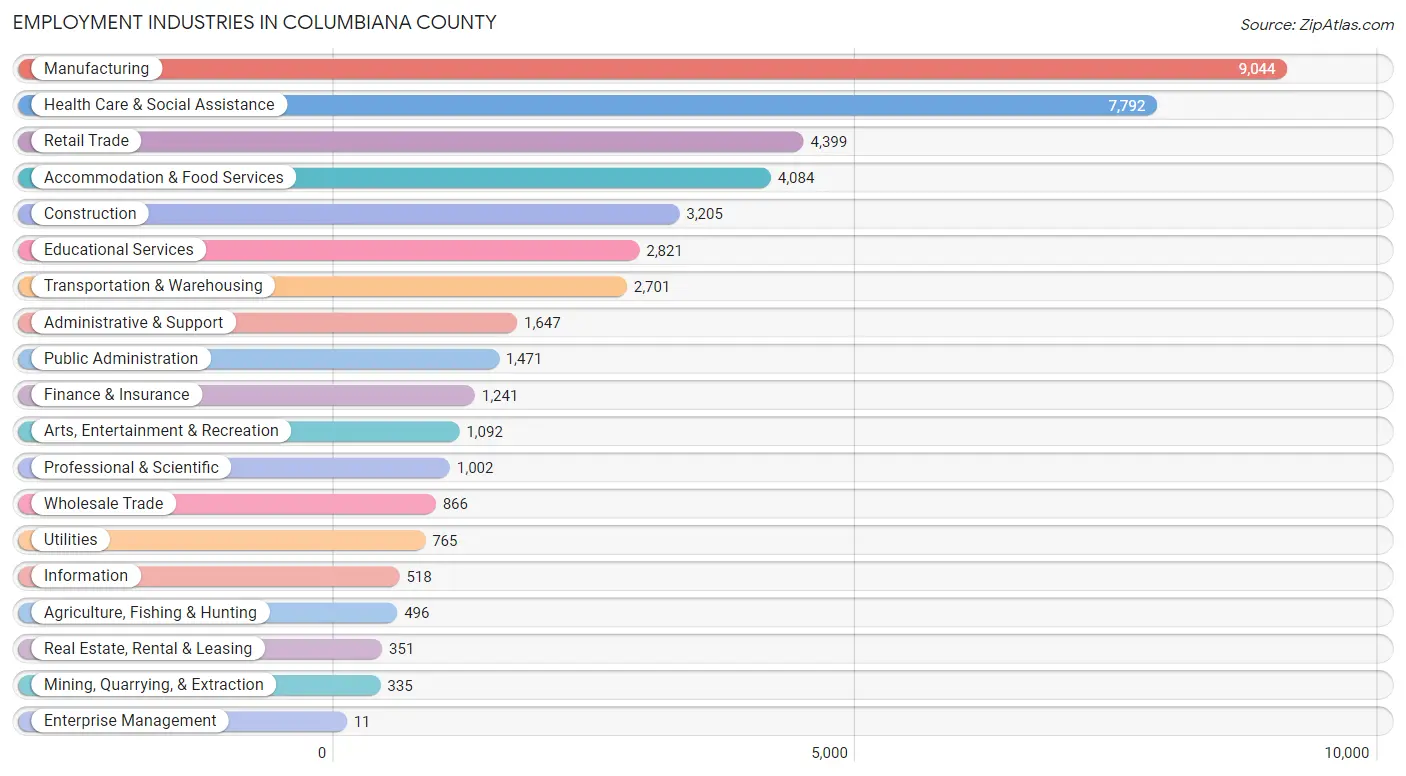
Employment Industries in Columbiana County
The major employment industries in Columbiana County include Manufacturing (9,044 | 19.5%), Health Care & Social Assistance (7,792 | 16.8%), Retail Trade (4,399 | 9.5%), Accommodation & Food Services (4,084 | 8.8%), and Construction (3,205 | 6.9%).
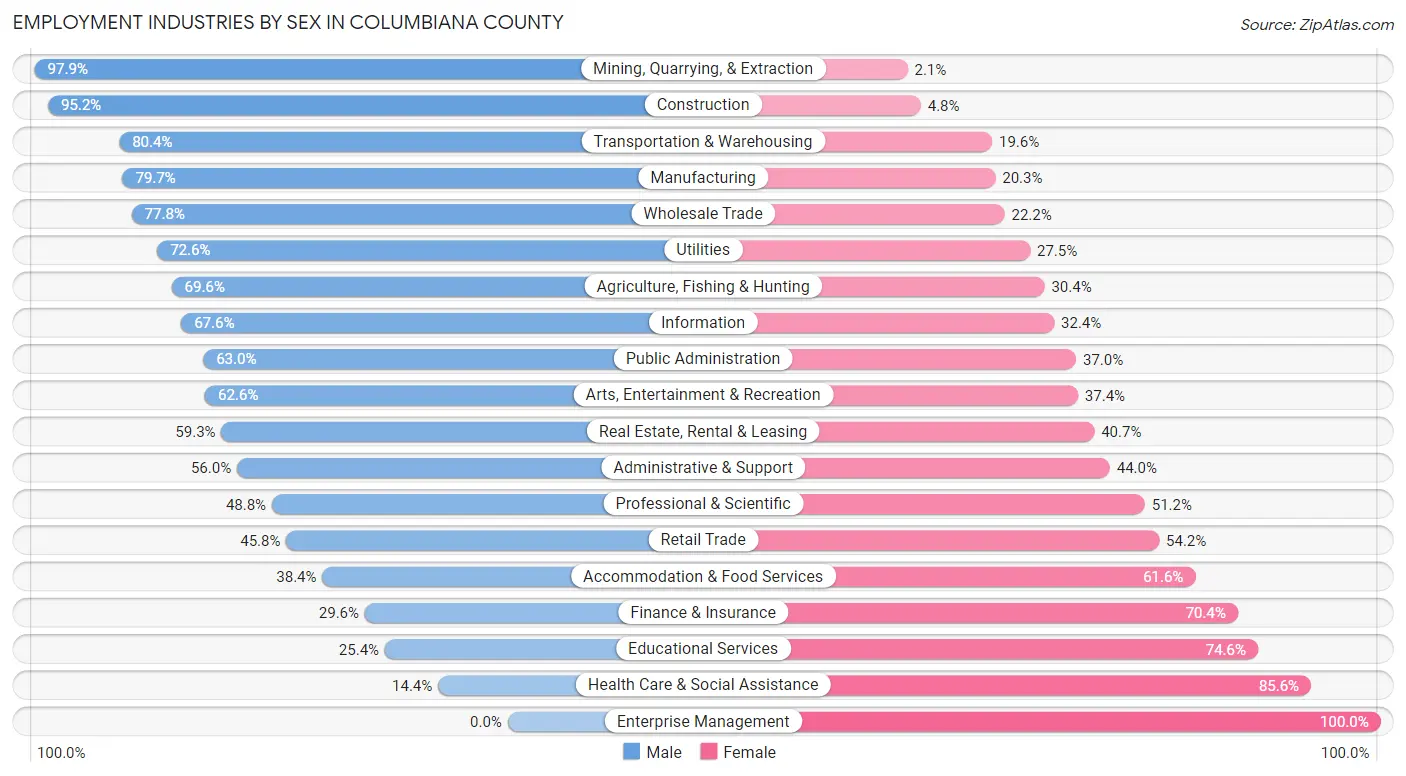
Employment Industries by Sex in Columbiana County
The Columbiana County industries that see more men than women are Mining, Quarrying, & Extraction (97.9%), Construction (95.2%), and Transportation & Warehousing (80.4%), whereas the industries that tend to have a higher number of women are Enterprise Management (100.0%), Health Care & Social Assistance (85.6%), and Educational Services (74.6%).
| Industry | Male | Female |
| Agriculture, Fishing & Hunting | 345 (69.6%) | 151 (30.4%) |
| Mining, Quarrying, & Extraction | 328 (97.9%) | 7 (2.1%) |
| Construction | 3,050 (95.2%) | 155 (4.8%) |
| Manufacturing | 7,212 (79.7%) | 1,832 (20.3%) |
| Wholesale Trade | 674 (77.8%) | 192 (22.2%) |
| Retail Trade | 2,016 (45.8%) | 2,383 (54.2%) |
| Transportation & Warehousing | 2,172 (80.4%) | 529 (19.6%) |
| Utilities | 555 (72.6%) | 210 (27.5%) |
| Information | 350 (67.6%) | 168 (32.4%) |
| Finance & Insurance | 367 (29.6%) | 874 (70.4%) |
| Real Estate, Rental & Leasing | 208 (59.3%) | 143 (40.7%) |
| Professional & Scientific | 489 (48.8%) | 513 (51.2%) |
| Enterprise Management | 0 (0.0%) | 11 (100.0%) |
| Administrative & Support | 923 (56.0%) | 724 (44.0%) |
| Educational Services | 717 (25.4%) | 2,104 (74.6%) |
| Health Care & Social Assistance | 1,123 (14.4%) | 6,669 (85.6%) |
| Arts, Entertainment & Recreation | 684 (62.6%) | 408 (37.4%) |
| Accommodation & Food Services | 1,567 (38.4%) | 2,517 (61.6%) |
| Public Administration | 927 (63.0%) | 544 (37.0%) |
| Total | 24,986 (53.9%) | 21,365 (46.1%) |
Education in Columbiana County
School Enrollment in Columbiana County
The most common levels of schooling among the 20,135 students in Columbiana County are high school (5,016 | 24.9%), middle school (4,561 | 22.7%), and elementary school (4,495 | 22.3%).
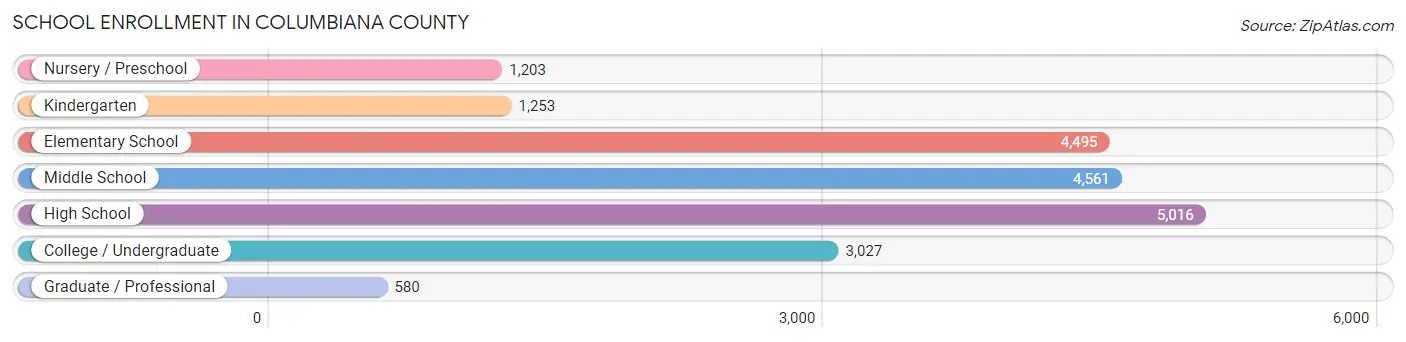
| School Level | # Students | % Students |
| Nursery / Preschool | 1,203 | 6.0% |
| Kindergarten | 1,253 | 6.2% |
| Elementary School | 4,495 | 22.3% |
| Middle School | 4,561 | 22.7% |
| High School | 5,016 | 24.9% |
| College / Undergraduate | 3,027 | 15.0% |
| Graduate / Professional | 580 | 2.9% |
| Total | 20,135 | 100.0% |
School Enrollment by Age by Funding Source in Columbiana County
Out of a total of 20,135 students who are enrolled in schools in Columbiana County, 2,336 (11.6%) attend a private institution, while the remaining 17,799 (88.4%) are enrolled in public schools. The age group of 35 years and over has the highest likelihood of being enrolled in private schools, with 409 (43.5% in the age bracket) enrolled. Conversely, the age group of 15 to 17 year olds has the lowest likelihood of being enrolled in a private school, with 3,393 (95.7% in the age bracket) attending a public institution.
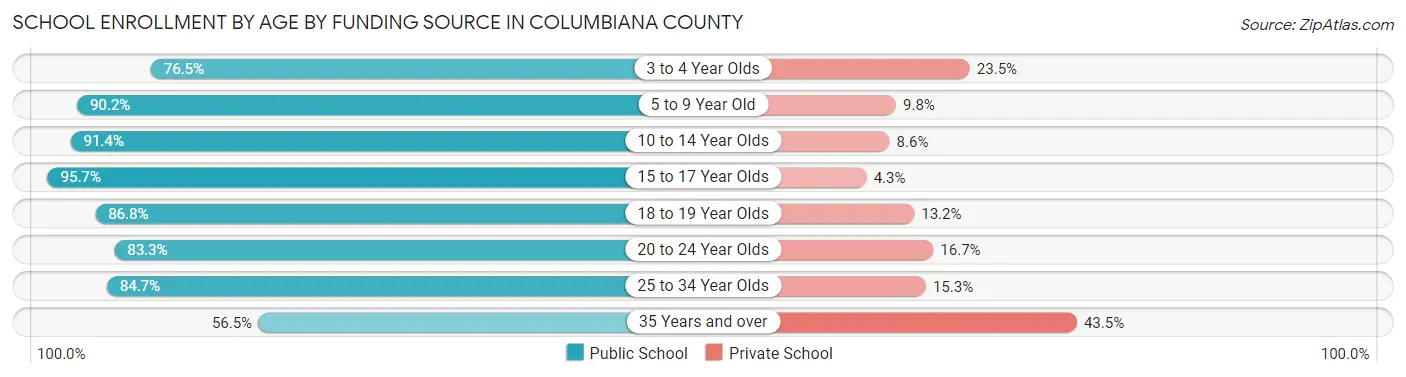
| Age Bracket | Public School | Private School |
| 3 to 4 Year Olds | 654 (76.5%) | 201 (23.5%) |
| 5 to 9 Year Old | 4,963 (90.2%) | 537 (9.8%) |
| 10 to 14 Year Olds | 5,235 (91.4%) | 491 (8.6%) |
| 15 to 17 Year Olds | 3,393 (95.7%) | 152 (4.3%) |
| 18 to 19 Year Olds | 1,102 (86.8%) | 167 (13.2%) |
| 20 to 24 Year Olds | 1,355 (83.3%) | 272 (16.7%) |
| 25 to 34 Year Olds | 569 (84.7%) | 103 (15.3%) |
| 35 Years and over | 532 (56.5%) | 409 (43.5%) |
| Total | 17,799 (88.4%) | 2,336 (11.6%) |
Educational Attainment by Field of Study in Columbiana County
Education (3,024 | 23.6%), business (2,394 | 18.7%), science & technology (1,846 | 14.4%), arts & humanities (883 | 6.9%), and bio, nature & agricultural (788 | 6.1%) are the most common fields of study among 12,804 individuals in Columbiana County who have obtained a bachelor's degree or higher.
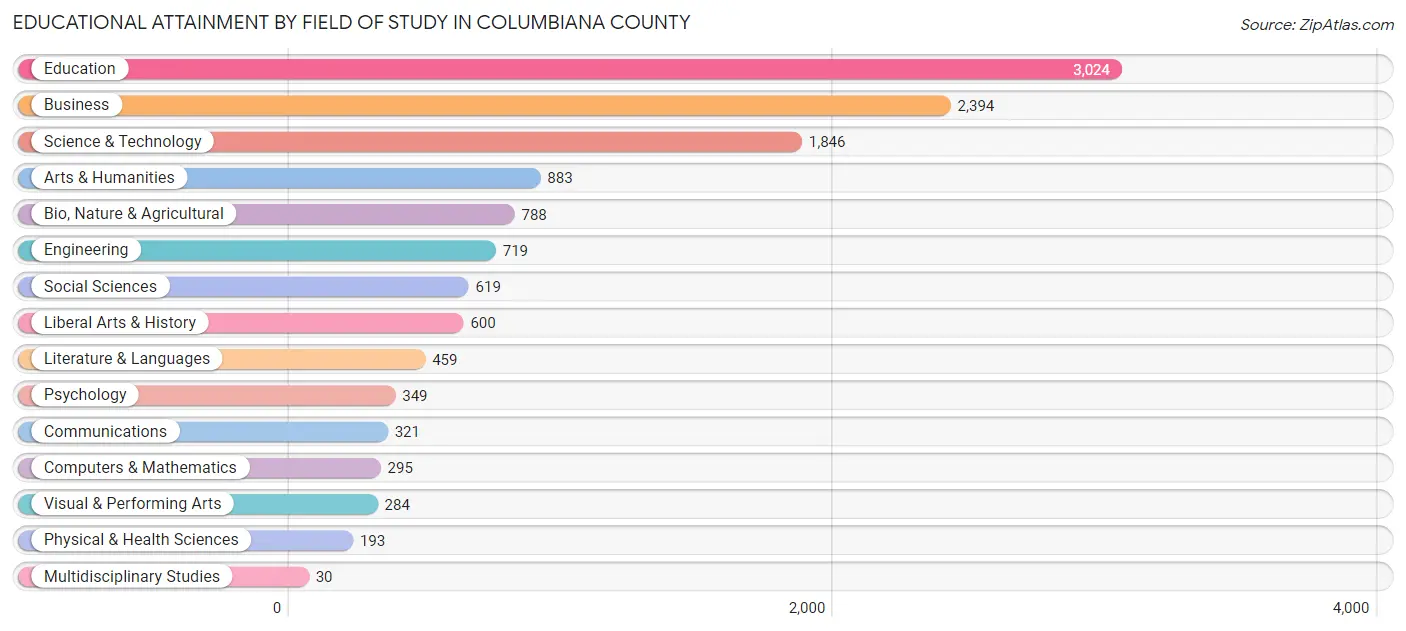
| Field of Study | # Graduates | % Graduates |
| Computers & Mathematics | 295 | 2.3% |
| Bio, Nature & Agricultural | 788 | 6.1% |
| Physical & Health Sciences | 193 | 1.5% |
| Psychology | 349 | 2.7% |
| Social Sciences | 619 | 4.8% |
| Engineering | 719 | 5.6% |
| Multidisciplinary Studies | 30 | 0.2% |
| Science & Technology | 1,846 | 14.4% |
| Business | 2,394 | 18.7% |
| Education | 3,024 | 23.6% |
| Literature & Languages | 459 | 3.6% |
| Liberal Arts & History | 600 | 4.7% |
| Visual & Performing Arts | 284 | 2.2% |
| Communications | 321 | 2.5% |
| Arts & Humanities | 883 | 6.9% |
| Total | 12,804 | 100.0% |
Transportation & Commute in Columbiana County
Vehicle Availability by Sex in Columbiana County
The most prevalent vehicle ownership categories in Columbiana County are males with 2 vehicles (9,522, accounting for 38.9%) and females with 2 vehicles (8,537, making up 45.2%).
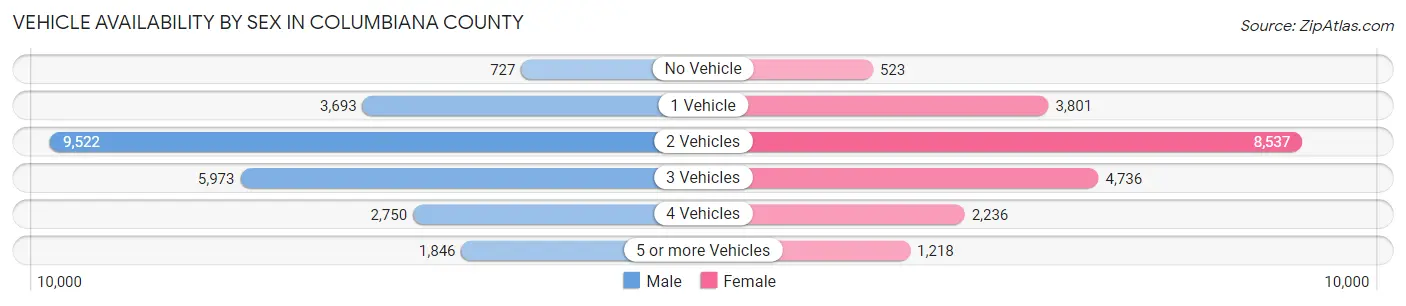
| Vehicles Available | Male | Female |
| No Vehicle | 727 (3.0%) | 523 (2.5%) |
| 1 Vehicle | 3,693 (15.1%) | 3,801 (18.1%) |
| 2 Vehicles | 9,522 (38.9%) | 8,537 (40.6%) |
| 3 Vehicles | 5,973 (24.4%) | 4,736 (22.5%) |
| 4 Vehicles | 2,750 (11.2%) | 2,236 (10.6%) |
| 5 or more Vehicles | 1,846 (7.5%) | 1,218 (5.8%) |
| Total | 24,511 (100.0%) | 21,051 (100.0%) |
Commute Time in Columbiana County
The most frequently occuring commute durations in Columbiana County are 5 to 9 minutes (6,965 commuters, 16.0%), 10 to 14 minutes (6,242 commuters, 14.3%), and 15 to 19 minutes (5,389 commuters, 12.4%).
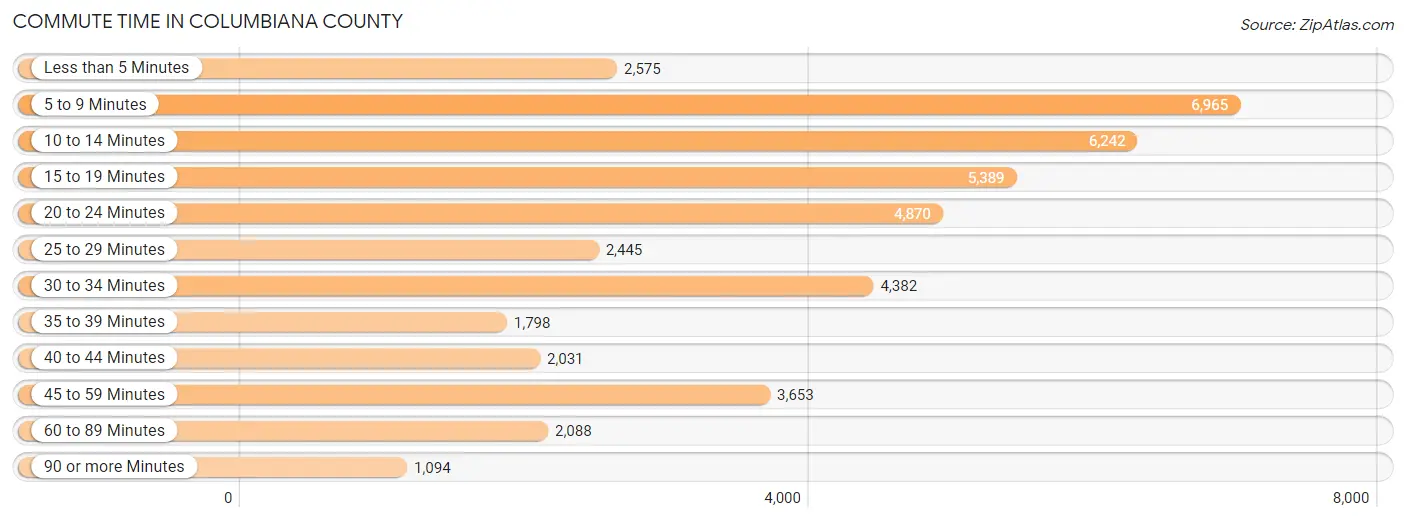
| Commute Time | # Commuters | % Commuters |
| Less than 5 Minutes | 2,575 | 5.9% |
| 5 to 9 Minutes | 6,965 | 16.0% |
| 10 to 14 Minutes | 6,242 | 14.3% |
| 15 to 19 Minutes | 5,389 | 12.4% |
| 20 to 24 Minutes | 4,870 | 11.2% |
| 25 to 29 Minutes | 2,445 | 5.6% |
| 30 to 34 Minutes | 4,382 | 10.1% |
| 35 to 39 Minutes | 1,798 | 4.1% |
| 40 to 44 Minutes | 2,031 | 4.7% |
| 45 to 59 Minutes | 3,653 | 8.4% |
| 60 to 89 Minutes | 2,088 | 4.8% |
| 90 or more Minutes | 1,094 | 2.5% |
Commute Time by Sex in Columbiana County
The most common commute times in Columbiana County are 5 to 9 minutes (3,346 commuters, 14.0%) for males and 5 to 9 minutes (3,619 commuters, 18.4%) for females.
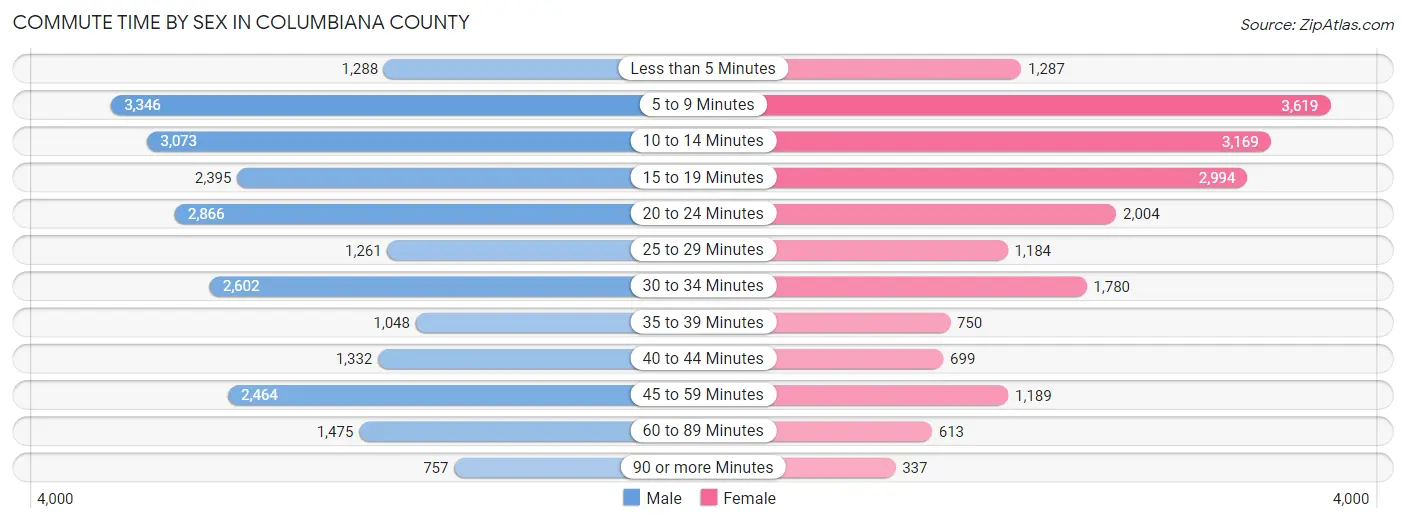
| Commute Time | Male | Female |
| Less than 5 Minutes | 1,288 (5.4%) | 1,287 (6.6%) |
| 5 to 9 Minutes | 3,346 (14.0%) | 3,619 (18.4%) |
| 10 to 14 Minutes | 3,073 (12.9%) | 3,169 (16.2%) |
| 15 to 19 Minutes | 2,395 (10.0%) | 2,994 (15.3%) |
| 20 to 24 Minutes | 2,866 (12.0%) | 2,004 (10.2%) |
| 25 to 29 Minutes | 1,261 (5.3%) | 1,184 (6.0%) |
| 30 to 34 Minutes | 2,602 (10.9%) | 1,780 (9.1%) |
| 35 to 39 Minutes | 1,048 (4.4%) | 750 (3.8%) |
| 40 to 44 Minutes | 1,332 (5.6%) | 699 (3.6%) |
| 45 to 59 Minutes | 2,464 (10.3%) | 1,189 (6.1%) |
| 60 to 89 Minutes | 1,475 (6.2%) | 613 (3.1%) |
| 90 or more Minutes | 757 (3.2%) | 337 (1.7%) |
Time of Departure to Work by Sex in Columbiana County
The most frequent times of departure to work in Columbiana County are 6:00 AM to 6:29 AM (2,486, 10.4%) for males and 7:30 AM to 7:59 AM (3,143, 16.0%) for females.
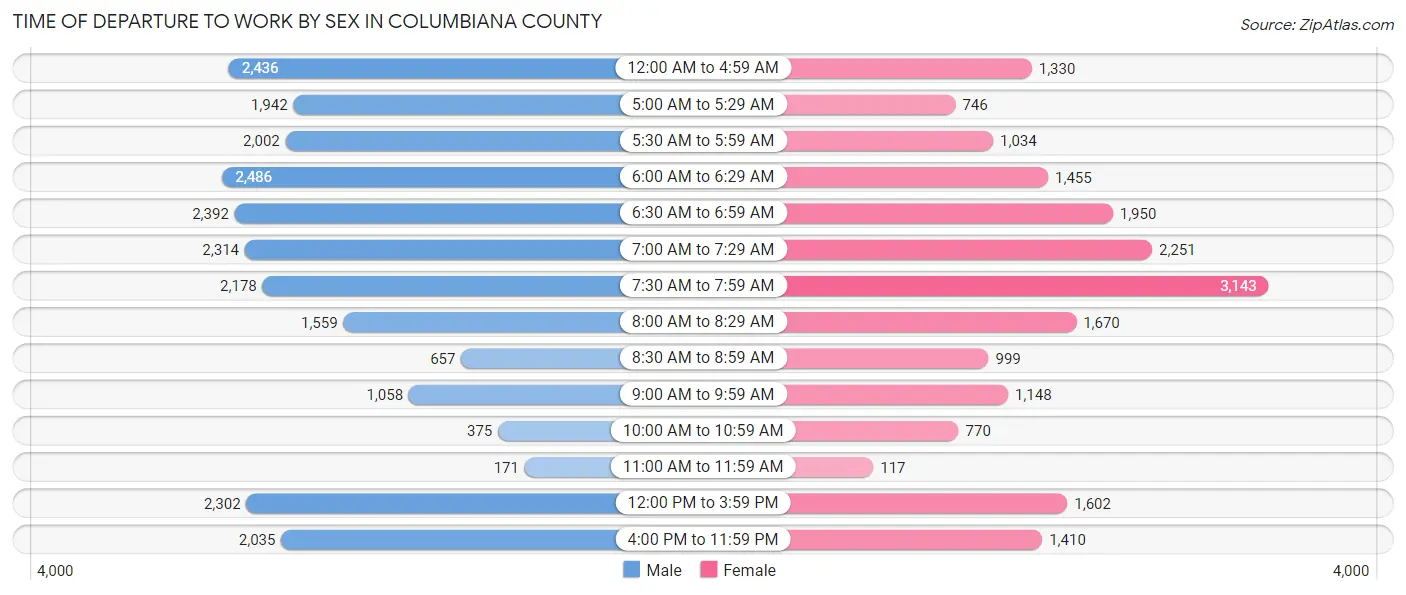
| Time of Departure | Male | Female |
| 12:00 AM to 4:59 AM | 2,436 (10.2%) | 1,330 (6.8%) |
| 5:00 AM to 5:29 AM | 1,942 (8.1%) | 746 (3.8%) |
| 5:30 AM to 5:59 AM | 2,002 (8.4%) | 1,034 (5.3%) |
| 6:00 AM to 6:29 AM | 2,486 (10.4%) | 1,455 (7.4%) |
| 6:30 AM to 6:59 AM | 2,392 (10.0%) | 1,950 (9.9%) |
| 7:00 AM to 7:29 AM | 2,314 (9.7%) | 2,251 (11.5%) |
| 7:30 AM to 7:59 AM | 2,178 (9.1%) | 3,143 (16.0%) |
| 8:00 AM to 8:29 AM | 1,559 (6.5%) | 1,670 (8.5%) |
| 8:30 AM to 8:59 AM | 657 (2.8%) | 999 (5.1%) |
| 9:00 AM to 9:59 AM | 1,058 (4.4%) | 1,148 (5.9%) |
| 10:00 AM to 10:59 AM | 375 (1.6%) | 770 (3.9%) |
| 11:00 AM to 11:59 AM | 171 (0.7%) | 117 (0.6%) |
| 12:00 PM to 3:59 PM | 2,302 (9.6%) | 1,602 (8.2%) |
| 4:00 PM to 11:59 PM | 2,035 (8.5%) | 1,410 (7.2%) |
| Total | 23,907 (100.0%) | 19,625 (100.0%) |
Housing Occupancy in Columbiana County
Occupancy by Ownership in Columbiana County
Of the total 41,251 dwellings in Columbiana County, owner-occupied units account for 30,192 (73.2%), while renter-occupied units make up 11,059 (26.8%).
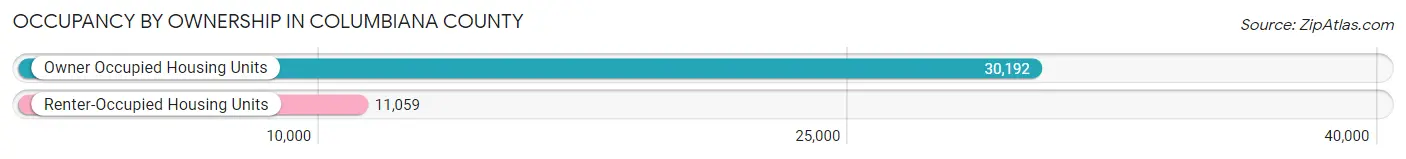
| Occupancy | # Housing Units | % Housing Units |
| Owner Occupied Housing Units | 30,192 | 73.2% |
| Renter-Occupied Housing Units | 11,059 | 26.8% |
| Total Occupied Housing Units | 41,251 | 100.0% |
Occupancy by Household Size in Columbiana County
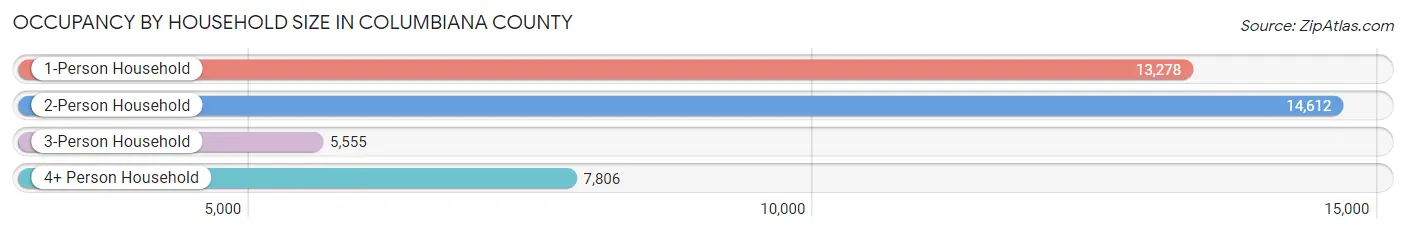
| Household Size | # Housing Units | % Housing Units |
| 1-Person Household | 13,278 | 32.2% |
| 2-Person Household | 14,612 | 35.4% |
| 3-Person Household | 5,555 | 13.5% |
| 4+ Person Household | 7,806 | 18.9% |
| Total Housing Units | 41,251 | 100.0% |
Occupancy by Ownership by Household Size in Columbiana County
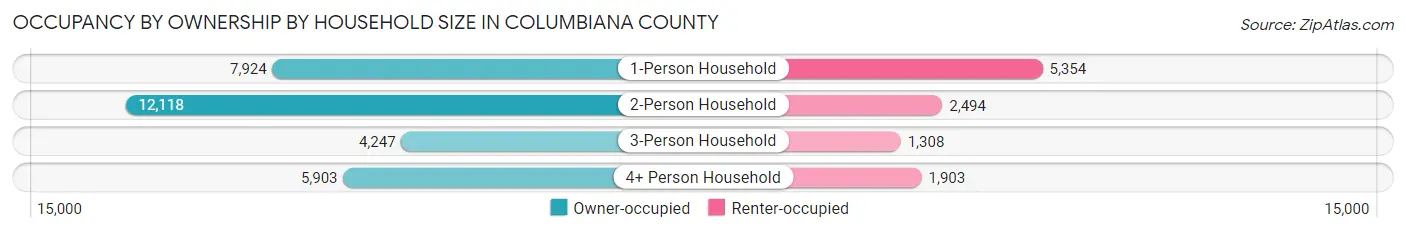
| Household Size | Owner-occupied | Renter-occupied |
| 1-Person Household | 7,924 (59.7%) | 5,354 (40.3%) |
| 2-Person Household | 12,118 (82.9%) | 2,494 (17.1%) |
| 3-Person Household | 4,247 (76.4%) | 1,308 (23.5%) |
| 4+ Person Household | 5,903 (75.6%) | 1,903 (24.4%) |
| Total Housing Units | 30,192 (73.2%) | 11,059 (26.8%) |
Occupancy by Educational Attainment in Columbiana County
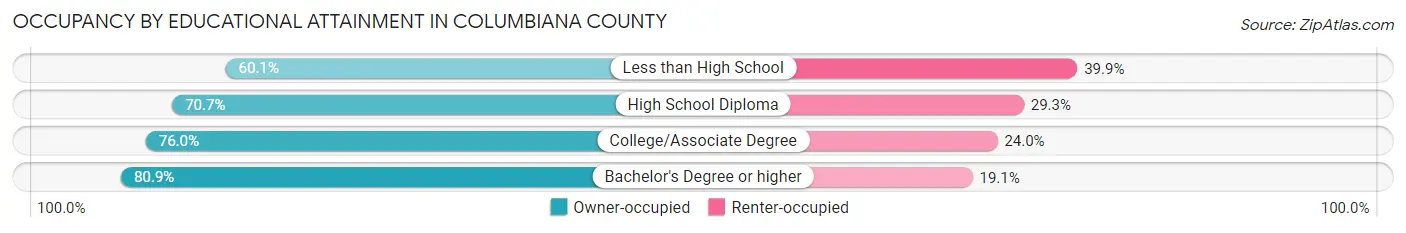
| Household Size | Owner-occupied | Renter-occupied |
| Less than High School | 2,124 (60.1%) | 1,408 (39.9%) |
| High School Diploma | 12,872 (70.7%) | 5,327 (29.3%) |
| College/Associate Degree | 9,146 (76.0%) | 2,895 (24.0%) |
| Bachelor's Degree or higher | 6,050 (80.9%) | 1,429 (19.1%) |
Occupancy by Age of Householder in Columbiana County
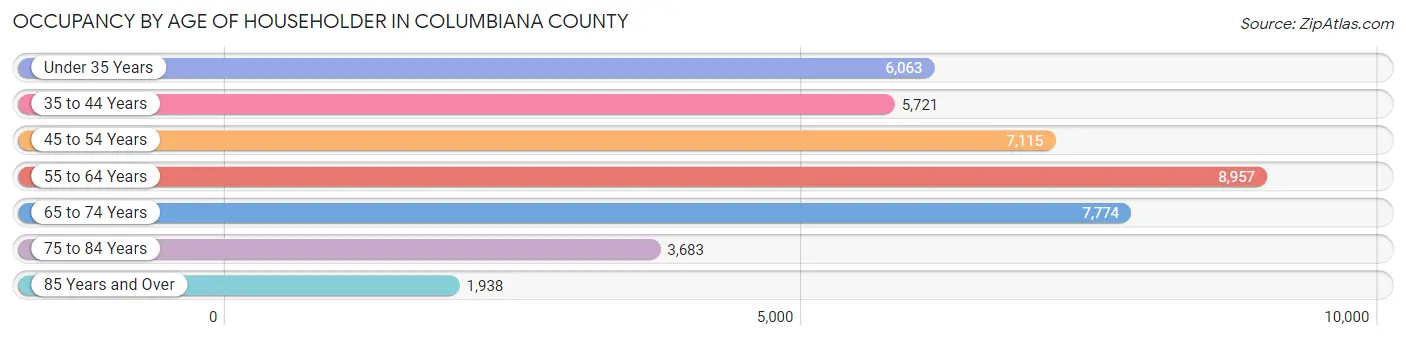
| Age Bracket | # Households | % Households |
| Under 35 Years | 6,063 | 14.7% |
| 35 to 44 Years | 5,721 | 13.9% |
| 45 to 54 Years | 7,115 | 17.2% |
| 55 to 64 Years | 8,957 | 21.7% |
| 65 to 74 Years | 7,774 | 18.9% |
| 75 to 84 Years | 3,683 | 8.9% |
| 85 Years and Over | 1,938 | 4.7% |
| Total | 41,251 | 100.0% |
Housing Finances in Columbiana County
Median Income by Occupancy in Columbiana County
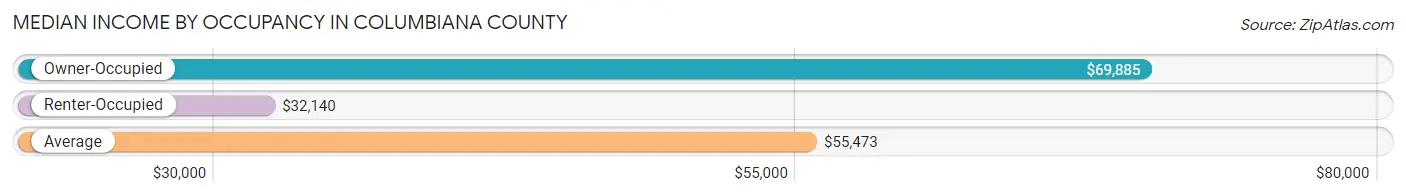
| Occupancy Type | # Households | Median Income |
| Owner-Occupied | 30,192 (73.2%) | $69,885 |
| Renter-Occupied | 11,059 (26.8%) | $32,140 |
| Average | 41,251 (100.0%) | $55,473 |
Occupancy by Householder Income Bracket in Columbiana County
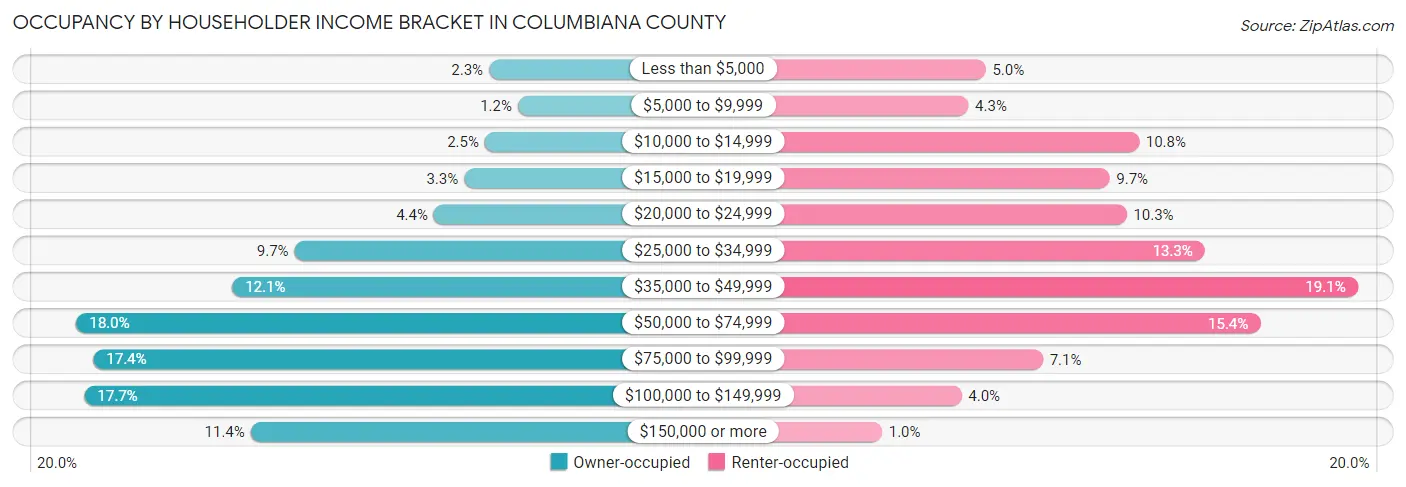
| Income Bracket | Owner-occupied | Renter-occupied |
| Less than $5,000 | 697 (2.3%) | 547 (5.0%) |
| $5,000 to $9,999 | 366 (1.2%) | 474 (4.3%) |
| $10,000 to $14,999 | 746 (2.5%) | 1,193 (10.8%) |
| $15,000 to $19,999 | 984 (3.3%) | 1,069 (9.7%) |
| $20,000 to $24,999 | 1,331 (4.4%) | 1,141 (10.3%) |
| $25,000 to $34,999 | 2,936 (9.7%) | 1,471 (13.3%) |
| $35,000 to $49,999 | 3,651 (12.1%) | 2,114 (19.1%) |
| $50,000 to $74,999 | 5,444 (18.0%) | 1,704 (15.4%) |
| $75,000 to $99,999 | 5,247 (17.4%) | 789 (7.1%) |
| $100,000 to $149,999 | 5,351 (17.7%) | 446 (4.0%) |
| $150,000 or more | 3,439 (11.4%) | 111 (1.0%) |
| Total | 30,192 (100.0%) | 11,059 (100.0%) |
Monthly Housing Cost Tiers in Columbiana County
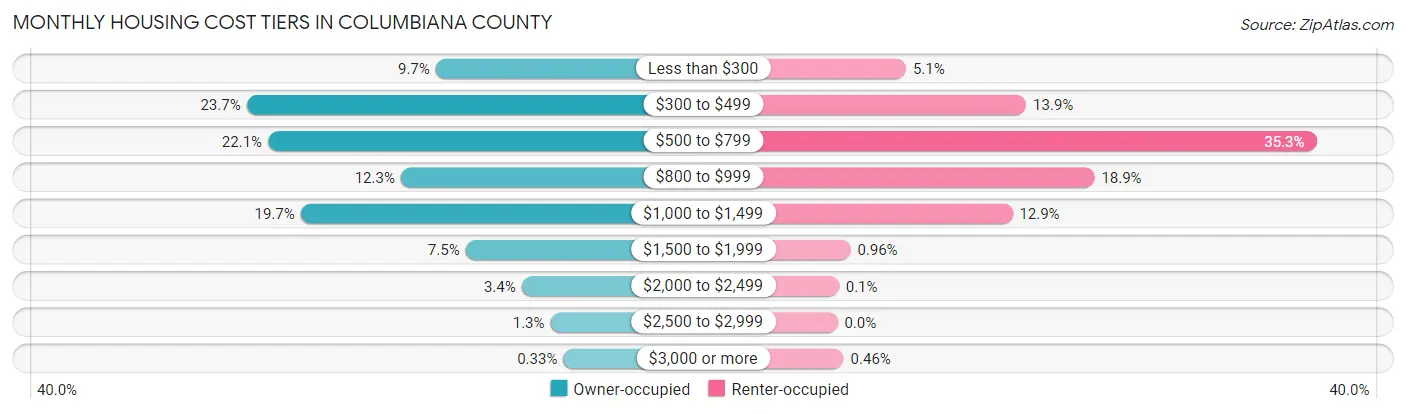
| Monthly Cost | Owner-occupied | Renter-occupied |
| Less than $300 | 2,939 (9.7%) | 559 (5.1%) |
| $300 to $499 | 7,144 (23.7%) | 1,537 (13.9%) |
| $500 to $799 | 6,666 (22.1%) | 3,900 (35.3%) |
| $800 to $999 | 3,714 (12.3%) | 2,093 (18.9%) |
| $1,000 to $1,499 | 5,943 (19.7%) | 1,426 (12.9%) |
| $1,500 to $1,999 | 2,273 (7.5%) | 106 (1.0%) |
| $2,000 to $2,499 | 1,026 (3.4%) | 11 (0.1%) |
| $2,500 to $2,999 | 386 (1.3%) | 0 (0.0%) |
| $3,000 or more | 101 (0.3%) | 51 (0.5%) |
| Total | 30,192 (100.0%) | 11,059 (100.0%) |
Physical Housing Characteristics in Columbiana County
Housing Structures in Columbiana County
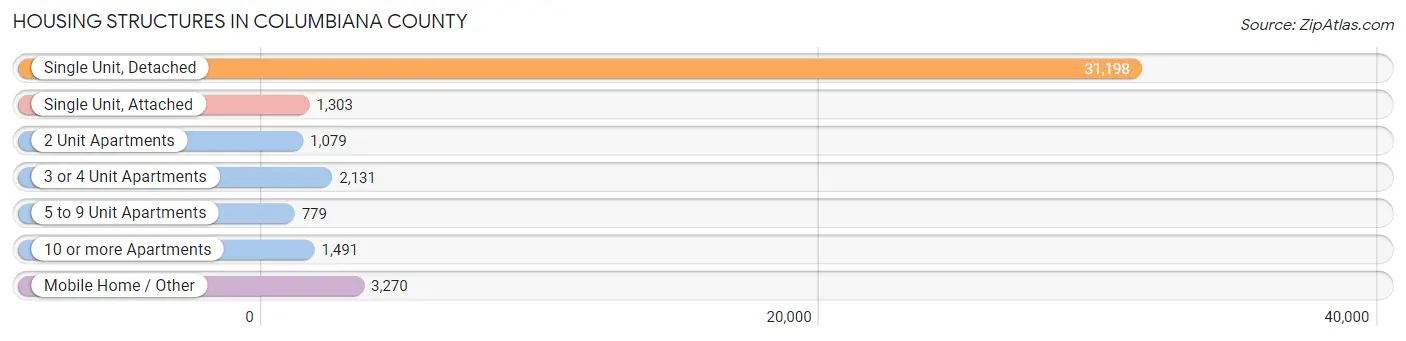
| Structure Type | # Housing Units | % Housing Units |
| Single Unit, Detached | 31,198 | 75.6% |
| Single Unit, Attached | 1,303 | 3.2% |
| 2 Unit Apartments | 1,079 | 2.6% |
| 3 or 4 Unit Apartments | 2,131 | 5.2% |
| 5 to 9 Unit Apartments | 779 | 1.9% |
| 10 or more Apartments | 1,491 | 3.6% |
| Mobile Home / Other | 3,270 | 7.9% |
| Total | 41,251 | 100.0% |
Housing Structures by Occupancy in Columbiana County
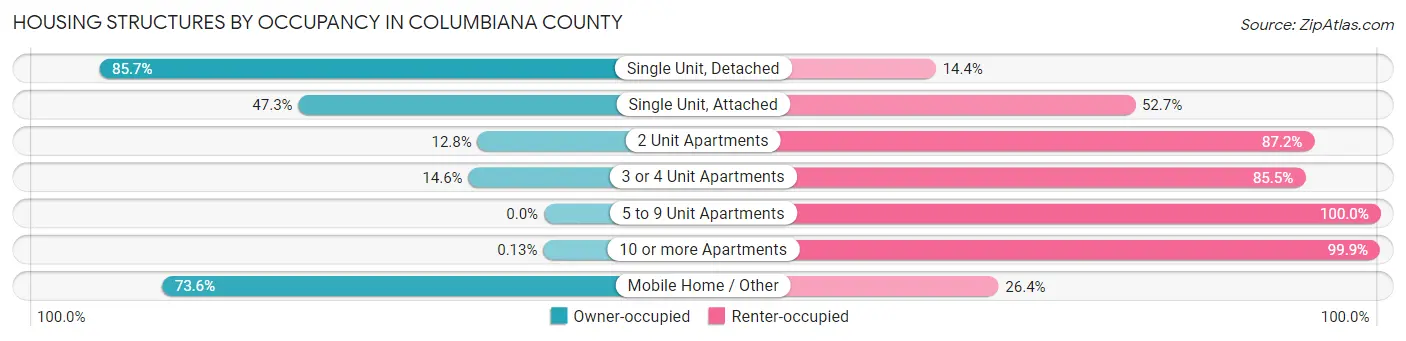
| Structure Type | Owner-occupied | Renter-occupied |
| Single Unit, Detached | 26,720 (85.7%) | 4,478 (14.3%) |
| Single Unit, Attached | 616 (47.3%) | 687 (52.7%) |
| 2 Unit Apartments | 138 (12.8%) | 941 (87.2%) |
| 3 or 4 Unit Apartments | 310 (14.5%) | 1,821 (85.5%) |
| 5 to 9 Unit Apartments | 0 (0.0%) | 779 (100.0%) |
| 10 or more Apartments | 2 (0.1%) | 1,489 (99.9%) |
| Mobile Home / Other | 2,406 (73.6%) | 864 (26.4%) |
| Total | 30,192 (73.2%) | 11,059 (26.8%) |
Housing Structures by Number of Rooms in Columbiana County
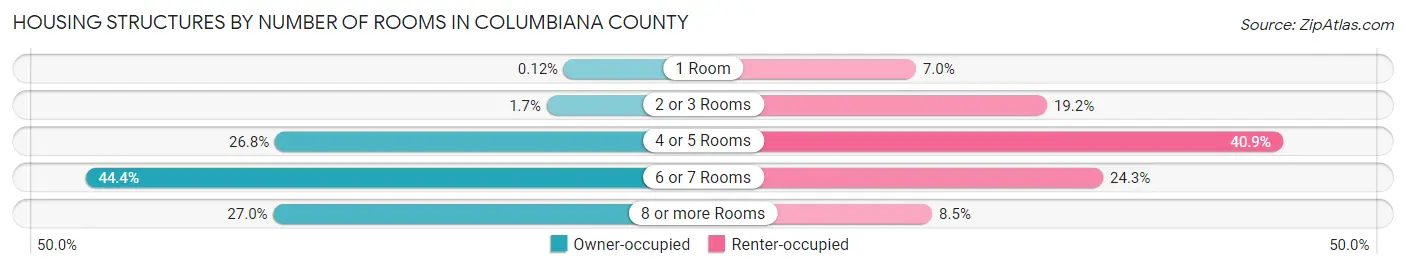
| Number of Rooms | Owner-occupied | Renter-occupied |
| 1 Room | 36 (0.1%) | 778 (7.0%) |
| 2 or 3 Rooms | 512 (1.7%) | 2,118 (19.2%) |
| 4 or 5 Rooms | 8,103 (26.8%) | 4,528 (40.9%) |
| 6 or 7 Rooms | 13,392 (44.4%) | 2,692 (24.3%) |
| 8 or more Rooms | 8,149 (27.0%) | 943 (8.5%) |
| Total | 30,192 (100.0%) | 11,059 (100.0%) |
Housing Structure by Heating Type in Columbiana County
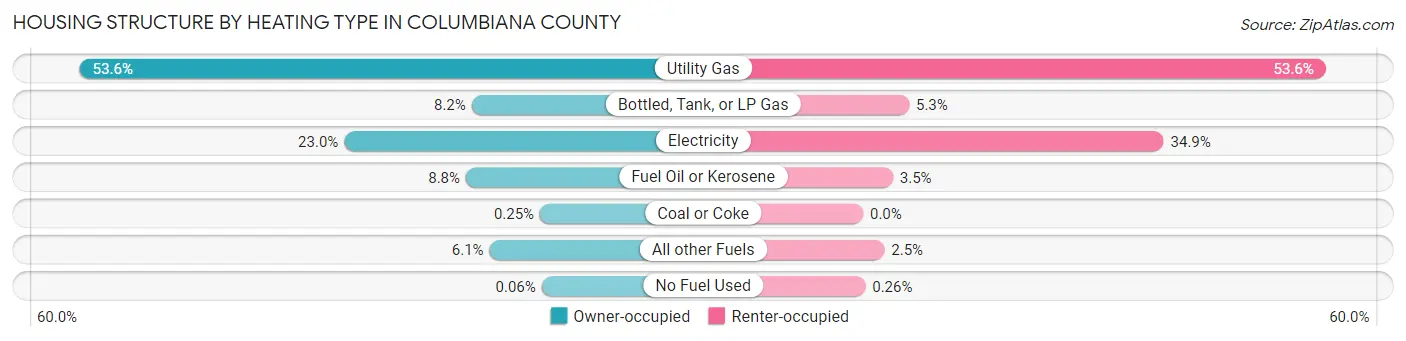
| Heating Type | Owner-occupied | Renter-occupied |
| Utility Gas | 16,185 (53.6%) | 5,931 (53.6%) |
| Bottled, Tank, or LP Gas | 2,468 (8.2%) | 589 (5.3%) |
| Electricity | 6,930 (23.0%) | 3,854 (34.8%) |
| Fuel Oil or Kerosene | 2,669 (8.8%) | 383 (3.5%) |
| Coal or Coke | 76 (0.3%) | 0 (0.0%) |
| All other Fuels | 1,845 (6.1%) | 273 (2.5%) |
| No Fuel Used | 19 (0.1%) | 29 (0.3%) |
| Total | 30,192 (100.0%) | 11,059 (100.0%) |
Household Vehicle Usage in Columbiana County
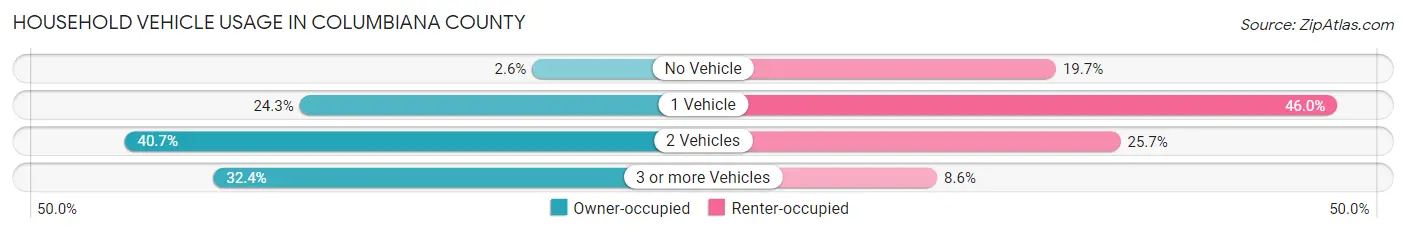
| Vehicles per Household | Owner-occupied | Renter-occupied |
| No Vehicle | 790 (2.6%) | 2,179 (19.7%) |
| 1 Vehicle | 7,350 (24.3%) | 5,082 (46.0%) |
| 2 Vehicles | 12,278 (40.7%) | 2,846 (25.7%) |
| 3 or more Vehicles | 9,774 (32.4%) | 952 (8.6%) |
| Total | 30,192 (100.0%) | 11,059 (100.0%) |
Real Estate & Mortgages in Columbiana County
Real Estate and Mortgage Overview in Columbiana County
| Characteristic | Without Mortgage | With Mortgage |
| Housing Units | 14,613 | 15,579 |
| Median Property Value | $110,900 | $137,000 |
| Median Household Income | $53,784 | $2,203 |
| Monthly Housing Costs | $427 | $84 |
| Real Estate Taxes | $1,318 | $440 |
Property Value by Mortgage Status in Columbiana County
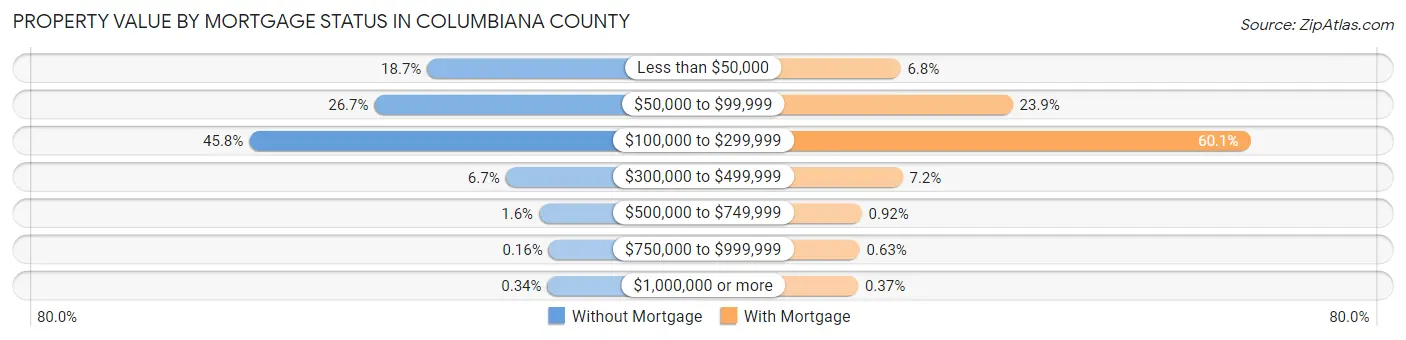
| Property Value | Without Mortgage | With Mortgage |
| Less than $50,000 | 2,727 (18.7%) | 1,066 (6.8%) |
| $50,000 to $99,999 | 3,903 (26.7%) | 3,728 (23.9%) |
| $100,000 to $299,999 | 6,692 (45.8%) | 9,369 (60.1%) |
| $300,000 to $499,999 | 982 (6.7%) | 1,116 (7.2%) |
| $500,000 to $749,999 | 236 (1.6%) | 144 (0.9%) |
| $750,000 to $999,999 | 24 (0.2%) | 98 (0.6%) |
| $1,000,000 or more | 49 (0.3%) | 58 (0.4%) |
| Total | 14,613 (100.0%) | 15,579 (100.0%) |
Household Income by Mortgage Status in Columbiana County
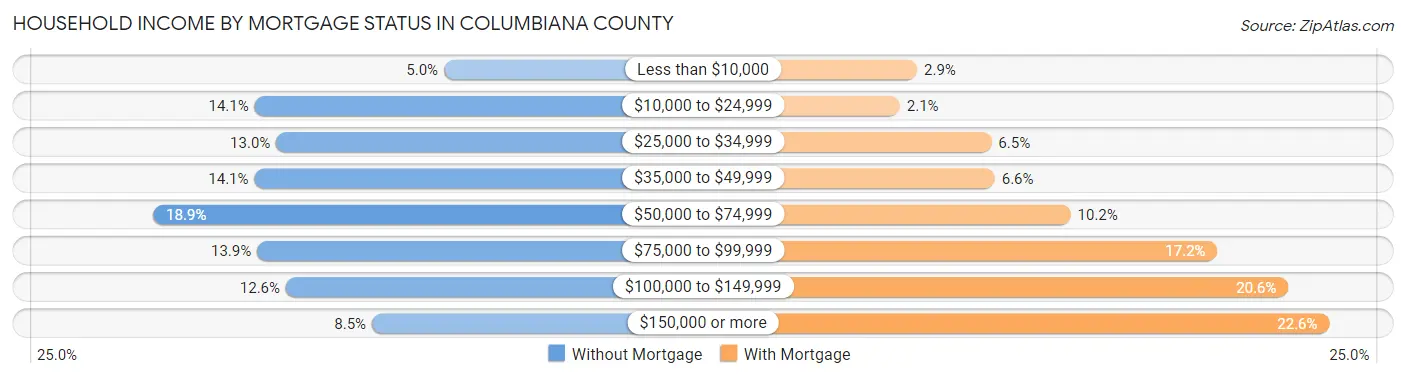
| Household Income | Without Mortgage | With Mortgage |
| Less than $10,000 | 735 (5.0%) | 456 (2.9%) |
| $10,000 to $24,999 | 2,053 (14.1%) | 328 (2.1%) |
| $25,000 to $34,999 | 1,903 (13.0%) | 1,008 (6.5%) |
| $35,000 to $49,999 | 2,055 (14.1%) | 1,033 (6.6%) |
| $50,000 to $74,999 | 2,759 (18.9%) | 1,596 (10.2%) |
| $75,000 to $99,999 | 2,036 (13.9%) | 2,685 (17.2%) |
| $100,000 to $149,999 | 1,836 (12.6%) | 3,211 (20.6%) |
| $150,000 or more | 1,236 (8.5%) | 3,515 (22.6%) |
| Total | 14,613 (100.0%) | 15,579 (100.0%) |
Property Value to Household Income Ratio in Columbiana County
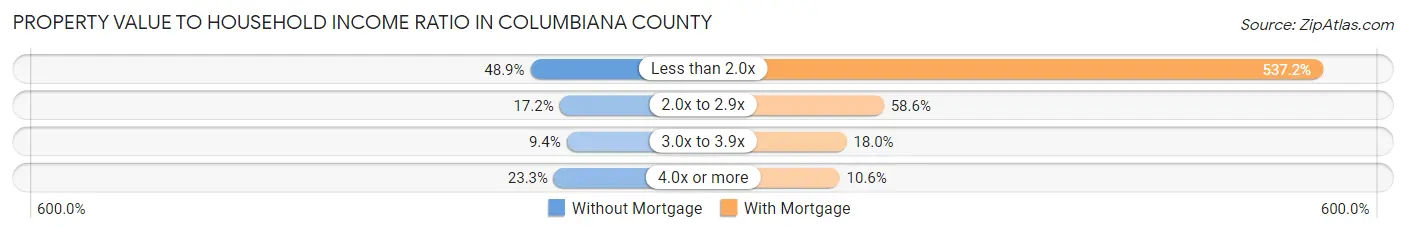
| Value-to-Income Ratio | Without Mortgage | With Mortgage |
| Less than 2.0x | 7,144 (48.9%) | 83,692 (537.2%) |
| 2.0x to 2.9x | 2,509 (17.2%) | 9,136 (58.6%) |
| 3.0x to 3.9x | 1,378 (9.4%) | 2,804 (18.0%) |
| 4.0x or more | 3,405 (23.3%) | 1,646 (10.6%) |
| Total | 14,613 (100.0%) | 15,579 (100.0%) |
Real Estate Taxes by Mortgage Status in Columbiana County
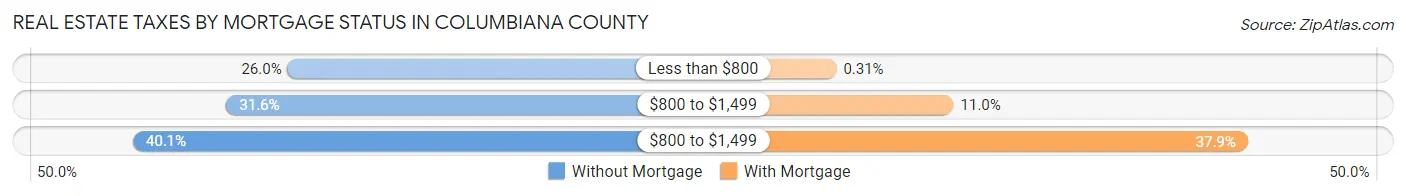
| Property Taxes | Without Mortgage | With Mortgage |
| Less than $800 | 3,798 (26.0%) | 48 (0.3%) |
| $800 to $1,499 | 4,613 (31.6%) | 1,716 (11.0%) |
| $800 to $1,499 | 5,861 (40.1%) | 5,902 (37.9%) |
| Total | 14,613 (100.0%) | 15,579 (100.0%) |
Health & Disability in Columbiana County
Health Insurance Coverage by Age in Columbiana County

| Age Bracket | With Coverage | Without Coverage |
| Under 6 Years | 5,700 (92.0%) | 492 (8.0%) |
| 6 to 18 Years | 14,735 (94.2%) | 909 (5.8%) |
| 19 to 25 Years | 6,704 (91.8%) | 602 (8.2%) |
| 26 to 34 Years | 7,896 (80.5%) | 1,915 (19.5%) |
| 35 to 44 Years | 10,071 (90.2%) | 1,095 (9.8%) |
| 45 to 54 Years | 12,126 (94.1%) | 759 (5.9%) |
| 55 to 64 Years | 13,846 (90.3%) | 1,492 (9.7%) |
| 65 to 74 Years | 12,149 (99.4%) | 70 (0.6%) |
| 75 Years and older | 7,980 (100.0%) | 3 (0.0%) |
| Total | 91,207 (92.5%) | 7,337 (7.4%) |
Health Insurance Coverage by Citizenship Status in Columbiana County
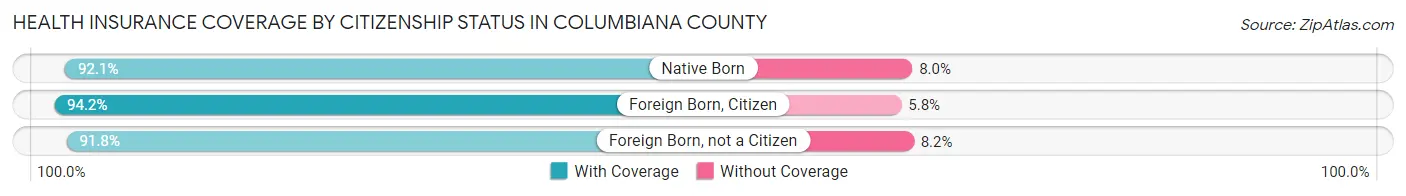
| Citizenship Status | With Coverage | Without Coverage |
| Native Born | 5,700 (92.0%) | 492 (8.0%) |
| Foreign Born, Citizen | 14,735 (94.2%) | 909 (5.8%) |
| Foreign Born, not a Citizen | 6,704 (91.8%) | 602 (8.2%) |
Health Insurance Coverage by Household Income in Columbiana County
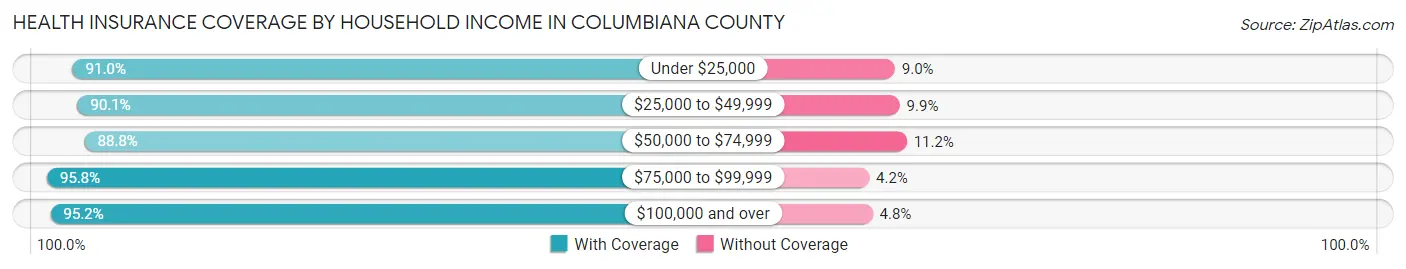
| Household Income | With Coverage | Without Coverage |
| Under $25,000 | 13,055 (91.0%) | 1,291 (9.0%) |
| $25,000 to $49,999 | 17,622 (90.1%) | 1,936 (9.9%) |
| $50,000 to $74,999 | 15,311 (88.8%) | 1,935 (11.2%) |
| $75,000 to $99,999 | 16,329 (95.8%) | 712 (4.2%) |
| $100,000 and over | 28,659 (95.2%) | 1,454 (4.8%) |
Public vs Private Health Insurance Coverage by Age in Columbiana County
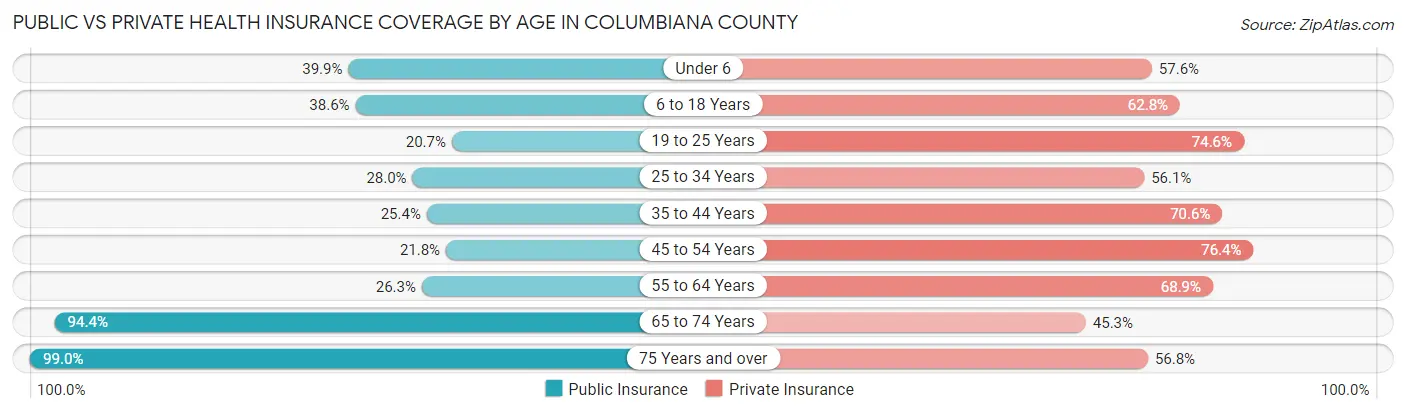
| Age Bracket | Public Insurance | Private Insurance |
| Under 6 | 2,472 (39.9%) | 3,564 (57.6%) |
| 6 to 18 Years | 6,038 (38.6%) | 9,816 (62.7%) |
| 19 to 25 Years | 1,513 (20.7%) | 5,452 (74.6%) |
| 25 to 34 Years | 2,748 (28.0%) | 5,507 (56.1%) |
| 35 to 44 Years | 2,832 (25.4%) | 7,883 (70.6%) |
| 45 to 54 Years | 2,807 (21.8%) | 9,843 (76.4%) |
| 55 to 64 Years | 4,029 (26.3%) | 10,564 (68.9%) |
| 65 to 74 Years | 11,536 (94.4%) | 5,535 (45.3%) |
| 75 Years and over | 7,900 (99.0%) | 4,537 (56.8%) |
| Total | 41,875 (42.5%) | 62,701 (63.6%) |
Disability Status by Sex by Age in Columbiana County
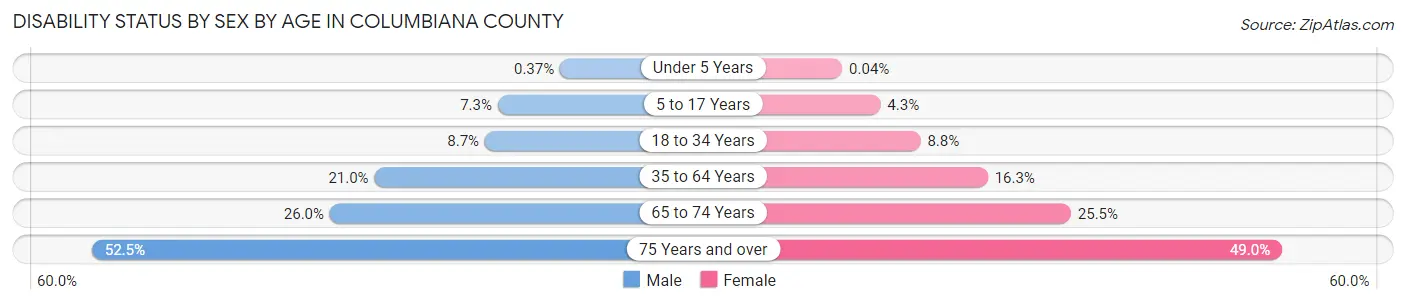
| Age Bracket | Male | Female |
| Under 5 Years | 9 (0.4%) | 1 (0.0%) |
| 5 to 17 Years | 562 (7.3%) | 334 (4.3%) |
| 18 to 34 Years | 836 (8.7%) | 778 (8.8%) |
| 35 to 64 Years | 4,216 (21.0%) | 3,145 (16.3%) |
| 65 to 74 Years | 1,569 (26.0%) | 1,578 (25.5%) |
| 75 Years and over | 1,770 (52.5%) | 2,261 (49.0%) |
Disability Class by Sex by Age in Columbiana County
Disability Class: Hearing Difficulty

| Age Bracket | Male | Female |
| Under 5 Years | 9 (0.4%) | 0 (0.0%) |
| 5 to 17 Years | 20 (0.3%) | 44 (0.6%) |
| 18 to 34 Years | 26 (0.3%) | 15 (0.2%) |
| 35 to 64 Years | 1,026 (5.1%) | 322 (1.7%) |
| 65 to 74 Years | 770 (12.8%) | 516 (8.3%) |
| 75 Years and over | 1,117 (33.1%) | 1,003 (21.7%) |
Disability Class: Vision Difficulty
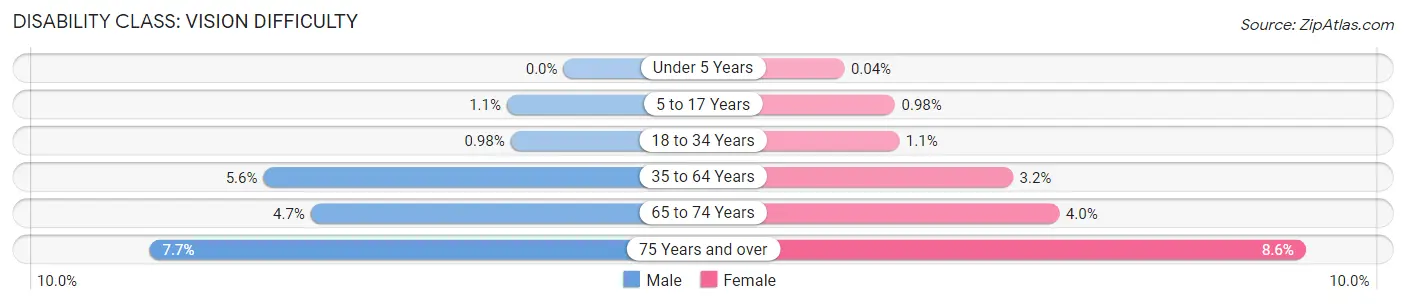
| Age Bracket | Male | Female |
| Under 5 Years | 0 (0.0%) | 1 (0.0%) |
| 5 to 17 Years | 81 (1.1%) | 76 (1.0%) |
| 18 to 34 Years | 94 (1.0%) | 94 (1.1%) |
| 35 to 64 Years | 1,117 (5.6%) | 613 (3.2%) |
| 65 to 74 Years | 283 (4.7%) | 249 (4.0%) |
| 75 Years and over | 259 (7.7%) | 397 (8.6%) |
Disability Class: Cognitive Difficulty
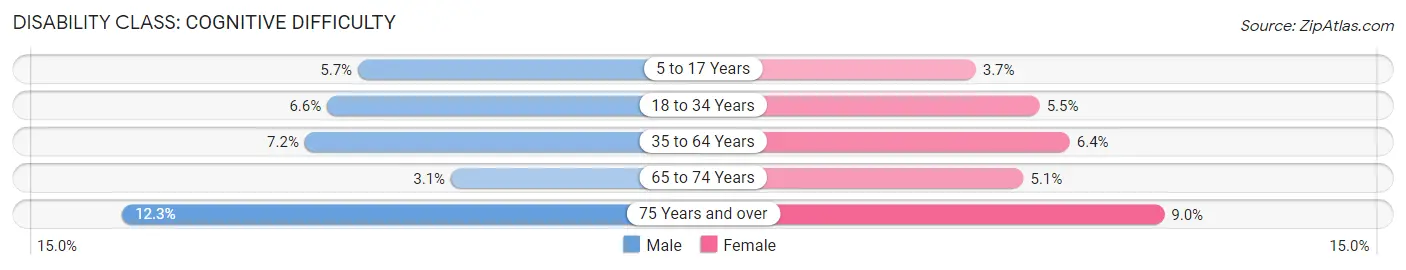
| Age Bracket | Male | Female |
| 5 to 17 Years | 440 (5.7%) | 290 (3.7%) |
| 18 to 34 Years | 630 (6.6%) | 489 (5.5%) |
| 35 to 64 Years | 1,443 (7.2%) | 1,229 (6.4%) |
| 65 to 74 Years | 189 (3.1%) | 313 (5.1%) |
| 75 Years and over | 414 (12.3%) | 414 (9.0%) |
Disability Class: Ambulatory Difficulty
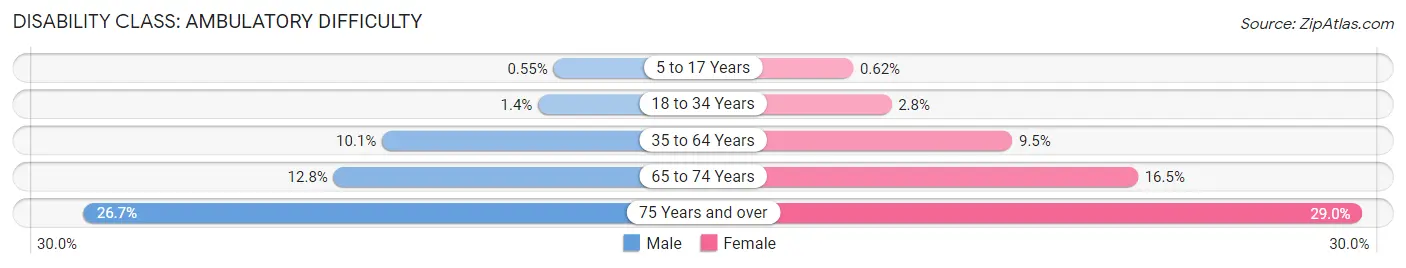
| Age Bracket | Male | Female |
| 5 to 17 Years | 42 (0.5%) | 48 (0.6%) |
| 18 to 34 Years | 134 (1.4%) | 244 (2.8%) |
| 35 to 64 Years | 2,023 (10.1%) | 1,834 (9.5%) |
| 65 to 74 Years | 772 (12.8%) | 1,019 (16.5%) |
| 75 Years and over | 900 (26.7%) | 1,337 (29.0%) |
Disability Class: Self-Care Difficulty
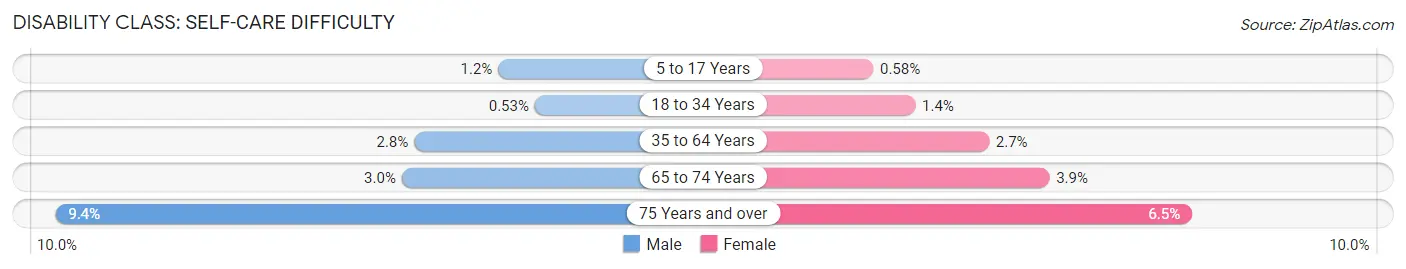
| Age Bracket | Male | Female |
| 5 to 17 Years | 93 (1.2%) | 45 (0.6%) |
| 18 to 34 Years | 51 (0.5%) | 121 (1.4%) |
| 35 to 64 Years | 555 (2.8%) | 529 (2.7%) |
| 65 to 74 Years | 181 (3.0%) | 238 (3.8%) |
| 75 Years and over | 318 (9.4%) | 300 (6.5%) |
Technology Access in Columbiana County
Computing Device Access in Columbiana County
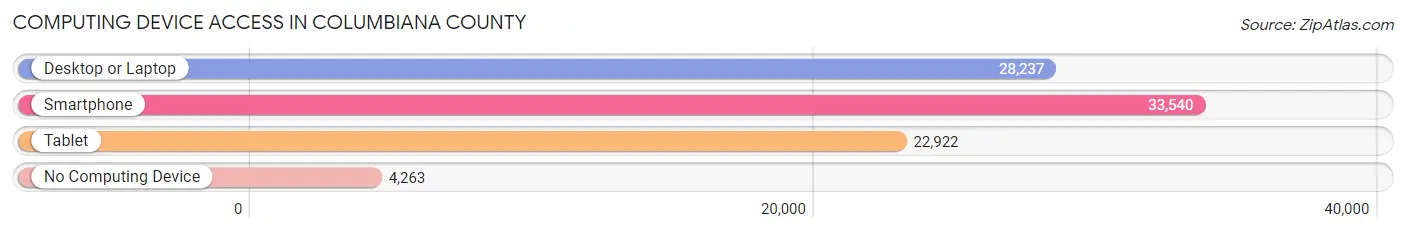
| Device Type | # Households | % Households |
| Desktop or Laptop | 28,237 | 68.4% |
| Smartphone | 33,540 | 81.3% |
| Tablet | 22,922 | 55.6% |
| No Computing Device | 4,263 | 10.3% |
| Total | 41,251 | 100.0% |
Internet Access in Columbiana County
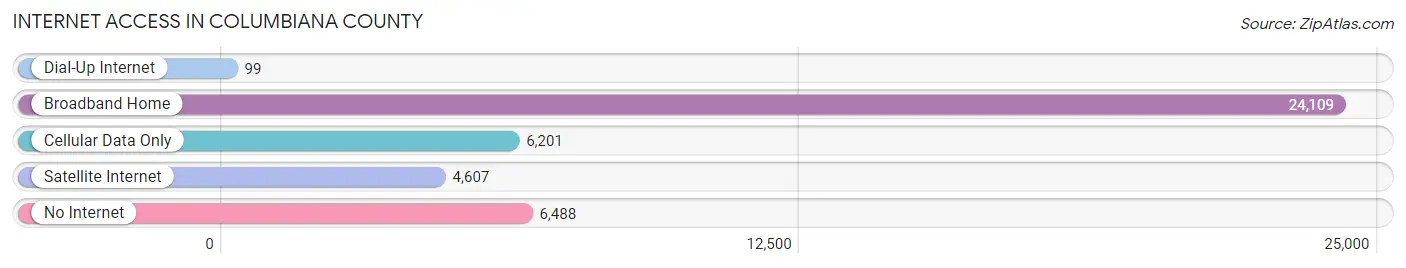
| Internet Type | # Households | % Households |
| Dial-Up Internet | 99 | 0.2% |
| Broadband Home | 24,109 | 58.4% |
| Cellular Data Only | 6,201 | 15.0% |
| Satellite Internet | 4,607 | 11.2% |
| No Internet | 6,488 | 15.7% |
| Total | 41,251 | 100.0% |
Columbiana County Summary
Columbiana County is located in the northeastern part of Ohio, and is part of the Appalachian region. It is bordered by Mahoning County to the north, Carroll County to the east, Stark County to the south, and Jefferson County to the west. The county seat is Lisbon, and the largest city is Salem. The county was established in 1803 and named after Christopher Columbus.
Geography
Columbiana County is located in the Appalachian Plateau region of Ohio. The county is mostly rural, with rolling hills and valleys. The highest point in the county is at 1,717 feet above sea level, located in the western part of the county. The county is drained by the Mahoning River, which flows through the northern part of the county. The county also contains several small lakes, including Guilford Lake, Leesville Lake, and Berlin Lake.
The climate of Columbiana County is humid continental, with cold winters and hot, humid summers. The average annual temperature is around 50 degrees Fahrenheit, and the average annual precipitation is around 40 inches.
Demographics
As of the 2010 census, the population of Columbiana County was 107,841. The population density was 109 people per square mile. The racial makeup of the county was 95.3% White, 1.7% African American, 0.3% Native American, 0.5% Asian, 0.1% Pacific Islander, 0.7% from other races, and 1.4% from two or more races. Hispanic or Latino of any race were 2.2% of the population.
The median income for a household in the county was $41,945, and the median income for a family was $50,945. The per capita income for the county was $20,845. About 11.2% of families and 14.3% of the population were below the poverty line, including 19.2% of those under age 18 and 8.2% of those age 65 or over.
Economy
The economy of Columbiana County is largely based on agriculture and manufacturing. The county is home to several large farms, which produce corn, soybeans, wheat, and other crops. The county is also home to several manufacturing companies, including a steel mill, a paper mill, and a plastics plant.
The county is also home to several tourist attractions, including the Little Beaver Creek Greenway Trail, the Beaver Creek State Park, and the Beaver Creek Wildlife Education Center.
Columbiana County is also home to several colleges and universities, including Kent State University at Salem, Youngstown State University, and the University of Mount Union.
Conclusion
Columbiana County is a rural county located in the northeastern part of Ohio. It is home to a diverse population and a strong economy based on agriculture and manufacturing. The county is also home to several tourist attractions, colleges, and universities.
Common Questions
What is the Total Population of Columbiana County?
Total Population of Columbiana County is 101,723.
What is the Total Male Population of Columbiana County?
Total Male Population of Columbiana County is 51,455.
What is the Total Female Population of Columbiana County?
Total Female Population of Columbiana County is 50,268.
What is the Ratio of Males per 100 Females in Columbiana County?
There are 102.36 Males per 100 Females in Columbiana County.
What is the Ratio of Females per 100 Males in Columbiana County?
There are 97.69 Females per 100 Males in Columbiana County.
What is the Median Population Age in Columbiana County?
Median Population Age in Columbiana County is 44.5 Years.
What is the Average Family Size in Columbiana County
Average Family Size in Columbiana County is 3.0 People.
What is the Average Household Size in Columbiana County
Average Household Size in Columbiana County is 2.4 People.
What is Per Capita Income in Columbiana County?
Per Capita income in Columbiana County is $30,553.
What is the Median Family Income in Columbiana County?
Median Family Income in Columbiana County is $75,945.
What is the Median Household income in Columbiana County?
Median Household Income in Columbiana County is $55,473.
What is Income or Wage Gap in Columbiana County?
Income or Wage Gap in Columbiana County is 36.7%.
Women in Columbiana County earn 63.3 cents for every dollar earned by a man.
What is Family Income Deficit in Columbiana County?
Family Income Deficit in Columbiana County is $10,620.
Families that are below poverty line in Columbiana County earn $10,620 less on average than the poverty threshold level.
What is Inequality or Gini Index in Columbiana County?
Inequality or Gini Index in Columbiana County is 0.44.
How Large is the Labor Force in Columbiana County?
There are 48,792 People in the Labor Forcein in Columbiana County.
What is the Percentage of People in the Labor Force in Columbiana County?
58.1% of People are in the Labor Force in Columbiana County.
What is the Unemployment Rate in Columbiana County?
Unemployment Rate in Columbiana County is 4.9%.