Clermont County, OH
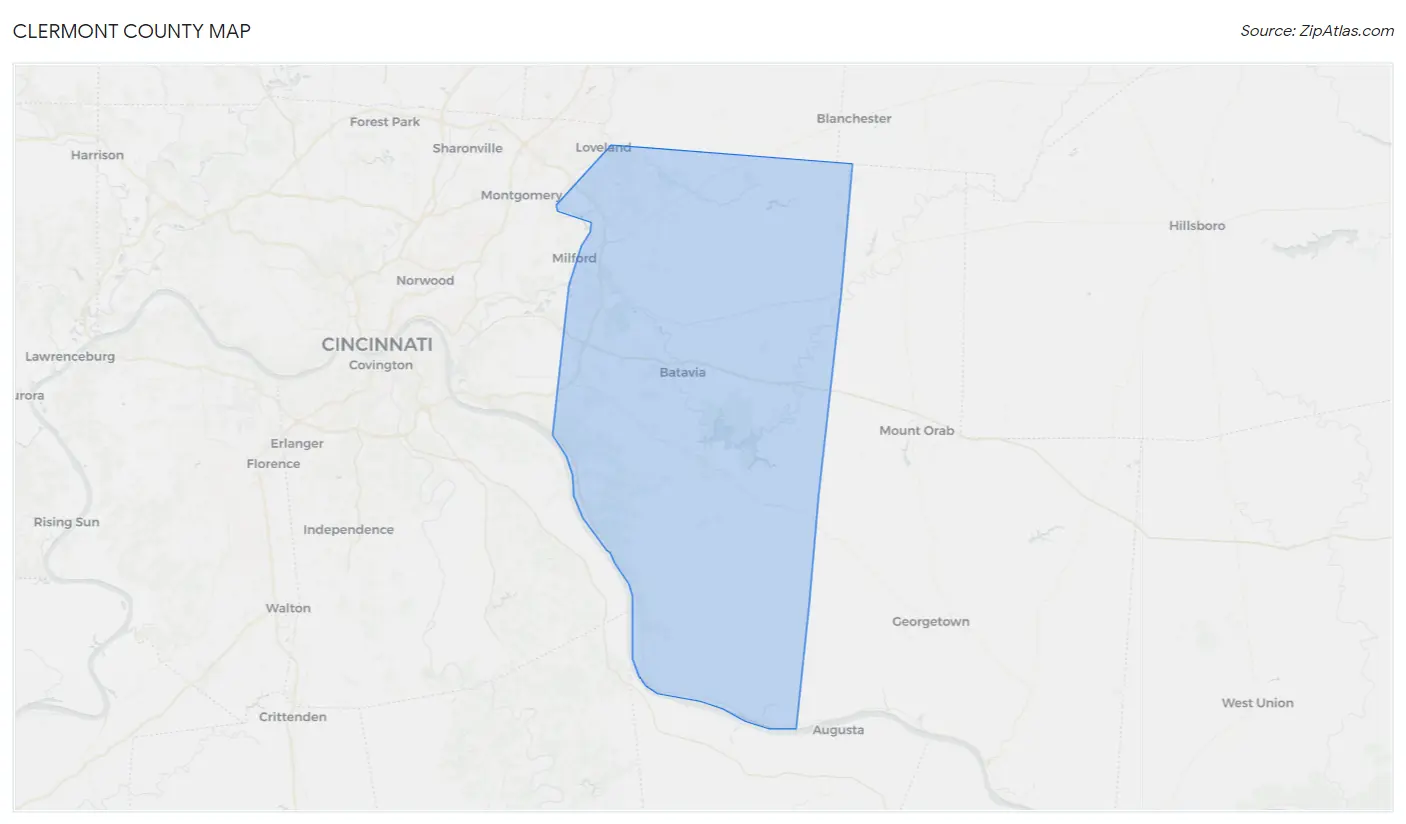
Clermont County Map
Clermont County Overview
208,851
TOTAL POPULATION
103,830
MALE POPULATION
105,021
FEMALE POPULATION
98.87
MALES / 100 FEMALES
101.15
FEMALES / 100 MALES
40.5
MEDIAN AGE
3.0
AVG FAMILY SIZE
2.5
AVG HOUSEHOLD SIZE
$41,566
PER CAPITA INCOME
$100,272
AVG FAMILY INCOME
$79,573
AVG HOUSEHOLD INCOME
28.9%
WAGE / INCOME GAP [ % ]
71.1¢/ $1
WAGE / INCOME GAP [ $ ]
$11,459
FAMILY INCOME DEFICIT
0.44
INEQUALITY / GINI INDEX
109,339
LABOR FORCE [ PEOPLE ]
65.2%
PERCENT IN LABOR FORCE
4.1%
UNEMPLOYMENT RATE
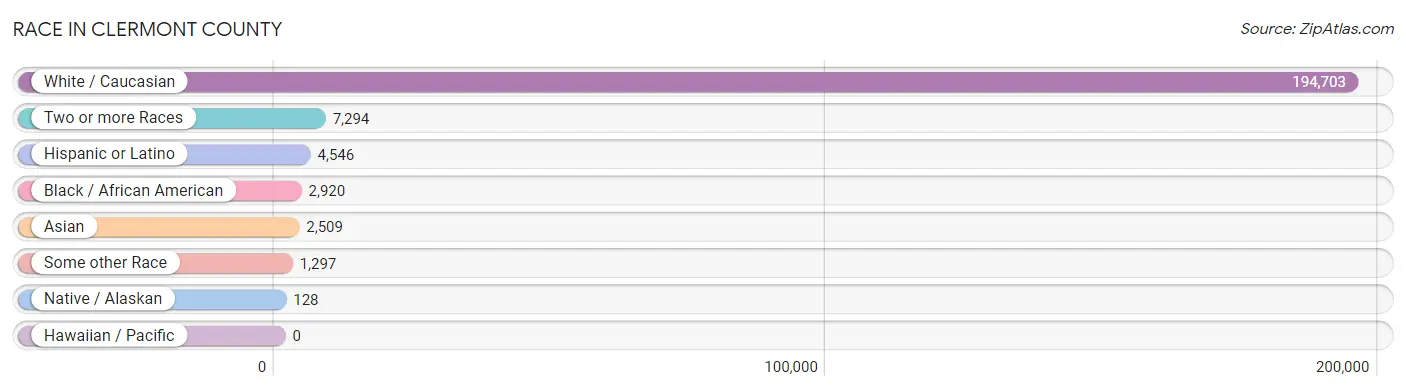
Race in Clermont County
The most populous races in Clermont County are White / Caucasian (194,703 | 93.2%), Two or more Races (7,294 | 3.5%), and Hispanic or Latino (4,546 | 2.2%).
| Race | # Population | % Population |
| Asian | 2,509 | 1.2% |
| Black / African American | 2,920 | 1.4% |
| Hawaiian / Pacific | 0 | 0.0% |
| Hispanic or Latino | 4,546 | 2.2% |
| Native / Alaskan | 128 | 0.1% |
| White / Caucasian | 194,703 | 93.2% |
| Two or more Races | 7,294 | 3.5% |
| Some other Race | 1,297 | 0.6% |
| Total | 208,851 | 100.0% |
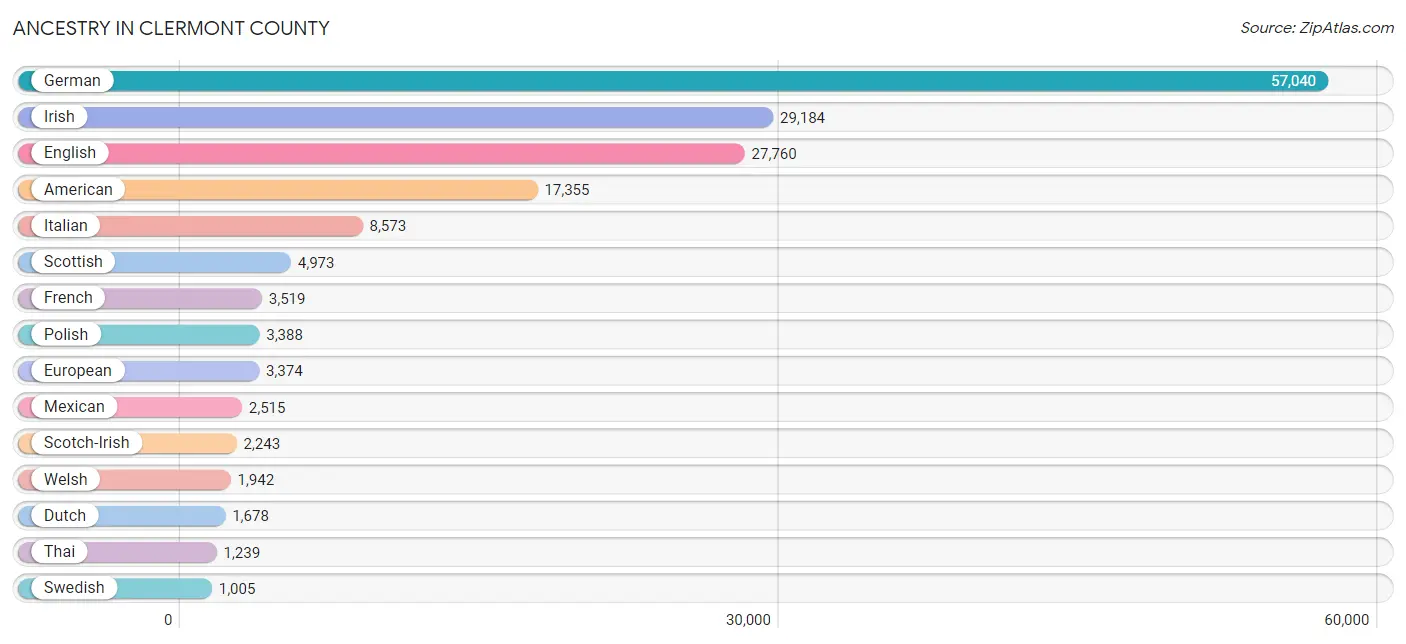
Ancestry in Clermont County
The most populous ancestries reported in Clermont County are German (57,040 | 27.3%), Irish (29,184 | 14.0%), English (27,760 | 13.3%), American (17,355 | 8.3%), and Italian (8,573 | 4.1%), together accounting for 67.0% of all Clermont County residents.
| Ancestry | # Population | % Population |
| African | 94 | 0.1% |
| American | 17,355 | 8.3% |
| Apache | 9 | 0.0% |
| Arab | 469 | 0.2% |
| Argentinean | 29 | 0.0% |
| Armenian | 13 | 0.0% |
| Australian | 15 | 0.0% |
| Austrian | 382 | 0.2% |
| Belgian | 124 | 0.1% |
| Belizean | 27 | 0.0% |
| Bhutanese | 350 | 0.2% |
| Blackfeet | 46 | 0.0% |
| Brazilian | 107 | 0.1% |
| British | 994 | 0.5% |
| Bulgarian | 55 | 0.0% |
| Burmese | 155 | 0.1% |
| Canadian | 88 | 0.0% |
| Celtic | 190 | 0.1% |
| Central American | 293 | 0.1% |
| Central American Indian | 50 | 0.0% |
| Cherokee | 555 | 0.3% |
| Chilean | 74 | 0.0% |
| Chippewa | 54 | 0.0% |
| Choctaw | 17 | 0.0% |
| Colombian | 44 | 0.0% |
| Creek | 5 | 0.0% |
| Croatian | 178 | 0.1% |
| Cuban | 219 | 0.1% |
| Czech | 406 | 0.2% |
| Czechoslovakian | 133 | 0.1% |
| Danish | 218 | 0.1% |
| Dominican | 62 | 0.0% |
| Dutch | 1,678 | 0.8% |
| Eastern European | 610 | 0.3% |
| Ecuadorian | 5 | 0.0% |
| English | 27,760 | 13.3% |
| Estonian | 23 | 0.0% |
| European | 3,374 | 1.6% |
| Finnish | 93 | 0.0% |
| French | 3,519 | 1.7% |
| French American Indian | 3 | 0.0% |
| French Canadian | 280 | 0.1% |
| German | 57,040 | 27.3% |
| Greek | 645 | 0.3% |
| Guamanian / Chamorro | 92 | 0.0% |
| Guatemalan | 86 | 0.0% |
| Haitian | 15 | 0.0% |
| Honduran | 120 | 0.1% |
| Hungarian | 910 | 0.4% |
| Icelander | 16 | 0.0% |
| Indian (Asian) | 739 | 0.4% |
| Inupiat | 1 | 0.0% |
| Iranian | 41 | 0.0% |
| Iraqi | 25 | 0.0% |
| Irish | 29,184 | 14.0% |
| Iroquois | 18 | 0.0% |
| Israeli | 12 | 0.0% |
| Italian | 8,573 | 4.1% |
| Japanese | 82 | 0.0% |
| Jordanian | 83 | 0.0% |
| Korean | 617 | 0.3% |
| Latvian | 62 | 0.0% |
| Lebanese | 169 | 0.1% |
| Lithuanian | 137 | 0.1% |
| Macedonian | 14 | 0.0% |
| Malaysian | 4 | 0.0% |
| Mexican | 2,515 | 1.2% |
| Mexican American Indian | 74 | 0.0% |
| Native Hawaiian | 57 | 0.0% |
| Navajo | 5 | 0.0% |
| Nicaraguan | 72 | 0.0% |
| Northern European | 270 | 0.1% |
| Norwegian | 842 | 0.4% |
| Pakistani | 130 | 0.1% |
| Pennsylvania German | 53 | 0.0% |
| Peruvian | 37 | 0.0% |
| Polish | 3,388 | 1.6% |
| Portuguese | 110 | 0.1% |
| Puerto Rican | 721 | 0.4% |
| Romanian | 348 | 0.2% |
| Russian | 898 | 0.4% |
| Salvadoran | 15 | 0.0% |
| Samoan | 14 | 0.0% |
| Scandinavian | 284 | 0.1% |
| Scotch-Irish | 2,243 | 1.1% |
| Scottish | 4,973 | 2.4% |
| Serbian | 178 | 0.1% |
| Sioux | 20 | 0.0% |
| Slavic | 29 | 0.0% |
| Slovak | 256 | 0.1% |
| Slovene | 100 | 0.1% |
| South American | 212 | 0.1% |
| Spaniard | 96 | 0.1% |
| Spanish | 86 | 0.0% |
| Sri Lankan | 264 | 0.1% |
| Subsaharan African | 261 | 0.1% |
| Swedish | 1,005 | 0.5% |
| Swiss | 489 | 0.2% |
| Syrian | 94 | 0.1% |
| Thai | 1,239 | 0.6% |
| Trinidadian and Tobagonian | 18 | 0.0% |
| Turkish | 116 | 0.1% |
| Ukrainian | 265 | 0.1% |
| Venezuelan | 23 | 0.0% |
| Vietnamese | 31 | 0.0% |
| Welsh | 1,942 | 0.9% |
| Yugoslavian | 42 | 0.0% | View All 107 Rows |
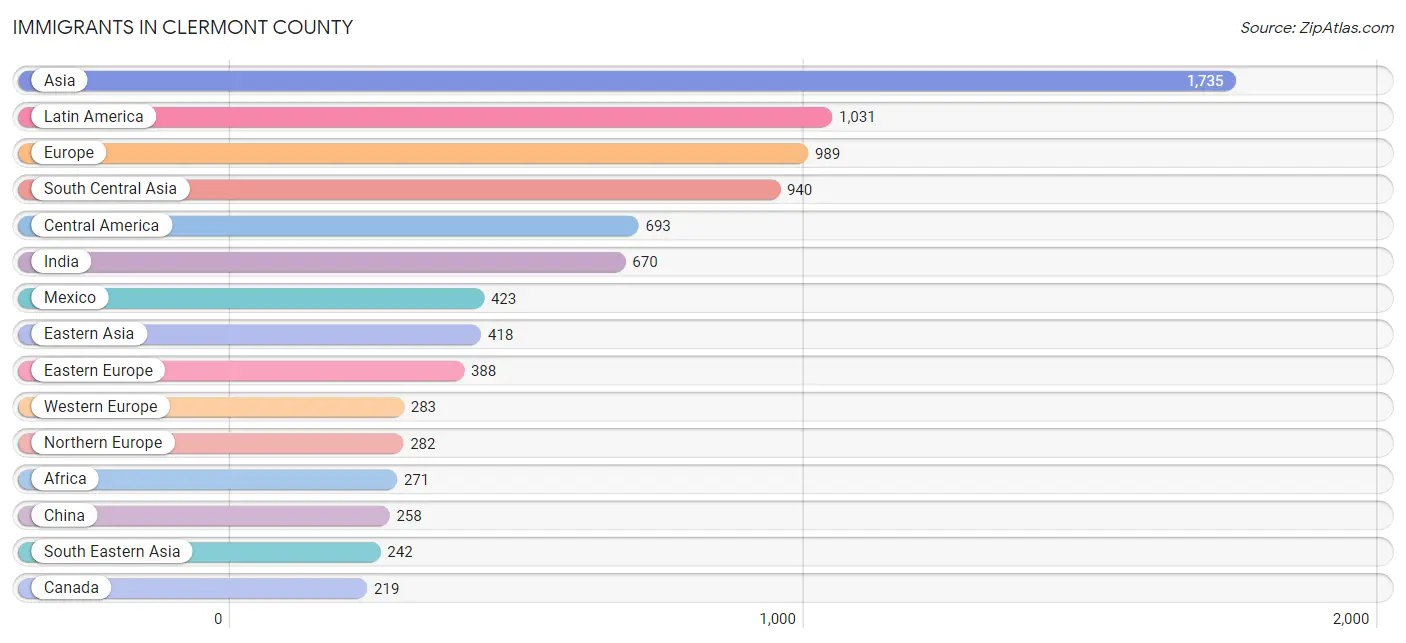
Immigrants in Clermont County
The most numerous immigrant groups reported in Clermont County came from Asia (1,735 | 0.8%), Latin America (1,031 | 0.5%), Europe (989 | 0.5%), South Central Asia (940 | 0.4%), and Central America (693 | 0.3%), together accounting for 2.6% of all Clermont County residents.
| Immigration Origin | # Population | % Population |
| Africa | 271 | 0.1% |
| Argentina | 44 | 0.0% |
| Asia | 1,735 | 0.8% |
| Australia | 29 | 0.0% |
| Bangladesh | 18 | 0.0% |
| Barbados | 19 | 0.0% |
| Belarus | 33 | 0.0% |
| Belgium | 26 | 0.0% |
| Brazil | 67 | 0.0% |
| Bulgaria | 27 | 0.0% |
| Cambodia | 21 | 0.0% |
| Canada | 219 | 0.1% |
| Caribbean | 139 | 0.1% |
| Central America | 693 | 0.3% |
| China | 258 | 0.1% |
| Colombia | 5 | 0.0% |
| Cuba | 34 | 0.0% |
| Dominican Republic | 60 | 0.0% |
| Eastern Africa | 32 | 0.0% |
| Eastern Asia | 418 | 0.2% |
| Eastern Europe | 388 | 0.2% |
| Egypt | 90 | 0.0% |
| El Salvador | 9 | 0.0% |
| England | 93 | 0.0% |
| Europe | 989 | 0.5% |
| France | 46 | 0.0% |
| Germany | 189 | 0.1% |
| Ghana | 3 | 0.0% |
| Guatemala | 127 | 0.1% |
| Honduras | 120 | 0.1% |
| Hungary | 17 | 0.0% |
| India | 670 | 0.3% |
| Iran | 25 | 0.0% |
| Ireland | 7 | 0.0% |
| Israel | 12 | 0.0% |
| Italy | 36 | 0.0% |
| Japan | 62 | 0.0% |
| Jordan | 57 | 0.0% |
| Kenya | 11 | 0.0% |
| Korea | 98 | 0.1% |
| Latin America | 1,031 | 0.5% |
| Latvia | 10 | 0.0% |
| Lebanon | 16 | 0.0% |
| Lithuania | 9 | 0.0% |
| Mexico | 423 | 0.2% |
| Morocco | 14 | 0.0% |
| Nepal | 22 | 0.0% |
| Netherlands | 18 | 0.0% |
| Nicaragua | 14 | 0.0% |
| Nigeria | 34 | 0.0% |
| Northern Africa | 104 | 0.1% |
| Northern Europe | 282 | 0.1% |
| Oceania | 35 | 0.0% |
| Pakistan | 85 | 0.0% |
| Peru | 37 | 0.0% |
| Philippines | 83 | 0.0% |
| Poland | 79 | 0.0% |
| Romania | 20 | 0.0% |
| Russia | 108 | 0.1% |
| Scotland | 13 | 0.0% |
| South America | 199 | 0.1% |
| South Central Asia | 940 | 0.4% |
| South Eastern Asia | 242 | 0.1% |
| Southern Europe | 36 | 0.0% |
| Switzerland | 4 | 0.0% |
| Taiwan | 24 | 0.0% |
| Thailand | 49 | 0.0% |
| Trinidad and Tobago | 26 | 0.0% |
| Turkey | 50 | 0.0% |
| Ukraine | 58 | 0.0% |
| Uzbekistan | 94 | 0.1% |
| Venezuela | 46 | 0.0% |
| Vietnam | 89 | 0.0% |
| Western Africa | 135 | 0.1% |
| Western Asia | 135 | 0.1% |
| Western Europe | 283 | 0.1% | View All 76 Rows |
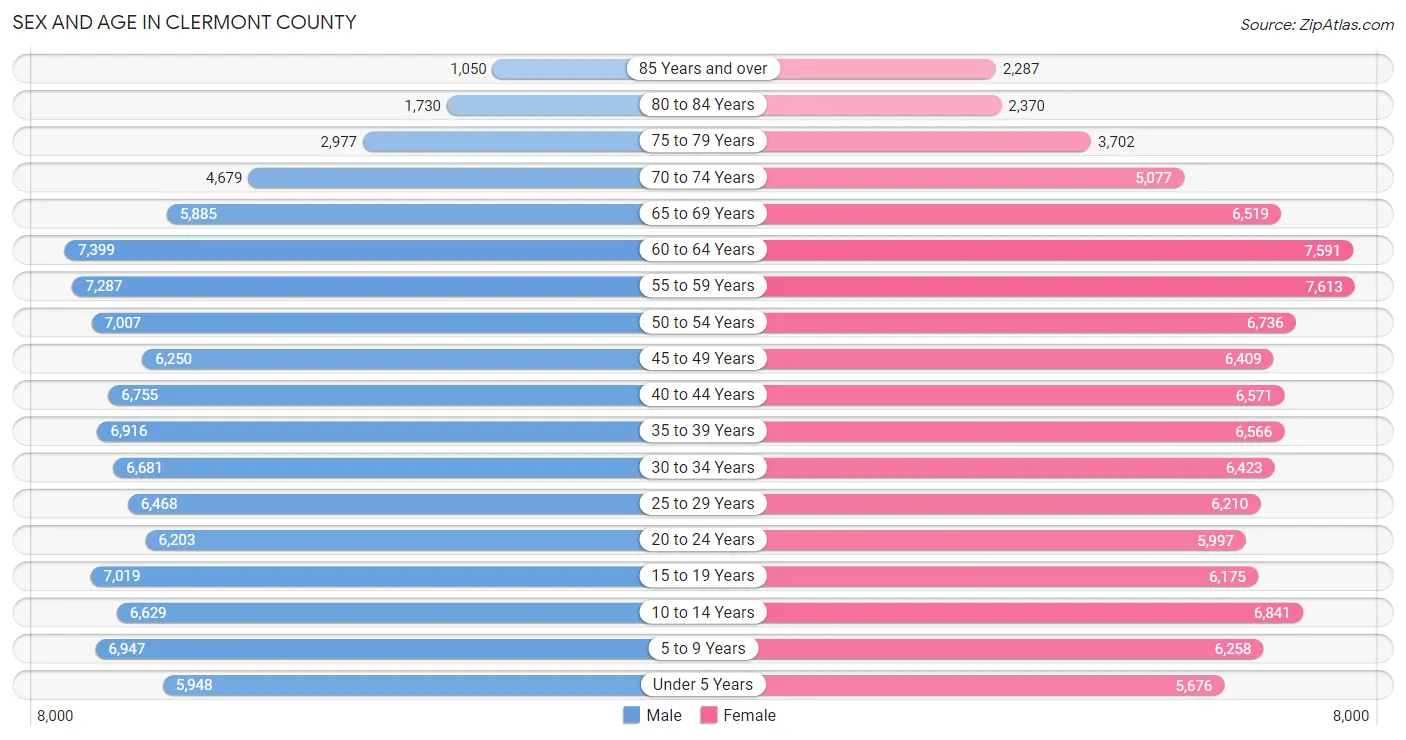
Sex and Age in Clermont County
Sex and Age in Clermont County
The most populous age groups in Clermont County are 60 to 64 Years (7,399 | 7.1%) for men and 55 to 59 Years (7,613 | 7.2%) for women.
| Age Bracket | Male | Female |
| Under 5 Years | 5,948 (5.7%) | 5,676 (5.4%) |
| 5 to 9 Years | 6,947 (6.7%) | 6,258 (6.0%) |
| 10 to 14 Years | 6,629 (6.4%) | 6,841 (6.5%) |
| 15 to 19 Years | 7,019 (6.8%) | 6,175 (5.9%) |
| 20 to 24 Years | 6,203 (6.0%) | 5,997 (5.7%) |
| 25 to 29 Years | 6,468 (6.2%) | 6,210 (5.9%) |
| 30 to 34 Years | 6,681 (6.4%) | 6,423 (6.1%) |
| 35 to 39 Years | 6,916 (6.7%) | 6,566 (6.2%) |
| 40 to 44 Years | 6,755 (6.5%) | 6,571 (6.3%) |
| 45 to 49 Years | 6,250 (6.0%) | 6,409 (6.1%) |
| 50 to 54 Years | 7,007 (6.8%) | 6,736 (6.4%) |
| 55 to 59 Years | 7,287 (7.0%) | 7,613 (7.2%) |
| 60 to 64 Years | 7,399 (7.1%) | 7,591 (7.2%) |
| 65 to 69 Years | 5,885 (5.7%) | 6,519 (6.2%) |
| 70 to 74 Years | 4,679 (4.5%) | 5,077 (4.8%) |
| 75 to 79 Years | 2,977 (2.9%) | 3,702 (3.5%) |
| 80 to 84 Years | 1,730 (1.7%) | 2,370 (2.3%) |
| 85 Years and over | 1,050 (1.0%) | 2,287 (2.2%) |
| Total | 103,830 (100.0%) | 105,021 (100.0%) |
Families and Households in Clermont County
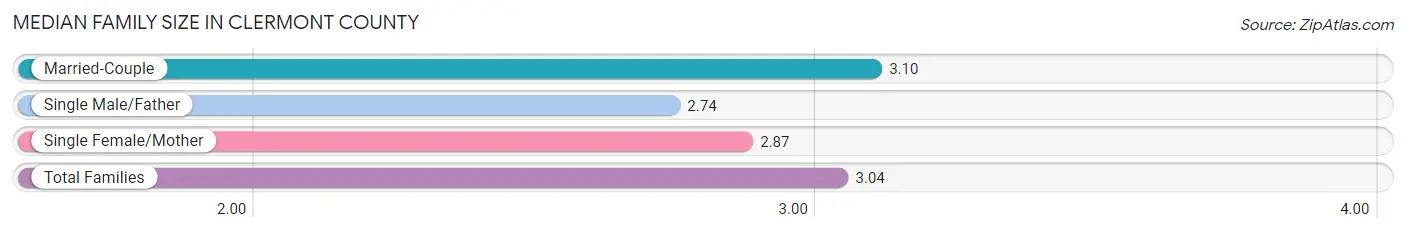
Median Family Size in Clermont County
The median family size in Clermont County is 3.04 persons per family, with married-couple families (42,887 | 77.5%) accounting for the largest median family size of 3.1 persons per family. On the other hand, single male/father families (4,045 | 7.3%) represent the smallest median family size with 2.74 persons per family.
| Family Type | # Families | Family Size |
| Married-Couple | 42,887 (77.5%) | 3.10 |
| Single Male/Father | 4,045 (7.3%) | 2.74 |
| Single Female/Mother | 8,427 (15.2%) | 2.87 |
| Total Families | 55,359 (100.0%) | 3.04 |
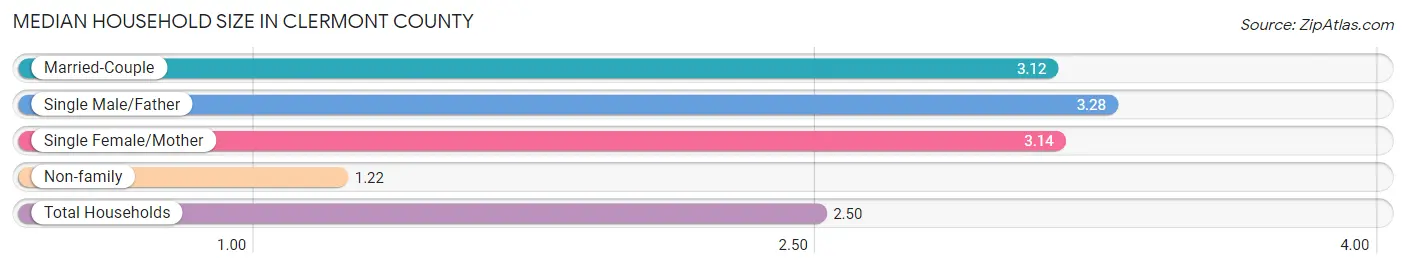
Median Household Size in Clermont County
The median household size in Clermont County is 2.50 persons per household, with single male/father households (4,045 | 4.9%) accounting for the largest median household size of 3.28 persons per household. non-family households (27,353 | 33.1%) represent the smallest median household size with 1.22 persons per household.
| Household Type | # Households | Household Size |
| Married-Couple | 42,887 (51.8%) | 3.12 |
| Single Male/Father | 4,045 (4.9%) | 3.28 |
| Single Female/Mother | 8,427 (10.2%) | 3.14 |
| Non-family | 27,353 (33.1%) | 1.22 |
| Total Households | 82,712 (100.0%) | 2.50 |
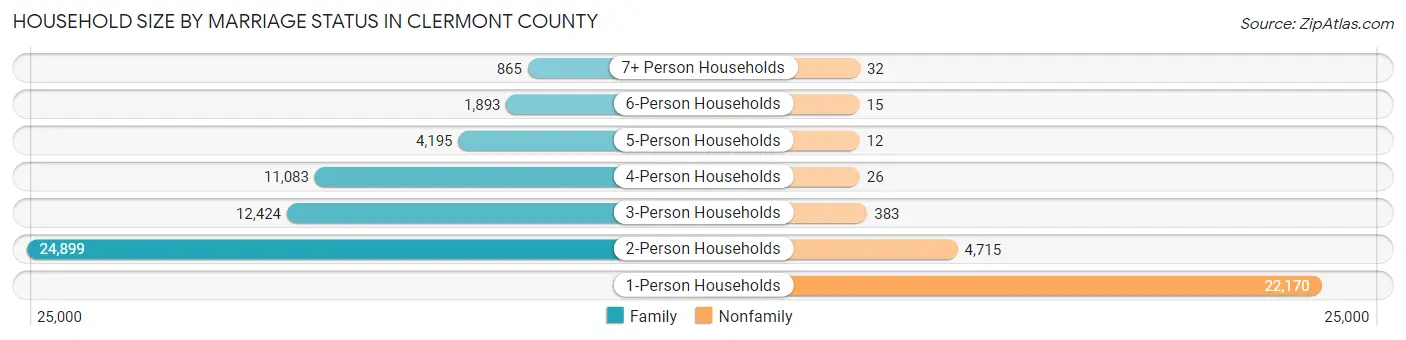
Household Size by Marriage Status in Clermont County
Out of a total of 82,712 households in Clermont County, 55,359 (66.9%) are family households, while 27,353 (33.1%) are nonfamily households. The most numerous type of family households are 2-person households, comprising 24,899, and the most common type of nonfamily households are 1-person households, comprising 22,170.
| Household Size | Family Households | Nonfamily Households |
| 1-Person Households | - | 22,170 (26.8%) |
| 2-Person Households | 24,899 (30.1%) | 4,715 (5.7%) |
| 3-Person Households | 12,424 (15.0%) | 383 (0.5%) |
| 4-Person Households | 11,083 (13.4%) | 26 (0.0%) |
| 5-Person Households | 4,195 (5.1%) | 12 (0.0%) |
| 6-Person Households | 1,893 (2.3%) | 15 (0.0%) |
| 7+ Person Households | 865 (1.1%) | 32 (0.0%) |
| Total | 55,359 (66.9%) | 27,353 (33.1%) |
Female Fertility in Clermont County
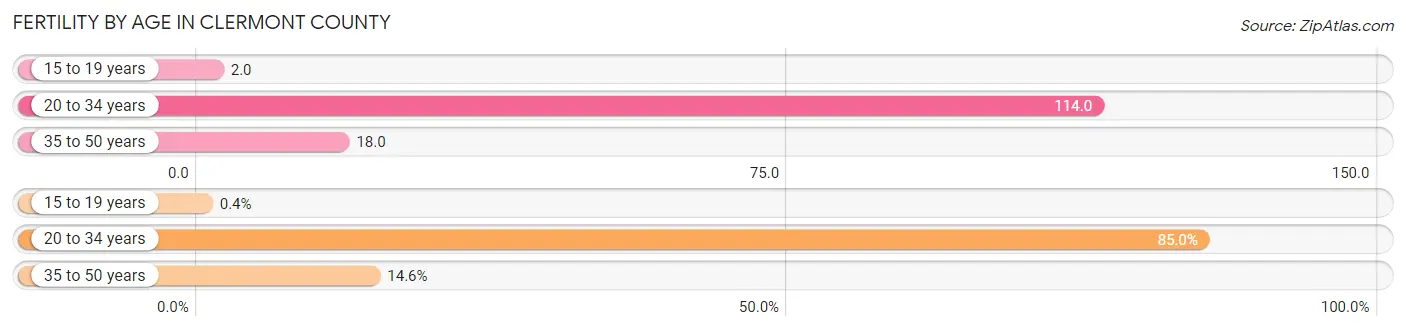
Fertility by Age in Clermont County
Average fertility rate in Clermont County is 55.0 births per 1,000 women. Women in the age bracket of 20 to 34 years have the highest fertility rate with 114.0 births per 1,000 women. Women in the age bracket of 20 to 34 years acount for 85.0% of all women with births.
| Age Bracket | Women with Births | Births / 1,000 Women |
| 15 to 19 years | 10 (0.4%) | 2.0 |
| 20 to 34 years | 2,121 (85.0%) | 114.0 |
| 35 to 50 years | 365 (14.6%) | 18.0 |
| Total | 2,496 (100.0%) | 55.0 |
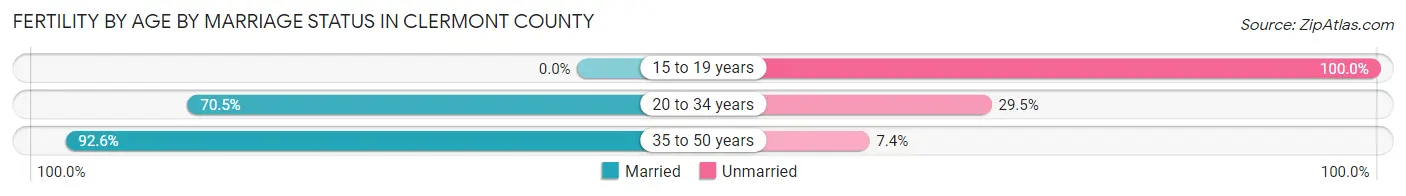
Fertility by Age by Marriage Status in Clermont County
73.4% of women with births (2,496) in Clermont County are married. The highest percentage of unmarried women with births falls into 15 to 19 years age bracket with 100.0% of them unmarried at the time of birth, while the lowest percentage of unmarried women with births belong to 35 to 50 years age bracket with 7.4% of them unmarried.
| Age Bracket | Married | Unmarried |
| 15 to 19 years | 0 (0.0%) | 10 (100.0%) |
| 20 to 34 years | 1,495 (70.5%) | 626 (29.5%) |
| 35 to 50 years | 338 (92.6%) | 27 (7.4%) |
| Total | 1,832 (73.4%) | 664 (26.6%) |
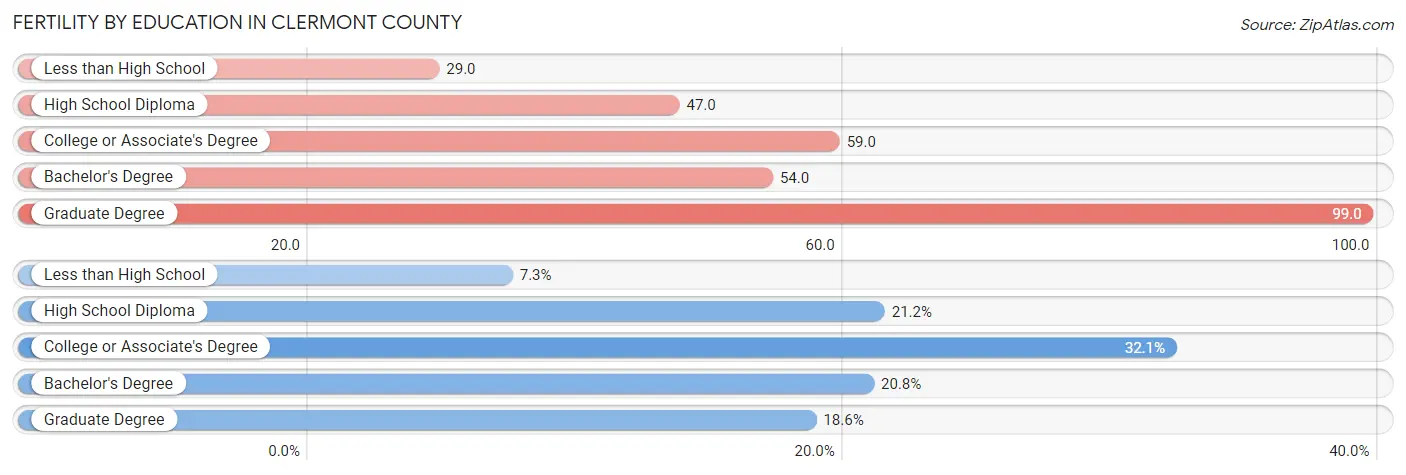
Fertility by Education in Clermont County
Average fertility rate in Clermont County is 55.0 births per 1,000 women. Women with the education attainment of graduate degree have the highest fertility rate of 99.0 births per 1,000 women, while women with the education attainment of less than high school have the lowest fertility at 29.0 births per 1,000 women. Women with the education attainment of college or associate's degree represent 32.1% of all women with births.
| Educational Attainment | Women with Births | Births / 1,000 Women |
| Less than High School | 181 (7.2%) | 29.0 |
| High School Diploma | 529 (21.2%) | 47.0 |
| College or Associate's Degree | 802 (32.1%) | 59.0 |
| Bachelor's Degree | 519 (20.8%) | 54.0 |
| Graduate Degree | 465 (18.6%) | 99.0 |
| Total | 2,496 (100.0%) | 55.0 |
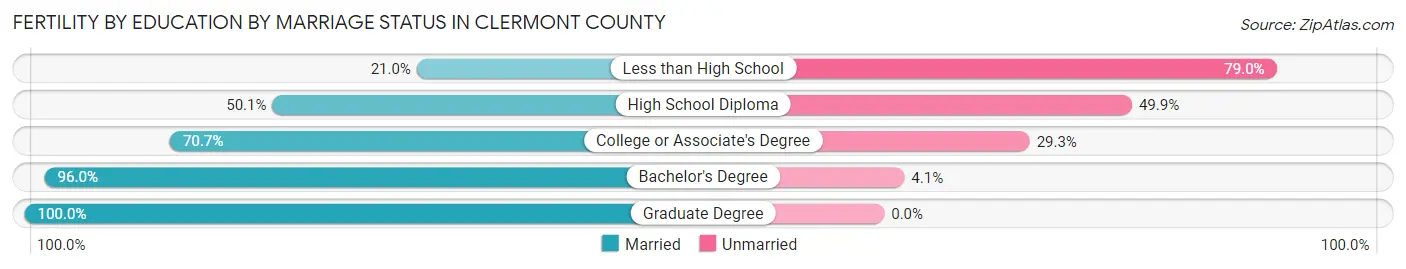
Fertility by Education by Marriage Status in Clermont County
26.6% of women with births in Clermont County are unmarried. Women with the educational attainment of graduate degree are most likely to be married with 100.0% of them married at childbirth, while women with the educational attainment of less than high school are least likely to be married with 79.0% of them unmarried at childbirth.
| Educational Attainment | Married | Unmarried |
| Less than High School | 38 (21.0%) | 143 (79.0%) |
| High School Diploma | 265 (50.1%) | 264 (49.9%) |
| College or Associate's Degree | 567 (70.7%) | 235 (29.3%) |
| Bachelor's Degree | 498 (96.0%) | 21 (4.1%) |
| Graduate Degree | 465 (100.0%) | 0 (0.0%) |
| Total | 1,832 (73.4%) | 664 (26.6%) |
Income in Clermont County
Income Overview in Clermont County
Per Capita Income in Clermont County is $41,566, while median incomes of families and households are $100,272 and $79,573 respectively.
| Characteristic | Number | Measure |
| Per Capita Income | 208,851 | $41,566 |
| Median Family Income | 55,359 | $100,272 |
| Mean Family Income | 55,359 | $122,894 |
| Median Household Income | 82,712 | $79,573 |
| Mean Household Income | 82,712 | $102,783 |
| Income Deficit | 55,359 | $11,459 |
| Wage / Income Gap (%) | 208,851 | 28.88% |
| Wage / Income Gap ($) | 208,851 | 71.12¢ per $1 |
| Gini / Inequality Index | 208,851 | 0.44 |
Earnings by Sex in Clermont County
Average Earnings in Clermont County are $45,331, $52,235 for men and $37,151 for women, a difference of 28.9%.
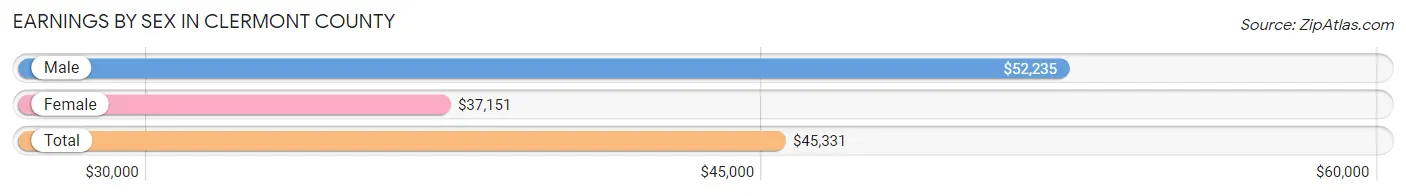
| Sex | Number | Average Earnings |
| Male | 61,014 (53.4%) | $52,235 |
| Female | 53,196 (46.6%) | $37,151 |
| Total | 114,210 (100.0%) | $45,331 |
Earnings by Sex by Income Bracket in Clermont County
The most common earnings brackets in Clermont County are $100,000+ for men (11,914 | 19.5%) and $100,000+ for women (4,941 | 9.3%).
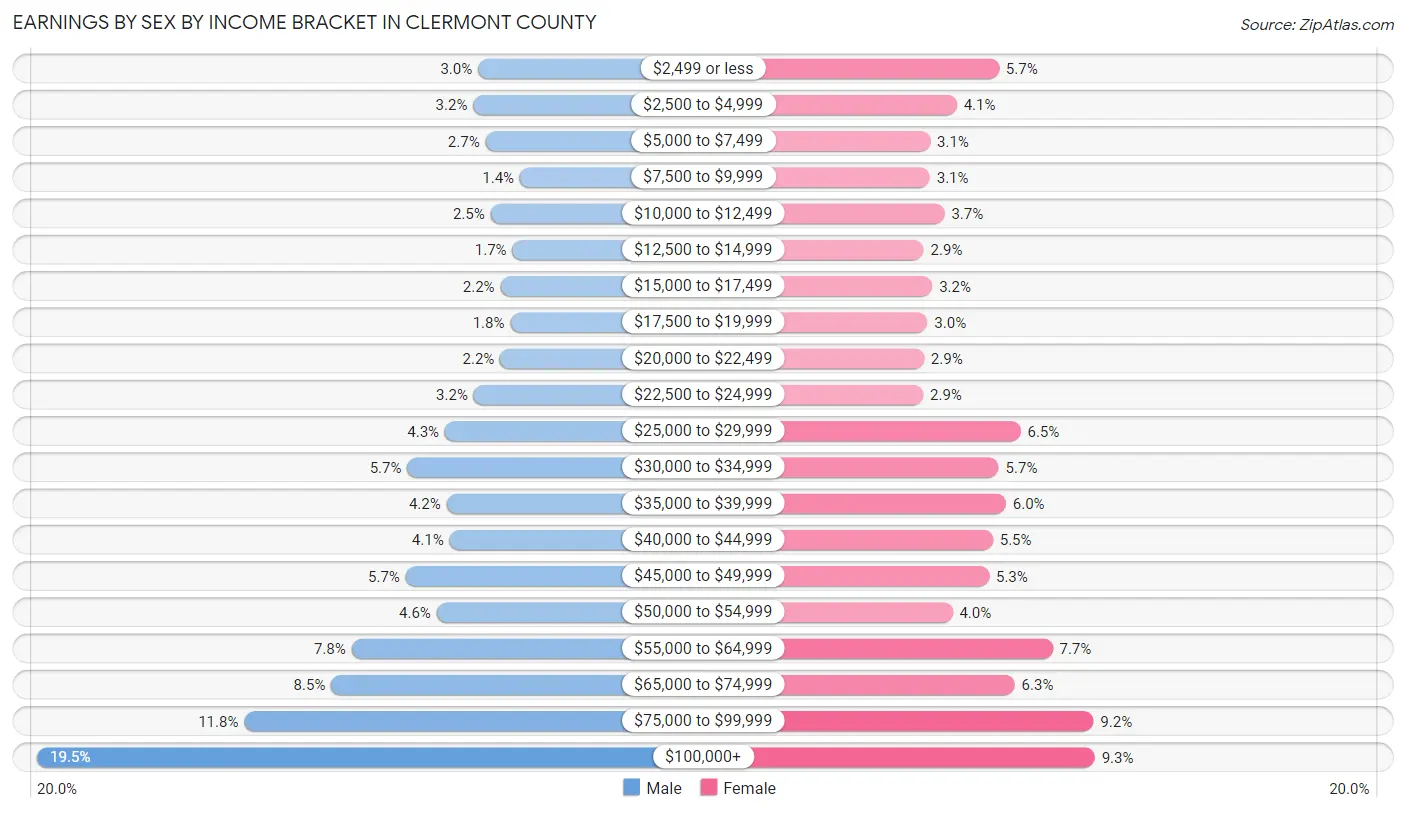
| Income | Male | Female |
| $2,499 or less | 1,837 (3.0%) | 3,031 (5.7%) |
| $2,500 to $4,999 | 1,948 (3.2%) | 2,191 (4.1%) |
| $5,000 to $7,499 | 1,667 (2.7%) | 1,658 (3.1%) |
| $7,500 to $9,999 | 876 (1.4%) | 1,654 (3.1%) |
| $10,000 to $12,499 | 1,552 (2.5%) | 1,949 (3.7%) |
| $12,500 to $14,999 | 1,047 (1.7%) | 1,532 (2.9%) |
| $15,000 to $17,499 | 1,327 (2.2%) | 1,700 (3.2%) |
| $17,500 to $19,999 | 1,101 (1.8%) | 1,607 (3.0%) |
| $20,000 to $22,499 | 1,333 (2.2%) | 1,538 (2.9%) |
| $22,500 to $24,999 | 1,937 (3.2%) | 1,523 (2.9%) |
| $25,000 to $29,999 | 2,596 (4.3%) | 3,463 (6.5%) |
| $30,000 to $34,999 | 3,454 (5.7%) | 3,027 (5.7%) |
| $35,000 to $39,999 | 2,554 (4.2%) | 3,171 (6.0%) |
| $40,000 to $44,999 | 2,489 (4.1%) | 2,908 (5.5%) |
| $45,000 to $49,999 | 3,491 (5.7%) | 2,834 (5.3%) |
| $50,000 to $54,999 | 2,785 (4.6%) | 2,108 (4.0%) |
| $55,000 to $64,999 | 4,729 (7.7%) | 4,101 (7.7%) |
| $65,000 to $74,999 | 5,194 (8.5%) | 3,344 (6.3%) |
| $75,000 to $99,999 | 7,183 (11.8%) | 4,916 (9.2%) |
| $100,000+ | 11,914 (19.5%) | 4,941 (9.3%) |
| Total | 61,014 (100.0%) | 53,196 (100.0%) |
Earnings by Sex by Educational Attainment in Clermont County
Average earnings in Clermont County are $59,660 for men and $44,035 for women, a difference of 26.2%. Men with an educational attainment of graduate degree enjoy the highest average annual earnings of $107,123, while those with less than high school education earn the least with $40,068. Women with an educational attainment of graduate degree earn the most with the average annual earnings of $71,659, while those with less than high school education have the smallest earnings of $28,756.
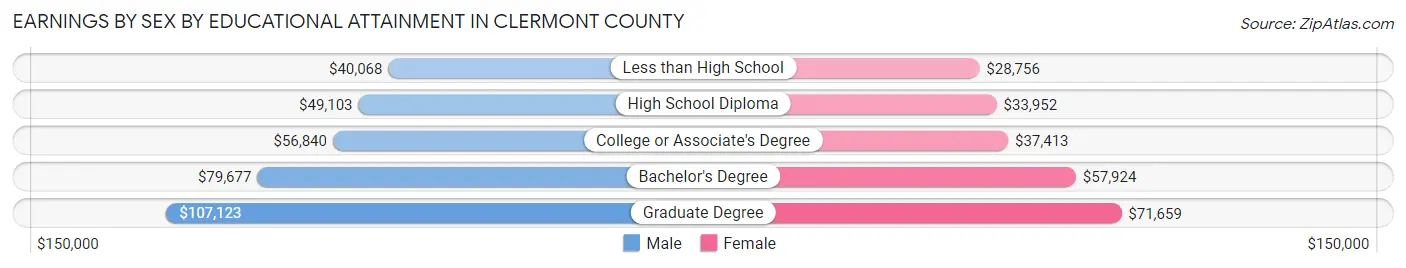
| Educational Attainment | Male Income | Female Income |
| Less than High School | $40,068 | $28,756 |
| High School Diploma | $49,103 | $33,952 |
| College or Associate's Degree | $56,840 | $37,413 |
| Bachelor's Degree | $79,677 | $57,924 |
| Graduate Degree | $107,123 | $71,659 |
| Total | $59,660 | $44,035 |
Family Income in Clermont County
Family Income Brackets in Clermont County
According to the Clermont County family income data, there are 12,899 families falling into the $100,000 to $149,999 income range, which is the most common income bracket and makes up 23.3% of all families. Conversely, the $10,000 to $14,999 income bracket is the least frequent group with only 830 families (1.5%) belonging to this category.
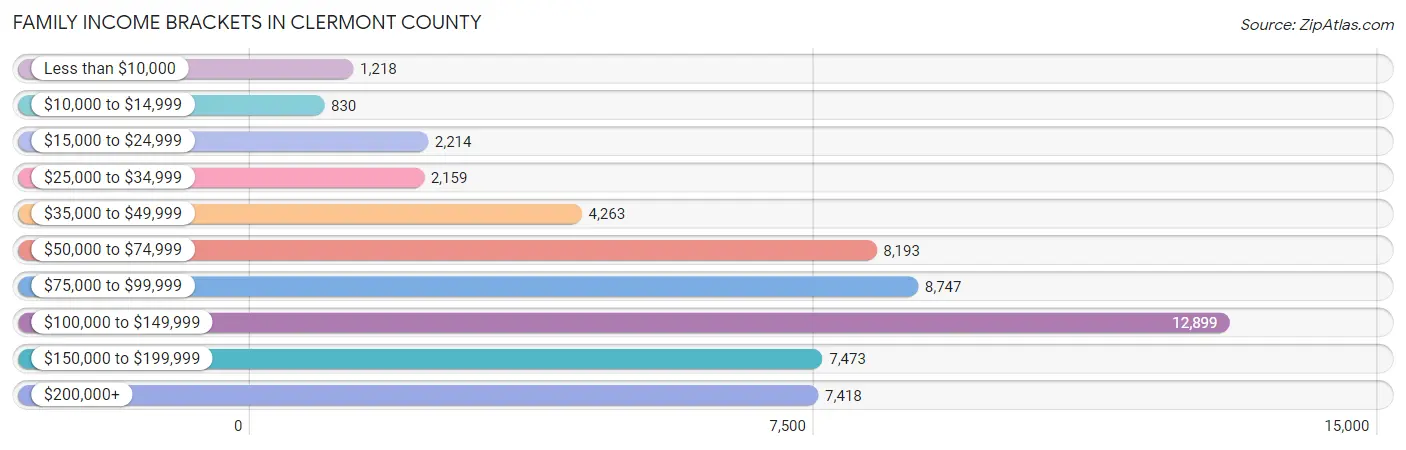
| Income Bracket | # Families | % Families |
| Less than $10,000 | 1,218 | 2.2% |
| $10,000 to $14,999 | 830 | 1.5% |
| $15,000 to $24,999 | 2,214 | 4.0% |
| $25,000 to $34,999 | 2,159 | 3.9% |
| $35,000 to $49,999 | 4,263 | 7.7% |
| $50,000 to $74,999 | 8,193 | 14.8% |
| $75,000 to $99,999 | 8,747 | 15.8% |
| $100,000 to $149,999 | 12,899 | 23.3% |
| $150,000 to $199,999 | 7,473 | 13.5% |
| $200,000+ | 7,418 | 13.4% |
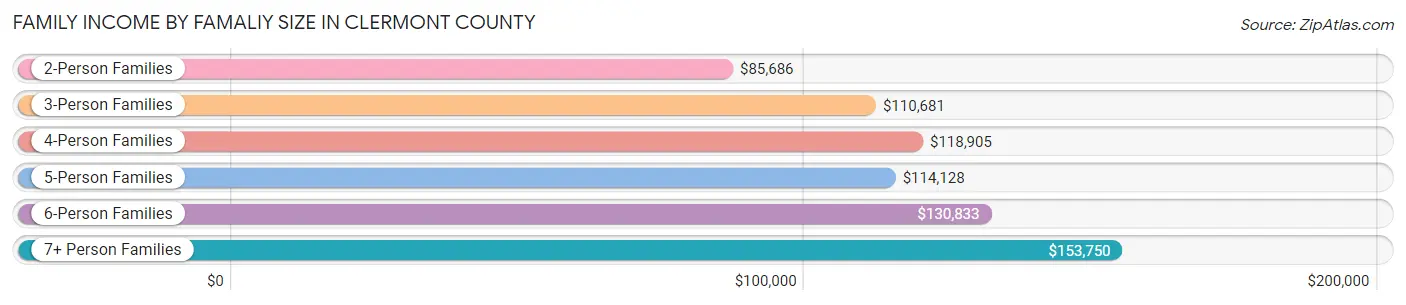
Family Income by Famaliy Size in Clermont County
7+ person families (638 | 1.1%) account for the highest median family income in Clermont County with $153,750 per family, while 2-person families (26,825 | 48.5%) have the highest median income of $42,843 per family member.
| Income Bracket | # Families | Median Income |
| 2-Person Families | 26,825 (48.5%) | $85,686 |
| 3-Person Families | 11,795 (21.3%) | $110,681 |
| 4-Person Families | 10,381 (18.8%) | $118,905 |
| 5-Person Families | 4,162 (7.5%) | $114,128 |
| 6-Person Families | 1,558 (2.8%) | $130,833 |
| 7+ Person Families | 638 (1.1%) | $153,750 |
| Total | 55,359 (100.0%) | $100,272 |
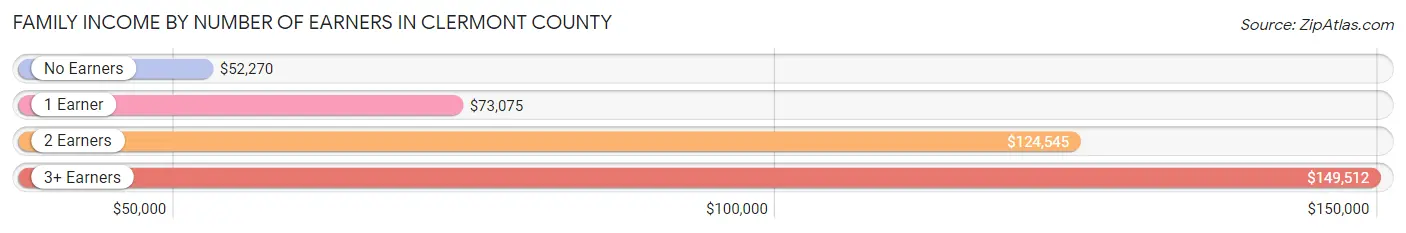
Family Income by Number of Earners in Clermont County
The median family income in Clermont County is $100,272, with families comprising 3+ earners (6,911) having the highest median family income of $149,512, while families with no earners (7,831) have the lowest median family income of $52,270, accounting for 12.5% and 14.1% of families, respectively.
| Number of Earners | # Families | Median Income |
| No Earners | 7,831 (14.1%) | $52,270 |
| 1 Earner | 16,766 (30.3%) | $73,075 |
| 2 Earners | 23,851 (43.1%) | $124,545 |
| 3+ Earners | 6,911 (12.5%) | $149,512 |
| Total | 55,359 (100.0%) | $100,272 |
Household Income in Clermont County
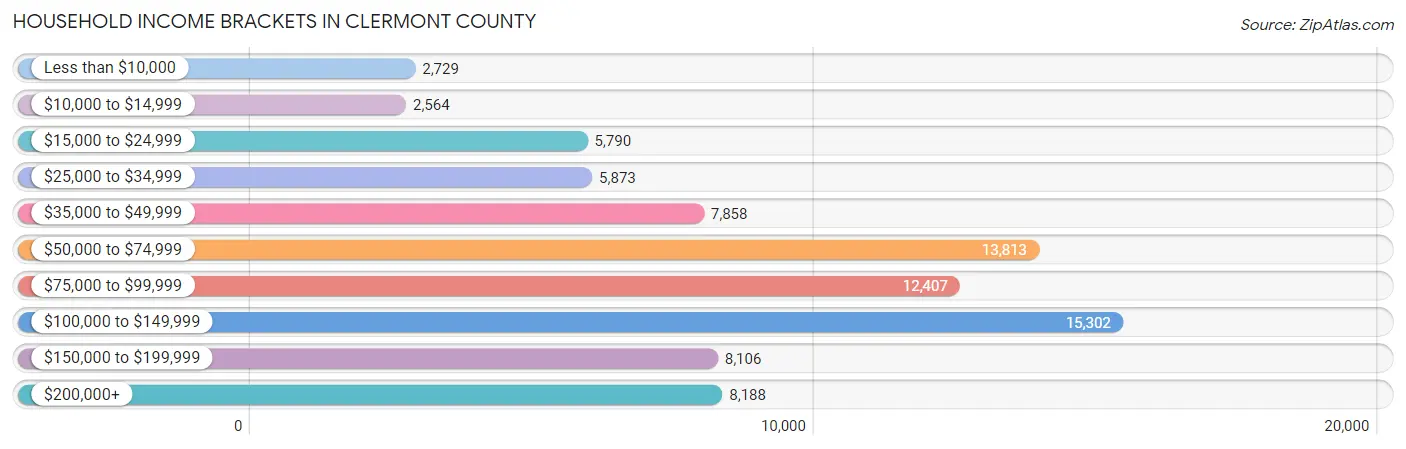
Household Income Brackets in Clermont County
With 15,302 households falling in the category, the $100,000 to $149,999 income range is the most frequent in Clermont County, accounting for 18.5% of all households. In contrast, only 2,564 households (3.1%) fall into the $10,000 to $14,999 income bracket, making it the least populous group.
| Income Bracket | # Households | % Households |
| Less than $10,000 | 2,729 | 3.3% |
| $10,000 to $14,999 | 2,564 | 3.1% |
| $15,000 to $24,999 | 5,790 | 7.0% |
| $25,000 to $34,999 | 5,873 | 7.1% |
| $35,000 to $49,999 | 7,858 | 9.5% |
| $50,000 to $74,999 | 13,813 | 16.7% |
| $75,000 to $99,999 | 12,407 | 15.0% |
| $100,000 to $149,999 | 15,302 | 18.5% |
| $150,000 to $199,999 | 8,106 | 9.8% |
| $200,000+ | 8,188 | 9.9% |
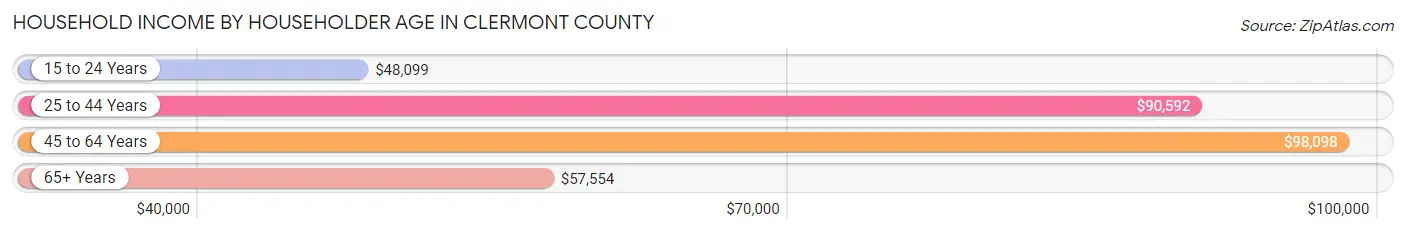
Household Income by Householder Age in Clermont County
The median household income in Clermont County is $79,573, with the highest median household income of $98,098 found in the 45 to 64 years age bracket for the primary householder. A total of 31,382 households (37.9%) fall into this category. Meanwhile, the 15 to 24 years age bracket for the primary householder has the lowest median household income of $48,099, with 2,835 households (3.4%) in this group.
| Income Bracket | # Households | Median Income |
| 15 to 24 Years | 2,835 (3.4%) | $48,099 |
| 25 to 44 Years | 25,220 (30.5%) | $90,592 |
| 45 to 64 Years | 31,382 (37.9%) | $98,098 |
| 65+ Years | 23,275 (28.1%) | $57,554 |
| Total | 82,712 (100.0%) | $79,573 |
Poverty in Clermont County
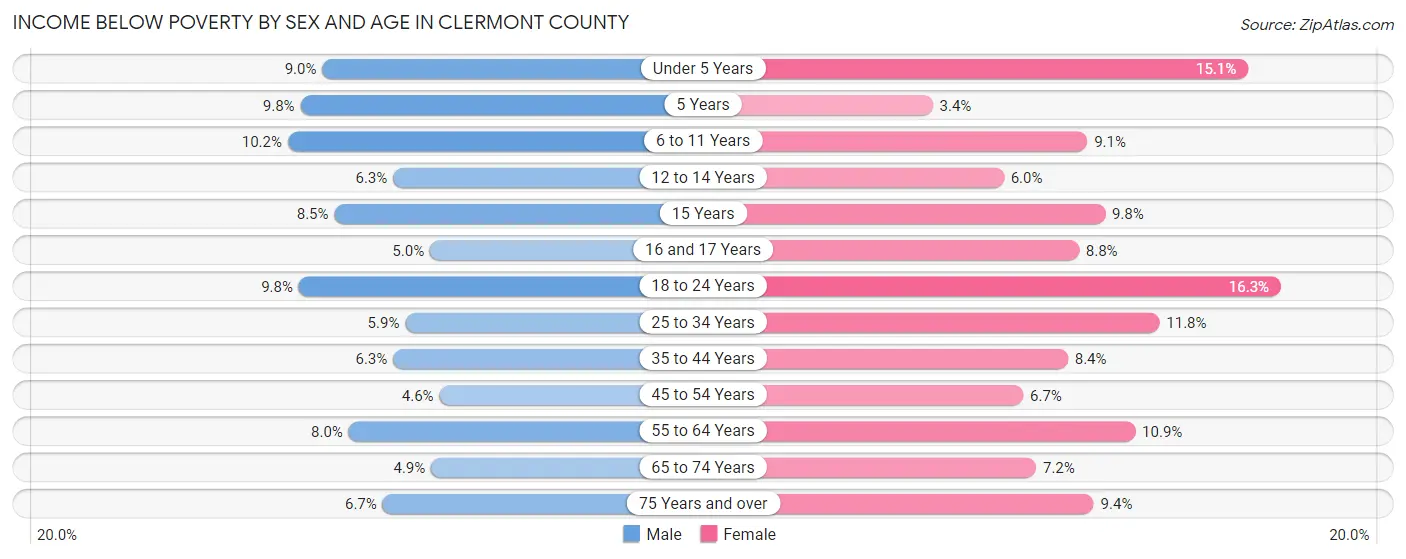
Income Below Poverty by Sex and Age in Clermont County
With 6.9% poverty level for males and 9.8% for females among the residents of Clermont County, 6 to 11 year old males and 18 to 24 year old females are the most vulnerable to poverty, with 797 males (10.2%) and 1,322 females (16.3%) in their respective age groups living below the poverty level.
| Age Bracket | Male | Female |
| Under 5 Years | 521 (8.9%) | 820 (15.1%) |
| 5 Years | 155 (9.8%) | 36 (3.4%) |
| 6 to 11 Years | 797 (10.2%) | 706 (9.1%) |
| 12 to 14 Years | 251 (6.3%) | 241 (6.0%) |
| 15 Years | 126 (8.5%) | 134 (9.8%) |
| 16 and 17 Years | 153 (5.0%) | 237 (8.8%) |
| 18 to 24 Years | 844 (9.8%) | 1,322 (16.3%) |
| 25 to 34 Years | 766 (5.9%) | 1,487 (11.8%) |
| 35 to 44 Years | 860 (6.3%) | 1,101 (8.4%) |
| 45 to 54 Years | 608 (4.6%) | 882 (6.7%) |
| 55 to 64 Years | 1,162 (8.0%) | 1,650 (10.9%) |
| 65 to 74 Years | 515 (4.9%) | 826 (7.2%) |
| 75 Years and over | 381 (6.7%) | 728 (9.3%) |
| Total | 7,139 (6.9%) | 10,170 (9.8%) |
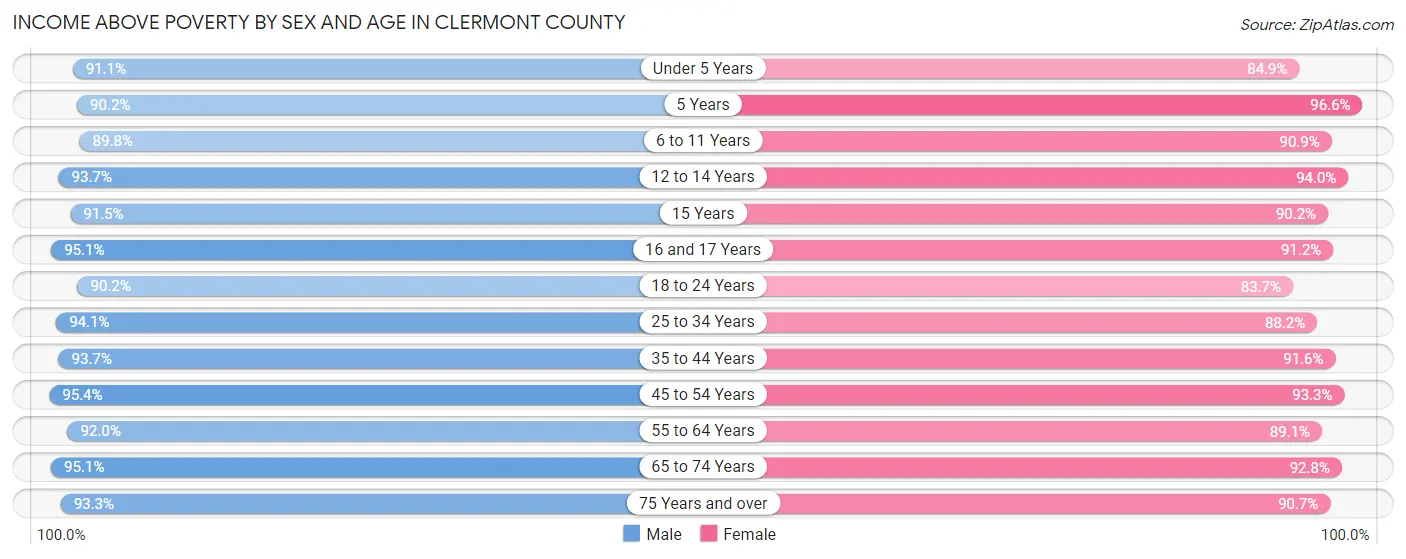
Income Above Poverty by Sex and Age in Clermont County
According to the poverty statistics in Clermont County, males aged 45 to 54 years and females aged 5 years are the age groups that are most secure financially, with 95.4% of males and 96.6% of females in these age groups living above the poverty line.
| Age Bracket | Male | Female |
| Under 5 Years | 5,302 (91.0%) | 4,618 (84.9%) |
| 5 Years | 1,433 (90.2%) | 1,031 (96.6%) |
| 6 to 11 Years | 6,995 (89.8%) | 7,041 (90.9%) |
| 12 to 14 Years | 3,723 (93.7%) | 3,772 (94.0%) |
| 15 Years | 1,356 (91.5%) | 1,238 (90.2%) |
| 16 and 17 Years | 2,940 (95.1%) | 2,455 (91.2%) |
| 18 to 24 Years | 7,753 (90.2%) | 6,786 (83.7%) |
| 25 to 34 Years | 12,282 (94.1%) | 11,124 (88.2%) |
| 35 to 44 Years | 12,758 (93.7%) | 12,017 (91.6%) |
| 45 to 54 Years | 12,623 (95.4%) | 12,220 (93.3%) |
| 55 to 64 Years | 13,418 (92.0%) | 13,504 (89.1%) |
| 65 to 74 Years | 9,965 (95.1%) | 10,632 (92.8%) |
| 75 Years and over | 5,297 (93.3%) | 7,061 (90.6%) |
| Total | 95,845 (93.1%) | 93,499 (90.2%) |
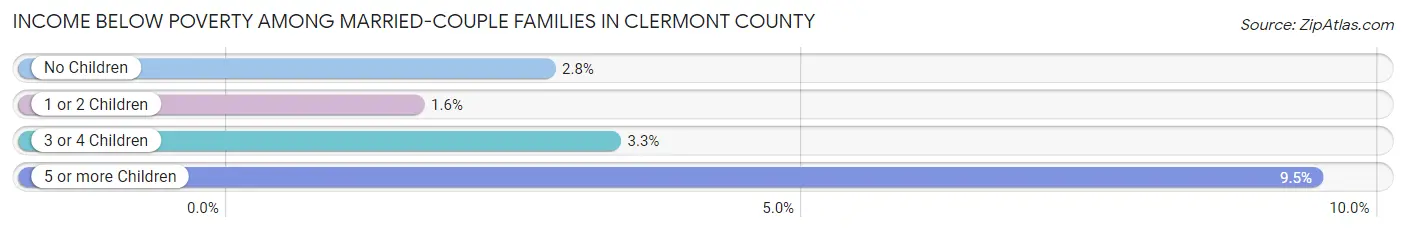
Income Below Poverty Among Married-Couple Families in Clermont County
The poverty statistics for married-couple families in Clermont County show that 2.5% or 1,062 of the total 42,887 families live below the poverty line. Families with 5 or more children have the highest poverty rate of 9.5%, comprising of 19 families. On the other hand, families with 1 or 2 children have the lowest poverty rate of 1.6%, which includes 223 families.
| Children | Above Poverty | Below Poverty |
| No Children | 24,526 (97.2%) | 696 (2.8%) |
| 1 or 2 Children | 13,522 (98.4%) | 223 (1.6%) |
| 3 or 4 Children | 3,595 (96.7%) | 124 (3.3%) |
| 5 or more Children | 182 (90.5%) | 19 (9.5%) |
| Total | 41,825 (97.5%) | 1,062 (2.5%) |
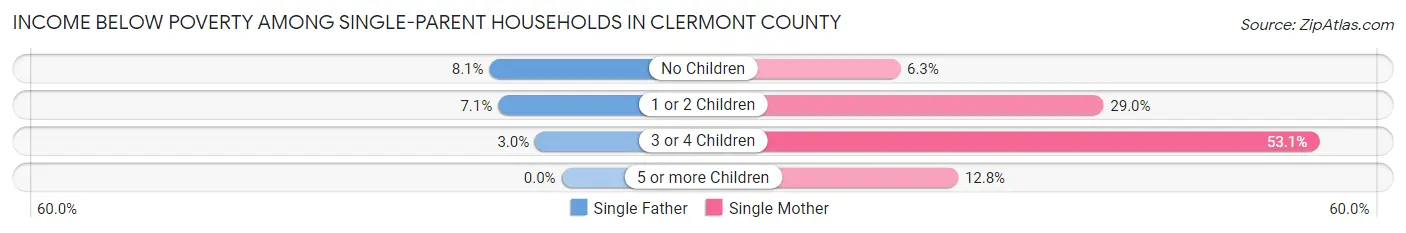
Income Below Poverty Among Single-Parent Households in Clermont County
According to the poverty data in Clermont County, 7.1% or 288 single-father households and 22.6% or 1,904 single-mother households are living below the poverty line. Among single-father households, those with no children have the highest poverty rate, with 127 households (8.1%) experiencing poverty. Likewise, among single-mother households, those with 3 or 4 children have the highest poverty rate, with 374 households (53.1%) falling below the poverty line.
| Children | Single Father | Single Mother |
| No Children | 127 (8.1%) | 195 (6.3%) |
| 1 or 2 Children | 152 (7.1%) | 1,329 (29.0%) |
| 3 or 4 Children | 9 (2.9%) | 374 (53.1%) |
| 5 or more Children | 0 (0.0%) | 6 (12.8%) |
| Total | 288 (7.1%) | 1,904 (22.6%) |
Income Below Poverty Among Married-Couple vs Single-Parent Households in Clermont County
The poverty data for Clermont County shows that 1,062 of the married-couple family households (2.5%) and 2,192 of the single-parent households (17.6%) are living below the poverty level. Within the married-couple family households, those with 5 or more children have the highest poverty rate, with 19 households (9.5%) falling below the poverty line. Among the single-parent households, those with 3 or 4 children have the highest poverty rate, with 383 household (38.0%) living below poverty.
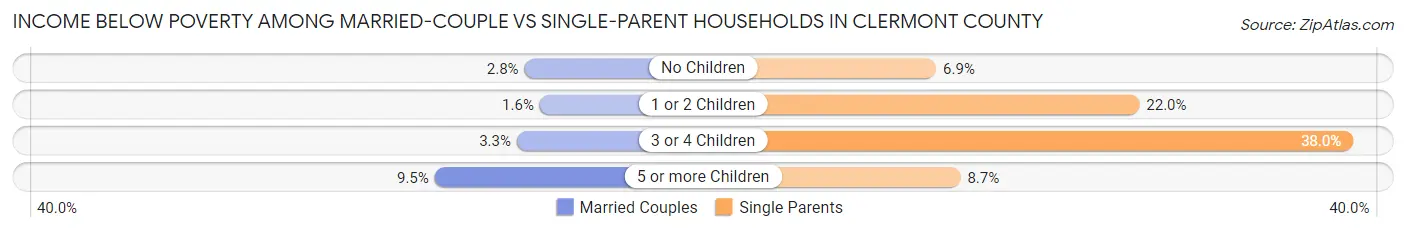
| Children | Married-Couple Families | Single-Parent Households |
| No Children | 696 (2.8%) | 322 (6.9%) |
| 1 or 2 Children | 223 (1.6%) | 1,481 (22.0%) |
| 3 or 4 Children | 124 (3.3%) | 383 (38.0%) |
| 5 or more Children | 19 (9.5%) | 6 (8.7%) |
| Total | 1,062 (2.5%) | 2,192 (17.6%) |
Employment Characteristics in Clermont County
Employment by Class of Employer in Clermont County
Among the 103,116 employed individuals in Clermont County, private company employees (75,782 | 73.5%), not-for-profit organizations (8,541 | 8.3%), and local government employees (6,400 | 6.2%) make up the most common classes of employment.
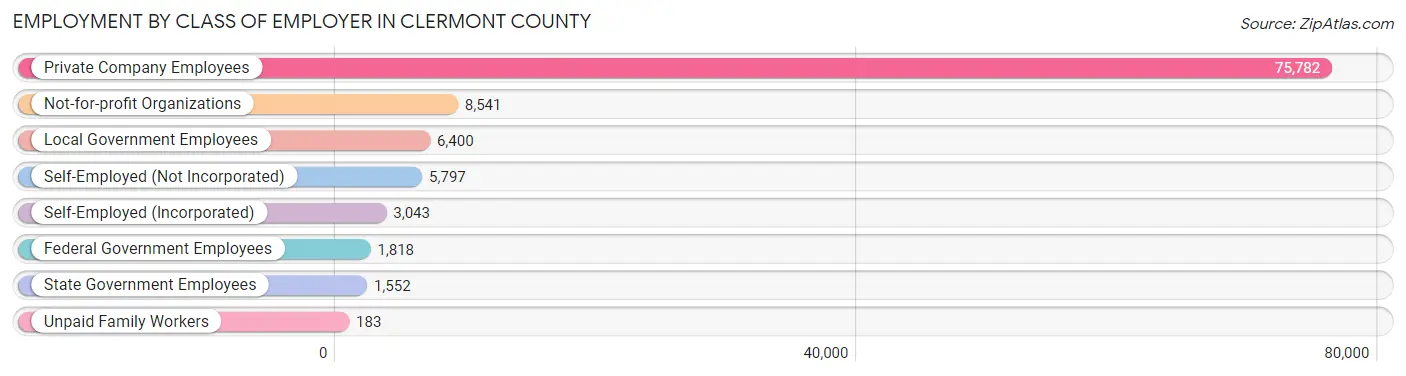
| Employer Class | # Employees | % Employees |
| Private Company Employees | 75,782 | 73.5% |
| Self-Employed (Incorporated) | 3,043 | 2.9% |
| Self-Employed (Not Incorporated) | 5,797 | 5.6% |
| Not-for-profit Organizations | 8,541 | 8.3% |
| Local Government Employees | 6,400 | 6.2% |
| State Government Employees | 1,552 | 1.5% |
| Federal Government Employees | 1,818 | 1.8% |
| Unpaid Family Workers | 183 | 0.2% |
| Total | 103,116 | 100.0% |
Employment Status by Age in Clermont County
According to the labor force statistics for Clermont County, out of the total population over 16 years of age (167,698), 65.2% or 109,339 individuals are in the labor force, with 4.1% or 4,483 of them unemployed. The age group with the highest labor force participation rate is 30 to 34 years, with 85.3% or 11,178 individuals in the labor force. Within the labor force, the 16 to 19 years age range has the highest percentage of unemployed individuals, with 9.2% or 484 of them being unemployed.
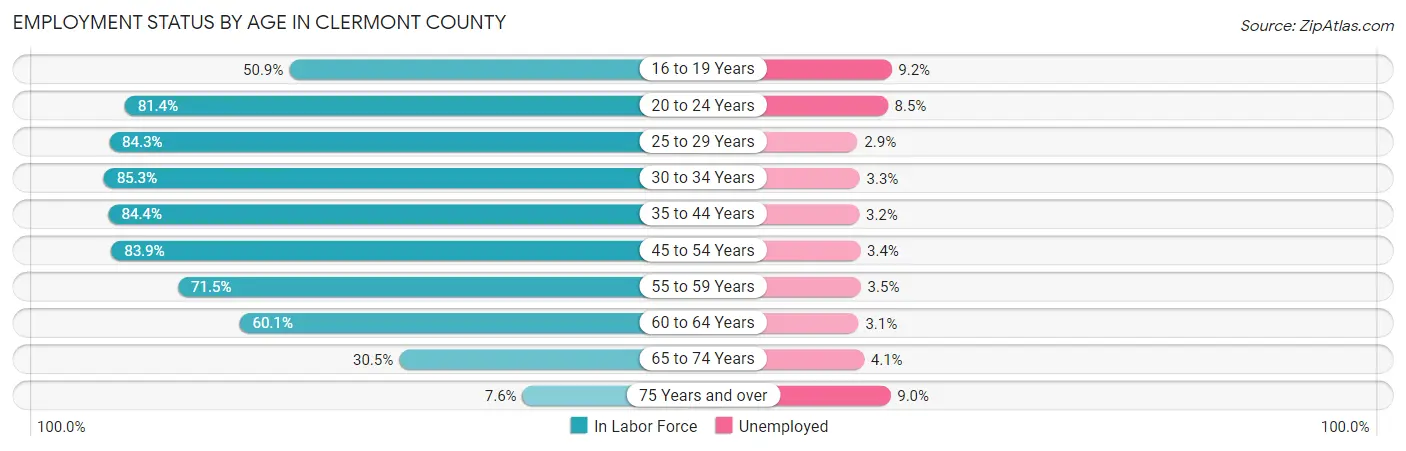
| Age Bracket | In Labor Force | Unemployed |
| 16 to 19 Years | 5,263 (50.9%) | 484 (9.2%) |
| 20 to 24 Years | 9,931 (81.4%) | 844 (8.5%) |
| 25 to 29 Years | 10,688 (84.3%) | 310 (2.9%) |
| 30 to 34 Years | 11,178 (85.3%) | 369 (3.3%) |
| 35 to 44 Years | 22,626 (84.4%) | 724 (3.2%) |
| 45 to 54 Years | 22,151 (83.9%) | 753 (3.4%) |
| 55 to 59 Years | 10,654 (71.5%) | 373 (3.5%) |
| 60 to 64 Years | 9,009 (60.1%) | 279 (3.1%) |
| 65 to 74 Years | 6,759 (30.5%) | 277 (4.1%) |
| 75 Years and over | 1,073 (7.6%) | 97 (9.0%) |
| Total | 109,339 (65.2%) | 4,483 (4.1%) |
Employment Status by Educational Attainment in Clermont County
According to labor force statistics for Clermont County, 79.3% of individuals (86,343) out of the total population between 25 and 64 years of age (108,882) are in the labor force, with 3.2% or 2,763 of them being unemployed. The group with the highest labor force participation rate are those with the educational attainment of bachelor's degree or higher, with 88.1% or 31,479 individuals in the labor force. Within the labor force, individuals with less than high school education have the highest percentage of unemployment, with 7.5% or 338 of them being unemployed.
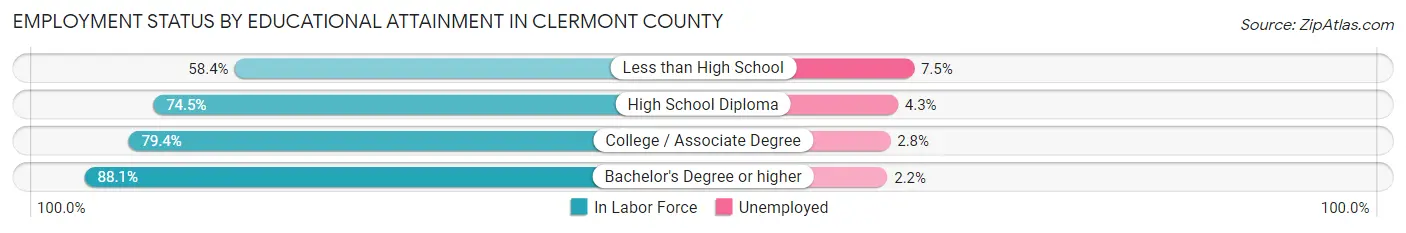
| Educational Attainment | In Labor Force | Unemployed |
| Less than High School | 4,507 (58.4%) | 579 (7.5%) |
| High School Diploma | 24,567 (74.5%) | 1,418 (4.3%) |
| College / Associate Degree | 25,772 (79.4%) | 909 (2.8%) |
| Bachelor's Degree or higher | 31,479 (88.1%) | 786 (2.2%) |
| Total | 86,343 (79.3%) | 3,484 (3.2%) |
Employment Occupations by Sex in Clermont County
Management, Business, Science and Arts Occupations
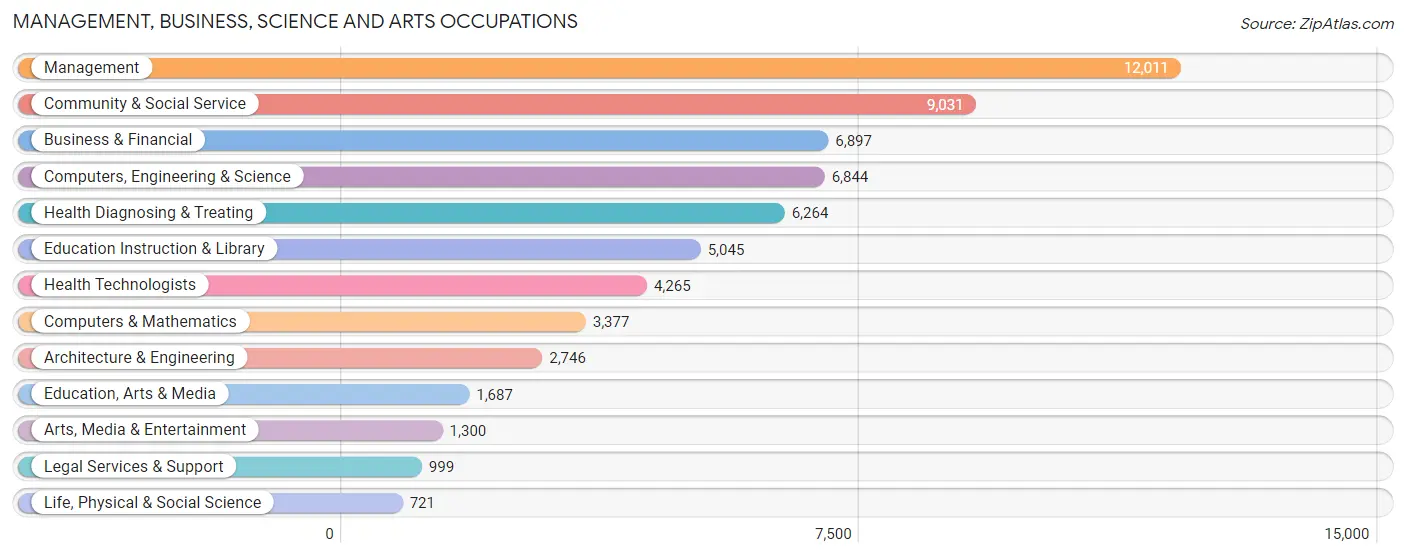
The most common Management, Business, Science and Arts occupations in Clermont County are Management (12,011 | 11.5%), Community & Social Service (9,031 | 8.6%), Business & Financial (6,897 | 6.6%), Computers, Engineering & Science (6,844 | 6.5%), and Health Diagnosing & Treating (6,264 | 6.0%).
Management, Business, Science and Arts Occupations by Sex
Within the Management, Business, Science and Arts occupations in Clermont County, the most male-oriented occupations are Architecture & Engineering (79.4%), Computers & Mathematics (77.6%), and Computers, Engineering & Science (75.4%), while the most female-oriented occupations are Health Diagnosing & Treating (81.2%), Health Technologists (79.1%), and Education Instruction & Library (74.4%).
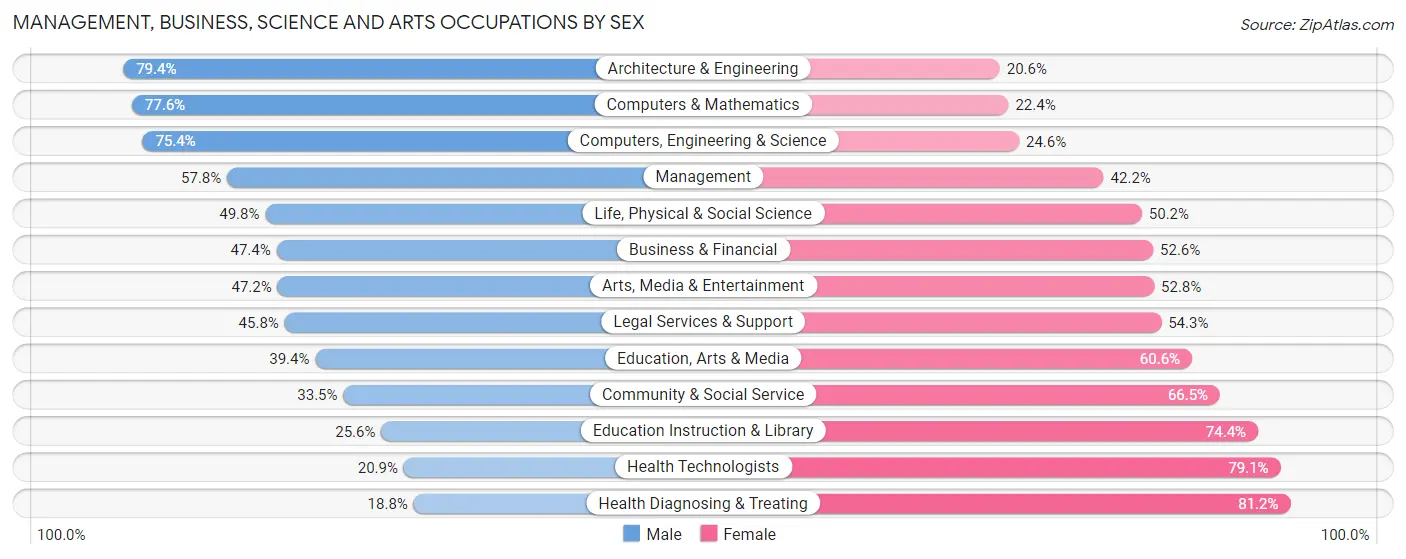
| Occupation | Male | Female |
| Management | 6,938 (57.8%) | 5,073 (42.2%) |
| Business & Financial | 3,272 (47.4%) | 3,625 (52.6%) |
| Computers, Engineering & Science | 5,161 (75.4%) | 1,683 (24.6%) |
| Computers & Mathematics | 2,621 (77.6%) | 756 (22.4%) |
| Architecture & Engineering | 2,181 (79.4%) | 565 (20.6%) |
| Life, Physical & Social Science | 359 (49.8%) | 362 (50.2%) |
| Community & Social Service | 3,026 (33.5%) | 6,005 (66.5%) |
| Education, Arts & Media | 664 (39.4%) | 1,023 (60.6%) |
| Legal Services & Support | 457 (45.8%) | 542 (54.2%) |
| Education Instruction & Library | 1,291 (25.6%) | 3,754 (74.4%) |
| Arts, Media & Entertainment | 614 (47.2%) | 686 (52.8%) |
| Health Diagnosing & Treating | 1,180 (18.8%) | 5,084 (81.2%) |
| Health Technologists | 891 (20.9%) | 3,374 (79.1%) |
| Total (Category) | 19,577 (47.7%) | 21,470 (52.3%) |
| Total (Overall) | 55,969 (53.4%) | 48,741 (46.6%) |
Services Occupations
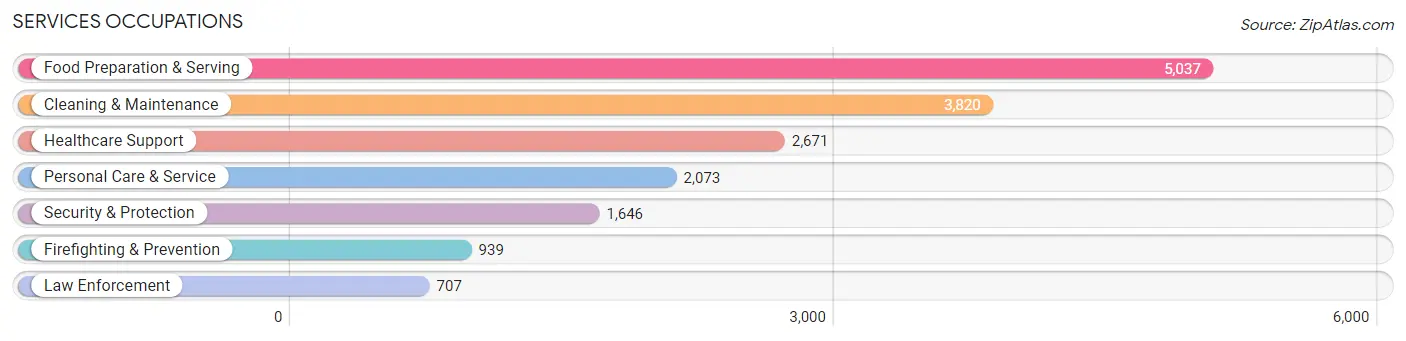
The most common Services occupations in Clermont County are Food Preparation & Serving (5,037 | 4.8%), Cleaning & Maintenance (3,820 | 3.6%), Healthcare Support (2,671 | 2.5%), Personal Care & Service (2,073 | 2.0%), and Security & Protection (1,646 | 1.6%).
Services Occupations by Sex
Within the Services occupations in Clermont County, the most male-oriented occupations are Law Enforcement (88.5%), Security & Protection (81.0%), and Firefighting & Prevention (75.4%), while the most female-oriented occupations are Healthcare Support (89.1%), Personal Care & Service (81.5%), and Food Preparation & Serving (53.9%).
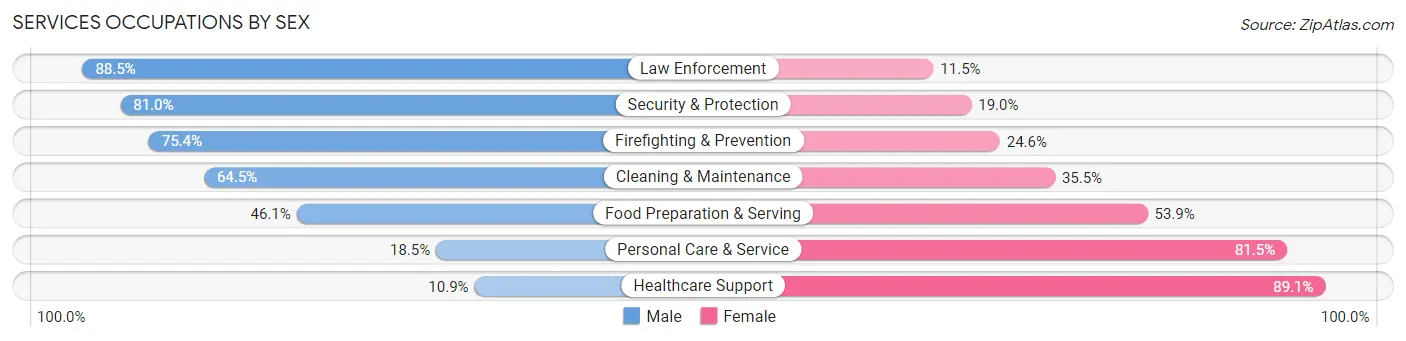
| Occupation | Male | Female |
| Healthcare Support | 292 (10.9%) | 2,379 (89.1%) |
| Security & Protection | 1,334 (81.0%) | 312 (19.0%) |
| Firefighting & Prevention | 708 (75.4%) | 231 (24.6%) |
| Law Enforcement | 626 (88.5%) | 81 (11.5%) |
| Food Preparation & Serving | 2,324 (46.1%) | 2,713 (53.9%) |
| Cleaning & Maintenance | 2,463 (64.5%) | 1,357 (35.5%) |
| Personal Care & Service | 384 (18.5%) | 1,689 (81.5%) |
| Total (Category) | 6,797 (44.6%) | 8,450 (55.4%) |
| Total (Overall) | 55,969 (53.4%) | 48,741 (46.6%) |
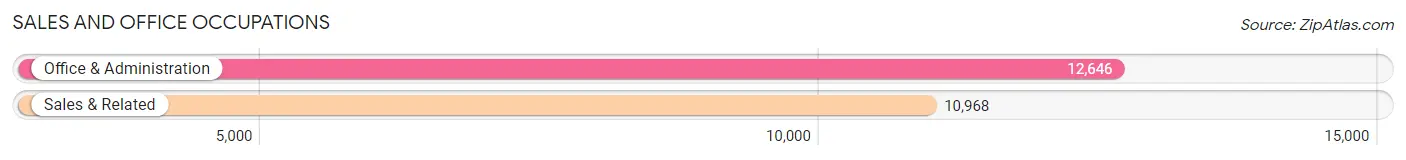
Sales and Office Occupations
The most common Sales and Office occupations in Clermont County are Office & Administration (12,646 | 12.1%), and Sales & Related (10,968 | 10.5%).
Sales and Office Occupations by Sex
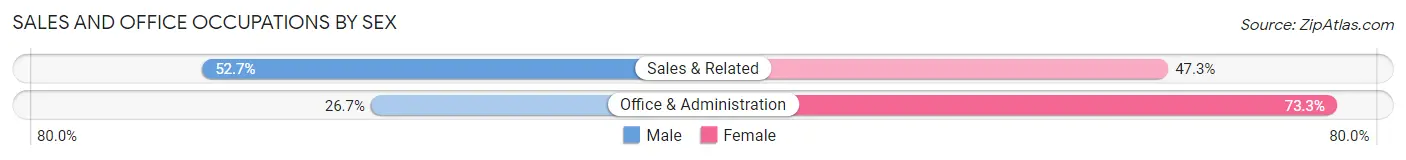
| Occupation | Male | Female |
| Sales & Related | 5,777 (52.7%) | 5,191 (47.3%) |
| Office & Administration | 3,382 (26.7%) | 9,264 (73.3%) |
| Total (Category) | 9,159 (38.8%) | 14,455 (61.2%) |
| Total (Overall) | 55,969 (53.4%) | 48,741 (46.6%) |
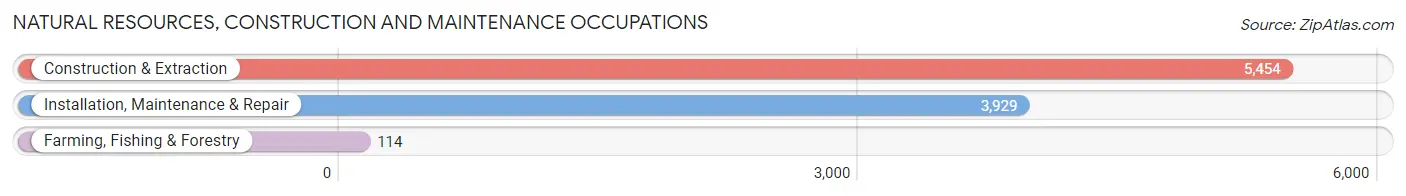
Natural Resources, Construction and Maintenance Occupations
The most common Natural Resources, Construction and Maintenance occupations in Clermont County are Construction & Extraction (5,454 | 5.2%), Installation, Maintenance & Repair (3,929 | 3.7%), and Farming, Fishing & Forestry (114 | 0.1%).
Natural Resources, Construction and Maintenance Occupations by Sex
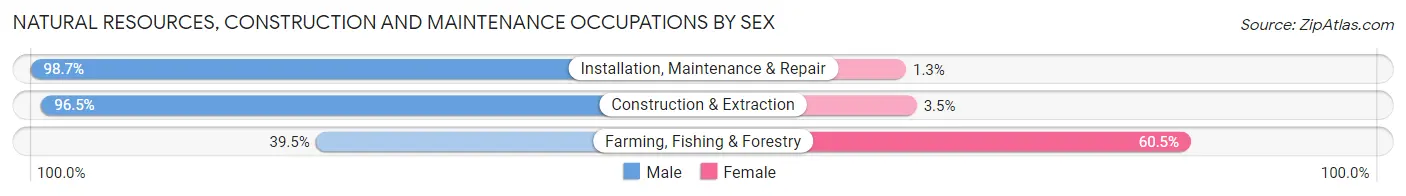
| Occupation | Male | Female |
| Farming, Fishing & Forestry | 45 (39.5%) | 69 (60.5%) |
| Construction & Extraction | 5,263 (96.5%) | 191 (3.5%) |
| Installation, Maintenance & Repair | 3,879 (98.7%) | 50 (1.3%) |
| Total (Category) | 9,187 (96.7%) | 310 (3.3%) |
| Total (Overall) | 55,969 (53.4%) | 48,741 (46.6%) |
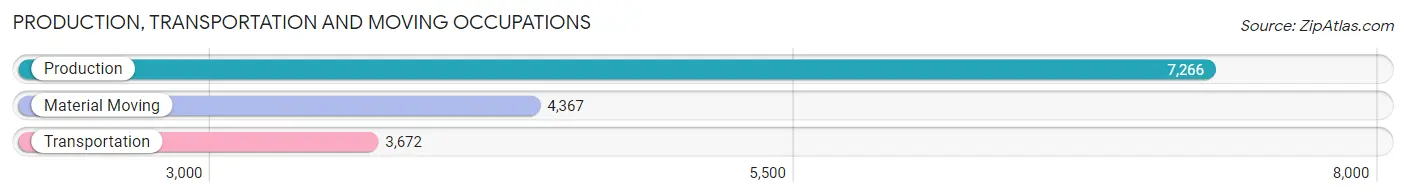
Production, Transportation and Moving Occupations
The most common Production, Transportation and Moving occupations in Clermont County are Production (7,266 | 6.9%), Material Moving (4,367 | 4.2%), and Transportation (3,672 | 3.5%).
Production, Transportation and Moving Occupations by Sex
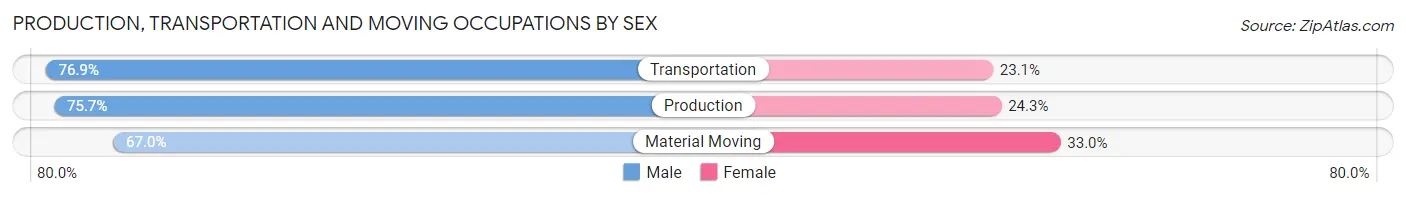
| Occupation | Male | Female |
| Production | 5,499 (75.7%) | 1,767 (24.3%) |
| Transportation | 2,824 (76.9%) | 848 (23.1%) |
| Material Moving | 2,926 (67.0%) | 1,441 (33.0%) |
| Total (Category) | 11,249 (73.5%) | 4,056 (26.5%) |
| Total (Overall) | 55,969 (53.4%) | 48,741 (46.6%) |
Employment Industries by Sex in Clermont County
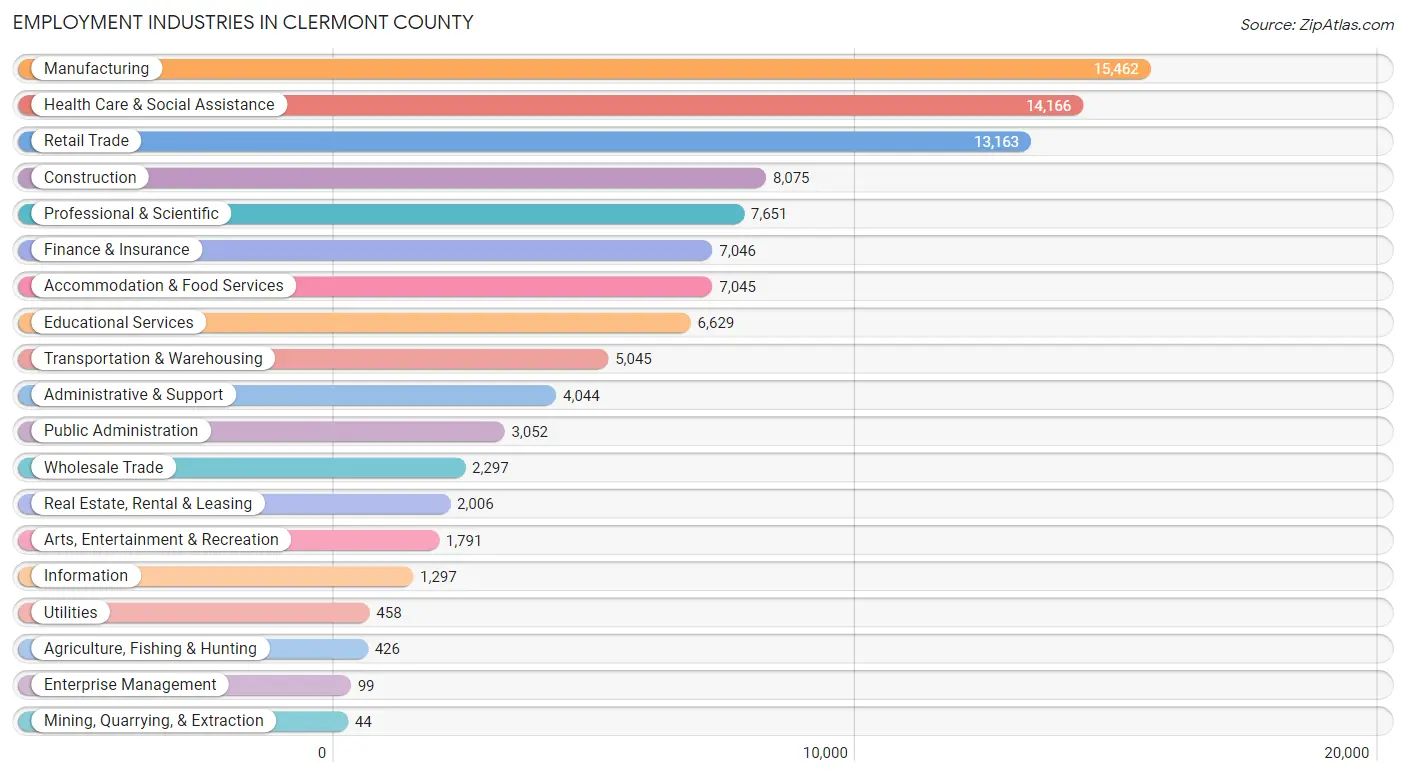
Employment Industries in Clermont County
The major employment industries in Clermont County include Manufacturing (15,462 | 14.8%), Health Care & Social Assistance (14,166 | 13.5%), Retail Trade (13,163 | 12.6%), Construction (8,075 | 7.7%), and Professional & Scientific (7,651 | 7.3%).
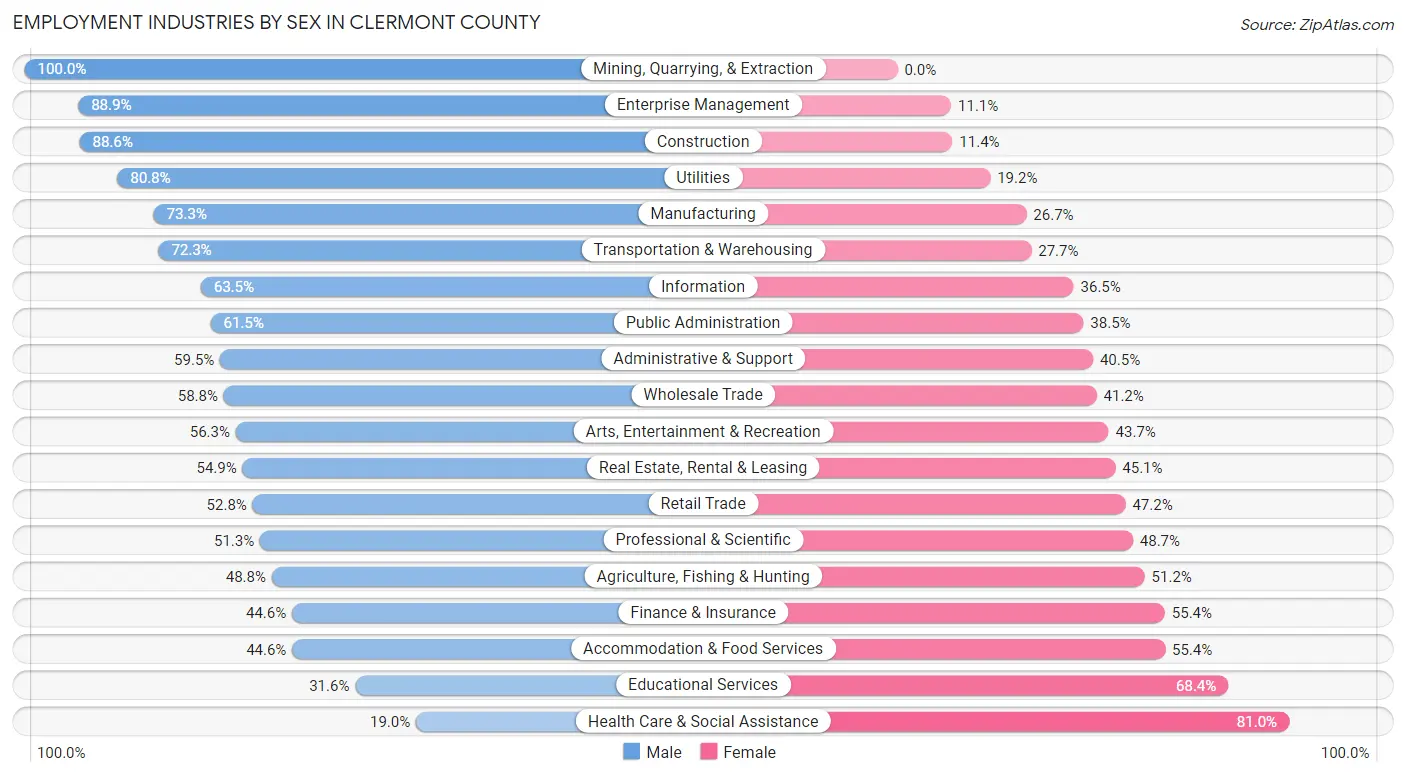
Employment Industries by Sex in Clermont County
The Clermont County industries that see more men than women are Mining, Quarrying, & Extraction (100.0%), Enterprise Management (88.9%), and Construction (88.6%), whereas the industries that tend to have a higher number of women are Health Care & Social Assistance (81.0%), Educational Services (68.4%), and Accommodation & Food Services (55.4%).
| Industry | Male | Female |
| Agriculture, Fishing & Hunting | 208 (48.8%) | 218 (51.2%) |
| Mining, Quarrying, & Extraction | 44 (100.0%) | 0 (0.0%) |
| Construction | 7,156 (88.6%) | 919 (11.4%) |
| Manufacturing | 11,333 (73.3%) | 4,129 (26.7%) |
| Wholesale Trade | 1,350 (58.8%) | 947 (41.2%) |
| Retail Trade | 6,949 (52.8%) | 6,214 (47.2%) |
| Transportation & Warehousing | 3,647 (72.3%) | 1,398 (27.7%) |
| Utilities | 370 (80.8%) | 88 (19.2%) |
| Information | 824 (63.5%) | 473 (36.5%) |
| Finance & Insurance | 3,145 (44.6%) | 3,901 (55.4%) |
| Real Estate, Rental & Leasing | 1,101 (54.9%) | 905 (45.1%) |
| Professional & Scientific | 3,923 (51.3%) | 3,728 (48.7%) |
| Enterprise Management | 88 (88.9%) | 11 (11.1%) |
| Administrative & Support | 2,407 (59.5%) | 1,637 (40.5%) |
| Educational Services | 2,092 (31.6%) | 4,537 (68.4%) |
| Health Care & Social Assistance | 2,689 (19.0%) | 11,477 (81.0%) |
| Arts, Entertainment & Recreation | 1,008 (56.3%) | 783 (43.7%) |
| Accommodation & Food Services | 3,143 (44.6%) | 3,902 (55.4%) |
| Public Administration | 1,877 (61.5%) | 1,175 (38.5%) |
| Total | 55,969 (53.4%) | 48,741 (46.6%) |
Education in Clermont County
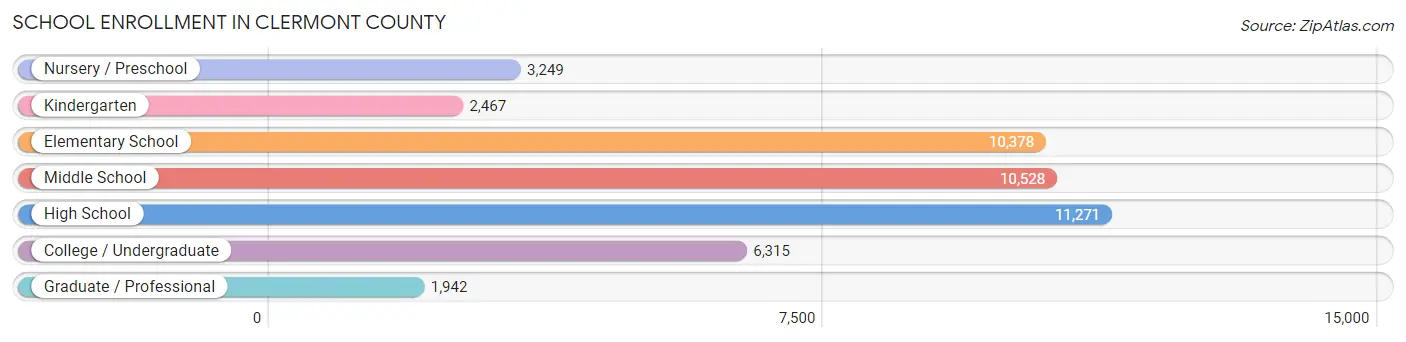
School Enrollment in Clermont County
The most common levels of schooling among the 46,150 students in Clermont County are high school (11,271 | 24.4%), middle school (10,528 | 22.8%), and elementary school (10,378 | 22.5%).
| School Level | # Students | % Students |
| Nursery / Preschool | 3,249 | 7.0% |
| Kindergarten | 2,467 | 5.3% |
| Elementary School | 10,378 | 22.5% |
| Middle School | 10,528 | 22.8% |
| High School | 11,271 | 24.4% |
| College / Undergraduate | 6,315 | 13.7% |
| Graduate / Professional | 1,942 | 4.2% |
| Total | 46,150 | 100.0% |
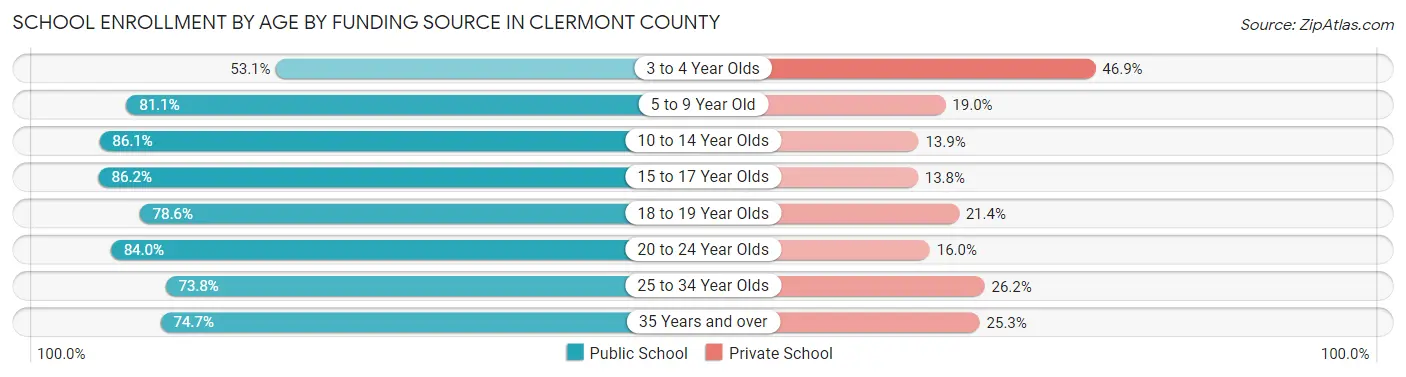
School Enrollment by Age by Funding Source in Clermont County
Out of a total of 46,150 students who are enrolled in schools in Clermont County, 8,538 (18.5%) attend a private institution, while the remaining 37,612 (81.5%) are enrolled in public schools. The age group of 3 to 4 year olds has the highest likelihood of being enrolled in private schools, with 1,086 (46.9% in the age bracket) enrolled. Conversely, the age group of 15 to 17 year olds has the lowest likelihood of being enrolled in a private school, with 7,266 (86.2% in the age bracket) attending a public institution.
| Age Bracket | Public School | Private School |
| 3 to 4 Year Olds | 1,230 (53.1%) | 1,086 (46.9%) |
| 5 to 9 Year Old | 9,962 (81.0%) | 2,329 (19.0%) |
| 10 to 14 Year Olds | 11,392 (86.1%) | 1,845 (13.9%) |
| 15 to 17 Year Olds | 7,266 (86.2%) | 1,163 (13.8%) |
| 18 to 19 Year Olds | 2,266 (78.6%) | 618 (21.4%) |
| 20 to 24 Year Olds | 2,759 (84.0%) | 527 (16.0%) |
| 25 to 34 Year Olds | 1,141 (73.8%) | 406 (26.2%) |
| 35 Years and over | 1,613 (74.7%) | 547 (25.3%) |
| Total | 37,612 (81.5%) | 8,538 (18.5%) |
Educational Attainment by Field of Study in Clermont County
Business (10,442 | 21.8%), education (6,160 | 12.9%), science & technology (5,358 | 11.2%), engineering (3,589 | 7.5%), and arts & humanities (2,960 | 6.2%) are the most common fields of study among 47,903 individuals in Clermont County who have obtained a bachelor's degree or higher.
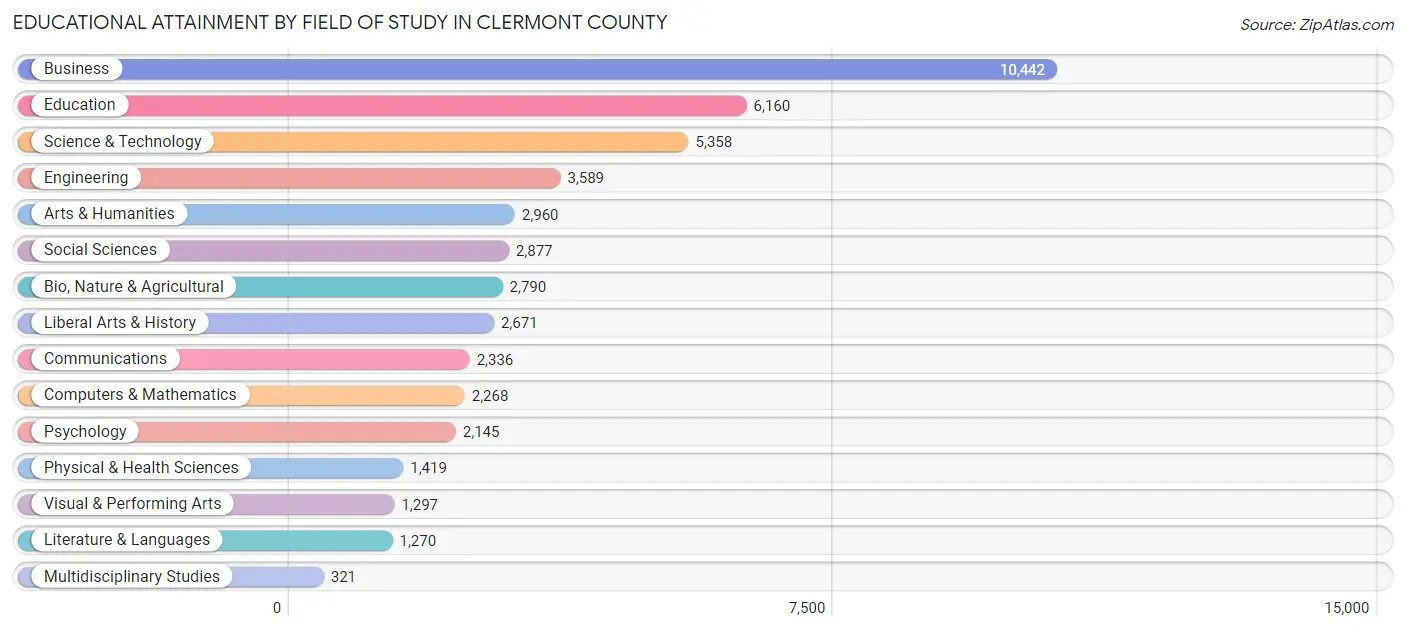
| Field of Study | # Graduates | % Graduates |
| Computers & Mathematics | 2,268 | 4.7% |
| Bio, Nature & Agricultural | 2,790 | 5.8% |
| Physical & Health Sciences | 1,419 | 3.0% |
| Psychology | 2,145 | 4.5% |
| Social Sciences | 2,877 | 6.0% |
| Engineering | 3,589 | 7.5% |
| Multidisciplinary Studies | 321 | 0.7% |
| Science & Technology | 5,358 | 11.2% |
| Business | 10,442 | 21.8% |
| Education | 6,160 | 12.9% |
| Literature & Languages | 1,270 | 2.6% |
| Liberal Arts & History | 2,671 | 5.6% |
| Visual & Performing Arts | 1,297 | 2.7% |
| Communications | 2,336 | 4.9% |
| Arts & Humanities | 2,960 | 6.2% |
| Total | 47,903 | 100.0% |
Transportation & Commute in Clermont County
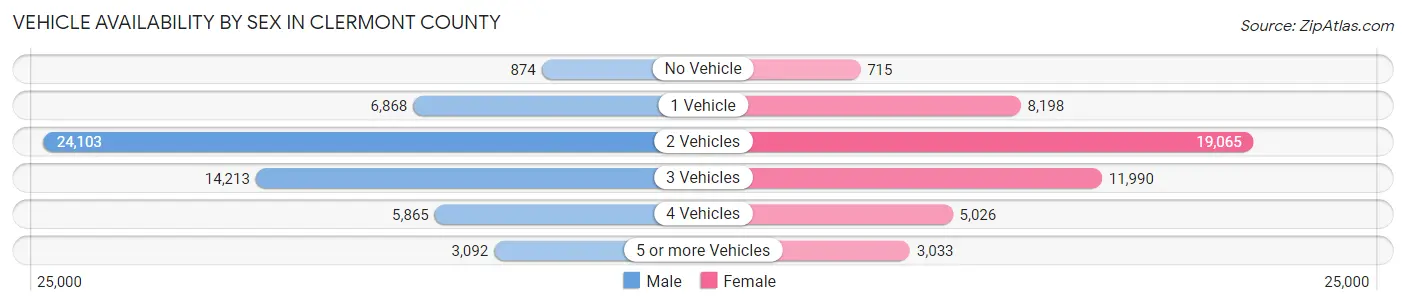
Vehicle Availability by Sex in Clermont County
The most prevalent vehicle ownership categories in Clermont County are males with 2 vehicles (24,103, accounting for 43.8%) and females with 2 vehicles (19,065, making up 50.2%).
| Vehicles Available | Male | Female |
| No Vehicle | 874 (1.6%) | 715 (1.5%) |
| 1 Vehicle | 6,868 (12.5%) | 8,198 (17.1%) |
| 2 Vehicles | 24,103 (43.8%) | 19,065 (39.7%) |
| 3 Vehicles | 14,213 (25.8%) | 11,990 (25.0%) |
| 4 Vehicles | 5,865 (10.7%) | 5,026 (10.5%) |
| 5 or more Vehicles | 3,092 (5.6%) | 3,033 (6.3%) |
| Total | 55,015 (100.0%) | 48,027 (100.0%) |
Commute Time in Clermont County
The most frequently occuring commute durations in Clermont County are 30 to 34 minutes (15,099 commuters, 16.4%), 20 to 24 minutes (12,341 commuters, 13.4%), and 15 to 19 minutes (10,721 commuters, 11.6%).
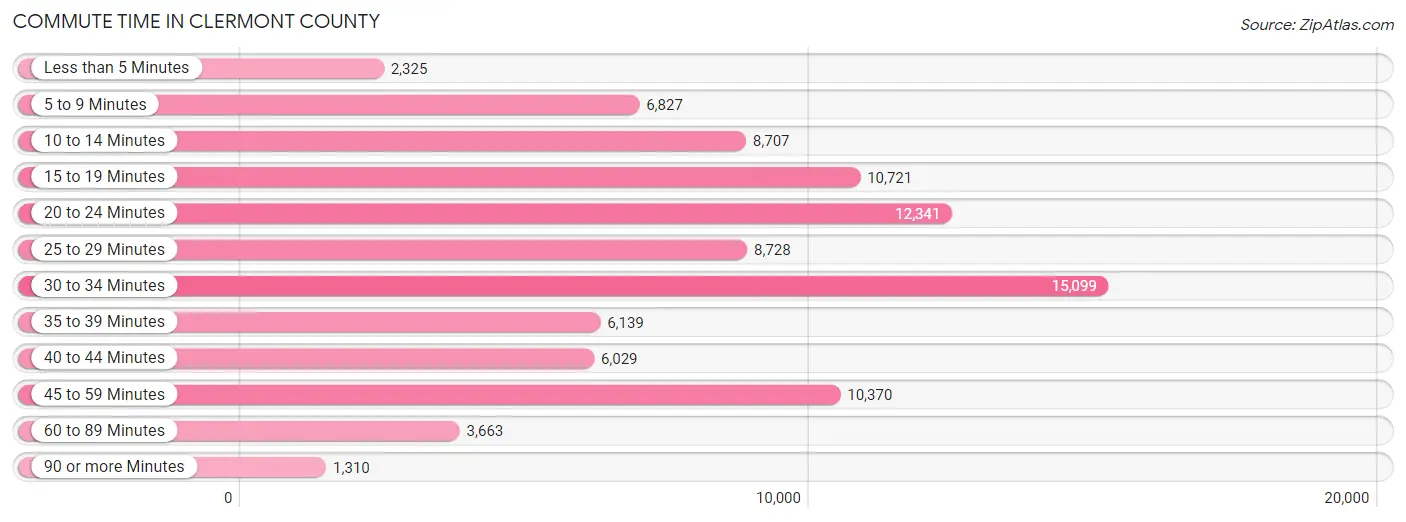
| Commute Time | # Commuters | % Commuters |
| Less than 5 Minutes | 2,325 | 2.5% |
| 5 to 9 Minutes | 6,827 | 7.4% |
| 10 to 14 Minutes | 8,707 | 9.4% |
| 15 to 19 Minutes | 10,721 | 11.6% |
| 20 to 24 Minutes | 12,341 | 13.4% |
| 25 to 29 Minutes | 8,728 | 9.5% |
| 30 to 34 Minutes | 15,099 | 16.4% |
| 35 to 39 Minutes | 6,139 | 6.7% |
| 40 to 44 Minutes | 6,029 | 6.5% |
| 45 to 59 Minutes | 10,370 | 11.2% |
| 60 to 89 Minutes | 3,663 | 4.0% |
| 90 or more Minutes | 1,310 | 1.4% |
Commute Time by Sex in Clermont County
The most common commute times in Clermont County are 30 to 34 minutes (8,137 commuters, 16.4%) for males and 30 to 34 minutes (6,962 commuters, 16.3%) for females.
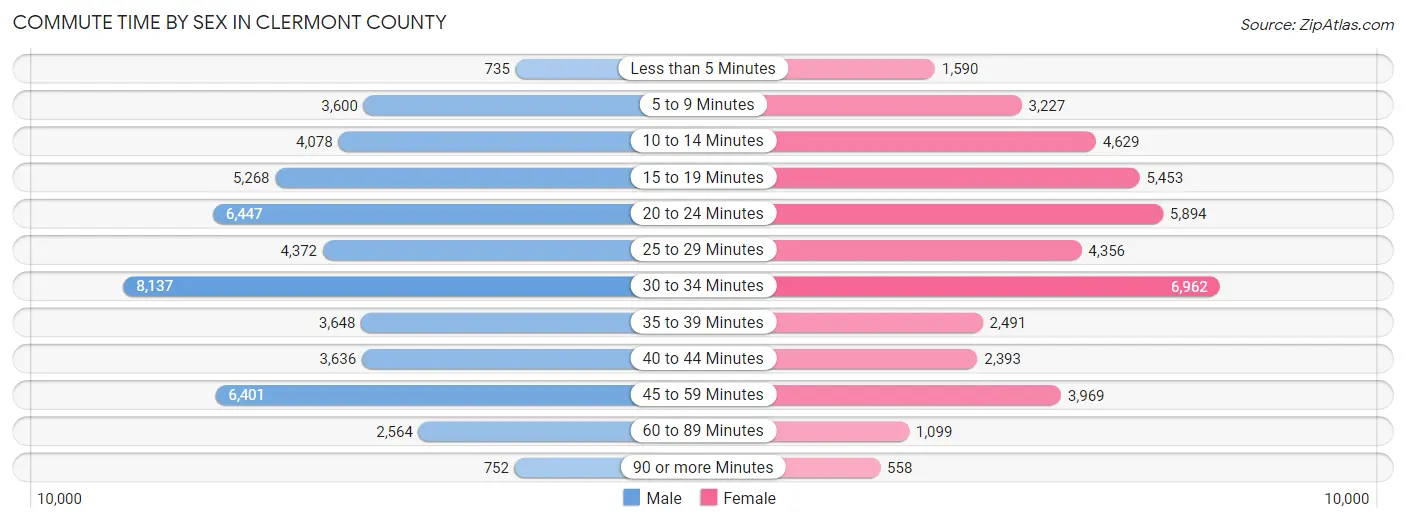
| Commute Time | Male | Female |
| Less than 5 Minutes | 735 (1.5%) | 1,590 (3.7%) |
| 5 to 9 Minutes | 3,600 (7.2%) | 3,227 (7.6%) |
| 10 to 14 Minutes | 4,078 (8.2%) | 4,629 (10.9%) |
| 15 to 19 Minutes | 5,268 (10.6%) | 5,453 (12.8%) |
| 20 to 24 Minutes | 6,447 (13.0%) | 5,894 (13.8%) |
| 25 to 29 Minutes | 4,372 (8.8%) | 4,356 (10.2%) |
| 30 to 34 Minutes | 8,137 (16.4%) | 6,962 (16.3%) |
| 35 to 39 Minutes | 3,648 (7.3%) | 2,491 (5.8%) |
| 40 to 44 Minutes | 3,636 (7.3%) | 2,393 (5.6%) |
| 45 to 59 Minutes | 6,401 (12.9%) | 3,969 (9.3%) |
| 60 to 89 Minutes | 2,564 (5.2%) | 1,099 (2.6%) |
| 90 or more Minutes | 752 (1.5%) | 558 (1.3%) |
Time of Departure to Work by Sex in Clermont County
The most frequent times of departure to work in Clermont County are 7:00 AM to 7:29 AM (6,609, 13.3%) for males and 7:00 AM to 7:29 AM (5,525, 13.0%) for females.
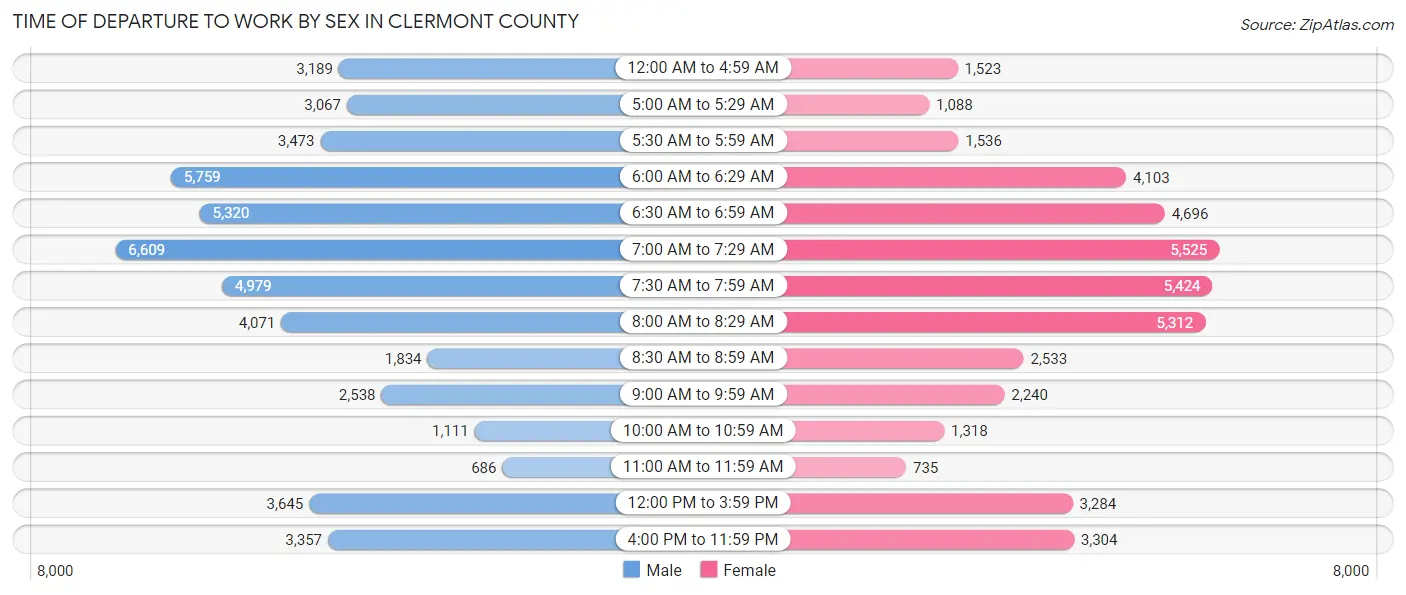
| Time of Departure | Male | Female |
| 12:00 AM to 4:59 AM | 3,189 (6.4%) | 1,523 (3.6%) |
| 5:00 AM to 5:29 AM | 3,067 (6.2%) | 1,088 (2.5%) |
| 5:30 AM to 5:59 AM | 3,473 (7.0%) | 1,536 (3.6%) |
| 6:00 AM to 6:29 AM | 5,759 (11.6%) | 4,103 (9.6%) |
| 6:30 AM to 6:59 AM | 5,320 (10.7%) | 4,696 (11.0%) |
| 7:00 AM to 7:29 AM | 6,609 (13.3%) | 5,525 (13.0%) |
| 7:30 AM to 7:59 AM | 4,979 (10.0%) | 5,424 (12.7%) |
| 8:00 AM to 8:29 AM | 4,071 (8.2%) | 5,312 (12.5%) |
| 8:30 AM to 8:59 AM | 1,834 (3.7%) | 2,533 (5.9%) |
| 9:00 AM to 9:59 AM | 2,538 (5.1%) | 2,240 (5.3%) |
| 10:00 AM to 10:59 AM | 1,111 (2.2%) | 1,318 (3.1%) |
| 11:00 AM to 11:59 AM | 686 (1.4%) | 735 (1.7%) |
| 12:00 PM to 3:59 PM | 3,645 (7.3%) | 3,284 (7.7%) |
| 4:00 PM to 11:59 PM | 3,357 (6.8%) | 3,304 (7.7%) |
| Total | 49,638 (100.0%) | 42,621 (100.0%) |
Housing Occupancy in Clermont County
Occupancy by Ownership in Clermont County
Of the total 82,712 dwellings in Clermont County, owner-occupied units account for 61,021 (73.8%), while renter-occupied units make up 21,691 (26.2%).
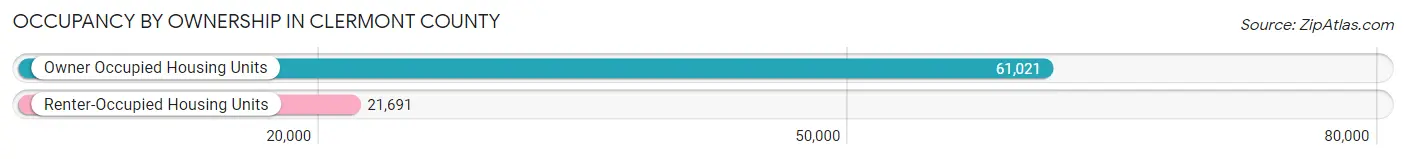
| Occupancy | # Housing Units | % Housing Units |
| Owner Occupied Housing Units | 61,021 | 73.8% |
| Renter-Occupied Housing Units | 21,691 | 26.2% |
| Total Occupied Housing Units | 82,712 | 100.0% |
Occupancy by Household Size in Clermont County
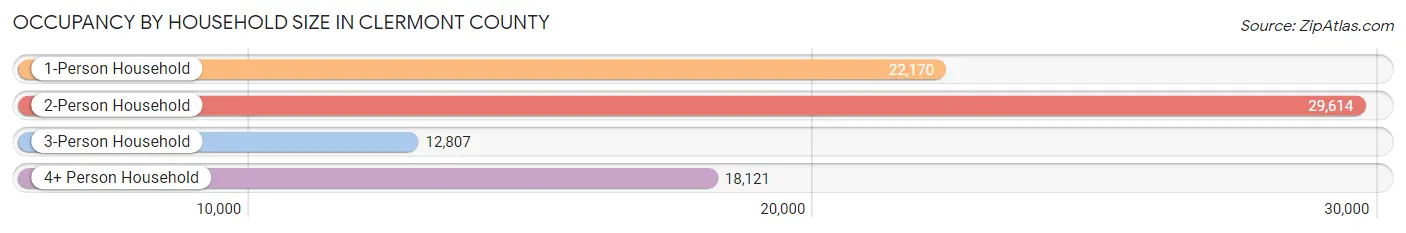
| Household Size | # Housing Units | % Housing Units |
| 1-Person Household | 22,170 | 26.8% |
| 2-Person Household | 29,614 | 35.8% |
| 3-Person Household | 12,807 | 15.5% |
| 4+ Person Household | 18,121 | 21.9% |
| Total Housing Units | 82,712 | 100.0% |
Occupancy by Ownership by Household Size in Clermont County
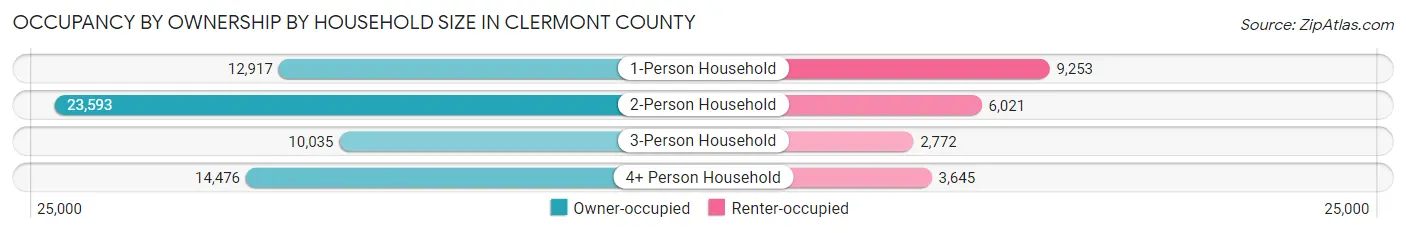
| Household Size | Owner-occupied | Renter-occupied |
| 1-Person Household | 12,917 (58.3%) | 9,253 (41.7%) |
| 2-Person Household | 23,593 (79.7%) | 6,021 (20.3%) |
| 3-Person Household | 10,035 (78.4%) | 2,772 (21.6%) |
| 4+ Person Household | 14,476 (79.9%) | 3,645 (20.1%) |
| Total Housing Units | 61,021 (73.8%) | 21,691 (26.2%) |
Occupancy by Educational Attainment in Clermont County
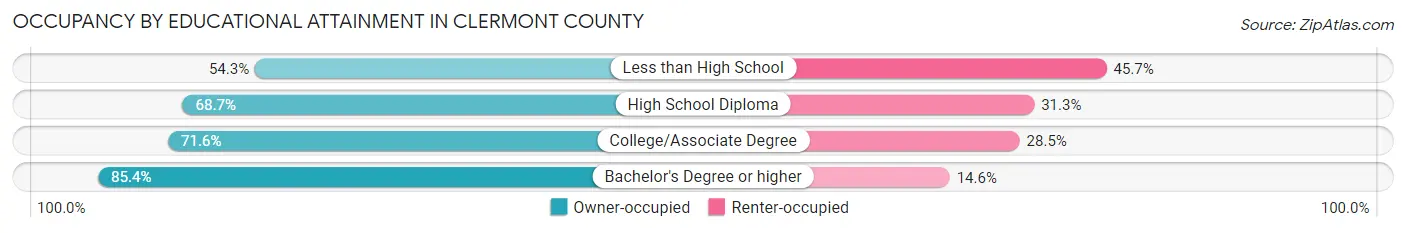
| Household Size | Owner-occupied | Renter-occupied |
| Less than High School | 3,349 (54.3%) | 2,816 (45.7%) |
| High School Diploma | 17,243 (68.7%) | 7,869 (31.3%) |
| College/Associate Degree | 18,076 (71.6%) | 7,187 (28.4%) |
| Bachelor's Degree or higher | 22,353 (85.4%) | 3,819 (14.6%) |
Occupancy by Age of Householder in Clermont County
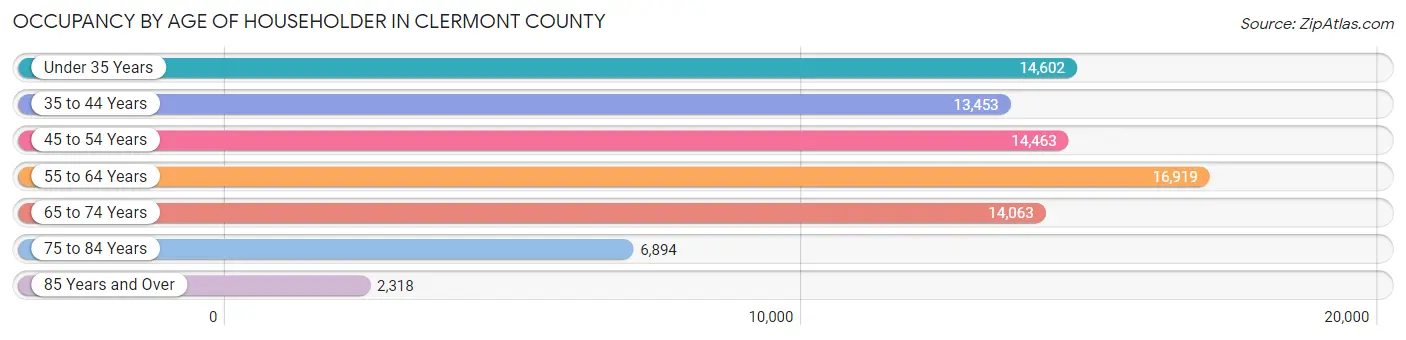
| Age Bracket | # Households | % Households |
| Under 35 Years | 14,602 | 17.6% |
| 35 to 44 Years | 13,453 | 16.3% |
| 45 to 54 Years | 14,463 | 17.5% |
| 55 to 64 Years | 16,919 | 20.5% |
| 65 to 74 Years | 14,063 | 17.0% |
| 75 to 84 Years | 6,894 | 8.3% |
| 85 Years and Over | 2,318 | 2.8% |
| Total | 82,712 | 100.0% |
Housing Finances in Clermont County
Median Income by Occupancy in Clermont County
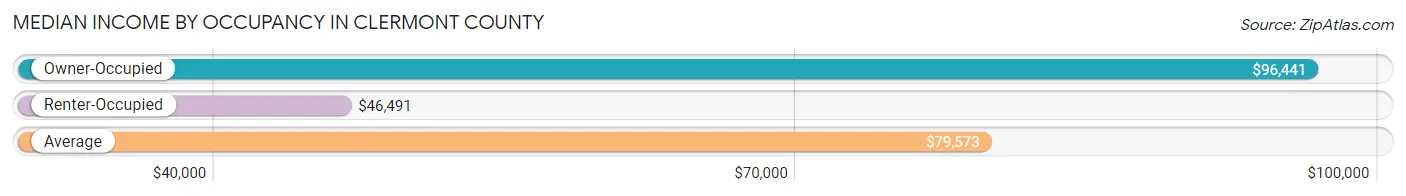
| Occupancy Type | # Households | Median Income |
| Owner-Occupied | 61,021 (73.8%) | $96,441 |
| Renter-Occupied | 21,691 (26.2%) | $46,491 |
| Average | 82,712 (100.0%) | $79,573 |
Occupancy by Householder Income Bracket in Clermont County
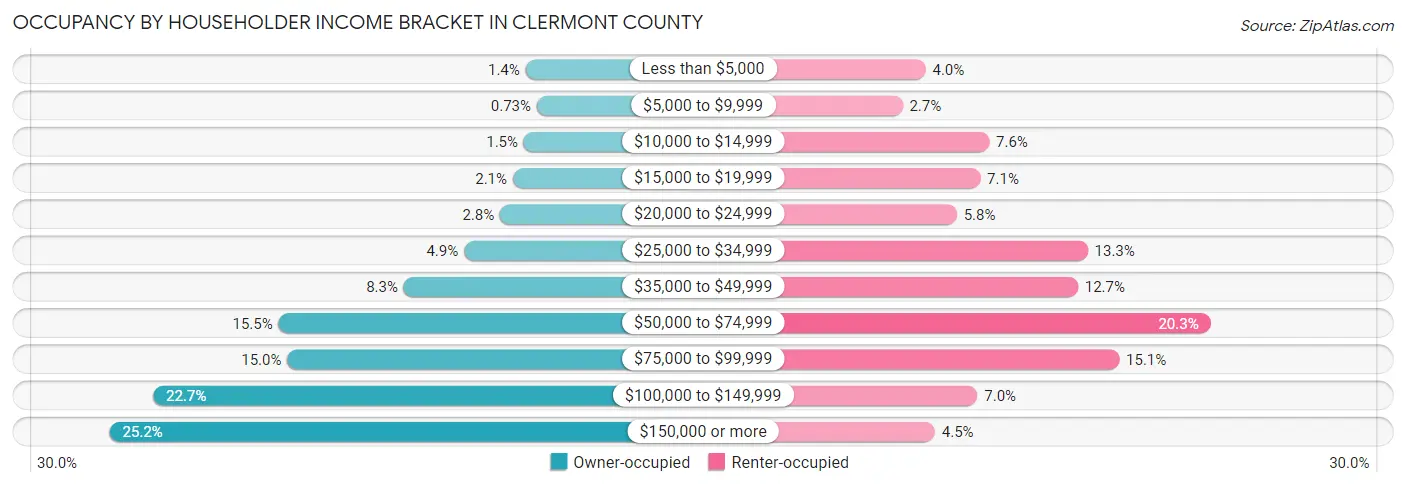
| Income Bracket | Owner-occupied | Renter-occupied |
| Less than $5,000 | 836 (1.4%) | 867 (4.0%) |
| $5,000 to $9,999 | 447 (0.7%) | 582 (2.7%) |
| $10,000 to $14,999 | 897 (1.5%) | 1,656 (7.6%) |
| $15,000 to $19,999 | 1,279 (2.1%) | 1,544 (7.1%) |
| $20,000 to $24,999 | 1,728 (2.8%) | 1,254 (5.8%) |
| $25,000 to $34,999 | 2,983 (4.9%) | 2,877 (13.3%) |
| $35,000 to $49,999 | 5,080 (8.3%) | 2,755 (12.7%) |
| $50,000 to $74,999 | 9,451 (15.5%) | 4,399 (20.3%) |
| $75,000 to $99,999 | 9,144 (15.0%) | 3,266 (15.1%) |
| $100,000 to $149,999 | 13,829 (22.7%) | 1,509 (7.0%) |
| $150,000 or more | 15,347 (25.2%) | 982 (4.5%) |
| Total | 61,021 (100.0%) | 21,691 (100.0%) |
Monthly Housing Cost Tiers in Clermont County
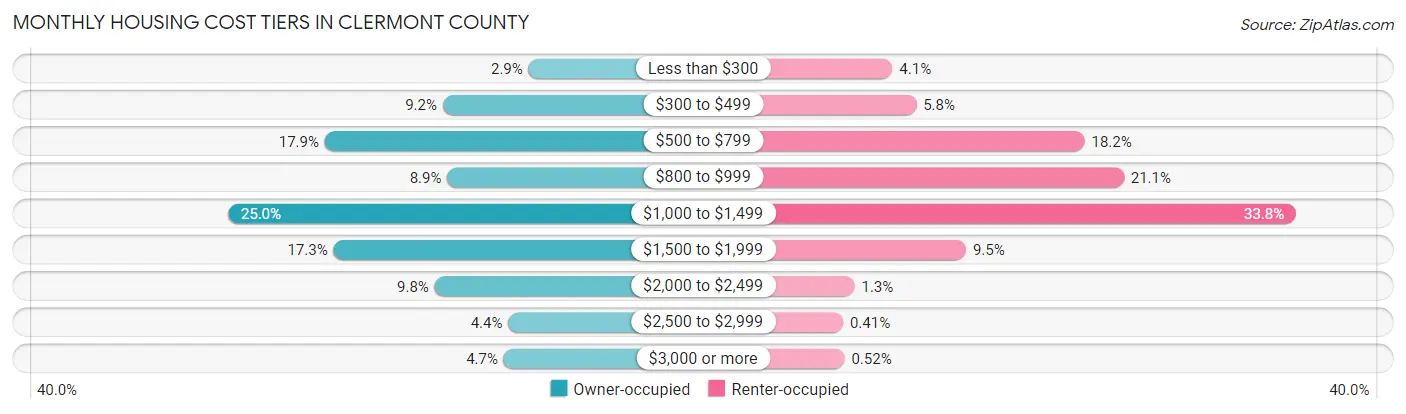
| Monthly Cost | Owner-occupied | Renter-occupied |
| Less than $300 | 1,755 (2.9%) | 878 (4.1%) |
| $300 to $499 | 5,612 (9.2%) | 1,257 (5.8%) |
| $500 to $799 | 10,918 (17.9%) | 3,947 (18.2%) |
| $800 to $999 | 5,413 (8.9%) | 4,574 (21.1%) |
| $1,000 to $1,499 | 15,271 (25.0%) | 7,328 (33.8%) |
| $1,500 to $1,999 | 10,527 (17.2%) | 2,054 (9.5%) |
| $2,000 to $2,499 | 5,979 (9.8%) | 274 (1.3%) |
| $2,500 to $2,999 | 2,672 (4.4%) | 88 (0.4%) |
| $3,000 or more | 2,874 (4.7%) | 113 (0.5%) |
| Total | 61,021 (100.0%) | 21,691 (100.0%) |
Physical Housing Characteristics in Clermont County
Housing Structures in Clermont County
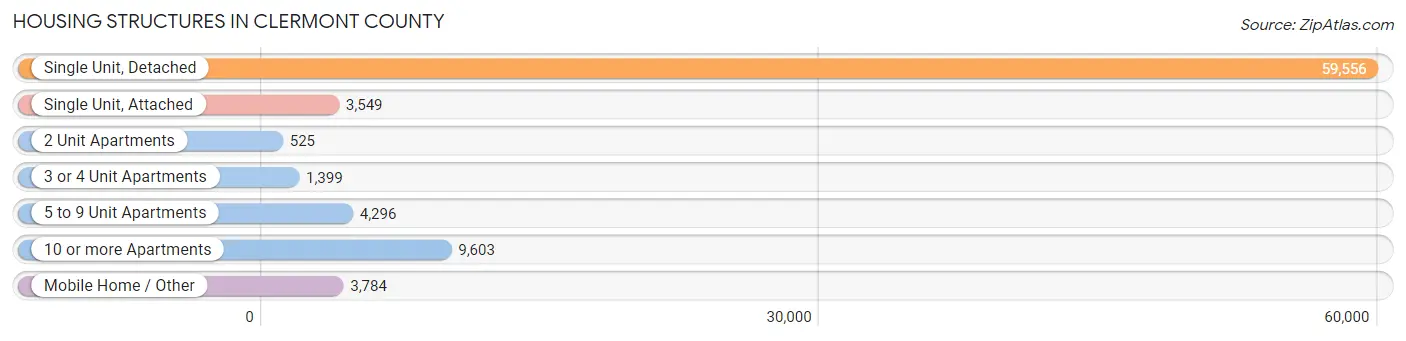
| Structure Type | # Housing Units | % Housing Units |
| Single Unit, Detached | 59,556 | 72.0% |
| Single Unit, Attached | 3,549 | 4.3% |
| 2 Unit Apartments | 525 | 0.6% |
| 3 or 4 Unit Apartments | 1,399 | 1.7% |
| 5 to 9 Unit Apartments | 4,296 | 5.2% |
| 10 or more Apartments | 9,603 | 11.6% |
| Mobile Home / Other | 3,784 | 4.6% |
| Total | 82,712 | 100.0% |
Housing Structures by Occupancy in Clermont County
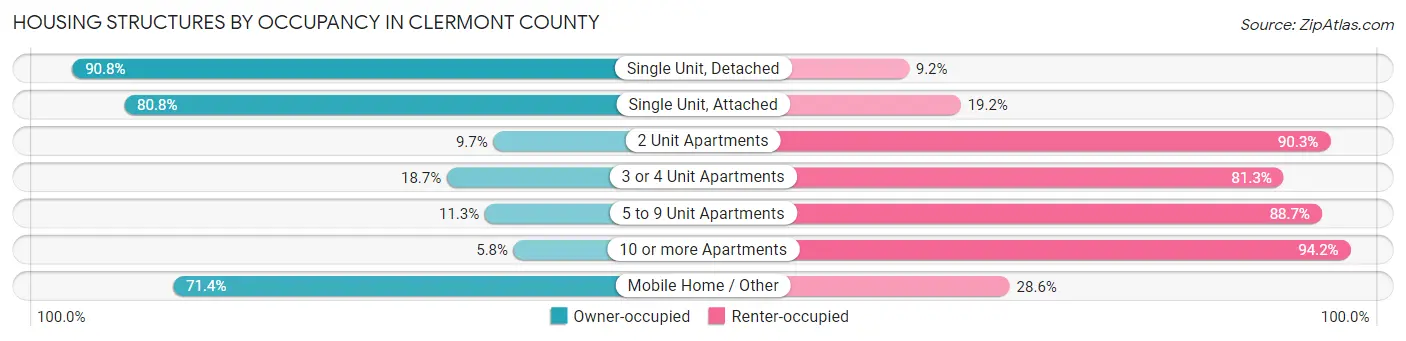
| Structure Type | Owner-occupied | Renter-occupied |
| Single Unit, Detached | 54,094 (90.8%) | 5,462 (9.2%) |
| Single Unit, Attached | 2,869 (80.8%) | 680 (19.2%) |
| 2 Unit Apartments | 51 (9.7%) | 474 (90.3%) |
| 3 or 4 Unit Apartments | 261 (18.7%) | 1,138 (81.3%) |
| 5 to 9 Unit Apartments | 487 (11.3%) | 3,809 (88.7%) |
| 10 or more Apartments | 557 (5.8%) | 9,046 (94.2%) |
| Mobile Home / Other | 2,702 (71.4%) | 1,082 (28.6%) |
| Total | 61,021 (73.8%) | 21,691 (26.2%) |
Housing Structures by Number of Rooms in Clermont County
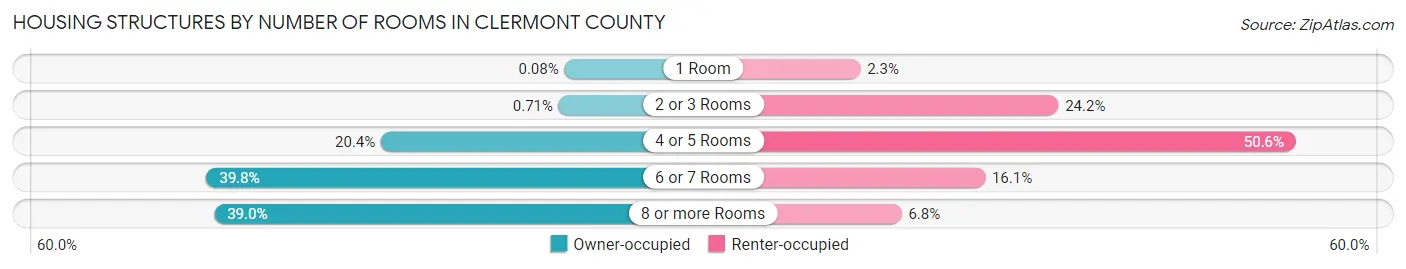
| Number of Rooms | Owner-occupied | Renter-occupied |
| 1 Room | 46 (0.1%) | 487 (2.2%) |
| 2 or 3 Rooms | 436 (0.7%) | 5,255 (24.2%) |
| 4 or 5 Rooms | 12,464 (20.4%) | 10,975 (50.6%) |
| 6 or 7 Rooms | 24,307 (39.8%) | 3,493 (16.1%) |
| 8 or more Rooms | 23,768 (39.0%) | 1,481 (6.8%) |
| Total | 61,021 (100.0%) | 21,691 (100.0%) |
Housing Structure by Heating Type in Clermont County
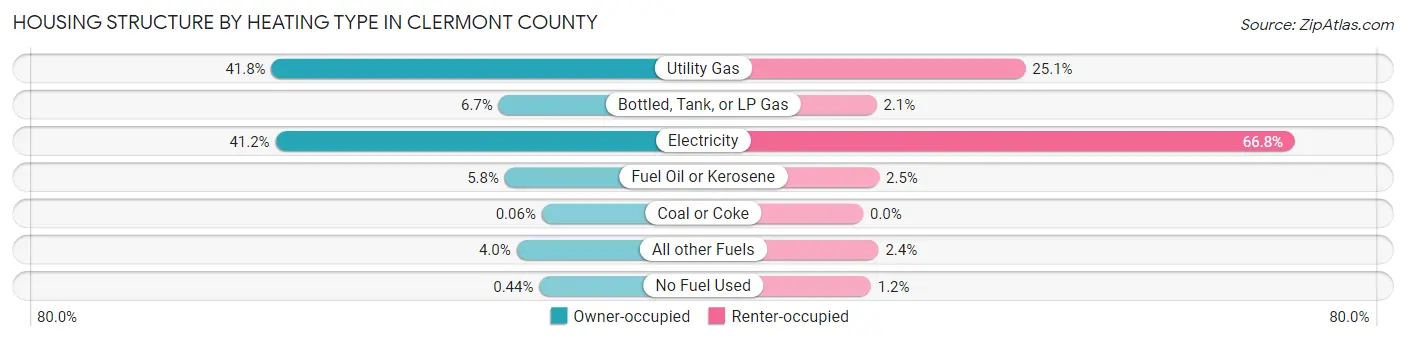
| Heating Type | Owner-occupied | Renter-occupied |
| Utility Gas | 25,532 (41.8%) | 5,444 (25.1%) |
| Bottled, Tank, or LP Gas | 4,102 (6.7%) | 450 (2.1%) |
| Electricity | 25,153 (41.2%) | 14,481 (66.8%) |
| Fuel Oil or Kerosene | 3,520 (5.8%) | 539 (2.5%) |
| Coal or Coke | 35 (0.1%) | 0 (0.0%) |
| All other Fuels | 2,412 (4.0%) | 516 (2.4%) |
| No Fuel Used | 267 (0.4%) | 261 (1.2%) |
| Total | 61,021 (100.0%) | 21,691 (100.0%) |
Household Vehicle Usage in Clermont County
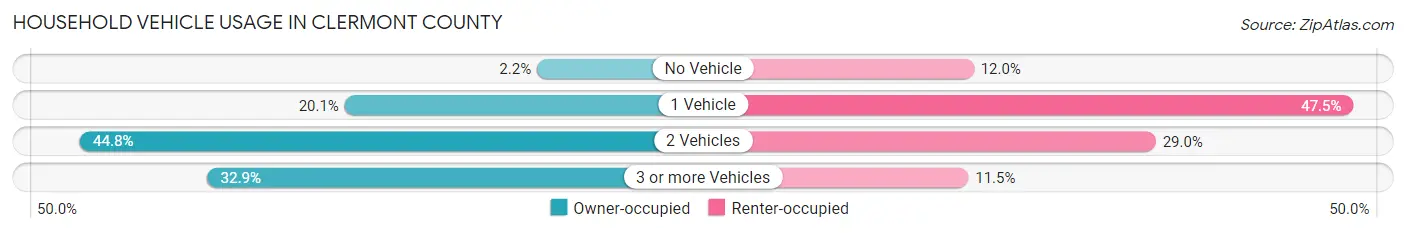
| Vehicles per Household | Owner-occupied | Renter-occupied |
| No Vehicle | 1,324 (2.2%) | 2,607 (12.0%) |
| 1 Vehicle | 12,276 (20.1%) | 10,292 (47.4%) |
| 2 Vehicles | 27,341 (44.8%) | 6,293 (29.0%) |
| 3 or more Vehicles | 20,080 (32.9%) | 2,499 (11.5%) |
| Total | 61,021 (100.0%) | 21,691 (100.0%) |
Real Estate & Mortgages in Clermont County
Real Estate and Mortgage Overview in Clermont County
| Characteristic | Without Mortgage | With Mortgage |
| Housing Units | 20,743 | 40,278 |
| Median Property Value | $198,900 | $237,400 |
| Median Household Income | $70,898 | $12,015 |
| Monthly Housing Costs | $589 | $2,860 |
| Real Estate Taxes | $2,677 | $694 |
Property Value by Mortgage Status in Clermont County
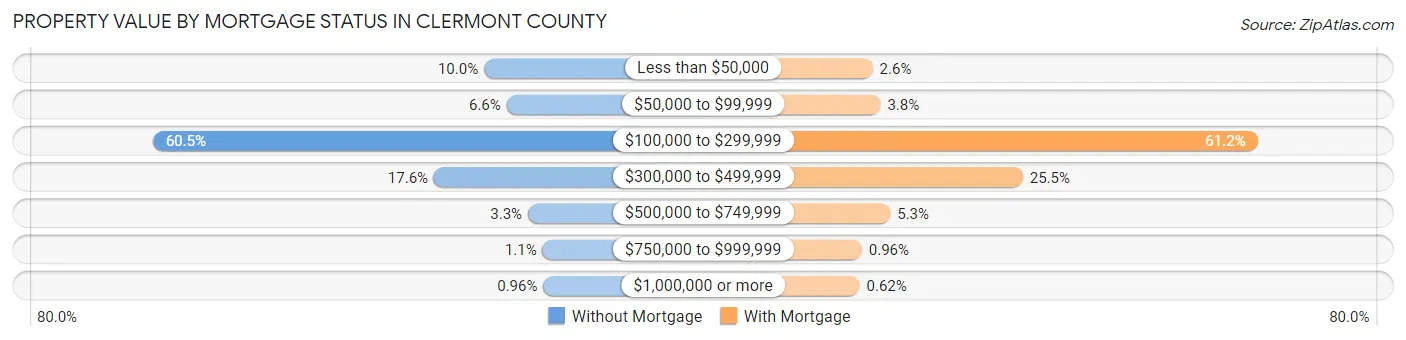
| Property Value | Without Mortgage | With Mortgage |
| Less than $50,000 | 2,074 (10.0%) | 1,052 (2.6%) |
| $50,000 to $99,999 | 1,358 (6.6%) | 1,531 (3.8%) |
| $100,000 to $299,999 | 12,544 (60.5%) | 24,665 (61.2%) |
| $300,000 to $499,999 | 3,657 (17.6%) | 10,265 (25.5%) |
| $500,000 to $749,999 | 685 (3.3%) | 2,129 (5.3%) |
| $750,000 to $999,999 | 225 (1.1%) | 385 (1.0%) |
| $1,000,000 or more | 200 (1.0%) | 251 (0.6%) |
| Total | 20,743 (100.0%) | 40,278 (100.0%) |
Household Income by Mortgage Status in Clermont County
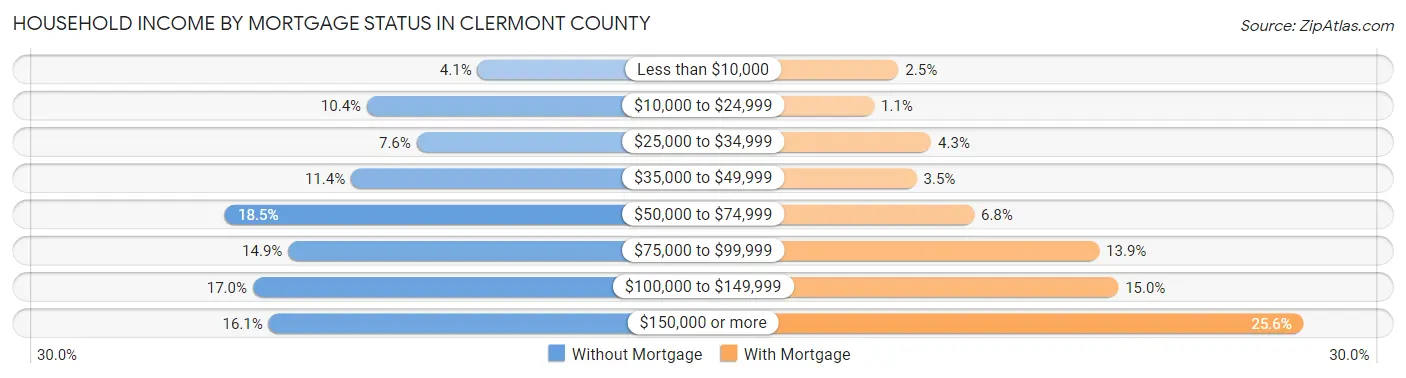
| Household Income | Without Mortgage | With Mortgage |
| Less than $10,000 | 855 (4.1%) | 987 (2.5%) |
| $10,000 to $24,999 | 2,165 (10.4%) | 428 (1.1%) |
| $25,000 to $34,999 | 1,577 (7.6%) | 1,739 (4.3%) |
| $35,000 to $49,999 | 2,354 (11.4%) | 1,406 (3.5%) |
| $50,000 to $74,999 | 3,845 (18.5%) | 2,726 (6.8%) |
| $75,000 to $99,999 | 3,098 (14.9%) | 5,606 (13.9%) |
| $100,000 to $149,999 | 3,517 (17.0%) | 6,046 (15.0%) |
| $150,000 or more | 3,332 (16.1%) | 10,312 (25.6%) |
| Total | 20,743 (100.0%) | 40,278 (100.0%) |
Property Value to Household Income Ratio in Clermont County
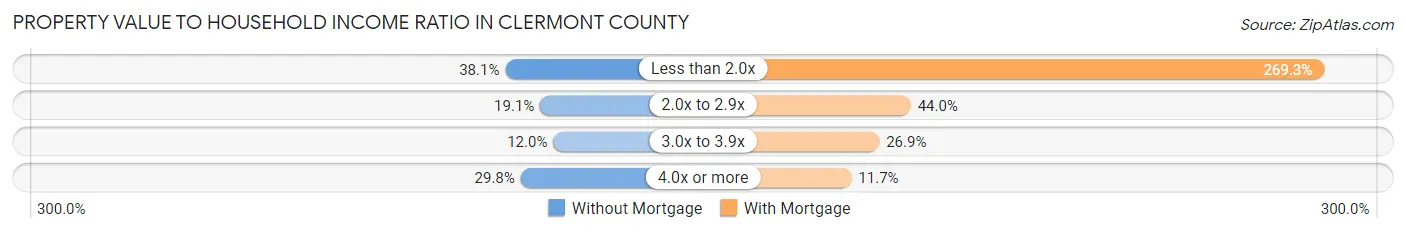
| Value-to-Income Ratio | Without Mortgage | With Mortgage |
| Less than 2.0x | 7,910 (38.1%) | 108,454 (269.3%) |
| 2.0x to 2.9x | 3,966 (19.1%) | 17,729 (44.0%) |
| 3.0x to 3.9x | 2,488 (12.0%) | 10,819 (26.9%) |
| 4.0x or more | 6,171 (29.7%) | 4,714 (11.7%) |
| Total | 20,743 (100.0%) | 40,278 (100.0%) |
Real Estate Taxes by Mortgage Status in Clermont County
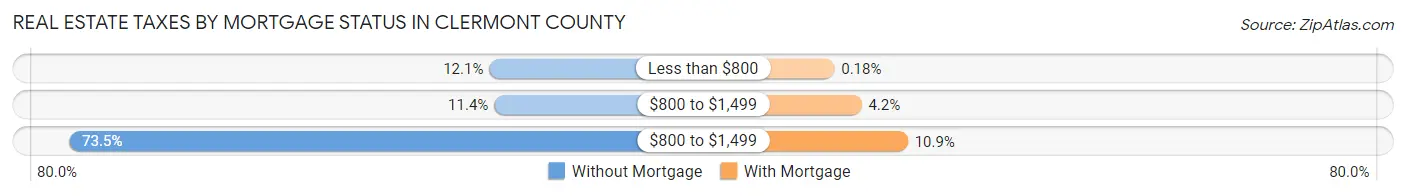
| Property Taxes | Without Mortgage | With Mortgage |
| Less than $800 | 2,513 (12.1%) | 71 (0.2%) |
| $800 to $1,499 | 2,362 (11.4%) | 1,673 (4.2%) |
| $800 to $1,499 | 15,245 (73.5%) | 4,395 (10.9%) |
| Total | 20,743 (100.0%) | 40,278 (100.0%) |
Health & Disability in Clermont County
Health Insurance Coverage by Age in Clermont County
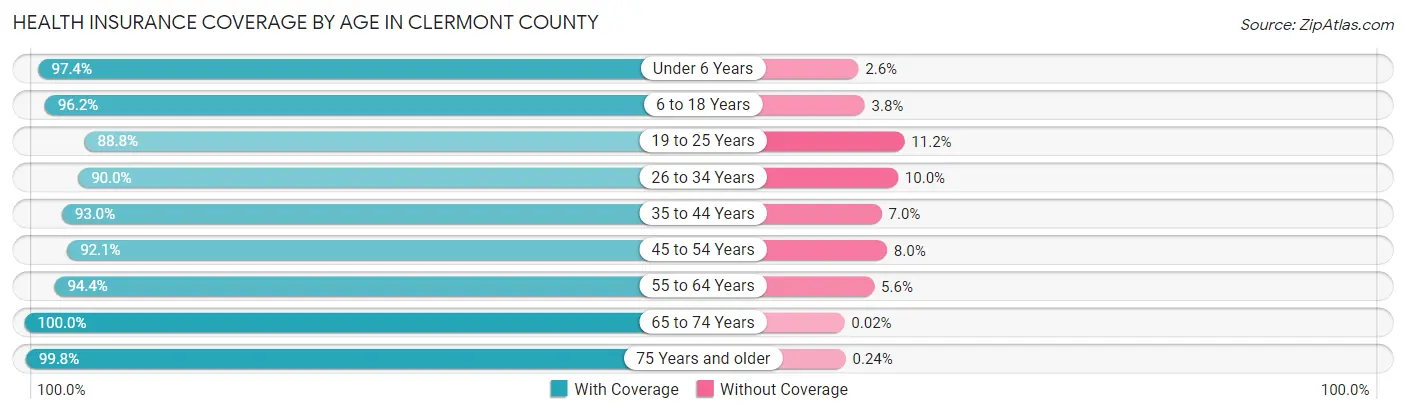
| Age Bracket | With Coverage | Without Coverage |
| Under 6 Years | 13,964 (97.4%) | 375 (2.6%) |
| 6 to 18 Years | 33,847 (96.2%) | 1,333 (3.8%) |
| 19 to 25 Years | 14,758 (88.8%) | 1,864 (11.2%) |
| 26 to 34 Years | 20,757 (90.0%) | 2,306 (10.0%) |
| 35 to 44 Years | 24,838 (93.0%) | 1,859 (7.0%) |
| 45 to 54 Years | 24,240 (92.0%) | 2,093 (8.0%) |
| 55 to 64 Years | 28,077 (94.4%) | 1,657 (5.6%) |
| 65 to 74 Years | 21,933 (100.0%) | 5 (0.0%) |
| 75 Years and older | 13,435 (99.8%) | 32 (0.2%) |
| Total | 195,849 (94.4%) | 11,524 (5.6%) |
Health Insurance Coverage by Citizenship Status in Clermont County
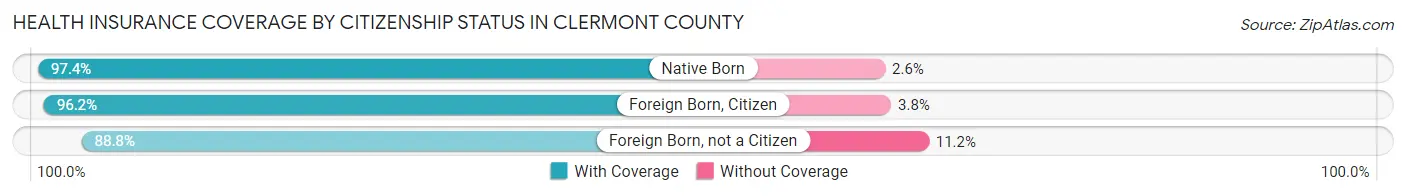
| Citizenship Status | With Coverage | Without Coverage |
| Native Born | 13,964 (97.4%) | 375 (2.6%) |
| Foreign Born, Citizen | 33,847 (96.2%) | 1,333 (3.8%) |
| Foreign Born, not a Citizen | 14,758 (88.8%) | 1,864 (11.2%) |
Health Insurance Coverage by Household Income in Clermont County
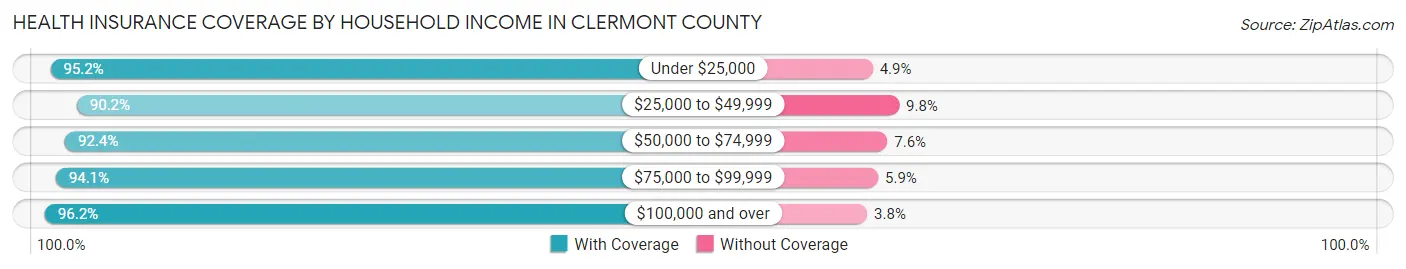
| Household Income | With Coverage | Without Coverage |
| Under $25,000 | 16,866 (95.2%) | 860 (4.9%) |
| $25,000 to $49,999 | 23,682 (90.2%) | 2,574 (9.8%) |
| $50,000 to $74,999 | 28,391 (92.4%) | 2,336 (7.6%) |
| $75,000 to $99,999 | 30,155 (94.1%) | 1,876 (5.9%) |
| $100,000 and over | 96,292 (96.2%) | 3,815 (3.8%) |
Public vs Private Health Insurance Coverage by Age in Clermont County
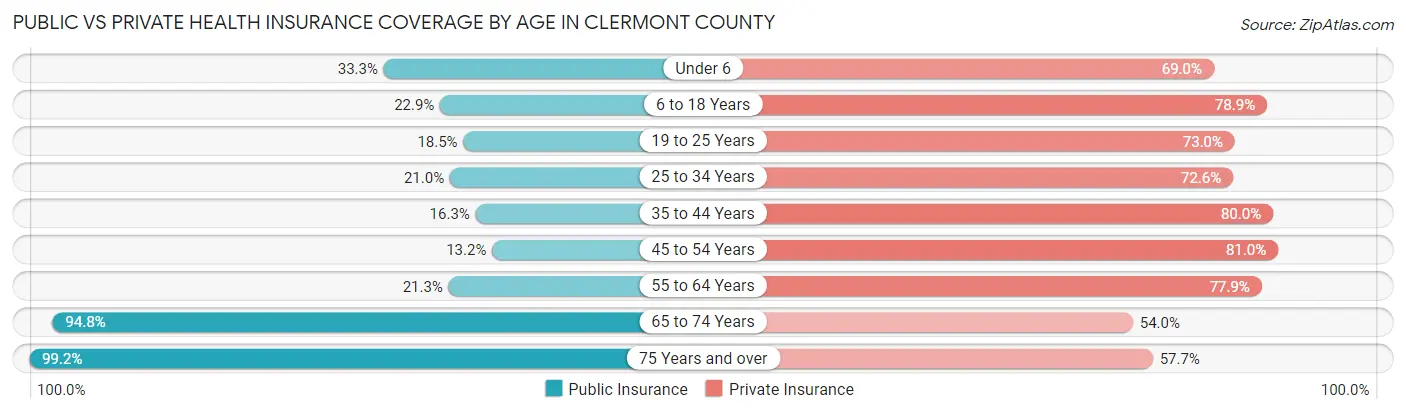
| Age Bracket | Public Insurance | Private Insurance |
| Under 6 | 4,779 (33.3%) | 9,900 (69.0%) |
| 6 to 18 Years | 8,042 (22.9%) | 27,763 (78.9%) |
| 19 to 25 Years | 3,082 (18.5%) | 12,126 (73.0%) |
| 25 to 34 Years | 4,853 (21.0%) | 16,748 (72.6%) |
| 35 to 44 Years | 4,345 (16.3%) | 21,368 (80.0%) |
| 45 to 54 Years | 3,477 (13.2%) | 21,324 (81.0%) |
| 55 to 64 Years | 6,326 (21.3%) | 23,173 (77.9%) |
| 65 to 74 Years | 20,803 (94.8%) | 11,849 (54.0%) |
| 75 Years and over | 13,356 (99.2%) | 7,772 (57.7%) |
| Total | 69,063 (33.3%) | 152,023 (73.3%) |
Disability Status by Sex by Age in Clermont County
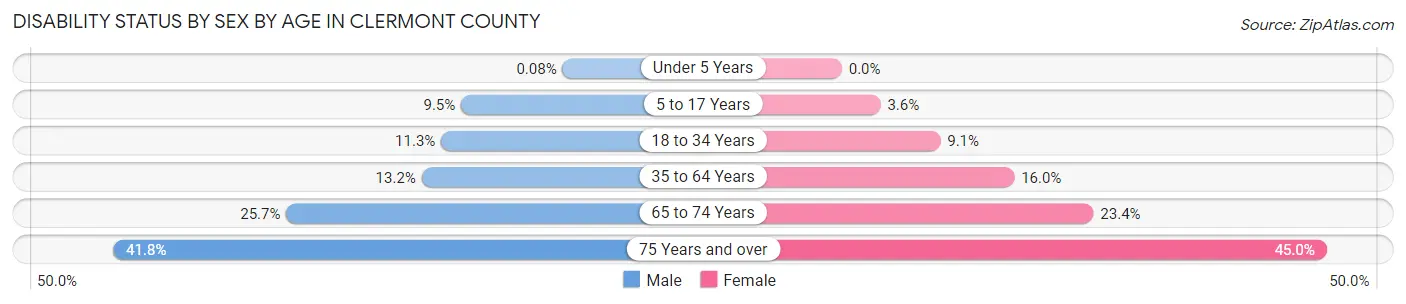
| Age Bracket | Male | Female |
| Under 5 Years | 5 (0.1%) | 0 (0.0%) |
| 5 to 17 Years | 1,722 (9.5%) | 616 (3.6%) |
| 18 to 34 Years | 2,452 (11.3%) | 1,886 (9.1%) |
| 35 to 64 Years | 5,446 (13.2%) | 6,616 (16.0%) |
| 65 to 74 Years | 2,694 (25.7%) | 2,675 (23.4%) |
| 75 Years and over | 2,373 (41.8%) | 3,505 (45.0%) |
Disability Class by Sex by Age in Clermont County
Disability Class: Hearing Difficulty
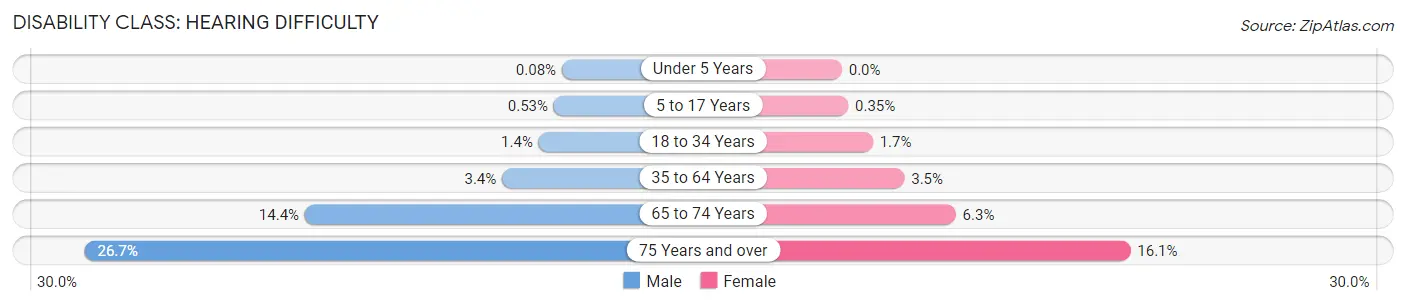
| Age Bracket | Male | Female |
| Under 5 Years | 5 (0.1%) | 0 (0.0%) |
| 5 to 17 Years | 96 (0.5%) | 60 (0.4%) |
| 18 to 34 Years | 297 (1.4%) | 356 (1.7%) |
| 35 to 64 Years | 1,413 (3.4%) | 1,438 (3.5%) |
| 65 to 74 Years | 1,508 (14.4%) | 726 (6.3%) |
| 75 Years and over | 1,514 (26.7%) | 1,252 (16.1%) |
Disability Class: Vision Difficulty

| Age Bracket | Male | Female |
| Under 5 Years | 0 (0.0%) | 0 (0.0%) |
| 5 to 17 Years | 92 (0.5%) | 64 (0.4%) |
| 18 to 34 Years | 325 (1.5%) | 386 (1.9%) |
| 35 to 64 Years | 1,508 (3.6%) | 1,163 (2.8%) |
| 65 to 74 Years | 474 (4.5%) | 591 (5.2%) |
| 75 Years and over | 248 (4.4%) | 674 (8.6%) |
Disability Class: Cognitive Difficulty
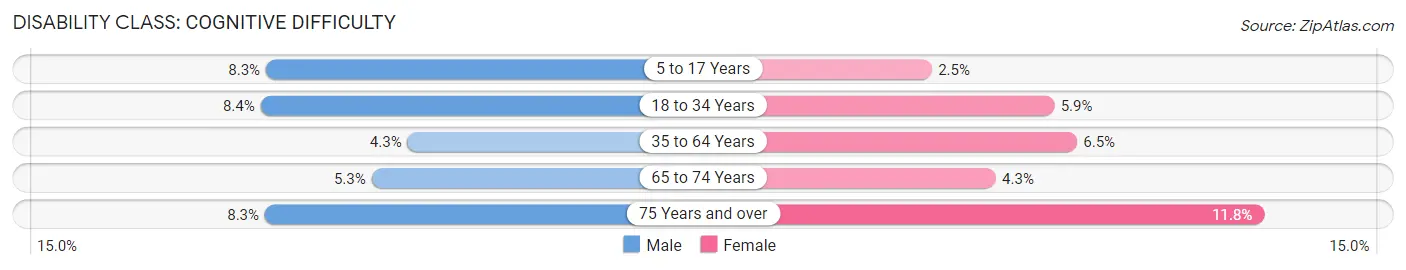
| Age Bracket | Male | Female |
| 5 to 17 Years | 1,502 (8.3%) | 428 (2.5%) |
| 18 to 34 Years | 1,823 (8.4%) | 1,218 (5.9%) |
| 35 to 64 Years | 1,797 (4.3%) | 2,700 (6.5%) |
| 65 to 74 Years | 560 (5.3%) | 489 (4.3%) |
| 75 Years and over | 472 (8.3%) | 916 (11.8%) |
Disability Class: Ambulatory Difficulty
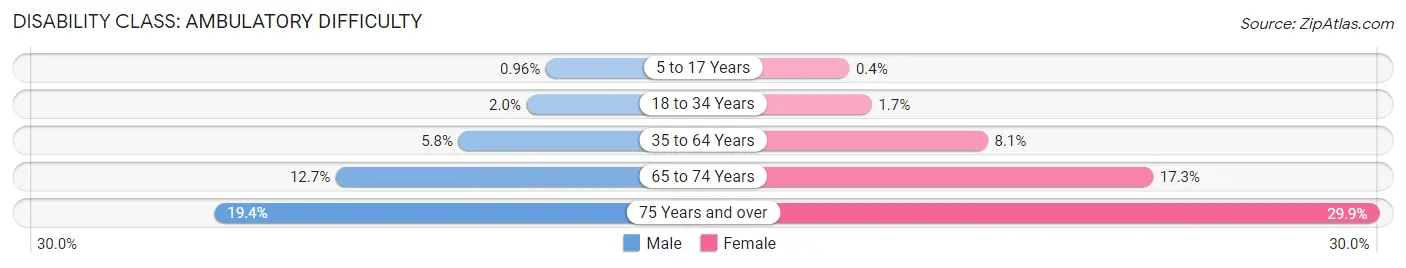
| Age Bracket | Male | Female |
| 5 to 17 Years | 174 (1.0%) | 69 (0.4%) |
| 18 to 34 Years | 441 (2.0%) | 340 (1.7%) |
| 35 to 64 Years | 2,411 (5.8%) | 3,356 (8.1%) |
| 65 to 74 Years | 1,327 (12.7%) | 1,985 (17.3%) |
| 75 Years and over | 1,103 (19.4%) | 2,331 (29.9%) |
Disability Class: Self-Care Difficulty
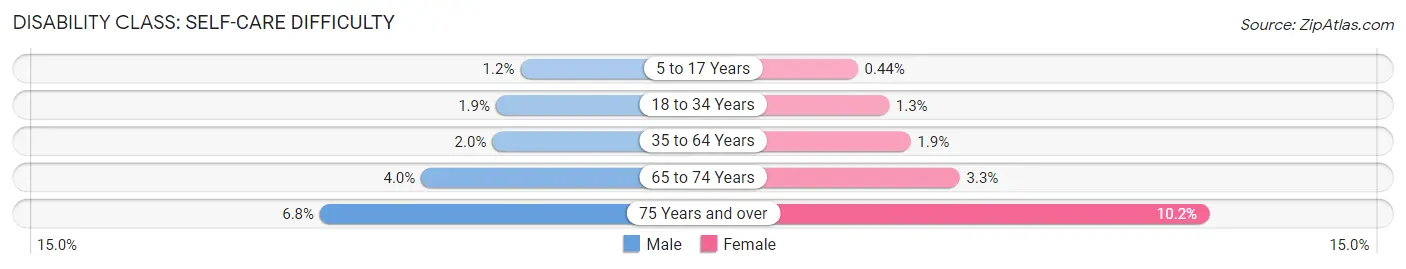
| Age Bracket | Male | Female |
| 5 to 17 Years | 217 (1.2%) | 76 (0.4%) |
| 18 to 34 Years | 407 (1.9%) | 271 (1.3%) |
| 35 to 64 Years | 821 (2.0%) | 789 (1.9%) |
| 65 to 74 Years | 415 (4.0%) | 376 (3.3%) |
| 75 Years and over | 385 (6.8%) | 796 (10.2%) |
Technology Access in Clermont County
Computing Device Access in Clermont County

| Device Type | # Households | % Households |
| Desktop or Laptop | 67,298 | 81.4% |
| Smartphone | 72,116 | 87.2% |
| Tablet | 56,119 | 67.8% |
| No Computing Device | 4,773 | 5.8% |
| Total | 82,712 | 100.0% |
Internet Access in Clermont County
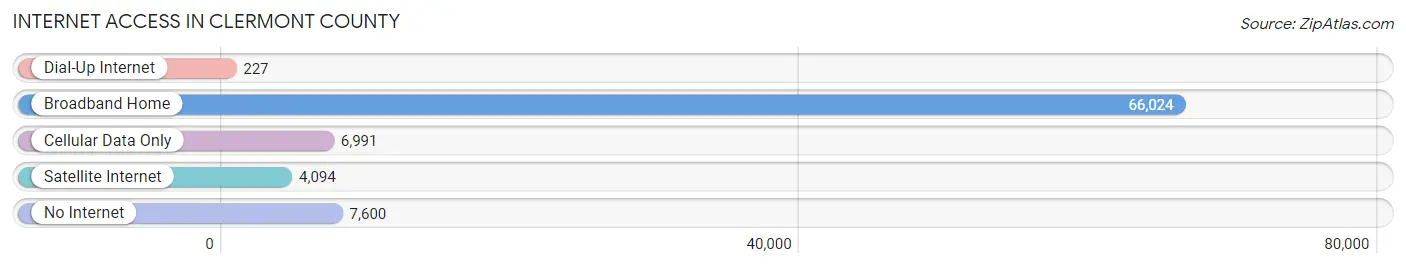
| Internet Type | # Households | % Households |
| Dial-Up Internet | 227 | 0.3% |
| Broadband Home | 66,024 | 79.8% |
| Cellular Data Only | 6,991 | 8.5% |
| Satellite Internet | 4,094 | 5.0% |
| No Internet | 7,600 | 9.2% |
| Total | 82,712 | 100.0% |
Clermont County Summary
Clermont County, Ohio is located in the southwestern corner of the state, just east of Cincinnati. It is bordered by Hamilton, Warren, Brown, and Clinton counties. The county seat is Batavia, and the largest city is Milford. The county was established in 1800 and named after Clermont-Ferrand, France.
Geography
Clermont County is located in the Appalachian Plateau region of Ohio. It is mostly rural, with rolling hills and valleys. The county is drained by the Little Miami River and its tributaries. The highest point in the county is located in the village of Bethel, at 1,068 feet above sea level. The county covers an area of 437 square miles, with a population of 197,363 as of the 2020 census.
Economy
Clermont County is home to a diverse economy. The county is home to several large employers, including Procter & Gamble, GE Aviation, and the Clermont County Airport. The county is also home to several small businesses, including manufacturing, retail, and service industries. Agriculture is also an important part of the county's economy, with corn, soybeans, and hay being the main crops.
Demographics
As of the 2020 census, Clermont County had a population of 197,363. The racial makeup of the county was 90.3% White, 4.2% Black or African American, 0.4% Native American, 2.2% Asian, 0.1% Pacific Islander, 1.2% from other races, and 1.7% from two or more races. Hispanic or Latino of any race were 3.2% of the population.
The median income for a household in the county was $60,945, and the median income for a family was $71,945. The per capita income for the county was $27,945. About 6.2% of families and 8.3% of the population were below the poverty line, including 10.2% of those under age 18 and 6.2% of those age 65 or over.
Education
Clermont County is served by the Clermont County Educational Service Center, which provides educational services to the county's public school districts. The county is also home to several private schools, including the Clermont Northeastern Local School District, the New Richmond Exempted Village School District, and the Bethel-Tate Local School District.
The county is also home to several higher education institutions, including the University of Cincinnati Clermont College, the University of Cincinnati Clermont College East, and the University of Cincinnati Clermont College West.
Conclusion
Clermont County, Ohio is a rural county located in the southwestern corner of the state. It is home to a diverse economy, with large employers, small businesses, and agriculture. The county has a population of 197,363, with a median income of $60,945. The county is served by several public and private schools, as well as several higher education institutions.
Common Questions
What is the Total Population of Clermont County?
Total Population of Clermont County is 208,851.
What is the Total Male Population of Clermont County?
Total Male Population of Clermont County is 103,830.
What is the Total Female Population of Clermont County?
Total Female Population of Clermont County is 105,021.
What is the Ratio of Males per 100 Females in Clermont County?
There are 98.87 Males per 100 Females in Clermont County.
What is the Ratio of Females per 100 Males in Clermont County?
There are 101.15 Females per 100 Males in Clermont County.
What is the Median Population Age in Clermont County?
Median Population Age in Clermont County is 40.5 Years.
What is the Average Family Size in Clermont County
Average Family Size in Clermont County is 3.0 People.
What is the Average Household Size in Clermont County
Average Household Size in Clermont County is 2.5 People.
What is Per Capita Income in Clermont County?
Per Capita income in Clermont County is $41,566.
What is the Median Family Income in Clermont County?
Median Family Income in Clermont County is $100,272.
What is the Median Household income in Clermont County?
Median Household Income in Clermont County is $79,573.
What is Income or Wage Gap in Clermont County?
Income or Wage Gap in Clermont County is 28.9%.
Women in Clermont County earn 71.1 cents for every dollar earned by a man.
What is Family Income Deficit in Clermont County?
Family Income Deficit in Clermont County is $11,459.
Families that are below poverty line in Clermont County earn $11,459 less on average than the poverty threshold level.
What is Inequality or Gini Index in Clermont County?
Inequality or Gini Index in Clermont County is 0.44.
How Large is the Labor Force in Clermont County?
There are 109,339 People in the Labor Forcein in Clermont County.
What is the Percentage of People in the Labor Force in Clermont County?
65.2% of People are in the Labor Force in Clermont County.
What is the Unemployment Rate in Clermont County?
Unemployment Rate in Clermont County is 4.1%.