Champaign County, OH
Champaign County Map
Champaign County Overview
38,715
TOTAL POPULATION
19,337
MALE POPULATION
19,378
FEMALE POPULATION
99.79
MALES / 100 FEMALES
100.21
FEMALES / 100 MALES
41.7
MEDIAN AGE
2.9
AVG FAMILY SIZE
2.4
AVG HOUSEHOLD SIZE
$33,377
PER CAPITA INCOME
$83,504
AVG FAMILY INCOME
$70,486
AVG HOUSEHOLD INCOME
30.1%
WAGE / INCOME GAP [ % ]
69.9¢/ $1
WAGE / INCOME GAP [ $ ]
$10,567
FAMILY INCOME DEFICIT
0.38
INEQUALITY / GINI INDEX
19,818
LABOR FORCE [ PEOPLE ]
63.0%
PERCENT IN LABOR FORCE
4.5%
UNEMPLOYMENT RATE
Champaign County Area Codes
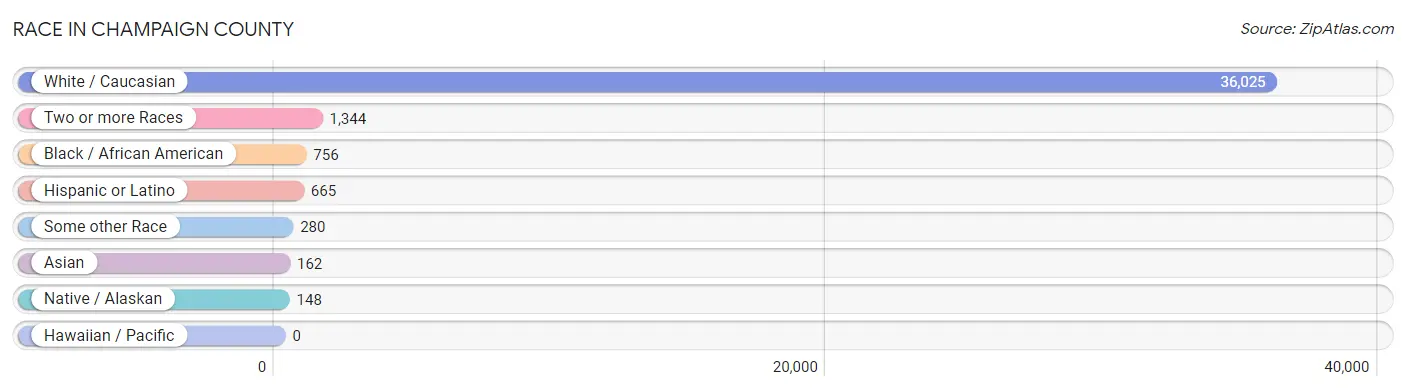
Race in Champaign County
The most populous races in Champaign County are White / Caucasian (36,025 | 93.0%), Two or more Races (1,344 | 3.5%), and Black / African American (756 | 1.9%).
| Race | # Population | % Population |
| Asian | 162 | 0.4% |
| Black / African American | 756 | 1.9% |
| Hawaiian / Pacific | 0 | 0.0% |
| Hispanic or Latino | 665 | 1.7% |
| Native / Alaskan | 148 | 0.4% |
| White / Caucasian | 36,025 | 93.0% |
| Two or more Races | 1,344 | 3.5% |
| Some other Race | 280 | 0.7% |
| Total | 38,715 | 100.0% |
Ancestry in Champaign County
The most populous ancestries reported in Champaign County are German (8,686 | 22.4%), Irish (5,632 | 14.5%), English (5,237 | 13.5%), American (3,220 | 8.3%), and Italian (1,077 | 2.8%), together accounting for 61.6% of all Champaign County residents.

| Ancestry | # Population | % Population |
| African | 89 | 0.2% |
| American | 3,220 | 8.3% |
| Apache | 53 | 0.1% |
| Arab | 4 | 0.0% |
| Australian | 28 | 0.1% |
| Austrian | 24 | 0.1% |
| Belgian | 37 | 0.1% |
| Bhutanese | 3 | 0.0% |
| Blackfeet | 58 | 0.2% |
| Brazilian | 13 | 0.0% |
| British | 178 | 0.5% |
| Bulgarian | 4 | 0.0% |
| Burmese | 76 | 0.2% |
| Canadian | 23 | 0.1% |
| Celtic | 5 | 0.0% |
| Central American | 44 | 0.1% |
| Central American Indian | 3 | 0.0% |
| Cherokee | 81 | 0.2% |
| Chickasaw | 15 | 0.0% |
| Chilean | 46 | 0.1% |
| Creek | 2 | 0.0% |
| Croatian | 3 | 0.0% |
| Cuban | 62 | 0.2% |
| Czech | 30 | 0.1% |
| Czechoslovakian | 8 | 0.0% |
| Danish | 8 | 0.0% |
| Dutch | 852 | 2.2% |
| Eastern European | 54 | 0.1% |
| English | 5,237 | 13.5% |
| European | 806 | 2.1% |
| Finnish | 30 | 0.1% |
| French | 592 | 1.5% |
| French Canadian | 85 | 0.2% |
| German | 8,686 | 22.4% |
| Greek | 150 | 0.4% |
| Guatemalan | 19 | 0.1% |
| Honduran | 25 | 0.1% |
| Hungarian | 164 | 0.4% |
| Icelander | 2 | 0.0% |
| Indian (Asian) | 11 | 0.0% |
| Irish | 5,632 | 14.5% |
| Italian | 1,077 | 2.8% |
| Korean | 112 | 0.3% |
| Laotian | 10 | 0.0% |
| Lebanese | 4 | 0.0% |
| Mexican | 432 | 1.1% |
| Native Hawaiian | 130 | 0.3% |
| Northern European | 63 | 0.2% |
| Norwegian | 35 | 0.1% |
| Pennsylvania German | 38 | 0.1% |
| Peruvian | 13 | 0.0% |
| Polish | 465 | 1.2% |
| Portuguese | 16 | 0.0% |
| Puerto Rican | 68 | 0.2% |
| Romanian | 32 | 0.1% |
| Russian | 49 | 0.1% |
| Scandinavian | 40 | 0.1% |
| Scotch-Irish | 357 | 0.9% |
| Scottish | 951 | 2.5% |
| Sioux | 1 | 0.0% |
| Slavic | 28 | 0.1% |
| Slovak | 27 | 0.1% |
| Slovene | 19 | 0.1% |
| South American | 59 | 0.2% |
| Sri Lankan | 6 | 0.0% |
| Subsaharan African | 95 | 0.3% |
| Swedish | 174 | 0.4% |
| Swiss | 80 | 0.2% |
| Thai | 56 | 0.1% |
| Ukrainian | 3 | 0.0% |
| Welsh | 251 | 0.6% |
| Yugoslavian | 12 | 0.0% | View All 72 Rows |
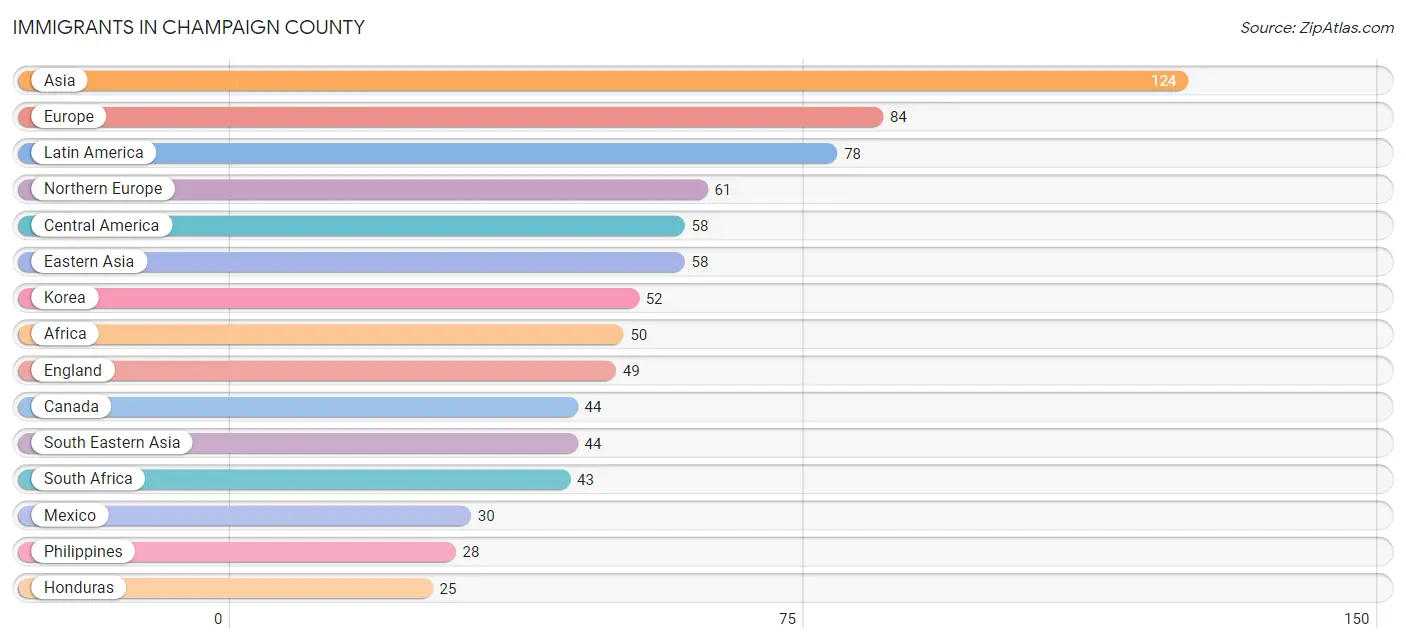
Immigrants in Champaign County
The most numerous immigrant groups reported in Champaign County came from Asia (124 | 0.3%), Europe (84 | 0.2%), Latin America (78 | 0.2%), Northern Europe (61 | 0.2%), and Central America (58 | 0.2%), together accounting for 1.1% of all Champaign County residents.
| Immigration Origin | # Population | % Population |
| Africa | 50 | 0.1% |
| Asia | 124 | 0.3% |
| Australia | 7 | 0.0% |
| Brazil | 7 | 0.0% |
| Canada | 44 | 0.1% |
| Central America | 58 | 0.2% |
| China | 6 | 0.0% |
| Eastern Asia | 58 | 0.2% |
| Eastern Europe | 8 | 0.0% |
| England | 49 | 0.1% |
| Europe | 84 | 0.2% |
| France | 7 | 0.0% |
| Germany | 2 | 0.0% |
| Greece | 2 | 0.0% |
| Guatemala | 3 | 0.0% |
| Honduras | 25 | 0.1% |
| Indonesia | 10 | 0.0% |
| Korea | 52 | 0.1% |
| Latin America | 78 | 0.2% |
| Mexico | 30 | 0.1% |
| Netherlands | 4 | 0.0% |
| Northern Europe | 61 | 0.2% |
| Oceania | 7 | 0.0% |
| Peru | 13 | 0.0% |
| Philippines | 28 | 0.1% |
| Russia | 4 | 0.0% |
| South Africa | 43 | 0.1% |
| South America | 20 | 0.1% |
| South Eastern Asia | 44 | 0.1% |
| Southern Europe | 2 | 0.0% |
| Ukraine | 4 | 0.0% |
| Vietnam | 6 | 0.0% |
| Western Africa | 7 | 0.0% |
| Western Europe | 13 | 0.0% | View All 34 Rows |
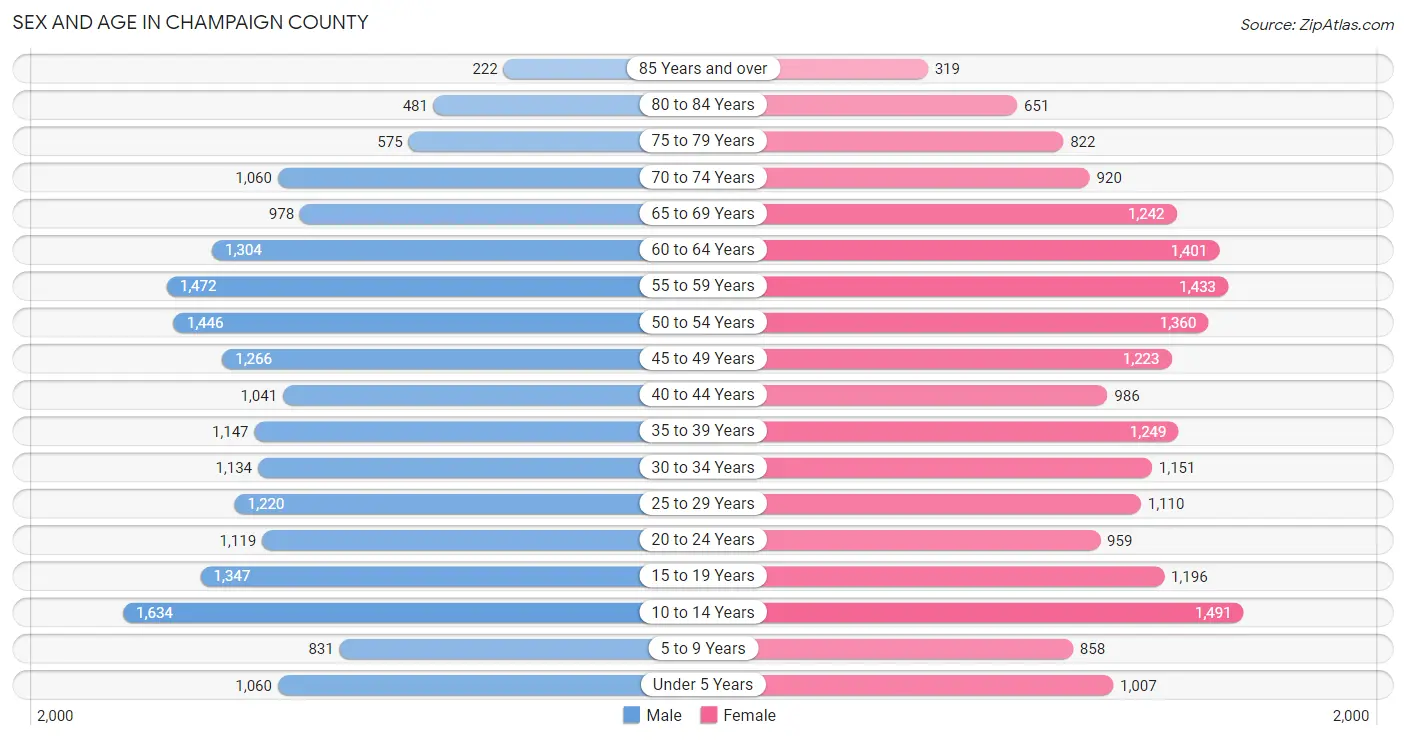
Sex and Age in Champaign County
Sex and Age in Champaign County
The most populous age groups in Champaign County are 10 to 14 Years (1,634 | 8.5%) for men and 10 to 14 Years (1,491 | 7.7%) for women.
| Age Bracket | Male | Female |
| Under 5 Years | 1,060 (5.5%) | 1,007 (5.2%) |
| 5 to 9 Years | 831 (4.3%) | 858 (4.4%) |
| 10 to 14 Years | 1,634 (8.5%) | 1,491 (7.7%) |
| 15 to 19 Years | 1,347 (7.0%) | 1,196 (6.2%) |
| 20 to 24 Years | 1,119 (5.8%) | 959 (5.0%) |
| 25 to 29 Years | 1,220 (6.3%) | 1,110 (5.7%) |
| 30 to 34 Years | 1,134 (5.9%) | 1,151 (5.9%) |
| 35 to 39 Years | 1,147 (5.9%) | 1,249 (6.5%) |
| 40 to 44 Years | 1,041 (5.4%) | 986 (5.1%) |
| 45 to 49 Years | 1,266 (6.6%) | 1,223 (6.3%) |
| 50 to 54 Years | 1,446 (7.5%) | 1,360 (7.0%) |
| 55 to 59 Years | 1,472 (7.6%) | 1,433 (7.4%) |
| 60 to 64 Years | 1,304 (6.7%) | 1,401 (7.2%) |
| 65 to 69 Years | 978 (5.1%) | 1,242 (6.4%) |
| 70 to 74 Years | 1,060 (5.5%) | 920 (4.8%) |
| 75 to 79 Years | 575 (3.0%) | 822 (4.2%) |
| 80 to 84 Years | 481 (2.5%) | 651 (3.4%) |
| 85 Years and over | 222 (1.1%) | 319 (1.7%) |
| Total | 19,337 (100.0%) | 19,378 (100.0%) |
Families and Households in Champaign County
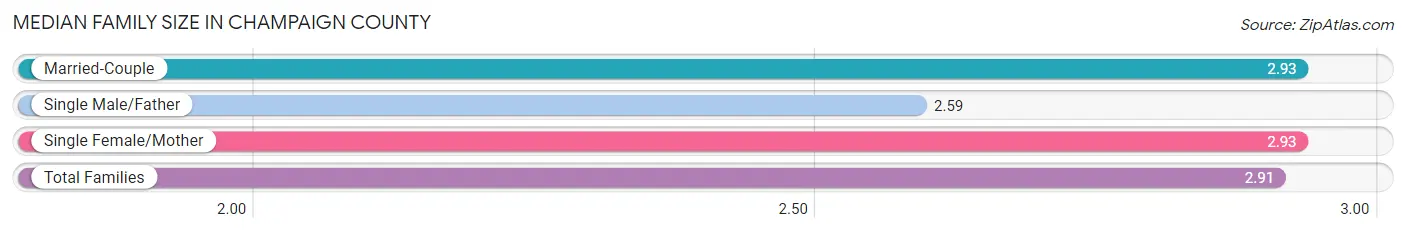
Median Family Size in Champaign County
The median family size in Champaign County is 2.91 persons per family, with married-couple families (8,223 | 76.6%) accounting for the largest median family size of 2.93 persons per family. On the other hand, single male/father families (643 | 6.0%) represent the smallest median family size with 2.59 persons per family.
| Family Type | # Families | Family Size |
| Married-Couple | 8,223 (76.6%) | 2.93 |
| Single Male/Father | 643 (6.0%) | 2.59 |
| Single Female/Mother | 1,870 (17.4%) | 2.93 |
| Total Families | 10,736 (100.0%) | 2.91 |
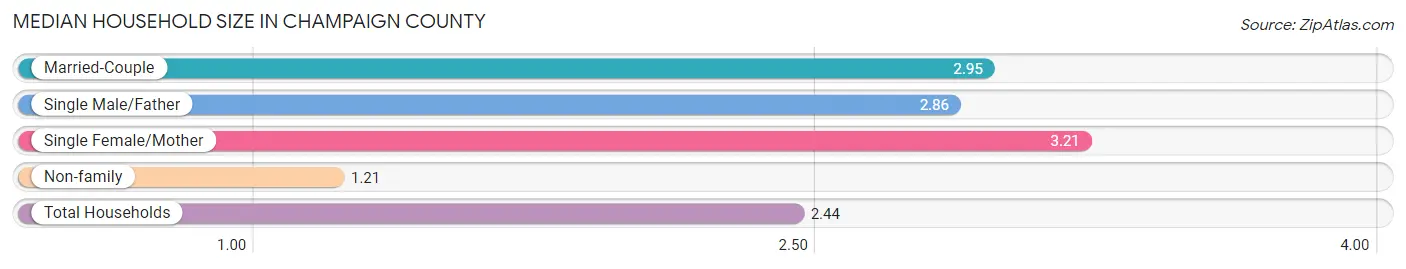
Median Household Size in Champaign County
The median household size in Champaign County is 2.44 persons per household, with single female/mother households (1,870 | 12.0%) accounting for the largest median household size of 3.21 persons per household. non-family households (4,876 | 31.2%) represent the smallest median household size with 1.21 persons per household.
| Household Type | # Households | Household Size |
| Married-Couple | 8,223 (52.7%) | 2.95 |
| Single Male/Father | 643 (4.1%) | 2.86 |
| Single Female/Mother | 1,870 (12.0%) | 3.21 |
| Non-family | 4,876 (31.2%) | 1.21 |
| Total Households | 15,612 (100.0%) | 2.44 |
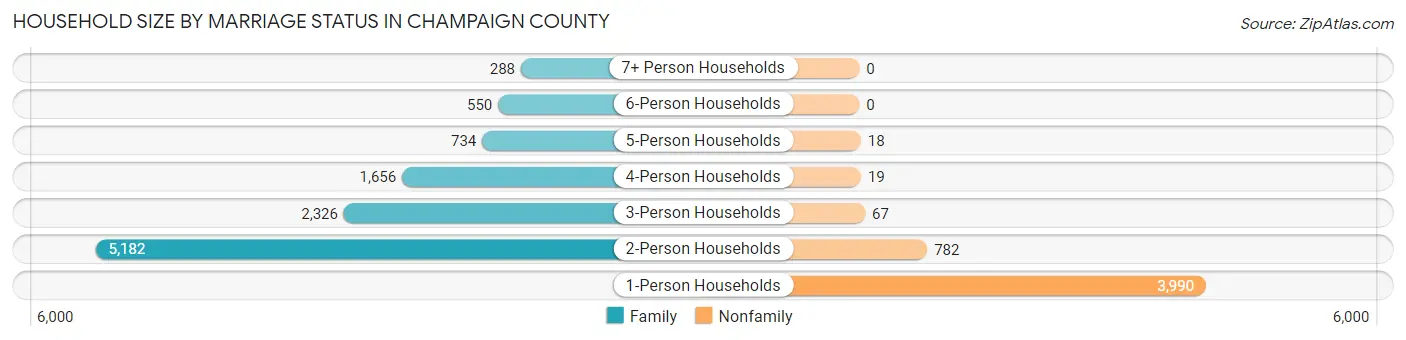
Household Size by Marriage Status in Champaign County
Out of a total of 15,612 households in Champaign County, 10,736 (68.8%) are family households, while 4,876 (31.2%) are nonfamily households. The most numerous type of family households are 2-person households, comprising 5,182, and the most common type of nonfamily households are 1-person households, comprising 3,990.
| Household Size | Family Households | Nonfamily Households |
| 1-Person Households | - | 3,990 (25.6%) |
| 2-Person Households | 5,182 (33.2%) | 782 (5.0%) |
| 3-Person Households | 2,326 (14.9%) | 67 (0.4%) |
| 4-Person Households | 1,656 (10.6%) | 19 (0.1%) |
| 5-Person Households | 734 (4.7%) | 18 (0.1%) |
| 6-Person Households | 550 (3.5%) | 0 (0.0%) |
| 7+ Person Households | 288 (1.8%) | 0 (0.0%) |
| Total | 10,736 (68.8%) | 4,876 (31.2%) |
Female Fertility in Champaign County
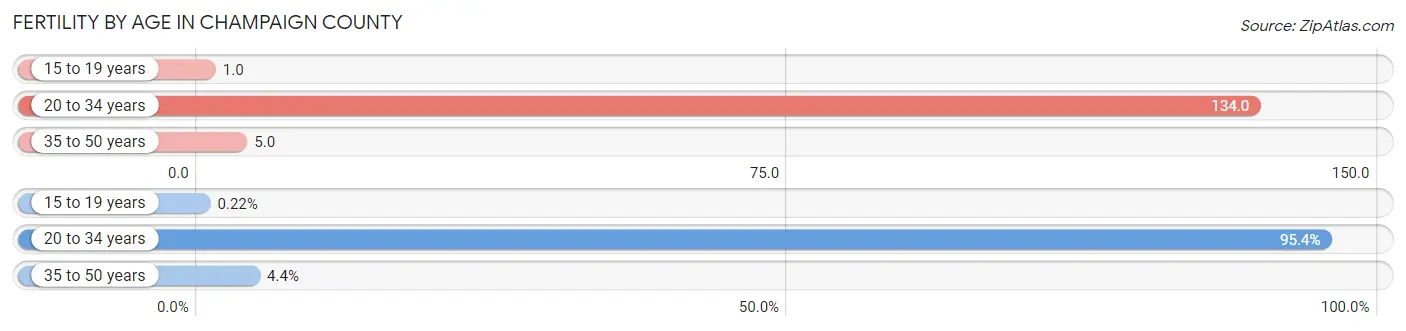
Fertility by Age in Champaign County
Average fertility rate in Champaign County is 55.0 births per 1,000 women. Women in the age bracket of 20 to 34 years have the highest fertility rate with 134.0 births per 1,000 women. Women in the age bracket of 20 to 34 years acount for 95.4% of all women with births.
| Age Bracket | Women with Births | Births / 1,000 Women |
| 15 to 19 years | 1 (0.2%) | 1.0 |
| 20 to 34 years | 432 (95.4%) | 134.0 |
| 35 to 50 years | 20 (4.4%) | 5.0 |
| Total | 453 (100.0%) | 55.0 |
Fertility by Age by Marriage Status in Champaign County
79.7% of women with births (453) in Champaign County are married. The highest percentage of unmarried women with births falls into 15 to 19 years age bracket with 100.0% of them unmarried at the time of birth, while the lowest percentage of unmarried women with births belong to 20 to 34 years age bracket with 18.8% of them unmarried.
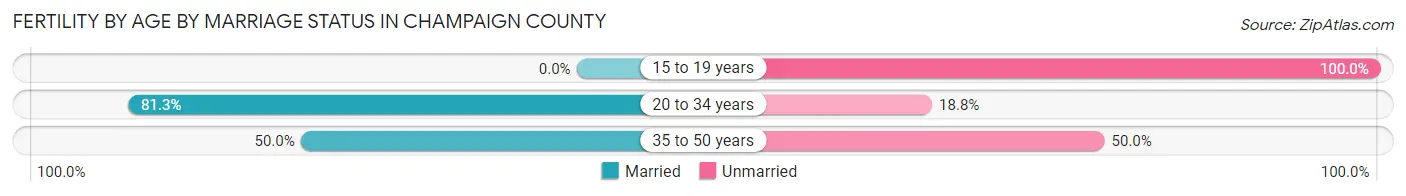
| Age Bracket | Married | Unmarried |
| 15 to 19 years | 0 (0.0%) | 1 (100.0%) |
| 20 to 34 years | 351 (81.2%) | 81 (18.8%) |
| 35 to 50 years | 10 (50.0%) | 10 (50.0%) |
| Total | 361 (79.7%) | 92 (20.3%) |
Fertility by Education in Champaign County
Average fertility rate in Champaign County is 55.0 births per 1,000 women. Women with the education attainment of graduate degree have the highest fertility rate of 103.0 births per 1,000 women, while women with the education attainment of high school diploma have the lowest fertility at 20.0 births per 1,000 women. Women with the education attainment of college or associate's degree represent 40.8% of all women with births.
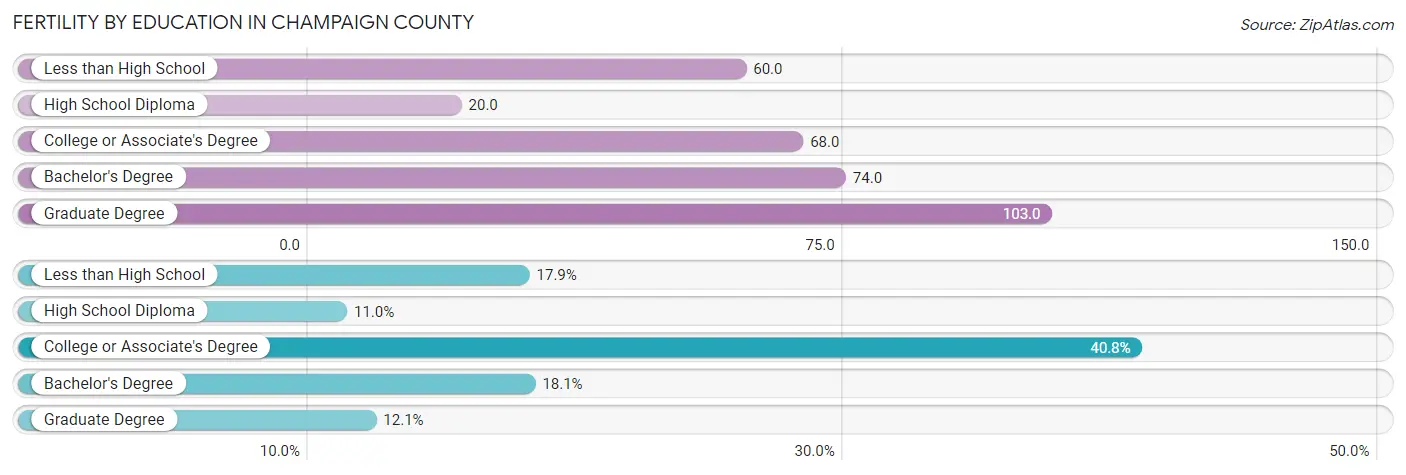
| Educational Attainment | Women with Births | Births / 1,000 Women |
| Less than High School | 81 (17.9%) | 60.0 |
| High School Diploma | 50 (11.0%) | 20.0 |
| College or Associate's Degree | 185 (40.8%) | 68.0 |
| Bachelor's Degree | 82 (18.1%) | 74.0 |
| Graduate Degree | 55 (12.1%) | 103.0 |
| Total | 453 (100.0%) | 55.0 |
Fertility by Education by Marriage Status in Champaign County
20.3% of women with births in Champaign County are unmarried. Women with the educational attainment of bachelor's degree are most likely to be married with 100.0% of them married at childbirth, while women with the educational attainment of high school diploma are least likely to be married with 80.0% of them unmarried at childbirth.
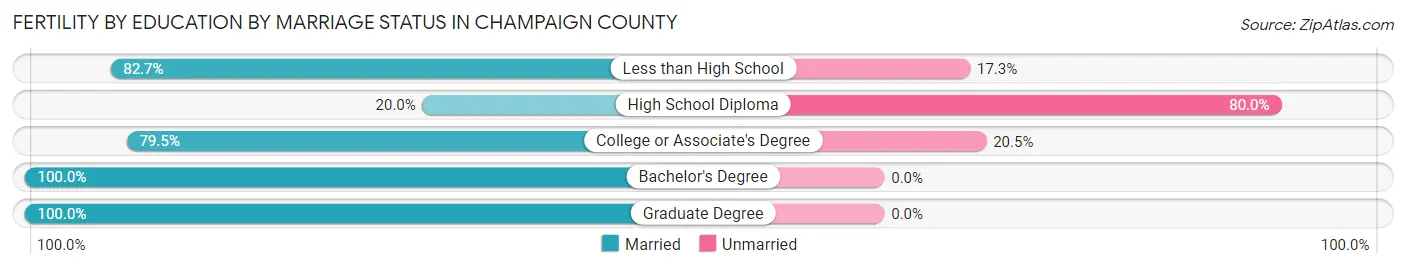
| Educational Attainment | Married | Unmarried |
| Less than High School | 67 (82.7%) | 14 (17.3%) |
| High School Diploma | 10 (20.0%) | 40 (80.0%) |
| College or Associate's Degree | 147 (79.5%) | 38 (20.5%) |
| Bachelor's Degree | 82 (100.0%) | 0 (0.0%) |
| Graduate Degree | 55 (100.0%) | 0 (0.0%) |
| Total | 361 (79.7%) | 92 (20.3%) |
Income in Champaign County
Income Overview in Champaign County
Per Capita Income in Champaign County is $33,377, while median incomes of families and households are $83,504 and $70,486 respectively.
| Characteristic | Number | Measure |
| Per Capita Income | 38,715 | $33,377 |
| Median Family Income | 10,736 | $83,504 |
| Mean Family Income | 10,736 | $94,544 |
| Median Household Income | 15,612 | $70,486 |
| Mean Household Income | 15,612 | $82,162 |
| Income Deficit | 10,736 | $10,567 |
| Wage / Income Gap (%) | 38,715 | 30.09% |
| Wage / Income Gap ($) | 38,715 | 69.91¢ per $1 |
| Gini / Inequality Index | 38,715 | 0.38 |
Earnings by Sex in Champaign County
Average Earnings in Champaign County are $40,108, $48,395 for men and $33,831 for women, a difference of 30.1%.
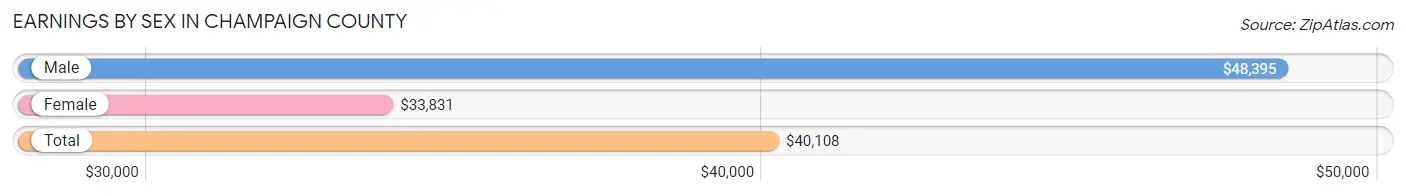
| Sex | Number | Average Earnings |
| Male | 11,025 (52.8%) | $48,395 |
| Female | 9,838 (47.2%) | $33,831 |
| Total | 20,863 (100.0%) | $40,108 |
Earnings by Sex by Income Bracket in Champaign County
The most common earnings brackets in Champaign County are $55,000 to $64,999 for men (1,181 | 10.7%) and $30,000 to $34,999 for women (866 | 8.8%).

| Income | Male | Female |
| $2,499 or less | 520 (4.7%) | 635 (6.5%) |
| $2,500 to $4,999 | 262 (2.4%) | 339 (3.5%) |
| $5,000 to $7,499 | 432 (3.9%) | 347 (3.5%) |
| $7,500 to $9,999 | 190 (1.7%) | 276 (2.8%) |
| $10,000 to $12,499 | 200 (1.8%) | 315 (3.2%) |
| $12,500 to $14,999 | 218 (2.0%) | 368 (3.7%) |
| $15,000 to $17,499 | 293 (2.7%) | 315 (3.2%) |
| $17,500 to $19,999 | 188 (1.7%) | 243 (2.5%) |
| $20,000 to $22,499 | 210 (1.9%) | 314 (3.2%) |
| $22,500 to $24,999 | 268 (2.4%) | 364 (3.7%) |
| $25,000 to $29,999 | 616 (5.6%) | 753 (7.6%) |
| $30,000 to $34,999 | 599 (5.4%) | 866 (8.8%) |
| $35,000 to $39,999 | 549 (5.0%) | 720 (7.3%) |
| $40,000 to $44,999 | 445 (4.0%) | 752 (7.6%) |
| $45,000 to $49,999 | 762 (6.9%) | 472 (4.8%) |
| $50,000 to $54,999 | 817 (7.4%) | 482 (4.9%) |
| $55,000 to $64,999 | 1,181 (10.7%) | 583 (5.9%) |
| $65,000 to $74,999 | 1,035 (9.4%) | 607 (6.2%) |
| $75,000 to $99,999 | 1,084 (9.8%) | 543 (5.5%) |
| $100,000+ | 1,156 (10.5%) | 544 (5.5%) |
| Total | 11,025 (100.0%) | 9,838 (100.0%) |
Earnings by Sex by Educational Attainment in Champaign County
Average earnings in Champaign County are $51,769 for men and $36,656 for women, a difference of 29.2%. Men with an educational attainment of bachelor's degree enjoy the highest average annual earnings of $69,735, while those with high school diploma education earn the least with $47,146. Women with an educational attainment of graduate degree earn the most with the average annual earnings of $74,830, while those with less than high school education have the smallest earnings of $21,495.
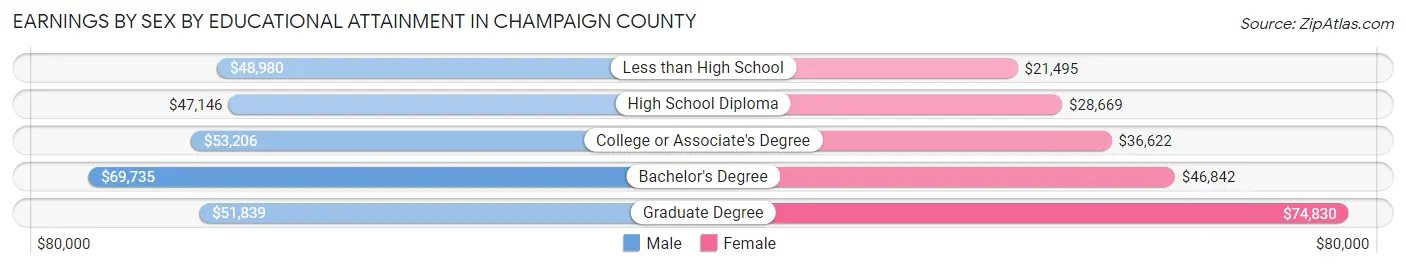
| Educational Attainment | Male Income | Female Income |
| Less than High School | $48,980 | $21,495 |
| High School Diploma | $47,146 | $28,669 |
| College or Associate's Degree | $53,206 | $36,622 |
| Bachelor's Degree | $69,735 | $46,842 |
| Graduate Degree | $51,839 | $74,830 |
| Total | $51,769 | $36,656 |
Family Income in Champaign County
Family Income Brackets in Champaign County
According to the Champaign County family income data, there are 2,512 families falling into the $75,000 to $99,999 income range, which is the most common income bracket and makes up 23.4% of all families. Conversely, the $10,000 to $14,999 income bracket is the least frequent group with only 150 families (1.4%) belonging to this category.

| Income Bracket | # Families | % Families |
| Less than $10,000 | 290 | 2.7% |
| $10,000 to $14,999 | 150 | 1.4% |
| $15,000 to $24,999 | 376 | 3.5% |
| $25,000 to $34,999 | 526 | 4.9% |
| $35,000 to $49,999 | 1,170 | 10.9% |
| $50,000 to $74,999 | 1,836 | 17.1% |
| $75,000 to $99,999 | 2,512 | 23.4% |
| $100,000 to $149,999 | 2,373 | 22.1% |
| $150,000 to $199,999 | 966 | 9.0% |
| $200,000+ | 526 | 4.9% |
Family Income by Famaliy Size in Champaign County
6-person families (572 | 5.3%) account for the highest median family income in Champaign County with $113,038 per family, while 2-person families (5,430 | 50.6%) have the highest median income of $38,207 per family member.
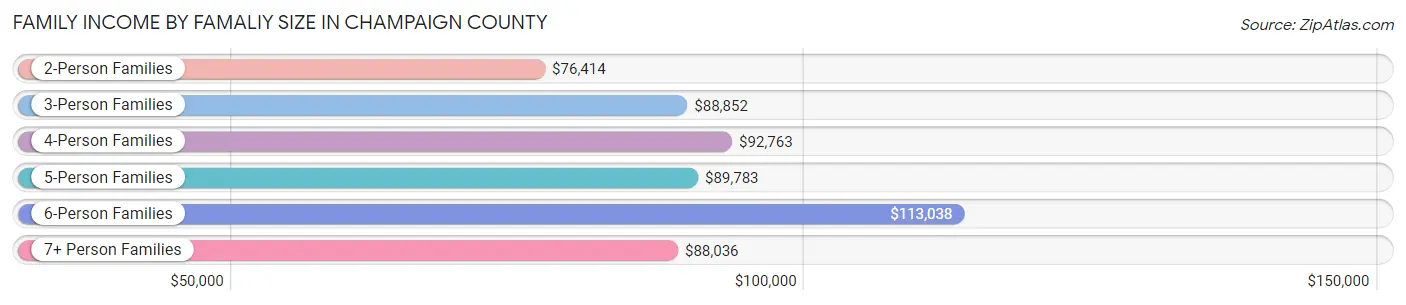
| Income Bracket | # Families | Median Income |
| 2-Person Families | 5,430 (50.6%) | $76,414 |
| 3-Person Families | 2,285 (21.3%) | $88,852 |
| 4-Person Families | 1,598 (14.9%) | $92,763 |
| 5-Person Families | 666 (6.2%) | $89,783 |
| 6-Person Families | 572 (5.3%) | $113,038 |
| 7+ Person Families | 185 (1.7%) | $88,036 |
| Total | 10,736 (100.0%) | $83,504 |
Family Income by Number of Earners in Champaign County
The median family income in Champaign County is $83,504, with families comprising 3+ earners (1,080) having the highest median family income of $119,375, while families with no earners (1,540) have the lowest median family income of $48,967, accounting for 10.1% and 14.3% of families, respectively.

| Number of Earners | # Families | Median Income |
| No Earners | 1,540 (14.3%) | $48,967 |
| 1 Earner | 3,418 (31.8%) | $61,753 |
| 2 Earners | 4,698 (43.8%) | $99,707 |
| 3+ Earners | 1,080 (10.1%) | $119,375 |
| Total | 10,736 (100.0%) | $83,504 |
Household Income in Champaign County
Household Income Brackets in Champaign County
With 3,013 households falling in the category, the $50,000 to $74,999 income range is the most frequent in Champaign County, accounting for 19.3% of all households. In contrast, only 468 households (3.0%) fall into the $10,000 to $14,999 income bracket, making it the least populous group.
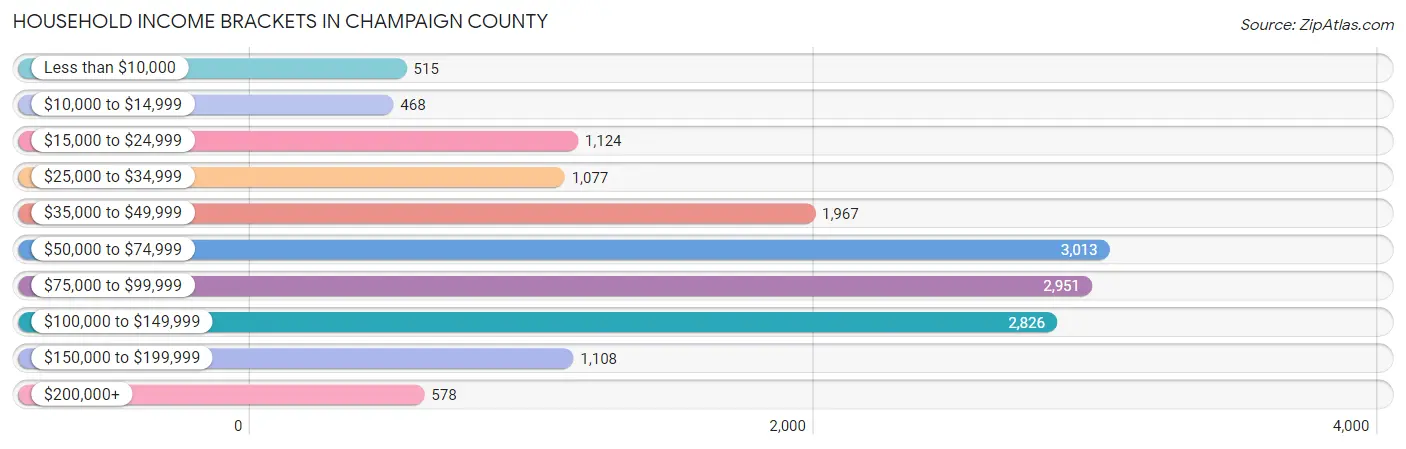
| Income Bracket | # Households | % Households |
| Less than $10,000 | 515 | 3.3% |
| $10,000 to $14,999 | 468 | 3.0% |
| $15,000 to $24,999 | 1,124 | 7.2% |
| $25,000 to $34,999 | 1,077 | 6.9% |
| $35,000 to $49,999 | 1,967 | 12.6% |
| $50,000 to $74,999 | 3,013 | 19.3% |
| $75,000 to $99,999 | 2,951 | 18.9% |
| $100,000 to $149,999 | 2,826 | 18.1% |
| $150,000 to $199,999 | 1,108 | 7.1% |
| $200,000+ | 578 | 3.7% |
Household Income by Householder Age in Champaign County
The median household income in Champaign County is $70,486, with the highest median household income of $86,917 found in the 45 to 64 years age bracket for the primary householder. A total of 6,192 households (39.7%) fall into this category. Meanwhile, the 65+ years age bracket for the primary householder has the lowest median household income of $50,257, with 4,579 households (29.3%) in this group.

| Income Bracket | # Households | Median Income |
| 15 to 24 Years | 586 (3.7%) | $60,118 |
| 25 to 44 Years | 4,255 (27.3%) | $75,575 |
| 45 to 64 Years | 6,192 (39.7%) | $86,917 |
| 65+ Years | 4,579 (29.3%) | $50,257 |
| Total | 15,612 (100.0%) | $70,486 |
Poverty in Champaign County
Income Below Poverty by Sex and Age in Champaign County
With 8.3% poverty level for males and 10.2% for females among the residents of Champaign County, 12 to 14 year old males and 16 and 17 year old females are the most vulnerable to poverty, with 221 males (22.3%) and 125 females (20.2%) in their respective age groups living below the poverty level.
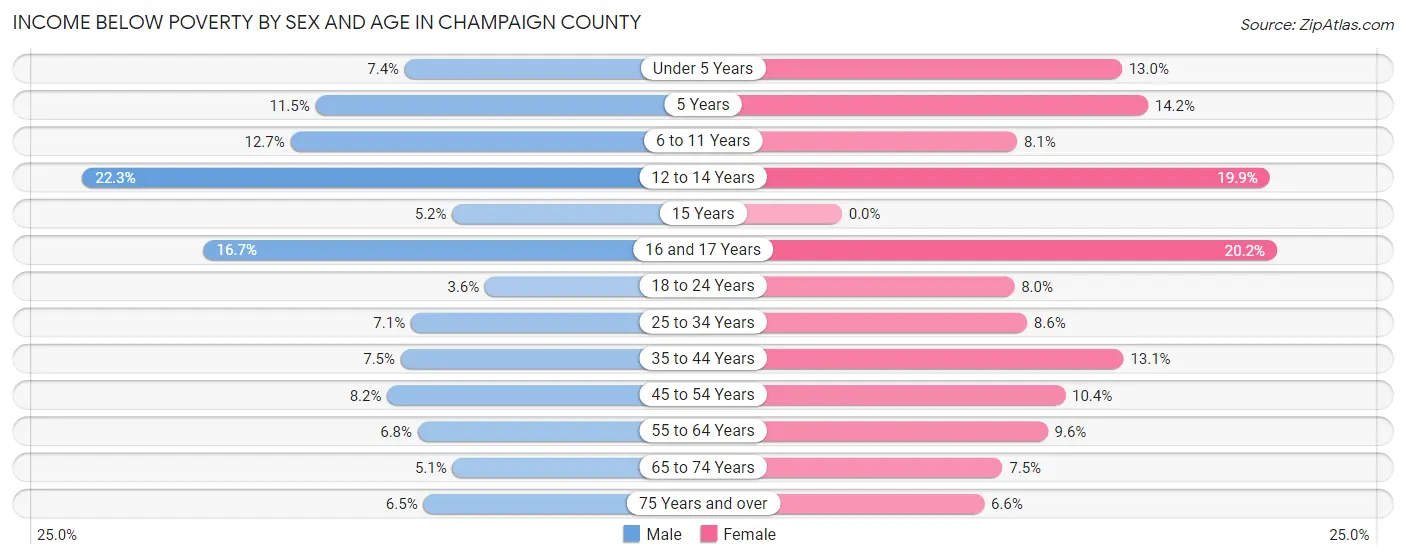
| Age Bracket | Male | Female |
| Under 5 Years | 77 (7.3%) | 128 (13.0%) |
| 5 Years | 26 (11.5%) | 23 (14.2%) |
| 6 to 11 Years | 150 (12.7%) | 101 (8.1%) |
| 12 to 14 Years | 221 (22.3%) | 182 (19.9%) |
| 15 Years | 10 (5.1%) | 0 (0.0%) |
| 16 and 17 Years | 115 (16.7%) | 125 (20.2%) |
| 18 to 24 Years | 54 (3.6%) | 103 (8.0%) |
| 25 to 34 Years | 161 (7.1%) | 191 (8.6%) |
| 35 to 44 Years | 162 (7.5%) | 288 (13.1%) |
| 45 to 54 Years | 221 (8.2%) | 265 (10.4%) |
| 55 to 64 Years | 184 (6.8%) | 269 (9.6%) |
| 65 to 74 Years | 104 (5.1%) | 159 (7.4%) |
| 75 Years and over | 78 (6.5%) | 115 (6.6%) |
| Total | 1,563 (8.3%) | 1,949 (10.2%) |
Income Above Poverty by Sex and Age in Champaign County
According to the poverty statistics in Champaign County, males aged 18 to 24 years and females aged 15 years are the age groups that are most secure financially, with 96.4% of males and 100.0% of females in these age groups living above the poverty line.

| Age Bracket | Male | Female |
| Under 5 Years | 970 (92.6%) | 857 (87.0%) |
| 5 Years | 200 (88.5%) | 139 (85.8%) |
| 6 to 11 Years | 1,035 (87.3%) | 1,142 (91.9%) |
| 12 to 14 Years | 769 (77.7%) | 735 (80.1%) |
| 15 Years | 184 (94.9%) | 183 (100.0%) |
| 16 and 17 Years | 574 (83.3%) | 494 (79.8%) |
| 18 to 24 Years | 1,432 (96.4%) | 1,184 (92.0%) |
| 25 to 34 Years | 2,116 (92.9%) | 2,033 (91.4%) |
| 35 to 44 Years | 1,987 (92.5%) | 1,916 (86.9%) |
| 45 to 54 Years | 2,484 (91.8%) | 2,294 (89.6%) |
| 55 to 64 Years | 2,541 (93.2%) | 2,547 (90.4%) |
| 65 to 74 Years | 1,920 (94.9%) | 1,975 (92.5%) |
| 75 Years and over | 1,124 (93.5%) | 1,628 (93.4%) |
| Total | 17,336 (91.7%) | 17,127 (89.8%) |
Income Below Poverty Among Married-Couple Families in Champaign County
The poverty statistics for married-couple families in Champaign County show that 2.7% or 224 of the total 8,223 families live below the poverty line. Families with 5 or more children have the highest poverty rate of 17.6%, comprising of 23 families. On the other hand, families with 3 or 4 children have the lowest poverty rate of 0.0%, which includes 0 families.
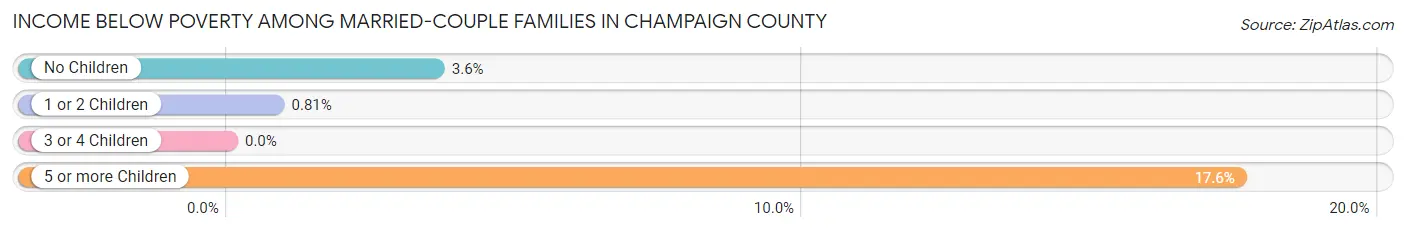
| Children | Above Poverty | Below Poverty |
| No Children | 4,814 (96.4%) | 180 (3.6%) |
| 1 or 2 Children | 2,560 (99.2%) | 21 (0.8%) |
| 3 or 4 Children | 517 (100.0%) | 0 (0.0%) |
| 5 or more Children | 108 (82.4%) | 23 (17.6%) |
| Total | 7,999 (97.3%) | 224 (2.7%) |
Income Below Poverty Among Single-Parent Households in Champaign County
According to the poverty data in Champaign County, 11.5% or 74 single-father households and 24.0% or 448 single-mother households are living below the poverty line. Among single-father households, those with 1 or 2 children have the highest poverty rate, with 74 households (22.3%) experiencing poverty. Likewise, among single-mother households, those with 5 or more children have the highest poverty rate, with 103 households (96.3%) falling below the poverty line.
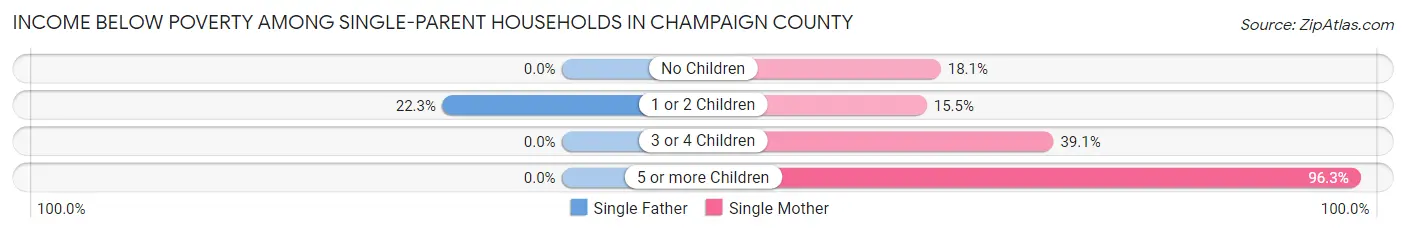
| Children | Single Father | Single Mother |
| No Children | 0 (0.0%) | 110 (18.1%) |
| 1 or 2 Children | 74 (22.3%) | 142 (15.5%) |
| 3 or 4 Children | 0 (0.0%) | 93 (39.1%) |
| 5 or more Children | 0 (0.0%) | 103 (96.3%) |
| Total | 74 (11.5%) | 448 (24.0%) |
Income Below Poverty Among Married-Couple vs Single-Parent Households in Champaign County
The poverty data for Champaign County shows that 224 of the married-couple family households (2.7%) and 522 of the single-parent households (20.8%) are living below the poverty level. Within the married-couple family households, those with 5 or more children have the highest poverty rate, with 23 households (17.6%) falling below the poverty line. Among the single-parent households, those with 5 or more children have the highest poverty rate, with 103 household (96.3%) living below poverty.
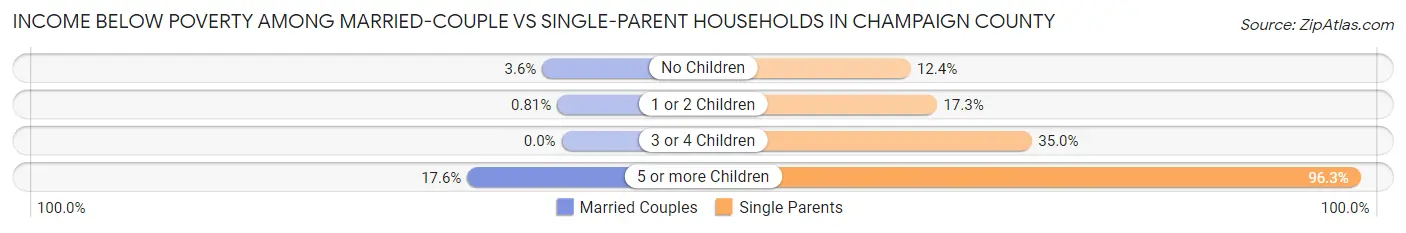
| Children | Married-Couple Families | Single-Parent Households |
| No Children | 180 (3.6%) | 110 (12.3%) |
| 1 or 2 Children | 21 (0.8%) | 216 (17.3%) |
| 3 or 4 Children | 0 (0.0%) | 93 (35.0%) |
| 5 or more Children | 23 (17.6%) | 103 (96.3%) |
| Total | 224 (2.7%) | 522 (20.8%) |
Employment Characteristics in Champaign County
Employment by Class of Employer in Champaign County
Among the 18,144 employed individuals in Champaign County, private company employees (12,002 | 66.1%), not-for-profit organizations (1,695 | 9.3%), and local government employees (1,691 | 9.3%) make up the most common classes of employment.

| Employer Class | # Employees | % Employees |
| Private Company Employees | 12,002 | 66.1% |
| Self-Employed (Incorporated) | 636 | 3.5% |
| Self-Employed (Not Incorporated) | 1,205 | 6.6% |
| Not-for-profit Organizations | 1,695 | 9.3% |
| Local Government Employees | 1,691 | 9.3% |
| State Government Employees | 624 | 3.4% |
| Federal Government Employees | 286 | 1.6% |
| Unpaid Family Workers | 5 | 0.0% |
| Total | 18,144 | 100.0% |
Employment Status by Age in Champaign County
According to the labor force statistics for Champaign County, out of the total population over 16 years of age (31,457), 63.0% or 19,818 individuals are in the labor force, with 4.5% or 892 of them unemployed. The age group with the highest labor force participation rate is 30 to 34 years, with 91.6% or 2,093 individuals in the labor force. Within the labor force, the 16 to 19 years age range has the highest percentage of unemployed individuals, with 14.3% or 130 of them being unemployed.
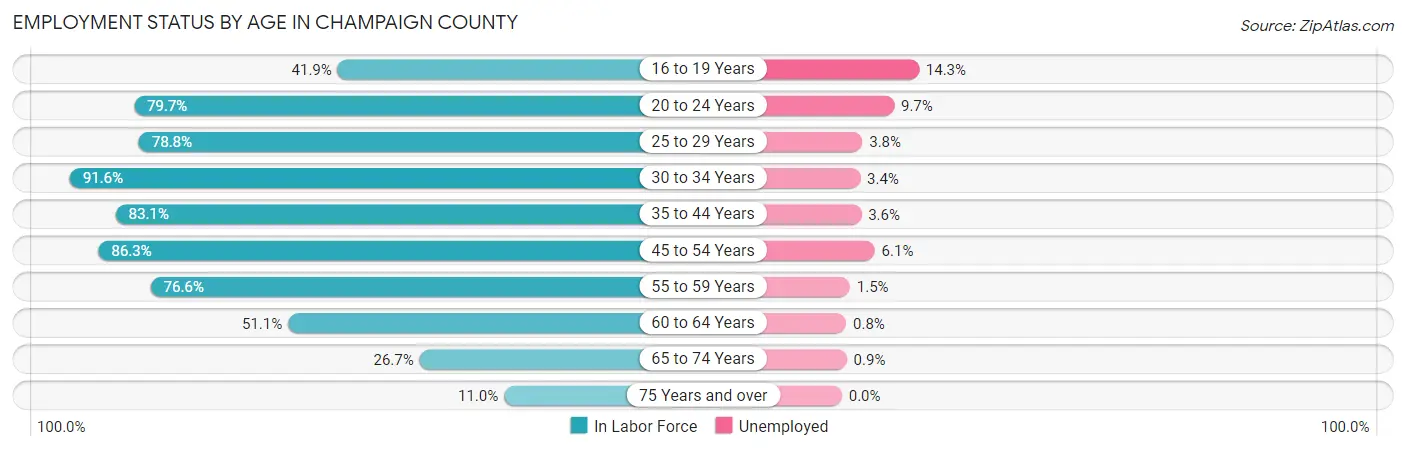
| Age Bracket | In Labor Force | Unemployed |
| 16 to 19 Years | 908 (41.9%) | 130 (14.3%) |
| 20 to 24 Years | 1,656 (79.7%) | 161 (9.7%) |
| 25 to 29 Years | 1,836 (78.8%) | 70 (3.8%) |
| 30 to 34 Years | 2,093 (91.6%) | 71 (3.4%) |
| 35 to 44 Years | 3,676 (83.1%) | 132 (3.6%) |
| 45 to 54 Years | 4,570 (86.3%) | 279 (6.1%) |
| 55 to 59 Years | 2,225 (76.6%) | 33 (1.5%) |
| 60 to 64 Years | 1,382 (51.1%) | 11 (0.8%) |
| 65 to 74 Years | 1,121 (26.7%) | 10 (0.9%) |
| 75 Years and over | 338 (11.0%) | 0 (0.0%) |
| Total | 19,818 (63.0%) | 892 (4.5%) |
Employment Status by Educational Attainment in Champaign County
According to labor force statistics for Champaign County, 79.1% of individuals (15,775) out of the total population between 25 and 64 years of age (19,943) are in the labor force, with 3.8% or 599 of them being unemployed. The group with the highest labor force participation rate are those with the educational attainment of bachelor's degree or higher, with 92.0% or 3,471 individuals in the labor force. Within the labor force, individuals with less than high school education have the highest percentage of unemployment, with 16.6% or 179 of them being unemployed.

| Educational Attainment | In Labor Force | Unemployed |
| Less than High School | 1,079 (67.0%) | 267 (16.6%) |
| High School Diploma | 5,677 (74.6%) | 221 (2.9%) |
| College / Associate Degree | 5,553 (79.9%) | 299 (4.3%) |
| Bachelor's Degree or higher | 3,471 (92.0%) | 11 (0.3%) |
| Total | 15,775 (79.1%) | 758 (3.8%) |
Employment Occupations by Sex in Champaign County
Management, Business, Science and Arts Occupations
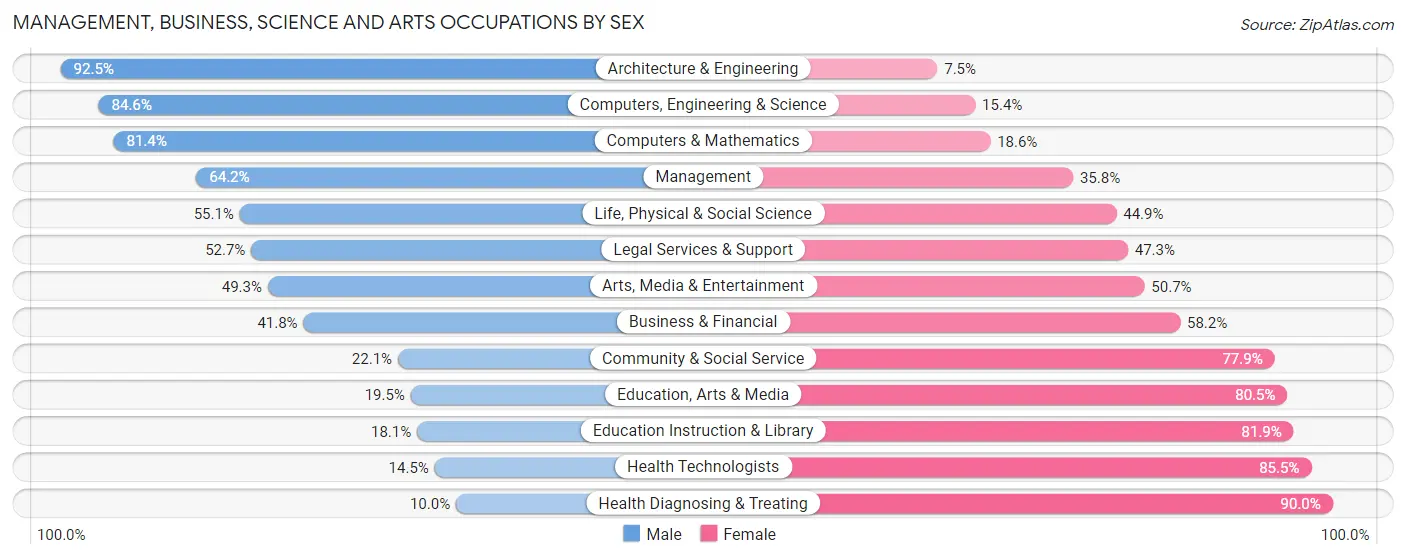
The most common Management, Business, Science and Arts occupations in Champaign County are Management (1,903 | 10.1%), Community & Social Service (1,672 | 8.8%), Health Diagnosing & Treating (1,119 | 5.9%), Education Instruction & Library (1,075 | 5.7%), and Health Technologists (754 | 4.0%).

Management, Business, Science and Arts Occupations by Sex
Within the Management, Business, Science and Arts occupations in Champaign County, the most male-oriented occupations are Architecture & Engineering (92.5%), Computers, Engineering & Science (84.6%), and Computers & Mathematics (81.4%), while the most female-oriented occupations are Health Diagnosing & Treating (90.0%), Health Technologists (85.5%), and Education Instruction & Library (81.9%).
| Occupation | Male | Female |
| Management | 1,221 (64.2%) | 682 (35.8%) |
| Business & Financial | 302 (41.8%) | 420 (58.2%) |
| Computers, Engineering & Science | 592 (84.6%) | 108 (15.4%) |
| Computers & Mathematics | 193 (81.4%) | 44 (18.6%) |
| Architecture & Engineering | 356 (92.5%) | 29 (7.5%) |
| Life, Physical & Social Science | 43 (55.1%) | 35 (44.9%) |
| Community & Social Service | 370 (22.1%) | 1,302 (77.9%) |
| Education, Arts & Media | 79 (19.5%) | 327 (80.5%) |
| Legal Services & Support | 29 (52.7%) | 26 (47.3%) |
| Education Instruction & Library | 195 (18.1%) | 880 (81.9%) |
| Arts, Media & Entertainment | 67 (49.3%) | 69 (50.7%) |
| Health Diagnosing & Treating | 112 (10.0%) | 1,007 (90.0%) |
| Health Technologists | 109 (14.5%) | 645 (85.5%) |
| Total (Category) | 2,597 (42.5%) | 3,519 (57.5%) |
| Total (Overall) | 9,945 (52.6%) | 8,964 (47.4%) |
Services Occupations
The most common Services occupations in Champaign County are Healthcare Support (702 | 3.7%), Personal Care & Service (683 | 3.6%), Food Preparation & Serving (608 | 3.2%), Cleaning & Maintenance (508 | 2.7%), and Security & Protection (504 | 2.7%).
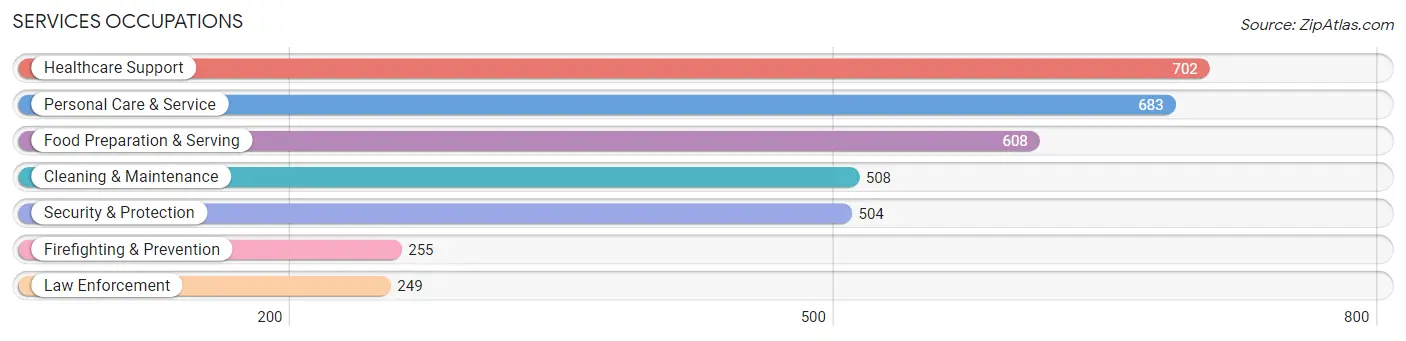
Services Occupations by Sex
Within the Services occupations in Champaign County, the most male-oriented occupations are Firefighting & Prevention (80.0%), Security & Protection (75.0%), and Law Enforcement (69.9%), while the most female-oriented occupations are Healthcare Support (91.9%), Personal Care & Service (79.4%), and Food Preparation & Serving (65.0%).

| Occupation | Male | Female |
| Healthcare Support | 57 (8.1%) | 645 (91.9%) |
| Security & Protection | 378 (75.0%) | 126 (25.0%) |
| Firefighting & Prevention | 204 (80.0%) | 51 (20.0%) |
| Law Enforcement | 174 (69.9%) | 75 (30.1%) |
| Food Preparation & Serving | 213 (35.0%) | 395 (65.0%) |
| Cleaning & Maintenance | 330 (65.0%) | 178 (35.0%) |
| Personal Care & Service | 141 (20.6%) | 542 (79.4%) |
| Total (Category) | 1,119 (37.2%) | 1,886 (62.8%) |
| Total (Overall) | 9,945 (52.6%) | 8,964 (47.4%) |
Sales and Office Occupations
The most common Sales and Office occupations in Champaign County are Office & Administration (2,076 | 11.0%), and Sales & Related (1,061 | 5.6%).
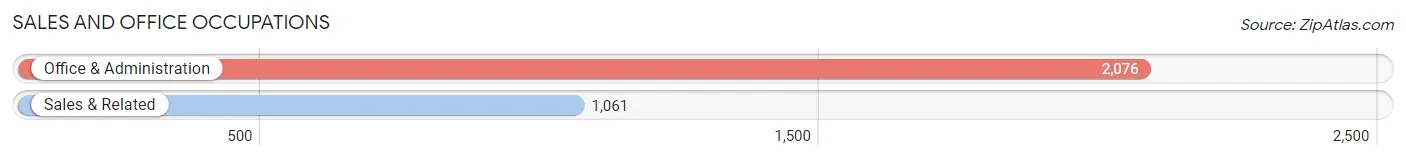
Sales and Office Occupations by Sex

| Occupation | Male | Female |
| Sales & Related | 503 (47.4%) | 558 (52.6%) |
| Office & Administration | 430 (20.7%) | 1,646 (79.3%) |
| Total (Category) | 933 (29.7%) | 2,204 (70.3%) |
| Total (Overall) | 9,945 (52.6%) | 8,964 (47.4%) |
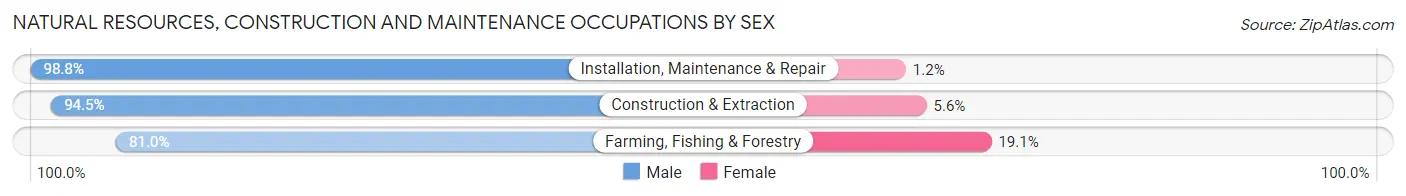
Natural Resources, Construction and Maintenance Occupations
The most common Natural Resources, Construction and Maintenance occupations in Champaign County are Installation, Maintenance & Repair (889 | 4.7%), Construction & Extraction (757 | 4.0%), and Farming, Fishing & Forestry (84 | 0.4%).

Natural Resources, Construction and Maintenance Occupations by Sex
| Occupation | Male | Female |
| Farming, Fishing & Forestry | 68 (80.9%) | 16 (19.1%) |
| Construction & Extraction | 715 (94.5%) | 42 (5.6%) |
| Installation, Maintenance & Repair | 878 (98.8%) | 11 (1.2%) |
| Total (Category) | 1,661 (96.0%) | 69 (4.0%) |
| Total (Overall) | 9,945 (52.6%) | 8,964 (47.4%) |
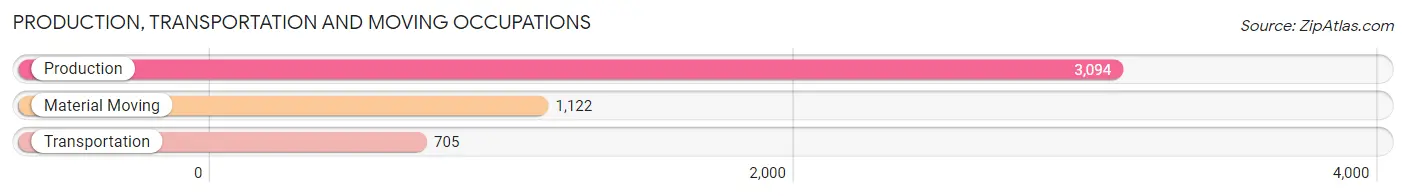
Production, Transportation and Moving Occupations
The most common Production, Transportation and Moving occupations in Champaign County are Production (3,094 | 16.4%), Material Moving (1,122 | 5.9%), and Transportation (705 | 3.7%).
Production, Transportation and Moving Occupations by Sex

| Occupation | Male | Female |
| Production | 2,198 (71.0%) | 896 (29.0%) |
| Transportation | 589 (83.6%) | 116 (16.5%) |
| Material Moving | 848 (75.6%) | 274 (24.4%) |
| Total (Category) | 3,635 (73.9%) | 1,286 (26.1%) |
| Total (Overall) | 9,945 (52.6%) | 8,964 (47.4%) |
Employment Industries by Sex in Champaign County
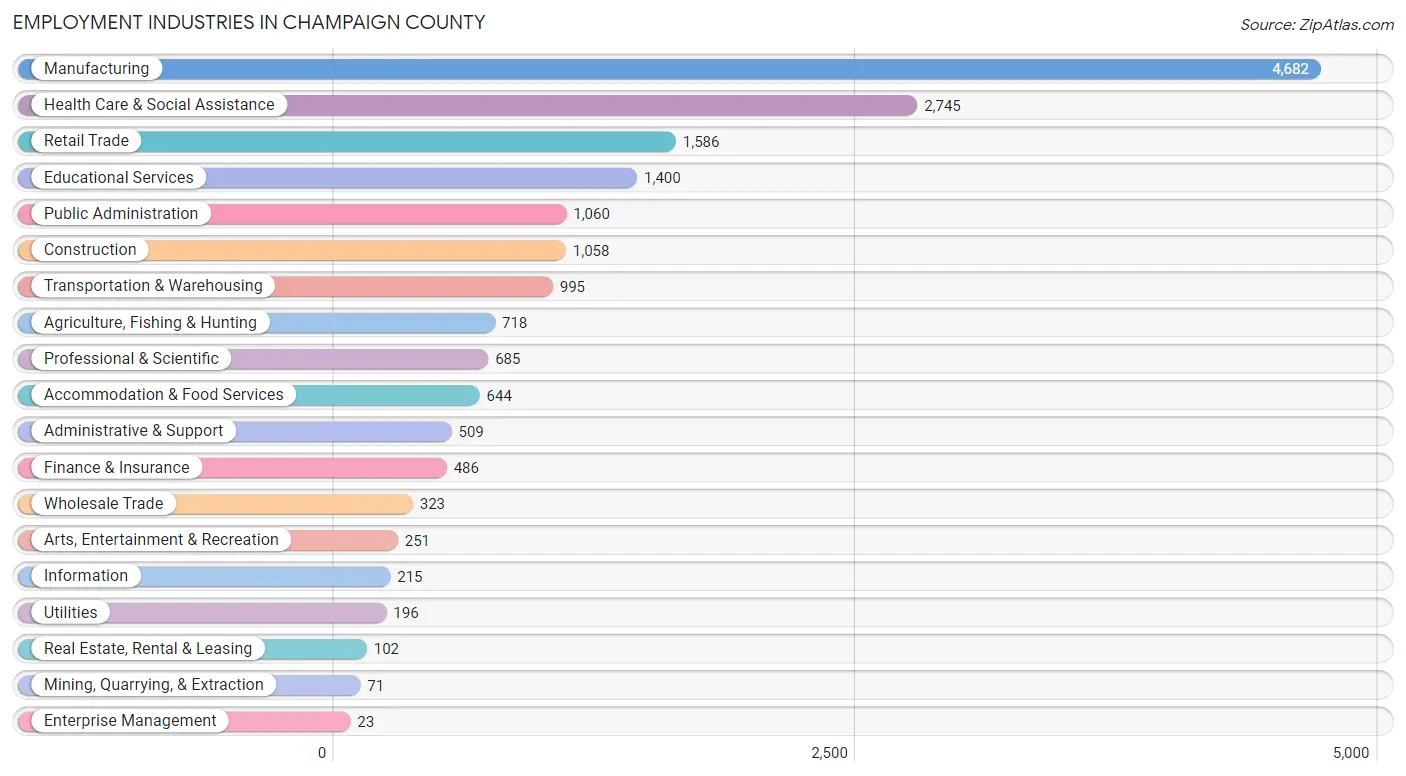
Employment Industries in Champaign County
The major employment industries in Champaign County include Manufacturing (4,682 | 24.8%), Health Care & Social Assistance (2,745 | 14.5%), Retail Trade (1,586 | 8.4%), Educational Services (1,400 | 7.4%), and Public Administration (1,060 | 5.6%).
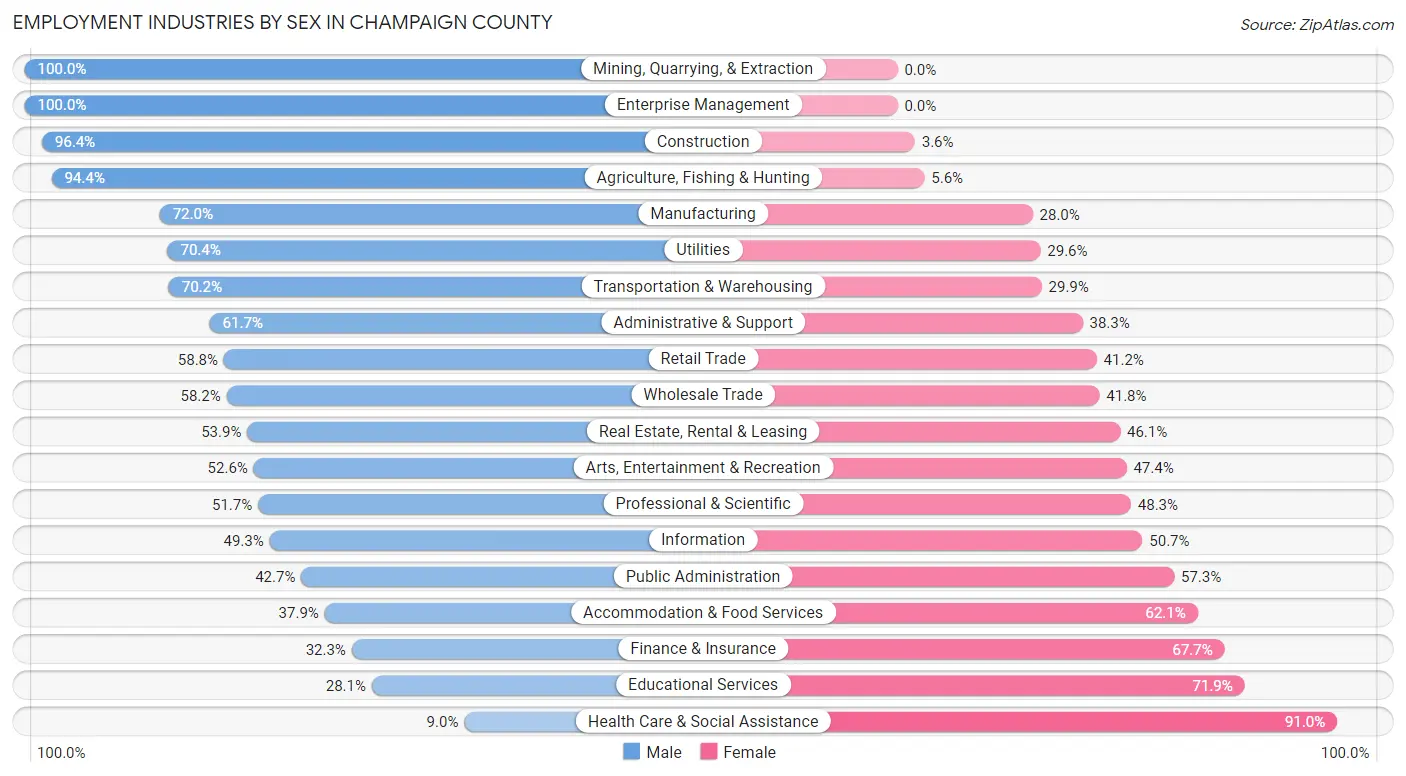
Employment Industries by Sex in Champaign County
The Champaign County industries that see more men than women are Mining, Quarrying, & Extraction (100.0%), Enterprise Management (100.0%), and Construction (96.4%), whereas the industries that tend to have a higher number of women are Health Care & Social Assistance (91.0%), Educational Services (71.9%), and Finance & Insurance (67.7%).
| Industry | Male | Female |
| Agriculture, Fishing & Hunting | 678 (94.4%) | 40 (5.6%) |
| Mining, Quarrying, & Extraction | 71 (100.0%) | 0 (0.0%) |
| Construction | 1,020 (96.4%) | 38 (3.6%) |
| Manufacturing | 3,372 (72.0%) | 1,310 (28.0%) |
| Wholesale Trade | 188 (58.2%) | 135 (41.8%) |
| Retail Trade | 932 (58.8%) | 654 (41.2%) |
| Transportation & Warehousing | 698 (70.2%) | 297 (29.8%) |
| Utilities | 138 (70.4%) | 58 (29.6%) |
| Information | 106 (49.3%) | 109 (50.7%) |
| Finance & Insurance | 157 (32.3%) | 329 (67.7%) |
| Real Estate, Rental & Leasing | 55 (53.9%) | 47 (46.1%) |
| Professional & Scientific | 354 (51.7%) | 331 (48.3%) |
| Enterprise Management | 23 (100.0%) | 0 (0.0%) |
| Administrative & Support | 314 (61.7%) | 195 (38.3%) |
| Educational Services | 394 (28.1%) | 1,006 (71.9%) |
| Health Care & Social Assistance | 247 (9.0%) | 2,498 (91.0%) |
| Arts, Entertainment & Recreation | 132 (52.6%) | 119 (47.4%) |
| Accommodation & Food Services | 244 (37.9%) | 400 (62.1%) |
| Public Administration | 453 (42.7%) | 607 (57.3%) |
| Total | 9,945 (52.6%) | 8,964 (47.4%) |
Education in Champaign County
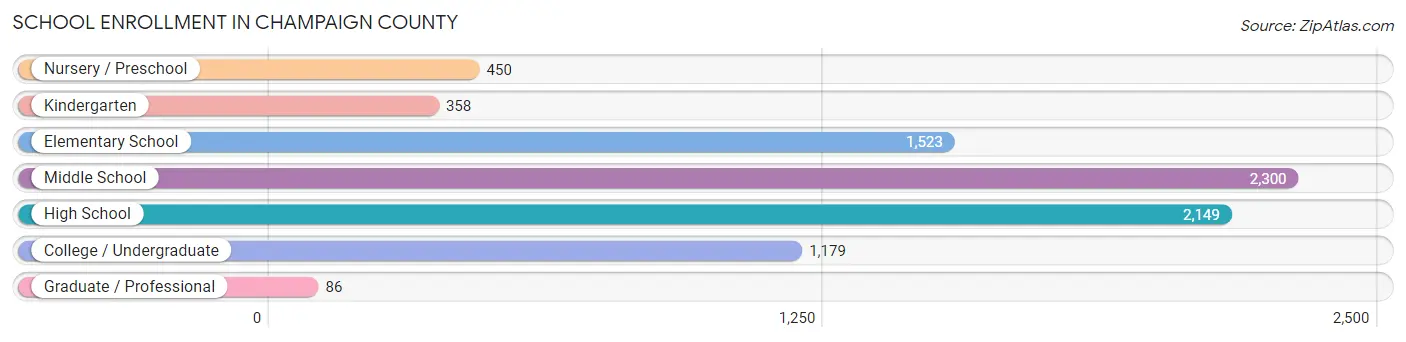
School Enrollment in Champaign County
The most common levels of schooling among the 8,045 students in Champaign County are middle school (2,300 | 28.6%), high school (2,149 | 26.7%), and elementary school (1,523 | 18.9%).
| School Level | # Students | % Students |
| Nursery / Preschool | 450 | 5.6% |
| Kindergarten | 358 | 4.4% |
| Elementary School | 1,523 | 18.9% |
| Middle School | 2,300 | 28.6% |
| High School | 2,149 | 26.7% |
| College / Undergraduate | 1,179 | 14.7% |
| Graduate / Professional | 86 | 1.1% |
| Total | 8,045 | 100.0% |
School Enrollment by Age by Funding Source in Champaign County
Out of a total of 8,045 students who are enrolled in schools in Champaign County, 1,287 (16.0%) attend a private institution, while the remaining 6,758 (84.0%) are enrolled in public schools. The age group of 35 years and over has the highest likelihood of being enrolled in private schools, with 102 (32.9% in the age bracket) enrolled. Conversely, the age group of 10 to 14 year olds has the lowest likelihood of being enrolled in a private school, with 2,739 (89.1% in the age bracket) attending a public institution.
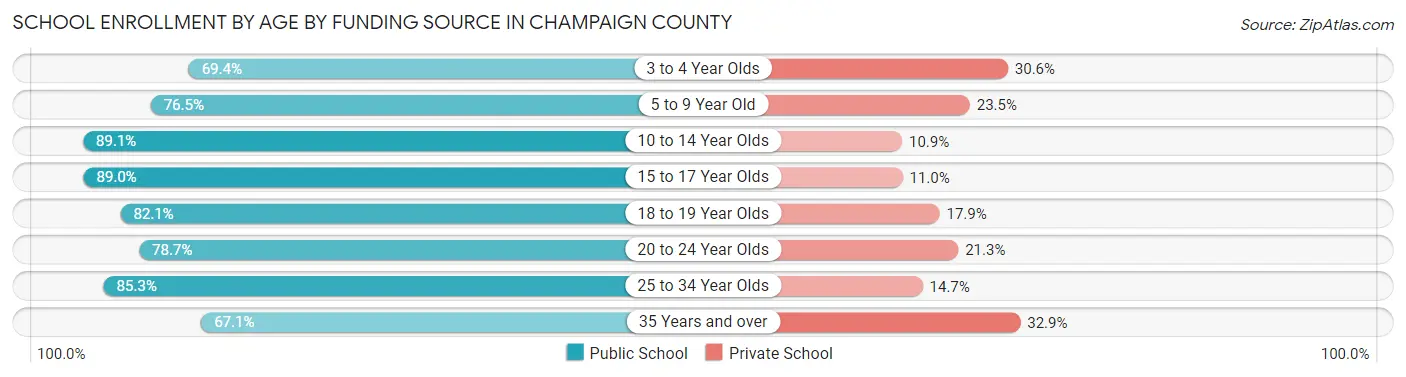
| Age Bracket | Public School | Private School |
| 3 to 4 Year Olds | 168 (69.4%) | 74 (30.6%) |
| 5 to 9 Year Old | 1,224 (76.5%) | 376 (23.5%) |
| 10 to 14 Year Olds | 2,739 (89.1%) | 334 (10.9%) |
| 15 to 17 Year Olds | 1,388 (89.0%) | 171 (11.0%) |
| 18 to 19 Year Olds | 391 (82.1%) | 85 (17.9%) |
| 20 to 24 Year Olds | 398 (78.7%) | 108 (21.3%) |
| 25 to 34 Year Olds | 238 (85.3%) | 41 (14.7%) |
| 35 Years and over | 208 (67.1%) | 102 (32.9%) |
| Total | 6,758 (84.0%) | 1,287 (16.0%) |
Educational Attainment by Field of Study in Champaign County
Education (1,049 | 19.6%), business (987 | 18.4%), bio, nature & agricultural (694 | 13.0%), science & technology (654 | 12.2%), and arts & humanities (478 | 8.9%) are the most common fields of study among 5,354 individuals in Champaign County who have obtained a bachelor's degree or higher.
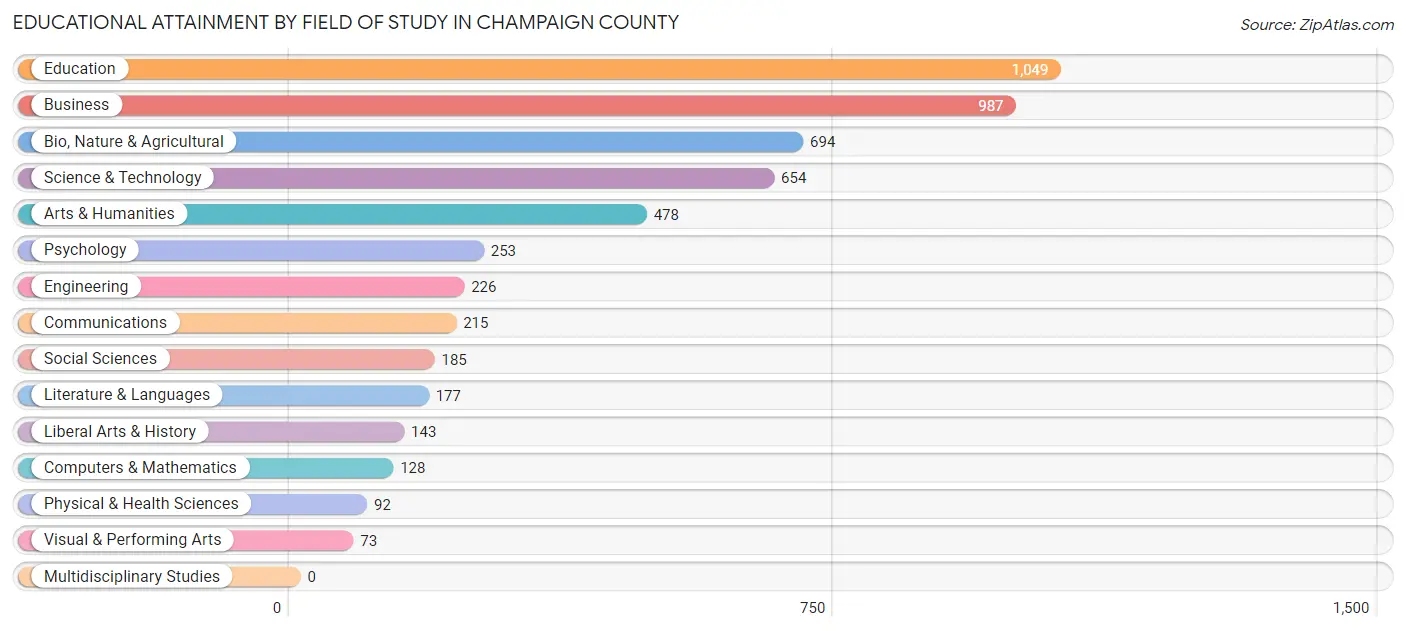
| Field of Study | # Graduates | % Graduates |
| Computers & Mathematics | 128 | 2.4% |
| Bio, Nature & Agricultural | 694 | 13.0% |
| Physical & Health Sciences | 92 | 1.7% |
| Psychology | 253 | 4.7% |
| Social Sciences | 185 | 3.5% |
| Engineering | 226 | 4.2% |
| Multidisciplinary Studies | 0 | 0.0% |
| Science & Technology | 654 | 12.2% |
| Business | 987 | 18.4% |
| Education | 1,049 | 19.6% |
| Literature & Languages | 177 | 3.3% |
| Liberal Arts & History | 143 | 2.7% |
| Visual & Performing Arts | 73 | 1.4% |
| Communications | 215 | 4.0% |
| Arts & Humanities | 478 | 8.9% |
| Total | 5,354 | 100.0% |
Transportation & Commute in Champaign County
Vehicle Availability by Sex in Champaign County
The most prevalent vehicle ownership categories in Champaign County are males with 2 vehicles (3,503, accounting for 36.5%) and females with 2 vehicles (3,055, making up 41.4%).
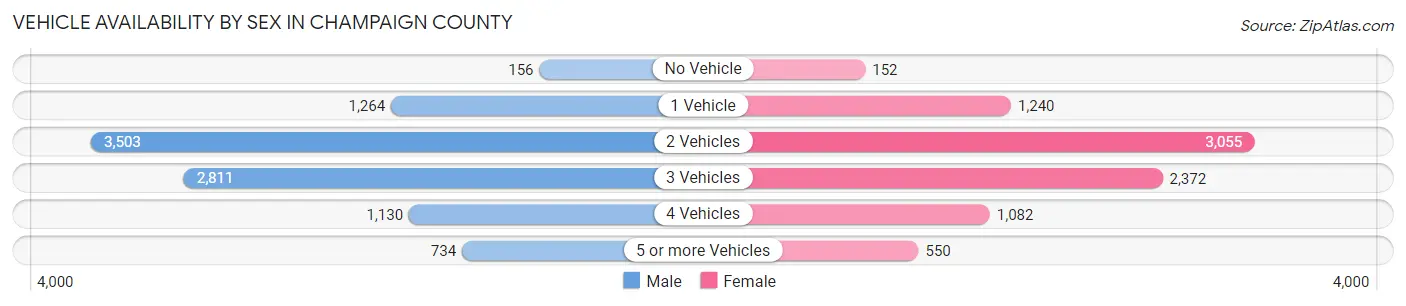
| Vehicles Available | Male | Female |
| No Vehicle | 156 (1.6%) | 152 (1.8%) |
| 1 Vehicle | 1,264 (13.2%) | 1,240 (14.7%) |
| 2 Vehicles | 3,503 (36.5%) | 3,055 (36.1%) |
| 3 Vehicles | 2,811 (29.3%) | 2,372 (28.1%) |
| 4 Vehicles | 1,130 (11.8%) | 1,082 (12.8%) |
| 5 or more Vehicles | 734 (7.6%) | 550 (6.5%) |
| Total | 9,598 (100.0%) | 8,451 (100.0%) |
Commute Time in Champaign County
The most frequently occuring commute durations in Champaign County are 5 to 9 minutes (2,172 commuters, 12.9%), 20 to 24 minutes (2,122 commuters, 12.6%), and 30 to 34 minutes (2,051 commuters, 12.1%).
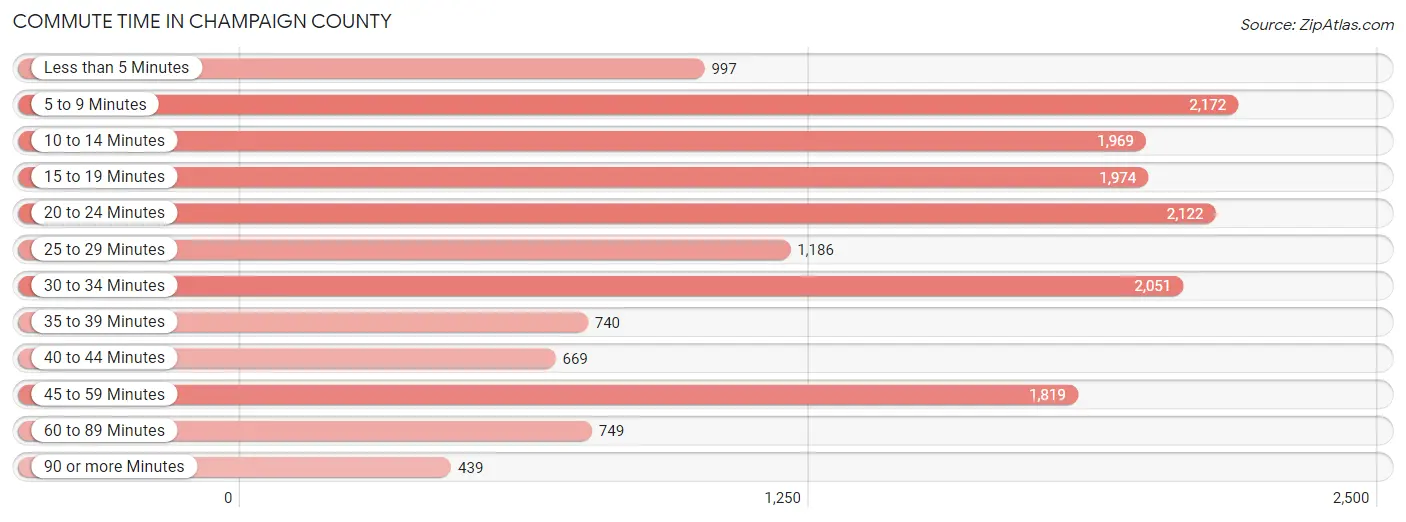
| Commute Time | # Commuters | % Commuters |
| Less than 5 Minutes | 997 | 5.9% |
| 5 to 9 Minutes | 2,172 | 12.9% |
| 10 to 14 Minutes | 1,969 | 11.7% |
| 15 to 19 Minutes | 1,974 | 11.7% |
| 20 to 24 Minutes | 2,122 | 12.6% |
| 25 to 29 Minutes | 1,186 | 7.0% |
| 30 to 34 Minutes | 2,051 | 12.1% |
| 35 to 39 Minutes | 740 | 4.4% |
| 40 to 44 Minutes | 669 | 4.0% |
| 45 to 59 Minutes | 1,819 | 10.8% |
| 60 to 89 Minutes | 749 | 4.4% |
| 90 or more Minutes | 439 | 2.6% |
Commute Time by Sex in Champaign County
The most common commute times in Champaign County are 20 to 24 minutes (1,198 commuters, 13.2%) for males and 5 to 9 minutes (1,297 commuters, 16.6%) for females.

| Commute Time | Male | Female |
| Less than 5 Minutes | 607 (6.7%) | 390 (5.0%) |
| 5 to 9 Minutes | 875 (9.7%) | 1,297 (16.6%) |
| 10 to 14 Minutes | 1,136 (12.6%) | 833 (10.6%) |
| 15 to 19 Minutes | 1,016 (11.2%) | 958 (12.2%) |
| 20 to 24 Minutes | 1,198 (13.2%) | 924 (11.8%) |
| 25 to 29 Minutes | 679 (7.5%) | 507 (6.5%) |
| 30 to 34 Minutes | 998 (11.0%) | 1,053 (13.4%) |
| 35 to 39 Minutes | 509 (5.6%) | 231 (2.9%) |
| 40 to 44 Minutes | 405 (4.5%) | 264 (3.4%) |
| 45 to 59 Minutes | 1,064 (11.7%) | 755 (9.6%) |
| 60 to 89 Minutes | 345 (3.8%) | 404 (5.2%) |
| 90 or more Minutes | 220 (2.4%) | 219 (2.8%) |
Time of Departure to Work by Sex in Champaign County
The most frequent times of departure to work in Champaign County are 6:00 AM to 6:29 AM (1,168, 12.9%) for males and 7:00 AM to 7:29 AM (1,257, 16.0%) for females.
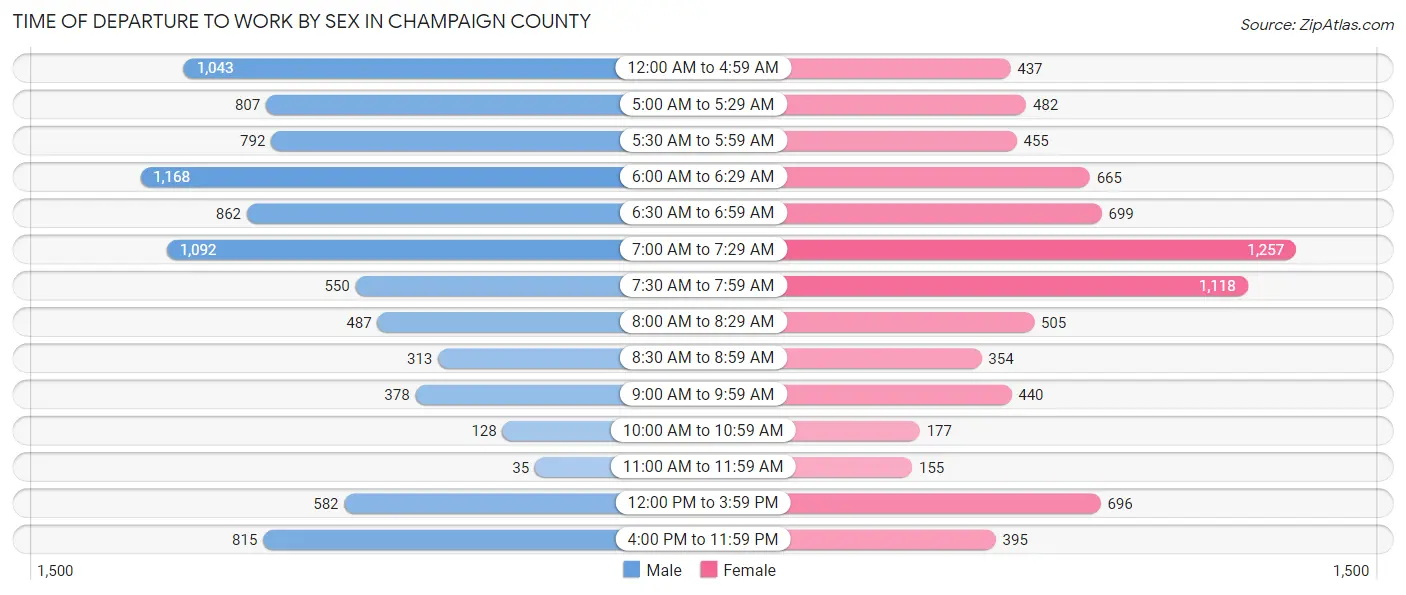
| Time of Departure | Male | Female |
| 12:00 AM to 4:59 AM | 1,043 (11.5%) | 437 (5.6%) |
| 5:00 AM to 5:29 AM | 807 (8.9%) | 482 (6.1%) |
| 5:30 AM to 5:59 AM | 792 (8.7%) | 455 (5.8%) |
| 6:00 AM to 6:29 AM | 1,168 (12.9%) | 665 (8.5%) |
| 6:30 AM to 6:59 AM | 862 (9.5%) | 699 (8.9%) |
| 7:00 AM to 7:29 AM | 1,092 (12.1%) | 1,257 (16.0%) |
| 7:30 AM to 7:59 AM | 550 (6.1%) | 1,118 (14.3%) |
| 8:00 AM to 8:29 AM | 487 (5.4%) | 505 (6.5%) |
| 8:30 AM to 8:59 AM | 313 (3.5%) | 354 (4.5%) |
| 9:00 AM to 9:59 AM | 378 (4.2%) | 440 (5.6%) |
| 10:00 AM to 10:59 AM | 128 (1.4%) | 177 (2.3%) |
| 11:00 AM to 11:59 AM | 35 (0.4%) | 155 (2.0%) |
| 12:00 PM to 3:59 PM | 582 (6.4%) | 696 (8.9%) |
| 4:00 PM to 11:59 PM | 815 (9.0%) | 395 (5.0%) |
| Total | 9,052 (100.0%) | 7,835 (100.0%) |
Housing Occupancy in Champaign County
Occupancy by Ownership in Champaign County
Of the total 15,612 dwellings in Champaign County, owner-occupied units account for 11,914 (76.3%), while renter-occupied units make up 3,698 (23.7%).
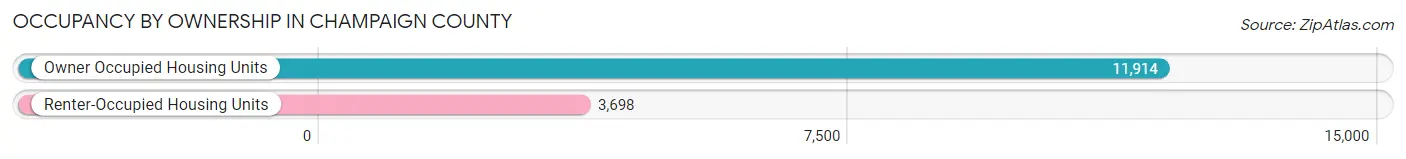
| Occupancy | # Housing Units | % Housing Units |
| Owner Occupied Housing Units | 11,914 | 76.3% |
| Renter-Occupied Housing Units | 3,698 | 23.7% |
| Total Occupied Housing Units | 15,612 | 100.0% |
Occupancy by Household Size in Champaign County
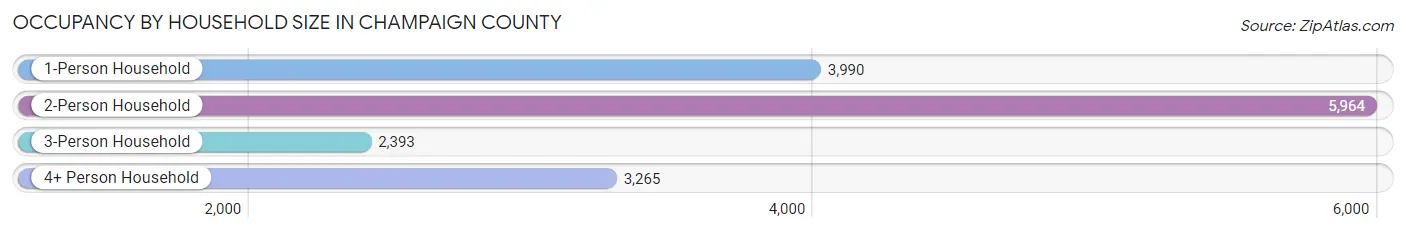
| Household Size | # Housing Units | % Housing Units |
| 1-Person Household | 3,990 | 25.6% |
| 2-Person Household | 5,964 | 38.2% |
| 3-Person Household | 2,393 | 15.3% |
| 4+ Person Household | 3,265 | 20.9% |
| Total Housing Units | 15,612 | 100.0% |
Occupancy by Ownership by Household Size in Champaign County
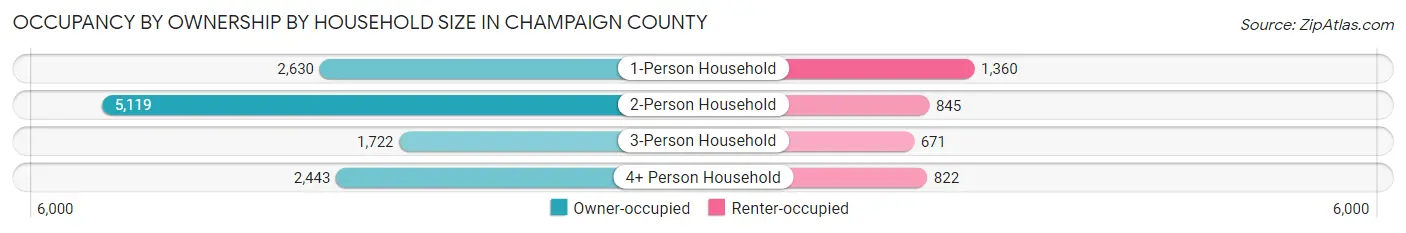
| Household Size | Owner-occupied | Renter-occupied |
| 1-Person Household | 2,630 (65.9%) | 1,360 (34.1%) |
| 2-Person Household | 5,119 (85.8%) | 845 (14.2%) |
| 3-Person Household | 1,722 (72.0%) | 671 (28.0%) |
| 4+ Person Household | 2,443 (74.8%) | 822 (25.2%) |
| Total Housing Units | 11,914 (76.3%) | 3,698 (23.7%) |
Occupancy by Educational Attainment in Champaign County
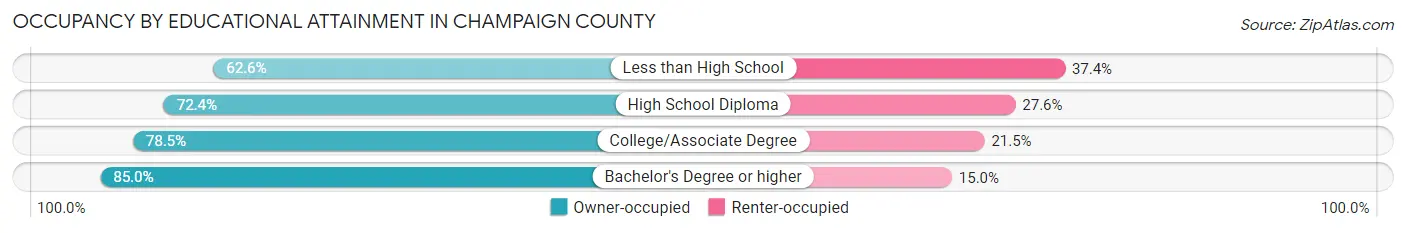
| Household Size | Owner-occupied | Renter-occupied |
| Less than High School | 692 (62.6%) | 414 (37.4%) |
| High School Diploma | 4,410 (72.4%) | 1,681 (27.6%) |
| College/Associate Degree | 4,134 (78.5%) | 1,130 (21.5%) |
| Bachelor's Degree or higher | 2,678 (85.0%) | 473 (15.0%) |
Occupancy by Age of Householder in Champaign County
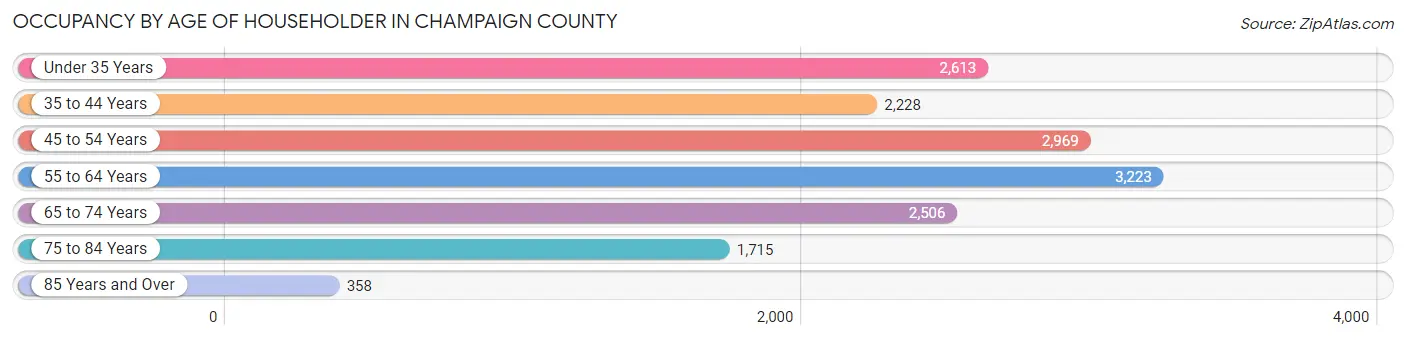
| Age Bracket | # Households | % Households |
| Under 35 Years | 2,613 | 16.7% |
| 35 to 44 Years | 2,228 | 14.3% |
| 45 to 54 Years | 2,969 | 19.0% |
| 55 to 64 Years | 3,223 | 20.6% |
| 65 to 74 Years | 2,506 | 16.1% |
| 75 to 84 Years | 1,715 | 11.0% |
| 85 Years and Over | 358 | 2.3% |
| Total | 15,612 | 100.0% |
Housing Finances in Champaign County
Median Income by Occupancy in Champaign County
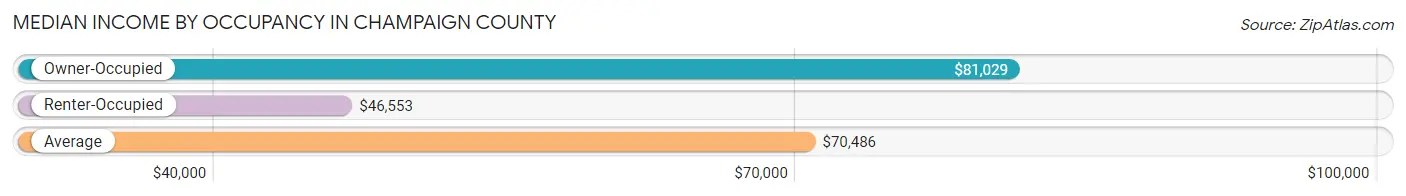
| Occupancy Type | # Households | Median Income |
| Owner-Occupied | 11,914 (76.3%) | $81,029 |
| Renter-Occupied | 3,698 (23.7%) | $46,553 |
| Average | 15,612 (100.0%) | $70,486 |
Occupancy by Householder Income Bracket in Champaign County

| Income Bracket | Owner-occupied | Renter-occupied |
| Less than $5,000 | 124 (1.0%) | 174 (4.7%) |
| $5,000 to $9,999 | 154 (1.3%) | 61 (1.7%) |
| $10,000 to $14,999 | 204 (1.7%) | 271 (7.3%) |
| $15,000 to $19,999 | 281 (2.4%) | 171 (4.6%) |
| $20,000 to $24,999 | 413 (3.5%) | 260 (7.0%) |
| $25,000 to $34,999 | 723 (6.1%) | 349 (9.4%) |
| $35,000 to $49,999 | 1,274 (10.7%) | 696 (18.8%) |
| $50,000 to $74,999 | 2,208 (18.5%) | 803 (21.7%) |
| $75,000 to $99,999 | 2,262 (19.0%) | 685 (18.5%) |
| $100,000 to $149,999 | 2,686 (22.5%) | 133 (3.6%) |
| $150,000 or more | 1,585 (13.3%) | 95 (2.6%) |
| Total | 11,914 (100.0%) | 3,698 (100.0%) |
Monthly Housing Cost Tiers in Champaign County
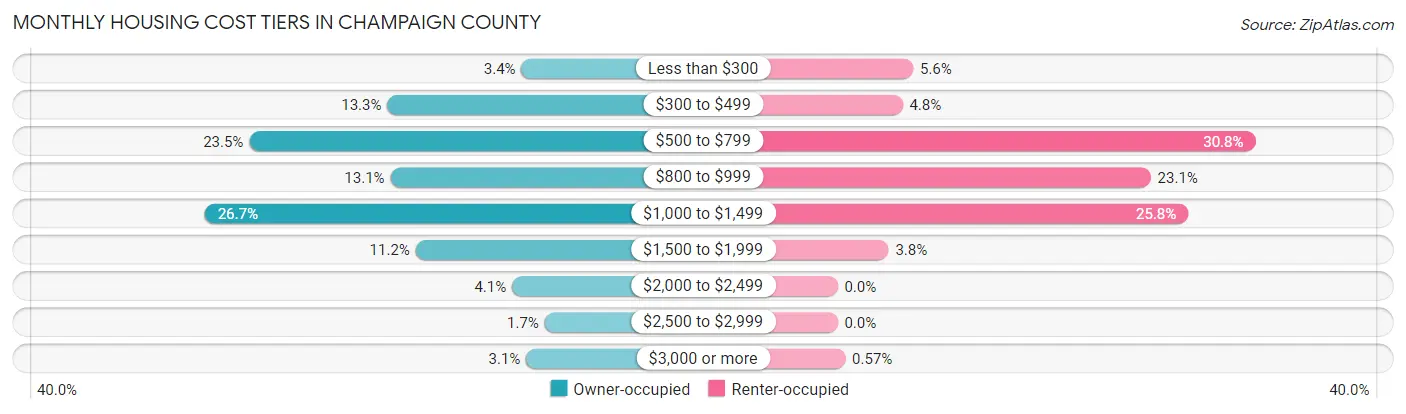
| Monthly Cost | Owner-occupied | Renter-occupied |
| Less than $300 | 406 (3.4%) | 206 (5.6%) |
| $300 to $499 | 1,583 (13.3%) | 177 (4.8%) |
| $500 to $799 | 2,795 (23.5%) | 1,138 (30.8%) |
| $800 to $999 | 1,556 (13.1%) | 853 (23.1%) |
| $1,000 to $1,499 | 3,185 (26.7%) | 955 (25.8%) |
| $1,500 to $1,999 | 1,334 (11.2%) | 139 (3.8%) |
| $2,000 to $2,499 | 488 (4.1%) | 0 (0.0%) |
| $2,500 to $2,999 | 202 (1.7%) | 0 (0.0%) |
| $3,000 or more | 365 (3.1%) | 21 (0.6%) |
| Total | 11,914 (100.0%) | 3,698 (100.0%) |
Physical Housing Characteristics in Champaign County
Housing Structures in Champaign County
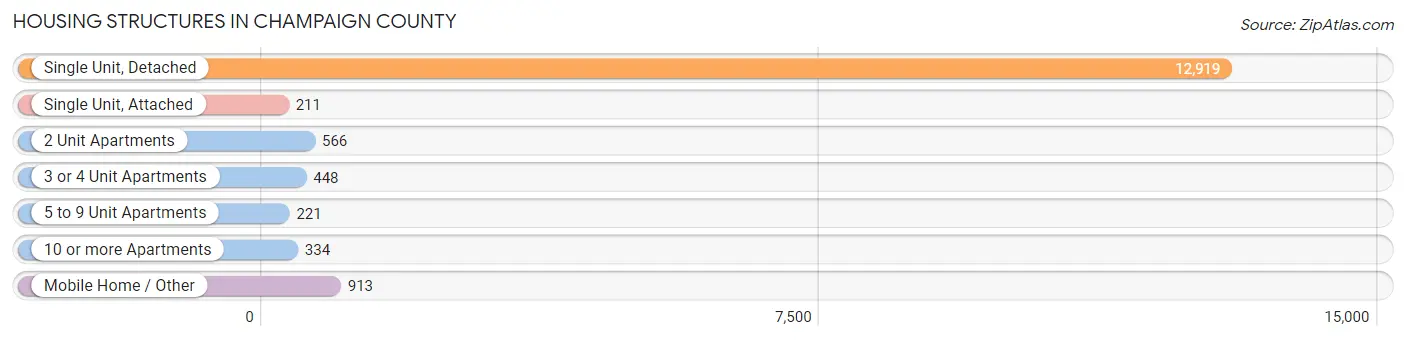
| Structure Type | # Housing Units | % Housing Units |
| Single Unit, Detached | 12,919 | 82.8% |
| Single Unit, Attached | 211 | 1.3% |
| 2 Unit Apartments | 566 | 3.6% |
| 3 or 4 Unit Apartments | 448 | 2.9% |
| 5 to 9 Unit Apartments | 221 | 1.4% |
| 10 or more Apartments | 334 | 2.1% |
| Mobile Home / Other | 913 | 5.9% |
| Total | 15,612 | 100.0% |
Housing Structures by Occupancy in Champaign County

| Structure Type | Owner-occupied | Renter-occupied |
| Single Unit, Detached | 11,095 (85.9%) | 1,824 (14.1%) |
| Single Unit, Attached | 117 (55.4%) | 94 (44.6%) |
| 2 Unit Apartments | 77 (13.6%) | 489 (86.4%) |
| 3 or 4 Unit Apartments | 13 (2.9%) | 435 (97.1%) |
| 5 to 9 Unit Apartments | 0 (0.0%) | 221 (100.0%) |
| 10 or more Apartments | 7 (2.1%) | 327 (97.9%) |
| Mobile Home / Other | 605 (66.3%) | 308 (33.7%) |
| Total | 11,914 (76.3%) | 3,698 (23.7%) |
Housing Structures by Number of Rooms in Champaign County
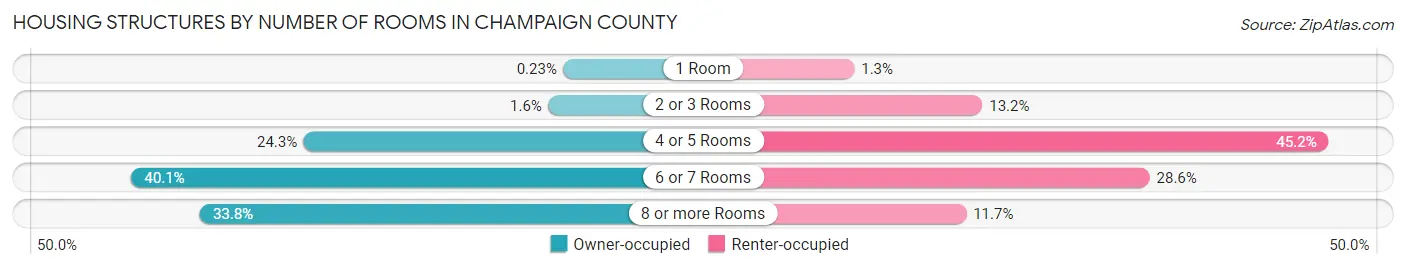
| Number of Rooms | Owner-occupied | Renter-occupied |
| 1 Room | 27 (0.2%) | 49 (1.3%) |
| 2 or 3 Rooms | 193 (1.6%) | 487 (13.2%) |
| 4 or 5 Rooms | 2,889 (24.2%) | 1,671 (45.2%) |
| 6 or 7 Rooms | 4,780 (40.1%) | 1,059 (28.6%) |
| 8 or more Rooms | 4,025 (33.8%) | 432 (11.7%) |
| Total | 11,914 (100.0%) | 3,698 (100.0%) |
Housing Structure by Heating Type in Champaign County

| Heating Type | Owner-occupied | Renter-occupied |
| Utility Gas | 4,066 (34.1%) | 1,633 (44.2%) |
| Bottled, Tank, or LP Gas | 3,075 (25.8%) | 481 (13.0%) |
| Electricity | 2,576 (21.6%) | 1,373 (37.1%) |
| Fuel Oil or Kerosene | 832 (7.0%) | 149 (4.0%) |
| Coal or Coke | 56 (0.5%) | 0 (0.0%) |
| All other Fuels | 1,187 (10.0%) | 53 (1.4%) |
| No Fuel Used | 122 (1.0%) | 9 (0.2%) |
| Total | 11,914 (100.0%) | 3,698 (100.0%) |
Household Vehicle Usage in Champaign County

| Vehicles per Household | Owner-occupied | Renter-occupied |
| No Vehicle | 230 (1.9%) | 534 (14.4%) |
| 1 Vehicle | 2,384 (20.0%) | 1,545 (41.8%) |
| 2 Vehicles | 4,709 (39.5%) | 1,106 (29.9%) |
| 3 or more Vehicles | 4,591 (38.5%) | 513 (13.9%) |
| Total | 11,914 (100.0%) | 3,698 (100.0%) |
Real Estate & Mortgages in Champaign County
Real Estate and Mortgage Overview in Champaign County
| Characteristic | Without Mortgage | With Mortgage |
| Housing Units | 5,004 | 6,910 |
| Median Property Value | $159,400 | $171,800 |
| Median Household Income | $67,716 | $923 |
| Monthly Housing Costs | $564 | $354 |
| Real Estate Taxes | $1,864 | $163 |
Property Value by Mortgage Status in Champaign County
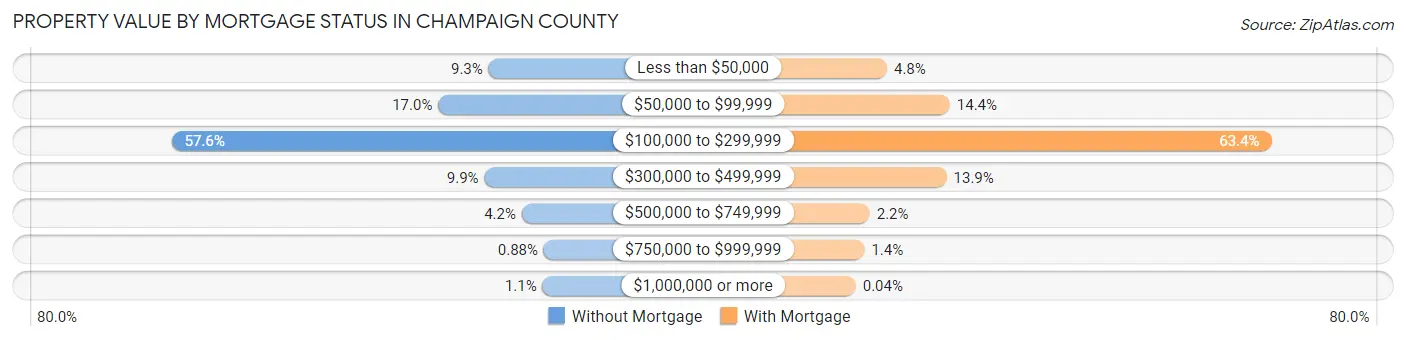
| Property Value | Without Mortgage | With Mortgage |
| Less than $50,000 | 465 (9.3%) | 332 (4.8%) |
| $50,000 to $99,999 | 849 (17.0%) | 993 (14.4%) |
| $100,000 to $299,999 | 2,883 (57.6%) | 4,379 (63.4%) |
| $300,000 to $499,999 | 497 (9.9%) | 959 (13.9%) |
| $500,000 to $749,999 | 212 (4.2%) | 150 (2.2%) |
| $750,000 to $999,999 | 44 (0.9%) | 94 (1.4%) |
| $1,000,000 or more | 54 (1.1%) | 3 (0.0%) |
| Total | 5,004 (100.0%) | 6,910 (100.0%) |
Household Income by Mortgage Status in Champaign County
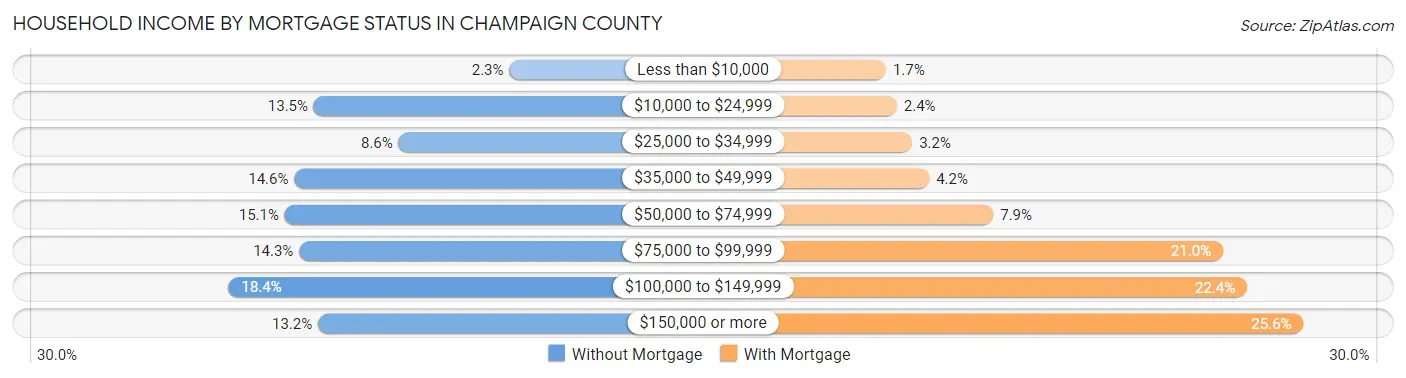
| Household Income | Without Mortgage | With Mortgage |
| Less than $10,000 | 115 (2.3%) | 120 (1.7%) |
| $10,000 to $24,999 | 674 (13.5%) | 163 (2.4%) |
| $25,000 to $34,999 | 432 (8.6%) | 224 (3.2%) |
| $35,000 to $49,999 | 730 (14.6%) | 291 (4.2%) |
| $50,000 to $74,999 | 757 (15.1%) | 544 (7.9%) |
| $75,000 to $99,999 | 716 (14.3%) | 1,451 (21.0%) |
| $100,000 to $149,999 | 918 (18.3%) | 1,546 (22.4%) |
| $150,000 or more | 662 (13.2%) | 1,768 (25.6%) |
| Total | 5,004 (100.0%) | 6,910 (100.0%) |
Property Value to Household Income Ratio in Champaign County
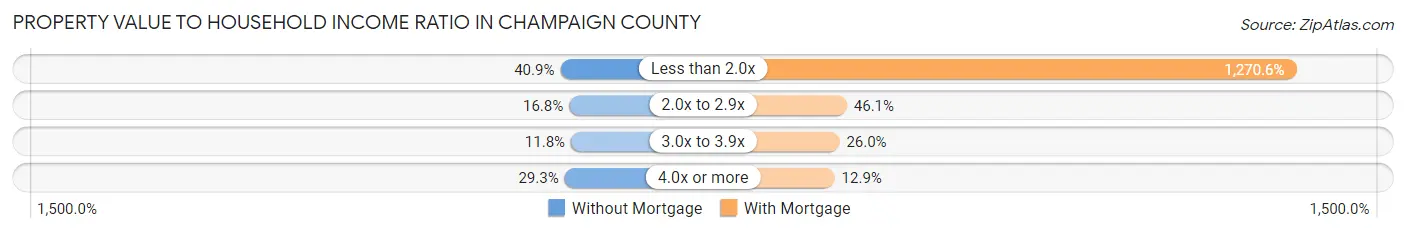
| Value-to-Income Ratio | Without Mortgage | With Mortgage |
| Less than 2.0x | 2,045 (40.9%) | 87,797 (1,270.6%) |
| 2.0x to 2.9x | 840 (16.8%) | 3,188 (46.1%) |
| 3.0x to 3.9x | 588 (11.7%) | 1,796 (26.0%) |
| 4.0x or more | 1,465 (29.3%) | 892 (12.9%) |
| Total | 5,004 (100.0%) | 6,910 (100.0%) |
Real Estate Taxes by Mortgage Status in Champaign County
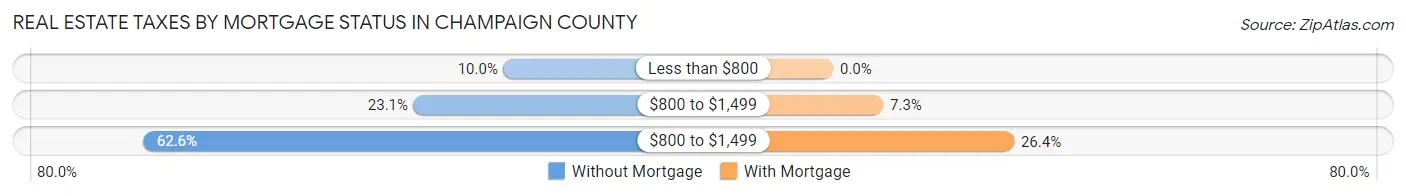
| Property Taxes | Without Mortgage | With Mortgage |
| Less than $800 | 500 (10.0%) | 0 (0.0%) |
| $800 to $1,499 | 1,157 (23.1%) | 505 (7.3%) |
| $800 to $1,499 | 3,131 (62.6%) | 1,827 (26.4%) |
| Total | 5,004 (100.0%) | 6,910 (100.0%) |
Health & Disability in Champaign County
Health Insurance Coverage by Age in Champaign County
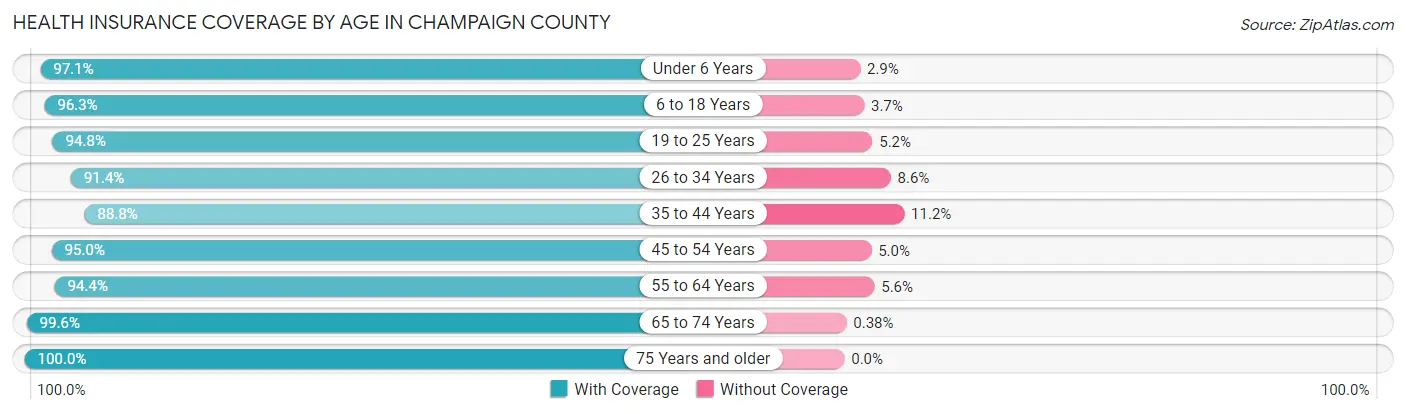
| Age Bracket | With Coverage | Without Coverage |
| Under 6 Years | 2,386 (97.1%) | 72 (2.9%) |
| 6 to 18 Years | 6,309 (96.3%) | 241 (3.7%) |
| 19 to 25 Years | 2,940 (94.8%) | 162 (5.2%) |
| 26 to 34 Years | 3,573 (91.4%) | 338 (8.6%) |
| 35 to 44 Years | 3,867 (88.8%) | 486 (11.2%) |
| 45 to 54 Years | 5,000 (95.0%) | 264 (5.0%) |
| 55 to 64 Years | 5,231 (94.4%) | 310 (5.6%) |
| 65 to 74 Years | 4,142 (99.6%) | 16 (0.4%) |
| 75 Years and older | 2,945 (100.0%) | 0 (0.0%) |
| Total | 36,393 (95.1%) | 1,889 (4.9%) |
Health Insurance Coverage by Citizenship Status in Champaign County
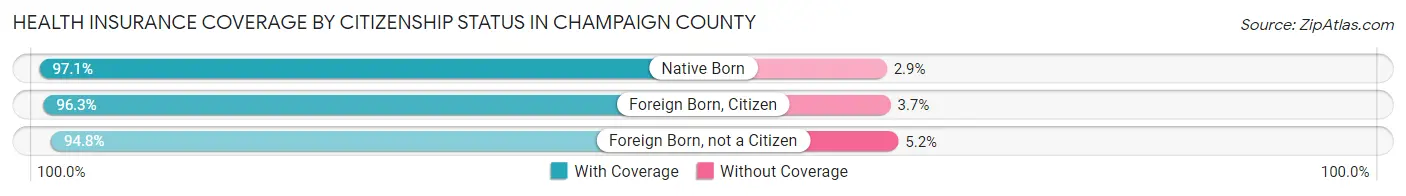
| Citizenship Status | With Coverage | Without Coverage |
| Native Born | 2,386 (97.1%) | 72 (2.9%) |
| Foreign Born, Citizen | 6,309 (96.3%) | 241 (3.7%) |
| Foreign Born, not a Citizen | 2,940 (94.8%) | 162 (5.2%) |
Health Insurance Coverage by Household Income in Champaign County
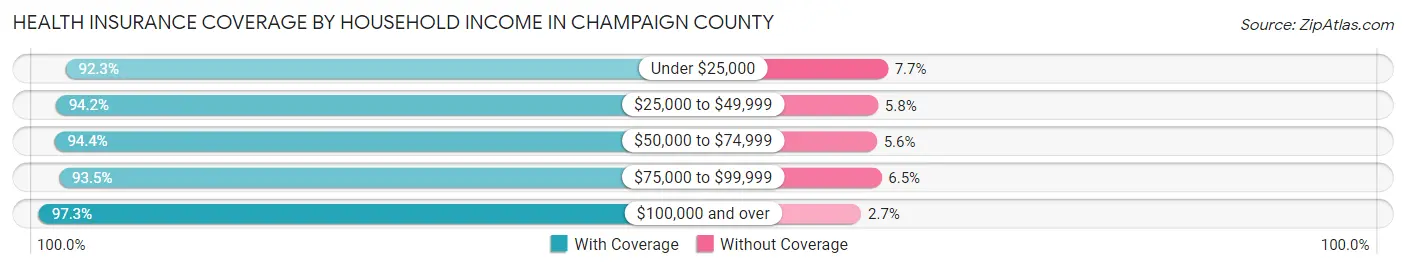
| Household Income | With Coverage | Without Coverage |
| Under $25,000 | 3,035 (92.3%) | 252 (7.7%) |
| $25,000 to $49,999 | 5,262 (94.2%) | 326 (5.8%) |
| $50,000 to $74,999 | 6,709 (94.4%) | 398 (5.6%) |
| $75,000 to $99,999 | 7,876 (93.5%) | 545 (6.5%) |
| $100,000 and over | 13,275 (97.3%) | 366 (2.7%) |
Public vs Private Health Insurance Coverage by Age in Champaign County

| Age Bracket | Public Insurance | Private Insurance |
| Under 6 | 801 (32.6%) | 1,737 (70.7%) |
| 6 to 18 Years | 1,773 (27.1%) | 4,764 (72.7%) |
| 19 to 25 Years | 551 (17.8%) | 2,482 (80.0%) |
| 25 to 34 Years | 688 (17.6%) | 2,951 (75.4%) |
| 35 to 44 Years | 851 (19.6%) | 3,114 (71.5%) |
| 45 to 54 Years | 865 (16.4%) | 4,250 (80.7%) |
| 55 to 64 Years | 1,005 (18.1%) | 4,423 (79.8%) |
| 65 to 74 Years | 3,961 (95.3%) | 2,787 (67.0%) |
| 75 Years and over | 2,906 (98.7%) | 1,988 (67.5%) |
| Total | 13,401 (35.0%) | 28,496 (74.4%) |
Disability Status by Sex by Age in Champaign County
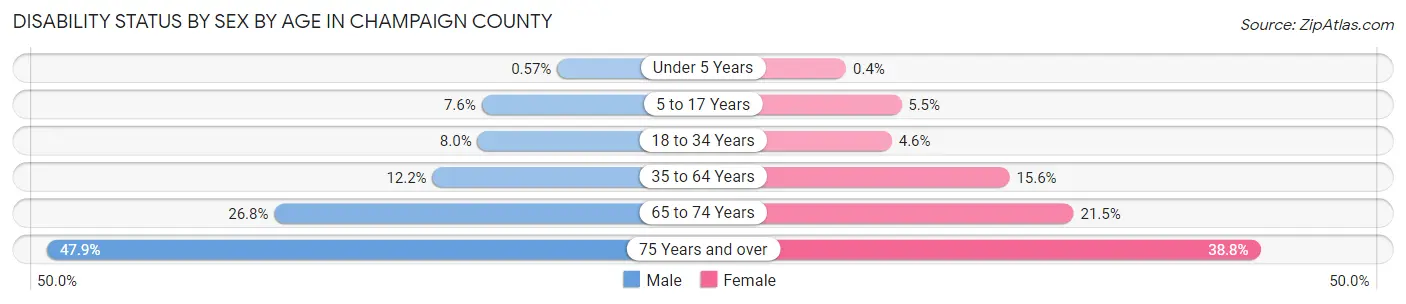
| Age Bracket | Male | Female |
| Under 5 Years | 6 (0.6%) | 4 (0.4%) |
| 5 to 17 Years | 254 (7.6%) | 174 (5.5%) |
| 18 to 34 Years | 309 (8.0%) | 166 (4.6%) |
| 35 to 64 Years | 921 (12.1%) | 1,179 (15.6%) |
| 65 to 74 Years | 543 (26.8%) | 459 (21.5%) |
| 75 Years and over | 576 (47.9%) | 677 (38.8%) |
Disability Class by Sex by Age in Champaign County
Disability Class: Hearing Difficulty
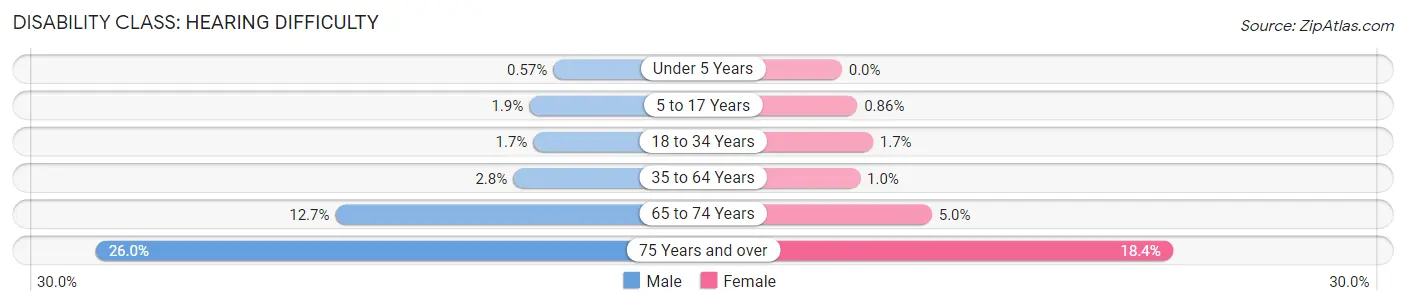
| Age Bracket | Male | Female |
| Under 5 Years | 6 (0.6%) | 0 (0.0%) |
| 5 to 17 Years | 64 (1.9%) | 27 (0.9%) |
| 18 to 34 Years | 65 (1.7%) | 62 (1.7%) |
| 35 to 64 Years | 212 (2.8%) | 77 (1.0%) |
| 65 to 74 Years | 257 (12.7%) | 107 (5.0%) |
| 75 Years and over | 313 (26.0%) | 321 (18.4%) |
Disability Class: Vision Difficulty
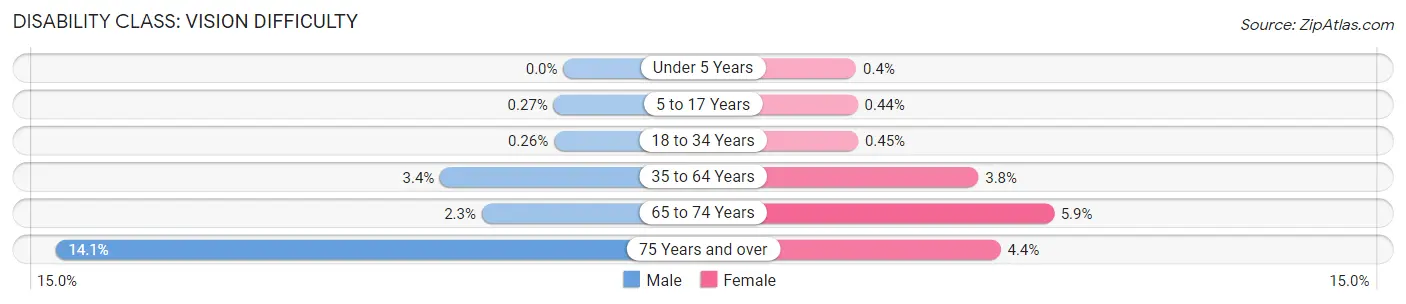
| Age Bracket | Male | Female |
| Under 5 Years | 0 (0.0%) | 4 (0.4%) |
| 5 to 17 Years | 9 (0.3%) | 14 (0.4%) |
| 18 to 34 Years | 10 (0.3%) | 16 (0.4%) |
| 35 to 64 Years | 260 (3.4%) | 288 (3.8%) |
| 65 to 74 Years | 46 (2.3%) | 126 (5.9%) |
| 75 Years and over | 170 (14.1%) | 77 (4.4%) |
Disability Class: Cognitive Difficulty
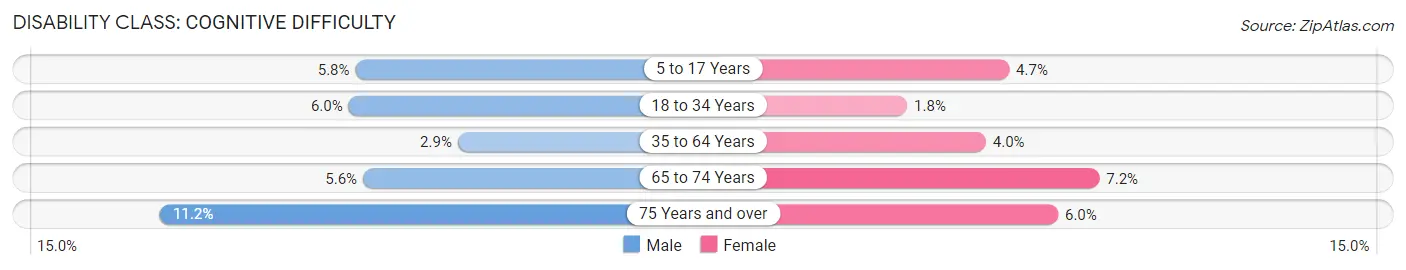
| Age Bracket | Male | Female |
| 5 to 17 Years | 194 (5.8%) | 147 (4.7%) |
| 18 to 34 Years | 232 (6.0%) | 65 (1.8%) |
| 35 to 64 Years | 223 (2.9%) | 304 (4.0%) |
| 65 to 74 Years | 113 (5.6%) | 153 (7.2%) |
| 75 Years and over | 135 (11.2%) | 105 (6.0%) |
Disability Class: Ambulatory Difficulty
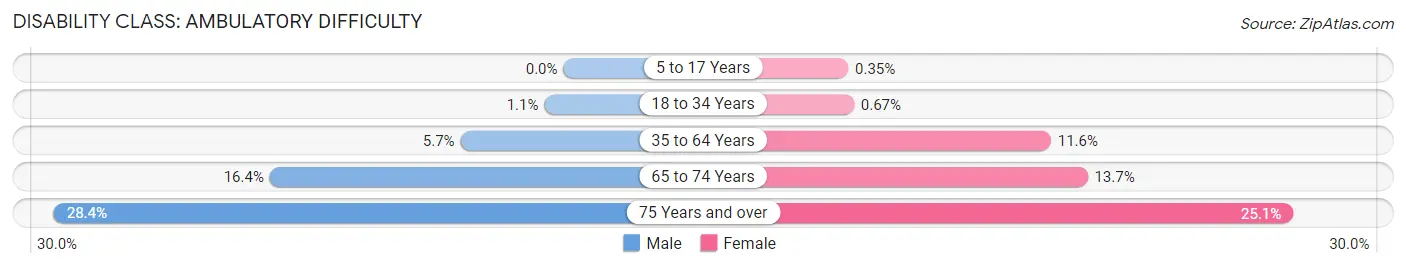
| Age Bracket | Male | Female |
| 5 to 17 Years | 0 (0.0%) | 11 (0.4%) |
| 18 to 34 Years | 41 (1.1%) | 24 (0.7%) |
| 35 to 64 Years | 434 (5.7%) | 882 (11.6%) |
| 65 to 74 Years | 331 (16.4%) | 292 (13.7%) |
| 75 Years and over | 341 (28.4%) | 438 (25.1%) |
Disability Class: Self-Care Difficulty
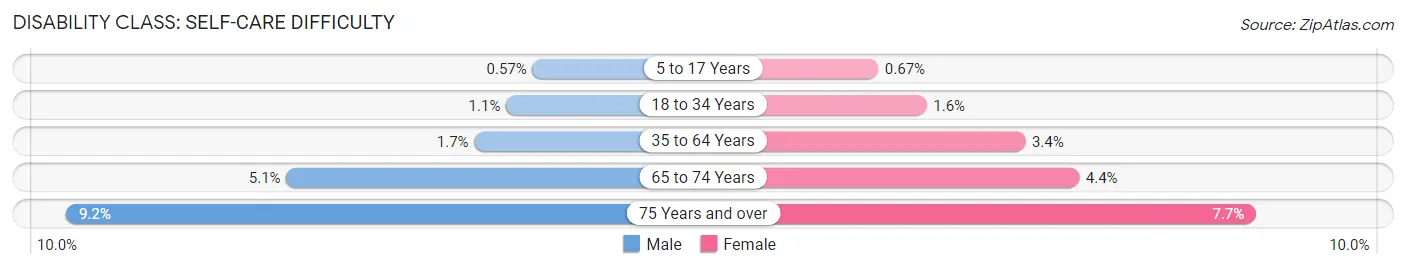
| Age Bracket | Male | Female |
| 5 to 17 Years | 19 (0.6%) | 21 (0.7%) |
| 18 to 34 Years | 41 (1.1%) | 56 (1.6%) |
| 35 to 64 Years | 125 (1.7%) | 258 (3.4%) |
| 65 to 74 Years | 104 (5.1%) | 94 (4.4%) |
| 75 Years and over | 111 (9.2%) | 134 (7.7%) |
Technology Access in Champaign County
Computing Device Access in Champaign County
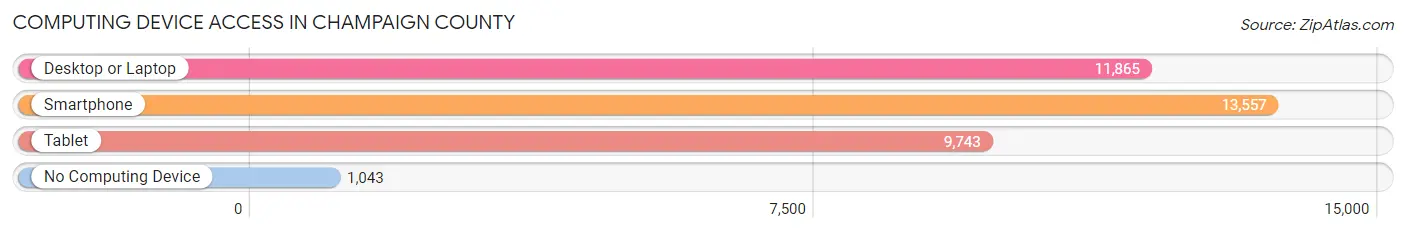
| Device Type | # Households | % Households |
| Desktop or Laptop | 11,865 | 76.0% |
| Smartphone | 13,557 | 86.8% |
| Tablet | 9,743 | 62.4% |
| No Computing Device | 1,043 | 6.7% |
| Total | 15,612 | 100.0% |
Internet Access in Champaign County
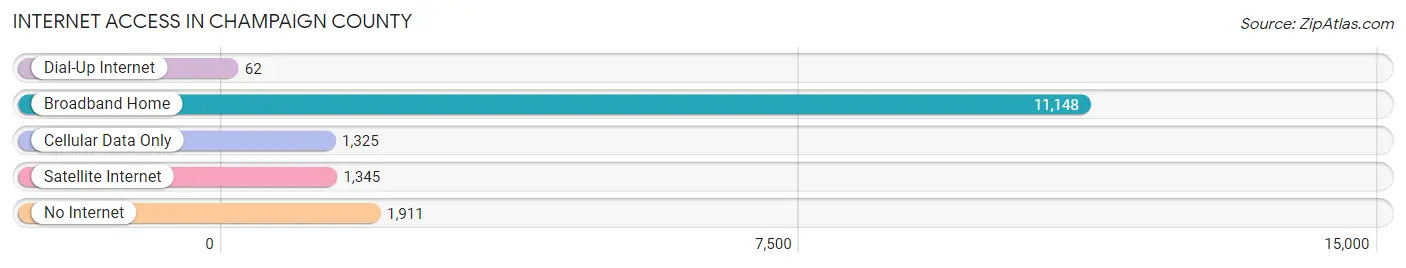
| Internet Type | # Households | % Households |
| Dial-Up Internet | 62 | 0.4% |
| Broadband Home | 11,148 | 71.4% |
| Cellular Data Only | 1,325 | 8.5% |
| Satellite Internet | 1,345 | 8.6% |
| No Internet | 1,911 | 12.2% |
| Total | 15,612 | 100.0% |
Champaign County Summary
Champaign County, Ohio is located in the western part of the state, and is part of the Dayton metropolitan area. The county seat is Urbana, and the county is bordered by Clark, Logan, Shelby, Union, and Madison counties. The county was established in 1805 and named after the French province of Champagne. As of the 2010 census, the population of Champaign County was 40,097.
Geography
Champaign County is located in the western part of Ohio, and is part of the Dayton metropolitan area. The county is bordered by Clark, Logan, Shelby, Union, and Madison counties. The county has a total area of 518 square miles, of which 517 square miles is land and 1.2 square miles is water. The county is mostly flat, with some rolling hills in the northern and eastern parts. The Mad River runs through the county, and there are several small lakes and ponds scattered throughout.
The county is divided into two distinct regions: the northern part is mostly rural, with small towns and villages, while the southern part is more urbanized, with larger cities and towns. The county is home to several state parks, including Buck Creek State Park, Mad River Gorge State Nature Preserve, and the Champaign County State Wildlife Area.
Demographics
As of the 2010 census, the population of Champaign County was 40,097. The population density was 78.2 people per square mile. The racial makeup of the county was 92.3% White, 4.2% African American, 0.4% Native American, 0.7% Asian, 0.1% Pacific Islander, 0.7% from other races, and 1.6% from two or more races. Hispanic or Latino of any race were 2.2% of the population.
The median income for a household in the county was $45,837, and the median income for a family was $54,837. The per capita income for the county was $21,837. About 8.7% of families and 11.2% of the population were below the poverty line, including 15.2% of those under age 18 and 8.2% of those age 65 or over.
Economy
The economy of Champaign County is largely based on agriculture and manufacturing. The county is home to several large farms, and the agricultural industry is the largest employer in the county. The county is also home to several manufacturing companies, including Honda of America, which has a large manufacturing plant in the county.
The county also has a growing tourism industry, with several attractions, including the Champaign County Historical Society Museum, the Champaign County Fairgrounds, and the Mad River Gorge State Nature Preserve.
Conclusion
Champaign County, Ohio is a rural county located in the western part of the state. The county is home to several state parks, and the economy is largely based on agriculture and manufacturing. The population of the county is 40,097, and the median income for a household is $45,837. The county is also home to several attractions, making it a popular tourist destination.
Common Questions
What is the Total Population of Champaign County?
Total Population of Champaign County is 38,715.
What is the Total Male Population of Champaign County?
Total Male Population of Champaign County is 19,337.
What is the Total Female Population of Champaign County?
Total Female Population of Champaign County is 19,378.
What is the Ratio of Males per 100 Females in Champaign County?
There are 99.79 Males per 100 Females in Champaign County.
What is the Ratio of Females per 100 Males in Champaign County?
There are 100.21 Females per 100 Males in Champaign County.
What is the Median Population Age in Champaign County?
Median Population Age in Champaign County is 41.7 Years.
What is the Average Family Size in Champaign County
Average Family Size in Champaign County is 2.9 People.
What is the Average Household Size in Champaign County
Average Household Size in Champaign County is 2.4 People.
What is Per Capita Income in Champaign County?
Per Capita income in Champaign County is $33,377.
What is the Median Family Income in Champaign County?
Median Family Income in Champaign County is $83,504.
What is the Median Household income in Champaign County?
Median Household Income in Champaign County is $70,486.
What is Income or Wage Gap in Champaign County?
Income or Wage Gap in Champaign County is 30.1%.
Women in Champaign County earn 69.9 cents for every dollar earned by a man.
What is Family Income Deficit in Champaign County?
Family Income Deficit in Champaign County is $10,567.
Families that are below poverty line in Champaign County earn $10,567 less on average than the poverty threshold level.
What is Inequality or Gini Index in Champaign County?
Inequality or Gini Index in Champaign County is 0.38.
How Large is the Labor Force in Champaign County?
There are 19,818 People in the Labor Forcein in Champaign County.
What is the Percentage of People in the Labor Force in Champaign County?
63.0% of People are in the Labor Force in Champaign County.
What is the Unemployment Rate in Champaign County?
Unemployment Rate in Champaign County is 4.5%.