Belmont County, OH
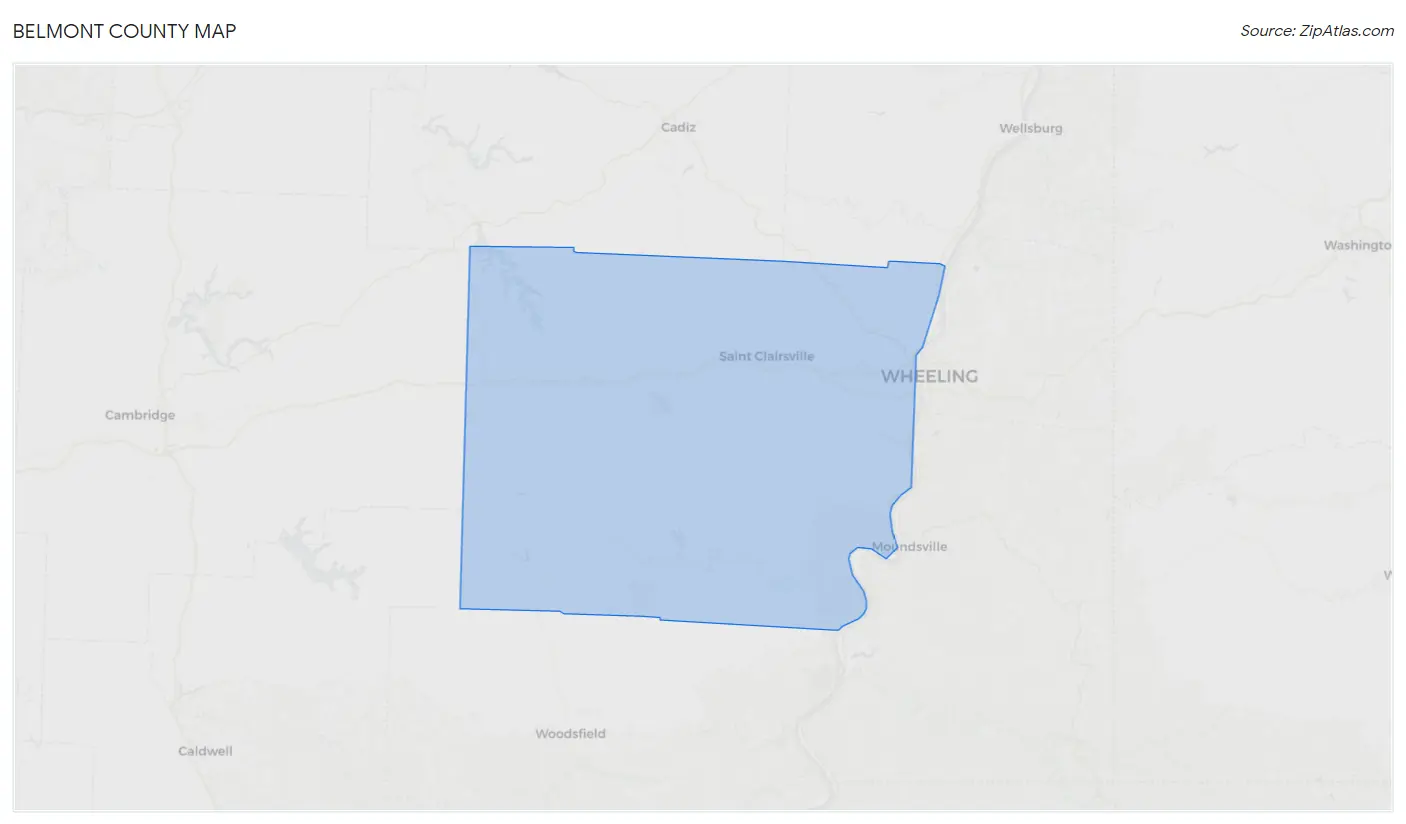
Belmont County Map
Belmont County Overview
66,554
TOTAL POPULATION
34,600
MALE POPULATION
31,954
FEMALE POPULATION
108.28
MALES / 100 FEMALES
92.35
FEMALES / 100 MALES
44.1
MEDIAN AGE
3.1
AVG FAMILY SIZE
2.4
AVG HOUSEHOLD SIZE
$30,563
PER CAPITA INCOME
$72,358
AVG FAMILY INCOME
$56,943
AVG HOUSEHOLD INCOME
24.2%
WAGE / INCOME GAP [ % ]
75.8¢/ $1
WAGE / INCOME GAP [ $ ]
$12,399
FAMILY INCOME DEFICIT
0.44
INEQUALITY / GINI INDEX
30,285
LABOR FORCE [ PEOPLE ]
54.3%
PERCENT IN LABOR FORCE
6.0%
UNEMPLOYMENT RATE
Belmont County Area Codes
Race in Belmont County
The most populous races in Belmont County are White / Caucasian (61,237 | 92.0%), Two or more Races (2,516 | 3.8%), and Black / African American (2,014 | 3.0%).
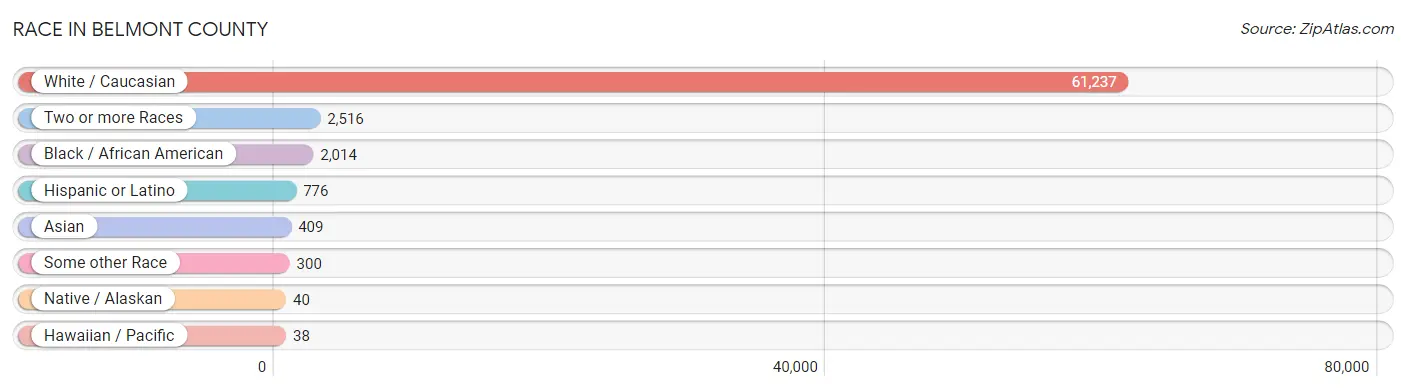
| Race | # Population | % Population |
| Asian | 409 | 0.6% |
| Black / African American | 2,014 | 3.0% |
| Hawaiian / Pacific | 38 | 0.1% |
| Hispanic or Latino | 776 | 1.2% |
| Native / Alaskan | 40 | 0.1% |
| White / Caucasian | 61,237 | 92.0% |
| Two or more Races | 2,516 | 3.8% |
| Some other Race | 300 | 0.4% |
| Total | 66,554 | 100.0% |
Ancestry in Belmont County
The most populous ancestries reported in Belmont County are German (11,965 | 18.0%), Irish (8,755 | 13.2%), English (7,124 | 10.7%), Italian (5,816 | 8.7%), and Polish (4,629 | 7.0%), together accounting for 57.5% of all Belmont County residents.

| Ancestry | # Population | % Population |
| African | 1,248 | 1.9% |
| Alsatian | 13 | 0.0% |
| American | 2,944 | 4.4% |
| Apache | 3 | 0.0% |
| Arab | 123 | 0.2% |
| Argentinean | 5 | 0.0% |
| Austrian | 200 | 0.3% |
| Bangladeshi | 4 | 0.0% |
| Belgian | 30 | 0.1% |
| Bhutanese | 7 | 0.0% |
| Blackfeet | 67 | 0.1% |
| British | 258 | 0.4% |
| Burmese | 80 | 0.1% |
| Canadian | 8 | 0.0% |
| Carpatho Rusyn | 7 | 0.0% |
| Celtic | 13 | 0.0% |
| Central American | 67 | 0.1% |
| Cherokee | 92 | 0.1% |
| Chippewa | 5 | 0.0% |
| Choctaw | 47 | 0.1% |
| Croatian | 110 | 0.2% |
| Czech | 540 | 0.8% |
| Czechoslovakian | 127 | 0.2% |
| Danish | 5 | 0.0% |
| Dutch | 716 | 1.1% |
| Eastern European | 107 | 0.2% |
| Egyptian | 2 | 0.0% |
| English | 7,124 | 10.7% |
| European | 779 | 1.2% |
| French | 1,006 | 1.5% |
| French American Indian | 6 | 0.0% |
| French Canadian | 80 | 0.1% |
| German | 11,965 | 18.0% |
| Greek | 520 | 0.8% |
| Guatemalan | 52 | 0.1% |
| Hungarian | 1,447 | 2.2% |
| Indian (Asian) | 74 | 0.1% |
| Irish | 8,755 | 13.2% |
| Italian | 5,816 | 8.7% |
| Jamaican | 5 | 0.0% |
| Korean | 108 | 0.2% |
| Lebanese | 84 | 0.1% |
| Lithuanian | 18 | 0.0% |
| Mexican | 247 | 0.4% |
| Native Hawaiian | 5 | 0.0% |
| Norwegian | 149 | 0.2% |
| Paiute | 4 | 0.0% |
| Panamanian | 15 | 0.0% |
| Pennsylvania German | 10 | 0.0% |
| Peruvian | 27 | 0.0% |
| Polish | 4,629 | 7.0% |
| Portuguese | 21 | 0.0% |
| Puerto Rican | 205 | 0.3% |
| Romanian | 240 | 0.4% |
| Russian | 193 | 0.3% |
| Samoan | 33 | 0.1% |
| Scandinavian | 87 | 0.1% |
| Scotch-Irish | 648 | 1.0% |
| Scottish | 1,244 | 1.9% |
| Seminole | 26 | 0.0% |
| Serbian | 280 | 0.4% |
| Slavic | 61 | 0.1% |
| Slovak | 787 | 1.2% |
| Slovene | 35 | 0.1% |
| South American | 32 | 0.1% |
| Spaniard | 78 | 0.1% |
| Spanish | 44 | 0.1% |
| Sri Lankan | 9 | 0.0% |
| Subsaharan African | 1,248 | 1.9% |
| Swedish | 94 | 0.1% |
| Swiss | 392 | 0.6% |
| Syrian | 10 | 0.0% |
| Thai | 163 | 0.2% |
| Trinidadian and Tobagonian | 7 | 0.0% |
| Turkish | 13 | 0.0% |
| Ukrainian | 144 | 0.2% |
| Welsh | 558 | 0.8% |
| West Indian | 25 | 0.0% |
| Yugoslavian | 53 | 0.1% | View All 79 Rows |
Immigrants in Belmont County
The most numerous immigrant groups reported in Belmont County came from Asia (318 | 0.5%), Europe (226 | 0.3%), South Central Asia (161 | 0.2%), Latin America (123 | 0.2%), and Western Europe (103 | 0.2%), together accounting for 1.4% of all Belmont County residents.
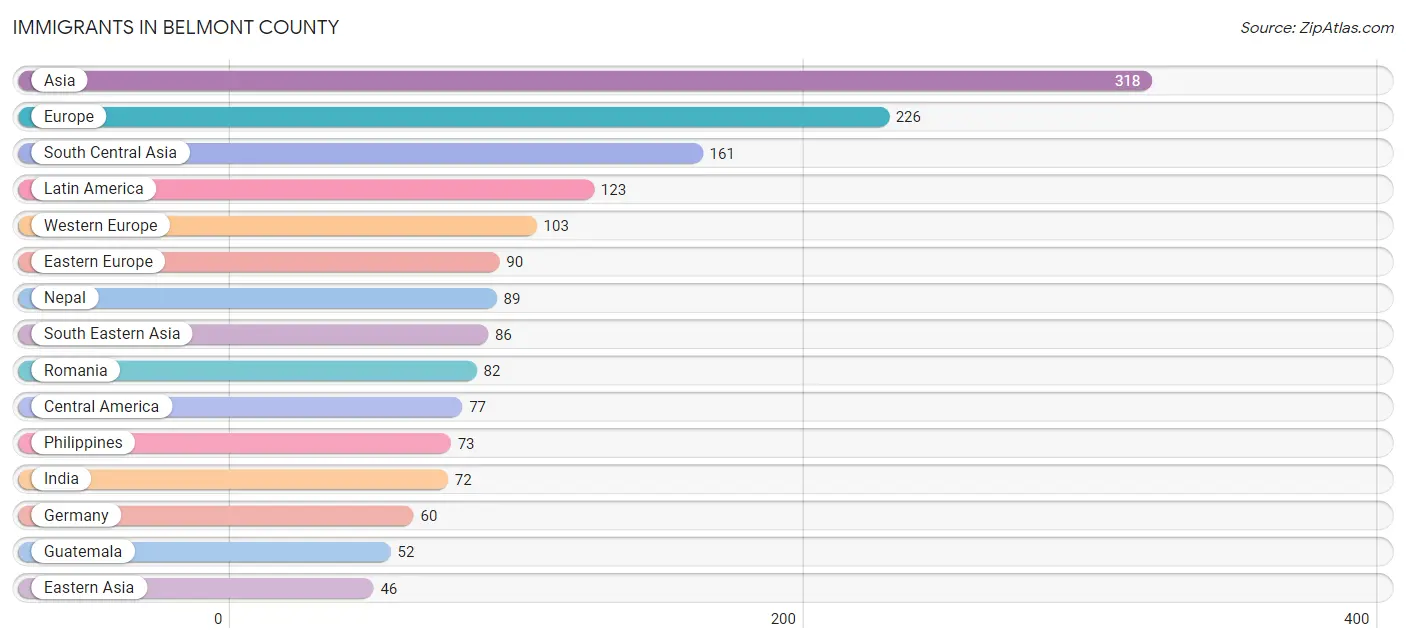
| Immigration Origin | # Population | % Population |
| Africa | 7 | 0.0% |
| Argentina | 5 | 0.0% |
| Asia | 318 | 0.5% |
| Austria | 14 | 0.0% |
| Belgium | 7 | 0.0% |
| Canada | 40 | 0.1% |
| Caribbean | 14 | 0.0% |
| Central America | 77 | 0.1% |
| China | 39 | 0.1% |
| Croatia | 8 | 0.0% |
| Eastern Africa | 1 | 0.0% |
| Eastern Asia | 46 | 0.1% |
| Eastern Europe | 90 | 0.1% |
| England | 9 | 0.0% |
| Europe | 226 | 0.3% |
| France | 22 | 0.0% |
| Germany | 60 | 0.1% |
| Greece | 4 | 0.0% |
| Guatemala | 52 | 0.1% |
| India | 72 | 0.1% |
| Indonesia | 6 | 0.0% |
| Italy | 20 | 0.0% |
| Japan | 7 | 0.0% |
| Kuwait | 7 | 0.0% |
| Latin America | 123 | 0.2% |
| Lebanon | 5 | 0.0% |
| Mexico | 19 | 0.0% |
| Morocco | 6 | 0.0% |
| Nepal | 89 | 0.1% |
| Northern Africa | 6 | 0.0% |
| Northern Europe | 9 | 0.0% |
| Oceania | 13 | 0.0% |
| Panama | 6 | 0.0% |
| Peru | 27 | 0.0% |
| Philippines | 73 | 0.1% |
| Romania | 82 | 0.1% |
| South America | 32 | 0.1% |
| South Central Asia | 161 | 0.2% |
| South Eastern Asia | 86 | 0.1% |
| Southern Europe | 24 | 0.0% |
| Thailand | 7 | 0.0% |
| Trinidad and Tobago | 7 | 0.0% |
| Turkey | 13 | 0.0% |
| Western Asia | 25 | 0.0% |
| Western Europe | 103 | 0.2% | View All 45 Rows |
Sex and Age in Belmont County
Sex and Age in Belmont County
The most populous age groups in Belmont County are 55 to 59 Years (2,635 | 7.6%) for men and 60 to 64 Years (2,571 | 8.1%) for women.

| Age Bracket | Male | Female |
| Under 5 Years | 1,636 (4.7%) | 1,440 (4.5%) |
| 5 to 9 Years | 1,818 (5.2%) | 1,611 (5.0%) |
| 10 to 14 Years | 1,764 (5.1%) | 1,789 (5.6%) |
| 15 to 19 Years | 2,291 (6.6%) | 1,740 (5.4%) |
| 20 to 24 Years | 2,090 (6.0%) | 1,517 (4.8%) |
| 25 to 29 Years | 2,326 (6.7%) | 1,688 (5.3%) |
| 30 to 34 Years | 2,263 (6.5%) | 1,760 (5.5%) |
| 35 to 39 Years | 2,197 (6.4%) | 2,069 (6.5%) |
| 40 to 44 Years | 2,394 (6.9%) | 1,597 (5.0%) |
| 45 to 49 Years | 2,174 (6.3%) | 1,879 (5.9%) |
| 50 to 54 Years | 2,315 (6.7%) | 2,071 (6.5%) |
| 55 to 59 Years | 2,635 (7.6%) | 2,507 (7.9%) |
| 60 to 64 Years | 2,371 (6.9%) | 2,571 (8.1%) |
| 65 to 69 Years | 2,292 (6.6%) | 2,309 (7.2%) |
| 70 to 74 Years | 1,891 (5.5%) | 1,968 (6.2%) |
| 75 to 79 Years | 976 (2.8%) | 1,177 (3.7%) |
| 80 to 84 Years | 524 (1.5%) | 1,241 (3.9%) |
| 85 Years and over | 643 (1.9%) | 1,020 (3.2%) |
| Total | 34,600 (100.0%) | 31,954 (100.0%) |
Families and Households in Belmont County
Median Family Size in Belmont County
The median family size in Belmont County is 3.06 persons per family, with single female/mother families (2,753 | 16.8%) accounting for the largest median family size of 3.25 persons per family. On the other hand, single male/father families (1,128 | 6.9%) represent the smallest median family size with 2.99 persons per family.
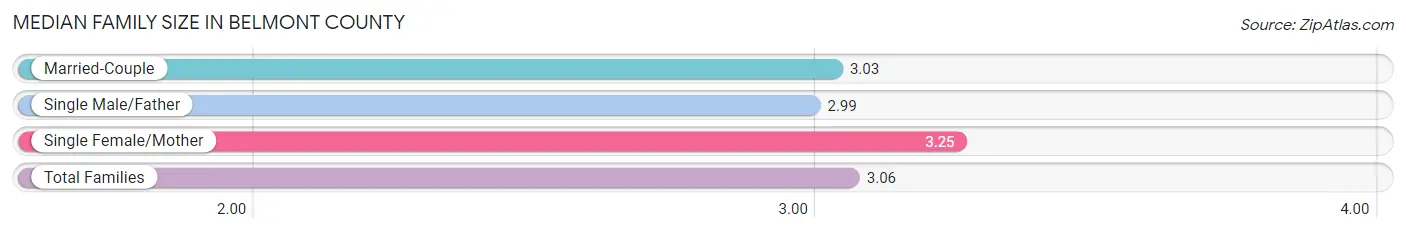
| Family Type | # Families | Family Size |
| Married-Couple | 12,553 (76.4%) | 3.03 |
| Single Male/Father | 1,128 (6.9%) | 2.99 |
| Single Female/Mother | 2,753 (16.8%) | 3.25 |
| Total Families | 16,434 (100.0%) | 3.06 |
Median Household Size in Belmont County
The median household size in Belmont County is 2.42 persons per household, with single female/mother households (2,753 | 10.6%) accounting for the largest median household size of 3.44 persons per household. non-family households (9,540 | 36.7%) represent the smallest median household size with 1.20 persons per household.
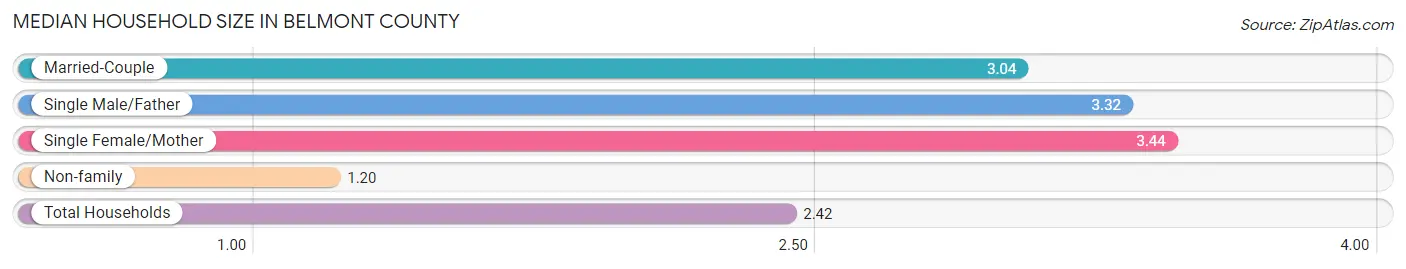
| Household Type | # Households | Household Size |
| Married-Couple | 12,553 (48.3%) | 3.04 |
| Single Male/Father | 1,128 (4.3%) | 3.32 |
| Single Female/Mother | 2,753 (10.6%) | 3.44 |
| Non-family | 9,540 (36.7%) | 1.20 |
| Total Households | 25,974 (100.0%) | 2.42 |
Household Size by Marriage Status in Belmont County
Out of a total of 25,974 households in Belmont County, 16,434 (63.3%) are family households, while 9,540 (36.7%) are nonfamily households. The most numerous type of family households are 2-person households, comprising 8,496, and the most common type of nonfamily households are 1-person households, comprising 8,378.
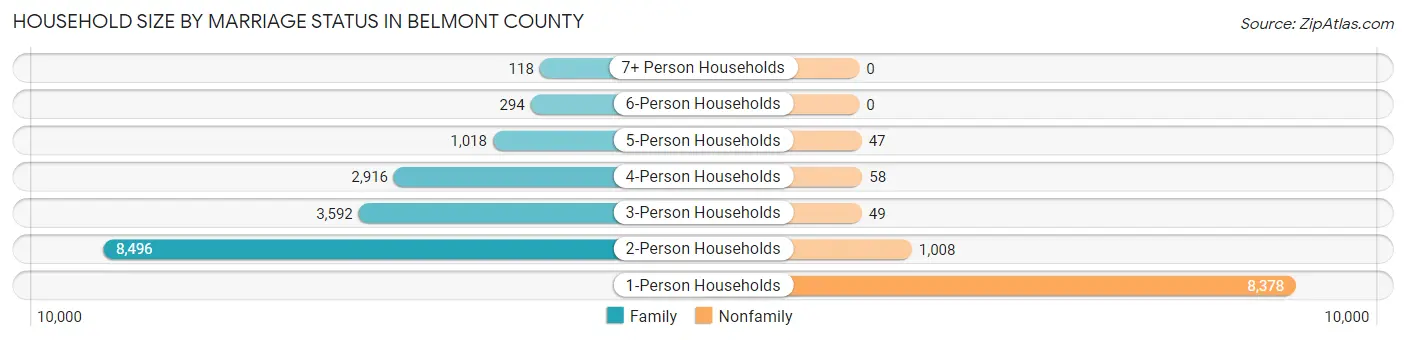
| Household Size | Family Households | Nonfamily Households |
| 1-Person Households | - | 8,378 (32.3%) |
| 2-Person Households | 8,496 (32.7%) | 1,008 (3.9%) |
| 3-Person Households | 3,592 (13.8%) | 49 (0.2%) |
| 4-Person Households | 2,916 (11.2%) | 58 (0.2%) |
| 5-Person Households | 1,018 (3.9%) | 47 (0.2%) |
| 6-Person Households | 294 (1.1%) | 0 (0.0%) |
| 7+ Person Households | 118 (0.4%) | 0 (0.0%) |
| Total | 16,434 (63.3%) | 9,540 (36.7%) |
Female Fertility in Belmont County
Fertility by Age in Belmont County
Average fertility rate in Belmont County is 40.0 births per 1,000 women. Women in the age bracket of 20 to 34 years have the highest fertility rate with 72.0 births per 1,000 women. Women in the age bracket of 20 to 34 years acount for 70.5% of all women with births.
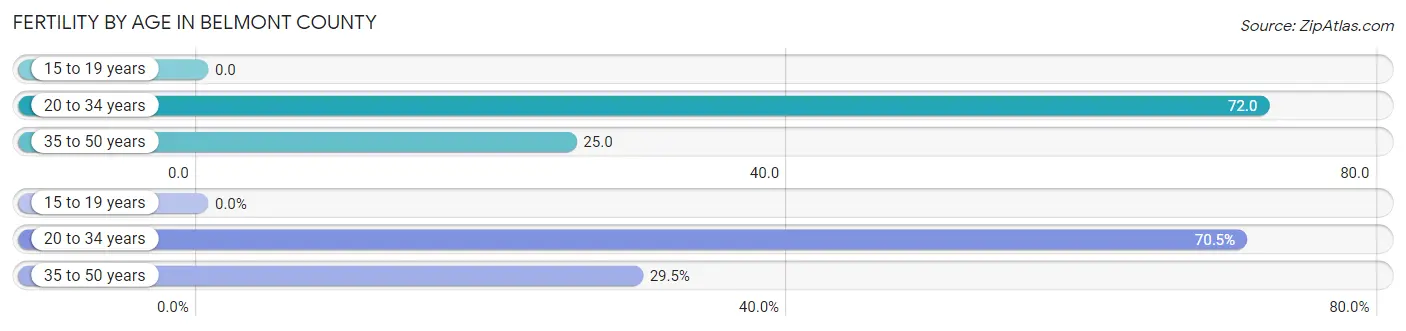
| Age Bracket | Women with Births | Births / 1,000 Women |
| 15 to 19 years | 0 (0.0%) | 0.0 |
| 20 to 34 years | 356 (70.5%) | 72.0 |
| 35 to 50 years | 149 (29.5%) | 25.0 |
| Total | 505 (100.0%) | 40.0 |
Fertility by Age by Marriage Status in Belmont County
65.0% of women with births (505) in Belmont County are married. The highest percentage of unmarried women with births falls into 20 to 34 years age bracket with 37.6% of them unmarried at the time of birth, while the lowest percentage of unmarried women with births belong to 35 to 50 years age bracket with 28.9% of them unmarried.
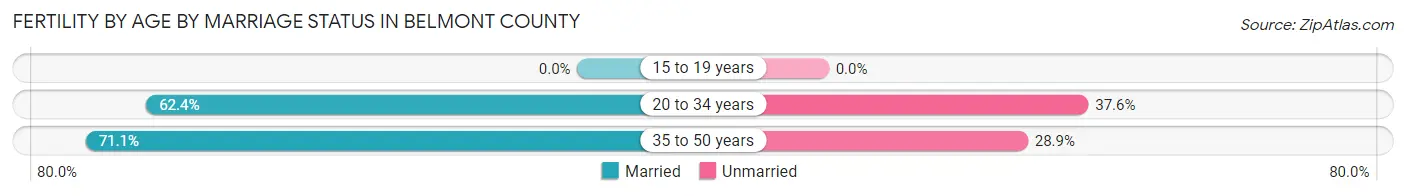
| Age Bracket | Married | Unmarried |
| 15 to 19 years | 0 (0.0%) | 0 (0.0%) |
| 20 to 34 years | 222 (62.4%) | 134 (37.6%) |
| 35 to 50 years | 106 (71.1%) | 43 (28.9%) |
| Total | 328 (64.9%) | 177 (35.0%) |
Fertility by Education in Belmont County
Average fertility rate in Belmont County is 40.0 births per 1,000 women. Women with the education attainment of graduate degree have the highest fertility rate of 68.0 births per 1,000 women, while women with the education attainment of less than high school have the lowest fertility at 22.0 births per 1,000 women. Women with the education attainment of college or associate's degree represent 43.6% of all women with births.

| Educational Attainment | Women with Births | Births / 1,000 Women |
| Less than High School | 44 (8.7%) | 22.0 |
| High School Diploma | 127 (25.2%) | 33.0 |
| College or Associate's Degree | 220 (43.6%) | 52.0 |
| Bachelor's Degree | 56 (11.1%) | 34.0 |
| Graduate Degree | 58 (11.5%) | 68.0 |
| Total | 505 (100.0%) | 40.0 |
Fertility by Education by Marriage Status in Belmont County
35.0% of women with births in Belmont County are unmarried. Women with the educational attainment of graduate degree are most likely to be married with 100.0% of them married at childbirth, while women with the educational attainment of less than high school are least likely to be married with 47.7% of them unmarried at childbirth.
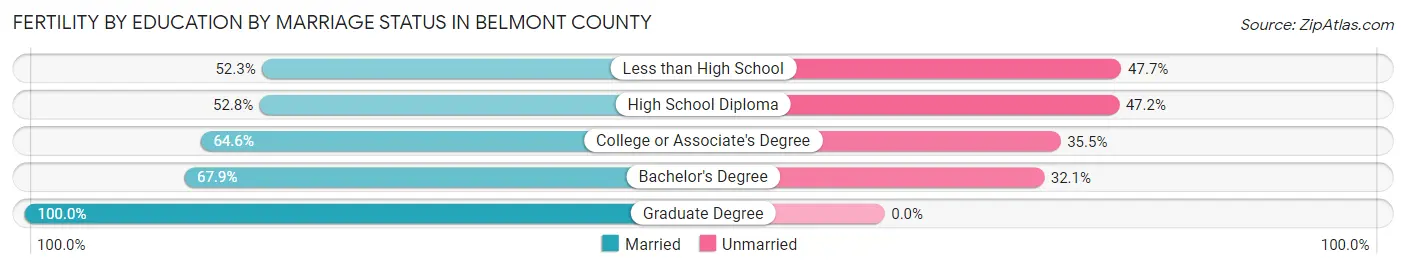
| Educational Attainment | Married | Unmarried |
| Less than High School | 23 (52.3%) | 21 (47.7%) |
| High School Diploma | 67 (52.8%) | 60 (47.2%) |
| College or Associate's Degree | 142 (64.5%) | 78 (35.4%) |
| Bachelor's Degree | 38 (67.9%) | 18 (32.1%) |
| Graduate Degree | 58 (100.0%) | 0 (0.0%) |
| Total | 328 (64.9%) | 177 (35.0%) |
Income in Belmont County
Income Overview in Belmont County
Per Capita Income in Belmont County is $30,563, while median incomes of families and households are $72,358 and $56,943 respectively.
| Characteristic | Number | Measure |
| Per Capita Income | 66,554 | $30,563 |
| Median Family Income | 16,434 | $72,358 |
| Mean Family Income | 16,434 | $87,037 |
| Median Household Income | 25,974 | $56,943 |
| Mean Household Income | 25,974 | $74,121 |
| Income Deficit | 16,434 | $12,399 |
| Wage / Income Gap (%) | 66,554 | 24.25% |
| Wage / Income Gap ($) | 66,554 | 75.75¢ per $1 |
| Gini / Inequality Index | 66,554 | 0.44 |
Earnings by Sex in Belmont County
Average Earnings in Belmont County are $30,564, $35,248 for men and $26,701 for women, a difference of 24.2%.
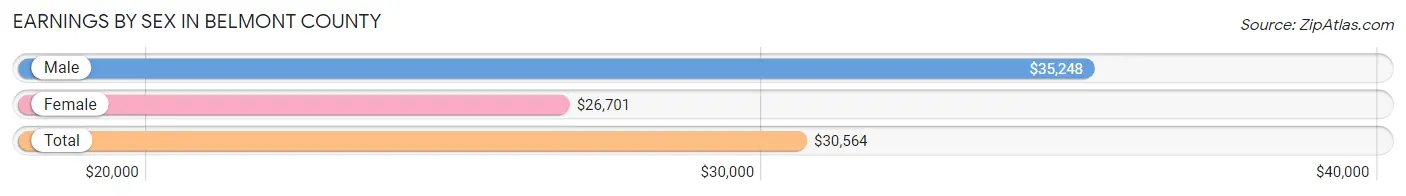
| Sex | Number | Average Earnings |
| Male | 19,779 (58.1%) | $35,248 |
| Female | 14,241 (41.9%) | $26,701 |
| Total | 34,020 (100.0%) | $30,564 |
Earnings by Sex by Income Bracket in Belmont County
The most common earnings brackets in Belmont County are $75,000 to $99,999 for men (2,199 | 11.1%) and $25,000 to $29,999 for women (1,335 | 9.4%).
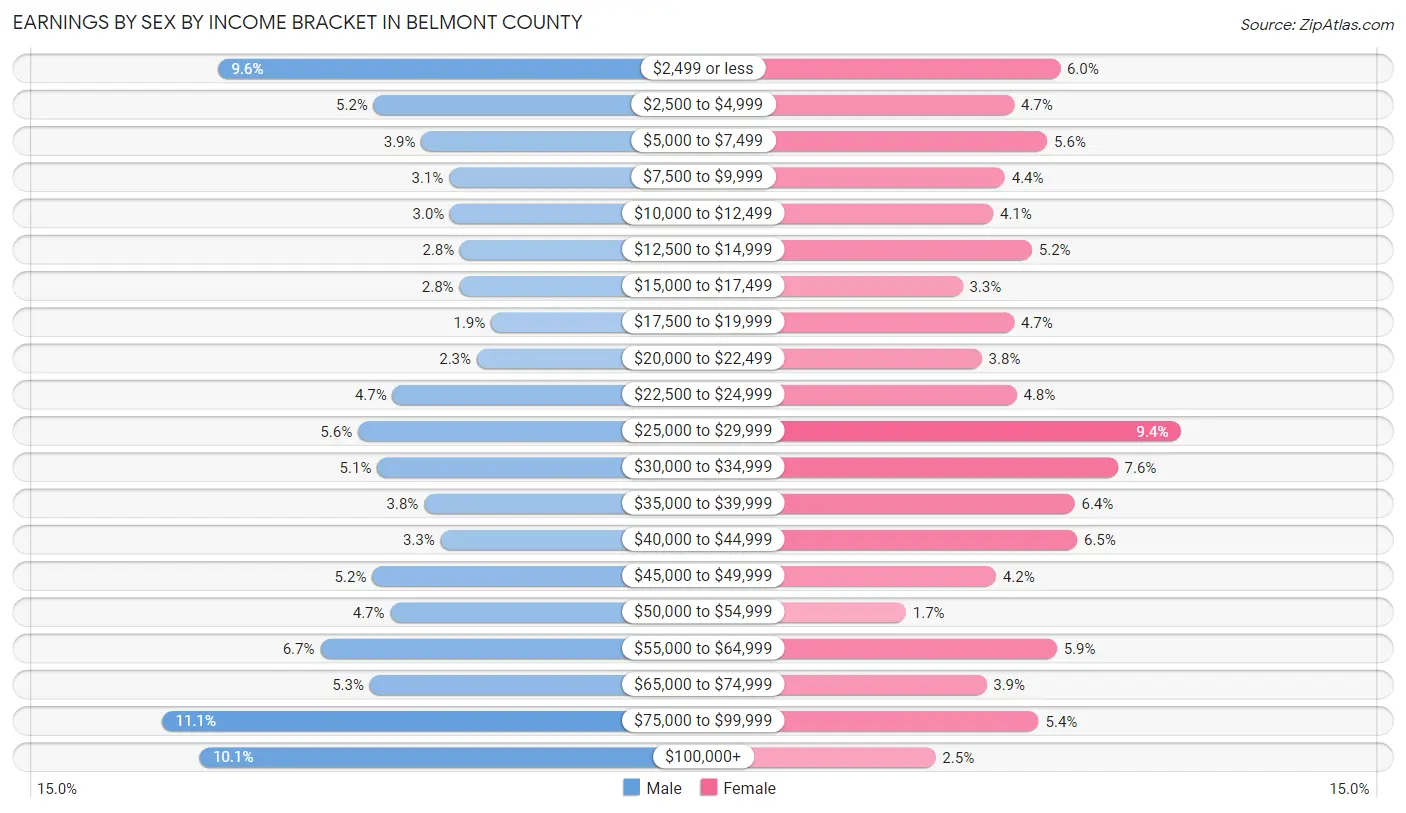
| Income | Male | Female |
| $2,499 or less | 1,888 (9.6%) | 853 (6.0%) |
| $2,500 to $4,999 | 1,027 (5.2%) | 670 (4.7%) |
| $5,000 to $7,499 | 762 (3.8%) | 802 (5.6%) |
| $7,500 to $9,999 | 607 (3.1%) | 632 (4.4%) |
| $10,000 to $12,499 | 602 (3.0%) | 585 (4.1%) |
| $12,500 to $14,999 | 545 (2.8%) | 741 (5.2%) |
| $15,000 to $17,499 | 550 (2.8%) | 463 (3.3%) |
| $17,500 to $19,999 | 373 (1.9%) | 670 (4.7%) |
| $20,000 to $22,499 | 453 (2.3%) | 540 (3.8%) |
| $22,500 to $24,999 | 922 (4.7%) | 680 (4.8%) |
| $25,000 to $29,999 | 1,113 (5.6%) | 1,335 (9.4%) |
| $30,000 to $34,999 | 1,007 (5.1%) | 1,084 (7.6%) |
| $35,000 to $39,999 | 745 (3.8%) | 912 (6.4%) |
| $40,000 to $44,999 | 655 (3.3%) | 921 (6.5%) |
| $45,000 to $49,999 | 1,034 (5.2%) | 596 (4.2%) |
| $50,000 to $54,999 | 933 (4.7%) | 236 (1.7%) |
| $55,000 to $64,999 | 1,323 (6.7%) | 840 (5.9%) |
| $65,000 to $74,999 | 1,049 (5.3%) | 558 (3.9%) |
| $75,000 to $99,999 | 2,199 (11.1%) | 768 (5.4%) |
| $100,000+ | 1,992 (10.1%) | 355 (2.5%) |
| Total | 19,779 (100.0%) | 14,241 (100.0%) |
Earnings by Sex by Educational Attainment in Belmont County
Average earnings in Belmont County are $42,217 for men and $29,484 for women, a difference of 30.2%. Men with an educational attainment of graduate degree enjoy the highest average annual earnings of $79,500, while those with less than high school education earn the least with $12,021. Women with an educational attainment of graduate degree earn the most with the average annual earnings of $65,335, while those with less than high school education have the smallest earnings of $18,661.
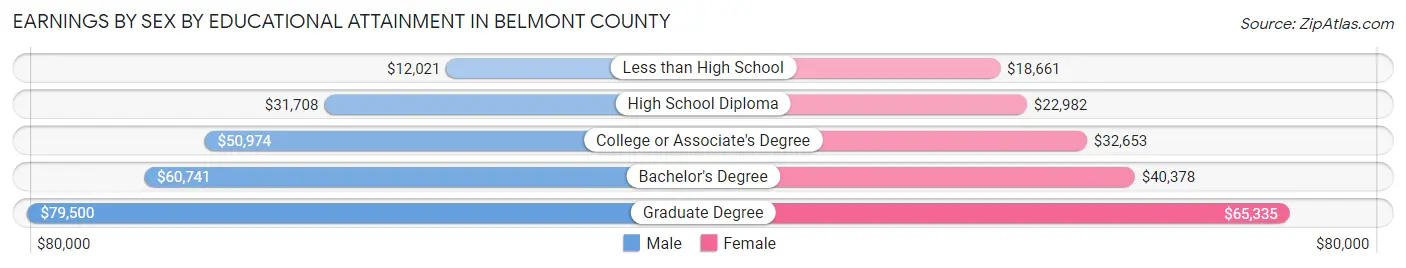
| Educational Attainment | Male Income | Female Income |
| Less than High School | $12,021 | $18,661 |
| High School Diploma | $31,708 | $22,982 |
| College or Associate's Degree | $50,974 | $32,653 |
| Bachelor's Degree | $60,741 | $40,378 |
| Graduate Degree | $79,500 | $65,335 |
| Total | $42,217 | $29,484 |
Family Income in Belmont County
Family Income Brackets in Belmont County
According to the Belmont County family income data, there are 3,402 families falling into the $100,000 to $149,999 income range, which is the most common income bracket and makes up 20.7% of all families. Conversely, the $10,000 to $14,999 income bracket is the least frequent group with only 345 families (2.1%) belonging to this category.

| Income Bracket | # Families | % Families |
| Less than $10,000 | 723 | 4.4% |
| $10,000 to $14,999 | 345 | 2.1% |
| $15,000 to $24,999 | 772 | 4.7% |
| $25,000 to $34,999 | 1,331 | 8.1% |
| $35,000 to $49,999 | 2,153 | 13.1% |
| $50,000 to $74,999 | 3,205 | 19.5% |
| $75,000 to $99,999 | 2,580 | 15.7% |
| $100,000 to $149,999 | 3,402 | 20.7% |
| $150,000 to $199,999 | 953 | 5.8% |
| $200,000+ | 970 | 5.9% |
Family Income by Famaliy Size in Belmont County
6-person families (307 | 1.9%) account for the highest median family income in Belmont County with $103,550 per family, while 2-person families (8,923 | 54.3%) have the highest median income of $30,336 per family member.
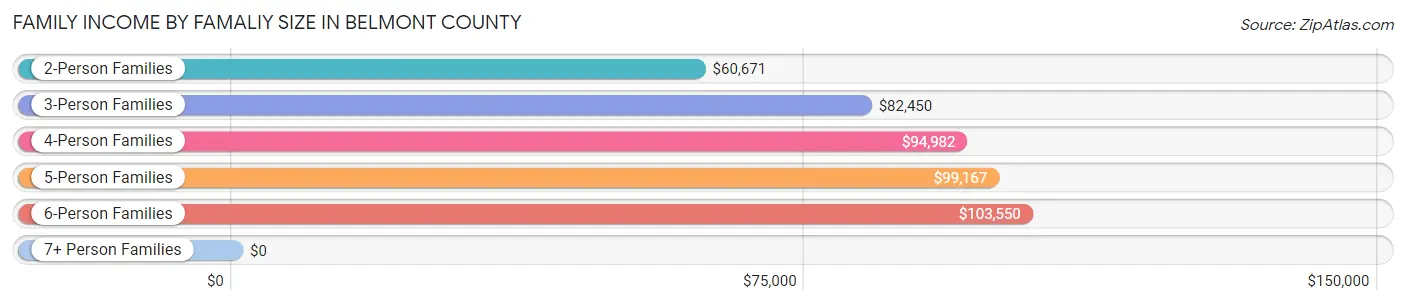
| Income Bracket | # Families | Median Income |
| 2-Person Families | 8,923 (54.3%) | $60,671 |
| 3-Person Families | 3,529 (21.5%) | $82,450 |
| 4-Person Families | 2,665 (16.2%) | $94,982 |
| 5-Person Families | 928 (5.7%) | $99,167 |
| 6-Person Families | 307 (1.9%) | $103,550 |
| 7+ Person Families | 82 (0.5%) | $0 |
| Total | 16,434 (100.0%) | $72,358 |
Family Income by Number of Earners in Belmont County
The median family income in Belmont County is $72,358, with families comprising 3+ earners (1,494) having the highest median family income of $123,707, while families with no earners (3,487) have the lowest median family income of $45,009, accounting for 9.1% and 21.2% of families, respectively.
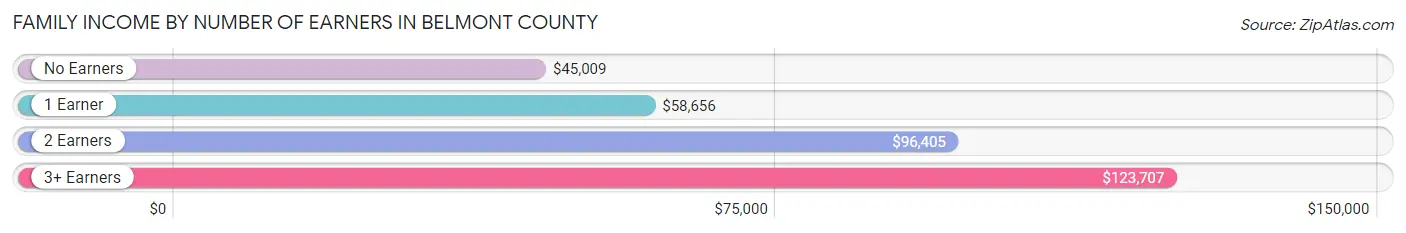
| Number of Earners | # Families | Median Income |
| No Earners | 3,487 (21.2%) | $45,009 |
| 1 Earner | 5,823 (35.4%) | $58,656 |
| 2 Earners | 5,630 (34.3%) | $96,405 |
| 3+ Earners | 1,494 (9.1%) | $123,707 |
| Total | 16,434 (100.0%) | $72,358 |
Household Income in Belmont County
Household Income Brackets in Belmont County
With 4,987 households falling in the category, the $50,000 to $74,999 income range is the most frequent in Belmont County, accounting for 19.2% of all households. In contrast, only 1,091 households (4.2%) fall into the $200,000+ income bracket, making it the least populous group.
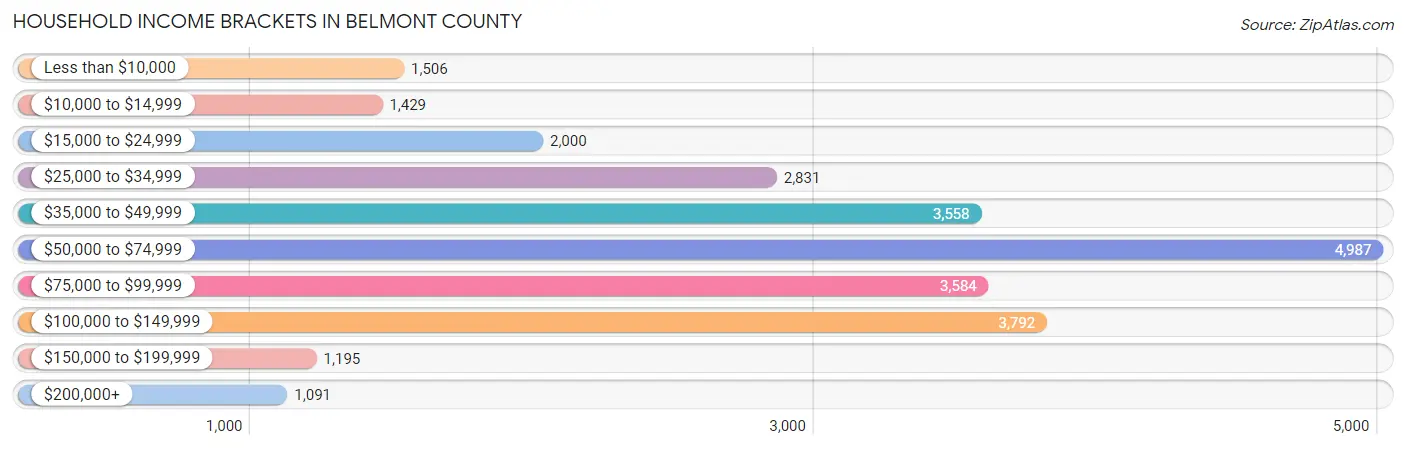
| Income Bracket | # Households | % Households |
| Less than $10,000 | 1,506 | 5.8% |
| $10,000 to $14,999 | 1,429 | 5.5% |
| $15,000 to $24,999 | 2,000 | 7.7% |
| $25,000 to $34,999 | 2,831 | 10.9% |
| $35,000 to $49,999 | 3,558 | 13.7% |
| $50,000 to $74,999 | 4,987 | 19.2% |
| $75,000 to $99,999 | 3,584 | 13.8% |
| $100,000 to $149,999 | 3,792 | 14.6% |
| $150,000 to $199,999 | 1,195 | 4.6% |
| $200,000+ | 1,091 | 4.2% |
Household Income by Householder Age in Belmont County
The median household income in Belmont County is $56,943, with the highest median household income of $72,113 found in the 25 to 44 years age bracket for the primary householder. A total of 6,653 households (25.6%) fall into this category. Meanwhile, the 65+ years age bracket for the primary householder has the lowest median household income of $43,713, with 8,754 households (33.7%) in this group.
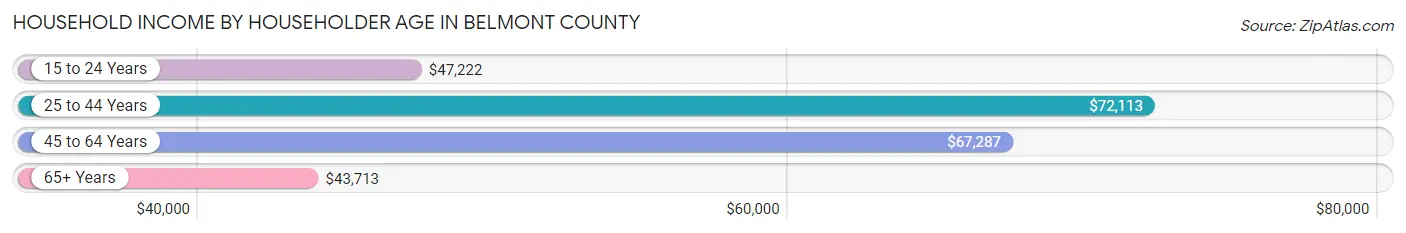
| Income Bracket | # Households | Median Income |
| 15 to 24 Years | 660 (2.5%) | $47,222 |
| 25 to 44 Years | 6,653 (25.6%) | $72,113 |
| 45 to 64 Years | 9,907 (38.1%) | $67,287 |
| 65+ Years | 8,754 (33.7%) | $43,713 |
| Total | 25,974 (100.0%) | $56,943 |
Poverty in Belmont County
Income Below Poverty by Sex and Age in Belmont County
With 13.1% poverty level for males and 15.0% for females among the residents of Belmont County, 5 year old males and 12 to 14 year old females are the most vulnerable to poverty, with 98 males (29.3%) and 318 females (29.6%) in their respective age groups living below the poverty level.
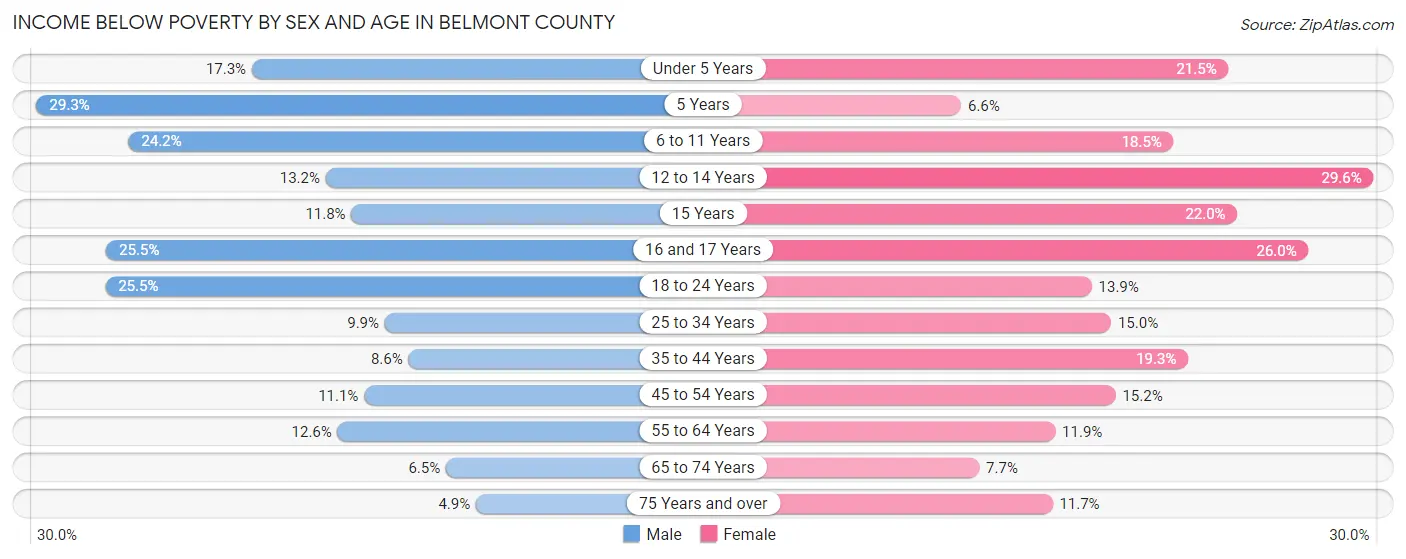
| Age Bracket | Male | Female |
| Under 5 Years | 279 (17.3%) | 304 (21.5%) |
| 5 Years | 98 (29.3%) | 17 (6.6%) |
| 6 to 11 Years | 491 (24.2%) | 363 (18.5%) |
| 12 to 14 Years | 145 (13.2%) | 318 (29.6%) |
| 15 Years | 36 (11.8%) | 87 (22.0%) |
| 16 and 17 Years | 208 (25.5%) | 203 (26.0%) |
| 18 to 24 Years | 769 (25.5%) | 288 (13.9%) |
| 25 to 34 Years | 378 (9.9%) | 517 (15.0%) |
| 35 to 44 Years | 321 (8.6%) | 706 (19.3%) |
| 45 to 54 Years | 443 (11.1%) | 602 (15.2%) |
| 55 to 64 Years | 603 (12.6%) | 599 (11.9%) |
| 65 to 74 Years | 268 (6.5%) | 318 (7.6%) |
| 75 Years and over | 101 (4.9%) | 338 (11.7%) |
| Total | 4,140 (13.1%) | 4,660 (15.0%) |
Income Above Poverty by Sex and Age in Belmont County
According to the poverty statistics in Belmont County, males aged 75 years and over and females aged 5 years are the age groups that are most secure financially, with 95.1% of males and 93.4% of females in these age groups living above the poverty line.
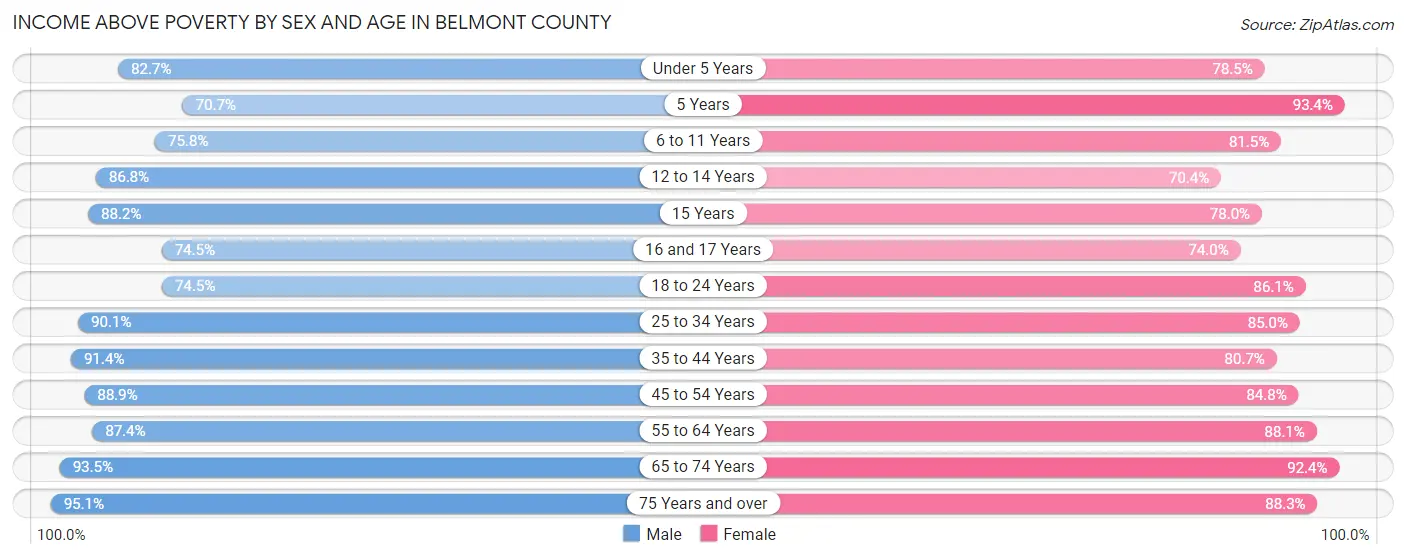
| Age Bracket | Male | Female |
| Under 5 Years | 1,330 (82.7%) | 1,108 (78.5%) |
| 5 Years | 236 (70.7%) | 239 (93.4%) |
| 6 to 11 Years | 1,536 (75.8%) | 1,601 (81.5%) |
| 12 to 14 Years | 951 (86.8%) | 756 (70.4%) |
| 15 Years | 269 (88.2%) | 308 (78.0%) |
| 16 and 17 Years | 609 (74.5%) | 578 (74.0%) |
| 18 to 24 Years | 2,246 (74.5%) | 1,783 (86.1%) |
| 25 to 34 Years | 3,423 (90.1%) | 2,931 (85.0%) |
| 35 to 44 Years | 3,402 (91.4%) | 2,954 (80.7%) |
| 45 to 54 Years | 3,553 (88.9%) | 3,348 (84.8%) |
| 55 to 64 Years | 4,196 (87.4%) | 4,442 (88.1%) |
| 65 to 74 Years | 3,834 (93.5%) | 3,840 (92.3%) |
| 75 Years and over | 1,978 (95.1%) | 2,544 (88.3%) |
| Total | 27,563 (86.9%) | 26,432 (85.0%) |
Income Below Poverty Among Married-Couple Families in Belmont County
The poverty statistics for married-couple families in Belmont County show that 3.8% or 483 of the total 12,553 families live below the poverty line. Families with 5 or more children have the highest poverty rate of 68.4%, comprising of 39 families. On the other hand, families with no children have the lowest poverty rate of 2.9%, which includes 242 families.

| Children | Above Poverty | Below Poverty |
| No Children | 8,104 (97.1%) | 242 (2.9%) |
| 1 or 2 Children | 3,169 (96.0%) | 131 (4.0%) |
| 3 or 4 Children | 779 (91.6%) | 71 (8.4%) |
| 5 or more Children | 18 (31.6%) | 39 (68.4%) |
| Total | 12,070 (96.2%) | 483 (3.8%) |
Income Below Poverty Among Single-Parent Households in Belmont County
According to the poverty data in Belmont County, 20.6% or 232 single-father households and 32.2% or 885 single-mother households are living below the poverty line. Among single-father households, those with 5 or more children have the highest poverty rate, with 10 households (100.0%) experiencing poverty. Likewise, among single-mother households, those with 5 or more children have the highest poverty rate, with 5 households (100.0%) falling below the poverty line.
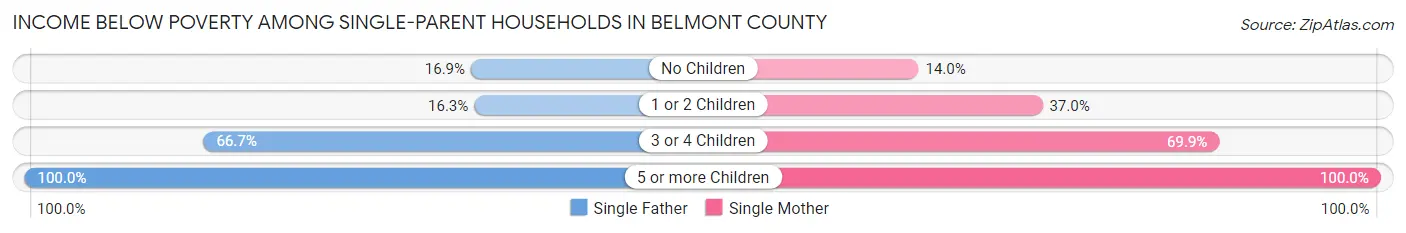
| Children | Single Father | Single Mother |
| No Children | 105 (16.9%) | 142 (14.0%) |
| 1 or 2 Children | 69 (16.3%) | 531 (37.0%) |
| 3 or 4 Children | 48 (66.7%) | 207 (69.9%) |
| 5 or more Children | 10 (100.0%) | 5 (100.0%) |
| Total | 232 (20.6%) | 885 (32.2%) |
Income Below Poverty Among Married-Couple vs Single-Parent Households in Belmont County
The poverty data for Belmont County shows that 483 of the married-couple family households (3.8%) and 1,117 of the single-parent households (28.8%) are living below the poverty level. Within the married-couple family households, those with 5 or more children have the highest poverty rate, with 39 households (68.4%) falling below the poverty line. Among the single-parent households, those with 5 or more children have the highest poverty rate, with 15 household (100.0%) living below poverty.
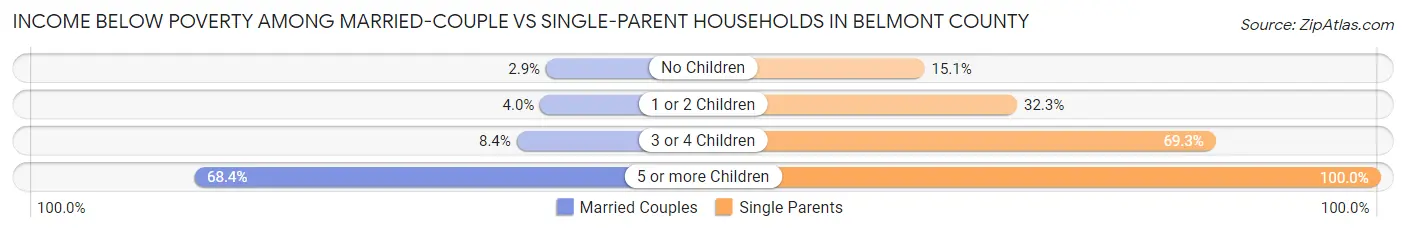
| Children | Married-Couple Families | Single-Parent Households |
| No Children | 242 (2.9%) | 247 (15.1%) |
| 1 or 2 Children | 131 (4.0%) | 600 (32.3%) |
| 3 or 4 Children | 71 (8.4%) | 255 (69.3%) |
| 5 or more Children | 39 (68.4%) | 15 (100.0%) |
| Total | 483 (3.8%) | 1,117 (28.8%) |
Employment Characteristics in Belmont County
Employment by Class of Employer in Belmont County
Among the 28,090 employed individuals in Belmont County, private company employees (21,403 | 76.2%), local government employees (2,196 | 7.8%), and not-for-profit organizations (1,938 | 6.9%) make up the most common classes of employment.

| Employer Class | # Employees | % Employees |
| Private Company Employees | 21,403 | 76.2% |
| Self-Employed (Incorporated) | 457 | 1.6% |
| Self-Employed (Not Incorporated) | 942 | 3.4% |
| Not-for-profit Organizations | 1,938 | 6.9% |
| Local Government Employees | 2,196 | 7.8% |
| State Government Employees | 762 | 2.7% |
| Federal Government Employees | 358 | 1.3% |
| Unpaid Family Workers | 34 | 0.1% |
| Total | 28,090 | 100.0% |
Employment Status by Age in Belmont County
According to the labor force statistics for Belmont County, out of the total population over 16 years of age (55,773), 54.3% or 30,285 individuals are in the labor force, with 6.0% or 1,817 of them unemployed. The age group with the highest labor force participation rate is 35 to 44 years, with 74.8% or 6,176 individuals in the labor force. Within the labor force, the 16 to 19 years age range has the highest percentage of unemployed individuals, with 27.7% or 408 of them being unemployed.
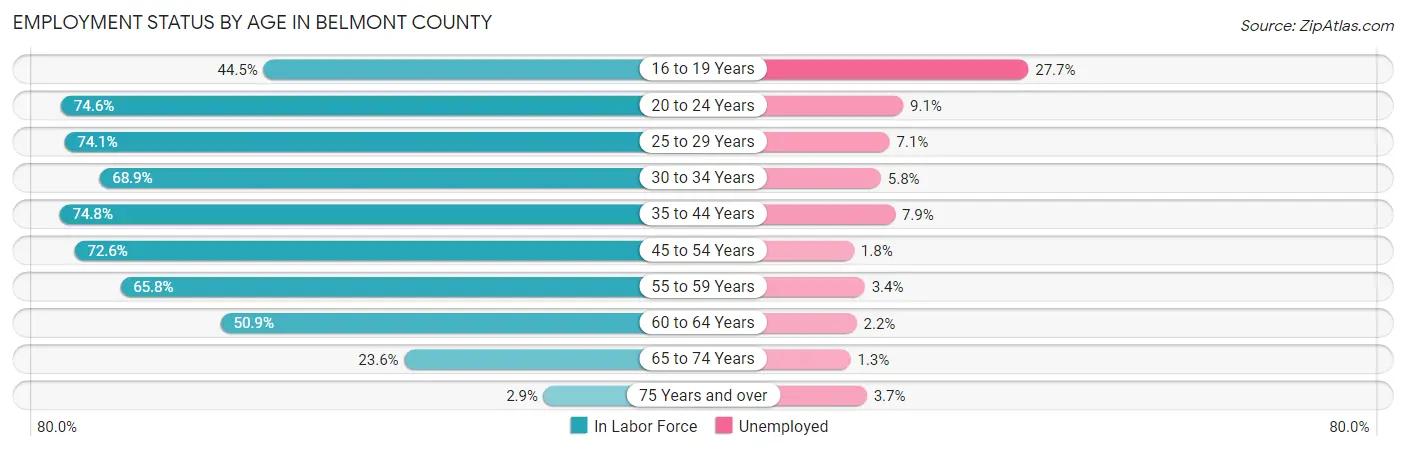
| Age Bracket | In Labor Force | Unemployed |
| 16 to 19 Years | 1,472 (44.5%) | 408 (27.7%) |
| 20 to 24 Years | 2,691 (74.6%) | 245 (9.1%) |
| 25 to 29 Years | 2,974 (74.1%) | 211 (7.1%) |
| 30 to 34 Years | 2,772 (68.9%) | 161 (5.8%) |
| 35 to 44 Years | 6,176 (74.8%) | 488 (7.9%) |
| 45 to 54 Years | 6,127 (72.6%) | 110 (1.8%) |
| 55 to 59 Years | 3,383 (65.8%) | 115 (3.4%) |
| 60 to 64 Years | 2,515 (50.9%) | 55 (2.2%) |
| 65 to 74 Years | 1,997 (23.6%) | 26 (1.3%) |
| 75 Years and over | 162 (2.9%) | 6 (3.7%) |
| Total | 30,285 (54.3%) | 1,817 (6.0%) |
Employment Status by Educational Attainment in Belmont County
According to labor force statistics for Belmont County, 68.8% of individuals (23,954) out of the total population between 25 and 64 years of age (34,817) are in the labor force, with 4.8% or 1,150 of them being unemployed. The group with the highest labor force participation rate are those with the educational attainment of bachelor's degree or higher, with 88.3% or 5,546 individuals in the labor force. Within the labor force, individuals with less than high school education have the highest percentage of unemployment, with 8.3% or 77 of them being unemployed.
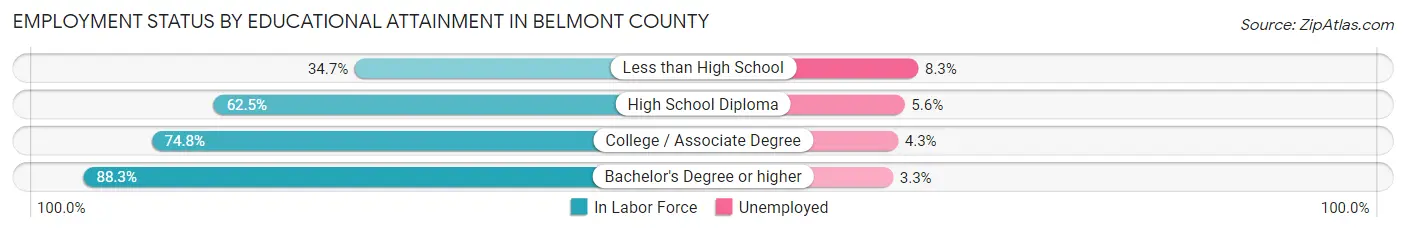
| Educational Attainment | In Labor Force | Unemployed |
| Less than High School | 924 (34.7%) | 221 (8.3%) |
| High School Diploma | 9,494 (62.5%) | 851 (5.6%) |
| College / Associate Degree | 7,991 (74.8%) | 459 (4.3%) |
| Bachelor's Degree or higher | 5,546 (88.3%) | 207 (3.3%) |
| Total | 23,954 (68.8%) | 1,671 (4.8%) |
Employment Occupations by Sex in Belmont County
Management, Business, Science and Arts Occupations
The most common Management, Business, Science and Arts occupations in Belmont County are Community & Social Service (2,348 | 8.3%), Health Diagnosing & Treating (2,277 | 8.0%), Management (2,016 | 7.1%), Health Technologists (1,513 | 5.3%), and Education Instruction & Library (1,426 | 5.0%).

Management, Business, Science and Arts Occupations by Sex
Within the Management, Business, Science and Arts occupations in Belmont County, the most male-oriented occupations are Architecture & Engineering (96.4%), Computers, Engineering & Science (78.5%), and Computers & Mathematics (68.3%), while the most female-oriented occupations are Health Diagnosing & Treating (82.4%), Health Technologists (79.3%), and Education Instruction & Library (76.8%).

| Occupation | Male | Female |
| Management | 1,245 (61.8%) | 771 (38.2%) |
| Business & Financial | 344 (53.7%) | 297 (46.3%) |
| Computers, Engineering & Science | 551 (78.5%) | 151 (21.5%) |
| Computers & Mathematics | 209 (68.3%) | 97 (31.7%) |
| Architecture & Engineering | 319 (96.4%) | 12 (3.6%) |
| Life, Physical & Social Science | 23 (35.4%) | 42 (64.6%) |
| Community & Social Service | 766 (32.6%) | 1,582 (67.4%) |
| Education, Arts & Media | 234 (41.3%) | 333 (58.7%) |
| Legal Services & Support | 57 (40.1%) | 85 (59.9%) |
| Education Instruction & Library | 331 (23.2%) | 1,095 (76.8%) |
| Arts, Media & Entertainment | 144 (67.6%) | 69 (32.4%) |
| Health Diagnosing & Treating | 401 (17.6%) | 1,876 (82.4%) |
| Health Technologists | 313 (20.7%) | 1,200 (79.3%) |
| Total (Category) | 3,307 (41.4%) | 4,677 (58.6%) |
| Total (Overall) | 15,494 (54.5%) | 12,946 (45.5%) |
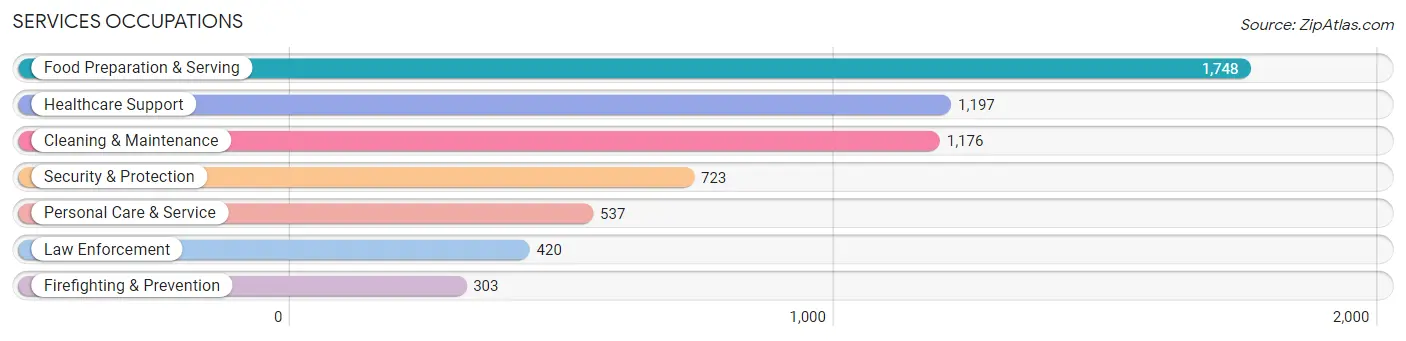
Services Occupations
The most common Services occupations in Belmont County are Food Preparation & Serving (1,748 | 6.1%), Healthcare Support (1,197 | 4.2%), Cleaning & Maintenance (1,176 | 4.1%), Security & Protection (723 | 2.5%), and Personal Care & Service (537 | 1.9%).
Services Occupations by Sex
Within the Services occupations in Belmont County, the most male-oriented occupations are Law Enforcement (88.1%), Security & Protection (86.6%), and Firefighting & Prevention (84.5%), while the most female-oriented occupations are Personal Care & Service (80.3%), Healthcare Support (79.9%), and Food Preparation & Serving (64.1%).
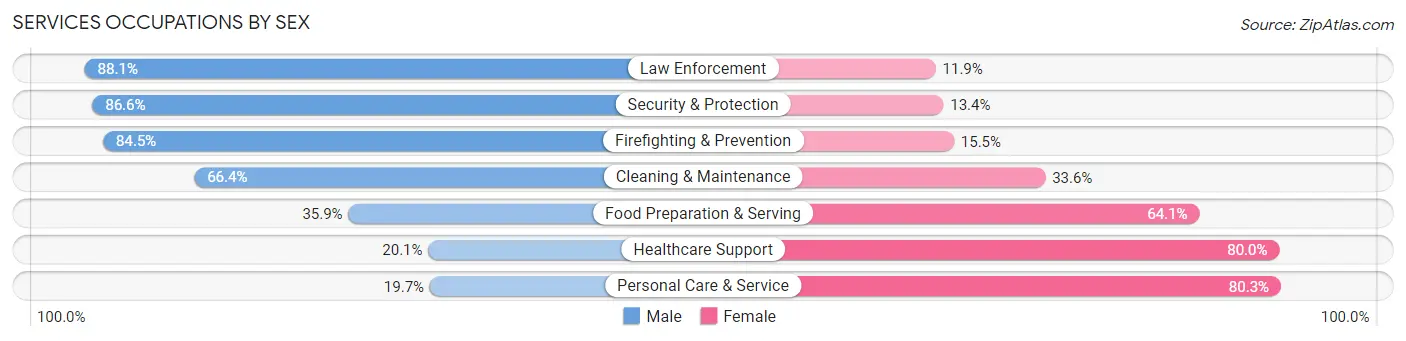
| Occupation | Male | Female |
| Healthcare Support | 240 (20.1%) | 957 (79.9%) |
| Security & Protection | 626 (86.6%) | 97 (13.4%) |
| Firefighting & Prevention | 256 (84.5%) | 47 (15.5%) |
| Law Enforcement | 370 (88.1%) | 50 (11.9%) |
| Food Preparation & Serving | 627 (35.9%) | 1,121 (64.1%) |
| Cleaning & Maintenance | 781 (66.4%) | 395 (33.6%) |
| Personal Care & Service | 106 (19.7%) | 431 (80.3%) |
| Total (Category) | 2,380 (44.2%) | 3,001 (55.8%) |
| Total (Overall) | 15,494 (54.5%) | 12,946 (45.5%) |
Sales and Office Occupations
The most common Sales and Office occupations in Belmont County are Office & Administration (3,368 | 11.8%), and Sales & Related (3,104 | 10.9%).

Sales and Office Occupations by Sex
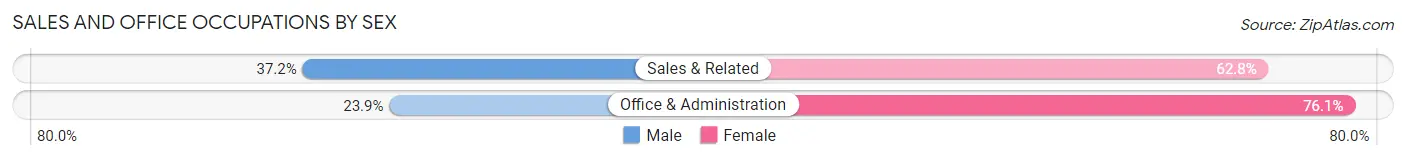
| Occupation | Male | Female |
| Sales & Related | 1,156 (37.2%) | 1,948 (62.8%) |
| Office & Administration | 805 (23.9%) | 2,563 (76.1%) |
| Total (Category) | 1,961 (30.3%) | 4,511 (69.7%) |
| Total (Overall) | 15,494 (54.5%) | 12,946 (45.5%) |
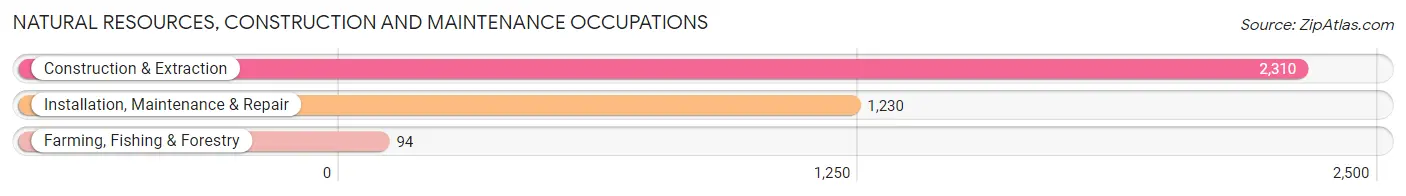
Natural Resources, Construction and Maintenance Occupations
The most common Natural Resources, Construction and Maintenance occupations in Belmont County are Construction & Extraction (2,310 | 8.1%), Installation, Maintenance & Repair (1,230 | 4.3%), and Farming, Fishing & Forestry (94 | 0.3%).
Natural Resources, Construction and Maintenance Occupations by Sex
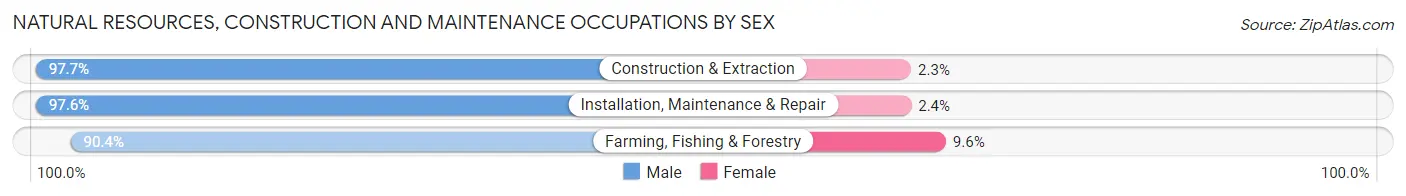
| Occupation | Male | Female |
| Farming, Fishing & Forestry | 85 (90.4%) | 9 (9.6%) |
| Construction & Extraction | 2,256 (97.7%) | 54 (2.3%) |
| Installation, Maintenance & Repair | 1,201 (97.6%) | 29 (2.4%) |
| Total (Category) | 3,542 (97.5%) | 92 (2.5%) |
| Total (Overall) | 15,494 (54.5%) | 12,946 (45.5%) |
Production, Transportation and Moving Occupations
The most common Production, Transportation and Moving occupations in Belmont County are Material Moving (1,699 | 6.0%), Production (1,657 | 5.8%), and Transportation (1,613 | 5.7%).
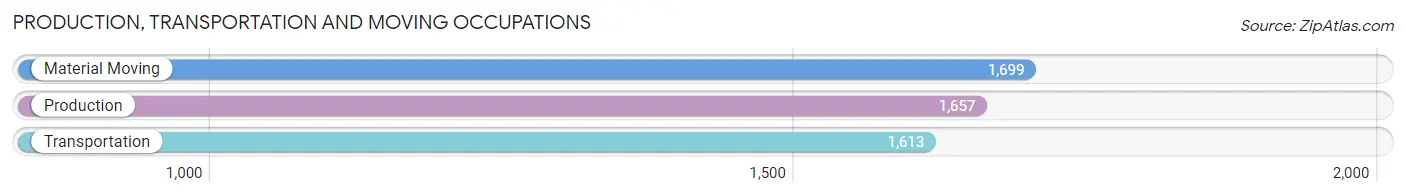
Production, Transportation and Moving Occupations by Sex
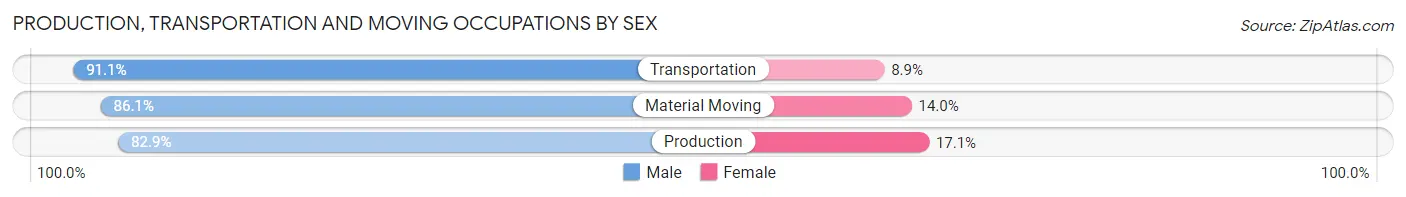
| Occupation | Male | Female |
| Production | 1,373 (82.9%) | 284 (17.1%) |
| Transportation | 1,469 (91.1%) | 144 (8.9%) |
| Material Moving | 1,462 (86.1%) | 237 (14.0%) |
| Total (Category) | 4,304 (86.6%) | 665 (13.4%) |
| Total (Overall) | 15,494 (54.5%) | 12,946 (45.5%) |
Employment Industries by Sex in Belmont County
Employment Industries in Belmont County
The major employment industries in Belmont County include Health Care & Social Assistance (4,609 | 16.2%), Retail Trade (4,458 | 15.7%), Manufacturing (2,391 | 8.4%), Accommodation & Food Services (2,218 | 7.8%), and Educational Services (2,050 | 7.2%).
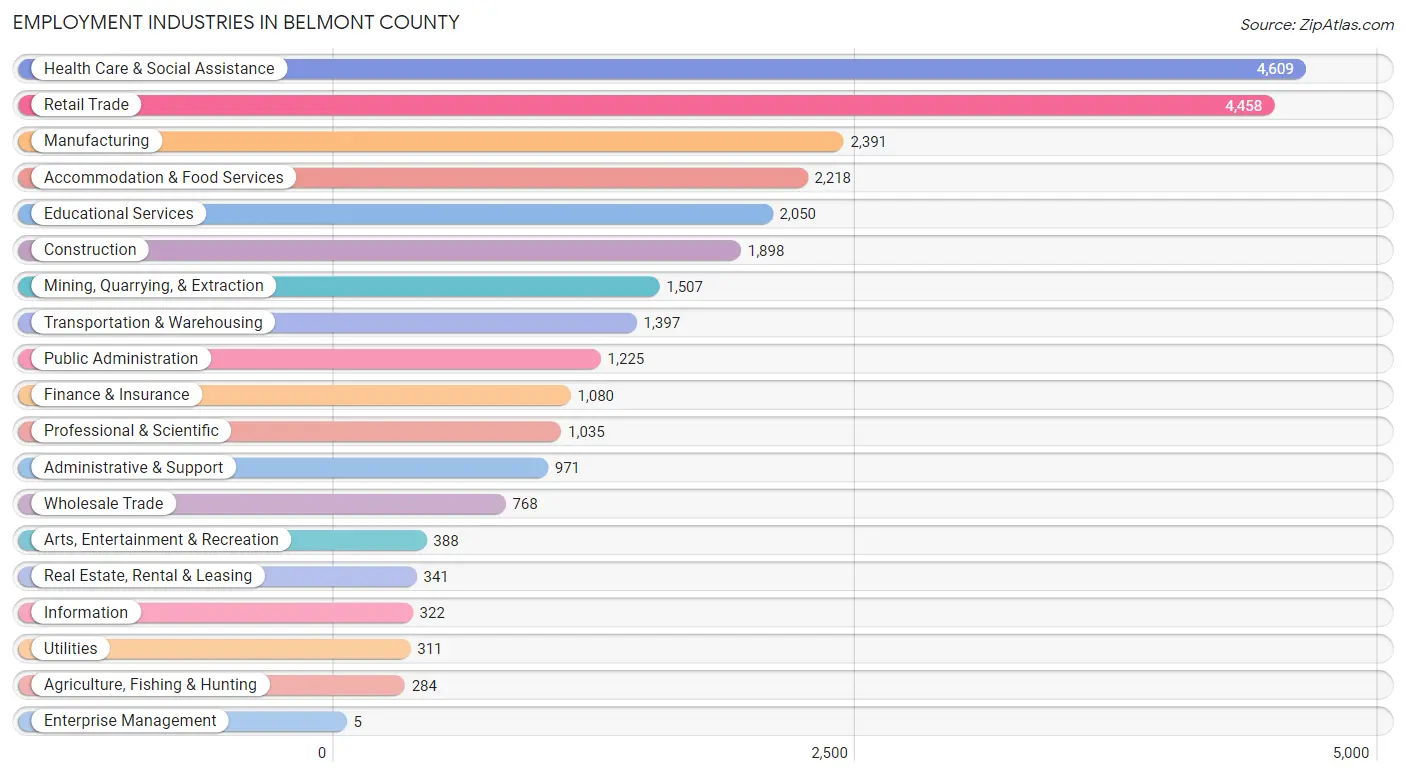
Employment Industries by Sex in Belmont County
The Belmont County industries that see more men than women are Enterprise Management (100.0%), Mining, Quarrying, & Extraction (97.0%), and Utilities (90.3%), whereas the industries that tend to have a higher number of women are Health Care & Social Assistance (75.4%), Educational Services (68.4%), and Arts, Entertainment & Recreation (65.7%).

| Industry | Male | Female |
| Agriculture, Fishing & Hunting | 235 (82.8%) | 49 (17.2%) |
| Mining, Quarrying, & Extraction | 1,462 (97.0%) | 45 (3.0%) |
| Construction | 1,698 (89.5%) | 200 (10.5%) |
| Manufacturing | 1,938 (81.0%) | 453 (19.0%) |
| Wholesale Trade | 582 (75.8%) | 186 (24.2%) |
| Retail Trade | 2,042 (45.8%) | 2,416 (54.2%) |
| Transportation & Warehousing | 1,149 (82.3%) | 248 (17.7%) |
| Utilities | 281 (90.3%) | 30 (9.7%) |
| Information | 251 (77.9%) | 71 (22.1%) |
| Finance & Insurance | 393 (36.4%) | 687 (63.6%) |
| Real Estate, Rental & Leasing | 212 (62.2%) | 129 (37.8%) |
| Professional & Scientific | 534 (51.6%) | 501 (48.4%) |
| Enterprise Management | 5 (100.0%) | 0 (0.0%) |
| Administrative & Support | 558 (57.5%) | 413 (42.5%) |
| Educational Services | 648 (31.6%) | 1,402 (68.4%) |
| Health Care & Social Assistance | 1,134 (24.6%) | 3,475 (75.4%) |
| Arts, Entertainment & Recreation | 133 (34.3%) | 255 (65.7%) |
| Accommodation & Food Services | 928 (41.8%) | 1,290 (58.2%) |
| Public Administration | 856 (69.9%) | 369 (30.1%) |
| Total | 15,494 (54.5%) | 12,946 (45.5%) |
Education in Belmont County
School Enrollment in Belmont County
The most common levels of schooling among the 12,220 students in Belmont County are high school (3,411 | 27.9%), middle school (2,883 | 23.6%), and elementary school (2,625 | 21.5%).
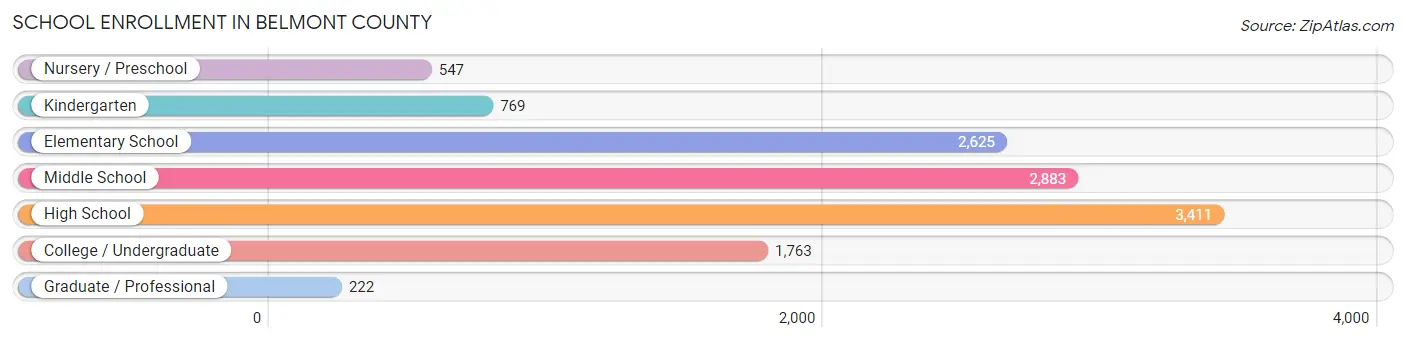
| School Level | # Students | % Students |
| Nursery / Preschool | 547 | 4.5% |
| Kindergarten | 769 | 6.3% |
| Elementary School | 2,625 | 21.5% |
| Middle School | 2,883 | 23.6% |
| High School | 3,411 | 27.9% |
| College / Undergraduate | 1,763 | 14.4% |
| Graduate / Professional | 222 | 1.8% |
| Total | 12,220 | 100.0% |
School Enrollment by Age by Funding Source in Belmont County
Out of a total of 12,220 students who are enrolled in schools in Belmont County, 1,760 (14.4%) attend a private institution, while the remaining 10,460 (85.6%) are enrolled in public schools. The age group of 35 years and over has the highest likelihood of being enrolled in private schools, with 312 (44.9% in the age bracket) enrolled. Conversely, the age group of 15 to 17 year olds has the lowest likelihood of being enrolled in a private school, with 2,113 (96.0% in the age bracket) attending a public institution.
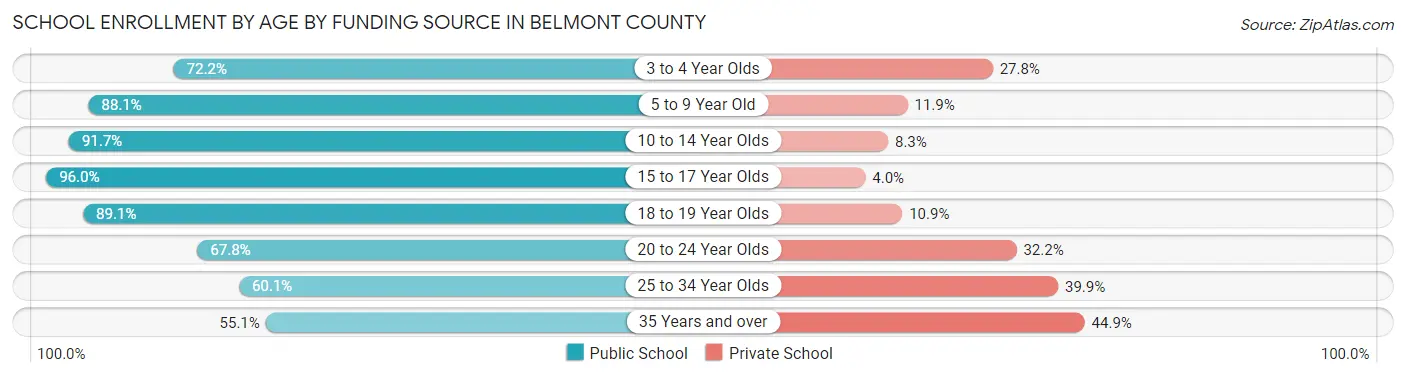
| Age Bracket | Public School | Private School |
| 3 to 4 Year Olds | 307 (72.2%) | 118 (27.8%) |
| 5 to 9 Year Old | 2,815 (88.1%) | 380 (11.9%) |
| 10 to 14 Year Olds | 3,167 (91.7%) | 285 (8.3%) |
| 15 to 17 Year Olds | 2,113 (96.0%) | 89 (4.0%) |
| 18 to 19 Year Olds | 817 (89.1%) | 100 (10.9%) |
| 20 to 24 Year Olds | 514 (67.8%) | 244 (32.2%) |
| 25 to 34 Year Olds | 346 (60.1%) | 230 (39.9%) |
| 35 Years and over | 383 (55.1%) | 312 (44.9%) |
| Total | 10,460 (85.6%) | 1,760 (14.4%) |
Educational Attainment by Field of Study in Belmont County
Education (2,122 | 23.1%), business (1,544 | 16.8%), science & technology (1,311 | 14.3%), arts & humanities (640 | 7.0%), and bio, nature & agricultural (517 | 5.6%) are the most common fields of study among 9,171 individuals in Belmont County who have obtained a bachelor's degree or higher.

| Field of Study | # Graduates | % Graduates |
| Computers & Mathematics | 400 | 4.4% |
| Bio, Nature & Agricultural | 517 | 5.6% |
| Physical & Health Sciences | 314 | 3.4% |
| Psychology | 367 | 4.0% |
| Social Sciences | 406 | 4.4% |
| Engineering | 335 | 3.6% |
| Multidisciplinary Studies | 48 | 0.5% |
| Science & Technology | 1,311 | 14.3% |
| Business | 1,544 | 16.8% |
| Education | 2,122 | 23.1% |
| Literature & Languages | 273 | 3.0% |
| Liberal Arts & History | 459 | 5.0% |
| Visual & Performing Arts | 177 | 1.9% |
| Communications | 258 | 2.8% |
| Arts & Humanities | 640 | 7.0% |
| Total | 9,171 | 100.0% |
Transportation & Commute in Belmont County
Vehicle Availability by Sex in Belmont County
The most prevalent vehicle ownership categories in Belmont County are males with 2 vehicles (6,083, accounting for 39.7%) and females with 2 vehicles (4,637, making up 47.7%).
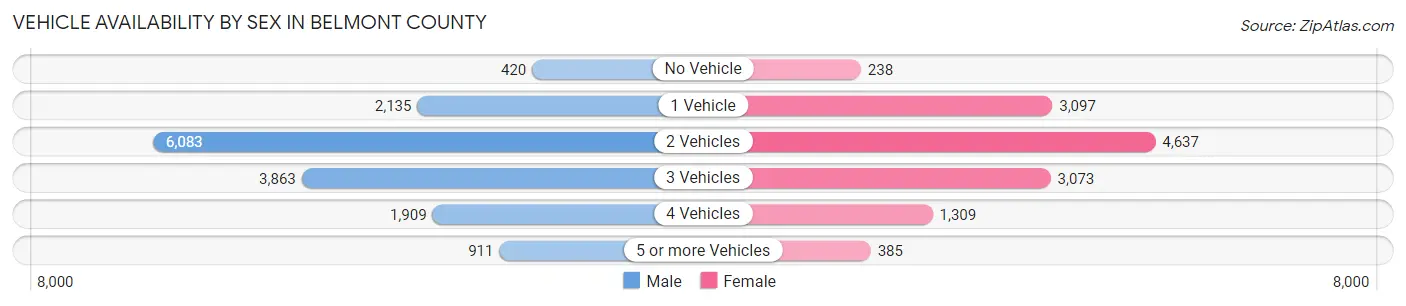
| Vehicles Available | Male | Female |
| No Vehicle | 420 (2.7%) | 238 (1.9%) |
| 1 Vehicle | 2,135 (13.9%) | 3,097 (24.3%) |
| 2 Vehicles | 6,083 (39.7%) | 4,637 (36.4%) |
| 3 Vehicles | 3,863 (25.2%) | 3,073 (24.1%) |
| 4 Vehicles | 1,909 (12.5%) | 1,309 (10.3%) |
| 5 or more Vehicles | 911 (5.9%) | 385 (3.0%) |
| Total | 15,321 (100.0%) | 12,739 (100.0%) |
Commute Time in Belmont County
The most frequently occuring commute durations in Belmont County are 20 to 24 minutes (4,970 commuters, 18.5%), 15 to 19 minutes (4,249 commuters, 15.8%), and 10 to 14 minutes (3,365 commuters, 12.5%).

| Commute Time | # Commuters | % Commuters |
| Less than 5 Minutes | 755 | 2.8% |
| 5 to 9 Minutes | 3,059 | 11.4% |
| 10 to 14 Minutes | 3,365 | 12.5% |
| 15 to 19 Minutes | 4,249 | 15.8% |
| 20 to 24 Minutes | 4,970 | 18.5% |
| 25 to 29 Minutes | 1,997 | 7.4% |
| 30 to 34 Minutes | 3,049 | 11.4% |
| 35 to 39 Minutes | 489 | 1.8% |
| 40 to 44 Minutes | 953 | 3.5% |
| 45 to 59 Minutes | 1,693 | 6.3% |
| 60 to 89 Minutes | 1,382 | 5.1% |
| 90 or more Minutes | 869 | 3.2% |
Commute Time by Sex in Belmont County
The most common commute times in Belmont County are 20 to 24 minutes (2,482 commuters, 16.8%) for males and 20 to 24 minutes (2,488 commuters, 20.6%) for females.
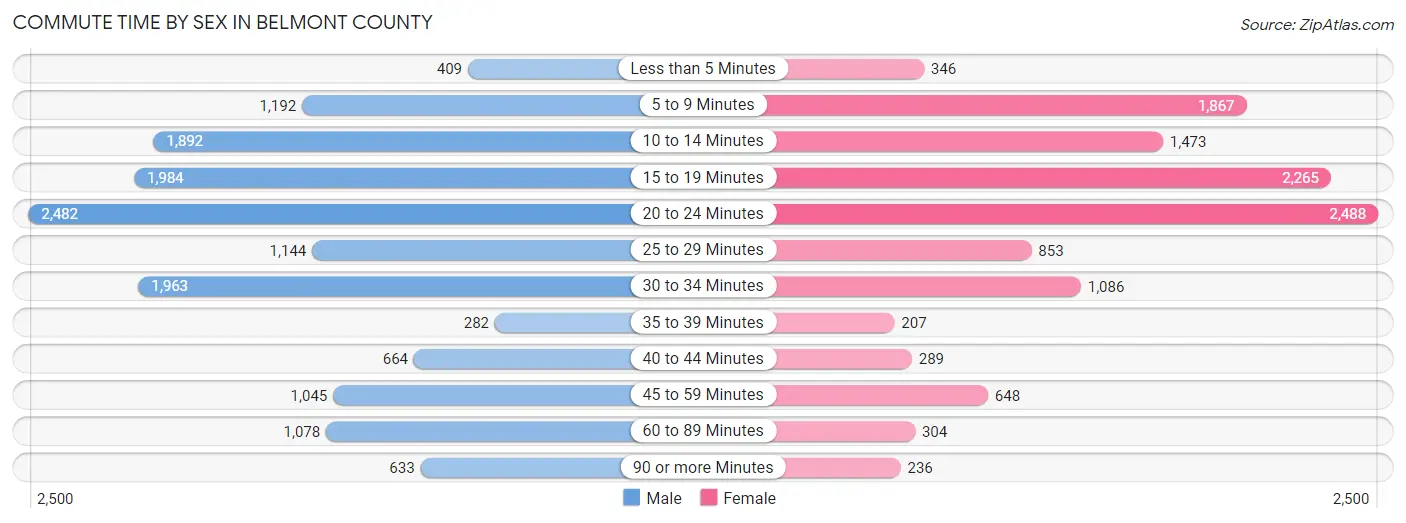
| Commute Time | Male | Female |
| Less than 5 Minutes | 409 (2.8%) | 346 (2.9%) |
| 5 to 9 Minutes | 1,192 (8.1%) | 1,867 (15.5%) |
| 10 to 14 Minutes | 1,892 (12.8%) | 1,473 (12.2%) |
| 15 to 19 Minutes | 1,984 (13.4%) | 2,265 (18.8%) |
| 20 to 24 Minutes | 2,482 (16.8%) | 2,488 (20.6%) |
| 25 to 29 Minutes | 1,144 (7.7%) | 853 (7.1%) |
| 30 to 34 Minutes | 1,963 (13.3%) | 1,086 (9.0%) |
| 35 to 39 Minutes | 282 (1.9%) | 207 (1.7%) |
| 40 to 44 Minutes | 664 (4.5%) | 289 (2.4%) |
| 45 to 59 Minutes | 1,045 (7.1%) | 648 (5.4%) |
| 60 to 89 Minutes | 1,078 (7.3%) | 304 (2.5%) |
| 90 or more Minutes | 633 (4.3%) | 236 (2.0%) |
Time of Departure to Work by Sex in Belmont County
The most frequent times of departure to work in Belmont County are 8:00 AM to 8:29 AM (1,998, 13.5%) for males and 7:30 AM to 7:59 AM (1,927, 16.0%) for females.
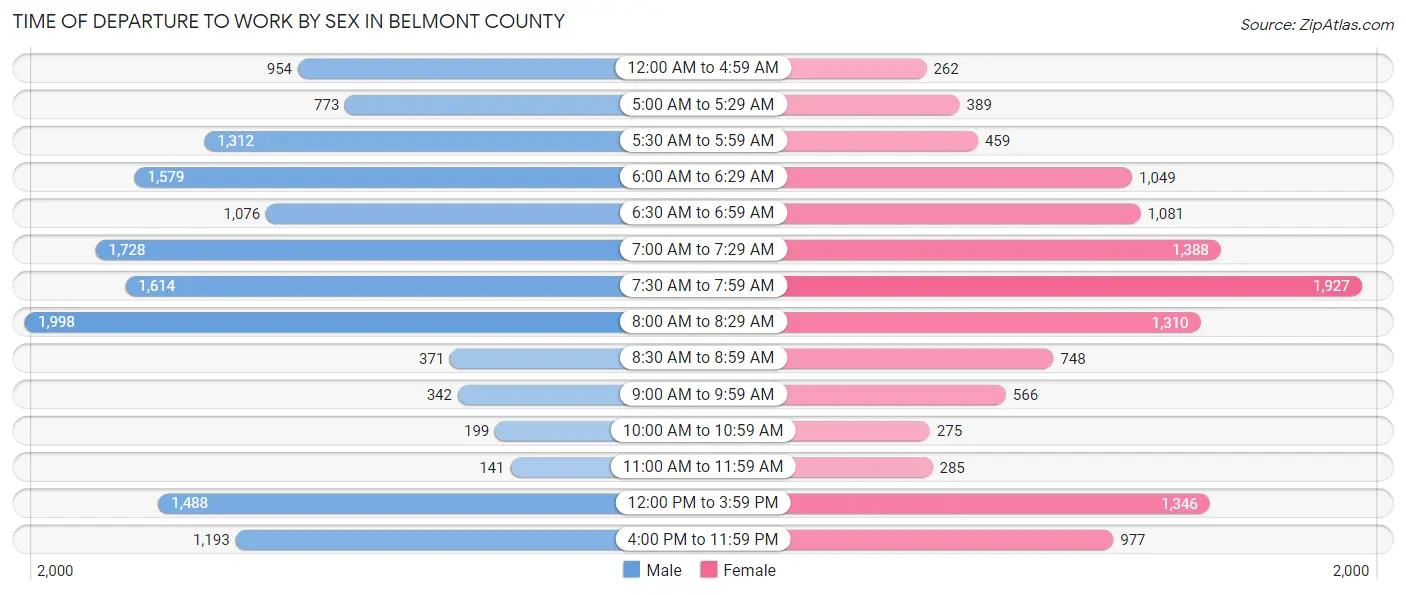
| Time of Departure | Male | Female |
| 12:00 AM to 4:59 AM | 954 (6.5%) | 262 (2.2%) |
| 5:00 AM to 5:29 AM | 773 (5.2%) | 389 (3.2%) |
| 5:30 AM to 5:59 AM | 1,312 (8.9%) | 459 (3.8%) |
| 6:00 AM to 6:29 AM | 1,579 (10.7%) | 1,049 (8.7%) |
| 6:30 AM to 6:59 AM | 1,076 (7.3%) | 1,081 (9.0%) |
| 7:00 AM to 7:29 AM | 1,728 (11.7%) | 1,388 (11.5%) |
| 7:30 AM to 7:59 AM | 1,614 (10.9%) | 1,927 (16.0%) |
| 8:00 AM to 8:29 AM | 1,998 (13.5%) | 1,310 (10.9%) |
| 8:30 AM to 8:59 AM | 371 (2.5%) | 748 (6.2%) |
| 9:00 AM to 9:59 AM | 342 (2.3%) | 566 (4.7%) |
| 10:00 AM to 10:59 AM | 199 (1.3%) | 275 (2.3%) |
| 11:00 AM to 11:59 AM | 141 (0.9%) | 285 (2.4%) |
| 12:00 PM to 3:59 PM | 1,488 (10.1%) | 1,346 (11.2%) |
| 4:00 PM to 11:59 PM | 1,193 (8.1%) | 977 (8.1%) |
| Total | 14,768 (100.0%) | 12,062 (100.0%) |
Housing Occupancy in Belmont County
Occupancy by Ownership in Belmont County
Of the total 25,974 dwellings in Belmont County, owner-occupied units account for 19,357 (74.5%), while renter-occupied units make up 6,617 (25.5%).
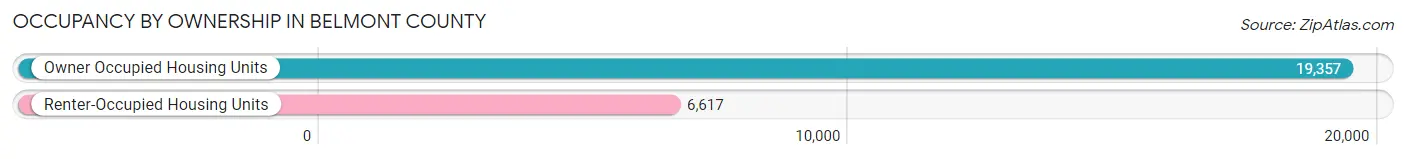
| Occupancy | # Housing Units | % Housing Units |
| Owner Occupied Housing Units | 19,357 | 74.5% |
| Renter-Occupied Housing Units | 6,617 | 25.5% |
| Total Occupied Housing Units | 25,974 | 100.0% |
Occupancy by Household Size in Belmont County
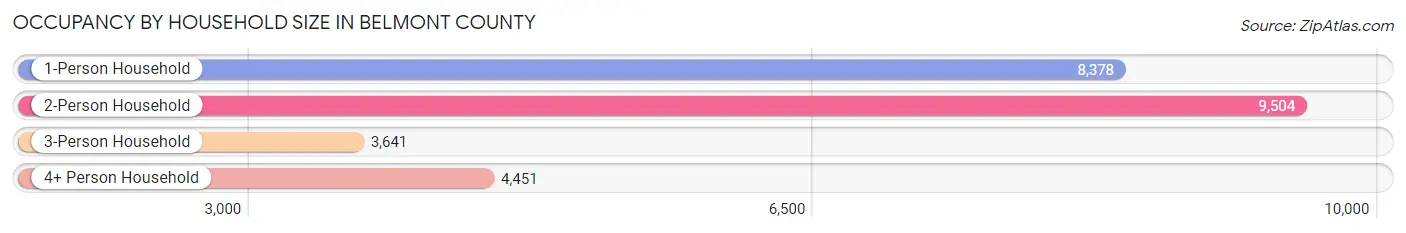
| Household Size | # Housing Units | % Housing Units |
| 1-Person Household | 8,378 | 32.3% |
| 2-Person Household | 9,504 | 36.6% |
| 3-Person Household | 3,641 | 14.0% |
| 4+ Person Household | 4,451 | 17.1% |
| Total Housing Units | 25,974 | 100.0% |
Occupancy by Ownership by Household Size in Belmont County
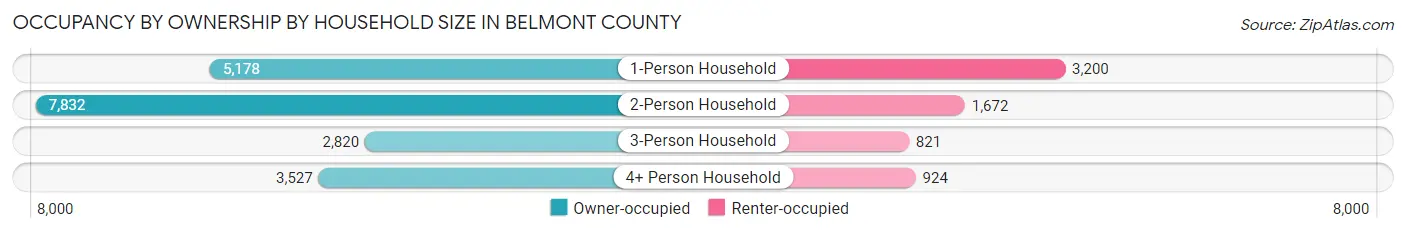
| Household Size | Owner-occupied | Renter-occupied |
| 1-Person Household | 5,178 (61.8%) | 3,200 (38.2%) |
| 2-Person Household | 7,832 (82.4%) | 1,672 (17.6%) |
| 3-Person Household | 2,820 (77.4%) | 821 (22.6%) |
| 4+ Person Household | 3,527 (79.2%) | 924 (20.8%) |
| Total Housing Units | 19,357 (74.5%) | 6,617 (25.5%) |
Occupancy by Educational Attainment in Belmont County
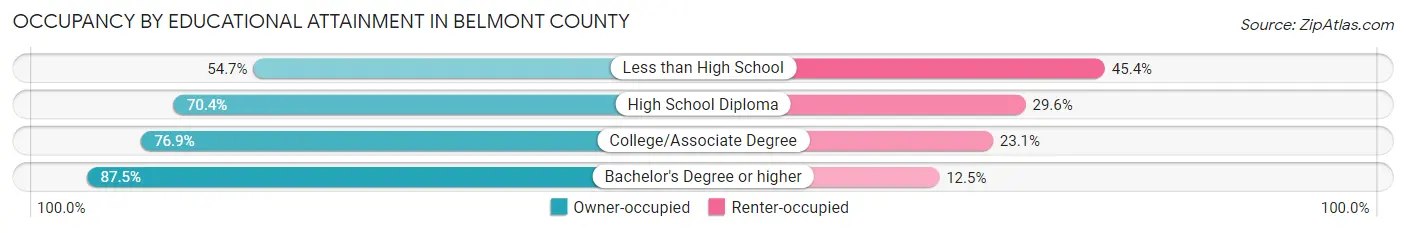
| Household Size | Owner-occupied | Renter-occupied |
| Less than High School | 1,005 (54.6%) | 834 (45.4%) |
| High School Diploma | 7,988 (70.4%) | 3,360 (29.6%) |
| College/Associate Degree | 5,962 (76.9%) | 1,794 (23.1%) |
| Bachelor's Degree or higher | 4,402 (87.5%) | 629 (12.5%) |
Occupancy by Age of Householder in Belmont County
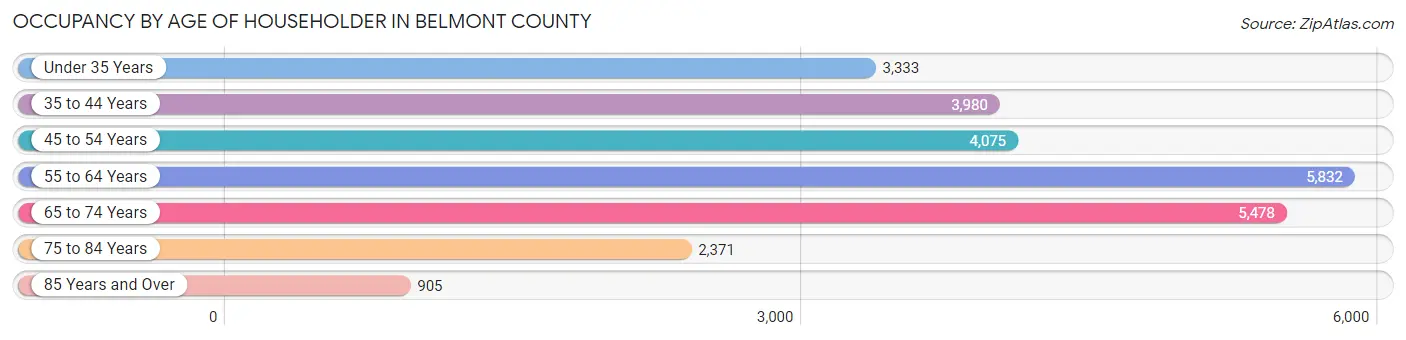
| Age Bracket | # Households | % Households |
| Under 35 Years | 3,333 | 12.8% |
| 35 to 44 Years | 3,980 | 15.3% |
| 45 to 54 Years | 4,075 | 15.7% |
| 55 to 64 Years | 5,832 | 22.5% |
| 65 to 74 Years | 5,478 | 21.1% |
| 75 to 84 Years | 2,371 | 9.1% |
| 85 Years and Over | 905 | 3.5% |
| Total | 25,974 | 100.0% |
Housing Finances in Belmont County
Median Income by Occupancy in Belmont County
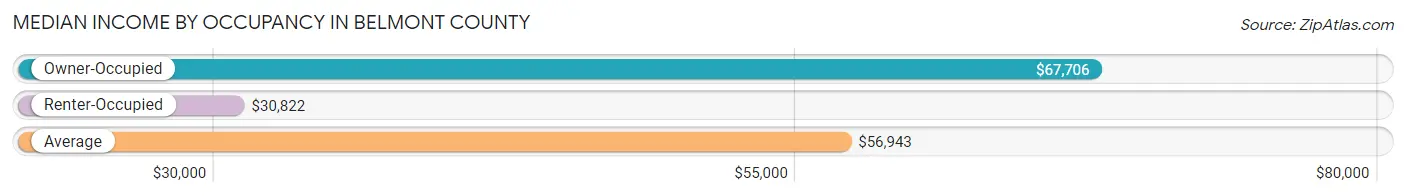
| Occupancy Type | # Households | Median Income |
| Owner-Occupied | 19,357 (74.5%) | $67,706 |
| Renter-Occupied | 6,617 (25.5%) | $30,822 |
| Average | 25,974 (100.0%) | $56,943 |
Occupancy by Householder Income Bracket in Belmont County
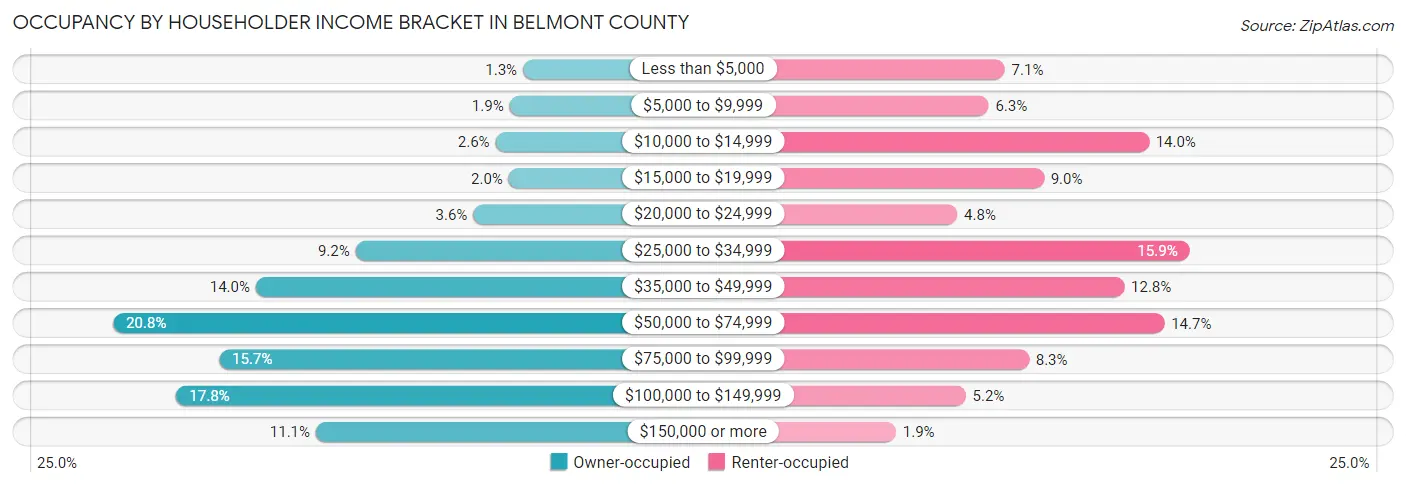
| Income Bracket | Owner-occupied | Renter-occupied |
| Less than $5,000 | 245 (1.3%) | 470 (7.1%) |
| $5,000 to $9,999 | 369 (1.9%) | 419 (6.3%) |
| $10,000 to $14,999 | 500 (2.6%) | 924 (14.0%) |
| $15,000 to $19,999 | 377 (1.9%) | 593 (9.0%) |
| $20,000 to $24,999 | 704 (3.6%) | 320 (4.8%) |
| $25,000 to $34,999 | 1,789 (9.2%) | 1,052 (15.9%) |
| $35,000 to $49,999 | 2,708 (14.0%) | 846 (12.8%) |
| $50,000 to $74,999 | 4,024 (20.8%) | 973 (14.7%) |
| $75,000 to $99,999 | 3,046 (15.7%) | 546 (8.3%) |
| $100,000 to $149,999 | 3,440 (17.8%) | 347 (5.2%) |
| $150,000 or more | 2,155 (11.1%) | 127 (1.9%) |
| Total | 19,357 (100.0%) | 6,617 (100.0%) |
Monthly Housing Cost Tiers in Belmont County
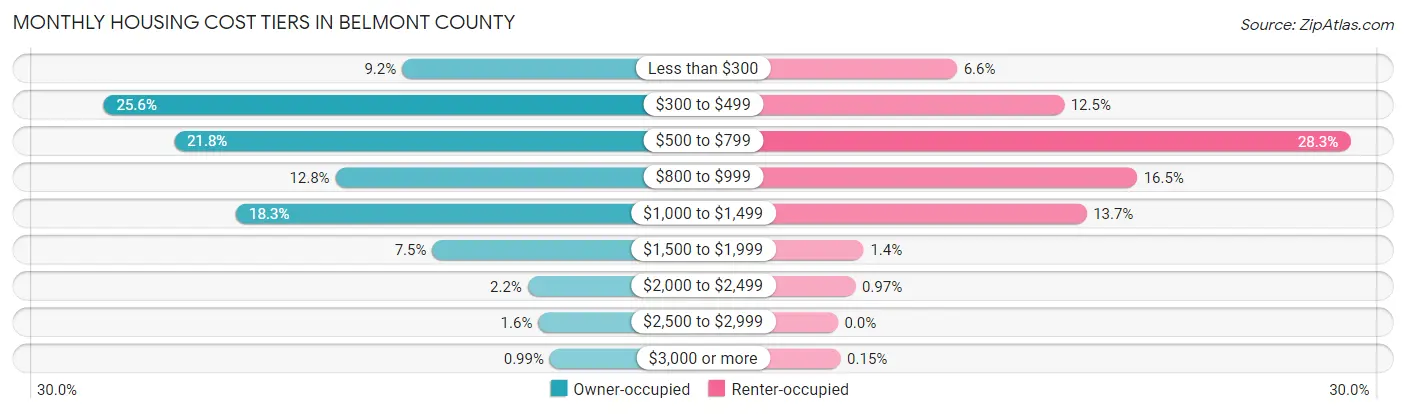
| Monthly Cost | Owner-occupied | Renter-occupied |
| Less than $300 | 1,771 (9.1%) | 436 (6.6%) |
| $300 to $499 | 4,963 (25.6%) | 827 (12.5%) |
| $500 to $799 | 4,211 (21.7%) | 1,873 (28.3%) |
| $800 to $999 | 2,483 (12.8%) | 1,094 (16.5%) |
| $1,000 to $1,499 | 3,546 (18.3%) | 909 (13.7%) |
| $1,500 to $1,999 | 1,448 (7.5%) | 95 (1.4%) |
| $2,000 to $2,499 | 427 (2.2%) | 64 (1.0%) |
| $2,500 to $2,999 | 316 (1.6%) | 0 (0.0%) |
| $3,000 or more | 192 (1.0%) | 10 (0.2%) |
| Total | 19,357 (100.0%) | 6,617 (100.0%) |
Physical Housing Characteristics in Belmont County
Housing Structures in Belmont County
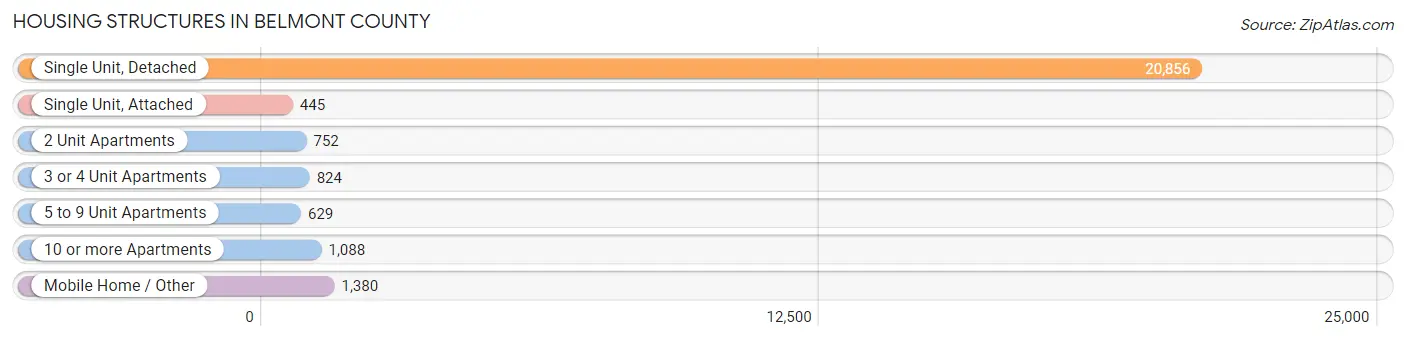
| Structure Type | # Housing Units | % Housing Units |
| Single Unit, Detached | 20,856 | 80.3% |
| Single Unit, Attached | 445 | 1.7% |
| 2 Unit Apartments | 752 | 2.9% |
| 3 or 4 Unit Apartments | 824 | 3.2% |
| 5 to 9 Unit Apartments | 629 | 2.4% |
| 10 or more Apartments | 1,088 | 4.2% |
| Mobile Home / Other | 1,380 | 5.3% |
| Total | 25,974 | 100.0% |
Housing Structures by Occupancy in Belmont County
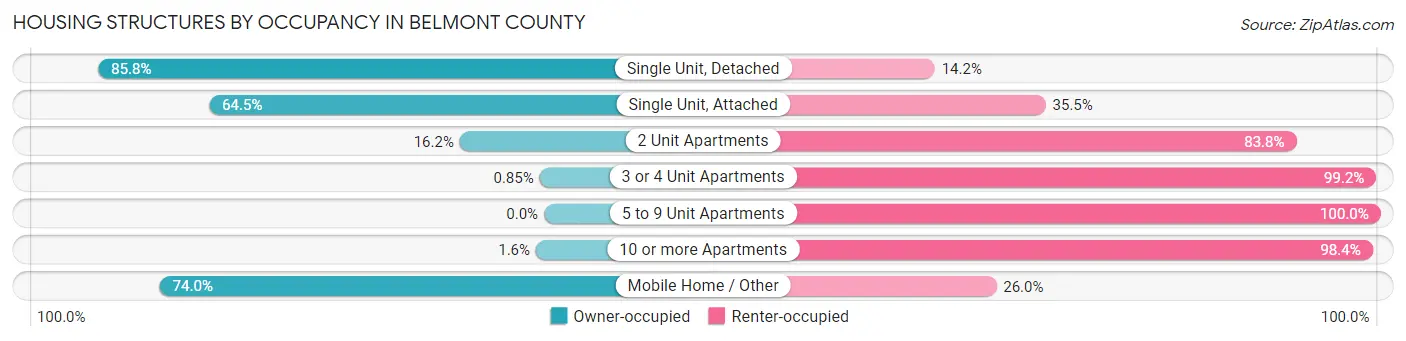
| Structure Type | Owner-occupied | Renter-occupied |
| Single Unit, Detached | 17,903 (85.8%) | 2,953 (14.2%) |
| Single Unit, Attached | 287 (64.5%) | 158 (35.5%) |
| 2 Unit Apartments | 122 (16.2%) | 630 (83.8%) |
| 3 or 4 Unit Apartments | 7 (0.9%) | 817 (99.2%) |
| 5 to 9 Unit Apartments | 0 (0.0%) | 629 (100.0%) |
| 10 or more Apartments | 17 (1.6%) | 1,071 (98.4%) |
| Mobile Home / Other | 1,021 (74.0%) | 359 (26.0%) |
| Total | 19,357 (74.5%) | 6,617 (25.5%) |
Housing Structures by Number of Rooms in Belmont County
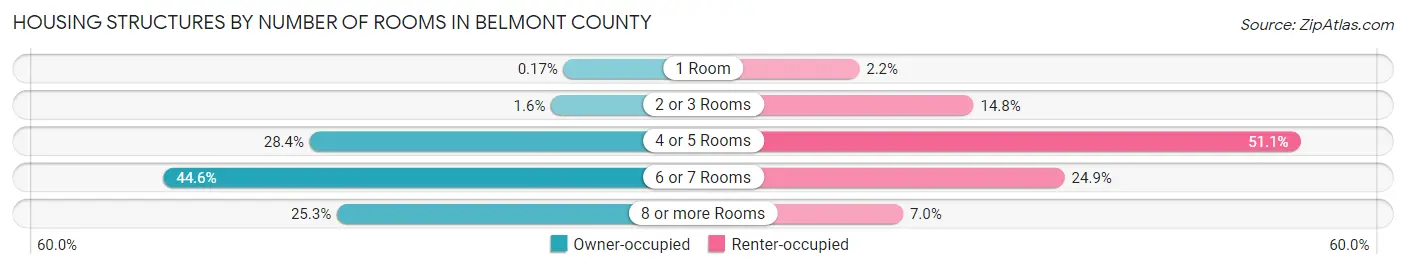
| Number of Rooms | Owner-occupied | Renter-occupied |
| 1 Room | 32 (0.2%) | 142 (2.1%) |
| 2 or 3 Rooms | 301 (1.5%) | 981 (14.8%) |
| 4 or 5 Rooms | 5,488 (28.3%) | 3,381 (51.1%) |
| 6 or 7 Rooms | 8,633 (44.6%) | 1,650 (24.9%) |
| 8 or more Rooms | 4,903 (25.3%) | 463 (7.0%) |
| Total | 19,357 (100.0%) | 6,617 (100.0%) |
Housing Structure by Heating Type in Belmont County
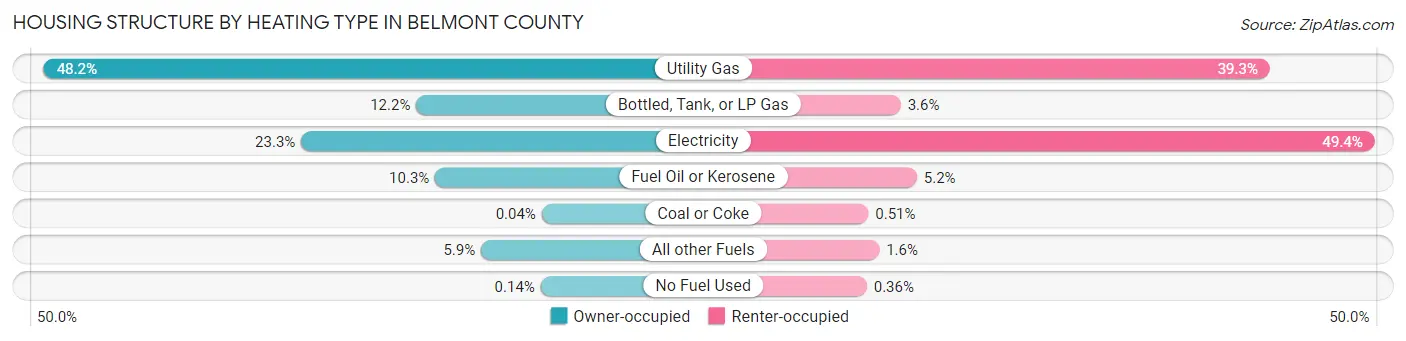
| Heating Type | Owner-occupied | Renter-occupied |
| Utility Gas | 9,320 (48.1%) | 2,600 (39.3%) |
| Bottled, Tank, or LP Gas | 2,353 (12.2%) | 241 (3.6%) |
| Electricity | 4,506 (23.3%) | 3,271 (49.4%) |
| Fuel Oil or Kerosene | 2,000 (10.3%) | 344 (5.2%) |
| Coal or Coke | 7 (0.0%) | 34 (0.5%) |
| All other Fuels | 1,143 (5.9%) | 103 (1.6%) |
| No Fuel Used | 28 (0.1%) | 24 (0.4%) |
| Total | 19,357 (100.0%) | 6,617 (100.0%) |
Household Vehicle Usage in Belmont County
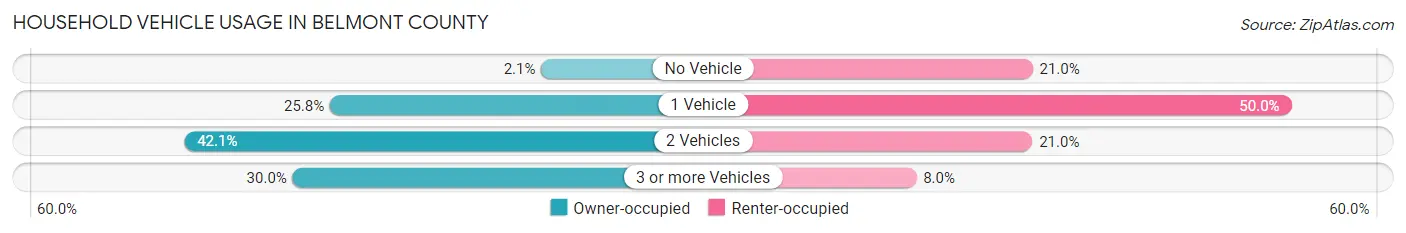
| Vehicles per Household | Owner-occupied | Renter-occupied |
| No Vehicle | 411 (2.1%) | 1,391 (21.0%) |
| 1 Vehicle | 4,991 (25.8%) | 3,309 (50.0%) |
| 2 Vehicles | 8,154 (42.1%) | 1,388 (21.0%) |
| 3 or more Vehicles | 5,801 (30.0%) | 529 (8.0%) |
| Total | 19,357 (100.0%) | 6,617 (100.0%) |
Real Estate & Mortgages in Belmont County
Real Estate and Mortgage Overview in Belmont County
| Characteristic | Without Mortgage | With Mortgage |
| Housing Units | 10,191 | 9,166 |
| Median Property Value | $117,700 | $146,700 |
| Median Household Income | $53,149 | $1,453 |
| Monthly Housing Costs | $446 | $175 |
| Real Estate Taxes | $1,285 | $193 |
Property Value by Mortgage Status in Belmont County
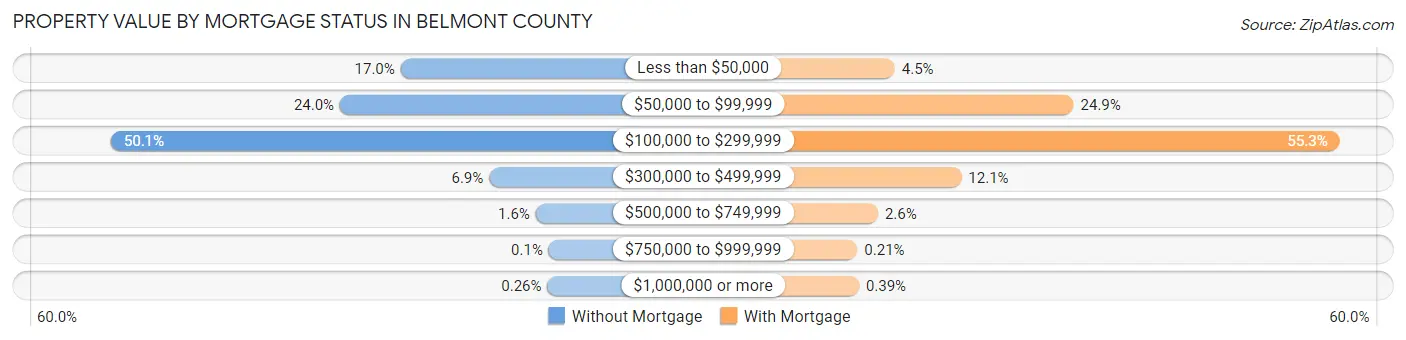
| Property Value | Without Mortgage | With Mortgage |
| Less than $50,000 | 1,736 (17.0%) | 412 (4.5%) |
| $50,000 to $99,999 | 2,442 (24.0%) | 2,284 (24.9%) |
| $100,000 to $299,999 | 5,110 (50.1%) | 5,071 (55.3%) |
| $300,000 to $499,999 | 704 (6.9%) | 1,109 (12.1%) |
| $500,000 to $749,999 | 162 (1.6%) | 235 (2.6%) |
| $750,000 to $999,999 | 10 (0.1%) | 19 (0.2%) |
| $1,000,000 or more | 27 (0.3%) | 36 (0.4%) |
| Total | 10,191 (100.0%) | 9,166 (100.0%) |
Household Income by Mortgage Status in Belmont County
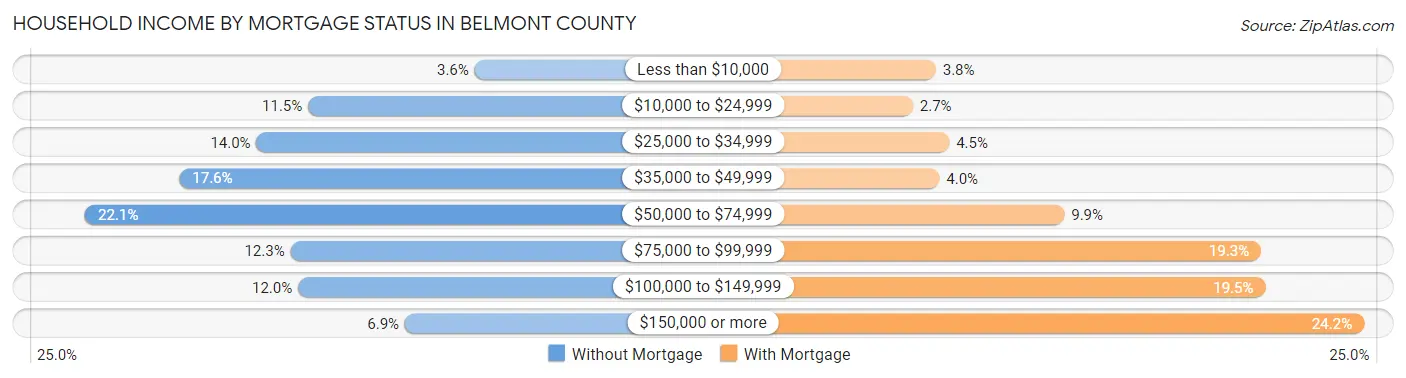
| Household Income | Without Mortgage | With Mortgage |
| Less than $10,000 | 364 (3.6%) | 350 (3.8%) |
| $10,000 to $24,999 | 1,172 (11.5%) | 250 (2.7%) |
| $25,000 to $34,999 | 1,423 (14.0%) | 409 (4.5%) |
| $35,000 to $49,999 | 1,797 (17.6%) | 366 (4.0%) |
| $50,000 to $74,999 | 2,254 (22.1%) | 911 (9.9%) |
| $75,000 to $99,999 | 1,258 (12.3%) | 1,770 (19.3%) |
| $100,000 to $149,999 | 1,221 (12.0%) | 1,788 (19.5%) |
| $150,000 or more | 702 (6.9%) | 2,219 (24.2%) |
| Total | 10,191 (100.0%) | 9,166 (100.0%) |
Property Value to Household Income Ratio in Belmont County
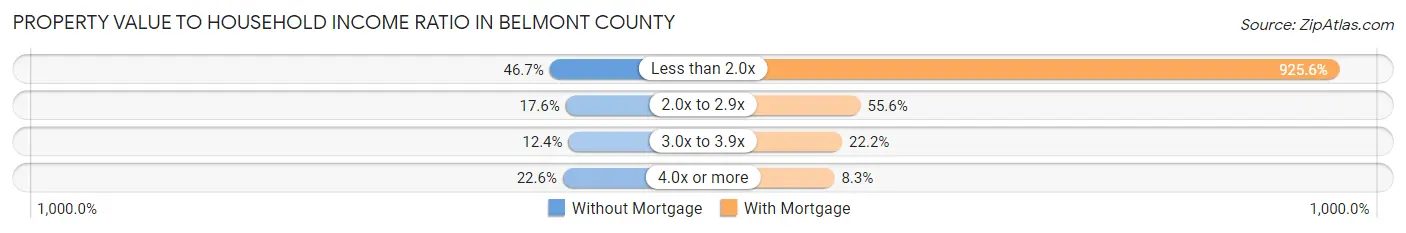
| Value-to-Income Ratio | Without Mortgage | With Mortgage |
| Less than 2.0x | 4,759 (46.7%) | 84,844 (925.6%) |
| 2.0x to 2.9x | 1,795 (17.6%) | 5,100 (55.6%) |
| 3.0x to 3.9x | 1,266 (12.4%) | 2,032 (22.2%) |
| 4.0x or more | 2,307 (22.6%) | 758 (8.3%) |
| Total | 10,191 (100.0%) | 9,166 (100.0%) |
Real Estate Taxes by Mortgage Status in Belmont County
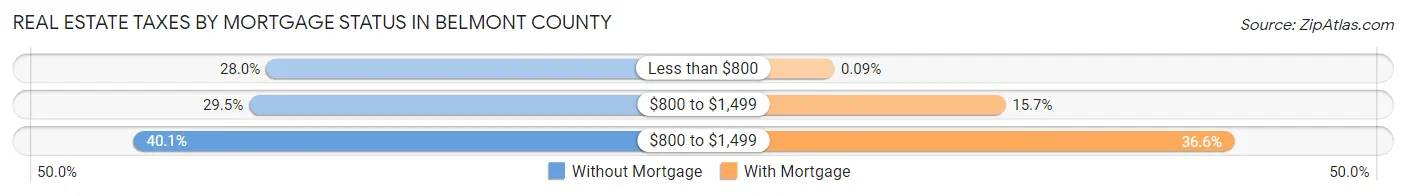
| Property Taxes | Without Mortgage | With Mortgage |
| Less than $800 | 2,848 (28.0%) | 8 (0.1%) |
| $800 to $1,499 | 3,007 (29.5%) | 1,442 (15.7%) |
| $800 to $1,499 | 4,082 (40.1%) | 3,354 (36.6%) |
| Total | 10,191 (100.0%) | 9,166 (100.0%) |
Health & Disability in Belmont County
Health Insurance Coverage by Age in Belmont County
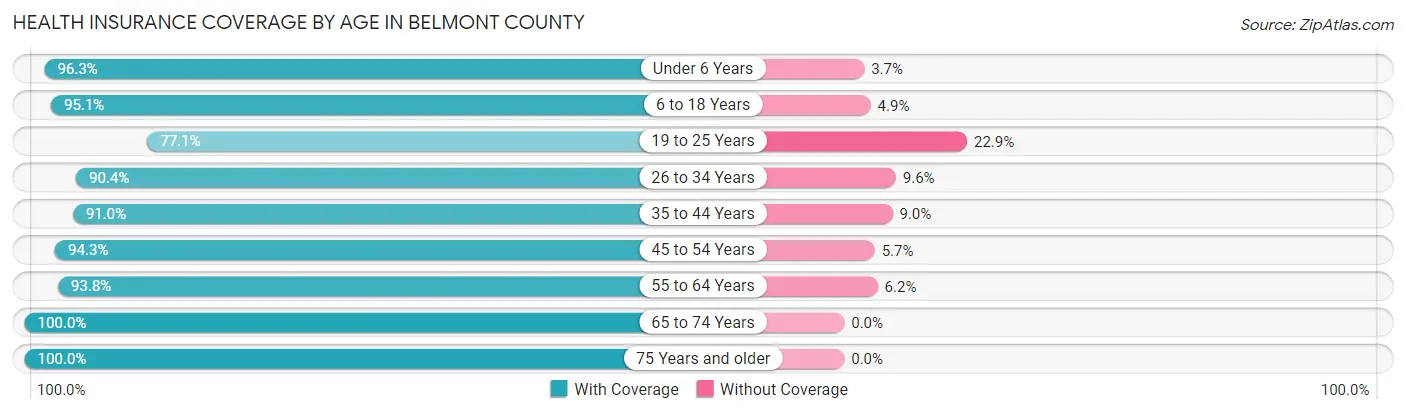
| Age Bracket | With Coverage | Without Coverage |
| Under 6 Years | 3,534 (96.3%) | 136 (3.7%) |
| 6 to 18 Years | 9,015 (95.1%) | 466 (4.9%) |
| 19 to 25 Years | 3,935 (77.1%) | 1,168 (22.9%) |
| 26 to 34 Years | 5,801 (90.4%) | 617 (9.6%) |
| 35 to 44 Years | 6,719 (91.0%) | 664 (9.0%) |
| 45 to 54 Years | 7,495 (94.3%) | 451 (5.7%) |
| 55 to 64 Years | 9,228 (93.8%) | 612 (6.2%) |
| 65 to 74 Years | 8,260 (100.0%) | 0 (0.0%) |
| 75 Years and older | 4,961 (100.0%) | 0 (0.0%) |
| Total | 58,948 (93.5%) | 4,114 (6.5%) |
Health Insurance Coverage by Citizenship Status in Belmont County
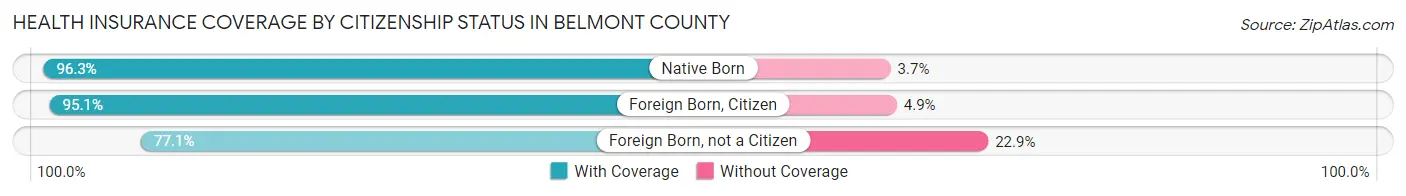
| Citizenship Status | With Coverage | Without Coverage |
| Native Born | 3,534 (96.3%) | 136 (3.7%) |
| Foreign Born, Citizen | 9,015 (95.1%) | 466 (4.9%) |
| Foreign Born, not a Citizen | 3,935 (77.1%) | 1,168 (22.9%) |
Health Insurance Coverage by Household Income in Belmont County
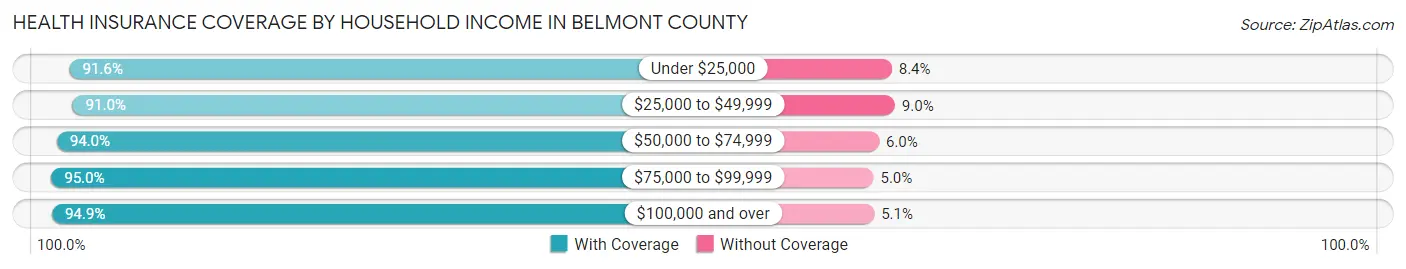
| Household Income | With Coverage | Without Coverage |
| Under $25,000 | 7,920 (91.6%) | 729 (8.4%) |
| $25,000 to $49,999 | 11,771 (91.0%) | 1,166 (9.0%) |
| $50,000 to $74,999 | 11,071 (94.0%) | 712 (6.0%) |
| $75,000 to $99,999 | 9,373 (95.0%) | 494 (5.0%) |
| $100,000 and over | 18,559 (94.9%) | 1,006 (5.1%) |
Public vs Private Health Insurance Coverage by Age in Belmont County

| Age Bracket | Public Insurance | Private Insurance |
| Under 6 | 1,734 (47.2%) | 1,976 (53.8%) |
| 6 to 18 Years | 3,526 (37.2%) | 5,941 (62.7%) |
| 19 to 25 Years | 906 (17.7%) | 3,101 (60.8%) |
| 25 to 34 Years | 1,739 (27.1%) | 4,190 (65.3%) |
| 35 to 44 Years | 1,378 (18.7%) | 5,405 (73.2%) |
| 45 to 54 Years | 1,923 (24.2%) | 5,790 (72.9%) |
| 55 to 64 Years | 2,537 (25.8%) | 7,153 (72.7%) |
| 65 to 74 Years | 7,906 (95.7%) | 4,488 (54.3%) |
| 75 Years and over | 4,953 (99.8%) | 2,760 (55.6%) |
| Total | 26,602 (42.2%) | 40,804 (64.7%) |
Disability Status by Sex by Age in Belmont County
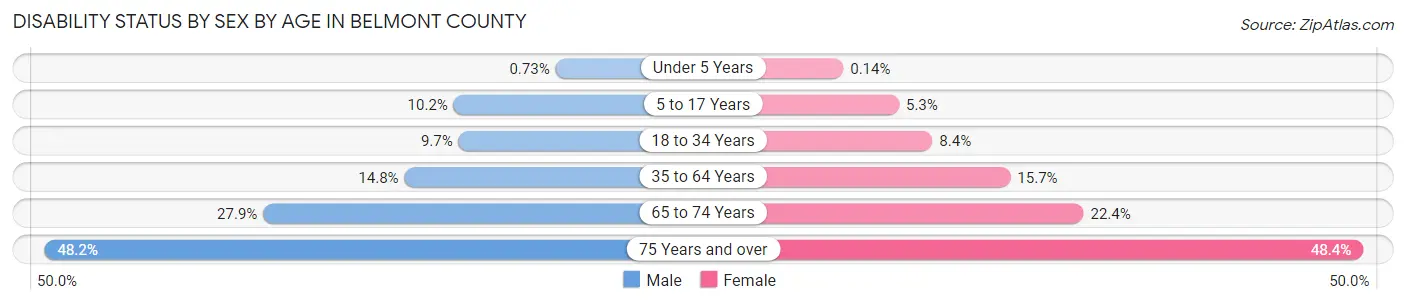
| Age Bracket | Male | Female |
| Under 5 Years | 12 (0.7%) | 2 (0.1%) |
| 5 to 17 Years | 477 (10.2%) | 243 (5.3%) |
| 18 to 34 Years | 663 (9.7%) | 464 (8.4%) |
| 35 to 64 Years | 1,846 (14.7%) | 1,980 (15.7%) |
| 65 to 74 Years | 1,143 (27.9%) | 933 (22.4%) |
| 75 Years and over | 1,001 (48.1%) | 1,394 (48.4%) |
Disability Class by Sex by Age in Belmont County
Disability Class: Hearing Difficulty

| Age Bracket | Male | Female |
| Under 5 Years | 0 (0.0%) | 0 (0.0%) |
| 5 to 17 Years | 2 (0.0%) | 7 (0.2%) |
| 18 to 34 Years | 29 (0.4%) | 22 (0.4%) |
| 35 to 64 Years | 543 (4.3%) | 270 (2.1%) |
| 65 to 74 Years | 655 (16.0%) | 258 (6.2%) |
| 75 Years and over | 658 (31.7%) | 542 (18.8%) |
Disability Class: Vision Difficulty

| Age Bracket | Male | Female |
| Under 5 Years | 12 (0.7%) | 2 (0.1%) |
| 5 to 17 Years | 56 (1.2%) | 63 (1.4%) |
| 18 to 34 Years | 73 (1.1%) | 24 (0.4%) |
| 35 to 64 Years | 285 (2.3%) | 220 (1.7%) |
| 65 to 74 Years | 154 (3.7%) | 115 (2.8%) |
| 75 Years and over | 131 (6.3%) | 261 (9.1%) |
Disability Class: Cognitive Difficulty
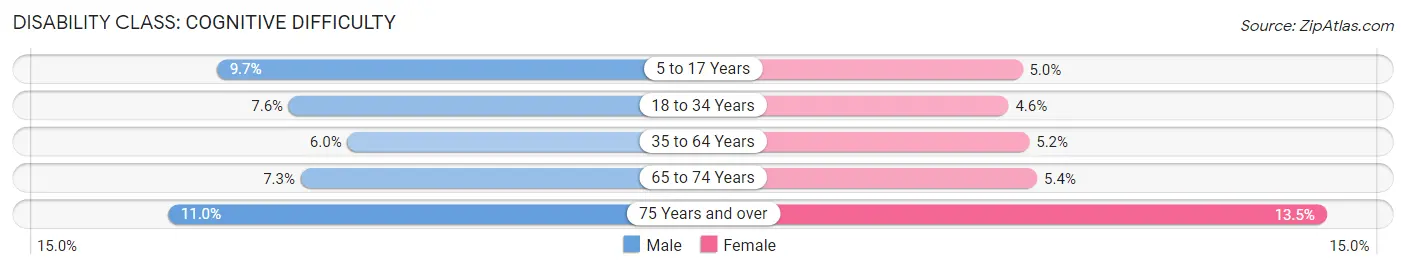
| Age Bracket | Male | Female |
| 5 to 17 Years | 452 (9.7%) | 230 (5.0%) |
| 18 to 34 Years | 521 (7.6%) | 256 (4.6%) |
| 35 to 64 Years | 752 (6.0%) | 660 (5.2%) |
| 65 to 74 Years | 300 (7.3%) | 226 (5.4%) |
| 75 Years and over | 229 (11.0%) | 389 (13.5%) |
Disability Class: Ambulatory Difficulty
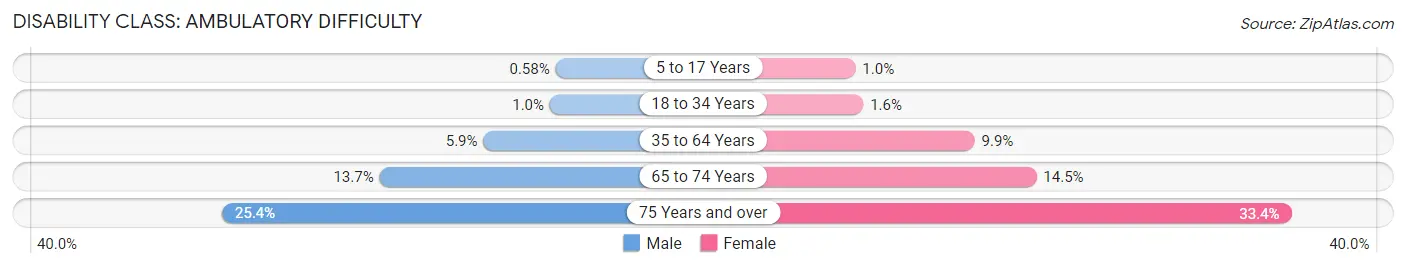
| Age Bracket | Male | Female |
| 5 to 17 Years | 27 (0.6%) | 46 (1.0%) |
| 18 to 34 Years | 68 (1.0%) | 88 (1.6%) |
| 35 to 64 Years | 743 (5.9%) | 1,248 (9.9%) |
| 65 to 74 Years | 560 (13.7%) | 601 (14.4%) |
| 75 Years and over | 527 (25.4%) | 962 (33.4%) |
Disability Class: Self-Care Difficulty
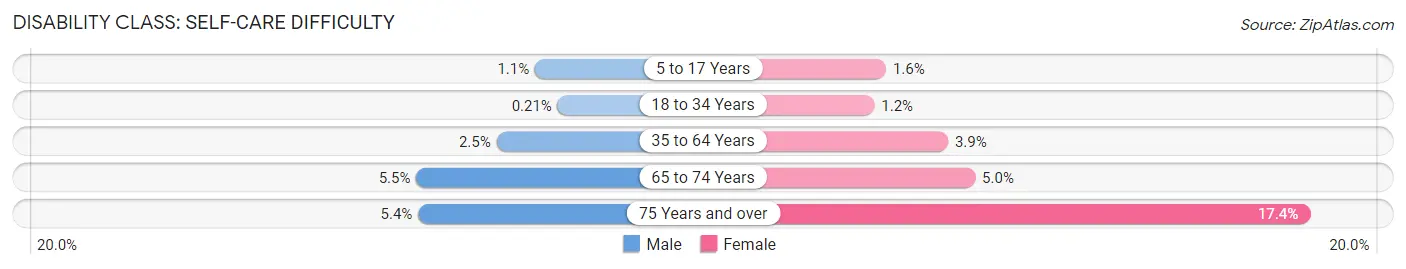
| Age Bracket | Male | Female |
| 5 to 17 Years | 49 (1.1%) | 75 (1.6%) |
| 18 to 34 Years | 14 (0.2%) | 67 (1.2%) |
| 35 to 64 Years | 310 (2.5%) | 498 (3.9%) |
| 65 to 74 Years | 224 (5.5%) | 206 (5.0%) |
| 75 Years and over | 112 (5.4%) | 501 (17.4%) |
Technology Access in Belmont County
Computing Device Access in Belmont County
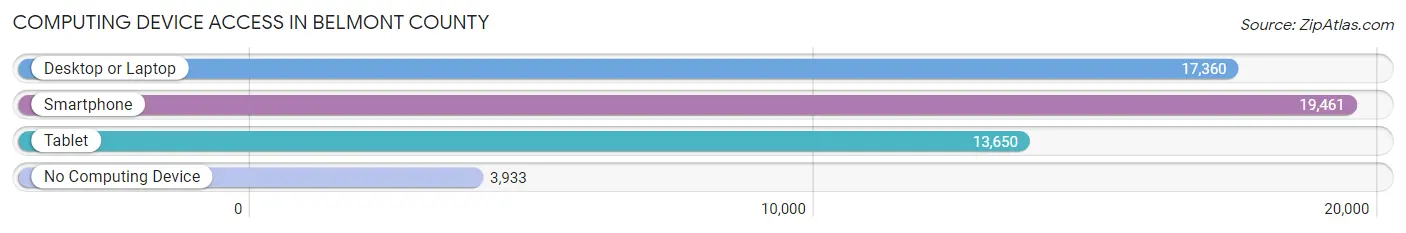
| Device Type | # Households | % Households |
| Desktop or Laptop | 17,360 | 66.8% |
| Smartphone | 19,461 | 74.9% |
| Tablet | 13,650 | 52.5% |
| No Computing Device | 3,933 | 15.1% |
| Total | 25,974 | 100.0% |
Internet Access in Belmont County
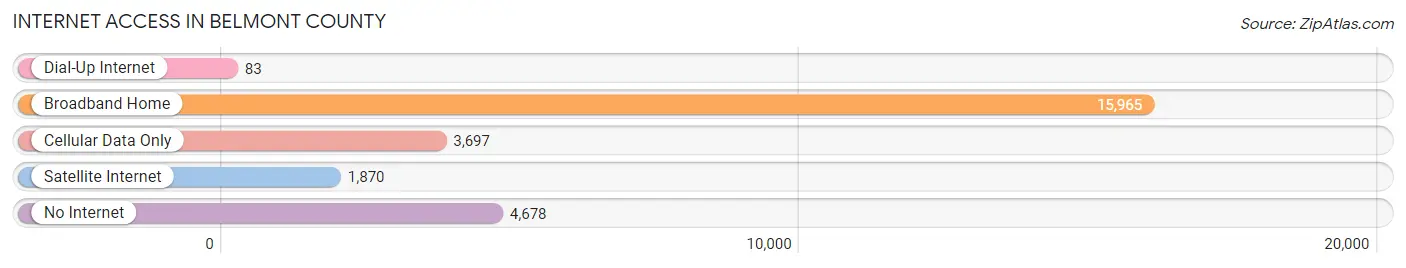
| Internet Type | # Households | % Households |
| Dial-Up Internet | 83 | 0.3% |
| Broadband Home | 15,965 | 61.5% |
| Cellular Data Only | 3,697 | 14.2% |
| Satellite Internet | 1,870 | 7.2% |
| No Internet | 4,678 | 18.0% |
| Total | 25,974 | 100.0% |
Belmont County Summary
Belmont County is located in the eastern part of Ohio, and is part of the Appalachian region. It is bordered by the Ohio River to the south, and is part of the Wheeling, West Virginia metropolitan area. The county was established in 1801 and named after the French-Canadian explorer, Louis-Joseph de Montcalm. The county seat is St. Clairsville.
Geography
Belmont County covers an area of 545 square miles, and is located in the Appalachian Plateau region of Ohio. The terrain is mostly hilly, with some flat areas in the northern part of the county. The highest point in the county is located at the intersection of the Ohio and West Virginia state lines, at an elevation of 1,092 feet. The county is drained by the Ohio River, which forms its southern boundary. Other major waterways include the Little Muskingum River, Captina Creek, and the Wills Creek.
The county is home to several state parks, including Barkcamp State Park, Beechwood State Park, and Wolf Run State Park. The county also contains several wildlife areas, including the Belmont County Wildlife Area, the Wolf Run Wildlife Area, and the Beechwood Wildlife Area.
Demographics
As of the 2010 census, Belmont County had a population of 70,400. The racial makeup of the county was 95.2% White, 2.3% African American, 0.3% Native American, 0.5% Asian, 0.2% Pacific Islander, 0.5% from other races, and 1.0% from two or more races. Hispanic or Latino of any race were 1.3% of the population.
The median income for a household in the county was $41,945, and the median income for a family was $50,945. The per capita income for the county was $20,945. About 11.2% of families and 14.2% of the population were below the poverty line, including 19.2% of those under age 18 and 8.2% of those age 65 or over.
Economy
Belmont County’s economy is largely based on agriculture, manufacturing, and energy production. The county is home to several large agricultural operations, including the Belmont County Farm Bureau, the Belmont County Cattlemen’s Association, and the Belmont County Dairymen’s Association.
Manufacturing is also an important part of the county’s economy. Major employers include the Ohio Valley Mall, the Belmont County Industrial Park, and the Belmont County Business Park. The county is also home to several energy production facilities, including the Belmont Power Plant, the Belmont County Wind Farm, and the Belmont County Solar Farm.
History
Belmont County was established in 1801 and named after the French-Canadian explorer, Louis-Joseph de Montcalm. The county was originally part of the Northwest Territory, and was later part of the Virginia Military District. The county was home to several Native American tribes, including the Shawnee, Delaware, and Wyandot.
During the 19th century, the county was home to several industries, including coal mining, iron production, and timber harvesting. The county was also home to several railroads, including the Baltimore and Ohio Railroad, the Wheeling and Lake Erie Railroad, and the Ohio Central Railroad.
In the 20th century, the county’s economy shifted to agriculture and manufacturing. The county is now home to several large agricultural operations, manufacturing facilities, and energy production facilities. Belmont County is also home to several state parks and wildlife areas, making it a popular destination for outdoor recreation.
Common Questions
What is the Total Population of Belmont County?
Total Population of Belmont County is 66,554.
What is the Total Male Population of Belmont County?
Total Male Population of Belmont County is 34,600.
What is the Total Female Population of Belmont County?
Total Female Population of Belmont County is 31,954.
What is the Ratio of Males per 100 Females in Belmont County?
There are 108.28 Males per 100 Females in Belmont County.
What is the Ratio of Females per 100 Males in Belmont County?
There are 92.35 Females per 100 Males in Belmont County.
What is the Median Population Age in Belmont County?
Median Population Age in Belmont County is 44.1 Years.
What is the Average Family Size in Belmont County
Average Family Size in Belmont County is 3.1 People.
What is the Average Household Size in Belmont County
Average Household Size in Belmont County is 2.4 People.
What is Per Capita Income in Belmont County?
Per Capita income in Belmont County is $30,563.
What is the Median Family Income in Belmont County?
Median Family Income in Belmont County is $72,358.
What is the Median Household income in Belmont County?
Median Household Income in Belmont County is $56,943.
What is Income or Wage Gap in Belmont County?
Income or Wage Gap in Belmont County is 24.2%.
Women in Belmont County earn 75.8 cents for every dollar earned by a man.
What is Family Income Deficit in Belmont County?
Family Income Deficit in Belmont County is $12,399.
Families that are below poverty line in Belmont County earn $12,399 less on average than the poverty threshold level.
What is Inequality or Gini Index in Belmont County?
Inequality or Gini Index in Belmont County is 0.44.
How Large is the Labor Force in Belmont County?
There are 30,285 People in the Labor Forcein in Belmont County.
What is the Percentage of People in the Labor Force in Belmont County?
54.3% of People are in the Labor Force in Belmont County.
What is the Unemployment Rate in Belmont County?
Unemployment Rate in Belmont County is 6.0%.