Ashtabula County, OH
Ashtabula County Map
Ashtabula County Overview
97,666
TOTAL POPULATION
49,966
MALE POPULATION
47,700
FEMALE POPULATION
104.75
MALES / 100 FEMALES
95.46
FEMALES / 100 MALES
42.6
MEDIAN AGE
3.1
AVG FAMILY SIZE
2.5
AVG HOUSEHOLD SIZE
$29,586
PER CAPITA INCOME
$68,475
AVG FAMILY INCOME
$53,663
AVG HOUSEHOLD INCOME
32.1%
WAGE / INCOME GAP [ % ]
67.9¢/ $1
WAGE / INCOME GAP [ $ ]
$9,186
FAMILY INCOME DEFICIT
0.45
INEQUALITY / GINI INDEX
45,627
LABOR FORCE [ PEOPLE ]
57.9%
PERCENT IN LABOR FORCE
7.6%
UNEMPLOYMENT RATE
Ashtabula County Area Codes
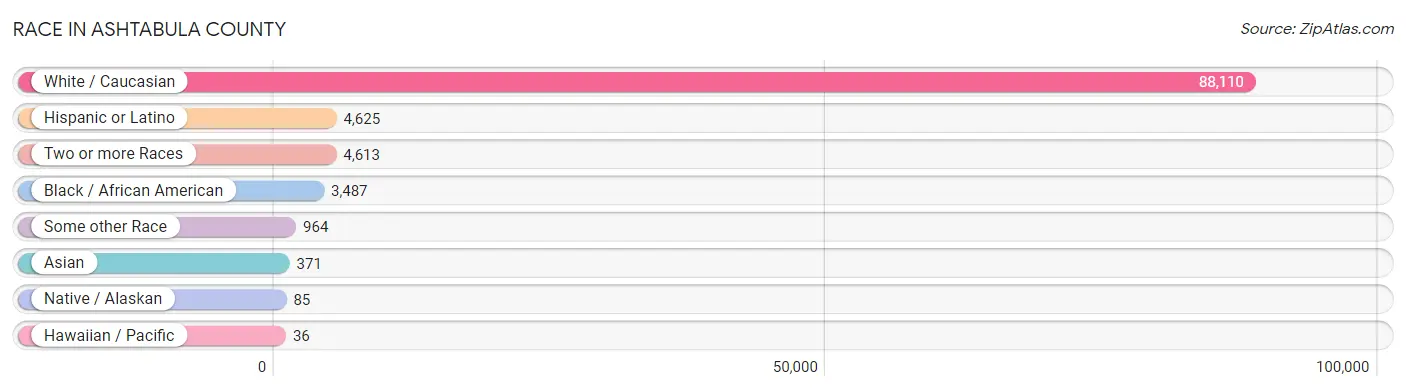
Race in Ashtabula County
The most populous races in Ashtabula County are White / Caucasian (88,110 | 90.2%), Hispanic or Latino (4,625 | 4.7%), and Two or more Races (4,613 | 4.7%).
| Race | # Population | % Population |
| Asian | 371 | 0.4% |
| Black / African American | 3,487 | 3.6% |
| Hawaiian / Pacific | 36 | 0.0% |
| Hispanic or Latino | 4,625 | 4.7% |
| Native / Alaskan | 85 | 0.1% |
| White / Caucasian | 88,110 | 90.2% |
| Two or more Races | 4,613 | 4.7% |
| Some other Race | 964 | 1.0% |
| Total | 97,666 | 100.0% |
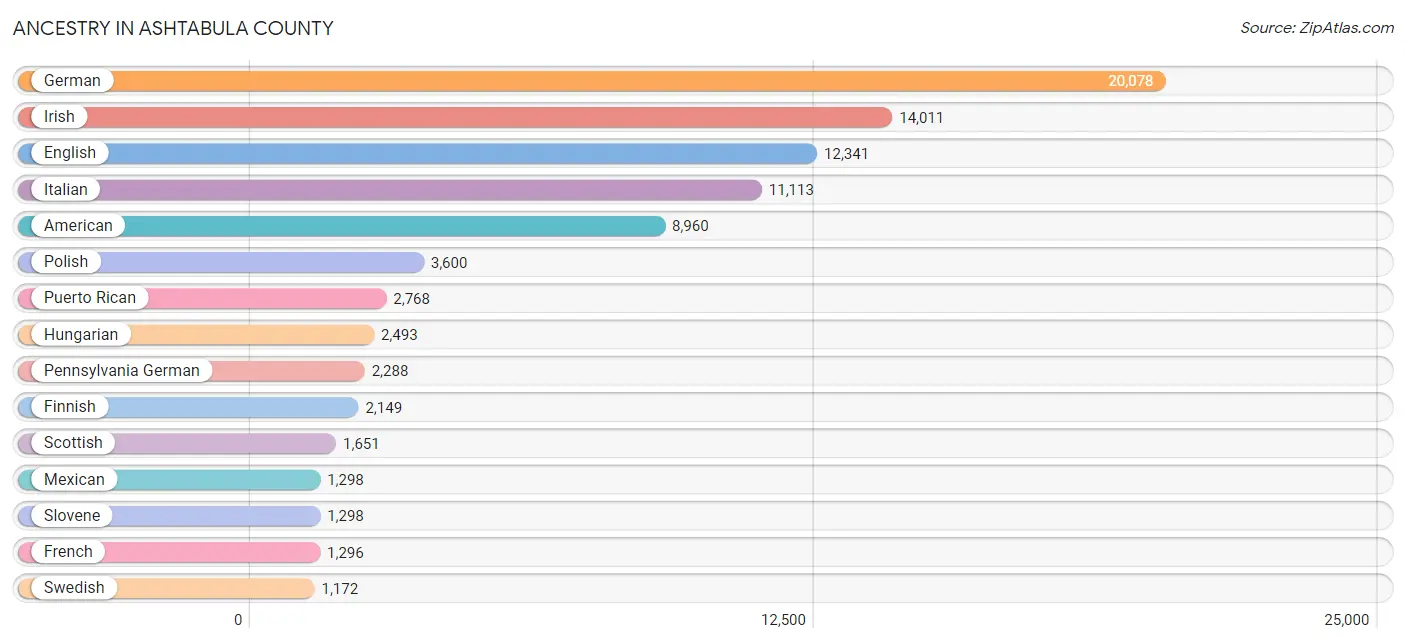
Ancestry in Ashtabula County
The most populous ancestries reported in Ashtabula County are German (20,078 | 20.6%), Irish (14,011 | 14.3%), English (12,341 | 12.6%), Italian (11,113 | 11.4%), and American (8,960 | 9.2%), together accounting for 68.1% of all Ashtabula County residents.
| Ancestry | # Population | % Population |
| African | 87 | 0.1% |
| American | 8,960 | 9.2% |
| Apache | 49 | 0.1% |
| Arab | 188 | 0.2% |
| Austrian | 115 | 0.1% |
| Belgian | 18 | 0.0% |
| Bhutanese | 100 | 0.1% |
| Blackfeet | 208 | 0.2% |
| Brazilian | 61 | 0.1% |
| British | 402 | 0.4% |
| Bulgarian | 5 | 0.0% |
| Burmese | 38 | 0.0% |
| Canadian | 78 | 0.1% |
| Central American | 142 | 0.2% |
| Cherokee | 404 | 0.4% |
| Chickasaw | 6 | 0.0% |
| Chippewa | 8 | 0.0% |
| Colombian | 6 | 0.0% |
| Comanche | 1 | 0.0% |
| Cree | 5 | 0.0% |
| Creek | 7 | 0.0% |
| Croatian | 336 | 0.3% |
| Cuban | 92 | 0.1% |
| Czech | 862 | 0.9% |
| Czechoslovakian | 174 | 0.2% |
| Danish | 34 | 0.0% |
| Dominican | 17 | 0.0% |
| Dutch | 822 | 0.8% |
| Eastern European | 238 | 0.2% |
| English | 12,341 | 12.6% |
| Estonian | 12 | 0.0% |
| European | 895 | 0.9% |
| Filipino | 24 | 0.0% |
| Finnish | 2,149 | 2.2% |
| French | 1,296 | 1.3% |
| French American Indian | 13 | 0.0% |
| French Canadian | 219 | 0.2% |
| German | 20,078 | 20.6% |
| German Russian | 18 | 0.0% |
| Greek | 201 | 0.2% |
| Guamanian / Chamorro | 40 | 0.0% |
| Guatemalan | 48 | 0.1% |
| Haitian | 3 | 0.0% |
| Honduran | 74 | 0.1% |
| Hungarian | 2,493 | 2.5% |
| Icelander | 5 | 0.0% |
| Indian (Asian) | 72 | 0.1% |
| Inupiat | 4 | 0.0% |
| Iranian | 13 | 0.0% |
| Irish | 14,011 | 14.3% |
| Iroquois | 47 | 0.1% |
| Italian | 11,113 | 11.4% |
| Jamaican | 101 | 0.1% |
| Japanese | 12 | 0.0% |
| Korean | 189 | 0.2% |
| Latvian | 15 | 0.0% |
| Lebanese | 182 | 0.2% |
| Lithuanian | 218 | 0.2% |
| Luxembourger | 15 | 0.0% |
| Macedonian | 39 | 0.0% |
| Mexican | 1,298 | 1.3% |
| Mexican American Indian | 7 | 0.0% |
| Native Hawaiian | 61 | 0.1% |
| Navajo | 5 | 0.0% |
| Nigerian | 8 | 0.0% |
| Northern European | 54 | 0.1% |
| Norwegian | 264 | 0.3% |
| Osage | 4 | 0.0% |
| Pakistani | 21 | 0.0% |
| Pennsylvania German | 2,288 | 2.3% |
| Peruvian | 54 | 0.1% |
| Polish | 3,600 | 3.7% |
| Portuguese | 172 | 0.2% |
| Potawatomi | 6 | 0.0% |
| Puerto Rican | 2,768 | 2.8% |
| Romanian | 197 | 0.2% |
| Russian | 534 | 0.5% |
| Salvadoran | 20 | 0.0% |
| Samoan | 30 | 0.0% |
| Scandinavian | 218 | 0.2% |
| Scotch-Irish | 899 | 0.9% |
| Scottish | 1,651 | 1.7% |
| Serbian | 37 | 0.0% |
| Slavic | 30 | 0.0% |
| Slovak | 845 | 0.9% |
| Slovene | 1,298 | 1.3% |
| South African | 1 | 0.0% |
| South American | 107 | 0.1% |
| Spaniard | 42 | 0.0% |
| Spanish | 159 | 0.2% |
| Sri Lankan | 107 | 0.1% |
| Subsaharan African | 96 | 0.1% |
| Swedish | 1,172 | 1.2% |
| Swiss | 376 | 0.4% |
| Thai | 71 | 0.1% |
| Trinidadian and Tobagonian | 29 | 0.0% |
| U.S. Virgin Islander | 25 | 0.0% |
| Ukrainian | 131 | 0.1% |
| Venezuelan | 47 | 0.1% |
| Welsh | 973 | 1.0% |
| West Indian | 14 | 0.0% |
| Yugoslavian | 47 | 0.1% | View All 102 Rows |
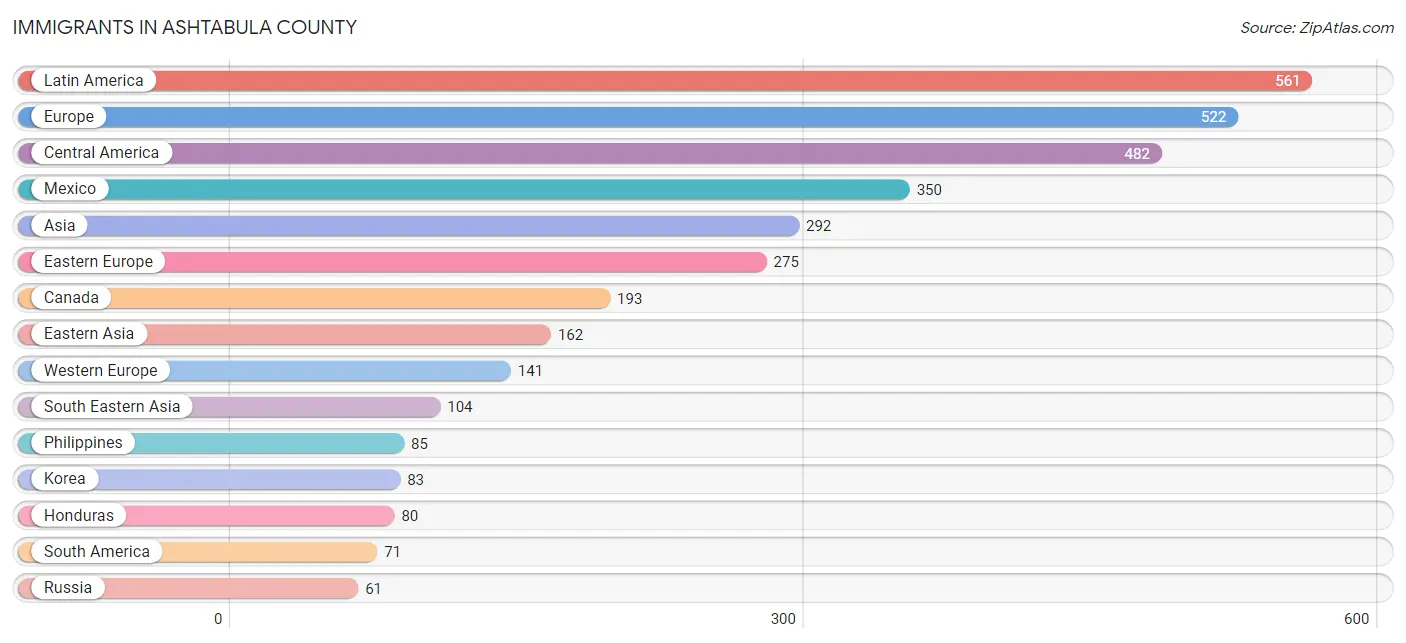
Immigrants in Ashtabula County
The most numerous immigrant groups reported in Ashtabula County came from Latin America (561 | 0.6%), Europe (522 | 0.5%), Central America (482 | 0.5%), Mexico (350 | 0.4%), and Asia (292 | 0.3%), together accounting for 2.2% of all Ashtabula County residents.
| Immigration Origin | # Population | % Population |
| Africa | 11 | 0.0% |
| Asia | 292 | 0.3% |
| Austria | 27 | 0.0% |
| Belgium | 10 | 0.0% |
| Canada | 193 | 0.2% |
| Caribbean | 8 | 0.0% |
| Central America | 482 | 0.5% |
| China | 54 | 0.1% |
| Croatia | 15 | 0.0% |
| Czechoslovakia | 46 | 0.1% |
| Eastern Africa | 7 | 0.0% |
| Eastern Asia | 162 | 0.2% |
| Eastern Europe | 275 | 0.3% |
| El Salvador | 4 | 0.0% |
| England | 18 | 0.0% |
| Europe | 522 | 0.5% |
| France | 39 | 0.0% |
| Germany | 58 | 0.1% |
| Guatemala | 48 | 0.1% |
| Honduras | 80 | 0.1% |
| Hungary | 50 | 0.1% |
| Iran | 13 | 0.0% |
| Iraq | 6 | 0.0% |
| Ireland | 5 | 0.0% |
| Italy | 53 | 0.1% |
| Jamaica | 7 | 0.0% |
| Japan | 25 | 0.0% |
| Korea | 83 | 0.1% |
| Latin America | 561 | 0.6% |
| Mexico | 350 | 0.4% |
| Nepal | 7 | 0.0% |
| Netherlands | 7 | 0.0% |
| Northern Europe | 53 | 0.1% |
| Peru | 24 | 0.0% |
| Philippines | 85 | 0.1% |
| Poland | 3 | 0.0% |
| Romania | 41 | 0.0% |
| Russia | 61 | 0.1% |
| Scotland | 30 | 0.0% |
| South Africa | 3 | 0.0% |
| South America | 71 | 0.1% |
| South Central Asia | 20 | 0.0% |
| South Eastern Asia | 104 | 0.1% |
| Southern Europe | 53 | 0.1% |
| Taiwan | 1 | 0.0% |
| Thailand | 19 | 0.0% |
| Trinidad and Tobago | 1 | 0.0% |
| Uganda | 6 | 0.0% |
| Ukraine | 22 | 0.0% |
| Venezuela | 47 | 0.1% |
| Western Asia | 6 | 0.0% |
| Western Europe | 141 | 0.1% | View All 52 Rows |
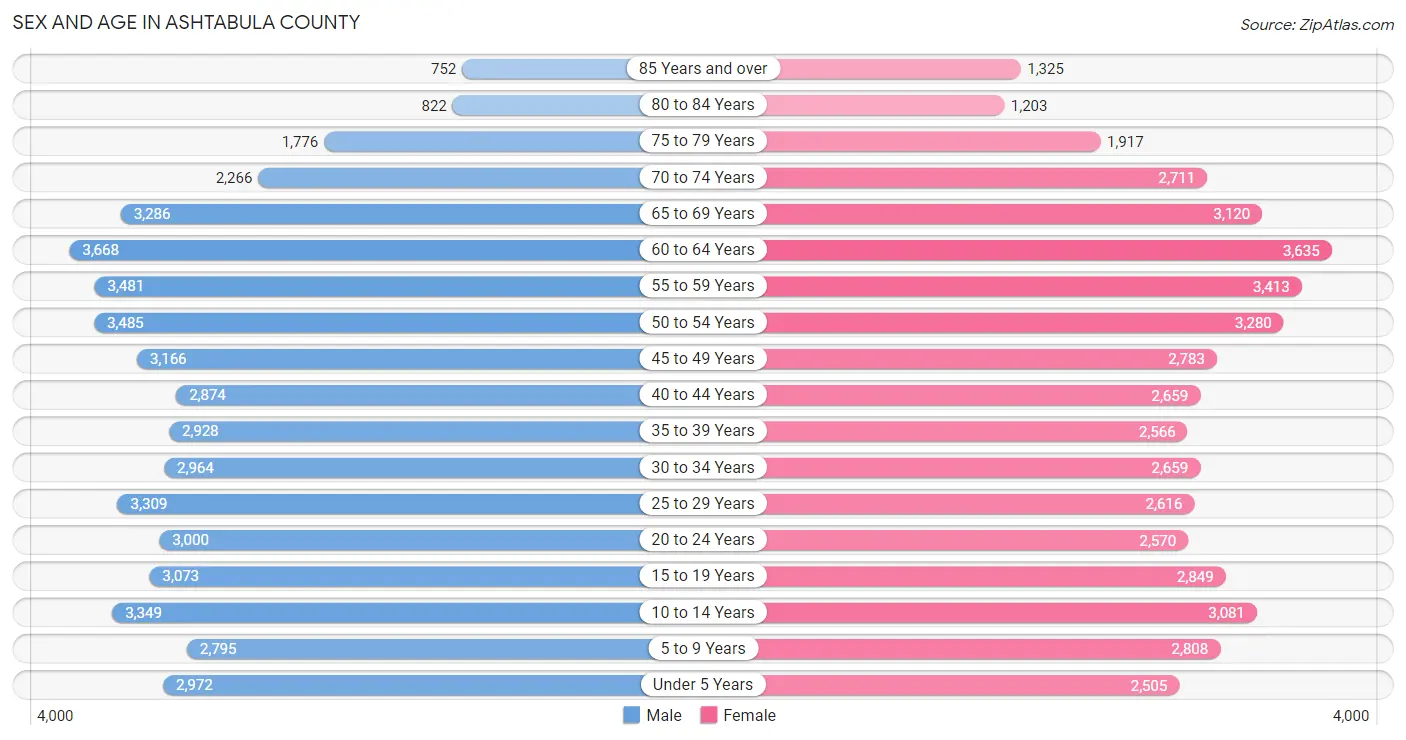
Sex and Age in Ashtabula County
Sex and Age in Ashtabula County
The most populous age groups in Ashtabula County are 60 to 64 Years (3,668 | 7.3%) for men and 60 to 64 Years (3,635 | 7.6%) for women.
| Age Bracket | Male | Female |
| Under 5 Years | 2,972 (5.9%) | 2,505 (5.2%) |
| 5 to 9 Years | 2,795 (5.6%) | 2,808 (5.9%) |
| 10 to 14 Years | 3,349 (6.7%) | 3,081 (6.5%) |
| 15 to 19 Years | 3,073 (6.1%) | 2,849 (6.0%) |
| 20 to 24 Years | 3,000 (6.0%) | 2,570 (5.4%) |
| 25 to 29 Years | 3,309 (6.6%) | 2,616 (5.5%) |
| 30 to 34 Years | 2,964 (5.9%) | 2,659 (5.6%) |
| 35 to 39 Years | 2,928 (5.9%) | 2,566 (5.4%) |
| 40 to 44 Years | 2,874 (5.8%) | 2,659 (5.6%) |
| 45 to 49 Years | 3,166 (6.3%) | 2,783 (5.8%) |
| 50 to 54 Years | 3,485 (7.0%) | 3,280 (6.9%) |
| 55 to 59 Years | 3,481 (7.0%) | 3,413 (7.2%) |
| 60 to 64 Years | 3,668 (7.3%) | 3,635 (7.6%) |
| 65 to 69 Years | 3,286 (6.6%) | 3,120 (6.5%) |
| 70 to 74 Years | 2,266 (4.5%) | 2,711 (5.7%) |
| 75 to 79 Years | 1,776 (3.5%) | 1,917 (4.0%) |
| 80 to 84 Years | 822 (1.7%) | 1,203 (2.5%) |
| 85 Years and over | 752 (1.5%) | 1,325 (2.8%) |
| Total | 49,966 (100.0%) | 47,700 (100.0%) |
Families and Households in Ashtabula County
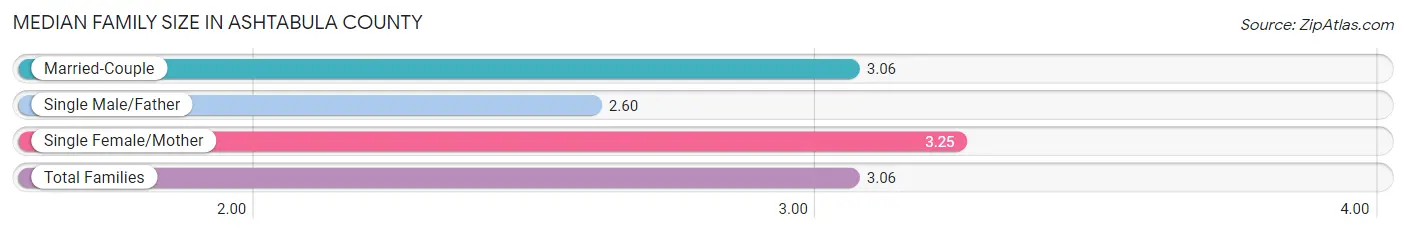
Median Family Size in Ashtabula County
The median family size in Ashtabula County is 3.06 persons per family, with single female/mother families (4,773 | 20.0%) accounting for the largest median family size of 3.25 persons per family. On the other hand, single male/father families (2,053 | 8.6%) represent the smallest median family size with 2.60 persons per family.
| Family Type | # Families | Family Size |
| Married-Couple | 17,098 (71.5%) | 3.06 |
| Single Male/Father | 2,053 (8.6%) | 2.60 |
| Single Female/Mother | 4,773 (20.0%) | 3.25 |
| Total Families | 23,924 (100.0%) | 3.06 |
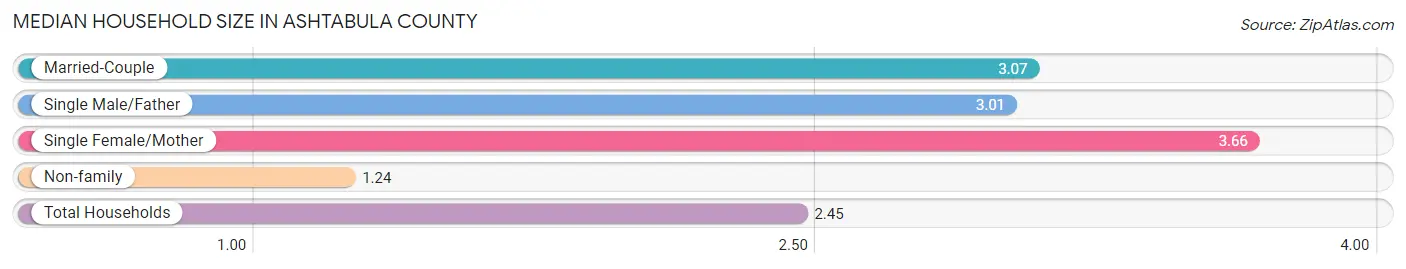
Median Household Size in Ashtabula County
The median household size in Ashtabula County is 2.45 persons per household, with single female/mother households (4,773 | 12.4%) accounting for the largest median household size of 3.66 persons per household. non-family households (14,625 | 37.9%) represent the smallest median household size with 1.24 persons per household.
| Household Type | # Households | Household Size |
| Married-Couple | 17,098 (44.4%) | 3.07 |
| Single Male/Father | 2,053 (5.3%) | 3.01 |
| Single Female/Mother | 4,773 (12.4%) | 3.66 |
| Non-family | 14,625 (37.9%) | 1.24 |
| Total Households | 38,549 (100.0%) | 2.45 |
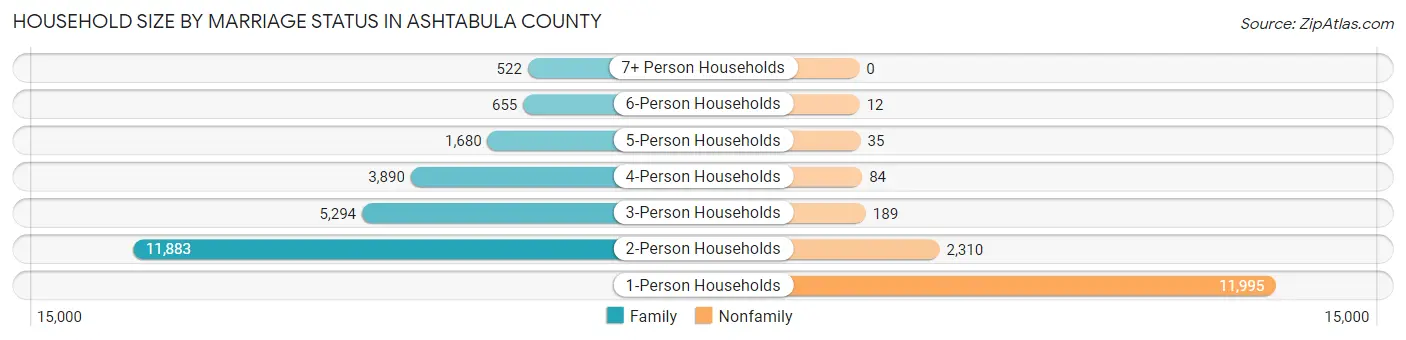
Household Size by Marriage Status in Ashtabula County
Out of a total of 38,549 households in Ashtabula County, 23,924 (62.1%) are family households, while 14,625 (37.9%) are nonfamily households. The most numerous type of family households are 2-person households, comprising 11,883, and the most common type of nonfamily households are 1-person households, comprising 11,995.
| Household Size | Family Households | Nonfamily Households |
| 1-Person Households | - | 11,995 (31.1%) |
| 2-Person Households | 11,883 (30.8%) | 2,310 (6.0%) |
| 3-Person Households | 5,294 (13.7%) | 189 (0.5%) |
| 4-Person Households | 3,890 (10.1%) | 84 (0.2%) |
| 5-Person Households | 1,680 (4.4%) | 35 (0.1%) |
| 6-Person Households | 655 (1.7%) | 12 (0.0%) |
| 7+ Person Households | 522 (1.3%) | 0 (0.0%) |
| Total | 23,924 (62.1%) | 14,625 (37.9%) |
Female Fertility in Ashtabula County
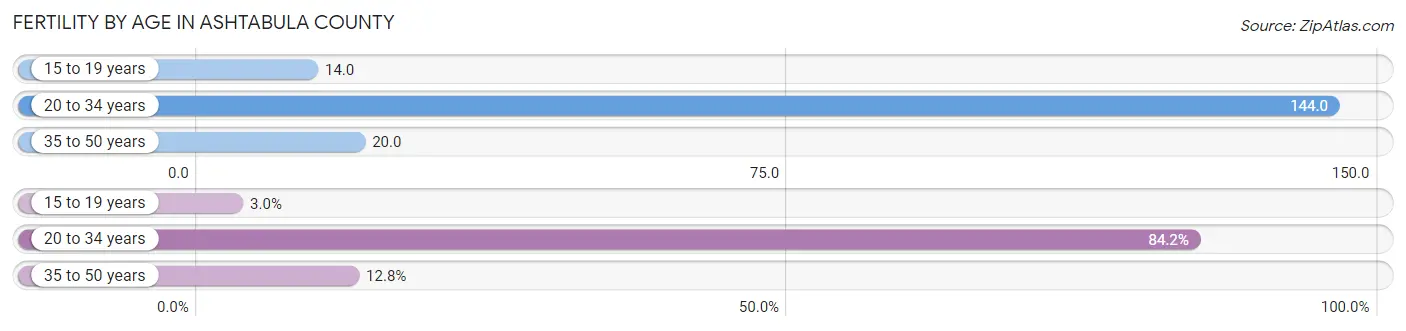
Fertility by Age in Ashtabula County
Average fertility rate in Ashtabula County is 70.0 births per 1,000 women. Women in the age bracket of 20 to 34 years have the highest fertility rate with 144.0 births per 1,000 women. Women in the age bracket of 20 to 34 years acount for 84.2% of all women with births.
| Age Bracket | Women with Births | Births / 1,000 Women |
| 15 to 19 years | 40 (3.0%) | 14.0 |
| 20 to 34 years | 1,130 (84.2%) | 144.0 |
| 35 to 50 years | 172 (12.8%) | 20.0 |
| Total | 1,342 (100.0%) | 70.0 |
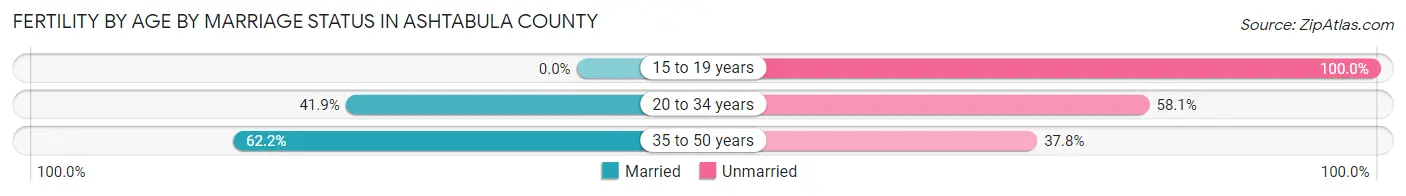
Fertility by Age by Marriage Status in Ashtabula County
43.2% of women with births (1,342) in Ashtabula County are married. The highest percentage of unmarried women with births falls into 15 to 19 years age bracket with 100.0% of them unmarried at the time of birth, while the lowest percentage of unmarried women with births belong to 35 to 50 years age bracket with 37.8% of them unmarried.
| Age Bracket | Married | Unmarried |
| 15 to 19 years | 0 (0.0%) | 40 (100.0%) |
| 20 to 34 years | 473 (41.9%) | 657 (58.1%) |
| 35 to 50 years | 107 (62.2%) | 65 (37.8%) |
| Total | 580 (43.2%) | 762 (56.8%) |
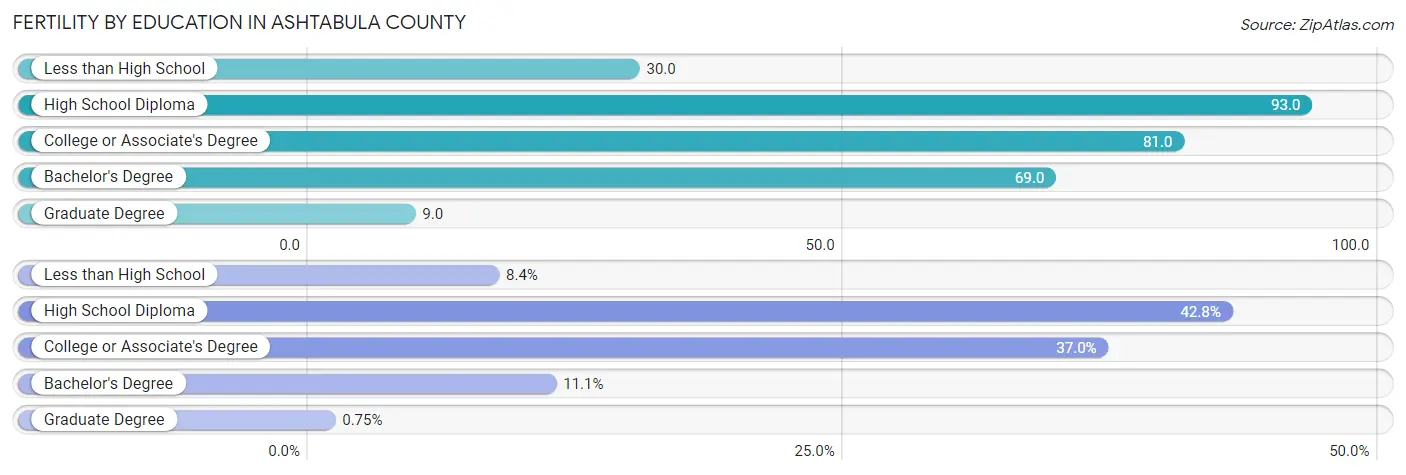
Fertility by Education in Ashtabula County
Average fertility rate in Ashtabula County is 70.0 births per 1,000 women. Women with the education attainment of high school diploma have the highest fertility rate of 93.0 births per 1,000 women, while women with the education attainment of graduate degree have the lowest fertility at 9.0 births per 1,000 women. Women with the education attainment of high school diploma represent 42.8% of all women with births.
| Educational Attainment | Women with Births | Births / 1,000 Women |
| Less than High School | 113 (8.4%) | 30.0 |
| High School Diploma | 574 (42.8%) | 93.0 |
| College or Associate's Degree | 496 (37.0%) | 81.0 |
| Bachelor's Degree | 149 (11.1%) | 69.0 |
| Graduate Degree | 10 (0.7%) | 9.0 |
| Total | 1,342 (100.0%) | 70.0 |
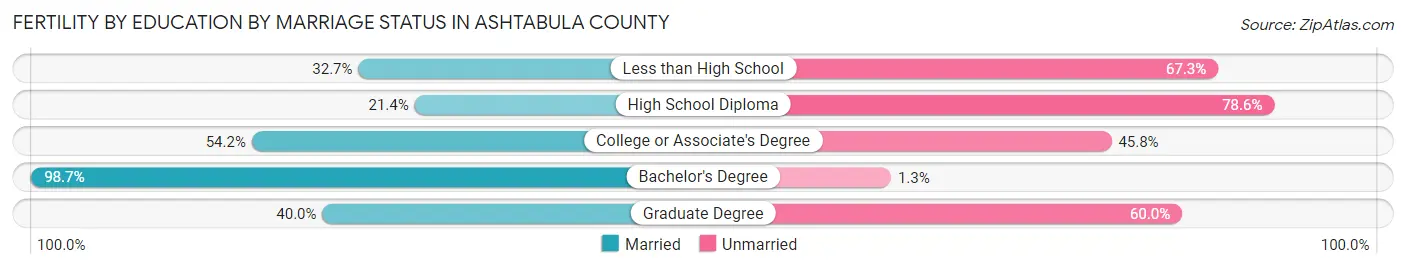
Fertility by Education by Marriage Status in Ashtabula County
56.8% of women with births in Ashtabula County are unmarried. Women with the educational attainment of bachelor's degree are most likely to be married with 98.7% of them married at childbirth, while women with the educational attainment of high school diploma are least likely to be married with 78.6% of them unmarried at childbirth.
| Educational Attainment | Married | Unmarried |
| Less than High School | 37 (32.7%) | 76 (67.3%) |
| High School Diploma | 123 (21.4%) | 451 (78.6%) |
| College or Associate's Degree | 269 (54.2%) | 227 (45.8%) |
| Bachelor's Degree | 147 (98.7%) | 2 (1.3%) |
| Graduate Degree | 4 (40.0%) | 6 (60.0%) |
| Total | 580 (43.2%) | 762 (56.8%) |
Income in Ashtabula County
Income Overview in Ashtabula County
Per Capita Income in Ashtabula County is $29,586, while median incomes of families and households are $68,475 and $53,663 respectively.
| Characteristic | Number | Measure |
| Per Capita Income | 97,666 | $29,586 |
| Median Family Income | 23,924 | $68,475 |
| Mean Family Income | 23,924 | $85,878 |
| Median Household Income | 38,549 | $53,663 |
| Mean Household Income | 38,549 | $71,398 |
| Income Deficit | 23,924 | $9,186 |
| Wage / Income Gap (%) | 97,666 | 32.12% |
| Wage / Income Gap ($) | 97,666 | 67.88¢ per $1 |
| Gini / Inequality Index | 97,666 | 0.45 |
Earnings by Sex in Ashtabula County
Average Earnings in Ashtabula County are $33,555, $41,551 for men and $28,204 for women, a difference of 32.1%.
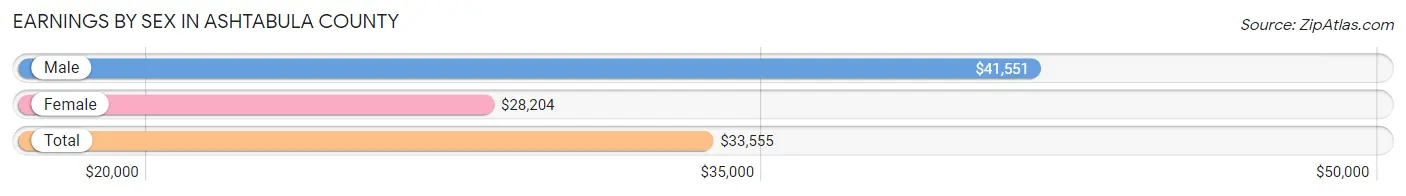
| Sex | Number | Average Earnings |
| Male | 26,323 (54.8%) | $41,551 |
| Female | 21,733 (45.2%) | $28,204 |
| Total | 48,056 (100.0%) | $33,555 |
Earnings by Sex by Income Bracket in Ashtabula County
The most common earnings brackets in Ashtabula County are $55,000 to $64,999 for men (2,463 | 9.4%) and $25,000 to $29,999 for women (1,959 | 9.0%).
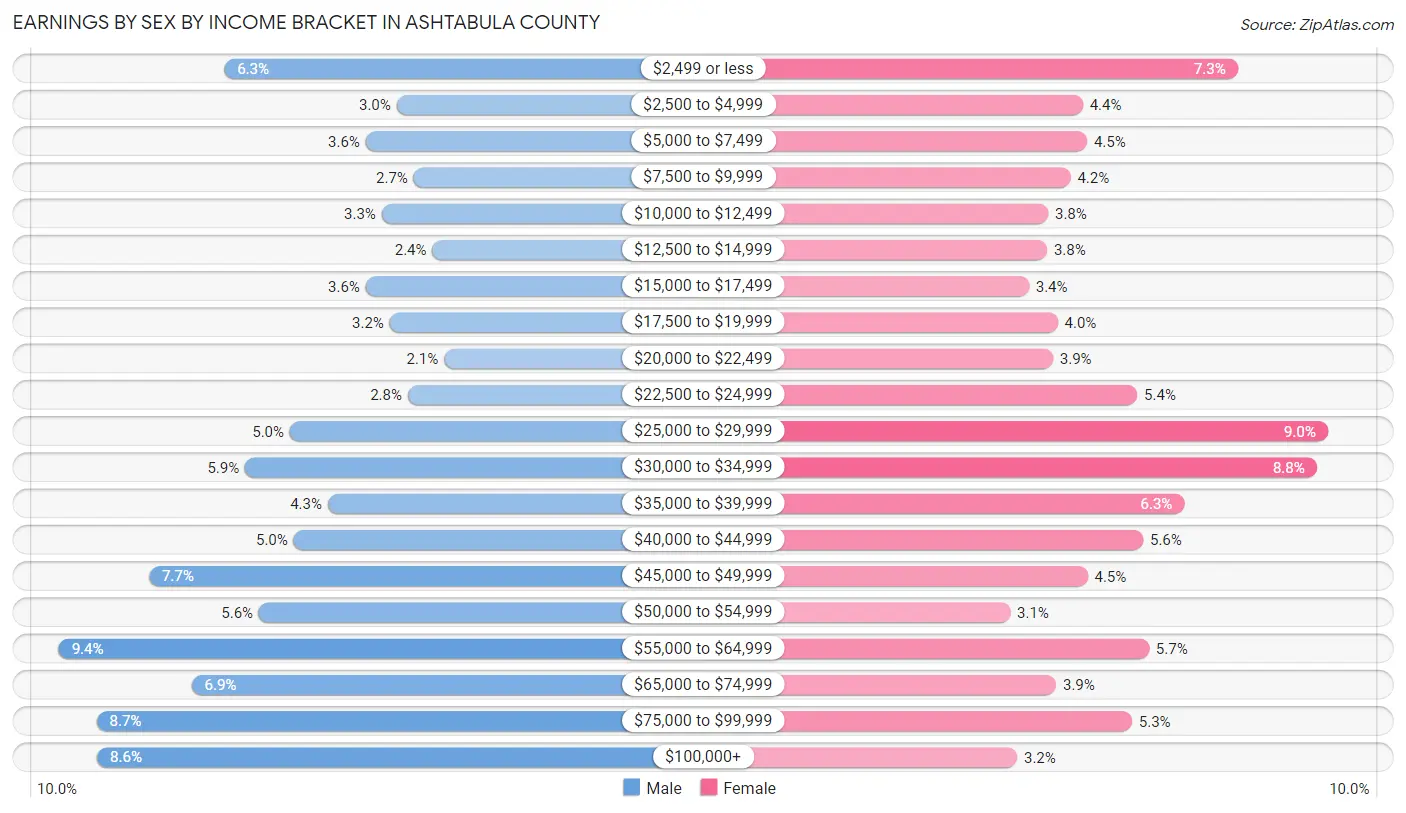
| Income | Male | Female |
| $2,499 or less | 1,649 (6.3%) | 1,591 (7.3%) |
| $2,500 to $4,999 | 797 (3.0%) | 961 (4.4%) |
| $5,000 to $7,499 | 949 (3.6%) | 978 (4.5%) |
| $7,500 to $9,999 | 713 (2.7%) | 911 (4.2%) |
| $10,000 to $12,499 | 872 (3.3%) | 819 (3.8%) |
| $12,500 to $14,999 | 622 (2.4%) | 816 (3.7%) |
| $15,000 to $17,499 | 950 (3.6%) | 741 (3.4%) |
| $17,500 to $19,999 | 832 (3.2%) | 859 (4.0%) |
| $20,000 to $22,499 | 563 (2.1%) | 838 (3.9%) |
| $22,500 to $24,999 | 743 (2.8%) | 1,183 (5.4%) |
| $25,000 to $29,999 | 1,325 (5.0%) | 1,959 (9.0%) |
| $30,000 to $34,999 | 1,545 (5.9%) | 1,913 (8.8%) |
| $35,000 to $39,999 | 1,138 (4.3%) | 1,374 (6.3%) |
| $40,000 to $44,999 | 1,305 (5.0%) | 1,207 (5.6%) |
| $45,000 to $49,999 | 2,020 (7.7%) | 981 (4.5%) |
| $50,000 to $54,999 | 1,476 (5.6%) | 664 (3.1%) |
| $55,000 to $64,999 | 2,463 (9.4%) | 1,231 (5.7%) |
| $65,000 to $74,999 | 1,809 (6.9%) | 852 (3.9%) |
| $75,000 to $99,999 | 2,278 (8.6%) | 1,161 (5.3%) |
| $100,000+ | 2,274 (8.6%) | 694 (3.2%) |
| Total | 26,323 (100.0%) | 21,733 (100.0%) |
Earnings by Sex by Educational Attainment in Ashtabula County
Average earnings in Ashtabula County are $46,780 for men and $31,778 for women, a difference of 32.1%. Men with an educational attainment of graduate degree enjoy the highest average annual earnings of $83,972, while those with less than high school education earn the least with $42,676. Women with an educational attainment of graduate degree earn the most with the average annual earnings of $71,214, while those with less than high school education have the smallest earnings of $23,701.
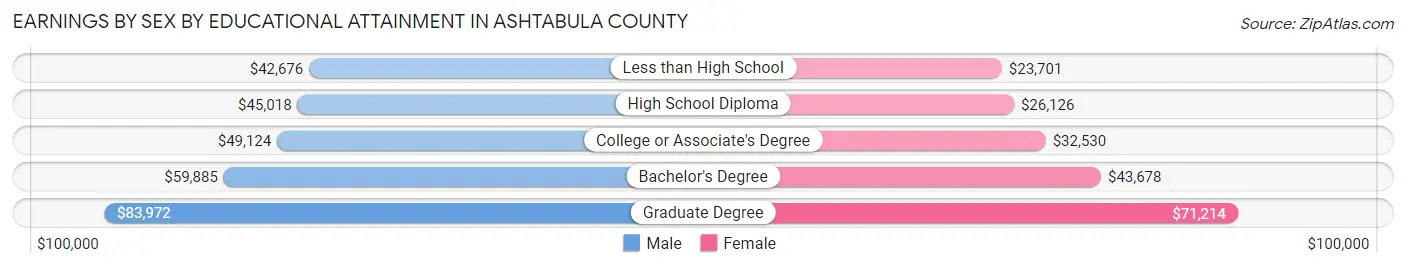
| Educational Attainment | Male Income | Female Income |
| Less than High School | $42,676 | $23,701 |
| High School Diploma | $45,018 | $26,126 |
| College or Associate's Degree | $49,124 | $32,530 |
| Bachelor's Degree | $59,885 | $43,678 |
| Graduate Degree | $83,972 | $71,214 |
| Total | $46,780 | $31,778 |
Family Income in Ashtabula County
Family Income Brackets in Ashtabula County
According to the Ashtabula County family income data, there are 4,713 families falling into the $50,000 to $74,999 income range, which is the most common income bracket and makes up 19.7% of all families. Conversely, the less than $10,000 income bracket is the least frequent group with only 933 families (3.9%) belonging to this category.
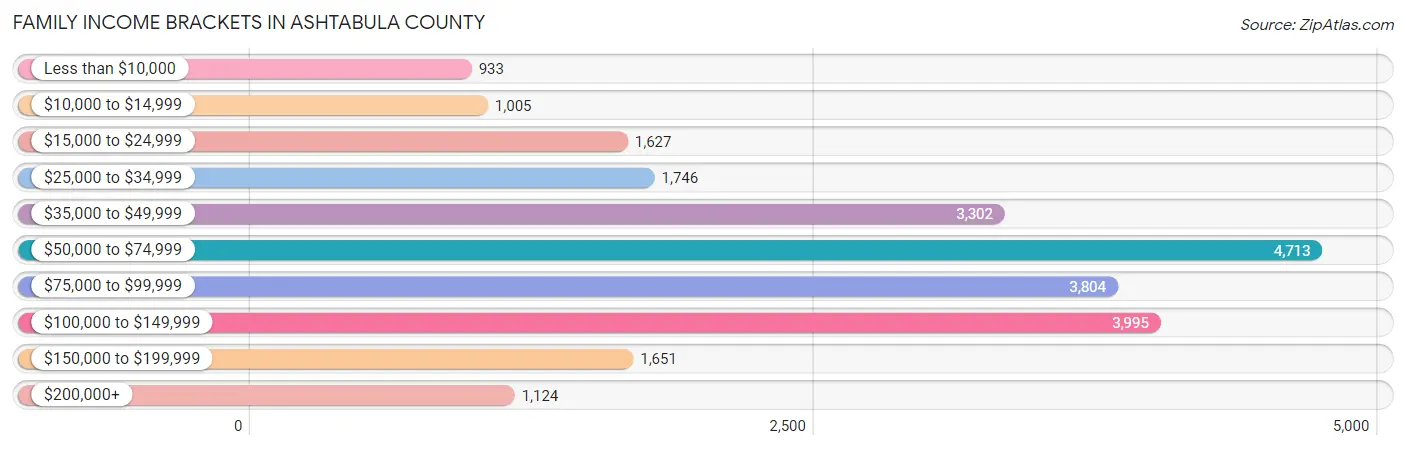
| Income Bracket | # Families | % Families |
| Less than $10,000 | 933 | 3.9% |
| $10,000 to $14,999 | 1,005 | 4.2% |
| $15,000 to $24,999 | 1,627 | 6.8% |
| $25,000 to $34,999 | 1,746 | 7.3% |
| $35,000 to $49,999 | 3,302 | 13.8% |
| $50,000 to $74,999 | 4,713 | 19.7% |
| $75,000 to $99,999 | 3,804 | 15.9% |
| $100,000 to $149,999 | 3,995 | 16.7% |
| $150,000 to $199,999 | 1,651 | 6.9% |
| $200,000+ | 1,124 | 4.7% |
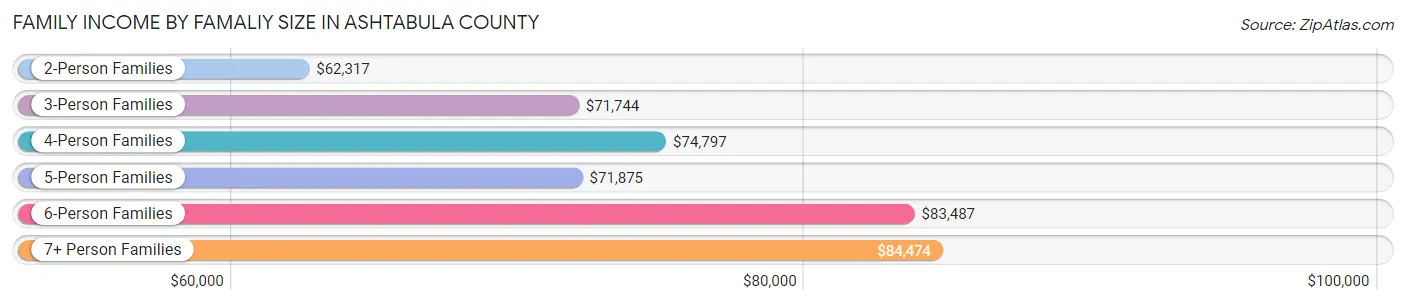
Family Income by Famaliy Size in Ashtabula County
7+ person families (472 | 2.0%) account for the highest median family income in Ashtabula County with $84,474 per family, while 2-person families (12,894 | 53.9%) have the highest median income of $31,158 per family member.
| Income Bracket | # Families | Median Income |
| 2-Person Families | 12,894 (53.9%) | $62,317 |
| 3-Person Families | 5,214 (21.8%) | $71,744 |
| 4-Person Families | 3,289 (13.8%) | $74,797 |
| 5-Person Families | 1,515 (6.3%) | $71,875 |
| 6-Person Families | 540 (2.3%) | $83,487 |
| 7+ Person Families | 472 (2.0%) | $84,474 |
| Total | 23,924 (100.0%) | $68,475 |
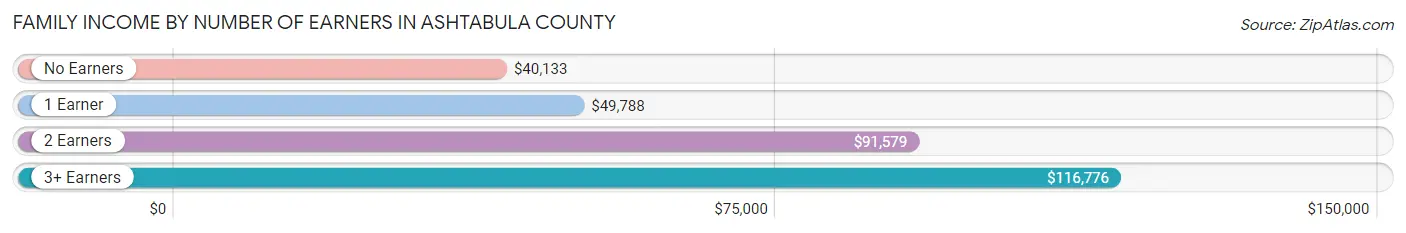
Family Income by Number of Earners in Ashtabula County
The median family income in Ashtabula County is $68,475, with families comprising 3+ earners (2,295) having the highest median family income of $116,776, while families with no earners (5,107) have the lowest median family income of $40,133, accounting for 9.6% and 21.3% of families, respectively.
| Number of Earners | # Families | Median Income |
| No Earners | 5,107 (21.3%) | $40,133 |
| 1 Earner | 8,060 (33.7%) | $49,788 |
| 2 Earners | 8,462 (35.4%) | $91,579 |
| 3+ Earners | 2,295 (9.6%) | $116,776 |
| Total | 23,924 (100.0%) | $68,475 |
Household Income in Ashtabula County
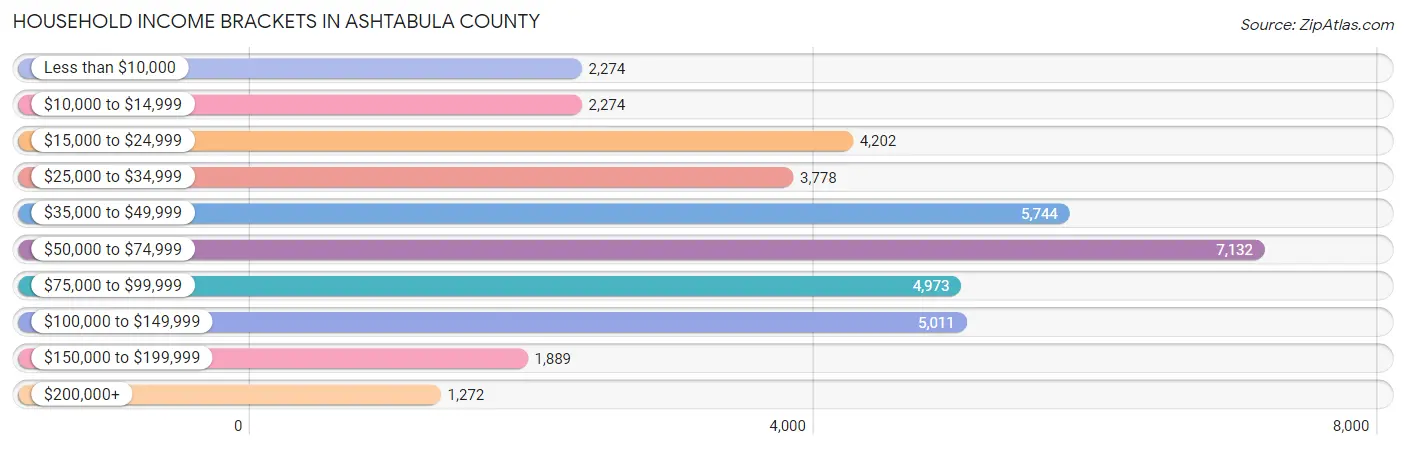
Household Income Brackets in Ashtabula County
With 7,132 households falling in the category, the $50,000 to $74,999 income range is the most frequent in Ashtabula County, accounting for 18.5% of all households. In contrast, only 1,272 households (3.3%) fall into the $200,000+ income bracket, making it the least populous group.
| Income Bracket | # Households | % Households |
| Less than $10,000 | 2,274 | 5.9% |
| $10,000 to $14,999 | 2,274 | 5.9% |
| $15,000 to $24,999 | 4,202 | 10.9% |
| $25,000 to $34,999 | 3,778 | 9.8% |
| $35,000 to $49,999 | 5,744 | 14.9% |
| $50,000 to $74,999 | 7,132 | 18.5% |
| $75,000 to $99,999 | 4,973 | 12.9% |
| $100,000 to $149,999 | 5,011 | 13.0% |
| $150,000 to $199,999 | 1,889 | 4.9% |
| $200,000+ | 1,272 | 3.3% |
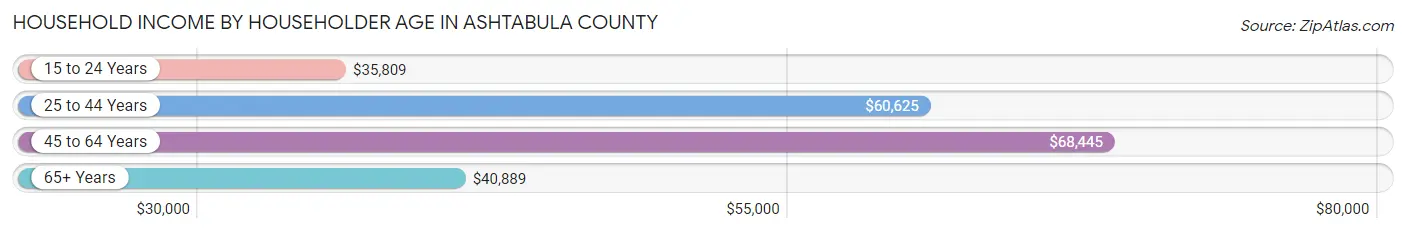
Household Income by Householder Age in Ashtabula County
The median household income in Ashtabula County is $53,663, with the highest median household income of $68,445 found in the 45 to 64 years age bracket for the primary householder. A total of 15,141 households (39.3%) fall into this category. Meanwhile, the 15 to 24 years age bracket for the primary householder has the lowest median household income of $35,809, with 1,254 households (3.3%) in this group.
| Income Bracket | # Households | Median Income |
| 15 to 24 Years | 1,254 (3.3%) | $35,809 |
| 25 to 44 Years | 9,928 (25.8%) | $60,625 |
| 45 to 64 Years | 15,141 (39.3%) | $68,445 |
| 65+ Years | 12,226 (31.7%) | $40,889 |
| Total | 38,549 (100.0%) | $53,663 |
Poverty in Ashtabula County
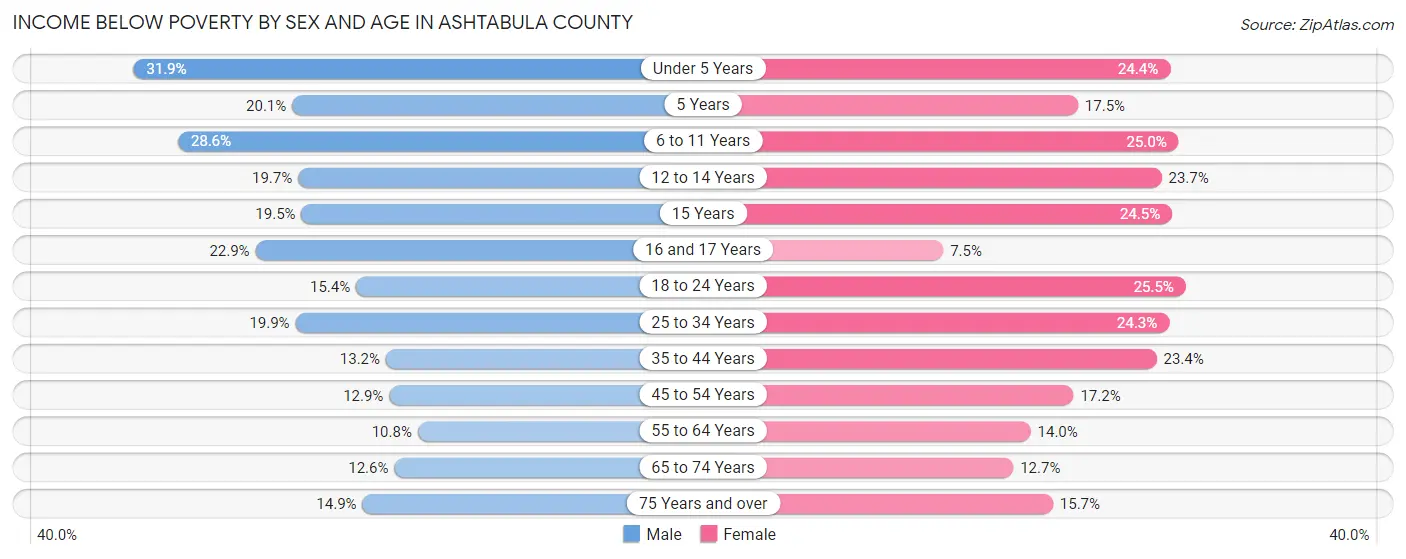
Income Below Poverty by Sex and Age in Ashtabula County
With 16.8% poverty level for males and 19.3% for females among the residents of Ashtabula County, under 5 year old males and 18 to 24 year old females are the most vulnerable to poverty, with 934 males (31.9%) and 896 females (25.5%) in their respective age groups living below the poverty level.
| Age Bracket | Male | Female |
| Under 5 Years | 934 (31.9%) | 606 (24.4%) |
| 5 Years | 112 (20.1%) | 88 (17.5%) |
| 6 to 11 Years | 965 (28.6%) | 865 (25.0%) |
| 12 to 14 Years | 415 (19.7%) | 429 (23.7%) |
| 15 Years | 120 (19.5%) | 180 (24.5%) |
| 16 and 17 Years | 296 (22.9%) | 88 (7.5%) |
| 18 to 24 Years | 600 (15.4%) | 896 (25.5%) |
| 25 to 34 Years | 1,140 (19.9%) | 1,282 (24.3%) |
| 35 to 44 Years | 701 (13.2%) | 1,221 (23.4%) |
| 45 to 54 Years | 819 (12.9%) | 1,043 (17.2%) |
| 55 to 64 Years | 753 (10.8%) | 972 (14.0%) |
| 65 to 74 Years | 670 (12.6%) | 730 (12.7%) |
| 75 Years and over | 474 (14.9%) | 625 (15.7%) |
| Total | 7,999 (16.8%) | 9,025 (19.3%) |
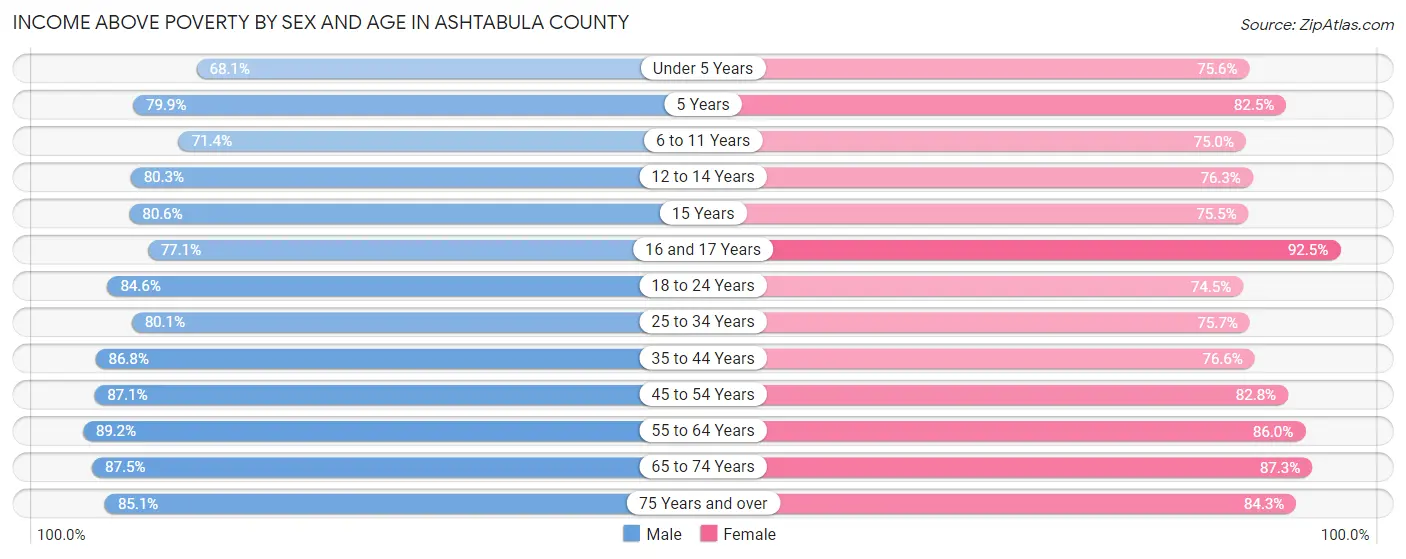
Income Above Poverty by Sex and Age in Ashtabula County
According to the poverty statistics in Ashtabula County, males aged 55 to 64 years and females aged 16 and 17 years are the age groups that are most secure financially, with 89.2% of males and 92.5% of females in these age groups living above the poverty line.
| Age Bracket | Male | Female |
| Under 5 Years | 1,992 (68.1%) | 1,881 (75.6%) |
| 5 Years | 444 (79.9%) | 414 (82.5%) |
| 6 to 11 Years | 2,407 (71.4%) | 2,593 (75.0%) |
| 12 to 14 Years | 1,692 (80.3%) | 1,378 (76.3%) |
| 15 Years | 497 (80.5%) | 554 (75.5%) |
| 16 and 17 Years | 999 (77.1%) | 1,080 (92.5%) |
| 18 to 24 Years | 3,298 (84.6%) | 2,613 (74.5%) |
| 25 to 34 Years | 4,592 (80.1%) | 3,993 (75.7%) |
| 35 to 44 Years | 4,616 (86.8%) | 4,004 (76.6%) |
| 45 to 54 Years | 5,514 (87.1%) | 5,020 (82.8%) |
| 55 to 64 Years | 6,212 (89.2%) | 5,960 (86.0%) |
| 65 to 74 Years | 4,670 (87.5%) | 5,003 (87.3%) |
| 75 Years and over | 2,702 (85.1%) | 3,363 (84.3%) |
| Total | 39,635 (83.2%) | 37,856 (80.7%) |
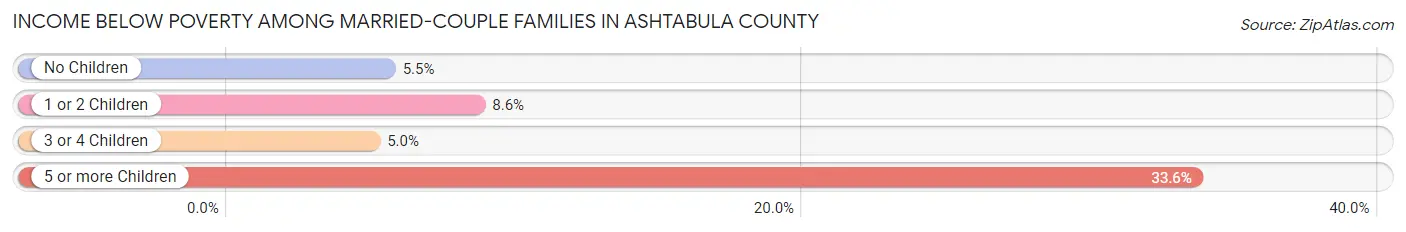
Income Below Poverty Among Married-Couple Families in Ashtabula County
The poverty statistics for married-couple families in Ashtabula County show that 6.6% or 1,134 of the total 17,098 families live below the poverty line. Families with 5 or more children have the highest poverty rate of 33.6%, comprising of 78 families. On the other hand, families with 3 or 4 children have the lowest poverty rate of 5.0%, which includes 59 families.
| Children | Above Poverty | Below Poverty |
| No Children | 10,688 (94.5%) | 621 (5.5%) |
| 1 or 2 Children | 3,989 (91.4%) | 376 (8.6%) |
| 3 or 4 Children | 1,133 (95.1%) | 59 (5.0%) |
| 5 or more Children | 154 (66.4%) | 78 (33.6%) |
| Total | 15,964 (93.4%) | 1,134 (6.6%) |
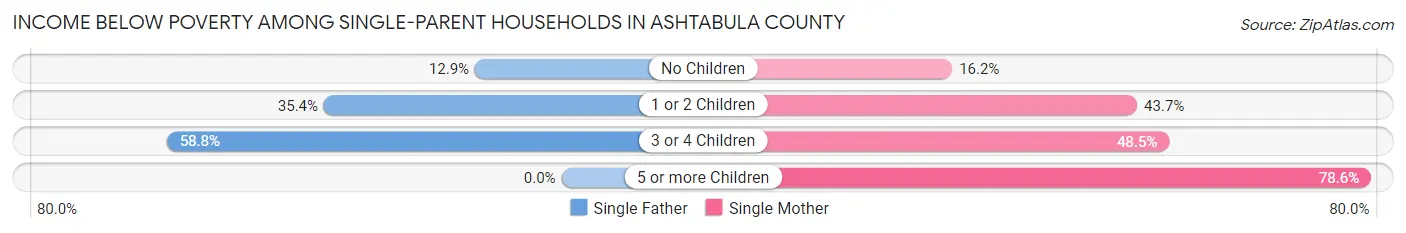
Income Below Poverty Among Single-Parent Households in Ashtabula County
According to the poverty data in Ashtabula County, 28.4% or 583 single-father households and 35.0% or 1,672 single-mother households are living below the poverty line. Among single-father households, those with 3 or 4 children have the highest poverty rate, with 60 households (58.8%) experiencing poverty. Likewise, among single-mother households, those with 5 or more children have the highest poverty rate, with 44 households (78.6%) falling below the poverty line.
| Children | Single Father | Single Mother |
| No Children | 96 (12.9%) | 271 (16.2%) |
| 1 or 2 Children | 427 (35.4%) | 1,082 (43.7%) |
| 3 or 4 Children | 60 (58.8%) | 275 (48.5%) |
| 5 or more Children | 0 (0.0%) | 44 (78.6%) |
| Total | 583 (28.4%) | 1,672 (35.0%) |
Income Below Poverty Among Married-Couple vs Single-Parent Households in Ashtabula County
The poverty data for Ashtabula County shows that 1,134 of the married-couple family households (6.6%) and 2,255 of the single-parent households (33.0%) are living below the poverty level. Within the married-couple family households, those with 5 or more children have the highest poverty rate, with 78 households (33.6%) falling below the poverty line. Among the single-parent households, those with 5 or more children have the highest poverty rate, with 44 household (78.6%) living below poverty.
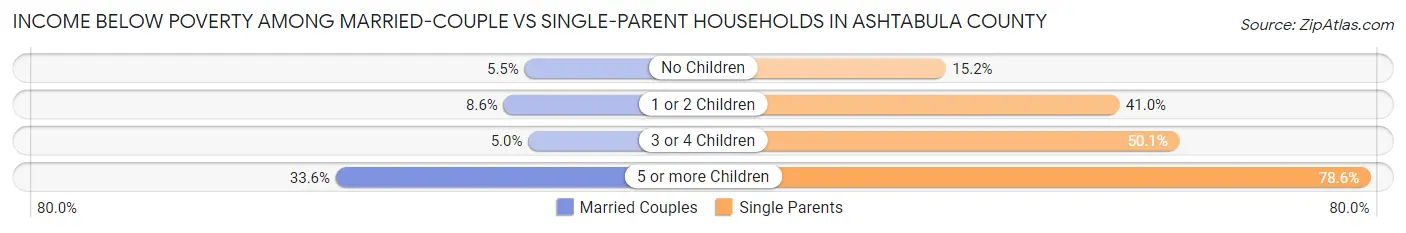
| Children | Married-Couple Families | Single-Parent Households |
| No Children | 621 (5.5%) | 367 (15.2%) |
| 1 or 2 Children | 376 (8.6%) | 1,509 (41.0%) |
| 3 or 4 Children | 59 (5.0%) | 335 (50.1%) |
| 5 or more Children | 78 (33.6%) | 44 (78.6%) |
| Total | 1,134 (6.6%) | 2,255 (33.0%) |
Employment Characteristics in Ashtabula County
Employment by Class of Employer in Ashtabula County
Among the 40,922 employed individuals in Ashtabula County, private company employees (30,102 | 73.6%), local government employees (3,034 | 7.4%), and not-for-profit organizations (2,981 | 7.3%) make up the most common classes of employment.
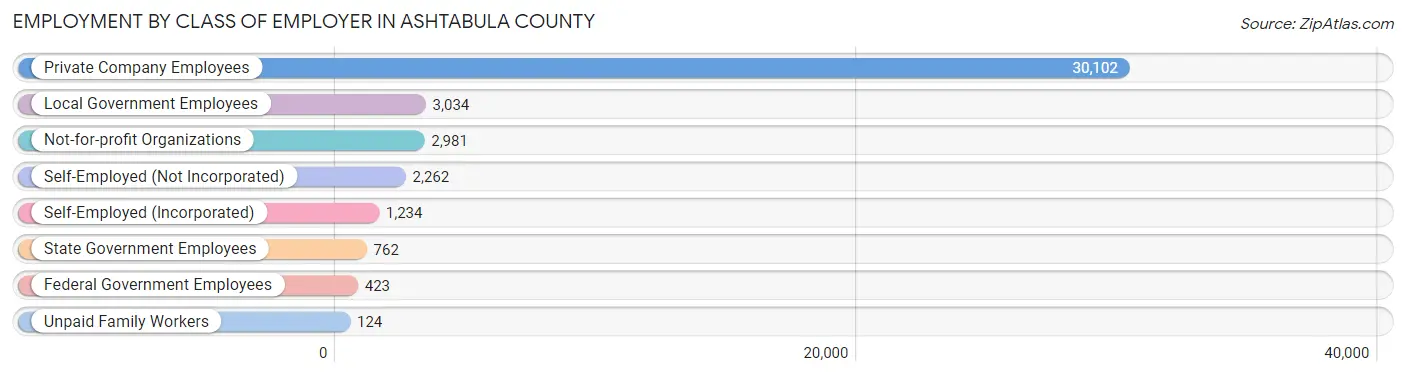
| Employer Class | # Employees | % Employees |
| Private Company Employees | 30,102 | 73.6% |
| Self-Employed (Incorporated) | 1,234 | 3.0% |
| Self-Employed (Not Incorporated) | 2,262 | 5.5% |
| Not-for-profit Organizations | 2,981 | 7.3% |
| Local Government Employees | 3,034 | 7.4% |
| State Government Employees | 762 | 1.9% |
| Federal Government Employees | 423 | 1.0% |
| Unpaid Family Workers | 124 | 0.3% |
| Total | 40,922 | 100.0% |
Employment Status by Age in Ashtabula County
According to the labor force statistics for Ashtabula County, out of the total population over 16 years of age (78,803), 57.9% or 45,627 individuals are in the labor force, with 7.6% or 3,468 of them unemployed. The age group with the highest labor force participation rate is 20 to 24 years, with 85.8% or 4,779 individuals in the labor force. Within the labor force, the 25 to 29 years age range has the highest percentage of unemployed individuals, with 16.5% or 744 of them being unemployed.
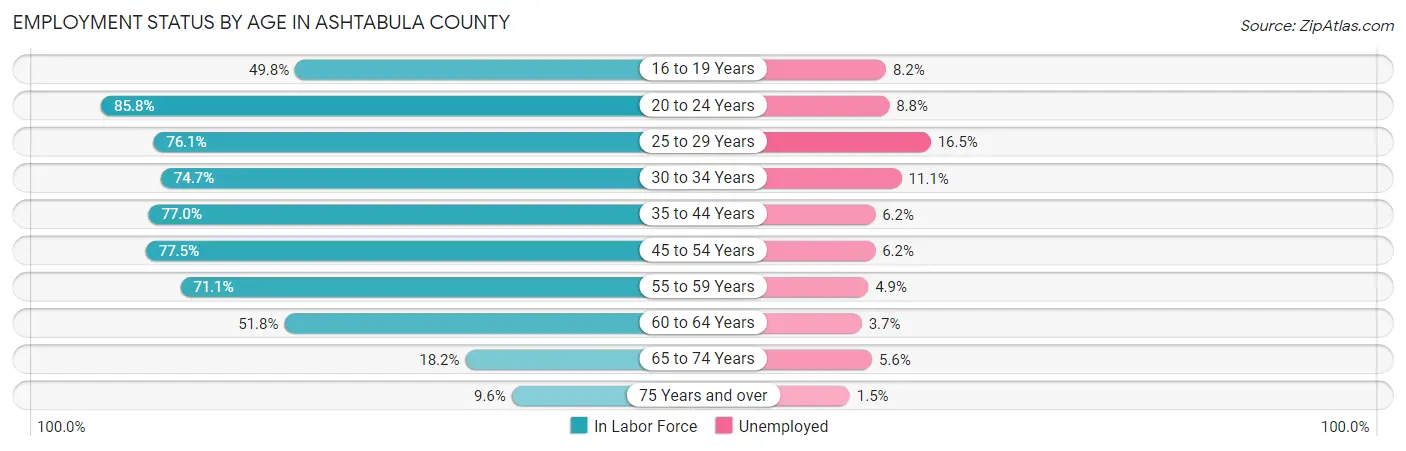
| Age Bracket | In Labor Force | Unemployed |
| 16 to 19 Years | 2,275 (49.8%) | 187 (8.2%) |
| 20 to 24 Years | 4,779 (85.8%) | 421 (8.8%) |
| 25 to 29 Years | 4,509 (76.1%) | 744 (16.5%) |
| 30 to 34 Years | 4,200 (74.7%) | 466 (11.1%) |
| 35 to 44 Years | 8,491 (77.0%) | 526 (6.2%) |
| 45 to 54 Years | 9,853 (77.5%) | 611 (6.2%) |
| 55 to 59 Years | 4,902 (71.1%) | 240 (4.9%) |
| 60 to 64 Years | 3,783 (51.8%) | 140 (3.7%) |
| 65 to 74 Years | 2,072 (18.2%) | 116 (5.6%) |
| 75 Years and over | 748 (9.6%) | 11 (1.5%) |
| Total | 45,627 (57.9%) | 3,468 (7.6%) |
Employment Status by Educational Attainment in Ashtabula County
According to labor force statistics for Ashtabula County, 72.2% of individuals (35,729) out of the total population between 25 and 64 years of age (49,486) are in the labor force, with 7.6% or 2,715 of them being unemployed. The group with the highest labor force participation rate are those with the educational attainment of bachelor's degree or higher, with 84.3% or 6,548 individuals in the labor force. Within the labor force, individuals with less than high school education have the highest percentage of unemployment, with 18.1% or 606 of them being unemployed.
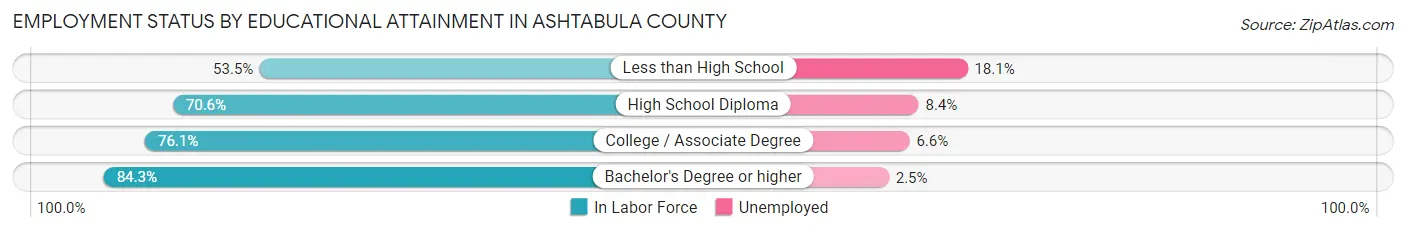
| Educational Attainment | In Labor Force | Unemployed |
| Less than High School | 3,350 (53.5%) | 1,133 (18.1%) |
| High School Diploma | 14,529 (70.6%) | 1,729 (8.4%) |
| College / Associate Degree | 11,321 (76.1%) | 982 (6.6%) |
| Bachelor's Degree or higher | 6,548 (84.3%) | 194 (2.5%) |
| Total | 35,729 (72.2%) | 3,761 (7.6%) |
Employment Occupations by Sex in Ashtabula County
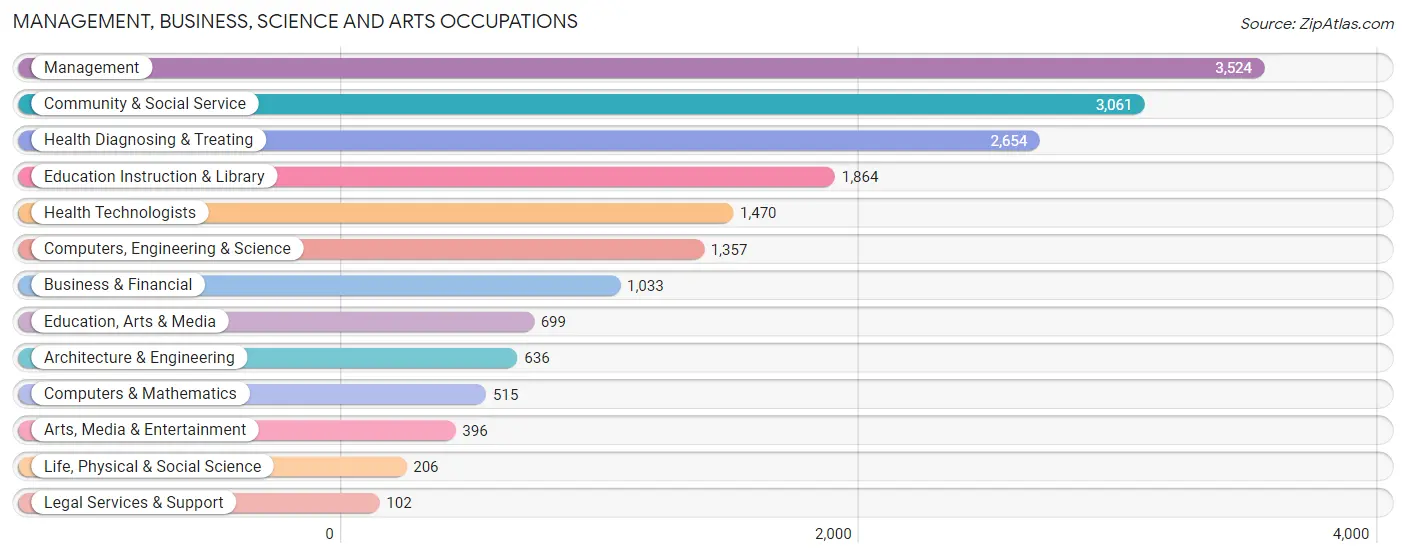
Management, Business, Science and Arts Occupations
The most common Management, Business, Science and Arts occupations in Ashtabula County are Management (3,524 | 8.4%), Community & Social Service (3,061 | 7.3%), Health Diagnosing & Treating (2,654 | 6.3%), Education Instruction & Library (1,864 | 4.4%), and Health Technologists (1,470 | 3.5%).
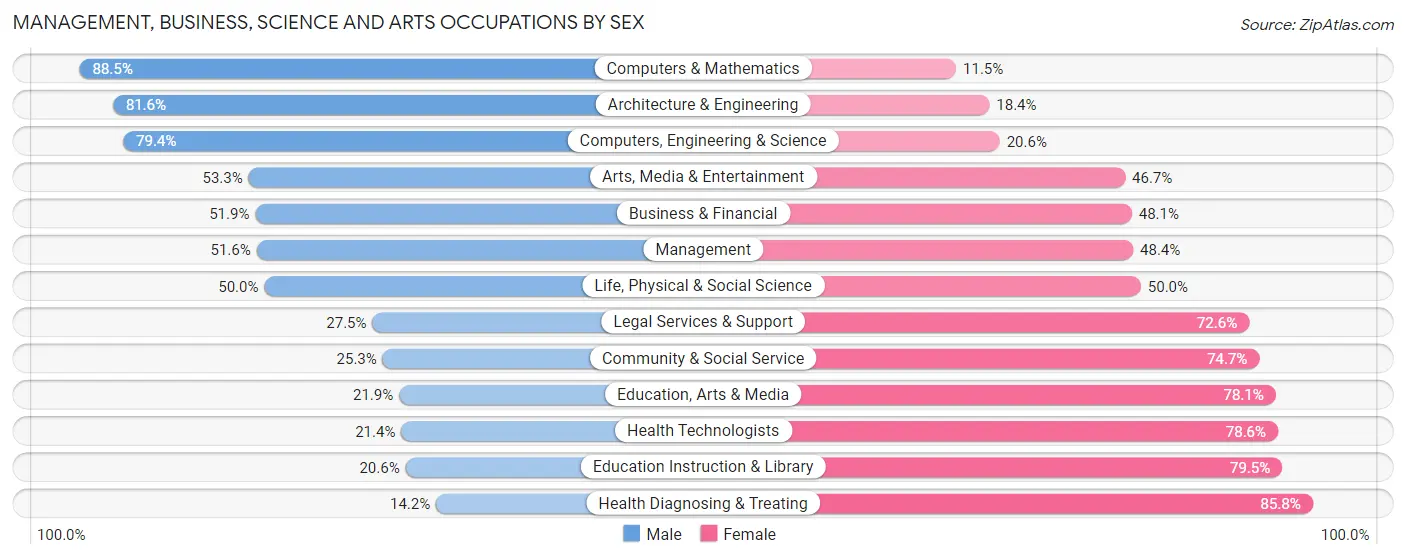
Management, Business, Science and Arts Occupations by Sex
Within the Management, Business, Science and Arts occupations in Ashtabula County, the most male-oriented occupations are Computers & Mathematics (88.5%), Architecture & Engineering (81.6%), and Computers, Engineering & Science (79.4%), while the most female-oriented occupations are Health Diagnosing & Treating (85.8%), Education Instruction & Library (79.4%), and Health Technologists (78.6%).
| Occupation | Male | Female |
| Management | 1,819 (51.6%) | 1,705 (48.4%) |
| Business & Financial | 536 (51.9%) | 497 (48.1%) |
| Computers, Engineering & Science | 1,078 (79.4%) | 279 (20.6%) |
| Computers & Mathematics | 456 (88.5%) | 59 (11.5%) |
| Architecture & Engineering | 519 (81.6%) | 117 (18.4%) |
| Life, Physical & Social Science | 103 (50.0%) | 103 (50.0%) |
| Community & Social Service | 775 (25.3%) | 2,286 (74.7%) |
| Education, Arts & Media | 153 (21.9%) | 546 (78.1%) |
| Legal Services & Support | 28 (27.5%) | 74 (72.6%) |
| Education Instruction & Library | 383 (20.5%) | 1,481 (79.4%) |
| Arts, Media & Entertainment | 211 (53.3%) | 185 (46.7%) |
| Health Diagnosing & Treating | 376 (14.2%) | 2,278 (85.8%) |
| Health Technologists | 315 (21.4%) | 1,155 (78.6%) |
| Total (Category) | 4,584 (39.4%) | 7,045 (60.6%) |
| Total (Overall) | 22,845 (54.2%) | 19,291 (45.8%) |
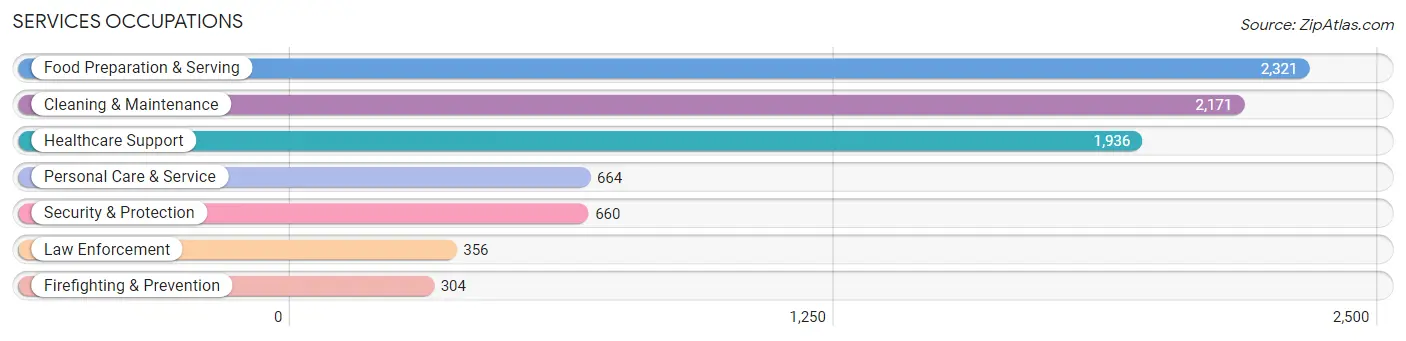
Services Occupations
The most common Services occupations in Ashtabula County are Food Preparation & Serving (2,321 | 5.5%), Cleaning & Maintenance (2,171 | 5.1%), Healthcare Support (1,936 | 4.6%), Personal Care & Service (664 | 1.6%), and Security & Protection (660 | 1.6%).
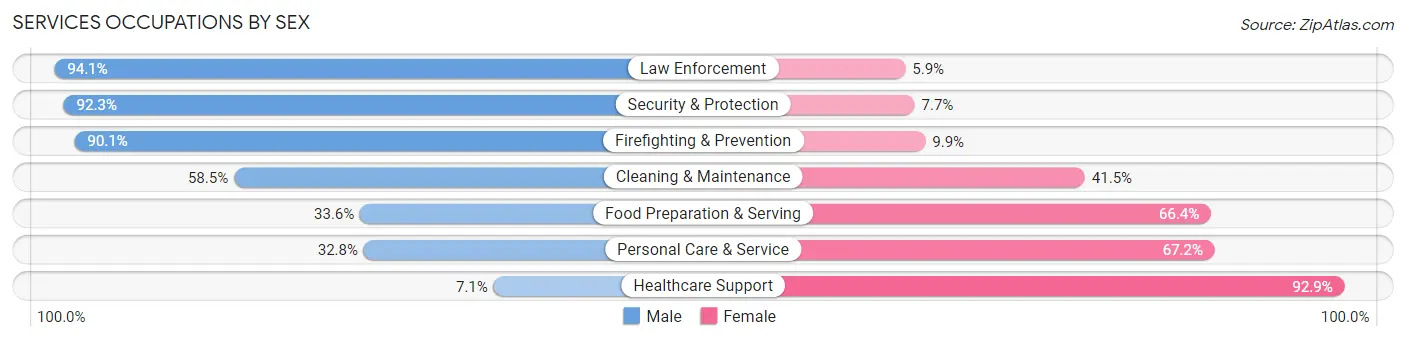
Services Occupations by Sex
Within the Services occupations in Ashtabula County, the most male-oriented occupations are Law Enforcement (94.1%), Security & Protection (92.3%), and Firefighting & Prevention (90.1%), while the most female-oriented occupations are Healthcare Support (92.9%), Personal Care & Service (67.2%), and Food Preparation & Serving (66.4%).
| Occupation | Male | Female |
| Healthcare Support | 138 (7.1%) | 1,798 (92.9%) |
| Security & Protection | 609 (92.3%) | 51 (7.7%) |
| Firefighting & Prevention | 274 (90.1%) | 30 (9.9%) |
| Law Enforcement | 335 (94.1%) | 21 (5.9%) |
| Food Preparation & Serving | 779 (33.6%) | 1,542 (66.4%) |
| Cleaning & Maintenance | 1,271 (58.5%) | 900 (41.5%) |
| Personal Care & Service | 218 (32.8%) | 446 (67.2%) |
| Total (Category) | 3,015 (38.9%) | 4,737 (61.1%) |
| Total (Overall) | 22,845 (54.2%) | 19,291 (45.8%) |
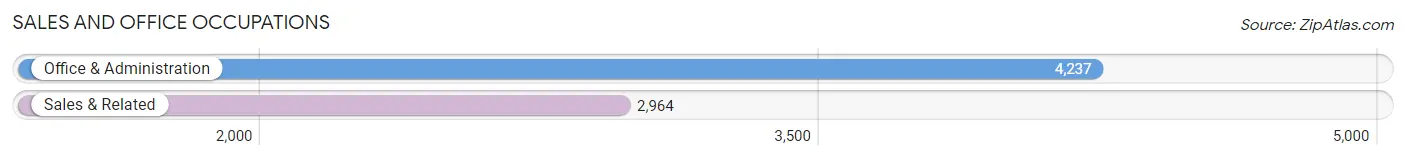
Sales and Office Occupations
The most common Sales and Office occupations in Ashtabula County are Office & Administration (4,237 | 10.1%), and Sales & Related (2,964 | 7.0%).
Sales and Office Occupations by Sex

| Occupation | Male | Female |
| Sales & Related | 1,303 (44.0%) | 1,661 (56.0%) |
| Office & Administration | 1,115 (26.3%) | 3,122 (73.7%) |
| Total (Category) | 2,418 (33.6%) | 4,783 (66.4%) |
| Total (Overall) | 22,845 (54.2%) | 19,291 (45.8%) |
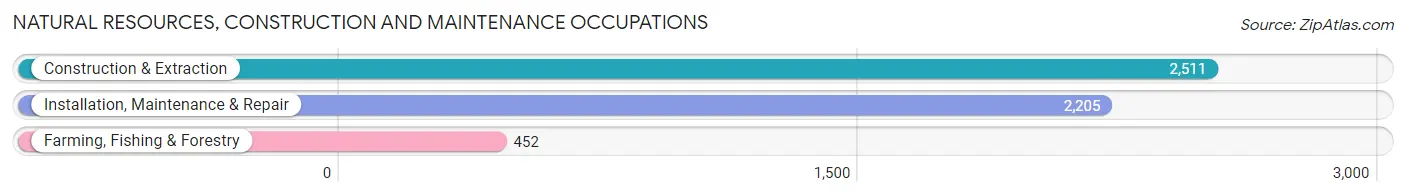
Natural Resources, Construction and Maintenance Occupations
The most common Natural Resources, Construction and Maintenance occupations in Ashtabula County are Construction & Extraction (2,511 | 6.0%), Installation, Maintenance & Repair (2,205 | 5.2%), and Farming, Fishing & Forestry (452 | 1.1%).
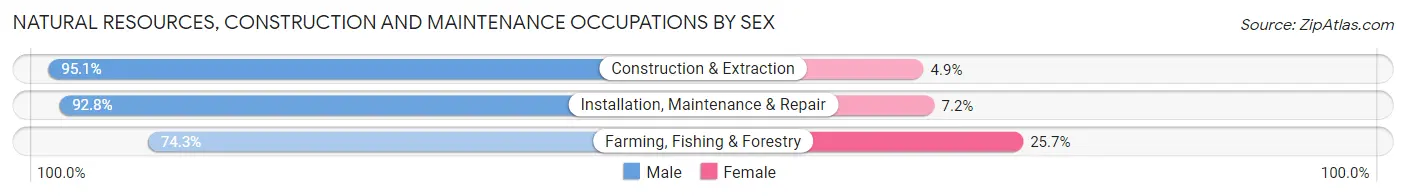
Natural Resources, Construction and Maintenance Occupations by Sex
| Occupation | Male | Female |
| Farming, Fishing & Forestry | 336 (74.3%) | 116 (25.7%) |
| Construction & Extraction | 2,387 (95.1%) | 124 (4.9%) |
| Installation, Maintenance & Repair | 2,046 (92.8%) | 159 (7.2%) |
| Total (Category) | 4,769 (92.3%) | 399 (7.7%) |
| Total (Overall) | 22,845 (54.2%) | 19,291 (45.8%) |
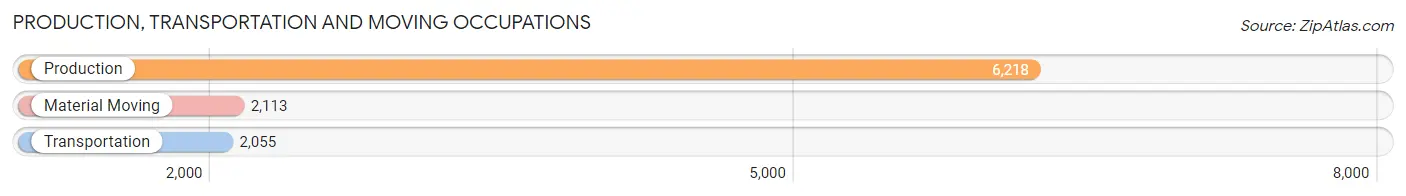
Production, Transportation and Moving Occupations
The most common Production, Transportation and Moving occupations in Ashtabula County are Production (6,218 | 14.8%), Material Moving (2,113 | 5.0%), and Transportation (2,055 | 4.9%).
Production, Transportation and Moving Occupations by Sex
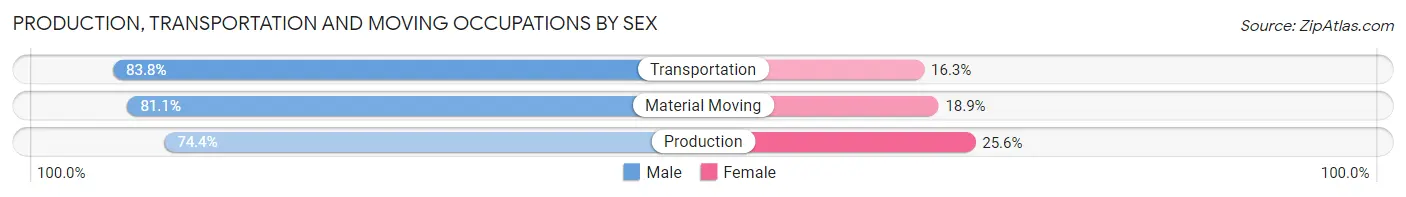
| Occupation | Male | Female |
| Production | 4,624 (74.4%) | 1,594 (25.6%) |
| Transportation | 1,721 (83.8%) | 334 (16.3%) |
| Material Moving | 1,714 (81.1%) | 399 (18.9%) |
| Total (Category) | 8,059 (77.6%) | 2,327 (22.4%) |
| Total (Overall) | 22,845 (54.2%) | 19,291 (45.8%) |
Employment Industries by Sex in Ashtabula County
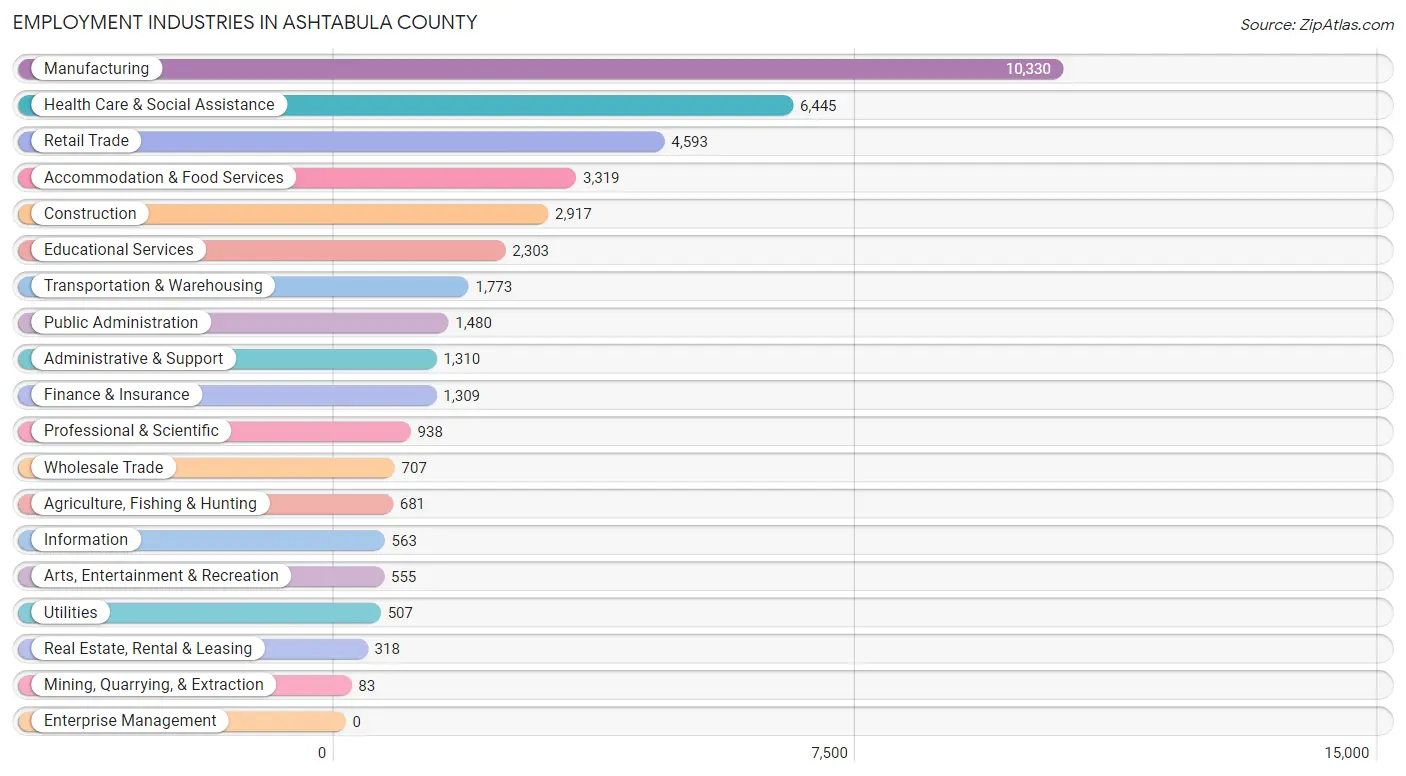
Employment Industries in Ashtabula County
The major employment industries in Ashtabula County include Manufacturing (10,330 | 24.5%), Health Care & Social Assistance (6,445 | 15.3%), Retail Trade (4,593 | 10.9%), Accommodation & Food Services (3,319 | 7.9%), and Construction (2,917 | 6.9%).
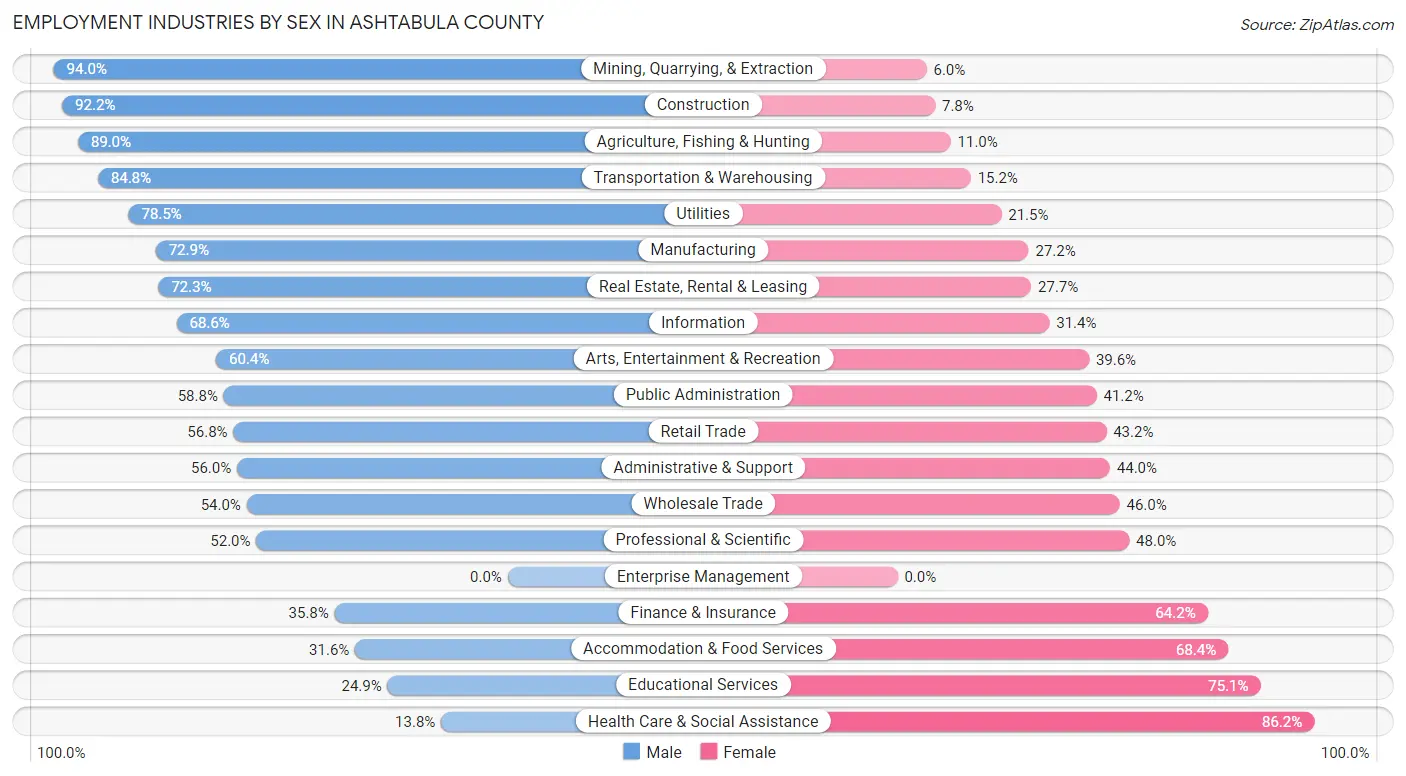
Employment Industries by Sex in Ashtabula County
The Ashtabula County industries that see more men than women are Mining, Quarrying, & Extraction (94.0%), Construction (92.2%), and Agriculture, Fishing & Hunting (89.0%), whereas the industries that tend to have a higher number of women are Health Care & Social Assistance (86.2%), Educational Services (75.1%), and Accommodation & Food Services (68.4%).
| Industry | Male | Female |
| Agriculture, Fishing & Hunting | 606 (89.0%) | 75 (11.0%) |
| Mining, Quarrying, & Extraction | 78 (94.0%) | 5 (6.0%) |
| Construction | 2,690 (92.2%) | 227 (7.8%) |
| Manufacturing | 7,525 (72.9%) | 2,805 (27.2%) |
| Wholesale Trade | 382 (54.0%) | 325 (46.0%) |
| Retail Trade | 2,608 (56.8%) | 1,985 (43.2%) |
| Transportation & Warehousing | 1,504 (84.8%) | 269 (15.2%) |
| Utilities | 398 (78.5%) | 109 (21.5%) |
| Information | 386 (68.6%) | 177 (31.4%) |
| Finance & Insurance | 469 (35.8%) | 840 (64.2%) |
| Real Estate, Rental & Leasing | 230 (72.3%) | 88 (27.7%) |
| Professional & Scientific | 488 (52.0%) | 450 (48.0%) |
| Enterprise Management | 0 (0.0%) | 0 (0.0%) |
| Administrative & Support | 734 (56.0%) | 576 (44.0%) |
| Educational Services | 573 (24.9%) | 1,730 (75.1%) |
| Health Care & Social Assistance | 888 (13.8%) | 5,557 (86.2%) |
| Arts, Entertainment & Recreation | 335 (60.4%) | 220 (39.6%) |
| Accommodation & Food Services | 1,048 (31.6%) | 2,271 (68.4%) |
| Public Administration | 870 (58.8%) | 610 (41.2%) |
| Total | 22,845 (54.2%) | 19,291 (45.8%) |
Education in Ashtabula County
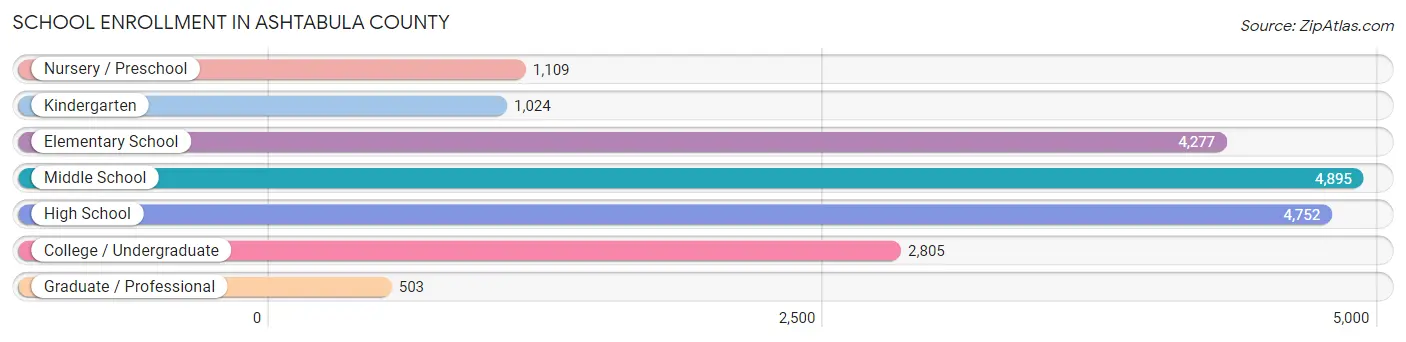
School Enrollment in Ashtabula County
The most common levels of schooling among the 19,365 students in Ashtabula County are middle school (4,895 | 25.3%), high school (4,752 | 24.5%), and elementary school (4,277 | 22.1%).
| School Level | # Students | % Students |
| Nursery / Preschool | 1,109 | 5.7% |
| Kindergarten | 1,024 | 5.3% |
| Elementary School | 4,277 | 22.1% |
| Middle School | 4,895 | 25.3% |
| High School | 4,752 | 24.5% |
| College / Undergraduate | 2,805 | 14.5% |
| Graduate / Professional | 503 | 2.6% |
| Total | 19,365 | 100.0% |
School Enrollment by Age by Funding Source in Ashtabula County
Out of a total of 19,365 students who are enrolled in schools in Ashtabula County, 3,040 (15.7%) attend a private institution, while the remaining 16,325 (84.3%) are enrolled in public schools. The age group of 3 to 4 year olds has the highest likelihood of being enrolled in private schools, with 213 (32.9% in the age bracket) enrolled. Conversely, the age group of 15 to 17 year olds has the lowest likelihood of being enrolled in a private school, with 3,074 (91.9% in the age bracket) attending a public institution.
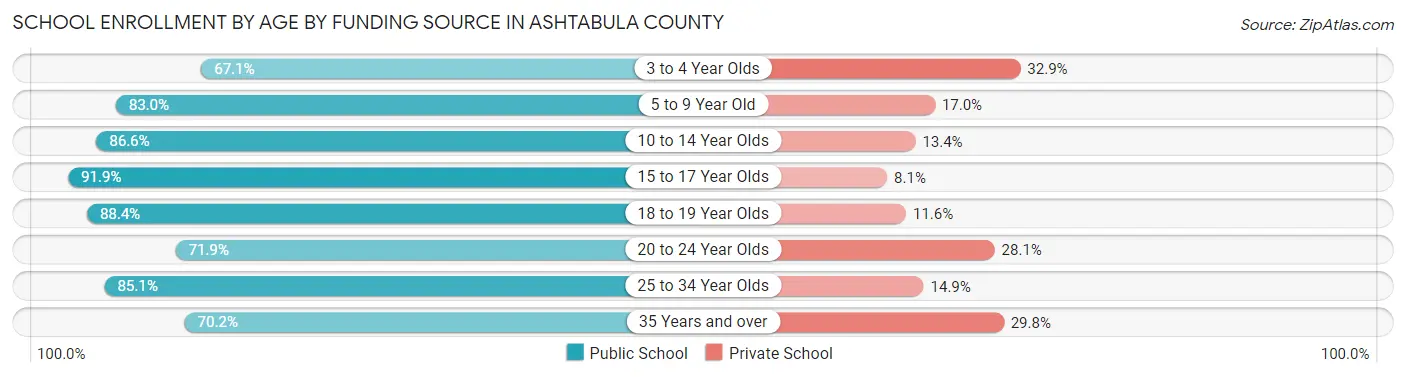
| Age Bracket | Public School | Private School |
| 3 to 4 Year Olds | 434 (67.1%) | 213 (32.9%) |
| 5 to 9 Year Old | 4,190 (83.0%) | 858 (17.0%) |
| 10 to 14 Year Olds | 5,217 (86.6%) | 805 (13.4%) |
| 15 to 17 Year Olds | 3,074 (91.9%) | 271 (8.1%) |
| 18 to 19 Year Olds | 1,179 (88.4%) | 155 (11.6%) |
| 20 to 24 Year Olds | 841 (71.9%) | 329 (28.1%) |
| 25 to 34 Year Olds | 766 (85.1%) | 134 (14.9%) |
| 35 Years and over | 631 (70.2%) | 268 (29.8%) |
| Total | 16,325 (84.3%) | 3,040 (15.7%) |
Educational Attainment by Field of Study in Ashtabula County
Education (2,564 | 22.5%), business (2,000 | 17.6%), science & technology (1,488 | 13.1%), arts & humanities (990 | 8.7%), and bio, nature & agricultural (528 | 4.6%) are the most common fields of study among 11,378 individuals in Ashtabula County who have obtained a bachelor's degree or higher.
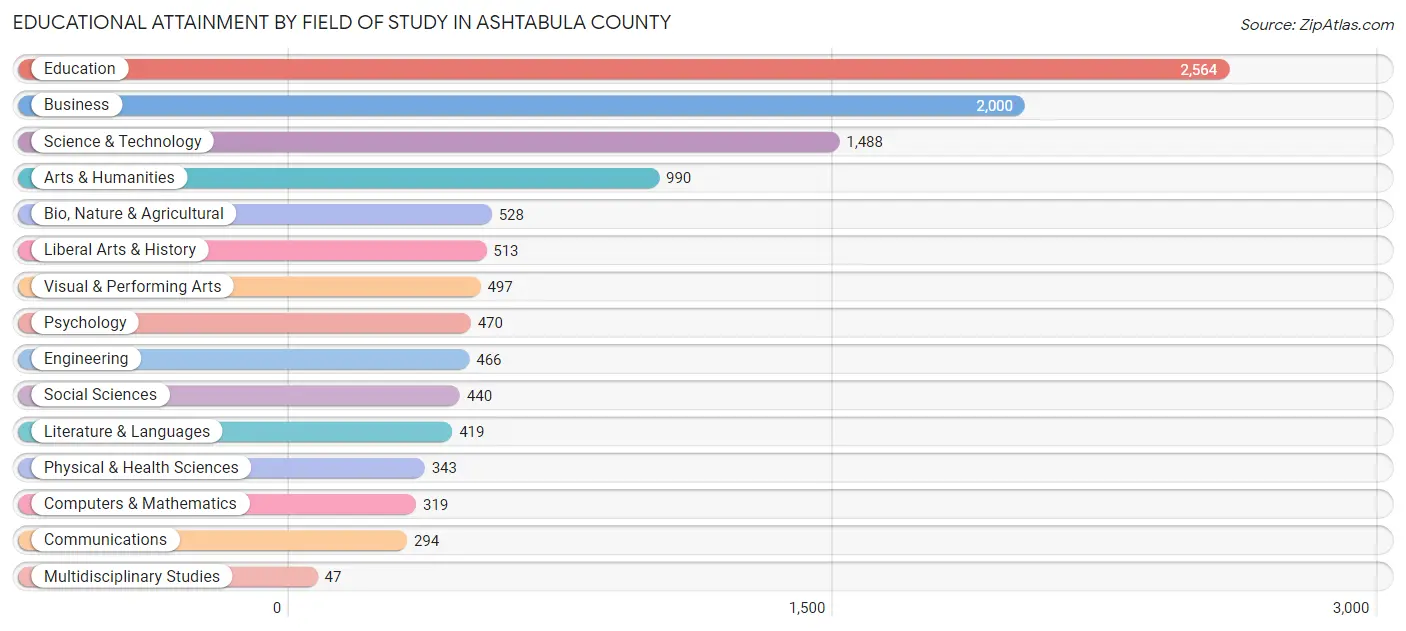
| Field of Study | # Graduates | % Graduates |
| Computers & Mathematics | 319 | 2.8% |
| Bio, Nature & Agricultural | 528 | 4.6% |
| Physical & Health Sciences | 343 | 3.0% |
| Psychology | 470 | 4.1% |
| Social Sciences | 440 | 3.9% |
| Engineering | 466 | 4.1% |
| Multidisciplinary Studies | 47 | 0.4% |
| Science & Technology | 1,488 | 13.1% |
| Business | 2,000 | 17.6% |
| Education | 2,564 | 22.5% |
| Literature & Languages | 419 | 3.7% |
| Liberal Arts & History | 513 | 4.5% |
| Visual & Performing Arts | 497 | 4.4% |
| Communications | 294 | 2.6% |
| Arts & Humanities | 990 | 8.7% |
| Total | 11,378 | 100.0% |
Transportation & Commute in Ashtabula County
Vehicle Availability by Sex in Ashtabula County
The most prevalent vehicle ownership categories in Ashtabula County are males with 2 vehicles (9,099, accounting for 41.1%) and females with 2 vehicles (7,274, making up 48.6%).
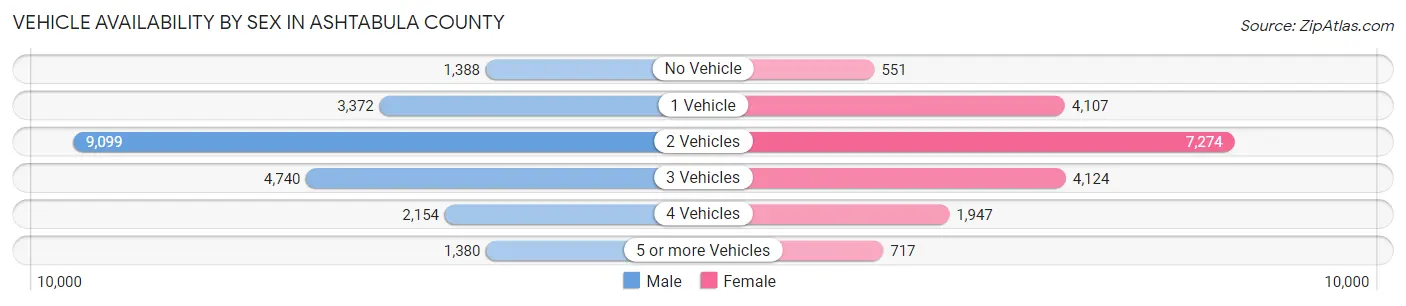
| Vehicles Available | Male | Female |
| No Vehicle | 1,388 (6.3%) | 551 (2.9%) |
| 1 Vehicle | 3,372 (15.2%) | 4,107 (21.9%) |
| 2 Vehicles | 9,099 (41.1%) | 7,274 (38.9%) |
| 3 Vehicles | 4,740 (21.4%) | 4,124 (22.0%) |
| 4 Vehicles | 2,154 (9.7%) | 1,947 (10.4%) |
| 5 or more Vehicles | 1,380 (6.2%) | 717 (3.8%) |
| Total | 22,133 (100.0%) | 18,720 (100.0%) |
Commute Time in Ashtabula County
The most frequently occuring commute durations in Ashtabula County are 5 to 9 minutes (5,432 commuters, 13.8%), 10 to 14 minutes (5,261 commuters, 13.4%), and 20 to 24 minutes (5,205 commuters, 13.2%).
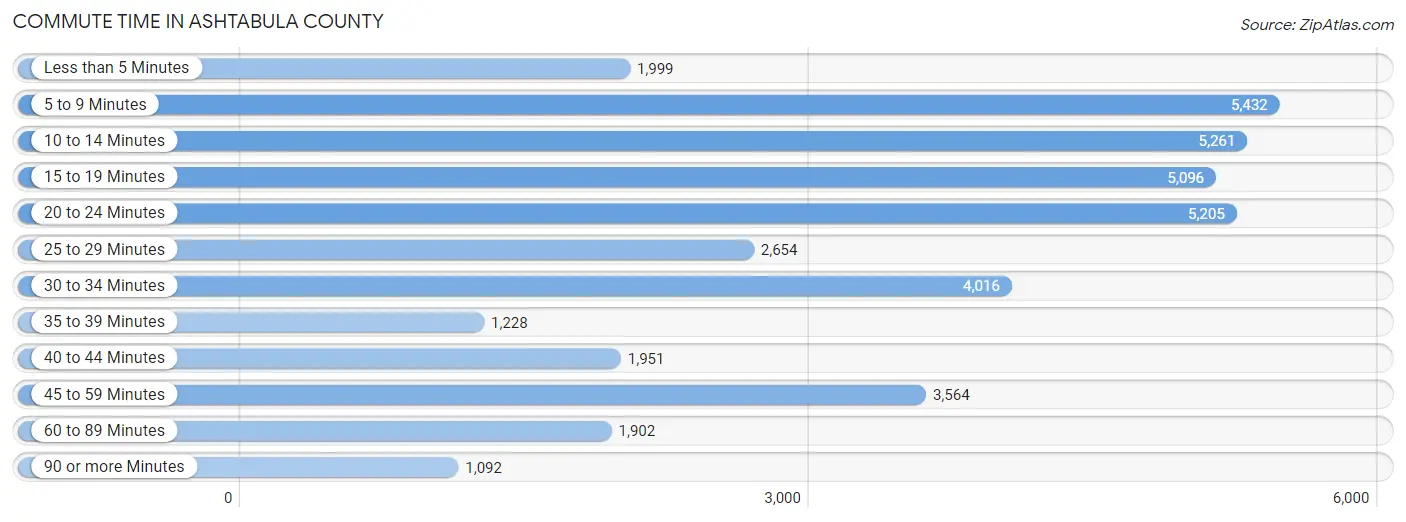
| Commute Time | # Commuters | % Commuters |
| Less than 5 Minutes | 1,999 | 5.1% |
| 5 to 9 Minutes | 5,432 | 13.8% |
| 10 to 14 Minutes | 5,261 | 13.4% |
| 15 to 19 Minutes | 5,096 | 12.9% |
| 20 to 24 Minutes | 5,205 | 13.2% |
| 25 to 29 Minutes | 2,654 | 6.7% |
| 30 to 34 Minutes | 4,016 | 10.2% |
| 35 to 39 Minutes | 1,228 | 3.1% |
| 40 to 44 Minutes | 1,951 | 5.0% |
| 45 to 59 Minutes | 3,564 | 9.0% |
| 60 to 89 Minutes | 1,902 | 4.8% |
| 90 or more Minutes | 1,092 | 2.8% |
Commute Time by Sex in Ashtabula County
The most common commute times in Ashtabula County are 15 to 19 minutes (2,935 commuters, 13.7%) for males and 5 to 9 minutes (3,202 commuters, 17.8%) for females.
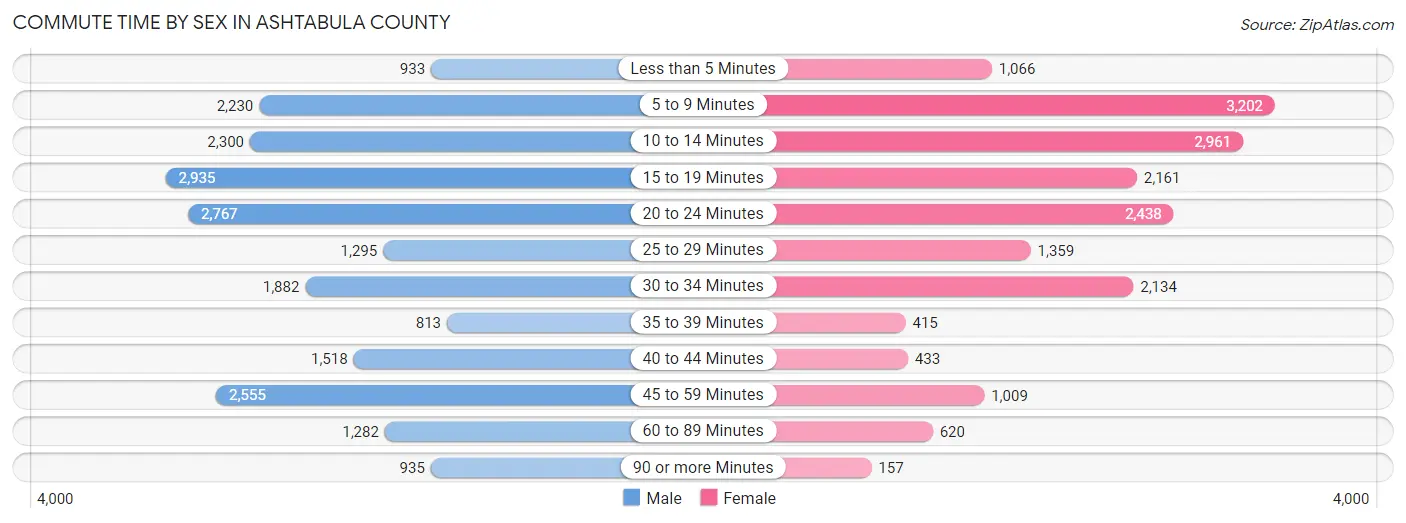
| Commute Time | Male | Female |
| Less than 5 Minutes | 933 (4.3%) | 1,066 (5.9%) |
| 5 to 9 Minutes | 2,230 (10.4%) | 3,202 (17.8%) |
| 10 to 14 Minutes | 2,300 (10.7%) | 2,961 (16.5%) |
| 15 to 19 Minutes | 2,935 (13.7%) | 2,161 (12.0%) |
| 20 to 24 Minutes | 2,767 (12.9%) | 2,438 (13.6%) |
| 25 to 29 Minutes | 1,295 (6.0%) | 1,359 (7.6%) |
| 30 to 34 Minutes | 1,882 (8.8%) | 2,134 (11.9%) |
| 35 to 39 Minutes | 813 (3.8%) | 415 (2.3%) |
| 40 to 44 Minutes | 1,518 (7.1%) | 433 (2.4%) |
| 45 to 59 Minutes | 2,555 (11.9%) | 1,009 (5.6%) |
| 60 to 89 Minutes | 1,282 (6.0%) | 620 (3.5%) |
| 90 or more Minutes | 935 (4.4%) | 157 (0.9%) |
Time of Departure to Work by Sex in Ashtabula County
The most frequent times of departure to work in Ashtabula County are 6:00 AM to 6:29 AM (2,571, 12.0%) for males and 7:00 AM to 7:29 AM (2,426, 13.5%) for females.
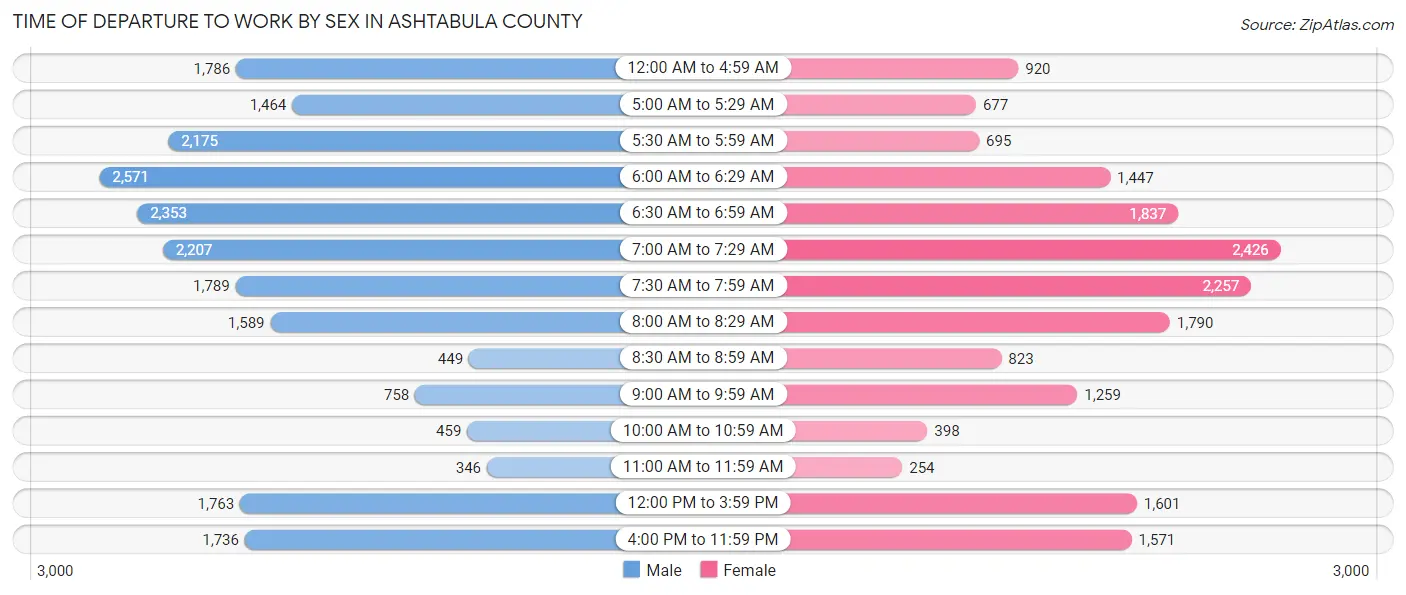
| Time of Departure | Male | Female |
| 12:00 AM to 4:59 AM | 1,786 (8.3%) | 920 (5.1%) |
| 5:00 AM to 5:29 AM | 1,464 (6.8%) | 677 (3.8%) |
| 5:30 AM to 5:59 AM | 2,175 (10.1%) | 695 (3.9%) |
| 6:00 AM to 6:29 AM | 2,571 (12.0%) | 1,447 (8.1%) |
| 6:30 AM to 6:59 AM | 2,353 (11.0%) | 1,837 (10.2%) |
| 7:00 AM to 7:29 AM | 2,207 (10.3%) | 2,426 (13.5%) |
| 7:30 AM to 7:59 AM | 1,789 (8.3%) | 2,257 (12.6%) |
| 8:00 AM to 8:29 AM | 1,589 (7.4%) | 1,790 (10.0%) |
| 8:30 AM to 8:59 AM | 449 (2.1%) | 823 (4.6%) |
| 9:00 AM to 9:59 AM | 758 (3.5%) | 1,259 (7.0%) |
| 10:00 AM to 10:59 AM | 459 (2.1%) | 398 (2.2%) |
| 11:00 AM to 11:59 AM | 346 (1.6%) | 254 (1.4%) |
| 12:00 PM to 3:59 PM | 1,763 (8.2%) | 1,601 (8.9%) |
| 4:00 PM to 11:59 PM | 1,736 (8.1%) | 1,571 (8.7%) |
| Total | 21,445 (100.0%) | 17,955 (100.0%) |
Housing Occupancy in Ashtabula County
Occupancy by Ownership in Ashtabula County
Of the total 38,549 dwellings in Ashtabula County, owner-occupied units account for 28,278 (73.4%), while renter-occupied units make up 10,271 (26.6%).
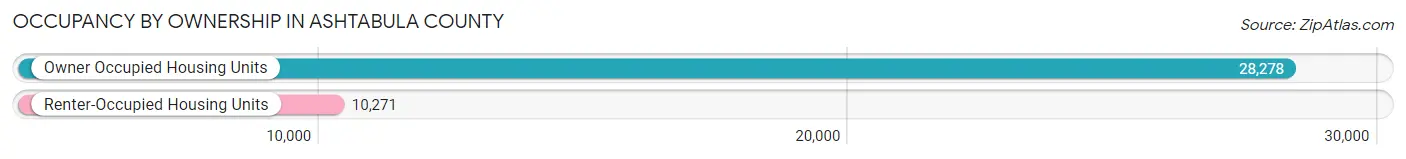
| Occupancy | # Housing Units | % Housing Units |
| Owner Occupied Housing Units | 28,278 | 73.4% |
| Renter-Occupied Housing Units | 10,271 | 26.6% |
| Total Occupied Housing Units | 38,549 | 100.0% |
Occupancy by Household Size in Ashtabula County
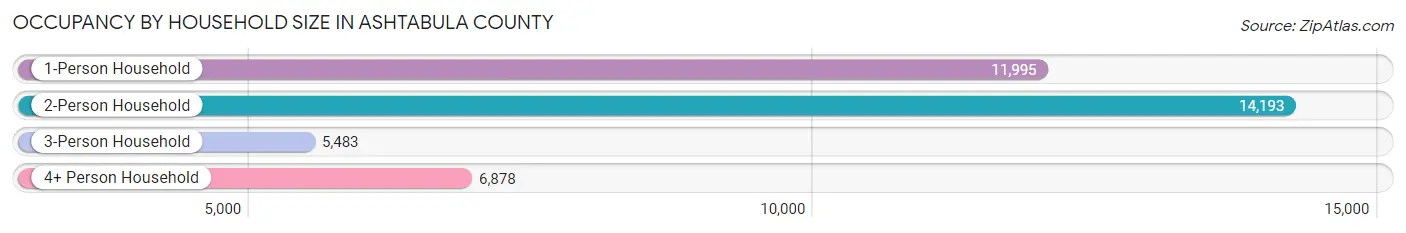
| Household Size | # Housing Units | % Housing Units |
| 1-Person Household | 11,995 | 31.1% |
| 2-Person Household | 14,193 | 36.8% |
| 3-Person Household | 5,483 | 14.2% |
| 4+ Person Household | 6,878 | 17.8% |
| Total Housing Units | 38,549 | 100.0% |
Occupancy by Ownership by Household Size in Ashtabula County
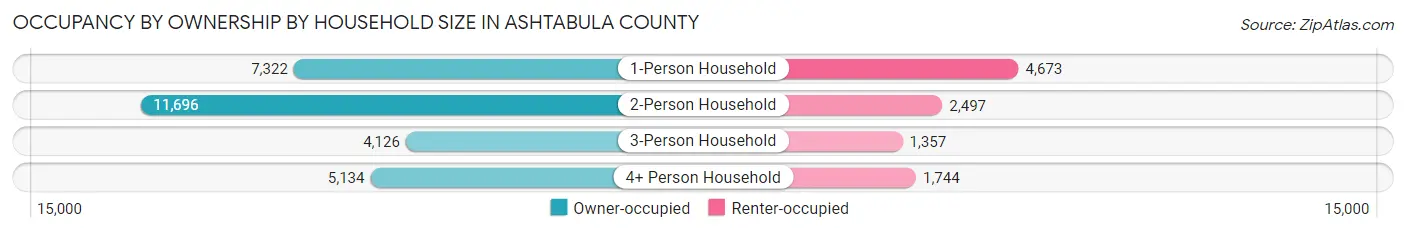
| Household Size | Owner-occupied | Renter-occupied |
| 1-Person Household | 7,322 (61.0%) | 4,673 (39.0%) |
| 2-Person Household | 11,696 (82.4%) | 2,497 (17.6%) |
| 3-Person Household | 4,126 (75.2%) | 1,357 (24.7%) |
| 4+ Person Household | 5,134 (74.6%) | 1,744 (25.4%) |
| Total Housing Units | 28,278 (73.4%) | 10,271 (26.6%) |
Occupancy by Educational Attainment in Ashtabula County
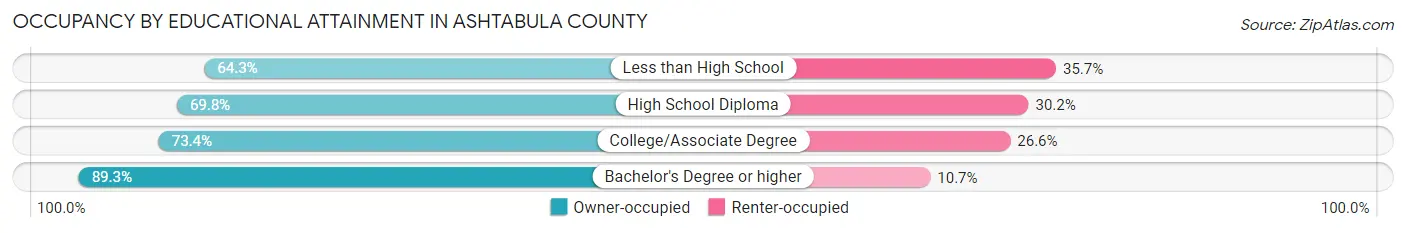
| Household Size | Owner-occupied | Renter-occupied |
| Less than High School | 2,975 (64.3%) | 1,649 (35.7%) |
| High School Diploma | 10,966 (69.8%) | 4,747 (30.2%) |
| College/Associate Degree | 8,874 (73.4%) | 3,218 (26.6%) |
| Bachelor's Degree or higher | 5,463 (89.3%) | 657 (10.7%) |
Occupancy by Age of Householder in Ashtabula County
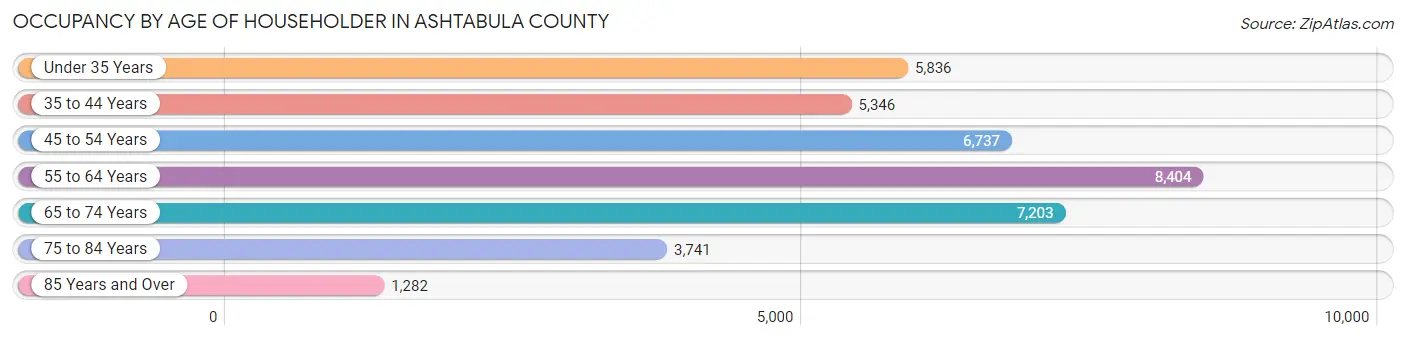
| Age Bracket | # Households | % Households |
| Under 35 Years | 5,836 | 15.1% |
| 35 to 44 Years | 5,346 | 13.9% |
| 45 to 54 Years | 6,737 | 17.5% |
| 55 to 64 Years | 8,404 | 21.8% |
| 65 to 74 Years | 7,203 | 18.7% |
| 75 to 84 Years | 3,741 | 9.7% |
| 85 Years and Over | 1,282 | 3.3% |
| Total | 38,549 | 100.0% |
Housing Finances in Ashtabula County
Median Income by Occupancy in Ashtabula County
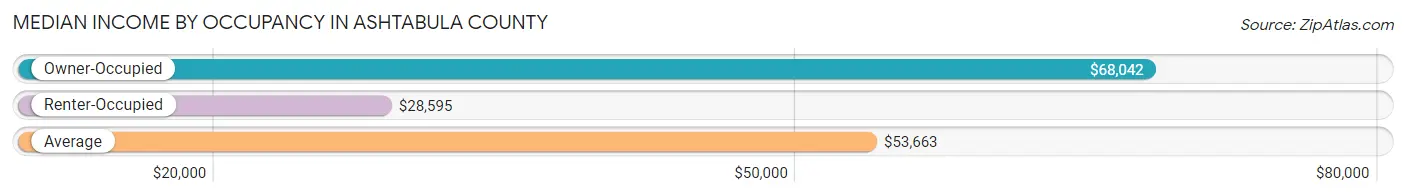
| Occupancy Type | # Households | Median Income |
| Owner-Occupied | 28,278 (73.4%) | $68,042 |
| Renter-Occupied | 10,271 (26.6%) | $28,595 |
| Average | 38,549 (100.0%) | $53,663 |
Occupancy by Householder Income Bracket in Ashtabula County
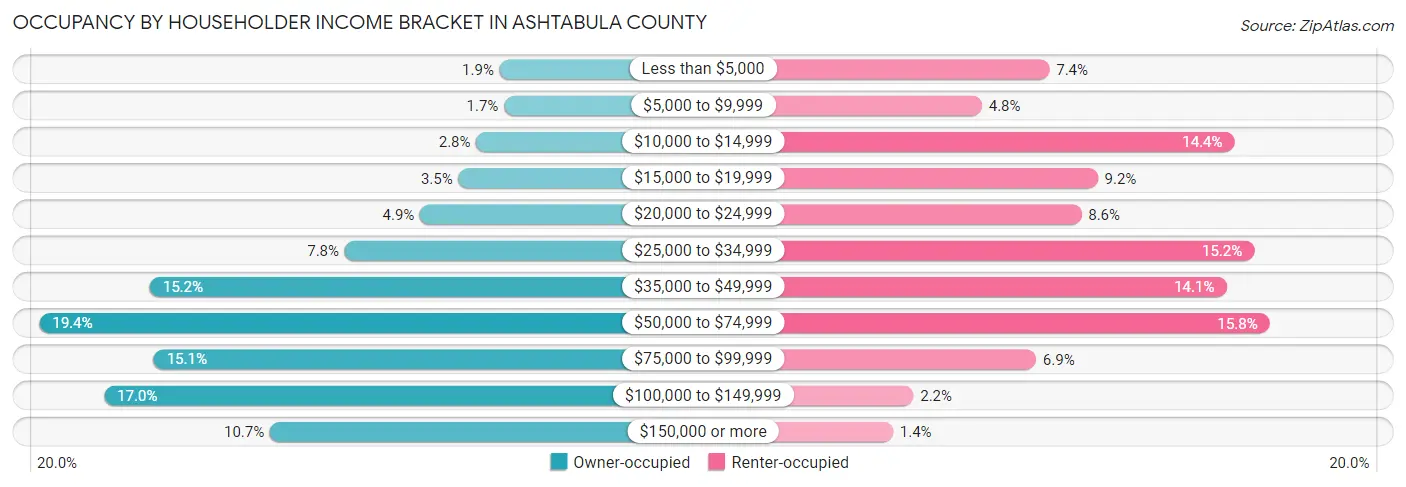
| Income Bracket | Owner-occupied | Renter-occupied |
| Less than $5,000 | 538 (1.9%) | 758 (7.4%) |
| $5,000 to $9,999 | 488 (1.7%) | 494 (4.8%) |
| $10,000 to $14,999 | 789 (2.8%) | 1,482 (14.4%) |
| $15,000 to $19,999 | 982 (3.5%) | 947 (9.2%) |
| $20,000 to $24,999 | 1,394 (4.9%) | 883 (8.6%) |
| $25,000 to $34,999 | 2,206 (7.8%) | 1,559 (15.2%) |
| $35,000 to $49,999 | 4,308 (15.2%) | 1,450 (14.1%) |
| $50,000 to $74,999 | 5,498 (19.4%) | 1,620 (15.8%) |
| $75,000 to $99,999 | 4,265 (15.1%) | 706 (6.9%) |
| $100,000 to $149,999 | 4,798 (17.0%) | 226 (2.2%) |
| $150,000 or more | 3,012 (10.6%) | 146 (1.4%) |
| Total | 28,278 (100.0%) | 10,271 (100.0%) |
Monthly Housing Cost Tiers in Ashtabula County
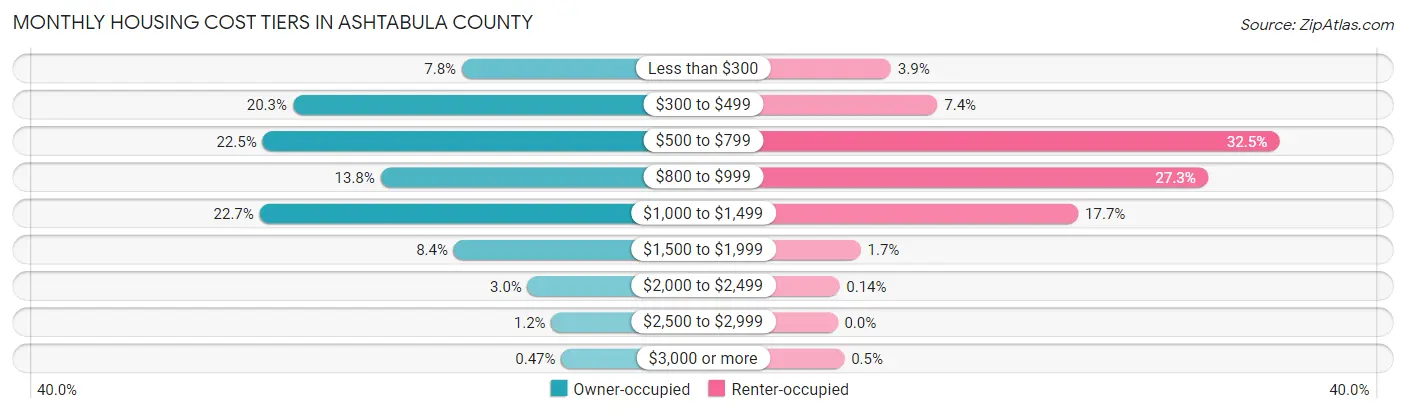
| Monthly Cost | Owner-occupied | Renter-occupied |
| Less than $300 | 2,203 (7.8%) | 405 (3.9%) |
| $300 to $499 | 5,726 (20.3%) | 756 (7.4%) |
| $500 to $799 | 6,358 (22.5%) | 3,340 (32.5%) |
| $800 to $999 | 3,896 (13.8%) | 2,800 (27.3%) |
| $1,000 to $1,499 | 6,416 (22.7%) | 1,821 (17.7%) |
| $1,500 to $1,999 | 2,372 (8.4%) | 176 (1.7%) |
| $2,000 to $2,499 | 834 (2.9%) | 14 (0.1%) |
| $2,500 to $2,999 | 339 (1.2%) | 0 (0.0%) |
| $3,000 or more | 134 (0.5%) | 51 (0.5%) |
| Total | 28,278 (100.0%) | 10,271 (100.0%) |
Physical Housing Characteristics in Ashtabula County
Housing Structures in Ashtabula County
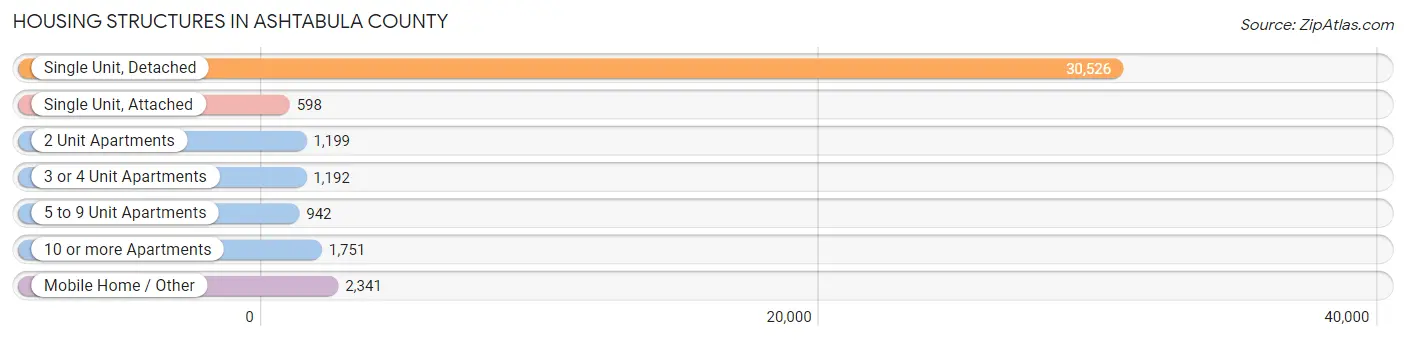
| Structure Type | # Housing Units | % Housing Units |
| Single Unit, Detached | 30,526 | 79.2% |
| Single Unit, Attached | 598 | 1.5% |
| 2 Unit Apartments | 1,199 | 3.1% |
| 3 or 4 Unit Apartments | 1,192 | 3.1% |
| 5 to 9 Unit Apartments | 942 | 2.4% |
| 10 or more Apartments | 1,751 | 4.5% |
| Mobile Home / Other | 2,341 | 6.1% |
| Total | 38,549 | 100.0% |
Housing Structures by Occupancy in Ashtabula County
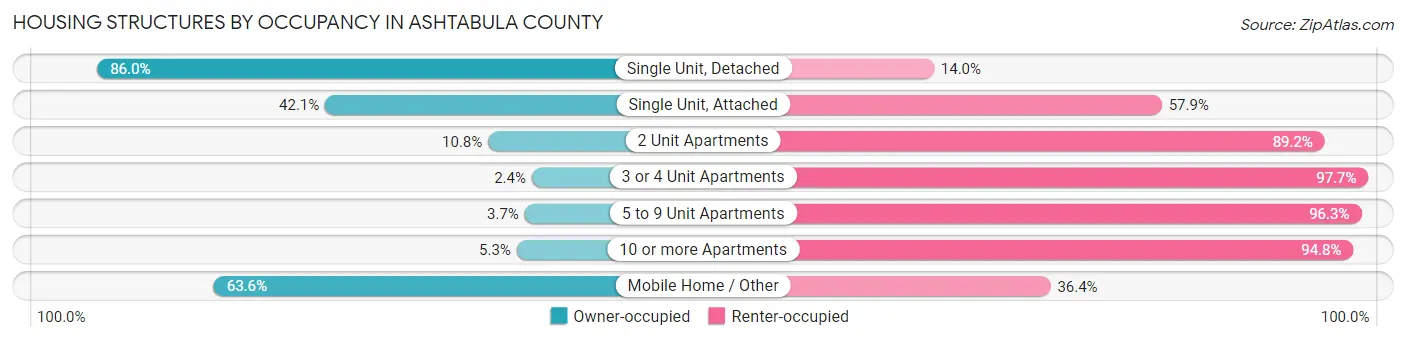
| Structure Type | Owner-occupied | Renter-occupied |
| Single Unit, Detached | 26,254 (86.0%) | 4,272 (14.0%) |
| Single Unit, Attached | 252 (42.1%) | 346 (57.9%) |
| 2 Unit Apartments | 129 (10.8%) | 1,070 (89.2%) |
| 3 or 4 Unit Apartments | 28 (2.4%) | 1,164 (97.7%) |
| 5 to 9 Unit Apartments | 35 (3.7%) | 907 (96.3%) |
| 10 or more Apartments | 92 (5.2%) | 1,659 (94.8%) |
| Mobile Home / Other | 1,488 (63.6%) | 853 (36.4%) |
| Total | 28,278 (73.4%) | 10,271 (26.6%) |
Housing Structures by Number of Rooms in Ashtabula County
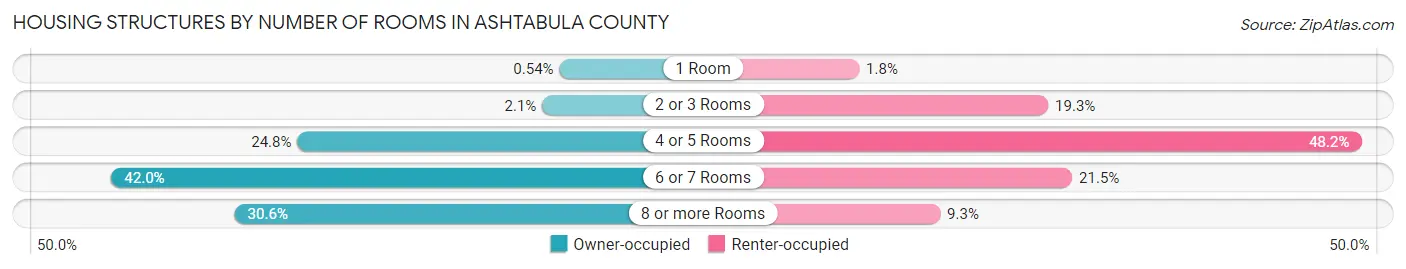
| Number of Rooms | Owner-occupied | Renter-occupied |
| 1 Room | 154 (0.5%) | 183 (1.8%) |
| 2 or 3 Rooms | 603 (2.1%) | 1,978 (19.3%) |
| 4 or 5 Rooms | 7,008 (24.8%) | 4,952 (48.2%) |
| 6 or 7 Rooms | 11,868 (42.0%) | 2,206 (21.5%) |
| 8 or more Rooms | 8,645 (30.6%) | 952 (9.3%) |
| Total | 28,278 (100.0%) | 10,271 (100.0%) |
Housing Structure by Heating Type in Ashtabula County
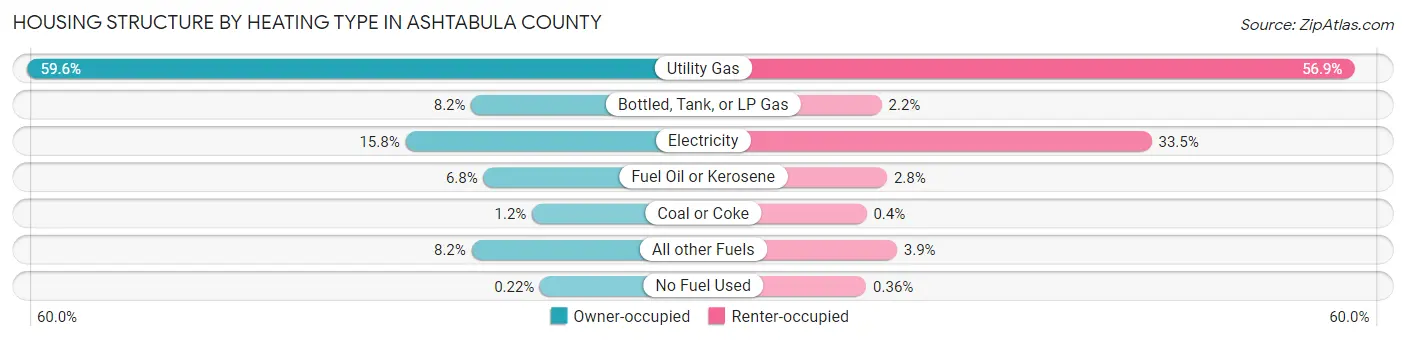
| Heating Type | Owner-occupied | Renter-occupied |
| Utility Gas | 16,865 (59.6%) | 5,848 (56.9%) |
| Bottled, Tank, or LP Gas | 2,319 (8.2%) | 221 (2.1%) |
| Electricity | 4,478 (15.8%) | 3,436 (33.5%) |
| Fuel Oil or Kerosene | 1,919 (6.8%) | 285 (2.8%) |
| Coal or Coke | 324 (1.1%) | 41 (0.4%) |
| All other Fuels | 2,311 (8.2%) | 403 (3.9%) |
| No Fuel Used | 62 (0.2%) | 37 (0.4%) |
| Total | 28,278 (100.0%) | 10,271 (100.0%) |
Household Vehicle Usage in Ashtabula County
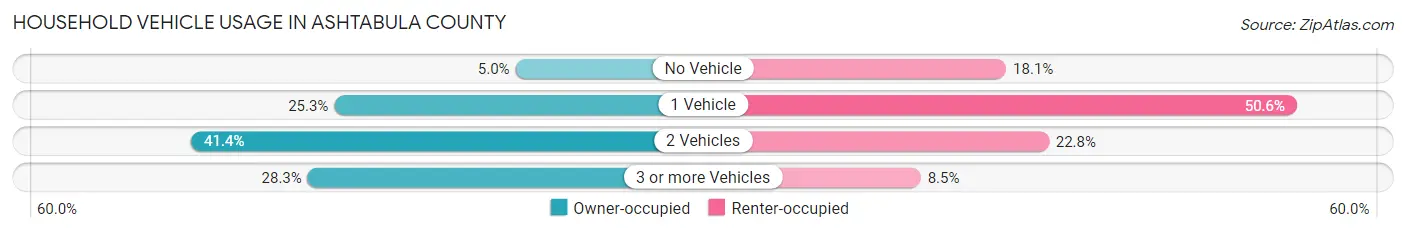
| Vehicles per Household | Owner-occupied | Renter-occupied |
| No Vehicle | 1,419 (5.0%) | 1,855 (18.1%) |
| 1 Vehicle | 7,161 (25.3%) | 5,198 (50.6%) |
| 2 Vehicles | 11,694 (41.3%) | 2,346 (22.8%) |
| 3 or more Vehicles | 8,004 (28.3%) | 872 (8.5%) |
| Total | 28,278 (100.0%) | 10,271 (100.0%) |
Real Estate & Mortgages in Ashtabula County
Real Estate and Mortgage Overview in Ashtabula County
| Characteristic | Without Mortgage | With Mortgage |
| Housing Units | 13,131 | 15,147 |
| Median Property Value | $124,300 | $145,900 |
| Median Household Income | $53,480 | $1,887 |
| Monthly Housing Costs | $461 | $96 |
| Real Estate Taxes | $1,620 | $264 |
Property Value by Mortgage Status in Ashtabula County
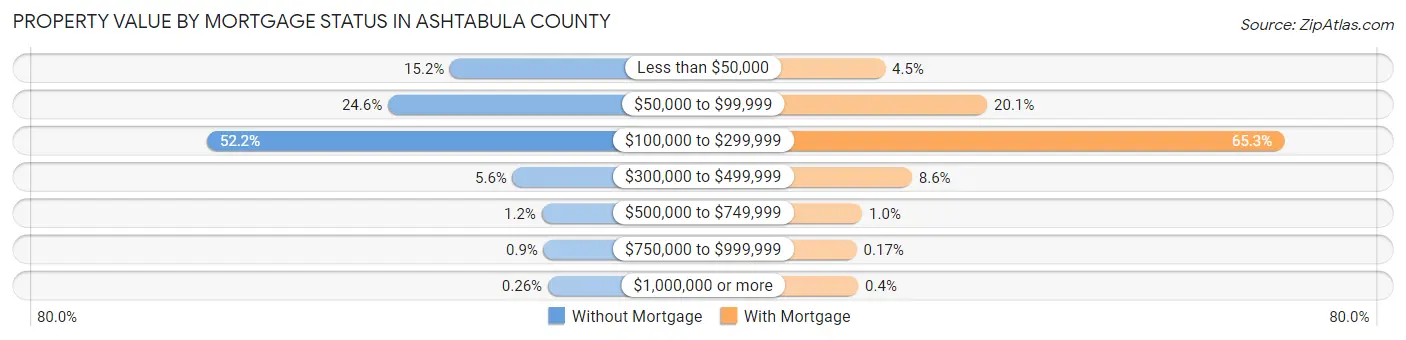
| Property Value | Without Mortgage | With Mortgage |
| Less than $50,000 | 1,990 (15.1%) | 682 (4.5%) |
| $50,000 to $99,999 | 3,234 (24.6%) | 3,037 (20.1%) |
| $100,000 to $299,999 | 6,857 (52.2%) | 9,890 (65.3%) |
| $300,000 to $499,999 | 739 (5.6%) | 1,300 (8.6%) |
| $500,000 to $749,999 | 159 (1.2%) | 153 (1.0%) |
| $750,000 to $999,999 | 118 (0.9%) | 25 (0.2%) |
| $1,000,000 or more | 34 (0.3%) | 60 (0.4%) |
| Total | 13,131 (100.0%) | 15,147 (100.0%) |
Household Income by Mortgage Status in Ashtabula County
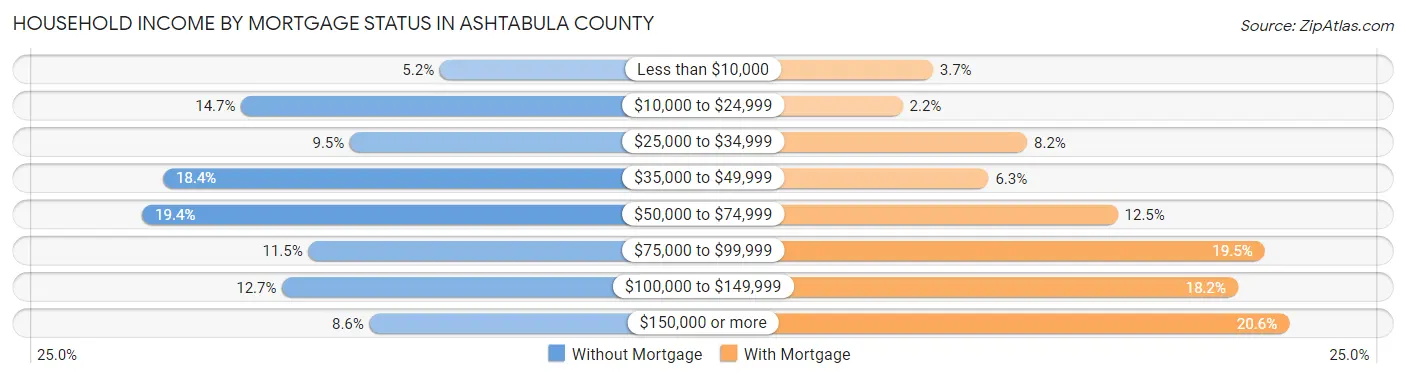
| Household Income | Without Mortgage | With Mortgage |
| Less than $10,000 | 686 (5.2%) | 557 (3.7%) |
| $10,000 to $24,999 | 1,928 (14.7%) | 340 (2.2%) |
| $25,000 to $34,999 | 1,247 (9.5%) | 1,237 (8.2%) |
| $35,000 to $49,999 | 2,418 (18.4%) | 959 (6.3%) |
| $50,000 to $74,999 | 2,548 (19.4%) | 1,890 (12.5%) |
| $75,000 to $99,999 | 1,508 (11.5%) | 2,950 (19.5%) |
| $100,000 to $149,999 | 1,671 (12.7%) | 2,757 (18.2%) |
| $150,000 or more | 1,125 (8.6%) | 3,127 (20.6%) |
| Total | 13,131 (100.0%) | 15,147 (100.0%) |
Property Value to Household Income Ratio in Ashtabula County
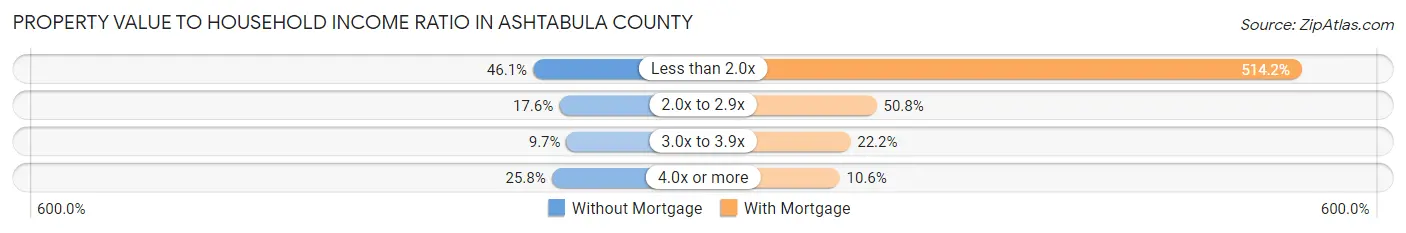
| Value-to-Income Ratio | Without Mortgage | With Mortgage |
| Less than 2.0x | 6,056 (46.1%) | 77,891 (514.2%) |
| 2.0x to 2.9x | 2,311 (17.6%) | 7,688 (50.8%) |
| 3.0x to 3.9x | 1,271 (9.7%) | 3,358 (22.2%) |
| 4.0x or more | 3,384 (25.8%) | 1,598 (10.5%) |
| Total | 13,131 (100.0%) | 15,147 (100.0%) |
Real Estate Taxes by Mortgage Status in Ashtabula County
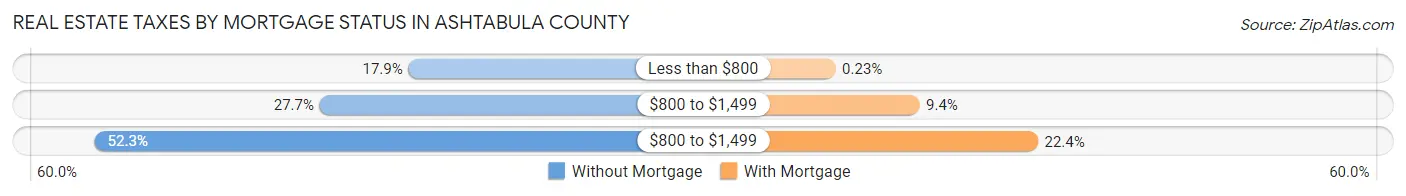
| Property Taxes | Without Mortgage | With Mortgage |
| Less than $800 | 2,353 (17.9%) | 35 (0.2%) |
| $800 to $1,499 | 3,631 (27.7%) | 1,428 (9.4%) |
| $800 to $1,499 | 6,870 (52.3%) | 3,394 (22.4%) |
| Total | 13,131 (100.0%) | 15,147 (100.0%) |
Health & Disability in Ashtabula County
Health Insurance Coverage by Age in Ashtabula County
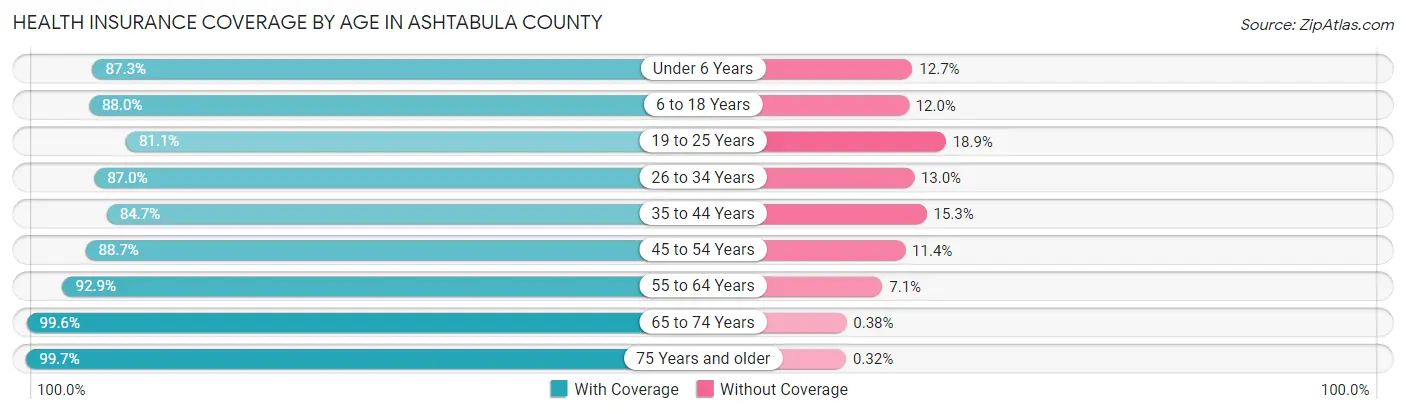
| Age Bracket | With Coverage | Without Coverage |
| Under 6 Years | 5,707 (87.3%) | 830 (12.7%) |
| 6 to 18 Years | 14,026 (88.0%) | 1,914 (12.0%) |
| 19 to 25 Years | 5,880 (81.1%) | 1,371 (18.9%) |
| 26 to 34 Years | 8,711 (87.0%) | 1,300 (13.0%) |
| 35 to 44 Years | 8,926 (84.7%) | 1,616 (15.3%) |
| 45 to 54 Years | 10,989 (88.6%) | 1,407 (11.4%) |
| 55 to 64 Years | 12,910 (92.9%) | 987 (7.1%) |
| 65 to 74 Years | 11,031 (99.6%) | 42 (0.4%) |
| 75 Years and older | 7,141 (99.7%) | 23 (0.3%) |
| Total | 85,321 (90.0%) | 9,490 (10.0%) |
Health Insurance Coverage by Citizenship Status in Ashtabula County
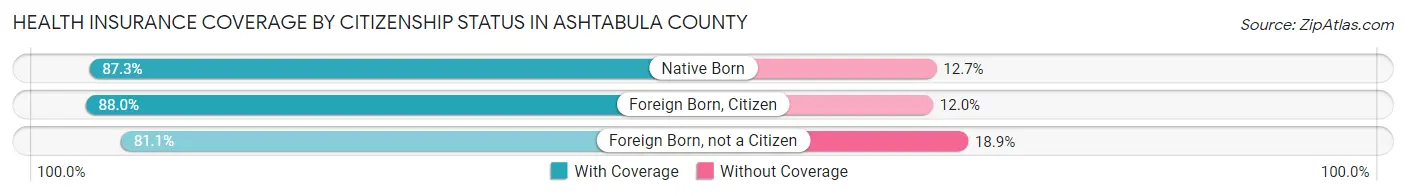
| Citizenship Status | With Coverage | Without Coverage |
| Native Born | 5,707 (87.3%) | 830 (12.7%) |
| Foreign Born, Citizen | 14,026 (88.0%) | 1,914 (12.0%) |
| Foreign Born, not a Citizen | 5,880 (81.1%) | 1,371 (18.9%) |
Health Insurance Coverage by Household Income in Ashtabula County
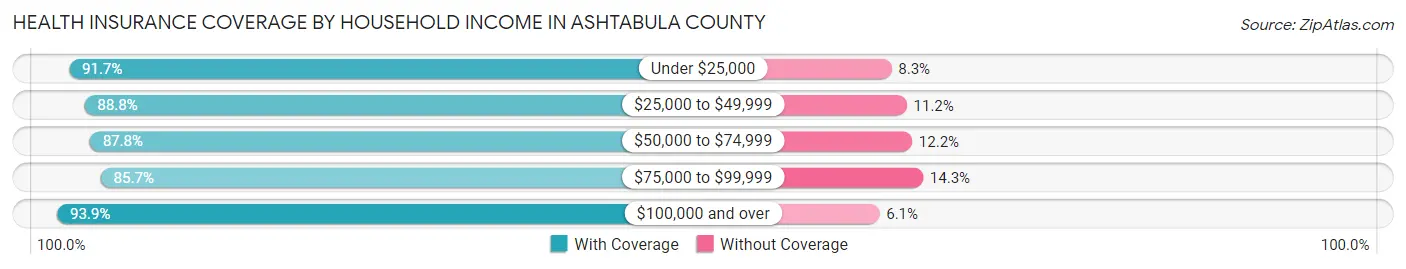
| Household Income | With Coverage | Without Coverage |
| Under $25,000 | 13,391 (91.7%) | 1,219 (8.3%) |
| $25,000 to $49,999 | 18,353 (88.8%) | 2,317 (11.2%) |
| $50,000 to $74,999 | 16,291 (87.8%) | 2,263 (12.2%) |
| $75,000 to $99,999 | 12,780 (85.7%) | 2,125 (14.3%) |
| $100,000 and over | 24,014 (93.9%) | 1,556 (6.1%) |
Public vs Private Health Insurance Coverage by Age in Ashtabula County
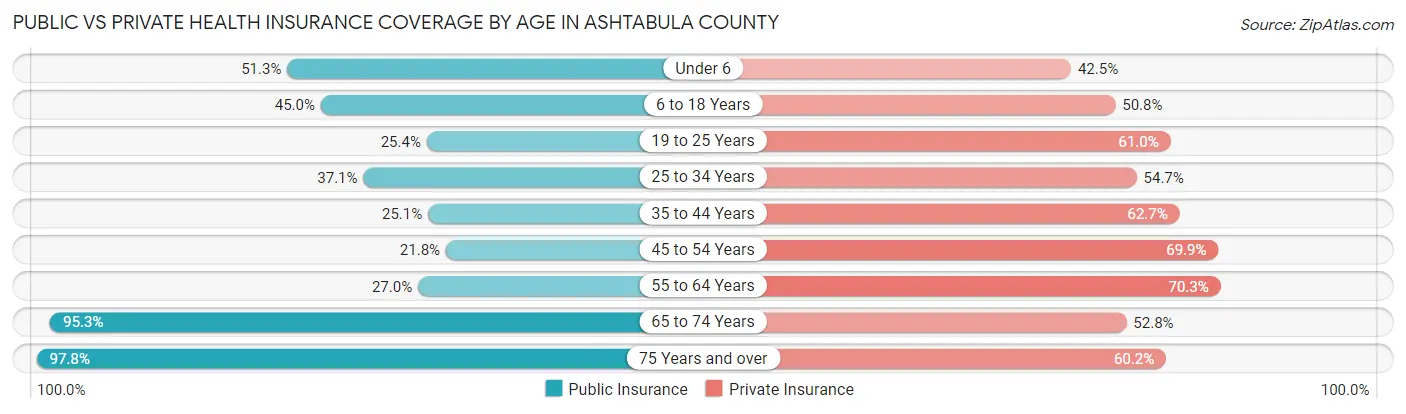
| Age Bracket | Public Insurance | Private Insurance |
| Under 6 | 3,350 (51.2%) | 2,781 (42.5%) |
| 6 to 18 Years | 7,176 (45.0%) | 8,091 (50.8%) |
| 19 to 25 Years | 1,839 (25.4%) | 4,424 (61.0%) |
| 25 to 34 Years | 3,716 (37.1%) | 5,478 (54.7%) |
| 35 to 44 Years | 2,647 (25.1%) | 6,608 (62.7%) |
| 45 to 54 Years | 2,702 (21.8%) | 8,662 (69.9%) |
| 55 to 64 Years | 3,749 (27.0%) | 9,771 (70.3%) |
| 65 to 74 Years | 10,549 (95.3%) | 5,850 (52.8%) |
| 75 Years and over | 7,005 (97.8%) | 4,312 (60.2%) |
| Total | 42,733 (45.1%) | 55,977 (59.0%) |
Disability Status by Sex by Age in Ashtabula County
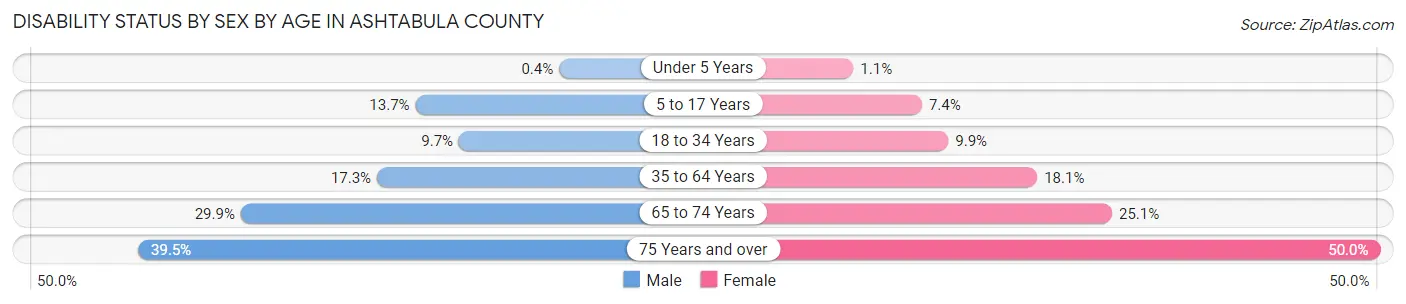
| Age Bracket | Male | Female |
| Under 5 Years | 12 (0.4%) | 27 (1.1%) |
| 5 to 17 Years | 1,106 (13.7%) | 580 (7.4%) |
| 18 to 34 Years | 934 (9.7%) | 868 (9.9%) |
| 35 to 64 Years | 3,220 (17.3%) | 3,305 (18.1%) |
| 65 to 74 Years | 1,599 (29.9%) | 1,438 (25.1%) |
| 75 Years and over | 1,254 (39.5%) | 1,993 (50.0%) |
Disability Class by Sex by Age in Ashtabula County
Disability Class: Hearing Difficulty
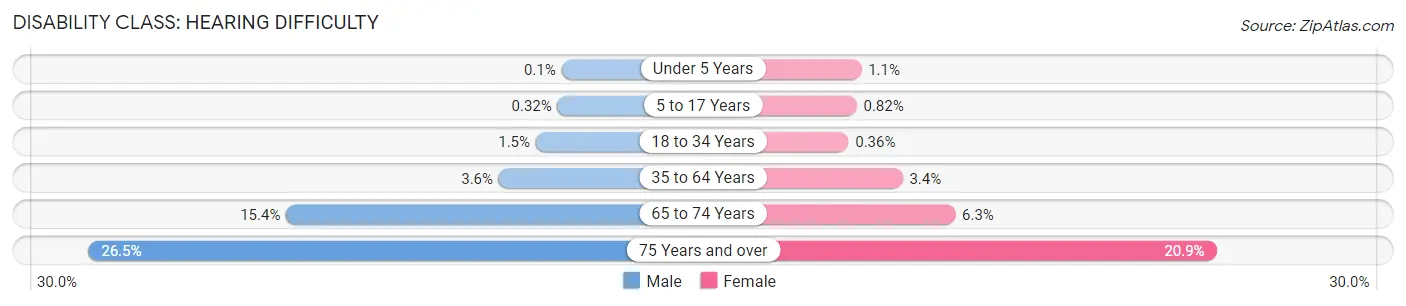
| Age Bracket | Male | Female |
| Under 5 Years | 3 (0.1%) | 27 (1.1%) |
| 5 to 17 Years | 26 (0.3%) | 64 (0.8%) |
| 18 to 34 Years | 147 (1.5%) | 32 (0.4%) |
| 35 to 64 Years | 669 (3.6%) | 616 (3.4%) |
| 65 to 74 Years | 824 (15.4%) | 362 (6.3%) |
| 75 Years and over | 840 (26.5%) | 832 (20.9%) |
Disability Class: Vision Difficulty
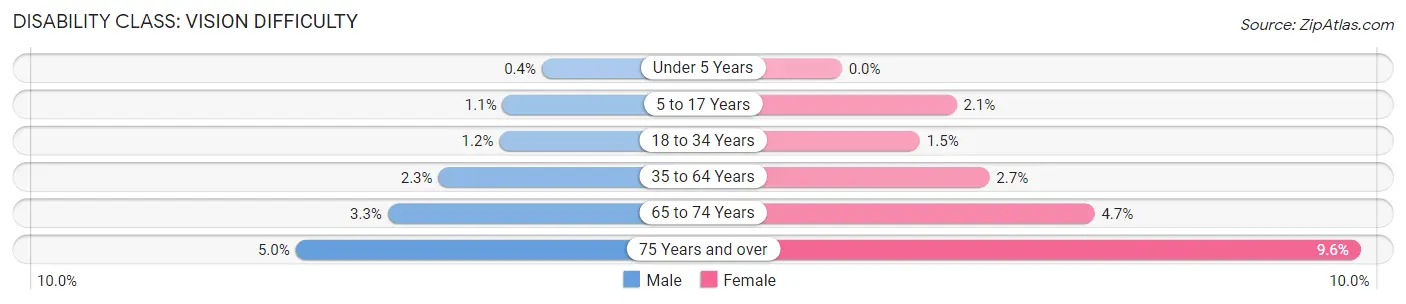
| Age Bracket | Male | Female |
| Under 5 Years | 12 (0.4%) | 0 (0.0%) |
| 5 to 17 Years | 91 (1.1%) | 166 (2.1%) |
| 18 to 34 Years | 115 (1.2%) | 127 (1.5%) |
| 35 to 64 Years | 431 (2.3%) | 499 (2.7%) |
| 65 to 74 Years | 174 (3.3%) | 269 (4.7%) |
| 75 Years and over | 158 (5.0%) | 384 (9.6%) |
Disability Class: Cognitive Difficulty
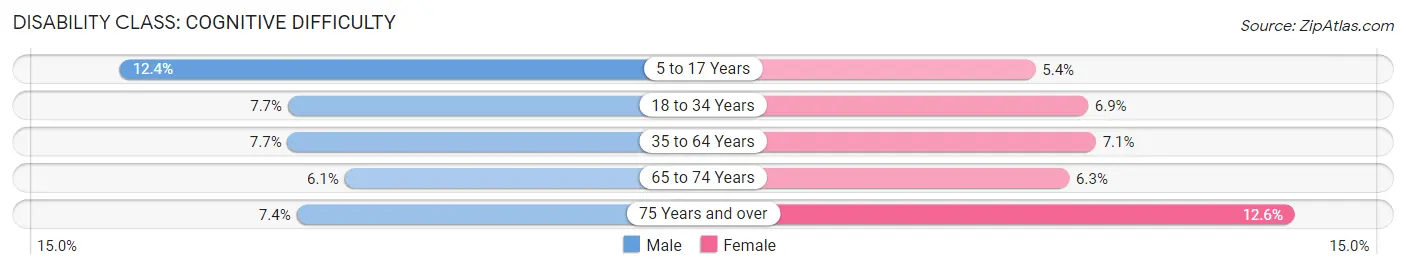
| Age Bracket | Male | Female |
| 5 to 17 Years | 995 (12.3%) | 420 (5.4%) |
| 18 to 34 Years | 739 (7.7%) | 601 (6.9%) |
| 35 to 64 Years | 1,429 (7.7%) | 1,289 (7.1%) |
| 65 to 74 Years | 325 (6.1%) | 363 (6.3%) |
| 75 Years and over | 236 (7.4%) | 503 (12.6%) |
Disability Class: Ambulatory Difficulty
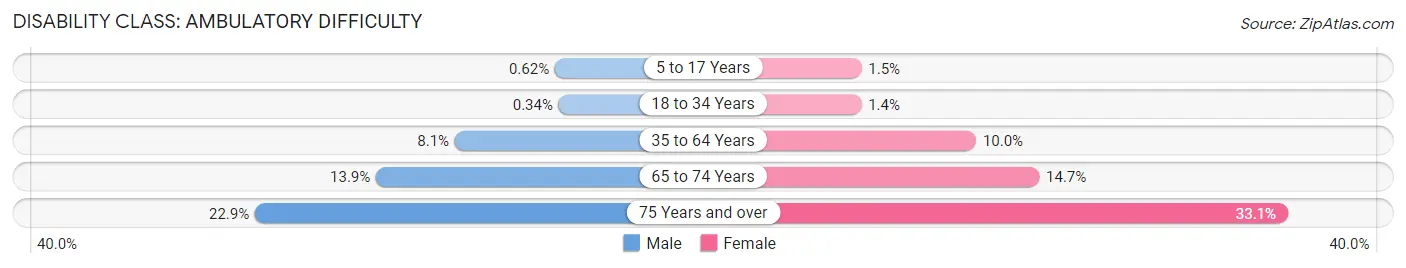
| Age Bracket | Male | Female |
| 5 to 17 Years | 50 (0.6%) | 113 (1.5%) |
| 18 to 34 Years | 33 (0.3%) | 126 (1.4%) |
| 35 to 64 Years | 1,498 (8.1%) | 1,814 (10.0%) |
| 65 to 74 Years | 742 (13.9%) | 840 (14.6%) |
| 75 Years and over | 727 (22.9%) | 1,321 (33.1%) |
Disability Class: Self-Care Difficulty
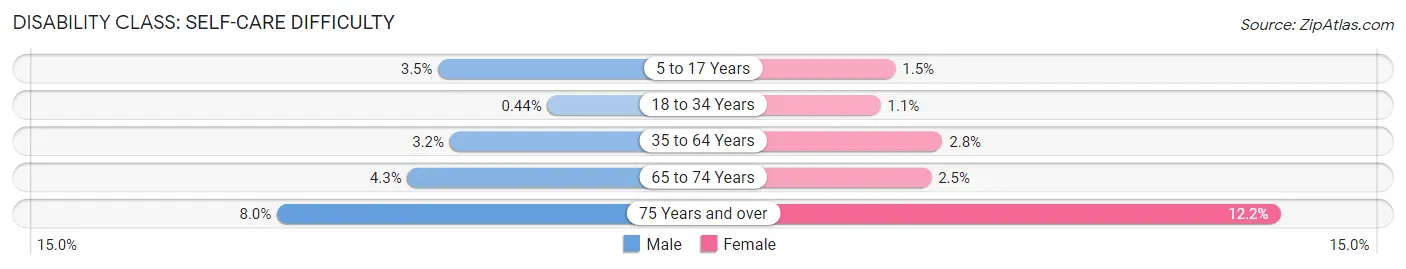
| Age Bracket | Male | Female |
| 5 to 17 Years | 280 (3.5%) | 116 (1.5%) |
| 18 to 34 Years | 42 (0.4%) | 95 (1.1%) |
| 35 to 64 Years | 589 (3.2%) | 511 (2.8%) |
| 65 to 74 Years | 232 (4.3%) | 143 (2.5%) |
| 75 Years and over | 253 (8.0%) | 487 (12.2%) |
Technology Access in Ashtabula County
Computing Device Access in Ashtabula County
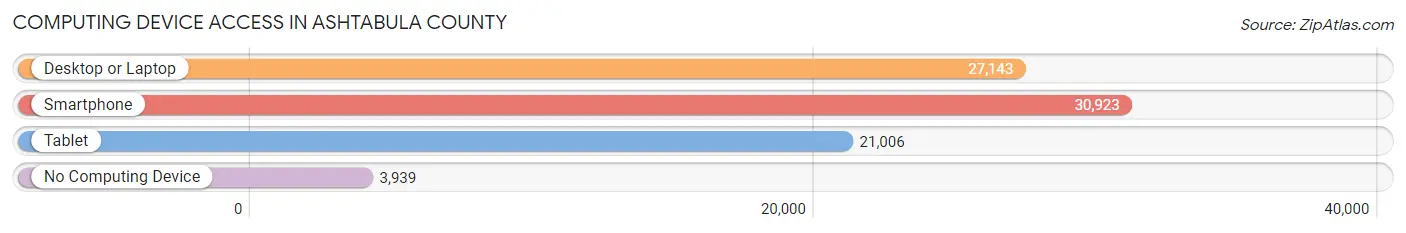
| Device Type | # Households | % Households |
| Desktop or Laptop | 27,143 | 70.4% |
| Smartphone | 30,923 | 80.2% |
| Tablet | 21,006 | 54.5% |
| No Computing Device | 3,939 | 10.2% |
| Total | 38,549 | 100.0% |
Internet Access in Ashtabula County
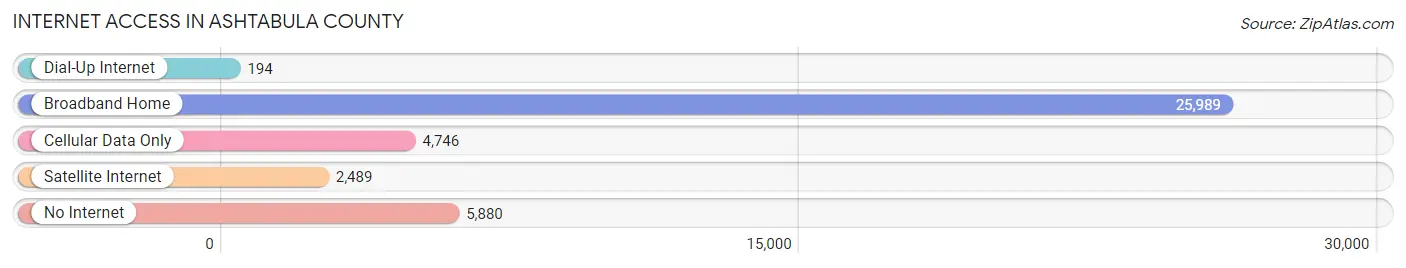
| Internet Type | # Households | % Households |
| Dial-Up Internet | 194 | 0.5% |
| Broadband Home | 25,989 | 67.4% |
| Cellular Data Only | 4,746 | 12.3% |
| Satellite Internet | 2,489 | 6.5% |
| No Internet | 5,880 | 15.2% |
| Total | 38,549 | 100.0% |
Ashtabula County Summary
Ashtabula County is located in the northeastern corner of Ohio, along the shores of Lake Erie. It is bordered by Lake County to the north, Trumbull County to the east, Geauga County to the south, and Cuyahoga County to the west. The county seat is Jefferson, and the largest city is Ashtabula. The county was established in 1807 and named for the Ashtabula River, which flows through the county.
History
The area that is now Ashtabula County was originally inhabited by the Iroquois and Erie Native American tribes. The first European settlers arrived in the area in the late 1700s, and the county was officially established in 1807. The county was named for the Ashtabula River, which flows through the county.
In the early 1800s, the county was largely agricultural, with the main crops being wheat, corn, and oats. The county also had a thriving lumber industry, with many sawmills located along the Ashtabula River. In the mid-1800s, the county began to industrialize, with the development of iron and steel mills, as well as coal mines.
The county was also home to several Underground Railroad stations, which were used to help escaped slaves reach freedom in Canada. The county was also home to several abolitionists, including John Brown, who was born in Torrington in 1805.
Geography
Ashtabula County is located in the northeastern corner of Ohio, along the shores of Lake Erie. It is bordered by Lake County to the north, Trumbull County to the east, Geauga County to the south, and Cuyahoga County to the west. The county has a total area of 1,368 square miles, of which 1,068 square miles is land and 300 square miles is water.
The county is mostly flat, with rolling hills in the western part of the county. The highest point in the county is located in the western part of the county, at an elevation of 1,092 feet. The county is drained by the Ashtabula River, which flows through the county from north to south.
Economy
The economy of Ashtabula County is largely based on manufacturing and agriculture. The county is home to several manufacturing companies, including steel mills, automotive parts manufacturers, and food processing plants. The county is also home to several agricultural operations, including dairy farms, fruit and vegetable farms, and livestock farms.
The county is also home to several tourist attractions, including wineries, golf courses, and state parks. The county is also home to several marinas, which provide access to Lake Erie.
Demographics
As of the 2010 census, the population of Ashtabula County was 101,497. The population is largely white (93.3%), with small percentages of African Americans (2.7%), Hispanics (1.3%), and Asians (0.7%). The median household income in the county is $45,945, and the median home value is $112,400. The county has a poverty rate of 14.3%.
The largest city in the county is Ashtabula, with a population of 19,124. Other cities in the county include Jefferson (population 8,845), Geneva (population 5,743), and Conneaut (population 4,837).
Conclusion
Ashtabula County is located in the northeastern corner of Ohio, along the shores of Lake Erie. It has a long history, dating back to the early 1800s, when it was largely agricultural. Today, the county is home to several manufacturing and agricultural operations, as well as several tourist attractions. The population of the county is largely white, with a median household income of $45,945 and a poverty rate of 14.3%. Ashtabula County is a vibrant and diverse county, with a rich history and a bright future.
Common Questions
What is the Total Population of Ashtabula County?
Total Population of Ashtabula County is 97,666.
What is the Total Male Population of Ashtabula County?
Total Male Population of Ashtabula County is 49,966.
What is the Total Female Population of Ashtabula County?
Total Female Population of Ashtabula County is 47,700.
What is the Ratio of Males per 100 Females in Ashtabula County?
There are 104.75 Males per 100 Females in Ashtabula County.
What is the Ratio of Females per 100 Males in Ashtabula County?
There are 95.46 Females per 100 Males in Ashtabula County.
What is the Median Population Age in Ashtabula County?
Median Population Age in Ashtabula County is 42.6 Years.
What is the Average Family Size in Ashtabula County
Average Family Size in Ashtabula County is 3.1 People.
What is the Average Household Size in Ashtabula County
Average Household Size in Ashtabula County is 2.5 People.
What is Per Capita Income in Ashtabula County?
Per Capita income in Ashtabula County is $29,586.
What is the Median Family Income in Ashtabula County?
Median Family Income in Ashtabula County is $68,475.
What is the Median Household income in Ashtabula County?
Median Household Income in Ashtabula County is $53,663.
What is Income or Wage Gap in Ashtabula County?
Income or Wage Gap in Ashtabula County is 32.1%.
Women in Ashtabula County earn 67.9 cents for every dollar earned by a man.
What is Family Income Deficit in Ashtabula County?
Family Income Deficit in Ashtabula County is $9,186.
Families that are below poverty line in Ashtabula County earn $9,186 less on average than the poverty threshold level.
What is Inequality or Gini Index in Ashtabula County?
Inequality or Gini Index in Ashtabula County is 0.45.
How Large is the Labor Force in Ashtabula County?
There are 45,627 People in the Labor Forcein in Ashtabula County.
What is the Percentage of People in the Labor Force in Ashtabula County?
57.9% of People are in the Labor Force in Ashtabula County.
What is the Unemployment Rate in Ashtabula County?
Unemployment Rate in Ashtabula County is 7.6%.