Allen County, OH
Allen County Map
Allen County Overview
102,087
TOTAL POPULATION
51,158
MALE POPULATION
50,929
FEMALE POPULATION
100.45
MALES / 100 FEMALES
99.55
FEMALES / 100 MALES
39.8
MEDIAN AGE
3.1
AVG FAMILY SIZE
2.4
AVG HOUSEHOLD SIZE
$31,523
PER CAPITA INCOME
$76,264
AVG FAMILY INCOME
$58,976
AVG HOUSEHOLD INCOME
34.8%
WAGE / INCOME GAP [ % ]
65.2¢/ $1
WAGE / INCOME GAP [ $ ]
$11,191
FAMILY INCOME DEFICIT
0.43
INEQUALITY / GINI INDEX
49,301
LABOR FORCE [ PEOPLE ]
61.0%
PERCENT IN LABOR FORCE
6.1%
UNEMPLOYMENT RATE
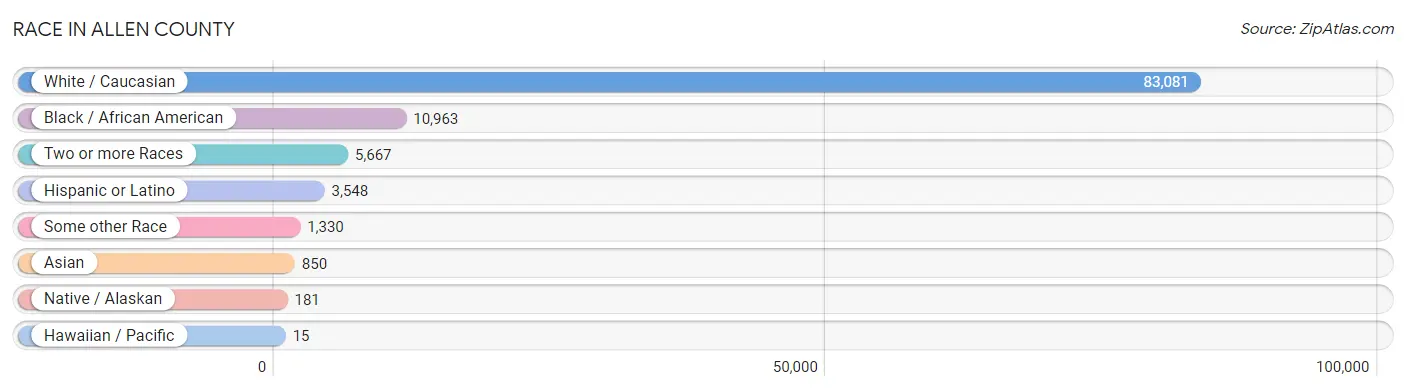
Race in Allen County
The most populous races in Allen County are White / Caucasian (83,081 | 81.4%), Black / African American (10,963 | 10.7%), and Two or more Races (5,667 | 5.6%).
| Race | # Population | % Population |
| Asian | 850 | 0.8% |
| Black / African American | 10,963 | 10.7% |
| Hawaiian / Pacific | 15 | 0.0% |
| Hispanic or Latino | 3,548 | 3.5% |
| Native / Alaskan | 181 | 0.2% |
| White / Caucasian | 83,081 | 81.4% |
| Two or more Races | 5,667 | 5.6% |
| Some other Race | 1,330 | 1.3% |
| Total | 102,087 | 100.0% |
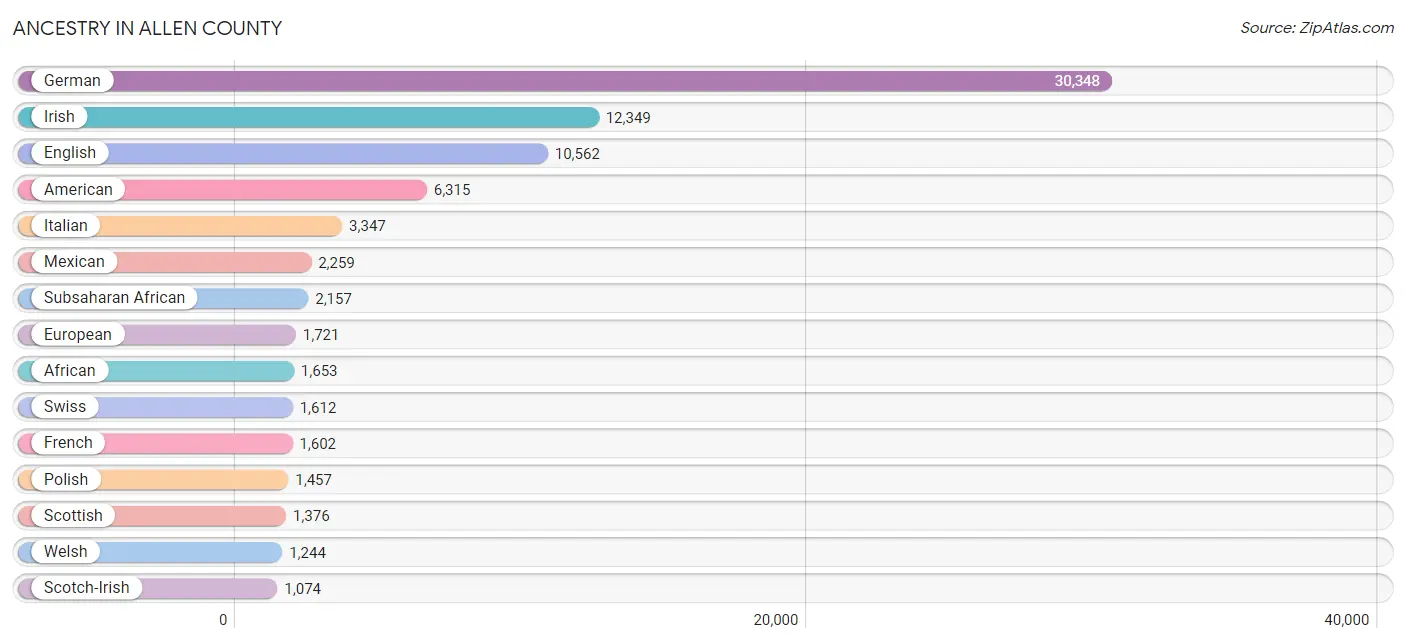
Ancestry in Allen County
The most populous ancestries reported in Allen County are German (30,348 | 29.7%), Irish (12,349 | 12.1%), English (10,562 | 10.3%), American (6,315 | 6.2%), and Italian (3,347 | 3.3%), together accounting for 61.7% of all Allen County residents.
| Ancestry | # Population | % Population |
| African | 1,653 | 1.6% |
| Alaskan Athabascan | 13 | 0.0% |
| American | 6,315 | 6.2% |
| Apache | 17 | 0.0% |
| Arab | 147 | 0.1% |
| Austrian | 19 | 0.0% |
| Belgian | 22 | 0.0% |
| Bhutanese | 83 | 0.1% |
| Blackfeet | 688 | 0.7% |
| Brazilian | 57 | 0.1% |
| British | 593 | 0.6% |
| Burmese | 167 | 0.2% |
| Cajun | 7 | 0.0% |
| Canadian | 62 | 0.1% |
| Central American | 237 | 0.2% |
| Cherokee | 533 | 0.5% |
| Chilean | 46 | 0.1% |
| Chippewa | 11 | 0.0% |
| Choctaw | 26 | 0.0% |
| Colombian | 43 | 0.0% |
| Croatian | 56 | 0.1% |
| Cuban | 60 | 0.1% |
| Czech | 121 | 0.1% |
| Czechoslovakian | 142 | 0.1% |
| Danish | 127 | 0.1% |
| Dominican | 1 | 0.0% |
| Dutch | 994 | 1.0% |
| Eastern European | 42 | 0.0% |
| Egyptian | 7 | 0.0% |
| English | 10,562 | 10.3% |
| Ethiopian | 354 | 0.4% |
| European | 1,721 | 1.7% |
| Finnish | 81 | 0.1% |
| French | 1,602 | 1.6% |
| French Canadian | 145 | 0.1% |
| German | 30,348 | 29.7% |
| Greek | 158 | 0.2% |
| Guatemalan | 149 | 0.2% |
| Guyanese | 5 | 0.0% |
| Haitian | 64 | 0.1% |
| Honduran | 4 | 0.0% |
| Hungarian | 253 | 0.3% |
| Indian (Asian) | 300 | 0.3% |
| Inupiat | 10 | 0.0% |
| Iranian | 10 | 0.0% |
| Irish | 12,349 | 12.1% |
| Iroquois | 24 | 0.0% |
| Italian | 3,347 | 3.3% |
| Jamaican | 217 | 0.2% |
| Japanese | 2 | 0.0% |
| Korean | 272 | 0.3% |
| Lebanese | 46 | 0.1% |
| Lithuanian | 129 | 0.1% |
| Lumbee | 8 | 0.0% |
| Luxembourger | 8 | 0.0% |
| Macedonian | 12 | 0.0% |
| Malaysian | 5 | 0.0% |
| Maltese | 1 | 0.0% |
| Mexican | 2,259 | 2.2% |
| Mexican American Indian | 25 | 0.0% |
| Moroccan | 8 | 0.0% |
| Native Hawaiian | 14 | 0.0% |
| Navajo | 14 | 0.0% |
| Nigerian | 150 | 0.2% |
| Northern European | 51 | 0.1% |
| Norwegian | 284 | 0.3% |
| Ottawa | 16 | 0.0% |
| Pakistani | 62 | 0.1% |
| Palestinian | 31 | 0.0% |
| Panamanian | 28 | 0.0% |
| Pennsylvania German | 291 | 0.3% |
| Polish | 1,457 | 1.4% |
| Portuguese | 47 | 0.1% |
| Puerto Rican | 492 | 0.5% |
| Romanian | 100 | 0.1% |
| Russian | 341 | 0.3% |
| Salvadoran | 56 | 0.1% |
| Samoan | 52 | 0.1% |
| Scandinavian | 175 | 0.2% |
| Scotch-Irish | 1,074 | 1.1% |
| Scottish | 1,376 | 1.3% |
| Serbian | 6 | 0.0% |
| Sioux | 27 | 0.0% |
| Slavic | 31 | 0.0% |
| Slovak | 172 | 0.2% |
| Slovene | 66 | 0.1% |
| South American | 89 | 0.1% |
| Spaniard | 172 | 0.2% |
| Spanish | 116 | 0.1% |
| Sri Lankan | 34 | 0.0% |
| Subsaharan African | 2,157 | 2.1% |
| Swedish | 513 | 0.5% |
| Swiss | 1,612 | 1.6% |
| Syrian | 18 | 0.0% |
| Thai | 229 | 0.2% |
| Trinidadian and Tobagonian | 6 | 0.0% |
| Turkish | 33 | 0.0% |
| Ukrainian | 33 | 0.0% |
| Welsh | 1,244 | 1.2% |
| West Indian | 26 | 0.0% |
| Zimbabwean | 24 | 0.0% | View All 101 Rows |
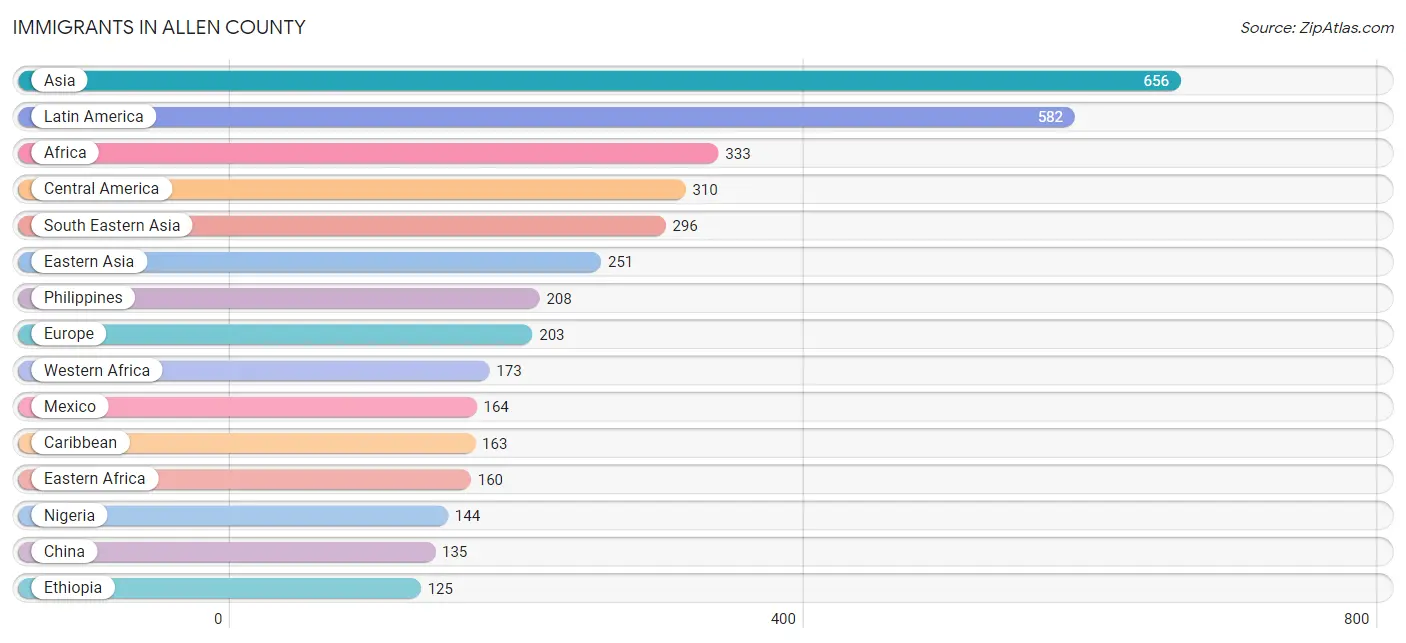
Immigrants in Allen County
The most numerous immigrant groups reported in Allen County came from Asia (656 | 0.6%), Latin America (582 | 0.6%), Africa (333 | 0.3%), Central America (310 | 0.3%), and South Eastern Asia (296 | 0.3%), together accounting for 2.1% of all Allen County residents.
| Immigration Origin | # Population | % Population |
| Africa | 333 | 0.3% |
| Asia | 656 | 0.6% |
| Barbados | 4 | 0.0% |
| Belize | 12 | 0.0% |
| Brazil | 64 | 0.1% |
| Canada | 73 | 0.1% |
| Caribbean | 163 | 0.2% |
| Central America | 310 | 0.3% |
| Chile | 29 | 0.0% |
| China | 135 | 0.1% |
| Colombia | 2 | 0.0% |
| Cuba | 16 | 0.0% |
| Czechoslovakia | 10 | 0.0% |
| Denmark | 9 | 0.0% |
| Eastern Africa | 160 | 0.2% |
| Eastern Asia | 251 | 0.3% |
| Eastern Europe | 70 | 0.1% |
| El Salvador | 29 | 0.0% |
| England | 58 | 0.1% |
| Ethiopia | 125 | 0.1% |
| Europe | 203 | 0.2% |
| Germany | 23 | 0.0% |
| Guatemala | 101 | 0.1% |
| Haiti | 48 | 0.1% |
| Honduras | 4 | 0.0% |
| Hungary | 23 | 0.0% |
| India | 51 | 0.1% |
| Iran | 10 | 0.0% |
| Israel | 31 | 0.0% |
| Italy | 4 | 0.0% |
| Jamaica | 78 | 0.1% |
| Japan | 11 | 0.0% |
| Korea | 105 | 0.1% |
| Latin America | 582 | 0.6% |
| Liberia | 29 | 0.0% |
| Malaysia | 14 | 0.0% |
| Mexico | 164 | 0.2% |
| Netherlands | 17 | 0.0% |
| Nigeria | 144 | 0.1% |
| Northern Europe | 89 | 0.1% |
| Oceania | 9 | 0.0% |
| Peru | 14 | 0.0% |
| Philippines | 208 | 0.2% |
| South America | 109 | 0.1% |
| South Central Asia | 61 | 0.1% |
| South Eastern Asia | 296 | 0.3% |
| Southern Europe | 4 | 0.0% |
| Sweden | 1 | 0.0% |
| Syria | 17 | 0.0% |
| Thailand | 47 | 0.1% |
| Trinidad and Tobago | 17 | 0.0% |
| Vietnam | 27 | 0.0% |
| Western Africa | 173 | 0.2% |
| Western Asia | 48 | 0.1% |
| Western Europe | 40 | 0.0% |
| Zimbabwe | 24 | 0.0% | View All 56 Rows |
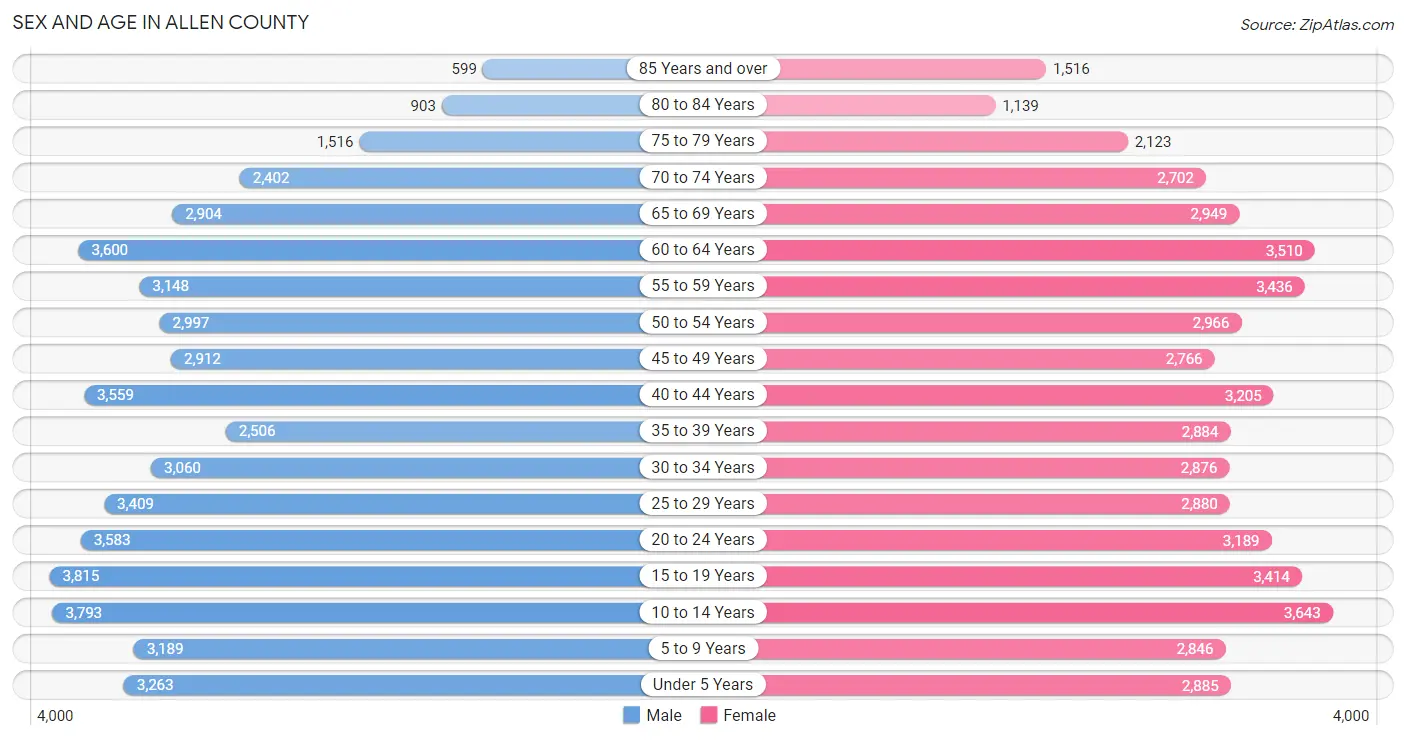
Sex and Age in Allen County
Sex and Age in Allen County
The most populous age groups in Allen County are 15 to 19 Years (3,815 | 7.5%) for men and 10 to 14 Years (3,643 | 7.1%) for women.
| Age Bracket | Male | Female |
| Under 5 Years | 3,263 (6.4%) | 2,885 (5.7%) |
| 5 to 9 Years | 3,189 (6.2%) | 2,846 (5.6%) |
| 10 to 14 Years | 3,793 (7.4%) | 3,643 (7.1%) |
| 15 to 19 Years | 3,815 (7.5%) | 3,414 (6.7%) |
| 20 to 24 Years | 3,583 (7.0%) | 3,189 (6.3%) |
| 25 to 29 Years | 3,409 (6.7%) | 2,880 (5.7%) |
| 30 to 34 Years | 3,060 (6.0%) | 2,876 (5.7%) |
| 35 to 39 Years | 2,506 (4.9%) | 2,884 (5.7%) |
| 40 to 44 Years | 3,559 (7.0%) | 3,205 (6.3%) |
| 45 to 49 Years | 2,912 (5.7%) | 2,766 (5.4%) |
| 50 to 54 Years | 2,997 (5.9%) | 2,966 (5.8%) |
| 55 to 59 Years | 3,148 (6.1%) | 3,436 (6.8%) |
| 60 to 64 Years | 3,600 (7.0%) | 3,510 (6.9%) |
| 65 to 69 Years | 2,904 (5.7%) | 2,949 (5.8%) |
| 70 to 74 Years | 2,402 (4.7%) | 2,702 (5.3%) |
| 75 to 79 Years | 1,516 (3.0%) | 2,123 (4.2%) |
| 80 to 84 Years | 903 (1.8%) | 1,139 (2.2%) |
| 85 Years and over | 599 (1.2%) | 1,516 (3.0%) |
| Total | 51,158 (100.0%) | 50,929 (100.0%) |
Families and Households in Allen County
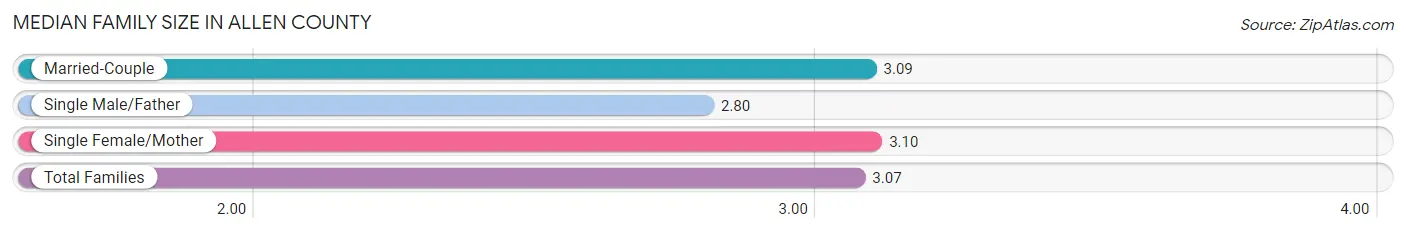
Median Family Size in Allen County
The median family size in Allen County is 3.07 persons per family, with single female/mother families (5,347 | 21.7%) accounting for the largest median family size of 3.1 persons per family. On the other hand, single male/father families (2,062 | 8.4%) represent the smallest median family size with 2.80 persons per family.
| Family Type | # Families | Family Size |
| Married-Couple | 17,260 (70.0%) | 3.09 |
| Single Male/Father | 2,062 (8.4%) | 2.80 |
| Single Female/Mother | 5,347 (21.7%) | 3.10 |
| Total Families | 24,669 (100.0%) | 3.07 |
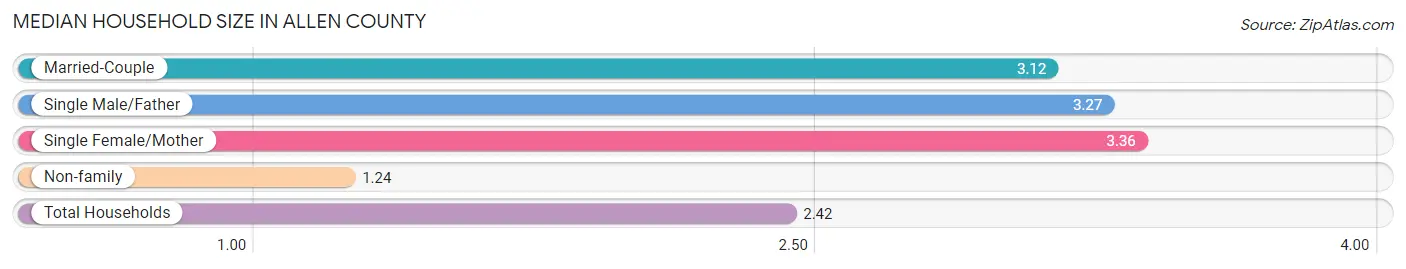
Median Household Size in Allen County
The median household size in Allen County is 2.42 persons per household, with single female/mother households (5,347 | 13.1%) accounting for the largest median household size of 3.36 persons per household. non-family households (16,066 | 39.4%) represent the smallest median household size with 1.24 persons per household.
| Household Type | # Households | Household Size |
| Married-Couple | 17,260 (42.4%) | 3.12 |
| Single Male/Father | 2,062 (5.1%) | 3.27 |
| Single Female/Mother | 5,347 (13.1%) | 3.36 |
| Non-family | 16,066 (39.4%) | 1.24 |
| Total Households | 40,735 (100.0%) | 2.42 |
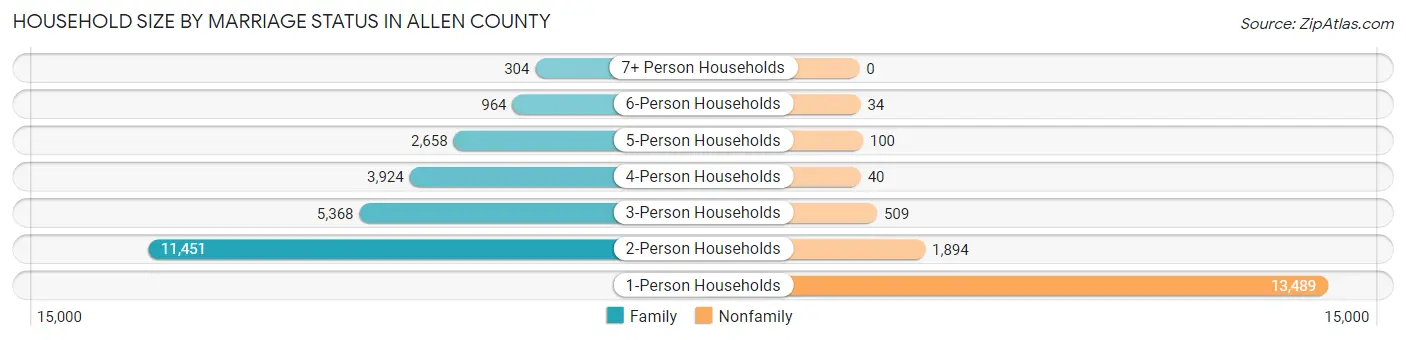
Household Size by Marriage Status in Allen County
Out of a total of 40,735 households in Allen County, 24,669 (60.6%) are family households, while 16,066 (39.4%) are nonfamily households. The most numerous type of family households are 2-person households, comprising 11,451, and the most common type of nonfamily households are 1-person households, comprising 13,489.
| Household Size | Family Households | Nonfamily Households |
| 1-Person Households | - | 13,489 (33.1%) |
| 2-Person Households | 11,451 (28.1%) | 1,894 (4.6%) |
| 3-Person Households | 5,368 (13.2%) | 509 (1.3%) |
| 4-Person Households | 3,924 (9.6%) | 40 (0.1%) |
| 5-Person Households | 2,658 (6.5%) | 100 (0.3%) |
| 6-Person Households | 964 (2.4%) | 34 (0.1%) |
| 7+ Person Households | 304 (0.7%) | 0 (0.0%) |
| Total | 24,669 (60.6%) | 16,066 (39.4%) |
Female Fertility in Allen County
Fertility by Age in Allen County
Average fertility rate in Allen County is 60.0 births per 1,000 women. Women in the age bracket of 20 to 34 years have the highest fertility rate with 120.0 births per 1,000 women. Women in the age bracket of 20 to 34 years acount for 82.5% of all women with births.
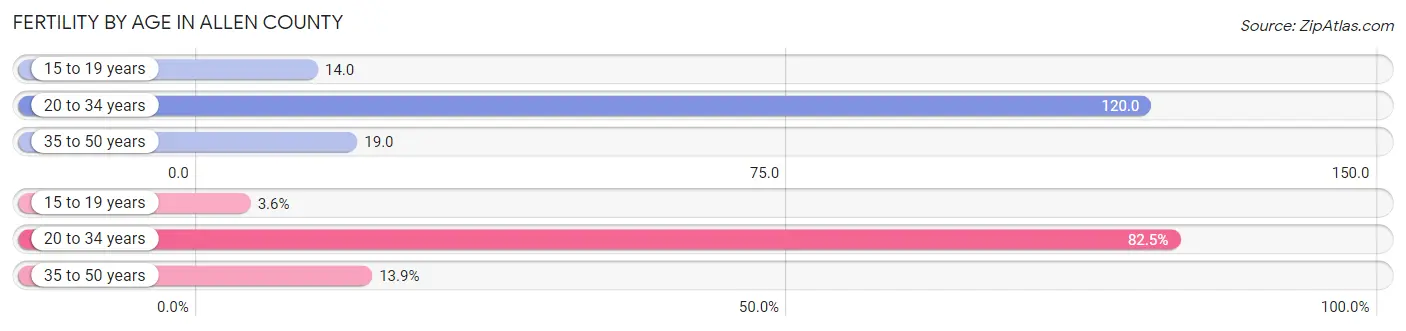
| Age Bracket | Women with Births | Births / 1,000 Women |
| 15 to 19 years | 47 (3.6%) | 14.0 |
| 20 to 34 years | 1,071 (82.5%) | 120.0 |
| 35 to 50 years | 181 (13.9%) | 19.0 |
| Total | 1,299 (100.0%) | 60.0 |
Fertility by Age by Marriage Status in Allen County
56.2% of women with births (1,299) in Allen County are married. The highest percentage of unmarried women with births falls into 15 to 19 years age bracket with 100.0% of them unmarried at the time of birth, while the lowest percentage of unmarried women with births belong to 35 to 50 years age bracket with 9.4% of them unmarried.
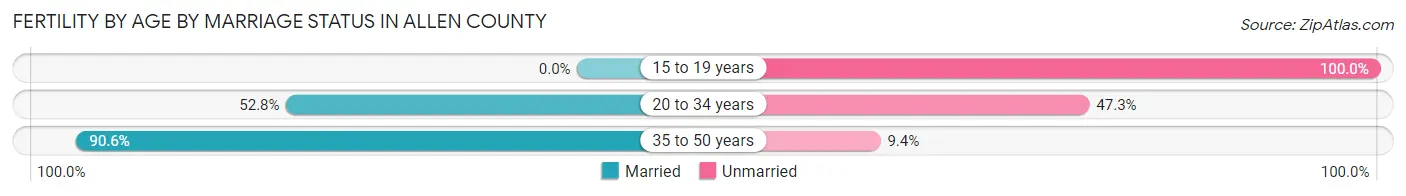
| Age Bracket | Married | Unmarried |
| 15 to 19 years | 0 (0.0%) | 47 (100.0%) |
| 20 to 34 years | 565 (52.7%) | 506 (47.2%) |
| 35 to 50 years | 164 (90.6%) | 17 (9.4%) |
| Total | 730 (56.2%) | 569 (43.8%) |
Fertility by Education in Allen County
Average fertility rate in Allen County is 60.0 births per 1,000 women. Women with the education attainment of graduate degree have the highest fertility rate of 79.0 births per 1,000 women, while women with the education attainment of less than high school have the lowest fertility at 38.0 births per 1,000 women. Women with the education attainment of college or associate's degree represent 33.7% of all women with births.
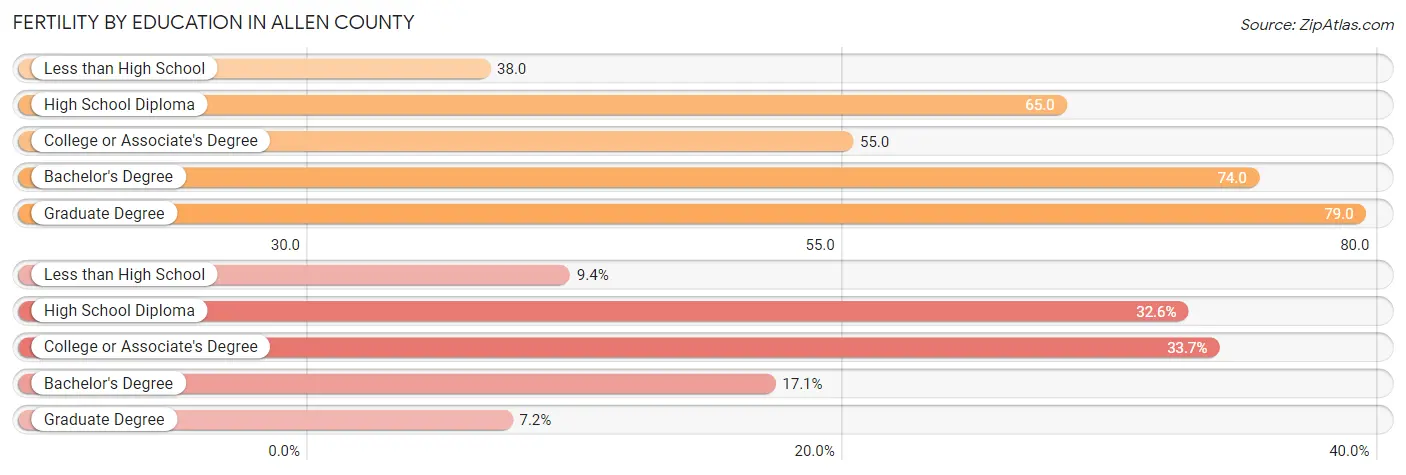
| Educational Attainment | Women with Births | Births / 1,000 Women |
| Less than High School | 122 (9.4%) | 38.0 |
| High School Diploma | 423 (32.6%) | 65.0 |
| College or Associate's Degree | 438 (33.7%) | 55.0 |
| Bachelor's Degree | 222 (17.1%) | 74.0 |
| Graduate Degree | 94 (7.2%) | 79.0 |
| Total | 1,299 (100.0%) | 60.0 |
Fertility by Education by Marriage Status in Allen County
43.8% of women with births in Allen County are unmarried. Women with the educational attainment of bachelor's degree are most likely to be married with 96.0% of them married at childbirth, while women with the educational attainment of high school diploma are least likely to be married with 73.3% of them unmarried at childbirth.
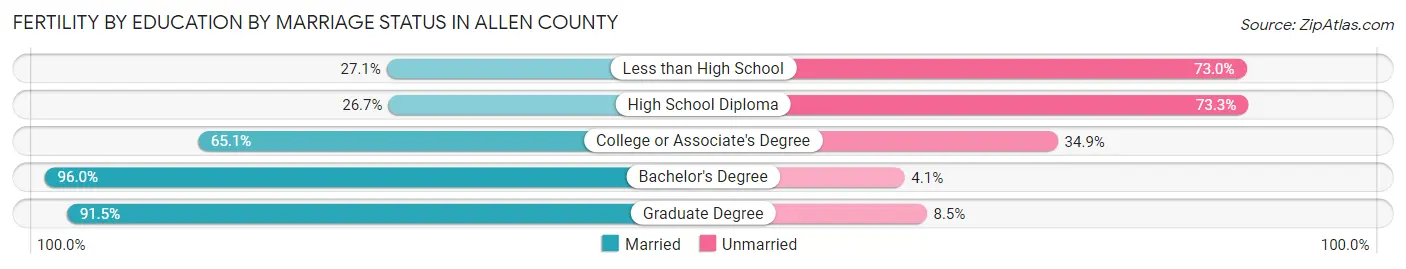
| Educational Attainment | Married | Unmarried |
| Less than High School | 33 (27.1%) | 89 (73.0%) |
| High School Diploma | 113 (26.7%) | 310 (73.3%) |
| College or Associate's Degree | 285 (65.1%) | 153 (34.9%) |
| Bachelor's Degree | 213 (96.0%) | 9 (4.1%) |
| Graduate Degree | 86 (91.5%) | 8 (8.5%) |
| Total | 730 (56.2%) | 569 (43.8%) |
Income in Allen County
Income Overview in Allen County
Per Capita Income in Allen County is $31,523, while median incomes of families and households are $76,264 and $58,976 respectively.
| Characteristic | Number | Measure |
| Per Capita Income | 102,087 | $31,523 |
| Median Family Income | 24,669 | $76,264 |
| Mean Family Income | 24,669 | $92,686 |
| Median Household Income | 40,735 | $58,976 |
| Mean Household Income | 40,735 | $76,592 |
| Income Deficit | 24,669 | $11,191 |
| Wage / Income Gap (%) | 102,087 | 34.84% |
| Wage / Income Gap ($) | 102,087 | 65.16¢ per $1 |
| Gini / Inequality Index | 102,087 | 0.43 |
Earnings by Sex in Allen County
Average Earnings in Allen County are $36,032, $45,616 for men and $29,722 for women, a difference of 34.8%.
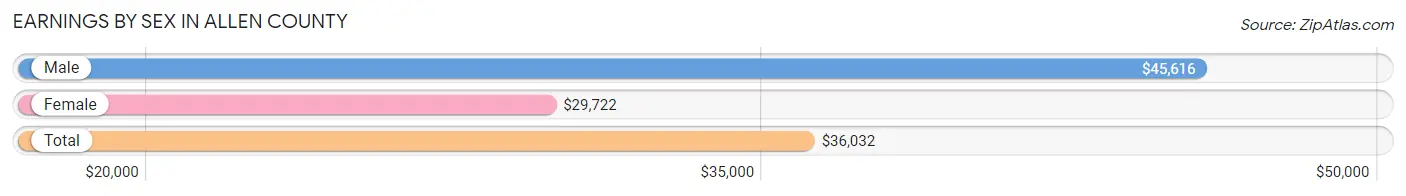
| Sex | Number | Average Earnings |
| Male | 26,889 (52.1%) | $45,616 |
| Female | 24,691 (47.9%) | $29,722 |
| Total | 51,580 (100.0%) | $36,032 |
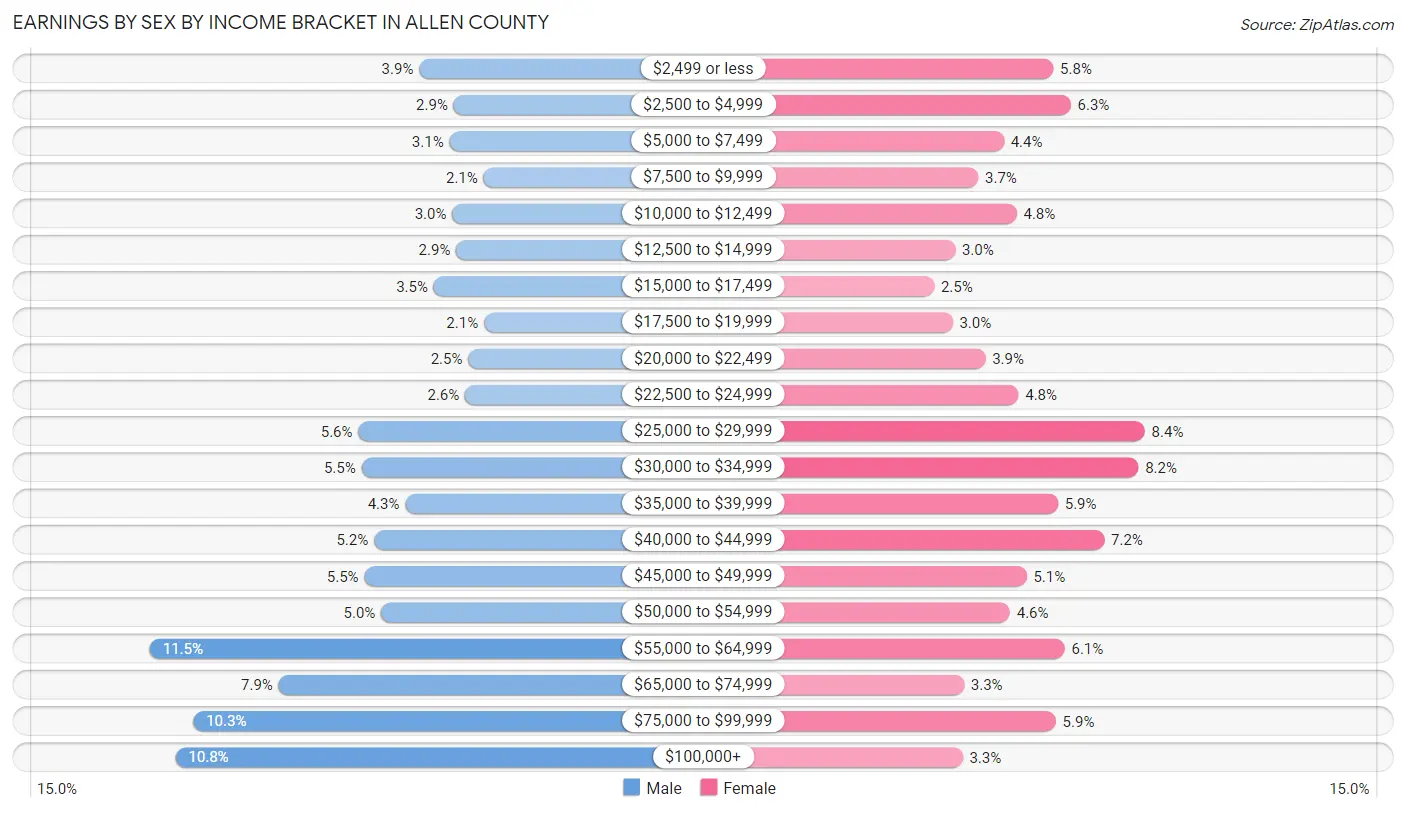
Earnings by Sex by Income Bracket in Allen County
The most common earnings brackets in Allen County are $55,000 to $64,999 for men (3,088 | 11.5%) and $25,000 to $29,999 for women (2,066 | 8.4%).
| Income | Male | Female |
| $2,499 or less | 1,051 (3.9%) | 1,432 (5.8%) |
| $2,500 to $4,999 | 791 (2.9%) | 1,553 (6.3%) |
| $5,000 to $7,499 | 822 (3.1%) | 1,090 (4.4%) |
| $7,500 to $9,999 | 564 (2.1%) | 910 (3.7%) |
| $10,000 to $12,499 | 800 (3.0%) | 1,178 (4.8%) |
| $12,500 to $14,999 | 771 (2.9%) | 751 (3.0%) |
| $15,000 to $17,499 | 940 (3.5%) | 605 (2.5%) |
| $17,500 to $19,999 | 562 (2.1%) | 733 (3.0%) |
| $20,000 to $22,499 | 679 (2.5%) | 961 (3.9%) |
| $22,500 to $24,999 | 704 (2.6%) | 1,190 (4.8%) |
| $25,000 to $29,999 | 1,511 (5.6%) | 2,066 (8.4%) |
| $30,000 to $34,999 | 1,486 (5.5%) | 2,021 (8.2%) |
| $35,000 to $39,999 | 1,155 (4.3%) | 1,463 (5.9%) |
| $40,000 to $44,999 | 1,393 (5.2%) | 1,785 (7.2%) |
| $45,000 to $49,999 | 1,466 (5.4%) | 1,246 (5.1%) |
| $50,000 to $54,999 | 1,340 (5.0%) | 1,132 (4.6%) |
| $55,000 to $64,999 | 3,088 (11.5%) | 1,511 (6.1%) |
| $65,000 to $74,999 | 2,114 (7.9%) | 812 (3.3%) |
| $75,000 to $99,999 | 2,759 (10.3%) | 1,449 (5.9%) |
| $100,000+ | 2,893 (10.8%) | 803 (3.3%) |
| Total | 26,889 (100.0%) | 24,691 (100.0%) |
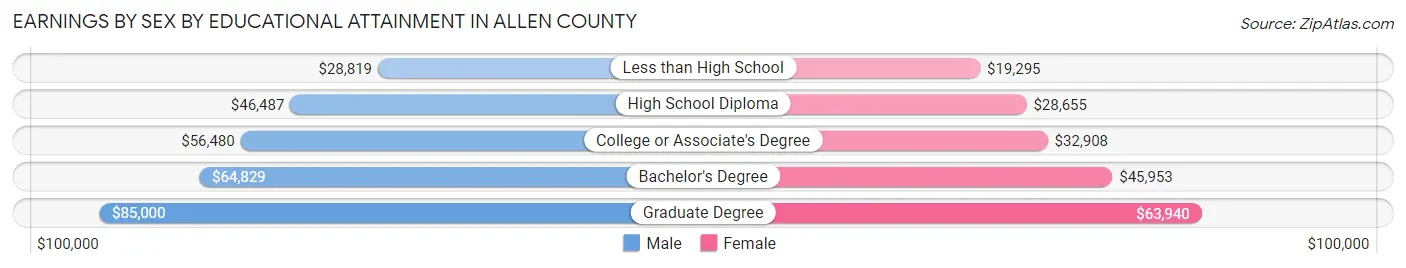
Earnings by Sex by Educational Attainment in Allen County
Average earnings in Allen County are $52,877 for men and $33,751 for women, a difference of 36.2%. Men with an educational attainment of graduate degree enjoy the highest average annual earnings of $85,000, while those with less than high school education earn the least with $28,819. Women with an educational attainment of graduate degree earn the most with the average annual earnings of $63,940, while those with less than high school education have the smallest earnings of $19,295.
| Educational Attainment | Male Income | Female Income |
| Less than High School | $28,819 | $19,295 |
| High School Diploma | $46,487 | $28,655 |
| College or Associate's Degree | $56,480 | $32,908 |
| Bachelor's Degree | $64,829 | $45,953 |
| Graduate Degree | $85,000 | $63,940 |
| Total | $52,877 | $33,751 |
Family Income in Allen County
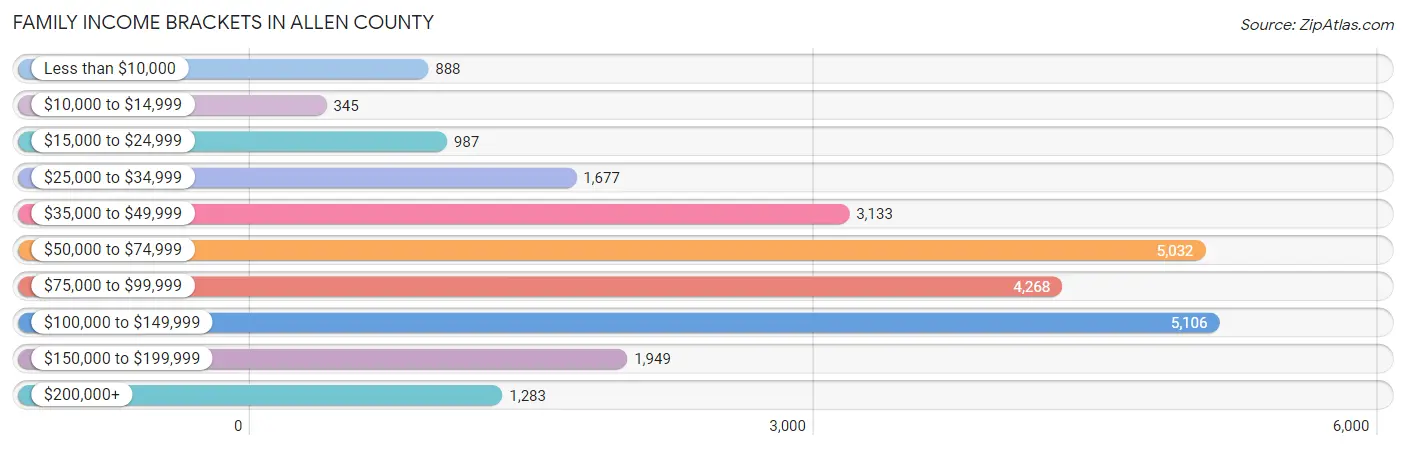
Family Income Brackets in Allen County
According to the Allen County family income data, there are 5,106 families falling into the $100,000 to $149,999 income range, which is the most common income bracket and makes up 20.7% of all families. Conversely, the $10,000 to $14,999 income bracket is the least frequent group with only 345 families (1.4%) belonging to this category.
| Income Bracket | # Families | % Families |
| Less than $10,000 | 888 | 3.6% |
| $10,000 to $14,999 | 345 | 1.4% |
| $15,000 to $24,999 | 987 | 4.0% |
| $25,000 to $34,999 | 1,677 | 6.8% |
| $35,000 to $49,999 | 3,133 | 12.7% |
| $50,000 to $74,999 | 5,032 | 20.4% |
| $75,000 to $99,999 | 4,268 | 17.3% |
| $100,000 to $149,999 | 5,106 | 20.7% |
| $150,000 to $199,999 | 1,949 | 7.9% |
| $200,000+ | 1,283 | 5.2% |
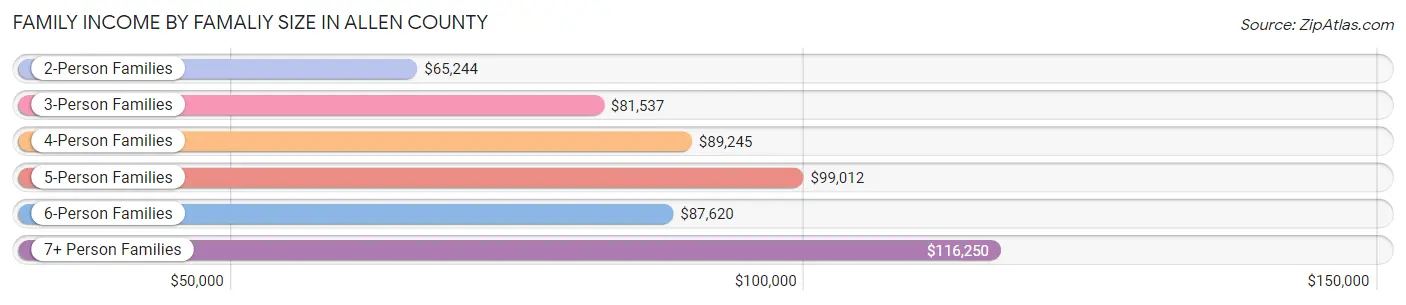
Family Income by Famaliy Size in Allen County
7+ person families (234 | 0.9%) account for the highest median family income in Allen County with $116,250 per family, while 2-person families (12,564 | 50.9%) have the highest median income of $32,622 per family member.
| Income Bracket | # Families | Median Income |
| 2-Person Families | 12,564 (50.9%) | $65,244 |
| 3-Person Families | 5,197 (21.1%) | $81,537 |
| 4-Person Families | 3,539 (14.3%) | $89,245 |
| 5-Person Families | 2,262 (9.2%) | $99,012 |
| 6-Person Families | 873 (3.5%) | $87,620 |
| 7+ Person Families | 234 (0.9%) | $116,250 |
| Total | 24,669 (100.0%) | $76,264 |
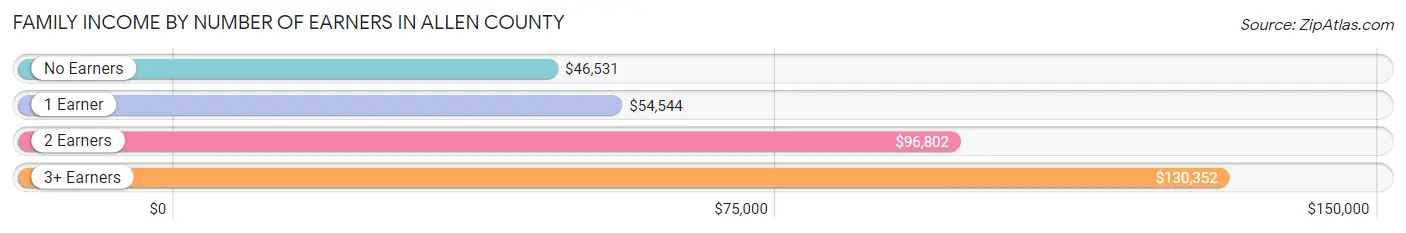
Family Income by Number of Earners in Allen County
The median family income in Allen County is $76,264, with families comprising 3+ earners (2,732) having the highest median family income of $130,352, while families with no earners (4,100) have the lowest median family income of $46,531, accounting for 11.1% and 16.6% of families, respectively.
| Number of Earners | # Families | Median Income |
| No Earners | 4,100 (16.6%) | $46,531 |
| 1 Earner | 8,254 (33.5%) | $54,544 |
| 2 Earners | 9,583 (38.9%) | $96,802 |
| 3+ Earners | 2,732 (11.1%) | $130,352 |
| Total | 24,669 (100.0%) | $76,264 |
Household Income in Allen County
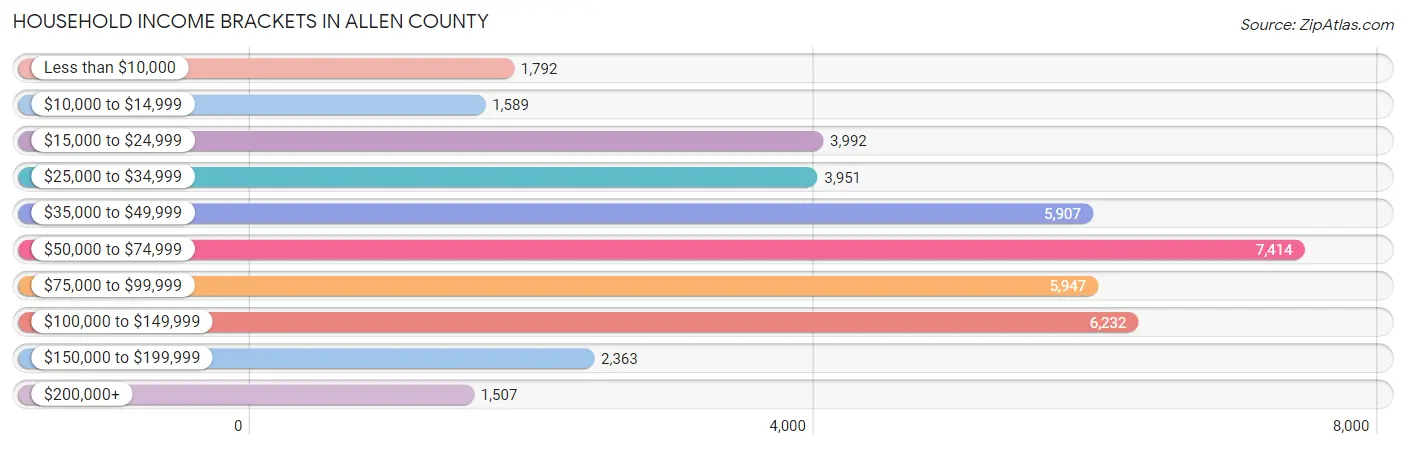
Household Income Brackets in Allen County
With 7,414 households falling in the category, the $50,000 to $74,999 income range is the most frequent in Allen County, accounting for 18.2% of all households. In contrast, only 1,507 households (3.7%) fall into the $200,000+ income bracket, making it the least populous group.
| Income Bracket | # Households | % Households |
| Less than $10,000 | 1,792 | 4.4% |
| $10,000 to $14,999 | 1,589 | 3.9% |
| $15,000 to $24,999 | 3,992 | 9.8% |
| $25,000 to $34,999 | 3,951 | 9.7% |
| $35,000 to $49,999 | 5,907 | 14.5% |
| $50,000 to $74,999 | 7,414 | 18.2% |
| $75,000 to $99,999 | 5,947 | 14.6% |
| $100,000 to $149,999 | 6,232 | 15.3% |
| $150,000 to $199,999 | 2,363 | 5.8% |
| $200,000+ | 1,507 | 3.7% |
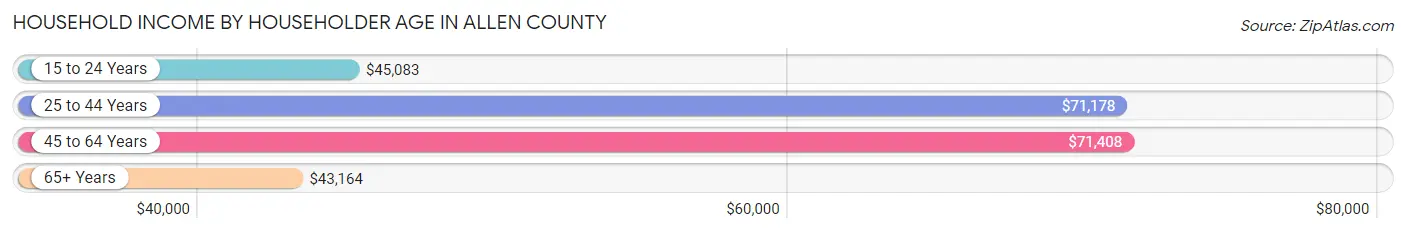
Household Income by Householder Age in Allen County
The median household income in Allen County is $58,976, with the highest median household income of $71,408 found in the 45 to 64 years age bracket for the primary householder. A total of 14,694 households (36.1%) fall into this category. Meanwhile, the 65+ years age bracket for the primary householder has the lowest median household income of $43,164, with 12,040 households (29.6%) in this group.
| Income Bracket | # Households | Median Income |
| 15 to 24 Years | 1,983 (4.9%) | $45,083 |
| 25 to 44 Years | 12,018 (29.5%) | $71,178 |
| 45 to 64 Years | 14,694 (36.1%) | $71,408 |
| 65+ Years | 12,040 (29.6%) | $43,164 |
| Total | 40,735 (100.0%) | $58,976 |
Poverty in Allen County
Income Below Poverty by Sex and Age in Allen County
With 11.2% poverty level for males and 13.4% for females among the residents of Allen County, 16 and 17 year old males and 5 year old females are the most vulnerable to poverty, with 248 males (20.2%) and 117 females (22.9%) in their respective age groups living below the poverty level.
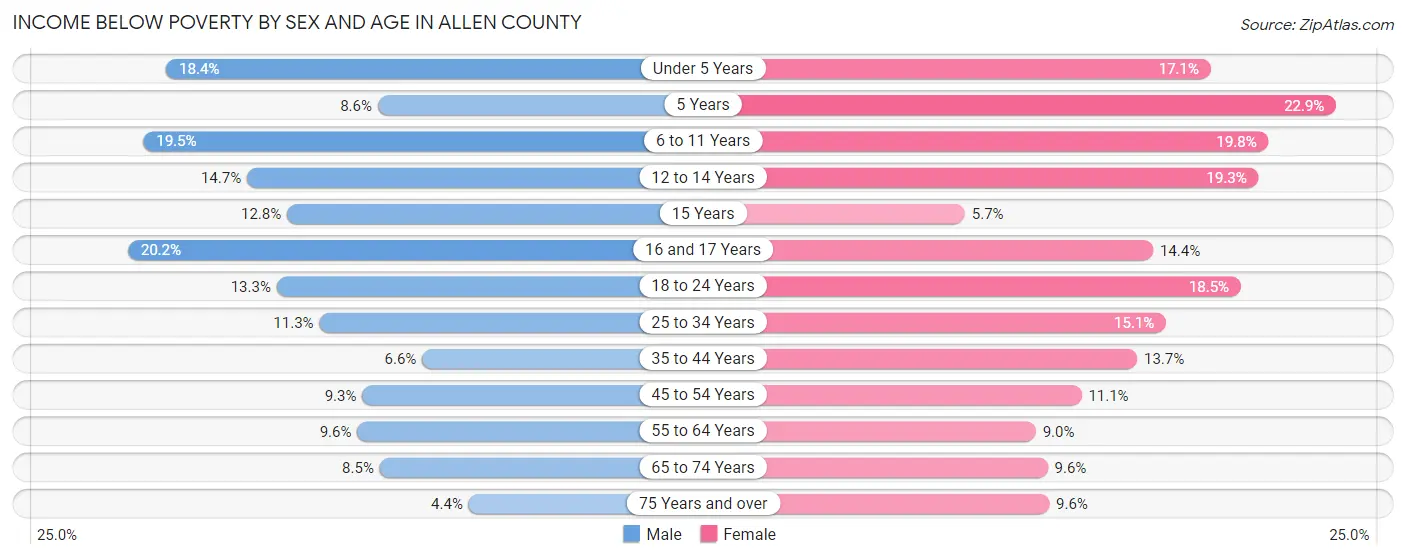
| Age Bracket | Male | Female |
| Under 5 Years | 575 (18.4%) | 486 (17.1%) |
| 5 Years | 52 (8.6%) | 117 (22.9%) |
| 6 to 11 Years | 719 (19.5%) | 701 (19.8%) |
| 12 to 14 Years | 329 (14.7%) | 427 (19.3%) |
| 15 Years | 119 (12.8%) | 41 (5.7%) |
| 16 and 17 Years | 248 (20.2%) | 205 (14.4%) |
| 18 to 24 Years | 598 (13.3%) | 795 (18.5%) |
| 25 to 34 Years | 697 (11.3%) | 865 (15.0%) |
| 35 to 44 Years | 377 (6.6%) | 833 (13.7%) |
| 45 to 54 Years | 504 (9.3%) | 635 (11.1%) |
| 55 to 64 Years | 620 (9.6%) | 622 (9.0%) |
| 65 to 74 Years | 432 (8.5%) | 529 (9.6%) |
| 75 Years and over | 125 (4.4%) | 430 (9.6%) |
| Total | 5,395 (11.2%) | 6,686 (13.4%) |
Income Above Poverty by Sex and Age in Allen County
According to the poverty statistics in Allen County, males aged 75 years and over and females aged 15 years are the age groups that are most secure financially, with 95.6% of males and 94.3% of females in these age groups living above the poverty line.
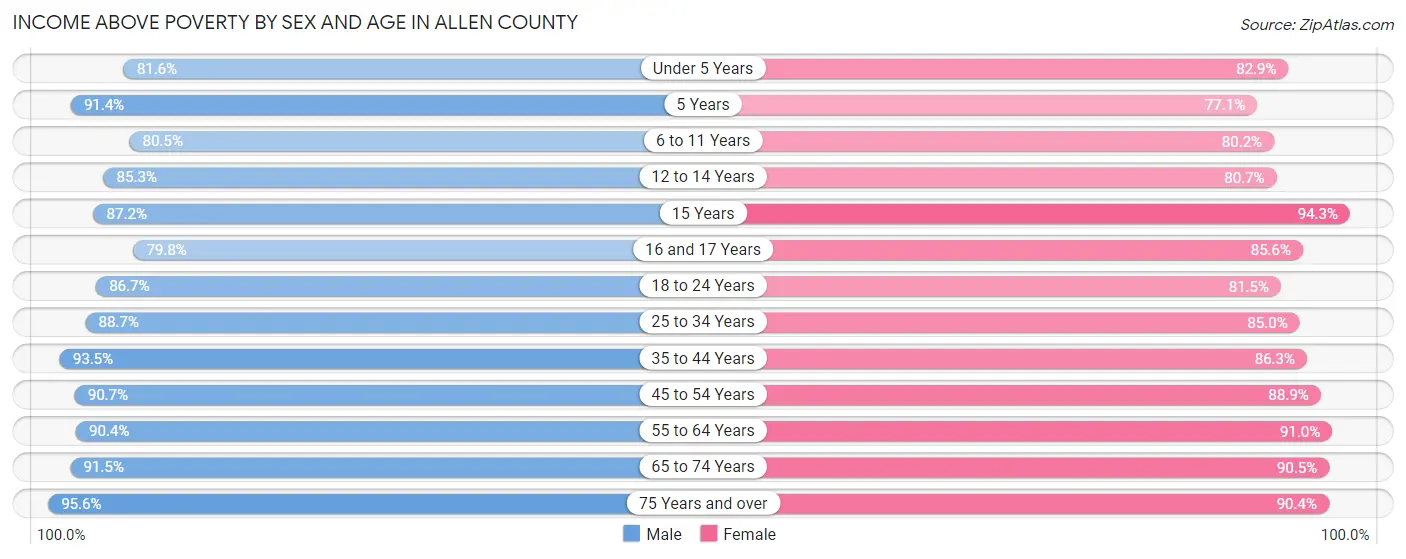
| Age Bracket | Male | Female |
| Under 5 Years | 2,545 (81.6%) | 2,352 (82.9%) |
| 5 Years | 552 (91.4%) | 393 (77.1%) |
| 6 to 11 Years | 2,971 (80.5%) | 2,840 (80.2%) |
| 12 to 14 Years | 1,912 (85.3%) | 1,781 (80.7%) |
| 15 Years | 809 (87.2%) | 677 (94.3%) |
| 16 and 17 Years | 979 (79.8%) | 1,215 (85.6%) |
| 18 to 24 Years | 3,899 (86.7%) | 3,498 (81.5%) |
| 25 to 34 Years | 5,460 (88.7%) | 4,881 (85.0%) |
| 35 to 44 Years | 5,383 (93.4%) | 5,246 (86.3%) |
| 45 to 54 Years | 4,899 (90.7%) | 5,076 (88.9%) |
| 55 to 64 Years | 5,865 (90.4%) | 6,292 (91.0%) |
| 65 to 74 Years | 4,636 (91.5%) | 5,012 (90.4%) |
| 75 Years and over | 2,724 (95.6%) | 4,039 (90.4%) |
| Total | 42,634 (88.8%) | 43,302 (86.6%) |
Income Below Poverty Among Married-Couple Families in Allen County
The poverty statistics for married-couple families in Allen County show that 3.4% or 590 of the total 17,260 families live below the poverty line. Families with 5 or more children have the highest poverty rate of 7.9%, comprising of 9 families. On the other hand, families with no children have the lowest poverty rate of 2.2%, which includes 239 families.

| Children | Above Poverty | Below Poverty |
| No Children | 10,437 (97.8%) | 239 (2.2%) |
| 1 or 2 Children | 4,418 (95.2%) | 224 (4.8%) |
| 3 or 4 Children | 1,710 (93.5%) | 118 (6.5%) |
| 5 or more Children | 105 (92.1%) | 9 (7.9%) |
| Total | 16,670 (96.6%) | 590 (3.4%) |
Income Below Poverty Among Single-Parent Households in Allen County
According to the poverty data in Allen County, 9.4% or 193 single-father households and 24.8% or 1,328 single-mother households are living below the poverty line. Among single-father households, those with 1 or 2 children have the highest poverty rate, with 159 households (14.6%) experiencing poverty. Likewise, among single-mother households, those with 5 or more children have the highest poverty rate, with 40 households (100.0%) falling below the poverty line.
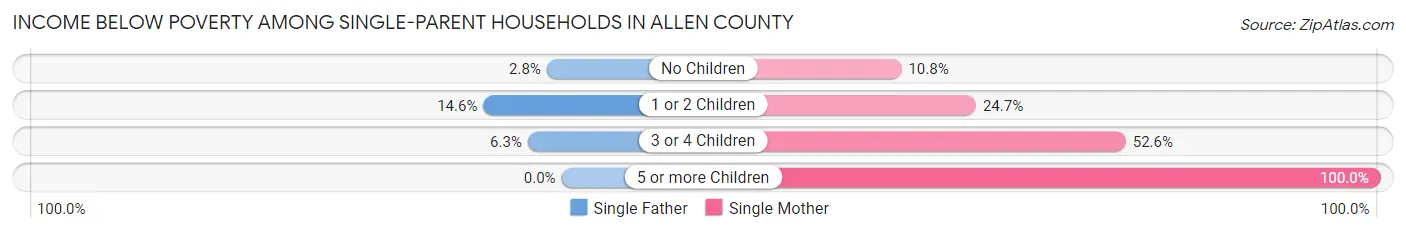
| Children | Single Father | Single Mother |
| No Children | 21 (2.8%) | 177 (10.8%) |
| 1 or 2 Children | 159 (14.6%) | 719 (24.6%) |
| 3 or 4 Children | 13 (6.3%) | 392 (52.5%) |
| 5 or more Children | 0 (0.0%) | 40 (100.0%) |
| Total | 193 (9.4%) | 1,328 (24.8%) |
Income Below Poverty Among Married-Couple vs Single-Parent Households in Allen County
The poverty data for Allen County shows that 590 of the married-couple family households (3.4%) and 1,521 of the single-parent households (20.5%) are living below the poverty level. Within the married-couple family households, those with 5 or more children have the highest poverty rate, with 9 households (7.9%) falling below the poverty line. Among the single-parent households, those with 5 or more children have the highest poverty rate, with 40 household (93.0%) living below poverty.
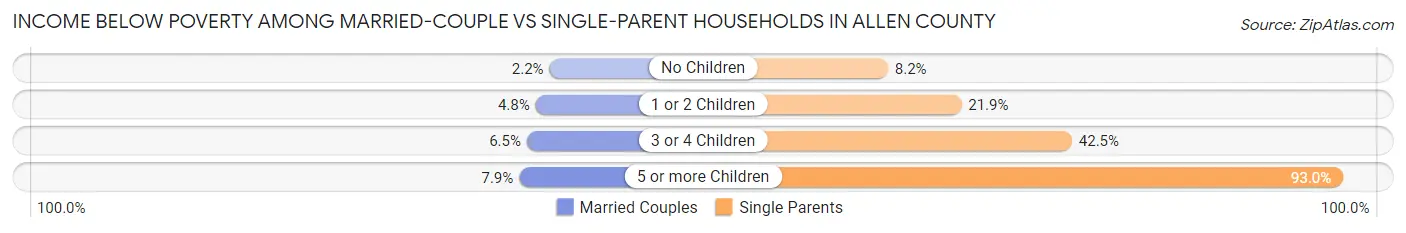
| Children | Married-Couple Families | Single-Parent Households |
| No Children | 239 (2.2%) | 198 (8.2%) |
| 1 or 2 Children | 224 (4.8%) | 878 (21.9%) |
| 3 or 4 Children | 118 (6.5%) | 405 (42.5%) |
| 5 or more Children | 9 (7.9%) | 40 (93.0%) |
| Total | 590 (3.4%) | 1,521 (20.5%) |
Employment Characteristics in Allen County
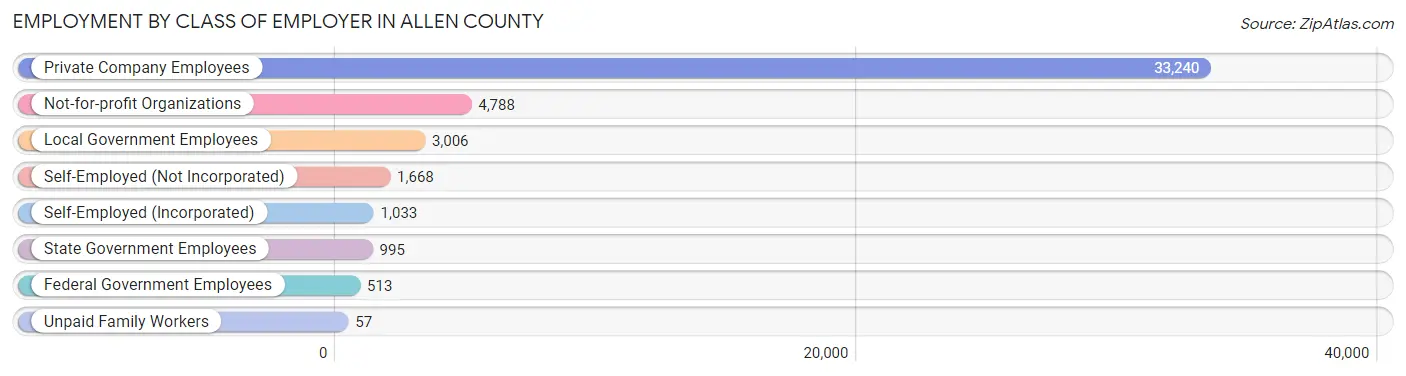
Employment by Class of Employer in Allen County
Among the 45,300 employed individuals in Allen County, private company employees (33,240 | 73.4%), not-for-profit organizations (4,788 | 10.6%), and local government employees (3,006 | 6.6%) make up the most common classes of employment.
| Employer Class | # Employees | % Employees |
| Private Company Employees | 33,240 | 73.4% |
| Self-Employed (Incorporated) | 1,033 | 2.3% |
| Self-Employed (Not Incorporated) | 1,668 | 3.7% |
| Not-for-profit Organizations | 4,788 | 10.6% |
| Local Government Employees | 3,006 | 6.6% |
| State Government Employees | 995 | 2.2% |
| Federal Government Employees | 513 | 1.1% |
| Unpaid Family Workers | 57 | 0.1% |
| Total | 45,300 | 100.0% |
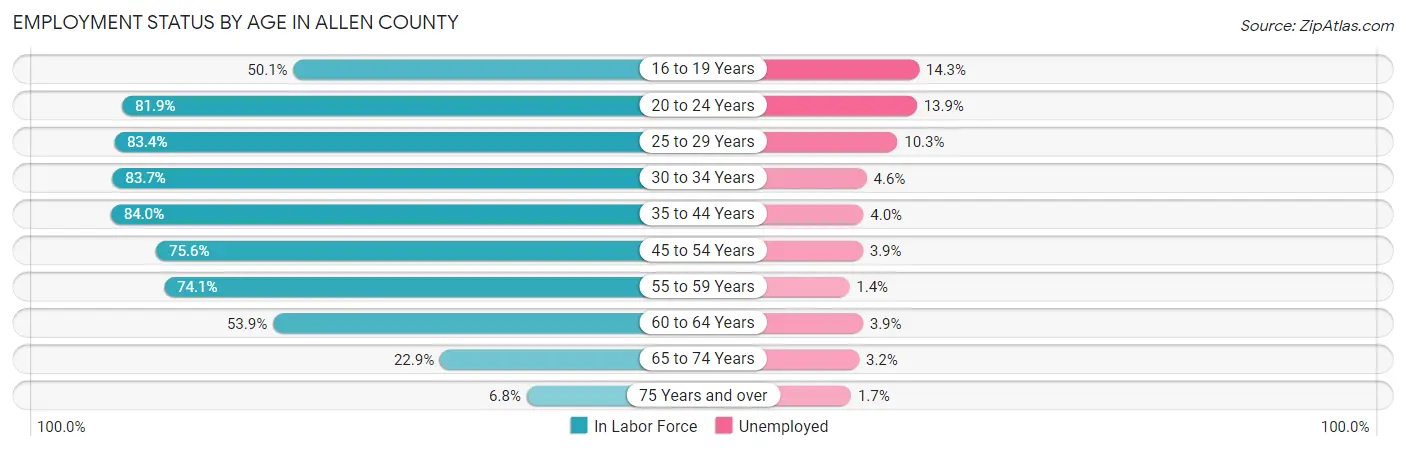
Employment Status by Age in Allen County
According to the labor force statistics for Allen County, out of the total population over 16 years of age (80,822), 61.0% or 49,301 individuals are in the labor force, with 6.1% or 3,007 of them unemployed. The age group with the highest labor force participation rate is 35 to 44 years, with 84.0% or 10,209 individuals in the labor force. Within the labor force, the 16 to 19 years age range has the highest percentage of unemployed individuals, with 14.3% or 400 of them being unemployed.
| Age Bracket | In Labor Force | Unemployed |
| 16 to 19 Years | 2,797 (50.1%) | 400 (14.3%) |
| 20 to 24 Years | 5,546 (81.9%) | 771 (13.9%) |
| 25 to 29 Years | 5,245 (83.4%) | 540 (10.3%) |
| 30 to 34 Years | 4,968 (83.7%) | 229 (4.6%) |
| 35 to 44 Years | 10,209 (84.0%) | 408 (4.0%) |
| 45 to 54 Years | 8,801 (75.6%) | 343 (3.9%) |
| 55 to 59 Years | 4,879 (74.1%) | 68 (1.4%) |
| 60 to 64 Years | 3,832 (53.9%) | 149 (3.9%) |
| 65 to 74 Years | 2,509 (22.9%) | 80 (3.2%) |
| 75 Years and over | 530 (6.8%) | 9 (1.7%) |
| Total | 49,301 (61.0%) | 3,007 (6.1%) |
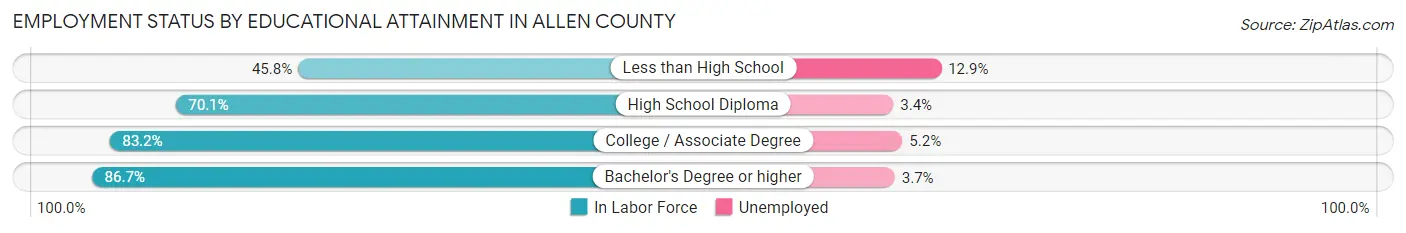
Employment Status by Educational Attainment in Allen County
According to labor force statistics for Allen County, 76.3% of individuals (37,932) out of the total population between 25 and 64 years of age (49,714) are in the labor force, with 4.6% or 1,745 of them being unemployed. The group with the highest labor force participation rate are those with the educational attainment of bachelor's degree or higher, with 86.7% or 8,477 individuals in the labor force. Within the labor force, individuals with less than high school education have the highest percentage of unemployment, with 12.9% or 212 of them being unemployed.
| Educational Attainment | In Labor Force | Unemployed |
| Less than High School | 1,642 (45.8%) | 463 (12.9%) |
| High School Diploma | 12,976 (70.1%) | 629 (3.4%) |
| College / Associate Degree | 14,844 (83.2%) | 928 (5.2%) |
| Bachelor's Degree or higher | 8,477 (86.7%) | 362 (3.7%) |
| Total | 37,932 (76.3%) | 2,287 (4.6%) |
Employment Occupations by Sex in Allen County
Management, Business, Science and Arts Occupations
The most common Management, Business, Science and Arts occupations in Allen County are Community & Social Service (3,939 | 8.5%), Management (3,631 | 7.9%), Health Diagnosing & Treating (3,109 | 6.7%), Education Instruction & Library (2,103 | 4.5%), and Health Technologists (1,994 | 4.3%).
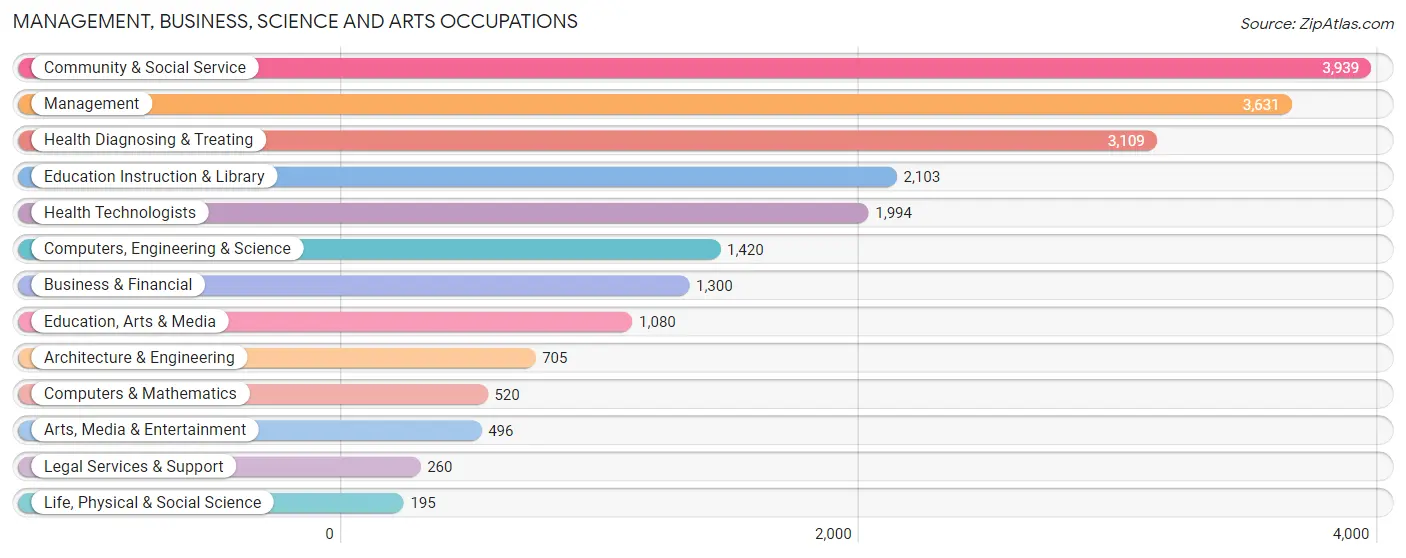
Management, Business, Science and Arts Occupations by Sex
Within the Management, Business, Science and Arts occupations in Allen County, the most male-oriented occupations are Architecture & Engineering (81.0%), Computers, Engineering & Science (73.2%), and Computers & Mathematics (69.8%), while the most female-oriented occupations are Health Diagnosing & Treating (84.7%), Health Technologists (83.7%), and Education, Arts & Media (72.1%).
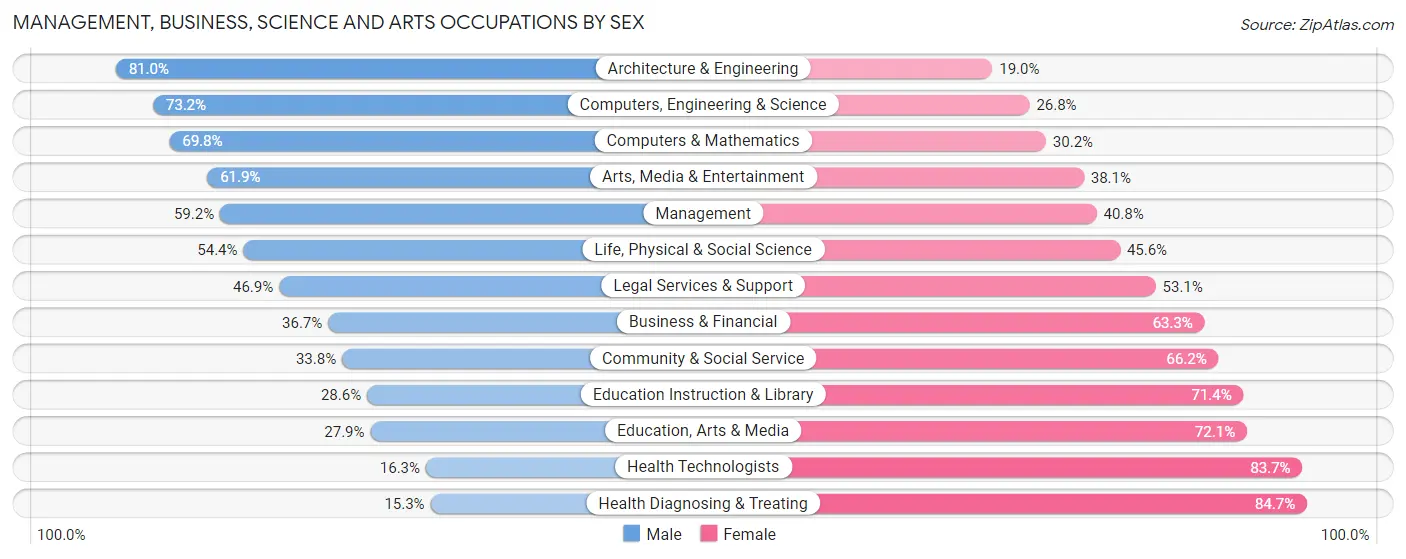
| Occupation | Male | Female |
| Management | 2,151 (59.2%) | 1,480 (40.8%) |
| Business & Financial | 477 (36.7%) | 823 (63.3%) |
| Computers, Engineering & Science | 1,040 (73.2%) | 380 (26.8%) |
| Computers & Mathematics | 363 (69.8%) | 157 (30.2%) |
| Architecture & Engineering | 571 (81.0%) | 134 (19.0%) |
| Life, Physical & Social Science | 106 (54.4%) | 89 (45.6%) |
| Community & Social Service | 1,331 (33.8%) | 2,608 (66.2%) |
| Education, Arts & Media | 301 (27.9%) | 779 (72.1%) |
| Legal Services & Support | 122 (46.9%) | 138 (53.1%) |
| Education Instruction & Library | 601 (28.6%) | 1,502 (71.4%) |
| Arts, Media & Entertainment | 307 (61.9%) | 189 (38.1%) |
| Health Diagnosing & Treating | 477 (15.3%) | 2,632 (84.7%) |
| Health Technologists | 325 (16.3%) | 1,669 (83.7%) |
| Total (Category) | 5,476 (40.9%) | 7,923 (59.1%) |
| Total (Overall) | 23,929 (51.7%) | 22,324 (48.3%) |
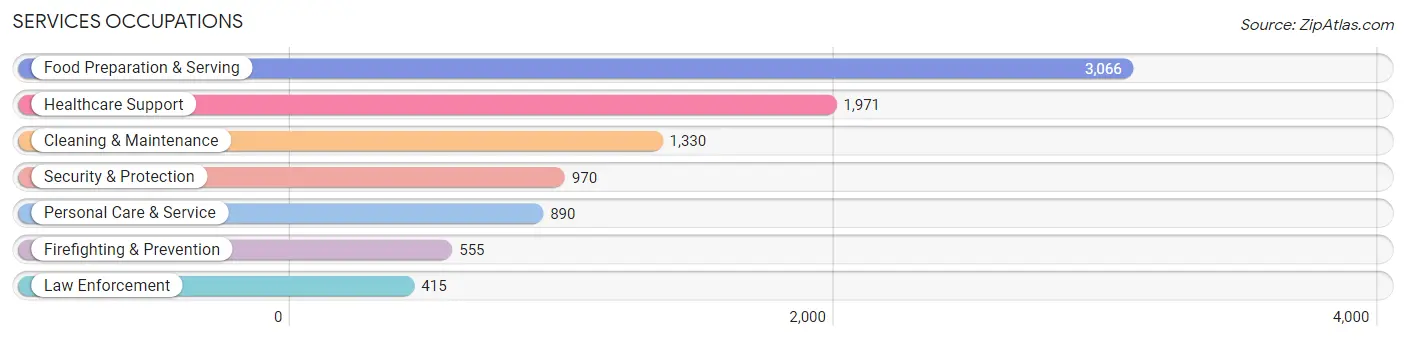
Services Occupations
The most common Services occupations in Allen County are Food Preparation & Serving (3,066 | 6.6%), Healthcare Support (1,971 | 4.3%), Cleaning & Maintenance (1,330 | 2.9%), Security & Protection (970 | 2.1%), and Personal Care & Service (890 | 1.9%).
Services Occupations by Sex
Within the Services occupations in Allen County, the most male-oriented occupations are Law Enforcement (90.8%), Security & Protection (67.0%), and Cleaning & Maintenance (54.0%), while the most female-oriented occupations are Healthcare Support (94.4%), Personal Care & Service (81.1%), and Food Preparation & Serving (54.2%).
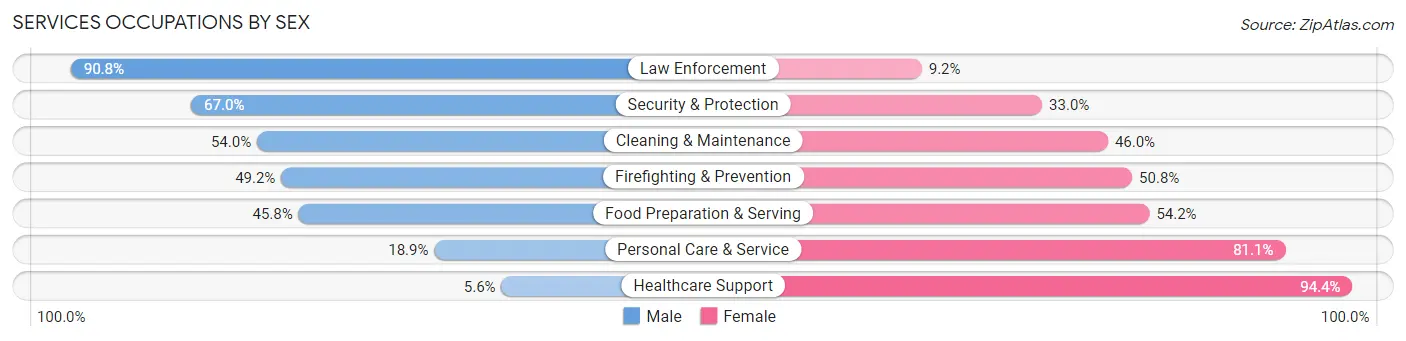
| Occupation | Male | Female |
| Healthcare Support | 110 (5.6%) | 1,861 (94.4%) |
| Security & Protection | 650 (67.0%) | 320 (33.0%) |
| Firefighting & Prevention | 273 (49.2%) | 282 (50.8%) |
| Law Enforcement | 377 (90.8%) | 38 (9.2%) |
| Food Preparation & Serving | 1,403 (45.8%) | 1,663 (54.2%) |
| Cleaning & Maintenance | 718 (54.0%) | 612 (46.0%) |
| Personal Care & Service | 168 (18.9%) | 722 (81.1%) |
| Total (Category) | 3,049 (37.1%) | 5,178 (62.9%) |
| Total (Overall) | 23,929 (51.7%) | 22,324 (48.3%) |
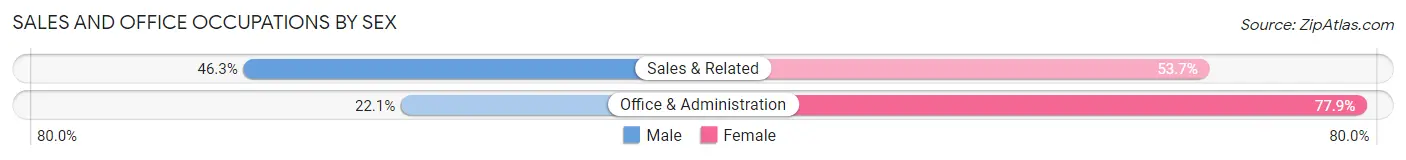
Sales and Office Occupations
The most common Sales and Office occupations in Allen County are Office & Administration (4,910 | 10.6%), and Sales & Related (4,039 | 8.7%).

Sales and Office Occupations by Sex
| Occupation | Male | Female |
| Sales & Related | 1,871 (46.3%) | 2,168 (53.7%) |
| Office & Administration | 1,084 (22.1%) | 3,826 (77.9%) |
| Total (Category) | 2,955 (33.0%) | 5,994 (67.0%) |
| Total (Overall) | 23,929 (51.7%) | 22,324 (48.3%) |
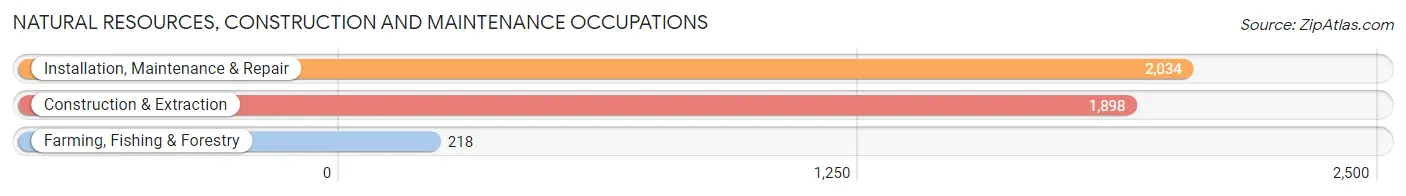
Natural Resources, Construction and Maintenance Occupations
The most common Natural Resources, Construction and Maintenance occupations in Allen County are Installation, Maintenance & Repair (2,034 | 4.4%), Construction & Extraction (1,898 | 4.1%), and Farming, Fishing & Forestry (218 | 0.5%).
Natural Resources, Construction and Maintenance Occupations by Sex
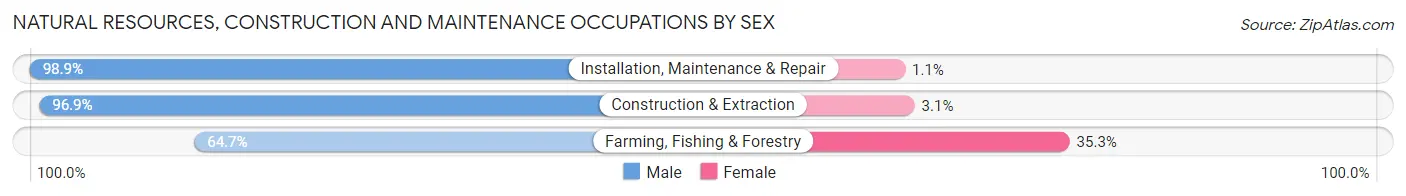
| Occupation | Male | Female |
| Farming, Fishing & Forestry | 141 (64.7%) | 77 (35.3%) |
| Construction & Extraction | 1,840 (96.9%) | 58 (3.1%) |
| Installation, Maintenance & Repair | 2,012 (98.9%) | 22 (1.1%) |
| Total (Category) | 3,993 (96.2%) | 157 (3.8%) |
| Total (Overall) | 23,929 (51.7%) | 22,324 (48.3%) |
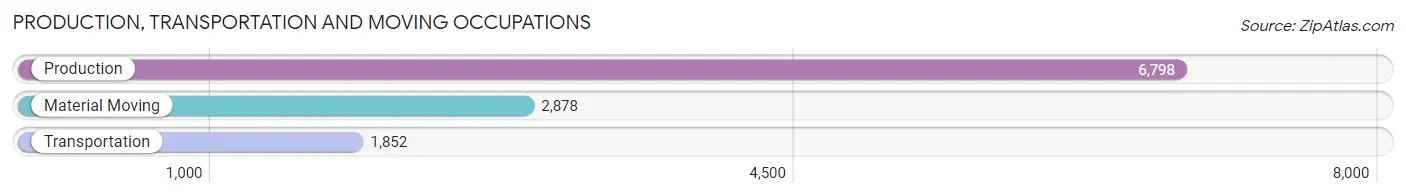
Production, Transportation and Moving Occupations
The most common Production, Transportation and Moving occupations in Allen County are Production (6,798 | 14.7%), Material Moving (2,878 | 6.2%), and Transportation (1,852 | 4.0%).
Production, Transportation and Moving Occupations by Sex
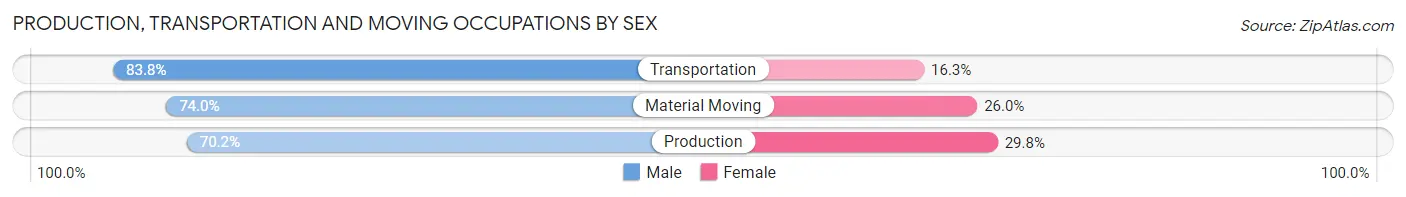
| Occupation | Male | Female |
| Production | 4,775 (70.2%) | 2,023 (29.8%) |
| Transportation | 1,551 (83.8%) | 301 (16.3%) |
| Material Moving | 2,130 (74.0%) | 748 (26.0%) |
| Total (Category) | 8,456 (73.4%) | 3,072 (26.7%) |
| Total (Overall) | 23,929 (51.7%) | 22,324 (48.3%) |
Employment Industries by Sex in Allen County
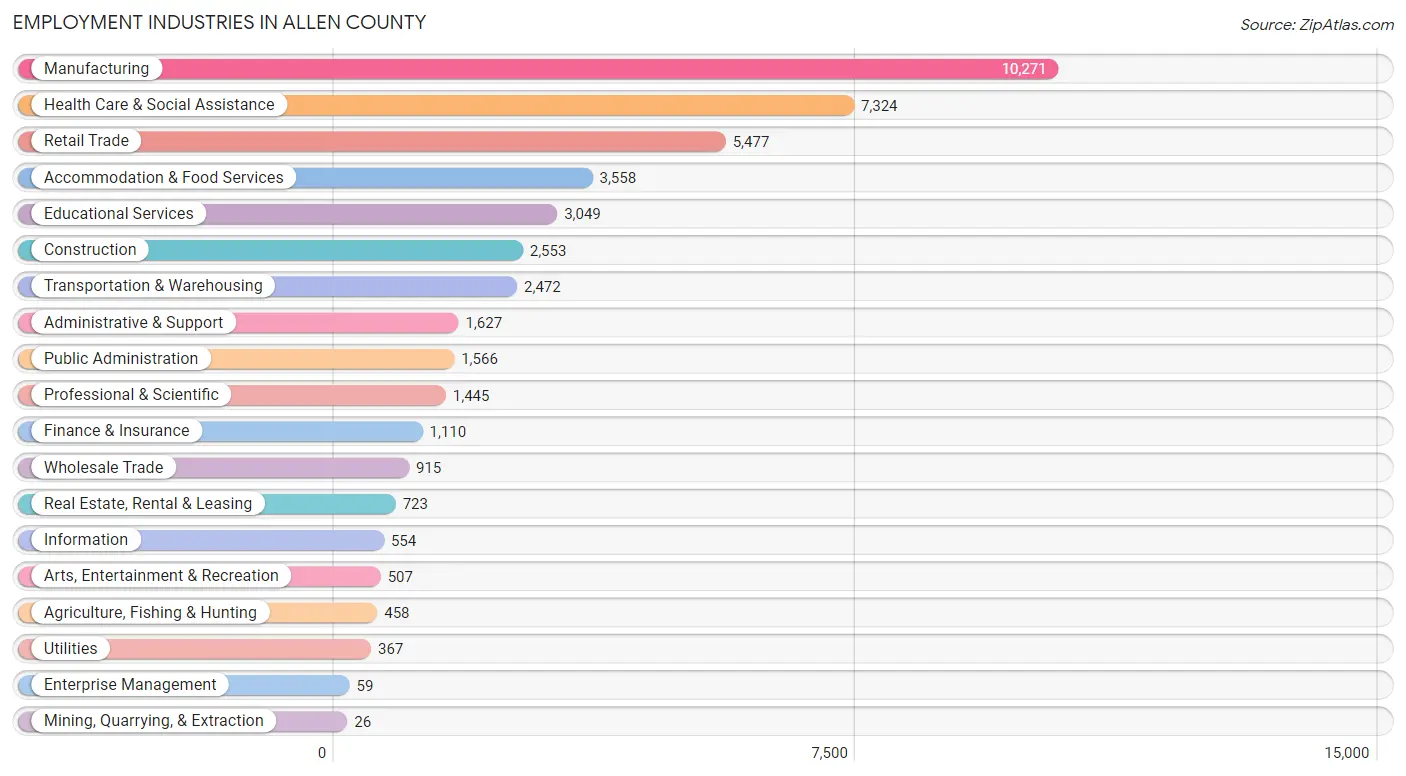
Employment Industries in Allen County
The major employment industries in Allen County include Manufacturing (10,271 | 22.2%), Health Care & Social Assistance (7,324 | 15.8%), Retail Trade (5,477 | 11.8%), Accommodation & Food Services (3,558 | 7.7%), and Educational Services (3,049 | 6.6%).
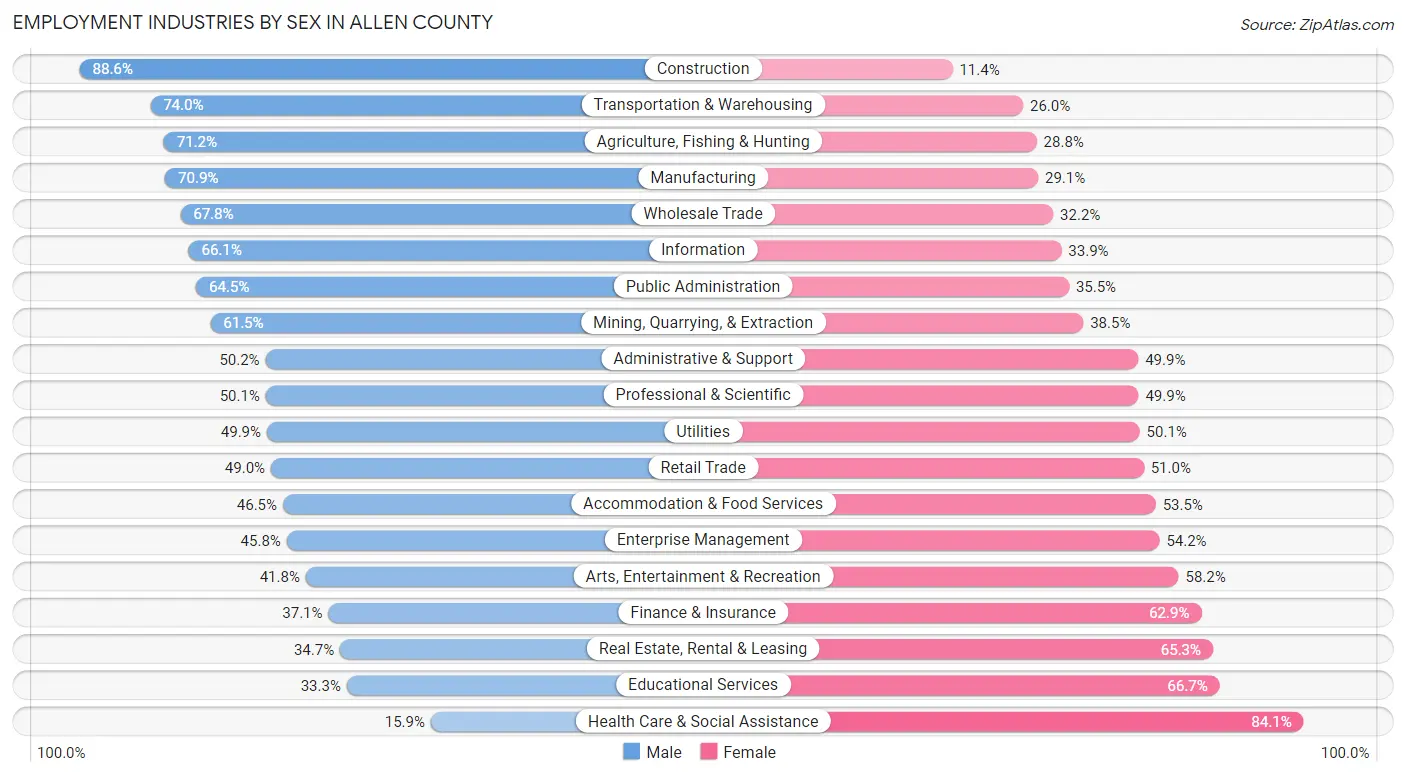
Employment Industries by Sex in Allen County
The Allen County industries that see more men than women are Construction (88.6%), Transportation & Warehousing (74.0%), and Agriculture, Fishing & Hunting (71.2%), whereas the industries that tend to have a higher number of women are Health Care & Social Assistance (84.1%), Educational Services (66.7%), and Real Estate, Rental & Leasing (65.3%).
| Industry | Male | Female |
| Agriculture, Fishing & Hunting | 326 (71.2%) | 132 (28.8%) |
| Mining, Quarrying, & Extraction | 16 (61.5%) | 10 (38.5%) |
| Construction | 2,262 (88.6%) | 291 (11.4%) |
| Manufacturing | 7,282 (70.9%) | 2,989 (29.1%) |
| Wholesale Trade | 620 (67.8%) | 295 (32.2%) |
| Retail Trade | 2,685 (49.0%) | 2,792 (51.0%) |
| Transportation & Warehousing | 1,829 (74.0%) | 643 (26.0%) |
| Utilities | 183 (49.9%) | 184 (50.1%) |
| Information | 366 (66.1%) | 188 (33.9%) |
| Finance & Insurance | 412 (37.1%) | 698 (62.9%) |
| Real Estate, Rental & Leasing | 251 (34.7%) | 472 (65.3%) |
| Professional & Scientific | 724 (50.1%) | 721 (49.9%) |
| Enterprise Management | 27 (45.8%) | 32 (54.2%) |
| Administrative & Support | 816 (50.1%) | 811 (49.8%) |
| Educational Services | 1,016 (33.3%) | 2,033 (66.7%) |
| Health Care & Social Assistance | 1,167 (15.9%) | 6,157 (84.1%) |
| Arts, Entertainment & Recreation | 212 (41.8%) | 295 (58.2%) |
| Accommodation & Food Services | 1,656 (46.5%) | 1,902 (53.5%) |
| Public Administration | 1,010 (64.5%) | 556 (35.5%) |
| Total | 23,929 (51.7%) | 22,324 (48.3%) |
Education in Allen County
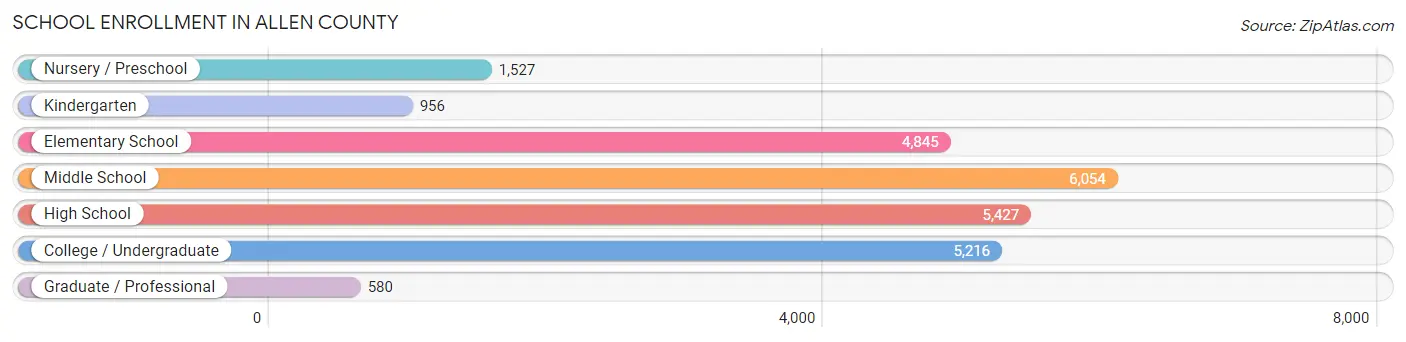
School Enrollment in Allen County
The most common levels of schooling among the 24,605 students in Allen County are middle school (6,054 | 24.6%), high school (5,427 | 22.1%), and college / undergraduate (5,216 | 21.2%).
| School Level | # Students | % Students |
| Nursery / Preschool | 1,527 | 6.2% |
| Kindergarten | 956 | 3.9% |
| Elementary School | 4,845 | 19.7% |
| Middle School | 6,054 | 24.6% |
| High School | 5,427 | 22.1% |
| College / Undergraduate | 5,216 | 21.2% |
| Graduate / Professional | 580 | 2.4% |
| Total | 24,605 | 100.0% |
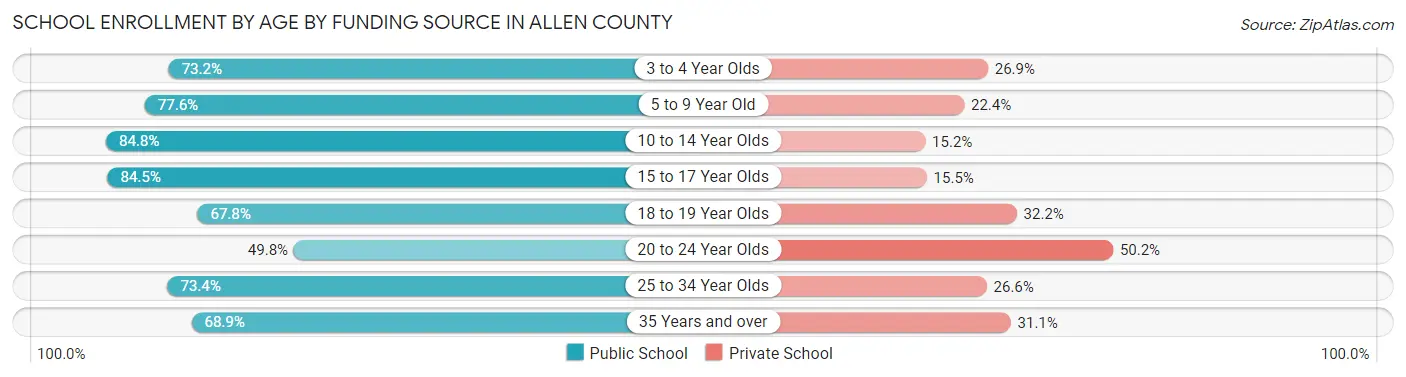
School Enrollment by Age by Funding Source in Allen County
Out of a total of 24,605 students who are enrolled in schools in Allen County, 5,782 (23.5%) attend a private institution, while the remaining 18,823 (76.5%) are enrolled in public schools. The age group of 20 to 24 year olds has the highest likelihood of being enrolled in private schools, with 1,219 (50.2% in the age bracket) enrolled. Conversely, the age group of 10 to 14 year olds has the lowest likelihood of being enrolled in a private school, with 6,137 (84.8% in the age bracket) attending a public institution.
| Age Bracket | Public School | Private School |
| 3 to 4 Year Olds | 722 (73.2%) | 265 (26.9%) |
| 5 to 9 Year Old | 4,315 (77.6%) | 1,247 (22.4%) |
| 10 to 14 Year Olds | 6,137 (84.8%) | 1,098 (15.2%) |
| 15 to 17 Year Olds | 3,461 (84.5%) | 633 (15.5%) |
| 18 to 19 Year Olds | 1,464 (67.8%) | 696 (32.2%) |
| 20 to 24 Year Olds | 1,211 (49.8%) | 1,219 (50.2%) |
| 25 to 34 Year Olds | 780 (73.4%) | 283 (26.6%) |
| 35 Years and over | 740 (68.9%) | 334 (31.1%) |
| Total | 18,823 (76.5%) | 5,782 (23.5%) |
Educational Attainment by Field of Study in Allen County
Education (3,117 | 22.1%), business (2,540 | 18.0%), science & technology (2,268 | 16.1%), arts & humanities (1,063 | 7.5%), and bio, nature & agricultural (876 | 6.2%) are the most common fields of study among 14,084 individuals in Allen County who have obtained a bachelor's degree or higher.
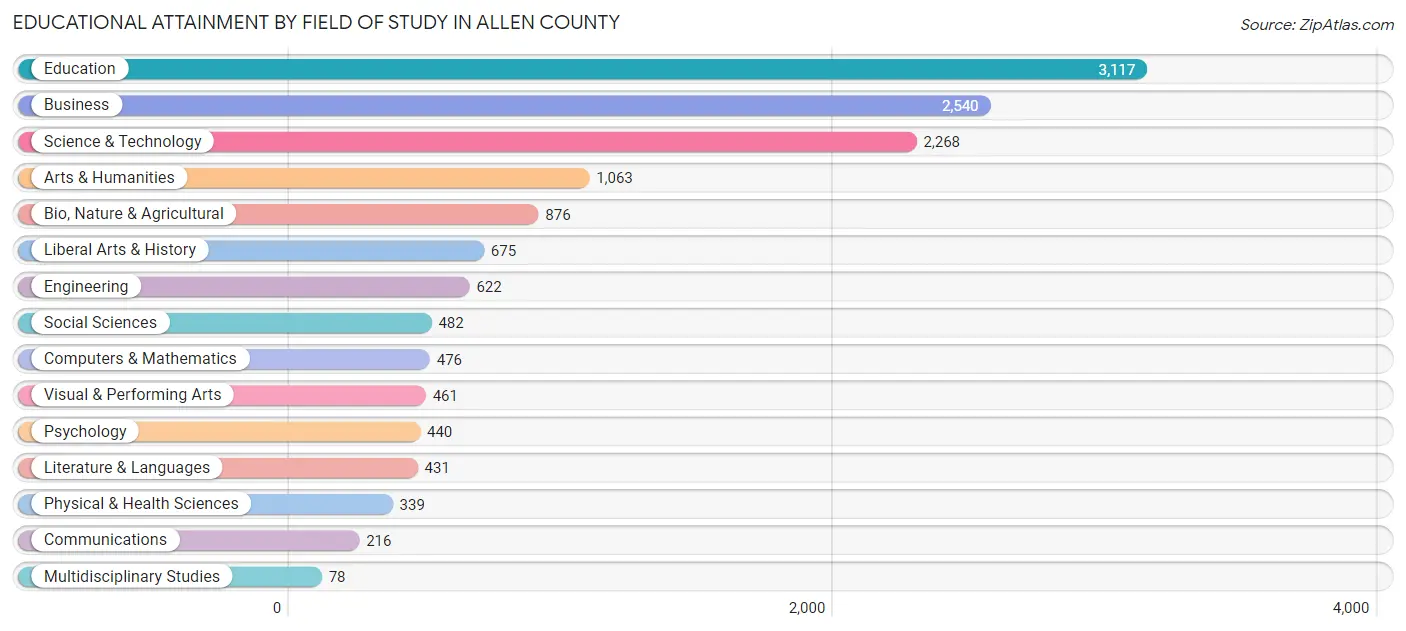
| Field of Study | # Graduates | % Graduates |
| Computers & Mathematics | 476 | 3.4% |
| Bio, Nature & Agricultural | 876 | 6.2% |
| Physical & Health Sciences | 339 | 2.4% |
| Psychology | 440 | 3.1% |
| Social Sciences | 482 | 3.4% |
| Engineering | 622 | 4.4% |
| Multidisciplinary Studies | 78 | 0.5% |
| Science & Technology | 2,268 | 16.1% |
| Business | 2,540 | 18.0% |
| Education | 3,117 | 22.1% |
| Literature & Languages | 431 | 3.1% |
| Liberal Arts & History | 675 | 4.8% |
| Visual & Performing Arts | 461 | 3.3% |
| Communications | 216 | 1.5% |
| Arts & Humanities | 1,063 | 7.5% |
| Total | 14,084 | 100.0% |
Transportation & Commute in Allen County
Vehicle Availability by Sex in Allen County
The most prevalent vehicle ownership categories in Allen County are males with 2 vehicles (9,478, accounting for 41.0%) and females with 2 vehicles (8,309, making up 43.6%).
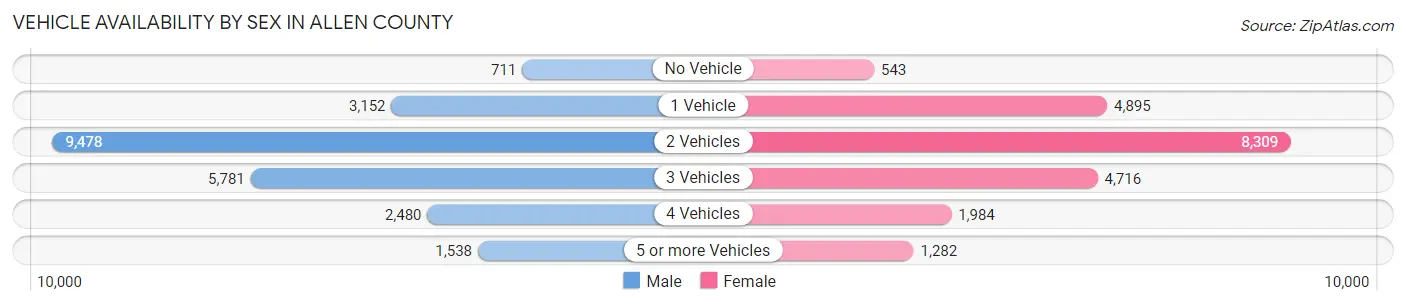
| Vehicles Available | Male | Female |
| No Vehicle | 711 (3.1%) | 543 (2.5%) |
| 1 Vehicle | 3,152 (13.6%) | 4,895 (22.5%) |
| 2 Vehicles | 9,478 (41.0%) | 8,309 (38.2%) |
| 3 Vehicles | 5,781 (25.0%) | 4,716 (21.7%) |
| 4 Vehicles | 2,480 (10.7%) | 1,984 (9.1%) |
| 5 or more Vehicles | 1,538 (6.7%) | 1,282 (5.9%) |
| Total | 23,140 (100.0%) | 21,729 (100.0%) |
Commute Time in Allen County
The most frequently occuring commute durations in Allen County are 10 to 14 minutes (8,929 commuters, 20.6%), 15 to 19 minutes (8,613 commuters, 19.9%), and 5 to 9 minutes (7,025 commuters, 16.2%).
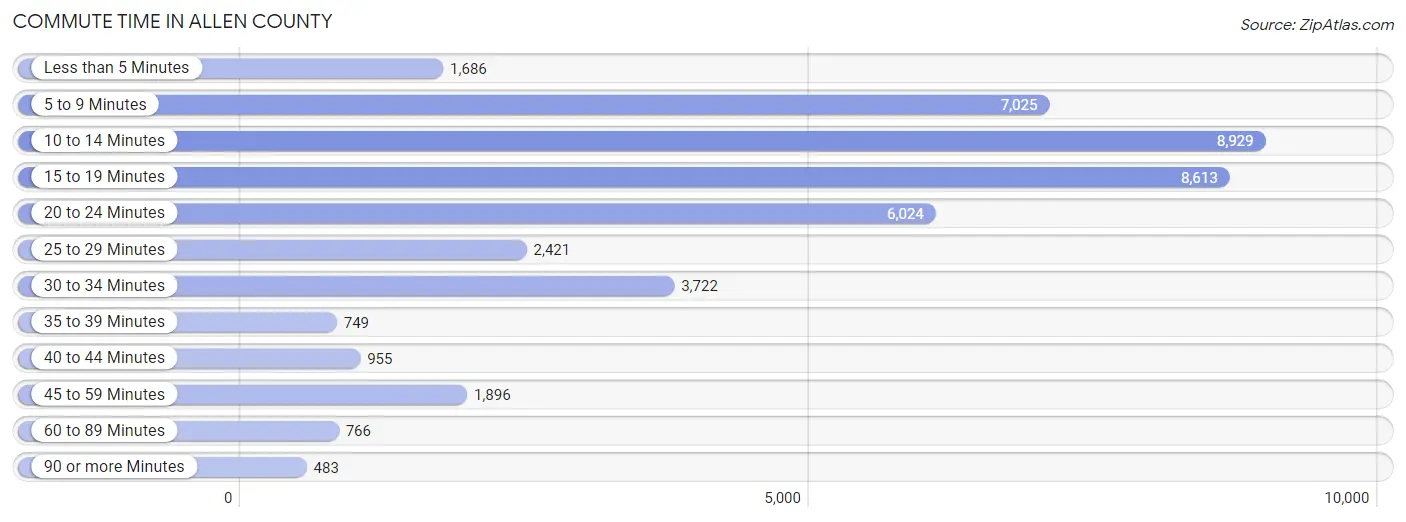
| Commute Time | # Commuters | % Commuters |
| Less than 5 Minutes | 1,686 | 3.9% |
| 5 to 9 Minutes | 7,025 | 16.2% |
| 10 to 14 Minutes | 8,929 | 20.6% |
| 15 to 19 Minutes | 8,613 | 19.9% |
| 20 to 24 Minutes | 6,024 | 13.9% |
| 25 to 29 Minutes | 2,421 | 5.6% |
| 30 to 34 Minutes | 3,722 | 8.6% |
| 35 to 39 Minutes | 749 | 1.7% |
| 40 to 44 Minutes | 955 | 2.2% |
| 45 to 59 Minutes | 1,896 | 4.4% |
| 60 to 89 Minutes | 766 | 1.8% |
| 90 or more Minutes | 483 | 1.1% |
Commute Time by Sex in Allen County
The most common commute times in Allen County are 15 to 19 minutes (4,205 commuters, 18.6%) for males and 10 to 14 minutes (4,793 commuters, 23.2%) for females.
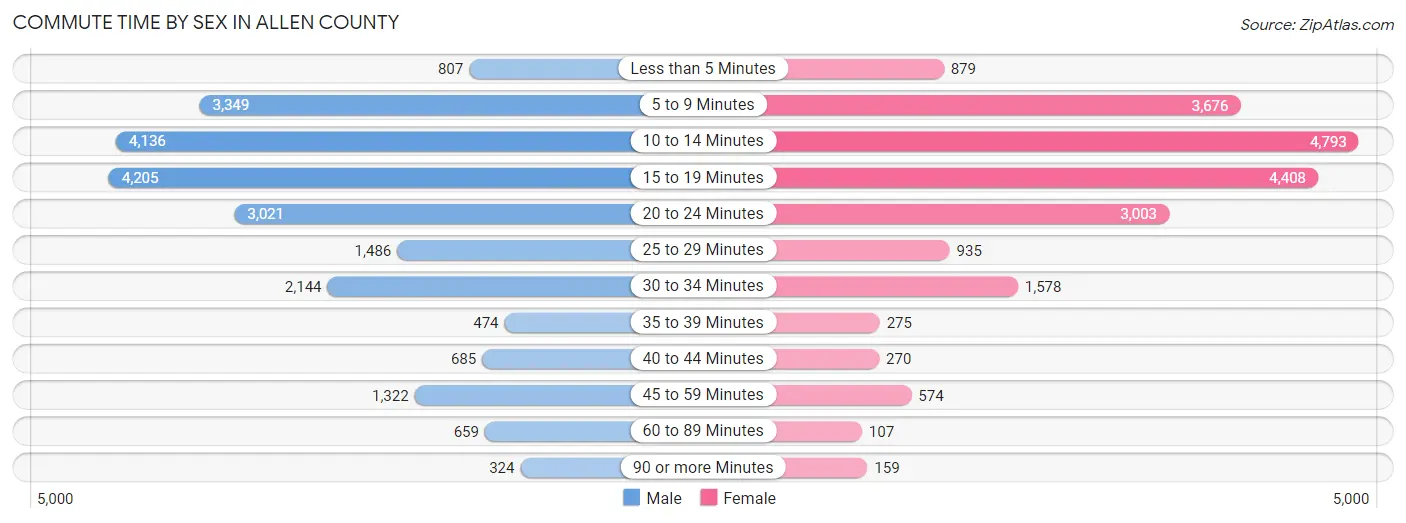
| Commute Time | Male | Female |
| Less than 5 Minutes | 807 (3.6%) | 879 (4.3%) |
| 5 to 9 Minutes | 3,349 (14.8%) | 3,676 (17.8%) |
| 10 to 14 Minutes | 4,136 (18.3%) | 4,793 (23.2%) |
| 15 to 19 Minutes | 4,205 (18.6%) | 4,408 (21.3%) |
| 20 to 24 Minutes | 3,021 (13.4%) | 3,003 (14.5%) |
| 25 to 29 Minutes | 1,486 (6.6%) | 935 (4.5%) |
| 30 to 34 Minutes | 2,144 (9.5%) | 1,578 (7.6%) |
| 35 to 39 Minutes | 474 (2.1%) | 275 (1.3%) |
| 40 to 44 Minutes | 685 (3.0%) | 270 (1.3%) |
| 45 to 59 Minutes | 1,322 (5.9%) | 574 (2.8%) |
| 60 to 89 Minutes | 659 (2.9%) | 107 (0.5%) |
| 90 or more Minutes | 324 (1.4%) | 159 (0.8%) |
Time of Departure to Work by Sex in Allen County
The most frequent times of departure to work in Allen County are 7:00 AM to 7:29 AM (2,878, 12.7%) for males and 7:30 AM to 7:59 AM (3,420, 16.6%) for females.
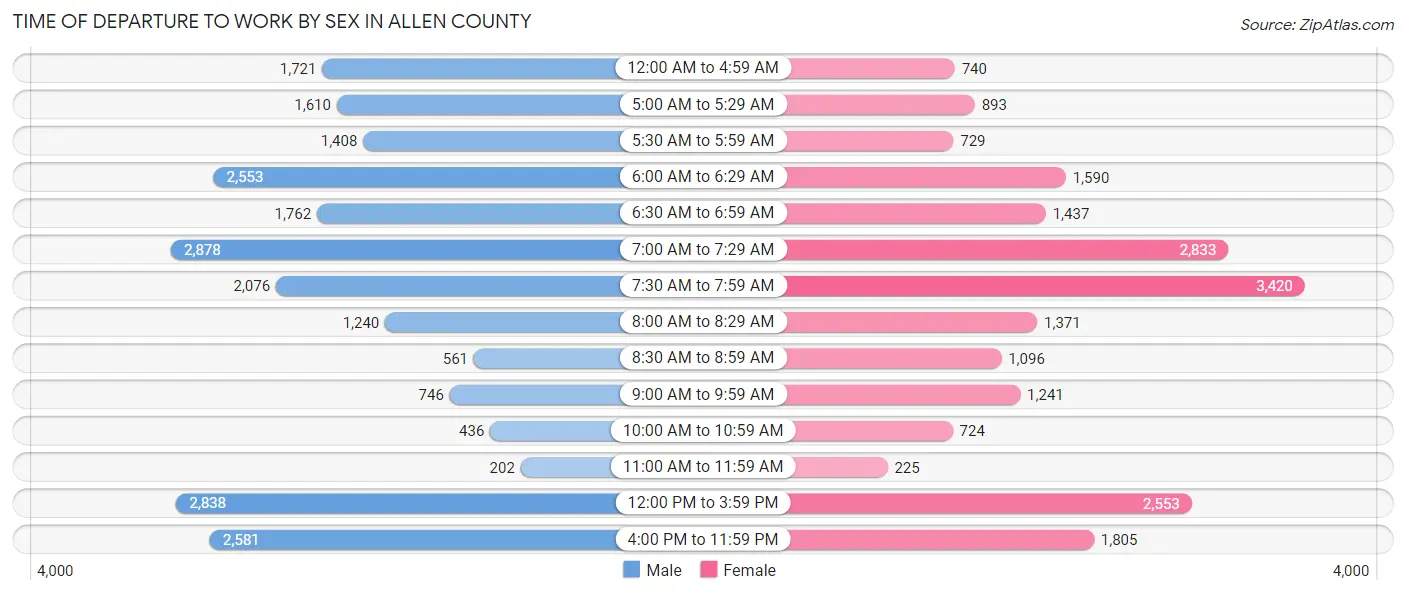
| Time of Departure | Male | Female |
| 12:00 AM to 4:59 AM | 1,721 (7.6%) | 740 (3.6%) |
| 5:00 AM to 5:29 AM | 1,610 (7.1%) | 893 (4.3%) |
| 5:30 AM to 5:59 AM | 1,408 (6.2%) | 729 (3.5%) |
| 6:00 AM to 6:29 AM | 2,553 (11.3%) | 1,590 (7.7%) |
| 6:30 AM to 6:59 AM | 1,762 (7.8%) | 1,437 (7.0%) |
| 7:00 AM to 7:29 AM | 2,878 (12.7%) | 2,833 (13.7%) |
| 7:30 AM to 7:59 AM | 2,076 (9.2%) | 3,420 (16.6%) |
| 8:00 AM to 8:29 AM | 1,240 (5.5%) | 1,371 (6.6%) |
| 8:30 AM to 8:59 AM | 561 (2.5%) | 1,096 (5.3%) |
| 9:00 AM to 9:59 AM | 746 (3.3%) | 1,241 (6.0%) |
| 10:00 AM to 10:59 AM | 436 (1.9%) | 724 (3.5%) |
| 11:00 AM to 11:59 AM | 202 (0.9%) | 225 (1.1%) |
| 12:00 PM to 3:59 PM | 2,838 (12.6%) | 2,553 (12.4%) |
| 4:00 PM to 11:59 PM | 2,581 (11.4%) | 1,805 (8.7%) |
| Total | 22,612 (100.0%) | 20,657 (100.0%) |
Housing Occupancy in Allen County
Occupancy by Ownership in Allen County
Of the total 40,735 dwellings in Allen County, owner-occupied units account for 27,494 (67.5%), while renter-occupied units make up 13,241 (32.5%).
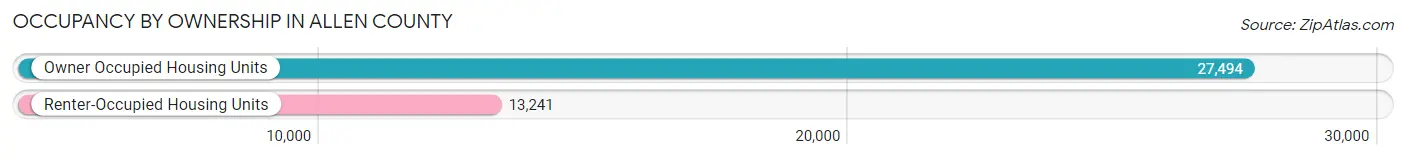
| Occupancy | # Housing Units | % Housing Units |
| Owner Occupied Housing Units | 27,494 | 67.5% |
| Renter-Occupied Housing Units | 13,241 | 32.5% |
| Total Occupied Housing Units | 40,735 | 100.0% |
Occupancy by Household Size in Allen County
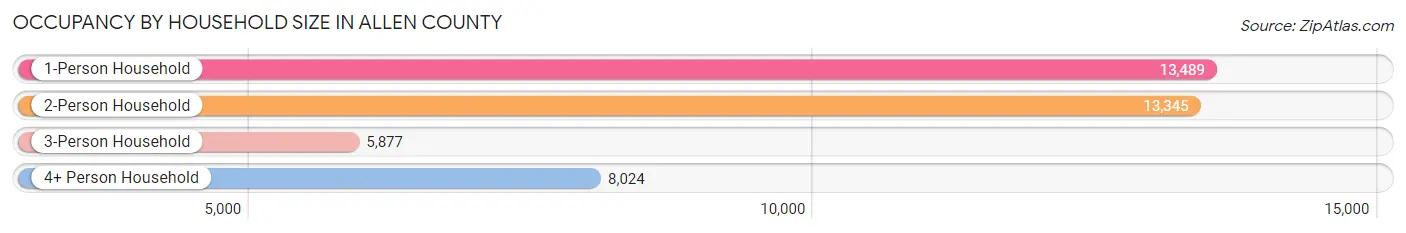
| Household Size | # Housing Units | % Housing Units |
| 1-Person Household | 13,489 | 33.1% |
| 2-Person Household | 13,345 | 32.8% |
| 3-Person Household | 5,877 | 14.4% |
| 4+ Person Household | 8,024 | 19.7% |
| Total Housing Units | 40,735 | 100.0% |
Occupancy by Ownership by Household Size in Allen County
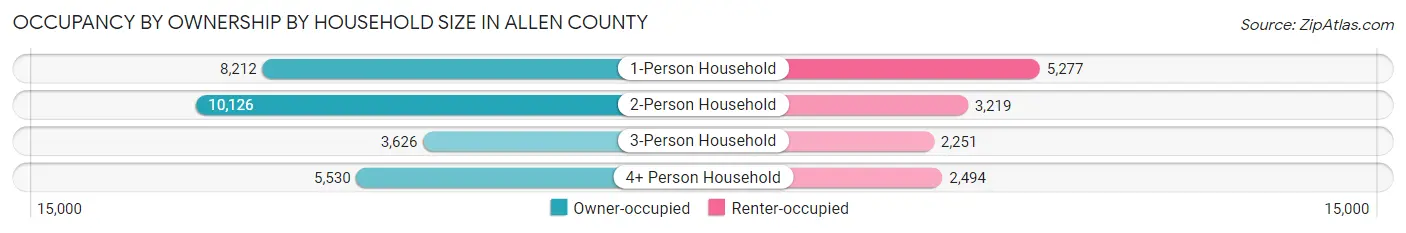
| Household Size | Owner-occupied | Renter-occupied |
| 1-Person Household | 8,212 (60.9%) | 5,277 (39.1%) |
| 2-Person Household | 10,126 (75.9%) | 3,219 (24.1%) |
| 3-Person Household | 3,626 (61.7%) | 2,251 (38.3%) |
| 4+ Person Household | 5,530 (68.9%) | 2,494 (31.1%) |
| Total Housing Units | 27,494 (67.5%) | 13,241 (32.5%) |
Occupancy by Educational Attainment in Allen County
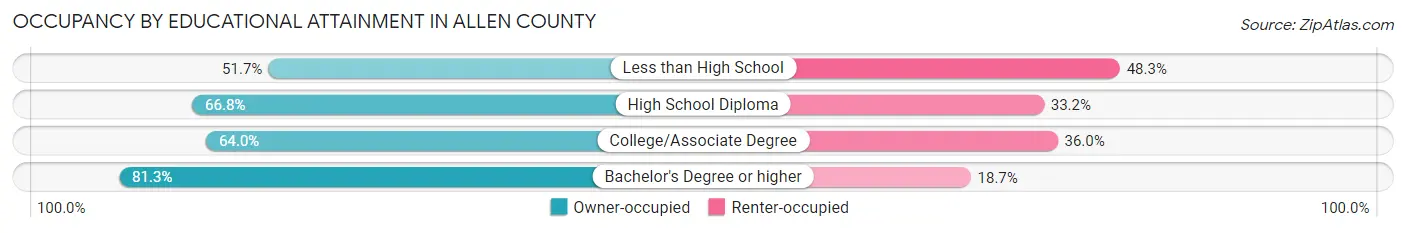
| Household Size | Owner-occupied | Renter-occupied |
| Less than High School | 1,515 (51.7%) | 1,415 (48.3%) |
| High School Diploma | 10,118 (66.8%) | 5,036 (33.2%) |
| College/Associate Degree | 9,470 (64.0%) | 5,317 (36.0%) |
| Bachelor's Degree or higher | 6,391 (81.3%) | 1,473 (18.7%) |
Occupancy by Age of Householder in Allen County
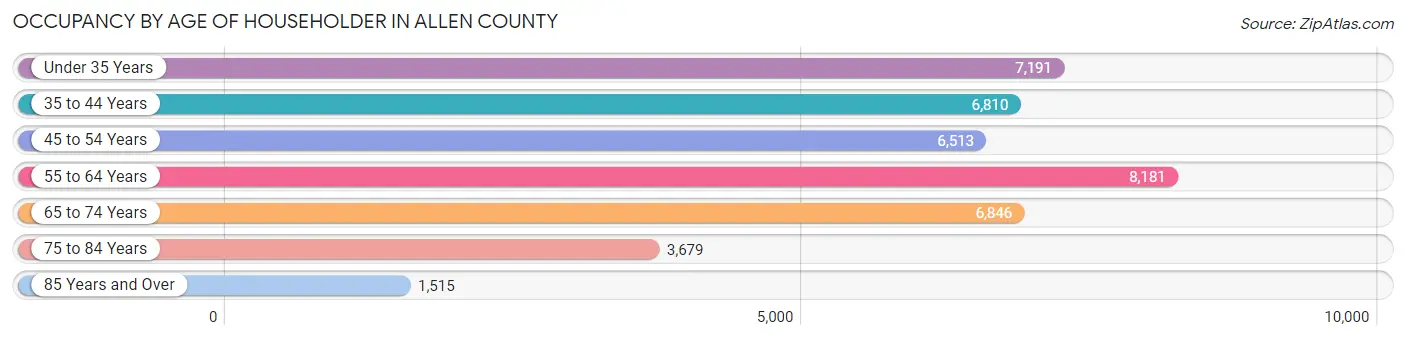
| Age Bracket | # Households | % Households |
| Under 35 Years | 7,191 | 17.6% |
| 35 to 44 Years | 6,810 | 16.7% |
| 45 to 54 Years | 6,513 | 16.0% |
| 55 to 64 Years | 8,181 | 20.1% |
| 65 to 74 Years | 6,846 | 16.8% |
| 75 to 84 Years | 3,679 | 9.0% |
| 85 Years and Over | 1,515 | 3.7% |
| Total | 40,735 | 100.0% |
Housing Finances in Allen County
Median Income by Occupancy in Allen County
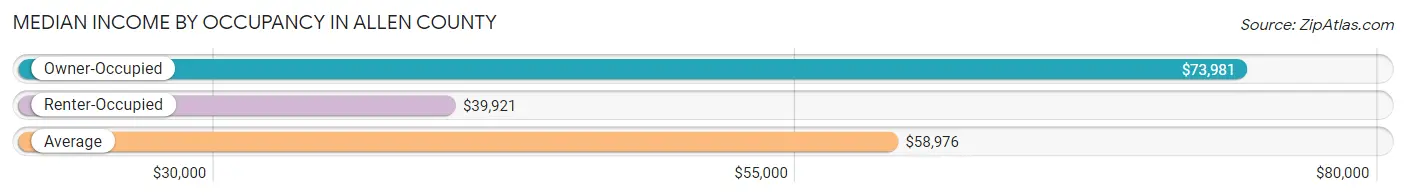
| Occupancy Type | # Households | Median Income |
| Owner-Occupied | 27,494 (67.5%) | $73,981 |
| Renter-Occupied | 13,241 (32.5%) | $39,921 |
| Average | 40,735 (100.0%) | $58,976 |
Occupancy by Householder Income Bracket in Allen County
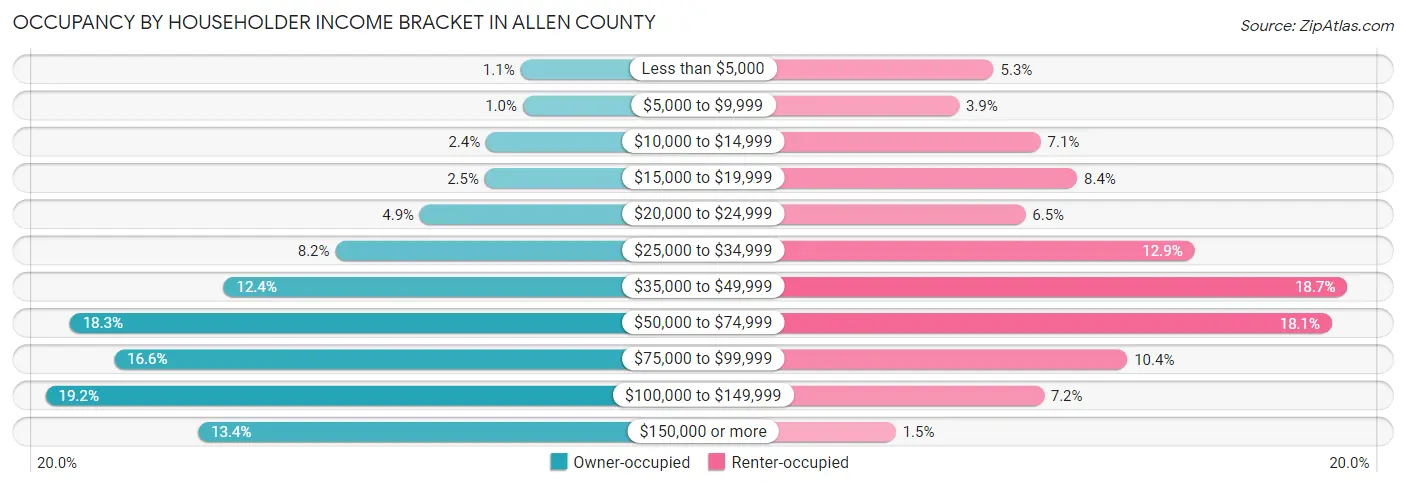
| Income Bracket | Owner-occupied | Renter-occupied |
| Less than $5,000 | 305 (1.1%) | 696 (5.3%) |
| $5,000 to $9,999 | 280 (1.0%) | 522 (3.9%) |
| $10,000 to $14,999 | 665 (2.4%) | 934 (7.0%) |
| $15,000 to $19,999 | 679 (2.5%) | 1,118 (8.4%) |
| $20,000 to $24,999 | 1,358 (4.9%) | 857 (6.5%) |
| $25,000 to $34,999 | 2,243 (8.2%) | 1,709 (12.9%) |
| $35,000 to $49,999 | 3,416 (12.4%) | 2,480 (18.7%) |
| $50,000 to $74,999 | 5,026 (18.3%) | 2,402 (18.1%) |
| $75,000 to $99,999 | 4,560 (16.6%) | 1,371 (10.3%) |
| $100,000 to $149,999 | 5,280 (19.2%) | 950 (7.2%) |
| $150,000 or more | 3,682 (13.4%) | 202 (1.5%) |
| Total | 27,494 (100.0%) | 13,241 (100.0%) |
Monthly Housing Cost Tiers in Allen County
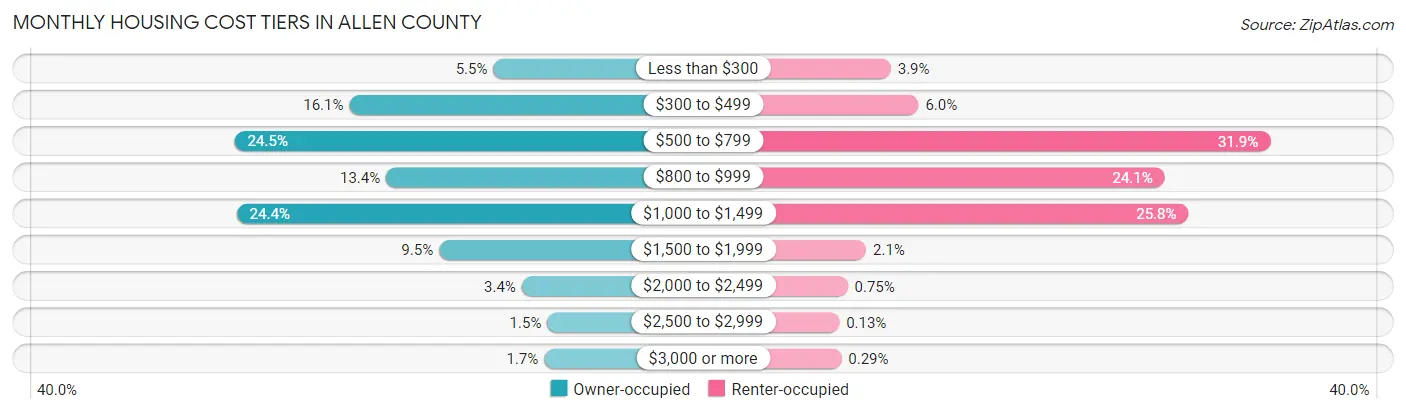
| Monthly Cost | Owner-occupied | Renter-occupied |
| Less than $300 | 1,508 (5.5%) | 520 (3.9%) |
| $300 to $499 | 4,425 (16.1%) | 790 (6.0%) |
| $500 to $799 | 6,748 (24.5%) | 4,218 (31.9%) |
| $800 to $999 | 3,680 (13.4%) | 3,190 (24.1%) |
| $1,000 to $1,499 | 6,702 (24.4%) | 3,421 (25.8%) |
| $1,500 to $1,999 | 2,606 (9.5%) | 280 (2.1%) |
| $2,000 to $2,499 | 933 (3.4%) | 99 (0.7%) |
| $2,500 to $2,999 | 414 (1.5%) | 17 (0.1%) |
| $3,000 or more | 478 (1.7%) | 39 (0.3%) |
| Total | 27,494 (100.0%) | 13,241 (100.0%) |
Physical Housing Characteristics in Allen County
Housing Structures in Allen County
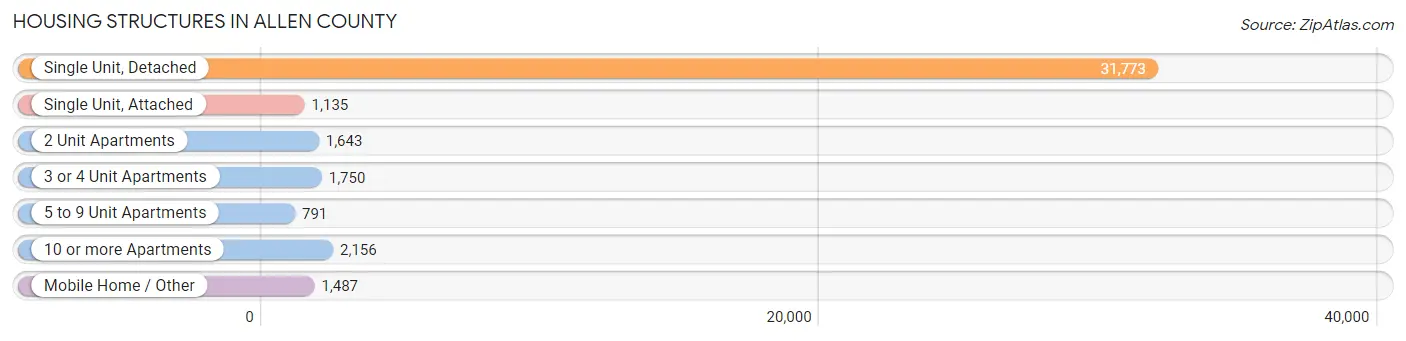
| Structure Type | # Housing Units | % Housing Units |
| Single Unit, Detached | 31,773 | 78.0% |
| Single Unit, Attached | 1,135 | 2.8% |
| 2 Unit Apartments | 1,643 | 4.0% |
| 3 or 4 Unit Apartments | 1,750 | 4.3% |
| 5 to 9 Unit Apartments | 791 | 1.9% |
| 10 or more Apartments | 2,156 | 5.3% |
| Mobile Home / Other | 1,487 | 3.6% |
| Total | 40,735 | 100.0% |
Housing Structures by Occupancy in Allen County
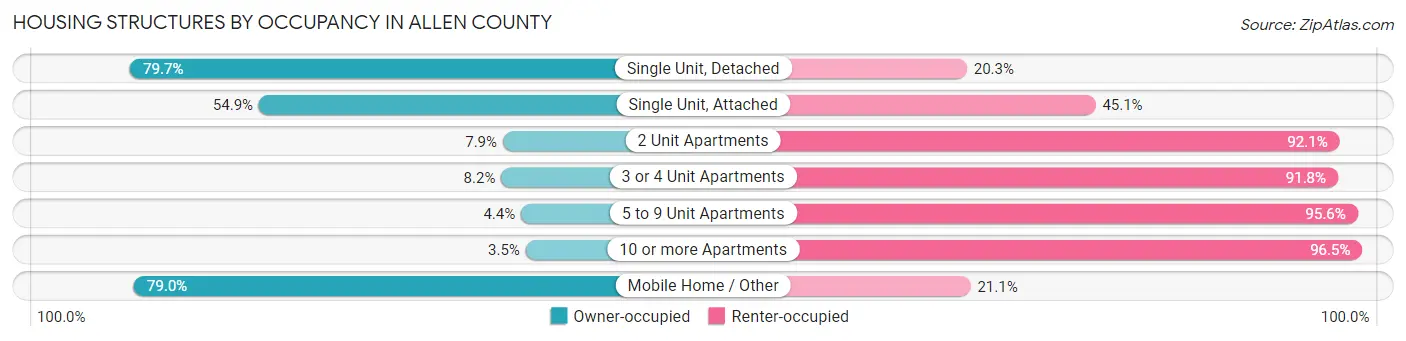
| Structure Type | Owner-occupied | Renter-occupied |
| Single Unit, Detached | 25,312 (79.7%) | 6,461 (20.3%) |
| Single Unit, Attached | 623 (54.9%) | 512 (45.1%) |
| 2 Unit Apartments | 130 (7.9%) | 1,513 (92.1%) |
| 3 or 4 Unit Apartments | 144 (8.2%) | 1,606 (91.8%) |
| 5 to 9 Unit Apartments | 35 (4.4%) | 756 (95.6%) |
| 10 or more Apartments | 76 (3.5%) | 2,080 (96.5%) |
| Mobile Home / Other | 1,174 (78.9%) | 313 (21.0%) |
| Total | 27,494 (67.5%) | 13,241 (32.5%) |
Housing Structures by Number of Rooms in Allen County
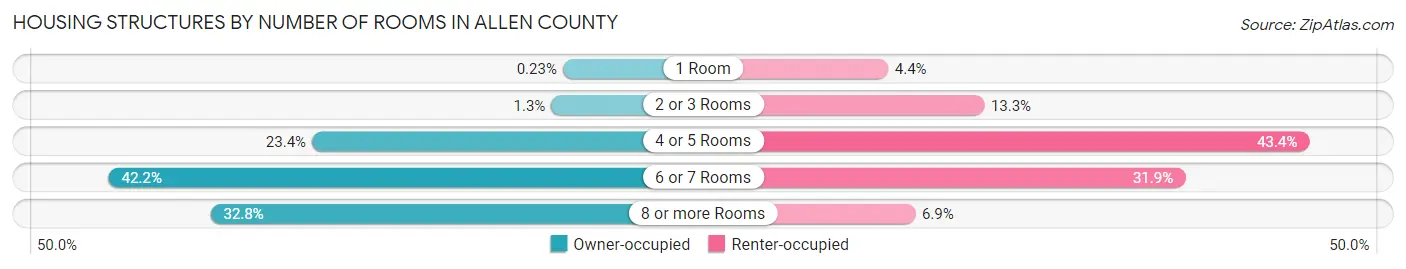
| Number of Rooms | Owner-occupied | Renter-occupied |
| 1 Room | 62 (0.2%) | 586 (4.4%) |
| 2 or 3 Rooms | 358 (1.3%) | 1,764 (13.3%) |
| 4 or 5 Rooms | 6,442 (23.4%) | 5,747 (43.4%) |
| 6 or 7 Rooms | 11,612 (42.2%) | 4,225 (31.9%) |
| 8 or more Rooms | 9,020 (32.8%) | 919 (6.9%) |
| Total | 27,494 (100.0%) | 13,241 (100.0%) |
Housing Structure by Heating Type in Allen County
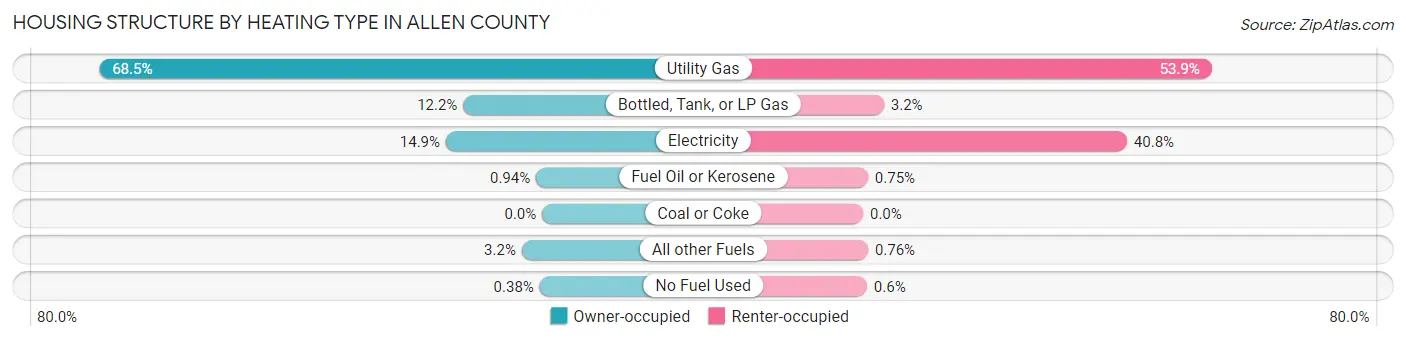
| Heating Type | Owner-occupied | Renter-occupied |
| Utility Gas | 18,823 (68.5%) | 7,136 (53.9%) |
| Bottled, Tank, or LP Gas | 3,354 (12.2%) | 425 (3.2%) |
| Electricity | 4,090 (14.9%) | 5,401 (40.8%) |
| Fuel Oil or Kerosene | 258 (0.9%) | 99 (0.7%) |
| Coal or Coke | 0 (0.0%) | 0 (0.0%) |
| All other Fuels | 865 (3.2%) | 100 (0.8%) |
| No Fuel Used | 104 (0.4%) | 80 (0.6%) |
| Total | 27,494 (100.0%) | 13,241 (100.0%) |
Household Vehicle Usage in Allen County
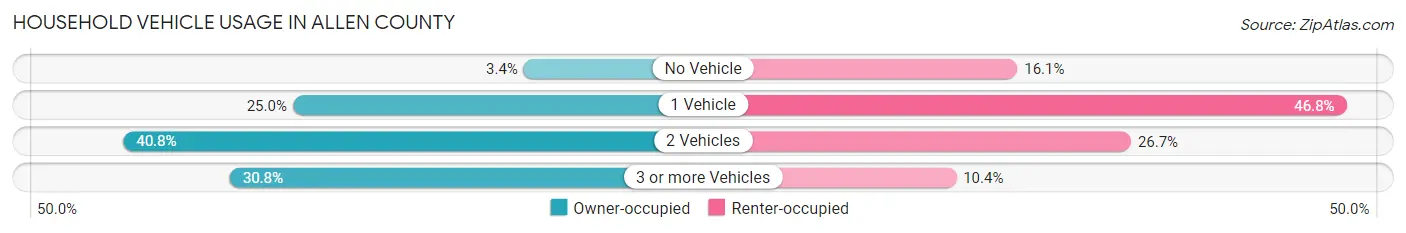
| Vehicles per Household | Owner-occupied | Renter-occupied |
| No Vehicle | 937 (3.4%) | 2,131 (16.1%) |
| 1 Vehicle | 6,865 (25.0%) | 6,198 (46.8%) |
| 2 Vehicles | 11,212 (40.8%) | 3,536 (26.7%) |
| 3 or more Vehicles | 8,480 (30.8%) | 1,376 (10.4%) |
| Total | 27,494 (100.0%) | 13,241 (100.0%) |
Real Estate & Mortgages in Allen County
Real Estate and Mortgage Overview in Allen County
| Characteristic | Without Mortgage | With Mortgage |
| Housing Units | 11,238 | 16,256 |
| Median Property Value | $138,300 | $151,300 |
| Median Household Income | $52,065 | $2,611 |
| Monthly Housing Costs | $497 | $450 |
| Real Estate Taxes | $1,567 | $456 |
Property Value by Mortgage Status in Allen County
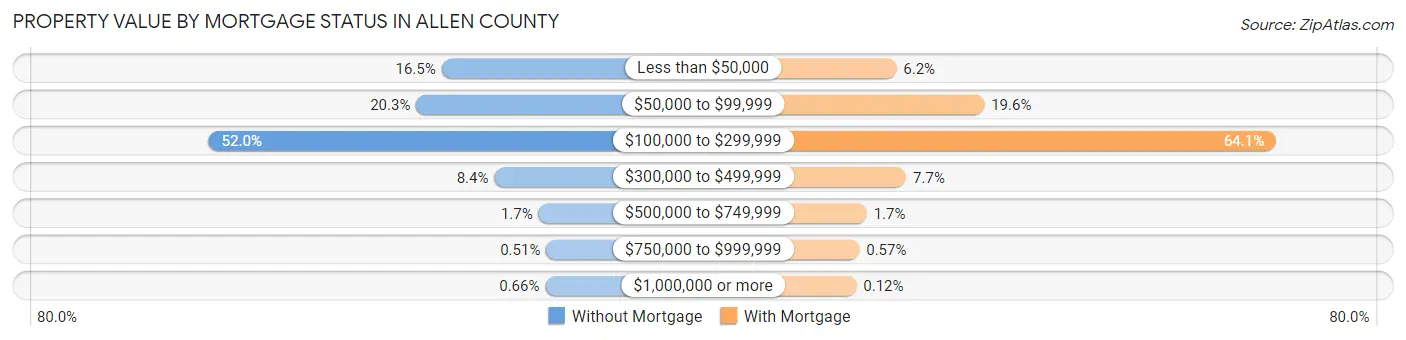
| Property Value | Without Mortgage | With Mortgage |
| Less than $50,000 | 1,850 (16.5%) | 1,011 (6.2%) |
| $50,000 to $99,999 | 2,284 (20.3%) | 3,187 (19.6%) |
| $100,000 to $299,999 | 5,838 (51.9%) | 10,414 (64.1%) |
| $300,000 to $499,999 | 946 (8.4%) | 1,254 (7.7%) |
| $500,000 to $749,999 | 189 (1.7%) | 277 (1.7%) |
| $750,000 to $999,999 | 57 (0.5%) | 93 (0.6%) |
| $1,000,000 or more | 74 (0.7%) | 20 (0.1%) |
| Total | 11,238 (100.0%) | 16,256 (100.0%) |
Household Income by Mortgage Status in Allen County
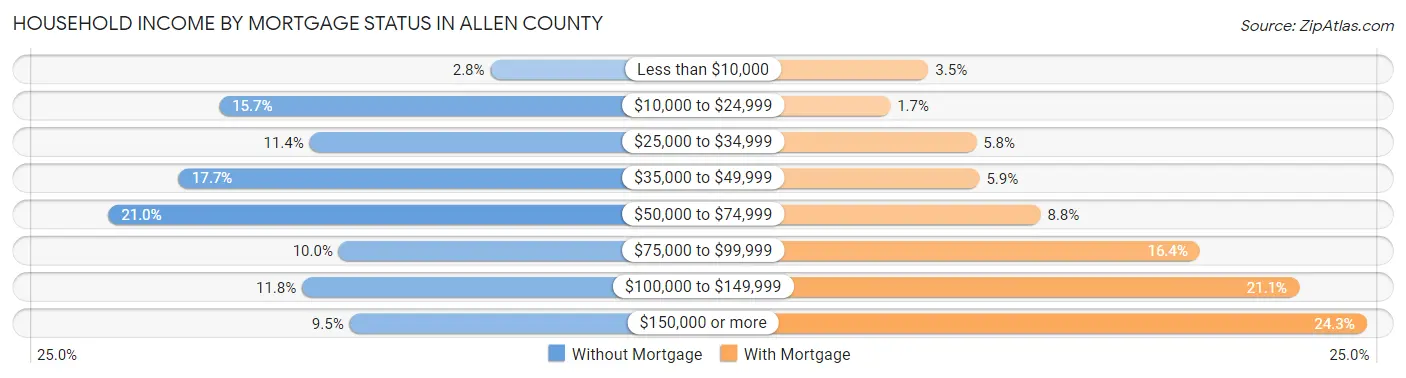
| Household Income | Without Mortgage | With Mortgage |
| Less than $10,000 | 317 (2.8%) | 564 (3.5%) |
| $10,000 to $24,999 | 1,768 (15.7%) | 268 (1.7%) |
| $25,000 to $34,999 | 1,284 (11.4%) | 934 (5.8%) |
| $35,000 to $49,999 | 1,984 (17.6%) | 959 (5.9%) |
| $50,000 to $74,999 | 2,361 (21.0%) | 1,432 (8.8%) |
| $75,000 to $99,999 | 1,128 (10.0%) | 2,665 (16.4%) |
| $100,000 to $149,999 | 1,325 (11.8%) | 3,432 (21.1%) |
| $150,000 or more | 1,071 (9.5%) | 3,955 (24.3%) |
| Total | 11,238 (100.0%) | 16,256 (100.0%) |
Property Value to Household Income Ratio in Allen County
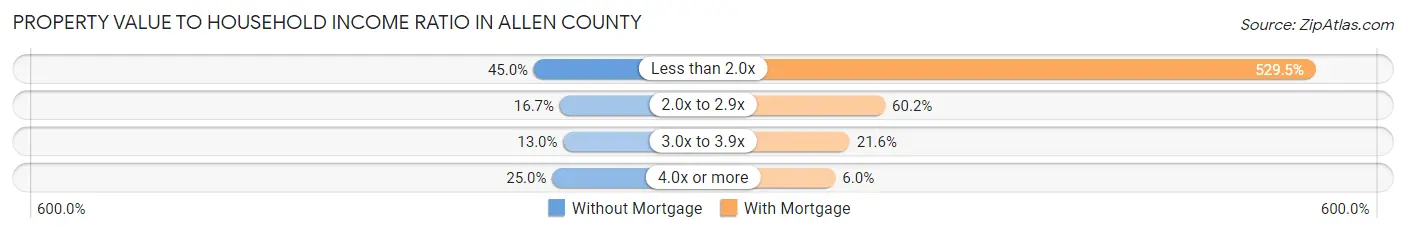
| Value-to-Income Ratio | Without Mortgage | With Mortgage |
| Less than 2.0x | 5,056 (45.0%) | 86,071 (529.5%) |
| 2.0x to 2.9x | 1,879 (16.7%) | 9,785 (60.2%) |
| 3.0x to 3.9x | 1,455 (13.0%) | 3,516 (21.6%) |
| 4.0x or more | 2,806 (25.0%) | 974 (6.0%) |
| Total | 11,238 (100.0%) | 16,256 (100.0%) |
Real Estate Taxes by Mortgage Status in Allen County
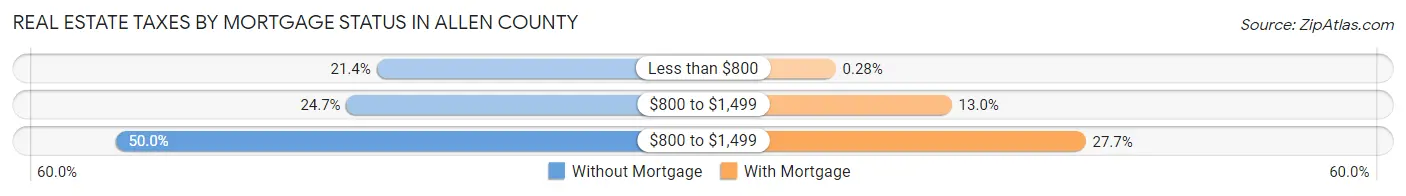
| Property Taxes | Without Mortgage | With Mortgage |
| Less than $800 | 2,408 (21.4%) | 46 (0.3%) |
| $800 to $1,499 | 2,779 (24.7%) | 2,113 (13.0%) |
| $800 to $1,499 | 5,624 (50.0%) | 4,498 (27.7%) |
| Total | 11,238 (100.0%) | 16,256 (100.0%) |
Health & Disability in Allen County
Health Insurance Coverage by Age in Allen County
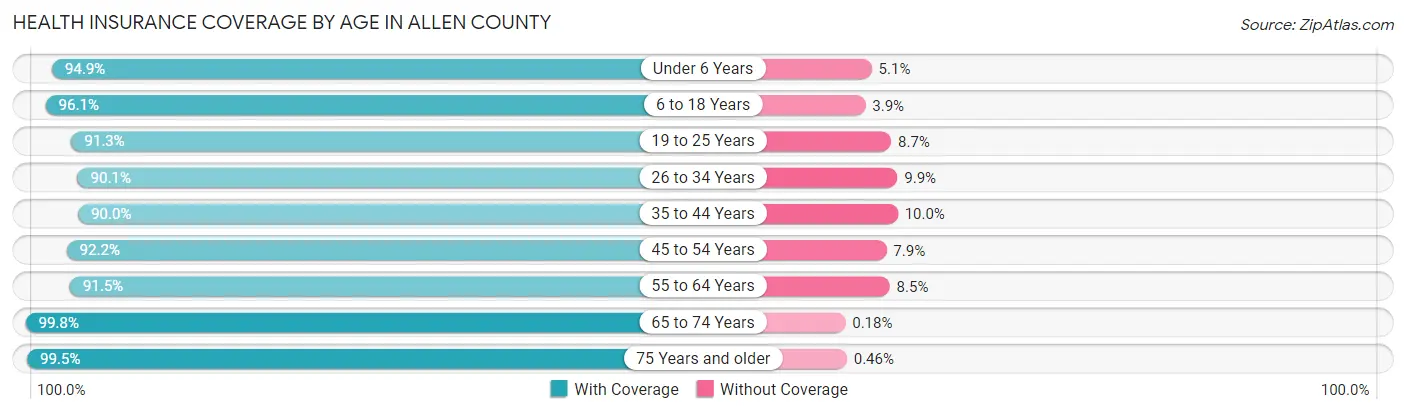
| Age Bracket | With Coverage | Without Coverage |
| Under 6 Years | 6,918 (94.9%) | 372 (5.1%) |
| 6 to 18 Years | 17,197 (96.1%) | 703 (3.9%) |
| 19 to 25 Years | 8,607 (91.3%) | 823 (8.7%) |
| 26 to 34 Years | 9,716 (90.1%) | 1,066 (9.9%) |
| 35 to 44 Years | 10,620 (90.0%) | 1,175 (10.0%) |
| 45 to 54 Years | 10,242 (92.1%) | 872 (7.9%) |
| 55 to 64 Years | 12,266 (91.5%) | 1,133 (8.5%) |
| 65 to 74 Years | 10,590 (99.8%) | 19 (0.2%) |
| 75 Years and older | 7,284 (99.5%) | 34 (0.5%) |
| Total | 93,440 (93.8%) | 6,197 (6.2%) |
Health Insurance Coverage by Citizenship Status in Allen County
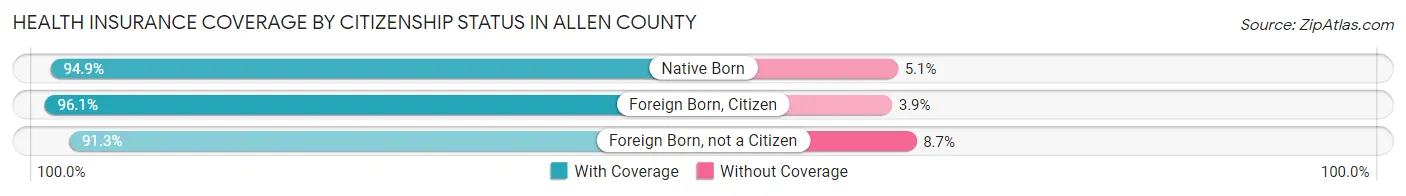
| Citizenship Status | With Coverage | Without Coverage |
| Native Born | 6,918 (94.9%) | 372 (5.1%) |
| Foreign Born, Citizen | 17,197 (96.1%) | 703 (3.9%) |
| Foreign Born, not a Citizen | 8,607 (91.3%) | 823 (8.7%) |
Health Insurance Coverage by Household Income in Allen County
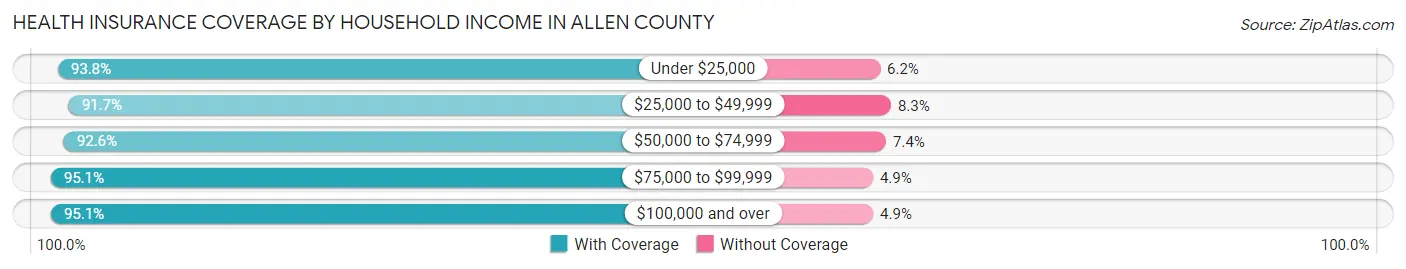
| Household Income | With Coverage | Without Coverage |
| Under $25,000 | 11,233 (93.8%) | 748 (6.2%) |
| $25,000 to $49,999 | 17,714 (91.7%) | 1,599 (8.3%) |
| $50,000 to $74,999 | 16,322 (92.6%) | 1,296 (7.4%) |
| $75,000 to $99,999 | 16,821 (95.1%) | 868 (4.9%) |
| $100,000 and over | 30,335 (95.1%) | 1,577 (4.9%) |
Public vs Private Health Insurance Coverage by Age in Allen County
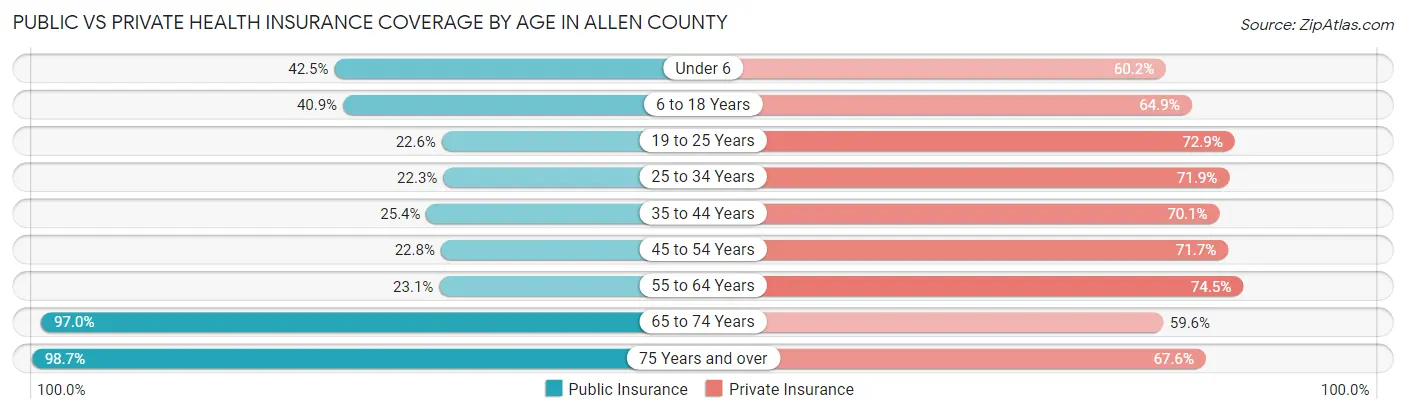
| Age Bracket | Public Insurance | Private Insurance |
| Under 6 | 3,100 (42.5%) | 4,387 (60.2%) |
| 6 to 18 Years | 7,323 (40.9%) | 11,617 (64.9%) |
| 19 to 25 Years | 2,129 (22.6%) | 6,873 (72.9%) |
| 25 to 34 Years | 2,406 (22.3%) | 7,751 (71.9%) |
| 35 to 44 Years | 2,999 (25.4%) | 8,267 (70.1%) |
| 45 to 54 Years | 2,530 (22.8%) | 7,966 (71.7%) |
| 55 to 64 Years | 3,089 (23.1%) | 9,980 (74.5%) |
| 65 to 74 Years | 10,285 (97.0%) | 6,322 (59.6%) |
| 75 Years and over | 7,221 (98.7%) | 4,943 (67.5%) |
| Total | 41,082 (41.2%) | 68,106 (68.3%) |
Disability Status by Sex by Age in Allen County
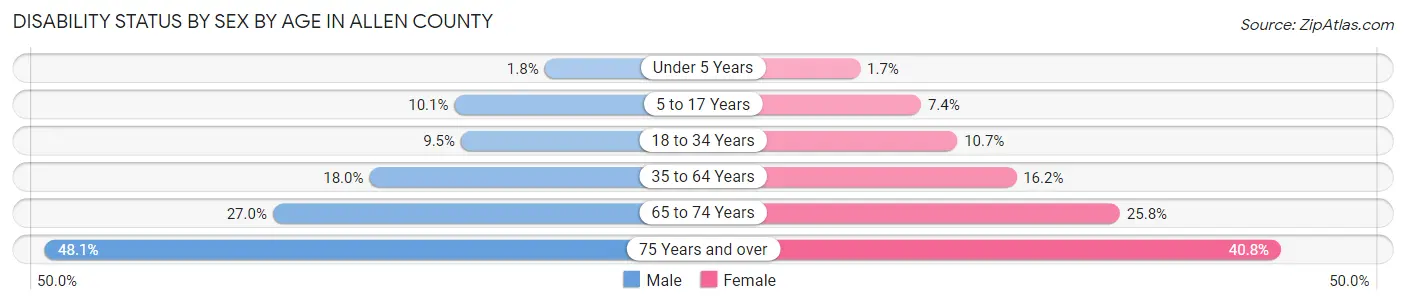
| Age Bracket | Male | Female |
| Under 5 Years | 57 (1.8%) | 49 (1.7%) |
| 5 to 17 Years | 924 (10.1%) | 634 (7.3%) |
| 18 to 34 Years | 1,074 (9.5%) | 1,093 (10.7%) |
| 35 to 64 Years | 3,170 (18.0%) | 3,028 (16.2%) |
| 65 to 74 Years | 1,367 (27.0%) | 1,430 (25.8%) |
| 75 Years and over | 1,370 (48.1%) | 1,821 (40.7%) |
Disability Class by Sex by Age in Allen County
Disability Class: Hearing Difficulty
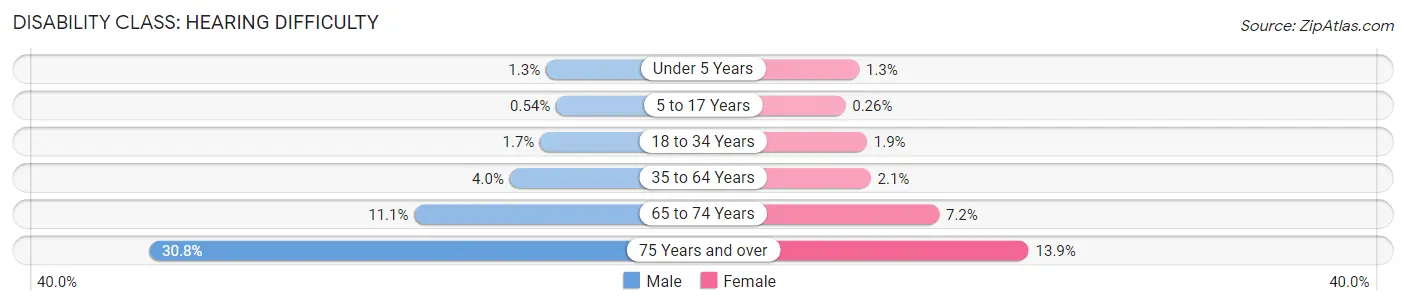
| Age Bracket | Male | Female |
| Under 5 Years | 42 (1.3%) | 37 (1.3%) |
| 5 to 17 Years | 49 (0.5%) | 22 (0.3%) |
| 18 to 34 Years | 194 (1.7%) | 190 (1.9%) |
| 35 to 64 Years | 701 (4.0%) | 400 (2.1%) |
| 65 to 74 Years | 561 (11.1%) | 400 (7.2%) |
| 75 Years and over | 876 (30.7%) | 620 (13.9%) |
Disability Class: Vision Difficulty
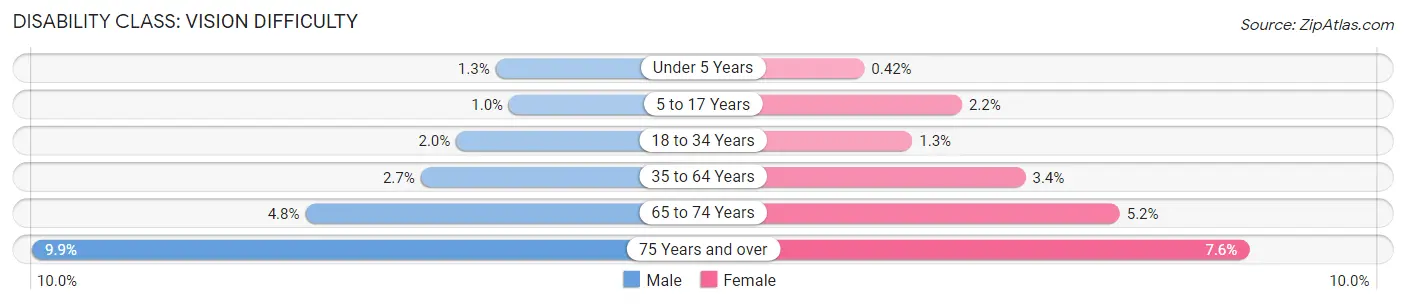
| Age Bracket | Male | Female |
| Under 5 Years | 41 (1.3%) | 12 (0.4%) |
| 5 to 17 Years | 92 (1.0%) | 192 (2.2%) |
| 18 to 34 Years | 225 (2.0%) | 134 (1.3%) |
| 35 to 64 Years | 466 (2.6%) | 637 (3.4%) |
| 65 to 74 Years | 243 (4.8%) | 286 (5.2%) |
| 75 Years and over | 281 (9.9%) | 338 (7.6%) |
Disability Class: Cognitive Difficulty
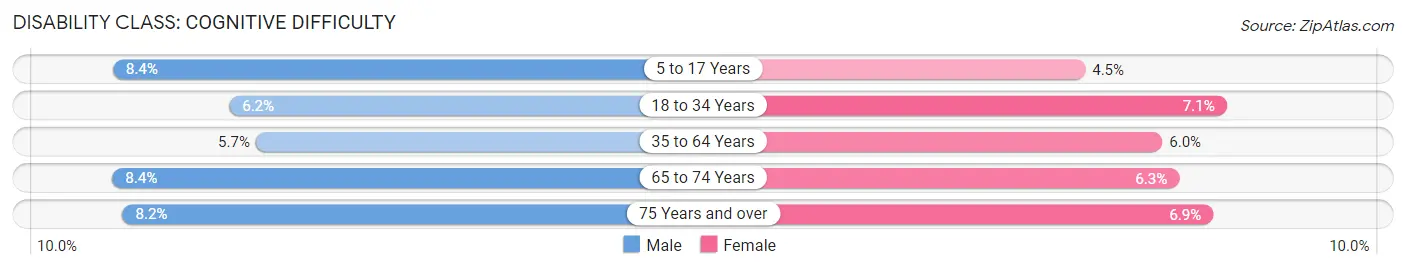
| Age Bracket | Male | Female |
| 5 to 17 Years | 763 (8.4%) | 390 (4.5%) |
| 18 to 34 Years | 700 (6.2%) | 729 (7.1%) |
| 35 to 64 Years | 1,006 (5.7%) | 1,112 (5.9%) |
| 65 to 74 Years | 424 (8.4%) | 347 (6.3%) |
| 75 Years and over | 233 (8.2%) | 308 (6.9%) |
Disability Class: Ambulatory Difficulty
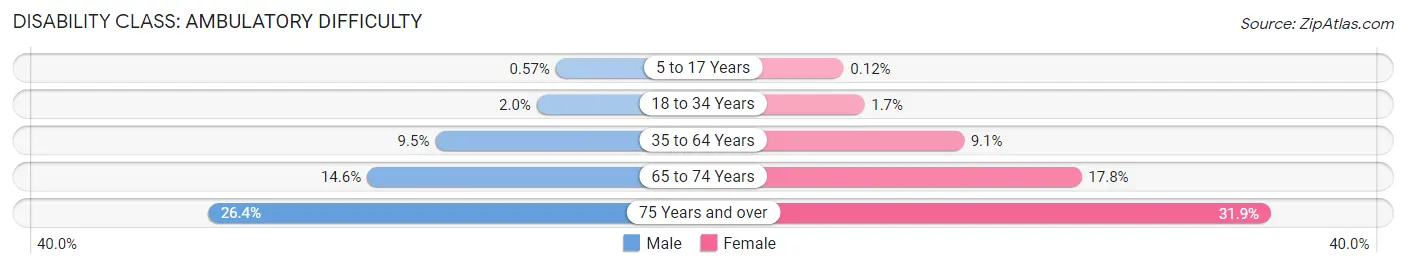
| Age Bracket | Male | Female |
| 5 to 17 Years | 52 (0.6%) | 10 (0.1%) |
| 18 to 34 Years | 224 (2.0%) | 171 (1.7%) |
| 35 to 64 Years | 1,674 (9.5%) | 1,693 (9.0%) |
| 65 to 74 Years | 739 (14.6%) | 986 (17.8%) |
| 75 Years and over | 752 (26.4%) | 1,424 (31.9%) |
Disability Class: Self-Care Difficulty
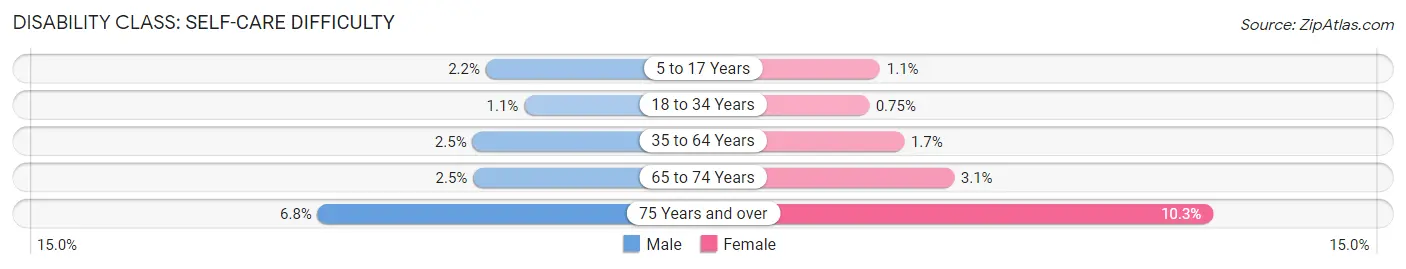
| Age Bracket | Male | Female |
| 5 to 17 Years | 197 (2.2%) | 91 (1.1%) |
| 18 to 34 Years | 123 (1.1%) | 77 (0.7%) |
| 35 to 64 Years | 445 (2.5%) | 324 (1.7%) |
| 65 to 74 Years | 127 (2.5%) | 173 (3.1%) |
| 75 Years and over | 195 (6.8%) | 462 (10.3%) |
Technology Access in Allen County
Computing Device Access in Allen County
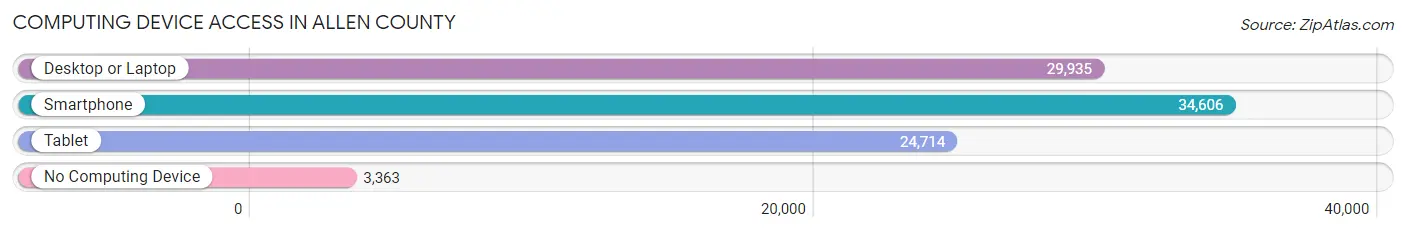
| Device Type | # Households | % Households |
| Desktop or Laptop | 29,935 | 73.5% |
| Smartphone | 34,606 | 85.0% |
| Tablet | 24,714 | 60.7% |
| No Computing Device | 3,363 | 8.3% |
| Total | 40,735 | 100.0% |
Internet Access in Allen County
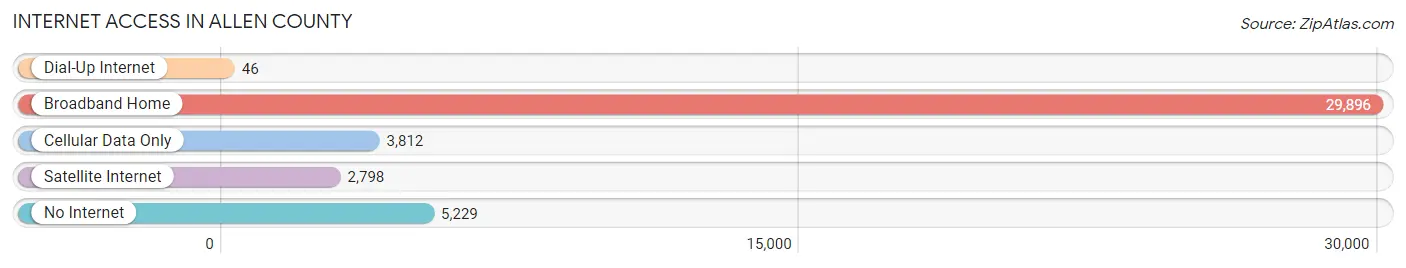
| Internet Type | # Households | % Households |
| Dial-Up Internet | 46 | 0.1% |
| Broadband Home | 29,896 | 73.4% |
| Cellular Data Only | 3,812 | 9.4% |
| Satellite Internet | 2,798 | 6.9% |
| No Internet | 5,229 | 12.8% |
| Total | 40,735 | 100.0% |
Allen County Summary
Allen County, Ohio is located in the northwestern part of the state and is part of the Toledo Metropolitan Statistical Area. It is bordered by Putnam County to the north, Hardin County to the east, Auglaize County to the south, and Van Wert County to the west. The county seat is Lima, which is also the largest city in the county. The county was established in 1820 and named after Colonel John Allen, a Revolutionary War hero.
Geography
Allen County covers an area of 437 square miles and is mostly flat with some rolling hills. The Blanchard River runs through the county and is a major tributary of the Auglaize River. The county is part of the Great Black Swamp region, which was once a vast marshland that covered much of northwestern Ohio. The county is also home to several state parks, including the Mary Jane Thurston State Park, the Indian Lake State Park, and the Grand Lake St. Marys State Park.
Demographics
As of the 2010 census, Allen County had a population of 106,331. The population was spread out with 24.3% under the age of 18, 8.7% from 18 to 24, 27.2% from 25 to 44, 24.3% from 45 to 64, and 15.5% who were 65 years of age or older. The median age was 38.3 years. The gender makeup of the county was 49.3% male and 50.7% female.
The racial makeup of the county was 90.2% White, 4.7% African American, 0.3% Native American, 1.2% Asian, 0.1% Pacific Islander, 1.3% from other races, and 2.3% from two or more races. Hispanic or Latino of any race were 3.2% of the population.
Economy
Allen County’s economy is largely based on manufacturing and agriculture. The county is home to several large manufacturing companies, including Honda of America, which has a large manufacturing plant in the city of Anna. Other major employers in the county include the Lima Refinery, the Lima Army Tank Plant, and the Lima Memorial Health System.
Agriculture is also an important part of the county’s economy. The county is home to several large farms, including the Miller Family Farm, which is one of the largest in the state. The county is also home to several wineries, including the Ohio Valley Winery and the St. Marys Winery.
Conclusion
Allen County, Ohio is a rural county located in the northwestern part of the state. It is home to a diverse population and a strong economy based on manufacturing and agriculture. The county is home to several state parks, wineries, and large farms, making it a great place to live and work.
Common Questions
What is the Total Population of Allen County?
Total Population of Allen County is 102,087.
What is the Total Male Population of Allen County?
Total Male Population of Allen County is 51,158.
What is the Total Female Population of Allen County?
Total Female Population of Allen County is 50,929.
What is the Ratio of Males per 100 Females in Allen County?
There are 100.45 Males per 100 Females in Allen County.
What is the Ratio of Females per 100 Males in Allen County?
There are 99.55 Females per 100 Males in Allen County.
What is the Median Population Age in Allen County?
Median Population Age in Allen County is 39.8 Years.
What is the Average Family Size in Allen County
Average Family Size in Allen County is 3.1 People.
What is the Average Household Size in Allen County
Average Household Size in Allen County is 2.4 People.
What is Per Capita Income in Allen County?
Per Capita income in Allen County is $31,523.
What is the Median Family Income in Allen County?
Median Family Income in Allen County is $76,264.
What is the Median Household income in Allen County?
Median Household Income in Allen County is $58,976.
What is Income or Wage Gap in Allen County?
Income or Wage Gap in Allen County is 34.8%.
Women in Allen County earn 65.2 cents for every dollar earned by a man.
What is Family Income Deficit in Allen County?
Family Income Deficit in Allen County is $11,191.
Families that are below poverty line in Allen County earn $11,191 less on average than the poverty threshold level.
What is Inequality or Gini Index in Allen County?
Inequality or Gini Index in Allen County is 0.43.
How Large is the Labor Force in Allen County?
There are 49,301 People in the Labor Forcein in Allen County.
What is the Percentage of People in the Labor Force in Allen County?
61.0% of People are in the Labor Force in Allen County.
What is the Unemployment Rate in Allen County?
Unemployment Rate in Allen County is 6.1%.