Bay View, OH
Bay View Map
Bay View Overview
710
TOTAL POPULATION
361
MALE POPULATION
349
FEMALE POPULATION
103.44
MALES / 100 FEMALES
96.68
FEMALES / 100 MALES
55.1
MEDIAN AGE
2.7
AVG FAMILY SIZE
2.4
AVG HOUSEHOLD SIZE
$42,951
PER CAPITA INCOME
$86,573
AVG FAMILY INCOME
$78,125
AVG HOUSEHOLD INCOME
35.6%
WAGE / INCOME GAP [ % ]
64.4¢/ $1
WAGE / INCOME GAP [ $ ]
0.45
INEQUALITY / GINI INDEX
436
LABOR FORCE [ PEOPLE ]
65.7%
PERCENT IN LABOR FORCE
6.2%
UNEMPLOYMENT RATE
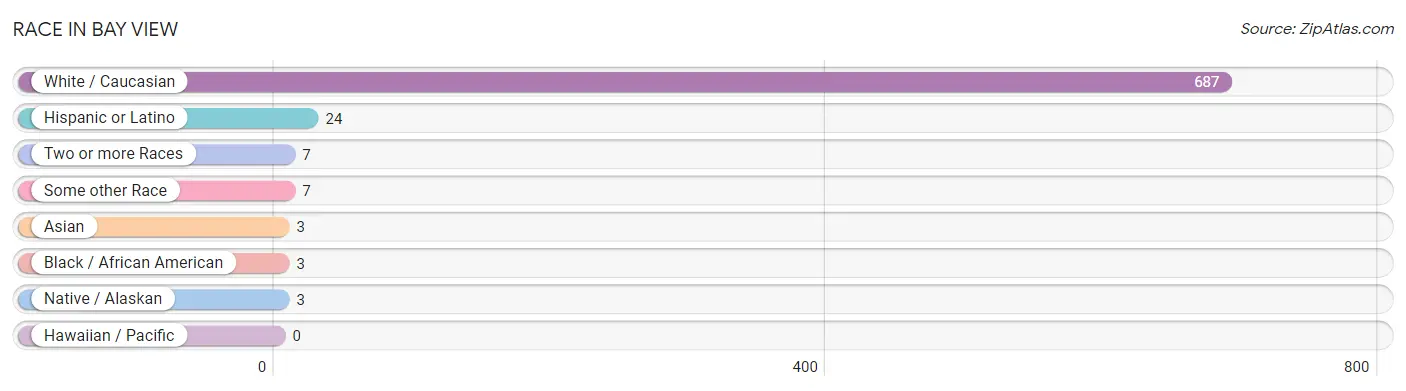
Race in Bay View
The most populous races in Bay View are White / Caucasian (687 | 96.8%), Hispanic or Latino (24 | 3.4%), and Two or more Races (7 | 1.0%).
| Race | # Population | % Population |
| Asian | 3 | 0.4% |
| Black / African American | 3 | 0.4% |
| Hawaiian / Pacific | 0 | 0.0% |
| Hispanic or Latino | 24 | 3.4% |
| Native / Alaskan | 3 | 0.4% |
| White / Caucasian | 687 | 96.8% |
| Two or more Races | 7 | 1.0% |
| Some other Race | 7 | 1.0% |
| Total | 710 | 100.0% |
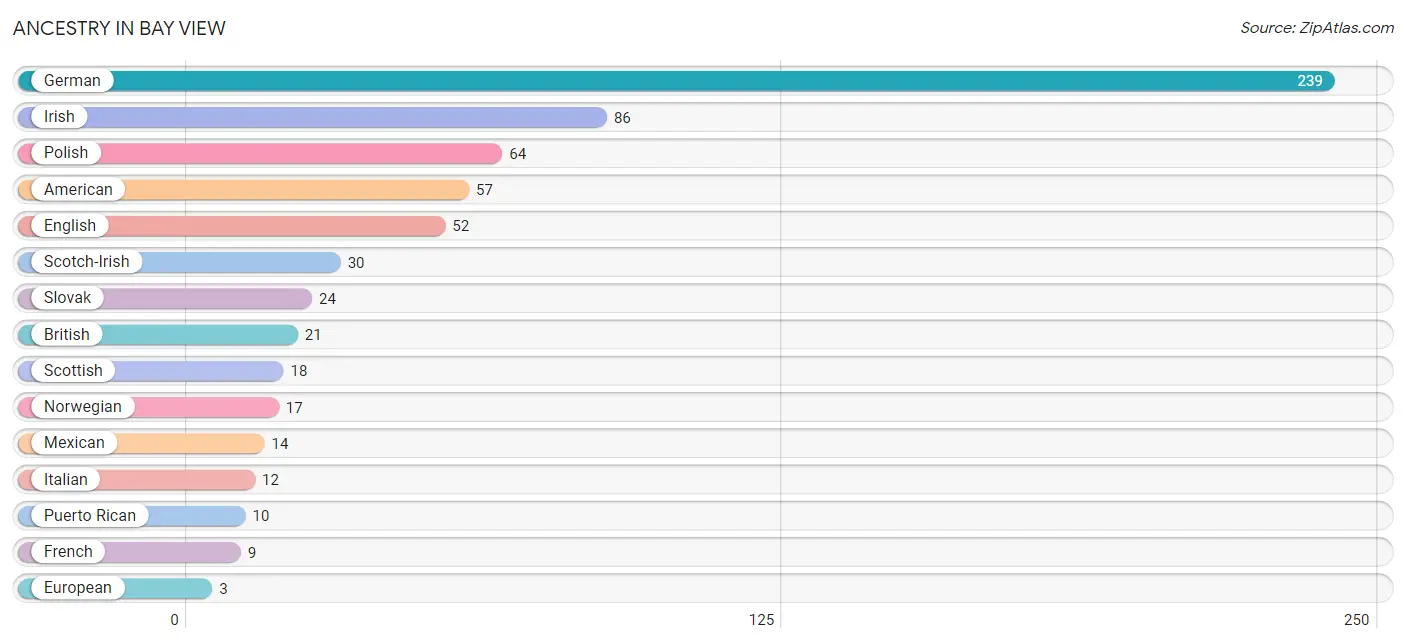
Ancestry in Bay View
The most populous ancestries reported in Bay View are German (239 | 33.7%), Irish (86 | 12.1%), Polish (64 | 9.0%), American (57 | 8.0%), and English (52 | 7.3%), together accounting for 70.1% of all Bay View residents.
| Ancestry | # Population | % Population |
| American | 57 | 8.0% |
| British | 21 | 3.0% |
| Danish | 2 | 0.3% |
| Eastern European | 2 | 0.3% |
| English | 52 | 7.3% |
| European | 3 | 0.4% |
| French | 9 | 1.3% |
| French Canadian | 1 | 0.1% |
| German | 239 | 33.7% |
| Hungarian | 1 | 0.1% |
| Indian (Asian) | 3 | 0.4% |
| Irish | 86 | 12.1% |
| Italian | 12 | 1.7% |
| Mexican | 14 | 2.0% |
| Mexican American Indian | 3 | 0.4% |
| Norwegian | 17 | 2.4% |
| Polish | 64 | 9.0% |
| Puerto Rican | 10 | 1.4% |
| Scotch-Irish | 30 | 4.2% |
| Scottish | 18 | 2.5% |
| Slovak | 24 | 3.4% |
| Swedish | 1 | 0.1% |
| Swiss | 2 | 0.3% | View All 23 Rows |
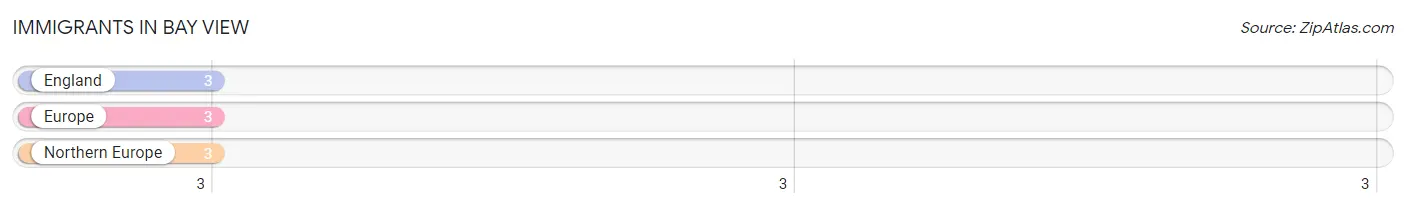
Immigrants in Bay View
The most numerous immigrant groups reported in Bay View came from England (3 | 0.4%), Europe (3 | 0.4%), and Northern Europe (3 | 0.4%), together accounting for 1.3% of all Bay View residents.
| Immigration Origin | # Population | % Population |
| England | 3 | 0.4% |
| Europe | 3 | 0.4% |
| Northern Europe | 3 | 0.4% | View All 3 Rows |
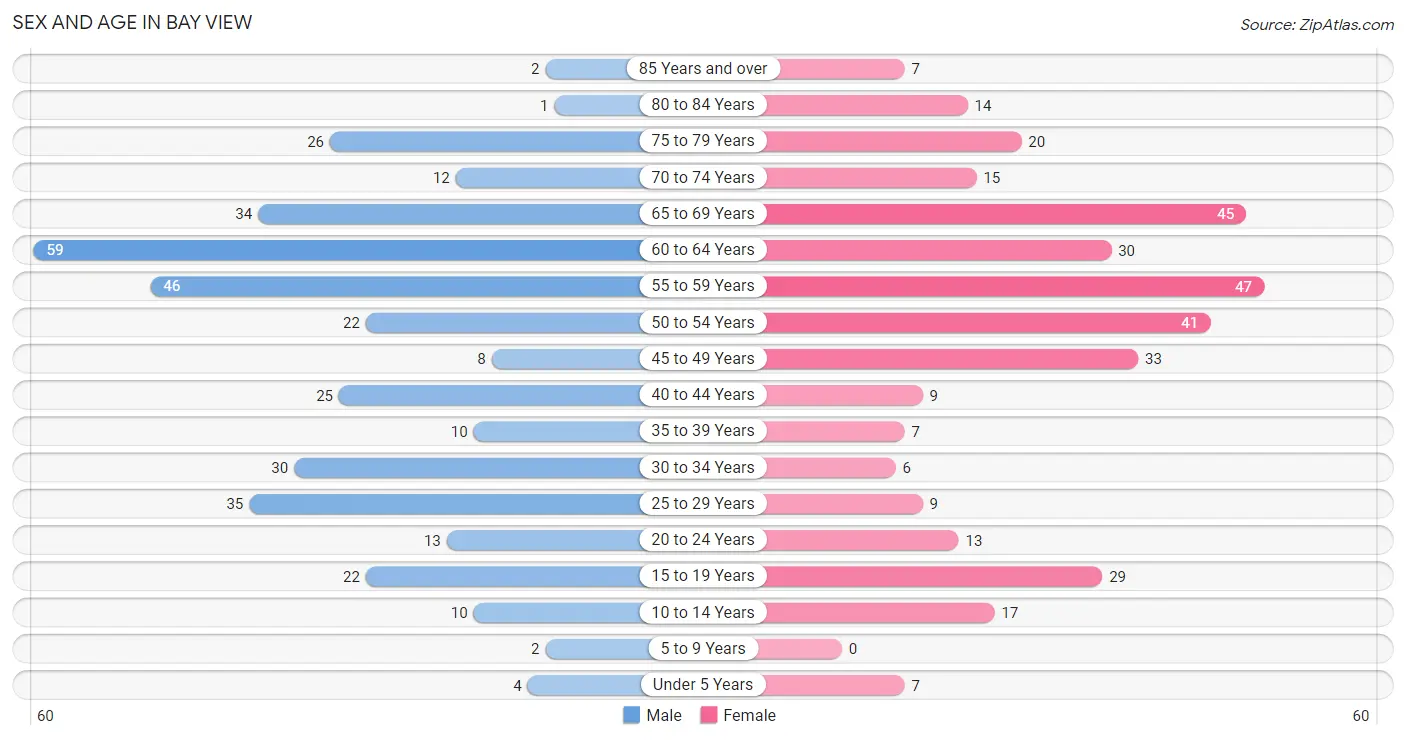
Sex and Age in Bay View
Sex and Age in Bay View
The most populous age groups in Bay View are 60 to 64 Years (59 | 16.3%) for men and 55 to 59 Years (47 | 13.5%) for women.
| Age Bracket | Male | Female |
| Under 5 Years | 4 (1.1%) | 7 (2.0%) |
| 5 to 9 Years | 2 (0.5%) | 0 (0.0%) |
| 10 to 14 Years | 10 (2.8%) | 17 (4.9%) |
| 15 to 19 Years | 22 (6.1%) | 29 (8.3%) |
| 20 to 24 Years | 13 (3.6%) | 13 (3.7%) |
| 25 to 29 Years | 35 (9.7%) | 9 (2.6%) |
| 30 to 34 Years | 30 (8.3%) | 6 (1.7%) |
| 35 to 39 Years | 10 (2.8%) | 7 (2.0%) |
| 40 to 44 Years | 25 (6.9%) | 9 (2.6%) |
| 45 to 49 Years | 8 (2.2%) | 33 (9.5%) |
| 50 to 54 Years | 22 (6.1%) | 41 (11.7%) |
| 55 to 59 Years | 46 (12.7%) | 47 (13.5%) |
| 60 to 64 Years | 59 (16.3%) | 30 (8.6%) |
| 65 to 69 Years | 34 (9.4%) | 45 (12.9%) |
| 70 to 74 Years | 12 (3.3%) | 15 (4.3%) |
| 75 to 79 Years | 26 (7.2%) | 20 (5.7%) |
| 80 to 84 Years | 1 (0.3%) | 14 (4.0%) |
| 85 Years and over | 2 (0.5%) | 7 (2.0%) |
| Total | 361 (100.0%) | 349 (100.0%) |
Families and Households in Bay View
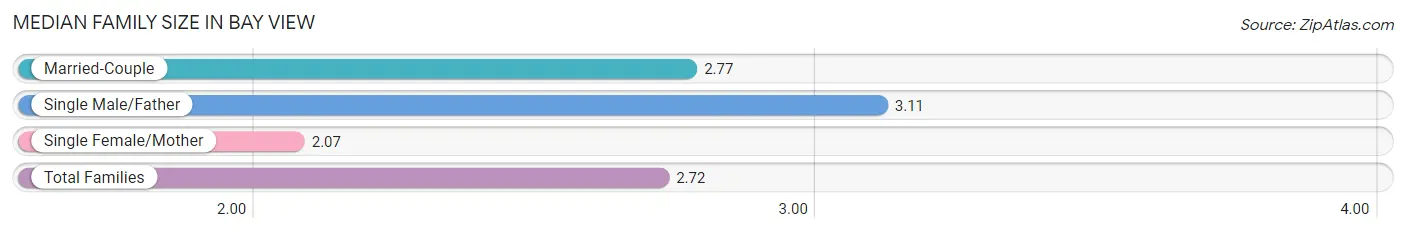
Median Family Size in Bay View
The median family size in Bay View is 2.72 persons per family, with single male/father families (27 | 12.1%) accounting for the largest median family size of 3.11 persons per family. On the other hand, single female/mother families (29 | 13.0%) represent the smallest median family size with 2.07 persons per family.
| Family Type | # Families | Family Size |
| Married-Couple | 167 (74.9%) | 2.77 |
| Single Male/Father | 27 (12.1%) | 3.11 |
| Single Female/Mother | 29 (13.0%) | 2.07 |
| Total Families | 223 (100.0%) | 2.72 |
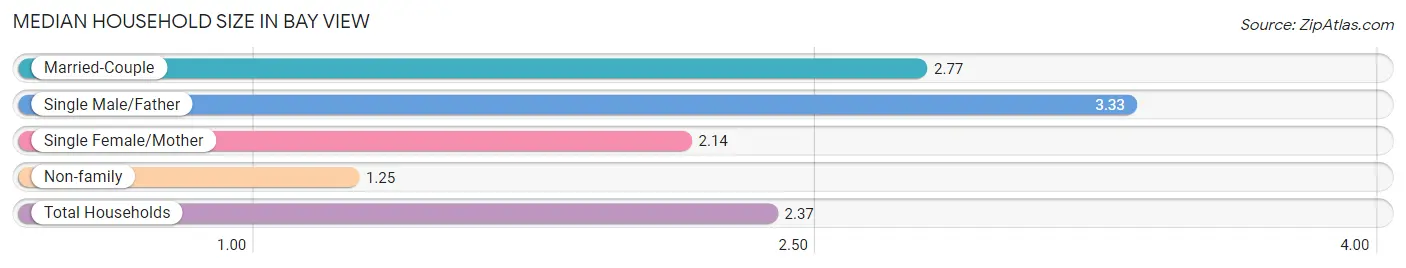
Median Household Size in Bay View
The median household size in Bay View is 2.37 persons per household, with single male/father households (27 | 9.0%) accounting for the largest median household size of 3.33 persons per household. non-family households (76 | 25.4%) represent the smallest median household size with 1.25 persons per household.
| Household Type | # Households | Household Size |
| Married-Couple | 167 (55.8%) | 2.77 |
| Single Male/Father | 27 (9.0%) | 3.33 |
| Single Female/Mother | 29 (9.7%) | 2.14 |
| Non-family | 76 (25.4%) | 1.25 |
| Total Households | 299 (100.0%) | 2.37 |
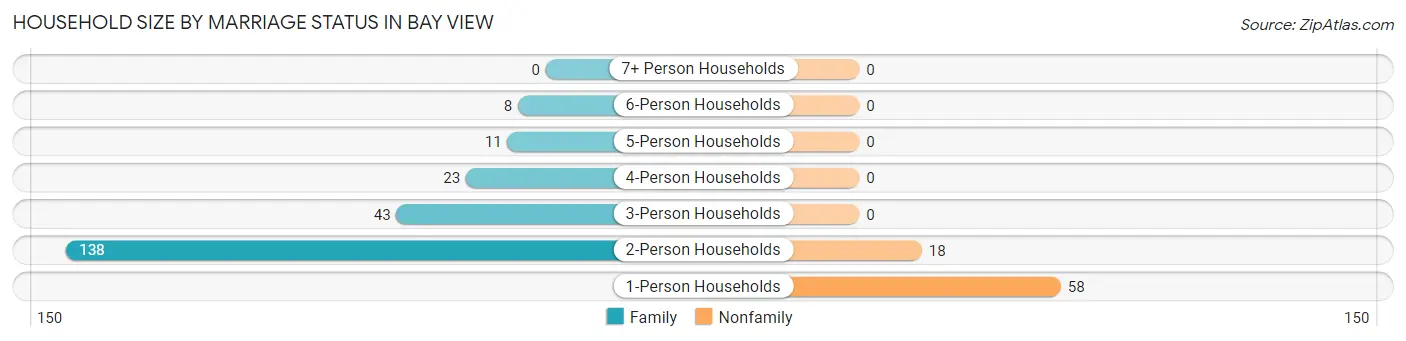
Household Size by Marriage Status in Bay View
Out of a total of 299 households in Bay View, 223 (74.6%) are family households, while 76 (25.4%) are nonfamily households. The most numerous type of family households are 2-person households, comprising 138, and the most common type of nonfamily households are 1-person households, comprising 58.
| Household Size | Family Households | Nonfamily Households |
| 1-Person Households | - | 58 (19.4%) |
| 2-Person Households | 138 (46.2%) | 18 (6.0%) |
| 3-Person Households | 43 (14.4%) | 0 (0.0%) |
| 4-Person Households | 23 (7.7%) | 0 (0.0%) |
| 5-Person Households | 11 (3.7%) | 0 (0.0%) |
| 6-Person Households | 8 (2.7%) | 0 (0.0%) |
| 7+ Person Households | 0 (0.0%) | 0 (0.0%) |
| Total | 223 (74.6%) | 76 (25.4%) |
Female Fertility in Bay View
Fertility by Age in Bay View
Average fertility rate in Bay View is 27.0 births per 1,000 women. Women in the age bracket of 15 to 19 years have the highest fertility rate with 103.0 births per 1,000 women. Women in the age bracket of 15 to 19 years acount for 100.0% of all women with births.
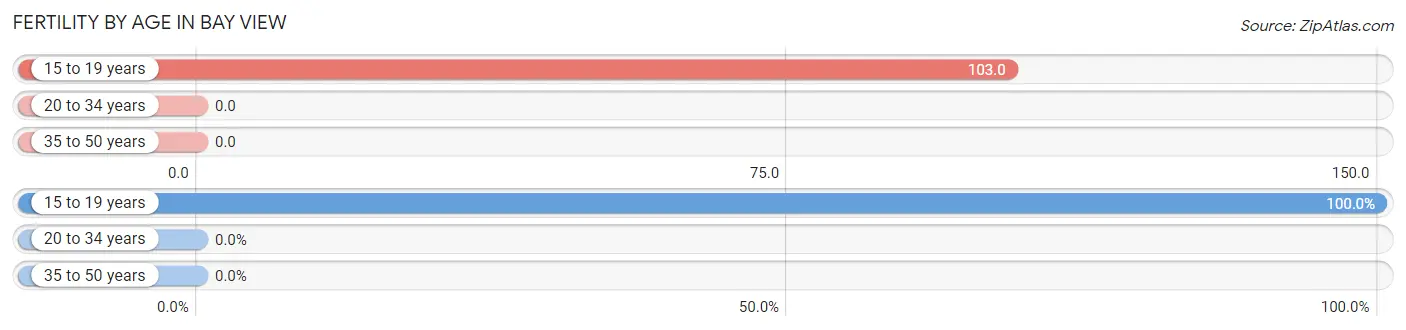
| Age Bracket | Women with Births | Births / 1,000 Women |
| 15 to 19 years | 3 (100.0%) | 103.0 |
| 20 to 34 years | 0 (0.0%) | 0.0 |
| 35 to 50 years | 0 (0.0%) | 0.0 |
| Total | 3 (100.0%) | 27.0 |
Fertility by Age by Marriage Status in Bay View
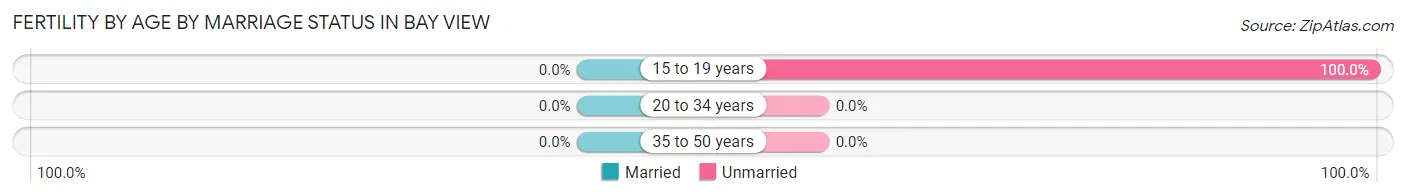
| Age Bracket | Married | Unmarried |
| 15 to 19 years | 0 (0.0%) | 3 (100.0%) |
| 20 to 34 years | 0 (0.0%) | 0 (0.0%) |
| 35 to 50 years | 0 (0.0%) | 0 (0.0%) |
| Total | 0 (0.0%) | 3 (100.0%) |
Fertility by Education in Bay View
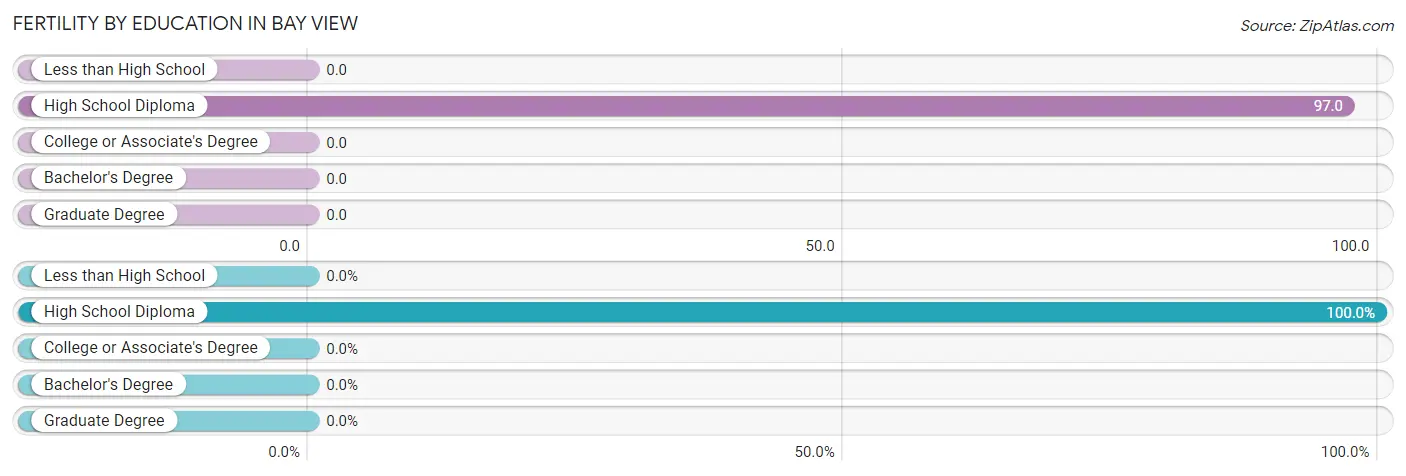
| Educational Attainment | Women with Births | Births / 1,000 Women |
| Less than High School | 0 (0.0%) | 0.0 |
| High School Diploma | 3 (100.0%) | 97.0 |
| College or Associate's Degree | 0 (0.0%) | 0.0 |
| Bachelor's Degree | 0 (0.0%) | 0.0 |
| Graduate Degree | 0 (0.0%) | 0.0 |
| Total | 3 (100.0%) | 27.0 |
Fertility by Education by Marriage Status in Bay View
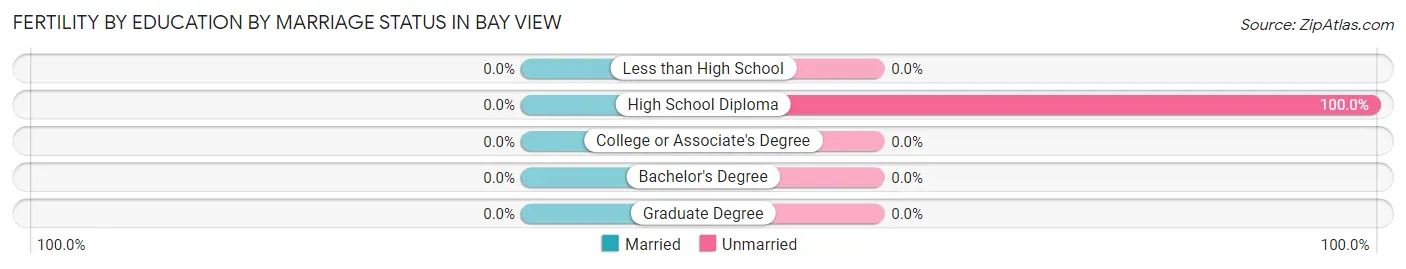
| Educational Attainment | Married | Unmarried |
| Less than High School | 0 (0.0%) | 0 (0.0%) |
| High School Diploma | 0 (0.0%) | 3 (100.0%) |
| College or Associate's Degree | 0 (0.0%) | 0 (0.0%) |
| Bachelor's Degree | 0 (0.0%) | 0 (0.0%) |
| Graduate Degree | 0 (0.0%) | 0 (0.0%) |
| Total | 0 (0.0%) | 3 (100.0%) |
Income in Bay View
Income Overview in Bay View
Per Capita Income in Bay View is $42,951, while median incomes of families and households are $86,573 and $78,125 respectively.
| Characteristic | Number | Measure |
| Per Capita Income | 710 | $42,951 |
| Median Family Income | 223 | $86,573 |
| Mean Family Income | 223 | $115,220 |
| Median Household Income | 299 | $78,125 |
| Mean Household Income | 299 | $102,134 |
| Income Deficit | 223 | $0 |
| Wage / Income Gap (%) | 710 | 35.62% |
| Wage / Income Gap ($) | 710 | 64.38¢ per $1 |
| Gini / Inequality Index | 710 | 0.45 |
Earnings by Sex in Bay View
Average Earnings in Bay View are $42,019, $51,563 for men and $33,194 for women, a difference of 35.6%.
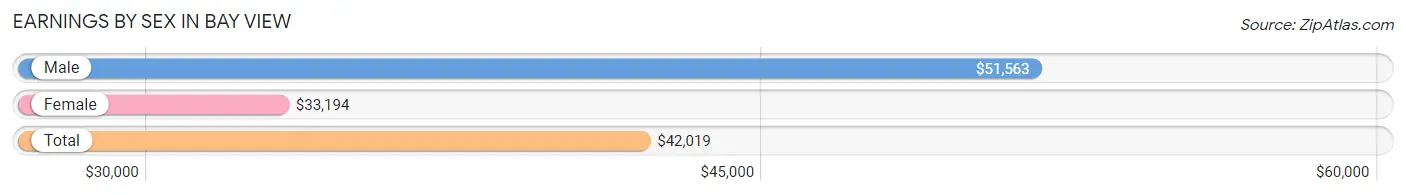
| Sex | Number | Average Earnings |
| Male | 256 (57.5%) | $51,563 |
| Female | 189 (42.5%) | $33,194 |
| Total | 445 (100.0%) | $42,019 |
Earnings by Sex by Income Bracket in Bay View
The most common earnings brackets in Bay View are $75,000 to $99,999 for men (42 | 16.4%) and $10,000 to $12,499 for women (19 | 10.1%).
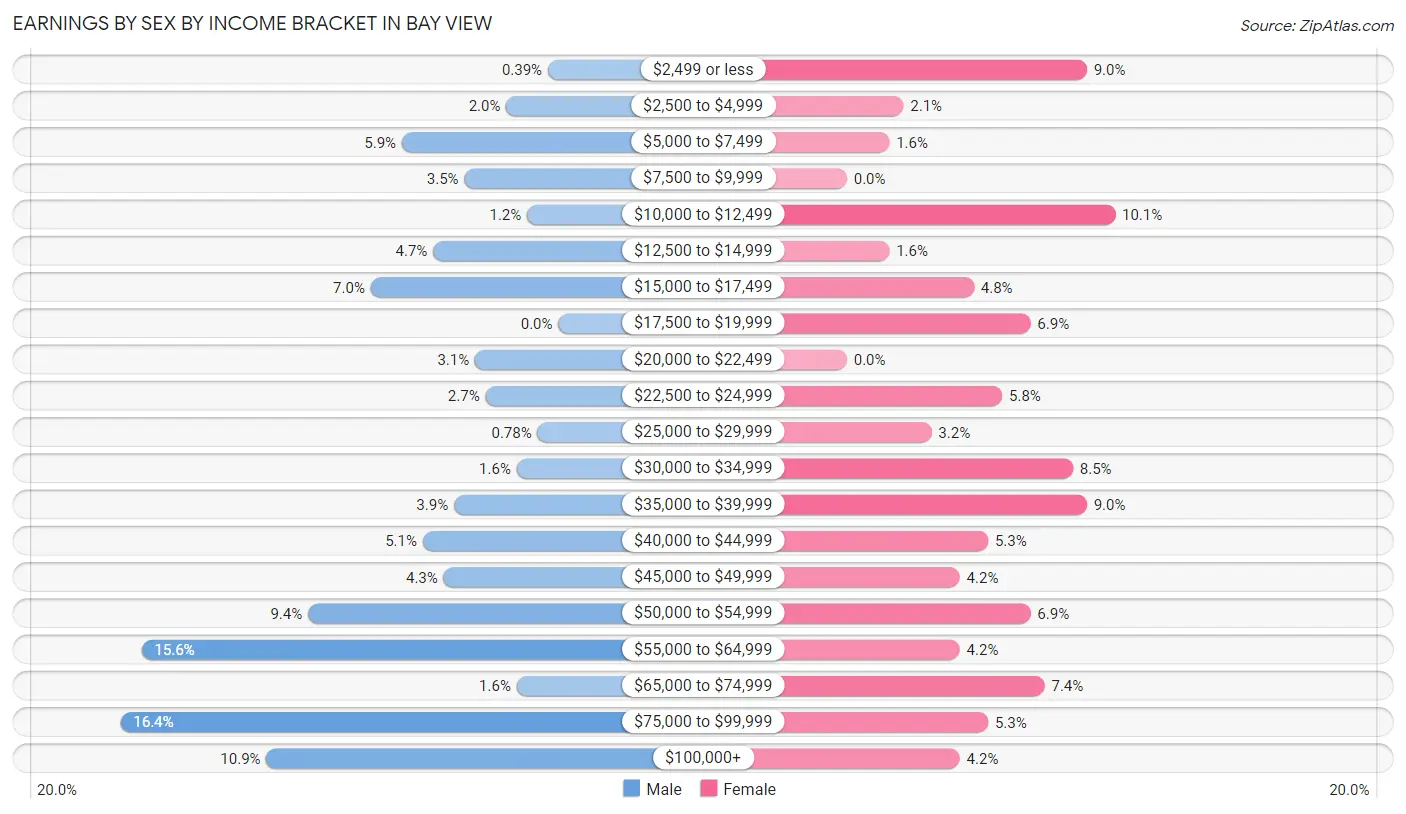
| Income | Male | Female |
| $2,499 or less | 1 (0.4%) | 17 (9.0%) |
| $2,500 to $4,999 | 5 (1.9%) | 4 (2.1%) |
| $5,000 to $7,499 | 15 (5.9%) | 3 (1.6%) |
| $7,500 to $9,999 | 9 (3.5%) | 0 (0.0%) |
| $10,000 to $12,499 | 3 (1.2%) | 19 (10.1%) |
| $12,500 to $14,999 | 12 (4.7%) | 3 (1.6%) |
| $15,000 to $17,499 | 18 (7.0%) | 9 (4.8%) |
| $17,500 to $19,999 | 0 (0.0%) | 13 (6.9%) |
| $20,000 to $22,499 | 8 (3.1%) | 0 (0.0%) |
| $22,500 to $24,999 | 7 (2.7%) | 11 (5.8%) |
| $25,000 to $29,999 | 2 (0.8%) | 6 (3.2%) |
| $30,000 to $34,999 | 4 (1.6%) | 16 (8.5%) |
| $35,000 to $39,999 | 10 (3.9%) | 17 (9.0%) |
| $40,000 to $44,999 | 13 (5.1%) | 10 (5.3%) |
| $45,000 to $49,999 | 11 (4.3%) | 8 (4.2%) |
| $50,000 to $54,999 | 24 (9.4%) | 13 (6.9%) |
| $55,000 to $64,999 | 40 (15.6%) | 8 (4.2%) |
| $65,000 to $74,999 | 4 (1.6%) | 14 (7.4%) |
| $75,000 to $99,999 | 42 (16.4%) | 10 (5.3%) |
| $100,000+ | 28 (10.9%) | 8 (4.2%) |
| Total | 256 (100.0%) | 189 (100.0%) |
Earnings by Sex by Educational Attainment in Bay View
Average earnings in Bay View are $53,125 for men and $36,719 for women, a difference of 30.9%. Men with an educational attainment of college or associate's degree enjoy the highest average annual earnings of $71,667, while those with high school diploma education earn the least with $46,607. Women with an educational attainment of bachelor's degree earn the most with the average annual earnings of $47,188, while those with less than high school education have the smallest earnings of $22,679.
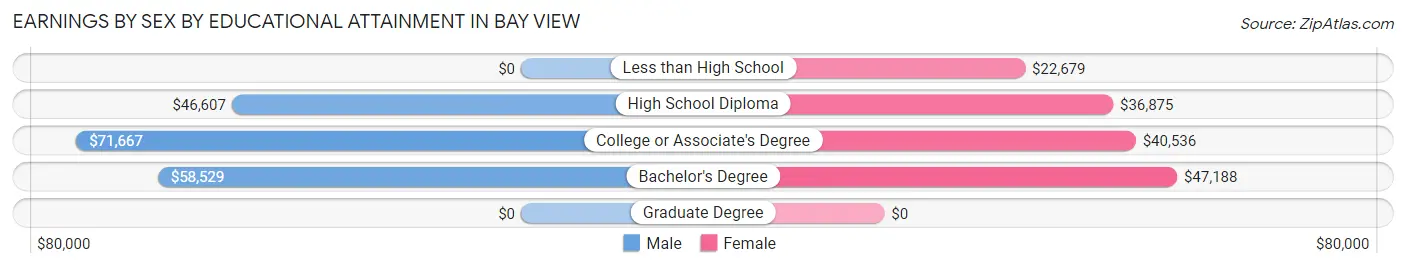
| Educational Attainment | Male Income | Female Income |
| Less than High School | - | - |
| High School Diploma | $46,607 | $36,875 |
| College or Associate's Degree | $71,667 | $40,536 |
| Bachelor's Degree | $58,529 | $47,188 |
| Graduate Degree | - | - |
| Total | $53,125 | $36,719 |
Family Income in Bay View
Family Income Brackets in Bay View
According to the Bay View family income data, there are 54 families falling into the $100,000 to $149,999 income range, which is the most common income bracket and makes up 24.2% of all families.
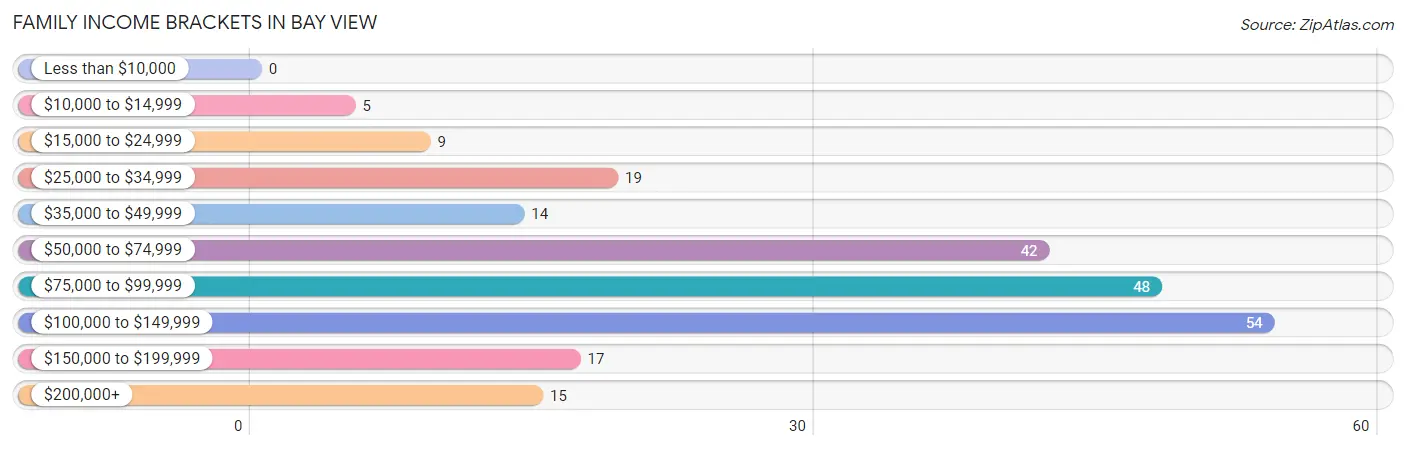
| Income Bracket | # Families | % Families |
| Less than $10,000 | 0 | 0.0% |
| $10,000 to $14,999 | 5 | 2.2% |
| $15,000 to $24,999 | 9 | 4.0% |
| $25,000 to $34,999 | 19 | 8.5% |
| $35,000 to $49,999 | 14 | 6.3% |
| $50,000 to $74,999 | 42 | 18.8% |
| $75,000 to $99,999 | 48 | 21.5% |
| $100,000 to $149,999 | 54 | 24.2% |
| $150,000 to $199,999 | 17 | 7.6% |
| $200,000+ | 15 | 6.7% |
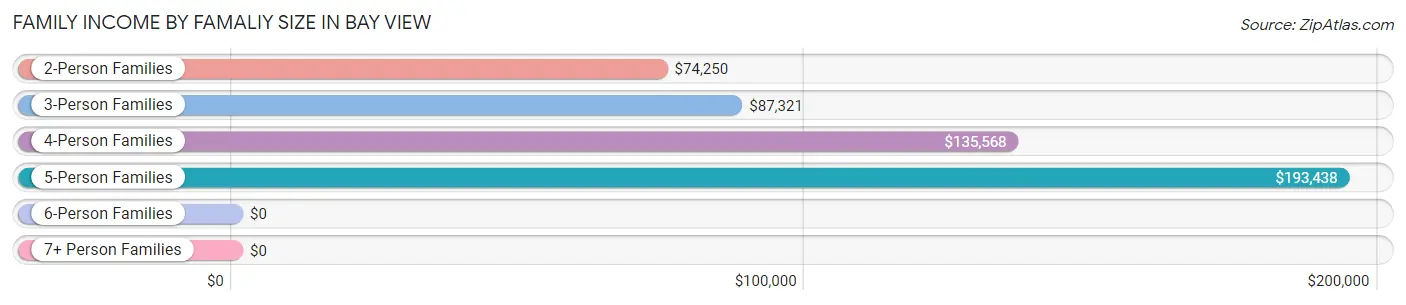
Family Income by Famaliy Size in Bay View
5-person families (11 | 4.9%) account for the highest median family income in Bay View with $193,438 per family, while 5-person families (11 | 4.9%) have the highest median income of $38,688 per family member.
| Income Bracket | # Families | Median Income |
| 2-Person Families | 144 (64.6%) | $74,250 |
| 3-Person Families | 41 (18.4%) | $87,321 |
| 4-Person Families | 19 (8.5%) | $135,568 |
| 5-Person Families | 11 (4.9%) | $193,438 |
| 6-Person Families | 8 (3.6%) | $0 |
| 7+ Person Families | 0 (0.0%) | $0 |
| Total | 223 (100.0%) | $86,573 |
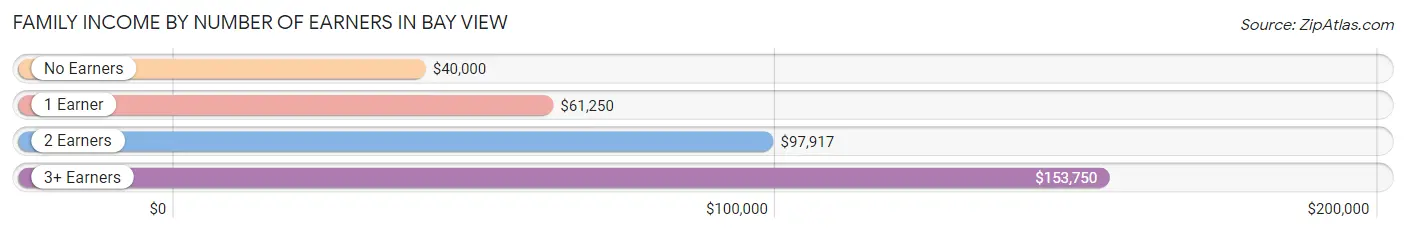
Family Income by Number of Earners in Bay View
The median family income in Bay View is $86,573, with families comprising 3+ earners (36) having the highest median family income of $153,750, while families with no earners (24) have the lowest median family income of $40,000, accounting for 16.1% and 10.8% of families, respectively.
| Number of Earners | # Families | Median Income |
| No Earners | 24 (10.8%) | $40,000 |
| 1 Earner | 78 (35.0%) | $61,250 |
| 2 Earners | 85 (38.1%) | $97,917 |
| 3+ Earners | 36 (16.1%) | $153,750 |
| Total | 223 (100.0%) | $86,573 |
Household Income in Bay View
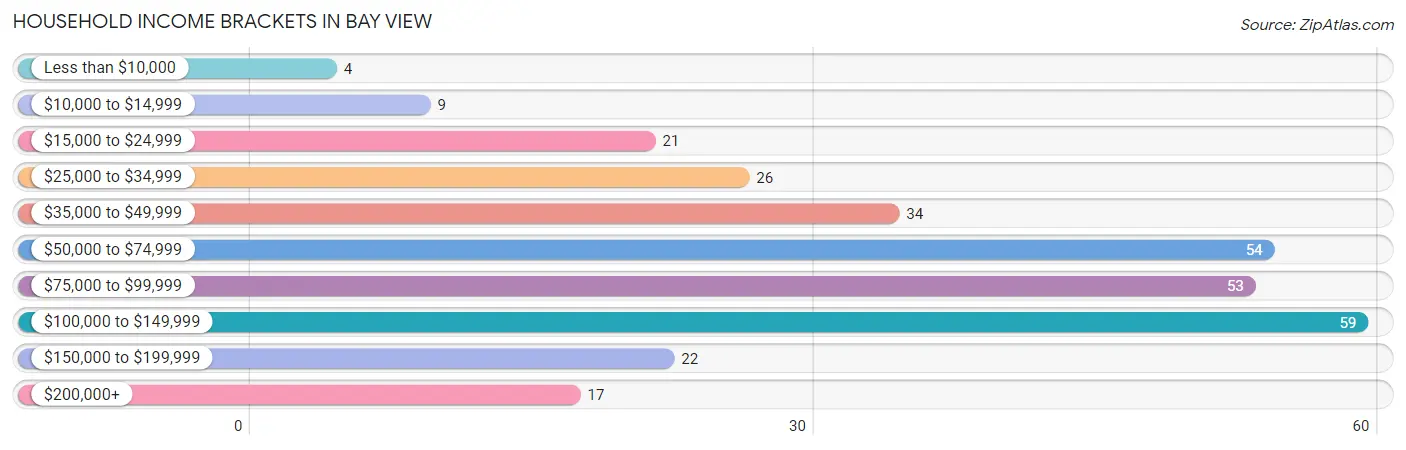
Household Income Brackets in Bay View
With 59 households falling in the category, the $100,000 to $149,999 income range is the most frequent in Bay View, accounting for 19.7% of all households. In contrast, only 4 households (1.3%) fall into the less than $10,000 income bracket, making it the least populous group.
| Income Bracket | # Households | % Households |
| Less than $10,000 | 4 | 1.3% |
| $10,000 to $14,999 | 9 | 3.0% |
| $15,000 to $24,999 | 21 | 7.0% |
| $25,000 to $34,999 | 26 | 8.7% |
| $35,000 to $49,999 | 34 | 11.4% |
| $50,000 to $74,999 | 54 | 18.1% |
| $75,000 to $99,999 | 53 | 17.7% |
| $100,000 to $149,999 | 59 | 19.7% |
| $150,000 to $199,999 | 22 | 7.4% |
| $200,000+ | 17 | 5.7% |
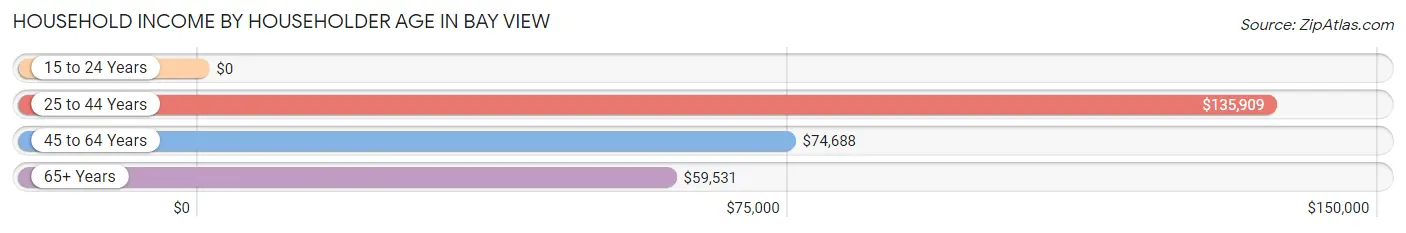
Household Income by Householder Age in Bay View
The median household income in Bay View is $78,125, with the highest median household income of $135,909 found in the 25 to 44 years age bracket for the primary householder. A total of 28 households (9.4%) fall into this category. Meanwhile, the 15 to 24 years age bracket for the primary householder has the lowest median household income of $0, with 2 households (0.7%) in this group.
| Income Bracket | # Households | Median Income |
| 15 to 24 Years | 2 (0.7%) | $0 |
| 25 to 44 Years | 28 (9.4%) | $135,909 |
| 45 to 64 Years | 138 (46.2%) | $74,688 |
| 65+ Years | 131 (43.8%) | $59,531 |
| Total | 299 (100.0%) | $78,125 |
Poverty in Bay View
Income Below Poverty by Sex and Age in Bay View
With 4.7% poverty level for males and 3.4% for females among the residents of Bay View, under 5 year old males and 18 to 24 year old females are the most vulnerable to poverty, with 4 males (100.0%) and 3 females (9.1%) in their respective age groups living below the poverty level.
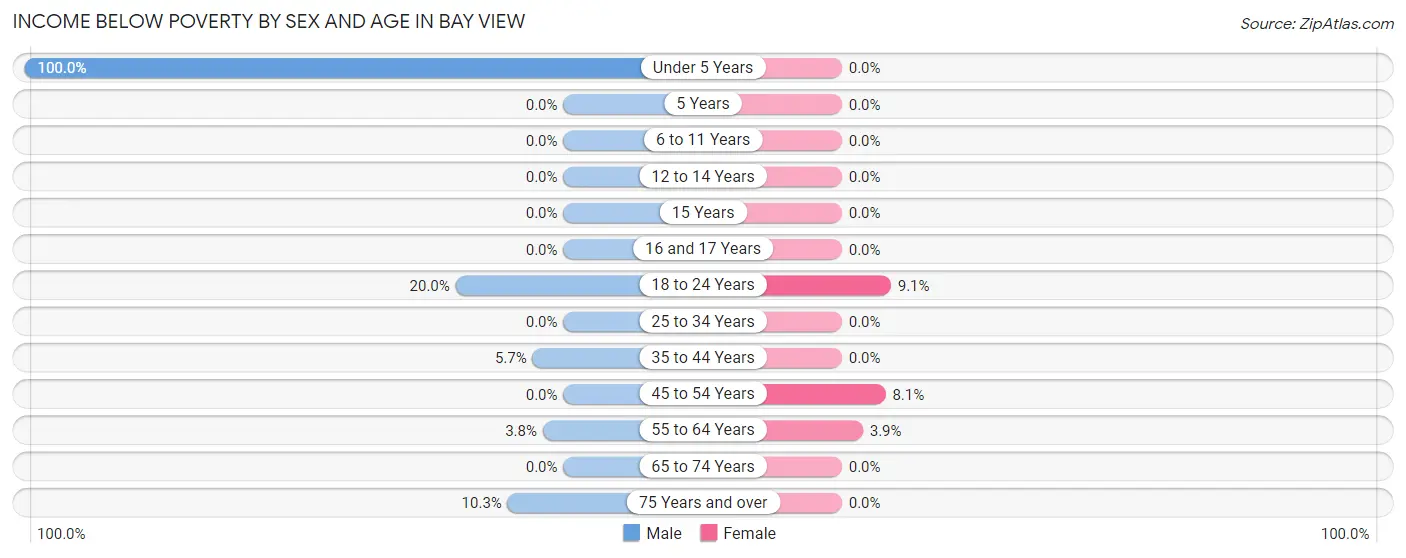
| Age Bracket | Male | Female |
| Under 5 Years | 4 (100.0%) | 0 (0.0%) |
| 5 Years | 0 (0.0%) | 0 (0.0%) |
| 6 to 11 Years | 0 (0.0%) | 0 (0.0%) |
| 12 to 14 Years | 0 (0.0%) | 0 (0.0%) |
| 15 Years | 0 (0.0%) | 0 (0.0%) |
| 16 and 17 Years | 0 (0.0%) | 0 (0.0%) |
| 18 to 24 Years | 4 (20.0%) | 3 (9.1%) |
| 25 to 34 Years | 0 (0.0%) | 0 (0.0%) |
| 35 to 44 Years | 2 (5.7%) | 0 (0.0%) |
| 45 to 54 Years | 0 (0.0%) | 6 (8.1%) |
| 55 to 64 Years | 4 (3.8%) | 3 (3.9%) |
| 65 to 74 Years | 0 (0.0%) | 0 (0.0%) |
| 75 Years and over | 3 (10.3%) | 0 (0.0%) |
| Total | 17 (4.7%) | 12 (3.4%) |
Income Above Poverty by Sex and Age in Bay View
According to the poverty statistics in Bay View, males aged 6 to 11 years and females aged under 5 years are the age groups that are most secure financially, with 100.0% of males and 100.0% of females in these age groups living above the poverty line.
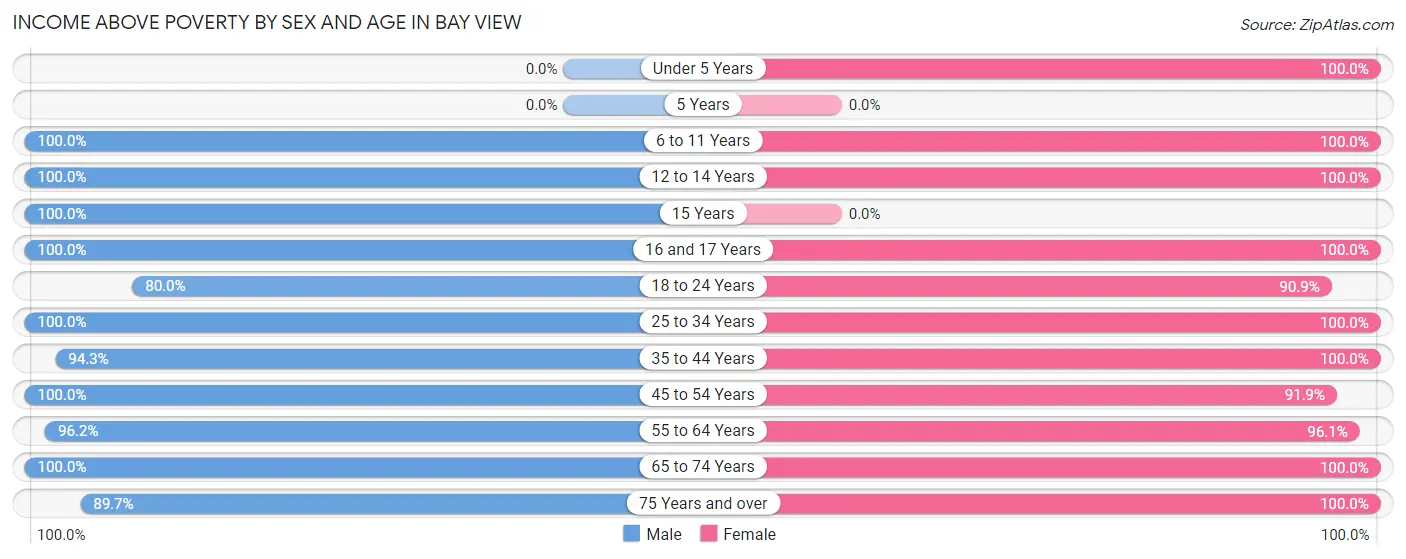
| Age Bracket | Male | Female |
| Under 5 Years | 0 (0.0%) | 7 (100.0%) |
| 5 Years | 0 (0.0%) | 0 (0.0%) |
| 6 to 11 Years | 9 (100.0%) | 7 (100.0%) |
| 12 to 14 Years | 3 (100.0%) | 10 (100.0%) |
| 15 Years | 6 (100.0%) | 0 (0.0%) |
| 16 and 17 Years | 9 (100.0%) | 9 (100.0%) |
| 18 to 24 Years | 16 (80.0%) | 30 (90.9%) |
| 25 to 34 Years | 65 (100.0%) | 15 (100.0%) |
| 35 to 44 Years | 33 (94.3%) | 16 (100.0%) |
| 45 to 54 Years | 30 (100.0%) | 68 (91.9%) |
| 55 to 64 Years | 101 (96.2%) | 74 (96.1%) |
| 65 to 74 Years | 46 (100.0%) | 60 (100.0%) |
| 75 Years and over | 26 (89.7%) | 41 (100.0%) |
| Total | 344 (95.3%) | 337 (96.6%) |
Income Below Poverty Among Married-Couple Families in Bay View
The poverty statistics for married-couple families in Bay View show that 0.6% or 1 of the total 167 families live below the poverty line. Families with no children have the highest poverty rate of 0.7%, comprising of 1 families. On the other hand, families with 1 or 2 children have the lowest poverty rate of 0.0%, which includes 0 families.
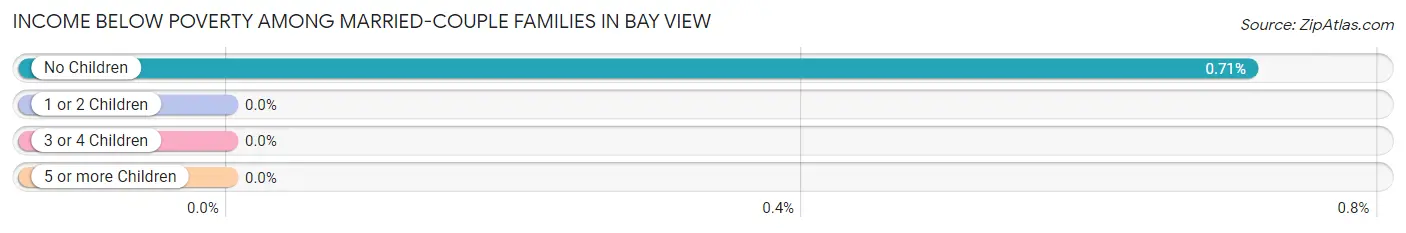
| Children | Above Poverty | Below Poverty |
| No Children | 140 (99.3%) | 1 (0.7%) |
| 1 or 2 Children | 23 (100.0%) | 0 (0.0%) |
| 3 or 4 Children | 3 (100.0%) | 0 (0.0%) |
| 5 or more Children | 0 (0.0%) | 0 (0.0%) |
| Total | 166 (99.4%) | 1 (0.6%) |
Income Below Poverty Among Single-Parent Households in Bay View
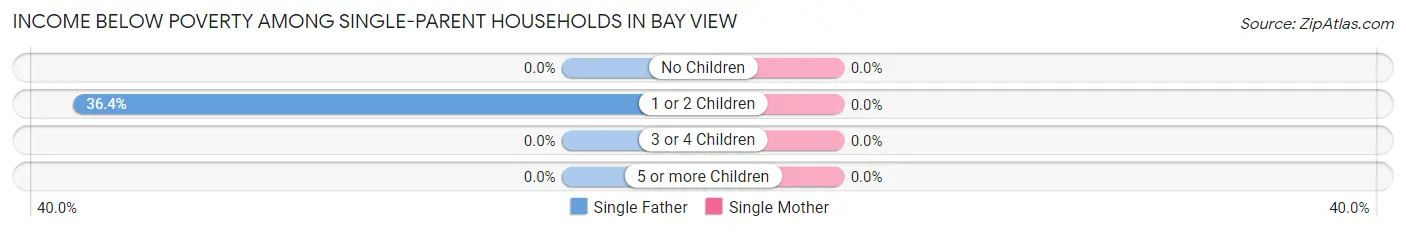
| Children | Single Father | Single Mother |
| No Children | 0 (0.0%) | 0 (0.0%) |
| 1 or 2 Children | 4 (36.4%) | 0 (0.0%) |
| 3 or 4 Children | 0 (0.0%) | 0 (0.0%) |
| 5 or more Children | 0 (0.0%) | 0 (0.0%) |
| Total | 4 (14.8%) | 0 (0.0%) |
Income Below Poverty Among Married-Couple vs Single-Parent Households in Bay View
The poverty data for Bay View shows that 1 of the married-couple family households (0.6%) and 4 of the single-parent households (7.1%) are living below the poverty level. Within the married-couple family households, those with no children have the highest poverty rate, with 1 households (0.7%) falling below the poverty line. Among the single-parent households, those with 1 or 2 children have the highest poverty rate, with 4 household (21.0%) living below poverty.
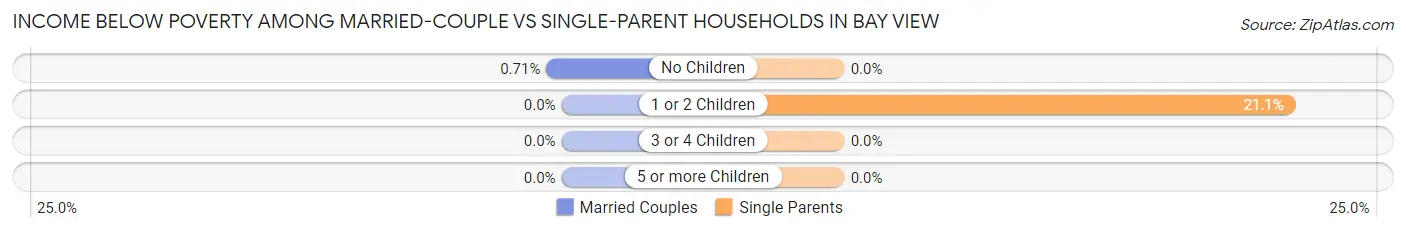
| Children | Married-Couple Families | Single-Parent Households |
| No Children | 1 (0.7%) | 0 (0.0%) |
| 1 or 2 Children | 0 (0.0%) | 4 (21.0%) |
| 3 or 4 Children | 0 (0.0%) | 0 (0.0%) |
| 5 or more Children | 0 (0.0%) | 0 (0.0%) |
| Total | 1 (0.6%) | 4 (7.1%) |
Employment Characteristics in Bay View
Employment by Class of Employer in Bay View
Among the 400 employed individuals in Bay View, private company employees (306 | 76.5%), not-for-profit organizations (31 | 7.7%), and local government employees (28 | 7.0%) make up the most common classes of employment.
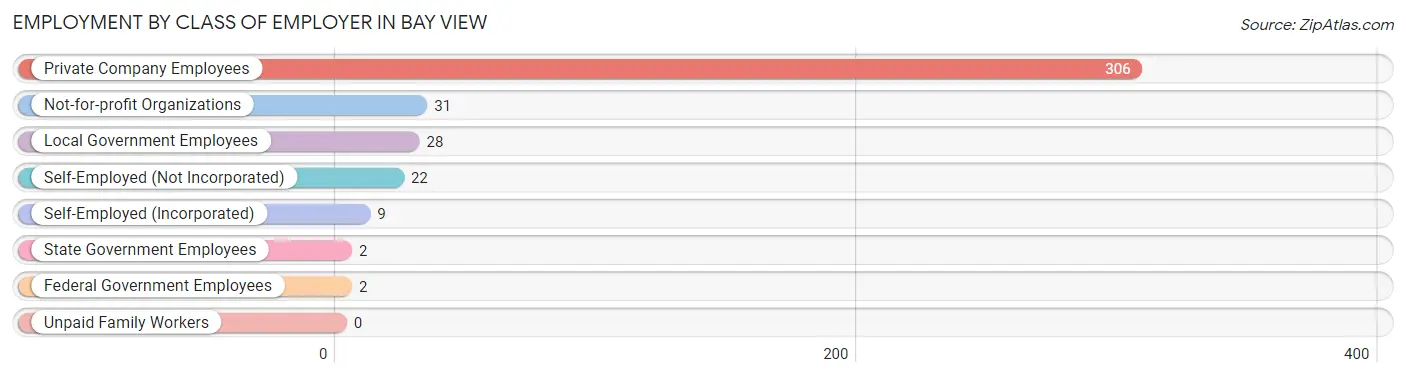
| Employer Class | # Employees | % Employees |
| Private Company Employees | 306 | 76.5% |
| Self-Employed (Incorporated) | 9 | 2.2% |
| Self-Employed (Not Incorporated) | 22 | 5.5% |
| Not-for-profit Organizations | 31 | 7.7% |
| Local Government Employees | 28 | 7.0% |
| State Government Employees | 2 | 0.5% |
| Federal Government Employees | 2 | 0.5% |
| Unpaid Family Workers | 0 | 0.0% |
| Total | 400 | 100.0% |
Employment Status by Age in Bay View
According to the labor force statistics for Bay View, out of the total population over 16 years of age (664), 65.7% or 436 individuals are in the labor force, with 6.2% or 27 of them unemployed. The age group with the highest labor force participation rate is 20 to 24 years, with 100.0% or 26 individuals in the labor force. Within the labor force, the 25 to 29 years age range has the highest percentage of unemployed individuals, with 34.1% or 14 of them being unemployed.
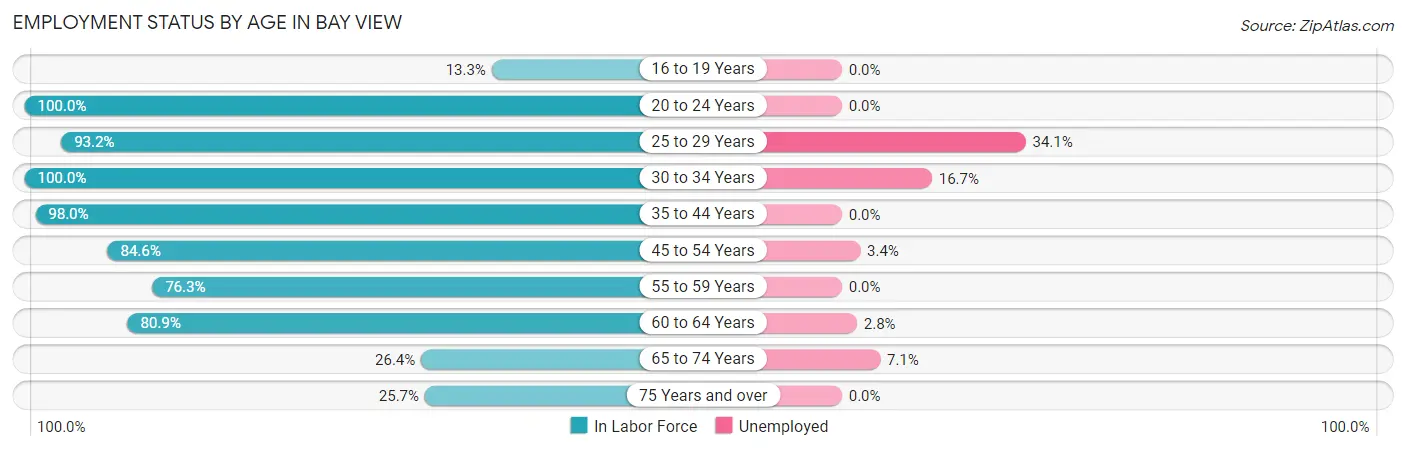
| Age Bracket | In Labor Force | Unemployed |
| 16 to 19 Years | 6 (13.3%) | 0 (0.0%) |
| 20 to 24 Years | 26 (100.0%) | 0 (0.0%) |
| 25 to 29 Years | 41 (93.2%) | 14 (34.1%) |
| 30 to 34 Years | 36 (100.0%) | 6 (16.7%) |
| 35 to 44 Years | 50 (98.0%) | 0 (0.0%) |
| 45 to 54 Years | 88 (84.6%) | 3 (3.4%) |
| 55 to 59 Years | 71 (76.3%) | 0 (0.0%) |
| 60 to 64 Years | 72 (80.9%) | 2 (2.8%) |
| 65 to 74 Years | 28 (26.4%) | 2 (7.1%) |
| 75 Years and over | 18 (25.7%) | 0 (0.0%) |
| Total | 436 (65.7%) | 27 (6.2%) |
Employment Status by Educational Attainment in Bay View
According to labor force statistics for Bay View, 85.9% of individuals (358) out of the total population between 25 and 64 years of age (417) are in the labor force, with 7.0% or 25 of them being unemployed. The group with the highest labor force participation rate are those with the educational attainment of less than high school, with 95.5% or 21 individuals in the labor force. Within the labor force, individuals with high school diploma education have the highest percentage of unemployment, with 15.0% or 22 of them being unemployed.
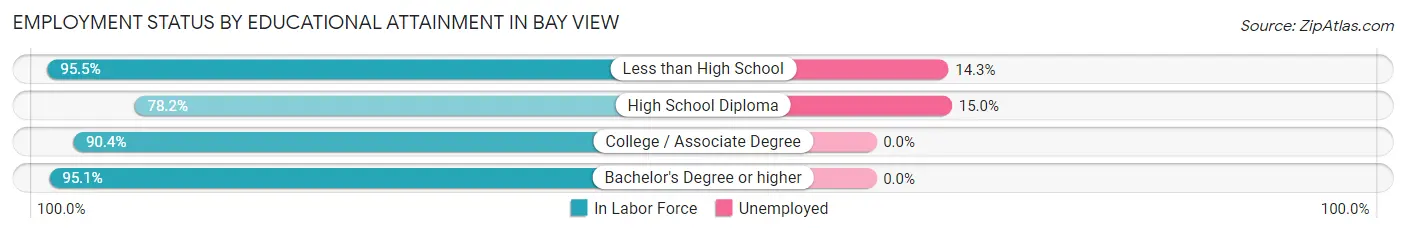
| Educational Attainment | In Labor Force | Unemployed |
| Less than High School | 21 (95.5%) | 3 (14.3%) |
| High School Diploma | 147 (78.2%) | 28 (15.0%) |
| College / Associate Degree | 132 (90.4%) | 0 (0.0%) |
| Bachelor's Degree or higher | 58 (95.1%) | 0 (0.0%) |
| Total | 358 (85.9%) | 29 (7.0%) |
Employment Occupations by Sex in Bay View
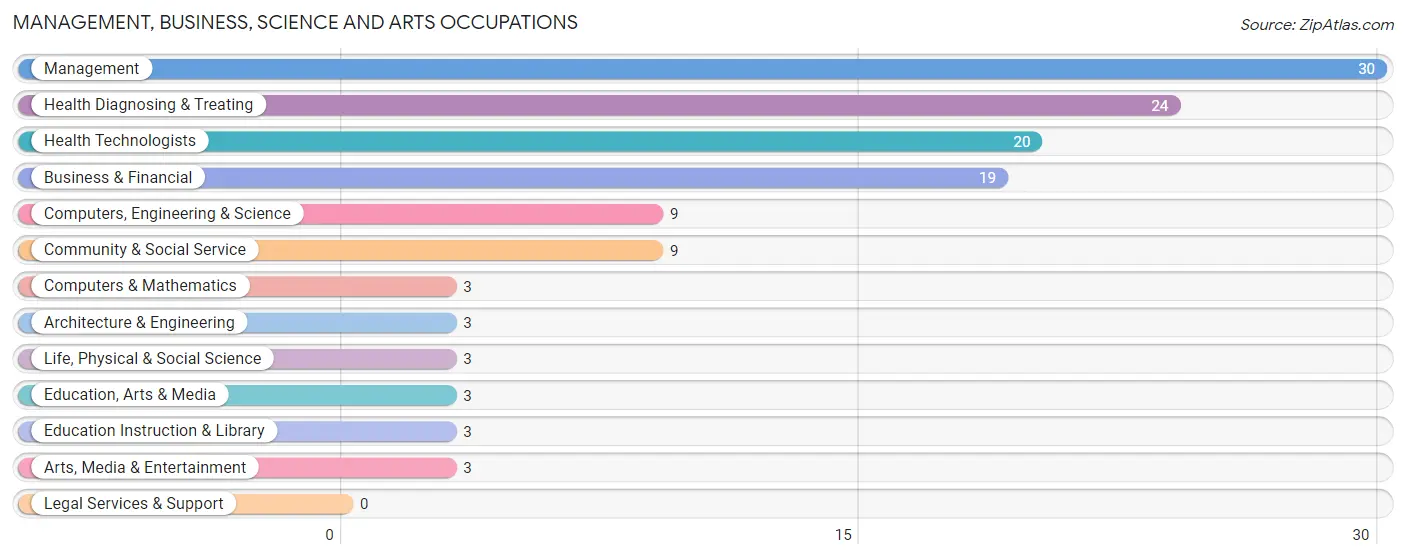
Management, Business, Science and Arts Occupations
The most common Management, Business, Science and Arts occupations in Bay View are Management (30 | 7.3%), Health Diagnosing & Treating (24 | 5.9%), Health Technologists (20 | 4.9%), Business & Financial (19 | 4.6%), and Computers, Engineering & Science (9 | 2.2%).
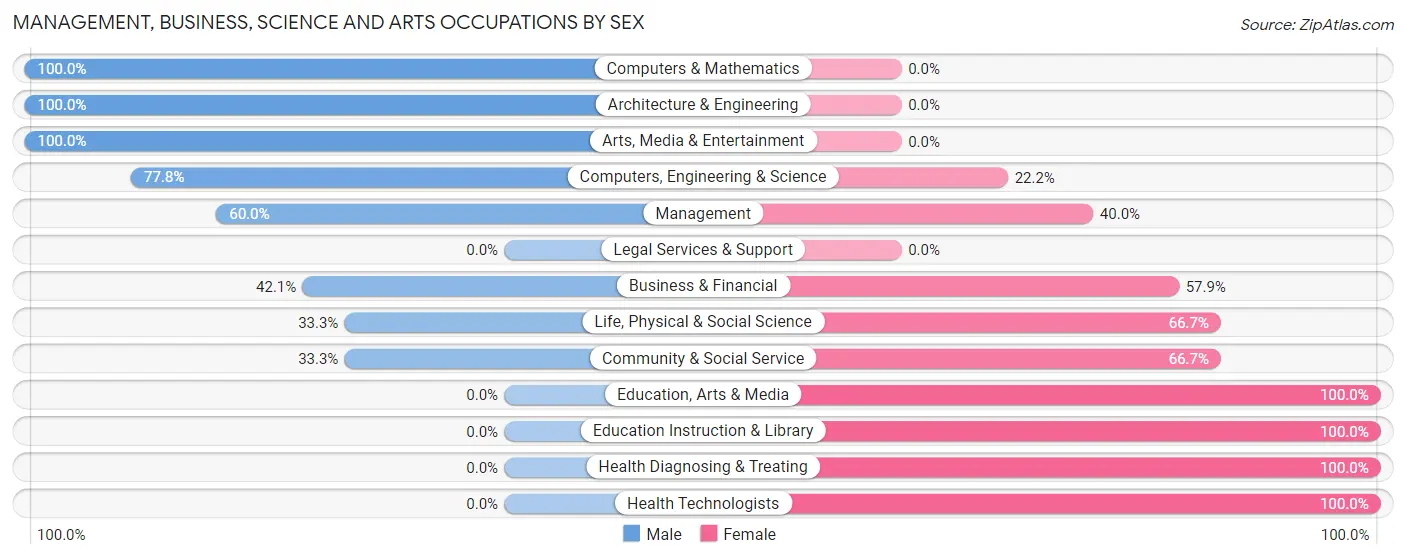
Management, Business, Science and Arts Occupations by Sex
Within the Management, Business, Science and Arts occupations in Bay View, the most male-oriented occupations are Computers & Mathematics (100.0%), Architecture & Engineering (100.0%), and Arts, Media & Entertainment (100.0%), while the most female-oriented occupations are Education, Arts & Media (100.0%), Education Instruction & Library (100.0%), and Health Diagnosing & Treating (100.0%).
| Occupation | Male | Female |
| Management | 18 (60.0%) | 12 (40.0%) |
| Business & Financial | 8 (42.1%) | 11 (57.9%) |
| Computers, Engineering & Science | 7 (77.8%) | 2 (22.2%) |
| Computers & Mathematics | 3 (100.0%) | 0 (0.0%) |
| Architecture & Engineering | 3 (100.0%) | 0 (0.0%) |
| Life, Physical & Social Science | 1 (33.3%) | 2 (66.7%) |
| Community & Social Service | 3 (33.3%) | 6 (66.7%) |
| Education, Arts & Media | 0 (0.0%) | 3 (100.0%) |
| Legal Services & Support | 0 (0.0%) | 0 (0.0%) |
| Education Instruction & Library | 0 (0.0%) | 3 (100.0%) |
| Arts, Media & Entertainment | 3 (100.0%) | 0 (0.0%) |
| Health Diagnosing & Treating | 0 (0.0%) | 24 (100.0%) |
| Health Technologists | 0 (0.0%) | 20 (100.0%) |
| Total (Category) | 36 (39.6%) | 55 (60.4%) |
| Total (Overall) | 240 (58.7%) | 169 (41.3%) |
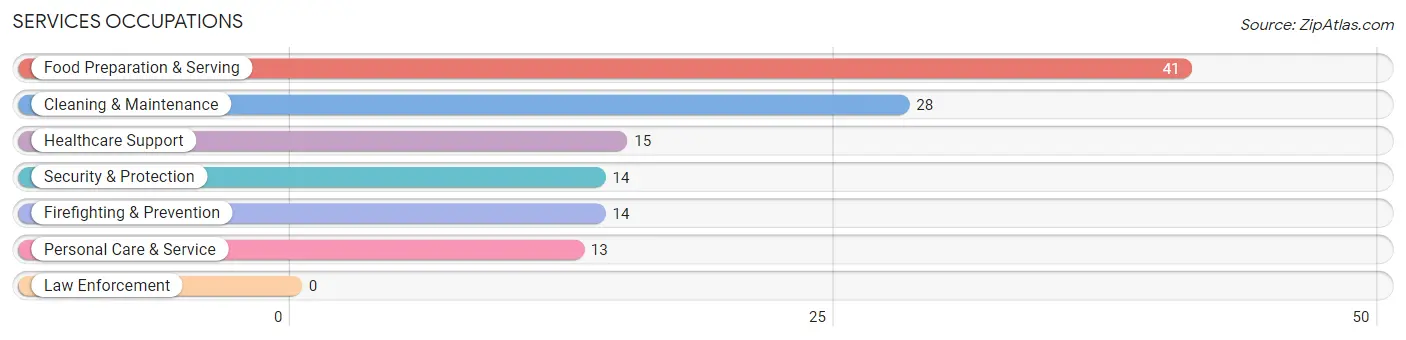
Services Occupations
The most common Services occupations in Bay View are Food Preparation & Serving (41 | 10.0%), Cleaning & Maintenance (28 | 6.9%), Healthcare Support (15 | 3.7%), Security & Protection (14 | 3.4%), and Firefighting & Prevention (14 | 3.4%).
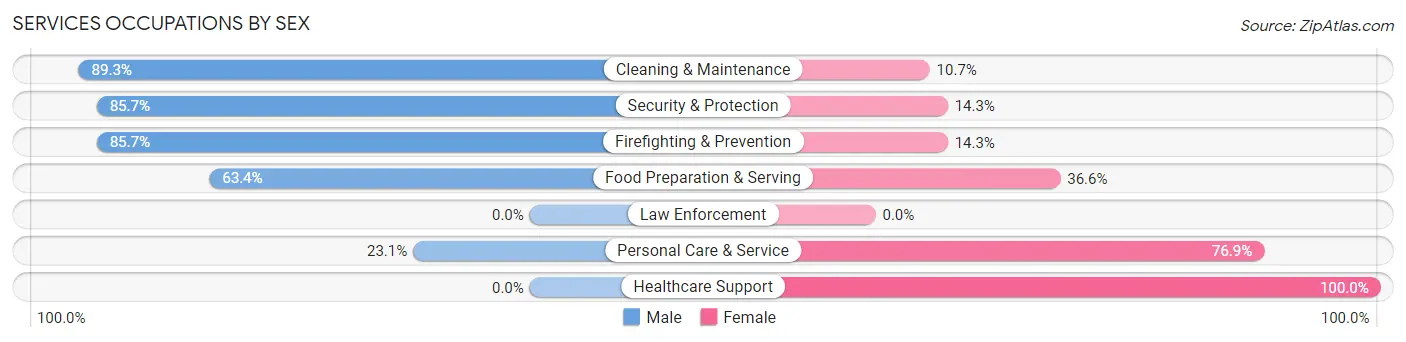
Services Occupations by Sex
Within the Services occupations in Bay View, the most male-oriented occupations are Cleaning & Maintenance (89.3%), Security & Protection (85.7%), and Firefighting & Prevention (85.7%), while the most female-oriented occupations are Healthcare Support (100.0%), Personal Care & Service (76.9%), and Food Preparation & Serving (36.6%).
| Occupation | Male | Female |
| Healthcare Support | 0 (0.0%) | 15 (100.0%) |
| Security & Protection | 12 (85.7%) | 2 (14.3%) |
| Firefighting & Prevention | 12 (85.7%) | 2 (14.3%) |
| Law Enforcement | 0 (0.0%) | 0 (0.0%) |
| Food Preparation & Serving | 26 (63.4%) | 15 (36.6%) |
| Cleaning & Maintenance | 25 (89.3%) | 3 (10.7%) |
| Personal Care & Service | 3 (23.1%) | 10 (76.9%) |
| Total (Category) | 66 (59.5%) | 45 (40.5%) |
| Total (Overall) | 240 (58.7%) | 169 (41.3%) |
Sales and Office Occupations
The most common Sales and Office occupations in Bay View are Sales & Related (44 | 10.8%), and Office & Administration (37 | 9.0%).

Sales and Office Occupations by Sex
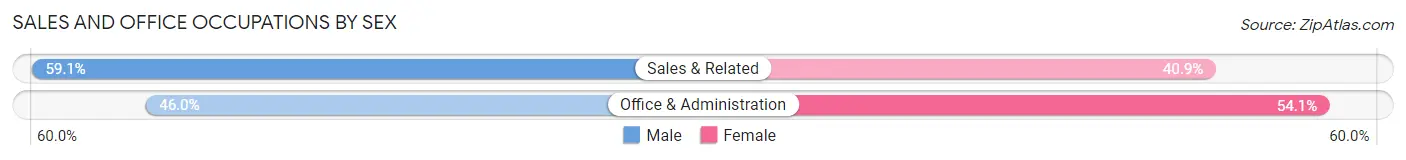
| Occupation | Male | Female |
| Sales & Related | 26 (59.1%) | 18 (40.9%) |
| Office & Administration | 17 (46.0%) | 20 (54.0%) |
| Total (Category) | 43 (53.1%) | 38 (46.9%) |
| Total (Overall) | 240 (58.7%) | 169 (41.3%) |
Natural Resources, Construction and Maintenance Occupations
The most common Natural Resources, Construction and Maintenance occupations in Bay View are Installation, Maintenance & Repair (14 | 3.4%), and Construction & Extraction (12 | 2.9%).
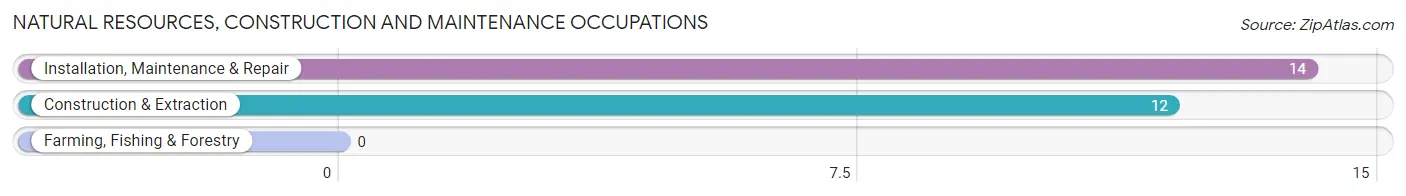
Natural Resources, Construction and Maintenance Occupations by Sex
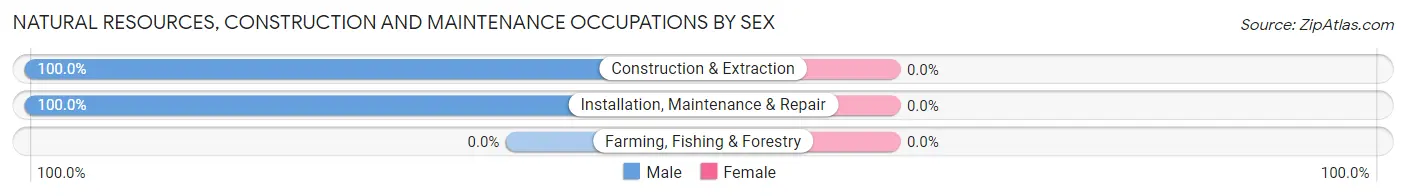
| Occupation | Male | Female |
| Farming, Fishing & Forestry | 0 (0.0%) | 0 (0.0%) |
| Construction & Extraction | 12 (100.0%) | 0 (0.0%) |
| Installation, Maintenance & Repair | 14 (100.0%) | 0 (0.0%) |
| Total (Category) | 26 (100.0%) | 0 (0.0%) |
| Total (Overall) | 240 (58.7%) | 169 (41.3%) |
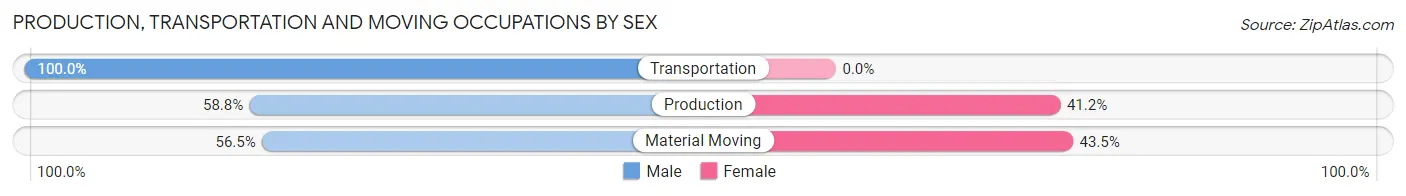
Production, Transportation and Moving Occupations
The most common Production, Transportation and Moving occupations in Bay View are Production (51 | 12.5%), Transportation (26 | 6.4%), and Material Moving (23 | 5.6%).
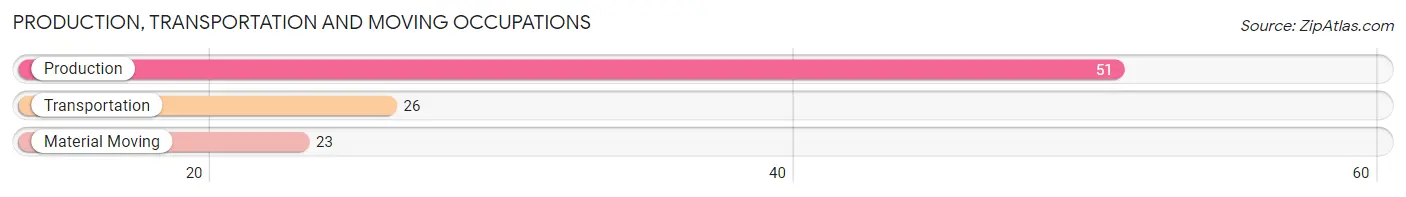
Production, Transportation and Moving Occupations by Sex
| Occupation | Male | Female |
| Production | 30 (58.8%) | 21 (41.2%) |
| Transportation | 26 (100.0%) | 0 (0.0%) |
| Material Moving | 13 (56.5%) | 10 (43.5%) |
| Total (Category) | 69 (69.0%) | 31 (31.0%) |
| Total (Overall) | 240 (58.7%) | 169 (41.3%) |
Employment Industries by Sex in Bay View
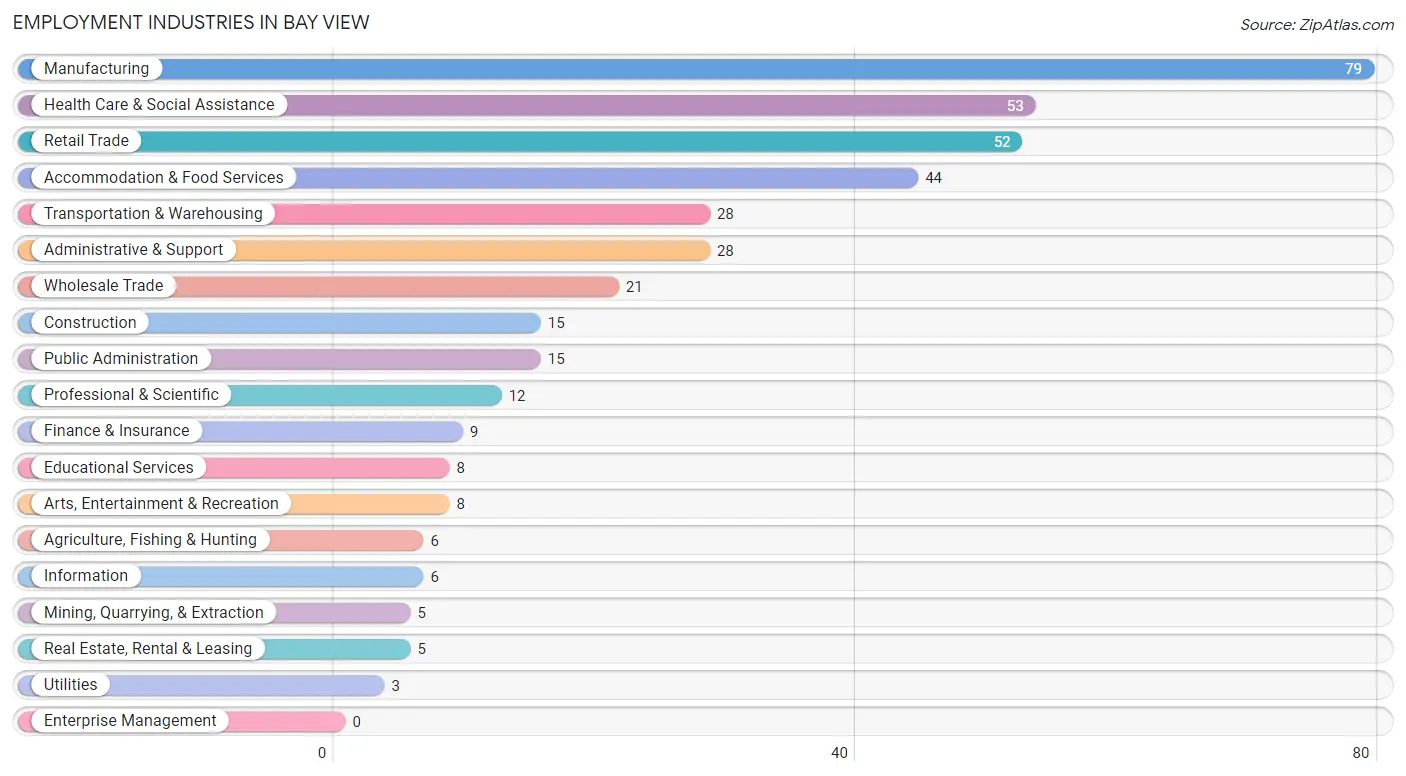
Employment Industries in Bay View
The major employment industries in Bay View include Manufacturing (79 | 19.3%), Health Care & Social Assistance (53 | 13.0%), Retail Trade (52 | 12.7%), Accommodation & Food Services (44 | 10.8%), and Transportation & Warehousing (28 | 6.9%).
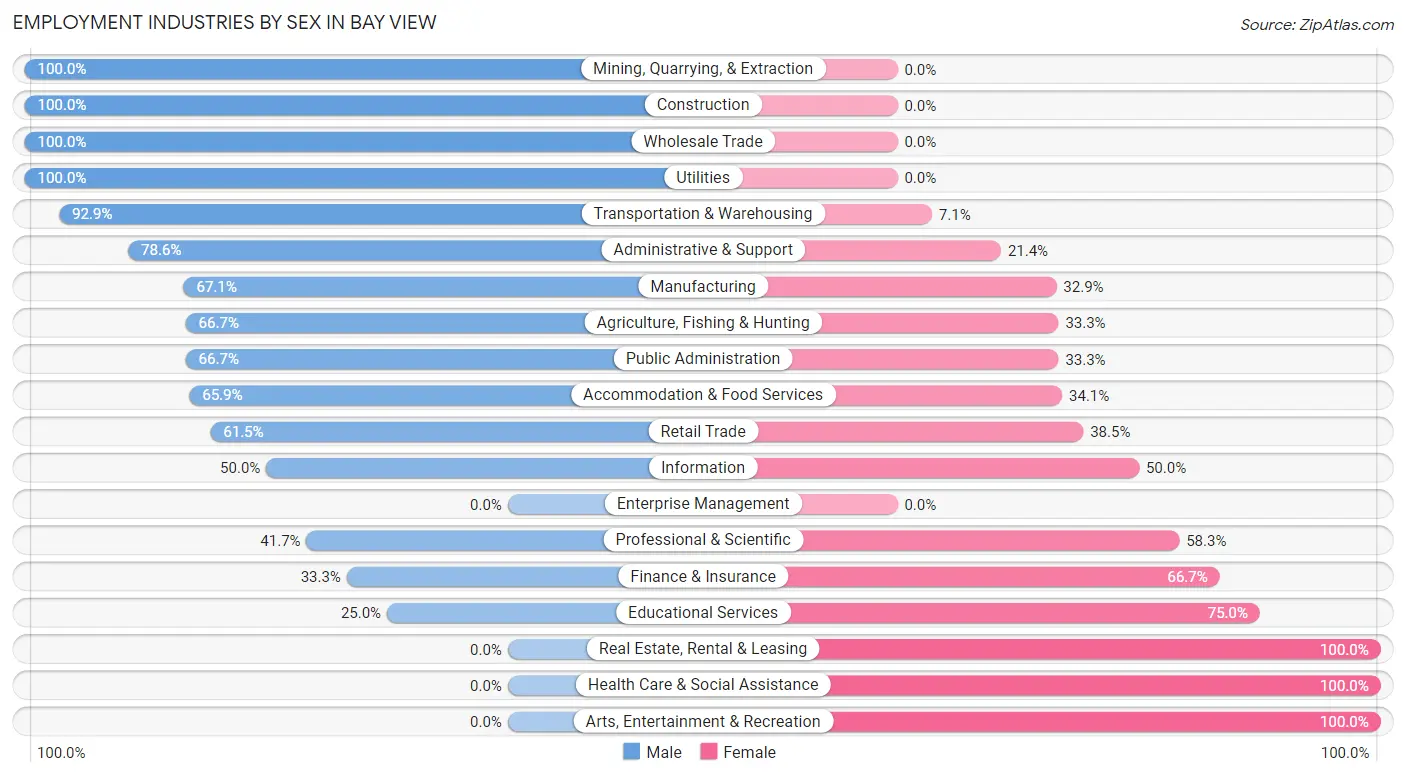
Employment Industries by Sex in Bay View
The Bay View industries that see more men than women are Mining, Quarrying, & Extraction (100.0%), Construction (100.0%), and Wholesale Trade (100.0%), whereas the industries that tend to have a higher number of women are Real Estate, Rental & Leasing (100.0%), Health Care & Social Assistance (100.0%), and Arts, Entertainment & Recreation (100.0%).
| Industry | Male | Female |
| Agriculture, Fishing & Hunting | 4 (66.7%) | 2 (33.3%) |
| Mining, Quarrying, & Extraction | 5 (100.0%) | 0 (0.0%) |
| Construction | 15 (100.0%) | 0 (0.0%) |
| Manufacturing | 53 (67.1%) | 26 (32.9%) |
| Wholesale Trade | 21 (100.0%) | 0 (0.0%) |
| Retail Trade | 32 (61.5%) | 20 (38.5%) |
| Transportation & Warehousing | 26 (92.9%) | 2 (7.1%) |
| Utilities | 3 (100.0%) | 0 (0.0%) |
| Information | 3 (50.0%) | 3 (50.0%) |
| Finance & Insurance | 3 (33.3%) | 6 (66.7%) |
| Real Estate, Rental & Leasing | 0 (0.0%) | 5 (100.0%) |
| Professional & Scientific | 5 (41.7%) | 7 (58.3%) |
| Enterprise Management | 0 (0.0%) | 0 (0.0%) |
| Administrative & Support | 22 (78.6%) | 6 (21.4%) |
| Educational Services | 2 (25.0%) | 6 (75.0%) |
| Health Care & Social Assistance | 0 (0.0%) | 53 (100.0%) |
| Arts, Entertainment & Recreation | 0 (0.0%) | 8 (100.0%) |
| Accommodation & Food Services | 29 (65.9%) | 15 (34.1%) |
| Public Administration | 10 (66.7%) | 5 (33.3%) |
| Total | 240 (58.7%) | 169 (41.3%) |
Education in Bay View
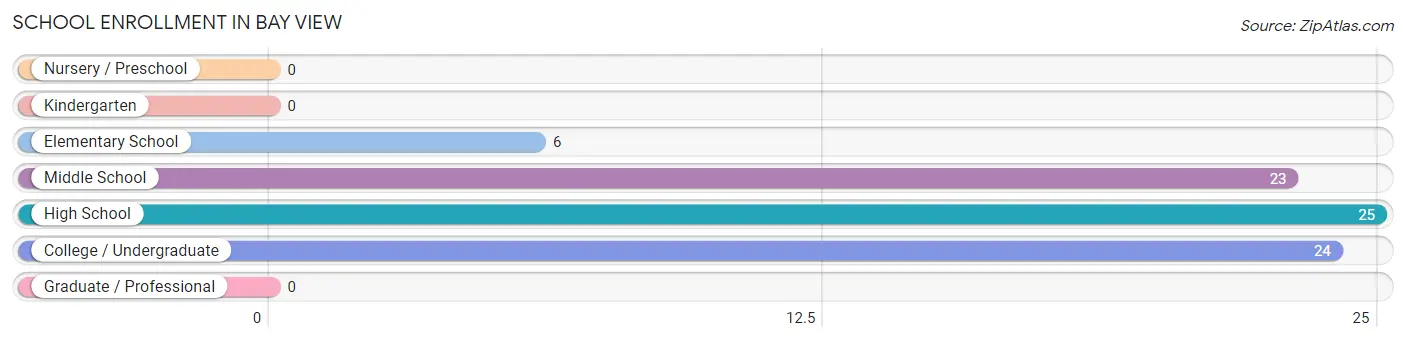
School Enrollment in Bay View
The most common levels of schooling among the 78 students in Bay View are high school (25 | 32.1%), college / undergraduate (24 | 30.8%), and middle school (23 | 29.5%).
| School Level | # Students | % Students |
| Nursery / Preschool | 0 | 0.0% |
| Kindergarten | 0 | 0.0% |
| Elementary School | 6 | 7.7% |
| Middle School | 23 | 29.5% |
| High School | 25 | 32.1% |
| College / Undergraduate | 24 | 30.8% |
| Graduate / Professional | 0 | 0.0% |
| Total | 78 | 100.0% |
School Enrollment by Age by Funding Source in Bay View
Out of a total of 78 students who are enrolled in schools in Bay View, 11 (14.1%) attend a private institution, while the remaining 67 (85.9%) are enrolled in public schools. The age group of 20 to 24 year olds has the highest likelihood of being enrolled in private schools, with 5 (100.0% in the age bracket) enrolled. Conversely, the age group of 5 to 9 year old has the lowest likelihood of being enrolled in a private school, with 2 (100.0% in the age bracket) attending a public institution.
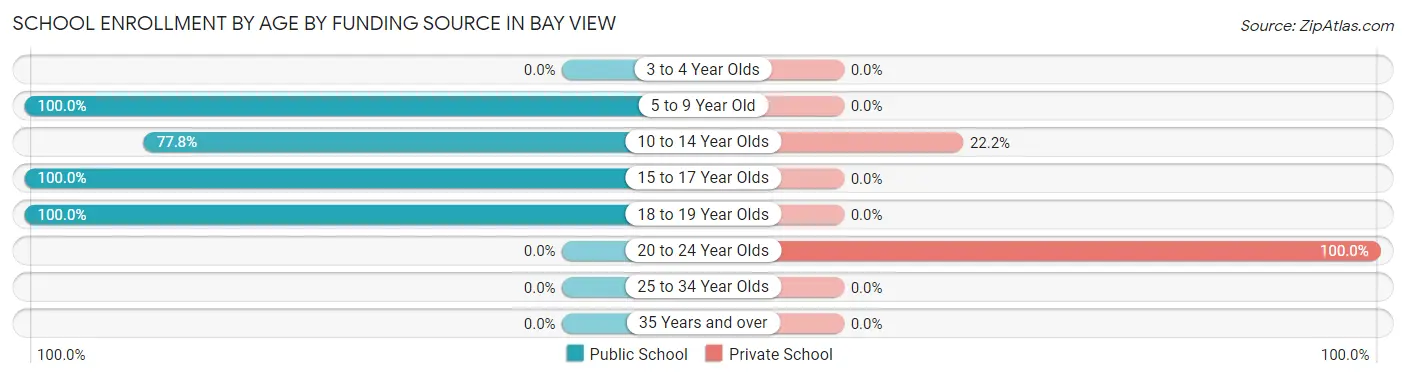
| Age Bracket | Public School | Private School |
| 3 to 4 Year Olds | 0 (0.0%) | 0 (0.0%) |
| 5 to 9 Year Old | 2 (100.0%) | 0 (0.0%) |
| 10 to 14 Year Olds | 21 (77.8%) | 6 (22.2%) |
| 15 to 17 Year Olds | 24 (100.0%) | 0 (0.0%) |
| 18 to 19 Year Olds | 20 (100.0%) | 0 (0.0%) |
| 20 to 24 Year Olds | 0 (0.0%) | 5 (100.0%) |
| 25 to 34 Year Olds | 0 (0.0%) | 0 (0.0%) |
| 35 Years and over | 0 (0.0%) | 0 (0.0%) |
| Total | 67 (85.9%) | 11 (14.1%) |
Educational Attainment by Field of Study in Bay View
Business (61 | 48.4%), literature & languages (26 | 20.6%), psychology (9 | 7.1%), physical & health sciences (7 | 5.6%), and bio, nature & agricultural (4 | 3.2%) are the most common fields of study among 126 individuals in Bay View who have obtained a bachelor's degree or higher.
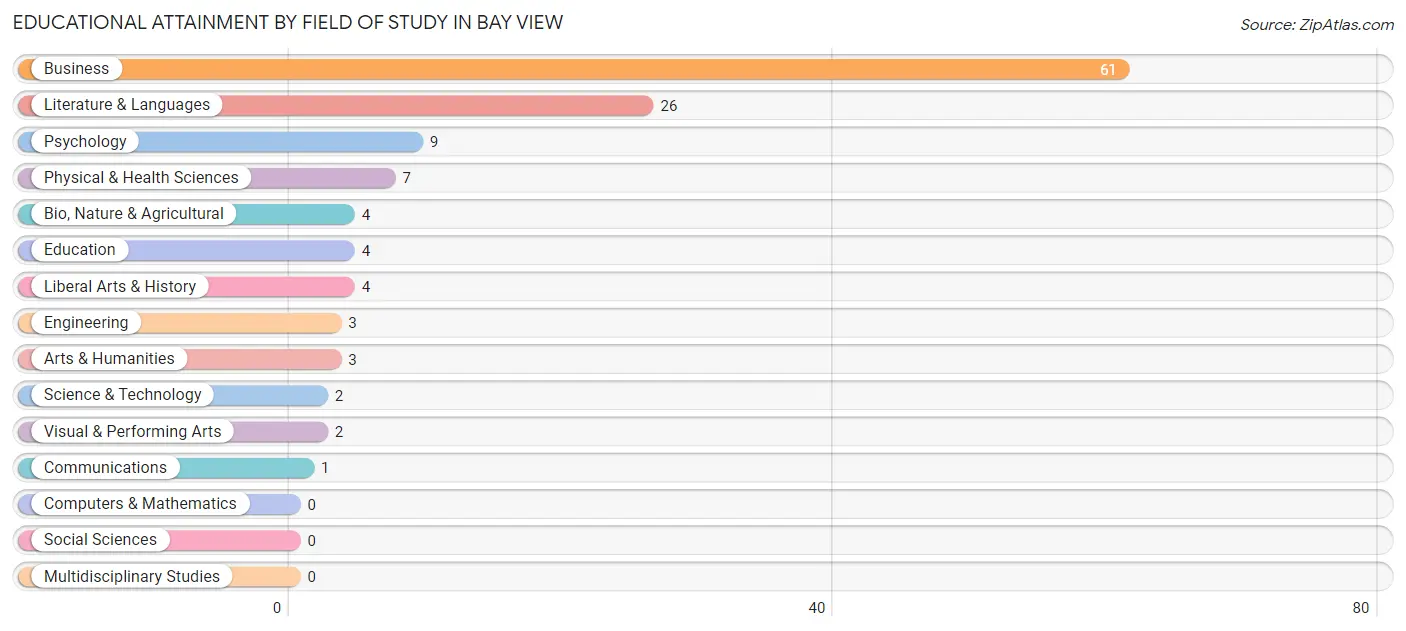
| Field of Study | # Graduates | % Graduates |
| Computers & Mathematics | 0 | 0.0% |
| Bio, Nature & Agricultural | 4 | 3.2% |
| Physical & Health Sciences | 7 | 5.6% |
| Psychology | 9 | 7.1% |
| Social Sciences | 0 | 0.0% |
| Engineering | 3 | 2.4% |
| Multidisciplinary Studies | 0 | 0.0% |
| Science & Technology | 2 | 1.6% |
| Business | 61 | 48.4% |
| Education | 4 | 3.2% |
| Literature & Languages | 26 | 20.6% |
| Liberal Arts & History | 4 | 3.2% |
| Visual & Performing Arts | 2 | 1.6% |
| Communications | 1 | 0.8% |
| Arts & Humanities | 3 | 2.4% |
| Total | 126 | 100.0% |
Transportation & Commute in Bay View
Vehicle Availability by Sex in Bay View
The most prevalent vehicle ownership categories in Bay View are males with 2 vehicles (78, accounting for 32.5%) and females with 2 vehicles (58, making up 48.7%).
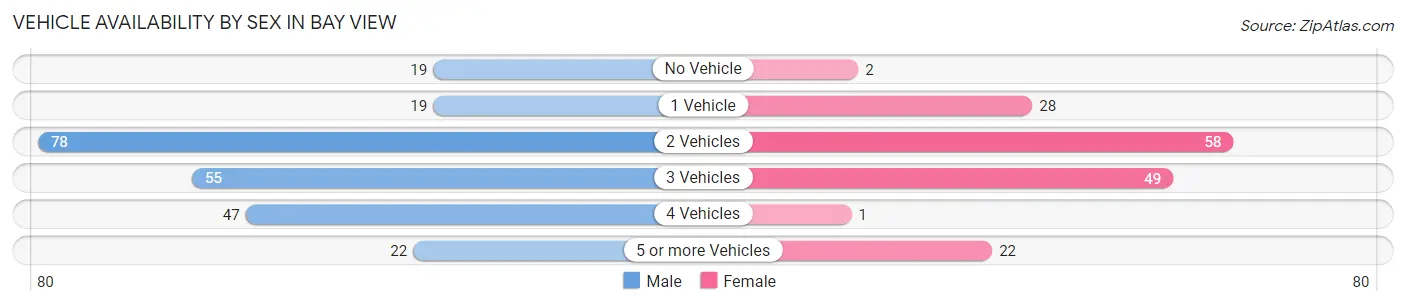
| Vehicles Available | Male | Female |
| No Vehicle | 19 (7.9%) | 2 (1.3%) |
| 1 Vehicle | 19 (7.9%) | 28 (17.5%) |
| 2 Vehicles | 78 (32.5%) | 58 (36.2%) |
| 3 Vehicles | 55 (22.9%) | 49 (30.6%) |
| 4 Vehicles | 47 (19.6%) | 1 (0.6%) |
| 5 or more Vehicles | 22 (9.2%) | 22 (13.8%) |
| Total | 240 (100.0%) | 160 (100.0%) |
Commute Time in Bay View
The most frequently occuring commute durations in Bay View are 15 to 19 minutes (75 commuters, 19.5%), 10 to 14 minutes (66 commuters, 17.1%), and 20 to 24 minutes (65 commuters, 16.9%).
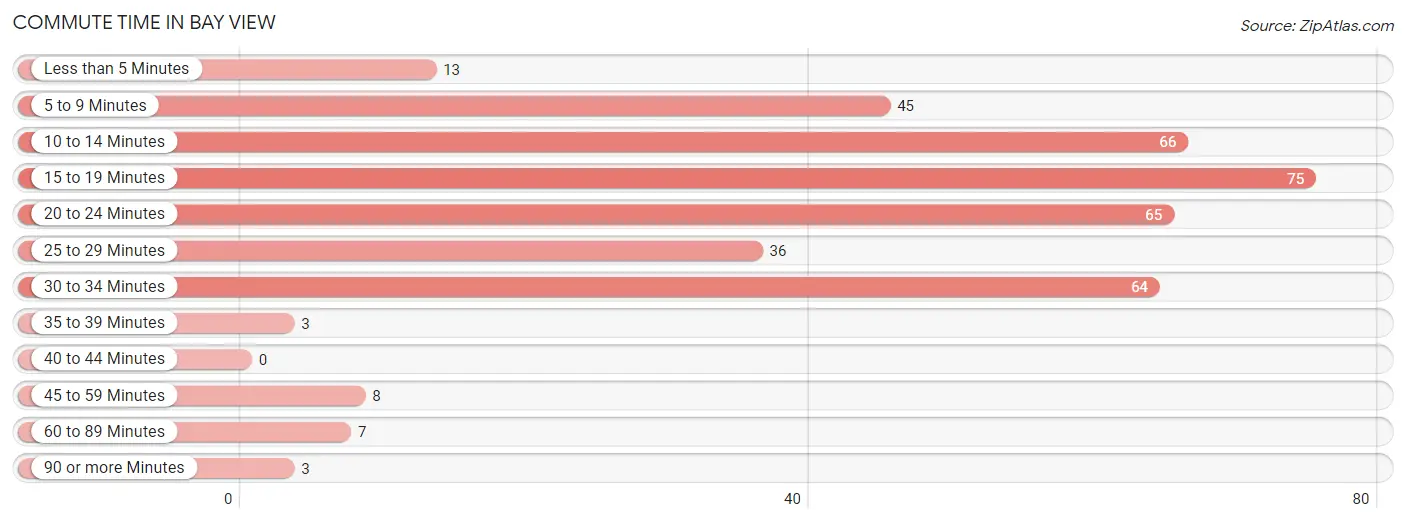
| Commute Time | # Commuters | % Commuters |
| Less than 5 Minutes | 13 | 3.4% |
| 5 to 9 Minutes | 45 | 11.7% |
| 10 to 14 Minutes | 66 | 17.1% |
| 15 to 19 Minutes | 75 | 19.5% |
| 20 to 24 Minutes | 65 | 16.9% |
| 25 to 29 Minutes | 36 | 9.3% |
| 30 to 34 Minutes | 64 | 16.6% |
| 35 to 39 Minutes | 3 | 0.8% |
| 40 to 44 Minutes | 0 | 0.0% |
| 45 to 59 Minutes | 8 | 2.1% |
| 60 to 89 Minutes | 7 | 1.8% |
| 90 or more Minutes | 3 | 0.8% |
Commute Time by Sex in Bay View
The most common commute times in Bay View are 15 to 19 minutes (47 commuters, 20.5%) for males and 15 to 19 minutes (28 commuters, 17.9%) for females.
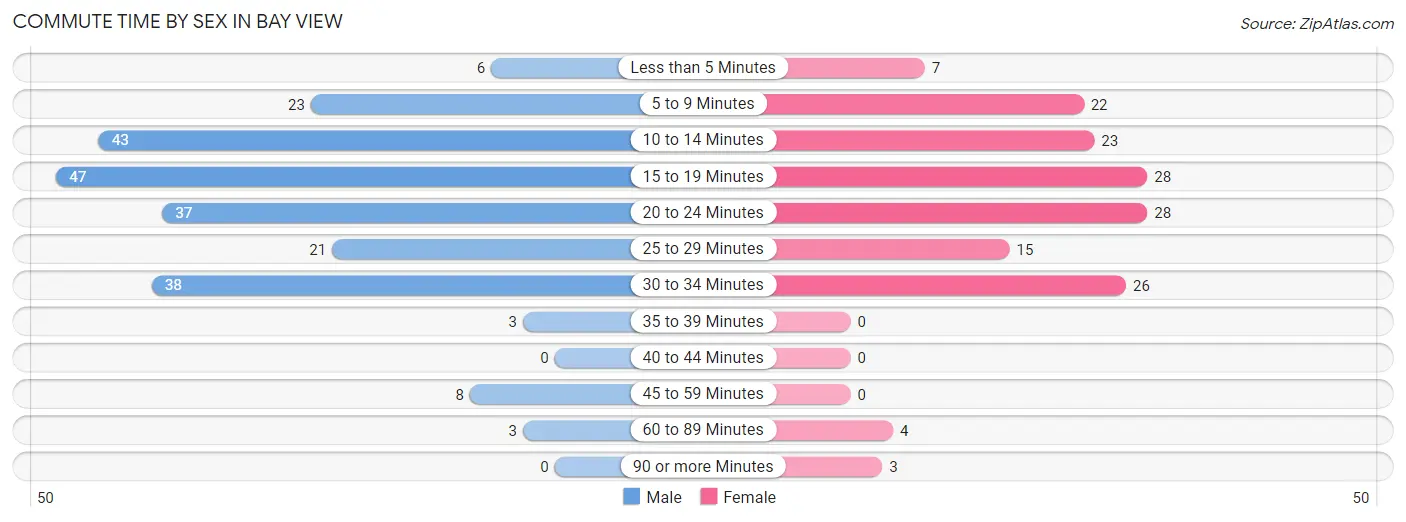
| Commute Time | Male | Female |
| Less than 5 Minutes | 6 (2.6%) | 7 (4.5%) |
| 5 to 9 Minutes | 23 (10.0%) | 22 (14.1%) |
| 10 to 14 Minutes | 43 (18.8%) | 23 (14.7%) |
| 15 to 19 Minutes | 47 (20.5%) | 28 (17.9%) |
| 20 to 24 Minutes | 37 (16.2%) | 28 (17.9%) |
| 25 to 29 Minutes | 21 (9.2%) | 15 (9.6%) |
| 30 to 34 Minutes | 38 (16.6%) | 26 (16.7%) |
| 35 to 39 Minutes | 3 (1.3%) | 0 (0.0%) |
| 40 to 44 Minutes | 0 (0.0%) | 0 (0.0%) |
| 45 to 59 Minutes | 8 (3.5%) | 0 (0.0%) |
| 60 to 89 Minutes | 3 (1.3%) | 4 (2.6%) |
| 90 or more Minutes | 0 (0.0%) | 3 (1.9%) |
Time of Departure to Work by Sex in Bay View
The most frequent times of departure to work in Bay View are 4:00 PM to 11:59 PM (42, 18.3%) for males and 5:30 AM to 5:59 AM (21, 13.5%) for females.
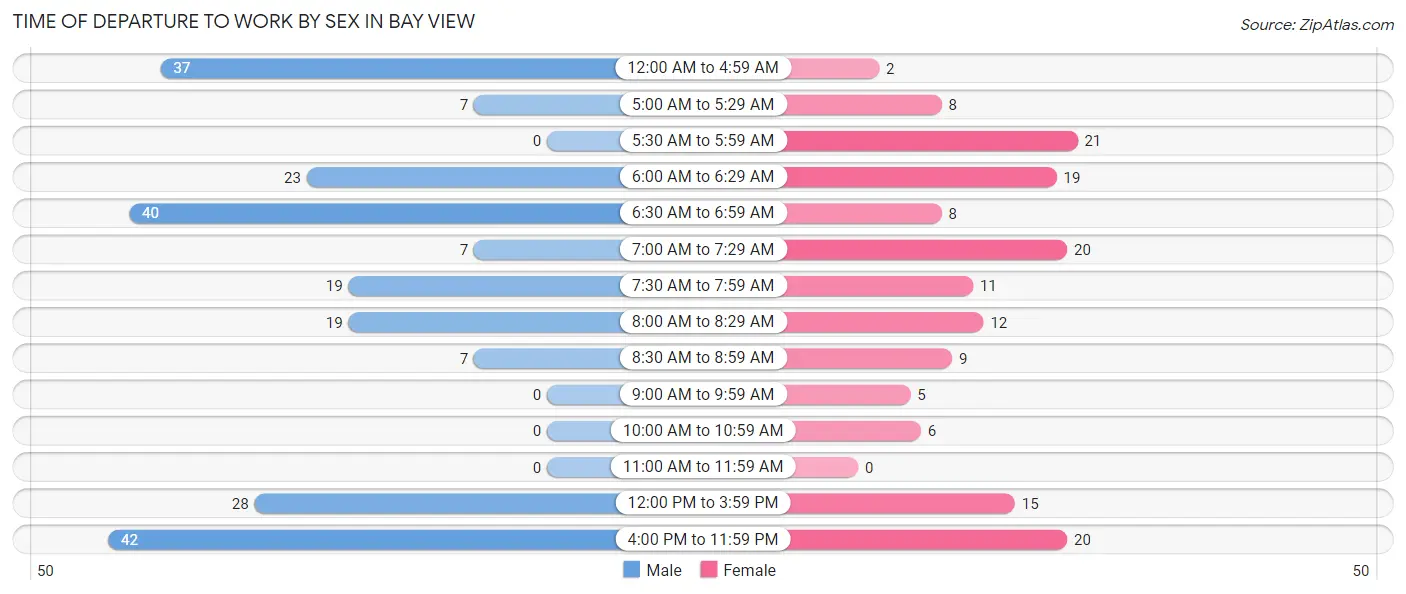
| Time of Departure | Male | Female |
| 12:00 AM to 4:59 AM | 37 (16.2%) | 2 (1.3%) |
| 5:00 AM to 5:29 AM | 7 (3.1%) | 8 (5.1%) |
| 5:30 AM to 5:59 AM | 0 (0.0%) | 21 (13.5%) |
| 6:00 AM to 6:29 AM | 23 (10.0%) | 19 (12.2%) |
| 6:30 AM to 6:59 AM | 40 (17.5%) | 8 (5.1%) |
| 7:00 AM to 7:29 AM | 7 (3.1%) | 20 (12.8%) |
| 7:30 AM to 7:59 AM | 19 (8.3%) | 11 (7.0%) |
| 8:00 AM to 8:29 AM | 19 (8.3%) | 12 (7.7%) |
| 8:30 AM to 8:59 AM | 7 (3.1%) | 9 (5.8%) |
| 9:00 AM to 9:59 AM | 0 (0.0%) | 5 (3.2%) |
| 10:00 AM to 10:59 AM | 0 (0.0%) | 6 (3.8%) |
| 11:00 AM to 11:59 AM | 0 (0.0%) | 0 (0.0%) |
| 12:00 PM to 3:59 PM | 28 (12.2%) | 15 (9.6%) |
| 4:00 PM to 11:59 PM | 42 (18.3%) | 20 (12.8%) |
| Total | 229 (100.0%) | 156 (100.0%) |
Housing Occupancy in Bay View
Occupancy by Ownership in Bay View
Of the total 299 dwellings in Bay View, owner-occupied units account for 269 (90.0%), while renter-occupied units make up 30 (10.0%).
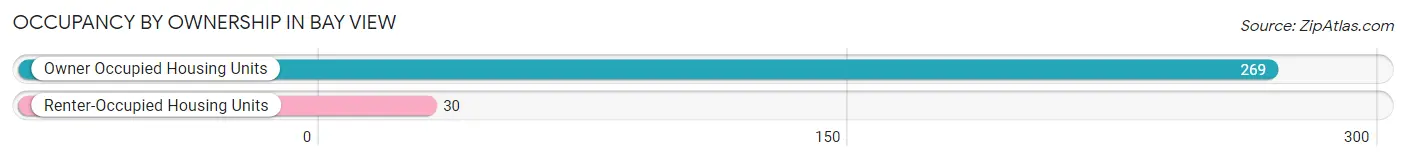
| Occupancy | # Housing Units | % Housing Units |
| Owner Occupied Housing Units | 269 | 90.0% |
| Renter-Occupied Housing Units | 30 | 10.0% |
| Total Occupied Housing Units | 299 | 100.0% |
Occupancy by Household Size in Bay View
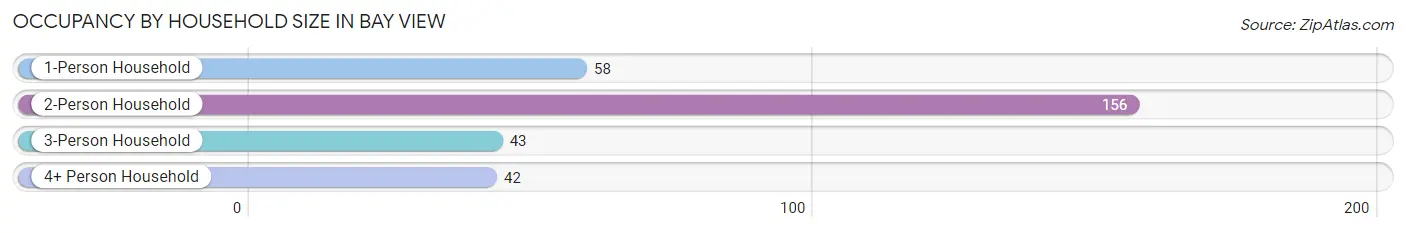
| Household Size | # Housing Units | % Housing Units |
| 1-Person Household | 58 | 19.4% |
| 2-Person Household | 156 | 52.2% |
| 3-Person Household | 43 | 14.4% |
| 4+ Person Household | 42 | 14.1% |
| Total Housing Units | 299 | 100.0% |
Occupancy by Ownership by Household Size in Bay View
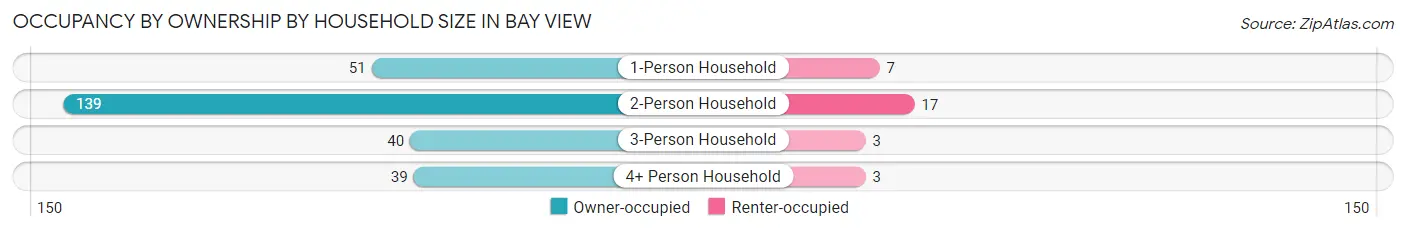
| Household Size | Owner-occupied | Renter-occupied |
| 1-Person Household | 51 (87.9%) | 7 (12.1%) |
| 2-Person Household | 139 (89.1%) | 17 (10.9%) |
| 3-Person Household | 40 (93.0%) | 3 (7.0%) |
| 4+ Person Household | 39 (92.9%) | 3 (7.1%) |
| Total Housing Units | 269 (90.0%) | 30 (10.0%) |
Occupancy by Educational Attainment in Bay View
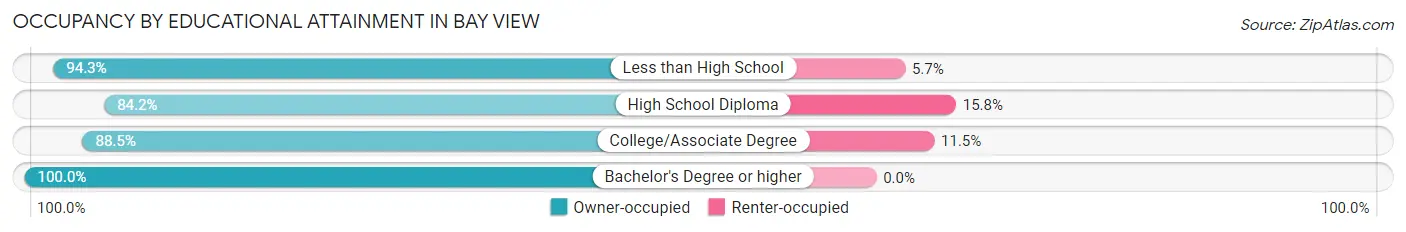
| Household Size | Owner-occupied | Renter-occupied |
| Less than High School | 33 (94.3%) | 2 (5.7%) |
| High School Diploma | 96 (84.2%) | 18 (15.8%) |
| College/Associate Degree | 77 (88.5%) | 10 (11.5%) |
| Bachelor's Degree or higher | 63 (100.0%) | 0 (0.0%) |
Occupancy by Age of Householder in Bay View
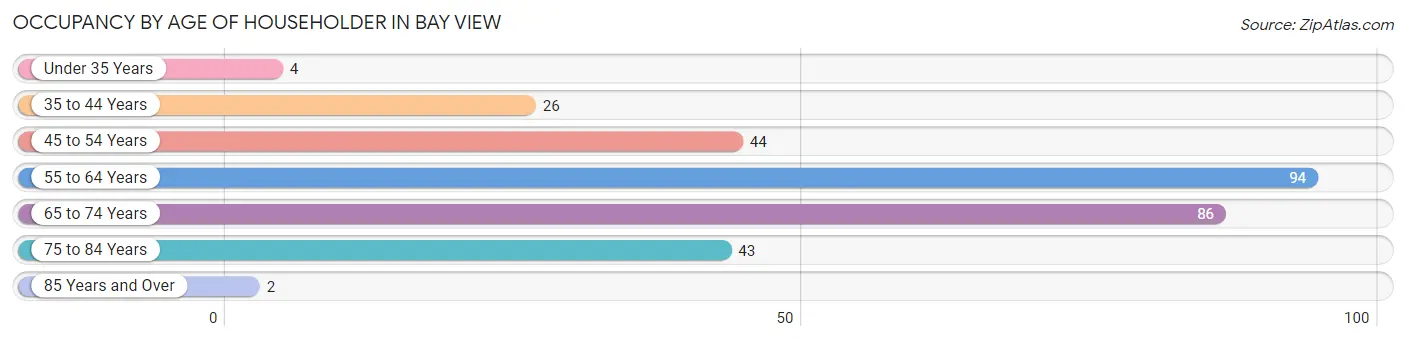
| Age Bracket | # Households | % Households |
| Under 35 Years | 4 | 1.3% |
| 35 to 44 Years | 26 | 8.7% |
| 45 to 54 Years | 44 | 14.7% |
| 55 to 64 Years | 94 | 31.4% |
| 65 to 74 Years | 86 | 28.8% |
| 75 to 84 Years | 43 | 14.4% |
| 85 Years and Over | 2 | 0.7% |
| Total | 299 | 100.0% |
Housing Finances in Bay View
Median Income by Occupancy in Bay View
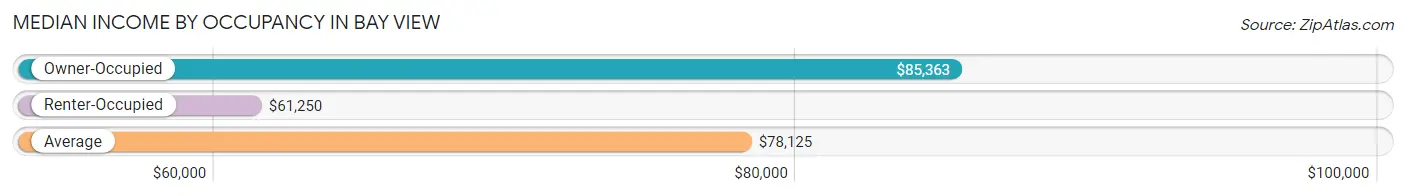
| Occupancy Type | # Households | Median Income |
| Owner-Occupied | 269 (90.0%) | $85,363 |
| Renter-Occupied | 30 (10.0%) | $61,250 |
| Average | 299 (100.0%) | $78,125 |
Occupancy by Householder Income Bracket in Bay View
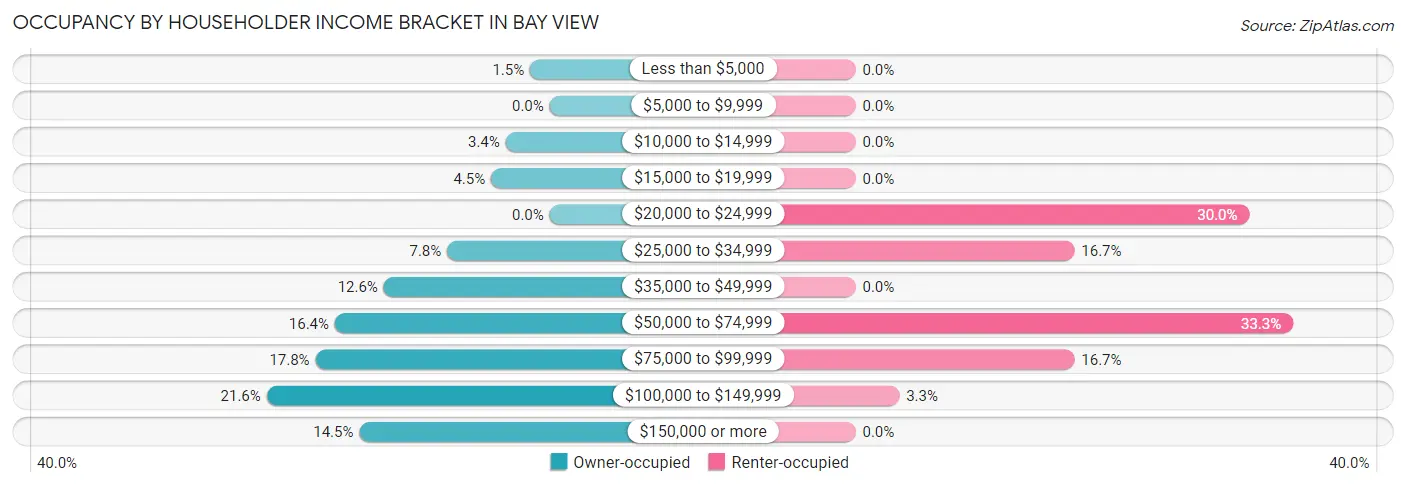
| Income Bracket | Owner-occupied | Renter-occupied |
| Less than $5,000 | 4 (1.5%) | 0 (0.0%) |
| $5,000 to $9,999 | 0 (0.0%) | 0 (0.0%) |
| $10,000 to $14,999 | 9 (3.4%) | 0 (0.0%) |
| $15,000 to $19,999 | 12 (4.5%) | 0 (0.0%) |
| $20,000 to $24,999 | 0 (0.0%) | 9 (30.0%) |
| $25,000 to $34,999 | 21 (7.8%) | 5 (16.7%) |
| $35,000 to $49,999 | 34 (12.6%) | 0 (0.0%) |
| $50,000 to $74,999 | 44 (16.4%) | 10 (33.3%) |
| $75,000 to $99,999 | 48 (17.8%) | 5 (16.7%) |
| $100,000 to $149,999 | 58 (21.6%) | 1 (3.3%) |
| $150,000 or more | 39 (14.5%) | 0 (0.0%) |
| Total | 269 (100.0%) | 30 (100.0%) |
Monthly Housing Cost Tiers in Bay View
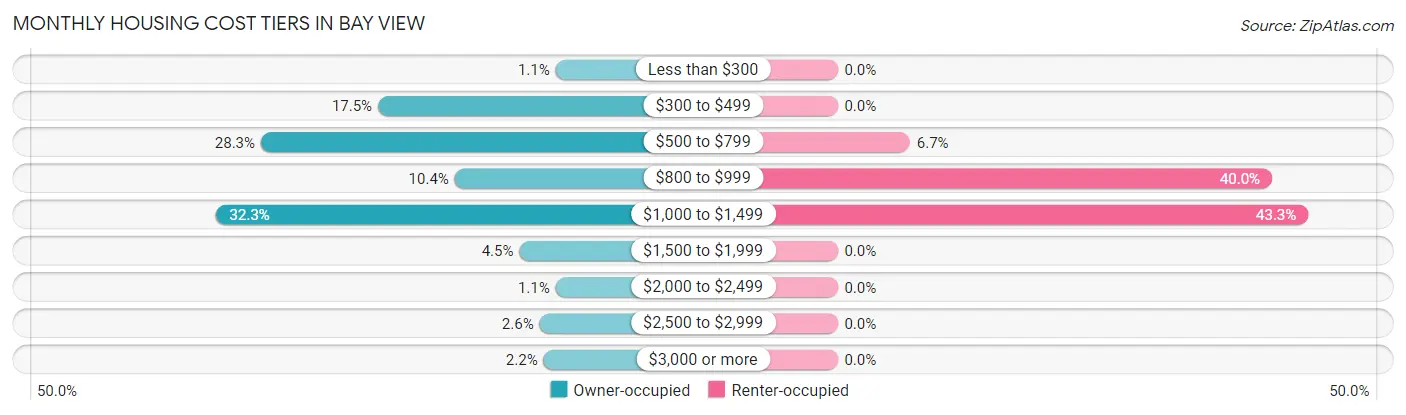
| Monthly Cost | Owner-occupied | Renter-occupied |
| Less than $300 | 3 (1.1%) | 0 (0.0%) |
| $300 to $499 | 47 (17.5%) | 0 (0.0%) |
| $500 to $799 | 76 (28.2%) | 2 (6.7%) |
| $800 to $999 | 28 (10.4%) | 12 (40.0%) |
| $1,000 to $1,499 | 87 (32.3%) | 13 (43.3%) |
| $1,500 to $1,999 | 12 (4.5%) | 0 (0.0%) |
| $2,000 to $2,499 | 3 (1.1%) | 0 (0.0%) |
| $2,500 to $2,999 | 7 (2.6%) | 0 (0.0%) |
| $3,000 or more | 6 (2.2%) | 0 (0.0%) |
| Total | 269 (100.0%) | 30 (100.0%) |
Physical Housing Characteristics in Bay View
Housing Structures in Bay View
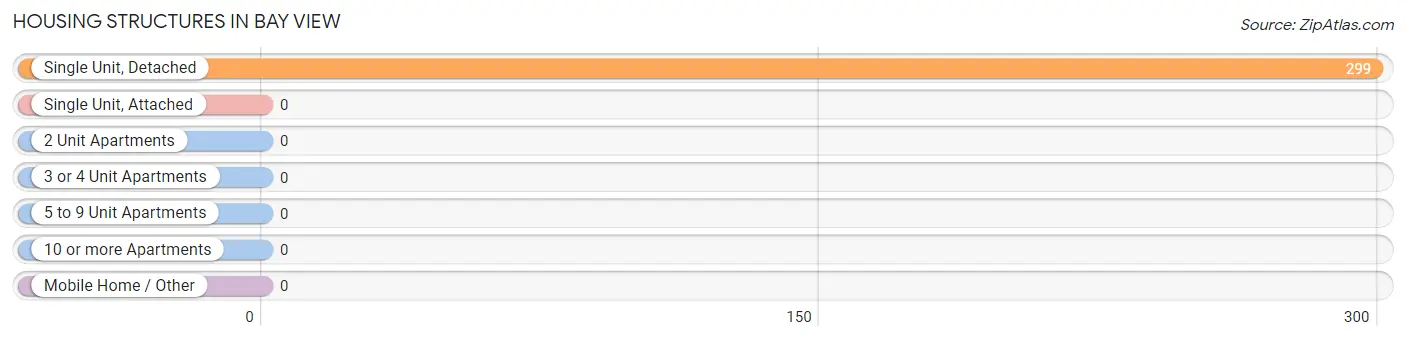
| Structure Type | # Housing Units | % Housing Units |
| Single Unit, Detached | 299 | 100.0% |
| Single Unit, Attached | 0 | 0.0% |
| 2 Unit Apartments | 0 | 0.0% |
| 3 or 4 Unit Apartments | 0 | 0.0% |
| 5 to 9 Unit Apartments | 0 | 0.0% |
| 10 or more Apartments | 0 | 0.0% |
| Mobile Home / Other | 0 | 0.0% |
| Total | 299 | 100.0% |
Housing Structures by Occupancy in Bay View
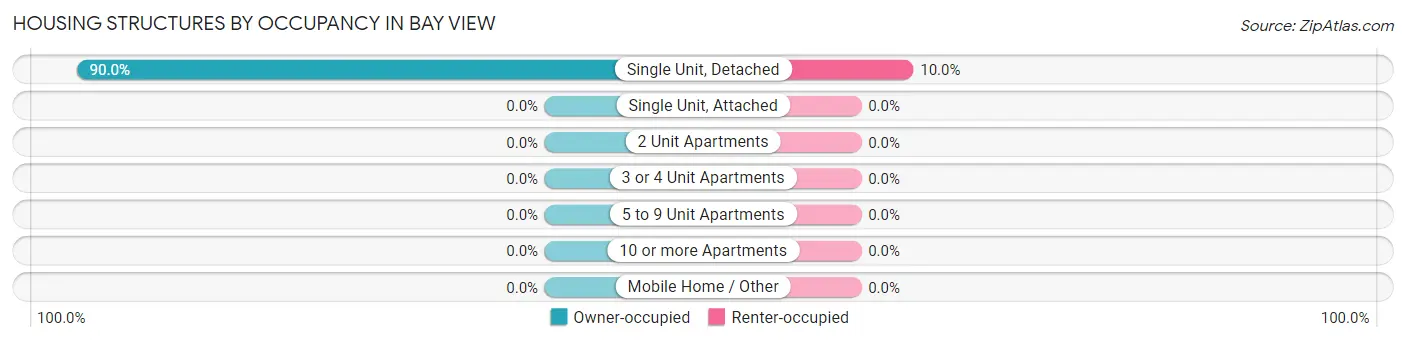
| Structure Type | Owner-occupied | Renter-occupied |
| Single Unit, Detached | 269 (90.0%) | 30 (10.0%) |
| Single Unit, Attached | 0 (0.0%) | 0 (0.0%) |
| 2 Unit Apartments | 0 (0.0%) | 0 (0.0%) |
| 3 or 4 Unit Apartments | 0 (0.0%) | 0 (0.0%) |
| 5 to 9 Unit Apartments | 0 (0.0%) | 0 (0.0%) |
| 10 or more Apartments | 0 (0.0%) | 0 (0.0%) |
| Mobile Home / Other | 0 (0.0%) | 0 (0.0%) |
| Total | 269 (90.0%) | 30 (10.0%) |
Housing Structures by Number of Rooms in Bay View
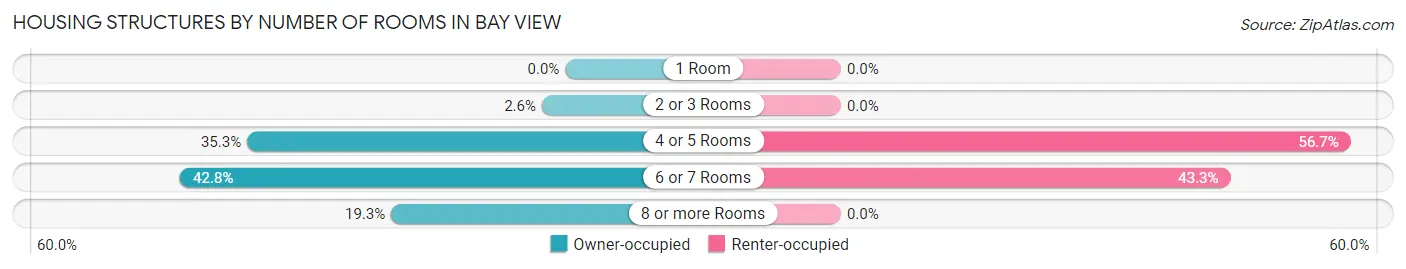
| Number of Rooms | Owner-occupied | Renter-occupied |
| 1 Room | 0 (0.0%) | 0 (0.0%) |
| 2 or 3 Rooms | 7 (2.6%) | 0 (0.0%) |
| 4 or 5 Rooms | 95 (35.3%) | 17 (56.7%) |
| 6 or 7 Rooms | 115 (42.7%) | 13 (43.3%) |
| 8 or more Rooms | 52 (19.3%) | 0 (0.0%) |
| Total | 269 (100.0%) | 30 (100.0%) |
Housing Structure by Heating Type in Bay View
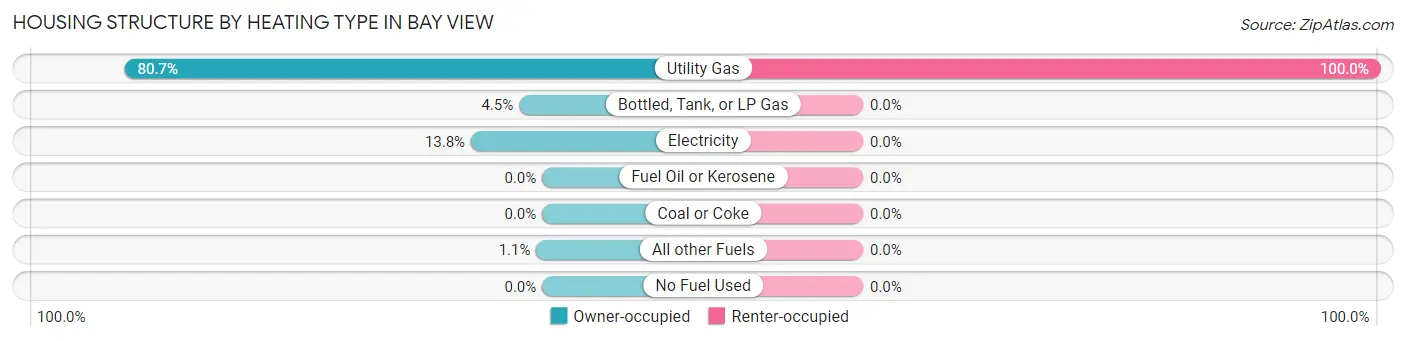
| Heating Type | Owner-occupied | Renter-occupied |
| Utility Gas | 217 (80.7%) | 30 (100.0%) |
| Bottled, Tank, or LP Gas | 12 (4.5%) | 0 (0.0%) |
| Electricity | 37 (13.8%) | 0 (0.0%) |
| Fuel Oil or Kerosene | 0 (0.0%) | 0 (0.0%) |
| Coal or Coke | 0 (0.0%) | 0 (0.0%) |
| All other Fuels | 3 (1.1%) | 0 (0.0%) |
| No Fuel Used | 0 (0.0%) | 0 (0.0%) |
| Total | 269 (100.0%) | 30 (100.0%) |
Household Vehicle Usage in Bay View
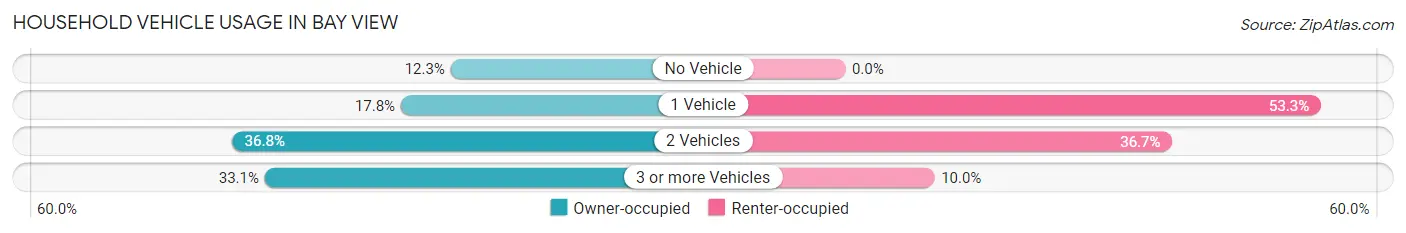
| Vehicles per Household | Owner-occupied | Renter-occupied |
| No Vehicle | 33 (12.3%) | 0 (0.0%) |
| 1 Vehicle | 48 (17.8%) | 16 (53.3%) |
| 2 Vehicles | 99 (36.8%) | 11 (36.7%) |
| 3 or more Vehicles | 89 (33.1%) | 3 (10.0%) |
| Total | 269 (100.0%) | 30 (100.0%) |
Real Estate & Mortgages in Bay View
Real Estate and Mortgage Overview in Bay View
| Characteristic | Without Mortgage | With Mortgage |
| Housing Units | 93 | 176 |
| Median Property Value | $126,800 | $146,300 |
| Median Household Income | $49,583 | $28 |
| Monthly Housing Costs | $550 | $5 |
| Real Estate Taxes | $1,880 | $0 |
Property Value by Mortgage Status in Bay View
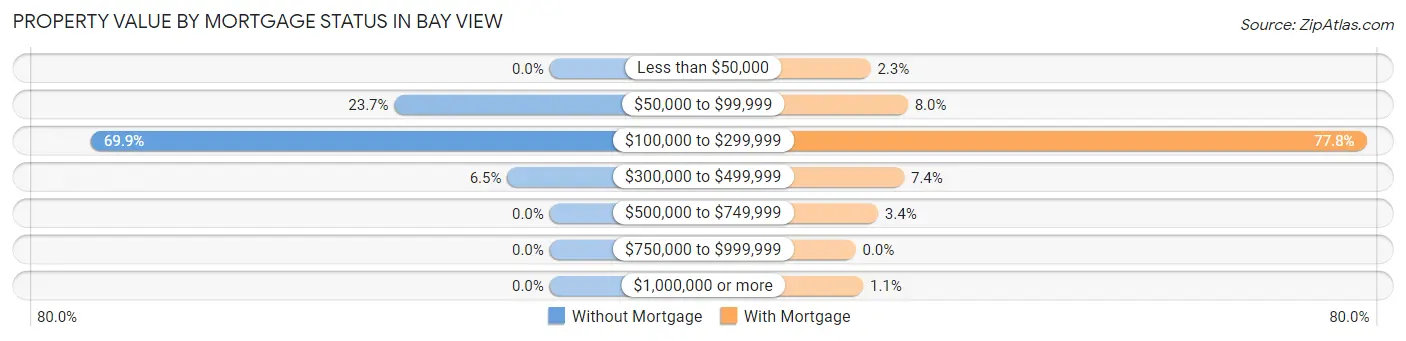
| Property Value | Without Mortgage | With Mortgage |
| Less than $50,000 | 0 (0.0%) | 4 (2.3%) |
| $50,000 to $99,999 | 22 (23.7%) | 14 (8.0%) |
| $100,000 to $299,999 | 65 (69.9%) | 137 (77.8%) |
| $300,000 to $499,999 | 6 (6.5%) | 13 (7.4%) |
| $500,000 to $749,999 | 0 (0.0%) | 6 (3.4%) |
| $750,000 to $999,999 | 0 (0.0%) | 0 (0.0%) |
| $1,000,000 or more | 0 (0.0%) | 2 (1.1%) |
| Total | 93 (100.0%) | 176 (100.0%) |
Household Income by Mortgage Status in Bay View
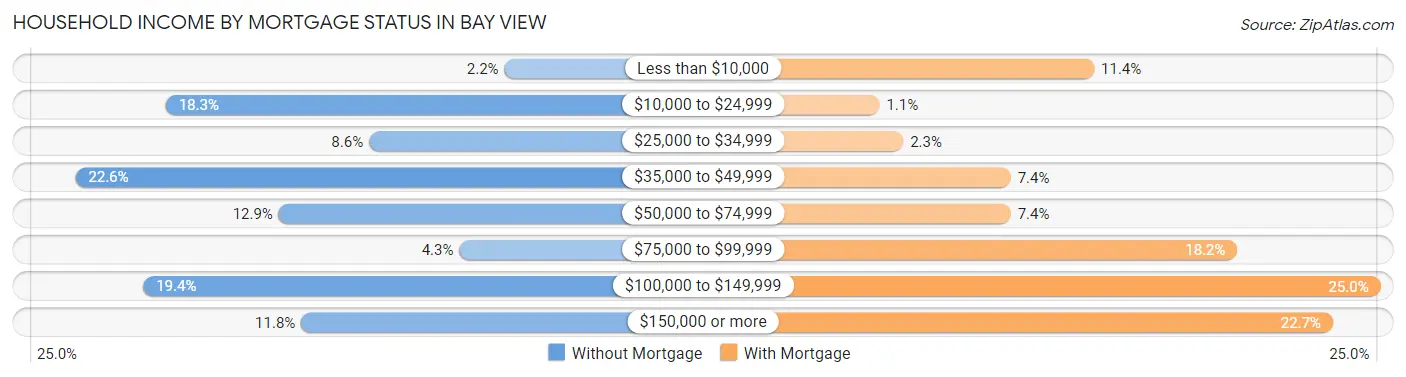
| Household Income | Without Mortgage | With Mortgage |
| Less than $10,000 | 2 (2.1%) | 20 (11.4%) |
| $10,000 to $24,999 | 17 (18.3%) | 2 (1.1%) |
| $25,000 to $34,999 | 8 (8.6%) | 4 (2.3%) |
| $35,000 to $49,999 | 21 (22.6%) | 13 (7.4%) |
| $50,000 to $74,999 | 12 (12.9%) | 13 (7.4%) |
| $75,000 to $99,999 | 4 (4.3%) | 32 (18.2%) |
| $100,000 to $149,999 | 18 (19.4%) | 44 (25.0%) |
| $150,000 or more | 11 (11.8%) | 40 (22.7%) |
| Total | 93 (100.0%) | 176 (100.0%) |
Property Value to Household Income Ratio in Bay View
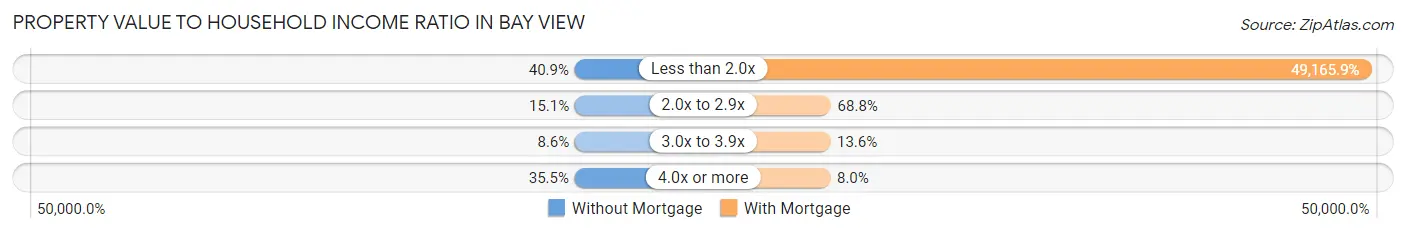
| Value-to-Income Ratio | Without Mortgage | With Mortgage |
| Less than 2.0x | 38 (40.9%) | 86,532 (49,165.9%) |
| 2.0x to 2.9x | 14 (15.0%) | 121 (68.8%) |
| 3.0x to 3.9x | 8 (8.6%) | 24 (13.6%) |
| 4.0x or more | 33 (35.5%) | 14 (8.0%) |
| Total | 93 (100.0%) | 176 (100.0%) |
Real Estate Taxes by Mortgage Status in Bay View
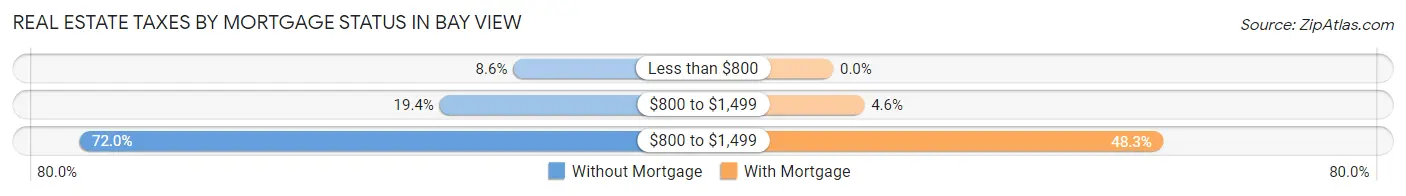
| Property Taxes | Without Mortgage | With Mortgage |
| Less than $800 | 8 (8.6%) | 0 (0.0%) |
| $800 to $1,499 | 18 (19.4%) | 8 (4.5%) |
| $800 to $1,499 | 67 (72.0%) | 85 (48.3%) |
| Total | 93 (100.0%) | 176 (100.0%) |
Health & Disability in Bay View
Health Insurance Coverage by Age in Bay View
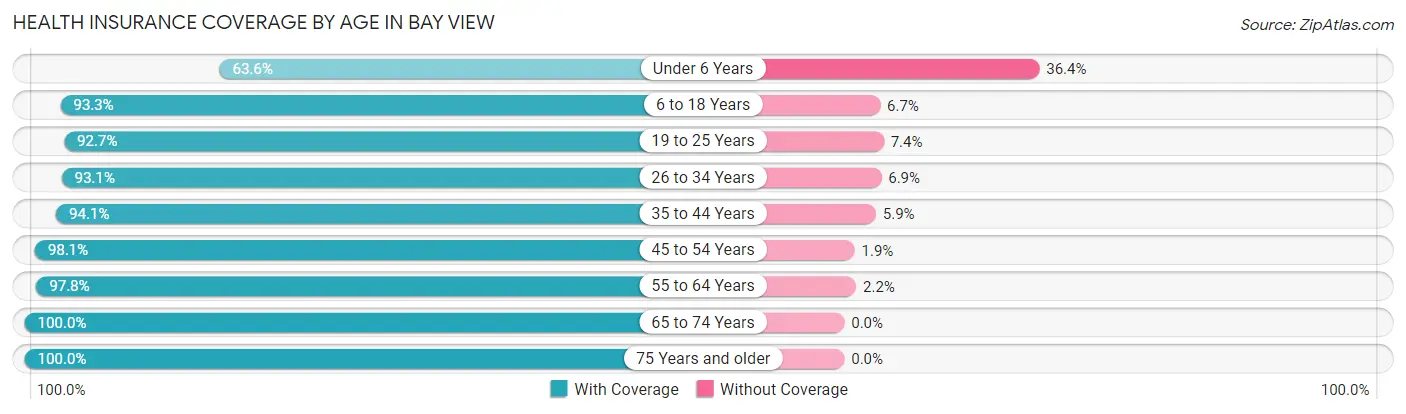
| Age Bracket | With Coverage | Without Coverage |
| Under 6 Years | 7 (63.6%) | 4 (36.4%) |
| 6 to 18 Years | 56 (93.3%) | 4 (6.7%) |
| 19 to 25 Years | 63 (92.6%) | 5 (7.3%) |
| 26 to 34 Years | 54 (93.1%) | 4 (6.9%) |
| 35 to 44 Years | 48 (94.1%) | 3 (5.9%) |
| 45 to 54 Years | 102 (98.1%) | 2 (1.9%) |
| 55 to 64 Years | 178 (97.8%) | 4 (2.2%) |
| 65 to 74 Years | 106 (100.0%) | 0 (0.0%) |
| 75 Years and older | 70 (100.0%) | 0 (0.0%) |
| Total | 684 (96.3%) | 26 (3.7%) |
Health Insurance Coverage by Citizenship Status in Bay View
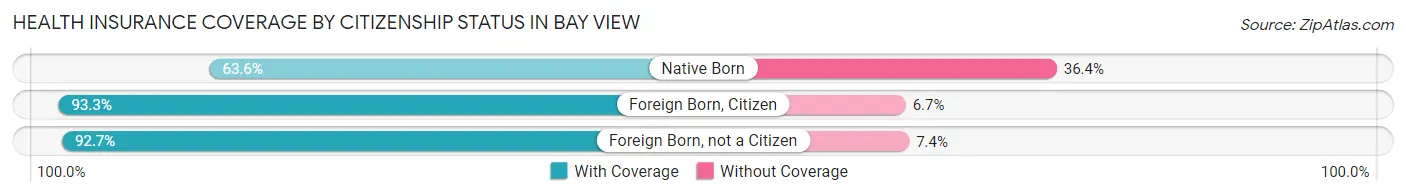
| Citizenship Status | With Coverage | Without Coverage |
| Native Born | 7 (63.6%) | 4 (36.4%) |
| Foreign Born, Citizen | 56 (93.3%) | 4 (6.7%) |
| Foreign Born, not a Citizen | 63 (92.6%) | 5 (7.3%) |
Health Insurance Coverage by Household Income in Bay View
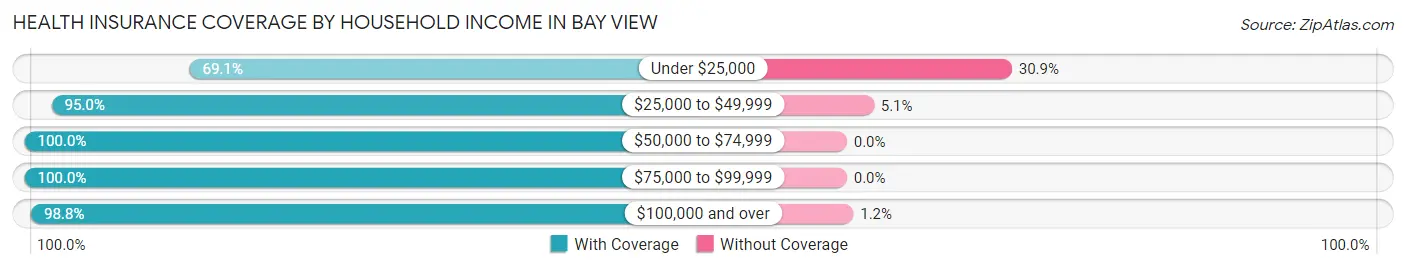
| Household Income | With Coverage | Without Coverage |
| Under $25,000 | 38 (69.1%) | 17 (30.9%) |
| $25,000 to $49,999 | 94 (95.0%) | 5 (5.1%) |
| $50,000 to $74,999 | 101 (100.0%) | 0 (0.0%) |
| $75,000 to $99,999 | 128 (100.0%) | 0 (0.0%) |
| $100,000 and over | 323 (98.8%) | 4 (1.2%) |
Public vs Private Health Insurance Coverage by Age in Bay View
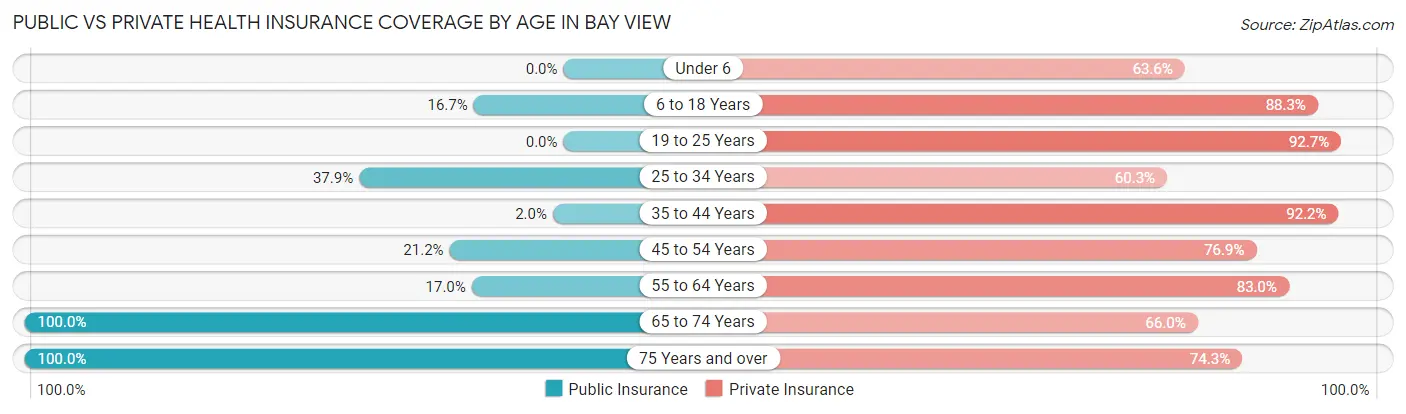
| Age Bracket | Public Insurance | Private Insurance |
| Under 6 | 0 (0.0%) | 7 (63.6%) |
| 6 to 18 Years | 10 (16.7%) | 53 (88.3%) |
| 19 to 25 Years | 0 (0.0%) | 63 (92.6%) |
| 25 to 34 Years | 22 (37.9%) | 35 (60.3%) |
| 35 to 44 Years | 1 (2.0%) | 47 (92.2%) |
| 45 to 54 Years | 22 (21.1%) | 80 (76.9%) |
| 55 to 64 Years | 31 (17.0%) | 151 (83.0%) |
| 65 to 74 Years | 106 (100.0%) | 70 (66.0%) |
| 75 Years and over | 70 (100.0%) | 52 (74.3%) |
| Total | 262 (36.9%) | 558 (78.6%) |
Disability Status by Sex by Age in Bay View
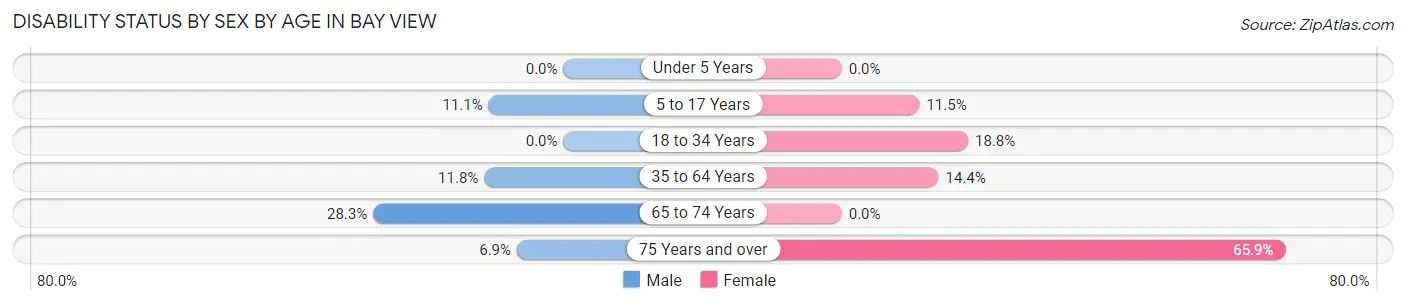
| Age Bracket | Male | Female |
| Under 5 Years | 0 (0.0%) | 0 (0.0%) |
| 5 to 17 Years | 3 (11.1%) | 3 (11.5%) |
| 18 to 34 Years | 0 (0.0%) | 9 (18.8%) |
| 35 to 64 Years | 20 (11.8%) | 24 (14.4%) |
| 65 to 74 Years | 13 (28.3%) | 0 (0.0%) |
| 75 Years and over | 2 (6.9%) | 27 (65.8%) |
Disability Class by Sex by Age in Bay View
Disability Class: Hearing Difficulty
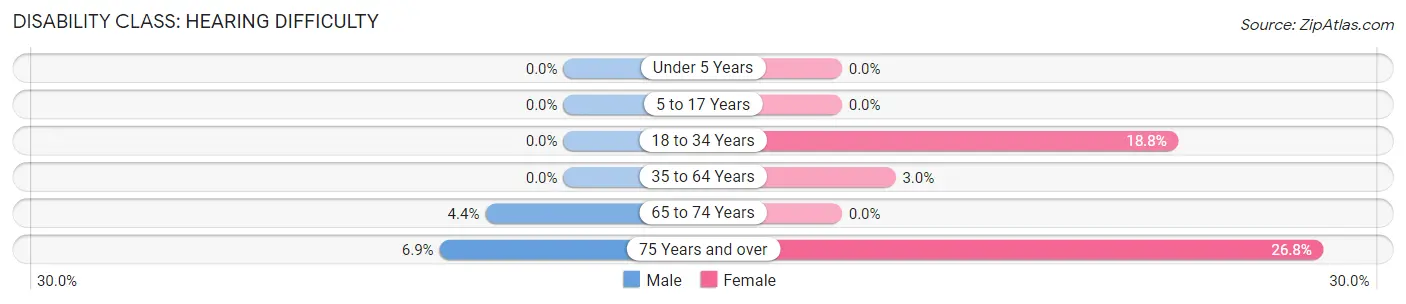
| Age Bracket | Male | Female |
| Under 5 Years | 0 (0.0%) | 0 (0.0%) |
| 5 to 17 Years | 0 (0.0%) | 0 (0.0%) |
| 18 to 34 Years | 0 (0.0%) | 9 (18.8%) |
| 35 to 64 Years | 0 (0.0%) | 5 (3.0%) |
| 65 to 74 Years | 2 (4.3%) | 0 (0.0%) |
| 75 Years and over | 2 (6.9%) | 11 (26.8%) |
Disability Class: Vision Difficulty
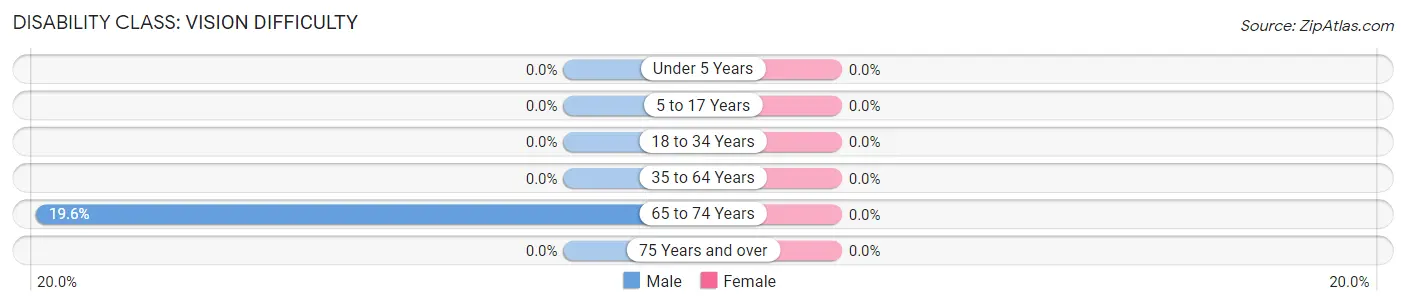
| Age Bracket | Male | Female |
| Under 5 Years | 0 (0.0%) | 0 (0.0%) |
| 5 to 17 Years | 0 (0.0%) | 0 (0.0%) |
| 18 to 34 Years | 0 (0.0%) | 0 (0.0%) |
| 35 to 64 Years | 0 (0.0%) | 0 (0.0%) |
| 65 to 74 Years | 9 (19.6%) | 0 (0.0%) |
| 75 Years and over | 0 (0.0%) | 0 (0.0%) |
Disability Class: Cognitive Difficulty
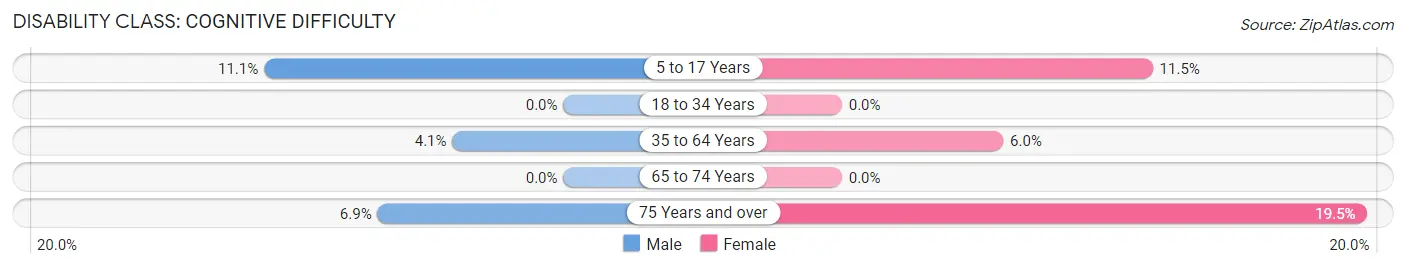
| Age Bracket | Male | Female |
| 5 to 17 Years | 3 (11.1%) | 3 (11.5%) |
| 18 to 34 Years | 0 (0.0%) | 0 (0.0%) |
| 35 to 64 Years | 7 (4.1%) | 10 (6.0%) |
| 65 to 74 Years | 0 (0.0%) | 0 (0.0%) |
| 75 Years and over | 2 (6.9%) | 8 (19.5%) |
Disability Class: Ambulatory Difficulty
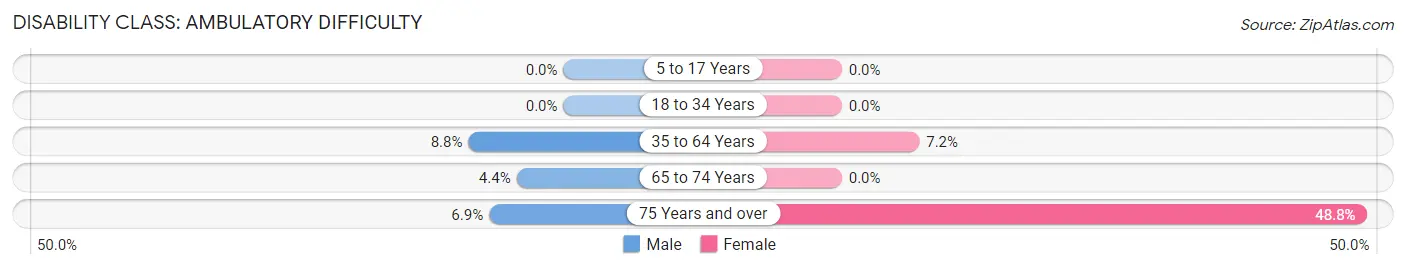
| Age Bracket | Male | Female |
| 5 to 17 Years | 0 (0.0%) | 0 (0.0%) |
| 18 to 34 Years | 0 (0.0%) | 0 (0.0%) |
| 35 to 64 Years | 15 (8.8%) | 12 (7.2%) |
| 65 to 74 Years | 2 (4.3%) | 0 (0.0%) |
| 75 Years and over | 2 (6.9%) | 20 (48.8%) |
Disability Class: Self-Care Difficulty
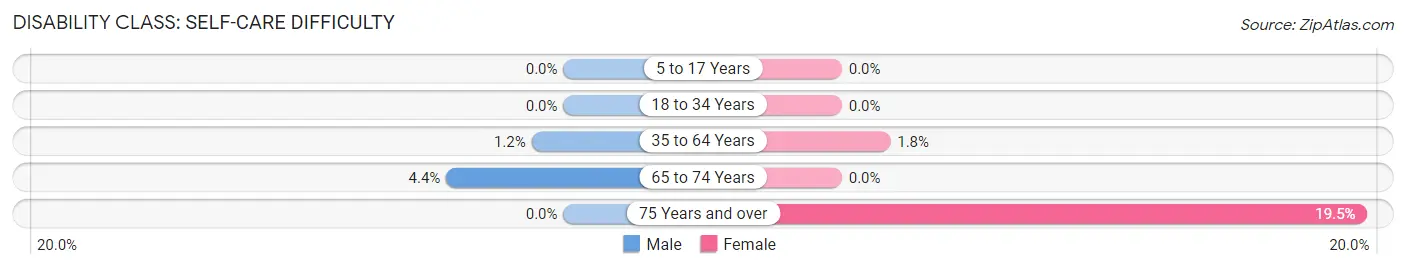
| Age Bracket | Male | Female |
| 5 to 17 Years | 0 (0.0%) | 0 (0.0%) |
| 18 to 34 Years | 0 (0.0%) | 0 (0.0%) |
| 35 to 64 Years | 2 (1.2%) | 3 (1.8%) |
| 65 to 74 Years | 2 (4.3%) | 0 (0.0%) |
| 75 Years and over | 0 (0.0%) | 8 (19.5%) |
Technology Access in Bay View
Computing Device Access in Bay View
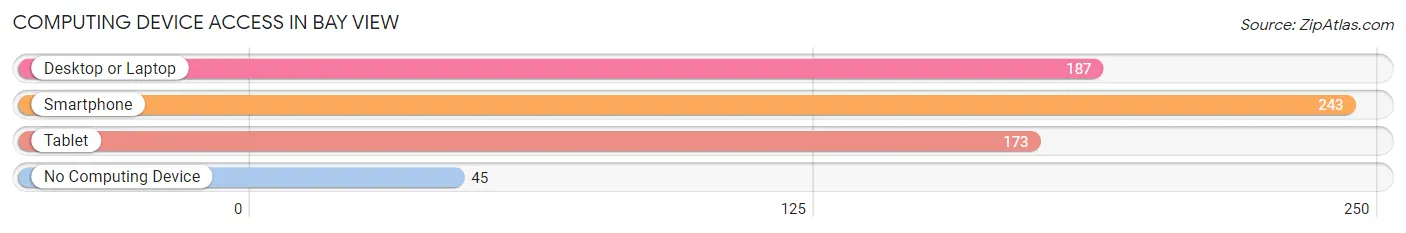
| Device Type | # Households | % Households |
| Desktop or Laptop | 187 | 62.5% |
| Smartphone | 243 | 81.3% |
| Tablet | 173 | 57.9% |
| No Computing Device | 45 | 15.0% |
| Total | 299 | 100.0% |
Internet Access in Bay View
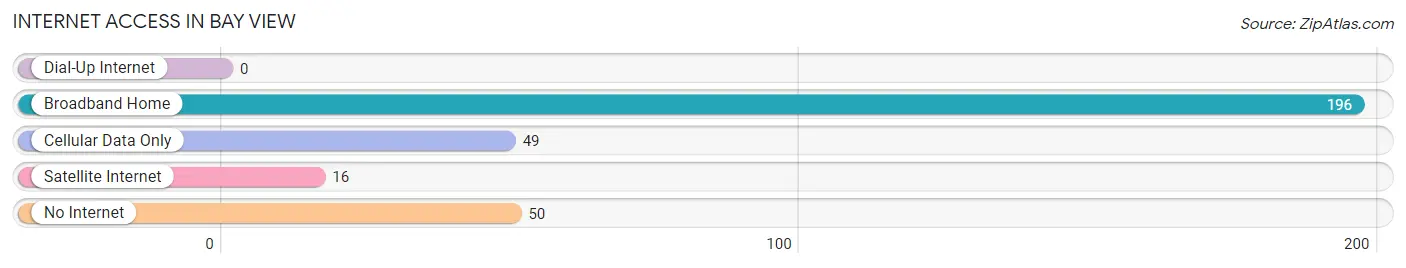
| Internet Type | # Households | % Households |
| Dial-Up Internet | 0 | 0.0% |
| Broadband Home | 196 | 65.5% |
| Cellular Data Only | 49 | 16.4% |
| Satellite Internet | 16 | 5.3% |
| No Internet | 50 | 16.7% |
| Total | 299 | 100.0% |
Bay View Summary
Bay View, Ohio is a small village located in Ottawa County, Ohio. It is situated on the shores of Lake Erie, just south of the city of Port Clinton. The village has a population of just over 1,000 people and is a popular tourist destination due to its proximity to the lake and its many attractions.
History
Bay View was founded in 1854 by a group of settlers from New York. The village was originally known as “Bay View Park” and was a popular summer resort for wealthy families from the east coast. The village was incorporated in 1867 and the name was changed to Bay View.
The village was a popular destination for vacationers and tourists throughout the late 19th and early 20th centuries. The village was home to several large hotels, including the Bay View Hotel, which was built in 1875 and was one of the largest hotels in the area.
The village was also home to a number of amusement parks, including the Bay View Amusement Park, which opened in 1895 and was one of the first amusement parks in the state of Ohio. The park featured a roller coaster, a carousel, and a variety of other attractions.
The village was also home to a number of factories, including the Bay View Glass Company, which was founded in 1892 and produced glass products for the automotive industry. The company was eventually sold to the Libbey Glass Company in the 1920s.
Geography
Bay View is located in Ottawa County, Ohio, on the shores of Lake Erie. The village is situated on a peninsula, with the lake to the north and east, and the Portage River to the south and west. The village is approximately 10 miles south of the city of Port Clinton and is approximately 40 miles east of Toledo.
The village is located in a temperate climate, with hot summers and cold winters. The average temperature in the summer is around 75 degrees Fahrenheit, and the average temperature in the winter is around 30 degrees Fahrenheit.
Economy
The economy of Bay View is largely based on tourism. The village is home to a number of hotels, restaurants, and other attractions that cater to tourists. The village is also home to a number of marinas, which provide access to Lake Erie for boaters.
The village is also home to a number of small businesses, including a grocery store, a hardware store, and a number of other retail stores. The village is also home to a number of manufacturing companies, including the Libbey Glass Company, which produces glass products for the automotive industry.
Demographics
As of the 2010 census, the population of Bay View was 1,072. The racial makeup of the village was 97.3% White, 0.7% African American, 0.2% Native American, 0.2% Asian, 0.1% Pacific Islander, 0.3% from other races, and 1.3% from two or more races. Hispanic or Latino of any race were 1.3% of the population.
The median income for a household in the village was $41,250, and the median income for a family was $50,000. The per capita income for the village was $20,945. About 8.3% of families and 10.2% of the population were below the poverty line, including 14.3% of those under age 18 and 4.2% of those age 65 or over.
Common Questions
What is the Total Population of Bay View?
Total Population of Bay View is 710.
What is the Total Male Population of Bay View?
Total Male Population of Bay View is 361.
What is the Total Female Population of Bay View?
Total Female Population of Bay View is 349.
What is the Ratio of Males per 100 Females in Bay View?
There are 103.44 Males per 100 Females in Bay View.
What is the Ratio of Females per 100 Males in Bay View?
There are 96.68 Females per 100 Males in Bay View.
What is the Median Population Age in Bay View?
Median Population Age in Bay View is 55.1 Years.
What is the Average Family Size in Bay View
Average Family Size in Bay View is 2.7 People.
What is the Average Household Size in Bay View
Average Household Size in Bay View is 2.4 People.
What is Per Capita Income in Bay View?
Per Capita income in Bay View is $42,951.
What is the Median Family Income in Bay View?
Median Family Income in Bay View is $86,573.
What is the Median Household income in Bay View?
Median Household Income in Bay View is $78,125.
What is Income or Wage Gap in Bay View?
Income or Wage Gap in Bay View is 35.6%.
Women in Bay View earn 64.4 cents for every dollar earned by a man.
What is Inequality or Gini Index in Bay View?
Inequality or Gini Index in Bay View is 0.45.
How Large is the Labor Force in Bay View?
There are 436 People in the Labor Forcein in Bay View.
What is the Percentage of People in the Labor Force in Bay View?
65.7% of People are in the Labor Force in Bay View.
What is the Unemployment Rate in Bay View?
Unemployment Rate in Bay View is 6.2%.