Apple Valley, OH
Apple Valley Map
Apple Valley Overview
5,217
TOTAL POPULATION
2,632
MALE POPULATION
2,585
FEMALE POPULATION
101.82
MALES / 100 FEMALES
98.21
FEMALES / 100 MALES
50.6
MEDIAN AGE
2.9
AVG FAMILY SIZE
2.5
AVG HOUSEHOLD SIZE
$44,519
PER CAPITA INCOME
$93,947
AVG FAMILY INCOME
$82,175
AVG HOUSEHOLD INCOME
44.8%
WAGE / INCOME GAP [ % ]
55.2¢/ $1
WAGE / INCOME GAP [ $ ]
$2,702
FAMILY INCOME DEFICIT
0.40
INEQUALITY / GINI INDEX
2,673
LABOR FORCE [ PEOPLE ]
61.7%
PERCENT IN LABOR FORCE
7.6%
UNEMPLOYMENT RATE
Race in Apple Valley
The most populous races in Apple Valley are White / Caucasian (4,896 | 93.9%), Two or more Races (248 | 4.8%), and Black / African American (73 | 1.4%).
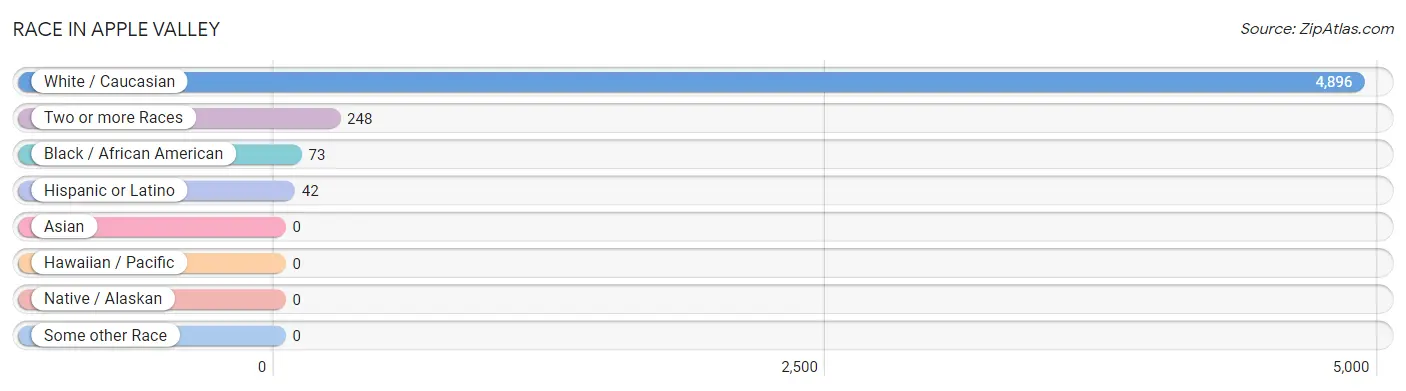
| Race | # Population | % Population |
| Asian | 0 | 0.0% |
| Black / African American | 73 | 1.4% |
| Hawaiian / Pacific | 0 | 0.0% |
| Hispanic or Latino | 42 | 0.8% |
| Native / Alaskan | 0 | 0.0% |
| White / Caucasian | 4,896 | 93.9% |
| Two or more Races | 248 | 4.8% |
| Some other Race | 0 | 0.0% |
| Total | 5,217 | 100.0% |
Ancestry in Apple Valley
The most populous ancestries reported in Apple Valley are German (1,489 | 28.5%), Irish (1,209 | 23.2%), English (741 | 14.2%), American (344 | 6.6%), and European (181 | 3.5%), together accounting for 76.0% of all Apple Valley residents.
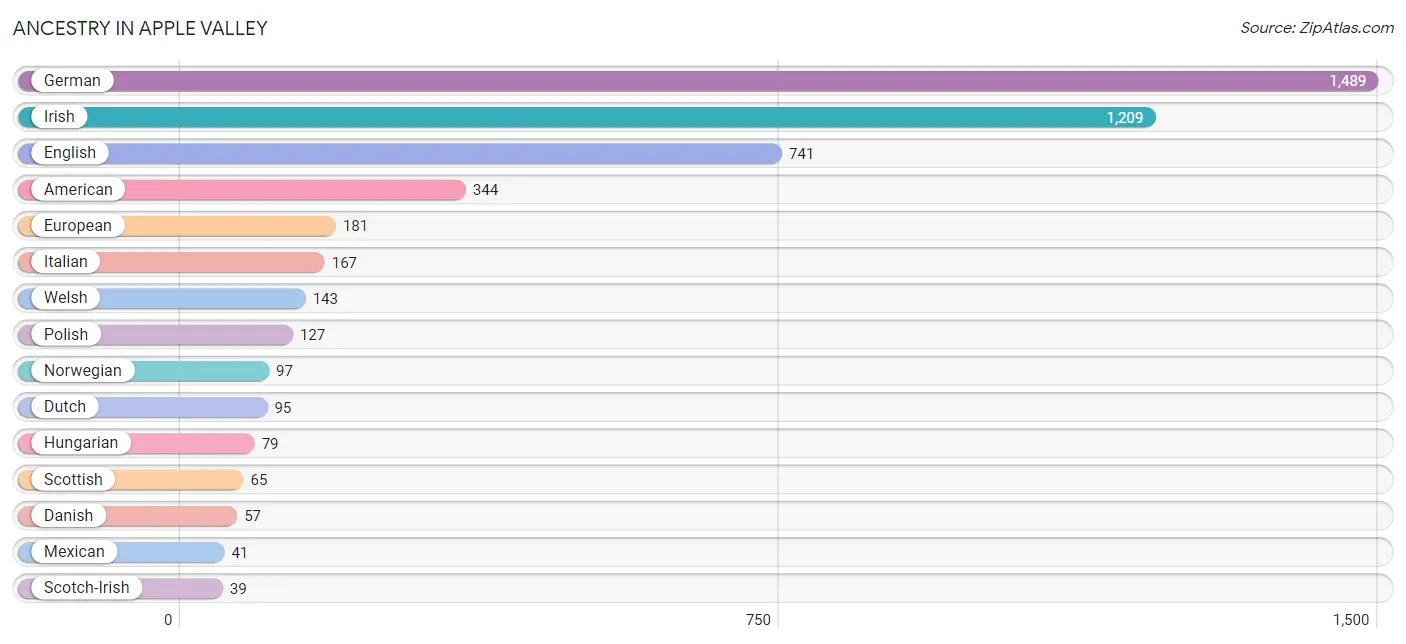
| Ancestry | # Population | % Population |
| American | 344 | 6.6% |
| British | 13 | 0.3% |
| Danish | 57 | 1.1% |
| Dutch | 95 | 1.8% |
| Eastern European | 19 | 0.4% |
| English | 741 | 14.2% |
| European | 181 | 3.5% |
| French | 28 | 0.5% |
| German | 1,489 | 28.5% |
| Hungarian | 79 | 1.5% |
| Irish | 1,209 | 23.2% |
| Italian | 167 | 3.2% |
| Mexican | 41 | 0.8% |
| Norwegian | 97 | 1.9% |
| Polish | 127 | 2.4% |
| Russian | 18 | 0.4% |
| Scotch-Irish | 39 | 0.7% |
| Scottish | 65 | 1.3% |
| Slovak | 18 | 0.4% |
| Spaniard | 1 | 0.0% |
| Swedish | 1 | 0.0% |
| Swiss | 22 | 0.4% |
| Welsh | 143 | 2.7% | View All 23 Rows |
Immigrants in Apple Valley
The most numerous immigrant groups reported in Apple Valley came from Europe (41 | 0.8%), and Northern Europe (41 | 0.8%), together accounting for 1.6% of all Apple Valley residents.
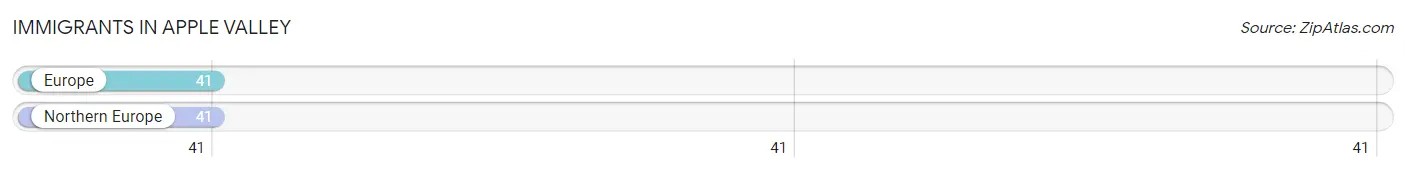
| Immigration Origin | # Population | % Population |
| Europe | 41 | 0.8% |
| Northern Europe | 41 | 0.8% | View All 2 Rows |
Sex and Age in Apple Valley
Sex and Age in Apple Valley
The most populous age groups in Apple Valley are 60 to 64 Years (381 | 14.5%) for men and 60 to 64 Years (392 | 15.2%) for women.
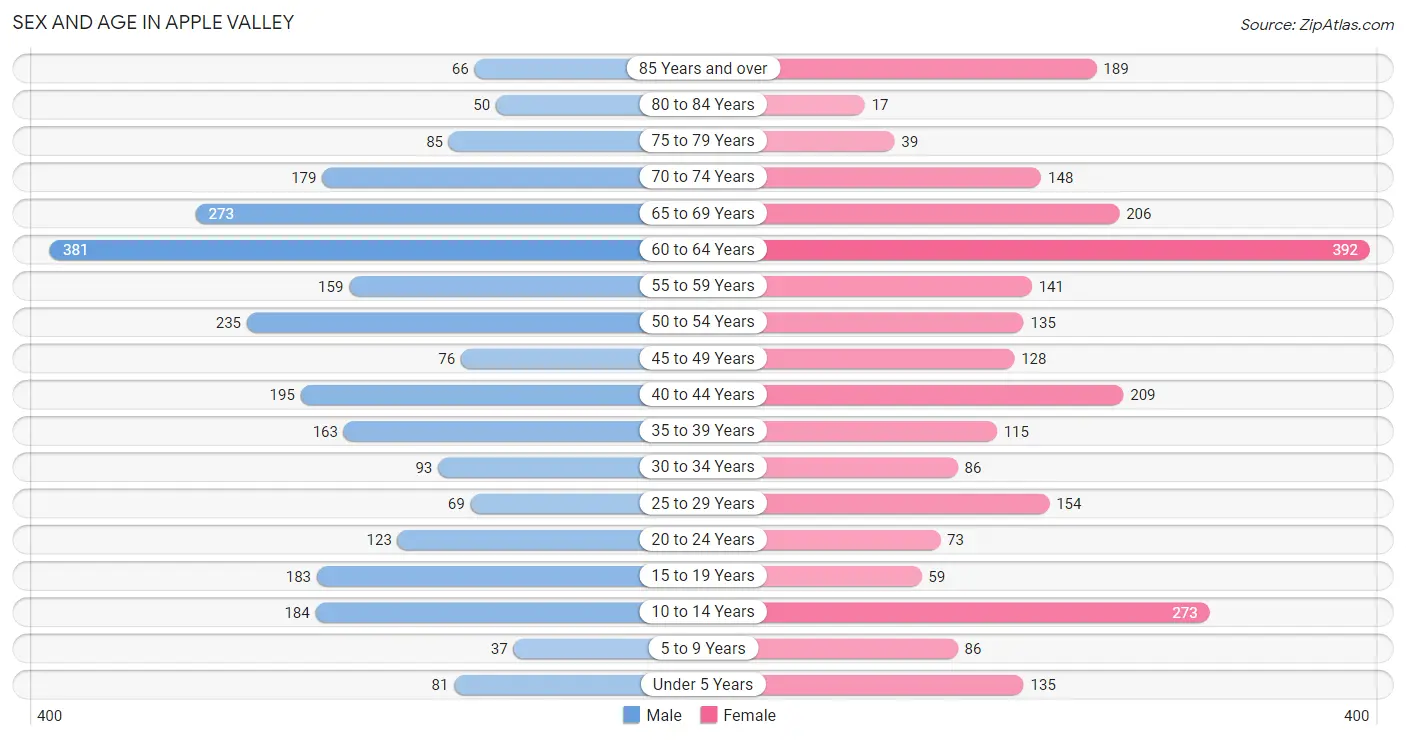
| Age Bracket | Male | Female |
| Under 5 Years | 81 (3.1%) | 135 (5.2%) |
| 5 to 9 Years | 37 (1.4%) | 86 (3.3%) |
| 10 to 14 Years | 184 (7.0%) | 273 (10.6%) |
| 15 to 19 Years | 183 (7.0%) | 59 (2.3%) |
| 20 to 24 Years | 123 (4.7%) | 73 (2.8%) |
| 25 to 29 Years | 69 (2.6%) | 154 (6.0%) |
| 30 to 34 Years | 93 (3.5%) | 86 (3.3%) |
| 35 to 39 Years | 163 (6.2%) | 115 (4.4%) |
| 40 to 44 Years | 195 (7.4%) | 209 (8.1%) |
| 45 to 49 Years | 76 (2.9%) | 128 (5.0%) |
| 50 to 54 Years | 235 (8.9%) | 135 (5.2%) |
| 55 to 59 Years | 159 (6.0%) | 141 (5.4%) |
| 60 to 64 Years | 381 (14.5%) | 392 (15.2%) |
| 65 to 69 Years | 273 (10.4%) | 206 (8.0%) |
| 70 to 74 Years | 179 (6.8%) | 148 (5.7%) |
| 75 to 79 Years | 85 (3.2%) | 39 (1.5%) |
| 80 to 84 Years | 50 (1.9%) | 17 (0.7%) |
| 85 Years and over | 66 (2.5%) | 189 (7.3%) |
| Total | 2,632 (100.0%) | 2,585 (100.0%) |
Families and Households in Apple Valley
Median Family Size in Apple Valley
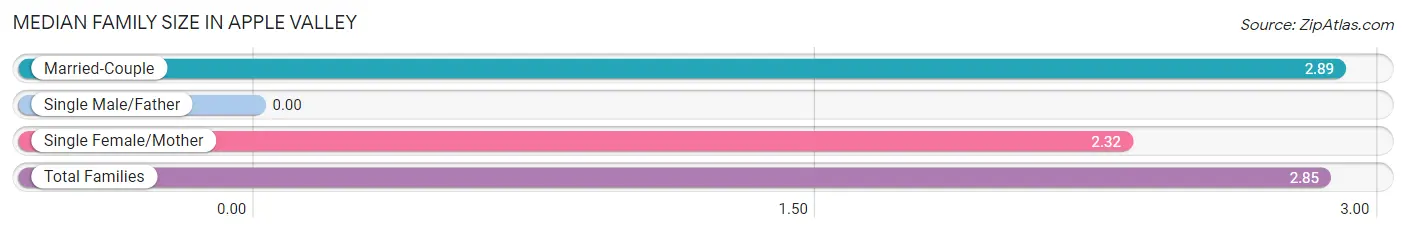
| Family Type | # Families | Family Size |
| Married-Couple | 1,513 (92.7%) | 2.89 |
| Single Male/Father | 0 (0.0%) | - |
| Single Female/Mother | 119 (7.3%) | 2.32 |
| Total Families | 1,632 (100.0%) | 2.85 |
Median Household Size in Apple Valley
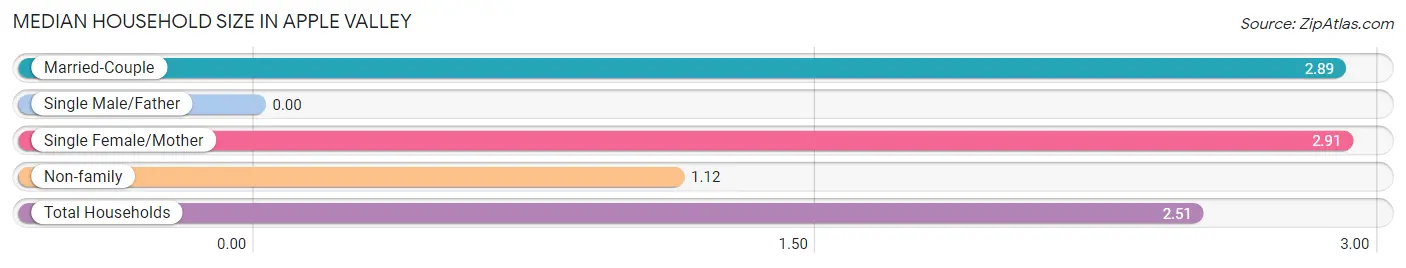
| Household Type | # Households | Household Size |
| Married-Couple | 1,513 (73.1%) | 2.89 |
| Single Male/Father | 0 (0.0%) | - |
| Single Female/Mother | 119 (5.8%) | 2.91 |
| Non-family | 439 (21.2%) | 1.12 |
| Total Households | 2,071 (100.0%) | 2.51 |
Household Size by Marriage Status in Apple Valley
Out of a total of 2,071 households in Apple Valley, 1,632 (78.8%) are family households, while 439 (21.2%) are nonfamily households. The most numerous type of family households are 2-person households, comprising 946, and the most common type of nonfamily households are 1-person households, comprising 393.
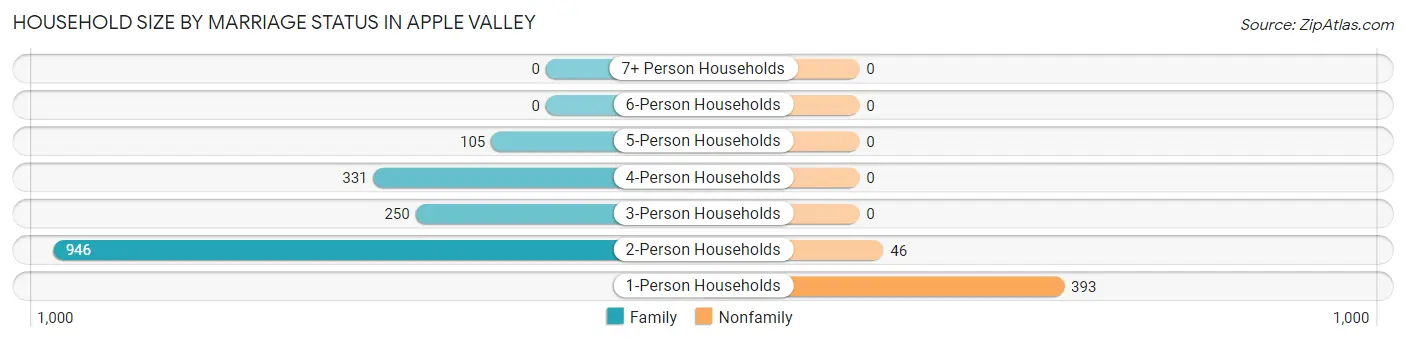
| Household Size | Family Households | Nonfamily Households |
| 1-Person Households | - | 393 (19.0%) |
| 2-Person Households | 946 (45.7%) | 46 (2.2%) |
| 3-Person Households | 250 (12.1%) | 0 (0.0%) |
| 4-Person Households | 331 (16.0%) | 0 (0.0%) |
| 5-Person Households | 105 (5.1%) | 0 (0.0%) |
| 6-Person Households | 0 (0.0%) | 0 (0.0%) |
| 7+ Person Households | 0 (0.0%) | 0 (0.0%) |
| Total | 1,632 (78.8%) | 439 (21.2%) |
Female Fertility in Apple Valley
Fertility by Age in Apple Valley
Average fertility rate in Apple Valley is 37.0 births per 1,000 women. Women in the age bracket of 20 to 34 years have the highest fertility rate with 99.0 births per 1,000 women. Women in the age bracket of 20 to 34 years acount for 100.0% of all women with births.
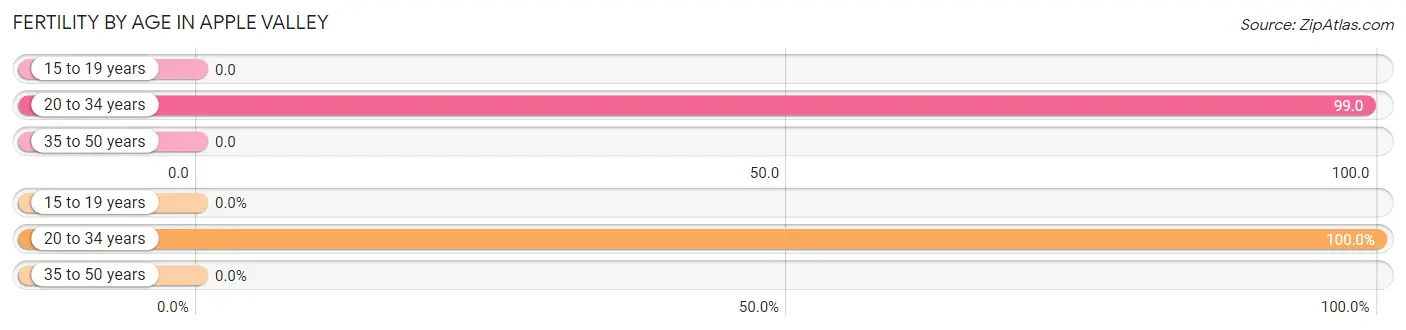
| Age Bracket | Women with Births | Births / 1,000 Women |
| 15 to 19 years | 0 (0.0%) | 0.0 |
| 20 to 34 years | 31 (100.0%) | 99.0 |
| 35 to 50 years | 0 (0.0%) | 0.0 |
| Total | 31 (100.0%) | 37.0 |
Fertility by Age by Marriage Status in Apple Valley
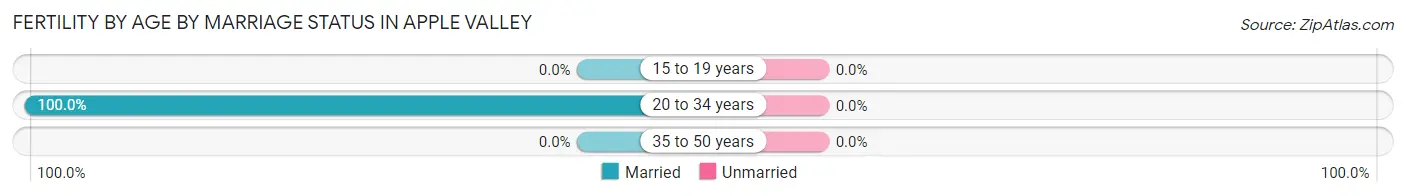
| Age Bracket | Married | Unmarried |
| 15 to 19 years | 0 (0.0%) | 0 (0.0%) |
| 20 to 34 years | 31 (100.0%) | 0 (0.0%) |
| 35 to 50 years | 0 (0.0%) | 0 (0.0%) |
| Total | 31 (100.0%) | 0 (0.0%) |
Fertility by Education in Apple Valley
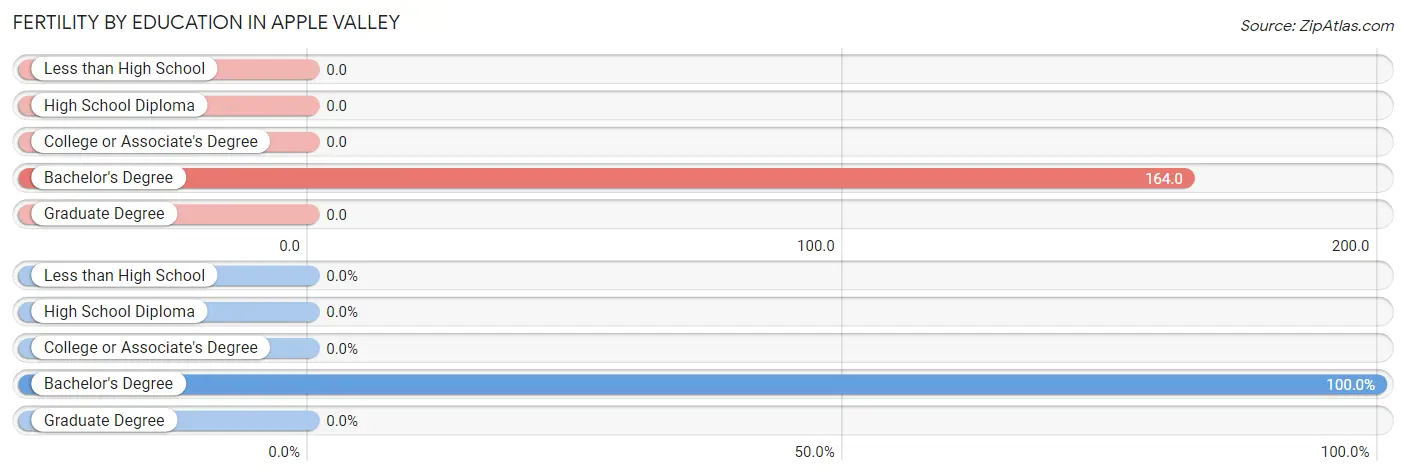
| Educational Attainment | Women with Births | Births / 1,000 Women |
| Less than High School | 0 (0.0%) | 0.0 |
| High School Diploma | 0 (0.0%) | 0.0 |
| College or Associate's Degree | 0 (0.0%) | 0.0 |
| Bachelor's Degree | 31 (100.0%) | 164.0 |
| Graduate Degree | 0 (0.0%) | 0.0 |
| Total | 31 (100.0%) | 37.0 |
Fertility by Education by Marriage Status in Apple Valley
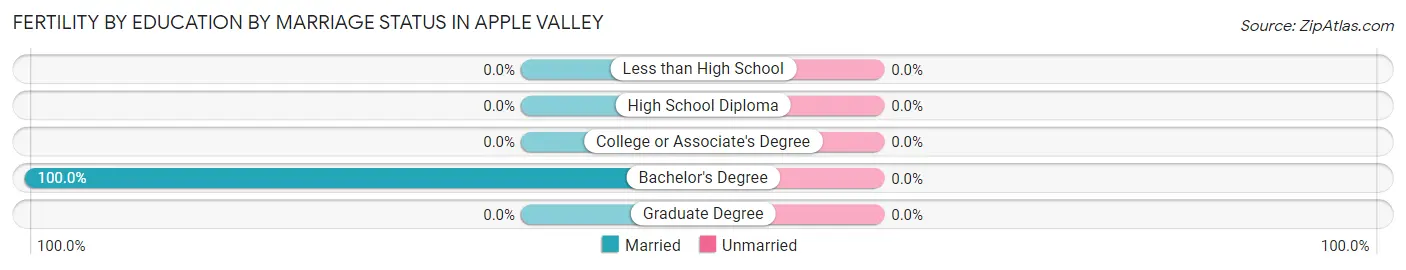
| Educational Attainment | Married | Unmarried |
| Less than High School | 0 (0.0%) | 0 (0.0%) |
| High School Diploma | 0 (0.0%) | 0 (0.0%) |
| College or Associate's Degree | 0 (0.0%) | 0 (0.0%) |
| Bachelor's Degree | 31 (100.0%) | 0 (0.0%) |
| Graduate Degree | 0 (0.0%) | 0 (0.0%) |
| Total | 31 (100.0%) | 0 (0.0%) |
Income in Apple Valley
Income Overview in Apple Valley
Per Capita Income in Apple Valley is $44,519, while median incomes of families and households are $93,947 and $82,175 respectively.
| Characteristic | Number | Measure |
| Per Capita Income | 5,217 | $44,519 |
| Median Family Income | 1,632 | $93,947 |
| Mean Family Income | 1,632 | $124,003 |
| Median Household Income | 2,071 | $82,175 |
| Mean Household Income | 2,071 | $110,574 |
| Income Deficit | 1,632 | $2,702 |
| Wage / Income Gap (%) | 5,217 | 44.85% |
| Wage / Income Gap ($) | 5,217 | 55.15¢ per $1 |
| Gini / Inequality Index | 5,217 | 0.40 |
Earnings by Sex in Apple Valley
Average Earnings in Apple Valley are $48,421, $52,129 for men and $28,750 for women, a difference of 44.9%.
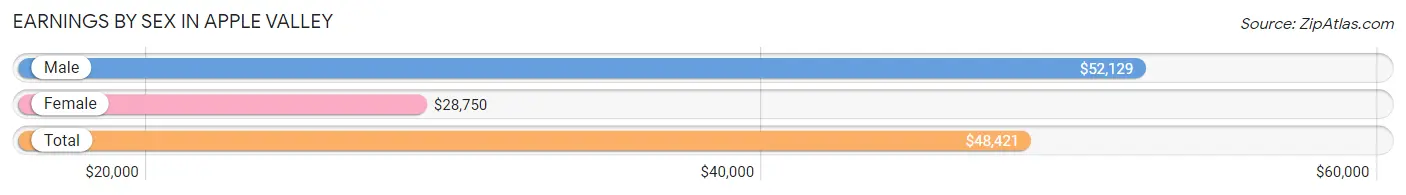
| Sex | Number | Average Earnings |
| Male | 1,538 (55.1%) | $52,129 |
| Female | 1,252 (44.9%) | $28,750 |
| Total | 2,790 (100.0%) | $48,421 |
Earnings by Sex by Income Bracket in Apple Valley
The most common earnings brackets in Apple Valley are $100,000+ for men (308 | 20.0%) and $100,000+ for women (209 | 16.7%).
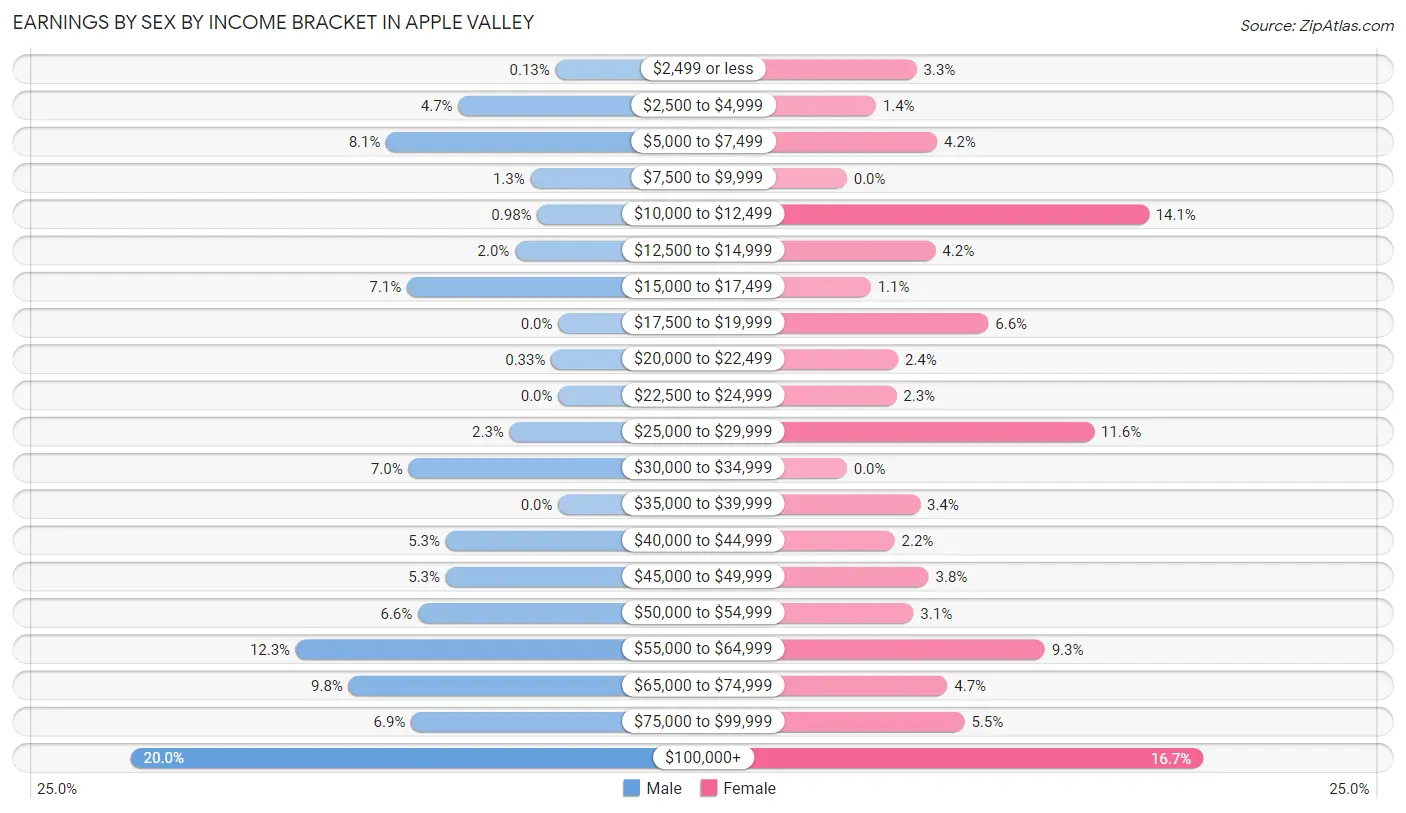
| Income | Male | Female |
| $2,499 or less | 2 (0.1%) | 41 (3.3%) |
| $2,500 to $4,999 | 72 (4.7%) | 17 (1.4%) |
| $5,000 to $7,499 | 124 (8.1%) | 53 (4.2%) |
| $7,500 to $9,999 | 20 (1.3%) | 0 (0.0%) |
| $10,000 to $12,499 | 15 (1.0%) | 177 (14.1%) |
| $12,500 to $14,999 | 31 (2.0%) | 52 (4.2%) |
| $15,000 to $17,499 | 109 (7.1%) | 14 (1.1%) |
| $17,500 to $19,999 | 0 (0.0%) | 83 (6.6%) |
| $20,000 to $22,499 | 5 (0.3%) | 30 (2.4%) |
| $22,500 to $24,999 | 0 (0.0%) | 29 (2.3%) |
| $25,000 to $29,999 | 35 (2.3%) | 145 (11.6%) |
| $30,000 to $34,999 | 108 (7.0%) | 0 (0.0%) |
| $35,000 to $39,999 | 0 (0.0%) | 43 (3.4%) |
| $40,000 to $44,999 | 81 (5.3%) | 28 (2.2%) |
| $45,000 to $49,999 | 81 (5.3%) | 48 (3.8%) |
| $50,000 to $54,999 | 101 (6.6%) | 39 (3.1%) |
| $55,000 to $64,999 | 189 (12.3%) | 116 (9.3%) |
| $65,000 to $74,999 | 151 (9.8%) | 59 (4.7%) |
| $75,000 to $99,999 | 106 (6.9%) | 69 (5.5%) |
| $100,000+ | 308 (20.0%) | 209 (16.7%) |
| Total | 1,538 (100.0%) | 1,252 (100.0%) |
Earnings by Sex by Educational Attainment in Apple Valley
Average earnings in Apple Valley are $60,332 for men and $37,167 for women, a difference of 38.4%. Men with an educational attainment of graduate degree enjoy the highest average annual earnings of $106,488, while those with high school diploma education earn the least with $47,986. Women with an educational attainment of bachelor's degree earn the most with the average annual earnings of $61,875, while those with high school diploma education have the smallest earnings of $14,345.
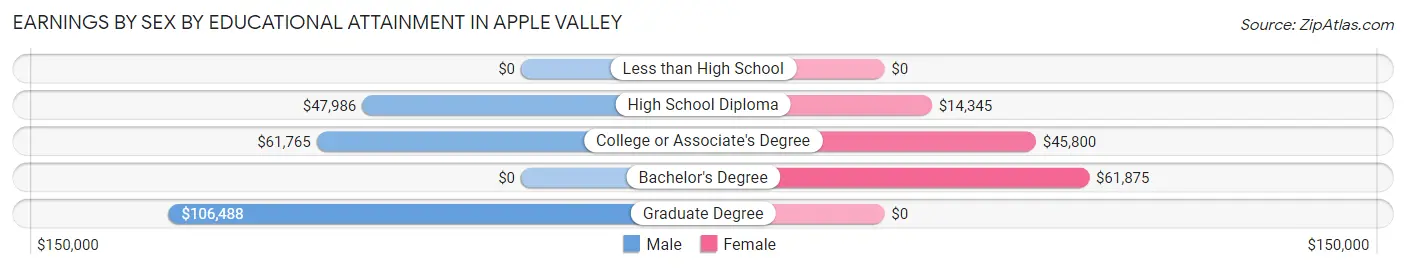
| Educational Attainment | Male Income | Female Income |
| Less than High School | - | - |
| High School Diploma | $47,986 | $14,345 |
| College or Associate's Degree | $61,765 | $45,800 |
| Bachelor's Degree | - | - |
| Graduate Degree | $106,488 | $0 |
| Total | $60,332 | $37,167 |
Family Income in Apple Valley
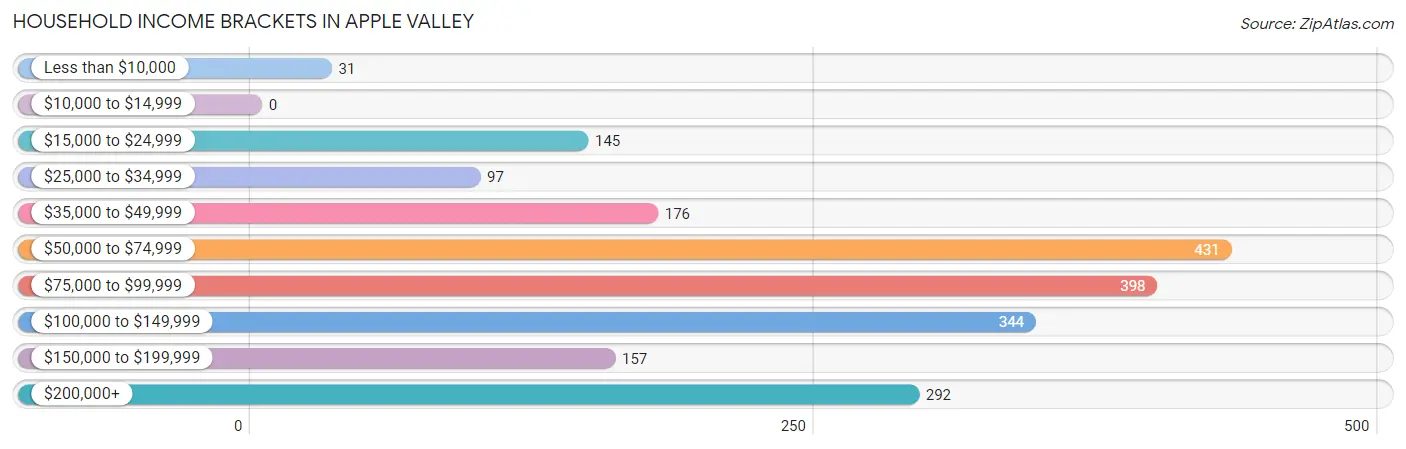
Family Income Brackets in Apple Valley
According to the Apple Valley family income data, there are 362 families falling into the $75,000 to $99,999 income range, which is the most common income bracket and makes up 22.2% of all families.
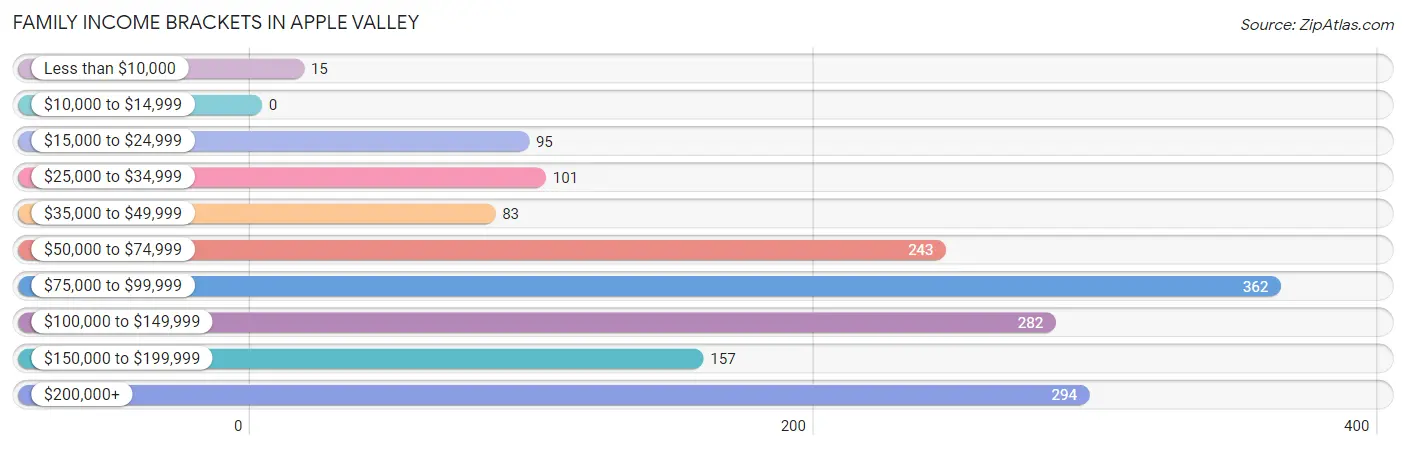
| Income Bracket | # Families | % Families |
| Less than $10,000 | 15 | 0.9% |
| $10,000 to $14,999 | 0 | 0.0% |
| $15,000 to $24,999 | 95 | 5.8% |
| $25,000 to $34,999 | 101 | 6.2% |
| $35,000 to $49,999 | 83 | 5.1% |
| $50,000 to $74,999 | 243 | 14.9% |
| $75,000 to $99,999 | 362 | 22.2% |
| $100,000 to $149,999 | 282 | 17.3% |
| $150,000 to $199,999 | 157 | 9.6% |
| $200,000+ | 294 | 18.0% |
Family Income by Famaliy Size in Apple Valley
5-person families (105 | 6.4%) account for the highest median family income in Apple Valley with $217,269 per family, while 5-person families (105 | 6.4%) have the highest median income of $43,454 per family member.
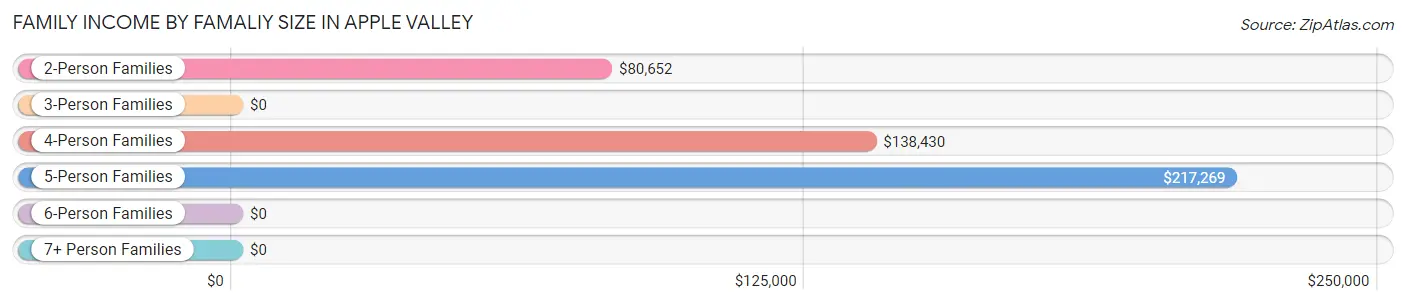
| Income Bracket | # Families | Median Income |
| 2-Person Families | 946 (58.0%) | $80,652 |
| 3-Person Families | 321 (19.7%) | $0 |
| 4-Person Families | 260 (15.9%) | $138,430 |
| 5-Person Families | 105 (6.4%) | $217,269 |
| 6-Person Families | 0 (0.0%) | $0 |
| 7+ Person Families | 0 (0.0%) | $0 |
| Total | 1,632 (100.0%) | $93,947 |
Family Income by Number of Earners in Apple Valley
The median family income in Apple Valley is $93,947, with families comprising 2 earners (673) having the highest median family income of $147,156, while families with no earners (286) have the lowest median family income of $71,250, accounting for 41.2% and 17.5% of families, respectively.
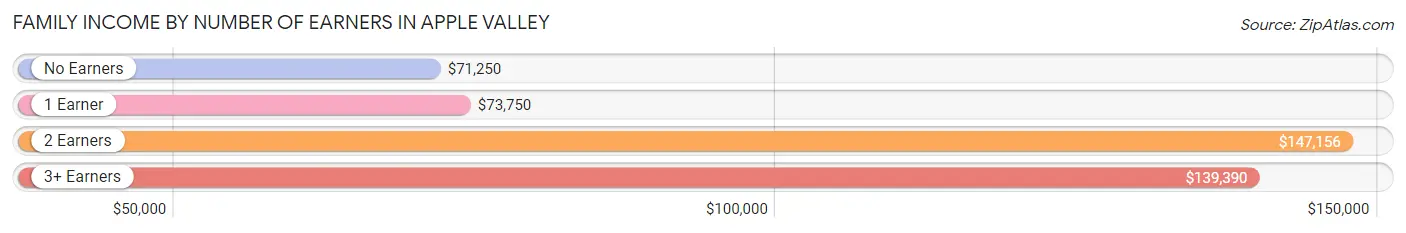
| Number of Earners | # Families | Median Income |
| No Earners | 286 (17.5%) | $71,250 |
| 1 Earner | 524 (32.1%) | $73,750 |
| 2 Earners | 673 (41.2%) | $147,156 |
| 3+ Earners | 149 (9.1%) | $139,390 |
| Total | 1,632 (100.0%) | $93,947 |
Household Income in Apple Valley
Household Income Brackets in Apple Valley
With 431 households falling in the category, the $50,000 to $74,999 income range is the most frequent in Apple Valley, accounting for 20.8% of all households.
| Income Bracket | # Households | % Households |
| Less than $10,000 | 31 | 1.5% |
| $10,000 to $14,999 | 0 | 0.0% |
| $15,000 to $24,999 | 145 | 7.0% |
| $25,000 to $34,999 | 97 | 4.7% |
| $35,000 to $49,999 | 176 | 8.5% |
| $50,000 to $74,999 | 431 | 20.8% |
| $75,000 to $99,999 | 398 | 19.2% |
| $100,000 to $149,999 | 344 | 16.6% |
| $150,000 to $199,999 | 157 | 7.6% |
| $200,000+ | 292 | 14.1% |
Household Income by Householder Age in Apple Valley
The median household income in Apple Valley is $82,175, with the highest median household income of $93,125 found in the 45 to 64 years age bracket for the primary householder. A total of 953 households (46.0%) fall into this category.
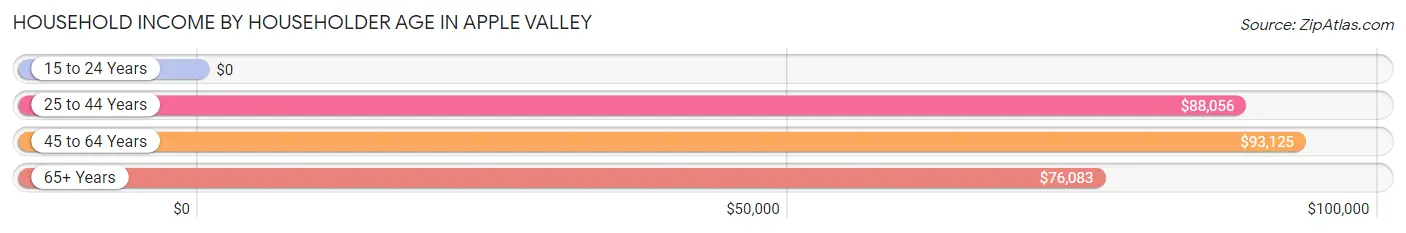
| Income Bracket | # Households | Median Income |
| 15 to 24 Years | 0 (0.0%) | $0 |
| 25 to 44 Years | 538 (26.0%) | $88,056 |
| 45 to 64 Years | 953 (46.0%) | $93,125 |
| 65+ Years | 580 (28.0%) | $76,083 |
| Total | 2,071 (100.0%) | $82,175 |
Poverty in Apple Valley
Income Below Poverty by Sex and Age in Apple Valley
With 5.2% poverty level for males and 4.8% for females among the residents of Apple Valley, 25 to 34 year old males and 55 to 64 year old females are the most vulnerable to poverty, with 70 males (43.2%) and 61 females (11.4%) in their respective age groups living below the poverty level.
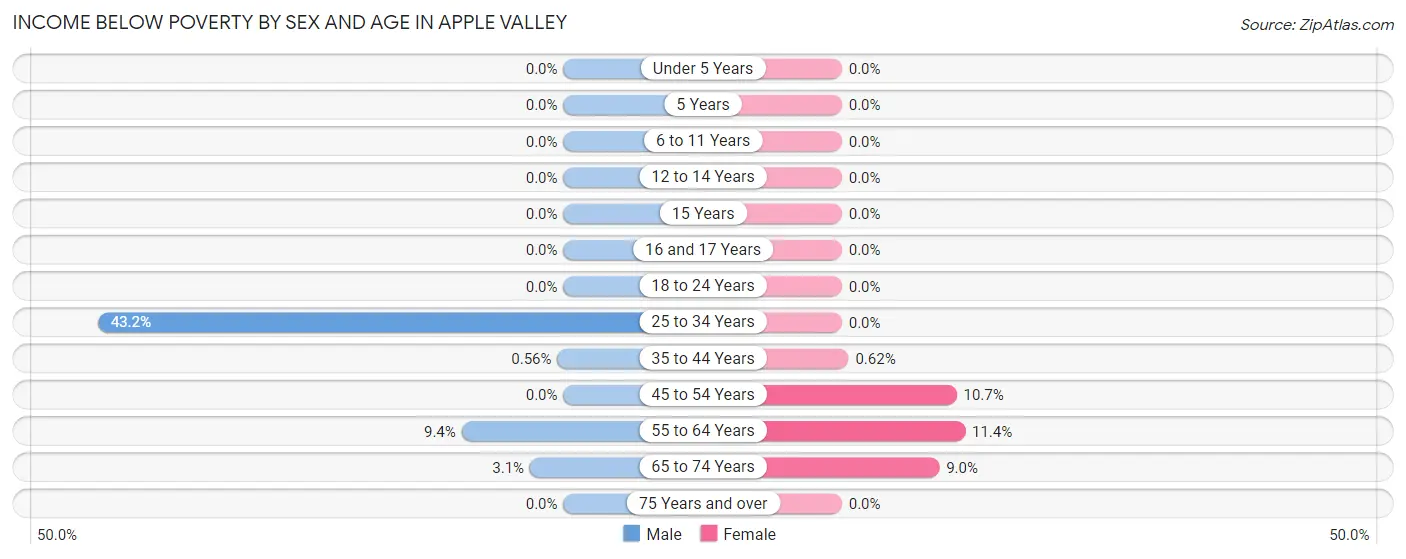
| Age Bracket | Male | Female |
| Under 5 Years | 0 (0.0%) | 0 (0.0%) |
| 5 Years | 0 (0.0%) | 0 (0.0%) |
| 6 to 11 Years | 0 (0.0%) | 0 (0.0%) |
| 12 to 14 Years | 0 (0.0%) | 0 (0.0%) |
| 15 Years | 0 (0.0%) | 0 (0.0%) |
| 16 and 17 Years | 0 (0.0%) | 0 (0.0%) |
| 18 to 24 Years | 0 (0.0%) | 0 (0.0%) |
| 25 to 34 Years | 70 (43.2%) | 0 (0.0%) |
| 35 to 44 Years | 2 (0.6%) | 2 (0.6%) |
| 45 to 54 Years | 0 (0.0%) | 28 (10.6%) |
| 55 to 64 Years | 51 (9.4%) | 61 (11.4%) |
| 65 to 74 Years | 14 (3.1%) | 32 (9.0%) |
| 75 Years and over | 0 (0.0%) | 0 (0.0%) |
| Total | 137 (5.2%) | 123 (4.8%) |
Income Above Poverty by Sex and Age in Apple Valley
According to the poverty statistics in Apple Valley, males aged under 5 years and females aged under 5 years are the age groups that are most secure financially, with 100.0% of males and 100.0% of females in these age groups living above the poverty line.
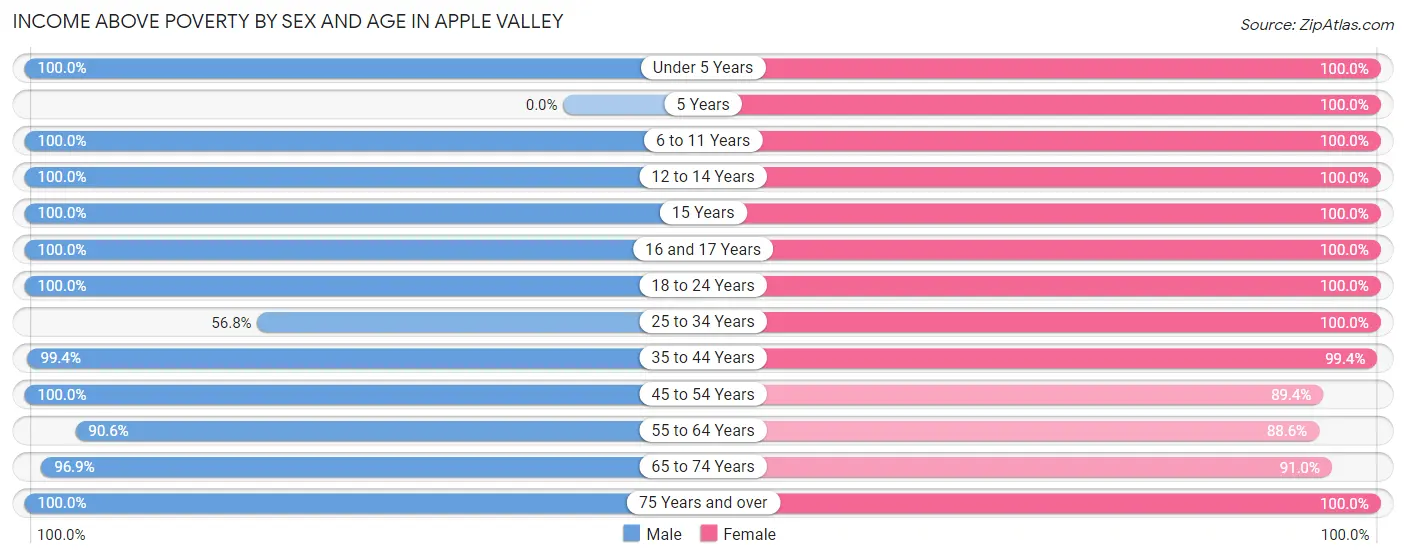
| Age Bracket | Male | Female |
| Under 5 Years | 81 (100.0%) | 135 (100.0%) |
| 5 Years | 0 (0.0%) | 9 (100.0%) |
| 6 to 11 Years | 194 (100.0%) | 171 (100.0%) |
| 12 to 14 Years | 27 (100.0%) | 179 (100.0%) |
| 15 Years | 65 (100.0%) | 24 (100.0%) |
| 16 and 17 Years | 60 (100.0%) | 35 (100.0%) |
| 18 to 24 Years | 181 (100.0%) | 73 (100.0%) |
| 25 to 34 Years | 92 (56.8%) | 240 (100.0%) |
| 35 to 44 Years | 356 (99.4%) | 322 (99.4%) |
| 45 to 54 Years | 311 (100.0%) | 235 (89.3%) |
| 55 to 64 Years | 489 (90.6%) | 472 (88.6%) |
| 65 to 74 Years | 438 (96.9%) | 322 (91.0%) |
| 75 Years and over | 201 (100.0%) | 245 (100.0%) |
| Total | 2,495 (94.8%) | 2,462 (95.2%) |
Income Below Poverty Among Married-Couple Families in Apple Valley
The poverty statistics for married-couple families in Apple Valley show that 4.1% or 62 of the total 1,513 families live below the poverty line. Families with no children have the highest poverty rate of 6.0%, comprising of 62 families. On the other hand, families with 1 or 2 children have the lowest poverty rate of 0.0%, which includes 0 families.
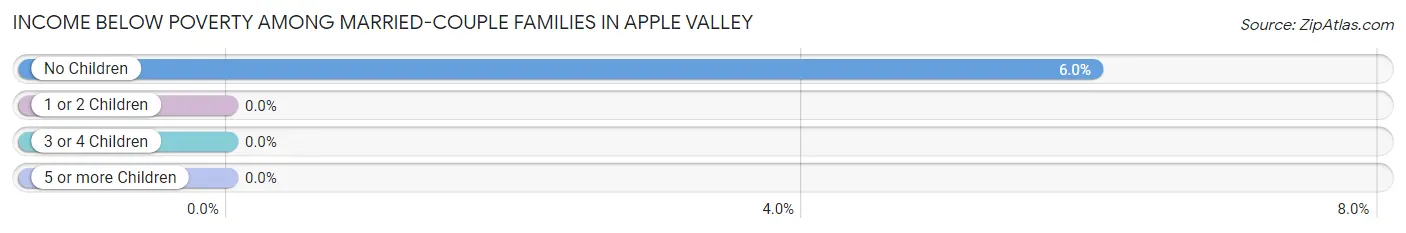
| Children | Above Poverty | Below Poverty |
| No Children | 968 (94.0%) | 62 (6.0%) |
| 1 or 2 Children | 421 (100.0%) | 0 (0.0%) |
| 3 or 4 Children | 62 (100.0%) | 0 (0.0%) |
| 5 or more Children | 0 (0.0%) | 0 (0.0%) |
| Total | 1,451 (95.9%) | 62 (4.1%) |
Income Below Poverty Among Single-Parent Households in Apple Valley
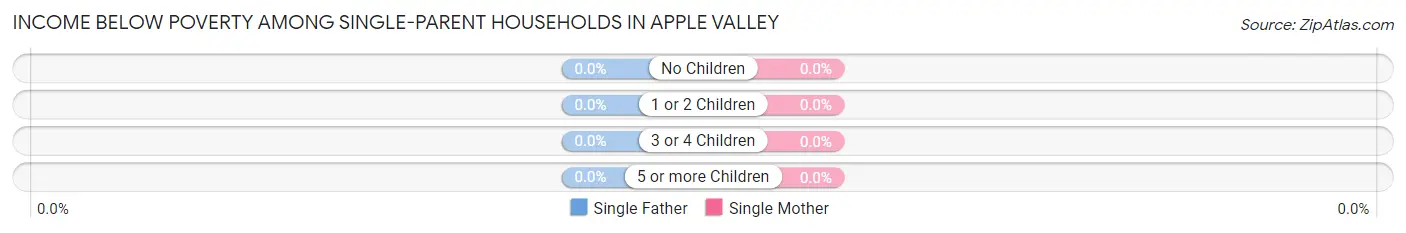
| Children | Single Father | Single Mother |
| No Children | 0 (0.0%) | 0 (0.0%) |
| 1 or 2 Children | 0 (0.0%) | 0 (0.0%) |
| 3 or 4 Children | 0 (0.0%) | 0 (0.0%) |
| 5 or more Children | 0 (0.0%) | 0 (0.0%) |
| Total | 0 (0.0%) | 0 (0.0%) |
Income Below Poverty Among Married-Couple vs Single-Parent Households in Apple Valley
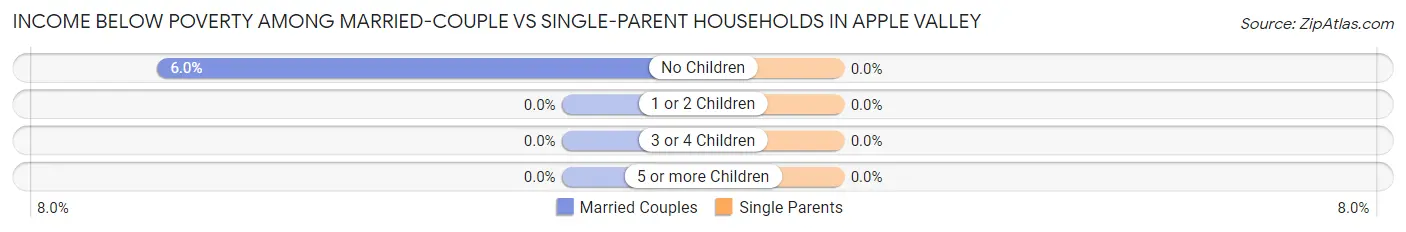
| Children | Married-Couple Families | Single-Parent Households |
| No Children | 62 (6.0%) | 0 (0.0%) |
| 1 or 2 Children | 0 (0.0%) | 0 (0.0%) |
| 3 or 4 Children | 0 (0.0%) | 0 (0.0%) |
| 5 or more Children | 0 (0.0%) | 0 (0.0%) |
| Total | 62 (4.1%) | 0 (0.0%) |
Employment Characteristics in Apple Valley
Employment by Class of Employer in Apple Valley
Among the 2,413 employed individuals in Apple Valley, private company employees (1,498 | 62.1%), local government employees (284 | 11.8%), and not-for-profit organizations (197 | 8.2%) make up the most common classes of employment.
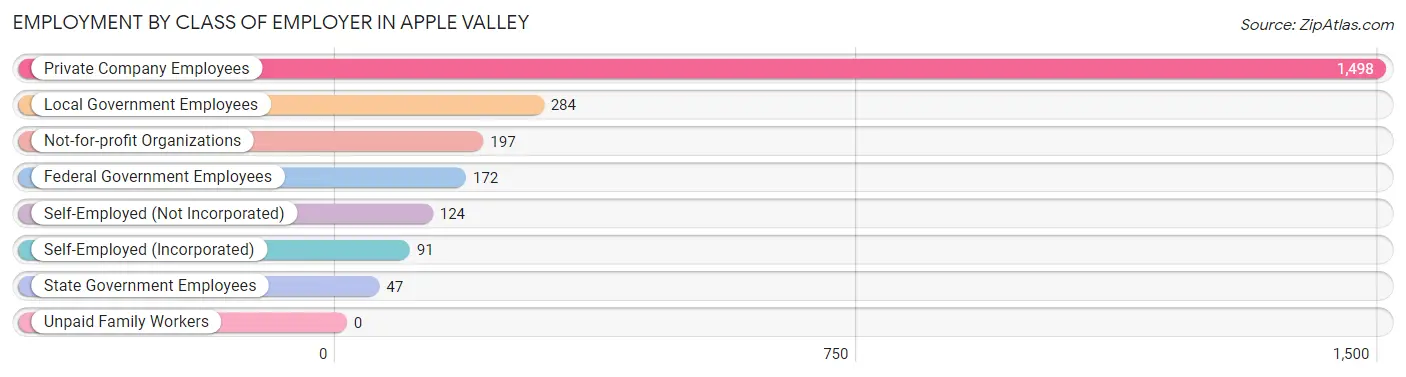
| Employer Class | # Employees | % Employees |
| Private Company Employees | 1,498 | 62.1% |
| Self-Employed (Incorporated) | 91 | 3.8% |
| Self-Employed (Not Incorporated) | 124 | 5.1% |
| Not-for-profit Organizations | 197 | 8.2% |
| Local Government Employees | 284 | 11.8% |
| State Government Employees | 47 | 1.9% |
| Federal Government Employees | 172 | 7.1% |
| Unpaid Family Workers | 0 | 0.0% |
| Total | 2,413 | 100.0% |
Employment Status by Age in Apple Valley
According to the labor force statistics for Apple Valley, out of the total population over 16 years of age (4,332), 61.7% or 2,673 individuals are in the labor force, with 7.6% or 203 of them unemployed. The age group with the highest labor force participation rate is 20 to 24 years, with 100.0% or 196 individuals in the labor force. Within the labor force, the 30 to 34 years age range has the highest percentage of unemployed individuals, with 41.2% or 70 of them being unemployed.
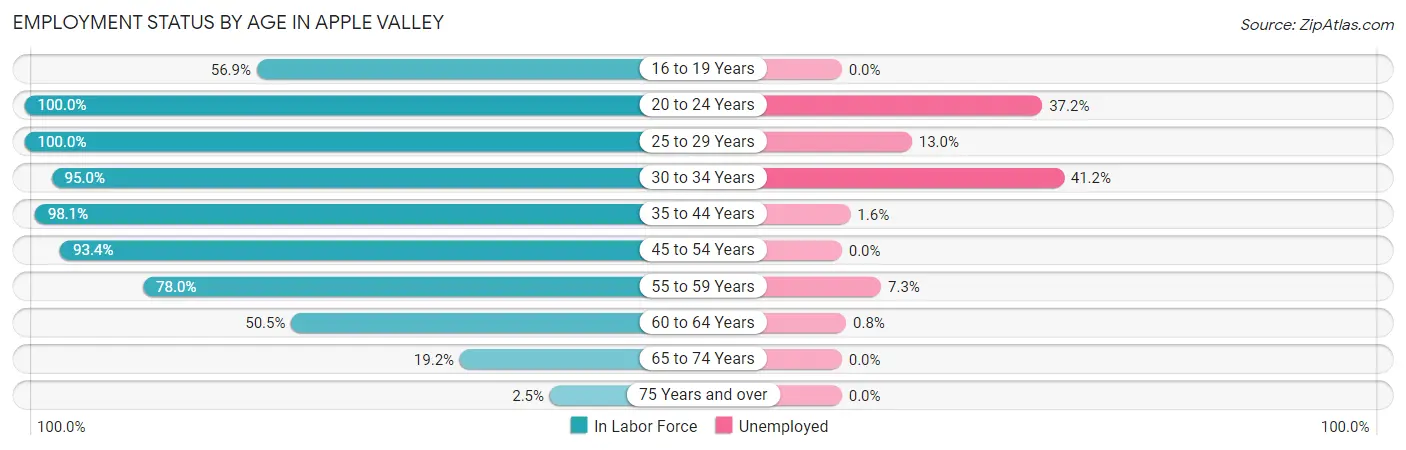
| Age Bracket | In Labor Force | Unemployed |
| 16 to 19 Years | 87 (56.9%) | 0 (0.0%) |
| 20 to 24 Years | 196 (100.0%) | 73 (37.2%) |
| 25 to 29 Years | 223 (100.0%) | 29 (13.0%) |
| 30 to 34 Years | 170 (95.0%) | 70 (41.2%) |
| 35 to 44 Years | 669 (98.1%) | 11 (1.6%) |
| 45 to 54 Years | 536 (93.4%) | 0 (0.0%) |
| 55 to 59 Years | 234 (78.0%) | 17 (7.3%) |
| 60 to 64 Years | 390 (50.5%) | 3 (0.8%) |
| 65 to 74 Years | 155 (19.2%) | 0 (0.0%) |
| 75 Years and over | 11 (2.5%) | 0 (0.0%) |
| Total | 2,673 (61.7%) | 203 (7.6%) |
Employment Status by Educational Attainment in Apple Valley
According to labor force statistics for Apple Valley, 81.4% of individuals (2,223) out of the total population between 25 and 64 years of age (2,731) are in the labor force, with 5.9% or 131 of them being unemployed. The group with the highest labor force participation rate are those with the educational attainment of bachelor's degree or higher, with 88.5% or 726 individuals in the labor force. Within the labor force, individuals with college / associate degree education have the highest percentage of unemployment, with 12.1% or 110 of them being unemployed.
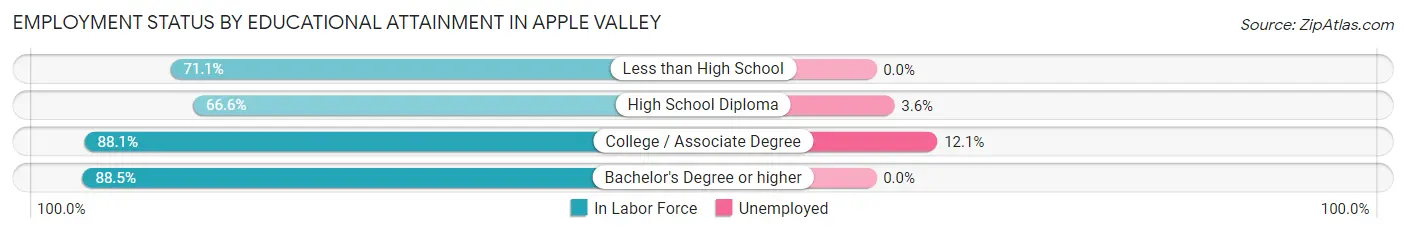
| Educational Attainment | In Labor Force | Unemployed |
| Less than High School | 32 (71.1%) | 0 (0.0%) |
| High School Diploma | 558 (66.6%) | 30 (3.6%) |
| College / Associate Degree | 906 (88.1%) | 124 (12.1%) |
| Bachelor's Degree or higher | 726 (88.5%) | 0 (0.0%) |
| Total | 2,223 (81.4%) | 161 (5.9%) |
Employment Occupations by Sex in Apple Valley
Management, Business, Science and Arts Occupations
The most common Management, Business, Science and Arts occupations in Apple Valley are Health Diagnosing & Treating (318 | 12.9%), Community & Social Service (283 | 11.5%), Health Technologists (251 | 10.2%), Education Instruction & Library (221 | 8.9%), and Management (203 | 8.2%).
Management, Business, Science and Arts Occupations by Sex
Within the Management, Business, Science and Arts occupations in Apple Valley, the most male-oriented occupations are Computers, Engineering & Science (100.0%), Architecture & Engineering (100.0%), and Arts, Media & Entertainment (100.0%), while the most female-oriented occupations are Health Technologists (70.5%), Health Diagnosing & Treating (61.3%), and Education, Arts & Media (61.2%).
| Occupation | Male | Female |
| Management | 165 (81.3%) | 38 (18.7%) |
| Business & Financial | 62 (40.5%) | 91 (59.5%) |
| Computers, Engineering & Science | 27 (100.0%) | 0 (0.0%) |
| Computers & Mathematics | 0 (0.0%) | 0 (0.0%) |
| Architecture & Engineering | 27 (100.0%) | 0 (0.0%) |
| Life, Physical & Social Science | 0 (0.0%) | 0 (0.0%) |
| Community & Social Service | 137 (48.4%) | 146 (51.6%) |
| Education, Arts & Media | 19 (38.8%) | 30 (61.2%) |
| Legal Services & Support | 0 (0.0%) | 0 (0.0%) |
| Education Instruction & Library | 105 (47.5%) | 116 (52.5%) |
| Arts, Media & Entertainment | 13 (100.0%) | 0 (0.0%) |
| Health Diagnosing & Treating | 123 (38.7%) | 195 (61.3%) |
| Health Technologists | 74 (29.5%) | 177 (70.5%) |
| Total (Category) | 514 (52.2%) | 470 (47.8%) |
| Total (Overall) | 1,410 (57.1%) | 1,058 (42.9%) |
Services Occupations
The most common Services occupations in Apple Valley are Food Preparation & Serving (129 | 5.2%), Healthcare Support (49 | 2.0%), Personal Care & Service (44 | 1.8%), Security & Protection (24 | 1.0%), and Law Enforcement (24 | 1.0%).
Services Occupations by Sex
Within the Services occupations in Apple Valley, the most male-oriented occupations are Security & Protection (100.0%), Law Enforcement (100.0%), and Food Preparation & Serving (17.1%), while the most female-oriented occupations are Healthcare Support (100.0%), Personal Care & Service (100.0%), and Food Preparation & Serving (83.0%).
| Occupation | Male | Female |
| Healthcare Support | 0 (0.0%) | 49 (100.0%) |
| Security & Protection | 24 (100.0%) | 0 (0.0%) |
| Firefighting & Prevention | 0 (0.0%) | 0 (0.0%) |
| Law Enforcement | 24 (100.0%) | 0 (0.0%) |
| Food Preparation & Serving | 22 (17.1%) | 107 (83.0%) |
| Cleaning & Maintenance | 0 (0.0%) | 0 (0.0%) |
| Personal Care & Service | 0 (0.0%) | 44 (100.0%) |
| Total (Category) | 46 (18.7%) | 200 (81.3%) |
| Total (Overall) | 1,410 (57.1%) | 1,058 (42.9%) |
Sales and Office Occupations
The most common Sales and Office occupations in Apple Valley are Office & Administration (353 | 14.3%), and Sales & Related (193 | 7.8%).
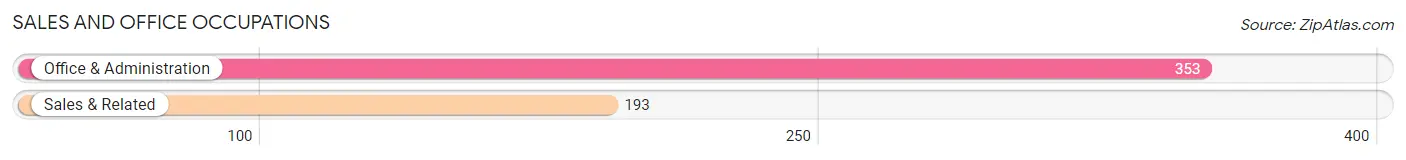
Sales and Office Occupations by Sex
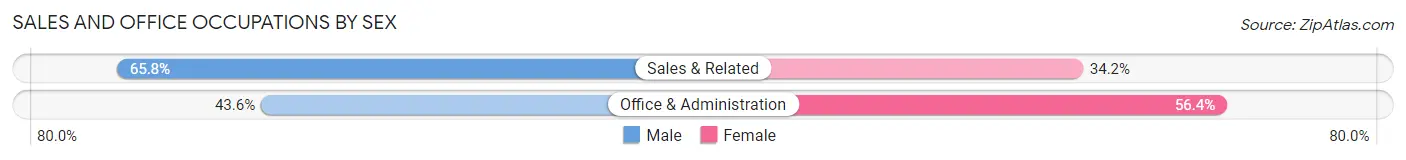
| Occupation | Male | Female |
| Sales & Related | 127 (65.8%) | 66 (34.2%) |
| Office & Administration | 154 (43.6%) | 199 (56.4%) |
| Total (Category) | 281 (51.5%) | 265 (48.5%) |
| Total (Overall) | 1,410 (57.1%) | 1,058 (42.9%) |
Natural Resources, Construction and Maintenance Occupations
The most common Natural Resources, Construction and Maintenance occupations in Apple Valley are Construction & Extraction (176 | 7.1%), and Installation, Maintenance & Repair (60 | 2.4%).
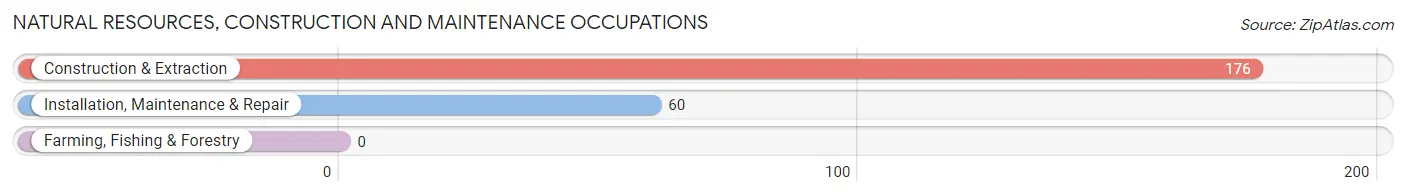
Natural Resources, Construction and Maintenance Occupations by Sex
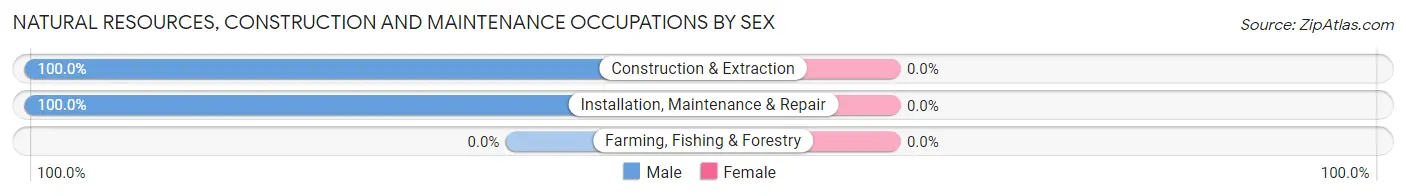
| Occupation | Male | Female |
| Farming, Fishing & Forestry | 0 (0.0%) | 0 (0.0%) |
| Construction & Extraction | 176 (100.0%) | 0 (0.0%) |
| Installation, Maintenance & Repair | 60 (100.0%) | 0 (0.0%) |
| Total (Category) | 236 (100.0%) | 0 (0.0%) |
| Total (Overall) | 1,410 (57.1%) | 1,058 (42.9%) |
Production, Transportation and Moving Occupations
The most common Production, Transportation and Moving occupations in Apple Valley are Production (290 | 11.7%), Transportation (88 | 3.6%), and Material Moving (78 | 3.2%).
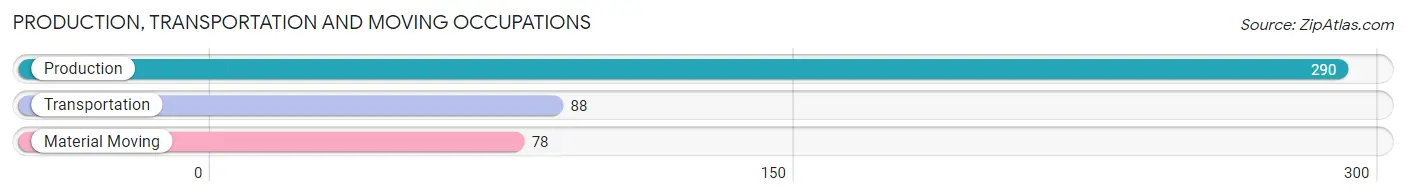
Production, Transportation and Moving Occupations by Sex
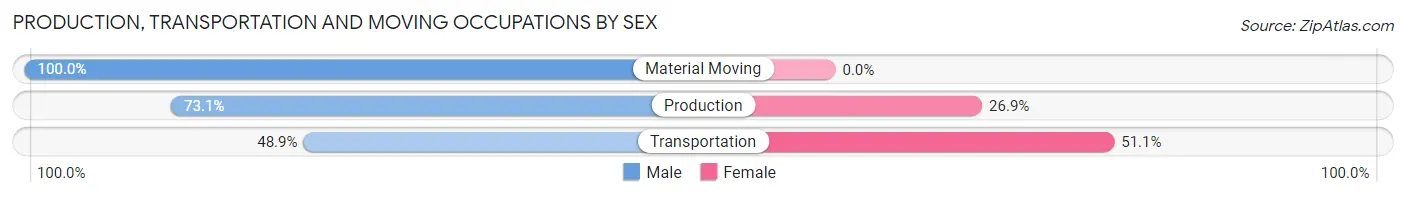
| Occupation | Male | Female |
| Production | 212 (73.1%) | 78 (26.9%) |
| Transportation | 43 (48.9%) | 45 (51.1%) |
| Material Moving | 78 (100.0%) | 0 (0.0%) |
| Total (Category) | 333 (73.0%) | 123 (27.0%) |
| Total (Overall) | 1,410 (57.1%) | 1,058 (42.9%) |
Employment Industries by Sex in Apple Valley
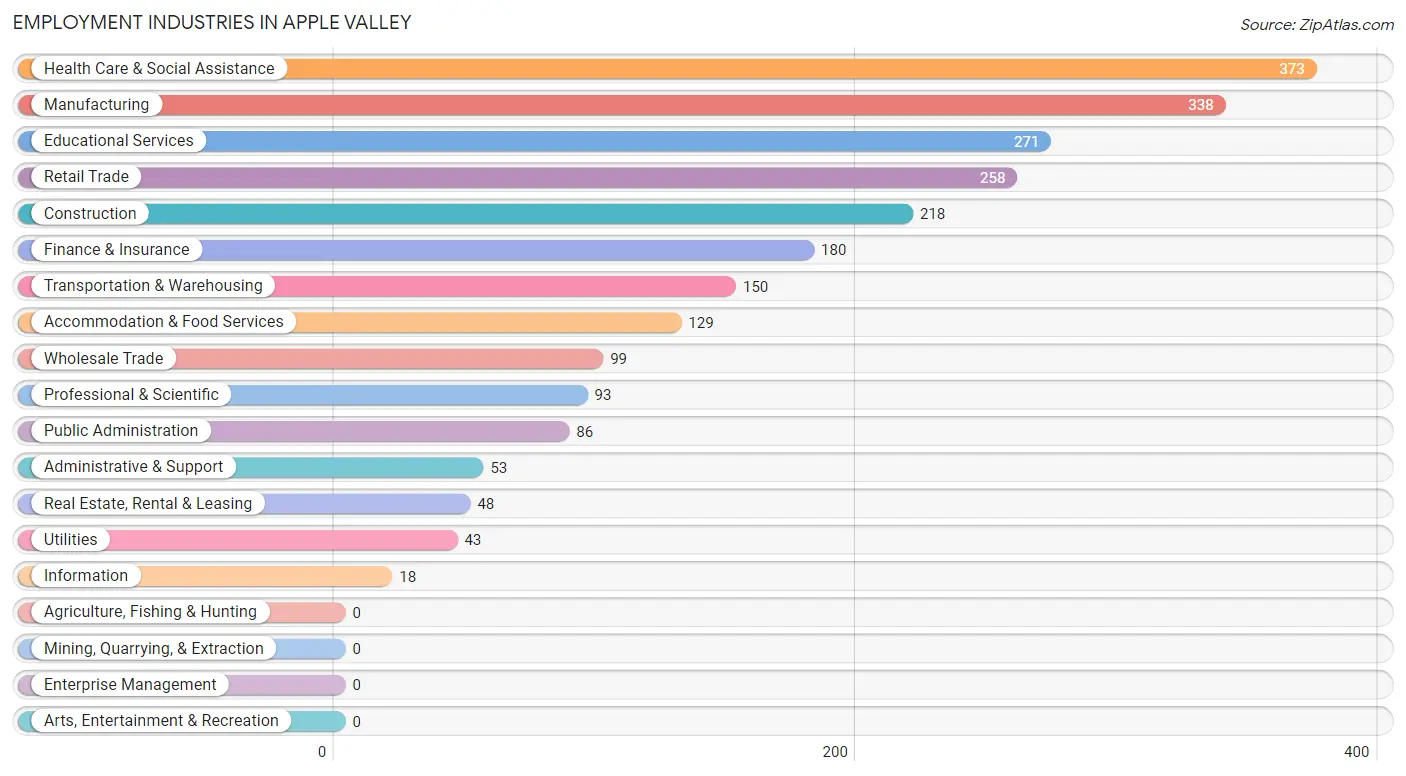
Employment Industries in Apple Valley
The major employment industries in Apple Valley include Health Care & Social Assistance (373 | 15.1%), Manufacturing (338 | 13.7%), Educational Services (271 | 11.0%), Retail Trade (258 | 10.4%), and Construction (218 | 8.8%).
Employment Industries by Sex in Apple Valley
The Apple Valley industries that see more men than women are Wholesale Trade (100.0%), Construction (94.0%), and Manufacturing (88.2%), whereas the industries that tend to have a higher number of women are Information (100.0%), Real Estate, Rental & Leasing (100.0%), and Professional & Scientific (100.0%).
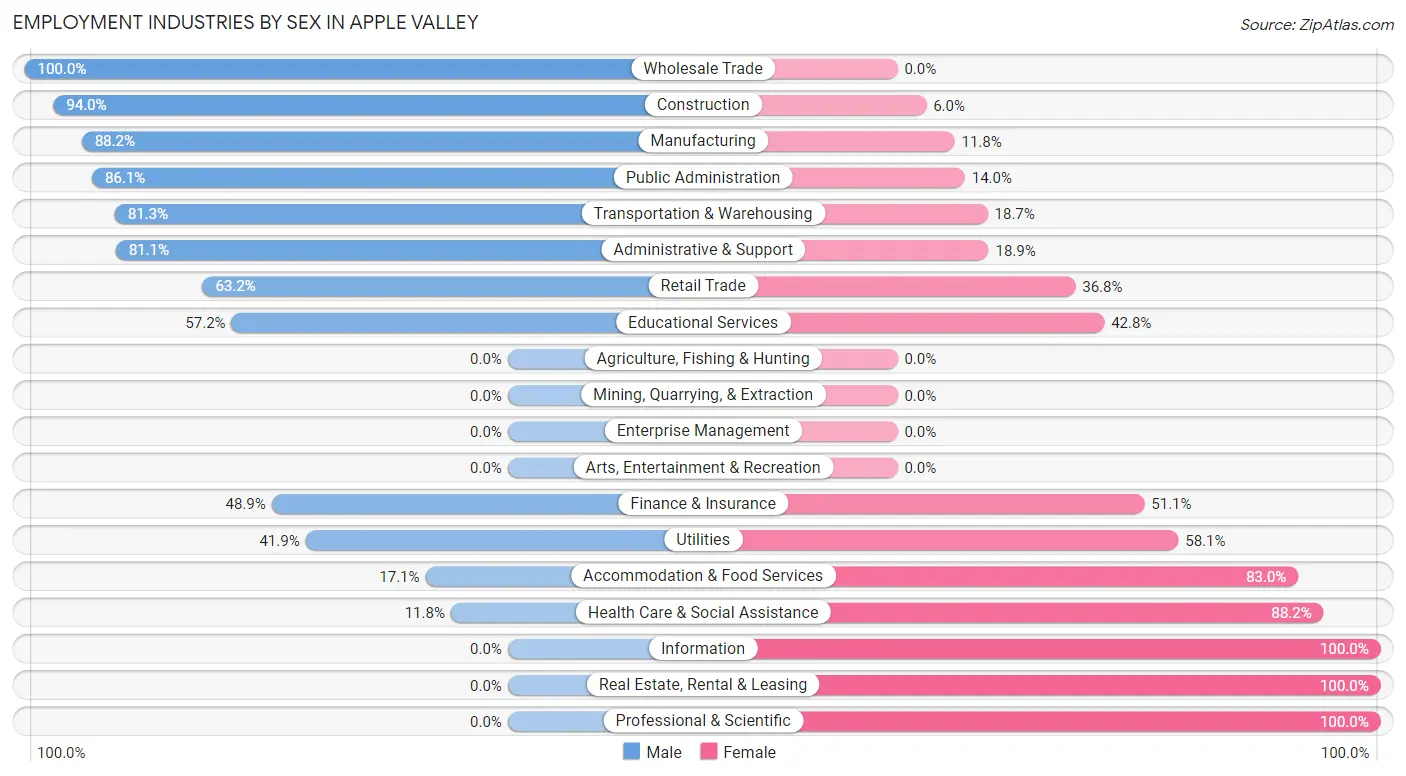
| Industry | Male | Female |
| Agriculture, Fishing & Hunting | 0 (0.0%) | 0 (0.0%) |
| Mining, Quarrying, & Extraction | 0 (0.0%) | 0 (0.0%) |
| Construction | 205 (94.0%) | 13 (6.0%) |
| Manufacturing | 298 (88.2%) | 40 (11.8%) |
| Wholesale Trade | 99 (100.0%) | 0 (0.0%) |
| Retail Trade | 163 (63.2%) | 95 (36.8%) |
| Transportation & Warehousing | 122 (81.3%) | 28 (18.7%) |
| Utilities | 18 (41.9%) | 25 (58.1%) |
| Information | 0 (0.0%) | 18 (100.0%) |
| Finance & Insurance | 88 (48.9%) | 92 (51.1%) |
| Real Estate, Rental & Leasing | 0 (0.0%) | 48 (100.0%) |
| Professional & Scientific | 0 (0.0%) | 93 (100.0%) |
| Enterprise Management | 0 (0.0%) | 0 (0.0%) |
| Administrative & Support | 43 (81.1%) | 10 (18.9%) |
| Educational Services | 155 (57.2%) | 116 (42.8%) |
| Health Care & Social Assistance | 44 (11.8%) | 329 (88.2%) |
| Arts, Entertainment & Recreation | 0 (0.0%) | 0 (0.0%) |
| Accommodation & Food Services | 22 (17.1%) | 107 (83.0%) |
| Public Administration | 74 (86.1%) | 12 (14.0%) |
| Total | 1,410 (57.1%) | 1,058 (42.9%) |
Education in Apple Valley
School Enrollment in Apple Valley
The most common levels of schooling among the 895 students in Apple Valley are high school (283 | 31.6%), middle school (267 | 29.8%), and elementary school (220 | 24.6%).
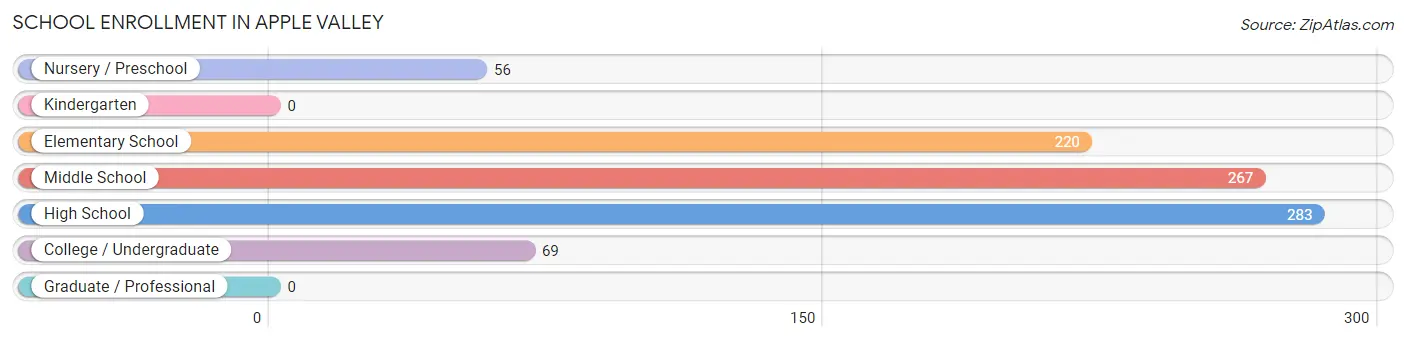
| School Level | # Students | % Students |
| Nursery / Preschool | 56 | 6.3% |
| Kindergarten | 0 | 0.0% |
| Elementary School | 220 | 24.6% |
| Middle School | 267 | 29.8% |
| High School | 283 | 31.6% |
| College / Undergraduate | 69 | 7.7% |
| Graduate / Professional | 0 | 0.0% |
| Total | 895 | 100.0% |
School Enrollment by Age by Funding Source in Apple Valley
Out of a total of 895 students who are enrolled in schools in Apple Valley, 163 (18.2%) attend a private institution, while the remaining 732 (81.8%) are enrolled in public schools. The age group of 20 to 24 year olds has the highest likelihood of being enrolled in private schools, with 31 (100.0% in the age bracket) enrolled. Conversely, the age group of 15 to 17 year olds has the lowest likelihood of being enrolled in a private school, with 184 (100.0% in the age bracket) attending a public institution.
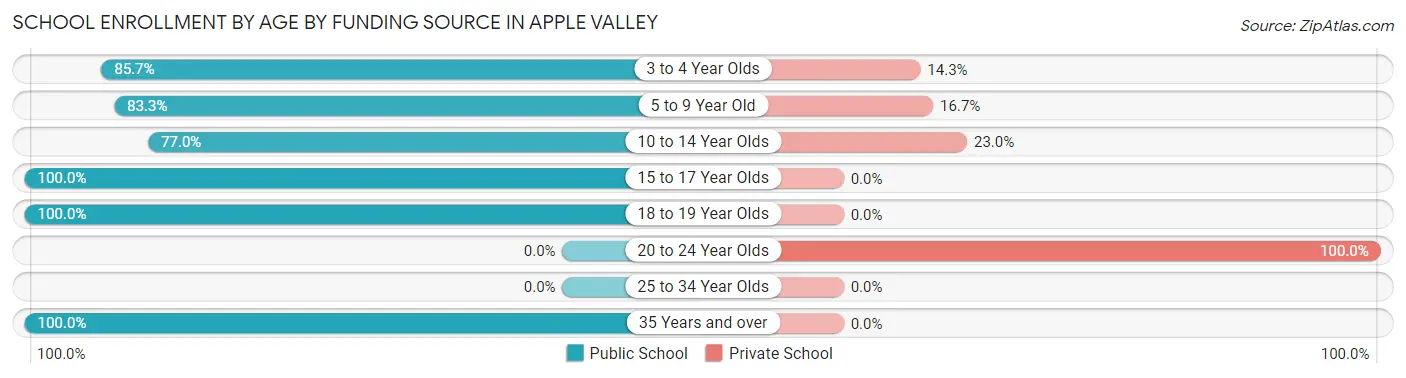
| Age Bracket | Public School | Private School |
| 3 to 4 Year Olds | 48 (85.7%) | 8 (14.3%) |
| 5 to 9 Year Old | 95 (83.3%) | 19 (16.7%) |
| 10 to 14 Year Olds | 352 (77.0%) | 105 (23.0%) |
| 15 to 17 Year Olds | 184 (100.0%) | 0 (0.0%) |
| 18 to 19 Year Olds | 42 (100.0%) | 0 (0.0%) |
| 20 to 24 Year Olds | 0 (0.0%) | 31 (100.0%) |
| 25 to 34 Year Olds | 0 (0.0%) | 0 (0.0%) |
| 35 Years and over | 11 (100.0%) | 0 (0.0%) |
| Total | 732 (81.8%) | 163 (18.2%) |
Educational Attainment by Field of Study in Apple Valley
Business (264 | 19.1%), science & technology (254 | 18.4%), education (190 | 13.7%), engineering (88 | 6.4%), and bio, nature & agricultural (85 | 6.1%) are the most common fields of study among 1,383 individuals in Apple Valley who have obtained a bachelor's degree or higher.
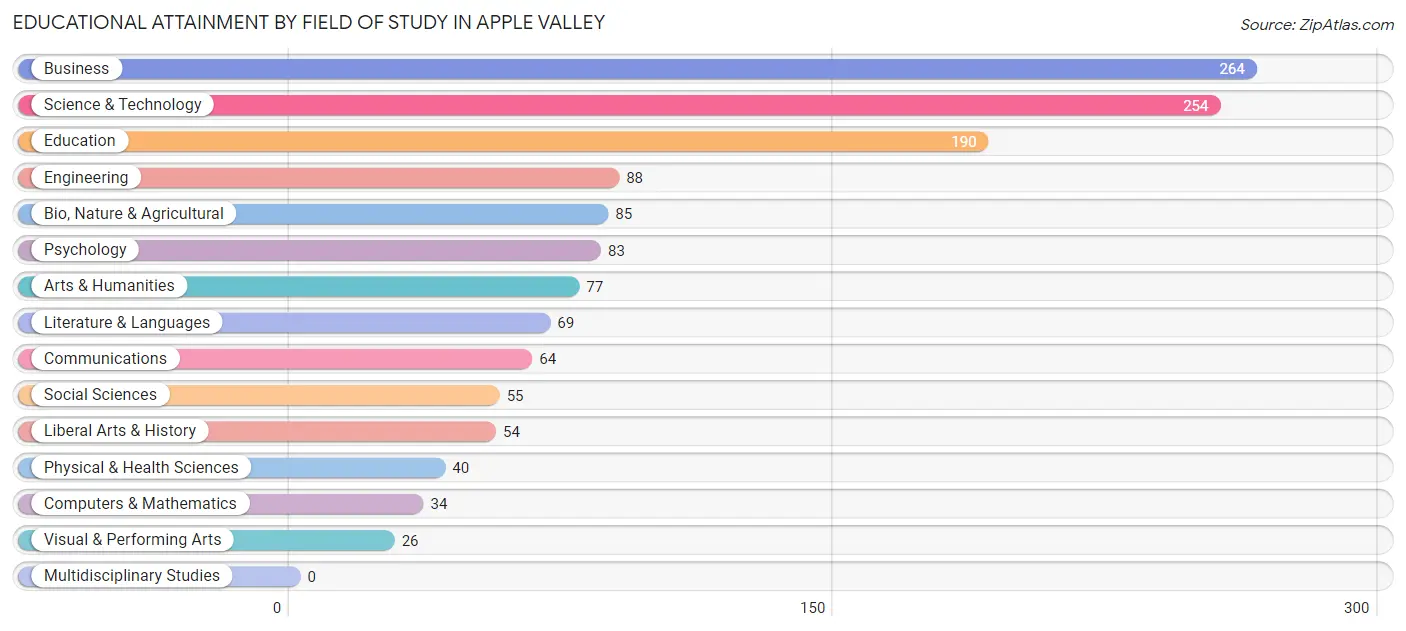
| Field of Study | # Graduates | % Graduates |
| Computers & Mathematics | 34 | 2.5% |
| Bio, Nature & Agricultural | 85 | 6.1% |
| Physical & Health Sciences | 40 | 2.9% |
| Psychology | 83 | 6.0% |
| Social Sciences | 55 | 4.0% |
| Engineering | 88 | 6.4% |
| Multidisciplinary Studies | 0 | 0.0% |
| Science & Technology | 254 | 18.4% |
| Business | 264 | 19.1% |
| Education | 190 | 13.7% |
| Literature & Languages | 69 | 5.0% |
| Liberal Arts & History | 54 | 3.9% |
| Visual & Performing Arts | 26 | 1.9% |
| Communications | 64 | 4.6% |
| Arts & Humanities | 77 | 5.6% |
| Total | 1,383 | 100.0% |
Transportation & Commute in Apple Valley
Vehicle Availability by Sex in Apple Valley
The most prevalent vehicle ownership categories in Apple Valley are males with 3 vehicles (564, accounting for 41.0%) and females with 3 vehicles (359, making up 54.4%).
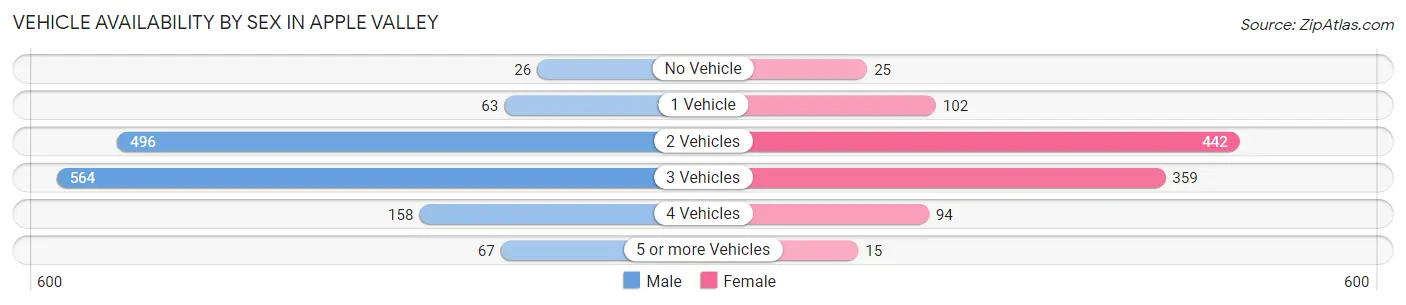
| Vehicles Available | Male | Female |
| No Vehicle | 26 (1.9%) | 25 (2.4%) |
| 1 Vehicle | 63 (4.6%) | 102 (9.8%) |
| 2 Vehicles | 496 (36.1%) | 442 (42.6%) |
| 3 Vehicles | 564 (41.0%) | 359 (34.6%) |
| 4 Vehicles | 158 (11.5%) | 94 (9.1%) |
| 5 or more Vehicles | 67 (4.9%) | 15 (1.5%) |
| Total | 1,374 (100.0%) | 1,037 (100.0%) |
Commute Time in Apple Valley
The most frequently occuring commute durations in Apple Valley are 60 to 89 minutes (380 commuters, 18.3%), 15 to 19 minutes (368 commuters, 17.7%), and 20 to 24 minutes (360 commuters, 17.3%).
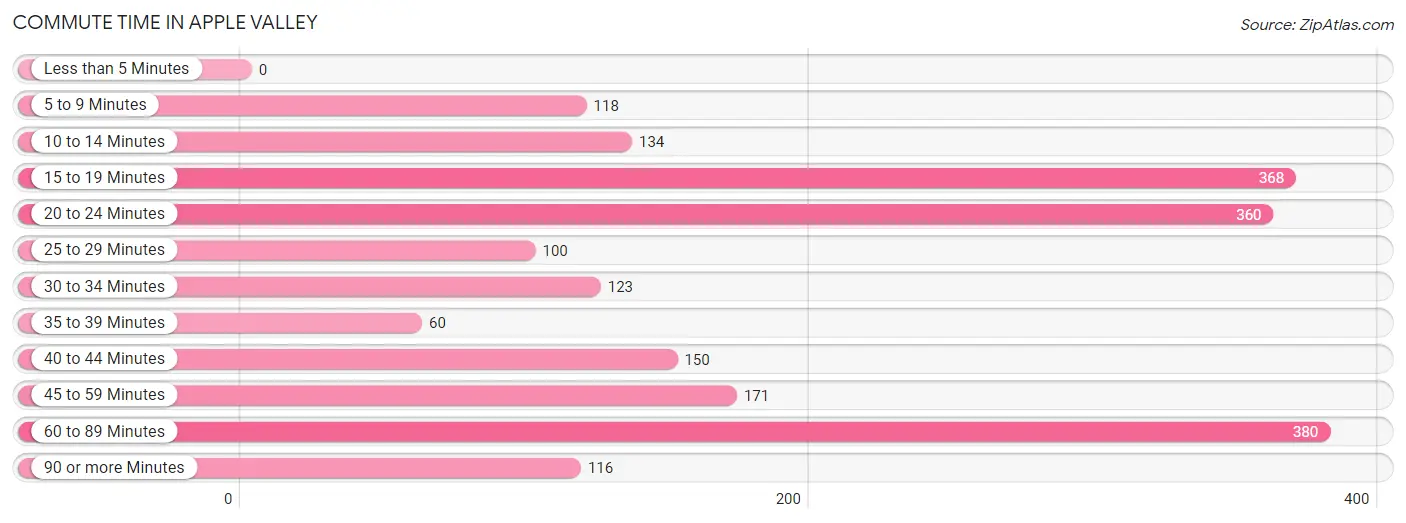
| Commute Time | # Commuters | % Commuters |
| Less than 5 Minutes | 0 | 0.0% |
| 5 to 9 Minutes | 118 | 5.7% |
| 10 to 14 Minutes | 134 | 6.4% |
| 15 to 19 Minutes | 368 | 17.7% |
| 20 to 24 Minutes | 360 | 17.3% |
| 25 to 29 Minutes | 100 | 4.8% |
| 30 to 34 Minutes | 123 | 5.9% |
| 35 to 39 Minutes | 60 | 2.9% |
| 40 to 44 Minutes | 150 | 7.2% |
| 45 to 59 Minutes | 171 | 8.2% |
| 60 to 89 Minutes | 380 | 18.3% |
| 90 or more Minutes | 116 | 5.6% |
Commute Time by Sex in Apple Valley
The most common commute times in Apple Valley are 60 to 89 minutes (263 commuters, 22.1%) for males and 45 to 59 minutes (140 commuters, 15.8%) for females.
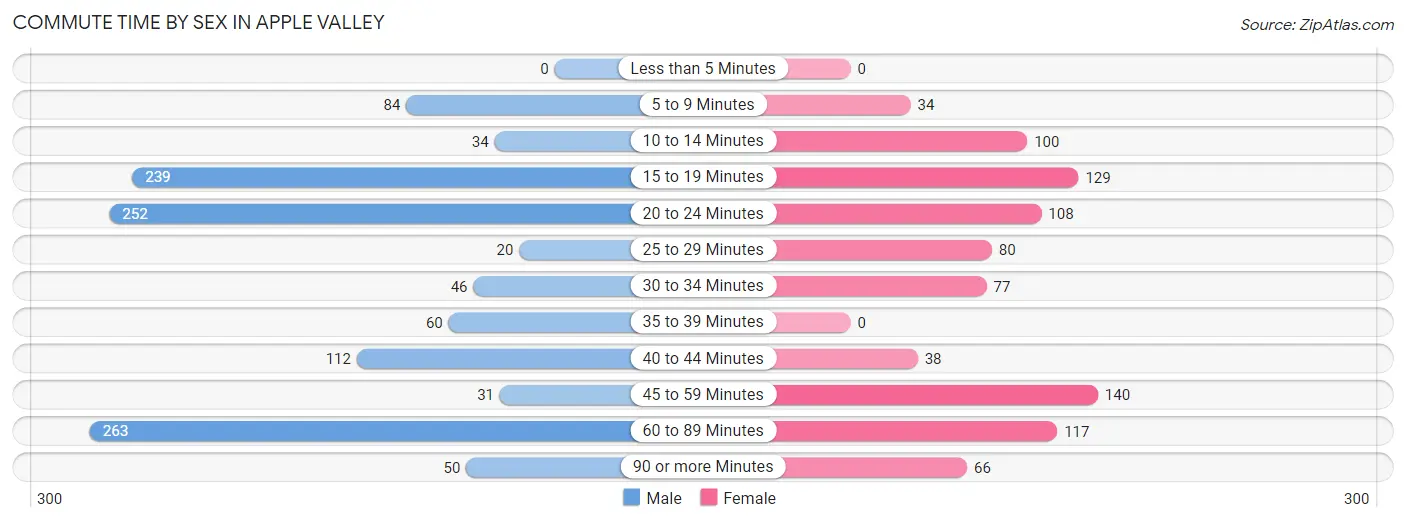
| Commute Time | Male | Female |
| Less than 5 Minutes | 0 (0.0%) | 0 (0.0%) |
| 5 to 9 Minutes | 84 (7.0%) | 34 (3.8%) |
| 10 to 14 Minutes | 34 (2.9%) | 100 (11.3%) |
| 15 to 19 Minutes | 239 (20.1%) | 129 (14.5%) |
| 20 to 24 Minutes | 252 (21.2%) | 108 (12.1%) |
| 25 to 29 Minutes | 20 (1.7%) | 80 (9.0%) |
| 30 to 34 Minutes | 46 (3.9%) | 77 (8.7%) |
| 35 to 39 Minutes | 60 (5.0%) | 0 (0.0%) |
| 40 to 44 Minutes | 112 (9.4%) | 38 (4.3%) |
| 45 to 59 Minutes | 31 (2.6%) | 140 (15.8%) |
| 60 to 89 Minutes | 263 (22.1%) | 117 (13.2%) |
| 90 or more Minutes | 50 (4.2%) | 66 (7.4%) |
Time of Departure to Work by Sex in Apple Valley
The most frequent times of departure to work in Apple Valley are 12:00 AM to 4:59 AM (235, 19.7%) for males and 7:00 AM to 7:29 AM (170, 19.1%) for females.
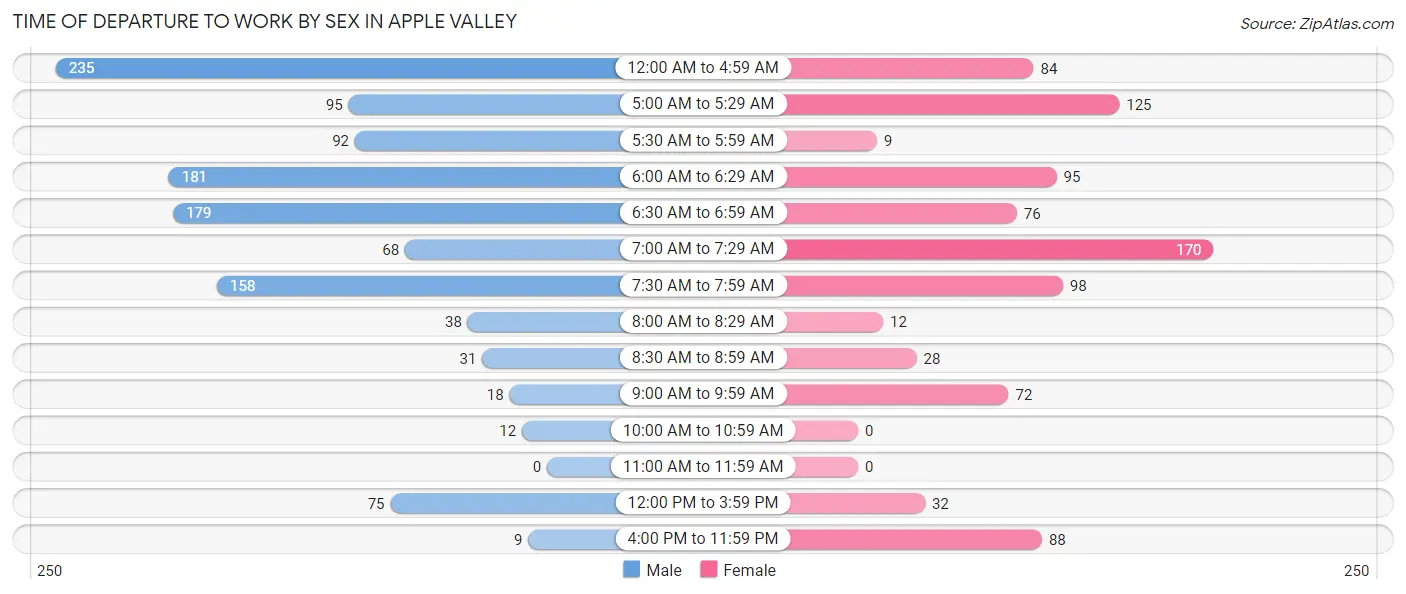
| Time of Departure | Male | Female |
| 12:00 AM to 4:59 AM | 235 (19.7%) | 84 (9.5%) |
| 5:00 AM to 5:29 AM | 95 (8.0%) | 125 (14.1%) |
| 5:30 AM to 5:59 AM | 92 (7.7%) | 9 (1.0%) |
| 6:00 AM to 6:29 AM | 181 (15.2%) | 95 (10.7%) |
| 6:30 AM to 6:59 AM | 179 (15.0%) | 76 (8.6%) |
| 7:00 AM to 7:29 AM | 68 (5.7%) | 170 (19.1%) |
| 7:30 AM to 7:59 AM | 158 (13.3%) | 98 (11.0%) |
| 8:00 AM to 8:29 AM | 38 (3.2%) | 12 (1.3%) |
| 8:30 AM to 8:59 AM | 31 (2.6%) | 28 (3.2%) |
| 9:00 AM to 9:59 AM | 18 (1.5%) | 72 (8.1%) |
| 10:00 AM to 10:59 AM | 12 (1.0%) | 0 (0.0%) |
| 11:00 AM to 11:59 AM | 0 (0.0%) | 0 (0.0%) |
| 12:00 PM to 3:59 PM | 75 (6.3%) | 32 (3.6%) |
| 4:00 PM to 11:59 PM | 9 (0.8%) | 88 (9.9%) |
| Total | 1,191 (100.0%) | 889 (100.0%) |
Housing Occupancy in Apple Valley
Occupancy by Ownership in Apple Valley
Of the total 2,071 dwellings in Apple Valley, owner-occupied units account for 1,852 (89.4%), while renter-occupied units make up 219 (10.6%).
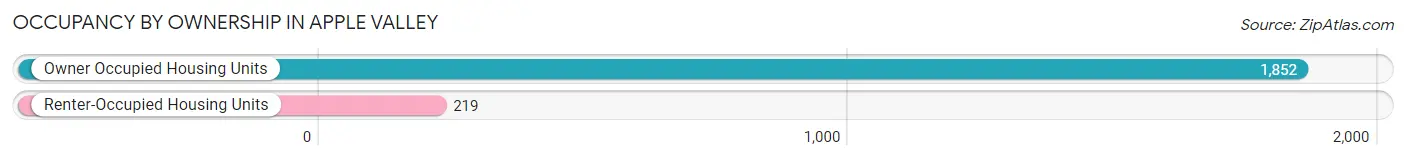
| Occupancy | # Housing Units | % Housing Units |
| Owner Occupied Housing Units | 1,852 | 89.4% |
| Renter-Occupied Housing Units | 219 | 10.6% |
| Total Occupied Housing Units | 2,071 | 100.0% |
Occupancy by Household Size in Apple Valley
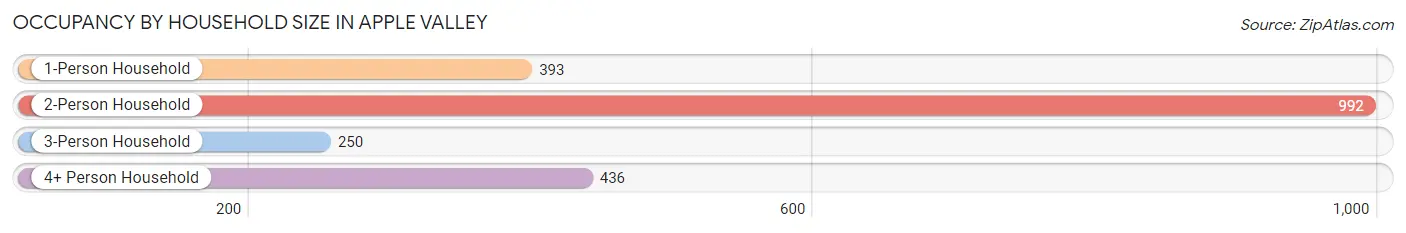
| Household Size | # Housing Units | % Housing Units |
| 1-Person Household | 393 | 19.0% |
| 2-Person Household | 992 | 47.9% |
| 3-Person Household | 250 | 12.1% |
| 4+ Person Household | 436 | 21.0% |
| Total Housing Units | 2,071 | 100.0% |
Occupancy by Ownership by Household Size in Apple Valley
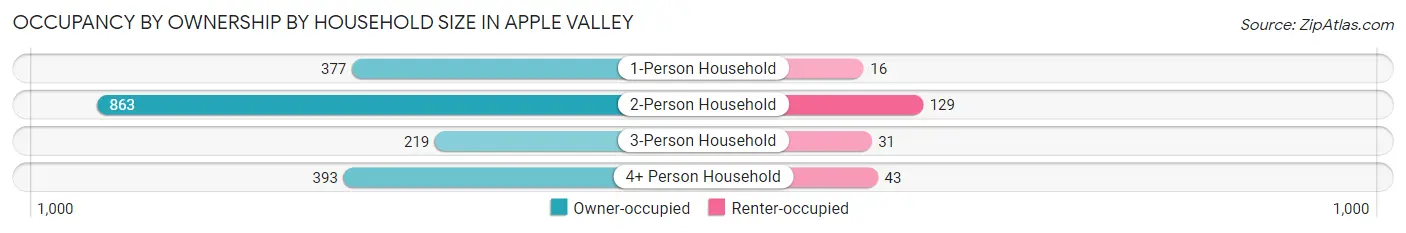
| Household Size | Owner-occupied | Renter-occupied |
| 1-Person Household | 377 (95.9%) | 16 (4.1%) |
| 2-Person Household | 863 (87.0%) | 129 (13.0%) |
| 3-Person Household | 219 (87.6%) | 31 (12.4%) |
| 4+ Person Household | 393 (90.1%) | 43 (9.9%) |
| Total Housing Units | 1,852 (89.4%) | 219 (10.6%) |
Occupancy by Educational Attainment in Apple Valley
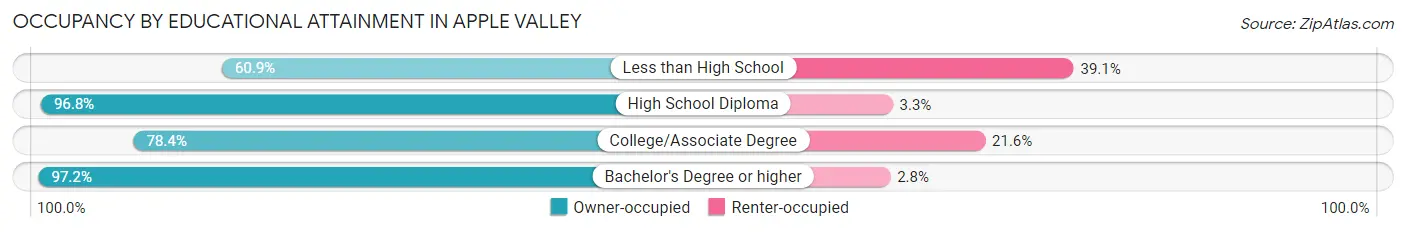
| Household Size | Owner-occupied | Renter-occupied |
| Less than High School | 14 (60.9%) | 9 (39.1%) |
| High School Diploma | 476 (96.8%) | 16 (3.3%) |
| College/Associate Degree | 628 (78.4%) | 173 (21.6%) |
| Bachelor's Degree or higher | 734 (97.2%) | 21 (2.8%) |
Occupancy by Age of Householder in Apple Valley
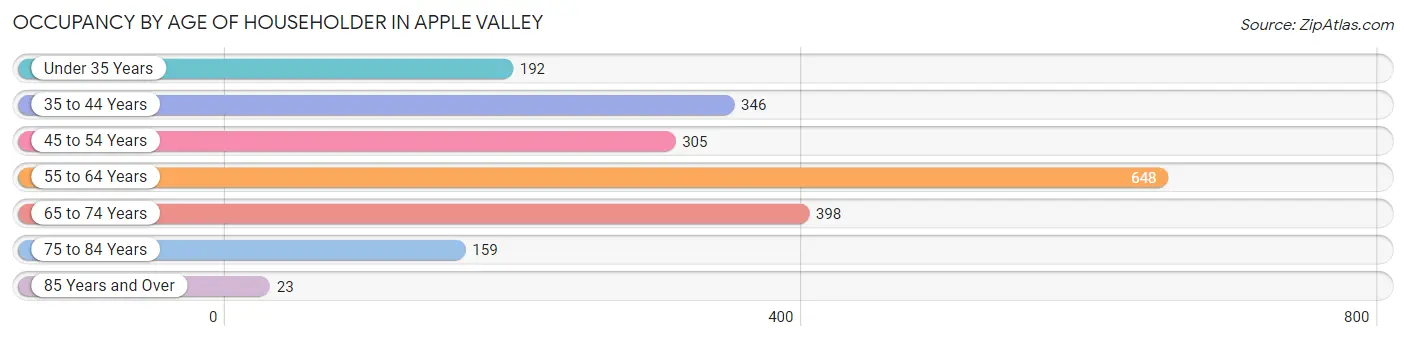
| Age Bracket | # Households | % Households |
| Under 35 Years | 192 | 9.3% |
| 35 to 44 Years | 346 | 16.7% |
| 45 to 54 Years | 305 | 14.7% |
| 55 to 64 Years | 648 | 31.3% |
| 65 to 74 Years | 398 | 19.2% |
| 75 to 84 Years | 159 | 7.7% |
| 85 Years and Over | 23 | 1.1% |
| Total | 2,071 | 100.0% |
Housing Finances in Apple Valley
Median Income by Occupancy in Apple Valley
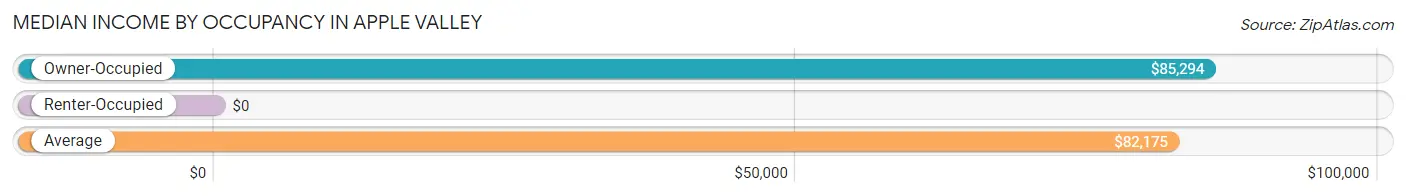
| Occupancy Type | # Households | Median Income |
| Owner-Occupied | 1,852 (89.4%) | $85,294 |
| Renter-Occupied | 219 (10.6%) | $0 |
| Average | 2,071 (100.0%) | $82,175 |
Occupancy by Householder Income Bracket in Apple Valley
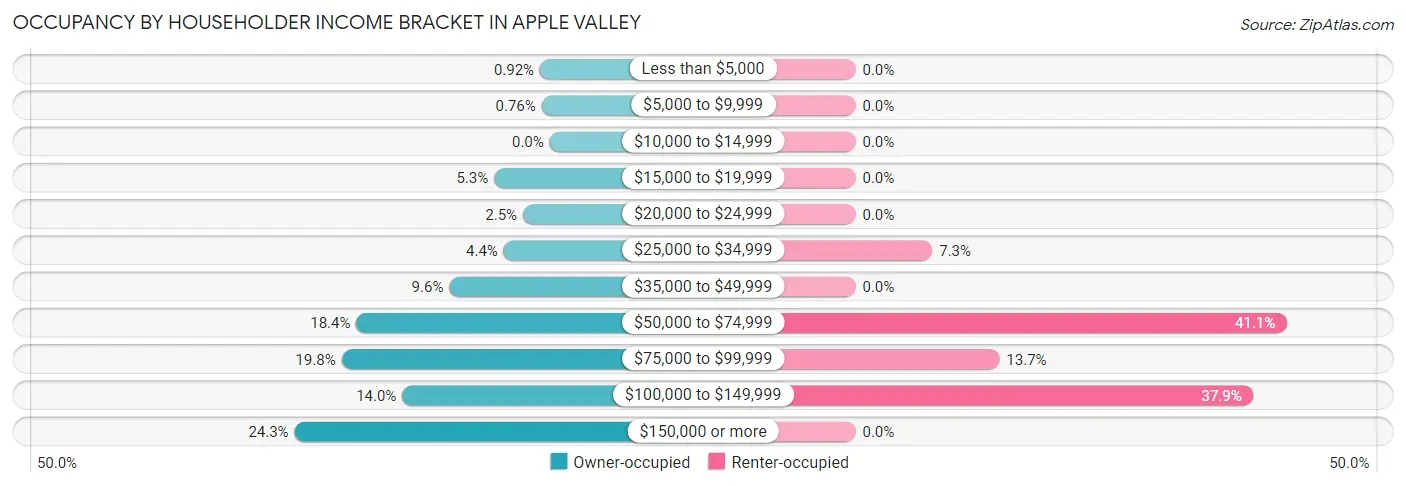
| Income Bracket | Owner-occupied | Renter-occupied |
| Less than $5,000 | 17 (0.9%) | 0 (0.0%) |
| $5,000 to $9,999 | 14 (0.8%) | 0 (0.0%) |
| $10,000 to $14,999 | 0 (0.0%) | 0 (0.0%) |
| $15,000 to $19,999 | 98 (5.3%) | 0 (0.0%) |
| $20,000 to $24,999 | 47 (2.5%) | 0 (0.0%) |
| $25,000 to $34,999 | 81 (4.4%) | 16 (7.3%) |
| $35,000 to $49,999 | 177 (9.6%) | 0 (0.0%) |
| $50,000 to $74,999 | 341 (18.4%) | 90 (41.1%) |
| $75,000 to $99,999 | 367 (19.8%) | 30 (13.7%) |
| $100,000 to $149,999 | 260 (14.0%) | 83 (37.9%) |
| $150,000 or more | 450 (24.3%) | 0 (0.0%) |
| Total | 1,852 (100.0%) | 219 (100.0%) |
Monthly Housing Cost Tiers in Apple Valley
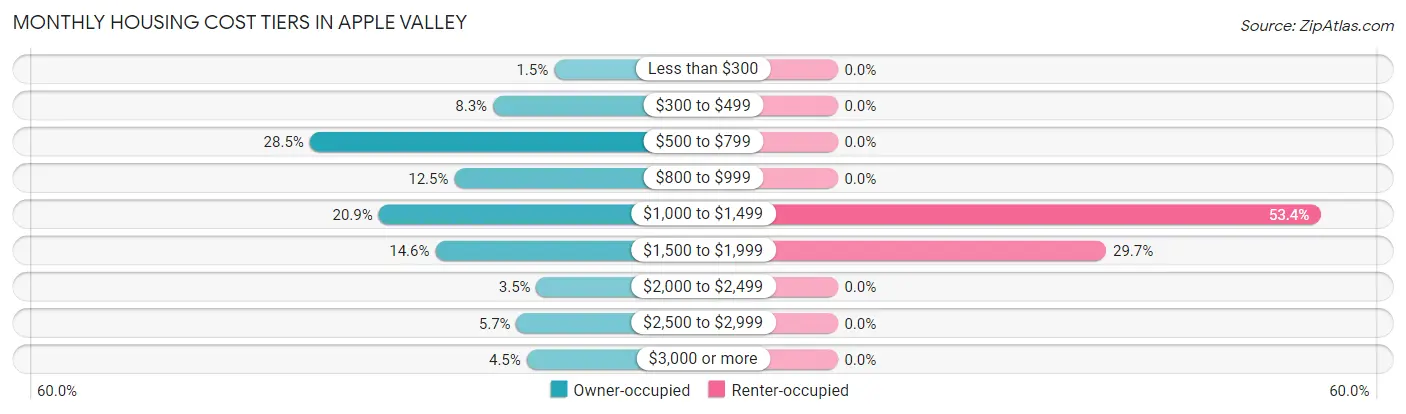
| Monthly Cost | Owner-occupied | Renter-occupied |
| Less than $300 | 28 (1.5%) | 0 (0.0%) |
| $300 to $499 | 153 (8.3%) | 0 (0.0%) |
| $500 to $799 | 528 (28.5%) | 0 (0.0%) |
| $800 to $999 | 232 (12.5%) | 0 (0.0%) |
| $1,000 to $1,499 | 387 (20.9%) | 117 (53.4%) |
| $1,500 to $1,999 | 271 (14.6%) | 65 (29.7%) |
| $2,000 to $2,499 | 64 (3.5%) | 0 (0.0%) |
| $2,500 to $2,999 | 105 (5.7%) | 0 (0.0%) |
| $3,000 or more | 84 (4.5%) | 0 (0.0%) |
| Total | 1,852 (100.0%) | 219 (100.0%) |
Physical Housing Characteristics in Apple Valley
Housing Structures in Apple Valley
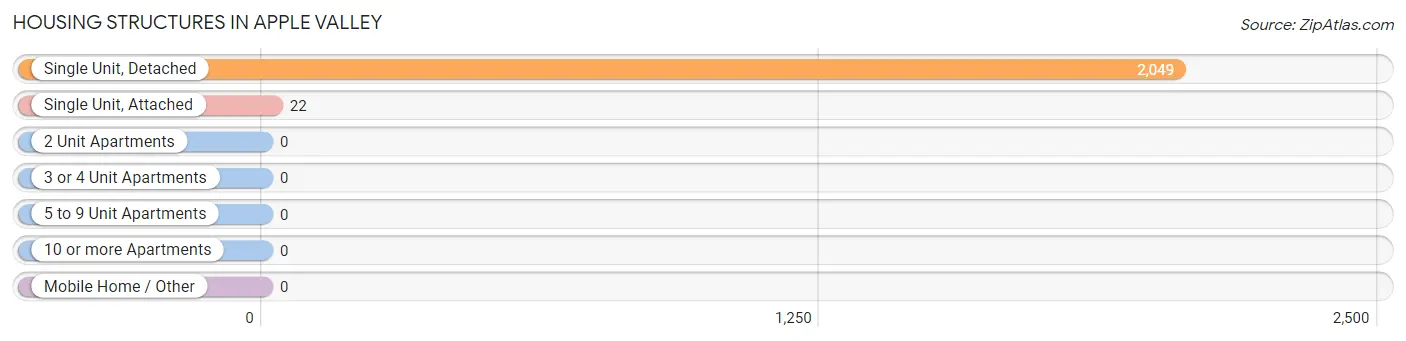
| Structure Type | # Housing Units | % Housing Units |
| Single Unit, Detached | 2,049 | 98.9% |
| Single Unit, Attached | 22 | 1.1% |
| 2 Unit Apartments | 0 | 0.0% |
| 3 or 4 Unit Apartments | 0 | 0.0% |
| 5 to 9 Unit Apartments | 0 | 0.0% |
| 10 or more Apartments | 0 | 0.0% |
| Mobile Home / Other | 0 | 0.0% |
| Total | 2,071 | 100.0% |
Housing Structures by Occupancy in Apple Valley
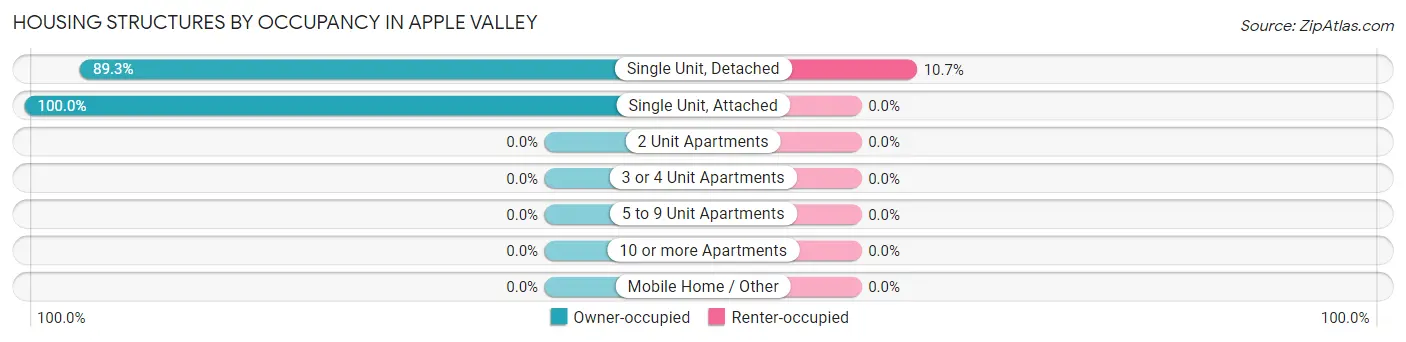
| Structure Type | Owner-occupied | Renter-occupied |
| Single Unit, Detached | 1,830 (89.3%) | 219 (10.7%) |
| Single Unit, Attached | 22 (100.0%) | 0 (0.0%) |
| 2 Unit Apartments | 0 (0.0%) | 0 (0.0%) |
| 3 or 4 Unit Apartments | 0 (0.0%) | 0 (0.0%) |
| 5 to 9 Unit Apartments | 0 (0.0%) | 0 (0.0%) |
| 10 or more Apartments | 0 (0.0%) | 0 (0.0%) |
| Mobile Home / Other | 0 (0.0%) | 0 (0.0%) |
| Total | 1,852 (89.4%) | 219 (10.6%) |
Housing Structures by Number of Rooms in Apple Valley
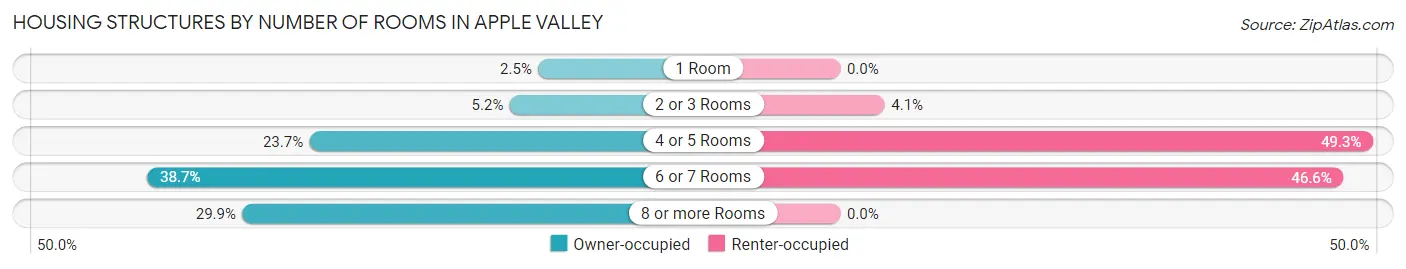
| Number of Rooms | Owner-occupied | Renter-occupied |
| 1 Room | 47 (2.5%) | 0 (0.0%) |
| 2 or 3 Rooms | 96 (5.2%) | 9 (4.1%) |
| 4 or 5 Rooms | 439 (23.7%) | 108 (49.3%) |
| 6 or 7 Rooms | 716 (38.7%) | 102 (46.6%) |
| 8 or more Rooms | 554 (29.9%) | 0 (0.0%) |
| Total | 1,852 (100.0%) | 219 (100.0%) |
Housing Structure by Heating Type in Apple Valley
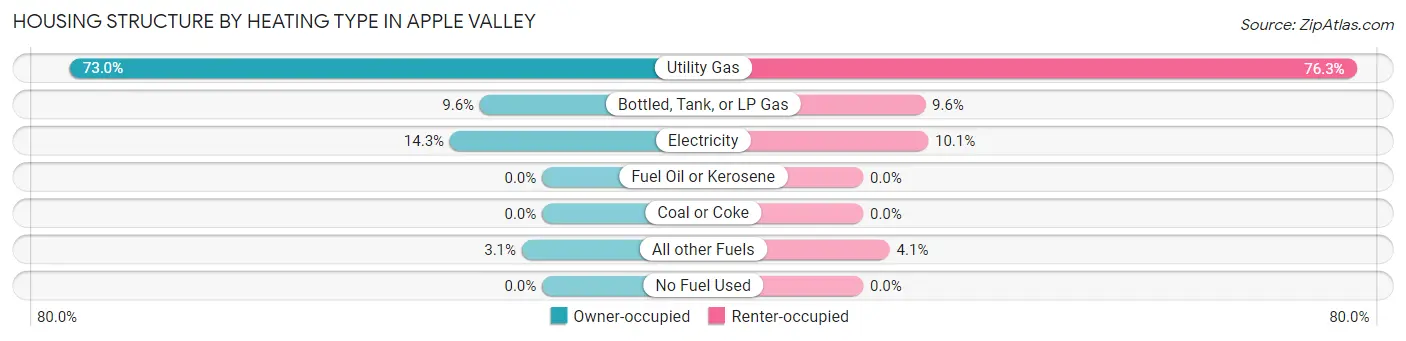
| Heating Type | Owner-occupied | Renter-occupied |
| Utility Gas | 1,352 (73.0%) | 167 (76.3%) |
| Bottled, Tank, or LP Gas | 178 (9.6%) | 21 (9.6%) |
| Electricity | 264 (14.2%) | 22 (10.1%) |
| Fuel Oil or Kerosene | 0 (0.0%) | 0 (0.0%) |
| Coal or Coke | 0 (0.0%) | 0 (0.0%) |
| All other Fuels | 58 (3.1%) | 9 (4.1%) |
| No Fuel Used | 0 (0.0%) | 0 (0.0%) |
| Total | 1,852 (100.0%) | 219 (100.0%) |
Household Vehicle Usage in Apple Valley
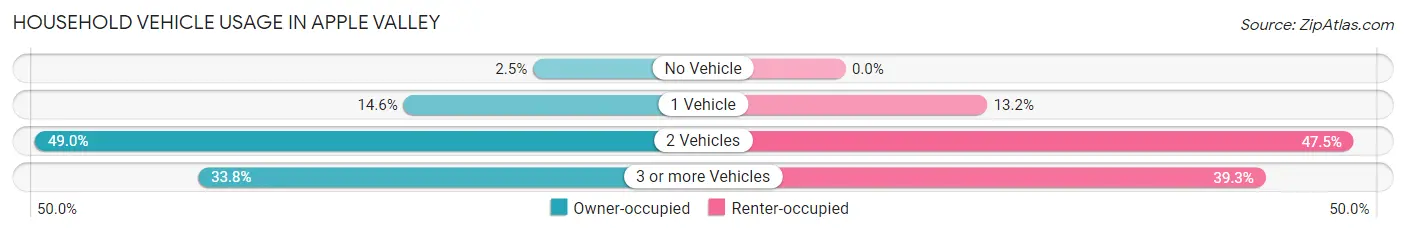
| Vehicles per Household | Owner-occupied | Renter-occupied |
| No Vehicle | 47 (2.5%) | 0 (0.0%) |
| 1 Vehicle | 271 (14.6%) | 29 (13.2%) |
| 2 Vehicles | 908 (49.0%) | 104 (47.5%) |
| 3 or more Vehicles | 626 (33.8%) | 86 (39.3%) |
| Total | 1,852 (100.0%) | 219 (100.0%) |
Real Estate & Mortgages in Apple Valley
Real Estate and Mortgage Overview in Apple Valley
| Characteristic | Without Mortgage | With Mortgage |
| Housing Units | 710 | 1,142 |
| Median Property Value | $228,900 | $224,700 |
| Median Household Income | $93,519 | $284 |
| Monthly Housing Costs | $576 | $84 |
| Real Estate Taxes | $3,195 | $0 |
Property Value by Mortgage Status in Apple Valley
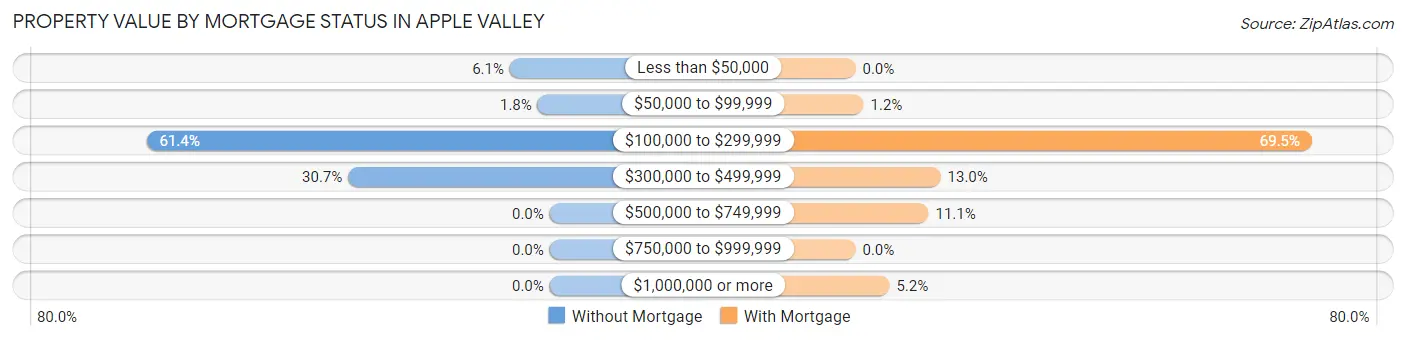
| Property Value | Without Mortgage | With Mortgage |
| Less than $50,000 | 43 (6.1%) | 0 (0.0%) |
| $50,000 to $99,999 | 13 (1.8%) | 14 (1.2%) |
| $100,000 to $299,999 | 436 (61.4%) | 794 (69.5%) |
| $300,000 to $499,999 | 218 (30.7%) | 148 (13.0%) |
| $500,000 to $749,999 | 0 (0.0%) | 127 (11.1%) |
| $750,000 to $999,999 | 0 (0.0%) | 0 (0.0%) |
| $1,000,000 or more | 0 (0.0%) | 59 (5.2%) |
| Total | 710 (100.0%) | 1,142 (100.0%) |
Household Income by Mortgage Status in Apple Valley
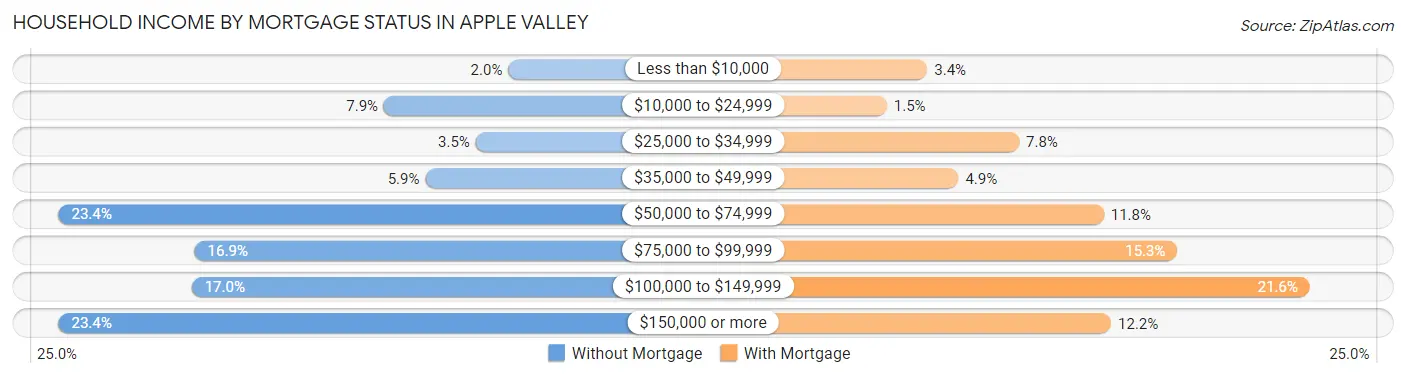
| Household Income | Without Mortgage | With Mortgage |
| Less than $10,000 | 14 (2.0%) | 39 (3.4%) |
| $10,000 to $24,999 | 56 (7.9%) | 17 (1.5%) |
| $25,000 to $34,999 | 25 (3.5%) | 89 (7.8%) |
| $35,000 to $49,999 | 42 (5.9%) | 56 (4.9%) |
| $50,000 to $74,999 | 166 (23.4%) | 135 (11.8%) |
| $75,000 to $99,999 | 120 (16.9%) | 175 (15.3%) |
| $100,000 to $149,999 | 121 (17.0%) | 247 (21.6%) |
| $150,000 or more | 166 (23.4%) | 139 (12.2%) |
| Total | 710 (100.0%) | 1,142 (100.0%) |
Property Value to Household Income Ratio in Apple Valley
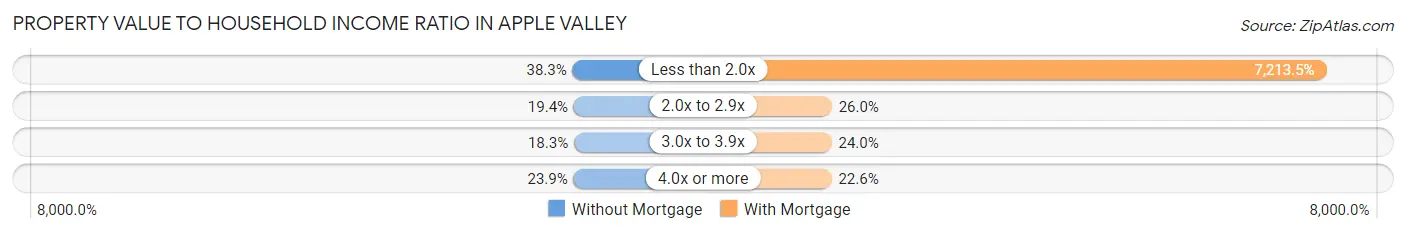
| Value-to-Income Ratio | Without Mortgage | With Mortgage |
| Less than 2.0x | 272 (38.3%) | 82,378 (7,213.5%) |
| 2.0x to 2.9x | 138 (19.4%) | 297 (26.0%) |
| 3.0x to 3.9x | 130 (18.3%) | 274 (24.0%) |
| 4.0x or more | 170 (23.9%) | 258 (22.6%) |
| Total | 710 (100.0%) | 1,142 (100.0%) |
Real Estate Taxes by Mortgage Status in Apple Valley
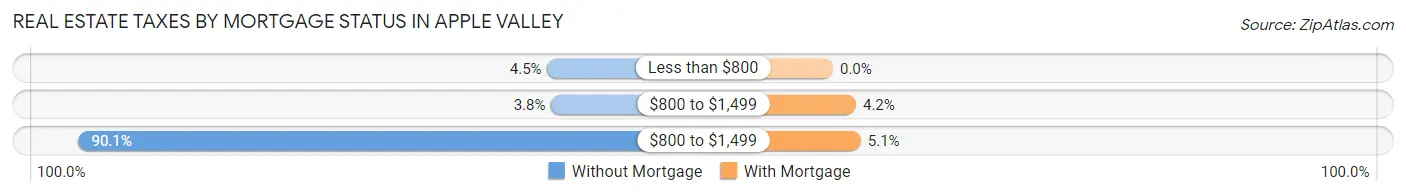
| Property Taxes | Without Mortgage | With Mortgage |
| Less than $800 | 32 (4.5%) | 0 (0.0%) |
| $800 to $1,499 | 27 (3.8%) | 48 (4.2%) |
| $800 to $1,499 | 640 (90.1%) | 58 (5.1%) |
| Total | 710 (100.0%) | 1,142 (100.0%) |
Health & Disability in Apple Valley
Health Insurance Coverage by Age in Apple Valley
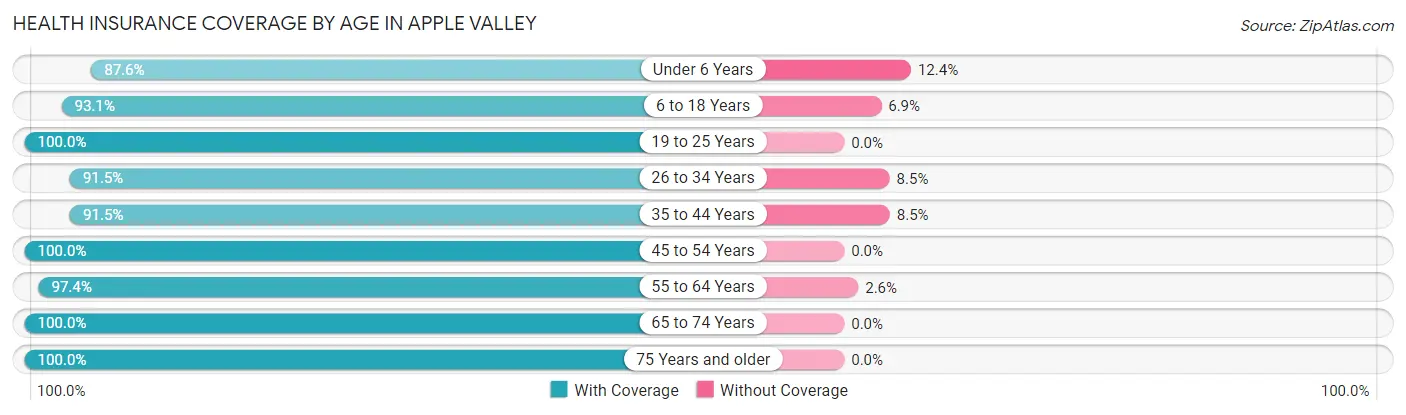
| Age Bracket | With Coverage | Without Coverage |
| Under 6 Years | 197 (87.6%) | 28 (12.4%) |
| 6 to 18 Years | 742 (93.1%) | 55 (6.9%) |
| 19 to 25 Years | 212 (100.0%) | 0 (0.0%) |
| 26 to 34 Years | 368 (91.5%) | 34 (8.5%) |
| 35 to 44 Years | 624 (91.5%) | 58 (8.5%) |
| 45 to 54 Years | 574 (100.0%) | 0 (0.0%) |
| 55 to 64 Years | 1,045 (97.4%) | 28 (2.6%) |
| 65 to 74 Years | 806 (100.0%) | 0 (0.0%) |
| 75 Years and older | 446 (100.0%) | 0 (0.0%) |
| Total | 5,014 (96.1%) | 203 (3.9%) |
Health Insurance Coverage by Citizenship Status in Apple Valley
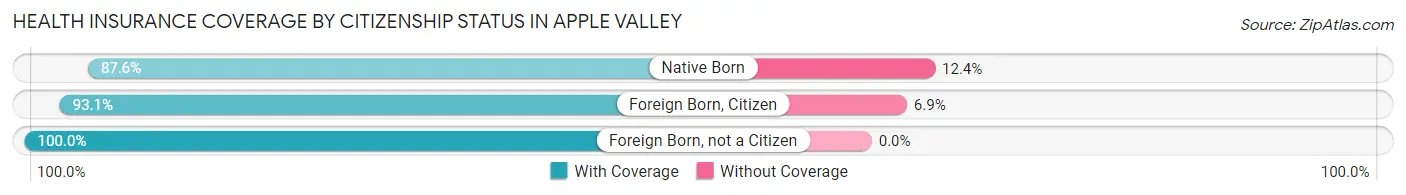
| Citizenship Status | With Coverage | Without Coverage |
| Native Born | 197 (87.6%) | 28 (12.4%) |
| Foreign Born, Citizen | 742 (93.1%) | 55 (6.9%) |
| Foreign Born, not a Citizen | 212 (100.0%) | 0 (0.0%) |
Health Insurance Coverage by Household Income in Apple Valley
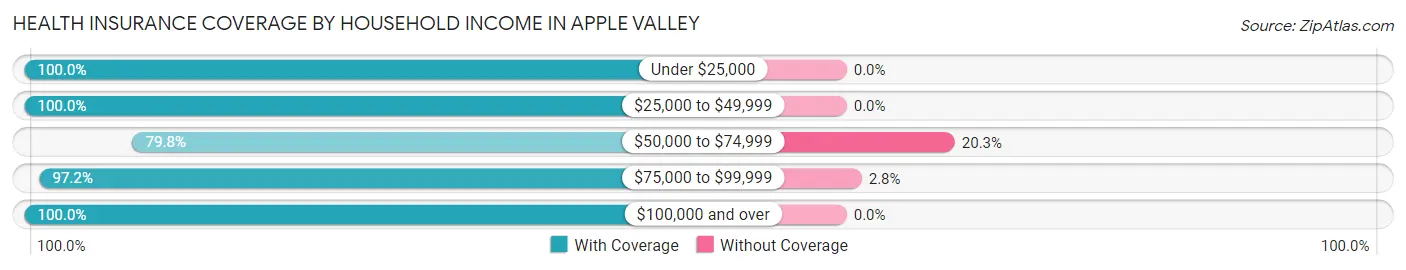
| Household Income | With Coverage | Without Coverage |
| Under $25,000 | 280 (100.0%) | 0 (0.0%) |
| $25,000 to $49,999 | 546 (100.0%) | 0 (0.0%) |
| $50,000 to $74,999 | 689 (79.7%) | 175 (20.3%) |
| $75,000 to $99,999 | 967 (97.2%) | 28 (2.8%) |
| $100,000 and over | 2,521 (100.0%) | 0 (0.0%) |
Public vs Private Health Insurance Coverage by Age in Apple Valley
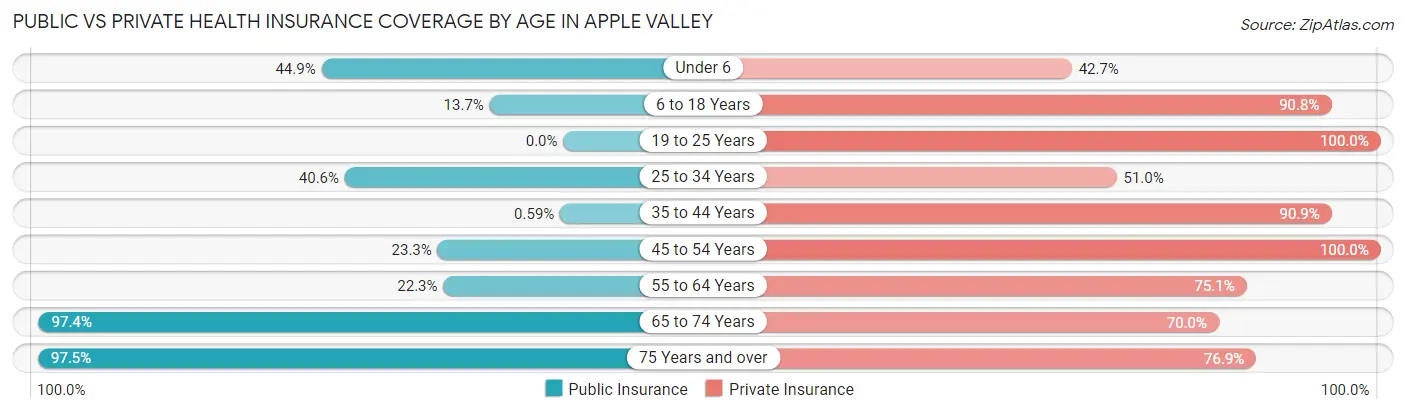
| Age Bracket | Public Insurance | Private Insurance |
| Under 6 | 101 (44.9%) | 96 (42.7%) |
| 6 to 18 Years | 109 (13.7%) | 724 (90.8%) |
| 19 to 25 Years | 0 (0.0%) | 212 (100.0%) |
| 25 to 34 Years | 163 (40.6%) | 205 (51.0%) |
| 35 to 44 Years | 4 (0.6%) | 620 (90.9%) |
| 45 to 54 Years | 134 (23.3%) | 574 (100.0%) |
| 55 to 64 Years | 239 (22.3%) | 806 (75.1%) |
| 65 to 74 Years | 785 (97.4%) | 564 (70.0%) |
| 75 Years and over | 435 (97.5%) | 343 (76.9%) |
| Total | 1,970 (37.8%) | 4,144 (79.4%) |
Disability Status by Sex by Age in Apple Valley
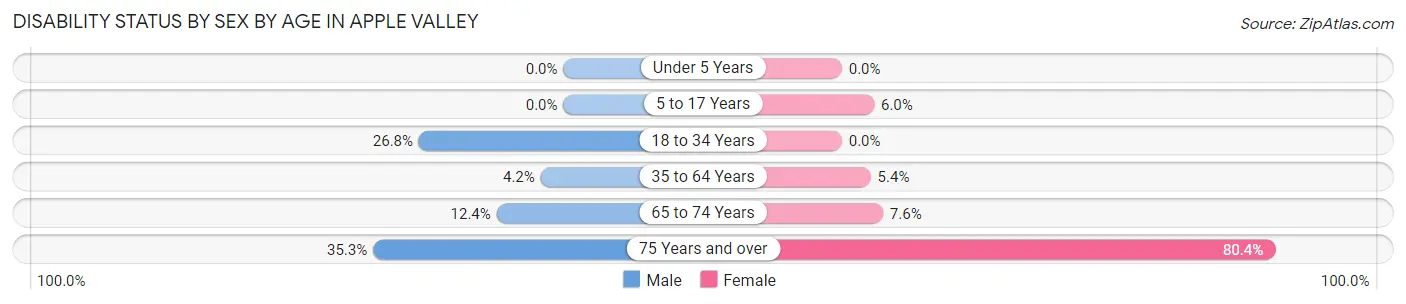
| Age Bracket | Male | Female |
| Under 5 Years | 0 (0.0%) | 0 (0.0%) |
| 5 to 17 Years | 0 (0.0%) | 25 (6.0%) |
| 18 to 34 Years | 92 (26.8%) | 0 (0.0%) |
| 35 to 64 Years | 51 (4.2%) | 60 (5.4%) |
| 65 to 74 Years | 56 (12.4%) | 27 (7.6%) |
| 75 Years and over | 71 (35.3%) | 197 (80.4%) |
Disability Class by Sex by Age in Apple Valley
Disability Class: Hearing Difficulty
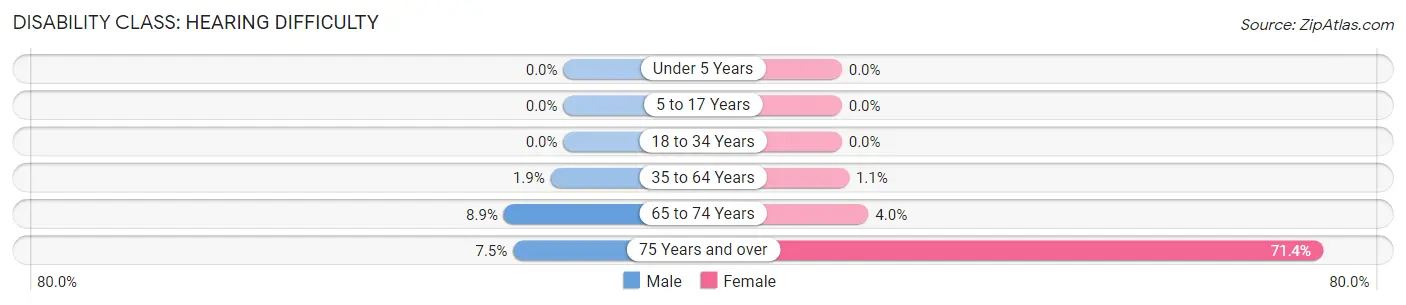
| Age Bracket | Male | Female |
| Under 5 Years | 0 (0.0%) | 0 (0.0%) |
| 5 to 17 Years | 0 (0.0%) | 0 (0.0%) |
| 18 to 34 Years | 0 (0.0%) | 0 (0.0%) |
| 35 to 64 Years | 23 (1.9%) | 12 (1.1%) |
| 65 to 74 Years | 40 (8.8%) | 14 (4.0%) |
| 75 Years and over | 15 (7.5%) | 175 (71.4%) |
Disability Class: Vision Difficulty
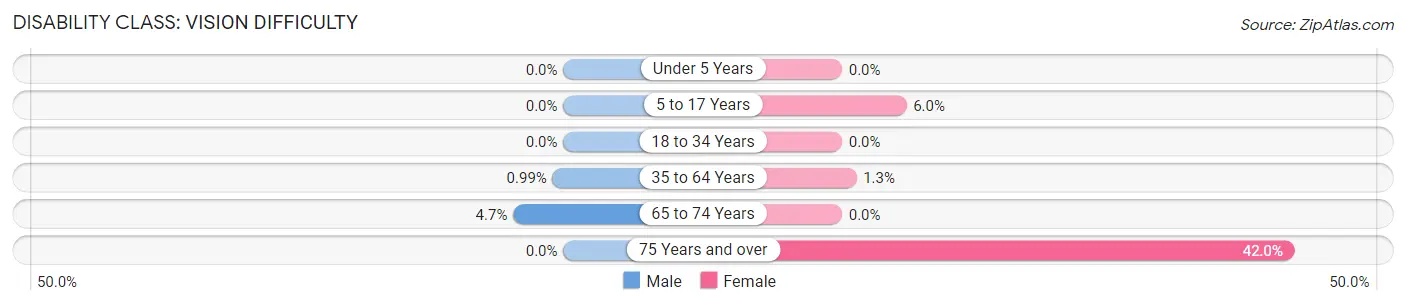
| Age Bracket | Male | Female |
| Under 5 Years | 0 (0.0%) | 0 (0.0%) |
| 5 to 17 Years | 0 (0.0%) | 25 (6.0%) |
| 18 to 34 Years | 0 (0.0%) | 0 (0.0%) |
| 35 to 64 Years | 12 (1.0%) | 15 (1.3%) |
| 65 to 74 Years | 21 (4.6%) | 0 (0.0%) |
| 75 Years and over | 0 (0.0%) | 103 (42.0%) |
Disability Class: Cognitive Difficulty
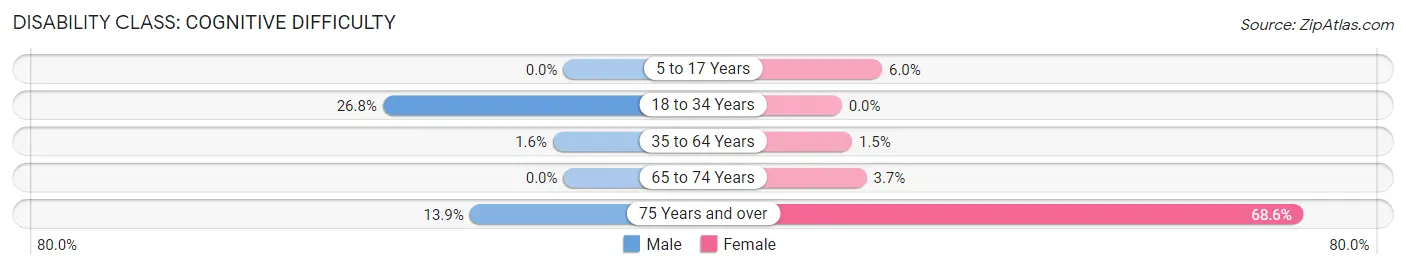
| Age Bracket | Male | Female |
| 5 to 17 Years | 0 (0.0%) | 25 (6.0%) |
| 18 to 34 Years | 92 (26.8%) | 0 (0.0%) |
| 35 to 64 Years | 19 (1.6%) | 17 (1.5%) |
| 65 to 74 Years | 0 (0.0%) | 13 (3.7%) |
| 75 Years and over | 28 (13.9%) | 168 (68.6%) |
Disability Class: Ambulatory Difficulty
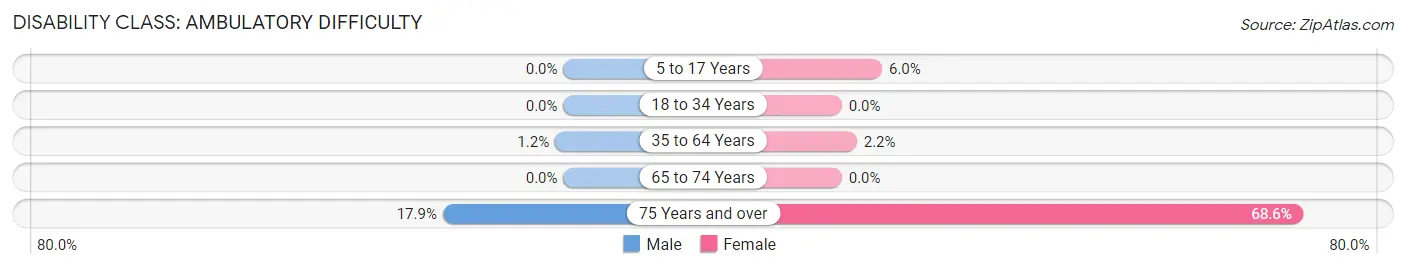
| Age Bracket | Male | Female |
| 5 to 17 Years | 0 (0.0%) | 25 (6.0%) |
| 18 to 34 Years | 0 (0.0%) | 0 (0.0%) |
| 35 to 64 Years | 15 (1.2%) | 25 (2.2%) |
| 65 to 74 Years | 0 (0.0%) | 0 (0.0%) |
| 75 Years and over | 36 (17.9%) | 168 (68.6%) |
Disability Class: Self-Care Difficulty
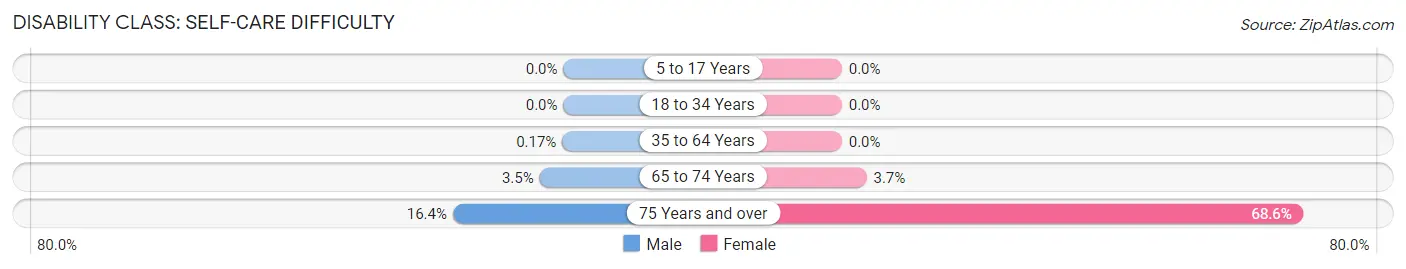
| Age Bracket | Male | Female |
| 5 to 17 Years | 0 (0.0%) | 0 (0.0%) |
| 18 to 34 Years | 0 (0.0%) | 0 (0.0%) |
| 35 to 64 Years | 2 (0.2%) | 0 (0.0%) |
| 65 to 74 Years | 16 (3.5%) | 13 (3.7%) |
| 75 Years and over | 33 (16.4%) | 168 (68.6%) |
Technology Access in Apple Valley
Computing Device Access in Apple Valley
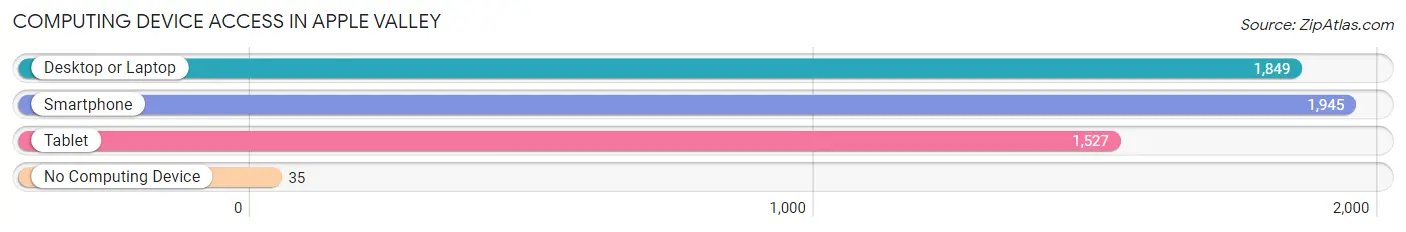
| Device Type | # Households | % Households |
| Desktop or Laptop | 1,849 | 89.3% |
| Smartphone | 1,945 | 93.9% |
| Tablet | 1,527 | 73.7% |
| No Computing Device | 35 | 1.7% |
| Total | 2,071 | 100.0% |
Internet Access in Apple Valley
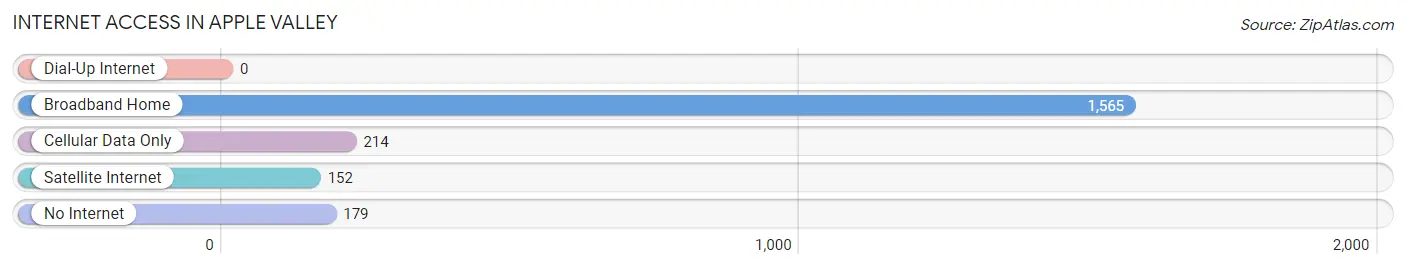
| Internet Type | # Households | % Households |
| Dial-Up Internet | 0 | 0.0% |
| Broadband Home | 1,565 | 75.6% |
| Cellular Data Only | 214 | 10.3% |
| Satellite Internet | 152 | 7.3% |
| No Internet | 179 | 8.6% |
| Total | 2,071 | 100.0% |
Apple Valley Summary
Apple Valley, Ohio is a small village located in the southeastern corner of Stark County, Ohio. It is situated on the banks of the Tuscarawas River, and is part of the Canton-Massillon Metropolitan Statistical Area. The village has a population of approximately 1,000 people, and is home to a variety of businesses, including a grocery store, a hardware store, a restaurant, and a few other small businesses.
History
Apple Valley was founded in 1820 by a group of settlers from Pennsylvania. The village was originally known as “Apple Valley Settlement”, and was named after the abundance of apple trees in the area. The village was incorporated in 1837, and the first post office was established in 1845.
The village was a popular stop for travelers on the Ohio and Erie Canal, which ran through the village. The canal was an important transportation route for goods and people, and it helped to spur the growth of the village.
In the late 19th century, Apple Valley was a thriving agricultural community. The village was home to several mills, including a grist mill, a saw mill, and a woolen mill. The village also had a blacksmith shop, a general store, and a hotel.
Geography
Apple Valley is located in the southeastern corner of Stark County, Ohio. It is situated on the banks of the Tuscarawas River, and is part of the Canton-Massillon Metropolitan Statistical Area. The village is located approximately 25 miles south of Canton, and 40 miles north of Akron.
The village is surrounded by rolling hills and farmland, and is home to a variety of wildlife, including deer, foxes, and wild turkeys. The village is also home to several parks, including Apple Valley Park, which features a playground, picnic areas, and a walking trail.
Economy
Apple Valley’s economy is largely based on agriculture and small businesses. The village is home to a variety of businesses, including a grocery store, a hardware store, a restaurant, and a few other small businesses.
The village is also home to several manufacturing companies, including a plastics manufacturer and a metal fabrication company. The village is also home to a few small farms, which produce a variety of crops, including corn, soybeans, and wheat.
Demographics
As of the 2010 census, Apple Valley had a population of 1,000 people. The village is predominantly white, with approximately 95% of the population identifying as white. The remaining 5% of the population is made up of African Americans, Hispanics, and other ethnicities.
The median household income in Apple Valley is $45,000, and the median home value is $125,000. The village has a low unemployment rate, and the majority of the population is employed in either agriculture or small businesses.
Apple Valley is a small, rural village with a rich history and a vibrant economy. The village is home to a variety of businesses, and is surrounded by rolling hills and farmland. The village is also home to a variety of wildlife, and is a popular destination for outdoor enthusiasts. Apple Valley is a great place to live, work, and play.
Common Questions
What is the Total Population of Apple Valley?
Total Population of Apple Valley is 5,217.
What is the Total Male Population of Apple Valley?
Total Male Population of Apple Valley is 2,632.
What is the Total Female Population of Apple Valley?
Total Female Population of Apple Valley is 2,585.
What is the Ratio of Males per 100 Females in Apple Valley?
There are 101.82 Males per 100 Females in Apple Valley.
What is the Ratio of Females per 100 Males in Apple Valley?
There are 98.21 Females per 100 Males in Apple Valley.
What is the Median Population Age in Apple Valley?
Median Population Age in Apple Valley is 50.6 Years.
What is the Average Family Size in Apple Valley
Average Family Size in Apple Valley is 2.9 People.
What is the Average Household Size in Apple Valley
Average Household Size in Apple Valley is 2.5 People.
What is Per Capita Income in Apple Valley?
Per Capita income in Apple Valley is $44,519.
What is the Median Family Income in Apple Valley?
Median Family Income in Apple Valley is $93,947.
What is the Median Household income in Apple Valley?
Median Household Income in Apple Valley is $82,175.
What is Income or Wage Gap in Apple Valley?
Income or Wage Gap in Apple Valley is 44.8%.
Women in Apple Valley earn 55.2 cents for every dollar earned by a man.
What is Family Income Deficit in Apple Valley?
Family Income Deficit in Apple Valley is $2,702.
Families that are below poverty line in Apple Valley earn $2,702 less on average than the poverty threshold level.
What is Inequality or Gini Index in Apple Valley?
Inequality or Gini Index in Apple Valley is 0.40.
How Large is the Labor Force in Apple Valley?
There are 2,673 People in the Labor Forcein in Apple Valley.
What is the Percentage of People in the Labor Force in Apple Valley?
61.7% of People are in the Labor Force in Apple Valley.
What is the Unemployment Rate in Apple Valley?
Unemployment Rate in Apple Valley is 7.6%.