Choudrant, LA
Choudrant Map
Choudrant Overview
1,395
TOTAL POPULATION
642
MALE POPULATION
753
FEMALE POPULATION
85.26
MALES / 100 FEMALES
117.29
FEMALES / 100 MALES
37.1
MEDIAN AGE
3.0
AVG FAMILY SIZE
2.8
AVG HOUSEHOLD SIZE
$44,121
PER CAPITA INCOME
$73,000
AVG FAMILY INCOME
$69,313
AVG HOUSEHOLD INCOME
37.6%
WAGE / INCOME GAP [ % ]
62.4¢/ $1
WAGE / INCOME GAP [ $ ]
0.56
INEQUALITY / GINI INDEX
660
LABOR FORCE [ PEOPLE ]
62.9%
PERCENT IN LABOR FORCE
1.4%
UNEMPLOYMENT RATE
Choudrant Zip Codes
Choudrant Area Codes
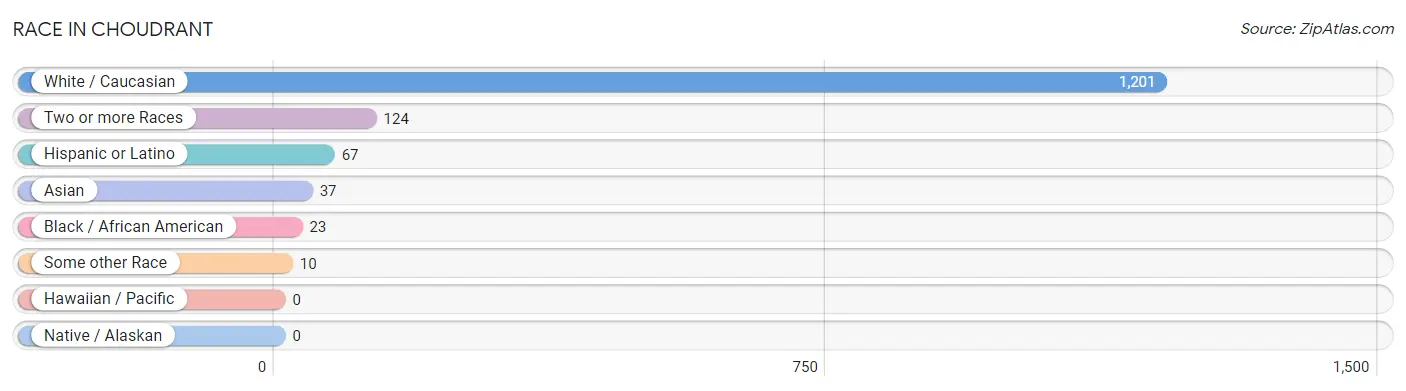
Race in Choudrant
The most populous races in Choudrant are White / Caucasian (1,201 | 86.1%), Two or more Races (124 | 8.9%), and Hispanic or Latino (67 | 4.8%).
| Race | # Population | % Population |
| Asian | 37 | 2.6% |
| Black / African American | 23 | 1.7% |
| Hawaiian / Pacific | 0 | 0.0% |
| Hispanic or Latino | 67 | 4.8% |
| Native / Alaskan | 0 | 0.0% |
| White / Caucasian | 1,201 | 86.1% |
| Two or more Races | 124 | 8.9% |
| Some other Race | 10 | 0.7% |
| Total | 1,395 | 100.0% |
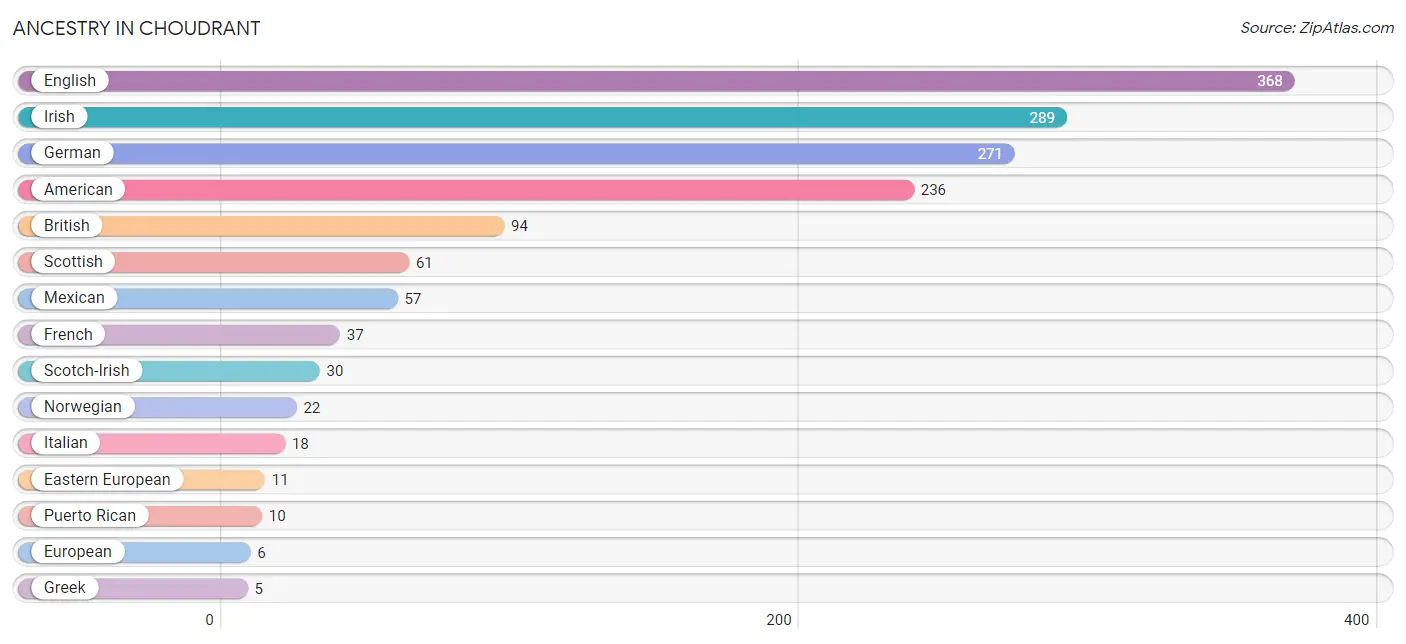
Ancestry in Choudrant
The most populous ancestries reported in Choudrant are English (368 | 26.4%), Irish (289 | 20.7%), German (271 | 19.4%), American (236 | 16.9%), and British (94 | 6.7%), together accounting for 90.2% of all Choudrant residents.
| Ancestry | # Population | % Population |
| American | 236 | 16.9% |
| British | 94 | 6.7% |
| Eastern European | 11 | 0.8% |
| English | 368 | 26.4% |
| European | 6 | 0.4% |
| French | 37 | 2.6% |
| German | 271 | 19.4% |
| Greek | 5 | 0.4% |
| Hungarian | 3 | 0.2% |
| Irish | 289 | 20.7% |
| Italian | 18 | 1.3% |
| Mexican | 57 | 4.1% |
| Norwegian | 22 | 1.6% |
| Polish | 1 | 0.1% |
| Puerto Rican | 10 | 0.7% |
| Scotch-Irish | 30 | 2.1% |
| Scottish | 61 | 4.4% |
| Welsh | 2 | 0.1% | View All 18 Rows |
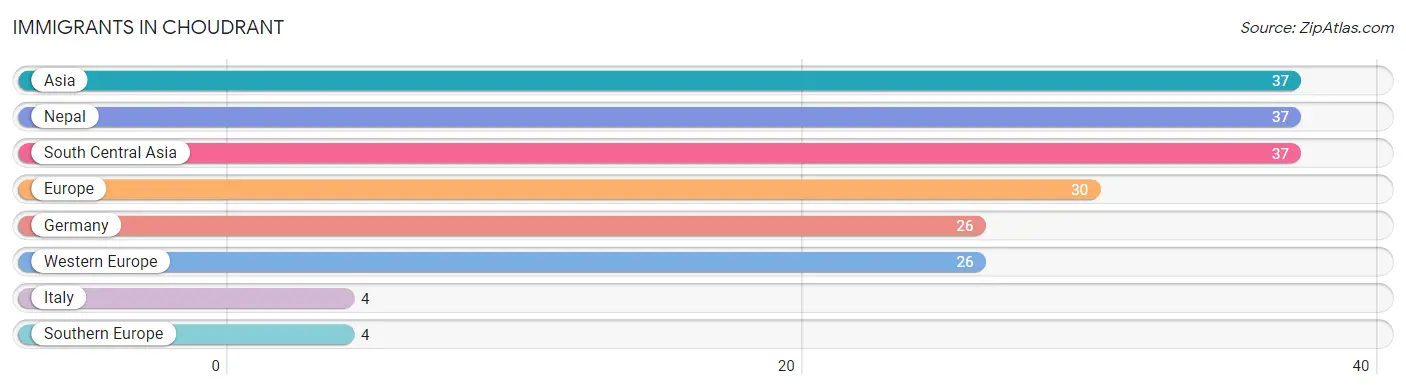
Immigrants in Choudrant
The most numerous immigrant groups reported in Choudrant came from Asia (37 | 2.6%), Nepal (37 | 2.6%), South Central Asia (37 | 2.6%), Europe (30 | 2.1%), and Germany (26 | 1.9%), together accounting for 12.0% of all Choudrant residents.
| Immigration Origin | # Population | % Population |
| Asia | 37 | 2.6% |
| Europe | 30 | 2.1% |
| Germany | 26 | 1.9% |
| Italy | 4 | 0.3% |
| Nepal | 37 | 2.6% |
| South Central Asia | 37 | 2.6% |
| Southern Europe | 4 | 0.3% |
| Western Europe | 26 | 1.9% | View All 8 Rows |
Sex and Age in Choudrant
Sex and Age in Choudrant
The most populous age groups in Choudrant are 5 to 9 Years (113 | 17.6%) for men and 40 to 44 Years (140 | 18.6%) for women.
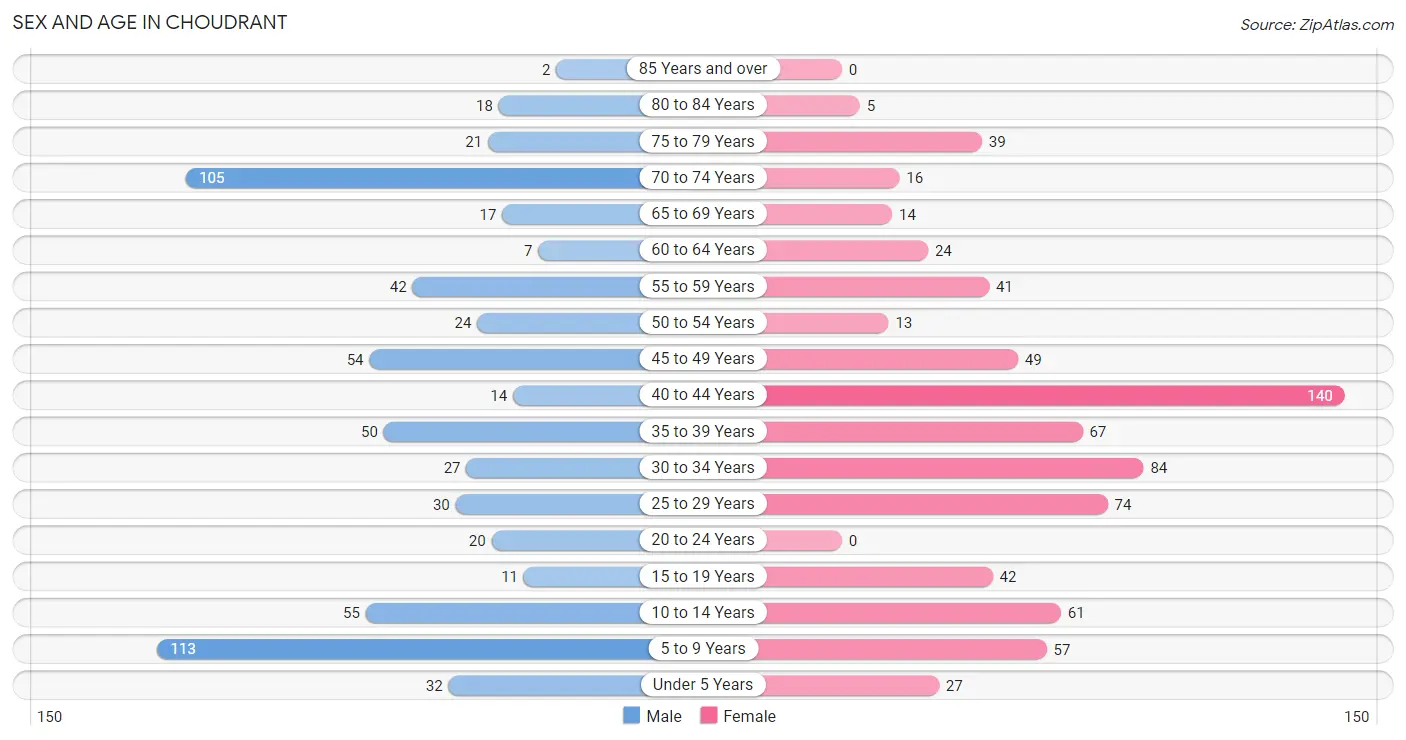
| Age Bracket | Male | Female |
| Under 5 Years | 32 (5.0%) | 27 (3.6%) |
| 5 to 9 Years | 113 (17.6%) | 57 (7.6%) |
| 10 to 14 Years | 55 (8.6%) | 61 (8.1%) |
| 15 to 19 Years | 11 (1.7%) | 42 (5.6%) |
| 20 to 24 Years | 20 (3.1%) | 0 (0.0%) |
| 25 to 29 Years | 30 (4.7%) | 74 (9.8%) |
| 30 to 34 Years | 27 (4.2%) | 84 (11.2%) |
| 35 to 39 Years | 50 (7.8%) | 67 (8.9%) |
| 40 to 44 Years | 14 (2.2%) | 140 (18.6%) |
| 45 to 49 Years | 54 (8.4%) | 49 (6.5%) |
| 50 to 54 Years | 24 (3.7%) | 13 (1.7%) |
| 55 to 59 Years | 42 (6.5%) | 41 (5.4%) |
| 60 to 64 Years | 7 (1.1%) | 24 (3.2%) |
| 65 to 69 Years | 17 (2.6%) | 14 (1.9%) |
| 70 to 74 Years | 105 (16.4%) | 16 (2.1%) |
| 75 to 79 Years | 21 (3.3%) | 39 (5.2%) |
| 80 to 84 Years | 18 (2.8%) | 5 (0.7%) |
| 85 Years and over | 2 (0.3%) | 0 (0.0%) |
| Total | 642 (100.0%) | 753 (100.0%) |
Families and Households in Choudrant
Median Family Size in Choudrant
The median family size in Choudrant is 3.00 persons per family, with married-couple families (248 | 57.7%) accounting for the largest median family size of 3.75 persons per family. On the other hand, single female/mother families (168 | 39.1%) represent the smallest median family size with 1.95 persons per family.
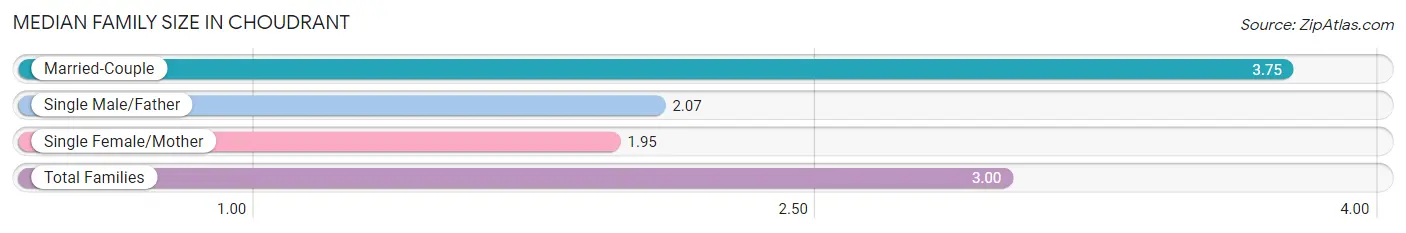
| Family Type | # Families | Family Size |
| Married-Couple | 248 (57.7%) | 3.75 |
| Single Male/Father | 14 (3.3%) | 2.07 |
| Single Female/Mother | 168 (39.1%) | 1.95 |
| Total Families | 430 (100.0%) | 3.00 |
Median Household Size in Choudrant
The median household size in Choudrant is 2.75 persons per household, with married-couple households (248 | 48.9%) accounting for the largest median household size of 3.75 persons per household. non-family households (77 | 15.2%) represent the smallest median household size with 1.10 persons per household.
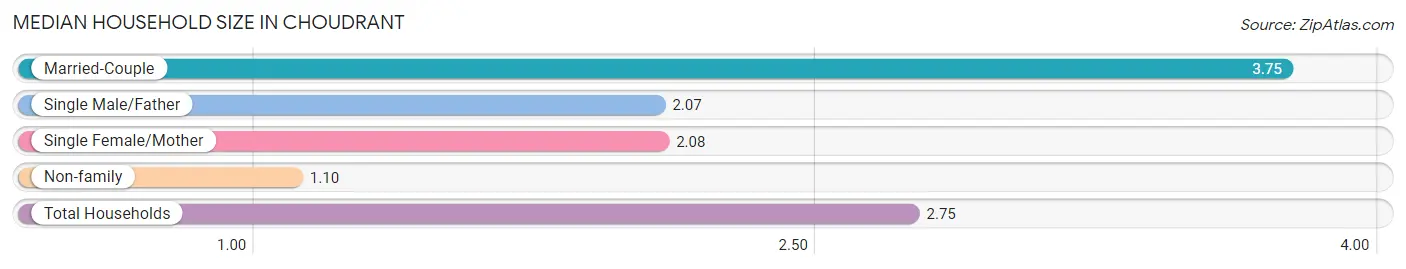
| Household Type | # Households | Household Size |
| Married-Couple | 248 (48.9%) | 3.75 |
| Single Male/Father | 14 (2.8%) | 2.07 |
| Single Female/Mother | 168 (33.1%) | 2.08 |
| Non-family | 77 (15.2%) | 1.10 |
| Total Households | 507 (100.0%) | 2.75 |
Household Size by Marriage Status in Choudrant
Out of a total of 507 households in Choudrant, 430 (84.8%) are family households, while 77 (15.2%) are nonfamily households. The most numerous type of family households are 2-person households, comprising 269, and the most common type of nonfamily households are 1-person households, comprising 71.
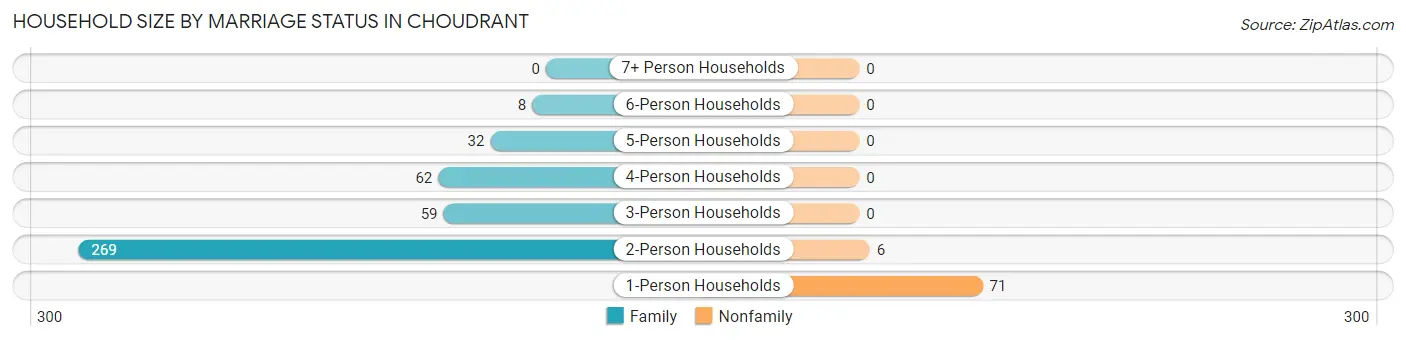
| Household Size | Family Households | Nonfamily Households |
| 1-Person Households | - | 71 (14.0%) |
| 2-Person Households | 269 (53.1%) | 6 (1.2%) |
| 3-Person Households | 59 (11.6%) | 0 (0.0%) |
| 4-Person Households | 62 (12.2%) | 0 (0.0%) |
| 5-Person Households | 32 (6.3%) | 0 (0.0%) |
| 6-Person Households | 8 (1.6%) | 0 (0.0%) |
| 7+ Person Households | 0 (0.0%) | 0 (0.0%) |
| Total | 430 (84.8%) | 77 (15.2%) |
Female Fertility in Choudrant
Fertility by Age in Choudrant
Average fertility rate in Choudrant is 11.0 births per 1,000 women. Women in the age bracket of 20 to 34 years have the highest fertility rate with 32.0 births per 1,000 women. Women in the age bracket of 20 to 34 years acount for 100.0% of all women with births.
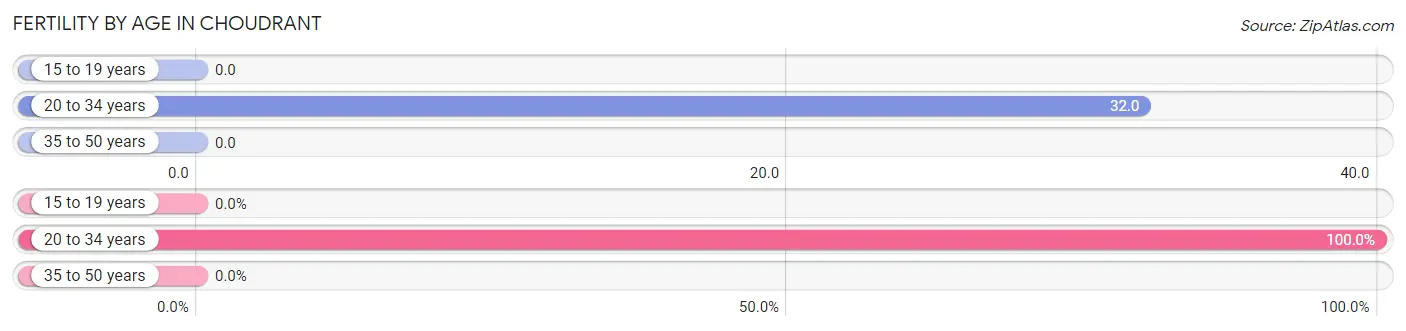
| Age Bracket | Women with Births | Births / 1,000 Women |
| 15 to 19 years | 0 (0.0%) | 0.0 |
| 20 to 34 years | 5 (100.0%) | 32.0 |
| 35 to 50 years | 0 (0.0%) | 0.0 |
| Total | 5 (100.0%) | 11.0 |
Fertility by Age by Marriage Status in Choudrant
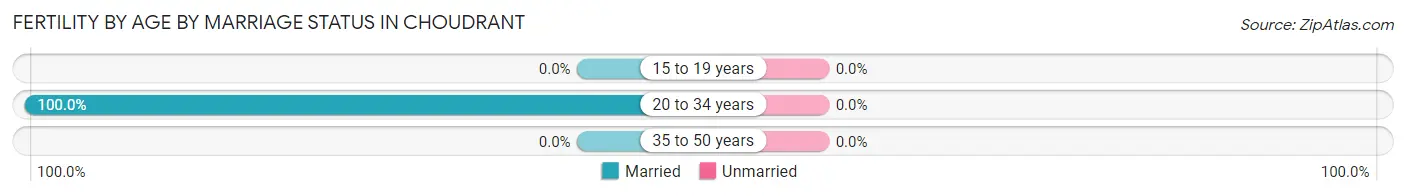
| Age Bracket | Married | Unmarried |
| 15 to 19 years | 0 (0.0%) | 0 (0.0%) |
| 20 to 34 years | 5 (100.0%) | 0 (0.0%) |
| 35 to 50 years | 0 (0.0%) | 0 (0.0%) |
| Total | 5 (100.0%) | 0 (0.0%) |
Fertility by Education in Choudrant
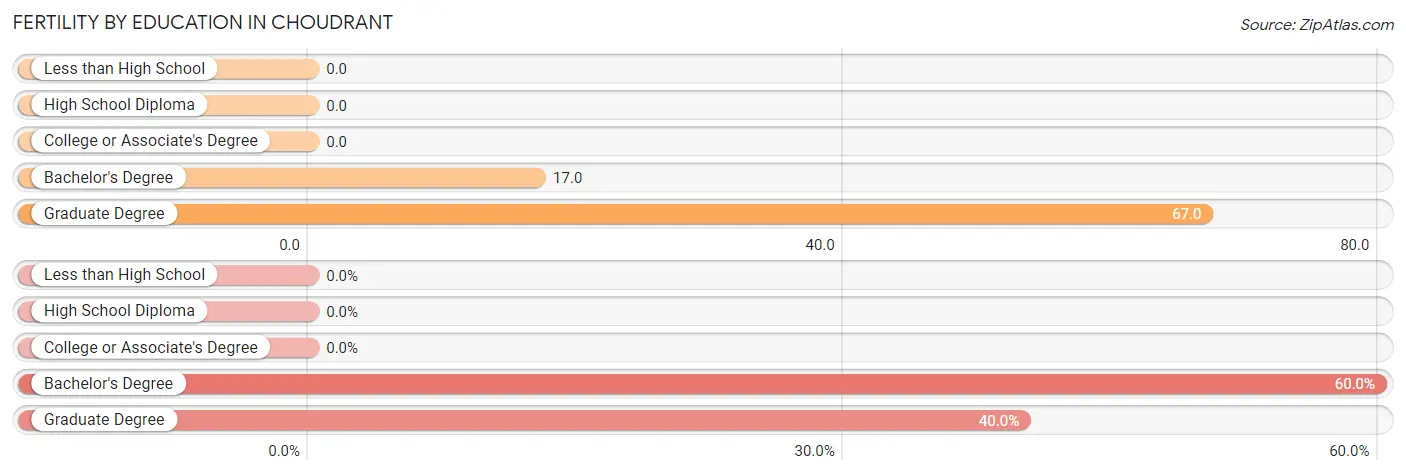
| Educational Attainment | Women with Births | Births / 1,000 Women |
| Less than High School | 0 (0.0%) | 0.0 |
| High School Diploma | 0 (0.0%) | 0.0 |
| College or Associate's Degree | 0 (0.0%) | 0.0 |
| Bachelor's Degree | 3 (60.0%) | 17.0 |
| Graduate Degree | 2 (40.0%) | 67.0 |
| Total | 5 (100.0%) | 11.0 |
Fertility by Education by Marriage Status in Choudrant

| Educational Attainment | Married | Unmarried |
| Less than High School | 0 (0.0%) | 0 (0.0%) |
| High School Diploma | 0 (0.0%) | 0 (0.0%) |
| College or Associate's Degree | 0 (0.0%) | 0 (0.0%) |
| Bachelor's Degree | 3 (100.0%) | 0 (0.0%) |
| Graduate Degree | 2 (100.0%) | 0 (0.0%) |
| Total | 5 (100.0%) | 0 (0.0%) |
Income in Choudrant
Income Overview in Choudrant
Per Capita Income in Choudrant is $44,121, while median incomes of families and households are $73,000 and $69,313 respectively.
| Characteristic | Number | Measure |
| Per Capita Income | 1,395 | $44,121 |
| Median Family Income | 430 | $73,000 |
| Mean Family Income | 430 | $124,581 |
| Median Household Income | 507 | $69,313 |
| Mean Household Income | 507 | $116,133 |
| Income Deficit | 430 | $0 |
| Wage / Income Gap (%) | 1,395 | 37.59% |
| Wage / Income Gap ($) | 1,395 | 62.41¢ per $1 |
| Gini / Inequality Index | 1,395 | 0.56 |
Earnings by Sex in Choudrant
Average Earnings in Choudrant are $37,344, $47,279 for men and $29,507 for women, a difference of 37.6%.
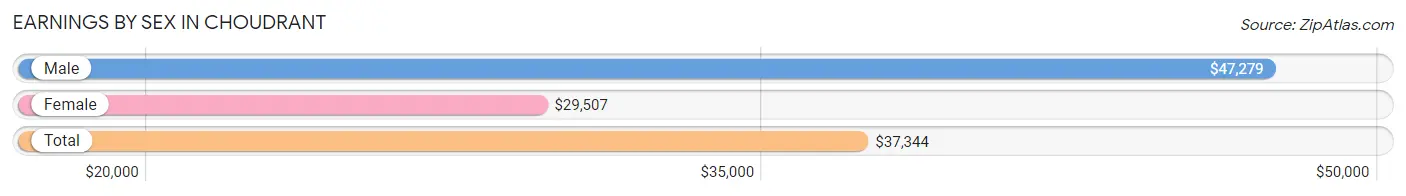
| Sex | Number | Average Earnings |
| Male | 267 (38.4%) | $47,279 |
| Female | 428 (61.6%) | $29,507 |
| Total | 695 (100.0%) | $37,344 |
Earnings by Sex by Income Bracket in Choudrant
The most common earnings brackets in Choudrant are $100,000+ for men (63 | 23.6%) and $25,000 to $29,999 for women (169 | 39.5%).
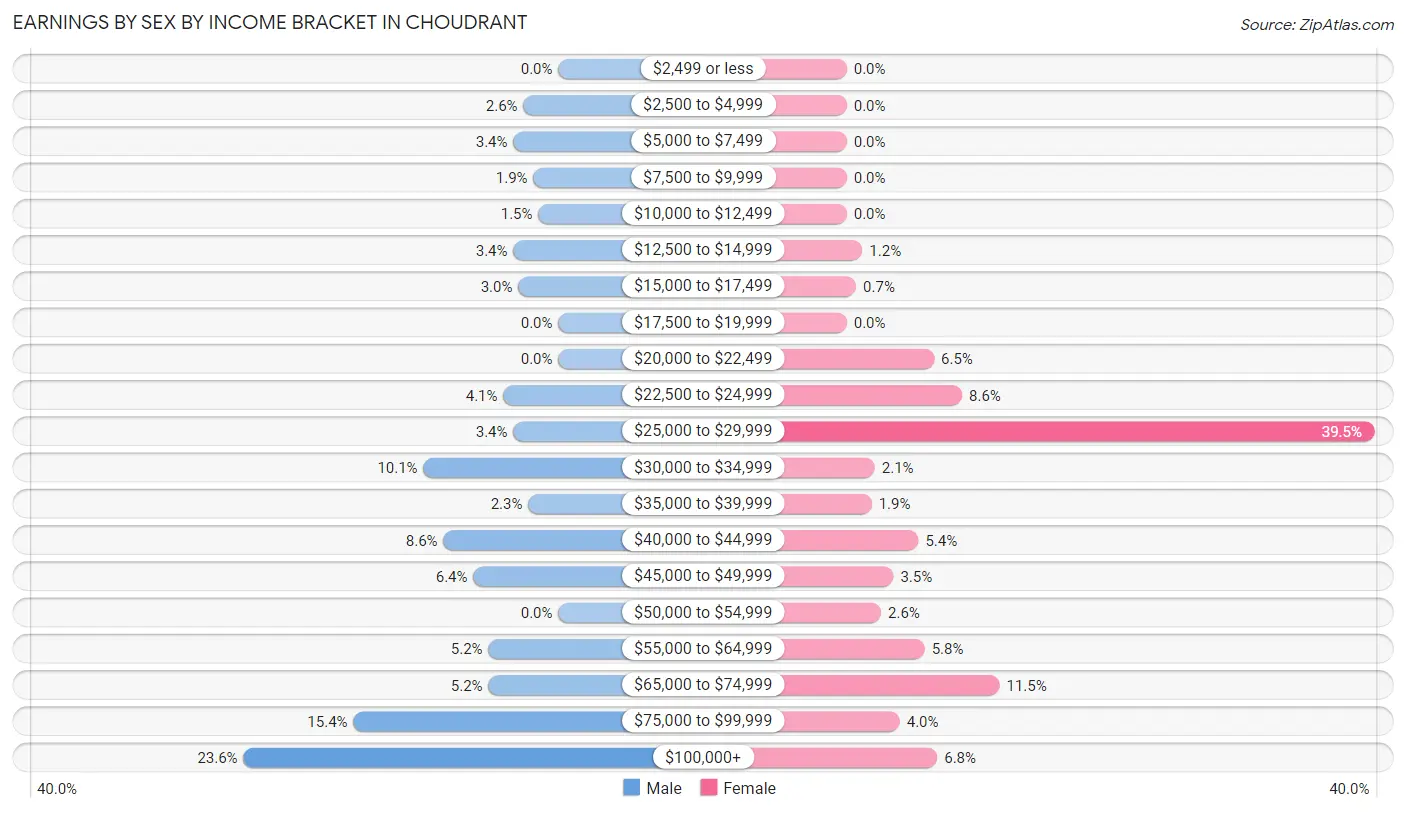
| Income | Male | Female |
| $2,499 or less | 0 (0.0%) | 0 (0.0%) |
| $2,500 to $4,999 | 7 (2.6%) | 0 (0.0%) |
| $5,000 to $7,499 | 9 (3.4%) | 0 (0.0%) |
| $7,500 to $9,999 | 5 (1.9%) | 0 (0.0%) |
| $10,000 to $12,499 | 4 (1.5%) | 0 (0.0%) |
| $12,500 to $14,999 | 9 (3.4%) | 5 (1.2%) |
| $15,000 to $17,499 | 8 (3.0%) | 3 (0.7%) |
| $17,500 to $19,999 | 0 (0.0%) | 0 (0.0%) |
| $20,000 to $22,499 | 0 (0.0%) | 28 (6.5%) |
| $22,500 to $24,999 | 11 (4.1%) | 37 (8.6%) |
| $25,000 to $29,999 | 9 (3.4%) | 169 (39.5%) |
| $30,000 to $34,999 | 27 (10.1%) | 9 (2.1%) |
| $35,000 to $39,999 | 6 (2.2%) | 8 (1.9%) |
| $40,000 to $44,999 | 23 (8.6%) | 23 (5.4%) |
| $45,000 to $49,999 | 17 (6.4%) | 15 (3.5%) |
| $50,000 to $54,999 | 0 (0.0%) | 11 (2.6%) |
| $55,000 to $64,999 | 14 (5.2%) | 25 (5.8%) |
| $65,000 to $74,999 | 14 (5.2%) | 49 (11.5%) |
| $75,000 to $99,999 | 41 (15.4%) | 17 (4.0%) |
| $100,000+ | 63 (23.6%) | 29 (6.8%) |
| Total | 267 (100.0%) | 428 (100.0%) |
Earnings by Sex by Educational Attainment in Choudrant
Average earnings in Choudrant are $64,375 for men and $29,507 for women, a difference of 54.2%. Men with an educational attainment of high school diploma enjoy the highest average annual earnings of $57,969, while those with bachelor's degree education earn the least with $46,103. Women with an educational attainment of graduate degree earn the most with the average annual earnings of $102,917, while those with high school diploma education have the smallest earnings of $27,917.
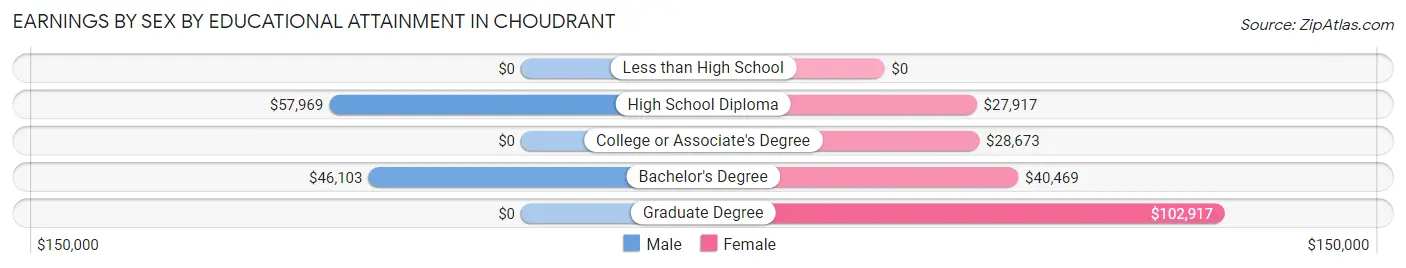
| Educational Attainment | Male Income | Female Income |
| Less than High School | - | - |
| High School Diploma | $57,969 | $27,917 |
| College or Associate's Degree | - | - |
| Bachelor's Degree | $46,103 | $40,469 |
| Graduate Degree | - | - |
| Total | $64,375 | $29,507 |
Family Income in Choudrant
Family Income Brackets in Choudrant
According to the Choudrant family income data, there are 112 families falling into the $25,000 to $34,999 income range, which is the most common income bracket and makes up 26.1% of all families.
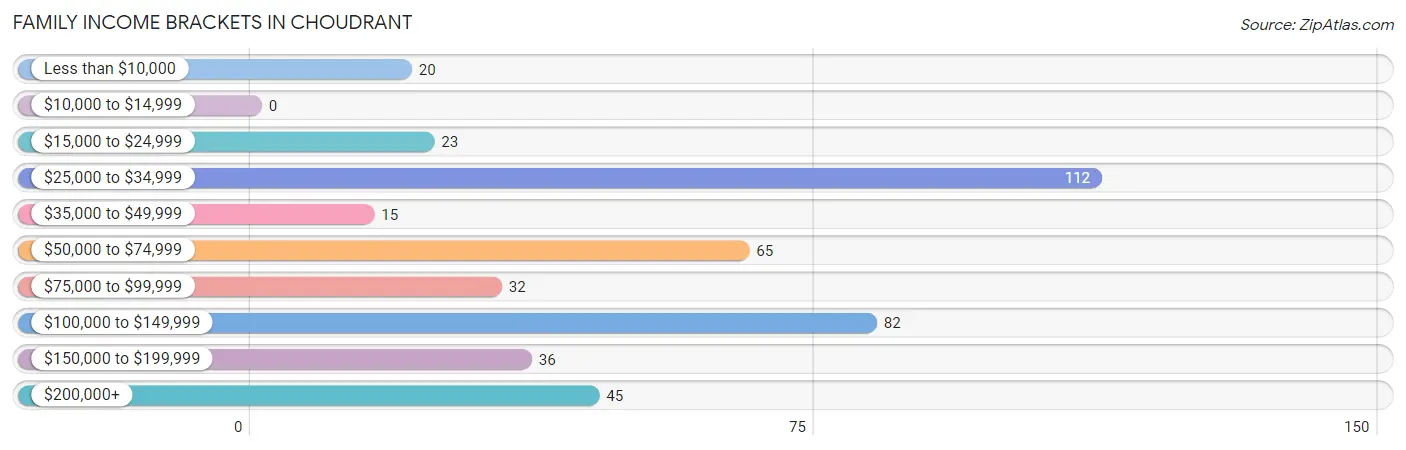
| Income Bracket | # Families | % Families |
| Less than $10,000 | 20 | 4.7% |
| $10,000 to $14,999 | 0 | 0.0% |
| $15,000 to $24,999 | 23 | 5.3% |
| $25,000 to $34,999 | 112 | 26.0% |
| $35,000 to $49,999 | 15 | 3.5% |
| $50,000 to $74,999 | 65 | 15.1% |
| $75,000 to $99,999 | 32 | 7.4% |
| $100,000 to $149,999 | 82 | 19.1% |
| $150,000 to $199,999 | 36 | 8.4% |
| $200,000+ | 45 | 10.5% |
Family Income by Famaliy Size in Choudrant
4-person families (62 | 14.4%) account for the highest median family income in Choudrant with $118,438 per family, while 3-person families (41 | 9.5%) have the highest median income of $35,130 per family member.
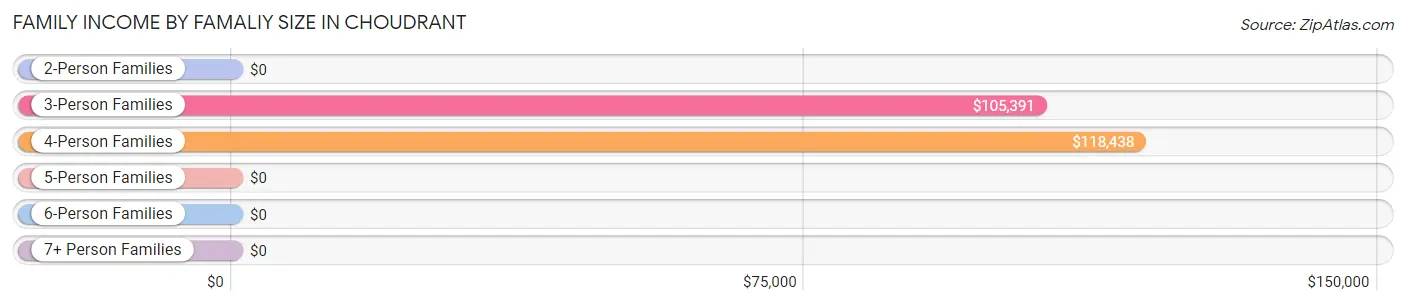
| Income Bracket | # Families | Median Income |
| 2-Person Families | 287 (66.7%) | $0 |
| 3-Person Families | 41 (9.5%) | $105,391 |
| 4-Person Families | 62 (14.4%) | $118,438 |
| 5-Person Families | 32 (7.4%) | $0 |
| 6-Person Families | 8 (1.9%) | $0 |
| 7+ Person Families | 0 (0.0%) | $0 |
| Total | 430 (100.0%) | $73,000 |
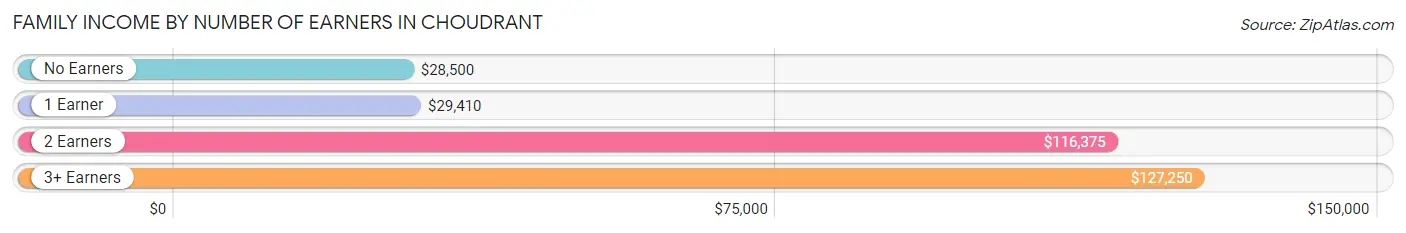
Family Income by Number of Earners in Choudrant
The median family income in Choudrant is $73,000, with families comprising 3+ earners (19) having the highest median family income of $127,250, while families with no earners (80) have the lowest median family income of $28,500, accounting for 4.4% and 18.6% of families, respectively.
| Number of Earners | # Families | Median Income |
| No Earners | 80 (18.6%) | $28,500 |
| 1 Earner | 158 (36.7%) | $29,410 |
| 2 Earners | 173 (40.2%) | $116,375 |
| 3+ Earners | 19 (4.4%) | $127,250 |
| Total | 430 (100.0%) | $73,000 |
Household Income in Choudrant
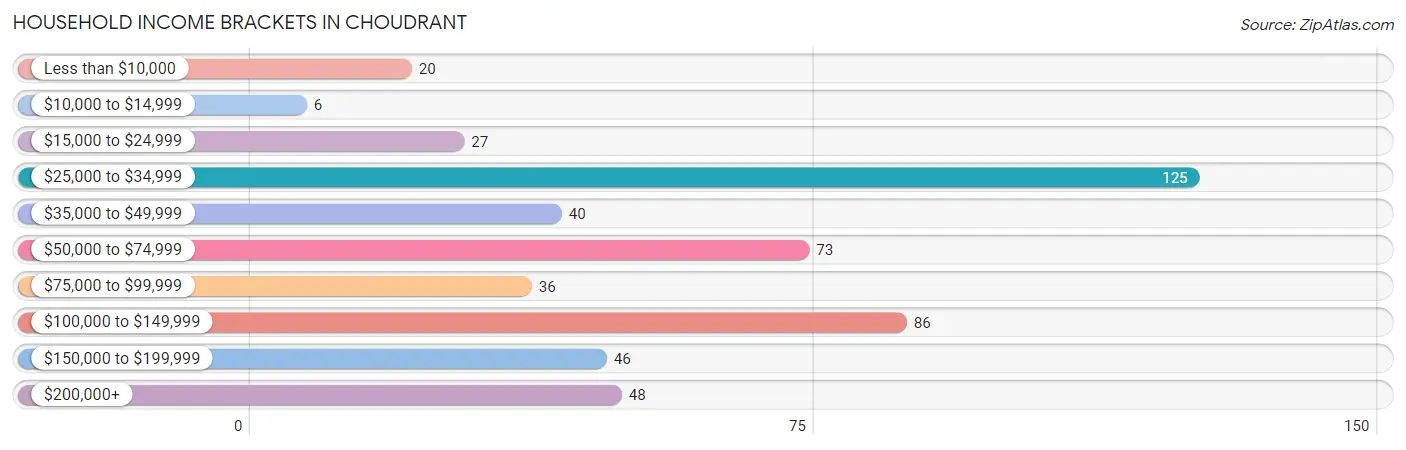
Household Income Brackets in Choudrant
With 125 households falling in the category, the $25,000 to $34,999 income range is the most frequent in Choudrant, accounting for 24.6% of all households. In contrast, only 6 households (1.2%) fall into the $10,000 to $14,999 income bracket, making it the least populous group.
| Income Bracket | # Households | % Households |
| Less than $10,000 | 20 | 3.9% |
| $10,000 to $14,999 | 6 | 1.2% |
| $15,000 to $24,999 | 27 | 5.3% |
| $25,000 to $34,999 | 125 | 24.7% |
| $35,000 to $49,999 | 40 | 7.9% |
| $50,000 to $74,999 | 73 | 14.4% |
| $75,000 to $99,999 | 36 | 7.1% |
| $100,000 to $149,999 | 86 | 17.0% |
| $150,000 to $199,999 | 46 | 9.1% |
| $200,000+ | 48 | 9.5% |
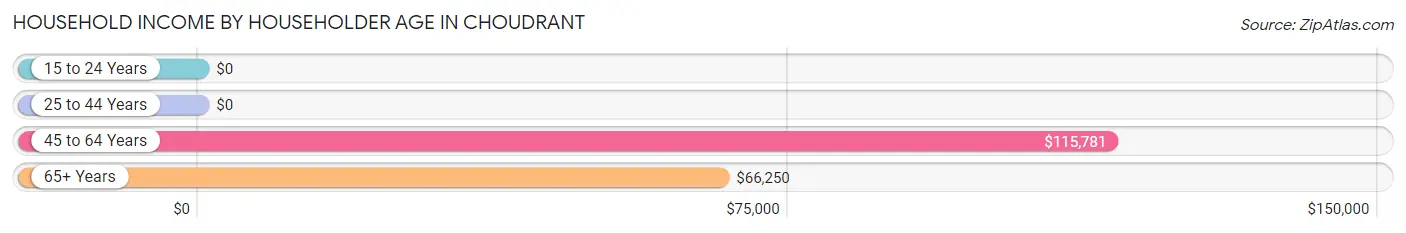
Household Income by Householder Age in Choudrant
The median household income in Choudrant is $69,313, with the highest median household income of $115,781 found in the 45 to 64 years age bracket for the primary householder. A total of 153 households (30.2%) fall into this category. Meanwhile, the 15 to 24 years age bracket for the primary householder has the lowest median household income of $0, with 2 households (0.4%) in this group.
| Income Bracket | # Households | Median Income |
| 15 to 24 Years | 2 (0.4%) | $0 |
| 25 to 44 Years | 270 (53.2%) | $0 |
| 45 to 64 Years | 153 (30.2%) | $115,781 |
| 65+ Years | 82 (16.2%) | $66,250 |
| Total | 507 (100.0%) | $69,313 |
Poverty in Choudrant
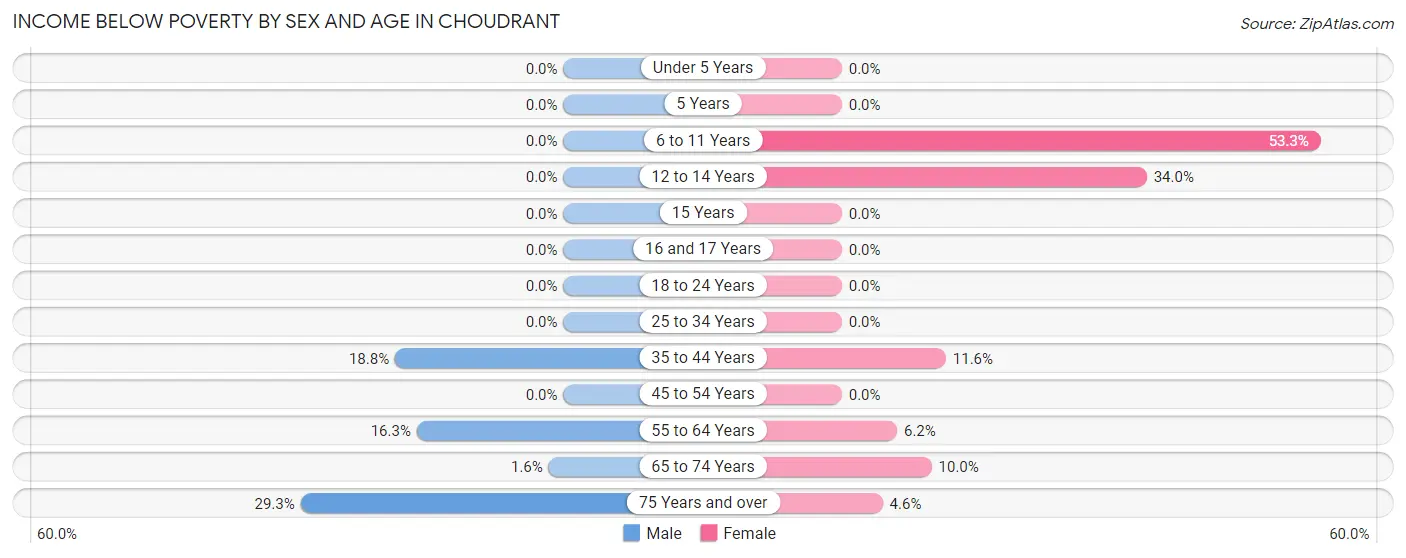
Income Below Poverty by Sex and Age in Choudrant
With 5.4% poverty level for males and 7.8% for females among the residents of Choudrant, 75 year old and over males and 6 to 11 year old females are the most vulnerable to poverty, with 12 males (29.3%) and 8 females (53.3%) in their respective age groups living below the poverty level.
| Age Bracket | Male | Female |
| Under 5 Years | 0 (0.0%) | 0 (0.0%) |
| 5 Years | 0 (0.0%) | 0 (0.0%) |
| 6 to 11 Years | 0 (0.0%) | 8 (53.3%) |
| 12 to 14 Years | 0 (0.0%) | 18 (34.0%) |
| 15 Years | 0 (0.0%) | 0 (0.0%) |
| 16 and 17 Years | 0 (0.0%) | 0 (0.0%) |
| 18 to 24 Years | 0 (0.0%) | 0 (0.0%) |
| 25 to 34 Years | 0 (0.0%) | 0 (0.0%) |
| 35 to 44 Years | 12 (18.8%) | 24 (11.6%) |
| 45 to 54 Years | 0 (0.0%) | 0 (0.0%) |
| 55 to 64 Years | 8 (16.3%) | 4 (6.1%) |
| 65 to 74 Years | 2 (1.6%) | 3 (10.0%) |
| 75 Years and over | 12 (29.3%) | 2 (4.5%) |
| Total | 34 (5.4%) | 59 (7.8%) |
Income Above Poverty by Sex and Age in Choudrant
According to the poverty statistics in Choudrant, males aged under 5 years and females aged under 5 years are the age groups that are most secure financially, with 100.0% of males and 100.0% of females in these age groups living above the poverty line.
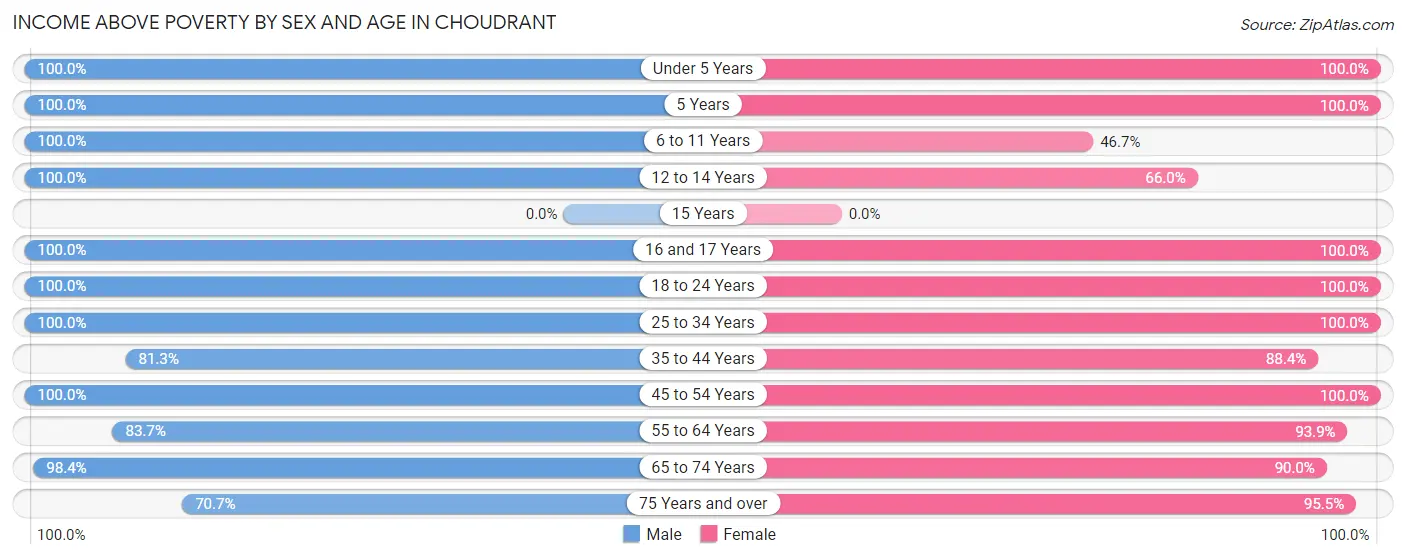
| Age Bracket | Male | Female |
| Under 5 Years | 32 (100.0%) | 27 (100.0%) |
| 5 Years | 3 (100.0%) | 50 (100.0%) |
| 6 to 11 Years | 143 (100.0%) | 7 (46.7%) |
| 12 to 14 Years | 12 (100.0%) | 35 (66.0%) |
| 15 Years | 0 (0.0%) | 0 (0.0%) |
| 16 and 17 Years | 4 (100.0%) | 40 (100.0%) |
| 18 to 24 Years | 27 (100.0%) | 2 (100.0%) |
| 25 to 34 Years | 57 (100.0%) | 158 (100.0%) |
| 35 to 44 Years | 52 (81.2%) | 183 (88.4%) |
| 45 to 54 Years | 78 (100.0%) | 62 (100.0%) |
| 55 to 64 Years | 41 (83.7%) | 61 (93.9%) |
| 65 to 74 Years | 120 (98.4%) | 27 (90.0%) |
| 75 Years and over | 29 (70.7%) | 42 (95.5%) |
| Total | 598 (94.6%) | 694 (92.2%) |
Income Below Poverty Among Married-Couple Families in Choudrant
The poverty statistics for married-couple families in Choudrant show that 7.3% or 18 of the total 248 families live below the poverty line. Families with 1 or 2 children have the highest poverty rate of 12.5%, comprising of 11 families. On the other hand, families with 3 or 4 children have the lowest poverty rate of 0.0%, which includes 0 families.
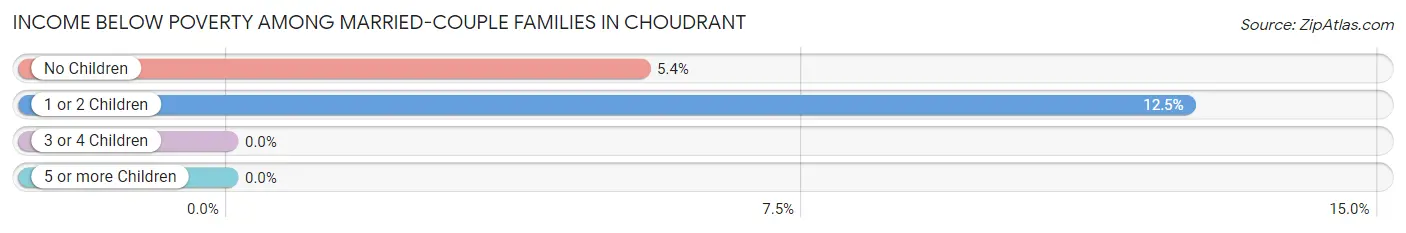
| Children | Above Poverty | Below Poverty |
| No Children | 123 (94.6%) | 7 (5.4%) |
| 1 or 2 Children | 77 (87.5%) | 11 (12.5%) |
| 3 or 4 Children | 30 (100.0%) | 0 (0.0%) |
| 5 or more Children | 0 (0.0%) | 0 (0.0%) |
| Total | 230 (92.7%) | 18 (7.3%) |
Income Below Poverty Among Single-Parent Households in Choudrant
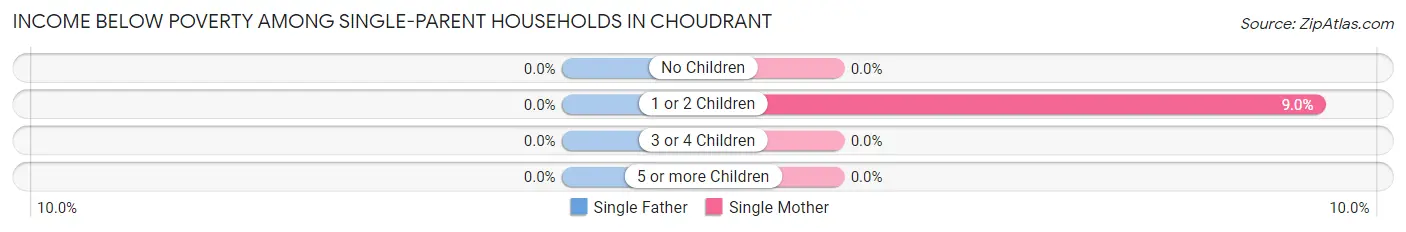
| Children | Single Father | Single Mother |
| No Children | 0 (0.0%) | 0 (0.0%) |
| 1 or 2 Children | 0 (0.0%) | 13 (9.0%) |
| 3 or 4 Children | 0 (0.0%) | 0 (0.0%) |
| 5 or more Children | 0 (0.0%) | 0 (0.0%) |
| Total | 0 (0.0%) | 13 (7.7%) |
Income Below Poverty Among Married-Couple vs Single-Parent Households in Choudrant
The poverty data for Choudrant shows that 18 of the married-couple family households (7.3%) and 13 of the single-parent households (7.1%) are living below the poverty level. Within the married-couple family households, those with 1 or 2 children have the highest poverty rate, with 11 households (12.5%) falling below the poverty line. Among the single-parent households, those with 1 or 2 children have the highest poverty rate, with 13 household (8.7%) living below poverty.
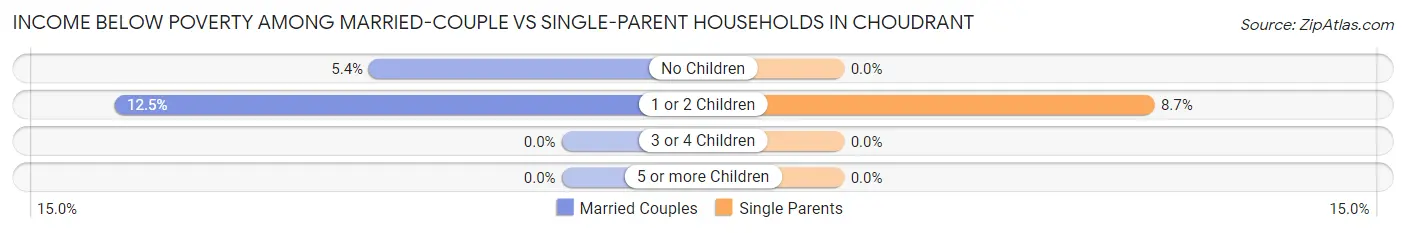
| Children | Married-Couple Families | Single-Parent Households |
| No Children | 7 (5.4%) | 0 (0.0%) |
| 1 or 2 Children | 11 (12.5%) | 13 (8.7%) |
| 3 or 4 Children | 0 (0.0%) | 0 (0.0%) |
| 5 or more Children | 0 (0.0%) | 0 (0.0%) |
| Total | 18 (7.3%) | 13 (7.1%) |
Employment Characteristics in Choudrant
Employment by Class of Employer in Choudrant
Among the 651 employed individuals in Choudrant, private company employees (448 | 68.8%), state government employees (65 | 10.0%), and local government employees (43 | 6.6%) make up the most common classes of employment.
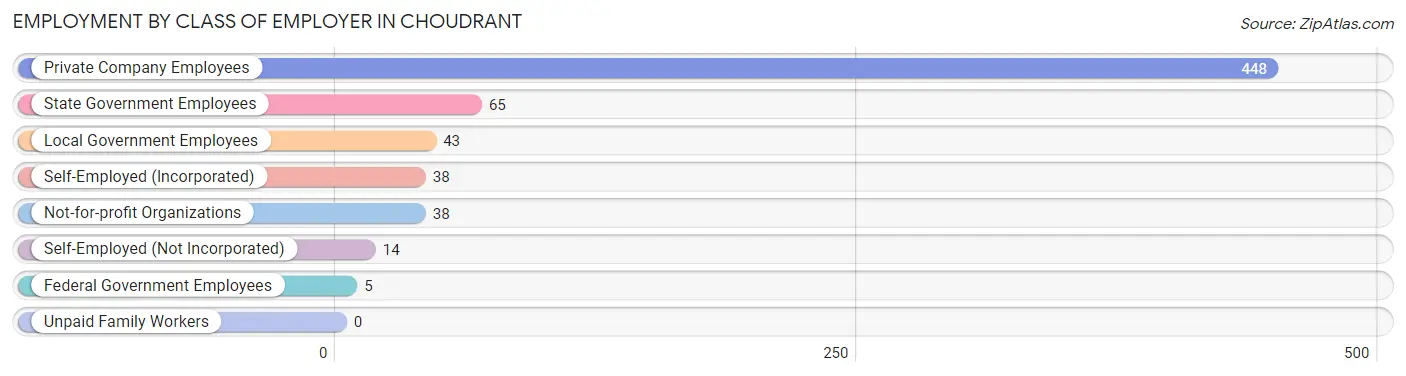
| Employer Class | # Employees | % Employees |
| Private Company Employees | 448 | 68.8% |
| Self-Employed (Incorporated) | 38 | 5.8% |
| Self-Employed (Not Incorporated) | 14 | 2.1% |
| Not-for-profit Organizations | 38 | 5.8% |
| Local Government Employees | 43 | 6.6% |
| State Government Employees | 65 | 10.0% |
| Federal Government Employees | 5 | 0.8% |
| Unpaid Family Workers | 0 | 0.0% |
| Total | 651 | 100.0% |
Employment Status by Age in Choudrant
According to the labor force statistics for Choudrant, out of the total population over 16 years of age (1,050), 62.9% or 660 individuals are in the labor force, with 1.4% or 9 of them unemployed. The age group with the highest labor force participation rate is 25 to 29 years, with 97.1% or 101 individuals in the labor force. Within the labor force, the 75 years and over age range has the highest percentage of unemployed individuals, with 50.0% or 3 of them being unemployed.
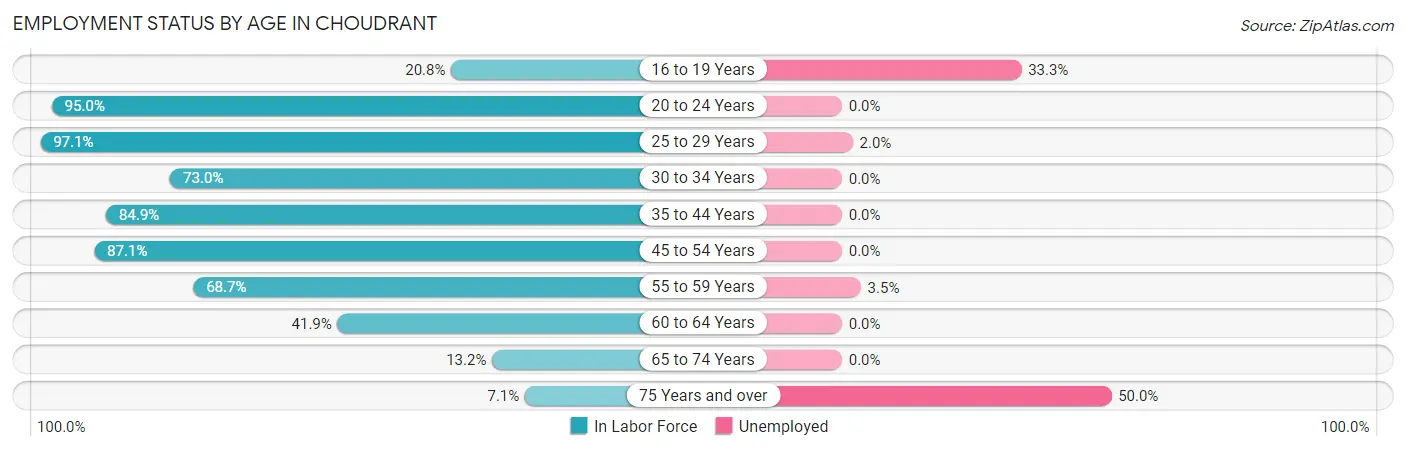
| Age Bracket | In Labor Force | Unemployed |
| 16 to 19 Years | 11 (20.8%) | 4 (33.3%) |
| 20 to 24 Years | 19 (95.0%) | 0 (0.0%) |
| 25 to 29 Years | 101 (97.1%) | 2 (2.0%) |
| 30 to 34 Years | 81 (73.0%) | 0 (0.0%) |
| 35 to 44 Years | 230 (84.9%) | 0 (0.0%) |
| 45 to 54 Years | 122 (87.1%) | 0 (0.0%) |
| 55 to 59 Years | 57 (68.7%) | 2 (3.5%) |
| 60 to 64 Years | 13 (41.9%) | 0 (0.0%) |
| 65 to 74 Years | 20 (13.2%) | 0 (0.0%) |
| 75 Years and over | 6 (7.1%) | 3 (50.0%) |
| Total | 660 (62.9%) | 9 (1.4%) |
Employment Status by Educational Attainment in Choudrant
According to labor force statistics for Choudrant, 81.6% of individuals (604) out of the total population between 25 and 64 years of age (740) are in the labor force, with 0.7% or 4 of them being unemployed. The group with the highest labor force participation rate are those with the educational attainment of less than high school, with 100.0% or 17 individuals in the labor force. Within the labor force, individuals with high school diploma education have the highest percentage of unemployment, with 2.5% or 2 of them being unemployed.
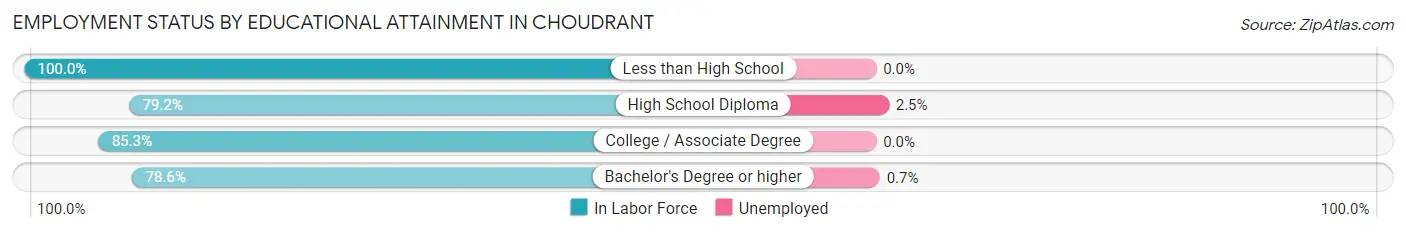
| Educational Attainment | In Labor Force | Unemployed |
| Less than High School | 17 (100.0%) | 0 (0.0%) |
| High School Diploma | 80 (79.2%) | 3 (2.5%) |
| College / Associate Degree | 232 (85.3%) | 0 (0.0%) |
| Bachelor's Degree or higher | 275 (78.6%) | 2 (0.7%) |
| Total | 604 (81.6%) | 5 (0.7%) |
Employment Occupations by Sex in Choudrant
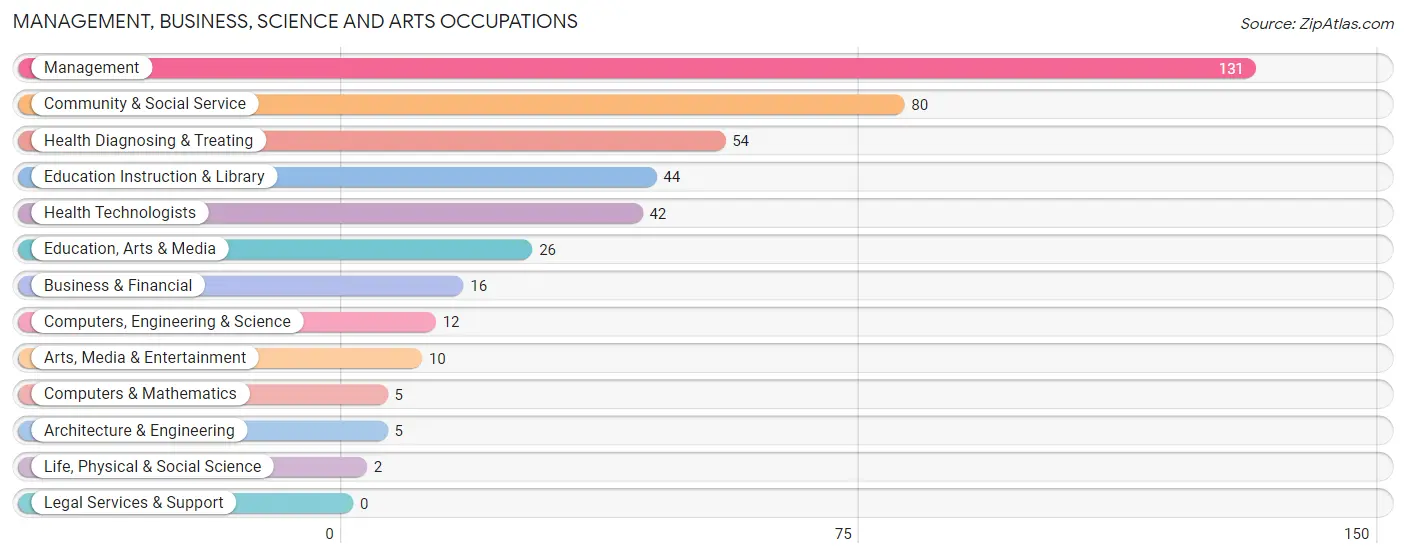
Management, Business, Science and Arts Occupations
The most common Management, Business, Science and Arts occupations in Choudrant are Management (131 | 20.3%), Community & Social Service (80 | 12.4%), Health Diagnosing & Treating (54 | 8.4%), Education Instruction & Library (44 | 6.8%), and Health Technologists (42 | 6.5%).
Management, Business, Science and Arts Occupations by Sex
Within the Management, Business, Science and Arts occupations in Choudrant, the most male-oriented occupations are Computers, Engineering & Science (100.0%), Computers & Mathematics (100.0%), and Architecture & Engineering (100.0%), while the most female-oriented occupations are Education, Arts & Media (100.0%), Health Diagnosing & Treating (77.8%), and Health Technologists (71.4%).
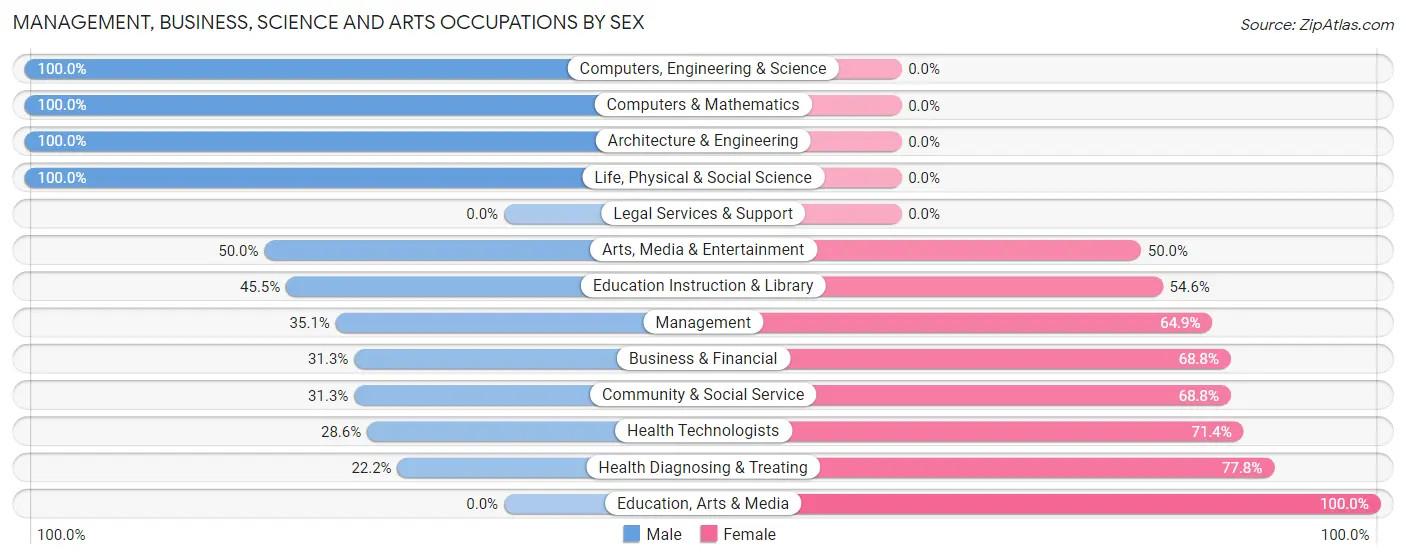
| Occupation | Male | Female |
| Management | 46 (35.1%) | 85 (64.9%) |
| Business & Financial | 5 (31.2%) | 11 (68.8%) |
| Computers, Engineering & Science | 12 (100.0%) | 0 (0.0%) |
| Computers & Mathematics | 5 (100.0%) | 0 (0.0%) |
| Architecture & Engineering | 5 (100.0%) | 0 (0.0%) |
| Life, Physical & Social Science | 2 (100.0%) | 0 (0.0%) |
| Community & Social Service | 25 (31.2%) | 55 (68.8%) |
| Education, Arts & Media | 0 (0.0%) | 26 (100.0%) |
| Legal Services & Support | 0 (0.0%) | 0 (0.0%) |
| Education Instruction & Library | 20 (45.5%) | 24 (54.5%) |
| Arts, Media & Entertainment | 5 (50.0%) | 5 (50.0%) |
| Health Diagnosing & Treating | 12 (22.2%) | 42 (77.8%) |
| Health Technologists | 12 (28.6%) | 30 (71.4%) |
| Total (Category) | 100 (34.1%) | 193 (65.9%) |
| Total (Overall) | 256 (39.6%) | 390 (60.4%) |
Services Occupations
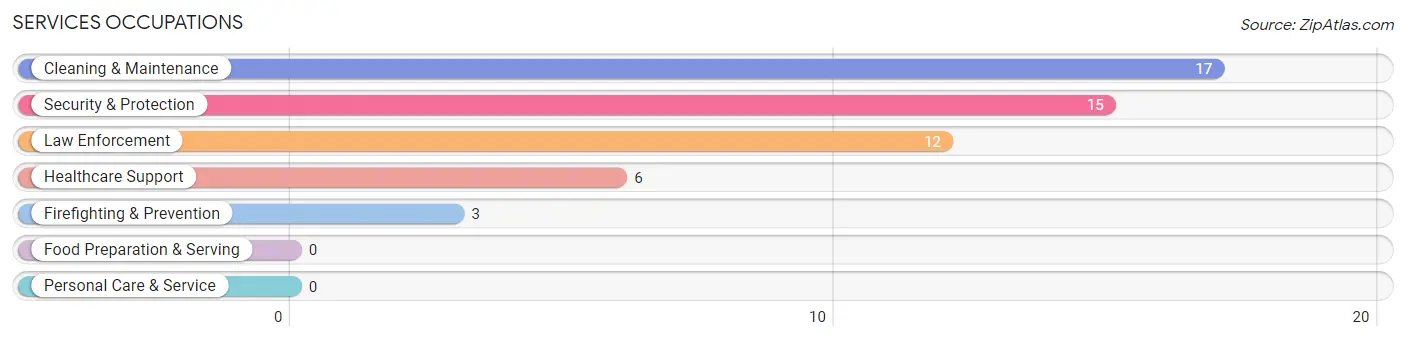
The most common Services occupations in Choudrant are Cleaning & Maintenance (17 | 2.6%), Security & Protection (15 | 2.3%), Law Enforcement (12 | 1.9%), Healthcare Support (6 | 0.9%), and Firefighting & Prevention (3 | 0.5%).
Services Occupations by Sex
Within the Services occupations in Choudrant, the most male-oriented occupations are Security & Protection (100.0%), Firefighting & Prevention (100.0%), and Law Enforcement (100.0%), while the most female-oriented occupations are Healthcare Support (100.0%), and Cleaning & Maintenance (11.8%).
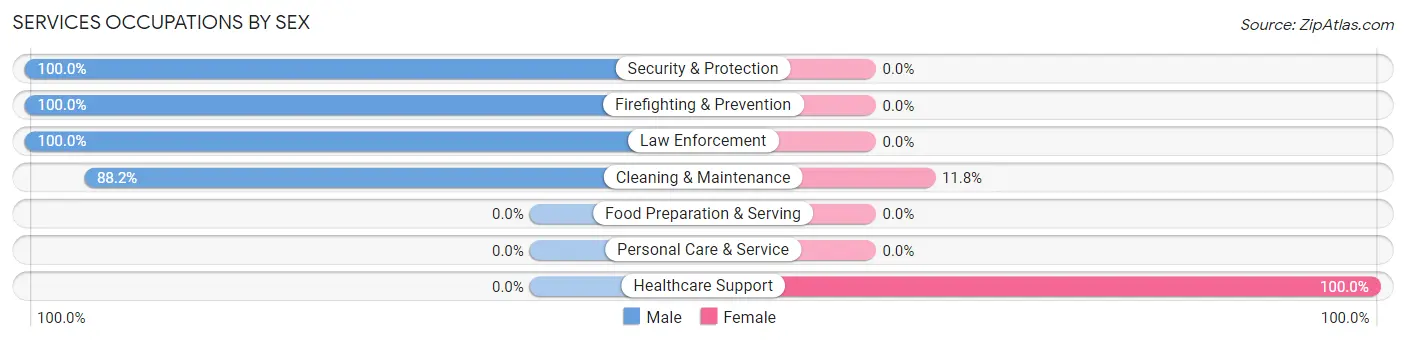
| Occupation | Male | Female |
| Healthcare Support | 0 (0.0%) | 6 (100.0%) |
| Security & Protection | 15 (100.0%) | 0 (0.0%) |
| Firefighting & Prevention | 3 (100.0%) | 0 (0.0%) |
| Law Enforcement | 12 (100.0%) | 0 (0.0%) |
| Food Preparation & Serving | 0 (0.0%) | 0 (0.0%) |
| Cleaning & Maintenance | 15 (88.2%) | 2 (11.8%) |
| Personal Care & Service | 0 (0.0%) | 0 (0.0%) |
| Total (Category) | 30 (78.9%) | 8 (21.0%) |
| Total (Overall) | 256 (39.6%) | 390 (60.4%) |
Sales and Office Occupations
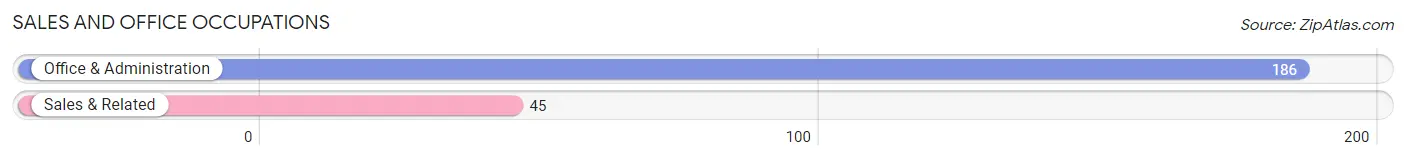
The most common Sales and Office occupations in Choudrant are Office & Administration (186 | 28.8%), and Sales & Related (45 | 7.0%).
Sales and Office Occupations by Sex
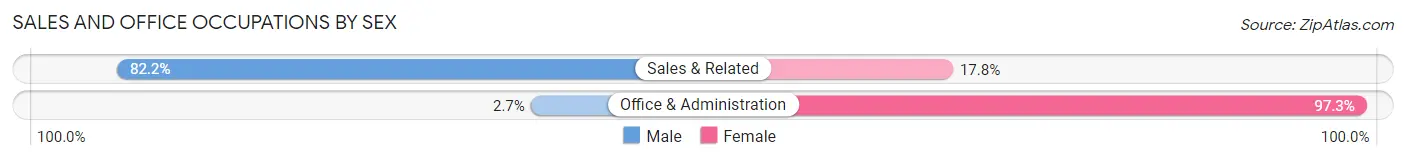
| Occupation | Male | Female |
| Sales & Related | 37 (82.2%) | 8 (17.8%) |
| Office & Administration | 5 (2.7%) | 181 (97.3%) |
| Total (Category) | 42 (18.2%) | 189 (81.8%) |
| Total (Overall) | 256 (39.6%) | 390 (60.4%) |
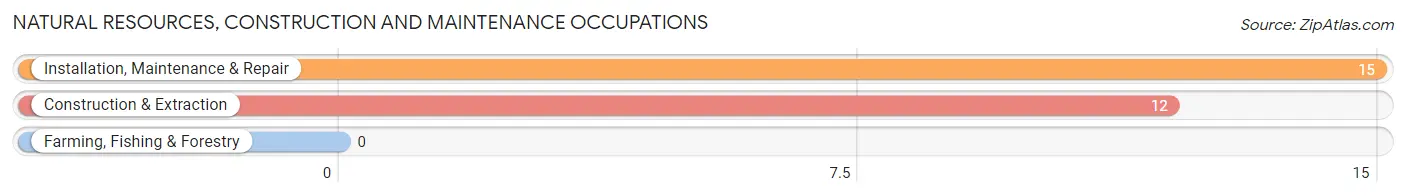
Natural Resources, Construction and Maintenance Occupations
The most common Natural Resources, Construction and Maintenance occupations in Choudrant are Installation, Maintenance & Repair (15 | 2.3%), and Construction & Extraction (12 | 1.9%).
Natural Resources, Construction and Maintenance Occupations by Sex
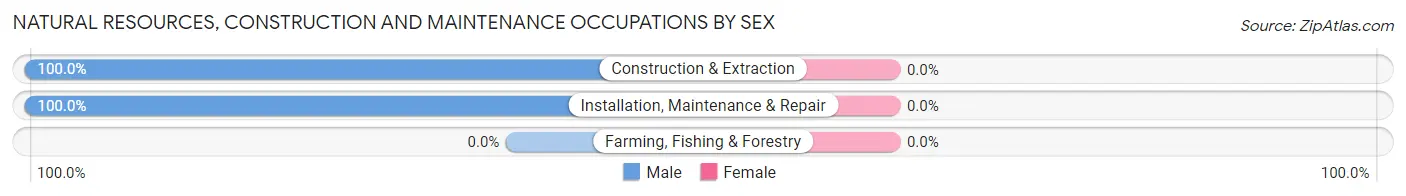
| Occupation | Male | Female |
| Farming, Fishing & Forestry | 0 (0.0%) | 0 (0.0%) |
| Construction & Extraction | 12 (100.0%) | 0 (0.0%) |
| Installation, Maintenance & Repair | 15 (100.0%) | 0 (0.0%) |
| Total (Category) | 27 (100.0%) | 0 (0.0%) |
| Total (Overall) | 256 (39.6%) | 390 (60.4%) |
Production, Transportation and Moving Occupations
The most common Production, Transportation and Moving occupations in Choudrant are Production (30 | 4.6%), Material Moving (19 | 2.9%), and Transportation (8 | 1.2%).
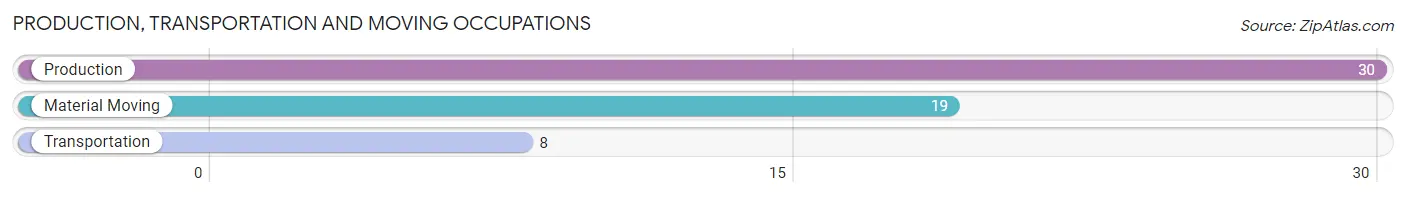
Production, Transportation and Moving Occupations by Sex
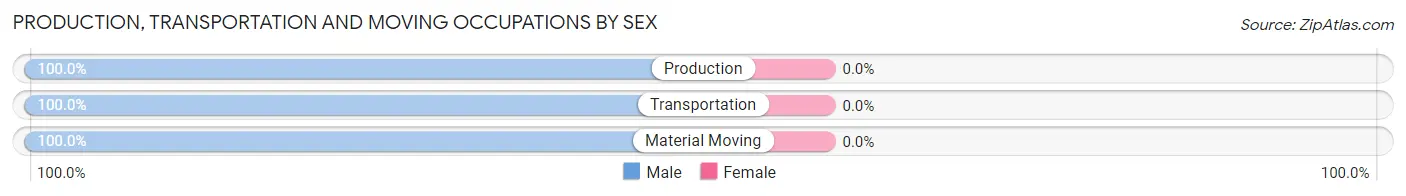
| Occupation | Male | Female |
| Production | 30 (100.0%) | 0 (0.0%) |
| Transportation | 8 (100.0%) | 0 (0.0%) |
| Material Moving | 19 (100.0%) | 0 (0.0%) |
| Total (Category) | 57 (100.0%) | 0 (0.0%) |
| Total (Overall) | 256 (39.6%) | 390 (60.4%) |
Employment Industries by Sex in Choudrant
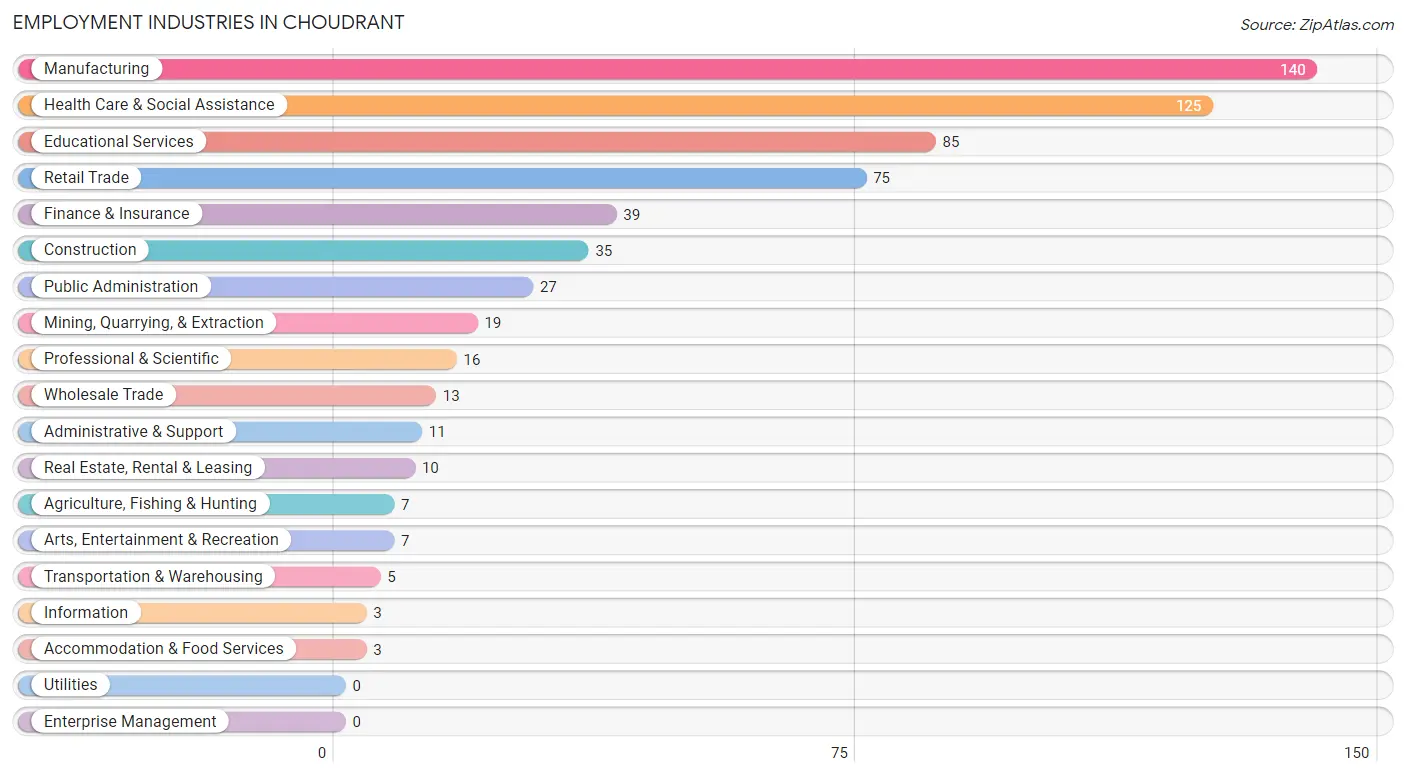
Employment Industries in Choudrant
The major employment industries in Choudrant include Manufacturing (140 | 21.7%), Health Care & Social Assistance (125 | 19.4%), Educational Services (85 | 13.2%), Retail Trade (75 | 11.6%), and Finance & Insurance (39 | 6.0%).
Employment Industries by Sex in Choudrant
The Choudrant industries that see more men than women are Agriculture, Fishing & Hunting (100.0%), Mining, Quarrying, & Extraction (100.0%), and Transportation & Warehousing (100.0%), whereas the industries that tend to have a higher number of women are Construction (100.0%), Information (100.0%), and Accommodation & Food Services (100.0%).
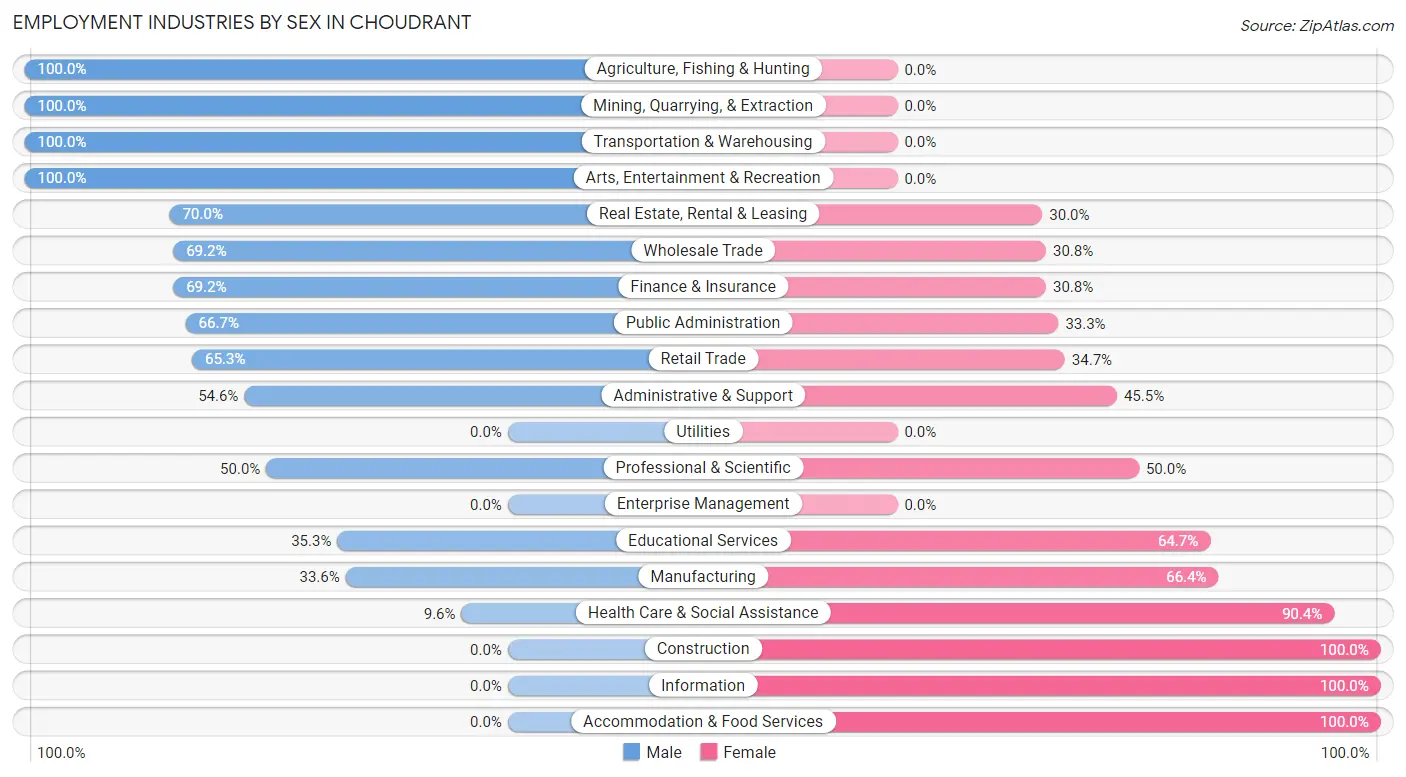
| Industry | Male | Female |
| Agriculture, Fishing & Hunting | 7 (100.0%) | 0 (0.0%) |
| Mining, Quarrying, & Extraction | 19 (100.0%) | 0 (0.0%) |
| Construction | 0 (0.0%) | 35 (100.0%) |
| Manufacturing | 47 (33.6%) | 93 (66.4%) |
| Wholesale Trade | 9 (69.2%) | 4 (30.8%) |
| Retail Trade | 49 (65.3%) | 26 (34.7%) |
| Transportation & Warehousing | 5 (100.0%) | 0 (0.0%) |
| Utilities | 0 (0.0%) | 0 (0.0%) |
| Information | 0 (0.0%) | 3 (100.0%) |
| Finance & Insurance | 27 (69.2%) | 12 (30.8%) |
| Real Estate, Rental & Leasing | 7 (70.0%) | 3 (30.0%) |
| Professional & Scientific | 8 (50.0%) | 8 (50.0%) |
| Enterprise Management | 0 (0.0%) | 0 (0.0%) |
| Administrative & Support | 6 (54.5%) | 5 (45.5%) |
| Educational Services | 30 (35.3%) | 55 (64.7%) |
| Health Care & Social Assistance | 12 (9.6%) | 113 (90.4%) |
| Arts, Entertainment & Recreation | 7 (100.0%) | 0 (0.0%) |
| Accommodation & Food Services | 0 (0.0%) | 3 (100.0%) |
| Public Administration | 18 (66.7%) | 9 (33.3%) |
| Total | 256 (39.6%) | 390 (60.4%) |
Education in Choudrant
School Enrollment in Choudrant
The most common levels of schooling among the 412 students in Choudrant are elementary school (169 | 41.0%), middle school (90 | 21.8%), and high school (51 | 12.4%).
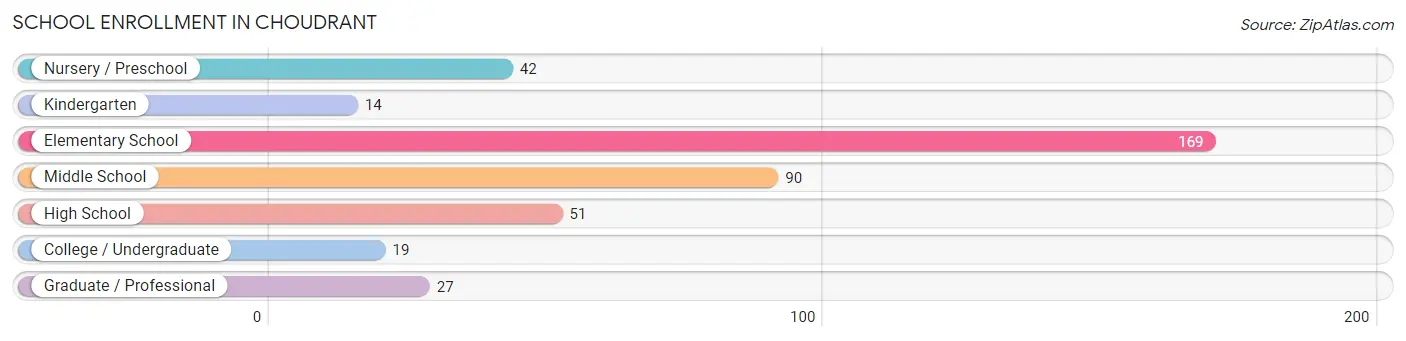
| School Level | # Students | % Students |
| Nursery / Preschool | 42 | 10.2% |
| Kindergarten | 14 | 3.4% |
| Elementary School | 169 | 41.0% |
| Middle School | 90 | 21.8% |
| High School | 51 | 12.4% |
| College / Undergraduate | 19 | 4.6% |
| Graduate / Professional | 27 | 6.6% |
| Total | 412 | 100.0% |
School Enrollment by Age by Funding Source in Choudrant
Out of a total of 412 students who are enrolled in schools in Choudrant, 85 (20.6%) attend a private institution, while the remaining 327 (79.4%) are enrolled in public schools. The age group of 20 to 24 year olds has the highest likelihood of being enrolled in private schools, with 7 (46.7% in the age bracket) enrolled. Conversely, the age group of 18 to 19 year olds has the lowest likelihood of being enrolled in a private school, with 7 (100.0% in the age bracket) attending a public institution.
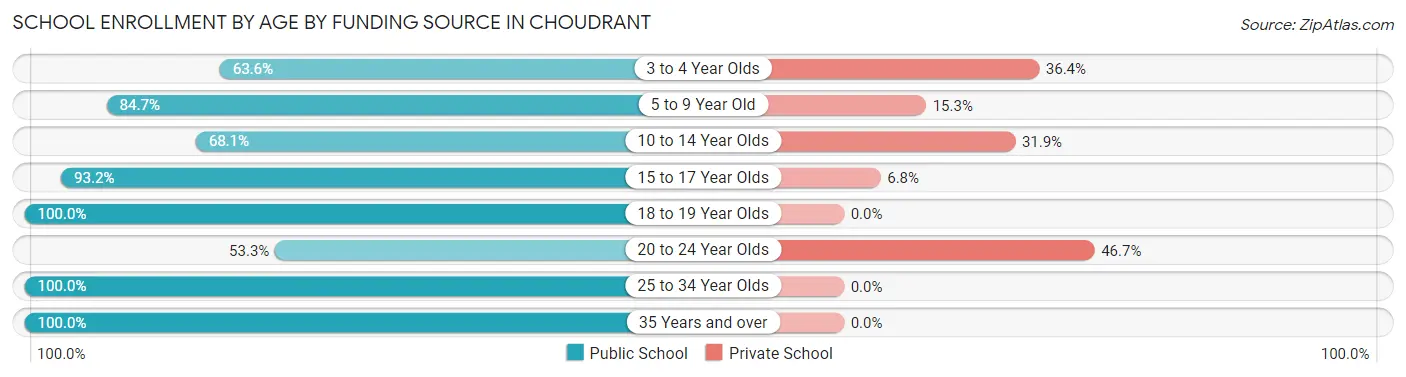
| Age Bracket | Public School | Private School |
| 3 to 4 Year Olds | 21 (63.6%) | 12 (36.4%) |
| 5 to 9 Year Old | 144 (84.7%) | 26 (15.3%) |
| 10 to 14 Year Olds | 79 (68.1%) | 37 (31.9%) |
| 15 to 17 Year Olds | 41 (93.2%) | 3 (6.8%) |
| 18 to 19 Year Olds | 7 (100.0%) | 0 (0.0%) |
| 20 to 24 Year Olds | 8 (53.3%) | 7 (46.7%) |
| 25 to 34 Year Olds | 7 (100.0%) | 0 (0.0%) |
| 35 Years and over | 20 (100.0%) | 0 (0.0%) |
| Total | 327 (79.4%) | 85 (20.6%) |
Educational Attainment by Field of Study in Choudrant
Business (128 | 30.6%), education (69 | 16.5%), science & technology (54 | 12.9%), arts & humanities (43 | 10.3%), and engineering (28 | 6.7%) are the most common fields of study among 418 individuals in Choudrant who have obtained a bachelor's degree or higher.
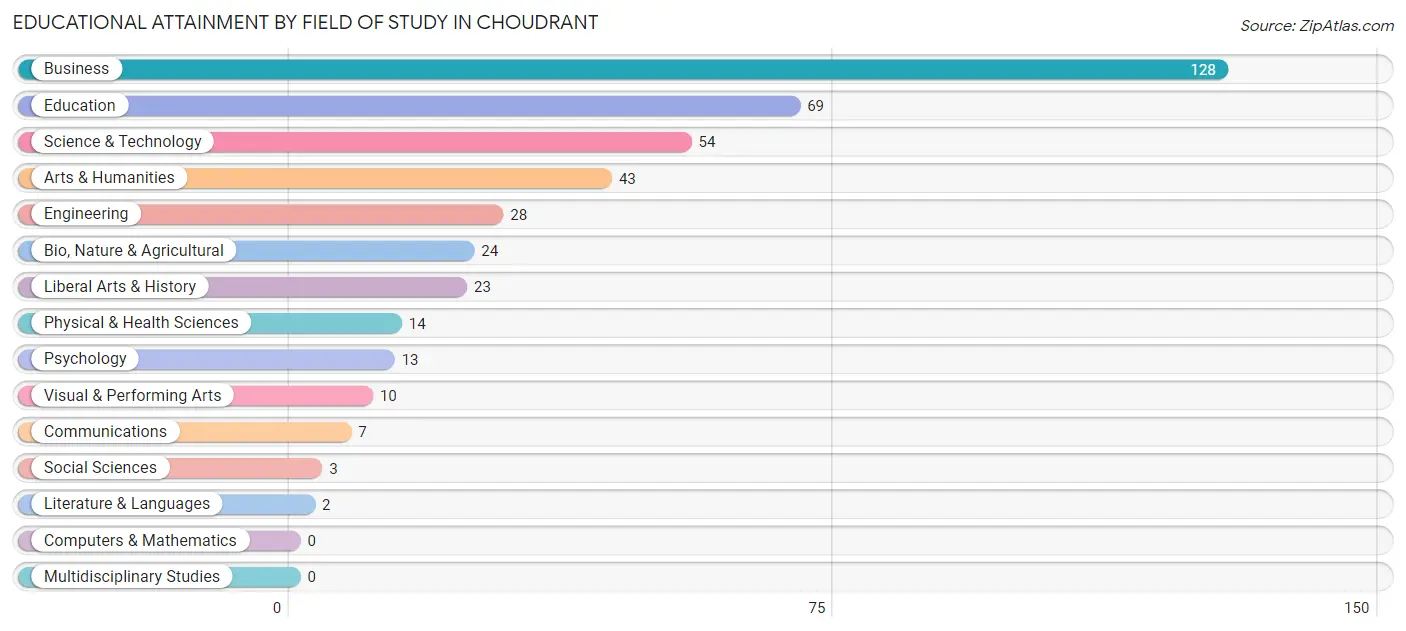
| Field of Study | # Graduates | % Graduates |
| Computers & Mathematics | 0 | 0.0% |
| Bio, Nature & Agricultural | 24 | 5.7% |
| Physical & Health Sciences | 14 | 3.4% |
| Psychology | 13 | 3.1% |
| Social Sciences | 3 | 0.7% |
| Engineering | 28 | 6.7% |
| Multidisciplinary Studies | 0 | 0.0% |
| Science & Technology | 54 | 12.9% |
| Business | 128 | 30.6% |
| Education | 69 | 16.5% |
| Literature & Languages | 2 | 0.5% |
| Liberal Arts & History | 23 | 5.5% |
| Visual & Performing Arts | 10 | 2.4% |
| Communications | 7 | 1.7% |
| Arts & Humanities | 43 | 10.3% |
| Total | 418 | 100.0% |
Transportation & Commute in Choudrant
Vehicle Availability by Sex in Choudrant
The most prevalent vehicle ownership categories in Choudrant are males with 2 vehicles (146, accounting for 55.9%) and females with 2 vehicles (103, making up 37.4%).
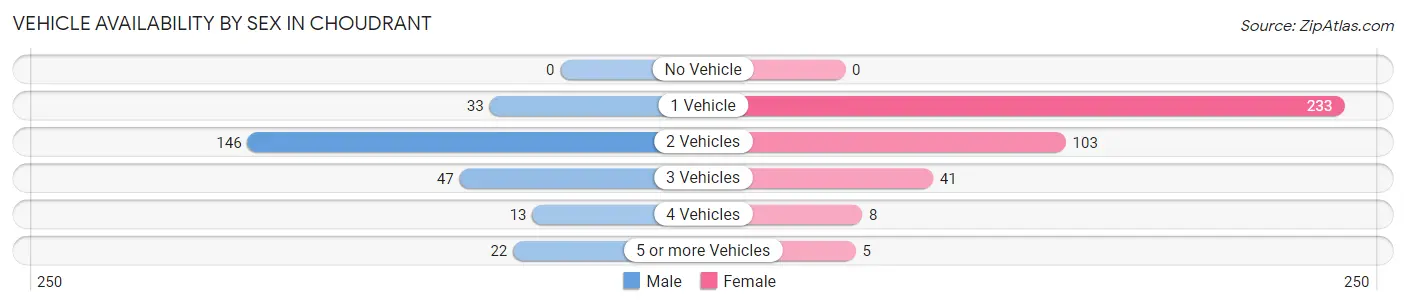
| Vehicles Available | Male | Female |
| No Vehicle | 0 (0.0%) | 0 (0.0%) |
| 1 Vehicle | 33 (12.6%) | 233 (59.7%) |
| 2 Vehicles | 146 (55.9%) | 103 (26.4%) |
| 3 Vehicles | 47 (18.0%) | 41 (10.5%) |
| 4 Vehicles | 13 (5.0%) | 8 (2.1%) |
| 5 or more Vehicles | 22 (8.4%) | 5 (1.3%) |
| Total | 261 (100.0%) | 390 (100.0%) |
Commute Time in Choudrant
The most frequently occuring commute durations in Choudrant are 10 to 14 minutes (203 commuters, 32.4%), 15 to 19 minutes (161 commuters, 25.7%), and less than 5 minutes (106 commuters, 16.9%).
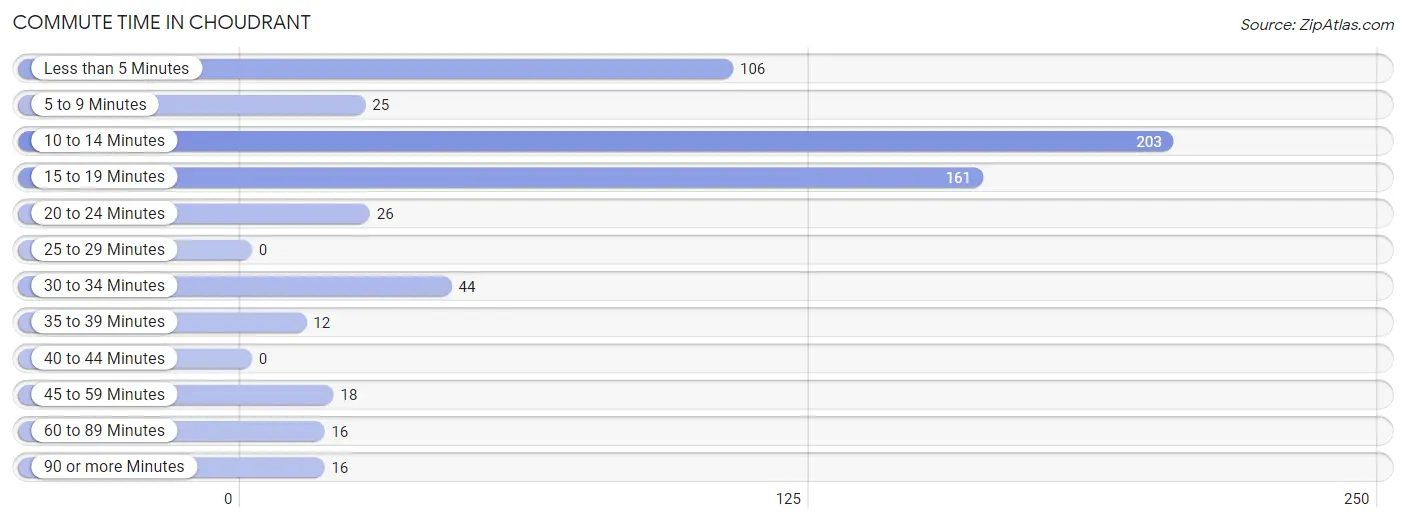
| Commute Time | # Commuters | % Commuters |
| Less than 5 Minutes | 106 | 16.9% |
| 5 to 9 Minutes | 25 | 4.0% |
| 10 to 14 Minutes | 203 | 32.4% |
| 15 to 19 Minutes | 161 | 25.7% |
| 20 to 24 Minutes | 26 | 4.2% |
| 25 to 29 Minutes | 0 | 0.0% |
| 30 to 34 Minutes | 44 | 7.0% |
| 35 to 39 Minutes | 12 | 1.9% |
| 40 to 44 Minutes | 0 | 0.0% |
| 45 to 59 Minutes | 18 | 2.9% |
| 60 to 89 Minutes | 16 | 2.5% |
| 90 or more Minutes | 16 | 2.5% |
Commute Time by Sex in Choudrant
The most common commute times in Choudrant are 10 to 14 minutes (95 commuters, 38.8%) for males and 15 to 19 minutes (113 commuters, 29.6%) for females.
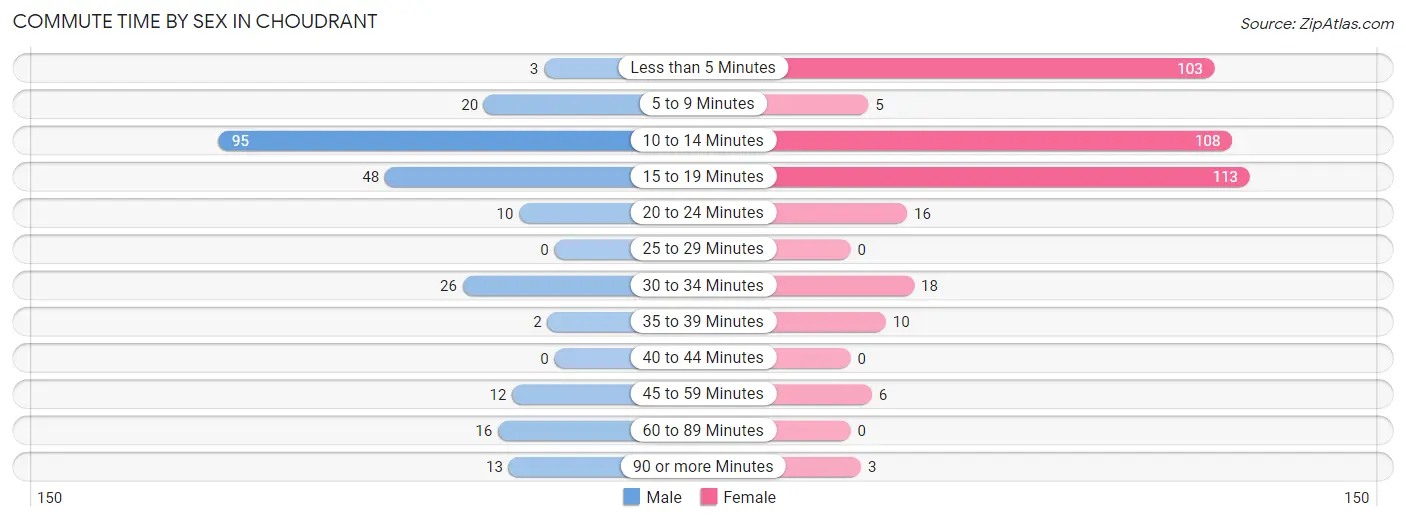
| Commute Time | Male | Female |
| Less than 5 Minutes | 3 (1.2%) | 103 (27.0%) |
| 5 to 9 Minutes | 20 (8.2%) | 5 (1.3%) |
| 10 to 14 Minutes | 95 (38.8%) | 108 (28.3%) |
| 15 to 19 Minutes | 48 (19.6%) | 113 (29.6%) |
| 20 to 24 Minutes | 10 (4.1%) | 16 (4.2%) |
| 25 to 29 Minutes | 0 (0.0%) | 0 (0.0%) |
| 30 to 34 Minutes | 26 (10.6%) | 18 (4.7%) |
| 35 to 39 Minutes | 2 (0.8%) | 10 (2.6%) |
| 40 to 44 Minutes | 0 (0.0%) | 0 (0.0%) |
| 45 to 59 Minutes | 12 (4.9%) | 6 (1.6%) |
| 60 to 89 Minutes | 16 (6.5%) | 0 (0.0%) |
| 90 or more Minutes | 13 (5.3%) | 3 (0.8%) |
Time of Departure to Work by Sex in Choudrant
The most frequent times of departure to work in Choudrant are 7:00 AM to 7:29 AM (51, 20.8%) for males and 6:30 AM to 6:59 AM (104, 27.2%) for females.
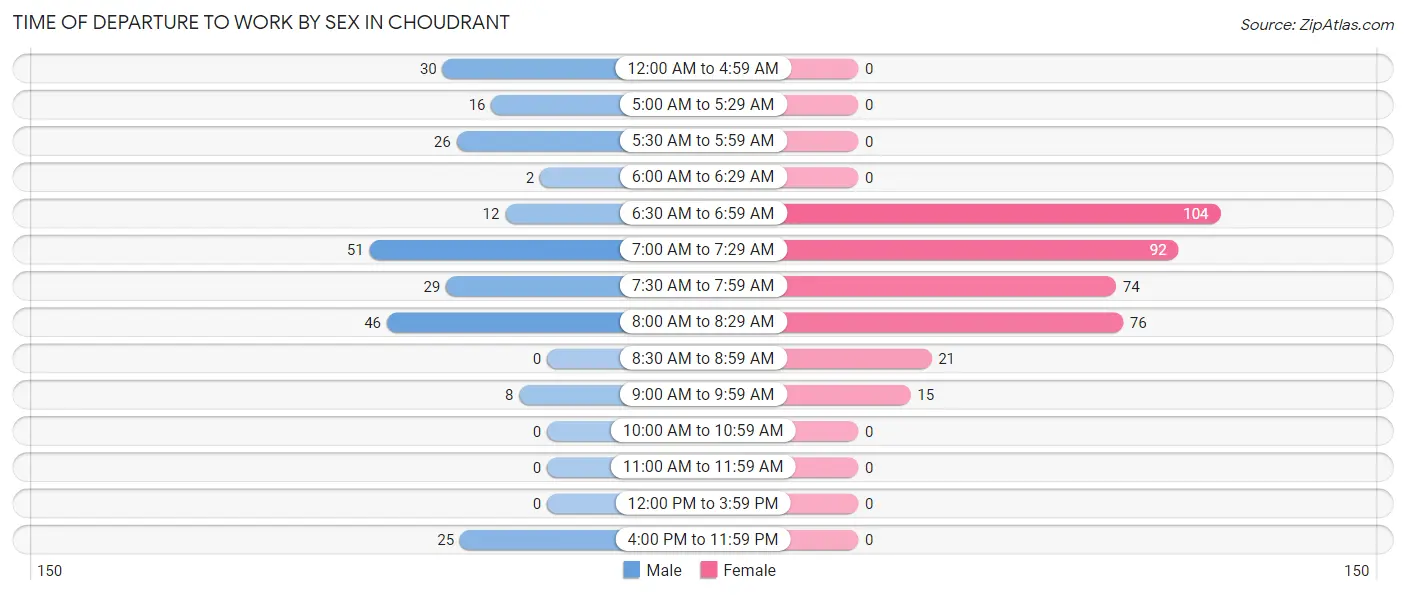
| Time of Departure | Male | Female |
| 12:00 AM to 4:59 AM | 30 (12.2%) | 0 (0.0%) |
| 5:00 AM to 5:29 AM | 16 (6.5%) | 0 (0.0%) |
| 5:30 AM to 5:59 AM | 26 (10.6%) | 0 (0.0%) |
| 6:00 AM to 6:29 AM | 2 (0.8%) | 0 (0.0%) |
| 6:30 AM to 6:59 AM | 12 (4.9%) | 104 (27.2%) |
| 7:00 AM to 7:29 AM | 51 (20.8%) | 92 (24.1%) |
| 7:30 AM to 7:59 AM | 29 (11.8%) | 74 (19.4%) |
| 8:00 AM to 8:29 AM | 46 (18.8%) | 76 (19.9%) |
| 8:30 AM to 8:59 AM | 0 (0.0%) | 21 (5.5%) |
| 9:00 AM to 9:59 AM | 8 (3.3%) | 15 (3.9%) |
| 10:00 AM to 10:59 AM | 0 (0.0%) | 0 (0.0%) |
| 11:00 AM to 11:59 AM | 0 (0.0%) | 0 (0.0%) |
| 12:00 PM to 3:59 PM | 0 (0.0%) | 0 (0.0%) |
| 4:00 PM to 11:59 PM | 25 (10.2%) | 0 (0.0%) |
| Total | 245 (100.0%) | 382 (100.0%) |
Housing Occupancy in Choudrant
Occupancy by Ownership in Choudrant
Of the total 507 dwellings in Choudrant, owner-occupied units account for 281 (55.4%), while renter-occupied units make up 226 (44.6%).
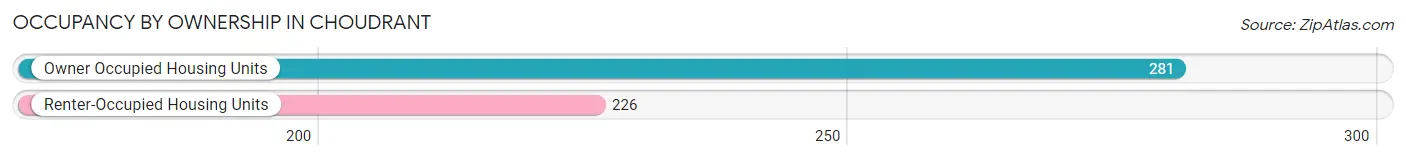
| Occupancy | # Housing Units | % Housing Units |
| Owner Occupied Housing Units | 281 | 55.4% |
| Renter-Occupied Housing Units | 226 | 44.6% |
| Total Occupied Housing Units | 507 | 100.0% |
Occupancy by Household Size in Choudrant
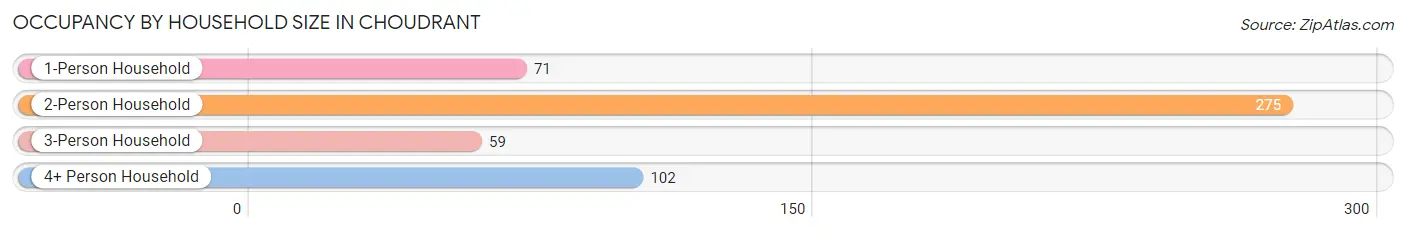
| Household Size | # Housing Units | % Housing Units |
| 1-Person Household | 71 | 14.0% |
| 2-Person Household | 275 | 54.2% |
| 3-Person Household | 59 | 11.6% |
| 4+ Person Household | 102 | 20.1% |
| Total Housing Units | 507 | 100.0% |
Occupancy by Ownership by Household Size in Choudrant
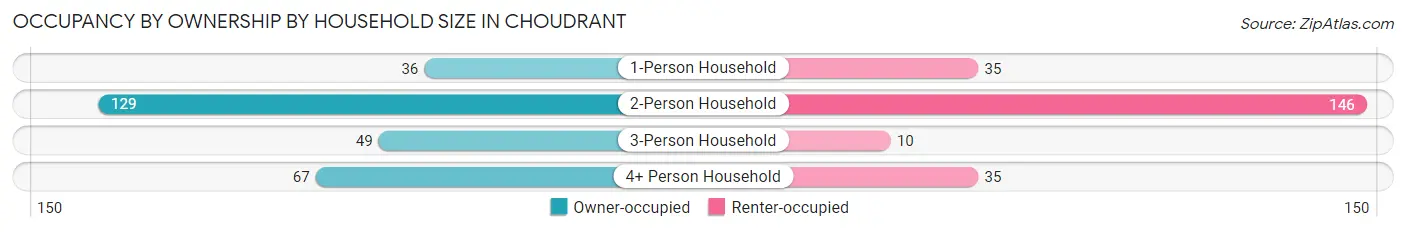
| Household Size | Owner-occupied | Renter-occupied |
| 1-Person Household | 36 (50.7%) | 35 (49.3%) |
| 2-Person Household | 129 (46.9%) | 146 (53.1%) |
| 3-Person Household | 49 (83.1%) | 10 (17.0%) |
| 4+ Person Household | 67 (65.7%) | 35 (34.3%) |
| Total Housing Units | 281 (55.4%) | 226 (44.6%) |
Occupancy by Educational Attainment in Choudrant
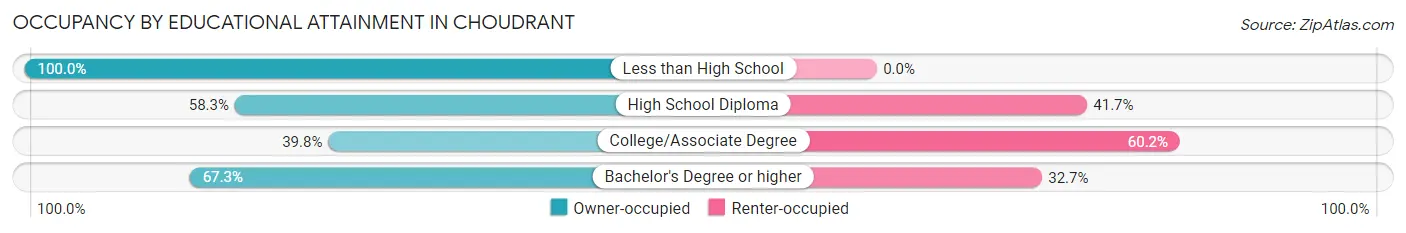
| Household Size | Owner-occupied | Renter-occupied |
| Less than High School | 4 (100.0%) | 0 (0.0%) |
| High School Diploma | 49 (58.3%) | 35 (41.7%) |
| College/Associate Degree | 78 (39.8%) | 118 (60.2%) |
| Bachelor's Degree or higher | 150 (67.3%) | 73 (32.7%) |
Occupancy by Age of Householder in Choudrant
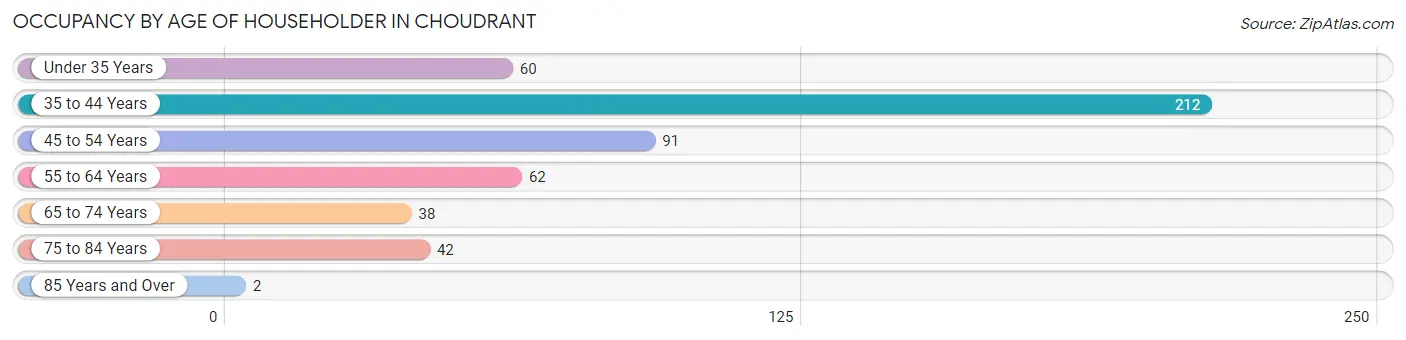
| Age Bracket | # Households | % Households |
| Under 35 Years | 60 | 11.8% |
| 35 to 44 Years | 212 | 41.8% |
| 45 to 54 Years | 91 | 17.9% |
| 55 to 64 Years | 62 | 12.2% |
| 65 to 74 Years | 38 | 7.5% |
| 75 to 84 Years | 42 | 8.3% |
| 85 Years and Over | 2 | 0.4% |
| Total | 507 | 100.0% |
Housing Finances in Choudrant
Median Income by Occupancy in Choudrant
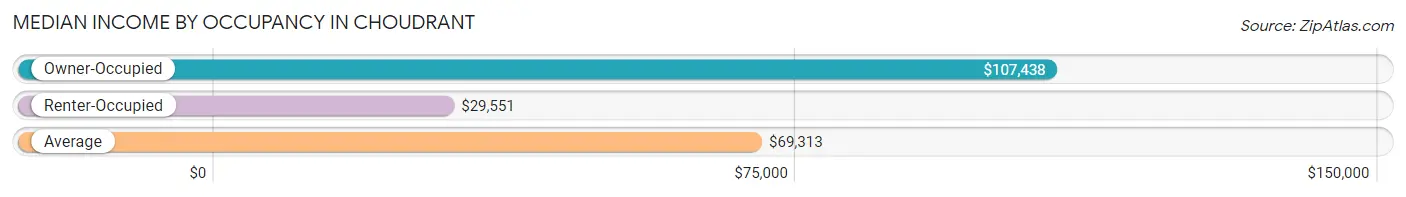
| Occupancy Type | # Households | Median Income |
| Owner-Occupied | 281 (55.4%) | $107,438 |
| Renter-Occupied | 226 (44.6%) | $29,551 |
| Average | 507 (100.0%) | $69,313 |
Occupancy by Householder Income Bracket in Choudrant
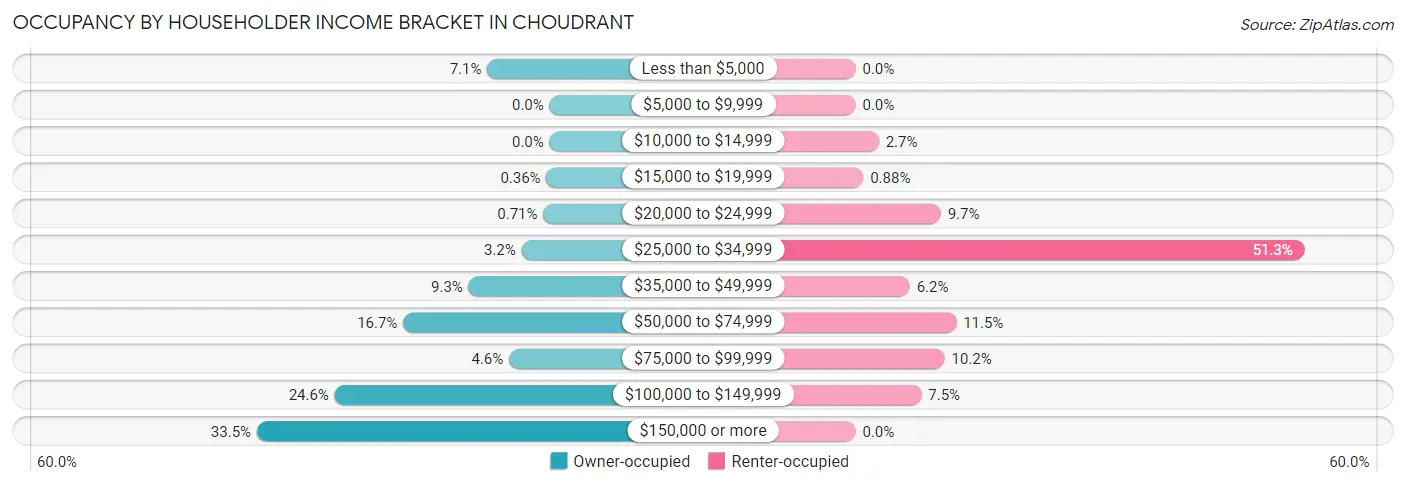
| Income Bracket | Owner-occupied | Renter-occupied |
| Less than $5,000 | 20 (7.1%) | 0 (0.0%) |
| $5,000 to $9,999 | 0 (0.0%) | 0 (0.0%) |
| $10,000 to $14,999 | 0 (0.0%) | 6 (2.6%) |
| $15,000 to $19,999 | 1 (0.4%) | 2 (0.9%) |
| $20,000 to $24,999 | 2 (0.7%) | 22 (9.7%) |
| $25,000 to $34,999 | 9 (3.2%) | 116 (51.3%) |
| $35,000 to $49,999 | 26 (9.2%) | 14 (6.2%) |
| $50,000 to $74,999 | 47 (16.7%) | 26 (11.5%) |
| $75,000 to $99,999 | 13 (4.6%) | 23 (10.2%) |
| $100,000 to $149,999 | 69 (24.6%) | 17 (7.5%) |
| $150,000 or more | 94 (33.5%) | 0 (0.0%) |
| Total | 281 (100.0%) | 226 (100.0%) |
Monthly Housing Cost Tiers in Choudrant
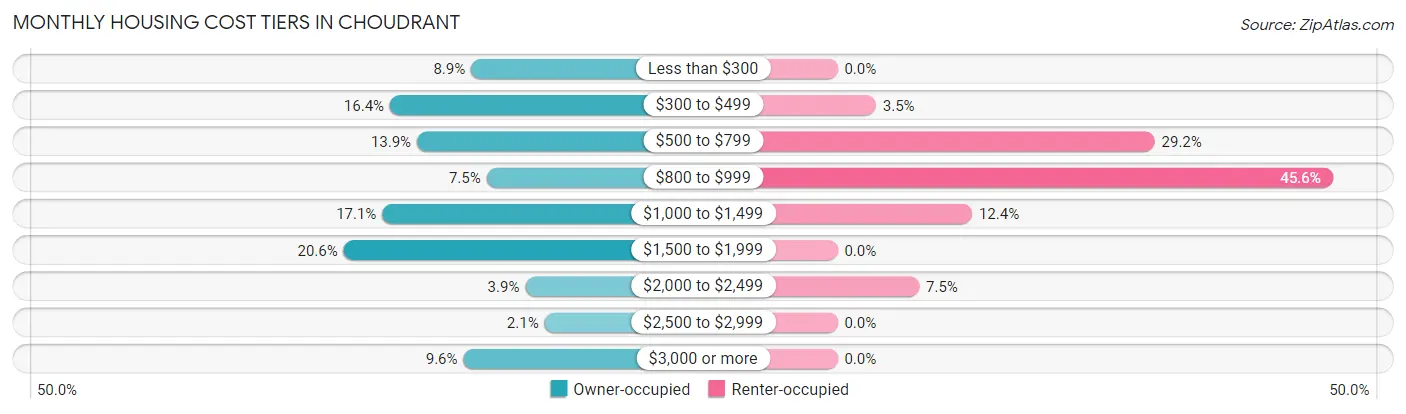
| Monthly Cost | Owner-occupied | Renter-occupied |
| Less than $300 | 25 (8.9%) | 0 (0.0%) |
| $300 to $499 | 46 (16.4%) | 8 (3.5%) |
| $500 to $799 | 39 (13.9%) | 66 (29.2%) |
| $800 to $999 | 21 (7.5%) | 103 (45.6%) |
| $1,000 to $1,499 | 48 (17.1%) | 28 (12.4%) |
| $1,500 to $1,999 | 58 (20.6%) | 0 (0.0%) |
| $2,000 to $2,499 | 11 (3.9%) | 17 (7.5%) |
| $2,500 to $2,999 | 6 (2.1%) | 0 (0.0%) |
| $3,000 or more | 27 (9.6%) | 0 (0.0%) |
| Total | 281 (100.0%) | 226 (100.0%) |
Physical Housing Characteristics in Choudrant
Housing Structures in Choudrant
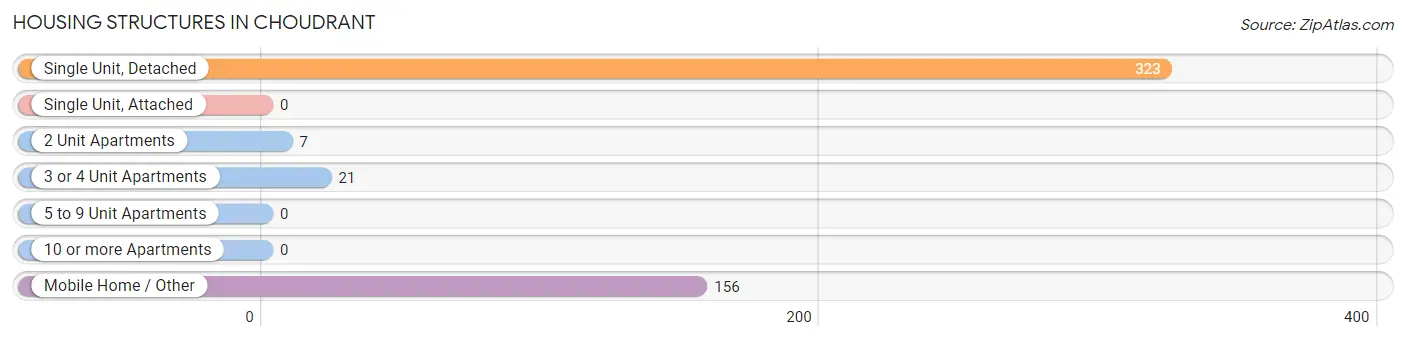
| Structure Type | # Housing Units | % Housing Units |
| Single Unit, Detached | 323 | 63.7% |
| Single Unit, Attached | 0 | 0.0% |
| 2 Unit Apartments | 7 | 1.4% |
| 3 or 4 Unit Apartments | 21 | 4.1% |
| 5 to 9 Unit Apartments | 0 | 0.0% |
| 10 or more Apartments | 0 | 0.0% |
| Mobile Home / Other | 156 | 30.8% |
| Total | 507 | 100.0% |
Housing Structures by Occupancy in Choudrant
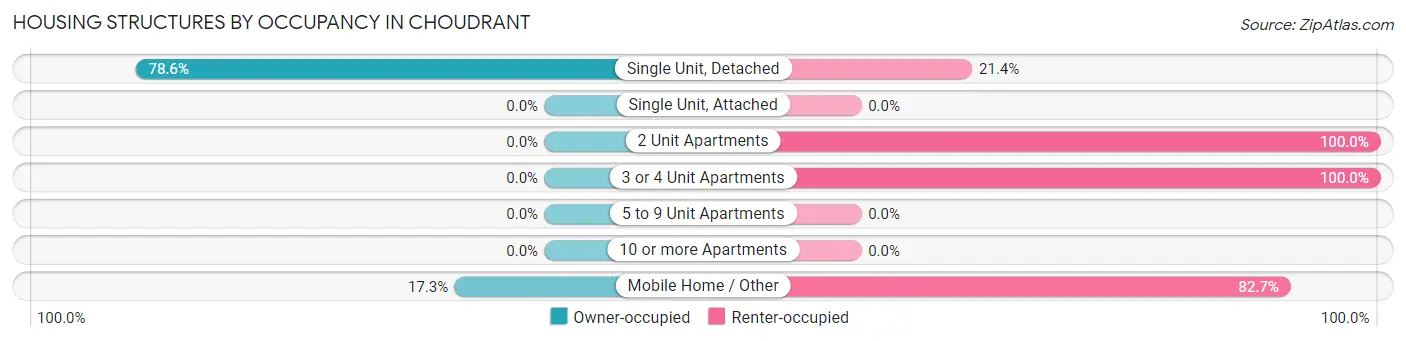
| Structure Type | Owner-occupied | Renter-occupied |
| Single Unit, Detached | 254 (78.6%) | 69 (21.4%) |
| Single Unit, Attached | 0 (0.0%) | 0 (0.0%) |
| 2 Unit Apartments | 0 (0.0%) | 7 (100.0%) |
| 3 or 4 Unit Apartments | 0 (0.0%) | 21 (100.0%) |
| 5 to 9 Unit Apartments | 0 (0.0%) | 0 (0.0%) |
| 10 or more Apartments | 0 (0.0%) | 0 (0.0%) |
| Mobile Home / Other | 27 (17.3%) | 129 (82.7%) |
| Total | 281 (55.4%) | 226 (44.6%) |
Housing Structures by Number of Rooms in Choudrant
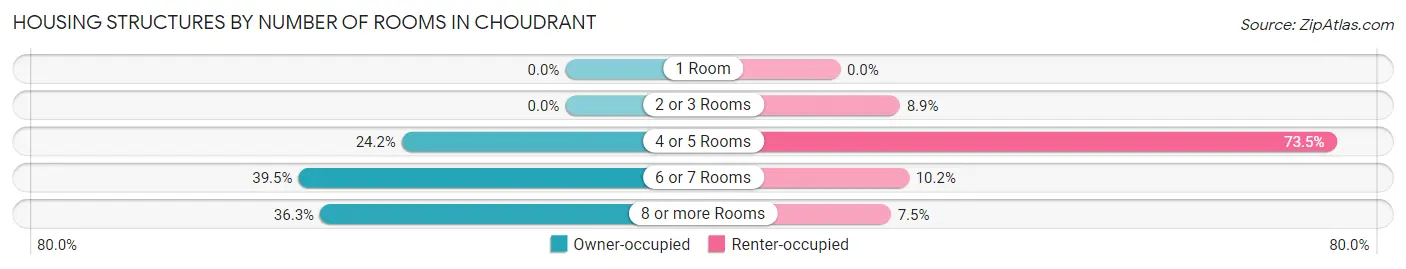
| Number of Rooms | Owner-occupied | Renter-occupied |
| 1 Room | 0 (0.0%) | 0 (0.0%) |
| 2 or 3 Rooms | 0 (0.0%) | 20 (8.8%) |
| 4 or 5 Rooms | 68 (24.2%) | 166 (73.5%) |
| 6 or 7 Rooms | 111 (39.5%) | 23 (10.2%) |
| 8 or more Rooms | 102 (36.3%) | 17 (7.5%) |
| Total | 281 (100.0%) | 226 (100.0%) |
Housing Structure by Heating Type in Choudrant
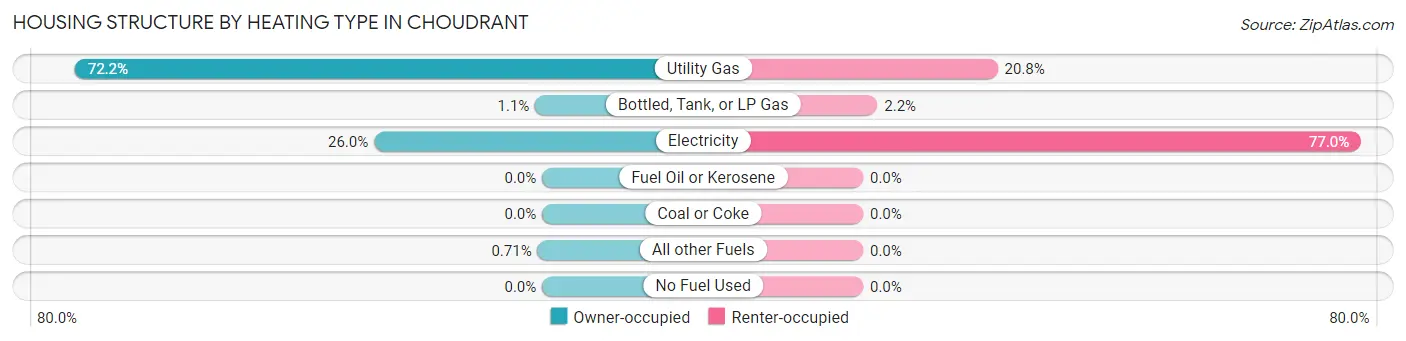
| Heating Type | Owner-occupied | Renter-occupied |
| Utility Gas | 203 (72.2%) | 47 (20.8%) |
| Bottled, Tank, or LP Gas | 3 (1.1%) | 5 (2.2%) |
| Electricity | 73 (26.0%) | 174 (77.0%) |
| Fuel Oil or Kerosene | 0 (0.0%) | 0 (0.0%) |
| Coal or Coke | 0 (0.0%) | 0 (0.0%) |
| All other Fuels | 2 (0.7%) | 0 (0.0%) |
| No Fuel Used | 0 (0.0%) | 0 (0.0%) |
| Total | 281 (100.0%) | 226 (100.0%) |
Household Vehicle Usage in Choudrant
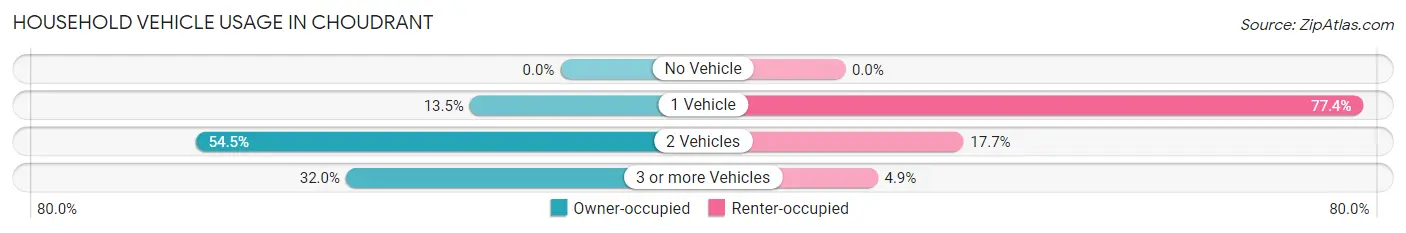
| Vehicles per Household | Owner-occupied | Renter-occupied |
| No Vehicle | 0 (0.0%) | 0 (0.0%) |
| 1 Vehicle | 38 (13.5%) | 175 (77.4%) |
| 2 Vehicles | 153 (54.4%) | 40 (17.7%) |
| 3 or more Vehicles | 90 (32.0%) | 11 (4.9%) |
| Total | 281 (100.0%) | 226 (100.0%) |
Real Estate & Mortgages in Choudrant
Real Estate and Mortgage Overview in Choudrant
| Characteristic | Without Mortgage | With Mortgage |
| Housing Units | 130 | 151 |
| Median Property Value | $288,900 | $264,400 |
| Median Household Income | $105,250 | $59 |
| Monthly Housing Costs | $484 | $20 |
| Real Estate Taxes | $1,803 | $10 |
Property Value by Mortgage Status in Choudrant
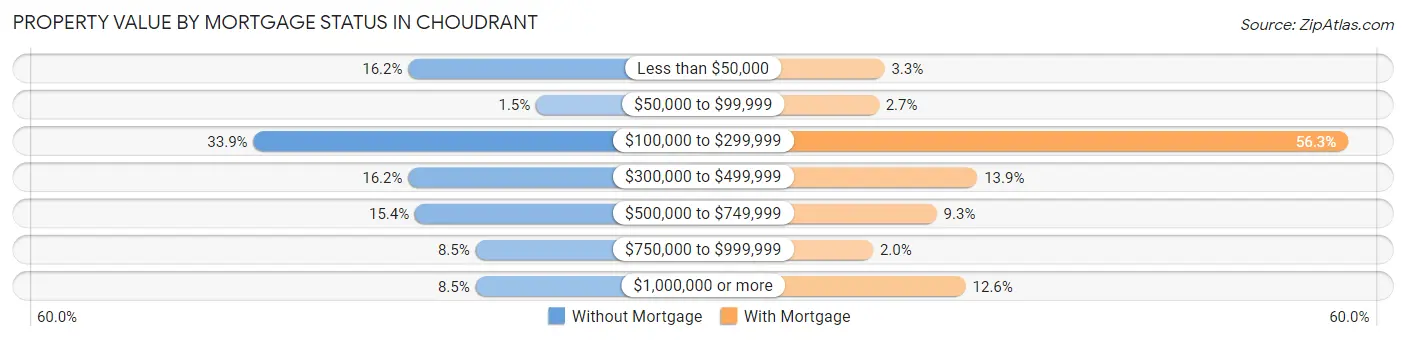
| Property Value | Without Mortgage | With Mortgage |
| Less than $50,000 | 21 (16.2%) | 5 (3.3%) |
| $50,000 to $99,999 | 2 (1.5%) | 4 (2.6%) |
| $100,000 to $299,999 | 44 (33.9%) | 85 (56.3%) |
| $300,000 to $499,999 | 21 (16.2%) | 21 (13.9%) |
| $500,000 to $749,999 | 20 (15.4%) | 14 (9.3%) |
| $750,000 to $999,999 | 11 (8.5%) | 3 (2.0%) |
| $1,000,000 or more | 11 (8.5%) | 19 (12.6%) |
| Total | 130 (100.0%) | 151 (100.0%) |
Household Income by Mortgage Status in Choudrant
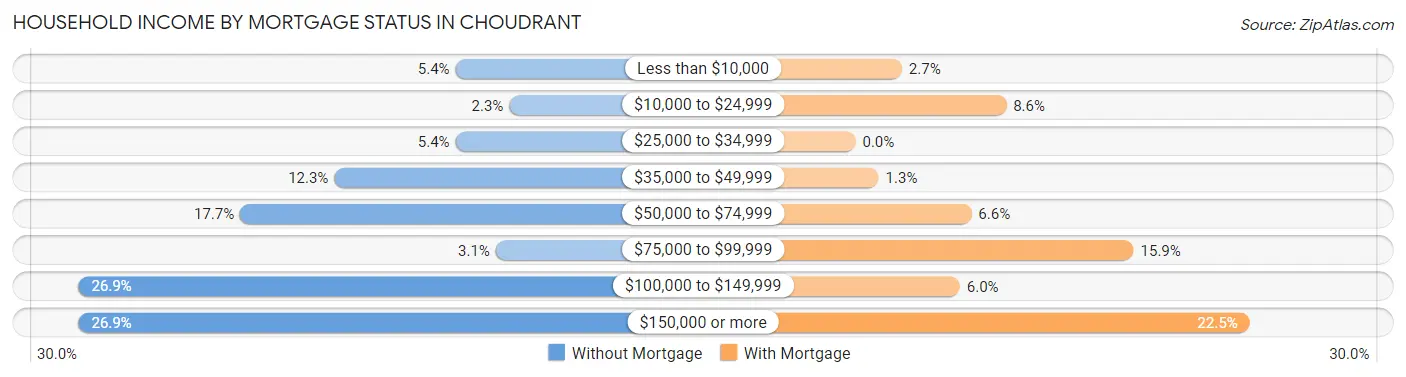
| Household Income | Without Mortgage | With Mortgage |
| Less than $10,000 | 7 (5.4%) | 4 (2.6%) |
| $10,000 to $24,999 | 3 (2.3%) | 13 (8.6%) |
| $25,000 to $34,999 | 7 (5.4%) | 0 (0.0%) |
| $35,000 to $49,999 | 16 (12.3%) | 2 (1.3%) |
| $50,000 to $74,999 | 23 (17.7%) | 10 (6.6%) |
| $75,000 to $99,999 | 4 (3.1%) | 24 (15.9%) |
| $100,000 to $149,999 | 35 (26.9%) | 9 (6.0%) |
| $150,000 or more | 35 (26.9%) | 34 (22.5%) |
| Total | 130 (100.0%) | 151 (100.0%) |
Property Value to Household Income Ratio in Choudrant
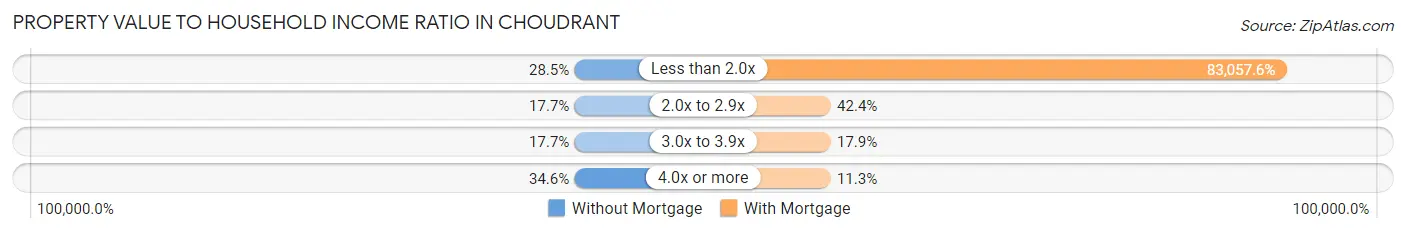
| Value-to-Income Ratio | Without Mortgage | With Mortgage |
| Less than 2.0x | 37 (28.5%) | 125,417 (83,057.6%) |
| 2.0x to 2.9x | 23 (17.7%) | 64 (42.4%) |
| 3.0x to 3.9x | 23 (17.7%) | 27 (17.9%) |
| 4.0x or more | 45 (34.6%) | 17 (11.3%) |
| Total | 130 (100.0%) | 151 (100.0%) |
Real Estate Taxes by Mortgage Status in Choudrant
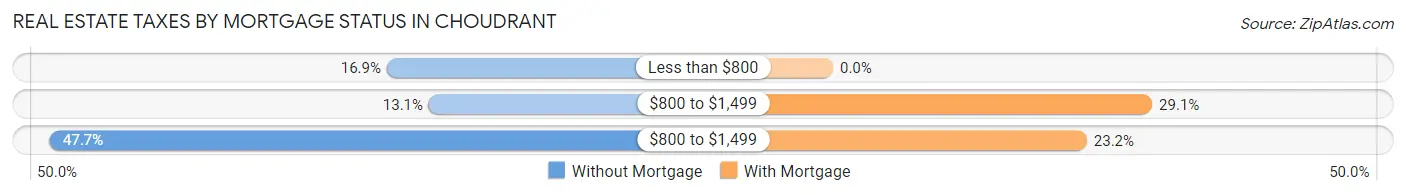
| Property Taxes | Without Mortgage | With Mortgage |
| Less than $800 | 22 (16.9%) | 0 (0.0%) |
| $800 to $1,499 | 17 (13.1%) | 44 (29.1%) |
| $800 to $1,499 | 62 (47.7%) | 35 (23.2%) |
| Total | 130 (100.0%) | 151 (100.0%) |
Health & Disability in Choudrant
Health Insurance Coverage by Age in Choudrant
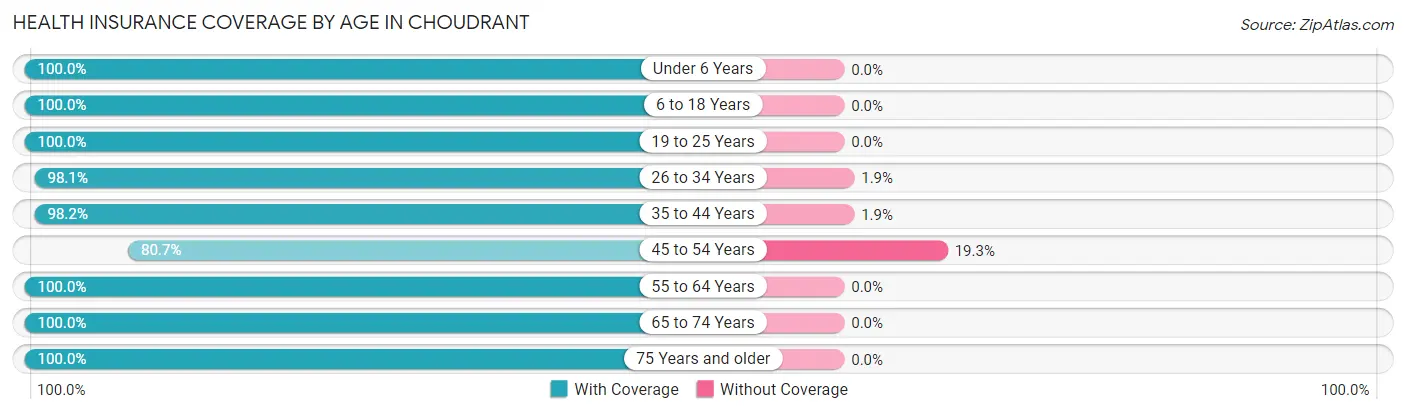
| Age Bracket | With Coverage | Without Coverage |
| Under 6 Years | 112 (100.0%) | 0 (0.0%) |
| 6 to 18 Years | 281 (100.0%) | 0 (0.0%) |
| 19 to 25 Years | 20 (100.0%) | 0 (0.0%) |
| 26 to 34 Years | 211 (98.1%) | 4 (1.9%) |
| 35 to 44 Years | 266 (98.2%) | 5 (1.8%) |
| 45 to 54 Years | 113 (80.7%) | 27 (19.3%) |
| 55 to 64 Years | 114 (100.0%) | 0 (0.0%) |
| 65 to 74 Years | 152 (100.0%) | 0 (0.0%) |
| 75 Years and older | 85 (100.0%) | 0 (0.0%) |
| Total | 1,354 (97.4%) | 36 (2.6%) |
Health Insurance Coverage by Citizenship Status in Choudrant
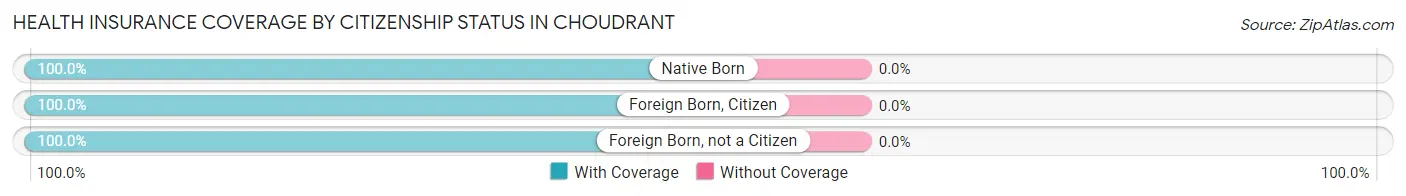
| Citizenship Status | With Coverage | Without Coverage |
| Native Born | 112 (100.0%) | 0 (0.0%) |
| Foreign Born, Citizen | 281 (100.0%) | 0 (0.0%) |
| Foreign Born, not a Citizen | 20 (100.0%) | 0 (0.0%) |
Health Insurance Coverage by Household Income in Choudrant
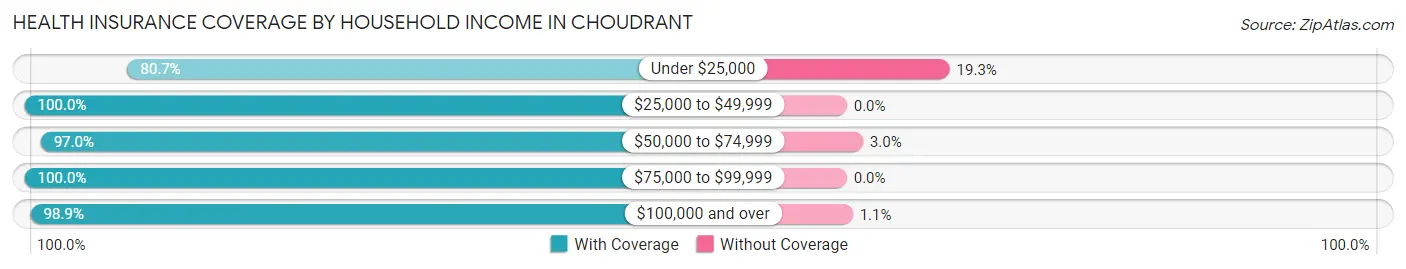
| Household Income | With Coverage | Without Coverage |
| Under $25,000 | 88 (80.7%) | 21 (19.3%) |
| $25,000 to $49,999 | 266 (100.0%) | 0 (0.0%) |
| $50,000 to $74,999 | 289 (97.0%) | 9 (3.0%) |
| $75,000 to $99,999 | 178 (100.0%) | 0 (0.0%) |
| $100,000 and over | 533 (98.9%) | 6 (1.1%) |
Public vs Private Health Insurance Coverage by Age in Choudrant
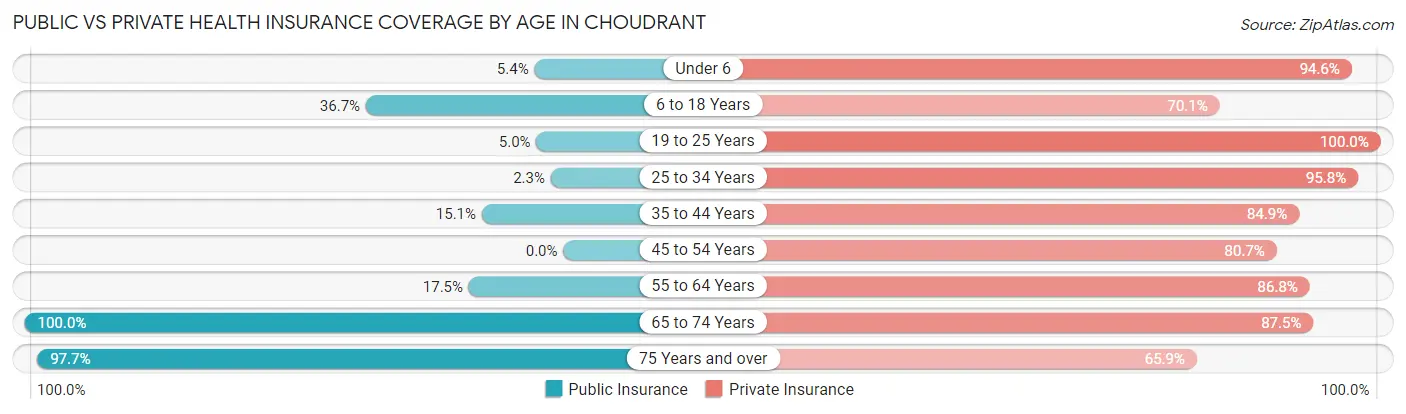
| Age Bracket | Public Insurance | Private Insurance |
| Under 6 | 6 (5.4%) | 106 (94.6%) |
| 6 to 18 Years | 103 (36.6%) | 197 (70.1%) |
| 19 to 25 Years | 1 (5.0%) | 20 (100.0%) |
| 25 to 34 Years | 5 (2.3%) | 206 (95.8%) |
| 35 to 44 Years | 41 (15.1%) | 230 (84.9%) |
| 45 to 54 Years | 0 (0.0%) | 113 (80.7%) |
| 55 to 64 Years | 20 (17.5%) | 99 (86.8%) |
| 65 to 74 Years | 152 (100.0%) | 133 (87.5%) |
| 75 Years and over | 83 (97.7%) | 56 (65.9%) |
| Total | 411 (29.6%) | 1,160 (83.5%) |
Disability Status by Sex by Age in Choudrant
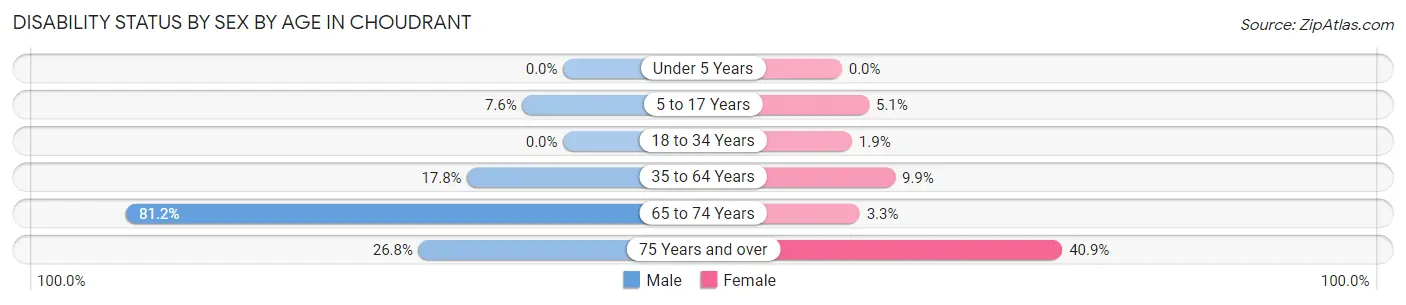
| Age Bracket | Male | Female |
| Under 5 Years | 0 (0.0%) | 0 (0.0%) |
| 5 to 17 Years | 13 (7.6%) | 8 (5.1%) |
| 18 to 34 Years | 0 (0.0%) | 3 (1.9%) |
| 35 to 64 Years | 34 (17.8%) | 33 (9.9%) |
| 65 to 74 Years | 99 (81.1%) | 1 (3.3%) |
| 75 Years and over | 11 (26.8%) | 18 (40.9%) |
Disability Class by Sex by Age in Choudrant
Disability Class: Hearing Difficulty
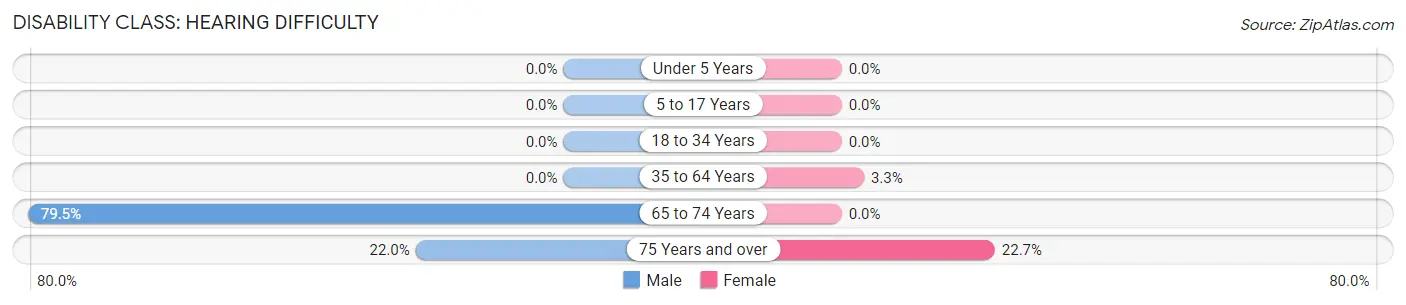
| Age Bracket | Male | Female |
| Under 5 Years | 0 (0.0%) | 0 (0.0%) |
| 5 to 17 Years | 0 (0.0%) | 0 (0.0%) |
| 18 to 34 Years | 0 (0.0%) | 0 (0.0%) |
| 35 to 64 Years | 0 (0.0%) | 11 (3.3%) |
| 65 to 74 Years | 97 (79.5%) | 0 (0.0%) |
| 75 Years and over | 9 (22.0%) | 10 (22.7%) |
Disability Class: Vision Difficulty
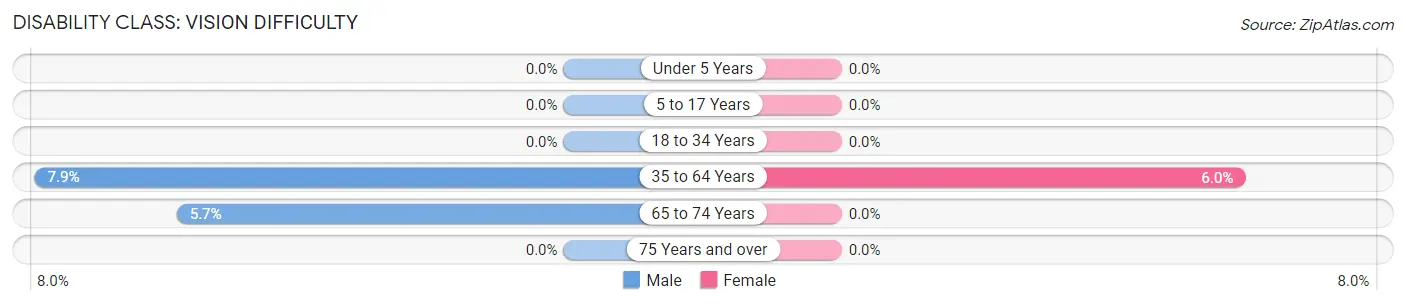
| Age Bracket | Male | Female |
| Under 5 Years | 0 (0.0%) | 0 (0.0%) |
| 5 to 17 Years | 0 (0.0%) | 0 (0.0%) |
| 18 to 34 Years | 0 (0.0%) | 0 (0.0%) |
| 35 to 64 Years | 15 (7.9%) | 20 (6.0%) |
| 65 to 74 Years | 7 (5.7%) | 0 (0.0%) |
| 75 Years and over | 0 (0.0%) | 0 (0.0%) |
Disability Class: Cognitive Difficulty
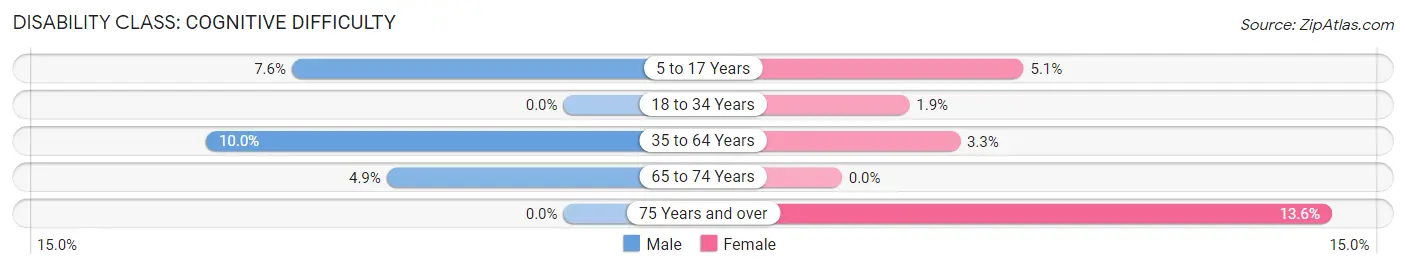
| Age Bracket | Male | Female |
| 5 to 17 Years | 13 (7.6%) | 8 (5.1%) |
| 18 to 34 Years | 0 (0.0%) | 3 (1.9%) |
| 35 to 64 Years | 19 (10.0%) | 11 (3.3%) |
| 65 to 74 Years | 6 (4.9%) | 0 (0.0%) |
| 75 Years and over | 0 (0.0%) | 6 (13.6%) |
Disability Class: Ambulatory Difficulty

| Age Bracket | Male | Female |
| 5 to 17 Years | 0 (0.0%) | 0 (0.0%) |
| 18 to 34 Years | 0 (0.0%) | 0 (0.0%) |
| 35 to 64 Years | 17 (8.9%) | 24 (7.2%) |
| 65 to 74 Years | 95 (77.9%) | 1 (3.3%) |
| 75 Years and over | 0 (0.0%) | 8 (18.2%) |
Disability Class: Self-Care Difficulty
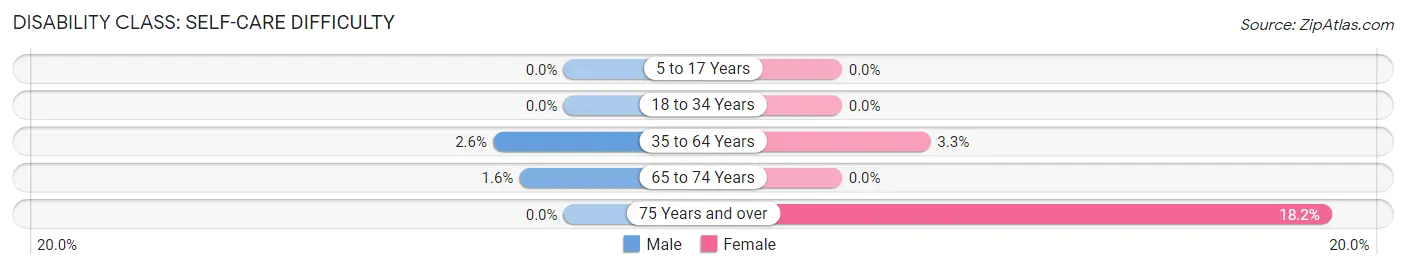
| Age Bracket | Male | Female |
| 5 to 17 Years | 0 (0.0%) | 0 (0.0%) |
| 18 to 34 Years | 0 (0.0%) | 0 (0.0%) |
| 35 to 64 Years | 5 (2.6%) | 11 (3.3%) |
| 65 to 74 Years | 2 (1.6%) | 0 (0.0%) |
| 75 Years and over | 0 (0.0%) | 8 (18.2%) |
Technology Access in Choudrant
Computing Device Access in Choudrant
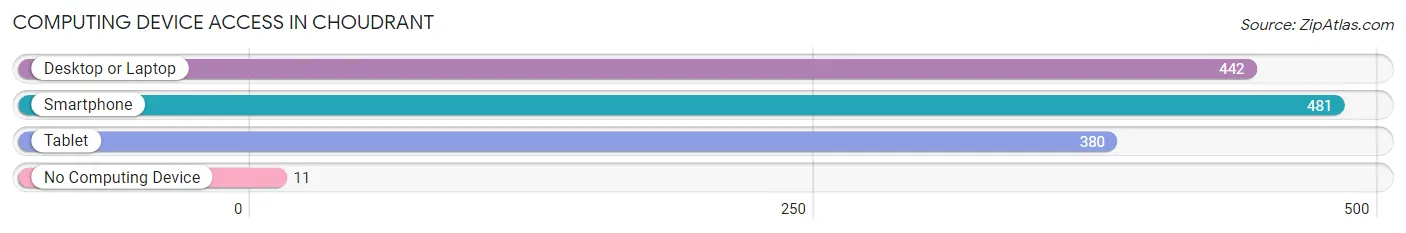
| Device Type | # Households | % Households |
| Desktop or Laptop | 442 | 87.2% |
| Smartphone | 481 | 94.9% |
| Tablet | 380 | 75.0% |
| No Computing Device | 11 | 2.2% |
| Total | 507 | 100.0% |
Internet Access in Choudrant
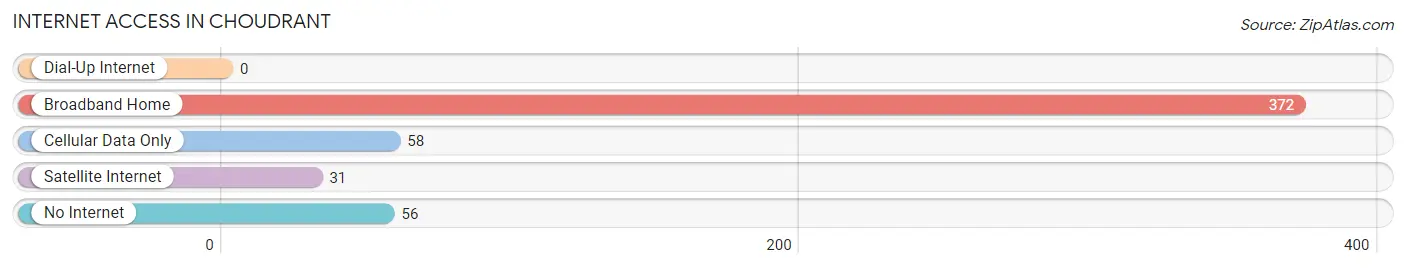
| Internet Type | # Households | % Households |
| Dial-Up Internet | 0 | 0.0% |
| Broadband Home | 372 | 73.4% |
| Cellular Data Only | 58 | 11.4% |
| Satellite Internet | 31 | 6.1% |
| No Internet | 56 | 11.1% |
| Total | 507 | 100.0% |
Choudrant Summary
Choudrant is a small town located in Lincoln Parish, Louisiana. It is situated in the northern part of the state, approximately 20 miles east of Ruston. The town was founded in 1883 and has a population of 1,845 as of the 2010 census.
History
Choudrant was founded in 1883 by a group of settlers from Mississippi. The town was named after a local creek, which was named after a Choctaw Indian chief. The town was originally a farming community, but it soon developed into a small commercial center. The first post office was established in 1884 and the first school was built in 1885.
In the early 1900s, Choudrant began to experience a period of growth. The town was incorporated in 1908 and the first bank was established in 1909. The town also had a cotton gin, a sawmill, and a gristmill.
In the 1920s, Choudrant experienced a period of decline. The Great Depression caused many businesses to close and the population decreased. However, the town was able to survive and in the 1940s, it began to experience a period of growth. The population increased and new businesses opened.
Geography
Choudrant is located in northern Louisiana, approximately 20 miles east of Ruston. The town is situated in the rolling hills of Lincoln Parish. The terrain is mostly flat with some areas of rolling hills. The town is located near the Ouachita River, which provides a source of water for the town.
The climate in Choudrant is humid subtropical, with hot summers and mild winters. The average annual temperature is around 70 degrees Fahrenheit. The average annual precipitation is around 50 inches.
Economy
The economy of Choudrant is largely based on agriculture. The town is home to several farms, which produce cotton, soybeans, corn, and other crops. The town also has several small businesses, including restaurants, retail stores, and service providers.
The town is also home to several manufacturing companies, including a furniture manufacturer and a plastics manufacturer. The town is also home to a lumber mill and a paper mill.
Demographics
As of the 2010 census, the population of Choudrant was 1,845. The racial makeup of the town was 79.3% White, 17.7% African American, 0.3% Native American, 0.3% Asian, 0.1% Pacific Islander, and 2.3% from other races. The median household income was $31,250 and the median family income was $37,500.
Conclusion
Choudrant is a small town located in northern Louisiana. It was founded in 1883 and has a population of 1,845 as of the 2010 census. The town is largely based on agriculture and has several small businesses. The town also has several manufacturing companies. The racial makeup of the town is 79.3% White, 17.7% African American, 0.3% Native American, 0.3% Asian, 0.1% Pacific Islander, and 2.3% from other races. The median household income was $31,250 and the median family income was $37,500.
Common Questions
What is the Total Population of Choudrant?
Total Population of Choudrant is 1,395.
What is the Total Male Population of Choudrant?
Total Male Population of Choudrant is 642.
What is the Total Female Population of Choudrant?
Total Female Population of Choudrant is 753.
What is the Ratio of Males per 100 Females in Choudrant?
There are 85.26 Males per 100 Females in Choudrant.
What is the Ratio of Females per 100 Males in Choudrant?
There are 117.29 Females per 100 Males in Choudrant.
What is the Median Population Age in Choudrant?
Median Population Age in Choudrant is 37.1 Years.
What is the Average Family Size in Choudrant
Average Family Size in Choudrant is 3.0 People.
What is the Average Household Size in Choudrant
Average Household Size in Choudrant is 2.8 People.
What is Per Capita Income in Choudrant?
Per Capita income in Choudrant is $44,121.
What is the Median Family Income in Choudrant?
Median Family Income in Choudrant is $73,000.
What is the Median Household income in Choudrant?
Median Household Income in Choudrant is $69,313.
What is Income or Wage Gap in Choudrant?
Income or Wage Gap in Choudrant is 37.6%.
Women in Choudrant earn 62.4 cents for every dollar earned by a man.
What is Inequality or Gini Index in Choudrant?
Inequality or Gini Index in Choudrant is 0.56.
How Large is the Labor Force in Choudrant?
There are 660 People in the Labor Forcein in Choudrant.
What is the Percentage of People in the Labor Force in Choudrant?
62.9% of People are in the Labor Force in Choudrant.
What is the Unemployment Rate in Choudrant?
Unemployment Rate in Choudrant is 1.4%.