Natchitoches, LA
Natchitoches Map
Natchitoches Overview
17,908
TOTAL POPULATION
8,462
MALE POPULATION
9,446
FEMALE POPULATION
89.58
MALES / 100 FEMALES
111.63
FEMALES / 100 MALES
26.6
MEDIAN AGE
3.7
AVG FAMILY SIZE
2.6
AVG HOUSEHOLD SIZE
$21,720
PER CAPITA INCOME
$57,639
AVG FAMILY INCOME
$34,020
AVG HOUSEHOLD INCOME
32.4%
WAGE / INCOME GAP [ % ]
67.6¢/ $1
WAGE / INCOME GAP [ $ ]
$14,672
FAMILY INCOME DEFICIT
0.57
INEQUALITY / GINI INDEX
7,262
LABOR FORCE [ PEOPLE ]
50.5%
PERCENT IN LABOR FORCE
11.4%
UNEMPLOYMENT RATE
Natchitoches Area Codes
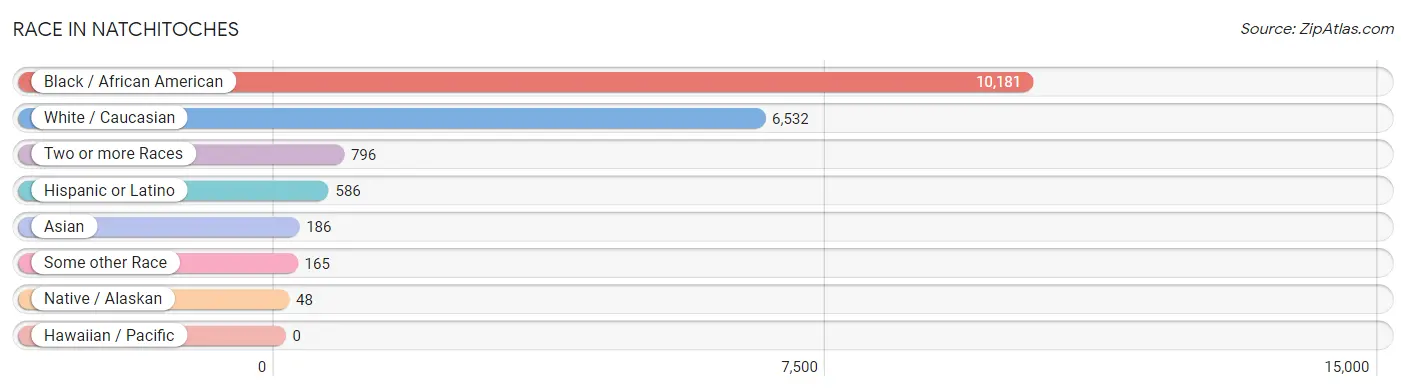
Race in Natchitoches
The most populous races in Natchitoches are Black / African American (10,181 | 56.9%), White / Caucasian (6,532 | 36.5%), and Two or more Races (796 | 4.4%).
| Race | # Population | % Population |
| Asian | 186 | 1.0% |
| Black / African American | 10,181 | 56.9% |
| Hawaiian / Pacific | 0 | 0.0% |
| Hispanic or Latino | 586 | 3.3% |
| Native / Alaskan | 48 | 0.3% |
| White / Caucasian | 6,532 | 36.5% |
| Two or more Races | 796 | 4.4% |
| Some other Race | 165 | 0.9% |
| Total | 17,908 | 100.0% |
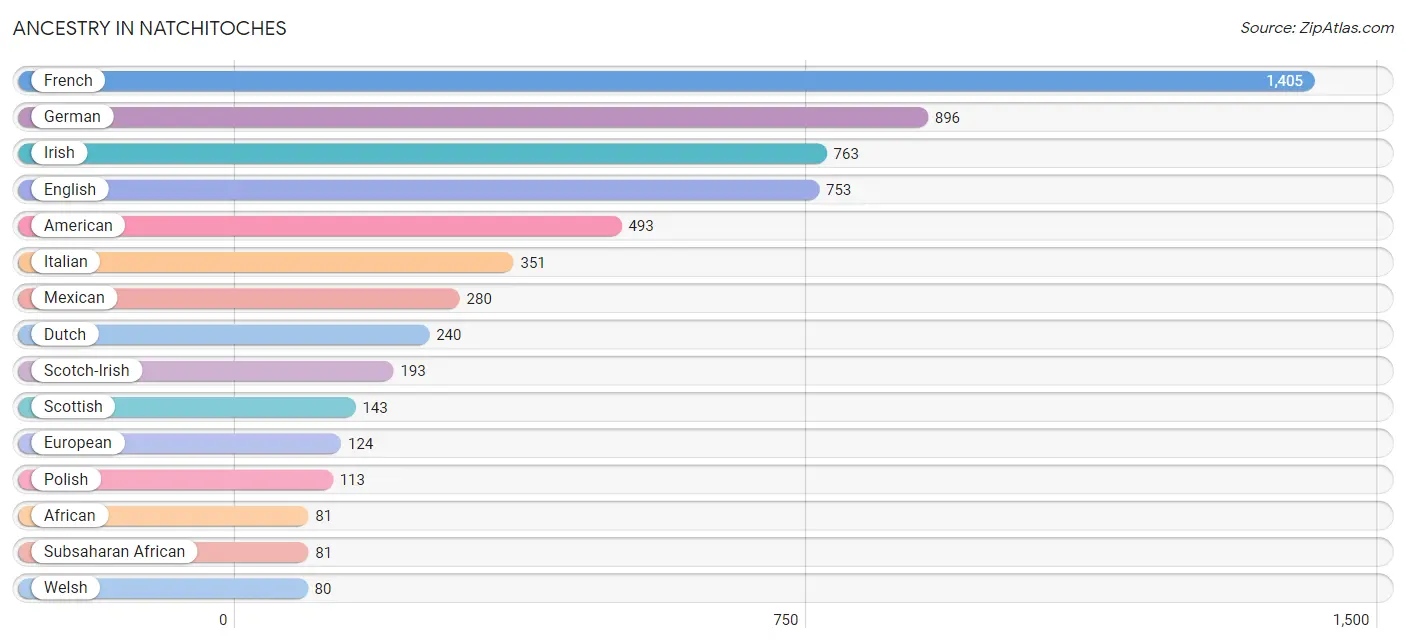
Ancestry in Natchitoches
The most populous ancestries reported in Natchitoches are French (1,405 | 7.9%), German (896 | 5.0%), Irish (763 | 4.3%), English (753 | 4.2%), and American (493 | 2.8%), together accounting for 24.1% of all Natchitoches residents.
| Ancestry | # Population | % Population |
| African | 81 | 0.4% |
| American | 493 | 2.8% |
| Arab | 40 | 0.2% |
| Austrian | 75 | 0.4% |
| Basque | 48 | 0.3% |
| Belgian | 10 | 0.1% |
| British | 54 | 0.3% |
| Burmese | 39 | 0.2% |
| Cajun | 18 | 0.1% |
| Celtic | 3 | 0.0% |
| Central American | 51 | 0.3% |
| Central American Indian | 50 | 0.3% |
| Cherokee | 8 | 0.0% |
| Colombian | 3 | 0.0% |
| Croatian | 12 | 0.1% |
| Cuban | 33 | 0.2% |
| Czech | 12 | 0.1% |
| Danish | 8 | 0.0% |
| Dutch | 240 | 1.3% |
| Eastern European | 12 | 0.1% |
| Egyptian | 1 | 0.0% |
| English | 753 | 4.2% |
| European | 124 | 0.7% |
| French | 1,405 | 7.9% |
| French Canadian | 57 | 0.3% |
| German | 896 | 5.0% |
| Greek | 35 | 0.2% |
| Guamanian / Chamorro | 13 | 0.1% |
| Guatemalan | 11 | 0.1% |
| Haitian | 34 | 0.2% |
| Honduran | 26 | 0.2% |
| Houma | 3 | 0.0% |
| Indian (Asian) | 72 | 0.4% |
| Irish | 763 | 4.3% |
| Italian | 351 | 2.0% |
| Jamaican | 12 | 0.1% |
| Jordanian | 10 | 0.1% |
| Korean | 27 | 0.2% |
| Lebanese | 2 | 0.0% |
| Mexican | 280 | 1.6% |
| Northern European | 50 | 0.3% |
| Norwegian | 15 | 0.1% |
| Polish | 113 | 0.6% |
| Portuguese | 3 | 0.0% |
| Puerto Rican | 76 | 0.4% |
| Romanian | 1 | 0.0% |
| Russian | 3 | 0.0% |
| Salvadoran | 14 | 0.1% |
| Scandinavian | 1 | 0.0% |
| Scotch-Irish | 193 | 1.1% |
| Scottish | 143 | 0.8% |
| Serbian | 3 | 0.0% |
| Shoshone | 10 | 0.1% |
| South American | 3 | 0.0% |
| Spaniard | 60 | 0.3% |
| Spanish | 46 | 0.3% |
| Sri Lankan | 22 | 0.1% |
| Subsaharan African | 81 | 0.4% |
| Swedish | 6 | 0.0% |
| Syrian | 6 | 0.0% |
| Thai | 27 | 0.2% |
| Trinidadian and Tobagonian | 15 | 0.1% |
| Vietnamese | 25 | 0.1% |
| Welsh | 80 | 0.4% | View All 64 Rows |
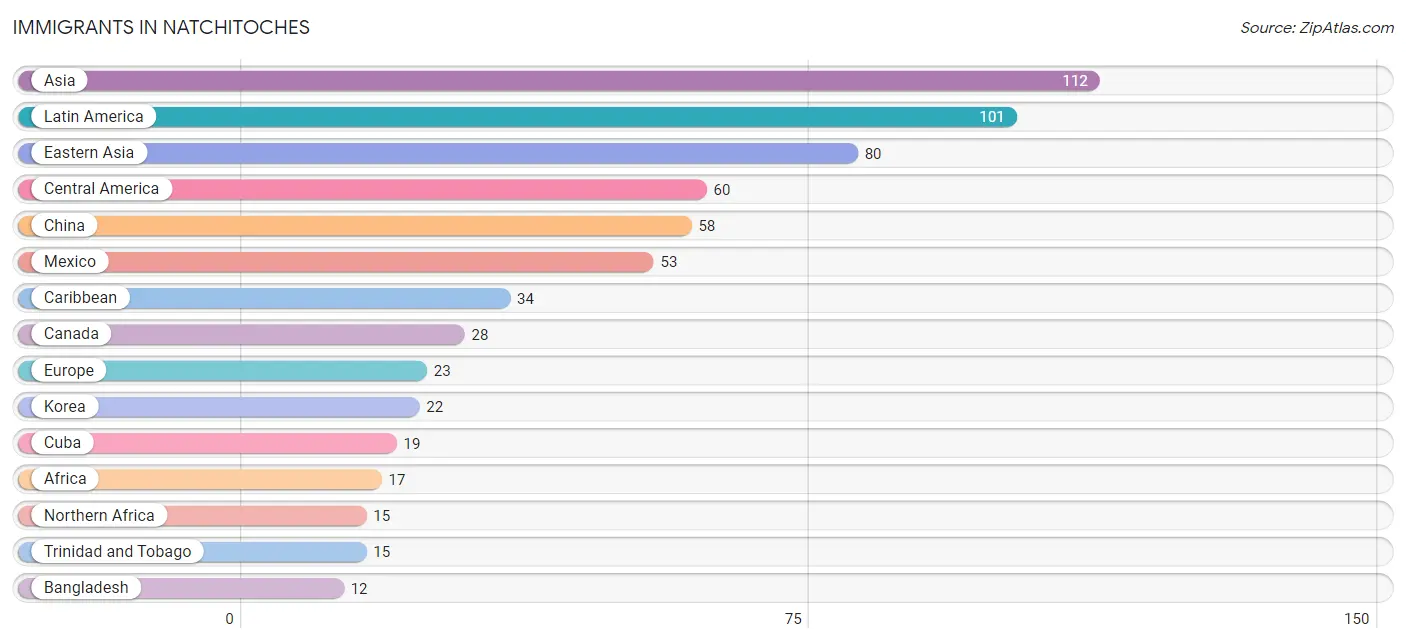
Immigrants in Natchitoches
The most numerous immigrant groups reported in Natchitoches came from Asia (112 | 0.6%), Latin America (101 | 0.6%), Eastern Asia (80 | 0.4%), Central America (60 | 0.3%), and China (58 | 0.3%), together accounting for 2.3% of all Natchitoches residents.
| Immigration Origin | # Population | % Population |
| Africa | 17 | 0.1% |
| Asia | 112 | 0.6% |
| Bangladesh | 12 | 0.1% |
| Belgium | 2 | 0.0% |
| Canada | 28 | 0.2% |
| Caribbean | 34 | 0.2% |
| Central America | 60 | 0.3% |
| China | 58 | 0.3% |
| Colombia | 3 | 0.0% |
| Cuba | 19 | 0.1% |
| Eastern Asia | 80 | 0.4% |
| Eastern Europe | 3 | 0.0% |
| England | 1 | 0.0% |
| Europe | 23 | 0.1% |
| France | 5 | 0.0% |
| Honduras | 7 | 0.0% |
| Italy | 10 | 0.1% |
| Jordan | 10 | 0.1% |
| Korea | 22 | 0.1% |
| Latin America | 101 | 0.6% |
| Mexico | 53 | 0.3% |
| Nigeria | 2 | 0.0% |
| Northern Africa | 15 | 0.1% |
| Northern Europe | 3 | 0.0% |
| Peru | 4 | 0.0% |
| Saudi Arabia | 1 | 0.0% |
| Serbia | 3 | 0.0% |
| South America | 7 | 0.0% |
| South Central Asia | 12 | 0.1% |
| South Eastern Asia | 9 | 0.1% |
| Southern Europe | 10 | 0.1% |
| Trinidad and Tobago | 15 | 0.1% |
| Vietnam | 9 | 0.1% |
| Western Africa | 2 | 0.0% |
| Western Asia | 11 | 0.1% |
| Western Europe | 7 | 0.0% | View All 36 Rows |
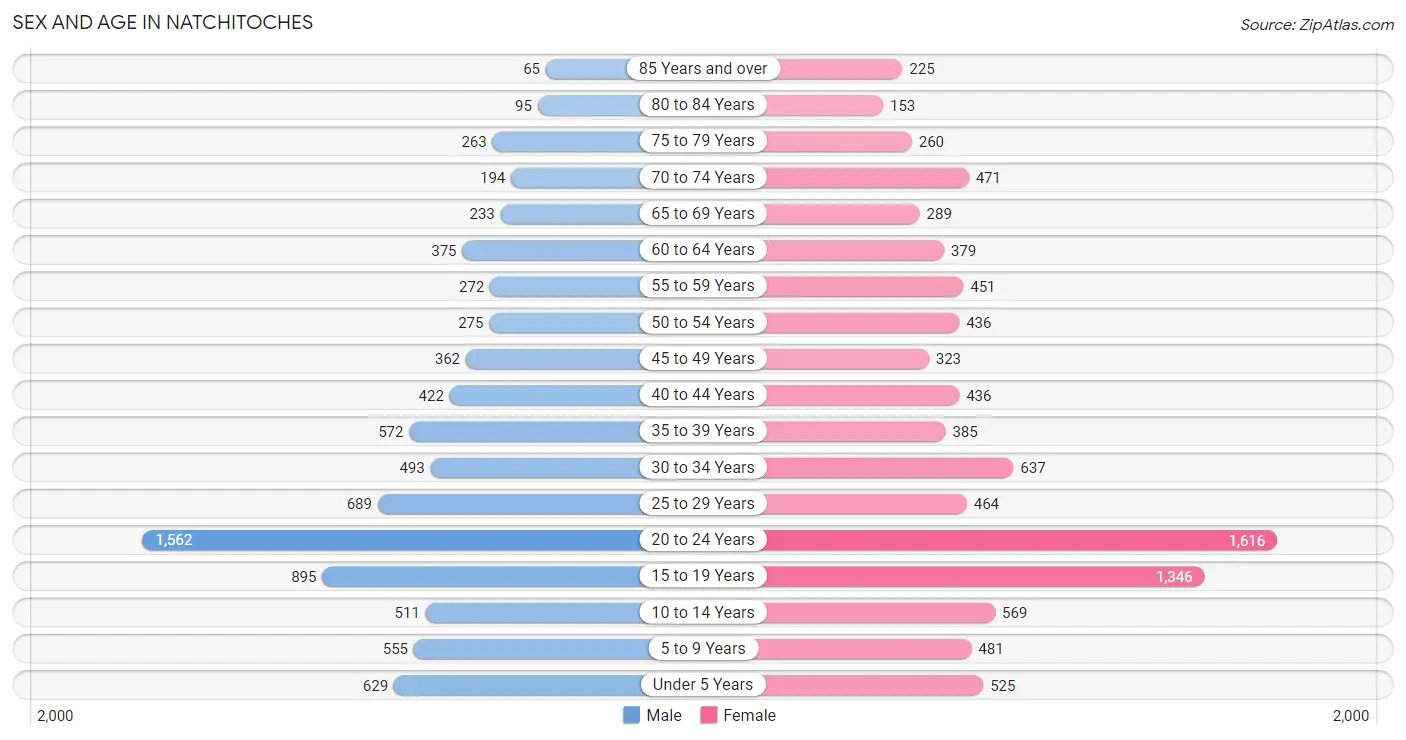
Sex and Age in Natchitoches
Sex and Age in Natchitoches
The most populous age groups in Natchitoches are 20 to 24 Years (1,562 | 18.5%) for men and 20 to 24 Years (1,616 | 17.1%) for women.
| Age Bracket | Male | Female |
| Under 5 Years | 629 (7.4%) | 525 (5.6%) |
| 5 to 9 Years | 555 (6.6%) | 481 (5.1%) |
| 10 to 14 Years | 511 (6.0%) | 569 (6.0%) |
| 15 to 19 Years | 895 (10.6%) | 1,346 (14.2%) |
| 20 to 24 Years | 1,562 (18.5%) | 1,616 (17.1%) |
| 25 to 29 Years | 689 (8.1%) | 464 (4.9%) |
| 30 to 34 Years | 493 (5.8%) | 637 (6.7%) |
| 35 to 39 Years | 572 (6.8%) | 385 (4.1%) |
| 40 to 44 Years | 422 (5.0%) | 436 (4.6%) |
| 45 to 49 Years | 362 (4.3%) | 323 (3.4%) |
| 50 to 54 Years | 275 (3.3%) | 436 (4.6%) |
| 55 to 59 Years | 272 (3.2%) | 451 (4.8%) |
| 60 to 64 Years | 375 (4.4%) | 379 (4.0%) |
| 65 to 69 Years | 233 (2.8%) | 289 (3.1%) |
| 70 to 74 Years | 194 (2.3%) | 471 (5.0%) |
| 75 to 79 Years | 263 (3.1%) | 260 (2.8%) |
| 80 to 84 Years | 95 (1.1%) | 153 (1.6%) |
| 85 Years and over | 65 (0.8%) | 225 (2.4%) |
| Total | 8,462 (100.0%) | 9,446 (100.0%) |
Families and Households in Natchitoches
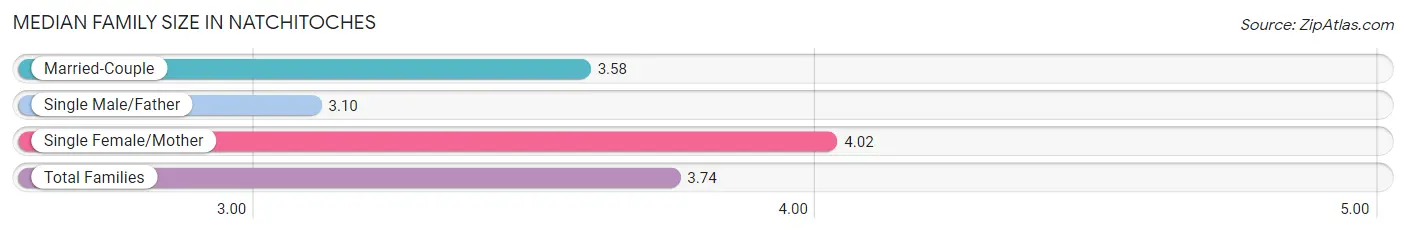
Median Family Size in Natchitoches
The median family size in Natchitoches is 3.74 persons per family, with single female/mother families (1,208 | 42.2%) accounting for the largest median family size of 4.02 persons per family. On the other hand, single male/father families (160 | 5.6%) represent the smallest median family size with 3.10 persons per family.
| Family Type | # Families | Family Size |
| Married-Couple | 1,496 (52.2%) | 3.58 |
| Single Male/Father | 160 (5.6%) | 3.10 |
| Single Female/Mother | 1,208 (42.2%) | 4.02 |
| Total Families | 2,864 (100.0%) | 3.74 |
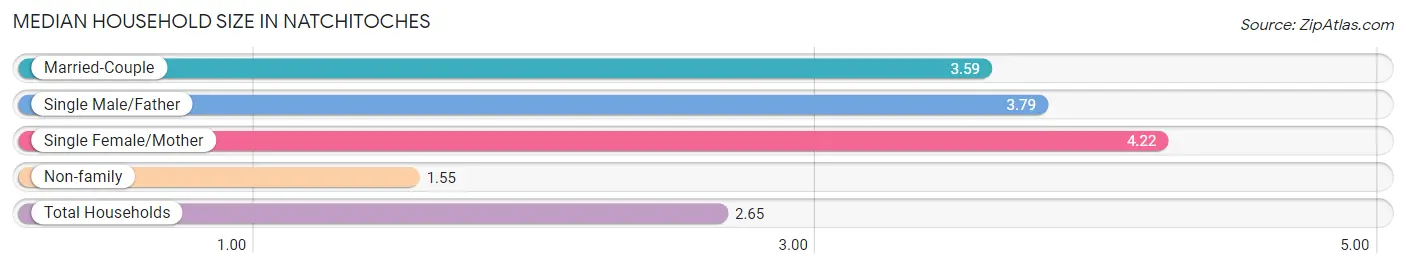
Median Household Size in Natchitoches
The median household size in Natchitoches is 2.65 persons per household, with single female/mother households (1,208 | 20.1%) accounting for the largest median household size of 4.22 persons per household. non-family households (3,134 | 52.2%) represent the smallest median household size with 1.55 persons per household.
| Household Type | # Households | Household Size |
| Married-Couple | 1,496 (24.9%) | 3.59 |
| Single Male/Father | 160 (2.7%) | 3.79 |
| Single Female/Mother | 1,208 (20.1%) | 4.22 |
| Non-family | 3,134 (52.2%) | 1.55 |
| Total Households | 5,998 (100.0%) | 2.65 |
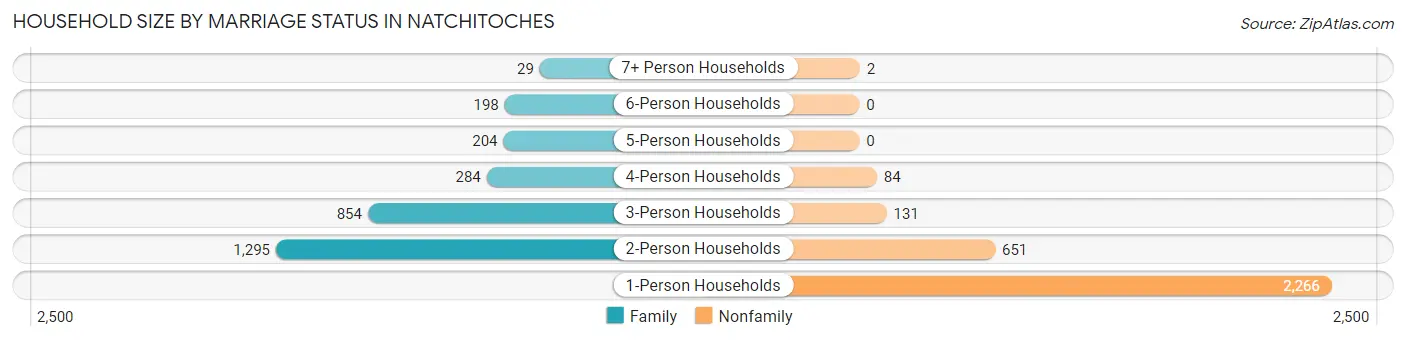
Household Size by Marriage Status in Natchitoches
Out of a total of 5,998 households in Natchitoches, 2,864 (47.7%) are family households, while 3,134 (52.2%) are nonfamily households. The most numerous type of family households are 2-person households, comprising 1,295, and the most common type of nonfamily households are 1-person households, comprising 2,266.
| Household Size | Family Households | Nonfamily Households |
| 1-Person Households | - | 2,266 (37.8%) |
| 2-Person Households | 1,295 (21.6%) | 651 (10.8%) |
| 3-Person Households | 854 (14.2%) | 131 (2.2%) |
| 4-Person Households | 284 (4.7%) | 84 (1.4%) |
| 5-Person Households | 204 (3.4%) | 0 (0.0%) |
| 6-Person Households | 198 (3.3%) | 0 (0.0%) |
| 7+ Person Households | 29 (0.5%) | 2 (0.0%) |
| Total | 2,864 (47.7%) | 3,134 (52.2%) |
Female Fertility in Natchitoches
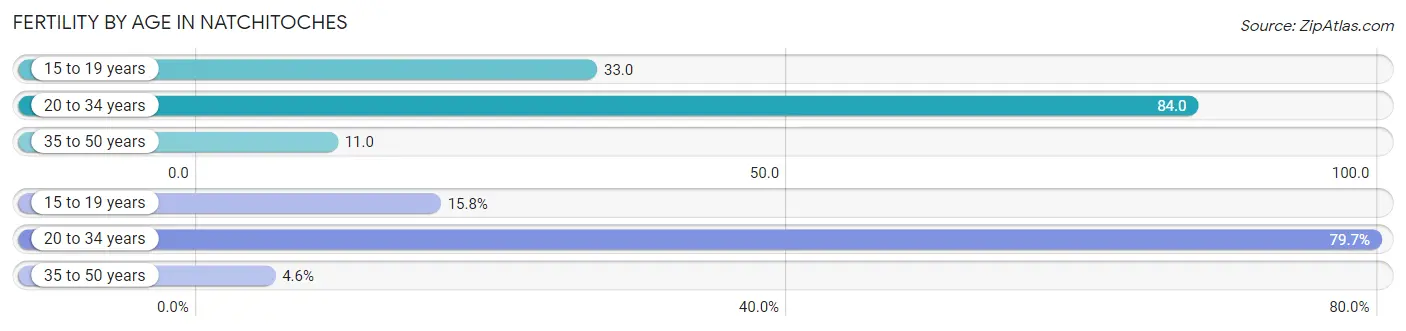
Fertility by Age in Natchitoches
Average fertility rate in Natchitoches is 54.0 births per 1,000 women. Women in the age bracket of 20 to 34 years have the highest fertility rate with 84.0 births per 1,000 women. Women in the age bracket of 20 to 34 years acount for 79.6% of all women with births.
| Age Bracket | Women with Births | Births / 1,000 Women |
| 15 to 19 years | 45 (15.8%) | 33.0 |
| 20 to 34 years | 227 (79.6%) | 84.0 |
| 35 to 50 years | 13 (4.6%) | 11.0 |
| Total | 285 (100.0%) | 54.0 |
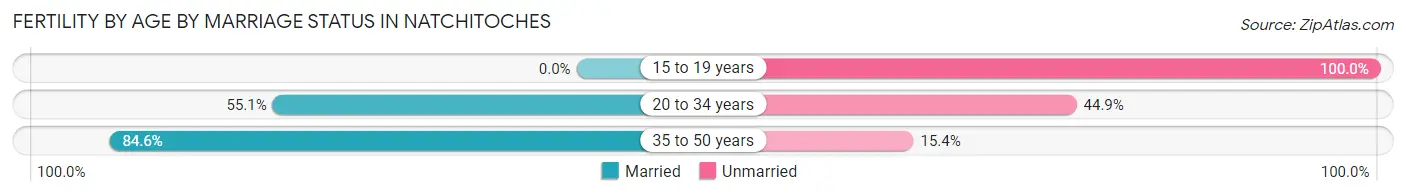
Fertility by Age by Marriage Status in Natchitoches
47.7% of women with births (285) in Natchitoches are married. The highest percentage of unmarried women with births falls into 15 to 19 years age bracket with 100.0% of them unmarried at the time of birth, while the lowest percentage of unmarried women with births belong to 35 to 50 years age bracket with 15.4% of them unmarried.
| Age Bracket | Married | Unmarried |
| 15 to 19 years | 0 (0.0%) | 45 (100.0%) |
| 20 to 34 years | 125 (55.1%) | 102 (44.9%) |
| 35 to 50 years | 11 (84.6%) | 2 (15.4%) |
| Total | 136 (47.7%) | 149 (52.3%) |
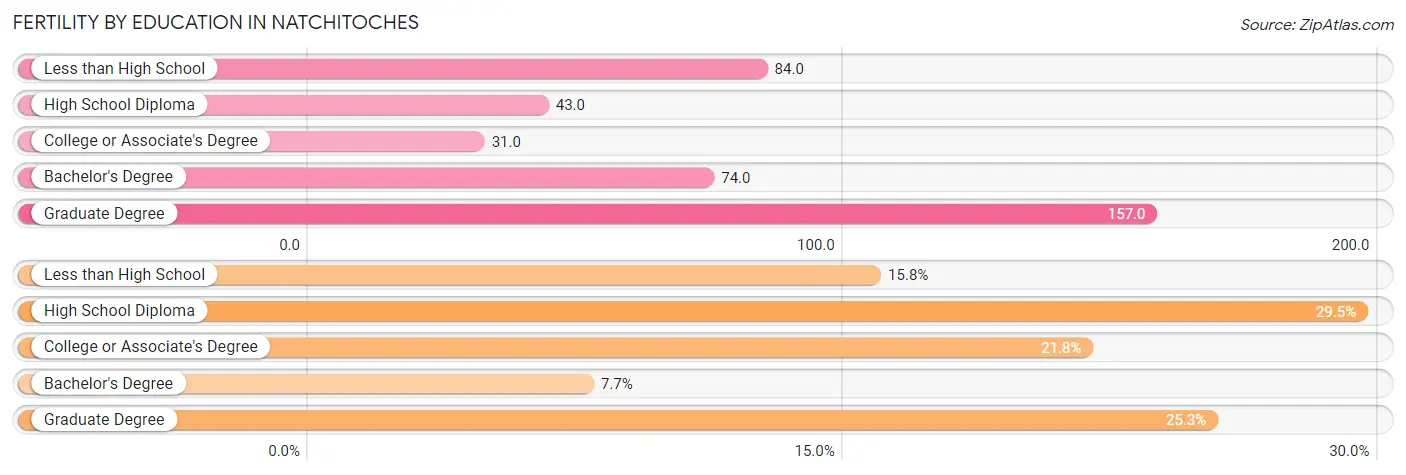
Fertility by Education in Natchitoches
Average fertility rate in Natchitoches is 54.0 births per 1,000 women. Women with the education attainment of graduate degree have the highest fertility rate of 157.0 births per 1,000 women, while women with the education attainment of college or associate's degree have the lowest fertility at 31.0 births per 1,000 women. Women with the education attainment of high school diploma represent 29.5% of all women with births.
| Educational Attainment | Women with Births | Births / 1,000 Women |
| Less than High School | 45 (15.8%) | 84.0 |
| High School Diploma | 84 (29.5%) | 43.0 |
| College or Associate's Degree | 62 (21.7%) | 31.0 |
| Bachelor's Degree | 22 (7.7%) | 74.0 |
| Graduate Degree | 72 (25.3%) | 157.0 |
| Total | 285 (100.0%) | 54.0 |
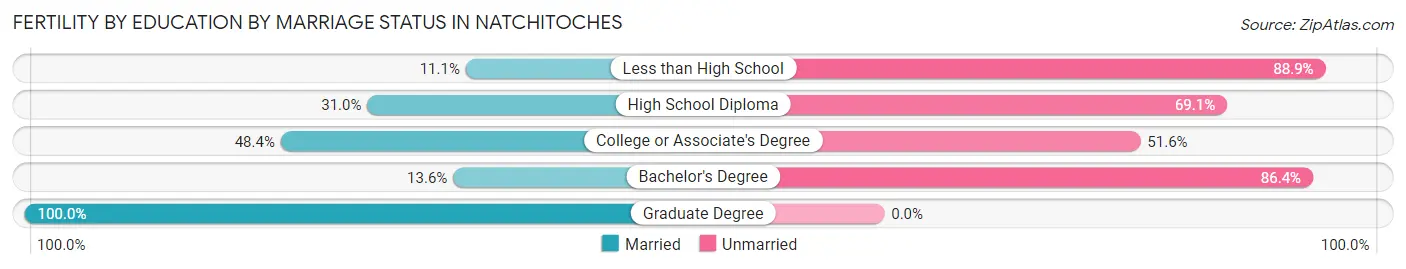
Fertility by Education by Marriage Status in Natchitoches
52.3% of women with births in Natchitoches are unmarried. Women with the educational attainment of graduate degree are most likely to be married with 100.0% of them married at childbirth, while women with the educational attainment of less than high school are least likely to be married with 88.9% of them unmarried at childbirth.
| Educational Attainment | Married | Unmarried |
| Less than High School | 5 (11.1%) | 40 (88.9%) |
| High School Diploma | 26 (30.9%) | 58 (69.1%) |
| College or Associate's Degree | 30 (48.4%) | 32 (51.6%) |
| Bachelor's Degree | 3 (13.6%) | 19 (86.4%) |
| Graduate Degree | 72 (100.0%) | 0 (0.0%) |
| Total | 136 (47.7%) | 149 (52.3%) |
Income in Natchitoches
Income Overview in Natchitoches
Per Capita Income in Natchitoches is $21,720, while median incomes of families and households are $57,639 and $34,020 respectively.
| Characteristic | Number | Measure |
| Per Capita Income | 17,908 | $21,720 |
| Median Family Income | 2,864 | $57,639 |
| Mean Family Income | 2,864 | $78,113 |
| Median Household Income | 5,998 | $34,020 |
| Mean Household Income | 5,998 | $59,122 |
| Income Deficit | 2,864 | $14,672 |
| Wage / Income Gap (%) | 17,908 | 32.38% |
| Wage / Income Gap ($) | 17,908 | 67.62¢ per $1 |
| Gini / Inequality Index | 17,908 | 0.57 |
Earnings by Sex in Natchitoches
Average Earnings in Natchitoches are $23,506, $28,590 for men and $19,333 for women, a difference of 32.4%.
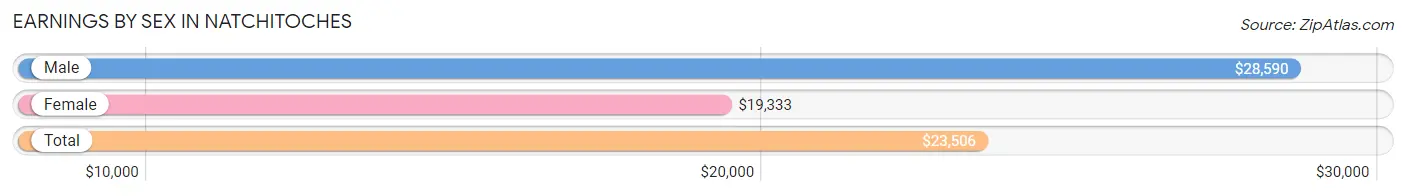
| Sex | Number | Average Earnings |
| Male | 3,406 (45.6%) | $28,590 |
| Female | 4,072 (54.4%) | $19,333 |
| Total | 7,478 (100.0%) | $23,506 |
Earnings by Sex by Income Bracket in Natchitoches
The most common earnings brackets in Natchitoches are $10,000 to $12,499 for men (327 | 9.6%) and $5,000 to $7,499 for women (619 | 15.2%).
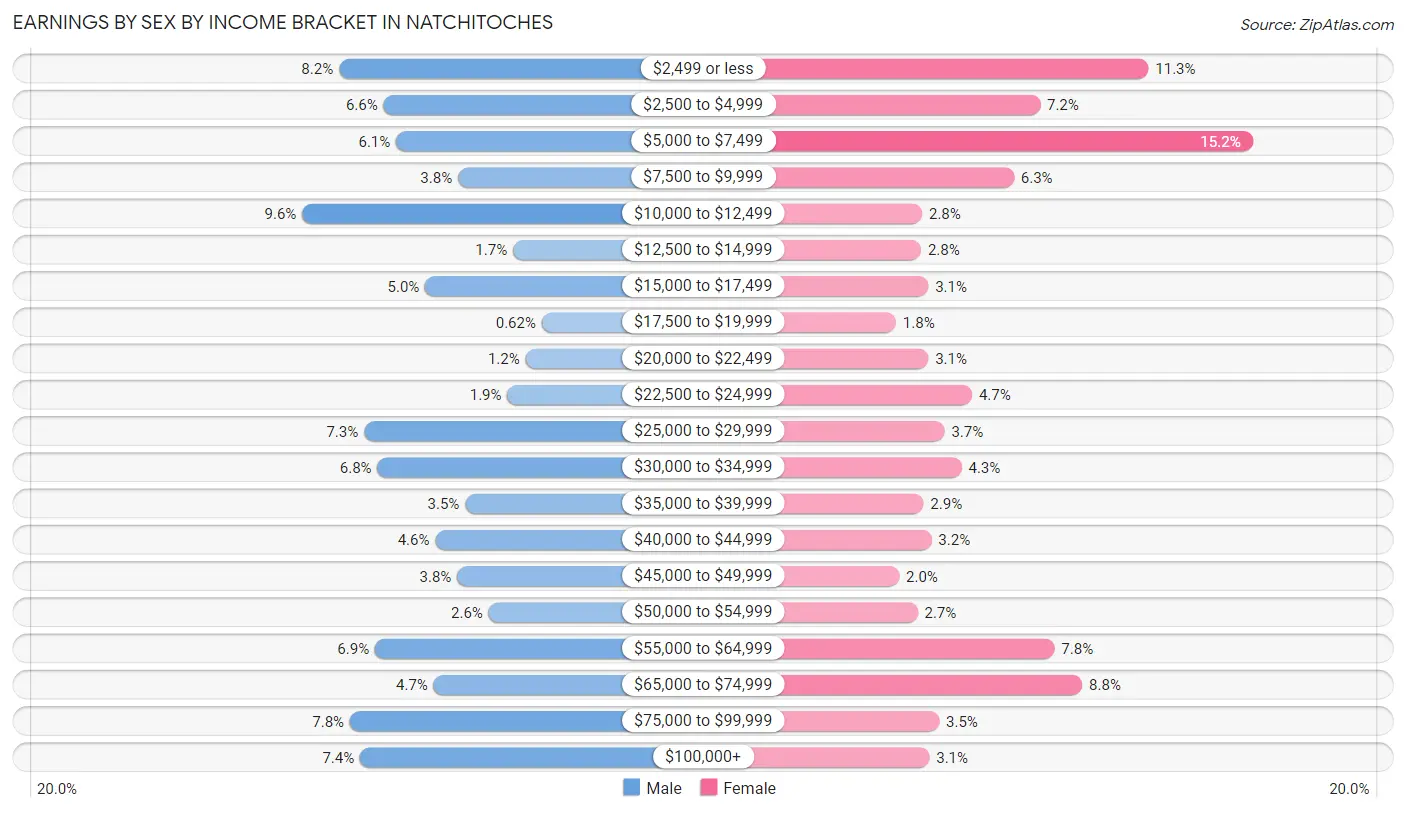
| Income | Male | Female |
| $2,499 or less | 280 (8.2%) | 460 (11.3%) |
| $2,500 to $4,999 | 223 (6.6%) | 295 (7.2%) |
| $5,000 to $7,499 | 207 (6.1%) | 619 (15.2%) |
| $7,500 to $9,999 | 128 (3.8%) | 255 (6.3%) |
| $10,000 to $12,499 | 327 (9.6%) | 115 (2.8%) |
| $12,500 to $14,999 | 58 (1.7%) | 113 (2.8%) |
| $15,000 to $17,499 | 170 (5.0%) | 124 (3.0%) |
| $17,500 to $19,999 | 21 (0.6%) | 75 (1.8%) |
| $20,000 to $22,499 | 42 (1.2%) | 124 (3.0%) |
| $22,500 to $24,999 | 65 (1.9%) | 191 (4.7%) |
| $25,000 to $29,999 | 248 (7.3%) | 149 (3.7%) |
| $30,000 to $34,999 | 231 (6.8%) | 175 (4.3%) |
| $35,000 to $39,999 | 119 (3.5%) | 117 (2.9%) |
| $40,000 to $44,999 | 157 (4.6%) | 129 (3.2%) |
| $45,000 to $49,999 | 129 (3.8%) | 80 (2.0%) |
| $50,000 to $54,999 | 89 (2.6%) | 108 (2.6%) |
| $55,000 to $64,999 | 234 (6.9%) | 317 (7.8%) |
| $65,000 to $74,999 | 159 (4.7%) | 359 (8.8%) |
| $75,000 to $99,999 | 266 (7.8%) | 141 (3.5%) |
| $100,000+ | 253 (7.4%) | 126 (3.1%) |
| Total | 3,406 (100.0%) | 4,072 (100.0%) |
Earnings by Sex by Educational Attainment in Natchitoches
Average earnings in Natchitoches are $35,636 for men and $38,640 for women, a difference of 7.8%. Men with an educational attainment of graduate degree enjoy the highest average annual earnings of $66,484, while those with high school diploma education earn the least with $26,250. Women with an educational attainment of graduate degree earn the most with the average annual earnings of $67,681, while those with college or associate's degree education have the smallest earnings of $28,929.
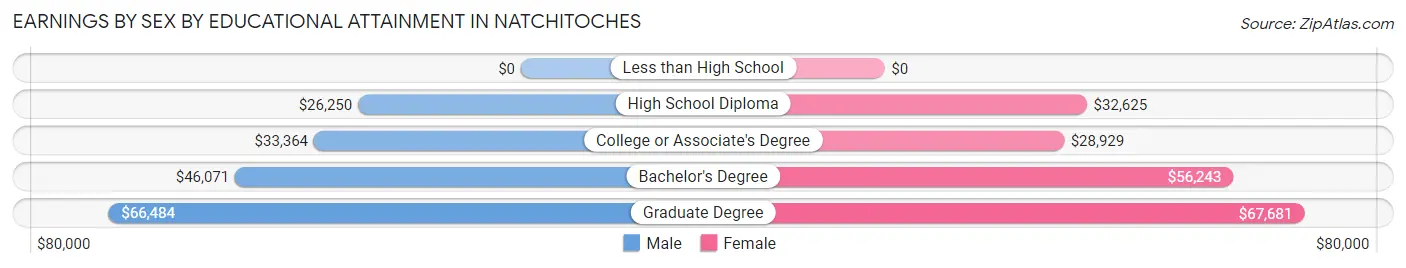
| Educational Attainment | Male Income | Female Income |
| Less than High School | - | - |
| High School Diploma | $26,250 | $32,625 |
| College or Associate's Degree | $33,364 | $28,929 |
| Bachelor's Degree | $46,071 | $56,243 |
| Graduate Degree | $66,484 | $67,681 |
| Total | $35,636 | $38,640 |
Family Income in Natchitoches
Family Income Brackets in Natchitoches
According to the Natchitoches family income data, there are 550 families falling into the $100,000 to $149,999 income range, which is the most common income bracket and makes up 19.2% of all families. Conversely, the $150,000 to $199,999 income bracket is the least frequent group with only 129 families (4.5%) belonging to this category.
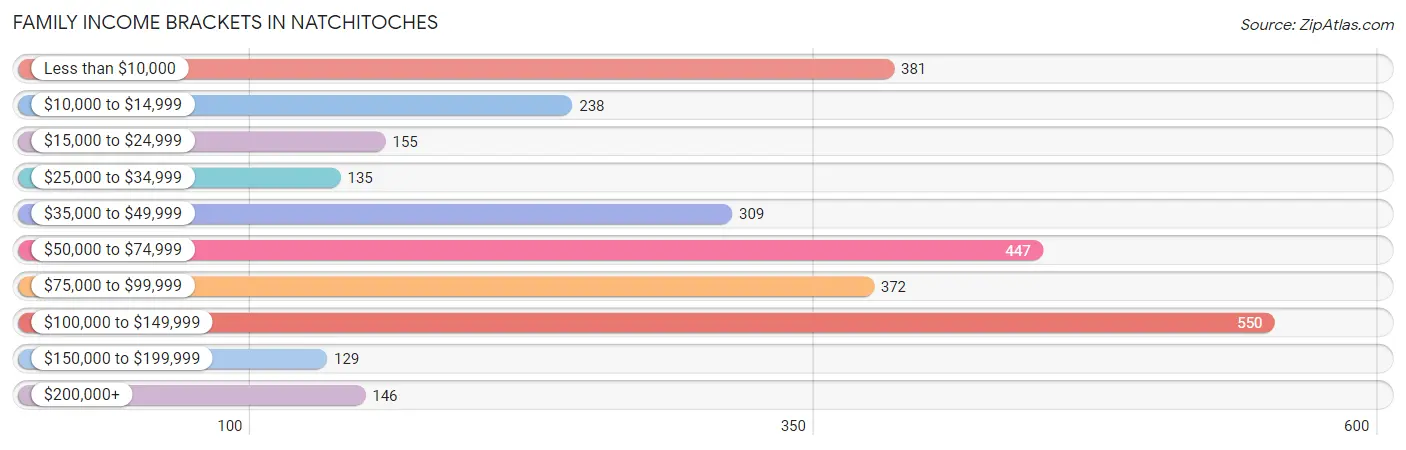
| Income Bracket | # Families | % Families |
| Less than $10,000 | 381 | 13.3% |
| $10,000 to $14,999 | 238 | 8.3% |
| $15,000 to $24,999 | 155 | 5.4% |
| $25,000 to $34,999 | 135 | 4.7% |
| $35,000 to $49,999 | 309 | 10.8% |
| $50,000 to $74,999 | 447 | 15.6% |
| $75,000 to $99,999 | 372 | 13.0% |
| $100,000 to $149,999 | 550 | 19.2% |
| $150,000 to $199,999 | 129 | 4.5% |
| $200,000+ | 146 | 5.1% |
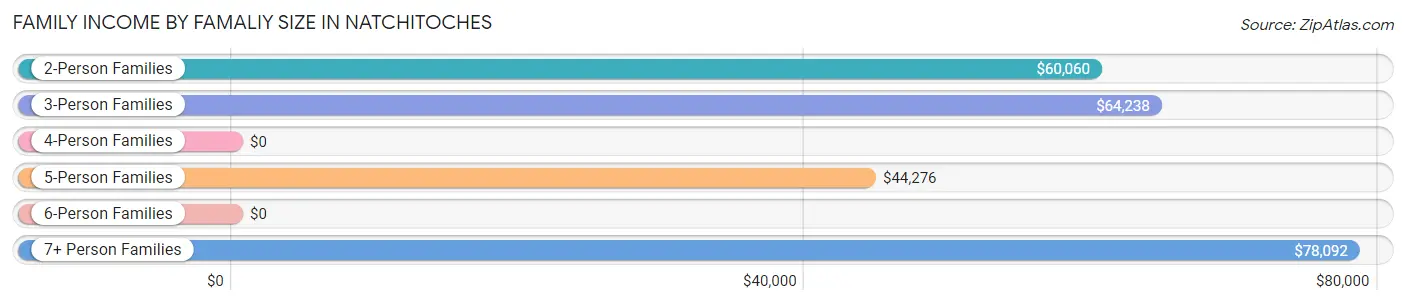
Family Income by Famaliy Size in Natchitoches
7+ person families (29 | 1.0%) account for the highest median family income in Natchitoches with $78,092 per family, while 2-person families (1,387 | 48.4%) have the highest median income of $30,030 per family member.
| Income Bracket | # Families | Median Income |
| 2-Person Families | 1,387 (48.4%) | $60,060 |
| 3-Person Families | 787 (27.5%) | $64,238 |
| 4-Person Families | 344 (12.0%) | $0 |
| 5-Person Families | 157 (5.5%) | $44,276 |
| 6-Person Families | 160 (5.6%) | $0 |
| 7+ Person Families | 29 (1.0%) | $78,092 |
| Total | 2,864 (100.0%) | $57,639 |
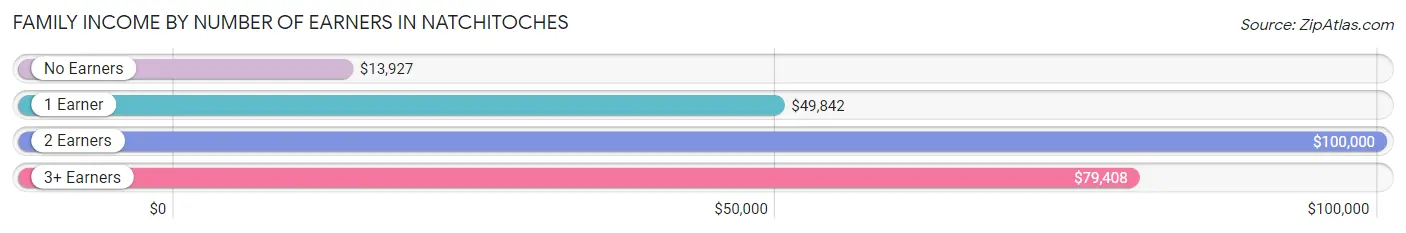
Family Income by Number of Earners in Natchitoches
The median family income in Natchitoches is $57,639, with families comprising 2 earners (998) having the highest median family income of $100,000, while families with no earners (695) have the lowest median family income of $13,927, accounting for 34.8% and 24.3% of families, respectively.
| Number of Earners | # Families | Median Income |
| No Earners | 695 (24.3%) | $13,927 |
| 1 Earner | 1,028 (35.9%) | $49,842 |
| 2 Earners | 998 (34.8%) | $100,000 |
| 3+ Earners | 143 (5.0%) | $79,408 |
| Total | 2,864 (100.0%) | $57,639 |
Household Income in Natchitoches
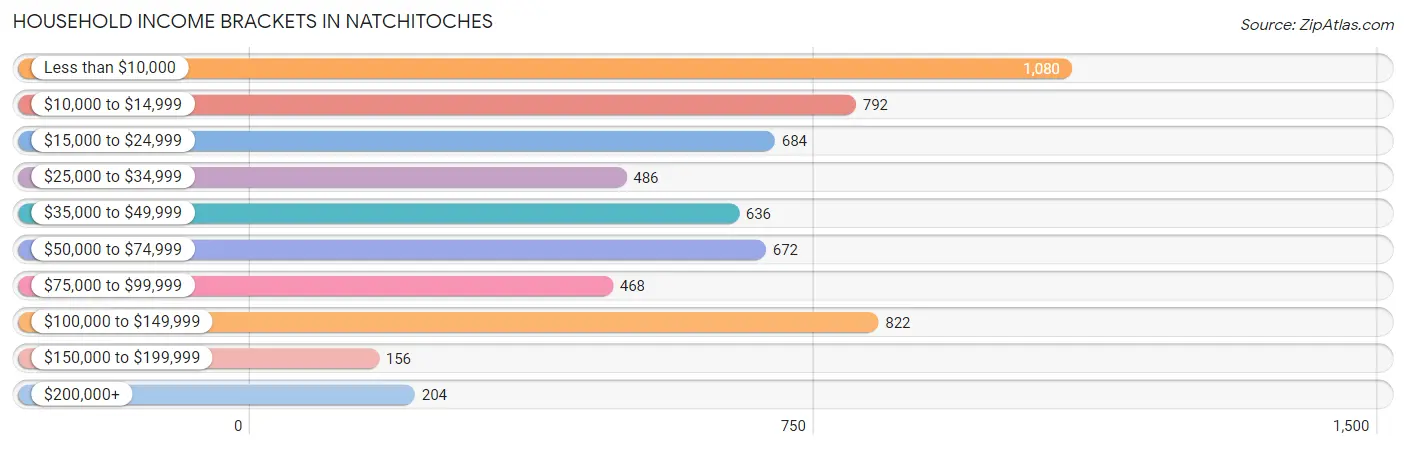
Household Income Brackets in Natchitoches
With 1,080 households falling in the category, the less than $10,000 income range is the most frequent in Natchitoches, accounting for 18.0% of all households. In contrast, only 156 households (2.6%) fall into the $150,000 to $199,999 income bracket, making it the least populous group.
| Income Bracket | # Households | % Households |
| Less than $10,000 | 1,080 | 18.0% |
| $10,000 to $14,999 | 792 | 13.2% |
| $15,000 to $24,999 | 684 | 11.4% |
| $25,000 to $34,999 | 486 | 8.1% |
| $35,000 to $49,999 | 636 | 10.6% |
| $50,000 to $74,999 | 672 | 11.2% |
| $75,000 to $99,999 | 468 | 7.8% |
| $100,000 to $149,999 | 822 | 13.7% |
| $150,000 to $199,999 | 156 | 2.6% |
| $200,000+ | 204 | 3.4% |
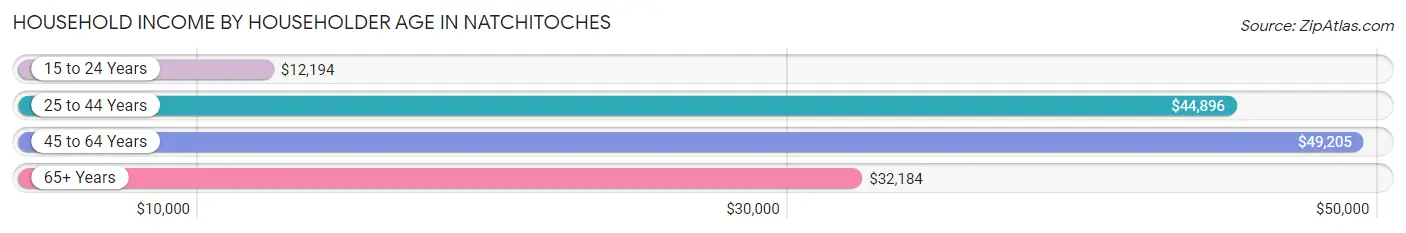
Household Income by Householder Age in Natchitoches
The median household income in Natchitoches is $34,020, with the highest median household income of $49,205 found in the 45 to 64 years age bracket for the primary householder. A total of 1,778 households (29.6%) fall into this category. Meanwhile, the 15 to 24 years age bracket for the primary householder has the lowest median household income of $12,194, with 1,070 households (17.8%) in this group.
| Income Bracket | # Households | Median Income |
| 15 to 24 Years | 1,070 (17.8%) | $12,194 |
| 25 to 44 Years | 1,769 (29.5%) | $44,896 |
| 45 to 64 Years | 1,778 (29.6%) | $49,205 |
| 65+ Years | 1,381 (23.0%) | $32,184 |
| Total | 5,998 (100.0%) | $34,020 |
Poverty in Natchitoches
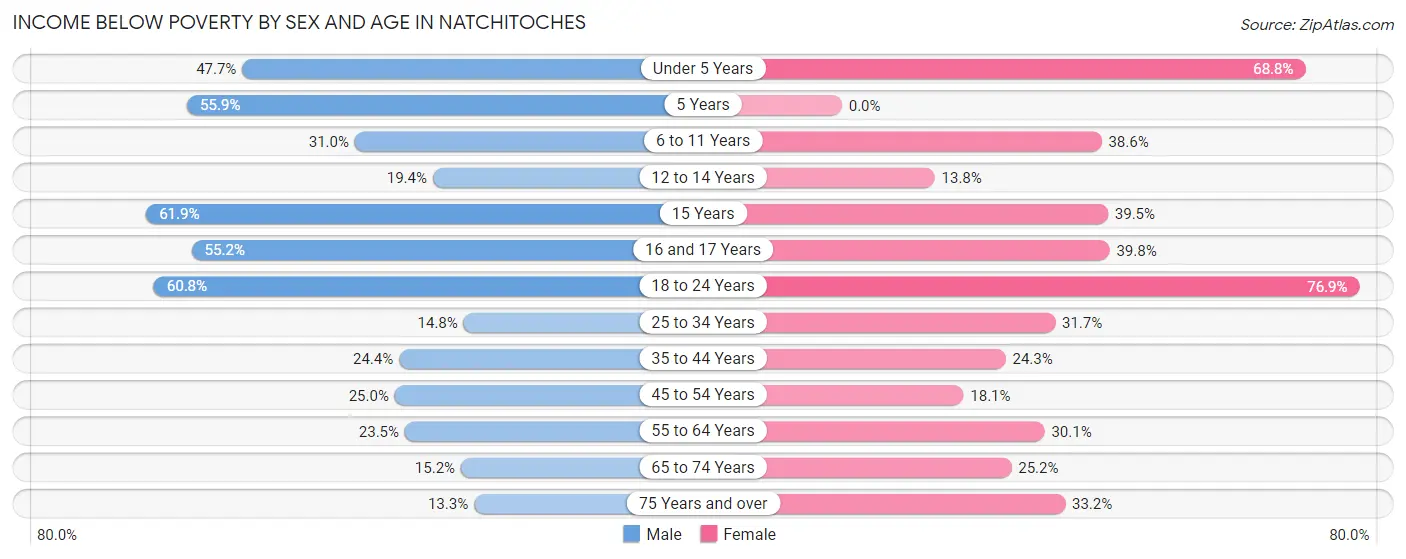
Income Below Poverty by Sex and Age in Natchitoches
With 34.8% poverty level for males and 40.9% for females among the residents of Natchitoches, 15 year old males and 18 to 24 year old females are the most vulnerable to poverty, with 109 males (61.9%) and 1,358 females (76.8%) in their respective age groups living below the poverty level.
| Age Bracket | Male | Female |
| Under 5 Years | 300 (47.7%) | 351 (68.8%) |
| 5 Years | 38 (55.9%) | 0 (0.0%) |
| 6 to 11 Years | 218 (31.0%) | 263 (38.6%) |
| 12 to 14 Years | 56 (19.4%) | 47 (13.8%) |
| 15 Years | 109 (61.9%) | 32 (39.5%) |
| 16 and 17 Years | 85 (55.2%) | 95 (39.8%) |
| 18 to 24 Years | 1,084 (60.8%) | 1,358 (76.8%) |
| 25 to 34 Years | 149 (14.8%) | 336 (31.7%) |
| 35 to 44 Years | 182 (24.4%) | 198 (24.3%) |
| 45 to 54 Years | 149 (25.0%) | 137 (18.0%) |
| 55 to 64 Years | 136 (23.5%) | 248 (30.1%) |
| 65 to 74 Years | 59 (15.2%) | 188 (25.2%) |
| 75 Years and over | 54 (13.3%) | 184 (33.2%) |
| Total | 2,619 (34.8%) | 3,437 (40.9%) |
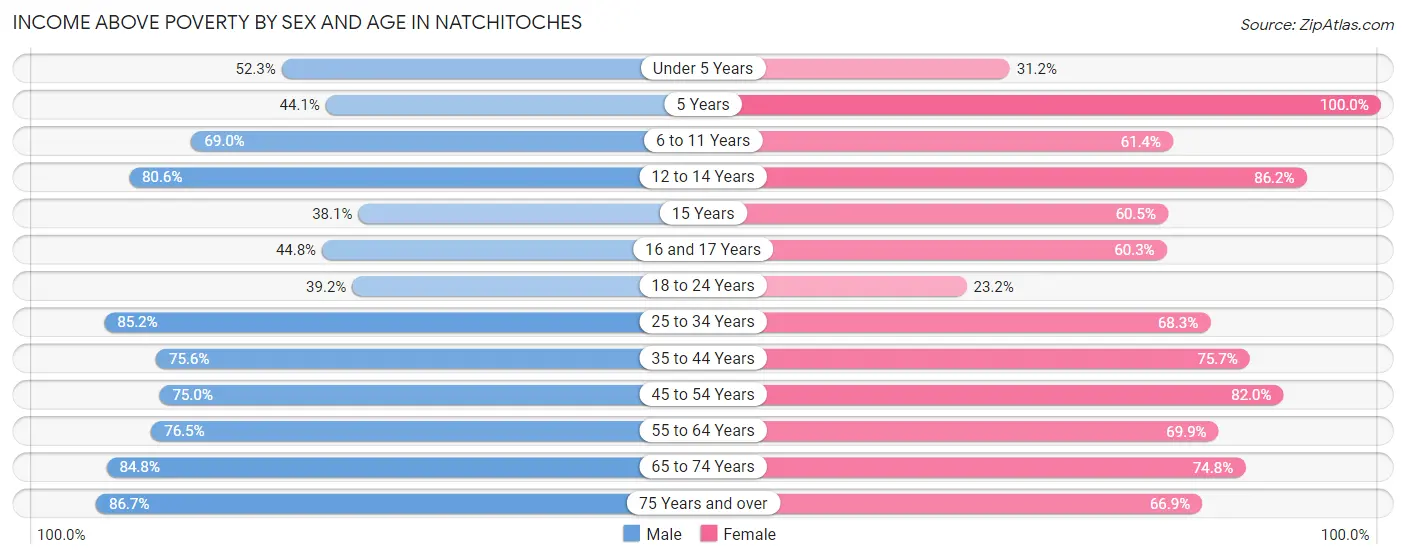
Income Above Poverty by Sex and Age in Natchitoches
According to the poverty statistics in Natchitoches, males aged 75 years and over and females aged 5 years are the age groups that are most secure financially, with 86.7% of males and 100.0% of females in these age groups living above the poverty line.
| Age Bracket | Male | Female |
| Under 5 Years | 329 (52.3%) | 159 (31.2%) |
| 5 Years | 30 (44.1%) | 27 (100.0%) |
| 6 to 11 Years | 486 (69.0%) | 419 (61.4%) |
| 12 to 14 Years | 233 (80.6%) | 294 (86.2%) |
| 15 Years | 67 (38.1%) | 49 (60.5%) |
| 16 and 17 Years | 69 (44.8%) | 144 (60.3%) |
| 18 to 24 Years | 699 (39.2%) | 409 (23.2%) |
| 25 to 34 Years | 857 (85.2%) | 725 (68.3%) |
| 35 to 44 Years | 564 (75.6%) | 616 (75.7%) |
| 45 to 54 Years | 446 (75.0%) | 622 (82.0%) |
| 55 to 64 Years | 442 (76.5%) | 576 (69.9%) |
| 65 to 74 Years | 329 (84.8%) | 559 (74.8%) |
| 75 Years and over | 353 (86.7%) | 371 (66.8%) |
| Total | 4,904 (65.2%) | 4,970 (59.1%) |
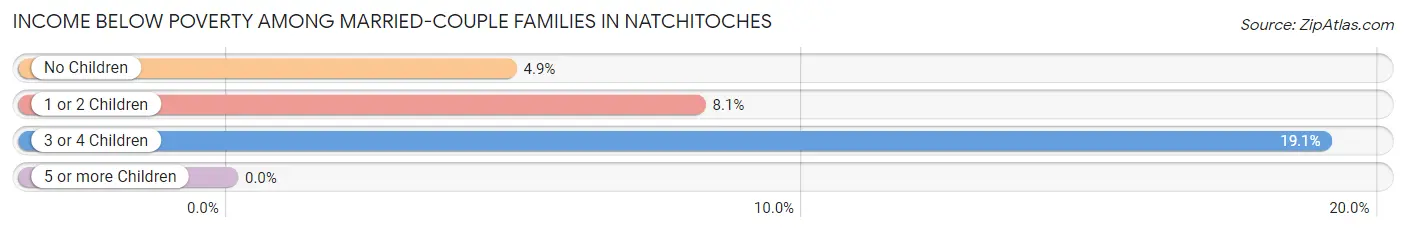
Income Below Poverty Among Married-Couple Families in Natchitoches
The poverty statistics for married-couple families in Natchitoches show that 6.8% or 102 of the total 1,496 families live below the poverty line. Families with 3 or 4 children have the highest poverty rate of 19.1%, comprising of 20 families. On the other hand, families with no children have the lowest poverty rate of 4.9%, which includes 46 families.
| Children | Above Poverty | Below Poverty |
| No Children | 903 (95.2%) | 46 (4.9%) |
| 1 or 2 Children | 406 (91.9%) | 36 (8.1%) |
| 3 or 4 Children | 85 (80.9%) | 20 (19.1%) |
| 5 or more Children | 0 (0.0%) | 0 (0.0%) |
| Total | 1,394 (93.2%) | 102 (6.8%) |
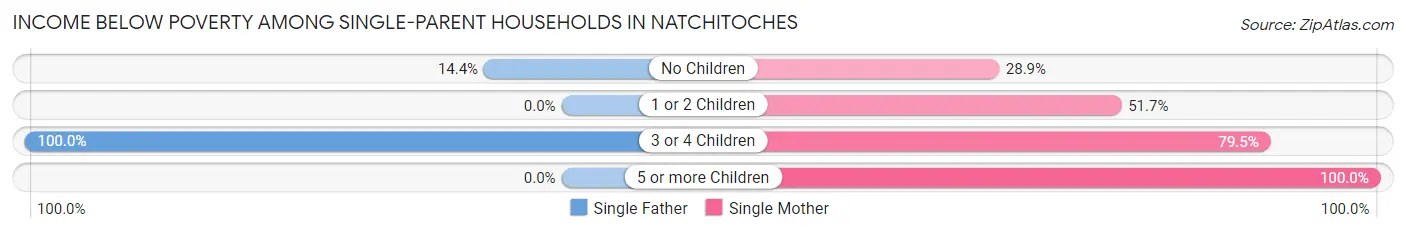
Income Below Poverty Among Single-Parent Households in Natchitoches
According to the poverty data in Natchitoches, 9.4% or 15 single-father households and 49.8% or 602 single-mother households are living below the poverty line. Among single-father households, those with 3 or 4 children have the highest poverty rate, with 2 households (100.0%) experiencing poverty. Likewise, among single-mother households, those with 5 or more children have the highest poverty rate, with 2 households (100.0%) falling below the poverty line.
| Children | Single Father | Single Mother |
| No Children | 13 (14.4%) | 102 (28.9%) |
| 1 or 2 Children | 0 (0.0%) | 335 (51.7%) |
| 3 or 4 Children | 2 (100.0%) | 163 (79.5%) |
| 5 or more Children | 0 (0.0%) | 2 (100.0%) |
| Total | 15 (9.4%) | 602 (49.8%) |
Income Below Poverty Among Married-Couple vs Single-Parent Households in Natchitoches
The poverty data for Natchitoches shows that 102 of the married-couple family households (6.8%) and 617 of the single-parent households (45.1%) are living below the poverty level. Within the married-couple family households, those with 3 or 4 children have the highest poverty rate, with 20 households (19.1%) falling below the poverty line. Among the single-parent households, those with 5 or more children have the highest poverty rate, with 2 household (100.0%) living below poverty.
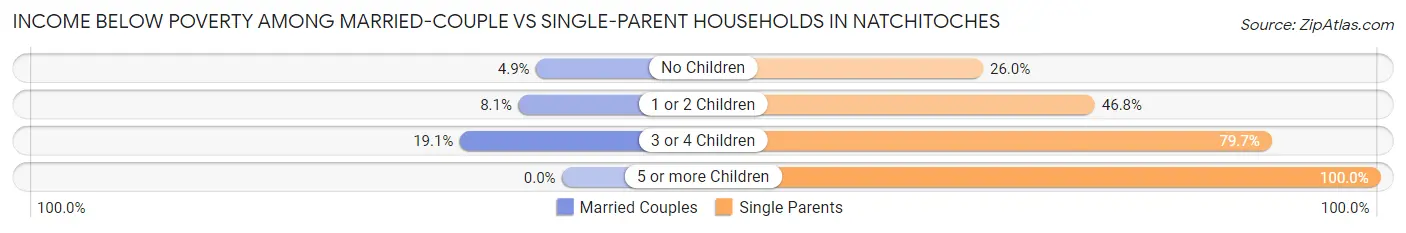
| Children | Married-Couple Families | Single-Parent Households |
| No Children | 46 (4.9%) | 115 (26.0%) |
| 1 or 2 Children | 36 (8.1%) | 335 (46.8%) |
| 3 or 4 Children | 20 (19.1%) | 165 (79.7%) |
| 5 or more Children | 0 (0.0%) | 2 (100.0%) |
| Total | 102 (6.8%) | 617 (45.1%) |
Employment Characteristics in Natchitoches
Employment by Class of Employer in Natchitoches
Among the 6,357 employed individuals in Natchitoches, private company employees (3,874 | 60.9%), state government employees (901 | 14.2%), and not-for-profit organizations (463 | 7.3%) make up the most common classes of employment.
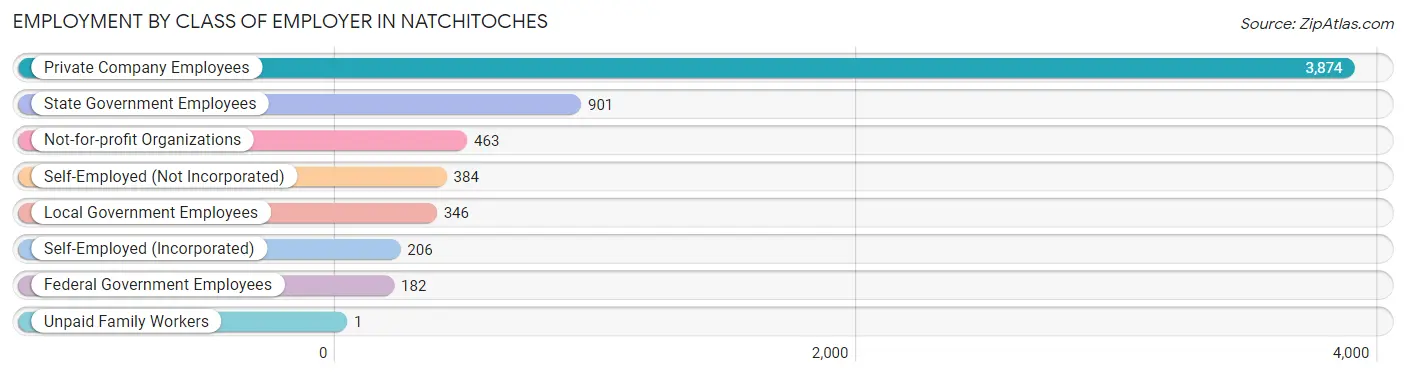
| Employer Class | # Employees | % Employees |
| Private Company Employees | 3,874 | 60.9% |
| Self-Employed (Incorporated) | 206 | 3.2% |
| Self-Employed (Not Incorporated) | 384 | 6.0% |
| Not-for-profit Organizations | 463 | 7.3% |
| Local Government Employees | 346 | 5.4% |
| State Government Employees | 901 | 14.2% |
| Federal Government Employees | 182 | 2.9% |
| Unpaid Family Workers | 1 | 0.0% |
| Total | 6,357 | 100.0% |
Employment Status by Age in Natchitoches
According to the labor force statistics for Natchitoches, out of the total population over 16 years of age (14,381), 50.5% or 7,262 individuals are in the labor force, with 11.4% or 828 of them unemployed. The age group with the highest labor force participation rate is 45 to 54 years, with 73.4% or 1,025 individuals in the labor force. Within the labor force, the 16 to 19 years age range has the highest percentage of unemployed individuals, with 42.9% or 246 of them being unemployed.
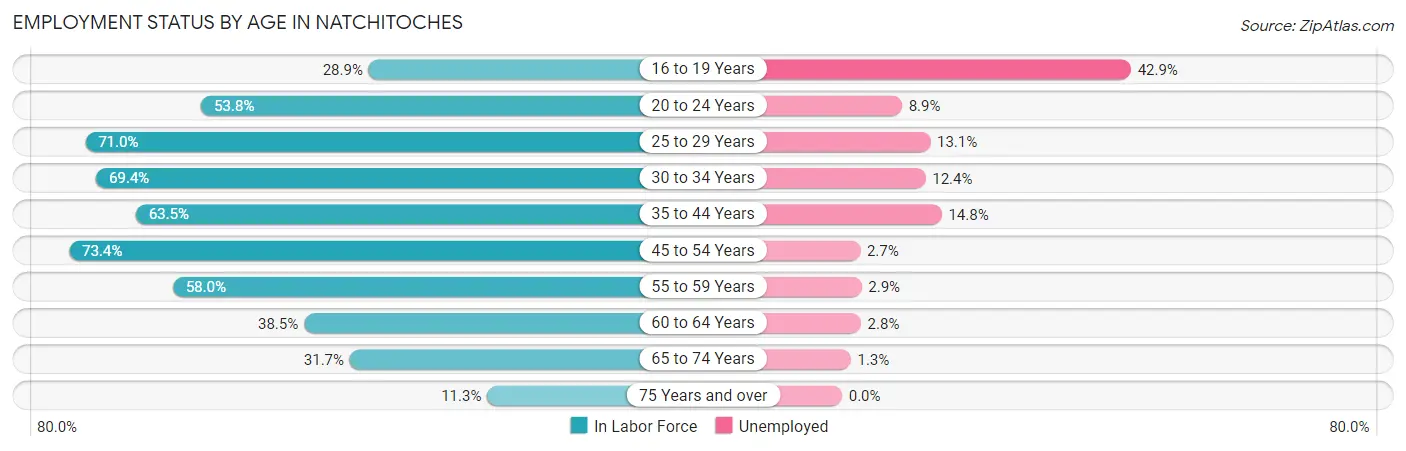
| Age Bracket | In Labor Force | Unemployed |
| 16 to 19 Years | 573 (28.9%) | 246 (42.9%) |
| 20 to 24 Years | 1,710 (53.8%) | 152 (8.9%) |
| 25 to 29 Years | 819 (71.0%) | 107 (13.1%) |
| 30 to 34 Years | 784 (69.4%) | 97 (12.4%) |
| 35 to 44 Years | 1,153 (63.5%) | 171 (14.8%) |
| 45 to 54 Years | 1,025 (73.4%) | 28 (2.7%) |
| 55 to 59 Years | 419 (58.0%) | 12 (2.9%) |
| 60 to 64 Years | 290 (38.5%) | 8 (2.8%) |
| 65 to 74 Years | 376 (31.7%) | 5 (1.3%) |
| 75 Years and over | 120 (11.3%) | 0 (0.0%) |
| Total | 7,262 (50.5%) | 828 (11.4%) |
Employment Status by Educational Attainment in Natchitoches
According to labor force statistics for Natchitoches, 64.4% of individuals (4,489) out of the total population between 25 and 64 years of age (6,971) are in the labor force, with 9.4% or 422 of them being unemployed. The group with the highest labor force participation rate are those with the educational attainment of bachelor's degree or higher, with 90.8% or 1,525 individuals in the labor force. Within the labor force, individuals with high school diploma education have the highest percentage of unemployment, with 20.1% or 245 of them being unemployed.
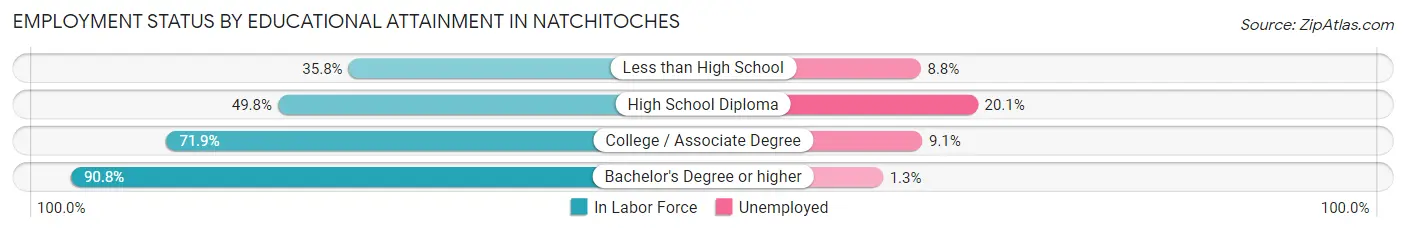
| Educational Attainment | In Labor Force | Unemployed |
| Less than High School | 297 (35.8%) | 73 (8.8%) |
| High School Diploma | 1,218 (49.8%) | 492 (20.1%) |
| College / Associate Degree | 1,450 (71.9%) | 183 (9.1%) |
| Bachelor's Degree or higher | 1,525 (90.8%) | 22 (1.3%) |
| Total | 4,489 (64.4%) | 655 (9.4%) |
Employment Occupations by Sex in Natchitoches
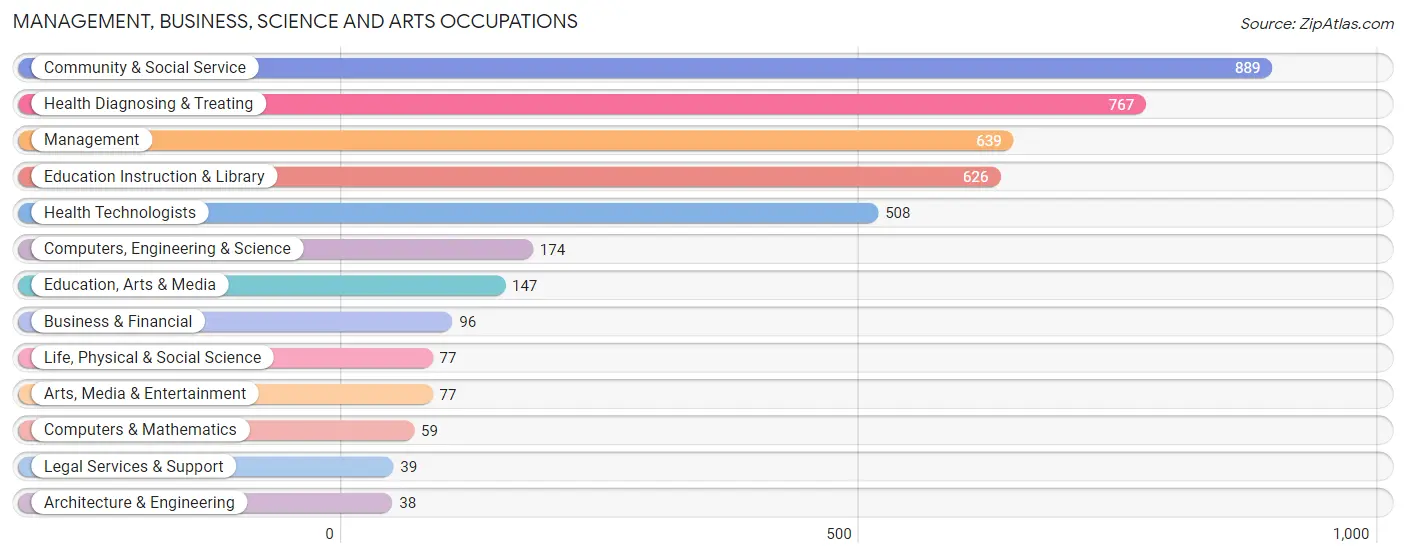
Management, Business, Science and Arts Occupations
The most common Management, Business, Science and Arts occupations in Natchitoches are Community & Social Service (889 | 13.8%), Health Diagnosing & Treating (767 | 11.9%), Management (639 | 9.9%), Education Instruction & Library (626 | 9.7%), and Health Technologists (508 | 7.9%).
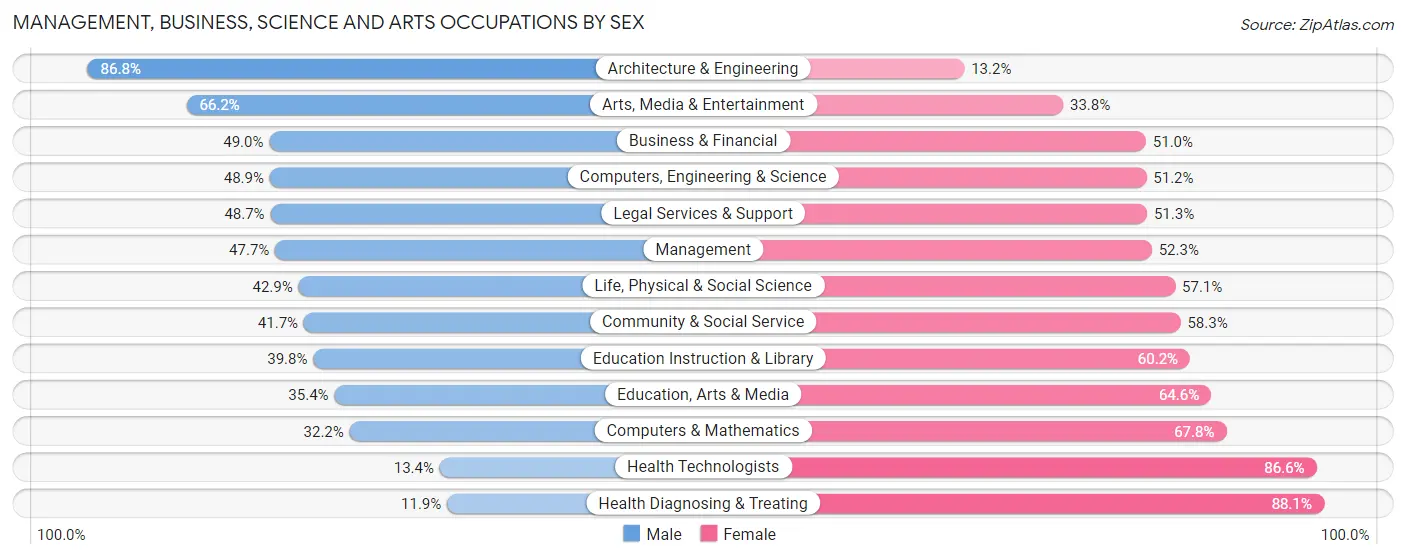
Management, Business, Science and Arts Occupations by Sex
Within the Management, Business, Science and Arts occupations in Natchitoches, the most male-oriented occupations are Architecture & Engineering (86.8%), Arts, Media & Entertainment (66.2%), and Business & Financial (49.0%), while the most female-oriented occupations are Health Diagnosing & Treating (88.1%), Health Technologists (86.6%), and Computers & Mathematics (67.8%).
| Occupation | Male | Female |
| Management | 305 (47.7%) | 334 (52.3%) |
| Business & Financial | 47 (49.0%) | 49 (51.0%) |
| Computers, Engineering & Science | 85 (48.8%) | 89 (51.1%) |
| Computers & Mathematics | 19 (32.2%) | 40 (67.8%) |
| Architecture & Engineering | 33 (86.8%) | 5 (13.2%) |
| Life, Physical & Social Science | 33 (42.9%) | 44 (57.1%) |
| Community & Social Service | 371 (41.7%) | 518 (58.3%) |
| Education, Arts & Media | 52 (35.4%) | 95 (64.6%) |
| Legal Services & Support | 19 (48.7%) | 20 (51.3%) |
| Education Instruction & Library | 249 (39.8%) | 377 (60.2%) |
| Arts, Media & Entertainment | 51 (66.2%) | 26 (33.8%) |
| Health Diagnosing & Treating | 91 (11.9%) | 676 (88.1%) |
| Health Technologists | 68 (13.4%) | 440 (86.6%) |
| Total (Category) | 899 (35.0%) | 1,666 (64.9%) |
| Total (Overall) | 2,820 (43.8%) | 3,617 (56.2%) |
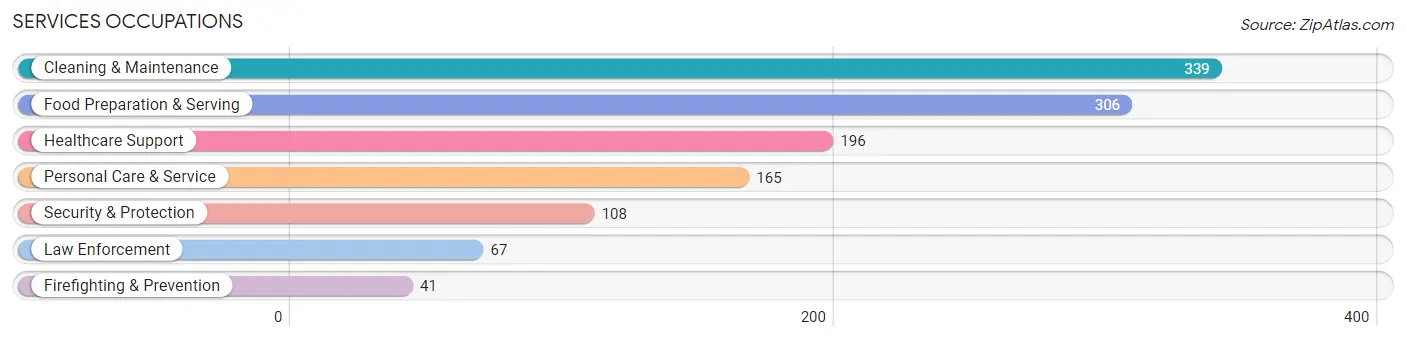
Services Occupations
The most common Services occupations in Natchitoches are Cleaning & Maintenance (339 | 5.3%), Food Preparation & Serving (306 | 4.8%), Healthcare Support (196 | 3.0%), Personal Care & Service (165 | 2.6%), and Security & Protection (108 | 1.7%).
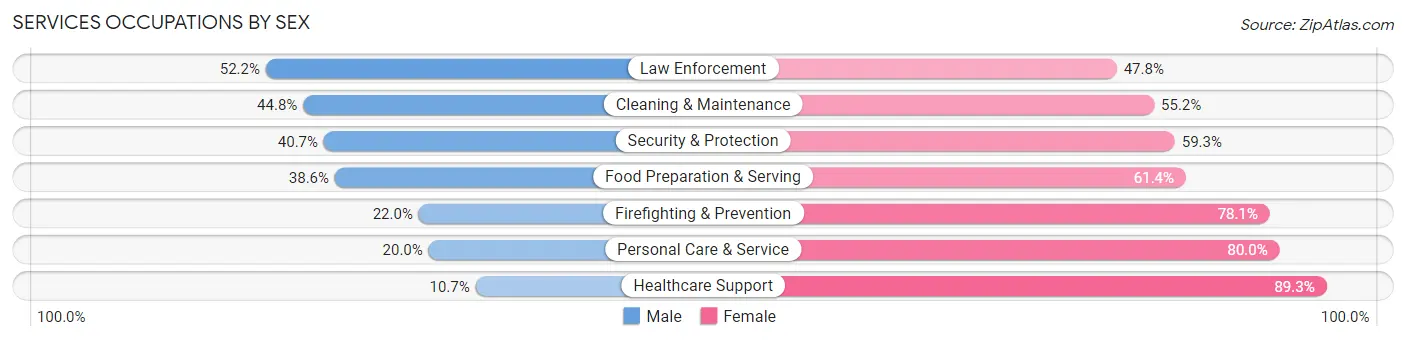
Services Occupations by Sex
Within the Services occupations in Natchitoches, the most male-oriented occupations are Law Enforcement (52.2%), Cleaning & Maintenance (44.8%), and Security & Protection (40.7%), while the most female-oriented occupations are Healthcare Support (89.3%), Personal Care & Service (80.0%), and Firefighting & Prevention (78.0%).
| Occupation | Male | Female |
| Healthcare Support | 21 (10.7%) | 175 (89.3%) |
| Security & Protection | 44 (40.7%) | 64 (59.3%) |
| Firefighting & Prevention | 9 (22.0%) | 32 (78.0%) |
| Law Enforcement | 35 (52.2%) | 32 (47.8%) |
| Food Preparation & Serving | 118 (38.6%) | 188 (61.4%) |
| Cleaning & Maintenance | 152 (44.8%) | 187 (55.2%) |
| Personal Care & Service | 33 (20.0%) | 132 (80.0%) |
| Total (Category) | 368 (33.0%) | 746 (67.0%) |
| Total (Overall) | 2,820 (43.8%) | 3,617 (56.2%) |
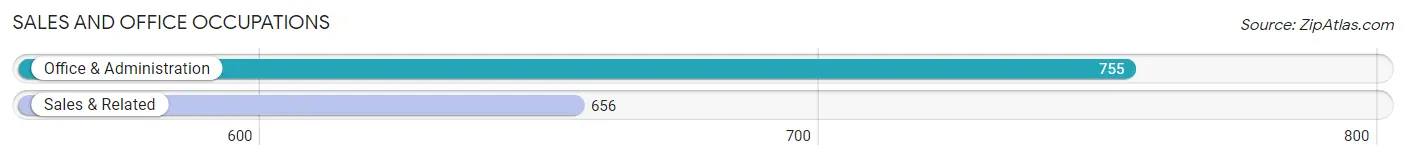
Sales and Office Occupations
The most common Sales and Office occupations in Natchitoches are Office & Administration (755 | 11.7%), and Sales & Related (656 | 10.2%).
Sales and Office Occupations by Sex
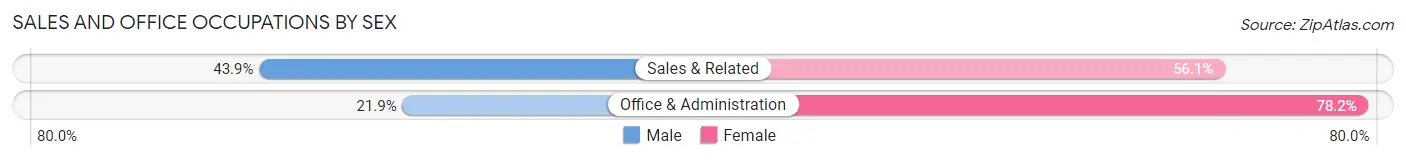
| Occupation | Male | Female |
| Sales & Related | 288 (43.9%) | 368 (56.1%) |
| Office & Administration | 165 (21.8%) | 590 (78.1%) |
| Total (Category) | 453 (32.1%) | 958 (67.9%) |
| Total (Overall) | 2,820 (43.8%) | 3,617 (56.2%) |
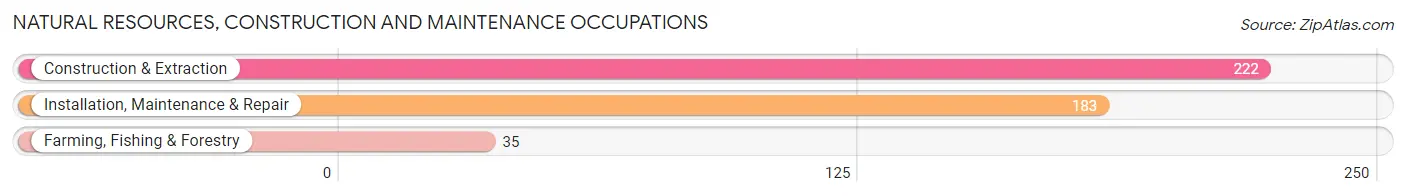
Natural Resources, Construction and Maintenance Occupations
The most common Natural Resources, Construction and Maintenance occupations in Natchitoches are Construction & Extraction (222 | 3.5%), Installation, Maintenance & Repair (183 | 2.8%), and Farming, Fishing & Forestry (35 | 0.5%).
Natural Resources, Construction and Maintenance Occupations by Sex
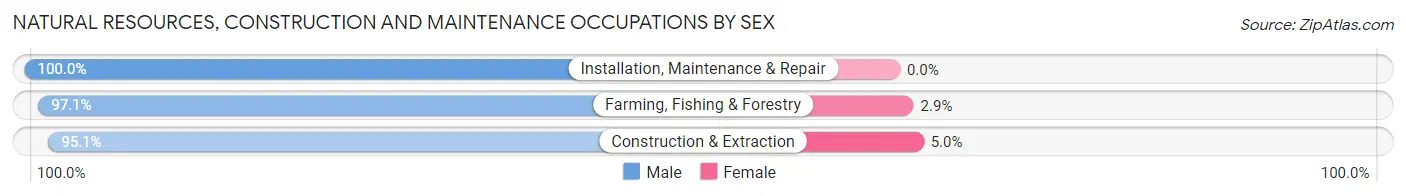
| Occupation | Male | Female |
| Farming, Fishing & Forestry | 34 (97.1%) | 1 (2.9%) |
| Construction & Extraction | 211 (95.1%) | 11 (5.0%) |
| Installation, Maintenance & Repair | 183 (100.0%) | 0 (0.0%) |
| Total (Category) | 428 (97.3%) | 12 (2.7%) |
| Total (Overall) | 2,820 (43.8%) | 3,617 (56.2%) |
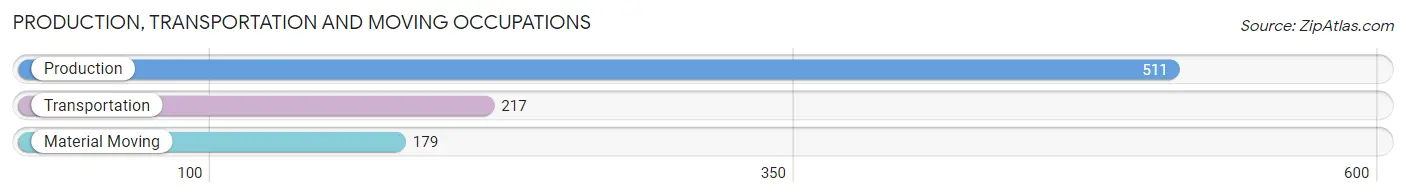
Production, Transportation and Moving Occupations
The most common Production, Transportation and Moving occupations in Natchitoches are Production (511 | 7.9%), Transportation (217 | 3.4%), and Material Moving (179 | 2.8%).
Production, Transportation and Moving Occupations by Sex
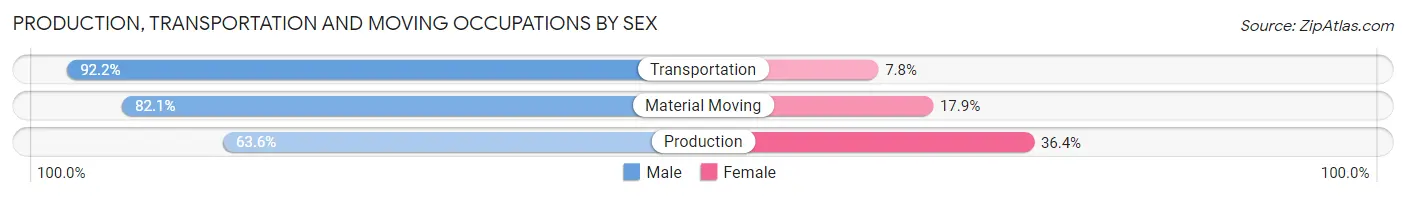
| Occupation | Male | Female |
| Production | 325 (63.6%) | 186 (36.4%) |
| Transportation | 200 (92.2%) | 17 (7.8%) |
| Material Moving | 147 (82.1%) | 32 (17.9%) |
| Total (Category) | 672 (74.1%) | 235 (25.9%) |
| Total (Overall) | 2,820 (43.8%) | 3,617 (56.2%) |
Employment Industries by Sex in Natchitoches
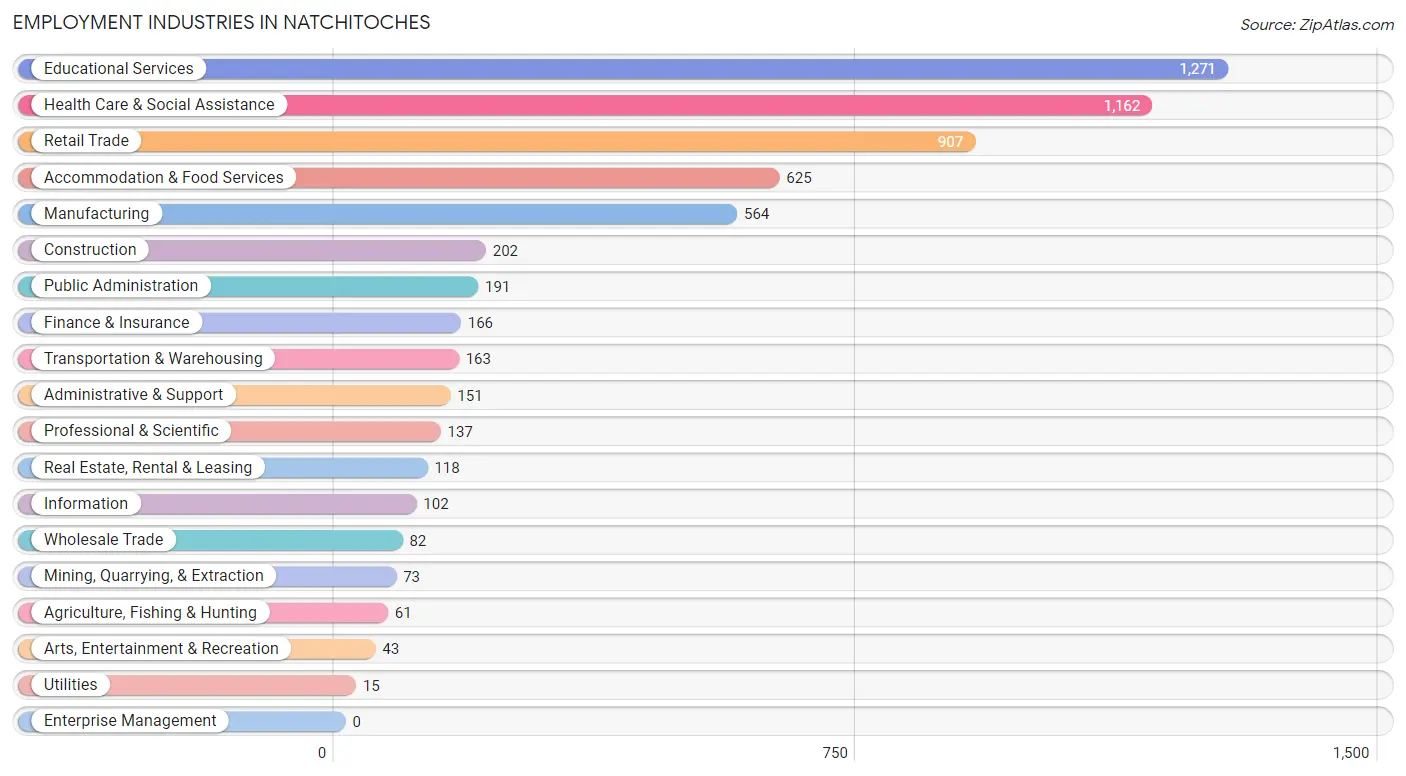
Employment Industries in Natchitoches
The major employment industries in Natchitoches include Educational Services (1,271 | 19.8%), Health Care & Social Assistance (1,162 | 18.0%), Retail Trade (907 | 14.1%), Accommodation & Food Services (625 | 9.7%), and Manufacturing (564 | 8.8%).
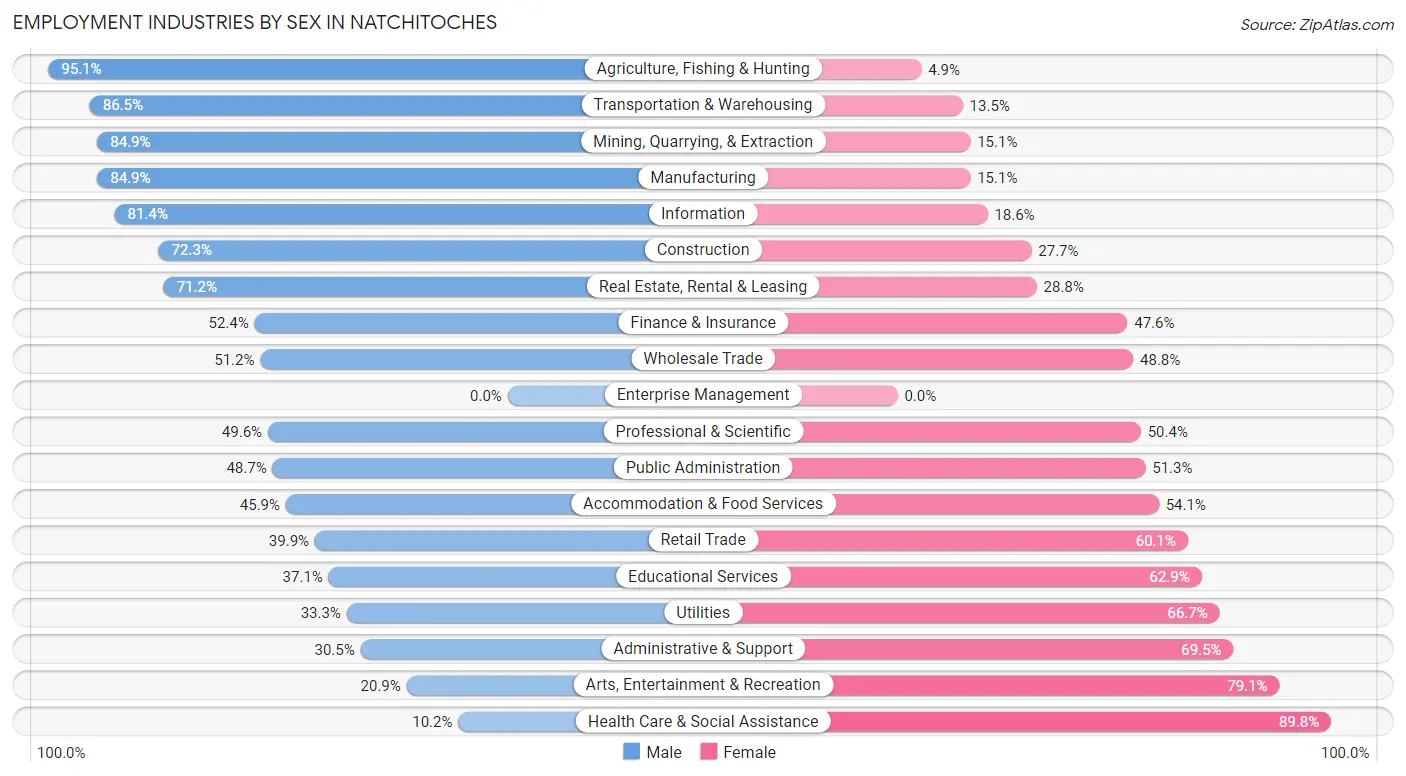
Employment Industries by Sex in Natchitoches
The Natchitoches industries that see more men than women are Agriculture, Fishing & Hunting (95.1%), Transportation & Warehousing (86.5%), and Mining, Quarrying, & Extraction (84.9%), whereas the industries that tend to have a higher number of women are Health Care & Social Assistance (89.8%), Arts, Entertainment & Recreation (79.1%), and Administrative & Support (69.5%).
| Industry | Male | Female |
| Agriculture, Fishing & Hunting | 58 (95.1%) | 3 (4.9%) |
| Mining, Quarrying, & Extraction | 62 (84.9%) | 11 (15.1%) |
| Construction | 146 (72.3%) | 56 (27.7%) |
| Manufacturing | 479 (84.9%) | 85 (15.1%) |
| Wholesale Trade | 42 (51.2%) | 40 (48.8%) |
| Retail Trade | 362 (39.9%) | 545 (60.1%) |
| Transportation & Warehousing | 141 (86.5%) | 22 (13.5%) |
| Utilities | 5 (33.3%) | 10 (66.7%) |
| Information | 83 (81.4%) | 19 (18.6%) |
| Finance & Insurance | 87 (52.4%) | 79 (47.6%) |
| Real Estate, Rental & Leasing | 84 (71.2%) | 34 (28.8%) |
| Professional & Scientific | 68 (49.6%) | 69 (50.4%) |
| Enterprise Management | 0 (0.0%) | 0 (0.0%) |
| Administrative & Support | 46 (30.5%) | 105 (69.5%) |
| Educational Services | 471 (37.1%) | 800 (62.9%) |
| Health Care & Social Assistance | 119 (10.2%) | 1,043 (89.8%) |
| Arts, Entertainment & Recreation | 9 (20.9%) | 34 (79.1%) |
| Accommodation & Food Services | 287 (45.9%) | 338 (54.1%) |
| Public Administration | 93 (48.7%) | 98 (51.3%) |
| Total | 2,820 (43.8%) | 3,617 (56.2%) |
Education in Natchitoches
School Enrollment in Natchitoches
The most common levels of schooling among the 6,429 students in Natchitoches are college / undergraduate (3,641 | 56.6%), elementary school (866 | 13.5%), and high school (811 | 12.6%).
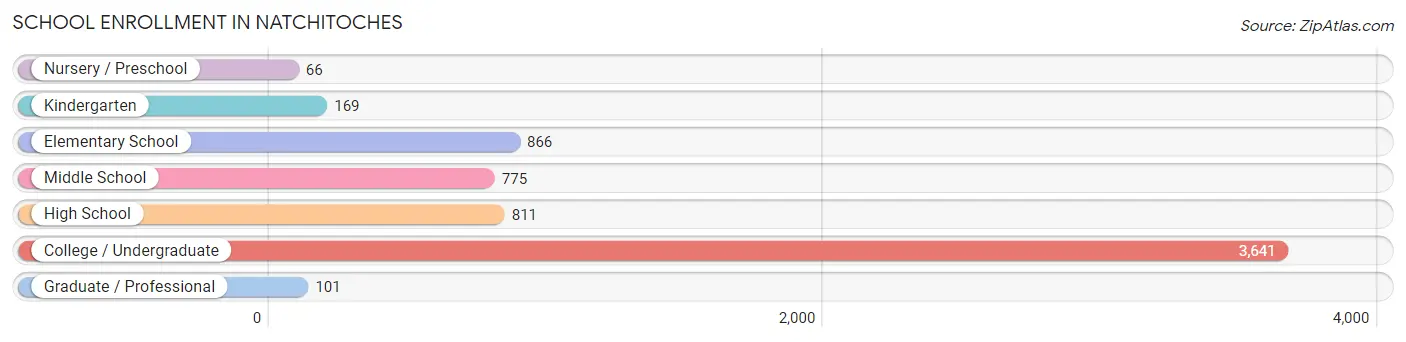
| School Level | # Students | % Students |
| Nursery / Preschool | 66 | 1.0% |
| Kindergarten | 169 | 2.6% |
| Elementary School | 866 | 13.5% |
| Middle School | 775 | 12.0% |
| High School | 811 | 12.6% |
| College / Undergraduate | 3,641 | 56.6% |
| Graduate / Professional | 101 | 1.6% |
| Total | 6,429 | 100.0% |
School Enrollment by Age by Funding Source in Natchitoches
Out of a total of 6,429 students who are enrolled in schools in Natchitoches, 643 (10.0%) attend a private institution, while the remaining 5,786 (90.0%) are enrolled in public schools. The age group of 25 to 34 year olds has the highest likelihood of being enrolled in private schools, with 47 (29.2% in the age bracket) enrolled. Conversely, the age group of 20 to 24 year olds has the lowest likelihood of being enrolled in a private school, with 2,022 (96.8% in the age bracket) attending a public institution.
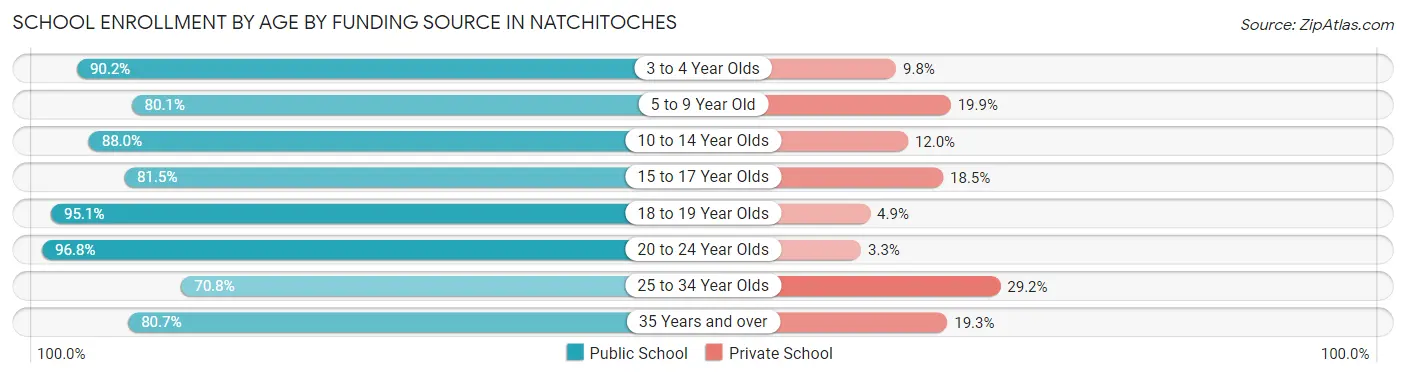
| Age Bracket | Public School | Private School |
| 3 to 4 Year Olds | 37 (90.2%) | 4 (9.8%) |
| 5 to 9 Year Old | 799 (80.1%) | 199 (19.9%) |
| 10 to 14 Year Olds | 846 (88.0%) | 115 (12.0%) |
| 15 to 17 Year Olds | 484 (81.5%) | 110 (18.5%) |
| 18 to 19 Year Olds | 1,368 (95.1%) | 71 (4.9%) |
| 20 to 24 Year Olds | 2,022 (96.8%) | 68 (3.3%) |
| 25 to 34 Year Olds | 114 (70.8%) | 47 (29.2%) |
| 35 Years and over | 117 (80.7%) | 28 (19.3%) |
| Total | 5,786 (90.0%) | 643 (10.0%) |
Educational Attainment by Field of Study in Natchitoches
Science & technology (531 | 18.4%), education (361 | 12.5%), arts & humanities (298 | 10.3%), business (263 | 9.1%), and bio, nature & agricultural (248 | 8.6%) are the most common fields of study among 2,889 individuals in Natchitoches who have obtained a bachelor's degree or higher.
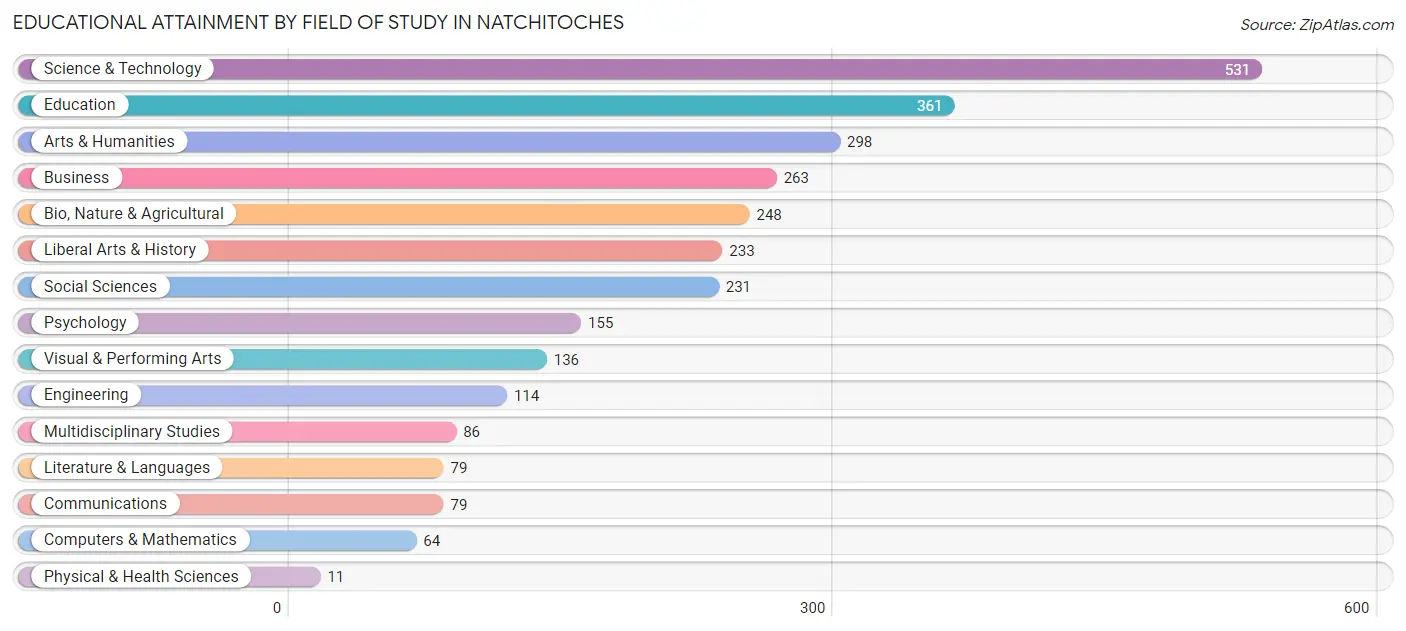
| Field of Study | # Graduates | % Graduates |
| Computers & Mathematics | 64 | 2.2% |
| Bio, Nature & Agricultural | 248 | 8.6% |
| Physical & Health Sciences | 11 | 0.4% |
| Psychology | 155 | 5.4% |
| Social Sciences | 231 | 8.0% |
| Engineering | 114 | 4.0% |
| Multidisciplinary Studies | 86 | 3.0% |
| Science & Technology | 531 | 18.4% |
| Business | 263 | 9.1% |
| Education | 361 | 12.5% |
| Literature & Languages | 79 | 2.7% |
| Liberal Arts & History | 233 | 8.1% |
| Visual & Performing Arts | 136 | 4.7% |
| Communications | 79 | 2.7% |
| Arts & Humanities | 298 | 10.3% |
| Total | 2,889 | 100.0% |
Transportation & Commute in Natchitoches
Vehicle Availability by Sex in Natchitoches
The most prevalent vehicle ownership categories in Natchitoches are males with 2 vehicles (1,072, accounting for 38.7%) and females with 2 vehicles (1,269, making up 33.5%).
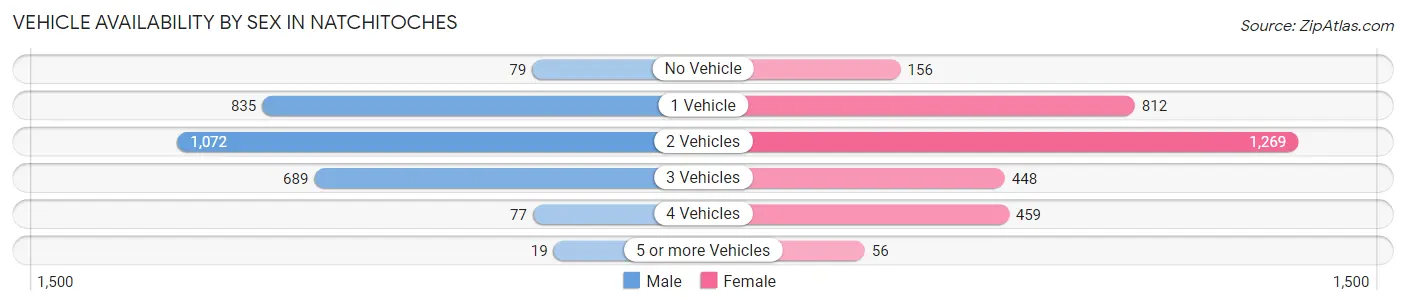
| Vehicles Available | Male | Female |
| No Vehicle | 79 (2.9%) | 156 (4.9%) |
| 1 Vehicle | 835 (30.1%) | 812 (25.4%) |
| 2 Vehicles | 1,072 (38.7%) | 1,269 (39.7%) |
| 3 Vehicles | 689 (24.9%) | 448 (14.0%) |
| 4 Vehicles | 77 (2.8%) | 459 (14.3%) |
| 5 or more Vehicles | 19 (0.7%) | 56 (1.8%) |
| Total | 2,771 (100.0%) | 3,200 (100.0%) |
Commute Time in Natchitoches
The most frequently occuring commute durations in Natchitoches are 5 to 9 minutes (1,750 commuters, 28.2%), 10 to 14 minutes (1,609 commuters, 26.0%), and 15 to 19 minutes (1,215 commuters, 19.6%).
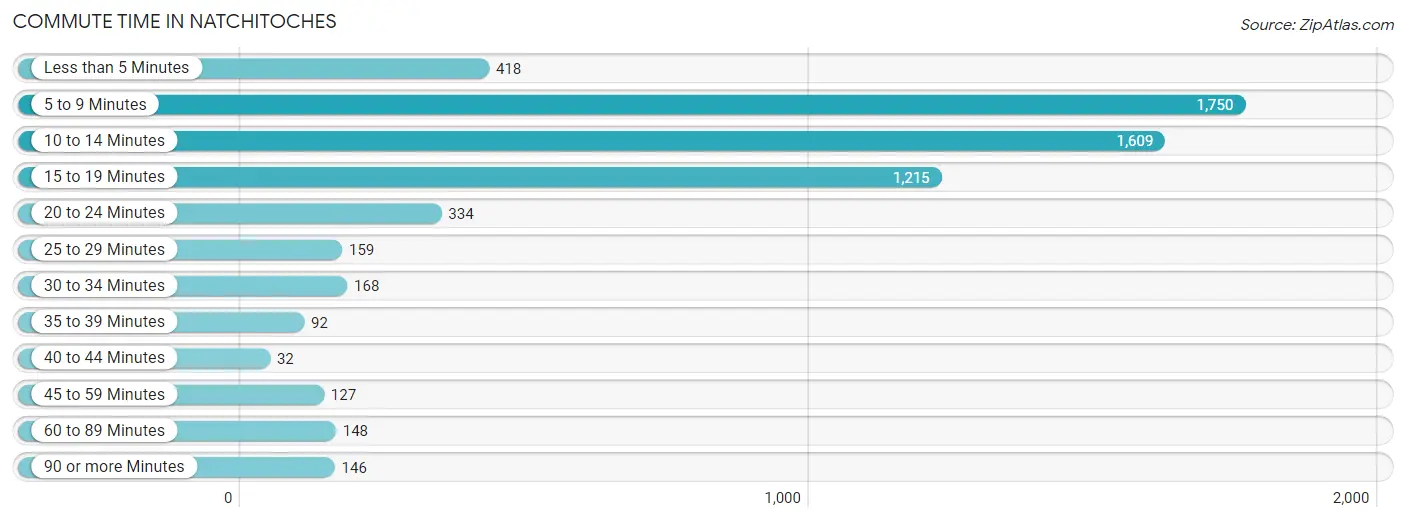
| Commute Time | # Commuters | % Commuters |
| Less than 5 Minutes | 418 | 6.7% |
| 5 to 9 Minutes | 1,750 | 28.2% |
| 10 to 14 Minutes | 1,609 | 26.0% |
| 15 to 19 Minutes | 1,215 | 19.6% |
| 20 to 24 Minutes | 334 | 5.4% |
| 25 to 29 Minutes | 159 | 2.6% |
| 30 to 34 Minutes | 168 | 2.7% |
| 35 to 39 Minutes | 92 | 1.5% |
| 40 to 44 Minutes | 32 | 0.5% |
| 45 to 59 Minutes | 127 | 2.1% |
| 60 to 89 Minutes | 148 | 2.4% |
| 90 or more Minutes | 146 | 2.4% |
Commute Time by Sex in Natchitoches
The most common commute times in Natchitoches are 5 to 9 minutes (769 commuters, 28.1%) for males and 5 to 9 minutes (981 commuters, 28.3%) for females.
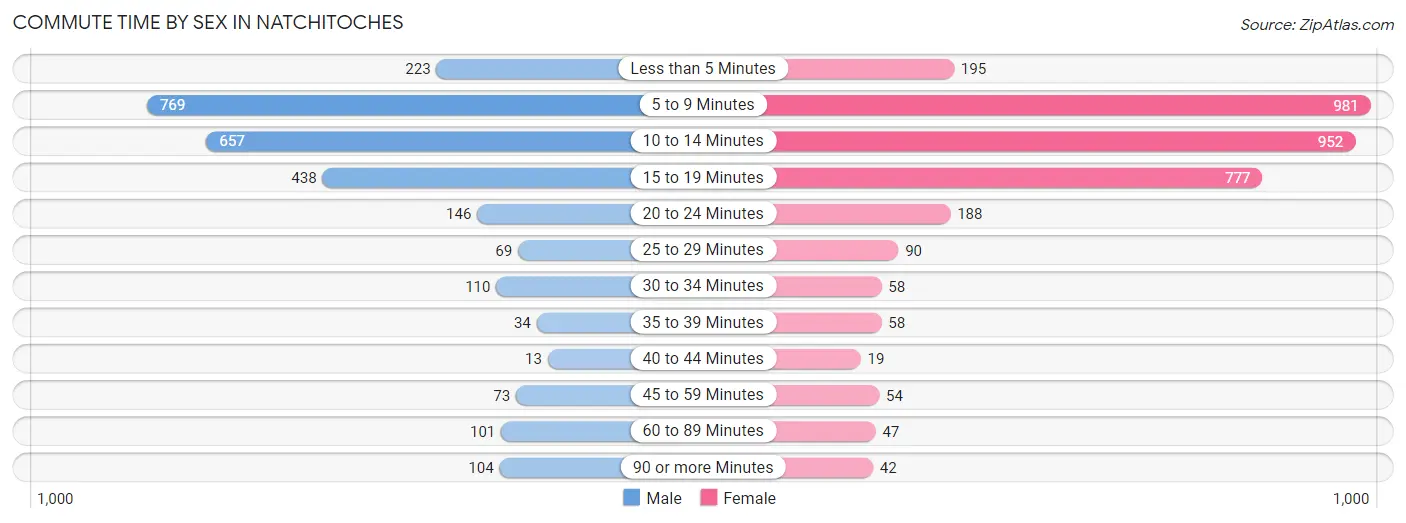
| Commute Time | Male | Female |
| Less than 5 Minutes | 223 (8.2%) | 195 (5.6%) |
| 5 to 9 Minutes | 769 (28.1%) | 981 (28.3%) |
| 10 to 14 Minutes | 657 (24.0%) | 952 (27.5%) |
| 15 to 19 Minutes | 438 (16.0%) | 777 (22.5%) |
| 20 to 24 Minutes | 146 (5.3%) | 188 (5.4%) |
| 25 to 29 Minutes | 69 (2.5%) | 90 (2.6%) |
| 30 to 34 Minutes | 110 (4.0%) | 58 (1.7%) |
| 35 to 39 Minutes | 34 (1.2%) | 58 (1.7%) |
| 40 to 44 Minutes | 13 (0.5%) | 19 (0.5%) |
| 45 to 59 Minutes | 73 (2.7%) | 54 (1.6%) |
| 60 to 89 Minutes | 101 (3.7%) | 47 (1.4%) |
| 90 or more Minutes | 104 (3.8%) | 42 (1.2%) |
Time of Departure to Work by Sex in Natchitoches
The most frequent times of departure to work in Natchitoches are 7:30 AM to 7:59 AM (399, 14.6%) for males and 7:00 AM to 7:29 AM (778, 22.5%) for females.
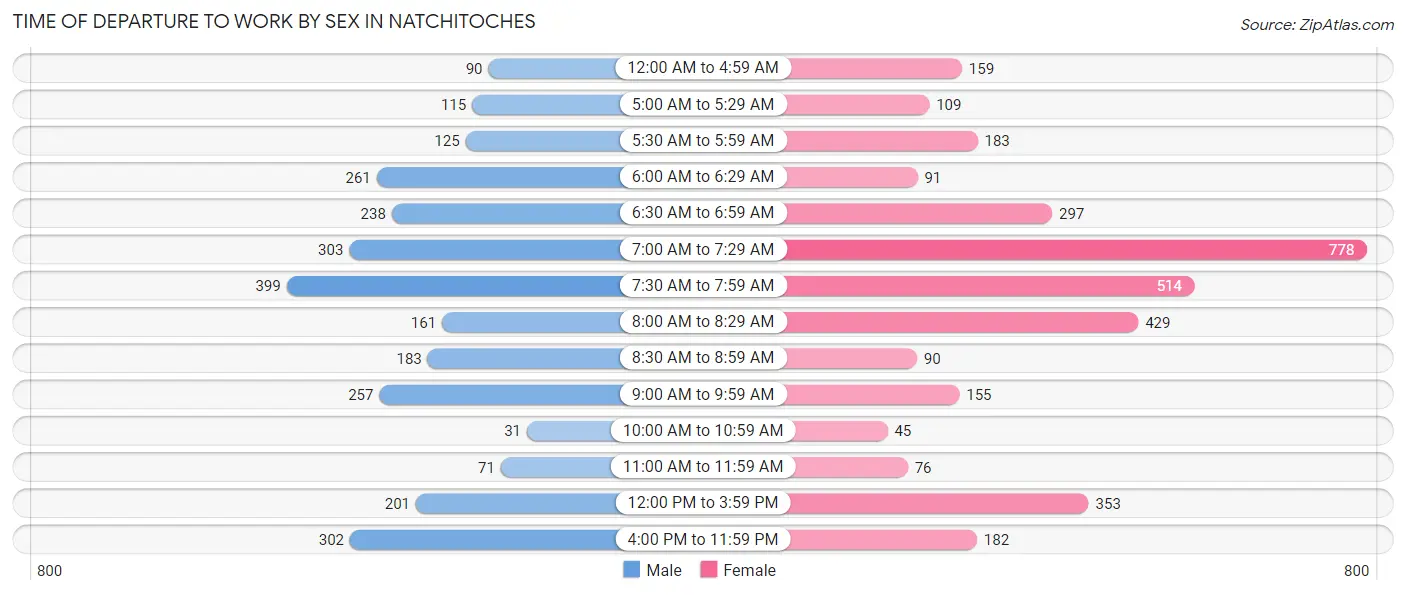
| Time of Departure | Male | Female |
| 12:00 AM to 4:59 AM | 90 (3.3%) | 159 (4.6%) |
| 5:00 AM to 5:29 AM | 115 (4.2%) | 109 (3.2%) |
| 5:30 AM to 5:59 AM | 125 (4.6%) | 183 (5.3%) |
| 6:00 AM to 6:29 AM | 261 (9.5%) | 91 (2.6%) |
| 6:30 AM to 6:59 AM | 238 (8.7%) | 297 (8.6%) |
| 7:00 AM to 7:29 AM | 303 (11.1%) | 778 (22.5%) |
| 7:30 AM to 7:59 AM | 399 (14.6%) | 514 (14.8%) |
| 8:00 AM to 8:29 AM | 161 (5.9%) | 429 (12.4%) |
| 8:30 AM to 8:59 AM | 183 (6.7%) | 90 (2.6%) |
| 9:00 AM to 9:59 AM | 257 (9.4%) | 155 (4.5%) |
| 10:00 AM to 10:59 AM | 31 (1.1%) | 45 (1.3%) |
| 11:00 AM to 11:59 AM | 71 (2.6%) | 76 (2.2%) |
| 12:00 PM to 3:59 PM | 201 (7.3%) | 353 (10.2%) |
| 4:00 PM to 11:59 PM | 302 (11.0%) | 182 (5.3%) |
| Total | 2,737 (100.0%) | 3,461 (100.0%) |
Housing Occupancy in Natchitoches
Occupancy by Ownership in Natchitoches
Of the total 5,998 dwellings in Natchitoches, owner-occupied units account for 2,564 (42.7%), while renter-occupied units make up 3,434 (57.3%).
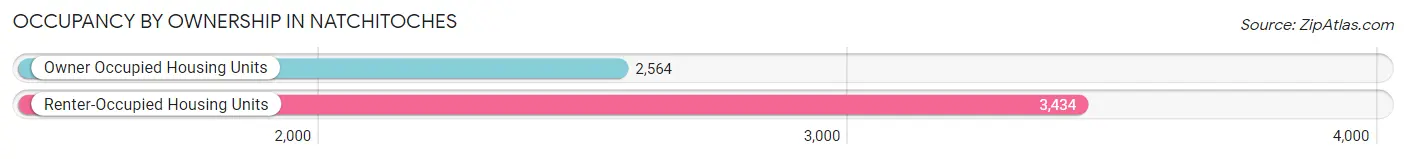
| Occupancy | # Housing Units | % Housing Units |
| Owner Occupied Housing Units | 2,564 | 42.7% |
| Renter-Occupied Housing Units | 3,434 | 57.3% |
| Total Occupied Housing Units | 5,998 | 100.0% |
Occupancy by Household Size in Natchitoches
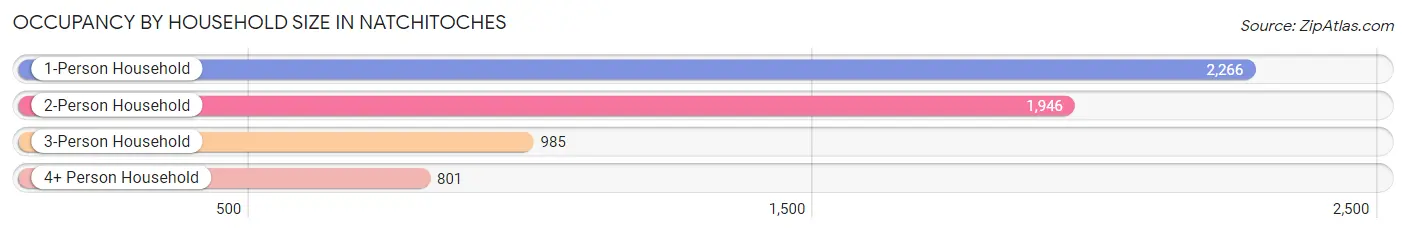
| Household Size | # Housing Units | % Housing Units |
| 1-Person Household | 2,266 | 37.8% |
| 2-Person Household | 1,946 | 32.4% |
| 3-Person Household | 985 | 16.4% |
| 4+ Person Household | 801 | 13.4% |
| Total Housing Units | 5,998 | 100.0% |
Occupancy by Ownership by Household Size in Natchitoches
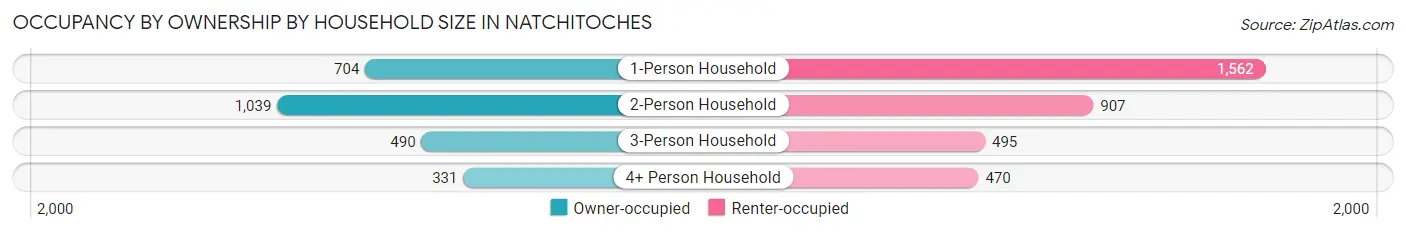
| Household Size | Owner-occupied | Renter-occupied |
| 1-Person Household | 704 (31.1%) | 1,562 (68.9%) |
| 2-Person Household | 1,039 (53.4%) | 907 (46.6%) |
| 3-Person Household | 490 (49.7%) | 495 (50.2%) |
| 4+ Person Household | 331 (41.3%) | 470 (58.7%) |
| Total Housing Units | 2,564 (42.7%) | 3,434 (57.3%) |
Occupancy by Educational Attainment in Natchitoches
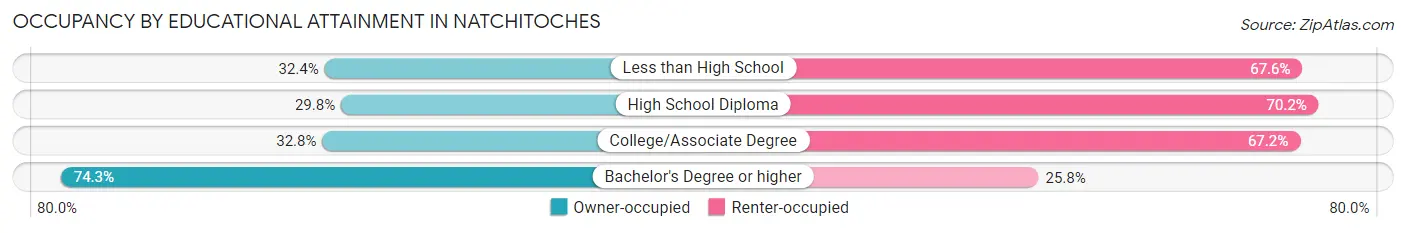
| Household Size | Owner-occupied | Renter-occupied |
| Less than High School | 178 (32.4%) | 371 (67.6%) |
| High School Diploma | 626 (29.8%) | 1,473 (70.2%) |
| College/Associate Degree | 575 (32.8%) | 1,179 (67.2%) |
| Bachelor's Degree or higher | 1,185 (74.3%) | 411 (25.8%) |
Occupancy by Age of Householder in Natchitoches
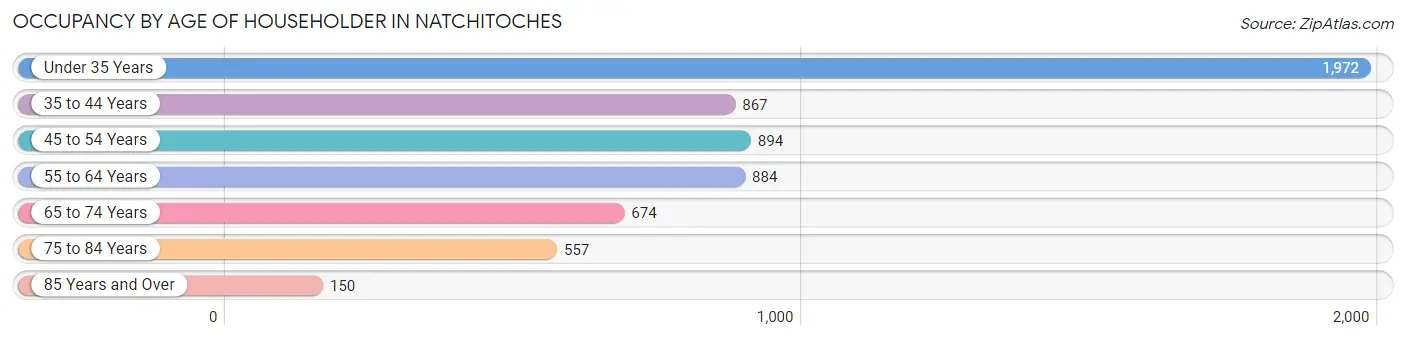
| Age Bracket | # Households | % Households |
| Under 35 Years | 1,972 | 32.9% |
| 35 to 44 Years | 867 | 14.4% |
| 45 to 54 Years | 894 | 14.9% |
| 55 to 64 Years | 884 | 14.7% |
| 65 to 74 Years | 674 | 11.2% |
| 75 to 84 Years | 557 | 9.3% |
| 85 Years and Over | 150 | 2.5% |
| Total | 5,998 | 100.0% |
Housing Finances in Natchitoches
Median Income by Occupancy in Natchitoches
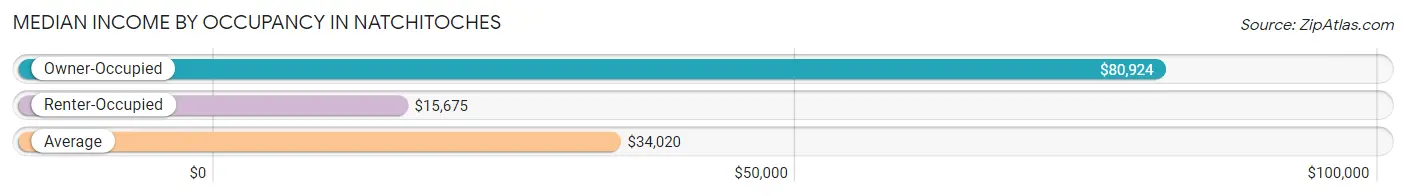
| Occupancy Type | # Households | Median Income |
| Owner-Occupied | 2,564 (42.7%) | $80,924 |
| Renter-Occupied | 3,434 (57.3%) | $15,675 |
| Average | 5,998 (100.0%) | $34,020 |
Occupancy by Householder Income Bracket in Natchitoches
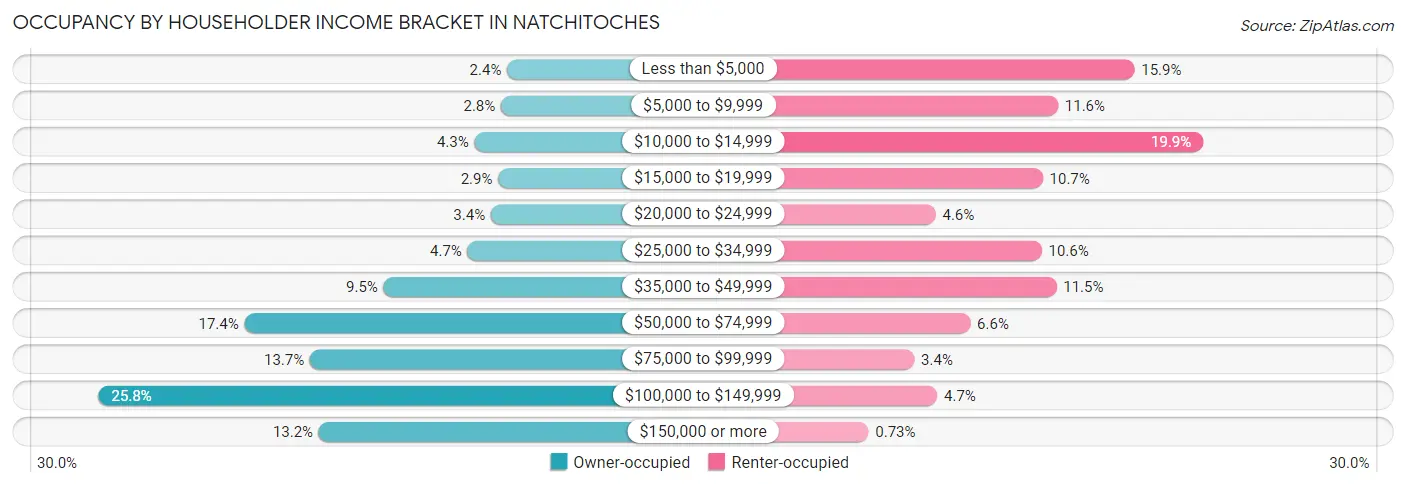
| Income Bracket | Owner-occupied | Renter-occupied |
| Less than $5,000 | 62 (2.4%) | 547 (15.9%) |
| $5,000 to $9,999 | 71 (2.8%) | 397 (11.6%) |
| $10,000 to $14,999 | 110 (4.3%) | 682 (19.9%) |
| $15,000 to $19,999 | 75 (2.9%) | 367 (10.7%) |
| $20,000 to $24,999 | 86 (3.4%) | 157 (4.6%) |
| $25,000 to $34,999 | 120 (4.7%) | 365 (10.6%) |
| $35,000 to $49,999 | 243 (9.5%) | 394 (11.5%) |
| $50,000 to $74,999 | 447 (17.4%) | 225 (6.6%) |
| $75,000 to $99,999 | 351 (13.7%) | 115 (3.4%) |
| $100,000 to $149,999 | 661 (25.8%) | 160 (4.7%) |
| $150,000 or more | 338 (13.2%) | 25 (0.7%) |
| Total | 2,564 (100.0%) | 3,434 (100.0%) |
Monthly Housing Cost Tiers in Natchitoches
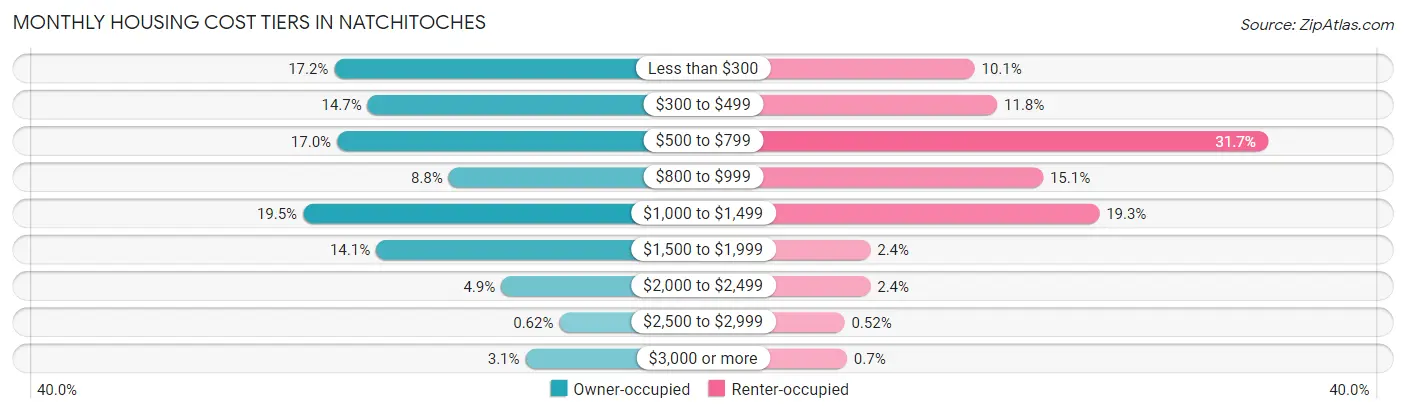
| Monthly Cost | Owner-occupied | Renter-occupied |
| Less than $300 | 441 (17.2%) | 347 (10.1%) |
| $300 to $499 | 378 (14.7%) | 404 (11.8%) |
| $500 to $799 | 436 (17.0%) | 1,088 (31.7%) |
| $800 to $999 | 225 (8.8%) | 520 (15.1%) |
| $1,000 to $1,499 | 500 (19.5%) | 662 (19.3%) |
| $1,500 to $1,999 | 362 (14.1%) | 83 (2.4%) |
| $2,000 to $2,499 | 126 (4.9%) | 83 (2.4%) |
| $2,500 to $2,999 | 16 (0.6%) | 18 (0.5%) |
| $3,000 or more | 80 (3.1%) | 24 (0.7%) |
| Total | 2,564 (100.0%) | 3,434 (100.0%) |
Physical Housing Characteristics in Natchitoches
Housing Structures in Natchitoches
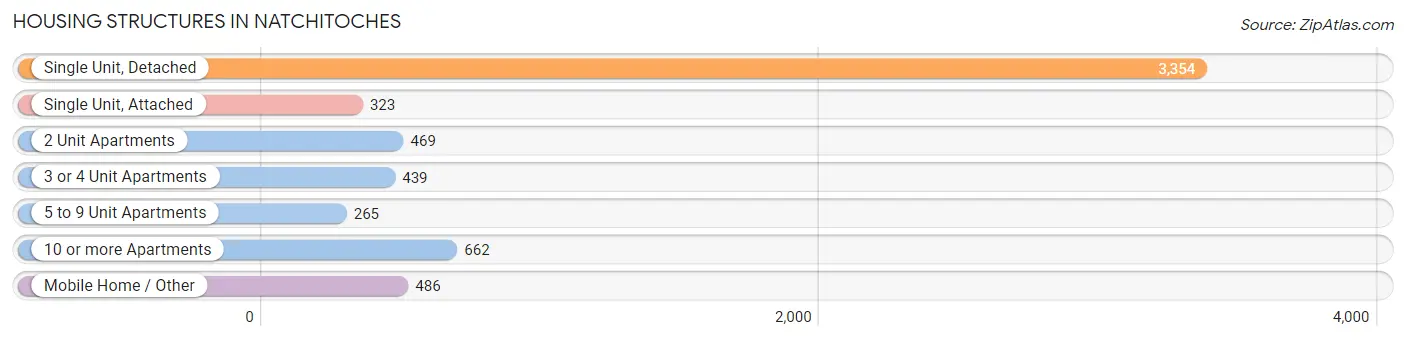
| Structure Type | # Housing Units | % Housing Units |
| Single Unit, Detached | 3,354 | 55.9% |
| Single Unit, Attached | 323 | 5.4% |
| 2 Unit Apartments | 469 | 7.8% |
| 3 or 4 Unit Apartments | 439 | 7.3% |
| 5 to 9 Unit Apartments | 265 | 4.4% |
| 10 or more Apartments | 662 | 11.0% |
| Mobile Home / Other | 486 | 8.1% |
| Total | 5,998 | 100.0% |
Housing Structures by Occupancy in Natchitoches
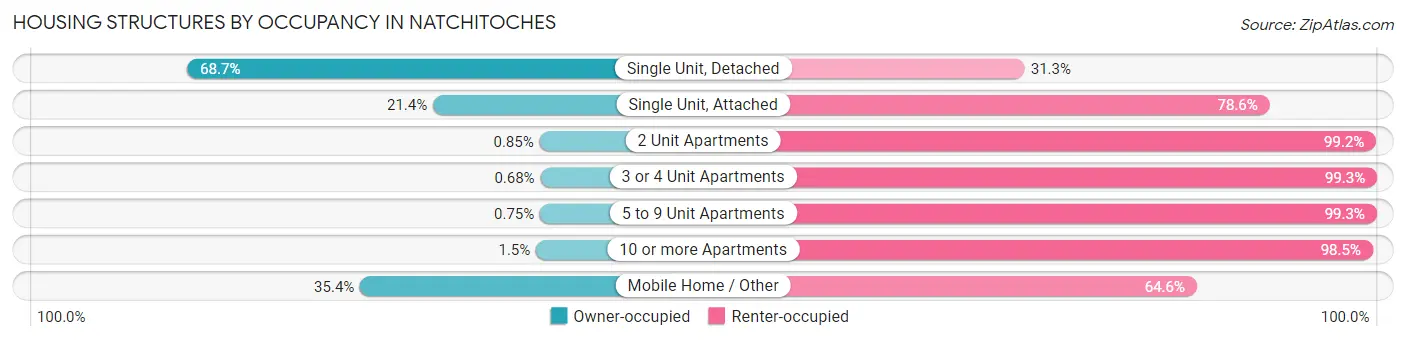
| Structure Type | Owner-occupied | Renter-occupied |
| Single Unit, Detached | 2,304 (68.7%) | 1,050 (31.3%) |
| Single Unit, Attached | 69 (21.4%) | 254 (78.6%) |
| 2 Unit Apartments | 4 (0.9%) | 465 (99.2%) |
| 3 or 4 Unit Apartments | 3 (0.7%) | 436 (99.3%) |
| 5 to 9 Unit Apartments | 2 (0.7%) | 263 (99.3%) |
| 10 or more Apartments | 10 (1.5%) | 652 (98.5%) |
| Mobile Home / Other | 172 (35.4%) | 314 (64.6%) |
| Total | 2,564 (42.7%) | 3,434 (57.3%) |
Housing Structures by Number of Rooms in Natchitoches
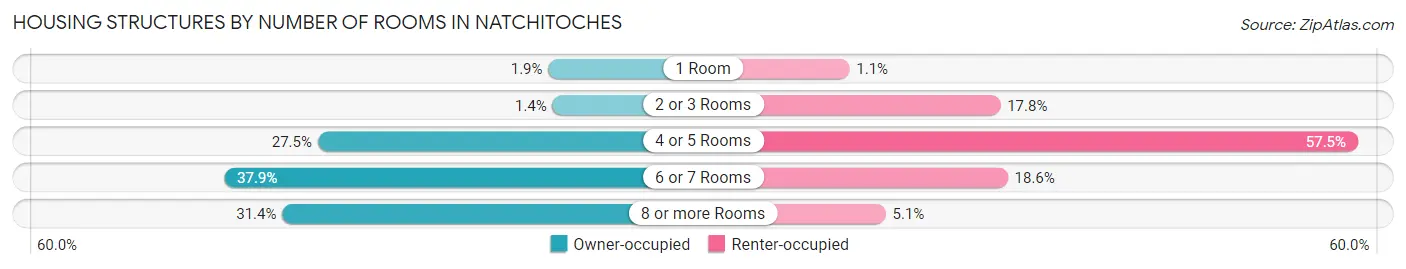
| Number of Rooms | Owner-occupied | Renter-occupied |
| 1 Room | 48 (1.9%) | 36 (1.1%) |
| 2 or 3 Rooms | 36 (1.4%) | 611 (17.8%) |
| 4 or 5 Rooms | 704 (27.5%) | 1,974 (57.5%) |
| 6 or 7 Rooms | 971 (37.9%) | 639 (18.6%) |
| 8 or more Rooms | 805 (31.4%) | 174 (5.1%) |
| Total | 2,564 (100.0%) | 3,434 (100.0%) |
Housing Structure by Heating Type in Natchitoches
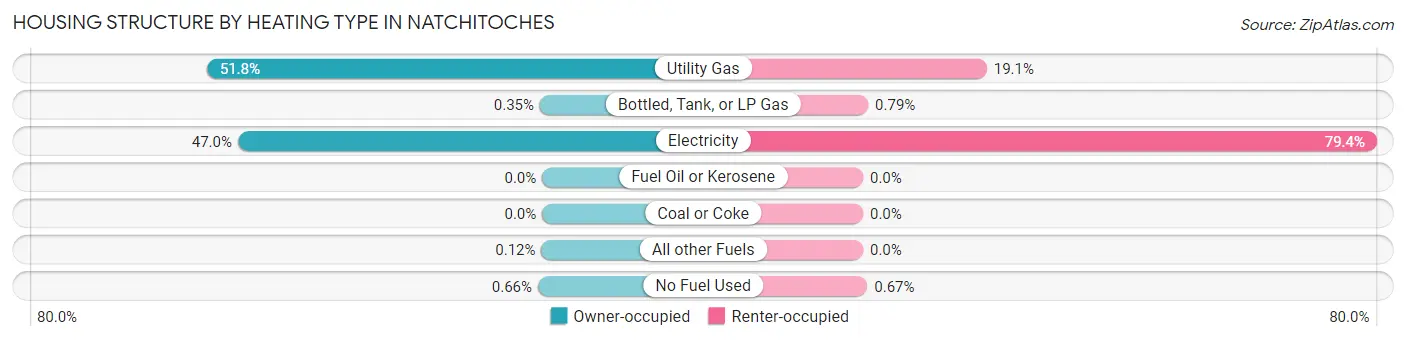
| Heating Type | Owner-occupied | Renter-occupied |
| Utility Gas | 1,329 (51.8%) | 657 (19.1%) |
| Bottled, Tank, or LP Gas | 9 (0.4%) | 27 (0.8%) |
| Electricity | 1,206 (47.0%) | 2,727 (79.4%) |
| Fuel Oil or Kerosene | 0 (0.0%) | 0 (0.0%) |
| Coal or Coke | 0 (0.0%) | 0 (0.0%) |
| All other Fuels | 3 (0.1%) | 0 (0.0%) |
| No Fuel Used | 17 (0.7%) | 23 (0.7%) |
| Total | 2,564 (100.0%) | 3,434 (100.0%) |
Household Vehicle Usage in Natchitoches
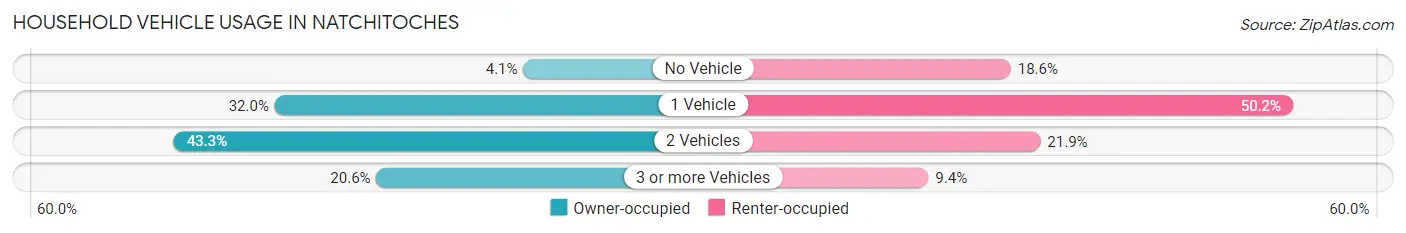
| Vehicles per Household | Owner-occupied | Renter-occupied |
| No Vehicle | 106 (4.1%) | 638 (18.6%) |
| 1 Vehicle | 820 (32.0%) | 1,723 (50.2%) |
| 2 Vehicles | 1,110 (43.3%) | 752 (21.9%) |
| 3 or more Vehicles | 528 (20.6%) | 321 (9.3%) |
| Total | 2,564 (100.0%) | 3,434 (100.0%) |
Real Estate & Mortgages in Natchitoches
Real Estate and Mortgage Overview in Natchitoches
| Characteristic | Without Mortgage | With Mortgage |
| Housing Units | 1,170 | 1,394 |
| Median Property Value | $148,100 | $195,200 |
| Median Household Income | $51,832 | $229 |
| Monthly Housing Costs | $391 | $80 |
| Real Estate Taxes | $417 | $167 |
Property Value by Mortgage Status in Natchitoches
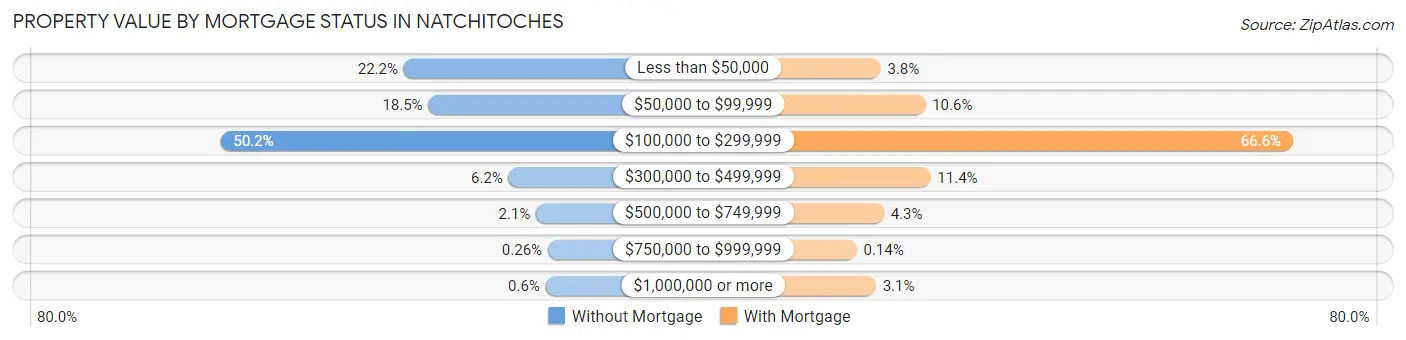
| Property Value | Without Mortgage | With Mortgage |
| Less than $50,000 | 260 (22.2%) | 53 (3.8%) |
| $50,000 to $99,999 | 216 (18.5%) | 148 (10.6%) |
| $100,000 to $299,999 | 587 (50.2%) | 929 (66.6%) |
| $300,000 to $499,999 | 73 (6.2%) | 159 (11.4%) |
| $500,000 to $749,999 | 24 (2.1%) | 60 (4.3%) |
| $750,000 to $999,999 | 3 (0.3%) | 2 (0.1%) |
| $1,000,000 or more | 7 (0.6%) | 43 (3.1%) |
| Total | 1,170 (100.0%) | 1,394 (100.0%) |
Household Income by Mortgage Status in Natchitoches
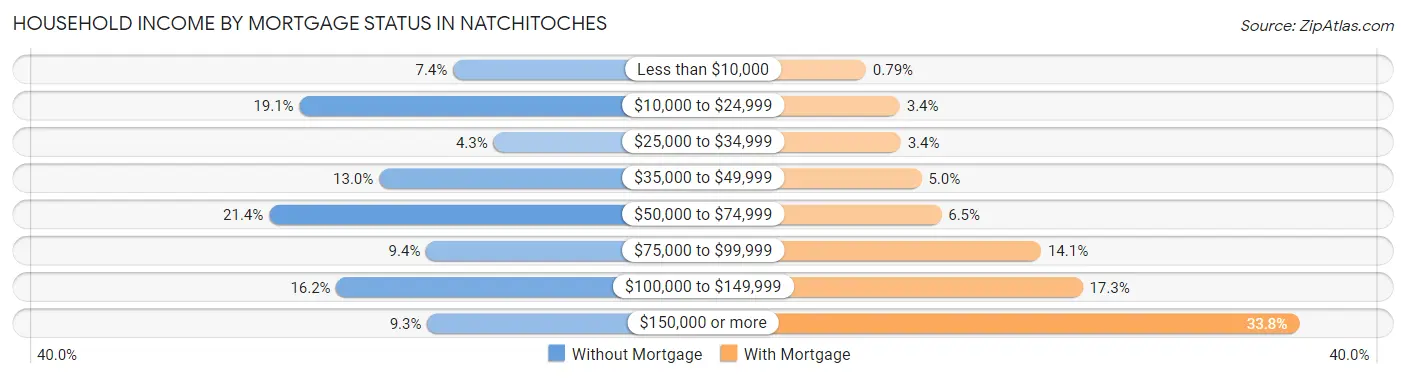
| Household Income | Without Mortgage | With Mortgage |
| Less than $10,000 | 86 (7.3%) | 11 (0.8%) |
| $10,000 to $24,999 | 223 (19.1%) | 47 (3.4%) |
| $25,000 to $34,999 | 50 (4.3%) | 48 (3.4%) |
| $35,000 to $49,999 | 152 (13.0%) | 70 (5.0%) |
| $50,000 to $74,999 | 250 (21.4%) | 91 (6.5%) |
| $75,000 to $99,999 | 110 (9.4%) | 197 (14.1%) |
| $100,000 to $149,999 | 190 (16.2%) | 241 (17.3%) |
| $150,000 or more | 109 (9.3%) | 471 (33.8%) |
| Total | 1,170 (100.0%) | 1,394 (100.0%) |
Property Value to Household Income Ratio in Natchitoches
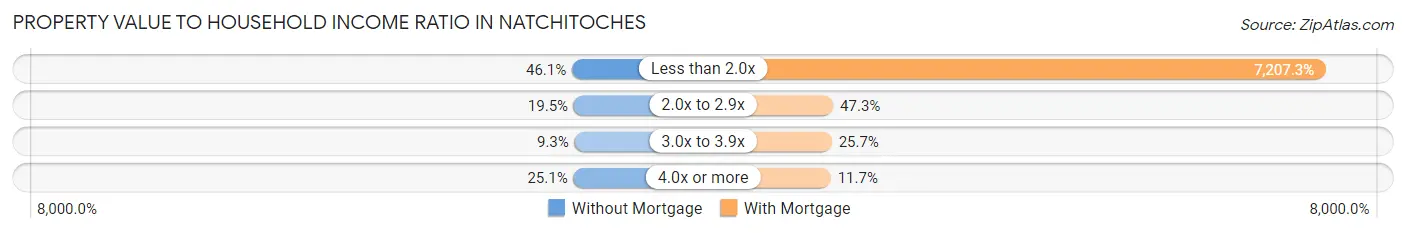
| Value-to-Income Ratio | Without Mortgage | With Mortgage |
| Less than 2.0x | 539 (46.1%) | 100,469 (7,207.3%) |
| 2.0x to 2.9x | 228 (19.5%) | 659 (47.3%) |
| 3.0x to 3.9x | 109 (9.3%) | 358 (25.7%) |
| 4.0x or more | 294 (25.1%) | 163 (11.7%) |
| Total | 1,170 (100.0%) | 1,394 (100.0%) |
Real Estate Taxes by Mortgage Status in Natchitoches
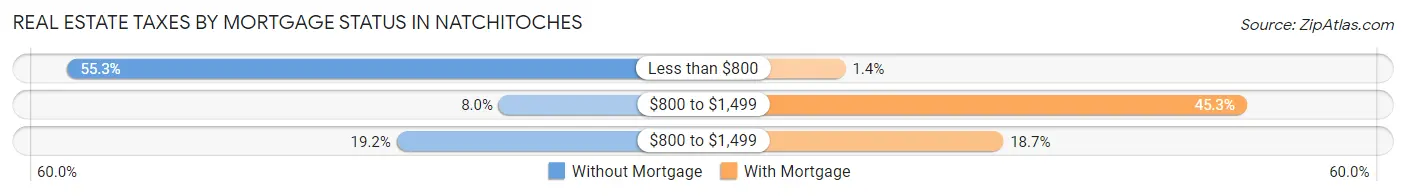
| Property Taxes | Without Mortgage | With Mortgage |
| Less than $800 | 647 (55.3%) | 19 (1.4%) |
| $800 to $1,499 | 94 (8.0%) | 632 (45.3%) |
| $800 to $1,499 | 225 (19.2%) | 260 (18.6%) |
| Total | 1,170 (100.0%) | 1,394 (100.0%) |
Health & Disability in Natchitoches
Health Insurance Coverage by Age in Natchitoches
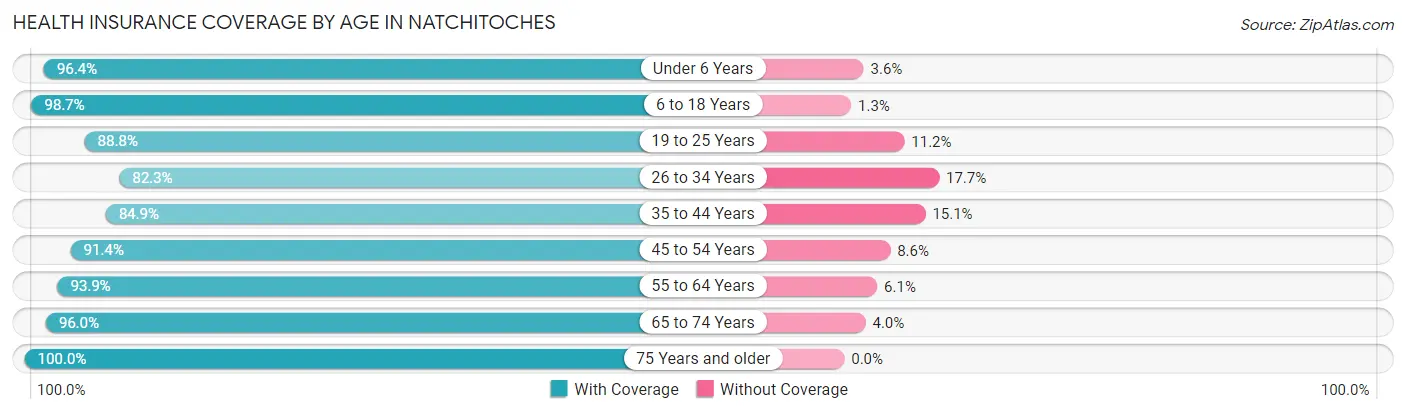
| Age Bracket | With Coverage | Without Coverage |
| Under 6 Years | 1,204 (96.4%) | 45 (3.6%) |
| 6 to 18 Years | 3,333 (98.7%) | 43 (1.3%) |
| 19 to 25 Years | 3,703 (88.8%) | 467 (11.2%) |
| 26 to 34 Years | 1,607 (82.3%) | 345 (17.7%) |
| 35 to 44 Years | 1,318 (84.9%) | 235 (15.1%) |
| 45 to 54 Years | 1,238 (91.4%) | 116 (8.6%) |
| 55 to 64 Years | 1,316 (93.9%) | 86 (6.1%) |
| 65 to 74 Years | 1,090 (96.0%) | 45 (4.0%) |
| 75 Years and older | 962 (100.0%) | 0 (0.0%) |
| Total | 15,771 (91.9%) | 1,382 (8.1%) |
Health Insurance Coverage by Citizenship Status in Natchitoches
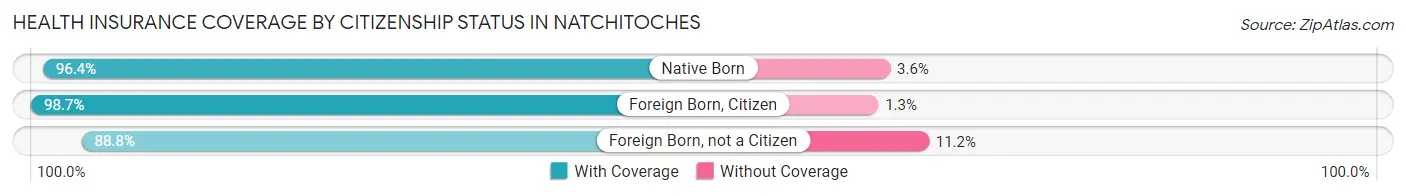
| Citizenship Status | With Coverage | Without Coverage |
| Native Born | 1,204 (96.4%) | 45 (3.6%) |
| Foreign Born, Citizen | 3,333 (98.7%) | 43 (1.3%) |
| Foreign Born, not a Citizen | 3,703 (88.8%) | 467 (11.2%) |
Health Insurance Coverage by Household Income in Natchitoches
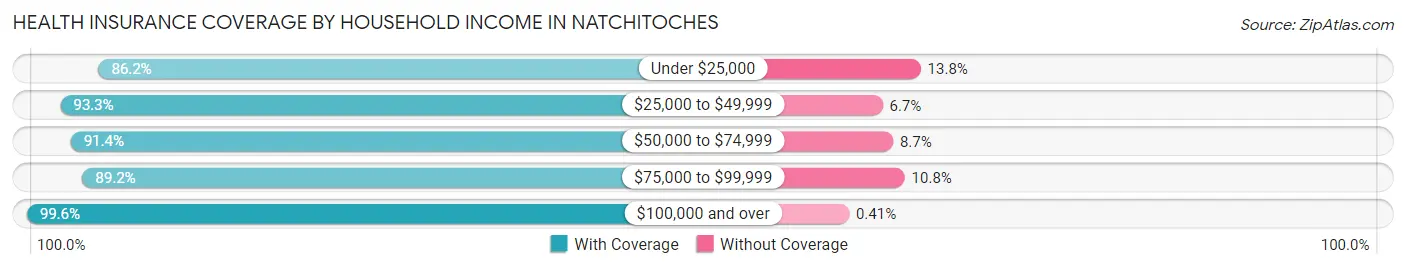
| Household Income | With Coverage | Without Coverage |
| Under $25,000 | 4,509 (86.2%) | 724 (13.8%) |
| $25,000 to $49,999 | 3,009 (93.3%) | 216 (6.7%) |
| $50,000 to $74,999 | 1,900 (91.3%) | 180 (8.6%) |
| $75,000 to $99,999 | 1,497 (89.2%) | 182 (10.8%) |
| $100,000 and over | 3,679 (99.6%) | 15 (0.4%) |
Public vs Private Health Insurance Coverage by Age in Natchitoches
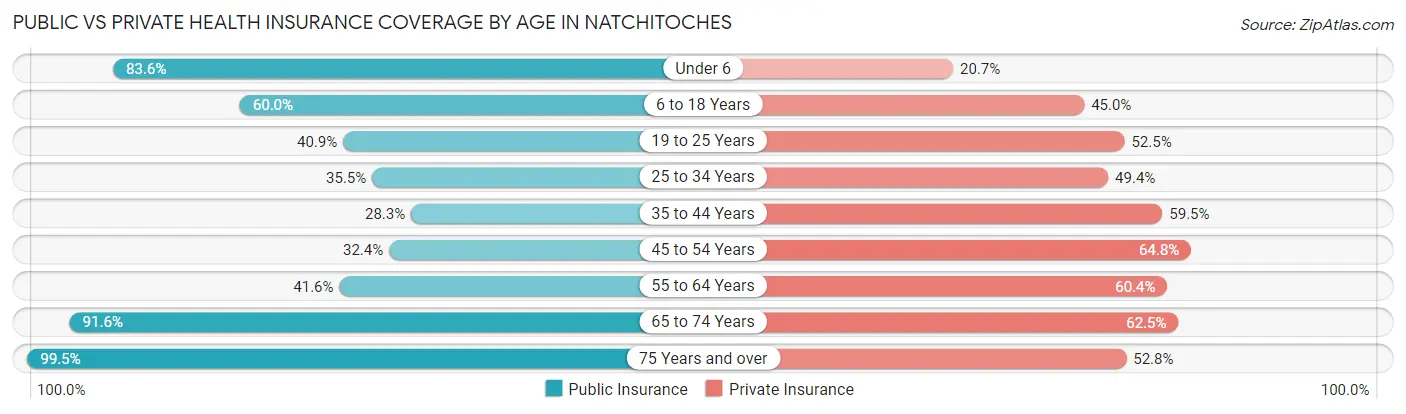
| Age Bracket | Public Insurance | Private Insurance |
| Under 6 | 1,044 (83.6%) | 258 (20.7%) |
| 6 to 18 Years | 2,027 (60.0%) | 1,519 (45.0%) |
| 19 to 25 Years | 1,705 (40.9%) | 2,188 (52.5%) |
| 25 to 34 Years | 693 (35.5%) | 965 (49.4%) |
| 35 to 44 Years | 439 (28.3%) | 924 (59.5%) |
| 45 to 54 Years | 438 (32.4%) | 878 (64.8%) |
| 55 to 64 Years | 583 (41.6%) | 847 (60.4%) |
| 65 to 74 Years | 1,040 (91.6%) | 709 (62.5%) |
| 75 Years and over | 957 (99.5%) | 508 (52.8%) |
| Total | 8,926 (52.0%) | 8,796 (51.3%) |
Disability Status by Sex by Age in Natchitoches
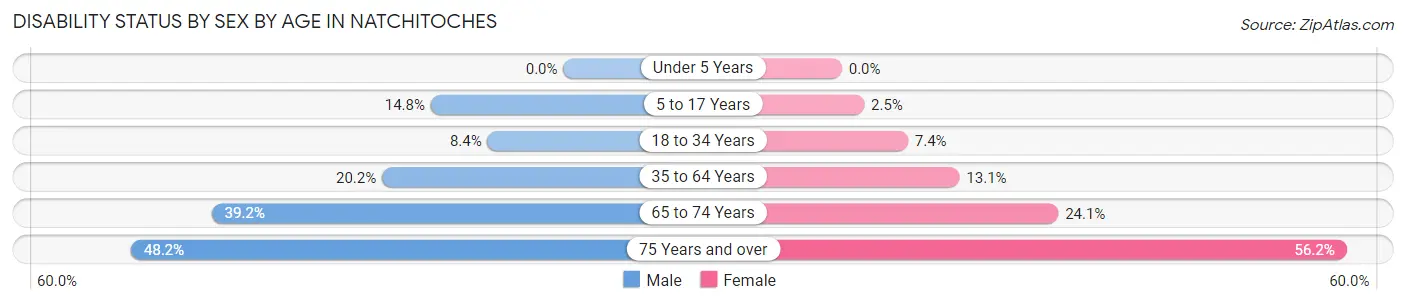
| Age Bracket | Male | Female |
| Under 5 Years | 0 (0.0%) | 0 (0.0%) |
| 5 to 17 Years | 206 (14.8%) | 34 (2.5%) |
| 18 to 34 Years | 261 (8.4%) | 275 (7.4%) |
| 35 to 64 Years | 386 (20.2%) | 314 (13.1%) |
| 65 to 74 Years | 152 (39.2%) | 180 (24.1%) |
| 75 Years and over | 196 (48.2%) | 312 (56.2%) |
Disability Class by Sex by Age in Natchitoches
Disability Class: Hearing Difficulty
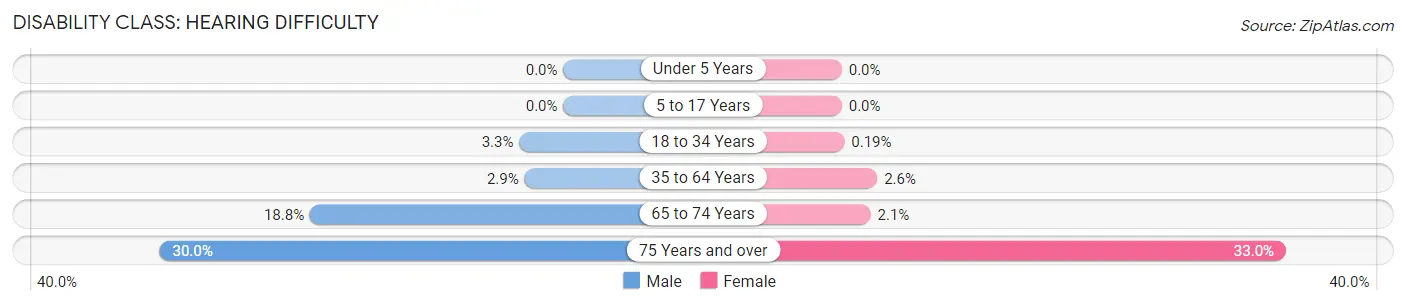
| Age Bracket | Male | Female |
| Under 5 Years | 0 (0.0%) | 0 (0.0%) |
| 5 to 17 Years | 0 (0.0%) | 0 (0.0%) |
| 18 to 34 Years | 101 (3.3%) | 7 (0.2%) |
| 35 to 64 Years | 55 (2.9%) | 63 (2.6%) |
| 65 to 74 Years | 73 (18.8%) | 16 (2.1%) |
| 75 Years and over | 122 (30.0%) | 183 (33.0%) |
Disability Class: Vision Difficulty
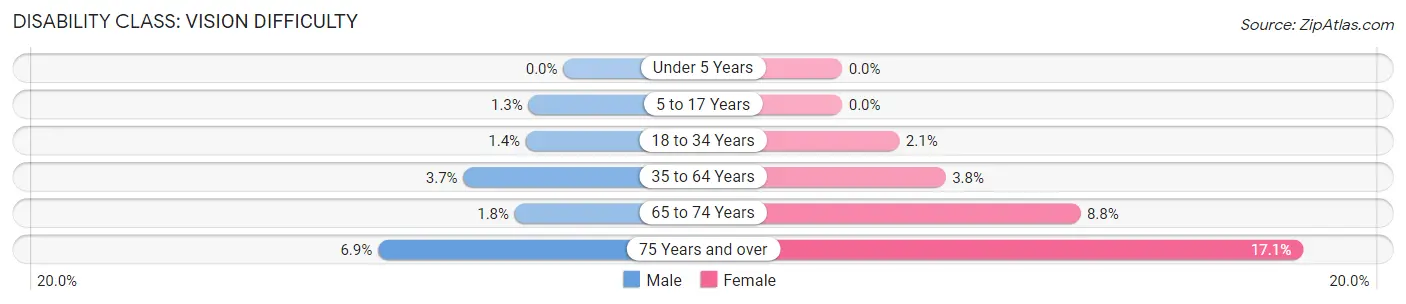
| Age Bracket | Male | Female |
| Under 5 Years | 0 (0.0%) | 0 (0.0%) |
| 5 to 17 Years | 18 (1.3%) | 0 (0.0%) |
| 18 to 34 Years | 43 (1.4%) | 79 (2.1%) |
| 35 to 64 Years | 71 (3.7%) | 92 (3.8%) |
| 65 to 74 Years | 7 (1.8%) | 66 (8.8%) |
| 75 Years and over | 28 (6.9%) | 95 (17.1%) |
Disability Class: Cognitive Difficulty
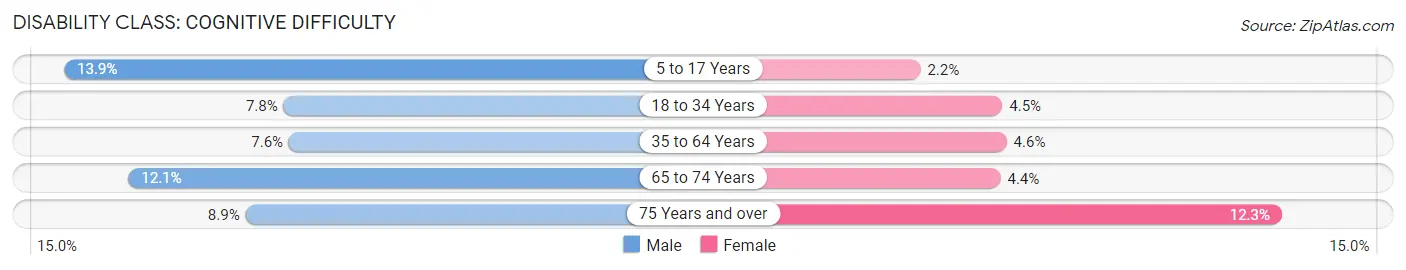
| Age Bracket | Male | Female |
| 5 to 17 Years | 194 (13.9%) | 30 (2.2%) |
| 18 to 34 Years | 241 (7.8%) | 167 (4.5%) |
| 35 to 64 Years | 146 (7.6%) | 110 (4.6%) |
| 65 to 74 Years | 47 (12.1%) | 33 (4.4%) |
| 75 Years and over | 36 (8.8%) | 68 (12.2%) |
Disability Class: Ambulatory Difficulty
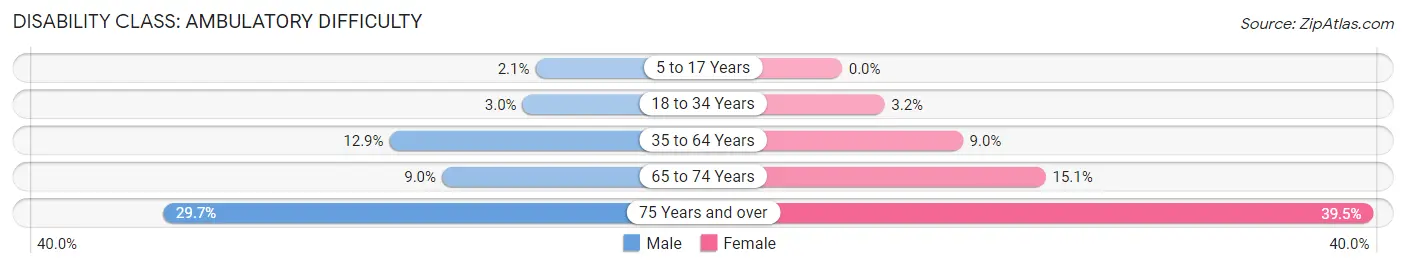
| Age Bracket | Male | Female |
| 5 to 17 Years | 29 (2.1%) | 0 (0.0%) |
| 18 to 34 Years | 94 (3.0%) | 118 (3.2%) |
| 35 to 64 Years | 247 (12.9%) | 215 (9.0%) |
| 65 to 74 Years | 35 (9.0%) | 113 (15.1%) |
| 75 Years and over | 121 (29.7%) | 219 (39.5%) |
Disability Class: Self-Care Difficulty
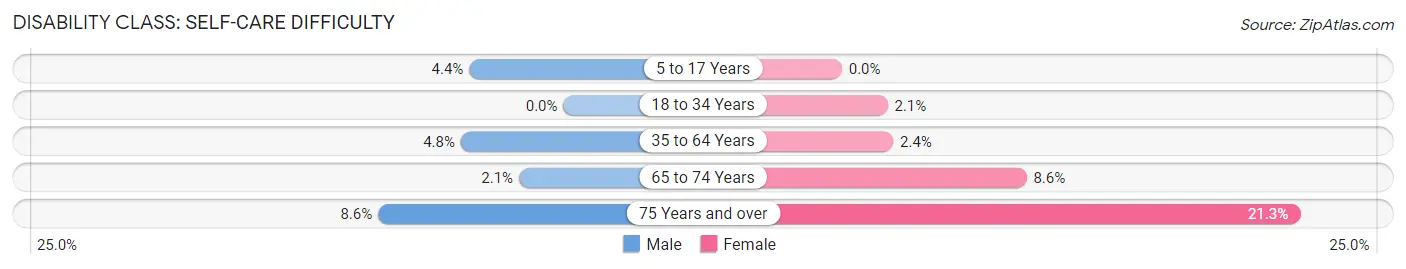
| Age Bracket | Male | Female |
| 5 to 17 Years | 61 (4.4%) | 0 (0.0%) |
| 18 to 34 Years | 0 (0.0%) | 79 (2.1%) |
| 35 to 64 Years | 91 (4.8%) | 57 (2.4%) |
| 65 to 74 Years | 8 (2.1%) | 64 (8.6%) |
| 75 Years and over | 35 (8.6%) | 118 (21.3%) |
Technology Access in Natchitoches
Computing Device Access in Natchitoches
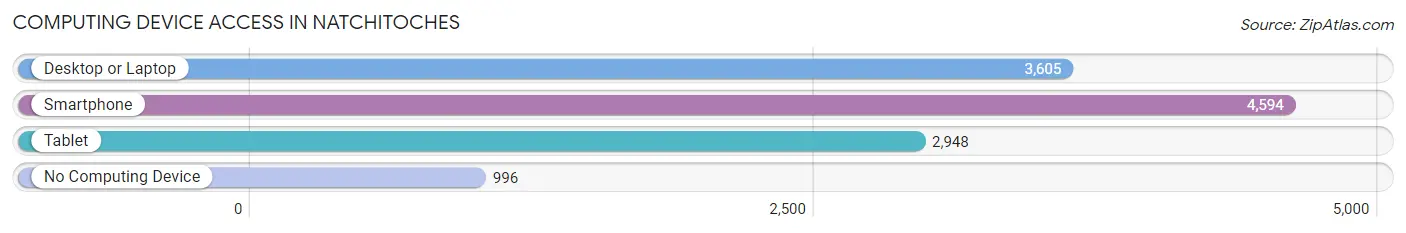
| Device Type | # Households | % Households |
| Desktop or Laptop | 3,605 | 60.1% |
| Smartphone | 4,594 | 76.6% |
| Tablet | 2,948 | 49.1% |
| No Computing Device | 996 | 16.6% |
| Total | 5,998 | 100.0% |
Internet Access in Natchitoches
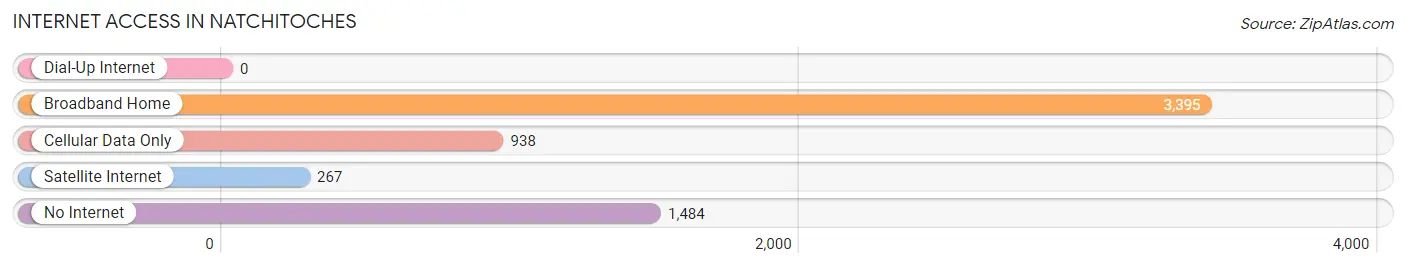
| Internet Type | # Households | % Households |
| Dial-Up Internet | 0 | 0.0% |
| Broadband Home | 3,395 | 56.6% |
| Cellular Data Only | 938 | 15.6% |
| Satellite Internet | 267 | 4.4% |
| No Internet | 1,484 | 24.7% |
| Total | 5,998 | 100.0% |
Natchitoches Summary
Natchitoches, Louisiana is a small city located in the northwestern corner of the state. It is the oldest permanent settlement in the Louisiana Purchase, having been founded in 1714 by French explorer Louis Juchereau de St. Denis. The city is situated on the banks of the Red River and is the parish seat of Natchitoches Parish. It is known for its historic downtown area, which is listed on the National Register of Historic Places, and for its annual Natchitoches Christmas Festival, which is the oldest and largest holiday celebration in the state.
History
Natchitoches was founded in 1714 by French explorer Louis Juchereau de St. Denis. He was sent by the French government to explore the area and establish a trading post. The city was named after the Natchitoches Native American tribe, who had inhabited the area for centuries. The city quickly grew and became an important trading post for the French and Spanish. It was also a major stop on the El Camino Real, a trade route that connected Mexico to the United States.
In 1763, the city was ceded to Spain, and in 1800, it was ceded back to France. In 1803, the city was sold to the United States as part of the Louisiana Purchase. During the Civil War, Natchitoches was the site of several battles, including the Battle of Natchitoches in 1864.
Geography
Natchitoches is located in the northwestern corner of Louisiana, on the banks of the Red River. It is situated in the Natchitoches Parish, which is bordered by the Sabine River to the east and the Red River to the west. The city is located about 90 miles east of Shreveport and about 150 miles northwest of New Orleans.
The city has a total area of 8.3 square miles, of which 8.2 square miles is land and 0.1 square miles is water. The terrain is mostly flat, with some rolling hills in the northern part of the city. The climate is humid subtropical, with hot, humid summers and mild winters.
Economy
Natchitoches’ economy is largely based on tourism, manufacturing, and agriculture. The city is home to several manufacturing companies, including a paper mill, a steel mill, and a furniture factory. Agriculture is also an important part of the local economy, with cotton, soybeans, and corn being the main crops.
The city is also a popular tourist destination, with its historic downtown area, the Natchitoches National Historic Landmark District, and the annual Natchitoches Christmas Festival. The festival is the oldest and largest holiday celebration in the state, and attracts thousands of visitors each year.
Demographics
As of the 2010 census, Natchitoches had a population of 18,323. The racial makeup of the city was 68.3% White, 28.2% African American, 0.5% Native American, 0.7% Asian, 0.1% Pacific Islander, and 2.2% from other races. Hispanic or Latino of any race were 3.2% of the population.
The median household income in Natchitoches was $30,945, and the median family income was $37,945. The per capita income was $17,845. About 19.3% of the population was below the poverty line.
Natchitoches is a small city with a rich history and a vibrant economy. It is home to a diverse population and is a popular tourist destination. The city is known for its historic downtown area, its annual Christmas Festival, and its proximity to the Red River. Natchitoches is a great place to live, work, and visit.
Common Questions
What is the Total Population of Natchitoches?
Total Population of Natchitoches is 17,908.
What is the Total Male Population of Natchitoches?
Total Male Population of Natchitoches is 8,462.
What is the Total Female Population of Natchitoches?
Total Female Population of Natchitoches is 9,446.
What is the Ratio of Males per 100 Females in Natchitoches?
There are 89.58 Males per 100 Females in Natchitoches.
What is the Ratio of Females per 100 Males in Natchitoches?
There are 111.63 Females per 100 Males in Natchitoches.
What is the Median Population Age in Natchitoches?
Median Population Age in Natchitoches is 26.6 Years.
What is the Average Family Size in Natchitoches
Average Family Size in Natchitoches is 3.7 People.
What is the Average Household Size in Natchitoches
Average Household Size in Natchitoches is 2.6 People.
What is Per Capita Income in Natchitoches?
Per Capita income in Natchitoches is $21,720.
What is the Median Family Income in Natchitoches?
Median Family Income in Natchitoches is $57,639.
What is the Median Household income in Natchitoches?
Median Household Income in Natchitoches is $34,020.
What is Income or Wage Gap in Natchitoches?
Income or Wage Gap in Natchitoches is 32.4%.
Women in Natchitoches earn 67.6 cents for every dollar earned by a man.
What is Family Income Deficit in Natchitoches?
Family Income Deficit in Natchitoches is $14,672.
Families that are below poverty line in Natchitoches earn $14,672 less on average than the poverty threshold level.
What is Inequality or Gini Index in Natchitoches?
Inequality or Gini Index in Natchitoches is 0.57.
How Large is the Labor Force in Natchitoches?
There are 7,262 People in the Labor Forcein in Natchitoches.
What is the Percentage of People in the Labor Force in Natchitoches?
50.5% of People are in the Labor Force in Natchitoches.
What is the Unemployment Rate in Natchitoches?
Unemployment Rate in Natchitoches is 11.4%.