St Rose, LA
St Rose Map
St Rose Overview
7,469
TOTAL POPULATION
3,472
MALE POPULATION
3,997
FEMALE POPULATION
86.87
MALES / 100 FEMALES
115.12
FEMALES / 100 MALES
37.5
MEDIAN AGE
3.7
AVG FAMILY SIZE
2.8
AVG HOUSEHOLD SIZE
$29,595
PER CAPITA INCOME
$80,774
AVG FAMILY INCOME
$61,920
AVG HOUSEHOLD INCOME
39.4%
WAGE / INCOME GAP [ % ]
60.6¢/ $1
WAGE / INCOME GAP [ $ ]
$12,116
FAMILY INCOME DEFICIT
0.42
INEQUALITY / GINI INDEX
3,568
LABOR FORCE [ PEOPLE ]
60.8%
PERCENT IN LABOR FORCE
12.3%
UNEMPLOYMENT RATE
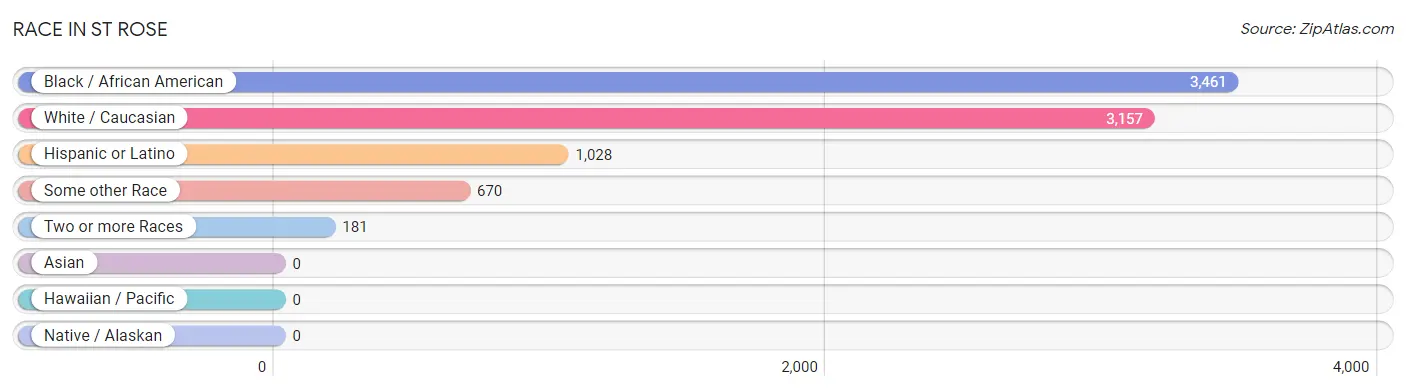
Race in St Rose
The most populous races in St Rose are Black / African American (3,461 | 46.3%), White / Caucasian (3,157 | 42.3%), and Hispanic or Latino (1,028 | 13.8%).
| Race | # Population | % Population |
| Asian | 0 | 0.0% |
| Black / African American | 3,461 | 46.3% |
| Hawaiian / Pacific | 0 | 0.0% |
| Hispanic or Latino | 1,028 | 13.8% |
| Native / Alaskan | 0 | 0.0% |
| White / Caucasian | 3,157 | 42.3% |
| Two or more Races | 181 | 2.4% |
| Some other Race | 670 | 9.0% |
| Total | 7,469 | 100.0% |
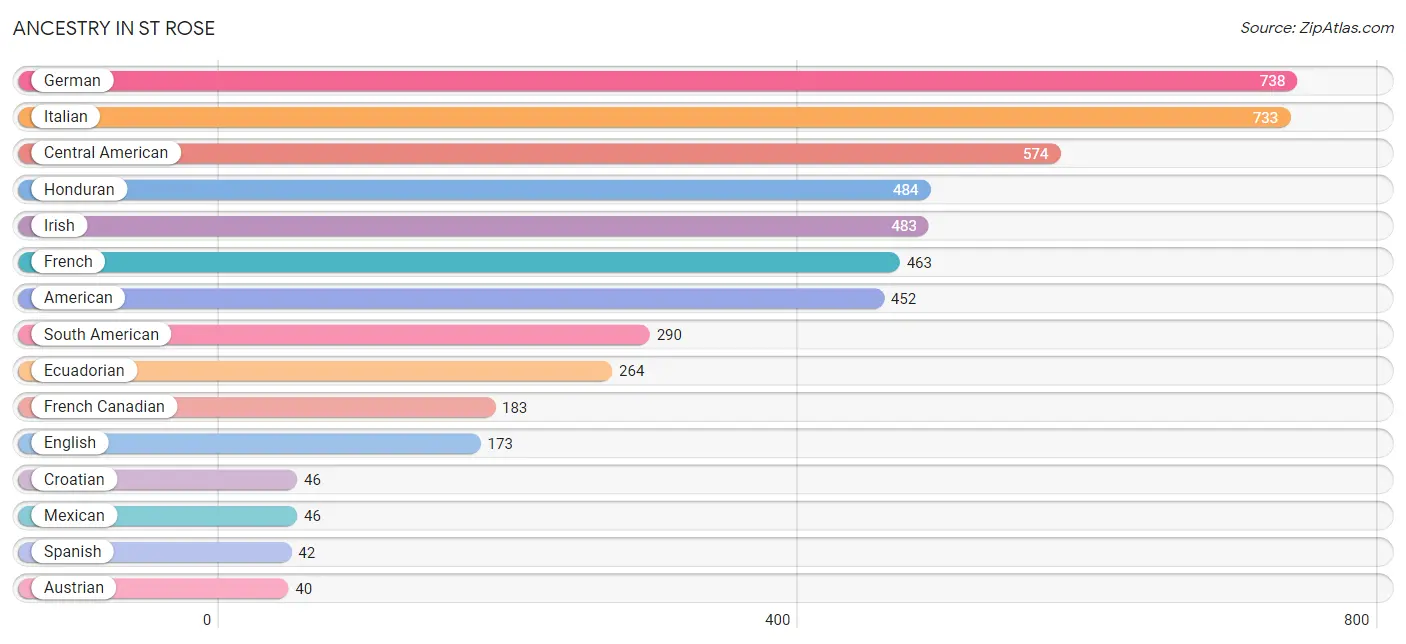
Ancestry in St Rose
The most populous ancestries reported in St Rose are German (738 | 9.9%), Italian (733 | 9.8%), Central American (574 | 7.7%), Honduran (484 | 6.5%), and Irish (483 | 6.5%), together accounting for 40.3% of all St Rose residents.
| Ancestry | # Population | % Population |
| African | 34 | 0.5% |
| American | 452 | 6.0% |
| Austrian | 40 | 0.5% |
| Cajun | 32 | 0.4% |
| Central American | 574 | 7.7% |
| Costa Rican | 25 | 0.3% |
| Croatian | 46 | 0.6% |
| Cuban | 33 | 0.4% |
| Dominican | 1 | 0.0% |
| Ecuadorian | 264 | 3.5% |
| English | 173 | 2.3% |
| French | 463 | 6.2% |
| French Canadian | 183 | 2.5% |
| German | 738 | 9.9% |
| Greek | 10 | 0.1% |
| Honduran | 484 | 6.5% |
| Irish | 483 | 6.5% |
| Italian | 733 | 9.8% |
| Korean | 26 | 0.4% |
| Mexican | 46 | 0.6% |
| Nicaraguan | 38 | 0.5% |
| Panamanian | 27 | 0.4% |
| Polish | 15 | 0.2% |
| South American | 290 | 3.9% |
| Spanish | 42 | 0.6% |
| Subsaharan African | 34 | 0.5% |
| Swedish | 24 | 0.3% |
| Venezuelan | 26 | 0.4% | View All 28 Rows |
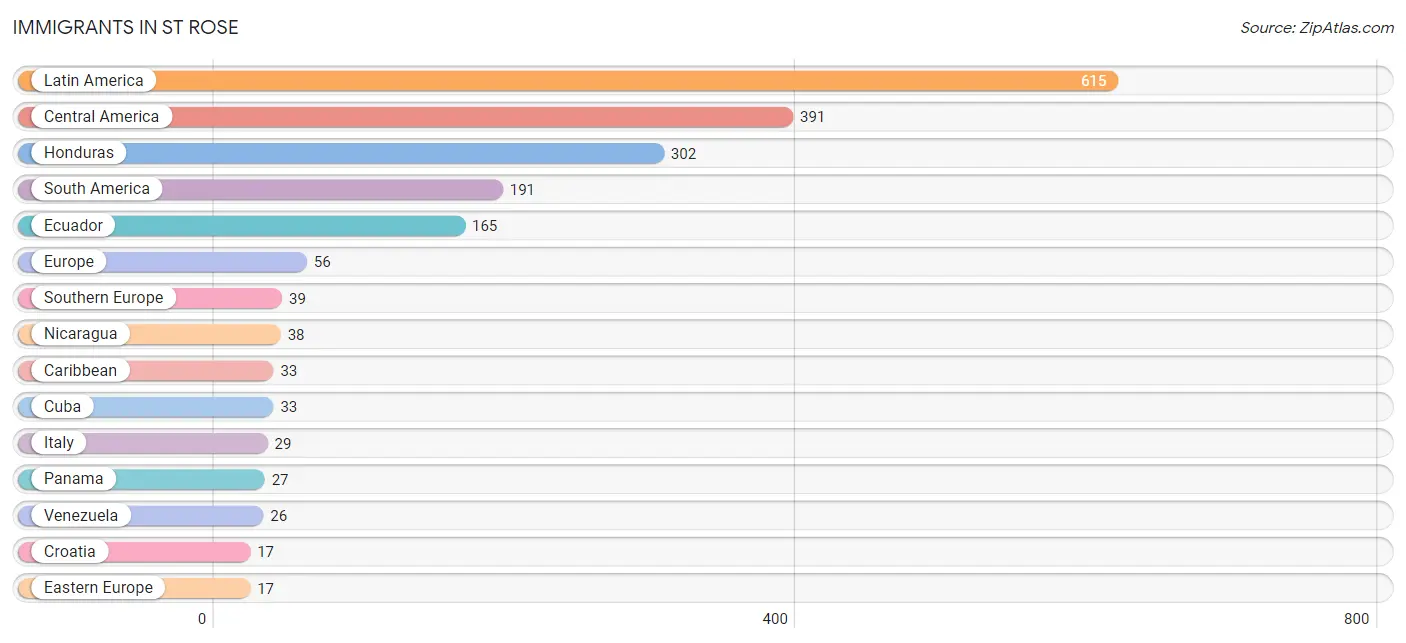
Immigrants in St Rose
The most numerous immigrant groups reported in St Rose came from Latin America (615 | 8.2%), Central America (391 | 5.2%), Honduras (302 | 4.0%), South America (191 | 2.6%), and Ecuador (165 | 2.2%), together accounting for 22.3% of all St Rose residents.
| Immigration Origin | # Population | % Population |
| Caribbean | 33 | 0.4% |
| Central America | 391 | 5.2% |
| Costa Rica | 15 | 0.2% |
| Croatia | 17 | 0.2% |
| Cuba | 33 | 0.4% |
| Eastern Europe | 17 | 0.2% |
| Ecuador | 165 | 2.2% |
| Europe | 56 | 0.7% |
| Greece | 10 | 0.1% |
| Honduras | 302 | 4.0% |
| Italy | 29 | 0.4% |
| Latin America | 615 | 8.2% |
| Mexico | 9 | 0.1% |
| Nicaragua | 38 | 0.5% |
| Panama | 27 | 0.4% |
| South America | 191 | 2.6% |
| Southern Europe | 39 | 0.5% |
| Venezuela | 26 | 0.4% | View All 18 Rows |
Sex and Age in St Rose
Sex and Age in St Rose
The most populous age groups in St Rose are 5 to 9 Years (435 | 12.5%) for men and 55 to 59 Years (380 | 9.5%) for women.
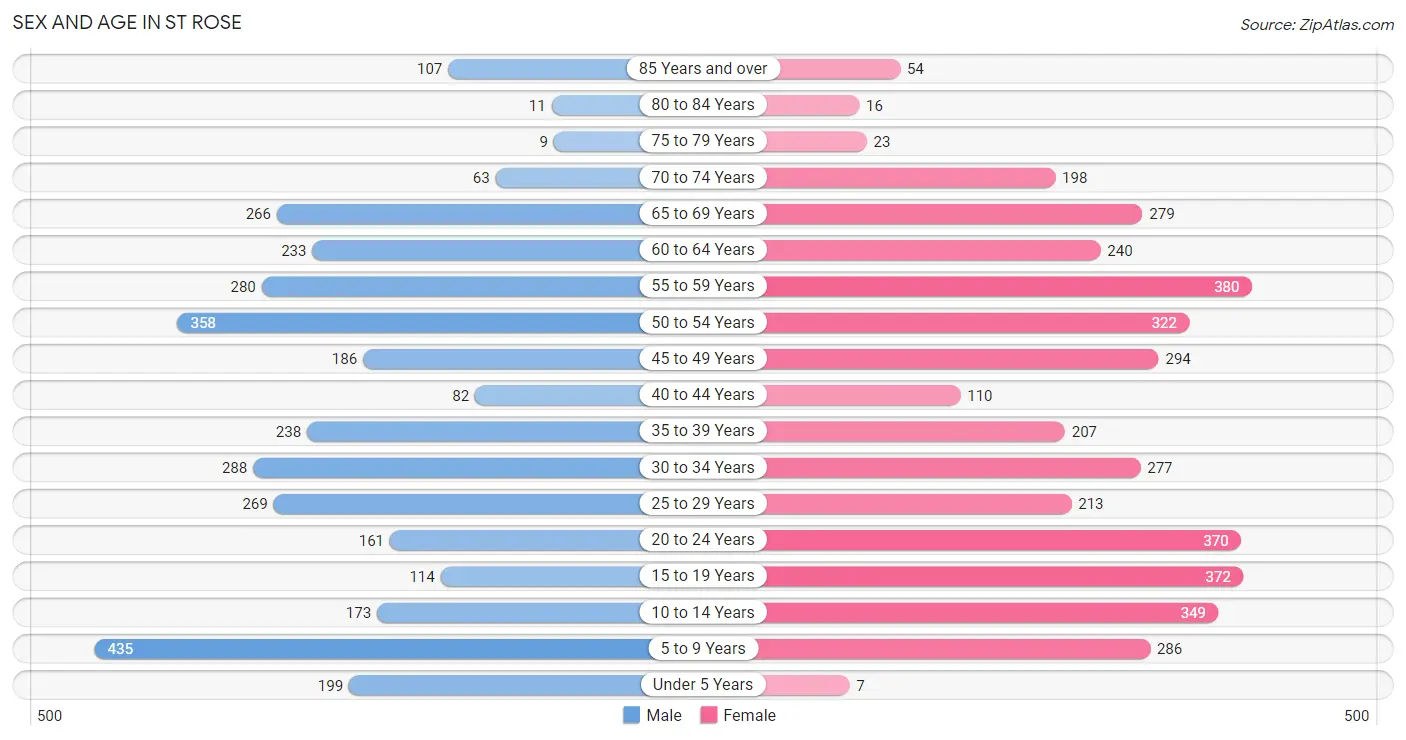
| Age Bracket | Male | Female |
| Under 5 Years | 199 (5.7%) | 7 (0.2%) |
| 5 to 9 Years | 435 (12.5%) | 286 (7.2%) |
| 10 to 14 Years | 173 (5.0%) | 349 (8.7%) |
| 15 to 19 Years | 114 (3.3%) | 372 (9.3%) |
| 20 to 24 Years | 161 (4.6%) | 370 (9.3%) |
| 25 to 29 Years | 269 (7.7%) | 213 (5.3%) |
| 30 to 34 Years | 288 (8.3%) | 277 (6.9%) |
| 35 to 39 Years | 238 (6.9%) | 207 (5.2%) |
| 40 to 44 Years | 82 (2.4%) | 110 (2.8%) |
| 45 to 49 Years | 186 (5.4%) | 294 (7.4%) |
| 50 to 54 Years | 358 (10.3%) | 322 (8.1%) |
| 55 to 59 Years | 280 (8.1%) | 380 (9.5%) |
| 60 to 64 Years | 233 (6.7%) | 240 (6.0%) |
| 65 to 69 Years | 266 (7.7%) | 279 (7.0%) |
| 70 to 74 Years | 63 (1.8%) | 198 (5.0%) |
| 75 to 79 Years | 9 (0.3%) | 23 (0.6%) |
| 80 to 84 Years | 11 (0.3%) | 16 (0.4%) |
| 85 Years and over | 107 (3.1%) | 54 (1.3%) |
| Total | 3,472 (100.0%) | 3,997 (100.0%) |
Families and Households in St Rose
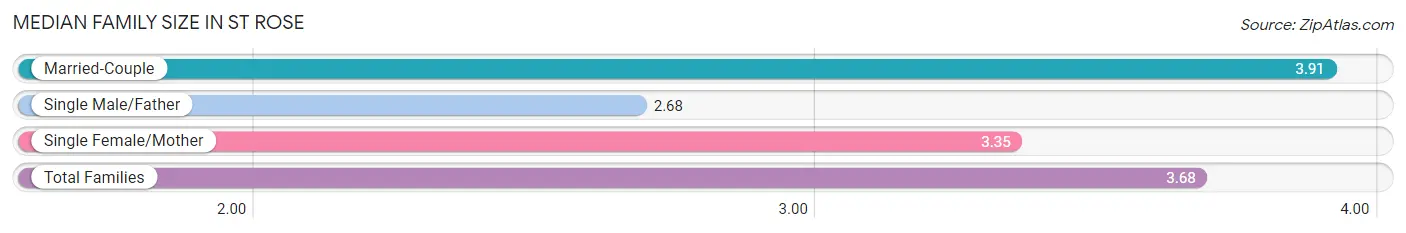
Median Family Size in St Rose
The median family size in St Rose is 3.68 persons per family, with married-couple families (1,228 | 70.6%) accounting for the largest median family size of 3.91 persons per family. On the other hand, single male/father families (165 | 9.5%) represent the smallest median family size with 2.68 persons per family.
| Family Type | # Families | Family Size |
| Married-Couple | 1,228 (70.6%) | 3.91 |
| Single Male/Father | 165 (9.5%) | 2.68 |
| Single Female/Mother | 347 (19.9%) | 3.35 |
| Total Families | 1,740 (100.0%) | 3.68 |
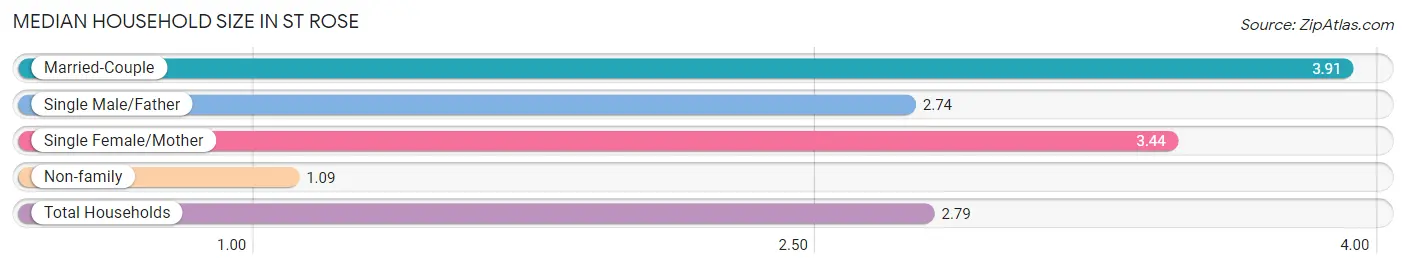
Median Household Size in St Rose
The median household size in St Rose is 2.79 persons per household, with married-couple households (1,228 | 45.9%) accounting for the largest median household size of 3.91 persons per household. non-family households (935 | 34.9%) represent the smallest median household size with 1.09 persons per household.
| Household Type | # Households | Household Size |
| Married-Couple | 1,228 (45.9%) | 3.91 |
| Single Male/Father | 165 (6.2%) | 2.74 |
| Single Female/Mother | 347 (13.0%) | 3.44 |
| Non-family | 935 (34.9%) | 1.09 |
| Total Households | 2,675 (100.0%) | 2.79 |
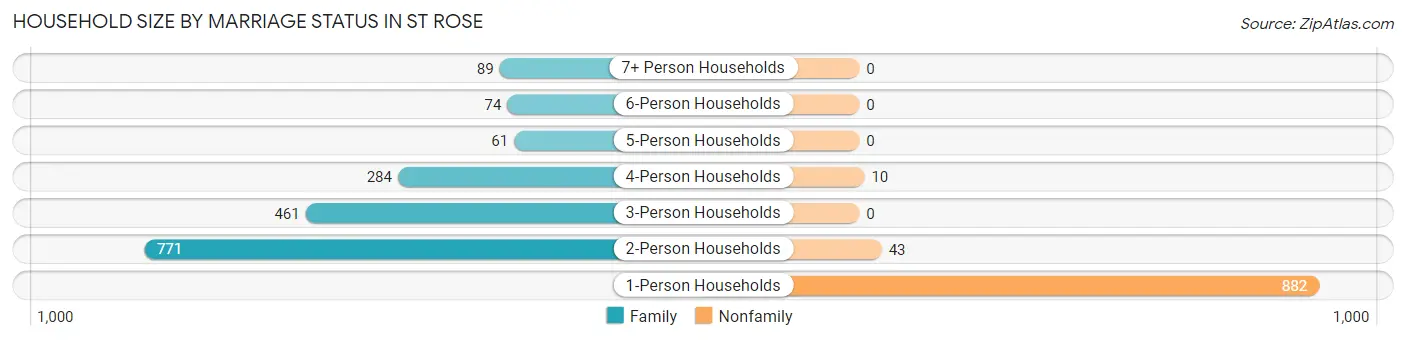
Household Size by Marriage Status in St Rose
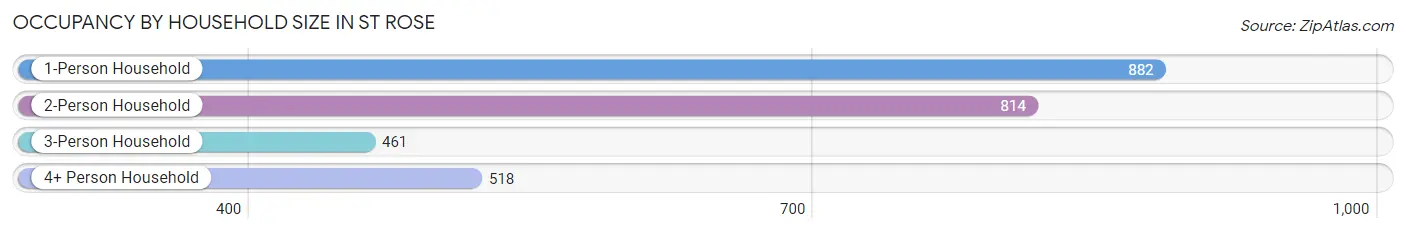
Out of a total of 2,675 households in St Rose, 1,740 (65.0%) are family households, while 935 (34.9%) are nonfamily households. The most numerous type of family households are 2-person households, comprising 771, and the most common type of nonfamily households are 1-person households, comprising 882.
| Household Size | Family Households | Nonfamily Households |
| 1-Person Households | - | 882 (33.0%) |
| 2-Person Households | 771 (28.8%) | 43 (1.6%) |
| 3-Person Households | 461 (17.2%) | 0 (0.0%) |
| 4-Person Households | 284 (10.6%) | 10 (0.4%) |
| 5-Person Households | 61 (2.3%) | 0 (0.0%) |
| 6-Person Households | 74 (2.8%) | 0 (0.0%) |
| 7+ Person Households | 89 (3.3%) | 0 (0.0%) |
| Total | 1,740 (65.0%) | 935 (34.9%) |
Female Fertility in St Rose
Fertility by Age in St Rose
| Age Bracket | Women with Births | Births / 1,000 Women |
| 15 to 19 years | 0 (0.0%) | 0.0 |
| 20 to 34 years | 0 (0.0%) | 0.0 |
| 35 to 50 years | 0 (0.0%) | 0.0 |
| Total | 0 (0.0%) | 0.0 |
Fertility by Age by Marriage Status in St Rose
| Age Bracket | Married | Unmarried |
| 15 to 19 years | 0 (0.0%) | 0 (0.0%) |
| 20 to 34 years | 0 (0.0%) | 0 (0.0%) |
| 35 to 50 years | 0 (0.0%) | 0 (0.0%) |
| Total | 0 (0.0%) | 0 (0.0%) |
Fertility by Education in St Rose
| Educational Attainment | Women with Births | Births / 1,000 Women |
| Less than High School | 0 (0.0%) | 0.0 |
| High School Diploma | 0 (0.0%) | 0.0 |
| College or Associate's Degree | 0 (0.0%) | 0.0 |
| Bachelor's Degree | 0 (0.0%) | 0.0 |
| Graduate Degree | 0 (0.0%) | 0.0 |
| Total | 0 (0.0%) | 0.0 |
Fertility by Education by Marriage Status in St Rose
| Educational Attainment | Married | Unmarried |
| Less than High School | 0 (0.0%) | 0 (0.0%) |
| High School Diploma | 0 (0.0%) | 0 (0.0%) |
| College or Associate's Degree | 0 (0.0%) | 0 (0.0%) |
| Bachelor's Degree | 0 (0.0%) | 0 (0.0%) |
| Graduate Degree | 0 (0.0%) | 0 (0.0%) |
| Total | 0 (0.0%) | 0 (0.0%) |
Income in St Rose
Income Overview in St Rose
Per Capita Income in St Rose is $29,595, while median incomes of families and households are $80,774 and $61,920 respectively.
| Characteristic | Number | Measure |
| Per Capita Income | 7,469 | $29,595 |
| Median Family Income | 1,740 | $80,774 |
| Mean Family Income | 1,740 | $97,401 |
| Median Household Income | 2,675 | $61,920 |
| Mean Household Income | 2,675 | $76,097 |
| Income Deficit | 1,740 | $12,116 |
| Wage / Income Gap (%) | 7,469 | 39.45% |
| Wage / Income Gap ($) | 7,469 | 60.55¢ per $1 |
| Gini / Inequality Index | 7,469 | 0.42 |
Earnings by Sex in St Rose
Average Earnings in St Rose are $38,512, $50,919 for men and $30,833 for women, a difference of 39.5%.
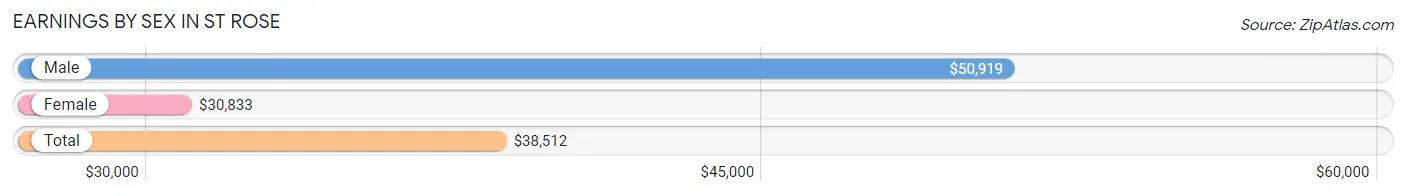
| Sex | Number | Average Earnings |
| Male | 1,953 (52.2%) | $50,919 |
| Female | 1,790 (47.8%) | $30,833 |
| Total | 3,743 (100.0%) | $38,512 |
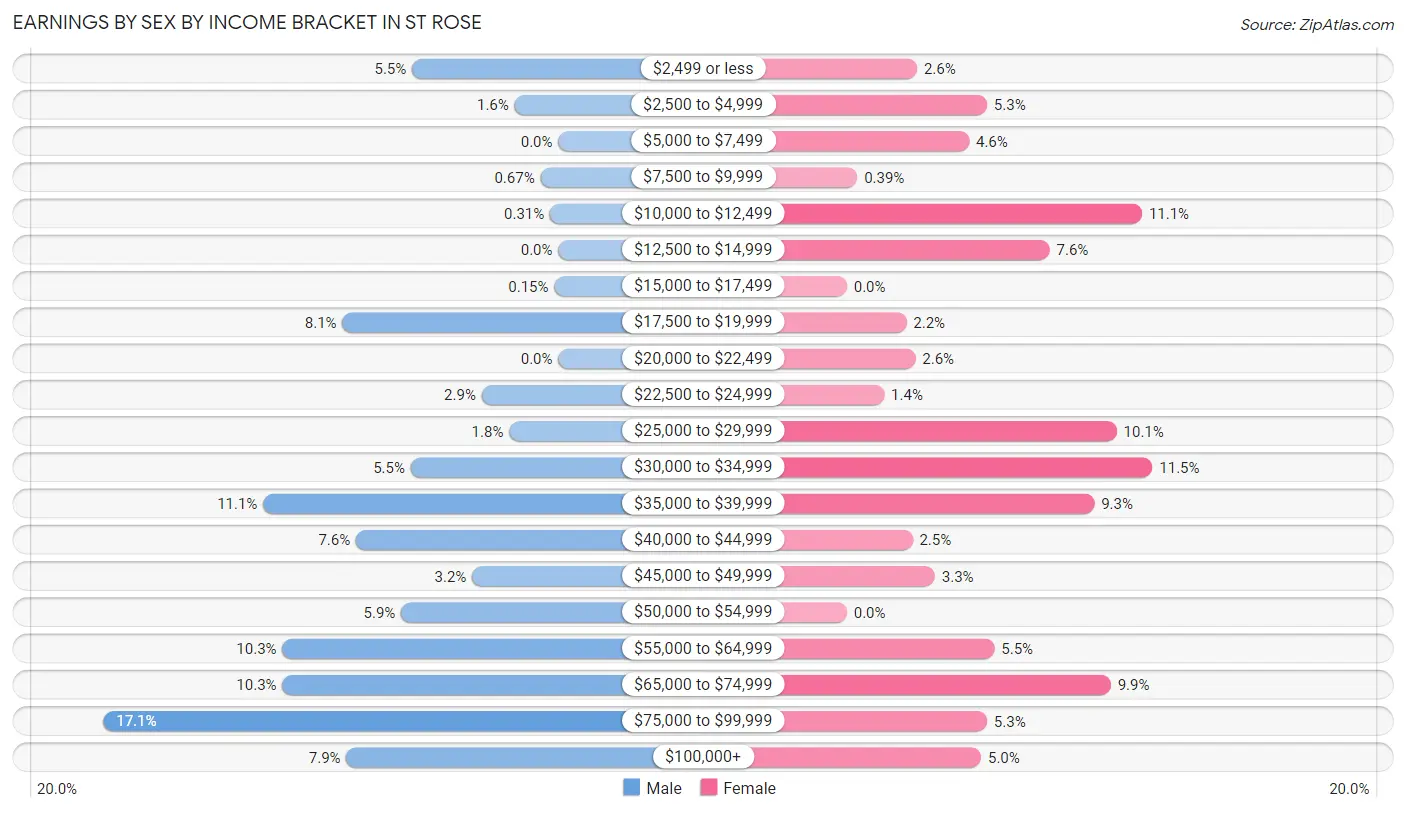
Earnings by Sex by Income Bracket in St Rose
The most common earnings brackets in St Rose are $75,000 to $99,999 for men (333 | 17.1%) and $30,000 to $34,999 for women (205 | 11.5%).
| Income | Male | Female |
| $2,499 or less | 107 (5.5%) | 47 (2.6%) |
| $2,500 to $4,999 | 32 (1.6%) | 94 (5.2%) |
| $5,000 to $7,499 | 0 (0.0%) | 82 (4.6%) |
| $7,500 to $9,999 | 13 (0.7%) | 7 (0.4%) |
| $10,000 to $12,499 | 6 (0.3%) | 198 (11.1%) |
| $12,500 to $14,999 | 0 (0.0%) | 136 (7.6%) |
| $15,000 to $17,499 | 3 (0.2%) | 0 (0.0%) |
| $17,500 to $19,999 | 158 (8.1%) | 40 (2.2%) |
| $20,000 to $22,499 | 0 (0.0%) | 46 (2.6%) |
| $22,500 to $24,999 | 56 (2.9%) | 25 (1.4%) |
| $25,000 to $29,999 | 36 (1.8%) | 181 (10.1%) |
| $30,000 to $34,999 | 108 (5.5%) | 205 (11.5%) |
| $35,000 to $39,999 | 216 (11.1%) | 166 (9.3%) |
| $40,000 to $44,999 | 148 (7.6%) | 44 (2.5%) |
| $45,000 to $49,999 | 63 (3.2%) | 59 (3.3%) |
| $50,000 to $54,999 | 115 (5.9%) | 0 (0.0%) |
| $55,000 to $64,999 | 202 (10.3%) | 99 (5.5%) |
| $65,000 to $74,999 | 202 (10.3%) | 177 (9.9%) |
| $75,000 to $99,999 | 333 (17.1%) | 94 (5.2%) |
| $100,000+ | 155 (7.9%) | 90 (5.0%) |
| Total | 1,953 (100.0%) | 1,790 (100.0%) |
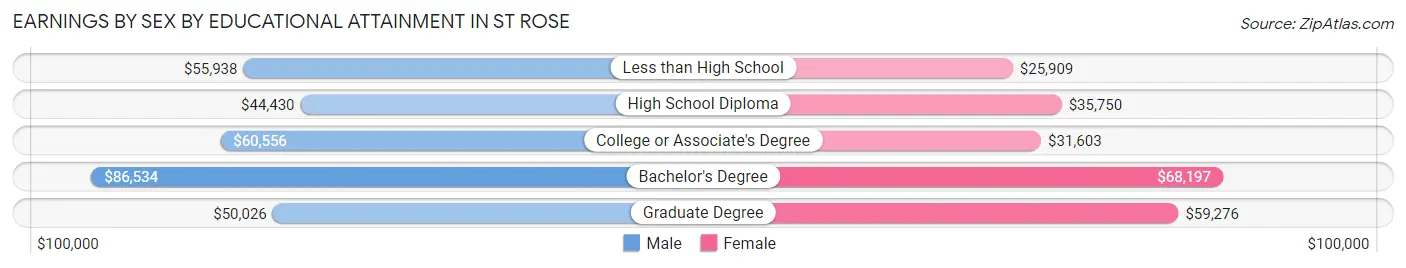
Earnings by Sex by Educational Attainment in St Rose
Average earnings in St Rose are $53,242 for men and $34,984 for women, a difference of 34.3%. Men with an educational attainment of bachelor's degree enjoy the highest average annual earnings of $86,534, while those with high school diploma education earn the least with $44,430. Women with an educational attainment of bachelor's degree earn the most with the average annual earnings of $68,197, while those with less than high school education have the smallest earnings of $25,909.
| Educational Attainment | Male Income | Female Income |
| Less than High School | $55,938 | $25,909 |
| High School Diploma | $44,430 | $35,750 |
| College or Associate's Degree | $60,556 | $31,603 |
| Bachelor's Degree | $86,534 | $68,197 |
| Graduate Degree | $50,026 | $59,276 |
| Total | $53,242 | $34,984 |
Family Income in St Rose
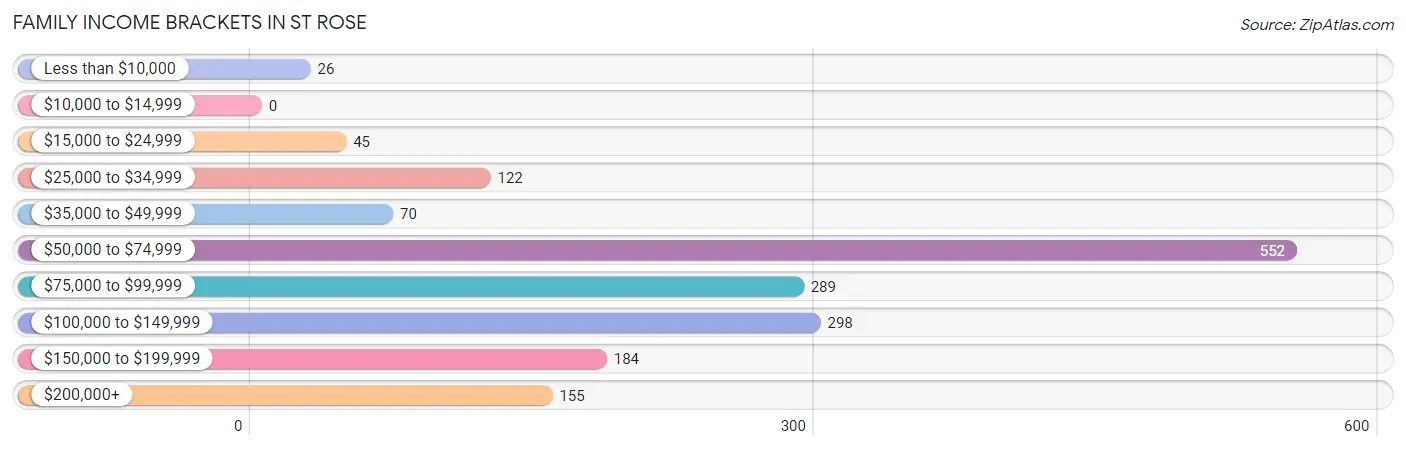
Family Income Brackets in St Rose
According to the St Rose family income data, there are 552 families falling into the $50,000 to $74,999 income range, which is the most common income bracket and makes up 31.7% of all families.
| Income Bracket | # Families | % Families |
| Less than $10,000 | 26 | 1.5% |
| $10,000 to $14,999 | 0 | 0.0% |
| $15,000 to $24,999 | 45 | 2.6% |
| $25,000 to $34,999 | 122 | 7.0% |
| $35,000 to $49,999 | 70 | 4.0% |
| $50,000 to $74,999 | 552 | 31.7% |
| $75,000 to $99,999 | 289 | 16.6% |
| $100,000 to $149,999 | 298 | 17.1% |
| $150,000 to $199,999 | 184 | 10.6% |
| $200,000+ | 155 | 8.9% |
Family Income by Famaliy Size in St Rose
7+ person families (89 | 5.1%) account for the highest median family income in St Rose with $219,960 per family, while 2-person families (806 | 46.3%) have the highest median income of $40,464 per family member.
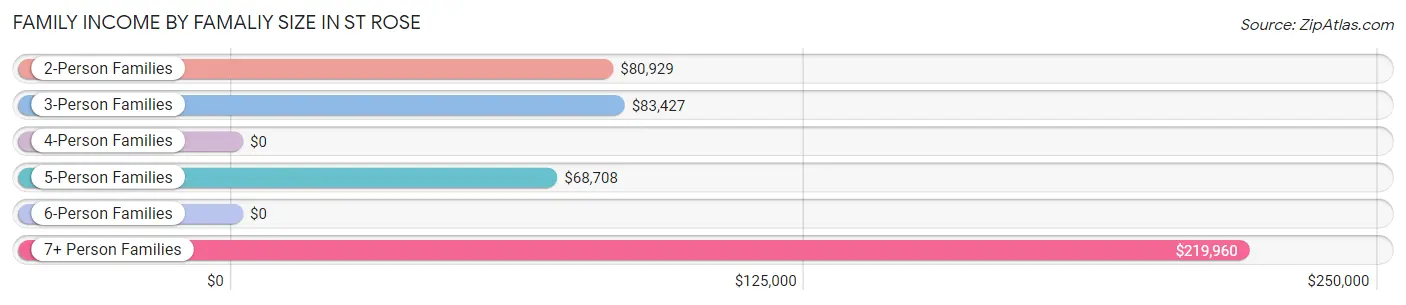
| Income Bracket | # Families | Median Income |
| 2-Person Families | 806 (46.3%) | $80,929 |
| 3-Person Families | 433 (24.9%) | $83,427 |
| 4-Person Families | 277 (15.9%) | $0 |
| 5-Person Families | 61 (3.5%) | $68,708 |
| 6-Person Families | 74 (4.3%) | $0 |
| 7+ Person Families | 89 (5.1%) | $219,960 |
| Total | 1,740 (100.0%) | $80,774 |
Family Income by Number of Earners in St Rose
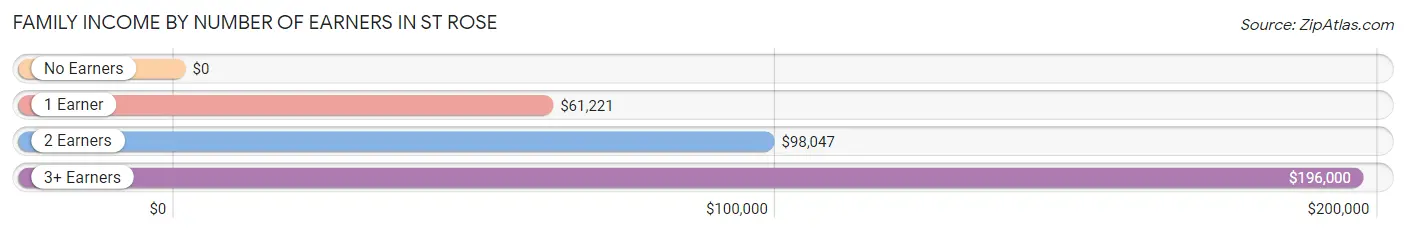
| Number of Earners | # Families | Median Income |
| No Earners | 134 (7.7%) | $0 |
| 1 Earner | 599 (34.4%) | $61,221 |
| 2 Earners | 873 (50.2%) | $98,047 |
| 3+ Earners | 134 (7.7%) | $196,000 |
| Total | 1,740 (100.0%) | $80,774 |
Household Income in St Rose
Household Income Brackets in St Rose
With 682 households falling in the category, the $50,000 to $74,999 income range is the most frequent in St Rose, accounting for 25.5% of all households. In contrast, only 72 households (2.7%) fall into the less than $10,000 income bracket, making it the least populous group.
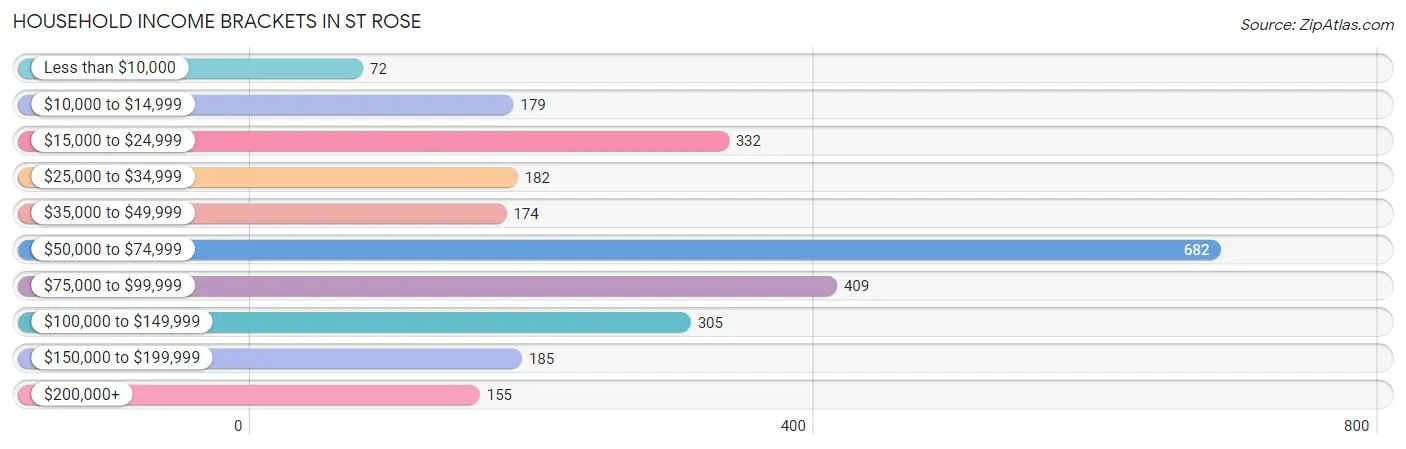
| Income Bracket | # Households | % Households |
| Less than $10,000 | 72 | 2.7% |
| $10,000 to $14,999 | 179 | 6.7% |
| $15,000 to $24,999 | 332 | 12.4% |
| $25,000 to $34,999 | 182 | 6.8% |
| $35,000 to $49,999 | 174 | 6.5% |
| $50,000 to $74,999 | 682 | 25.5% |
| $75,000 to $99,999 | 409 | 15.3% |
| $100,000 to $149,999 | 305 | 11.4% |
| $150,000 to $199,999 | 185 | 6.9% |
| $200,000+ | 155 | 5.8% |
Household Income by Householder Age in St Rose
The median household income in St Rose is $61,920, with the highest median household income of $71,250 found in the 45 to 64 years age bracket for the primary householder. A total of 1,316 households (49.2%) fall into this category. Meanwhile, the 15 to 24 years age bracket for the primary householder has the lowest median household income of $0, with 23 households (0.9%) in this group.
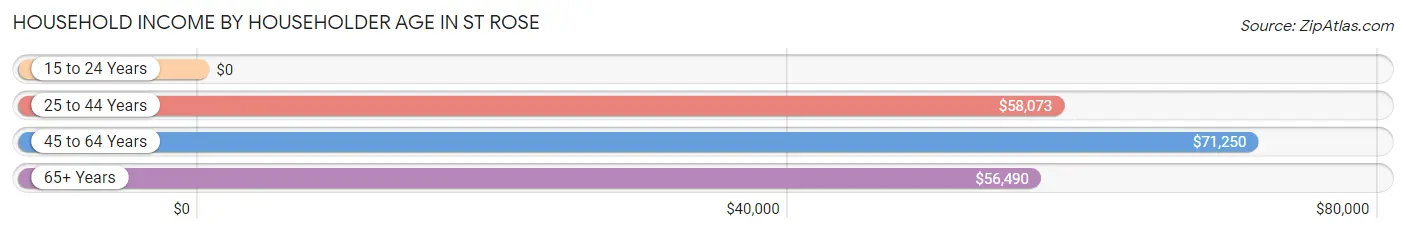
| Income Bracket | # Households | Median Income |
| 15 to 24 Years | 23 (0.9%) | $0 |
| 25 to 44 Years | 785 (29.3%) | $58,073 |
| 45 to 64 Years | 1,316 (49.2%) | $71,250 |
| 65+ Years | 551 (20.6%) | $56,490 |
| Total | 2,675 (100.0%) | $61,920 |
Poverty in St Rose
Income Below Poverty by Sex and Age in St Rose
With 8.3% poverty level for males and 6.7% for females among the residents of St Rose, under 5 year old males and 75 year old and over females are the most vulnerable to poverty, with 67 males (33.7%) and 34 females (36.6%) in their respective age groups living below the poverty level.
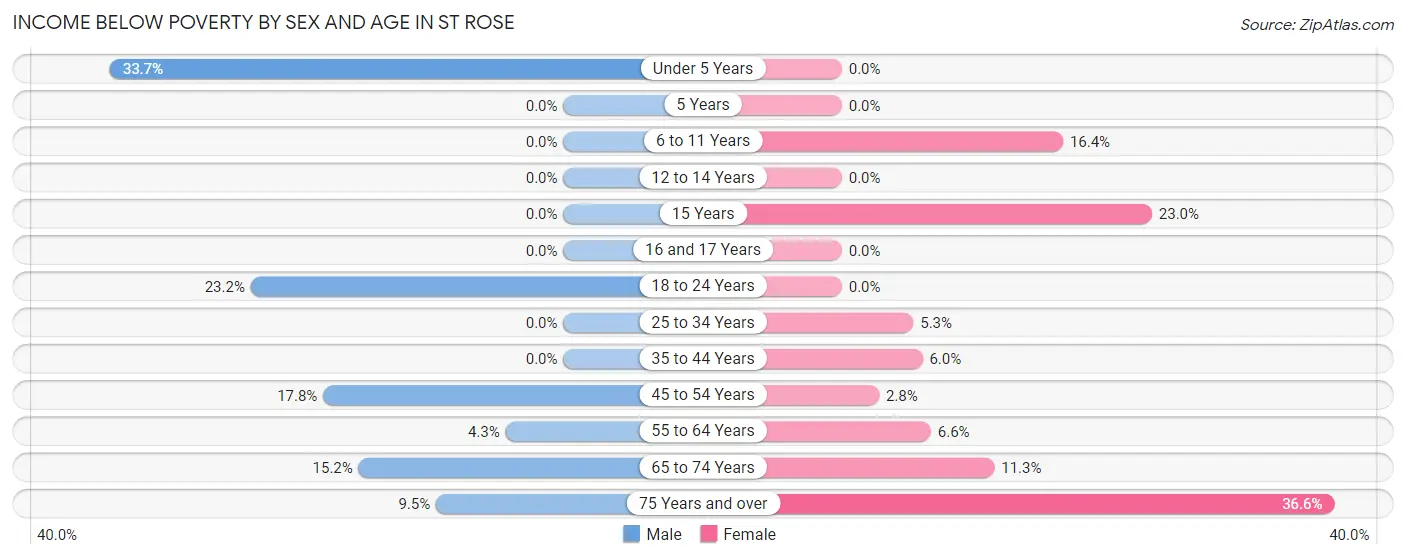
| Age Bracket | Male | Female |
| Under 5 Years | 67 (33.7%) | 0 (0.0%) |
| 5 Years | 0 (0.0%) | 0 (0.0%) |
| 6 to 11 Years | 0 (0.0%) | 44 (16.4%) |
| 12 to 14 Years | 0 (0.0%) | 0 (0.0%) |
| 15 Years | 0 (0.0%) | 32 (23.0%) |
| 16 and 17 Years | 0 (0.0%) | 0 (0.0%) |
| 18 to 24 Years | 39 (23.2%) | 0 (0.0%) |
| 25 to 34 Years | 0 (0.0%) | 26 (5.3%) |
| 35 to 44 Years | 0 (0.0%) | 19 (6.0%) |
| 45 to 54 Years | 97 (17.8%) | 17 (2.8%) |
| 55 to 64 Years | 22 (4.3%) | 41 (6.6%) |
| 65 to 74 Years | 50 (15.2%) | 54 (11.3%) |
| 75 Years and over | 12 (9.5%) | 34 (36.6%) |
| Total | 287 (8.3%) | 267 (6.7%) |
Income Above Poverty by Sex and Age in St Rose
According to the poverty statistics in St Rose, males aged 5 years and females aged under 5 years are the age groups that are most secure financially, with 100.0% of males and 100.0% of females in these age groups living above the poverty line.
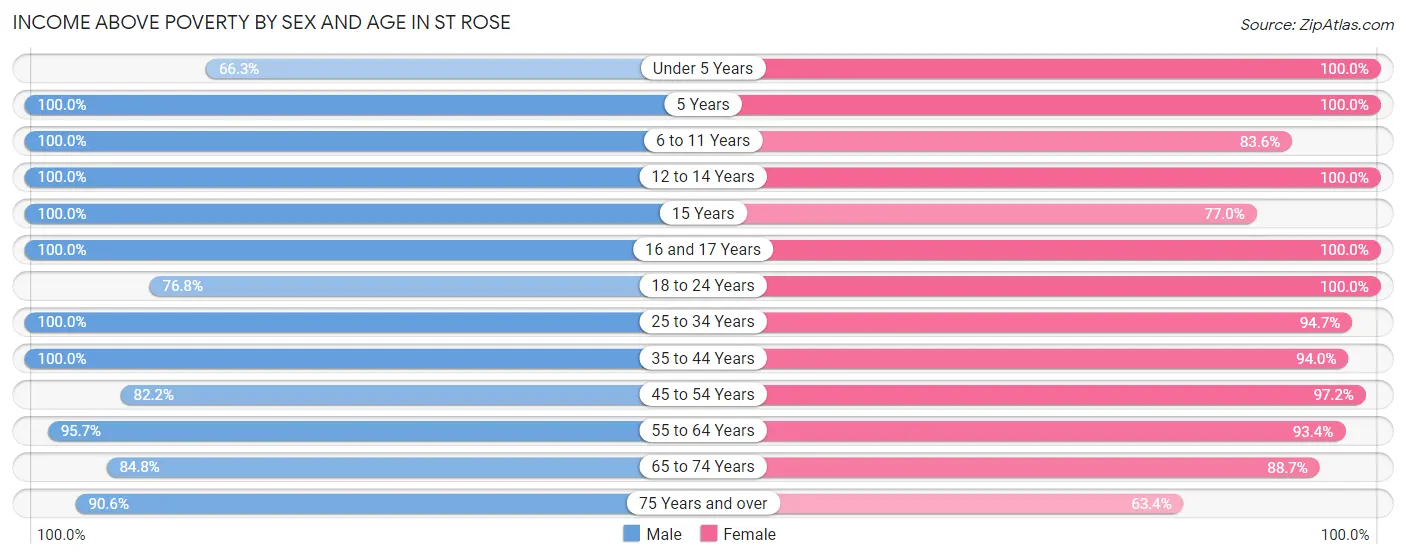
| Age Bracket | Male | Female |
| Under 5 Years | 132 (66.3%) | 7 (100.0%) |
| 5 Years | 207 (100.0%) | 47 (100.0%) |
| 6 to 11 Years | 357 (100.0%) | 224 (83.6%) |
| 12 to 14 Years | 44 (100.0%) | 320 (100.0%) |
| 15 Years | 13 (100.0%) | 107 (77.0%) |
| 16 and 17 Years | 94 (100.0%) | 134 (100.0%) |
| 18 to 24 Years | 129 (76.8%) | 469 (100.0%) |
| 25 to 34 Years | 557 (100.0%) | 464 (94.7%) |
| 35 to 44 Years | 320 (100.0%) | 298 (94.0%) |
| 45 to 54 Years | 447 (82.2%) | 599 (97.2%) |
| 55 to 64 Years | 491 (95.7%) | 579 (93.4%) |
| 65 to 74 Years | 279 (84.8%) | 423 (88.7%) |
| 75 Years and over | 115 (90.5%) | 59 (63.4%) |
| Total | 3,185 (91.7%) | 3,730 (93.3%) |
Income Below Poverty Among Married-Couple Families in St Rose
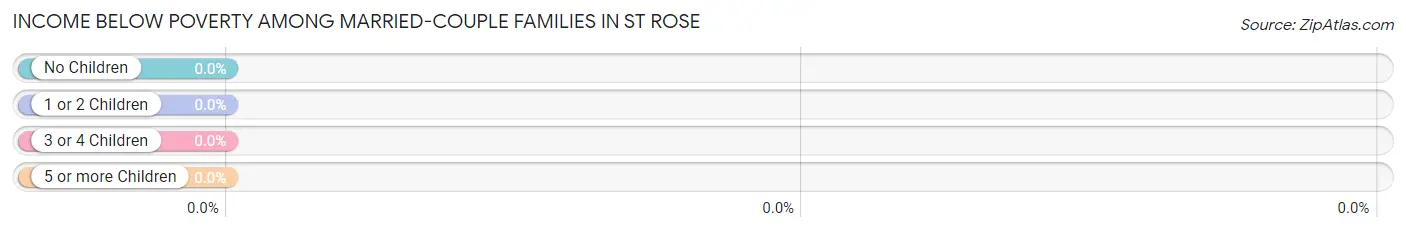
| Children | Above Poverty | Below Poverty |
| No Children | 807 (100.0%) | 0 (0.0%) |
| 1 or 2 Children | 219 (100.0%) | 0 (0.0%) |
| 3 or 4 Children | 158 (100.0%) | 0 (0.0%) |
| 5 or more Children | 44 (100.0%) | 0 (0.0%) |
| Total | 1,228 (100.0%) | 0 (0.0%) |
Income Below Poverty Among Single-Parent Households in St Rose
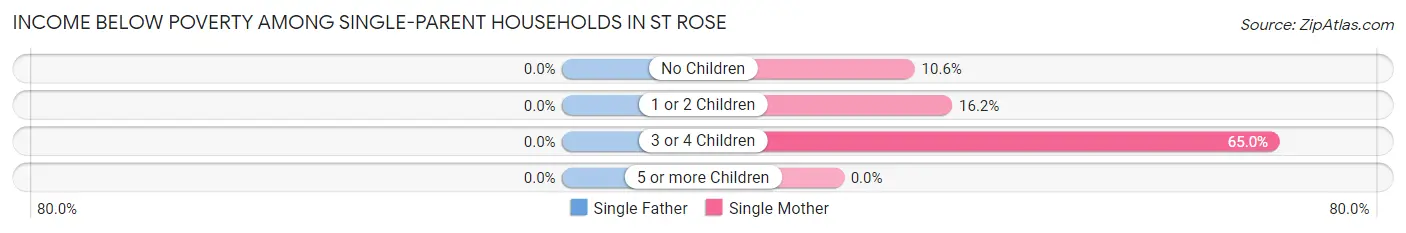
| Children | Single Father | Single Mother |
| No Children | 0 (0.0%) | 22 (10.6%) |
| 1 or 2 Children | 0 (0.0%) | 16 (16.2%) |
| 3 or 4 Children | 0 (0.0%) | 26 (65.0%) |
| 5 or more Children | 0 (0.0%) | 0 (0.0%) |
| Total | 0 (0.0%) | 64 (18.4%) |
Income Below Poverty Among Married-Couple vs Single-Parent Households in St Rose
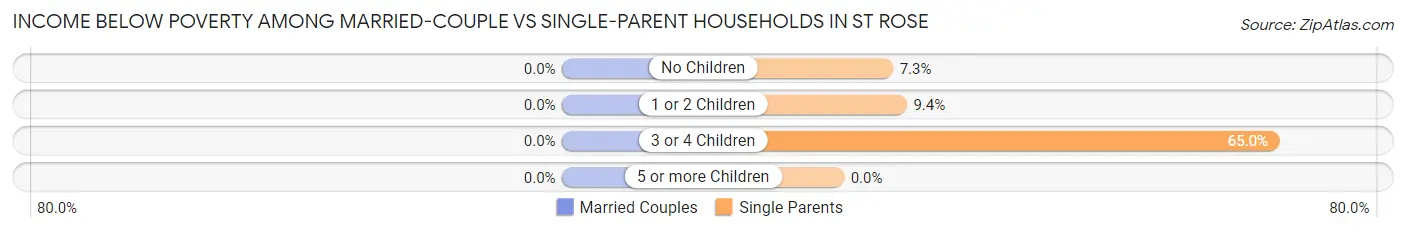
| Children | Married-Couple Families | Single-Parent Households |
| No Children | 0 (0.0%) | 22 (7.3%) |
| 1 or 2 Children | 0 (0.0%) | 16 (9.4%) |
| 3 or 4 Children | 0 (0.0%) | 26 (65.0%) |
| 5 or more Children | 0 (0.0%) | 0 (0.0%) |
| Total | 0 (0.0%) | 64 (12.5%) |
Employment Characteristics in St Rose
Employment by Class of Employer in St Rose
Among the 3,042 employed individuals in St Rose, private company employees (2,167 | 71.2%), local government employees (270 | 8.9%), and self-employed (not incorporated) (249 | 8.2%) make up the most common classes of employment.
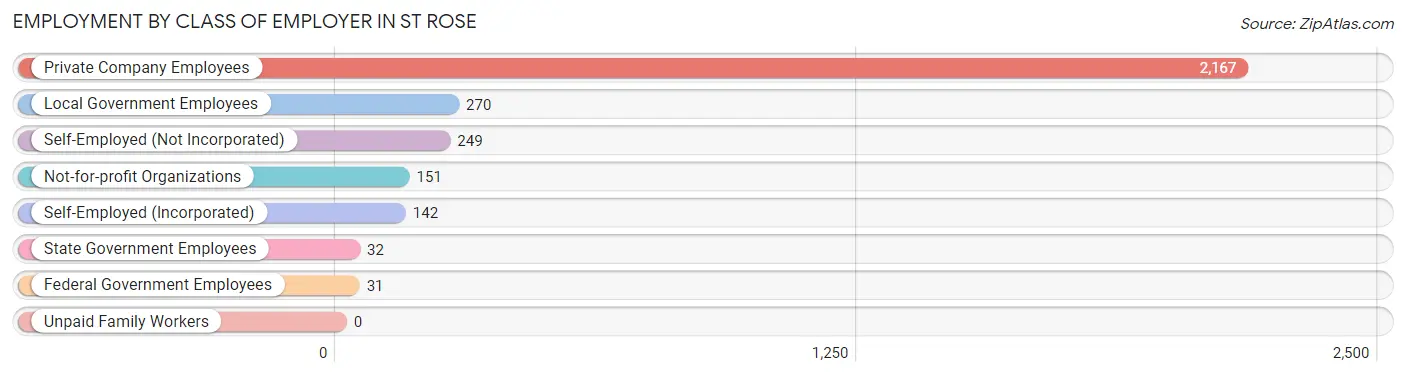
| Employer Class | # Employees | % Employees |
| Private Company Employees | 2,167 | 71.2% |
| Self-Employed (Incorporated) | 142 | 4.7% |
| Self-Employed (Not Incorporated) | 249 | 8.2% |
| Not-for-profit Organizations | 151 | 5.0% |
| Local Government Employees | 270 | 8.9% |
| State Government Employees | 32 | 1.1% |
| Federal Government Employees | 31 | 1.0% |
| Unpaid Family Workers | 0 | 0.0% |
| Total | 3,042 | 100.0% |
Employment Status by Age in St Rose
According to the labor force statistics for St Rose, out of the total population over 16 years of age (5,868), 60.8% or 3,568 individuals are in the labor force, with 12.3% or 439 of them unemployed. The age group with the highest labor force participation rate is 25 to 29 years, with 100.0% or 482 individuals in the labor force. Within the labor force, the 20 to 24 years age range has the highest percentage of unemployed individuals, with 39.0% or 121 of them being unemployed.
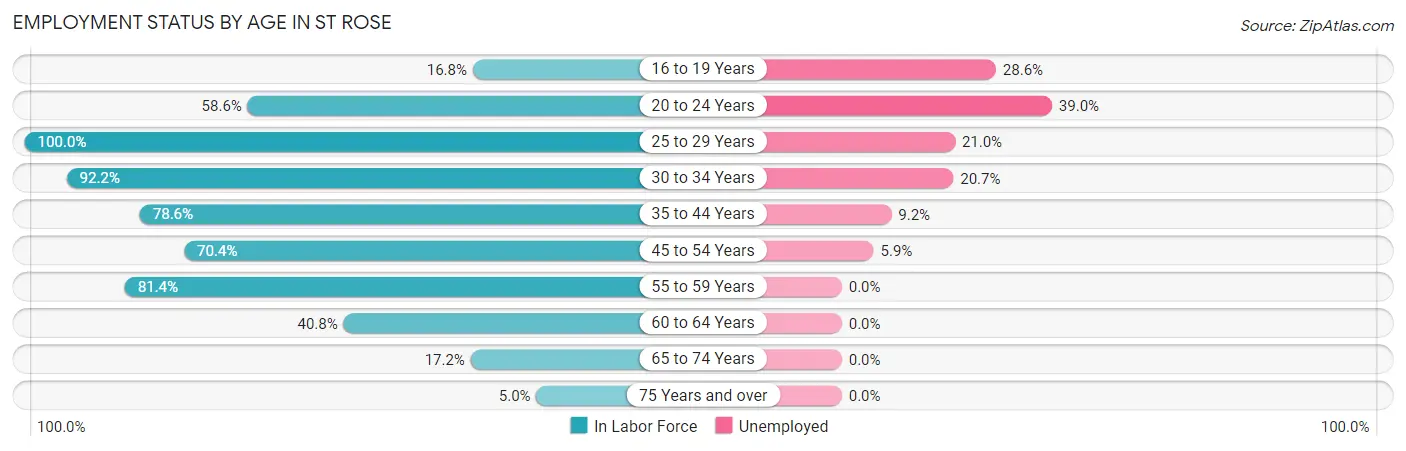
| Age Bracket | In Labor Force | Unemployed |
| 16 to 19 Years | 56 (16.8%) | 16 (28.6%) |
| 20 to 24 Years | 311 (58.6%) | 121 (39.0%) |
| 25 to 29 Years | 482 (100.0%) | 101 (21.0%) |
| 30 to 34 Years | 521 (92.2%) | 108 (20.7%) |
| 35 to 44 Years | 501 (78.6%) | 46 (9.2%) |
| 45 to 54 Years | 817 (70.4%) | 48 (5.9%) |
| 55 to 59 Years | 537 (81.4%) | 0 (0.0%) |
| 60 to 64 Years | 193 (40.8%) | 0 (0.0%) |
| 65 to 74 Years | 139 (17.2%) | 0 (0.0%) |
| 75 Years and over | 11 (5.0%) | 0 (0.0%) |
| Total | 3,568 (60.8%) | 439 (12.3%) |
Employment Status by Educational Attainment in St Rose
According to labor force statistics for St Rose, 76.7% of individuals (3,050) out of the total population between 25 and 64 years of age (3,977) are in the labor force, with 9.9% or 302 of them being unemployed. The group with the highest labor force participation rate are those with the educational attainment of college / associate degree, with 86.5% or 1,349 individuals in the labor force. Within the labor force, individuals with high school diploma education have the highest percentage of unemployment, with 17.7% or 135 of them being unemployed.
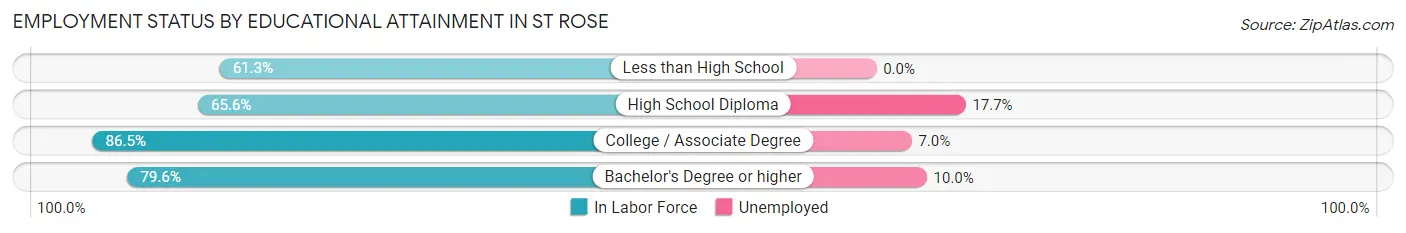
| Educational Attainment | In Labor Force | Unemployed |
| Less than High School | 200 (61.3%) | 0 (0.0%) |
| High School Diploma | 761 (65.6%) | 205 (17.7%) |
| College / Associate Degree | 1,349 (86.5%) | 109 (7.0%) |
| Bachelor's Degree or higher | 741 (79.6%) | 93 (10.0%) |
| Total | 3,050 (76.7%) | 394 (9.9%) |
Employment Occupations by Sex in St Rose
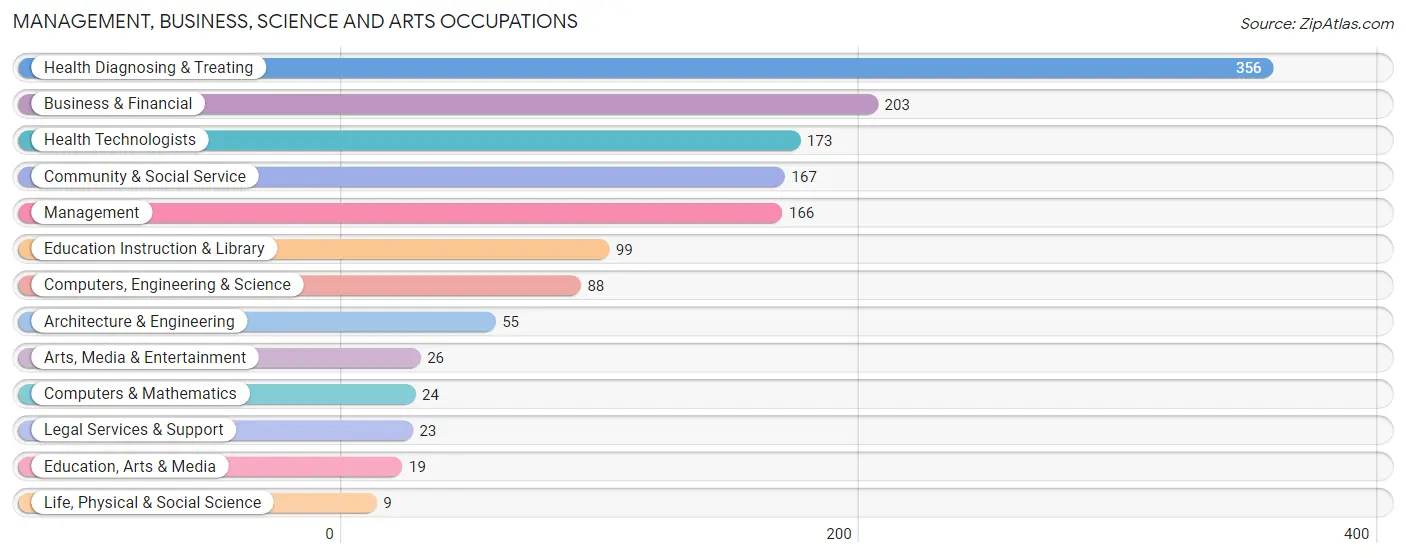
Management, Business, Science and Arts Occupations
The most common Management, Business, Science and Arts occupations in St Rose are Health Diagnosing & Treating (356 | 11.4%), Business & Financial (203 | 6.5%), Health Technologists (173 | 5.5%), Community & Social Service (167 | 5.3%), and Management (166 | 5.3%).
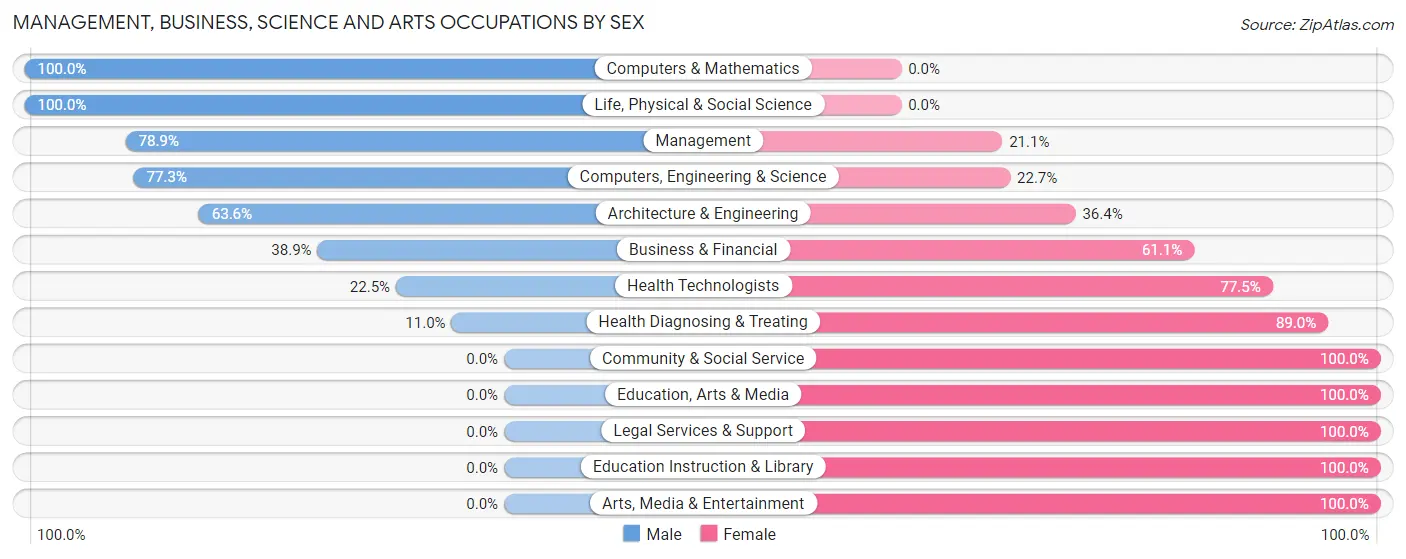
Management, Business, Science and Arts Occupations by Sex
Within the Management, Business, Science and Arts occupations in St Rose, the most male-oriented occupations are Computers & Mathematics (100.0%), Life, Physical & Social Science (100.0%), and Management (78.9%), while the most female-oriented occupations are Community & Social Service (100.0%), Education, Arts & Media (100.0%), and Legal Services & Support (100.0%).
| Occupation | Male | Female |
| Management | 131 (78.9%) | 35 (21.1%) |
| Business & Financial | 79 (38.9%) | 124 (61.1%) |
| Computers, Engineering & Science | 68 (77.3%) | 20 (22.7%) |
| Computers & Mathematics | 24 (100.0%) | 0 (0.0%) |
| Architecture & Engineering | 35 (63.6%) | 20 (36.4%) |
| Life, Physical & Social Science | 9 (100.0%) | 0 (0.0%) |
| Community & Social Service | 0 (0.0%) | 167 (100.0%) |
| Education, Arts & Media | 0 (0.0%) | 19 (100.0%) |
| Legal Services & Support | 0 (0.0%) | 23 (100.0%) |
| Education Instruction & Library | 0 (0.0%) | 99 (100.0%) |
| Arts, Media & Entertainment | 0 (0.0%) | 26 (100.0%) |
| Health Diagnosing & Treating | 39 (11.0%) | 317 (89.0%) |
| Health Technologists | 39 (22.5%) | 134 (77.5%) |
| Total (Category) | 317 (32.4%) | 663 (67.6%) |
| Total (Overall) | 1,643 (52.6%) | 1,481 (47.4%) |
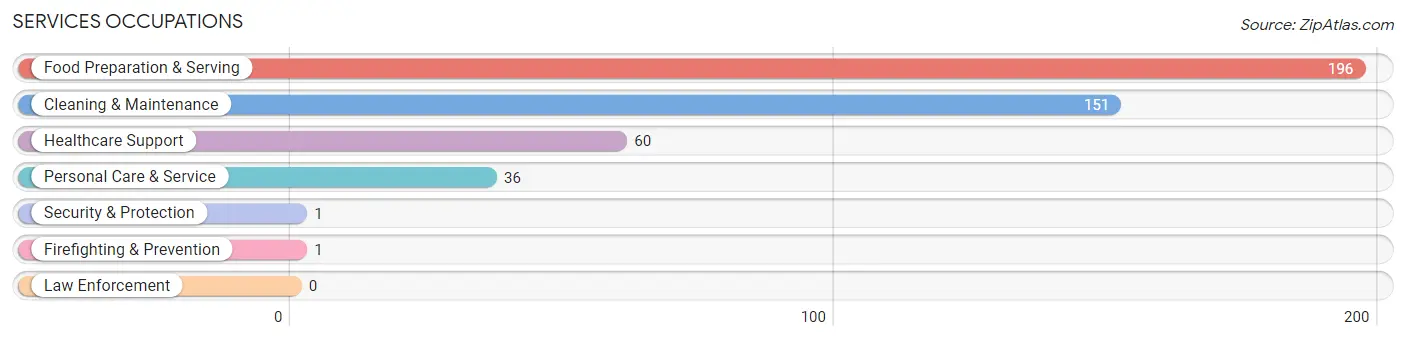
Services Occupations
The most common Services occupations in St Rose are Food Preparation & Serving (196 | 6.3%), Cleaning & Maintenance (151 | 4.8%), Healthcare Support (60 | 1.9%), Personal Care & Service (36 | 1.1%), and Security & Protection (1 | 0.0%).
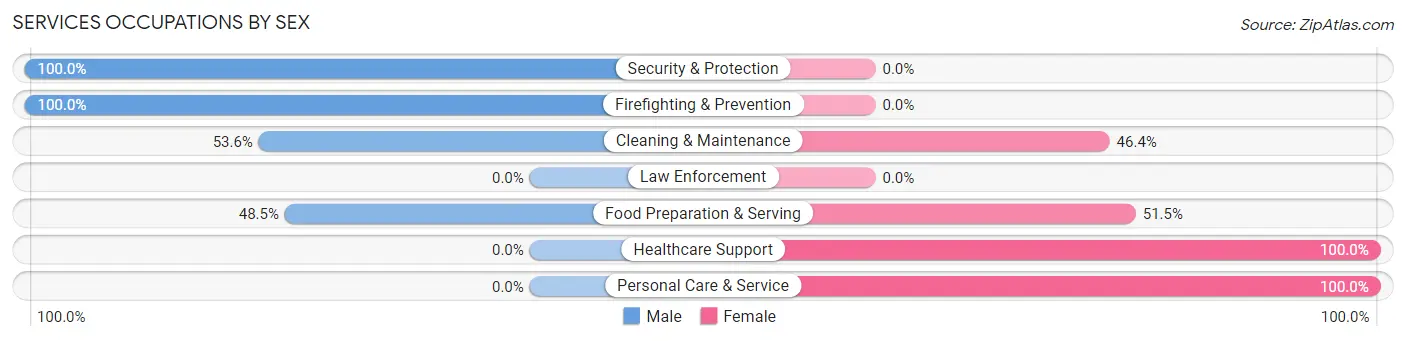
Services Occupations by Sex
Within the Services occupations in St Rose, the most male-oriented occupations are Security & Protection (100.0%), Firefighting & Prevention (100.0%), and Cleaning & Maintenance (53.6%), while the most female-oriented occupations are Healthcare Support (100.0%), Personal Care & Service (100.0%), and Food Preparation & Serving (51.5%).
| Occupation | Male | Female |
| Healthcare Support | 0 (0.0%) | 60 (100.0%) |
| Security & Protection | 1 (100.0%) | 0 (0.0%) |
| Firefighting & Prevention | 1 (100.0%) | 0 (0.0%) |
| Law Enforcement | 0 (0.0%) | 0 (0.0%) |
| Food Preparation & Serving | 95 (48.5%) | 101 (51.5%) |
| Cleaning & Maintenance | 81 (53.6%) | 70 (46.4%) |
| Personal Care & Service | 0 (0.0%) | 36 (100.0%) |
| Total (Category) | 177 (39.9%) | 267 (60.1%) |
| Total (Overall) | 1,643 (52.6%) | 1,481 (47.4%) |
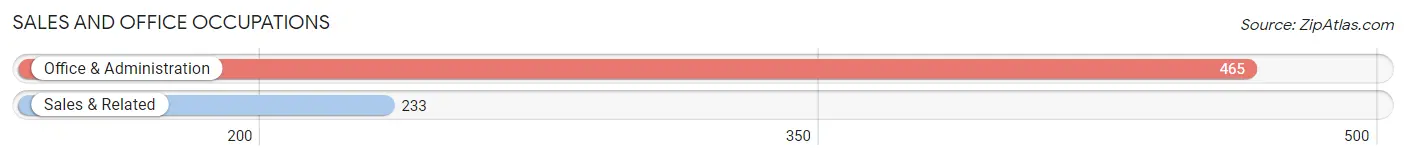
Sales and Office Occupations
The most common Sales and Office occupations in St Rose are Office & Administration (465 | 14.9%), and Sales & Related (233 | 7.5%).
Sales and Office Occupations by Sex
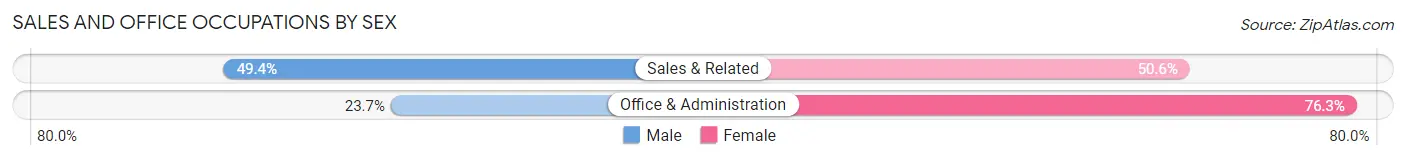
| Occupation | Male | Female |
| Sales & Related | 115 (49.4%) | 118 (50.6%) |
| Office & Administration | 110 (23.7%) | 355 (76.3%) |
| Total (Category) | 225 (32.2%) | 473 (67.8%) |
| Total (Overall) | 1,643 (52.6%) | 1,481 (47.4%) |
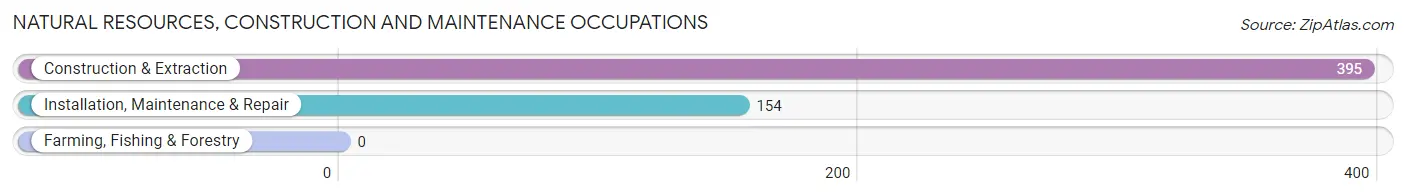
Natural Resources, Construction and Maintenance Occupations
The most common Natural Resources, Construction and Maintenance occupations in St Rose are Construction & Extraction (395 | 12.6%), and Installation, Maintenance & Repair (154 | 4.9%).
Natural Resources, Construction and Maintenance Occupations by Sex
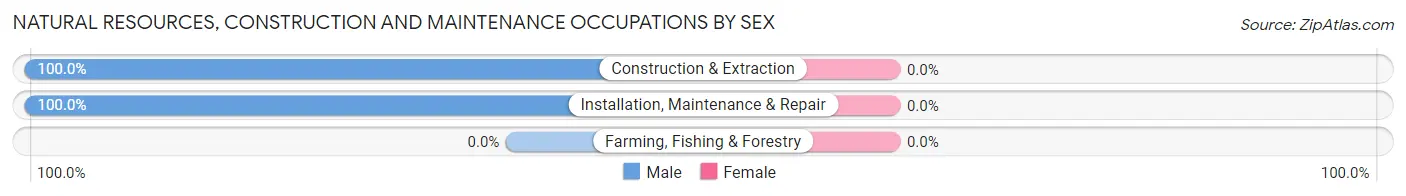
| Occupation | Male | Female |
| Farming, Fishing & Forestry | 0 (0.0%) | 0 (0.0%) |
| Construction & Extraction | 395 (100.0%) | 0 (0.0%) |
| Installation, Maintenance & Repair | 154 (100.0%) | 0 (0.0%) |
| Total (Category) | 549 (100.0%) | 0 (0.0%) |
| Total (Overall) | 1,643 (52.6%) | 1,481 (47.4%) |
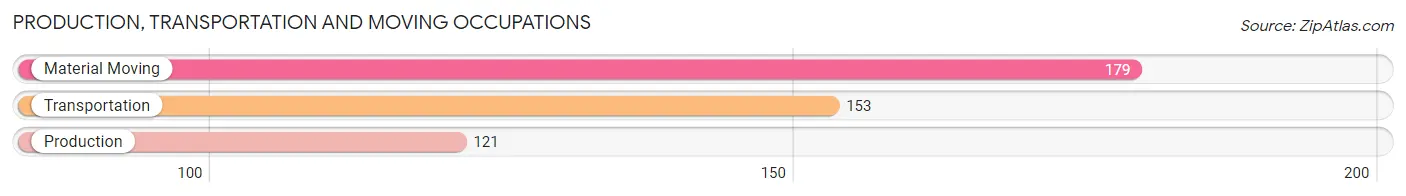
Production, Transportation and Moving Occupations
The most common Production, Transportation and Moving occupations in St Rose are Material Moving (179 | 5.7%), Transportation (153 | 4.9%), and Production (121 | 3.9%).
Production, Transportation and Moving Occupations by Sex
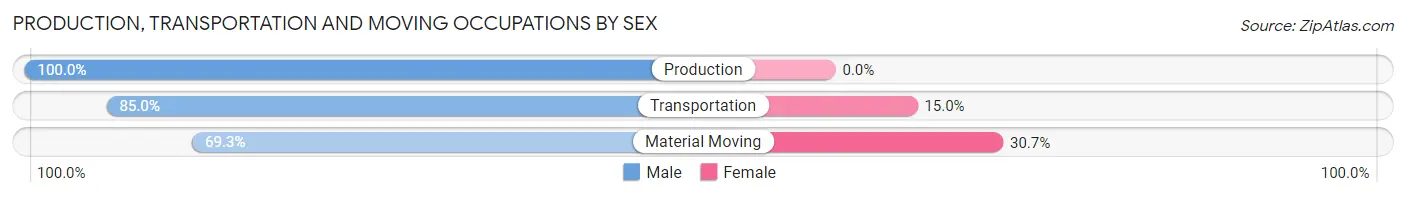
| Occupation | Male | Female |
| Production | 121 (100.0%) | 0 (0.0%) |
| Transportation | 130 (85.0%) | 23 (15.0%) |
| Material Moving | 124 (69.3%) | 55 (30.7%) |
| Total (Category) | 375 (82.8%) | 78 (17.2%) |
| Total (Overall) | 1,643 (52.6%) | 1,481 (47.4%) |
Employment Industries by Sex in St Rose
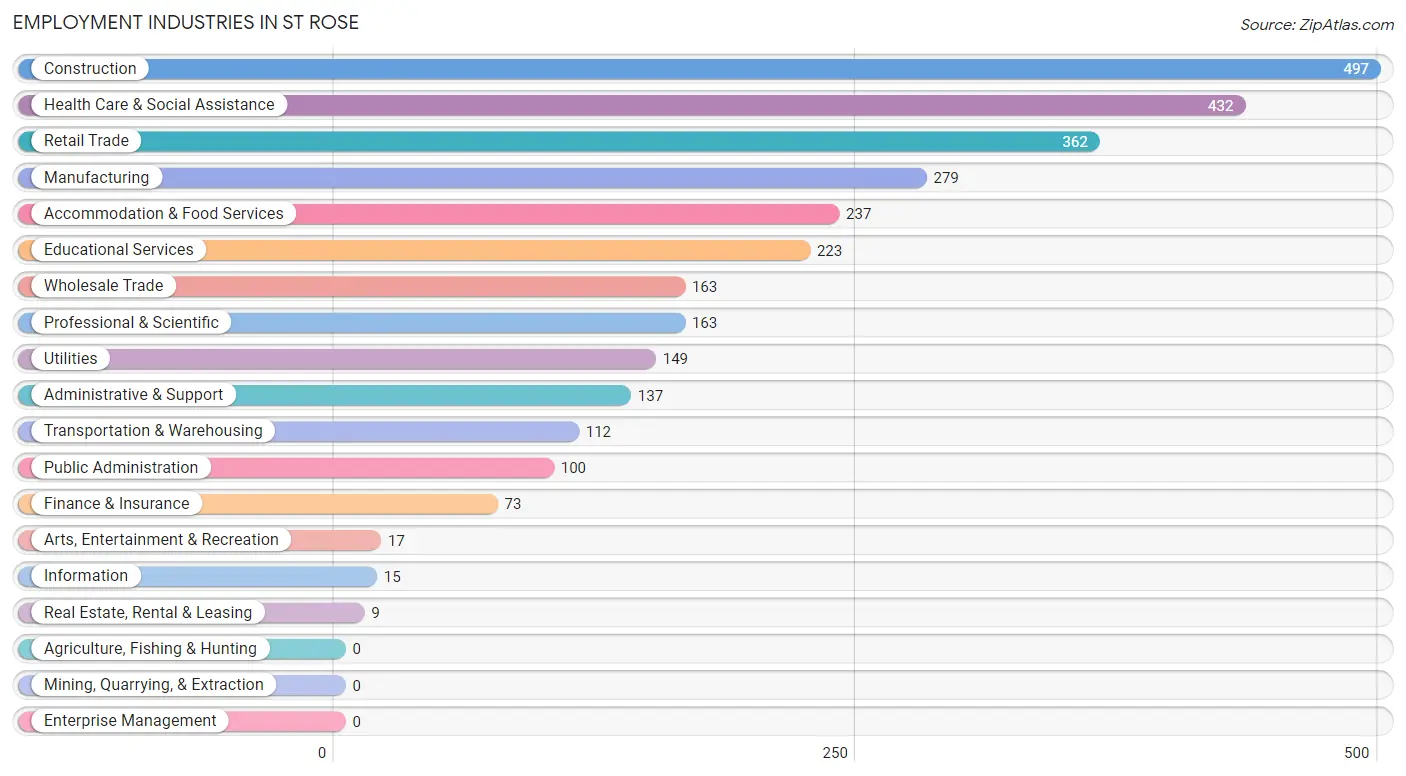
Employment Industries in St Rose
The major employment industries in St Rose include Construction (497 | 15.9%), Health Care & Social Assistance (432 | 13.8%), Retail Trade (362 | 11.6%), Manufacturing (279 | 8.9%), and Accommodation & Food Services (237 | 7.6%).
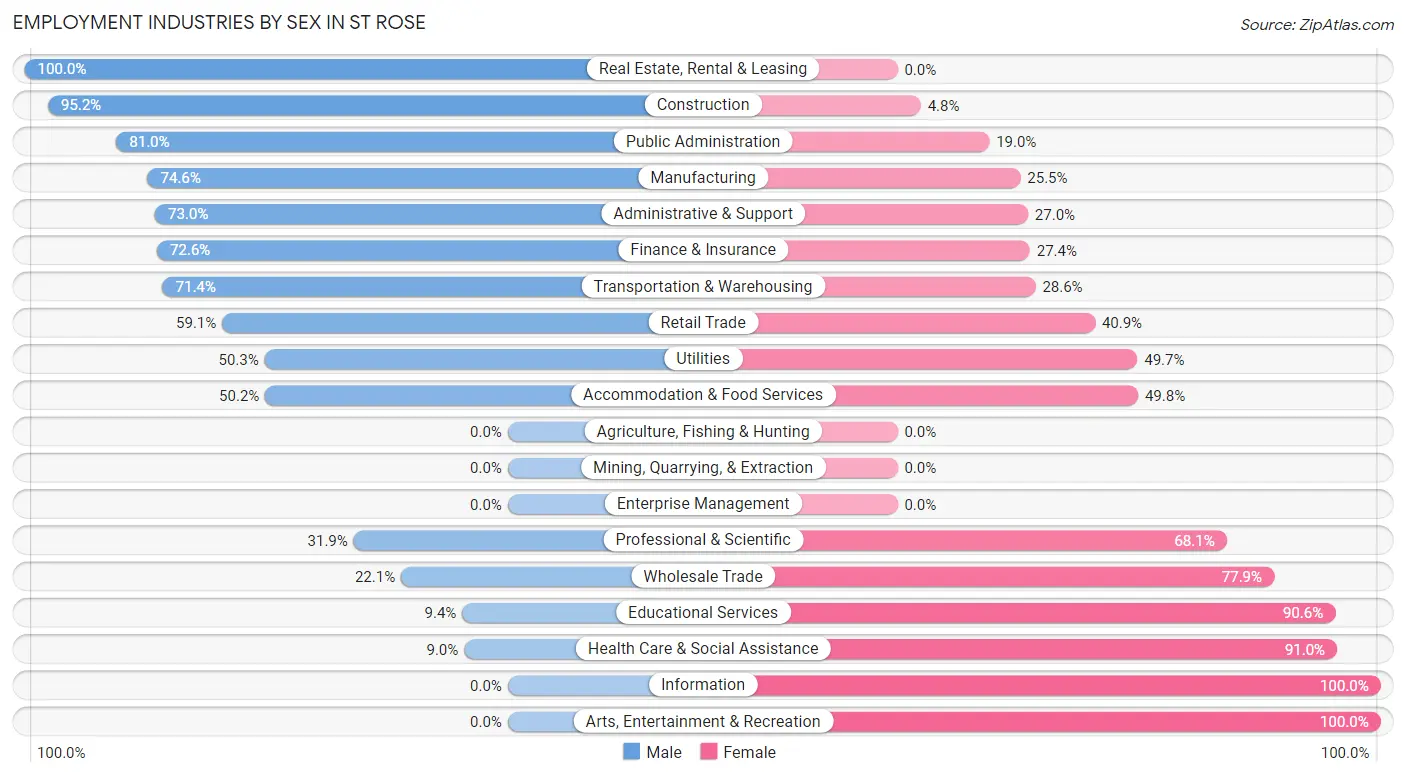
Employment Industries by Sex in St Rose
The St Rose industries that see more men than women are Real Estate, Rental & Leasing (100.0%), Construction (95.2%), and Public Administration (81.0%), whereas the industries that tend to have a higher number of women are Information (100.0%), Arts, Entertainment & Recreation (100.0%), and Health Care & Social Assistance (91.0%).
| Industry | Male | Female |
| Agriculture, Fishing & Hunting | 0 (0.0%) | 0 (0.0%) |
| Mining, Quarrying, & Extraction | 0 (0.0%) | 0 (0.0%) |
| Construction | 473 (95.2%) | 24 (4.8%) |
| Manufacturing | 208 (74.6%) | 71 (25.5%) |
| Wholesale Trade | 36 (22.1%) | 127 (77.9%) |
| Retail Trade | 214 (59.1%) | 148 (40.9%) |
| Transportation & Warehousing | 80 (71.4%) | 32 (28.6%) |
| Utilities | 75 (50.3%) | 74 (49.7%) |
| Information | 0 (0.0%) | 15 (100.0%) |
| Finance & Insurance | 53 (72.6%) | 20 (27.4%) |
| Real Estate, Rental & Leasing | 9 (100.0%) | 0 (0.0%) |
| Professional & Scientific | 52 (31.9%) | 111 (68.1%) |
| Enterprise Management | 0 (0.0%) | 0 (0.0%) |
| Administrative & Support | 100 (73.0%) | 37 (27.0%) |
| Educational Services | 21 (9.4%) | 202 (90.6%) |
| Health Care & Social Assistance | 39 (9.0%) | 393 (91.0%) |
| Arts, Entertainment & Recreation | 0 (0.0%) | 17 (100.0%) |
| Accommodation & Food Services | 119 (50.2%) | 118 (49.8%) |
| Public Administration | 81 (81.0%) | 19 (19.0%) |
| Total | 1,643 (52.6%) | 1,481 (47.4%) |
Education in St Rose
School Enrollment in St Rose
The most common levels of schooling among the 2,079 students in St Rose are high school (621 | 29.9%), elementary school (571 | 27.5%), and college / undergraduate (313 | 15.1%).
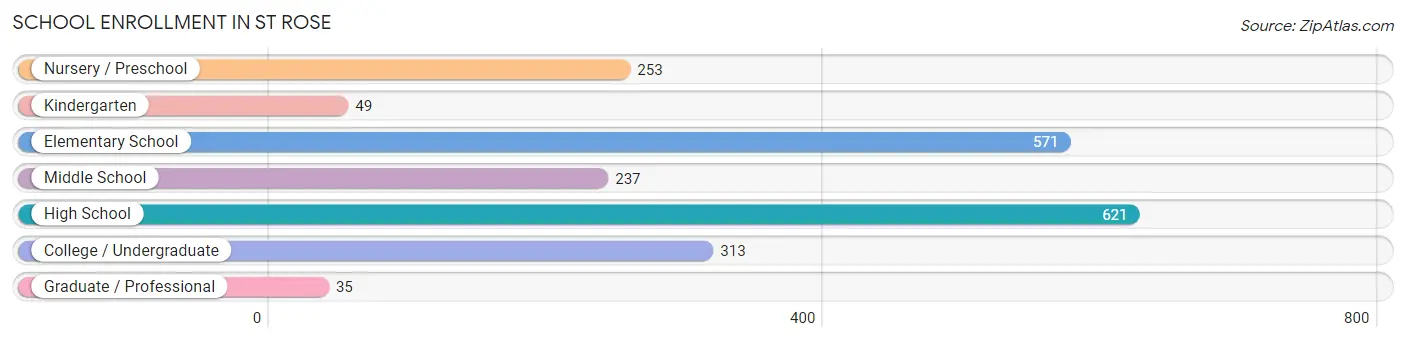
| School Level | # Students | % Students |
| Nursery / Preschool | 253 | 12.2% |
| Kindergarten | 49 | 2.4% |
| Elementary School | 571 | 27.5% |
| Middle School | 237 | 11.4% |
| High School | 621 | 29.9% |
| College / Undergraduate | 313 | 15.1% |
| Graduate / Professional | 35 | 1.7% |
| Total | 2,079 | 100.0% |
School Enrollment by Age by Funding Source in St Rose
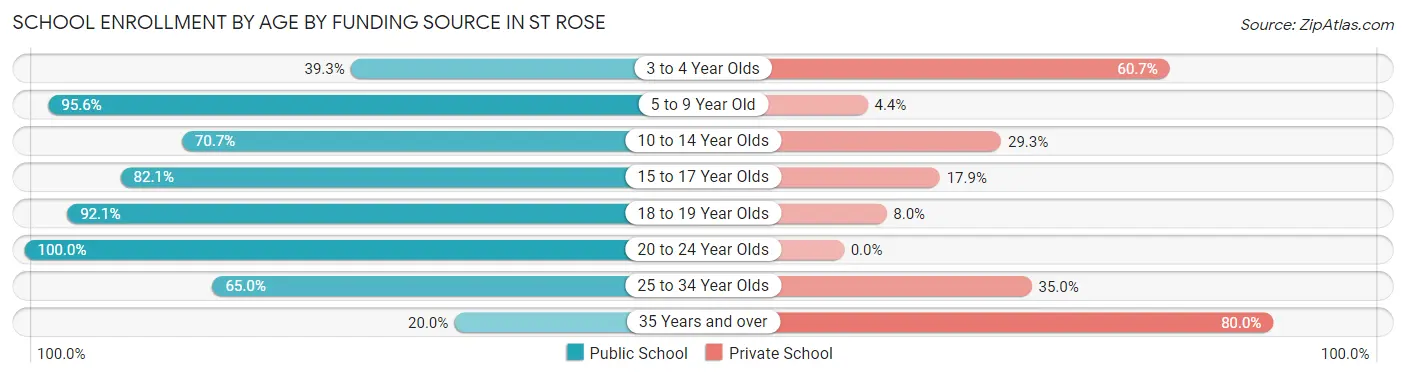
Out of a total of 2,079 students who are enrolled in schools in St Rose, 389 (18.7%) attend a private institution, while the remaining 1,690 (81.3%) are enrolled in public schools. The age group of 35 years and over has the highest likelihood of being enrolled in private schools, with 76 (80.0% in the age bracket) enrolled. Conversely, the age group of 20 to 24 year olds has the lowest likelihood of being enrolled in a private school, with 145 (100.0% in the age bracket) attending a public institution.
| Age Bracket | Public School | Private School |
| 3 to 4 Year Olds | 11 (39.3%) | 17 (60.7%) |
| 5 to 9 Year Old | 689 (95.6%) | 32 (4.4%) |
| 10 to 14 Year Olds | 369 (70.7%) | 153 (29.3%) |
| 15 to 17 Year Olds | 312 (82.1%) | 68 (17.9%) |
| 18 to 19 Year Olds | 81 (92.0%) | 7 (8.0%) |
| 20 to 24 Year Olds | 145 (100.0%) | 0 (0.0%) |
| 25 to 34 Year Olds | 65 (65.0%) | 35 (35.0%) |
| 35 Years and over | 19 (20.0%) | 76 (80.0%) |
| Total | 1,690 (81.3%) | 389 (18.7%) |
Educational Attainment by Field of Study in St Rose
Business (289 | 26.0%), engineering (165 | 14.8%), science & technology (109 | 9.8%), bio, nature & agricultural (108 | 9.7%), and education (97 | 8.7%) are the most common fields of study among 1,111 individuals in St Rose who have obtained a bachelor's degree or higher.
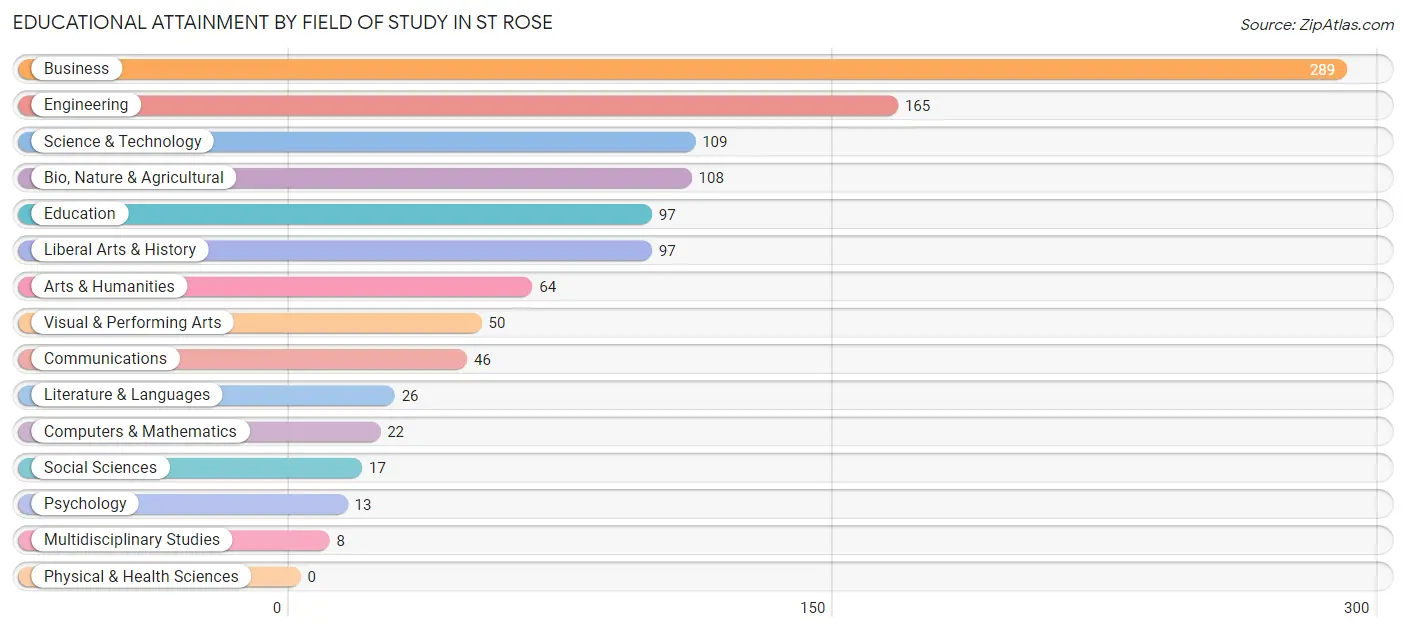
| Field of Study | # Graduates | % Graduates |
| Computers & Mathematics | 22 | 2.0% |
| Bio, Nature & Agricultural | 108 | 9.7% |
| Physical & Health Sciences | 0 | 0.0% |
| Psychology | 13 | 1.2% |
| Social Sciences | 17 | 1.5% |
| Engineering | 165 | 14.8% |
| Multidisciplinary Studies | 8 | 0.7% |
| Science & Technology | 109 | 9.8% |
| Business | 289 | 26.0% |
| Education | 97 | 8.7% |
| Literature & Languages | 26 | 2.3% |
| Liberal Arts & History | 97 | 8.7% |
| Visual & Performing Arts | 50 | 4.5% |
| Communications | 46 | 4.1% |
| Arts & Humanities | 64 | 5.8% |
| Total | 1,111 | 100.0% |
Transportation & Commute in St Rose
Vehicle Availability by Sex in St Rose
The most prevalent vehicle ownership categories in St Rose are males with 2 vehicles (634, accounting for 38.6%) and females with 2 vehicles (538, making up 45.3%).
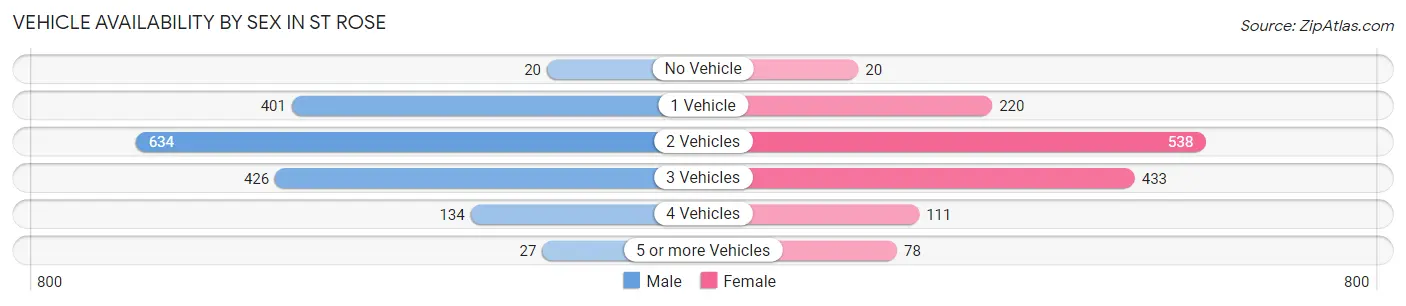
| Vehicles Available | Male | Female |
| No Vehicle | 20 (1.2%) | 20 (1.4%) |
| 1 Vehicle | 401 (24.4%) | 220 (15.7%) |
| 2 Vehicles | 634 (38.6%) | 538 (38.4%) |
| 3 Vehicles | 426 (25.9%) | 433 (30.9%) |
| 4 Vehicles | 134 (8.2%) | 111 (7.9%) |
| 5 or more Vehicles | 27 (1.6%) | 78 (5.6%) |
| Total | 1,642 (100.0%) | 1,400 (100.0%) |
Commute Time in St Rose
The most frequently occuring commute durations in St Rose are 20 to 24 minutes (552 commuters, 19.5%), 30 to 34 minutes (481 commuters, 17.0%), and 45 to 59 minutes (392 commuters, 13.9%).
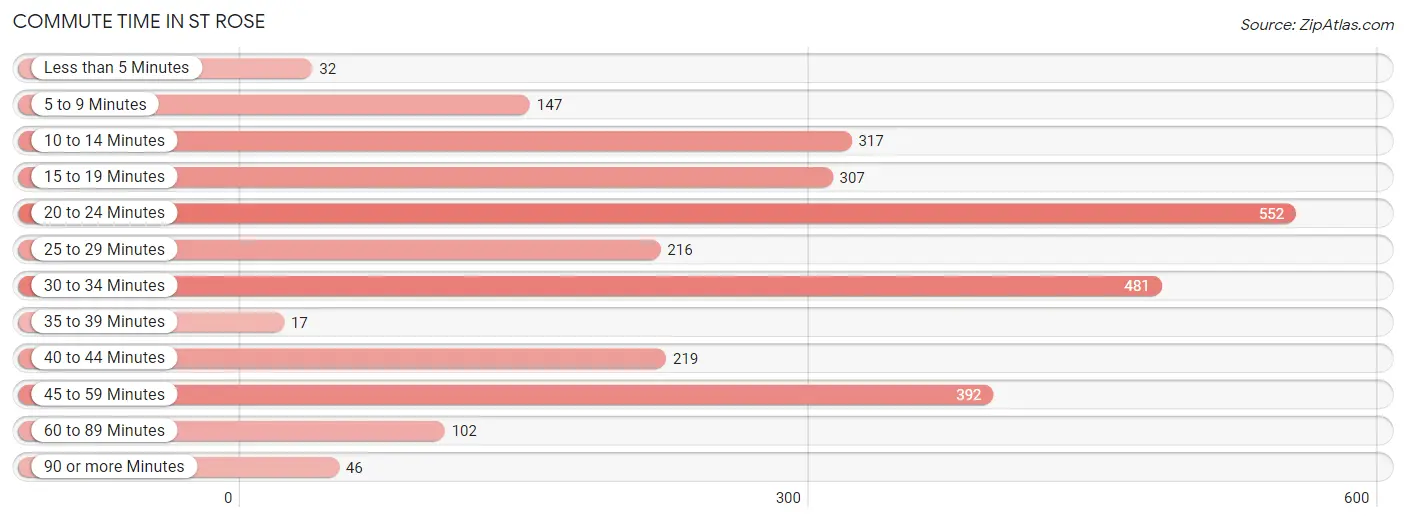
| Commute Time | # Commuters | % Commuters |
| Less than 5 Minutes | 32 | 1.1% |
| 5 to 9 Minutes | 147 | 5.2% |
| 10 to 14 Minutes | 317 | 11.2% |
| 15 to 19 Minutes | 307 | 10.9% |
| 20 to 24 Minutes | 552 | 19.5% |
| 25 to 29 Minutes | 216 | 7.6% |
| 30 to 34 Minutes | 481 | 17.0% |
| 35 to 39 Minutes | 17 | 0.6% |
| 40 to 44 Minutes | 219 | 7.7% |
| 45 to 59 Minutes | 392 | 13.9% |
| 60 to 89 Minutes | 102 | 3.6% |
| 90 or more Minutes | 46 | 1.6% |
Commute Time by Sex in St Rose
The most common commute times in St Rose are 10 to 14 minutes (258 commuters, 16.4%) for males and 20 to 24 minutes (318 commuters, 25.3%) for females.
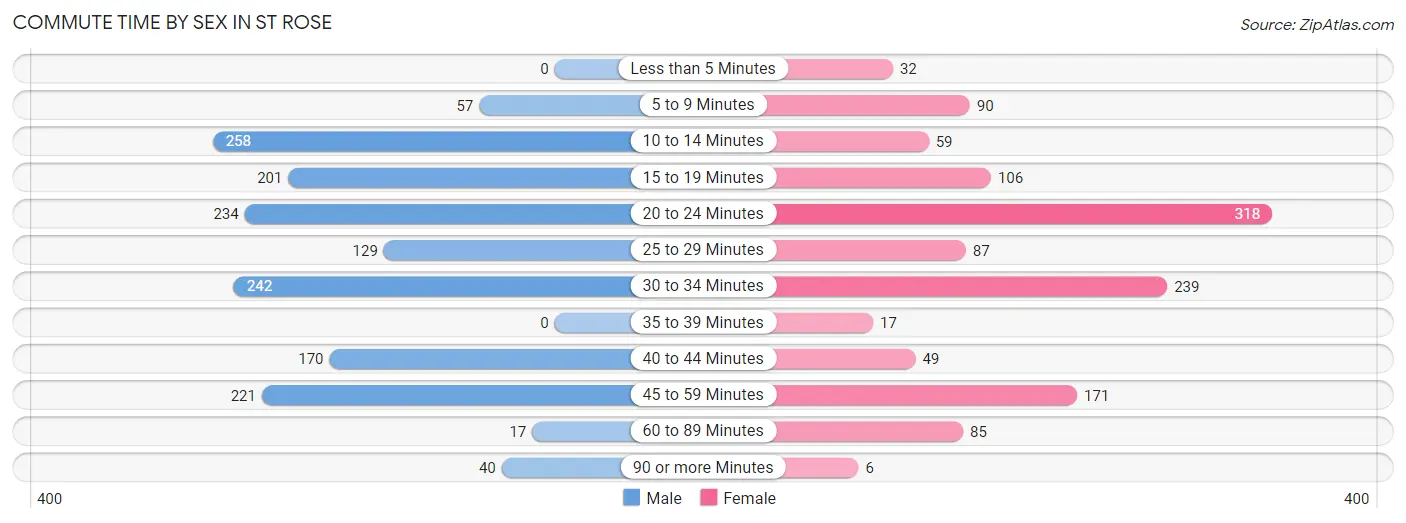
| Commute Time | Male | Female |
| Less than 5 Minutes | 0 (0.0%) | 32 (2.5%) |
| 5 to 9 Minutes | 57 (3.6%) | 90 (7.1%) |
| 10 to 14 Minutes | 258 (16.4%) | 59 (4.7%) |
| 15 to 19 Minutes | 201 (12.8%) | 106 (8.4%) |
| 20 to 24 Minutes | 234 (14.9%) | 318 (25.3%) |
| 25 to 29 Minutes | 129 (8.2%) | 87 (6.9%) |
| 30 to 34 Minutes | 242 (15.4%) | 239 (19.0%) |
| 35 to 39 Minutes | 0 (0.0%) | 17 (1.3%) |
| 40 to 44 Minutes | 170 (10.8%) | 49 (3.9%) |
| 45 to 59 Minutes | 221 (14.1%) | 171 (13.6%) |
| 60 to 89 Minutes | 17 (1.1%) | 85 (6.8%) |
| 90 or more Minutes | 40 (2.5%) | 6 (0.5%) |
Time of Departure to Work by Sex in St Rose
The most frequent times of departure to work in St Rose are 7:00 AM to 7:29 AM (306, 19.5%) for males and 7:00 AM to 7:29 AM (251, 19.9%) for females.
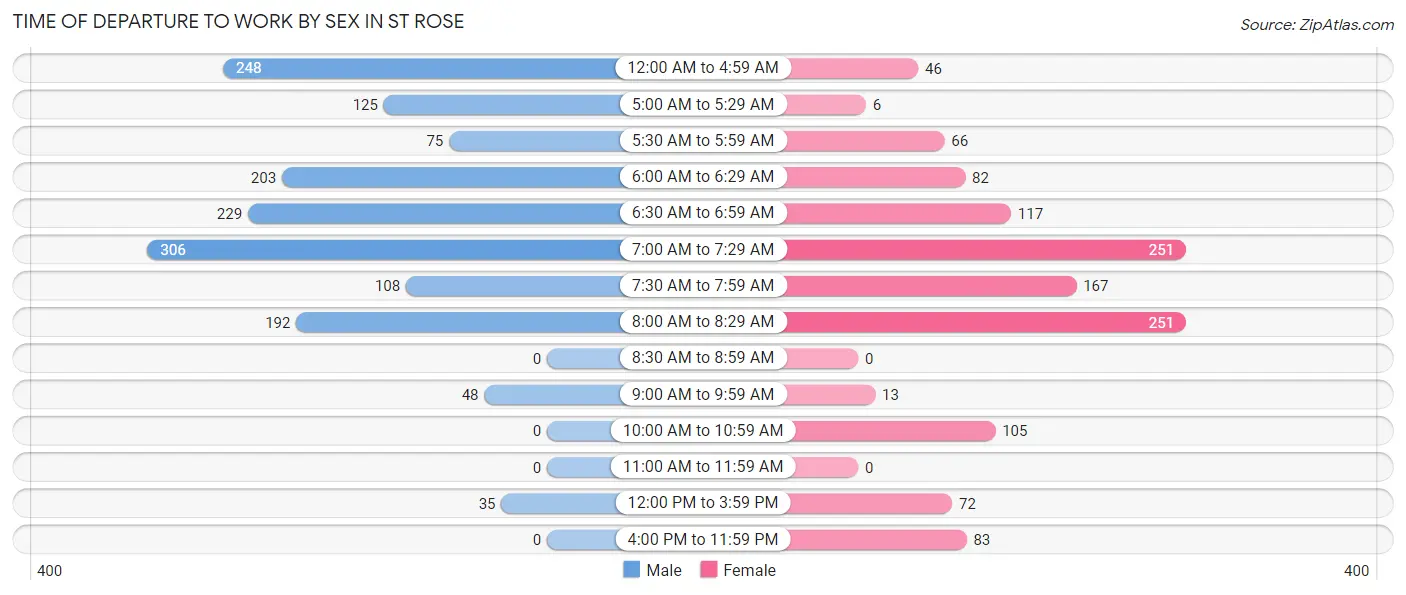
| Time of Departure | Male | Female |
| 12:00 AM to 4:59 AM | 248 (15.8%) | 46 (3.6%) |
| 5:00 AM to 5:29 AM | 125 (8.0%) | 6 (0.5%) |
| 5:30 AM to 5:59 AM | 75 (4.8%) | 66 (5.2%) |
| 6:00 AM to 6:29 AM | 203 (12.9%) | 82 (6.5%) |
| 6:30 AM to 6:59 AM | 229 (14.6%) | 117 (9.3%) |
| 7:00 AM to 7:29 AM | 306 (19.5%) | 251 (19.9%) |
| 7:30 AM to 7:59 AM | 108 (6.9%) | 167 (13.3%) |
| 8:00 AM to 8:29 AM | 192 (12.2%) | 251 (19.9%) |
| 8:30 AM to 8:59 AM | 0 (0.0%) | 0 (0.0%) |
| 9:00 AM to 9:59 AM | 48 (3.1%) | 13 (1.0%) |
| 10:00 AM to 10:59 AM | 0 (0.0%) | 105 (8.3%) |
| 11:00 AM to 11:59 AM | 0 (0.0%) | 0 (0.0%) |
| 12:00 PM to 3:59 PM | 35 (2.2%) | 72 (5.7%) |
| 4:00 PM to 11:59 PM | 0 (0.0%) | 83 (6.6%) |
| Total | 1,569 (100.0%) | 1,259 (100.0%) |
Housing Occupancy in St Rose
Occupancy by Ownership in St Rose
Of the total 2,675 dwellings in St Rose, owner-occupied units account for 2,067 (77.3%), while renter-occupied units make up 608 (22.7%).
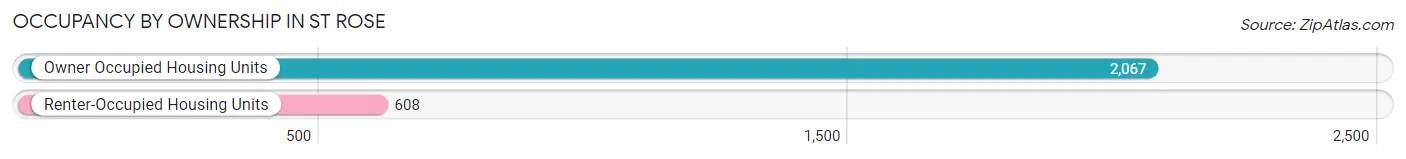
| Occupancy | # Housing Units | % Housing Units |
| Owner Occupied Housing Units | 2,067 | 77.3% |
| Renter-Occupied Housing Units | 608 | 22.7% |
| Total Occupied Housing Units | 2,675 | 100.0% |
Occupancy by Household Size in St Rose
| Household Size | # Housing Units | % Housing Units |
| 1-Person Household | 882 | 33.0% |
| 2-Person Household | 814 | 30.4% |
| 3-Person Household | 461 | 17.2% |
| 4+ Person Household | 518 | 19.4% |
| Total Housing Units | 2,675 | 100.0% |
Occupancy by Ownership by Household Size in St Rose
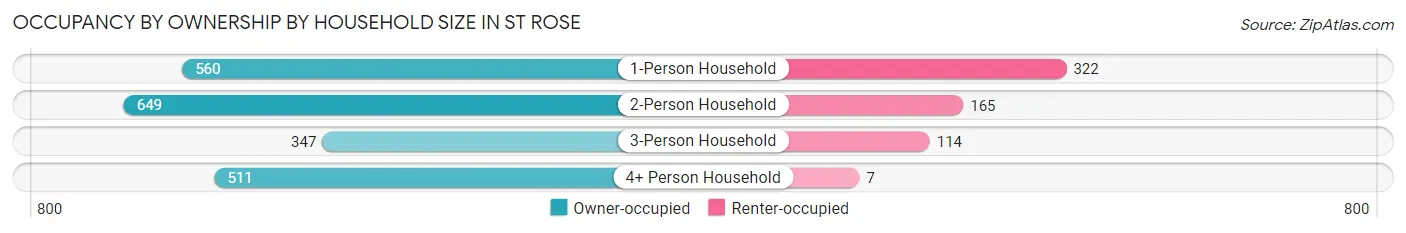
| Household Size | Owner-occupied | Renter-occupied |
| 1-Person Household | 560 (63.5%) | 322 (36.5%) |
| 2-Person Household | 649 (79.7%) | 165 (20.3%) |
| 3-Person Household | 347 (75.3%) | 114 (24.7%) |
| 4+ Person Household | 511 (98.7%) | 7 (1.3%) |
| Total Housing Units | 2,067 (77.3%) | 608 (22.7%) |
Occupancy by Educational Attainment in St Rose
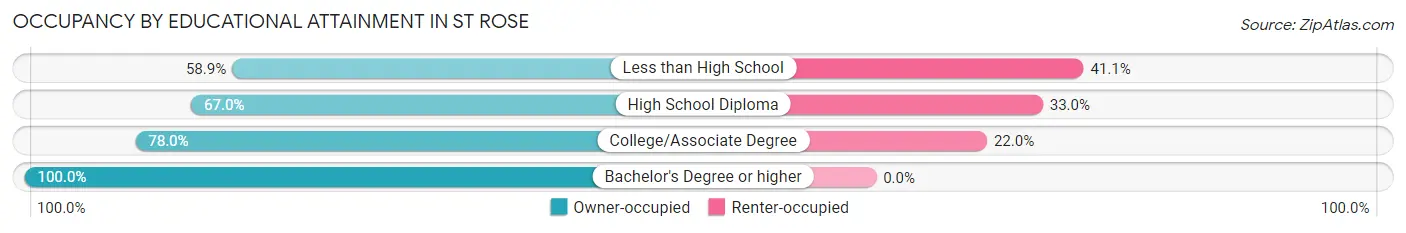
| Household Size | Owner-occupied | Renter-occupied |
| Less than High School | 189 (58.9%) | 132 (41.1%) |
| High School Diploma | 590 (67.0%) | 291 (33.0%) |
| College/Associate Degree | 657 (78.0%) | 185 (22.0%) |
| Bachelor's Degree or higher | 631 (100.0%) | 0 (0.0%) |
Occupancy by Age of Householder in St Rose
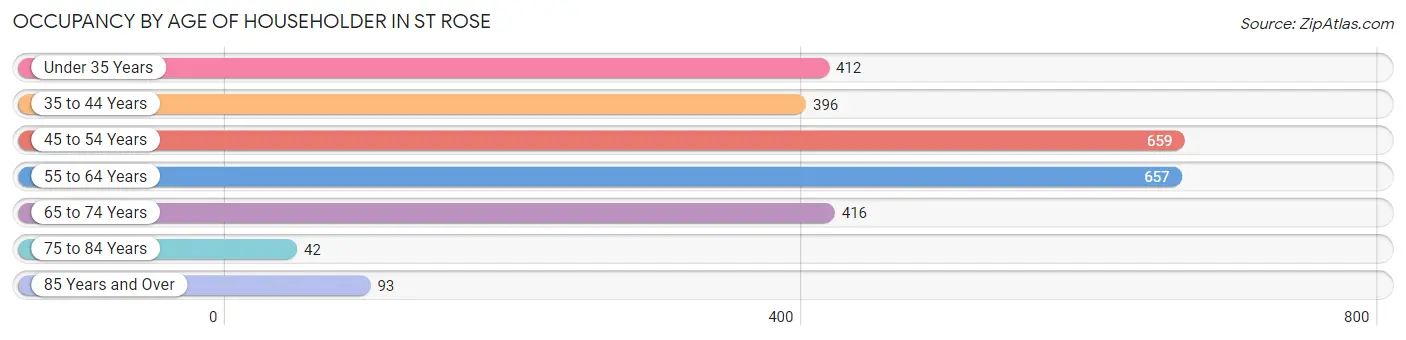
| Age Bracket | # Households | % Households |
| Under 35 Years | 412 | 15.4% |
| 35 to 44 Years | 396 | 14.8% |
| 45 to 54 Years | 659 | 24.6% |
| 55 to 64 Years | 657 | 24.6% |
| 65 to 74 Years | 416 | 15.5% |
| 75 to 84 Years | 42 | 1.6% |
| 85 Years and Over | 93 | 3.5% |
| Total | 2,675 | 100.0% |
Housing Finances in St Rose
Median Income by Occupancy in St Rose
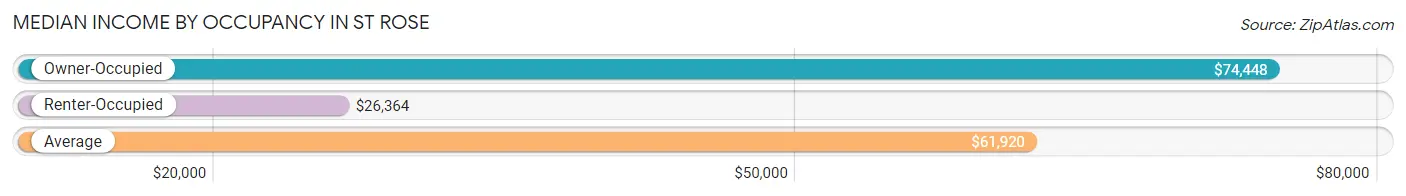
| Occupancy Type | # Households | Median Income |
| Owner-Occupied | 2,067 (77.3%) | $74,448 |
| Renter-Occupied | 608 (22.7%) | $26,364 |
| Average | 2,675 (100.0%) | $61,920 |
Occupancy by Householder Income Bracket in St Rose
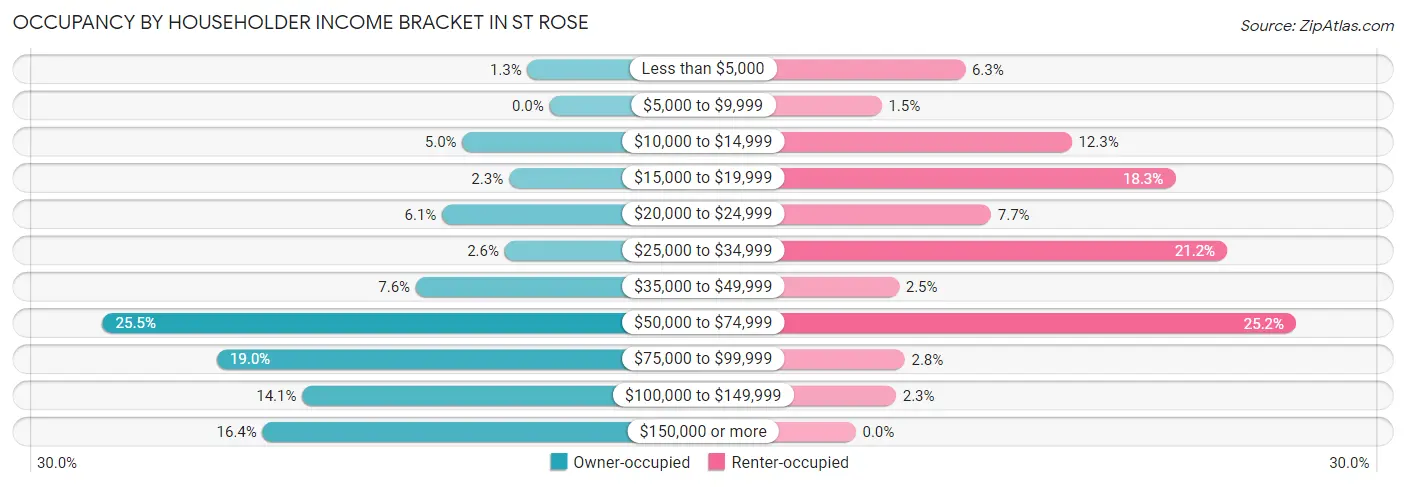
| Income Bracket | Owner-occupied | Renter-occupied |
| Less than $5,000 | 26 (1.3%) | 38 (6.2%) |
| $5,000 to $9,999 | 0 (0.0%) | 9 (1.5%) |
| $10,000 to $14,999 | 103 (5.0%) | 75 (12.3%) |
| $15,000 to $19,999 | 48 (2.3%) | 111 (18.3%) |
| $20,000 to $24,999 | 127 (6.1%) | 47 (7.7%) |
| $25,000 to $34,999 | 53 (2.6%) | 129 (21.2%) |
| $35,000 to $49,999 | 158 (7.6%) | 15 (2.5%) |
| $50,000 to $74,999 | 528 (25.5%) | 153 (25.2%) |
| $75,000 to $99,999 | 393 (19.0%) | 17 (2.8%) |
| $100,000 to $149,999 | 292 (14.1%) | 14 (2.3%) |
| $150,000 or more | 339 (16.4%) | 0 (0.0%) |
| Total | 2,067 (100.0%) | 608 (100.0%) |
Monthly Housing Cost Tiers in St Rose
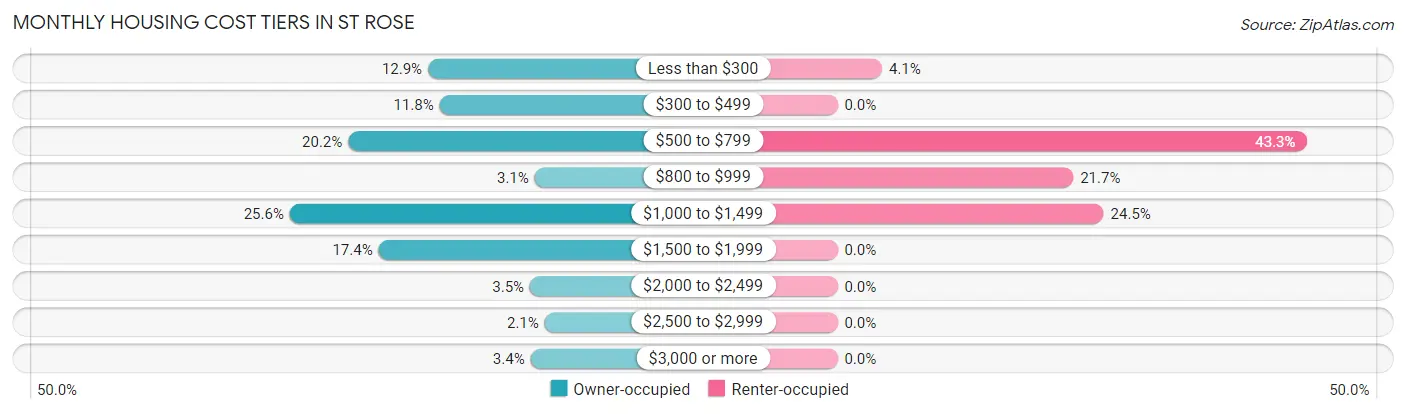
| Monthly Cost | Owner-occupied | Renter-occupied |
| Less than $300 | 266 (12.9%) | 25 (4.1%) |
| $300 to $499 | 244 (11.8%) | 0 (0.0%) |
| $500 to $799 | 418 (20.2%) | 263 (43.3%) |
| $800 to $999 | 63 (3.0%) | 132 (21.7%) |
| $1,000 to $1,499 | 529 (25.6%) | 149 (24.5%) |
| $1,500 to $1,999 | 360 (17.4%) | 0 (0.0%) |
| $2,000 to $2,499 | 72 (3.5%) | 0 (0.0%) |
| $2,500 to $2,999 | 44 (2.1%) | 0 (0.0%) |
| $3,000 or more | 71 (3.4%) | 0 (0.0%) |
| Total | 2,067 (100.0%) | 608 (100.0%) |
Physical Housing Characteristics in St Rose
Housing Structures in St Rose
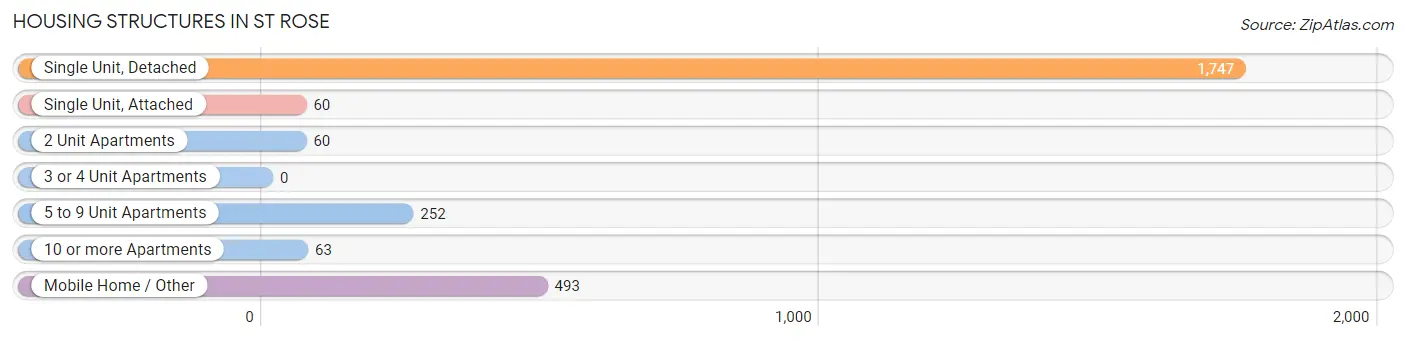
| Structure Type | # Housing Units | % Housing Units |
| Single Unit, Detached | 1,747 | 65.3% |
| Single Unit, Attached | 60 | 2.2% |
| 2 Unit Apartments | 60 | 2.2% |
| 3 or 4 Unit Apartments | 0 | 0.0% |
| 5 to 9 Unit Apartments | 252 | 9.4% |
| 10 or more Apartments | 63 | 2.4% |
| Mobile Home / Other | 493 | 18.4% |
| Total | 2,675 | 100.0% |
Housing Structures by Occupancy in St Rose
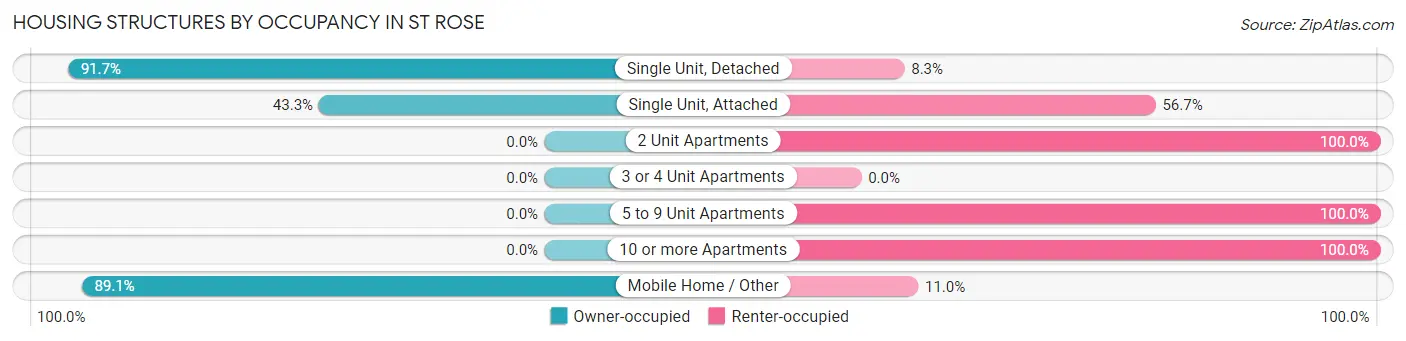
| Structure Type | Owner-occupied | Renter-occupied |
| Single Unit, Detached | 1,602 (91.7%) | 145 (8.3%) |
| Single Unit, Attached | 26 (43.3%) | 34 (56.7%) |
| 2 Unit Apartments | 0 (0.0%) | 60 (100.0%) |
| 3 or 4 Unit Apartments | 0 (0.0%) | 0 (0.0%) |
| 5 to 9 Unit Apartments | 0 (0.0%) | 252 (100.0%) |
| 10 or more Apartments | 0 (0.0%) | 63 (100.0%) |
| Mobile Home / Other | 439 (89.0%) | 54 (11.0%) |
| Total | 2,067 (77.3%) | 608 (22.7%) |
Housing Structures by Number of Rooms in St Rose
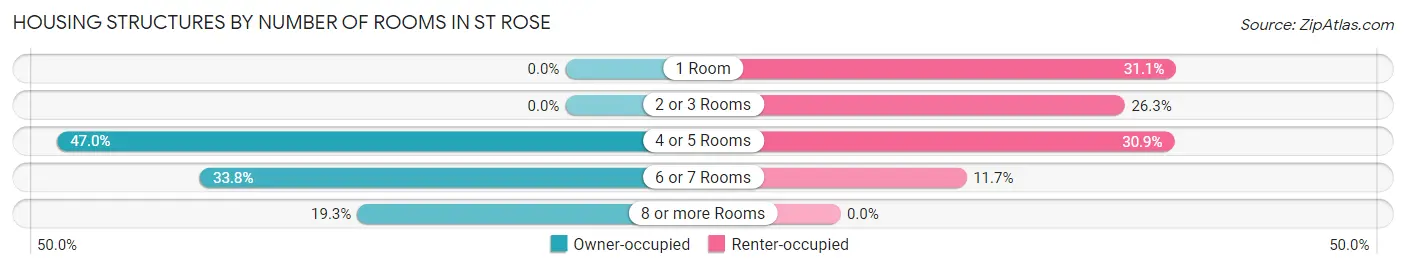
| Number of Rooms | Owner-occupied | Renter-occupied |
| 1 Room | 0 (0.0%) | 189 (31.1%) |
| 2 or 3 Rooms | 0 (0.0%) | 160 (26.3%) |
| 4 or 5 Rooms | 971 (47.0%) | 188 (30.9%) |
| 6 or 7 Rooms | 698 (33.8%) | 71 (11.7%) |
| 8 or more Rooms | 398 (19.3%) | 0 (0.0%) |
| Total | 2,067 (100.0%) | 608 (100.0%) |
Housing Structure by Heating Type in St Rose
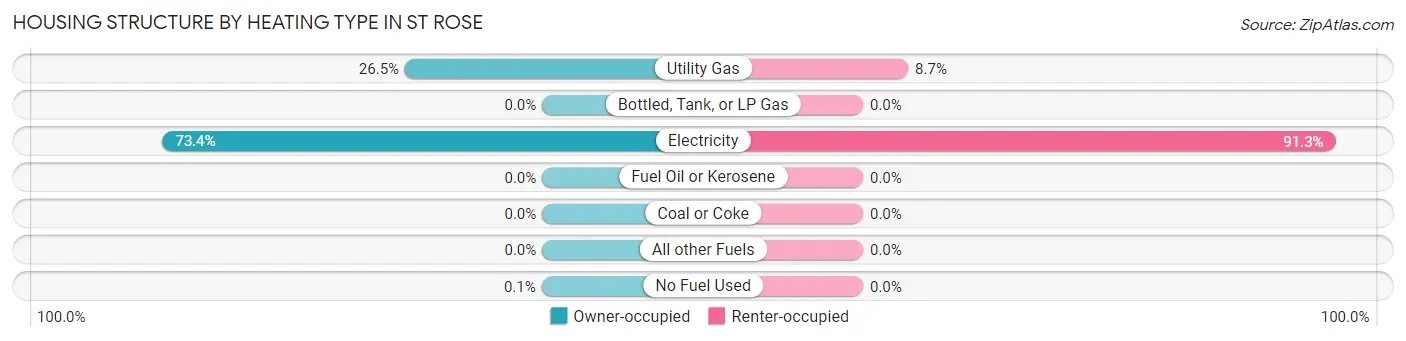
| Heating Type | Owner-occupied | Renter-occupied |
| Utility Gas | 548 (26.5%) | 53 (8.7%) |
| Bottled, Tank, or LP Gas | 0 (0.0%) | 0 (0.0%) |
| Electricity | 1,517 (73.4%) | 555 (91.3%) |
| Fuel Oil or Kerosene | 0 (0.0%) | 0 (0.0%) |
| Coal or Coke | 0 (0.0%) | 0 (0.0%) |
| All other Fuels | 0 (0.0%) | 0 (0.0%) |
| No Fuel Used | 2 (0.1%) | 0 (0.0%) |
| Total | 2,067 (100.0%) | 608 (100.0%) |
Household Vehicle Usage in St Rose
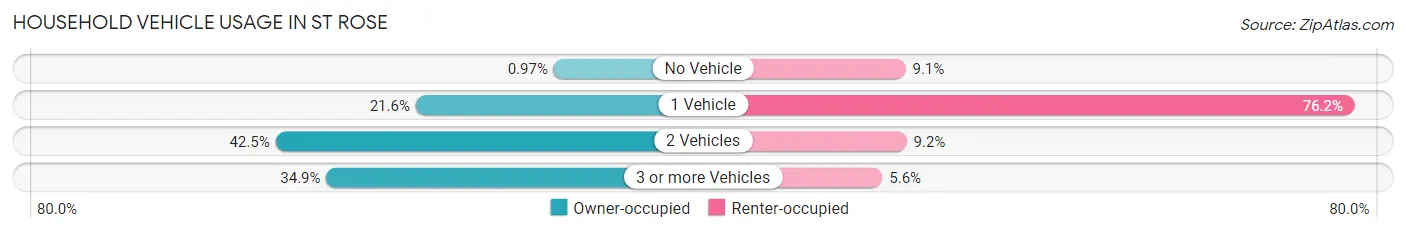
| Vehicles per Household | Owner-occupied | Renter-occupied |
| No Vehicle | 20 (1.0%) | 55 (9.0%) |
| 1 Vehicle | 446 (21.6%) | 463 (76.1%) |
| 2 Vehicles | 879 (42.5%) | 56 (9.2%) |
| 3 or more Vehicles | 722 (34.9%) | 34 (5.6%) |
| Total | 2,067 (100.0%) | 608 (100.0%) |
Real Estate & Mortgages in St Rose
Real Estate and Mortgage Overview in St Rose
| Characteristic | Without Mortgage | With Mortgage |
| Housing Units | 936 | 1,131 |
| Median Property Value | $135,900 | $229,100 |
| Median Household Income | $61,902 | $188 |
| Monthly Housing Costs | $486 | $71 |
| Real Estate Taxes | $700 | $80 |
Property Value by Mortgage Status in St Rose
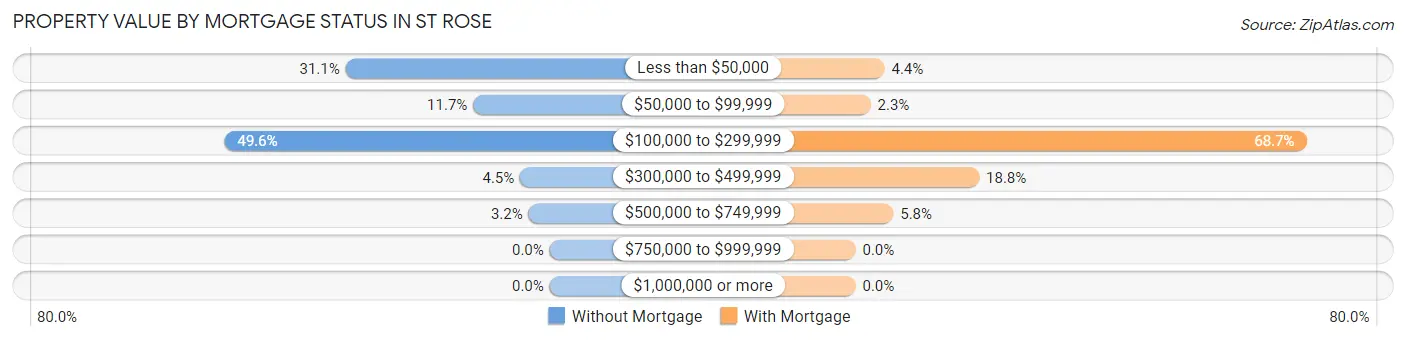
| Property Value | Without Mortgage | With Mortgage |
| Less than $50,000 | 291 (31.1%) | 50 (4.4%) |
| $50,000 to $99,999 | 109 (11.7%) | 26 (2.3%) |
| $100,000 to $299,999 | 464 (49.6%) | 777 (68.7%) |
| $300,000 to $499,999 | 42 (4.5%) | 213 (18.8%) |
| $500,000 to $749,999 | 30 (3.2%) | 65 (5.8%) |
| $750,000 to $999,999 | 0 (0.0%) | 0 (0.0%) |
| $1,000,000 or more | 0 (0.0%) | 0 (0.0%) |
| Total | 936 (100.0%) | 1,131 (100.0%) |
Household Income by Mortgage Status in St Rose
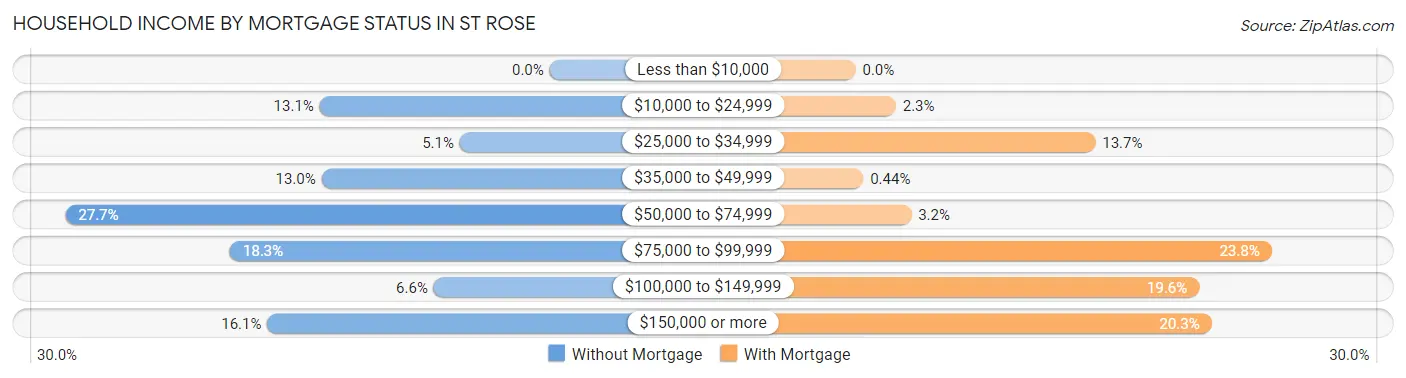
| Household Income | Without Mortgage | With Mortgage |
| Less than $10,000 | 0 (0.0%) | 0 (0.0%) |
| $10,000 to $24,999 | 123 (13.1%) | 26 (2.3%) |
| $25,000 to $34,999 | 48 (5.1%) | 155 (13.7%) |
| $35,000 to $49,999 | 122 (13.0%) | 5 (0.4%) |
| $50,000 to $74,999 | 259 (27.7%) | 36 (3.2%) |
| $75,000 to $99,999 | 171 (18.3%) | 269 (23.8%) |
| $100,000 to $149,999 | 62 (6.6%) | 222 (19.6%) |
| $150,000 or more | 151 (16.1%) | 230 (20.3%) |
| Total | 936 (100.0%) | 1,131 (100.0%) |
Property Value to Household Income Ratio in St Rose
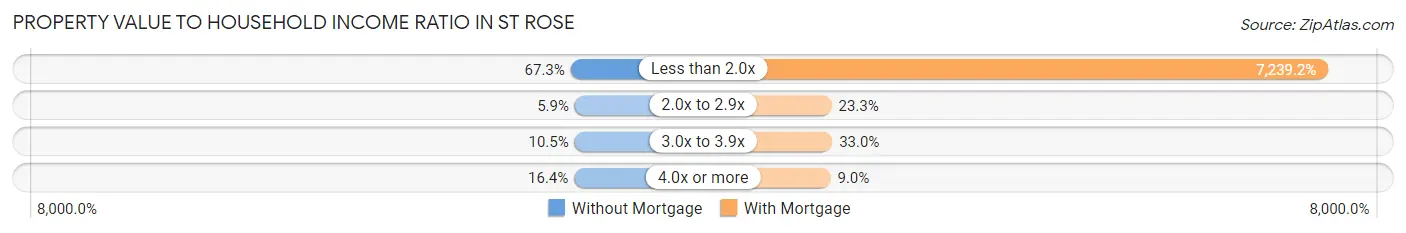
| Value-to-Income Ratio | Without Mortgage | With Mortgage |
| Less than 2.0x | 630 (67.3%) | 81,875 (7,239.2%) |
| 2.0x to 2.9x | 55 (5.9%) | 264 (23.3%) |
| 3.0x to 3.9x | 98 (10.5%) | 373 (33.0%) |
| 4.0x or more | 153 (16.4%) | 102 (9.0%) |
| Total | 936 (100.0%) | 1,131 (100.0%) |
Real Estate Taxes by Mortgage Status in St Rose
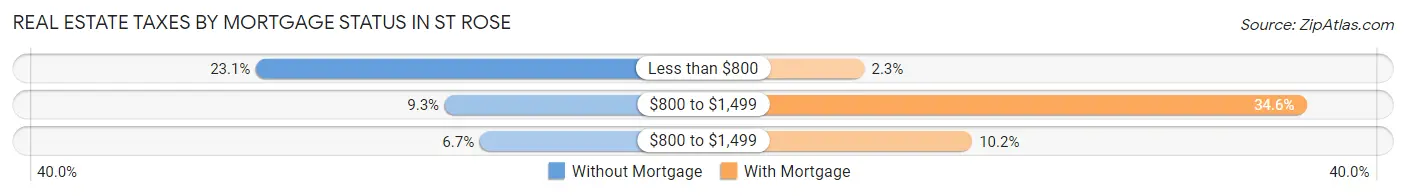
| Property Taxes | Without Mortgage | With Mortgage |
| Less than $800 | 216 (23.1%) | 26 (2.3%) |
| $800 to $1,499 | 87 (9.3%) | 391 (34.6%) |
| $800 to $1,499 | 63 (6.7%) | 115 (10.2%) |
| Total | 936 (100.0%) | 1,131 (100.0%) |
Health & Disability in St Rose
Health Insurance Coverage by Age in St Rose
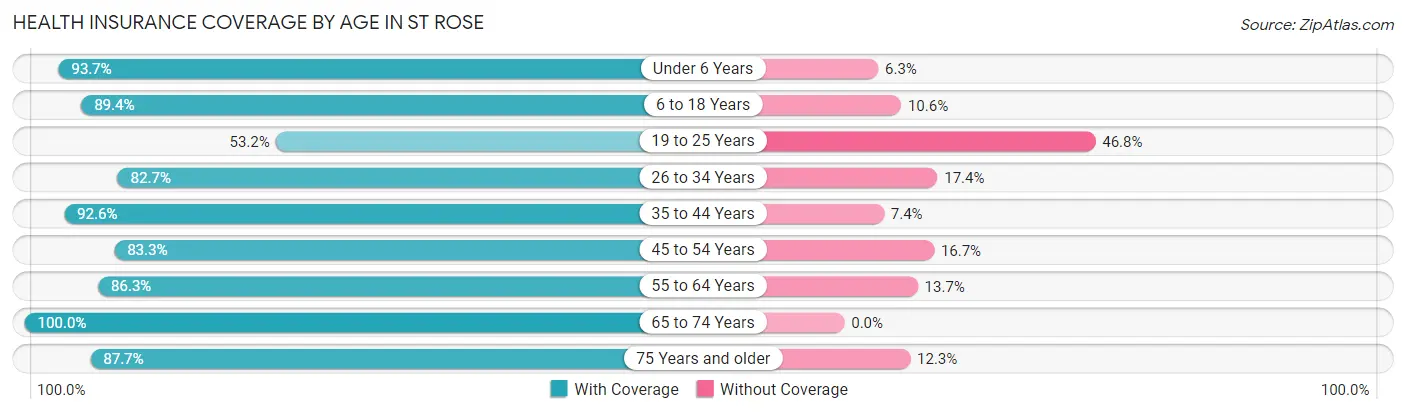
| Age Bracket | With Coverage | Without Coverage |
| Under 6 Years | 431 (93.7%) | 29 (6.3%) |
| 6 to 18 Years | 1,295 (89.4%) | 153 (10.6%) |
| 19 to 25 Years | 308 (53.2%) | 271 (46.8%) |
| 26 to 34 Years | 843 (82.7%) | 177 (17.3%) |
| 35 to 44 Years | 590 (92.6%) | 47 (7.4%) |
| 45 to 54 Years | 966 (83.3%) | 194 (16.7%) |
| 55 to 64 Years | 978 (86.3%) | 155 (13.7%) |
| 65 to 74 Years | 806 (100.0%) | 0 (0.0%) |
| 75 Years and older | 193 (87.7%) | 27 (12.3%) |
| Total | 6,410 (85.9%) | 1,053 (14.1%) |
Health Insurance Coverage by Citizenship Status in St Rose
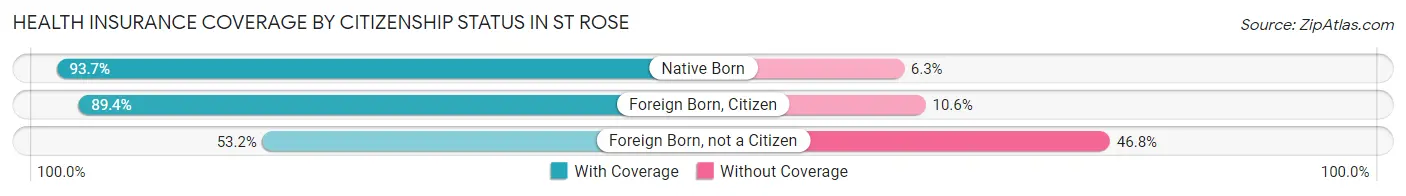
| Citizenship Status | With Coverage | Without Coverage |
| Native Born | 431 (93.7%) | 29 (6.3%) |
| Foreign Born, Citizen | 1,295 (89.4%) | 153 (10.6%) |
| Foreign Born, not a Citizen | 308 (53.2%) | 271 (46.8%) |
Health Insurance Coverage by Household Income in St Rose
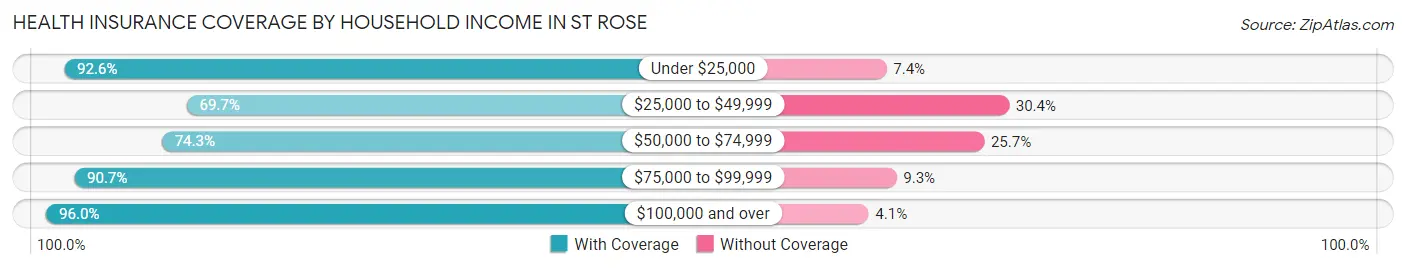
| Household Income | With Coverage | Without Coverage |
| Under $25,000 | 725 (92.6%) | 58 (7.4%) |
| $25,000 to $49,999 | 521 (69.7%) | 227 (30.3%) |
| $50,000 to $74,999 | 1,657 (74.3%) | 573 (25.7%) |
| $75,000 to $99,999 | 782 (90.7%) | 80 (9.3%) |
| $100,000 and over | 2,725 (96.0%) | 115 (4.1%) |
Public vs Private Health Insurance Coverage by Age in St Rose
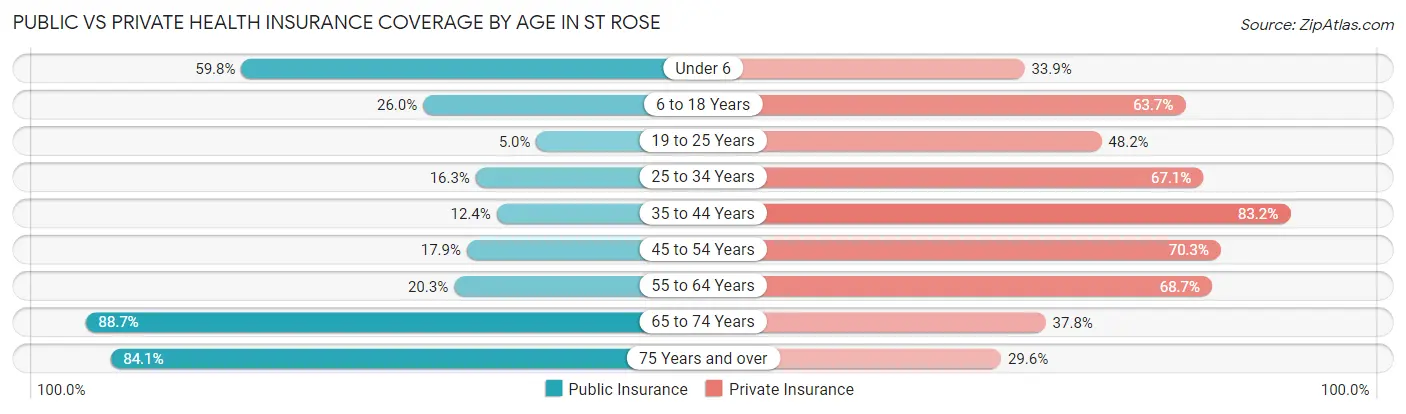
| Age Bracket | Public Insurance | Private Insurance |
| Under 6 | 275 (59.8%) | 156 (33.9%) |
| 6 to 18 Years | 377 (26.0%) | 923 (63.7%) |
| 19 to 25 Years | 29 (5.0%) | 279 (48.2%) |
| 25 to 34 Years | 166 (16.3%) | 684 (67.1%) |
| 35 to 44 Years | 79 (12.4%) | 530 (83.2%) |
| 45 to 54 Years | 208 (17.9%) | 816 (70.3%) |
| 55 to 64 Years | 230 (20.3%) | 778 (68.7%) |
| 65 to 74 Years | 715 (88.7%) | 305 (37.8%) |
| 75 Years and over | 185 (84.1%) | 65 (29.5%) |
| Total | 2,264 (30.3%) | 4,536 (60.8%) |
Disability Status by Sex by Age in St Rose
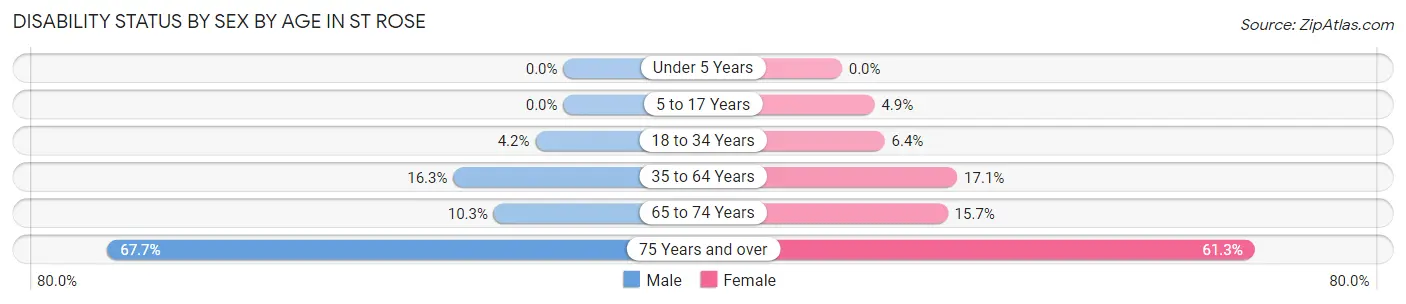
| Age Bracket | Male | Female |
| Under 5 Years | 0 (0.0%) | 0 (0.0%) |
| 5 to 17 Years | 0 (0.0%) | 44 (4.9%) |
| 18 to 34 Years | 30 (4.2%) | 61 (6.4%) |
| 35 to 64 Years | 225 (16.3%) | 266 (17.1%) |
| 65 to 74 Years | 34 (10.3%) | 75 (15.7%) |
| 75 Years and over | 86 (67.7%) | 57 (61.3%) |
Disability Class by Sex by Age in St Rose
Disability Class: Hearing Difficulty
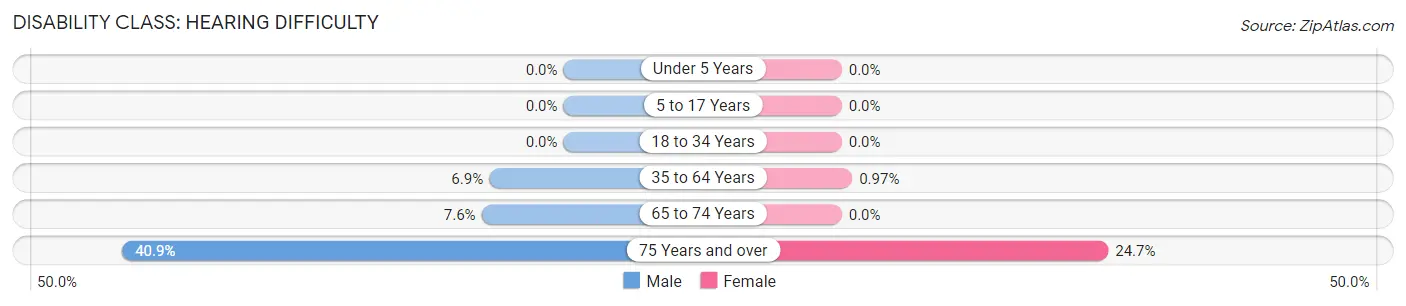
| Age Bracket | Male | Female |
| Under 5 Years | 0 (0.0%) | 0 (0.0%) |
| 5 to 17 Years | 0 (0.0%) | 0 (0.0%) |
| 18 to 34 Years | 0 (0.0%) | 0 (0.0%) |
| 35 to 64 Years | 95 (6.9%) | 15 (1.0%) |
| 65 to 74 Years | 25 (7.6%) | 0 (0.0%) |
| 75 Years and over | 52 (40.9%) | 23 (24.7%) |
Disability Class: Vision Difficulty
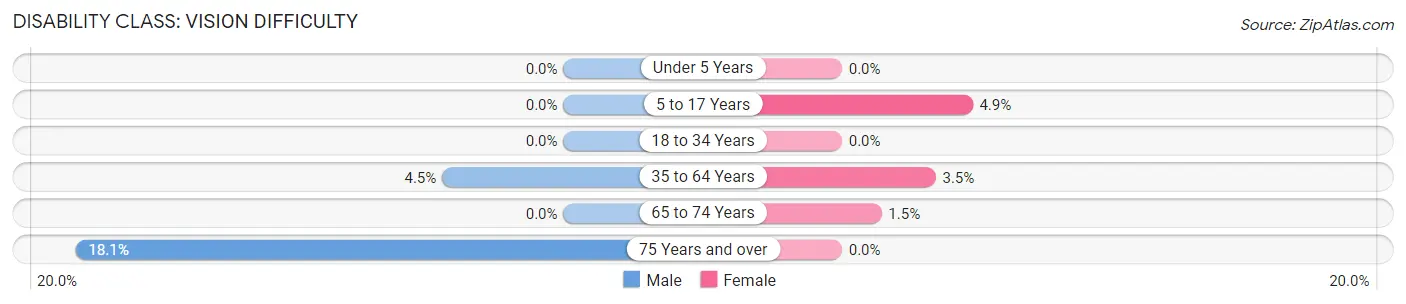
| Age Bracket | Male | Female |
| Under 5 Years | 0 (0.0%) | 0 (0.0%) |
| 5 to 17 Years | 0 (0.0%) | 44 (4.9%) |
| 18 to 34 Years | 0 (0.0%) | 0 (0.0%) |
| 35 to 64 Years | 62 (4.5%) | 54 (3.5%) |
| 65 to 74 Years | 0 (0.0%) | 7 (1.5%) |
| 75 Years and over | 23 (18.1%) | 0 (0.0%) |
Disability Class: Cognitive Difficulty
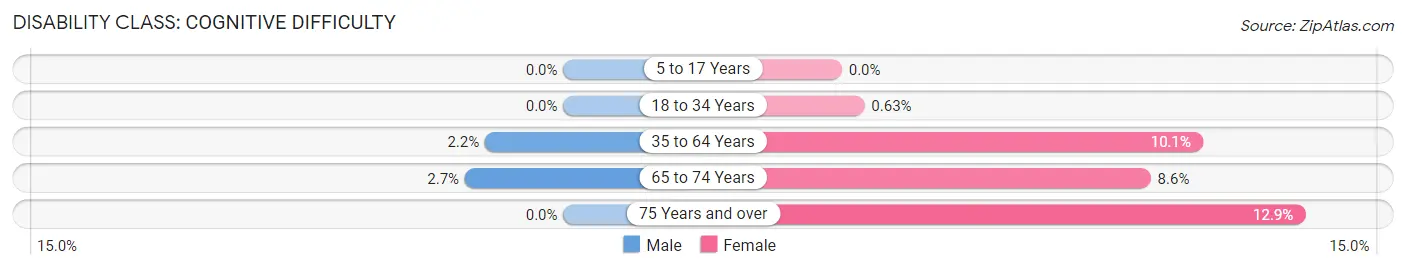
| Age Bracket | Male | Female |
| 5 to 17 Years | 0 (0.0%) | 0 (0.0%) |
| 18 to 34 Years | 0 (0.0%) | 6 (0.6%) |
| 35 to 64 Years | 30 (2.2%) | 156 (10.1%) |
| 65 to 74 Years | 9 (2.7%) | 41 (8.6%) |
| 75 Years and over | 0 (0.0%) | 12 (12.9%) |
Disability Class: Ambulatory Difficulty
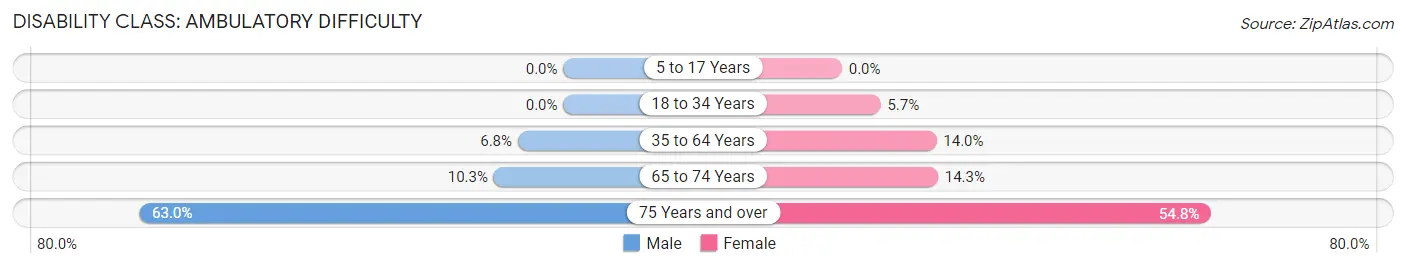
| Age Bracket | Male | Female |
| 5 to 17 Years | 0 (0.0%) | 0 (0.0%) |
| 18 to 34 Years | 0 (0.0%) | 55 (5.7%) |
| 35 to 64 Years | 93 (6.8%) | 218 (14.0%) |
| 65 to 74 Years | 34 (10.3%) | 68 (14.3%) |
| 75 Years and over | 80 (63.0%) | 51 (54.8%) |
Disability Class: Self-Care Difficulty
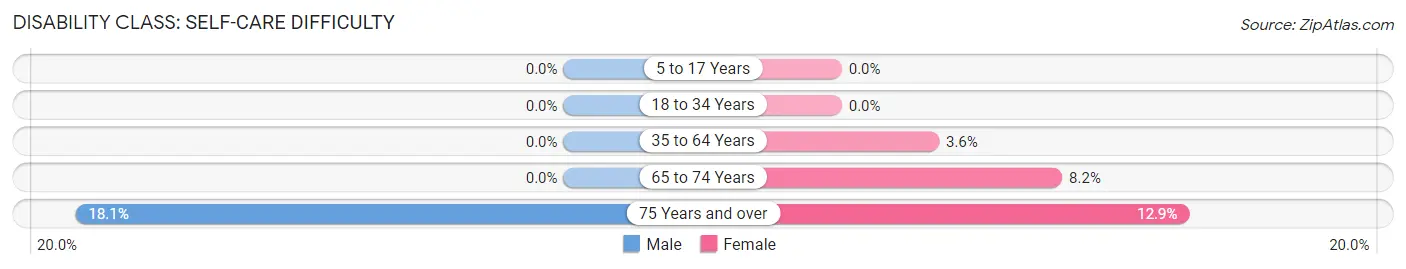
| Age Bracket | Male | Female |
| 5 to 17 Years | 0 (0.0%) | 0 (0.0%) |
| 18 to 34 Years | 0 (0.0%) | 0 (0.0%) |
| 35 to 64 Years | 0 (0.0%) | 56 (3.6%) |
| 65 to 74 Years | 0 (0.0%) | 39 (8.2%) |
| 75 Years and over | 23 (18.1%) | 12 (12.9%) |
Technology Access in St Rose
Computing Device Access in St Rose
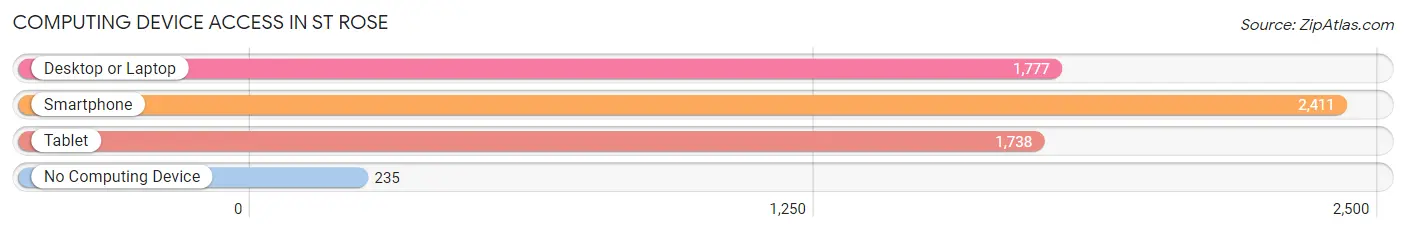
| Device Type | # Households | % Households |
| Desktop or Laptop | 1,777 | 66.4% |
| Smartphone | 2,411 | 90.1% |
| Tablet | 1,738 | 65.0% |
| No Computing Device | 235 | 8.8% |
| Total | 2,675 | 100.0% |
Internet Access in St Rose
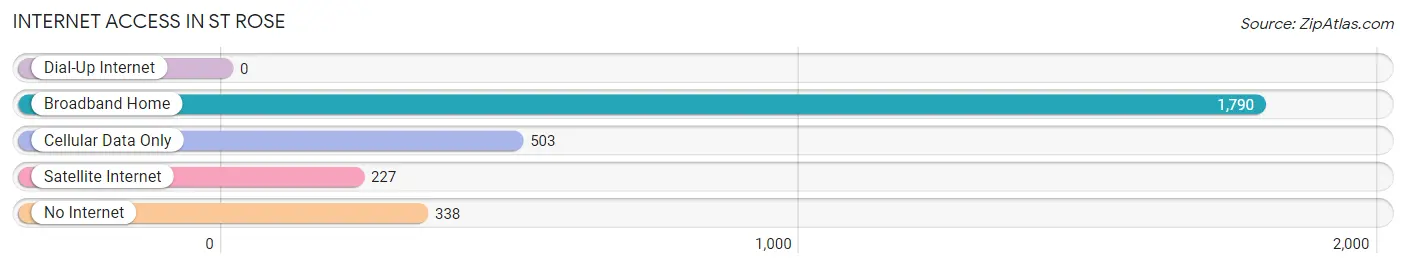
| Internet Type | # Households | % Households |
| Dial-Up Internet | 0 | 0.0% |
| Broadband Home | 1,790 | 66.9% |
| Cellular Data Only | 503 | 18.8% |
| Satellite Internet | 227 | 8.5% |
| No Internet | 338 | 12.6% |
| Total | 2,675 | 100.0% |
St Rose Summary
St. Rose is a small unincorporated community located in St. Charles Parish, Louisiana. It is situated along the Mississippi River, approximately 25 miles west of New Orleans. The population of St. Rose was estimated to be 2,845 in 2019.
History
St. Rose was founded in 1790 by French settlers who named it after the patron saint of France, St. Rose of Lima. The area was originally part of the German Coast, a settlement of German immigrants who had arrived in the area in the late 1700s. The area was also home to a large number of Acadian settlers who had been expelled from Nova Scotia in the mid-1700s.
The area was originally part of St. John the Baptist Parish, but in 1807 it was annexed to St. Charles Parish. The area was largely agricultural, with sugar cane and cotton being the main crops. The area was also home to a number of small businesses, including a sawmill, a gristmill, and a brickyard.
In the late 1800s, the area began to experience a period of growth and development. The St. Rose and Belle Chasse Railroad was built in 1883, connecting St. Rose to New Orleans. This allowed for the transportation of goods and people, and helped to spur economic growth in the area.
In the early 1900s, the area experienced a period of industrialization. The St. Rose Sugar Refinery was built in 1906, and the St. Rose Brickyard was established in 1910. These industries helped to create jobs and bring economic prosperity to the area.
Geography
St. Rose is located in St. Charles Parish, Louisiana, along the Mississippi River. It is situated approximately 25 miles west of New Orleans. The area is mostly flat, with some low hills in the area. The climate is humid subtropical, with hot, humid summers and mild winters.
Economy
The economy of St. Rose is largely based on agriculture and industry. The area is home to a number of agricultural businesses, including sugar cane and cotton farms. The St. Rose Sugar Refinery is one of the largest employers in the area, and the St. Rose Brickyard is also a major employer.
The area is also home to a number of small businesses, including restaurants, retail stores, and service providers. The area is also home to a number of manufacturing businesses, including a paper mill and a chemical plant.
Demographics
The population of St. Rose was estimated to be 2,845 in 2019. The population is largely white (77.3%), with African Americans (17.2%) and Hispanics (4.5%) making up the remainder of the population. The median household income in St. Rose is $50,945, and the median home value is $179,400. The unemployment rate in St. Rose is 4.2%.
Common Questions
What is the Total Population of St Rose?
Total Population of St Rose is 7,469.
What is the Total Male Population of St Rose?
Total Male Population of St Rose is 3,472.
What is the Total Female Population of St Rose?
Total Female Population of St Rose is 3,997.
What is the Ratio of Males per 100 Females in St Rose?
There are 86.87 Males per 100 Females in St Rose.
What is the Ratio of Females per 100 Males in St Rose?
There are 115.12 Females per 100 Males in St Rose.
What is the Median Population Age in St Rose?
Median Population Age in St Rose is 37.5 Years.
What is the Average Family Size in St Rose
Average Family Size in St Rose is 3.7 People.
What is the Average Household Size in St Rose
Average Household Size in St Rose is 2.8 People.
What is Per Capita Income in St Rose?
Per Capita income in St Rose is $29,595.
What is the Median Family Income in St Rose?
Median Family Income in St Rose is $80,774.
What is the Median Household income in St Rose?
Median Household Income in St Rose is $61,920.
What is Income or Wage Gap in St Rose?
Income or Wage Gap in St Rose is 39.4%.
Women in St Rose earn 60.6 cents for every dollar earned by a man.
What is Family Income Deficit in St Rose?
Family Income Deficit in St Rose is $12,116.
Families that are below poverty line in St Rose earn $12,116 less on average than the poverty threshold level.
What is Inequality or Gini Index in St Rose?
Inequality or Gini Index in St Rose is 0.42.
How Large is the Labor Force in St Rose?
There are 3,568 People in the Labor Forcein in St Rose.
What is the Percentage of People in the Labor Force in St Rose?
60.8% of People are in the Labor Force in St Rose.
What is the Unemployment Rate in St Rose?
Unemployment Rate in St Rose is 12.3%.