Baker, LA
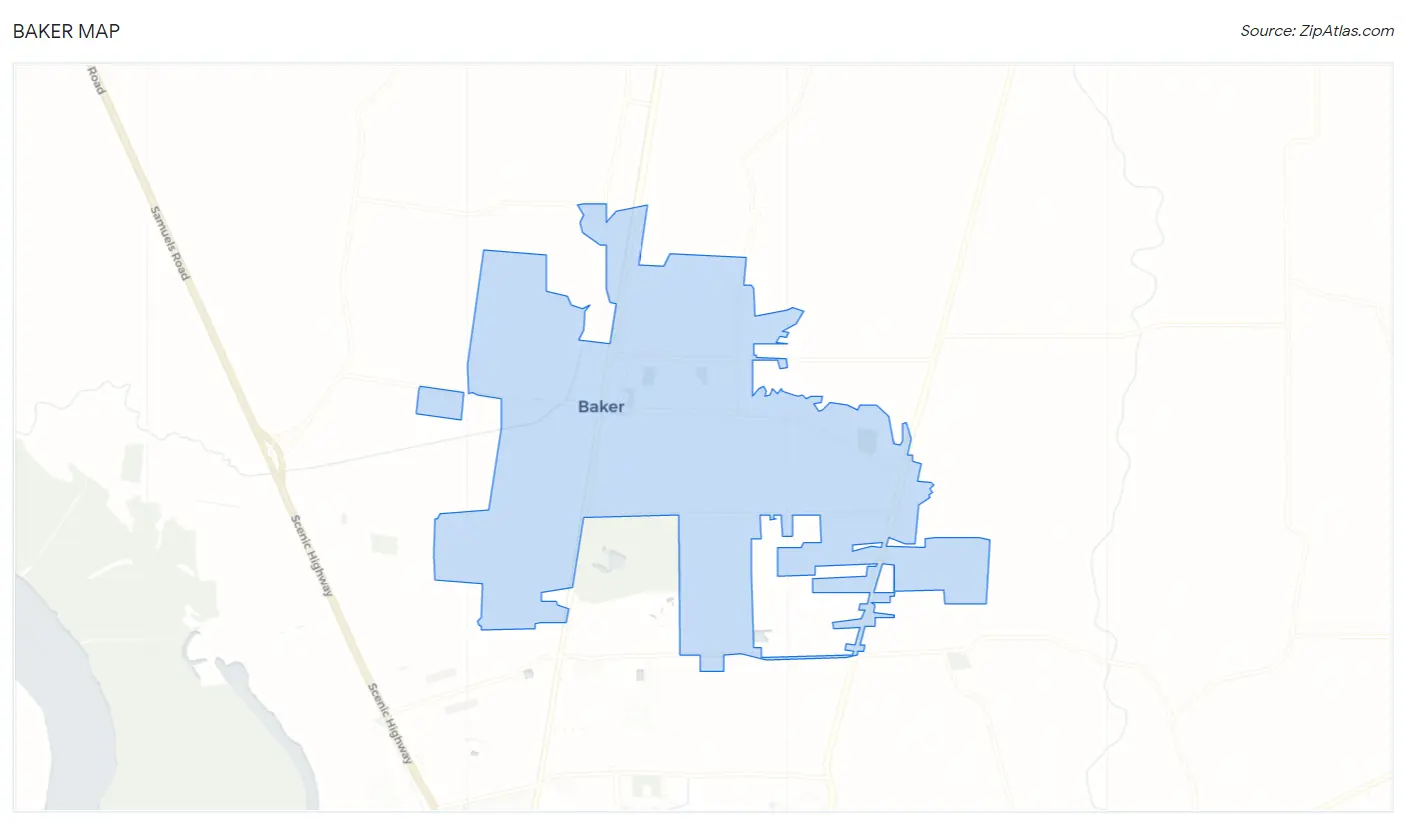
Baker Map
Baker Overview
12,463
TOTAL POPULATION
5,777
MALE POPULATION
6,686
FEMALE POPULATION
86.40
MALES / 100 FEMALES
115.73
FEMALES / 100 MALES
32.8
MEDIAN AGE
3.5
AVG FAMILY SIZE
2.9
AVG HOUSEHOLD SIZE
$26,252
PER CAPITA INCOME
$62,333
AVG FAMILY INCOME
$60,555
AVG HOUSEHOLD INCOME
14.4%
WAGE / INCOME GAP [ % ]
85.6¢/ $1
WAGE / INCOME GAP [ $ ]
0.39
INEQUALITY / GINI INDEX
6,650
LABOR FORCE [ PEOPLE ]
71.4%
PERCENT IN LABOR FORCE
12.6%
UNEMPLOYMENT RATE
Baker Zip Codes
Baker Area Codes
Race in Baker
The most populous races in Baker are Black / African American (10,890 | 87.4%), White / Caucasian (1,405 | 11.3%), and Two or more Races (135 | 1.1%).
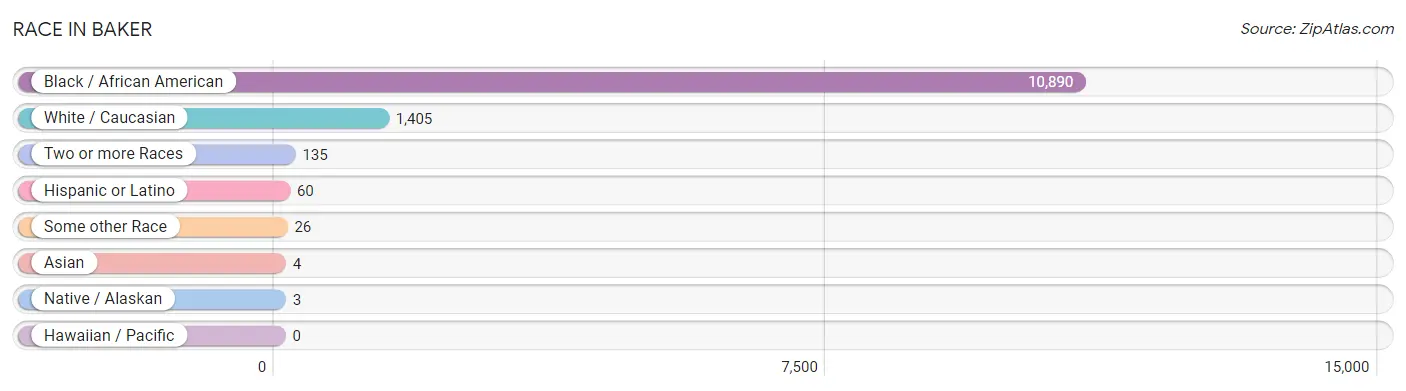
| Race | # Population | % Population |
| Asian | 4 | 0.0% |
| Black / African American | 10,890 | 87.4% |
| Hawaiian / Pacific | 0 | 0.0% |
| Hispanic or Latino | 60 | 0.5% |
| Native / Alaskan | 3 | 0.0% |
| White / Caucasian | 1,405 | 11.3% |
| Two or more Races | 135 | 1.1% |
| Some other Race | 26 | 0.2% |
| Total | 12,463 | 100.0% |
Ancestry in Baker
The most populous ancestries reported in Baker are American (463 | 3.7%), Subsaharan African (267 | 2.1%), French (247 | 2.0%), African (213 | 1.7%), and German (168 | 1.3%), together accounting for 10.9% of all Baker residents.
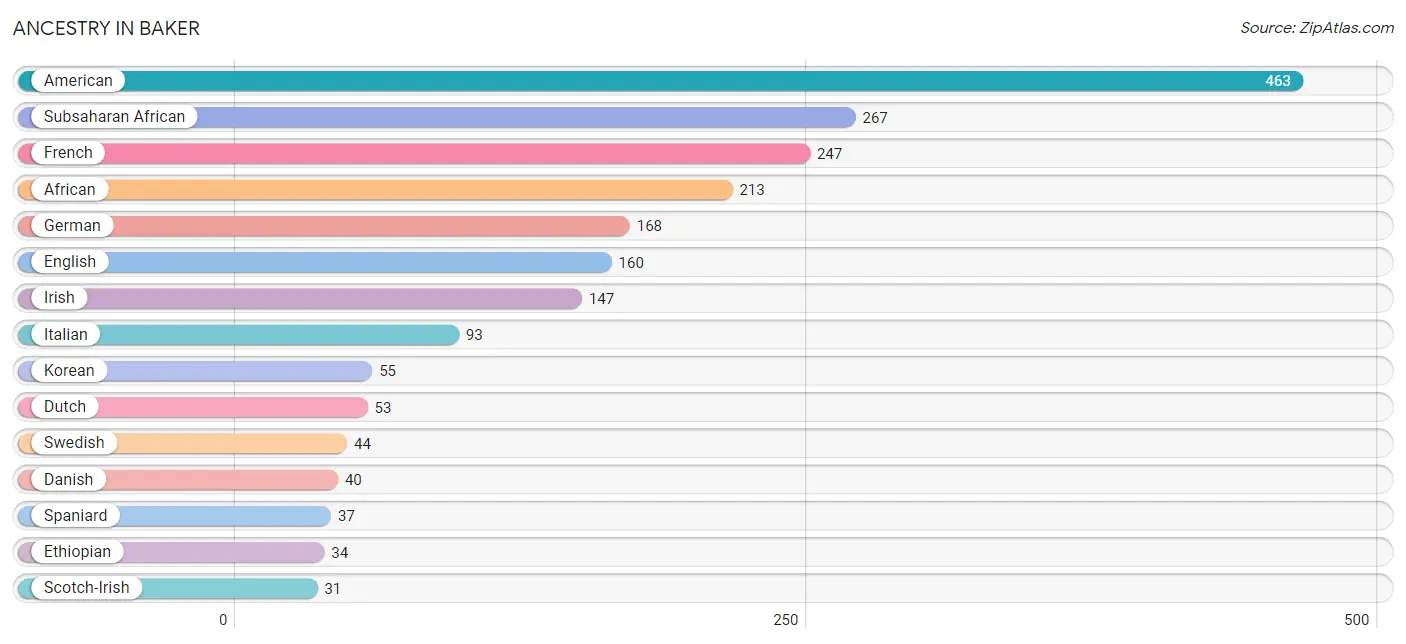
| Ancestry | # Population | % Population |
| African | 213 | 1.7% |
| American | 463 | 3.7% |
| Bhutanese | 5 | 0.0% |
| Cajun | 7 | 0.1% |
| Canadian | 9 | 0.1% |
| Cherokee | 5 | 0.0% |
| Choctaw | 25 | 0.2% |
| Creek | 3 | 0.0% |
| Cuban | 13 | 0.1% |
| Czech | 9 | 0.1% |
| Danish | 40 | 0.3% |
| Dutch | 53 | 0.4% |
| English | 160 | 1.3% |
| Ethiopian | 34 | 0.3% |
| French | 247 | 2.0% |
| French Canadian | 8 | 0.1% |
| German | 168 | 1.3% |
| Irish | 147 | 1.2% |
| Italian | 93 | 0.7% |
| Korean | 55 | 0.4% |
| Mexican | 10 | 0.1% |
| Russian | 8 | 0.1% |
| Scotch-Irish | 31 | 0.3% |
| Scottish | 11 | 0.1% |
| Spaniard | 37 | 0.3% |
| Subsaharan African | 267 | 2.1% |
| Swedish | 44 | 0.4% |
| Welsh | 12 | 0.1% |
| West Indian | 3 | 0.0% | View All 29 Rows |
Immigrants in Baker
The most numerous immigrant groups reported in Baker came from Asia (16 | 0.1%), Philippines (16 | 0.1%), South Eastern Asia (16 | 0.1%), Czechoslovakia (9 | 0.1%), and Eastern Europe (9 | 0.1%), together accounting for 0.5% of all Baker residents.
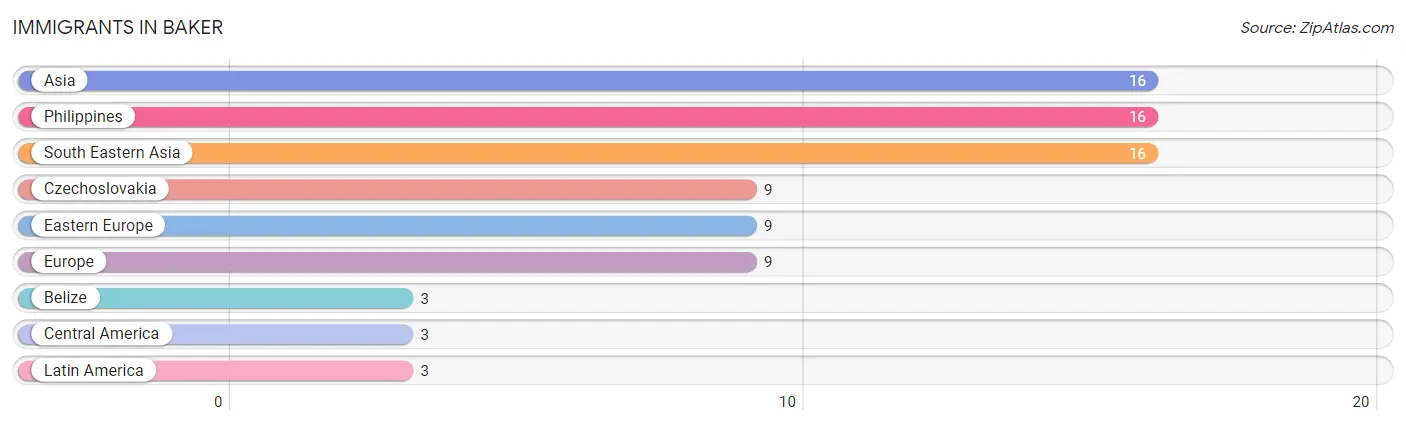
| Immigration Origin | # Population | % Population |
| Asia | 16 | 0.1% |
| Belize | 3 | 0.0% |
| Central America | 3 | 0.0% |
| Czechoslovakia | 9 | 0.1% |
| Eastern Europe | 9 | 0.1% |
| Europe | 9 | 0.1% |
| Latin America | 3 | 0.0% |
| Philippines | 16 | 0.1% |
| South Eastern Asia | 16 | 0.1% | View All 9 Rows |
Sex and Age in Baker
Sex and Age in Baker
The most populous age groups in Baker are 20 to 24 Years (685 | 11.9%) for men and Under 5 Years (930 | 13.9%) for women.
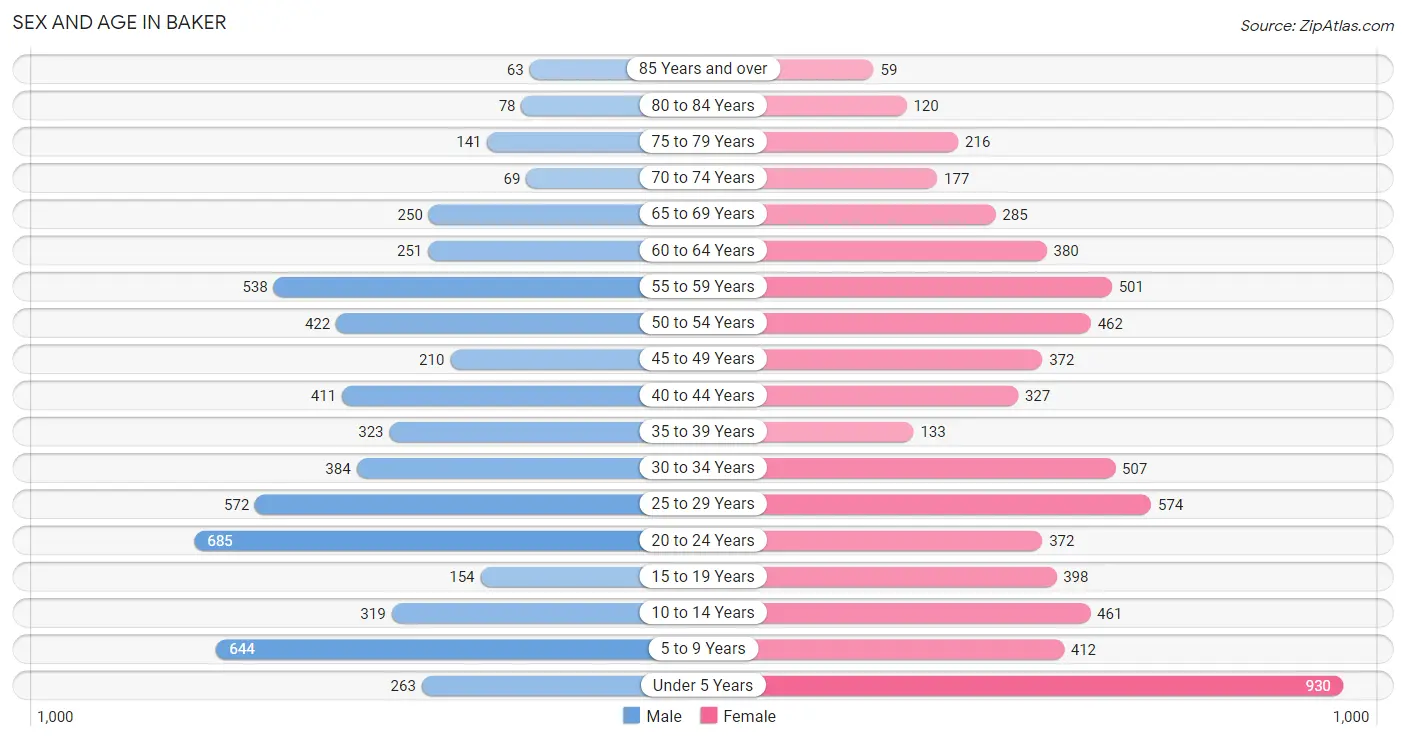
| Age Bracket | Male | Female |
| Under 5 Years | 263 (4.5%) | 930 (13.9%) |
| 5 to 9 Years | 644 (11.2%) | 412 (6.2%) |
| 10 to 14 Years | 319 (5.5%) | 461 (6.9%) |
| 15 to 19 Years | 154 (2.7%) | 398 (5.9%) |
| 20 to 24 Years | 685 (11.9%) | 372 (5.6%) |
| 25 to 29 Years | 572 (9.9%) | 574 (8.6%) |
| 30 to 34 Years | 384 (6.7%) | 507 (7.6%) |
| 35 to 39 Years | 323 (5.6%) | 133 (2.0%) |
| 40 to 44 Years | 411 (7.1%) | 327 (4.9%) |
| 45 to 49 Years | 210 (3.6%) | 372 (5.6%) |
| 50 to 54 Years | 422 (7.3%) | 462 (6.9%) |
| 55 to 59 Years | 538 (9.3%) | 501 (7.5%) |
| 60 to 64 Years | 251 (4.3%) | 380 (5.7%) |
| 65 to 69 Years | 250 (4.3%) | 285 (4.3%) |
| 70 to 74 Years | 69 (1.2%) | 177 (2.6%) |
| 75 to 79 Years | 141 (2.4%) | 216 (3.2%) |
| 80 to 84 Years | 78 (1.3%) | 120 (1.8%) |
| 85 Years and over | 63 (1.1%) | 59 (0.9%) |
| Total | 5,777 (100.0%) | 6,686 (100.0%) |
Families and Households in Baker
Median Family Size in Baker
The median family size in Baker is 3.50 persons per family, with single female/mother families (1,252 | 40.9%) accounting for the largest median family size of 3.98 persons per family. On the other hand, single male/father families (453 | 14.8%) represent the smallest median family size with 2.35 persons per family.
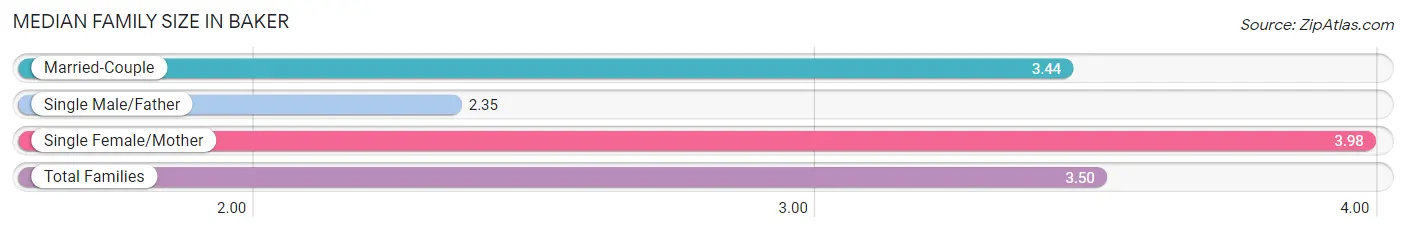
| Family Type | # Families | Family Size |
| Married-Couple | 1,355 (44.3%) | 3.44 |
| Single Male/Father | 453 (14.8%) | 2.35 |
| Single Female/Mother | 1,252 (40.9%) | 3.98 |
| Total Families | 3,060 (100.0%) | 3.50 |
Median Household Size in Baker
The median household size in Baker is 2.92 persons per household, with single female/mother households (1,252 | 29.6%) accounting for the largest median household size of 4.13 persons per household. non-family households (1,167 | 27.6%) represent the smallest median household size with 1.20 persons per household.
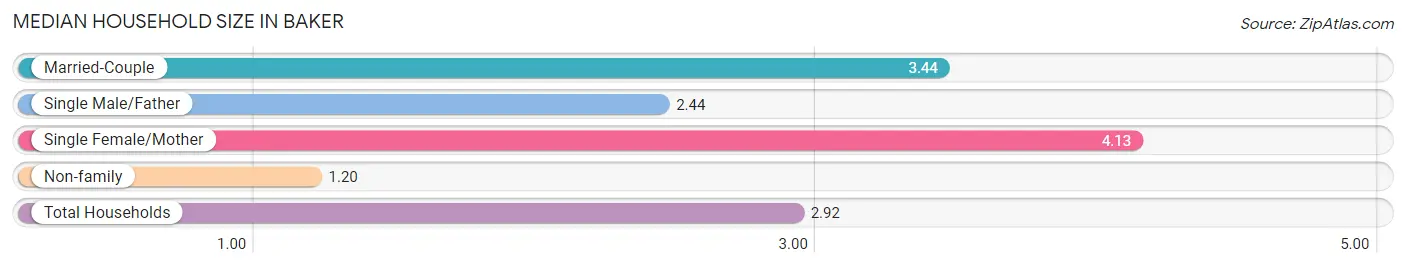
| Household Type | # Households | Household Size |
| Married-Couple | 1,355 (32.1%) | 3.44 |
| Single Male/Father | 453 (10.7%) | 2.44 |
| Single Female/Mother | 1,252 (29.6%) | 4.13 |
| Non-family | 1,167 (27.6%) | 1.20 |
| Total Households | 4,227 (100.0%) | 2.92 |
Household Size by Marriage Status in Baker
Out of a total of 4,227 households in Baker, 3,060 (72.4%) are family households, while 1,167 (27.6%) are nonfamily households. The most numerous type of family households are 2-person households, comprising 1,458, and the most common type of nonfamily households are 1-person households, comprising 948.
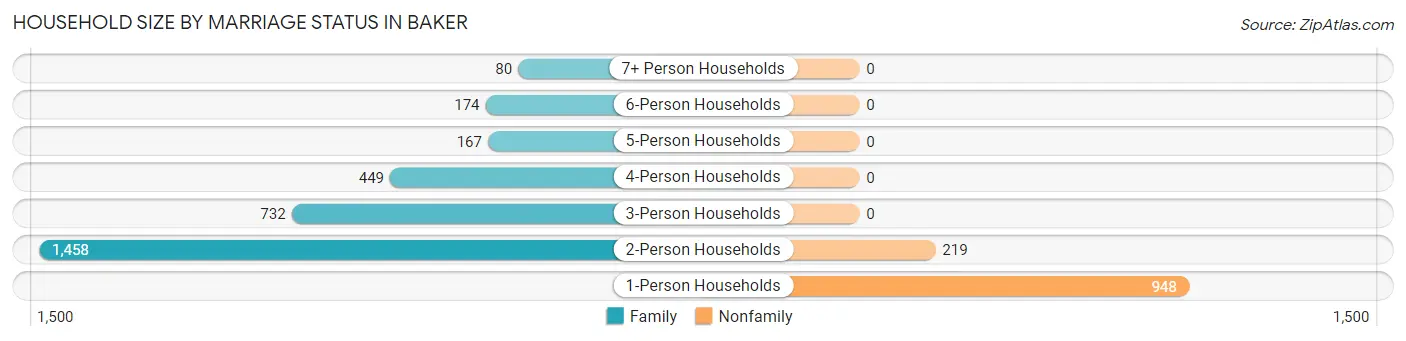
| Household Size | Family Households | Nonfamily Households |
| 1-Person Households | - | 948 (22.4%) |
| 2-Person Households | 1,458 (34.5%) | 219 (5.2%) |
| 3-Person Households | 732 (17.3%) | 0 (0.0%) |
| 4-Person Households | 449 (10.6%) | 0 (0.0%) |
| 5-Person Households | 167 (4.0%) | 0 (0.0%) |
| 6-Person Households | 174 (4.1%) | 0 (0.0%) |
| 7+ Person Households | 80 (1.9%) | 0 (0.0%) |
| Total | 3,060 (72.4%) | 1,167 (27.6%) |
Female Fertility in Baker
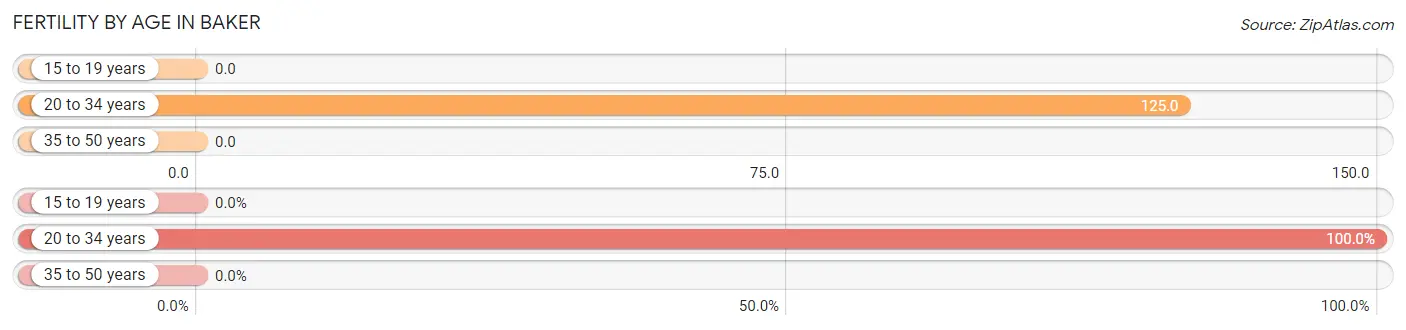
Fertility by Age in Baker
Average fertility rate in Baker is 67.0 births per 1,000 women. Women in the age bracket of 20 to 34 years have the highest fertility rate with 125.0 births per 1,000 women. Women in the age bracket of 20 to 34 years acount for 100.0% of all women with births.
| Age Bracket | Women with Births | Births / 1,000 Women |
| 15 to 19 years | 0 (0.0%) | 0.0 |
| 20 to 34 years | 181 (100.0%) | 125.0 |
| 35 to 50 years | 0 (0.0%) | 0.0 |
| Total | 181 (100.0%) | 67.0 |
Fertility by Age by Marriage Status in Baker
27.6% of women with births (181) in Baker are married. The highest percentage of unmarried women with births falls into 20 to 34 years age bracket with 72.4% of them unmarried at the time of birth, while the lowest percentage of unmarried women with births belong to 20 to 34 years age bracket with 72.4% of them unmarried.
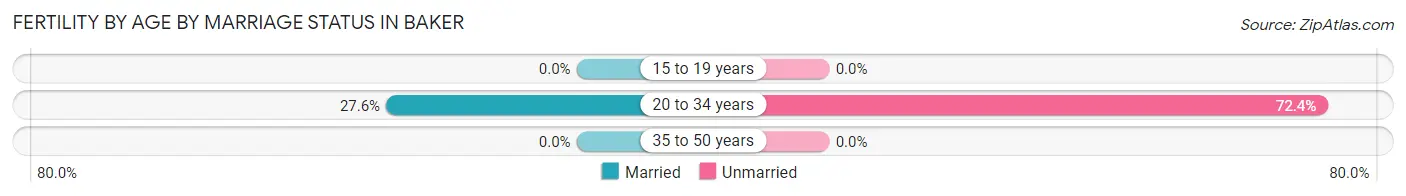
| Age Bracket | Married | Unmarried |
| 15 to 19 years | 0 (0.0%) | 0 (0.0%) |
| 20 to 34 years | 50 (27.6%) | 131 (72.4%) |
| 35 to 50 years | 0 (0.0%) | 0 (0.0%) |
| Total | 50 (27.6%) | 131 (72.4%) |
Fertility by Education in Baker
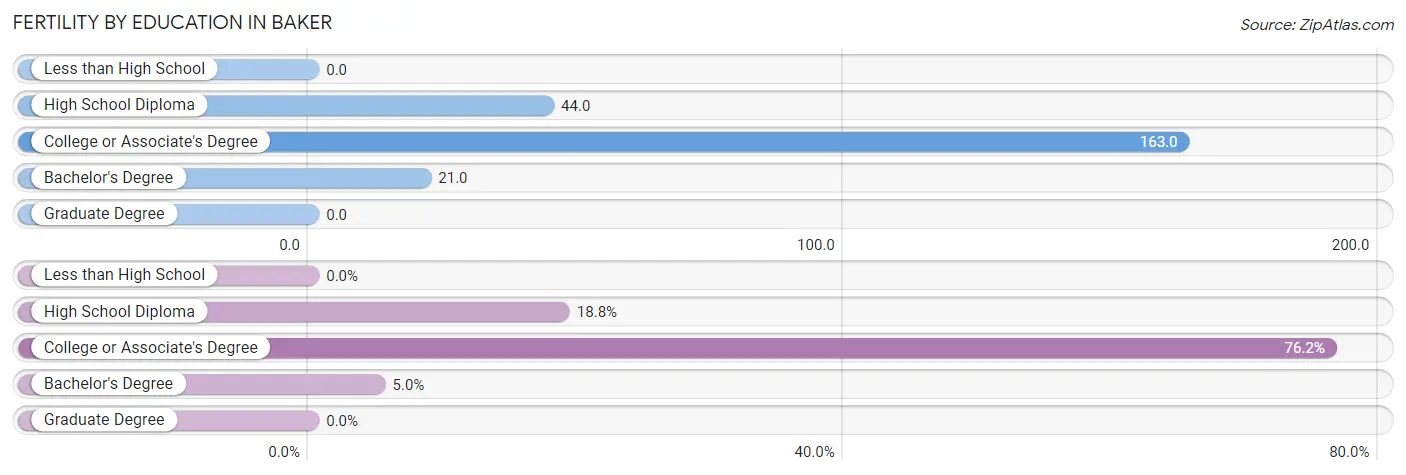
| Educational Attainment | Women with Births | Births / 1,000 Women |
| Less than High School | 0 (0.0%) | 0.0 |
| High School Diploma | 34 (18.8%) | 44.0 |
| College or Associate's Degree | 138 (76.2%) | 163.0 |
| Bachelor's Degree | 9 (5.0%) | 21.0 |
| Graduate Degree | 0 (0.0%) | 0.0 |
| Total | 181 (100.0%) | 67.0 |
Fertility by Education by Marriage Status in Baker
72.4% of women with births in Baker are unmarried. Women with the educational attainment of college or associate's degree are most likely to be married with 36.2% of them married at childbirth, while women with the educational attainment of high school diploma are least likely to be married with 100.0% of them unmarried at childbirth.
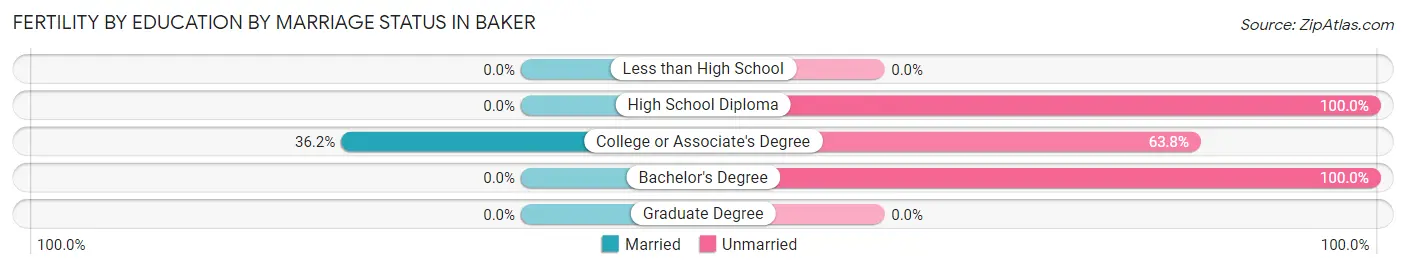
| Educational Attainment | Married | Unmarried |
| Less than High School | 0 (0.0%) | 0 (0.0%) |
| High School Diploma | 0 (0.0%) | 34 (100.0%) |
| College or Associate's Degree | 50 (36.2%) | 88 (63.8%) |
| Bachelor's Degree | 0 (0.0%) | 9 (100.0%) |
| Graduate Degree | 0 (0.0%) | 0 (0.0%) |
| Total | 50 (27.6%) | 131 (72.4%) |
Income in Baker
Income Overview in Baker
Per Capita Income in Baker is $26,252, while median incomes of families and households are $62,333 and $60,555 respectively.
| Characteristic | Number | Measure |
| Per Capita Income | 12,463 | $26,252 |
| Median Family Income | 3,060 | $62,333 |
| Mean Family Income | 3,060 | $74,308 |
| Median Household Income | 4,227 | $60,555 |
| Mean Household Income | 4,227 | $71,790 |
| Income Deficit | 3,060 | $0 |
| Wage / Income Gap (%) | 12,463 | 14.42% |
| Wage / Income Gap ($) | 12,463 | 85.58¢ per $1 |
| Gini / Inequality Index | 12,463 | 0.39 |
Earnings by Sex in Baker
Average Earnings in Baker are $32,206, $35,711 for men and $30,562 for women, a difference of 14.4%.
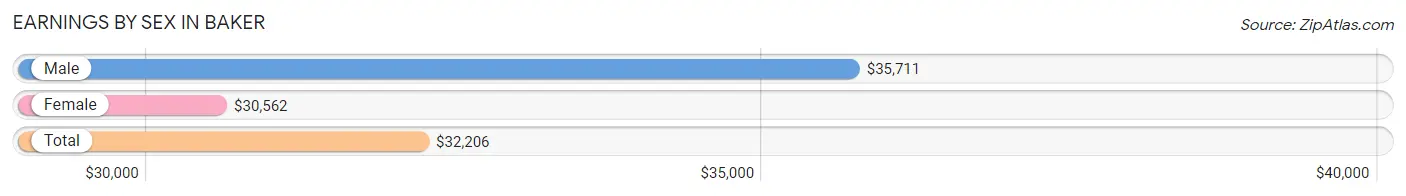
| Sex | Number | Average Earnings |
| Male | 3,509 (53.7%) | $35,711 |
| Female | 3,024 (46.3%) | $30,562 |
| Total | 6,533 (100.0%) | $32,206 |
Earnings by Sex by Income Bracket in Baker
The most common earnings brackets in Baker are $100,000+ for men (380 | 10.8%) and $40,000 to $44,999 for women (286 | 9.5%).
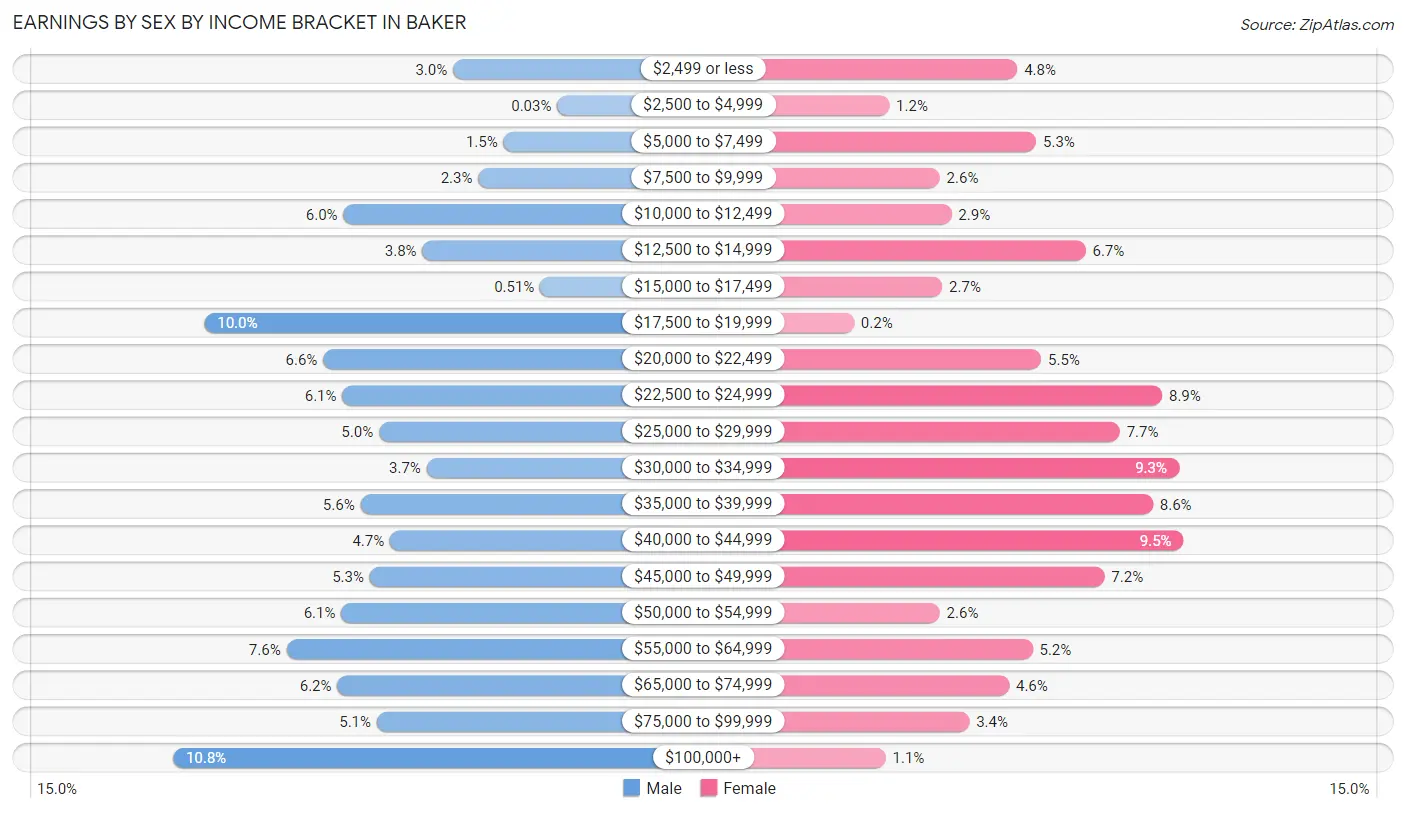
| Income | Male | Female |
| $2,499 or less | 104 (3.0%) | 145 (4.8%) |
| $2,500 to $4,999 | 1 (0.0%) | 36 (1.2%) |
| $5,000 to $7,499 | 54 (1.5%) | 161 (5.3%) |
| $7,500 to $9,999 | 79 (2.2%) | 79 (2.6%) |
| $10,000 to $12,499 | 212 (6.0%) | 89 (2.9%) |
| $12,500 to $14,999 | 134 (3.8%) | 203 (6.7%) |
| $15,000 to $17,499 | 18 (0.5%) | 81 (2.7%) |
| $17,500 to $19,999 | 349 (10.0%) | 6 (0.2%) |
| $20,000 to $22,499 | 232 (6.6%) | 165 (5.5%) |
| $22,500 to $24,999 | 213 (6.1%) | 268 (8.9%) |
| $25,000 to $29,999 | 177 (5.0%) | 232 (7.7%) |
| $30,000 to $34,999 | 130 (3.7%) | 282 (9.3%) |
| $35,000 to $39,999 | 195 (5.6%) | 260 (8.6%) |
| $40,000 to $44,999 | 166 (4.7%) | 286 (9.5%) |
| $45,000 to $49,999 | 186 (5.3%) | 219 (7.2%) |
| $50,000 to $54,999 | 214 (6.1%) | 79 (2.6%) |
| $55,000 to $64,999 | 268 (7.6%) | 158 (5.2%) |
| $65,000 to $74,999 | 218 (6.2%) | 138 (4.6%) |
| $75,000 to $99,999 | 179 (5.1%) | 104 (3.4%) |
| $100,000+ | 380 (10.8%) | 33 (1.1%) |
| Total | 3,509 (100.0%) | 3,024 (100.0%) |
Earnings by Sex by Educational Attainment in Baker
Average earnings in Baker are $43,293 for men and $31,884 for women, a difference of 26.4%. Men with an educational attainment of bachelor's degree enjoy the highest average annual earnings of $113,750, while those with college or associate's degree education earn the least with $36,289. Women with an educational attainment of bachelor's degree earn the most with the average annual earnings of $46,250, while those with less than high school education have the smallest earnings of $22,532.
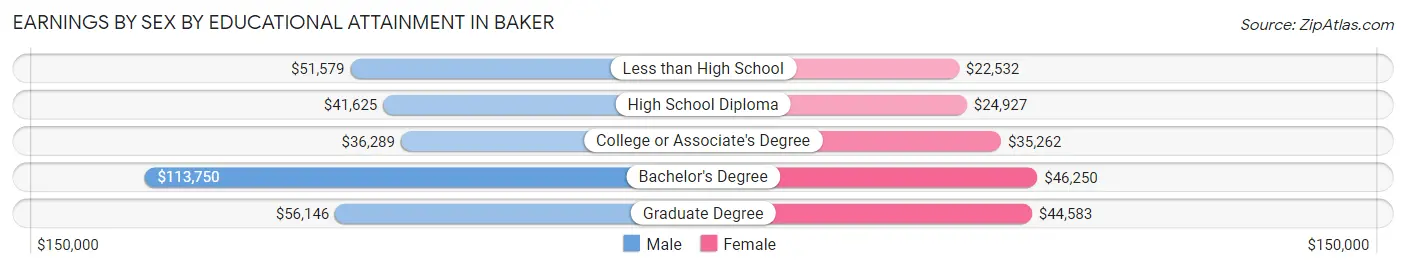
| Educational Attainment | Male Income | Female Income |
| Less than High School | $51,579 | $22,532 |
| High School Diploma | $41,625 | $24,927 |
| College or Associate's Degree | $36,289 | $35,262 |
| Bachelor's Degree | $113,750 | $46,250 |
| Graduate Degree | $56,146 | $44,583 |
| Total | $43,293 | $31,884 |
Family Income in Baker
Family Income Brackets in Baker
According to the Baker family income data, there are 692 families falling into the $75,000 to $99,999 income range, which is the most common income bracket and makes up 22.6% of all families. Conversely, the $200,000+ income bracket is the least frequent group with only 64 families (2.1%) belonging to this category.
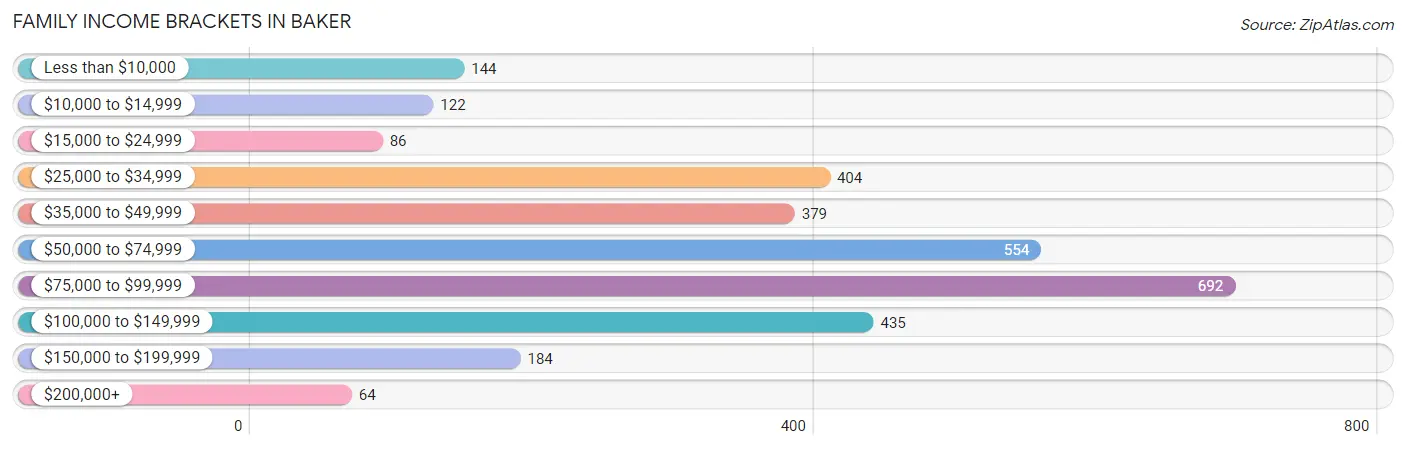
| Income Bracket | # Families | % Families |
| Less than $10,000 | 144 | 4.7% |
| $10,000 to $14,999 | 122 | 4.0% |
| $15,000 to $24,999 | 86 | 2.8% |
| $25,000 to $34,999 | 404 | 13.2% |
| $35,000 to $49,999 | 379 | 12.4% |
| $50,000 to $74,999 | 554 | 18.1% |
| $75,000 to $99,999 | 692 | 22.6% |
| $100,000 to $149,999 | 435 | 14.2% |
| $150,000 to $199,999 | 184 | 6.0% |
| $200,000+ | 64 | 2.1% |
Family Income by Famaliy Size in Baker
5-person families (139 | 4.5%) account for the highest median family income in Baker with $120,234 per family, while 2-person families (1,569 | 51.3%) have the highest median income of $30,668 per family member.
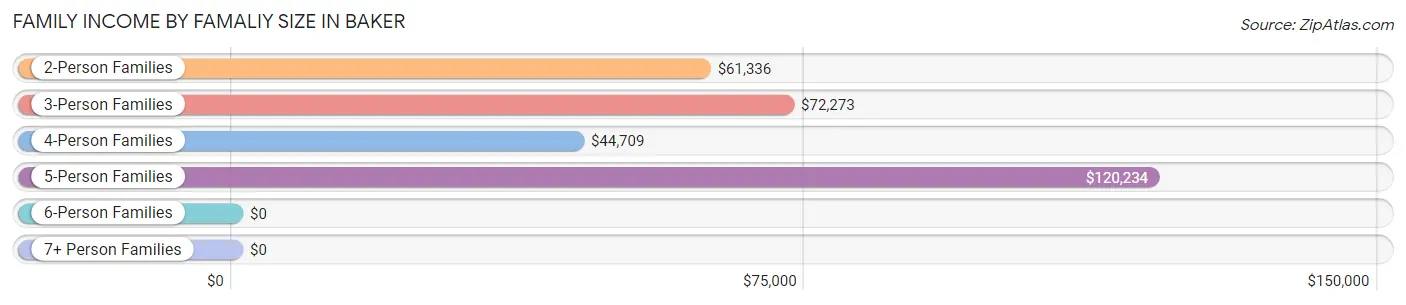
| Income Bracket | # Families | Median Income |
| 2-Person Families | 1,569 (51.3%) | $61,336 |
| 3-Person Families | 642 (21.0%) | $72,273 |
| 4-Person Families | 473 (15.5%) | $44,709 |
| 5-Person Families | 139 (4.5%) | $120,234 |
| 6-Person Families | 159 (5.2%) | $0 |
| 7+ Person Families | 78 (2.5%) | $0 |
| Total | 3,060 (100.0%) | $62,333 |
Family Income by Number of Earners in Baker
The median family income in Baker is $62,333, with families comprising 3+ earners (275) having the highest median family income of $96,737, while families with no earners (320) have the lowest median family income of $27,070, accounting for 9.0% and 10.5% of families, respectively.
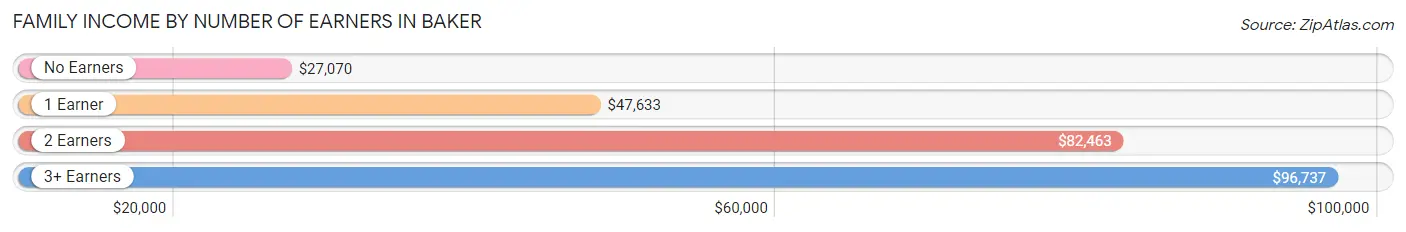
| Number of Earners | # Families | Median Income |
| No Earners | 320 (10.5%) | $27,070 |
| 1 Earner | 1,333 (43.6%) | $47,633 |
| 2 Earners | 1,132 (37.0%) | $82,463 |
| 3+ Earners | 275 (9.0%) | $96,737 |
| Total | 3,060 (100.0%) | $62,333 |
Household Income in Baker
Household Income Brackets in Baker
With 799 households falling in the category, the $75,000 to $99,999 income range is the most frequent in Baker, accounting for 18.9% of all households. In contrast, only 72 households (1.7%) fall into the $200,000+ income bracket, making it the least populous group.
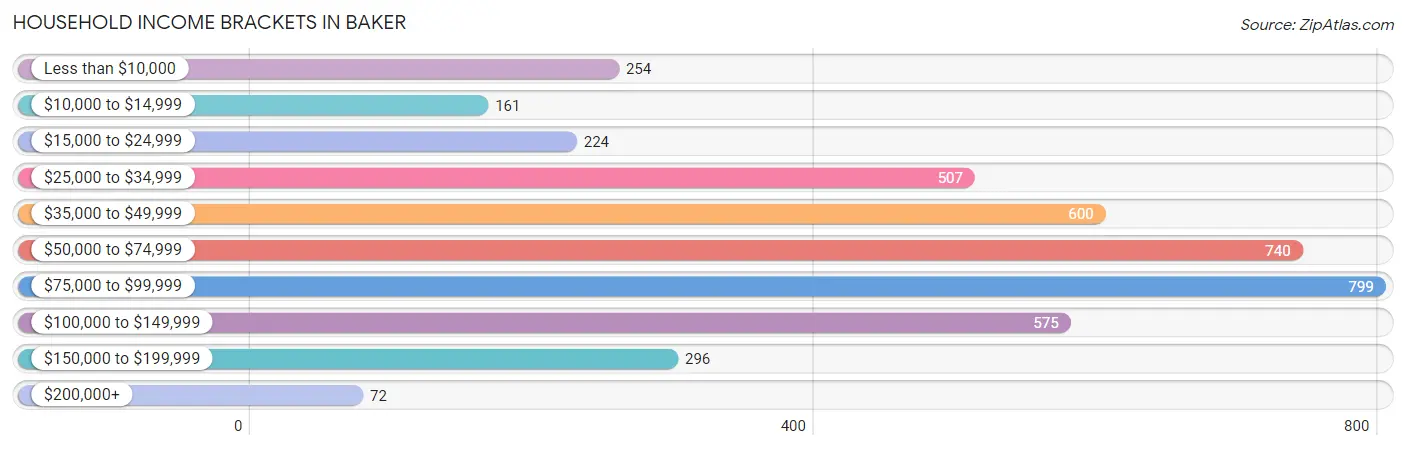
| Income Bracket | # Households | % Households |
| Less than $10,000 | 254 | 6.0% |
| $10,000 to $14,999 | 161 | 3.8% |
| $15,000 to $24,999 | 224 | 5.3% |
| $25,000 to $34,999 | 507 | 12.0% |
| $35,000 to $49,999 | 600 | 14.2% |
| $50,000 to $74,999 | 740 | 17.5% |
| $75,000 to $99,999 | 799 | 18.9% |
| $100,000 to $149,999 | 575 | 13.6% |
| $150,000 to $199,999 | 296 | 7.0% |
| $200,000+ | 72 | 1.7% |
Household Income by Householder Age in Baker
The median household income in Baker is $60,555, with the highest median household income of $75,522 found in the 45 to 64 years age bracket for the primary householder. A total of 1,725 households (40.8%) fall into this category. Meanwhile, the 15 to 24 years age bracket for the primary householder has the lowest median household income of $0, with 114 households (2.7%) in this group.
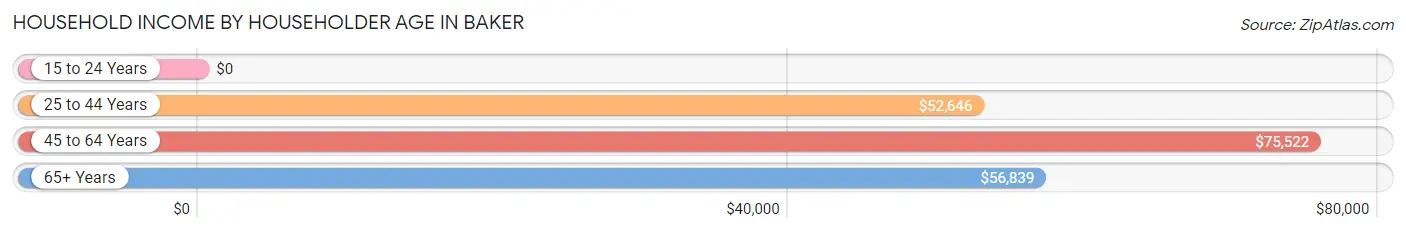
| Income Bracket | # Households | Median Income |
| 15 to 24 Years | 114 (2.7%) | $0 |
| 25 to 44 Years | 1,471 (34.8%) | $52,646 |
| 45 to 64 Years | 1,725 (40.8%) | $75,522 |
| 65+ Years | 917 (21.7%) | $56,839 |
| Total | 4,227 (100.0%) | $60,555 |
Poverty in Baker
Income Below Poverty by Sex and Age in Baker
With 13.6% poverty level for males and 22.8% for females among the residents of Baker, 15 year old males and 16 and 17 year old females are the most vulnerable to poverty, with 20 males (60.6%) and 38 females (45.8%) in their respective age groups living below the poverty level.
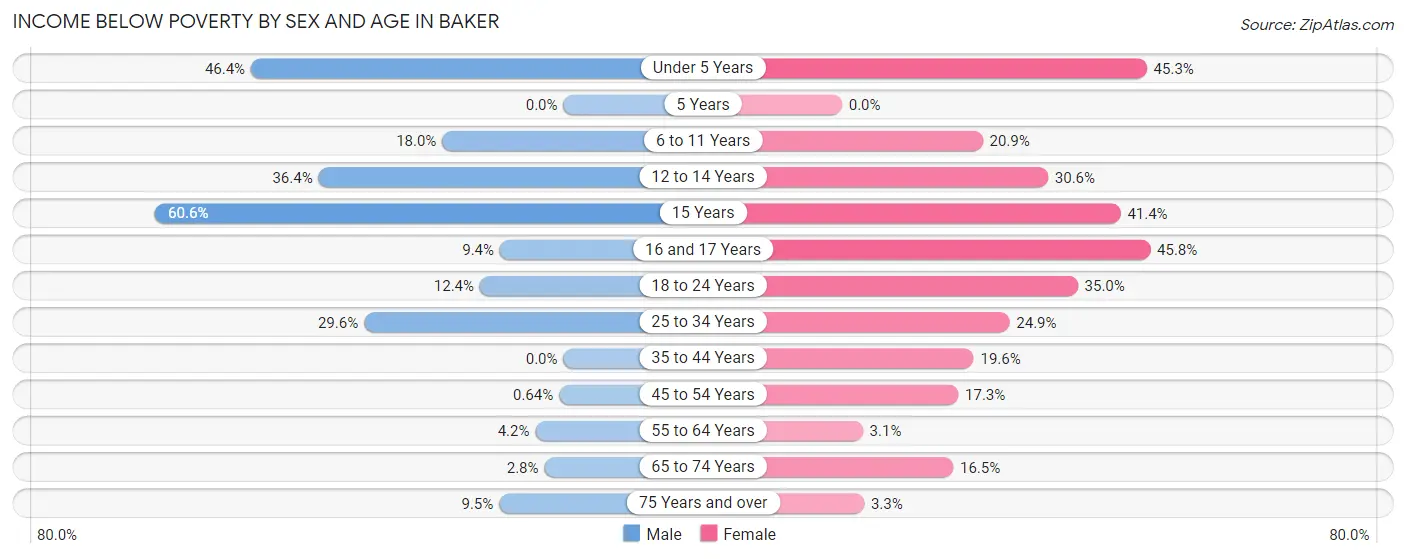
| Age Bracket | Male | Female |
| Under 5 Years | 122 (46.4%) | 421 (45.3%) |
| 5 Years | 0 (0.0%) | 0 (0.0%) |
| 6 to 11 Years | 129 (18.0%) | 134 (20.9%) |
| 12 to 14 Years | 56 (36.4%) | 56 (30.6%) |
| 15 Years | 20 (60.6%) | 36 (41.4%) |
| 16 and 17 Years | 5 (9.4%) | 38 (45.8%) |
| 18 to 24 Years | 93 (12.4%) | 208 (35.0%) |
| 25 to 34 Years | 283 (29.6%) | 269 (24.9%) |
| 35 to 44 Years | 0 (0.0%) | 90 (19.6%) |
| 45 to 54 Years | 4 (0.6%) | 144 (17.3%) |
| 55 to 64 Years | 32 (4.2%) | 27 (3.1%) |
| 65 to 74 Years | 9 (2.8%) | 75 (16.5%) |
| 75 Years and over | 25 (9.5%) | 12 (3.3%) |
| Total | 778 (13.6%) | 1,510 (22.8%) |
Income Above Poverty by Sex and Age in Baker
According to the poverty statistics in Baker, males aged 5 years and females aged 5 years are the age groups that are most secure financially, with 100.0% of males and 100.0% of females in these age groups living above the poverty line.
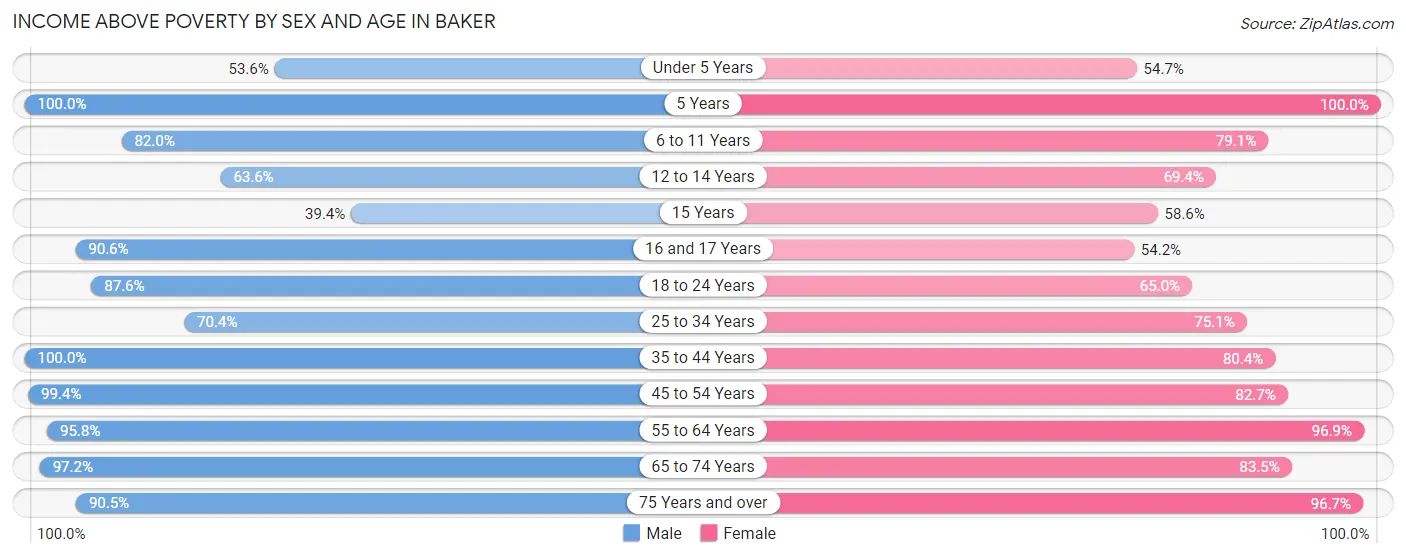
| Age Bracket | Male | Female |
| Under 5 Years | 141 (53.6%) | 509 (54.7%) |
| 5 Years | 91 (100.0%) | 44 (100.0%) |
| 6 to 11 Years | 588 (82.0%) | 507 (79.1%) |
| 12 to 14 Years | 98 (63.6%) | 127 (69.4%) |
| 15 Years | 13 (39.4%) | 51 (58.6%) |
| 16 and 17 Years | 48 (90.6%) | 45 (54.2%) |
| 18 to 24 Years | 657 (87.6%) | 386 (65.0%) |
| 25 to 34 Years | 673 (70.4%) | 812 (75.1%) |
| 35 to 44 Years | 734 (100.0%) | 370 (80.4%) |
| 45 to 54 Years | 620 (99.4%) | 690 (82.7%) |
| 55 to 64 Years | 736 (95.8%) | 843 (96.9%) |
| 65 to 74 Years | 310 (97.2%) | 379 (83.5%) |
| 75 Years and over | 237 (90.5%) | 353 (96.7%) |
| Total | 4,946 (86.4%) | 5,116 (77.2%) |
Income Below Poverty Among Married-Couple Families in Baker
The poverty statistics for married-couple families in Baker show that 4.1% or 55 of the total 1,355 families live below the poverty line. Families with 1 or 2 children have the highest poverty rate of 15.6%, comprising of 46 families. On the other hand, families with 3 or 4 children have the lowest poverty rate of 0.0%, which includes 0 families.
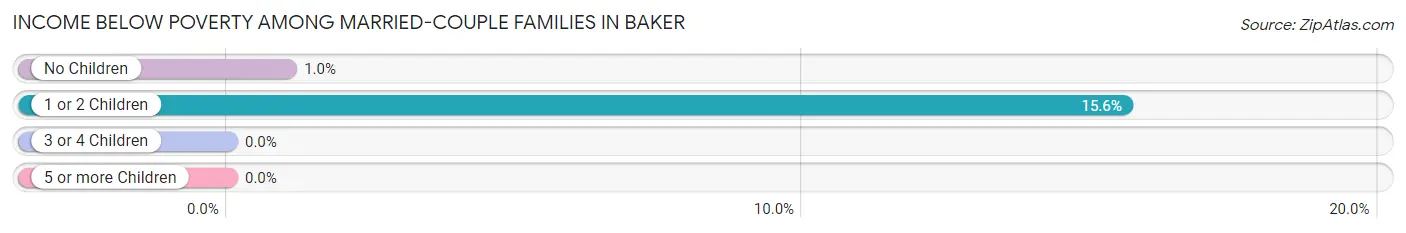
| Children | Above Poverty | Below Poverty |
| No Children | 869 (99.0%) | 9 (1.0%) |
| 1 or 2 Children | 249 (84.4%) | 46 (15.6%) |
| 3 or 4 Children | 120 (100.0%) | 0 (0.0%) |
| 5 or more Children | 62 (100.0%) | 0 (0.0%) |
| Total | 1,300 (95.9%) | 55 (4.1%) |
Income Below Poverty Among Single-Parent Households in Baker
According to the poverty data in Baker, 8.6% or 39 single-father households and 30.6% or 383 single-mother households are living below the poverty line. Among single-father households, those with 1 or 2 children have the highest poverty rate, with 39 households (21.5%) experiencing poverty. Likewise, among single-mother households, those with 5 or more children have the highest poverty rate, with 54 households (100.0%) falling below the poverty line.
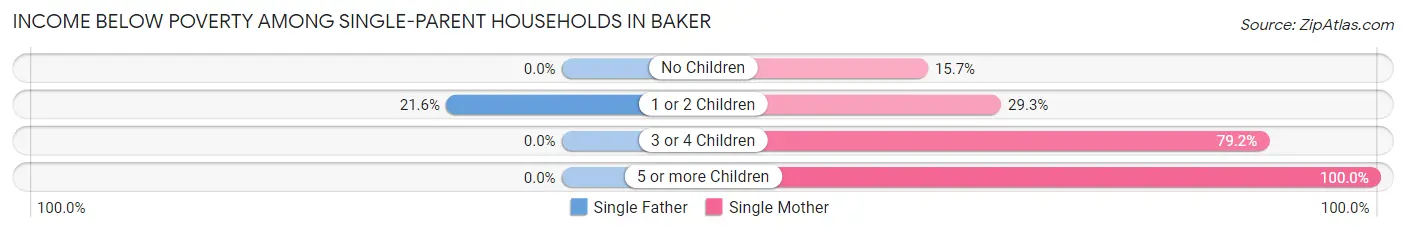
| Children | Single Father | Single Mother |
| No Children | 0 (0.0%) | 70 (15.7%) |
| 1 or 2 Children | 39 (21.5%) | 198 (29.3%) |
| 3 or 4 Children | 0 (0.0%) | 61 (79.2%) |
| 5 or more Children | 0 (0.0%) | 54 (100.0%) |
| Total | 39 (8.6%) | 383 (30.6%) |
Income Below Poverty Among Married-Couple vs Single-Parent Households in Baker
The poverty data for Baker shows that 55 of the married-couple family households (4.1%) and 422 of the single-parent households (24.7%) are living below the poverty level. Within the married-couple family households, those with 1 or 2 children have the highest poverty rate, with 46 households (15.6%) falling below the poverty line. Among the single-parent households, those with 5 or more children have the highest poverty rate, with 54 household (100.0%) living below poverty.
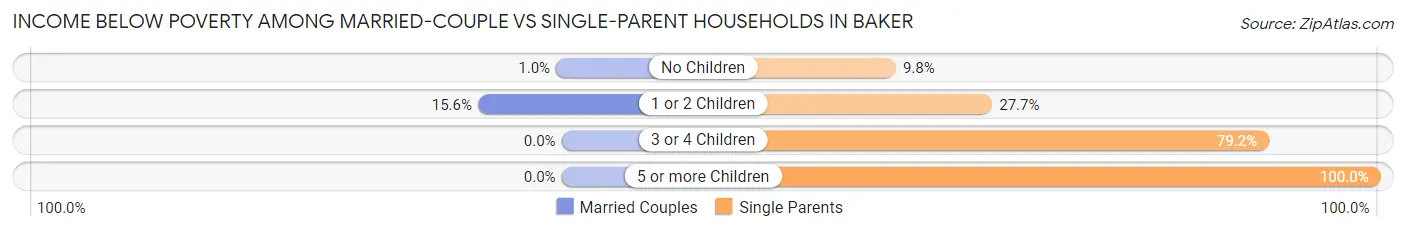
| Children | Married-Couple Families | Single-Parent Households |
| No Children | 9 (1.0%) | 70 (9.8%) |
| 1 or 2 Children | 46 (15.6%) | 237 (27.7%) |
| 3 or 4 Children | 0 (0.0%) | 61 (79.2%) |
| 5 or more Children | 0 (0.0%) | 54 (100.0%) |
| Total | 55 (4.1%) | 422 (24.7%) |
Employment Characteristics in Baker
Employment by Class of Employer in Baker
Among the 5,676 employed individuals in Baker, private company employees (3,815 | 67.2%), state government employees (779 | 13.7%), and not-for-profit organizations (367 | 6.5%) make up the most common classes of employment.
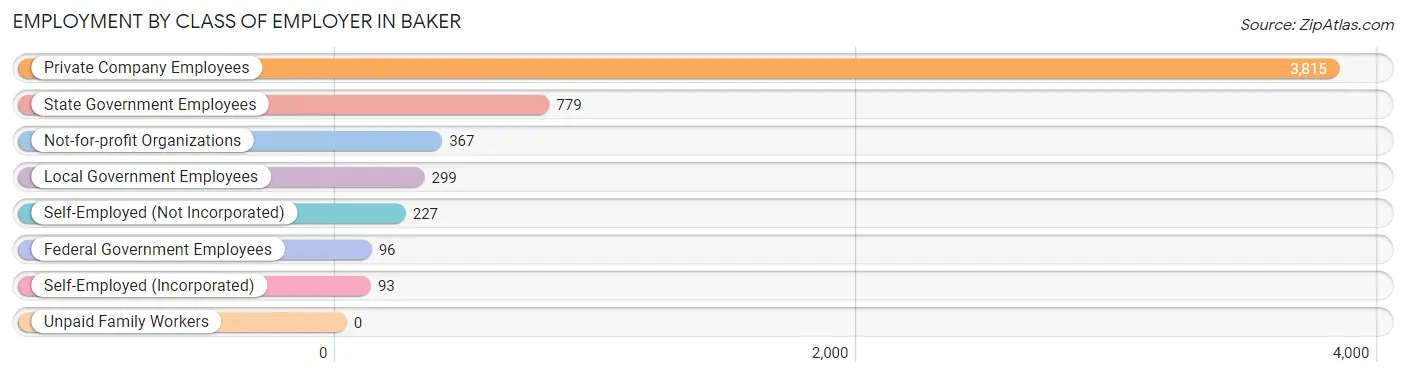
| Employer Class | # Employees | % Employees |
| Private Company Employees | 3,815 | 67.2% |
| Self-Employed (Incorporated) | 93 | 1.6% |
| Self-Employed (Not Incorporated) | 227 | 4.0% |
| Not-for-profit Organizations | 367 | 6.5% |
| Local Government Employees | 299 | 5.3% |
| State Government Employees | 779 | 13.7% |
| Federal Government Employees | 96 | 1.7% |
| Unpaid Family Workers | 0 | 0.0% |
| Total | 5,676 | 100.0% |
Employment Status by Age in Baker
According to the labor force statistics for Baker, out of the total population over 16 years of age (9,314), 71.4% or 6,650 individuals are in the labor force, with 12.6% or 838 of them unemployed. The age group with the highest labor force participation rate is 35 to 44 years, with 94.3% or 1,126 individuals in the labor force. Within the labor force, the 20 to 24 years age range has the highest percentage of unemployed individuals, with 34.4% or 242 of them being unemployed.
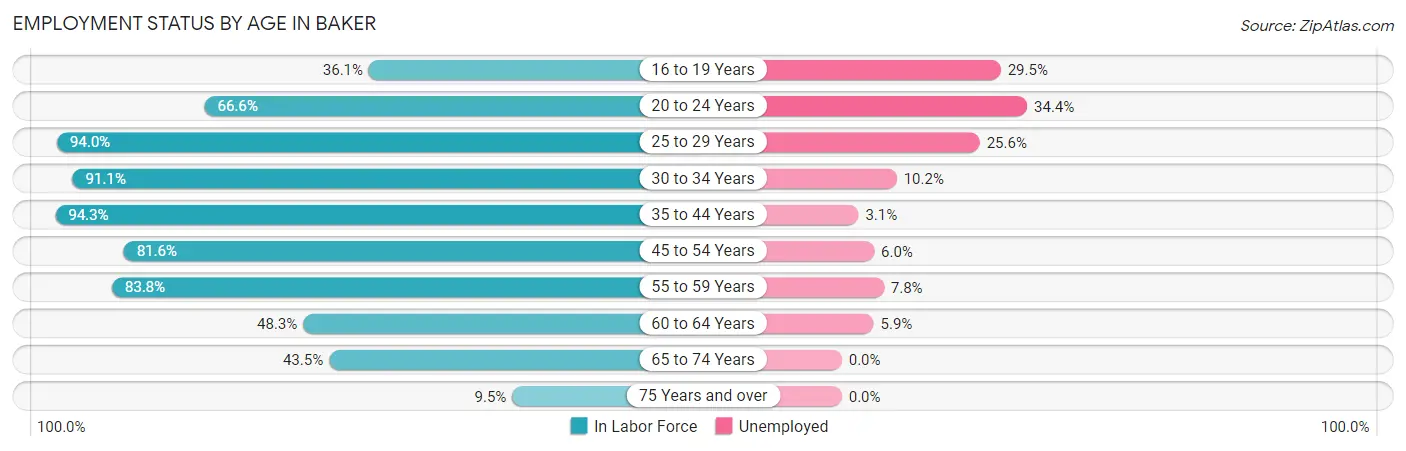
| Age Bracket | In Labor Force | Unemployed |
| 16 to 19 Years | 156 (36.1%) | 46 (29.5%) |
| 20 to 24 Years | 704 (66.6%) | 242 (34.4%) |
| 25 to 29 Years | 1,077 (94.0%) | 276 (25.6%) |
| 30 to 34 Years | 812 (91.1%) | 83 (10.2%) |
| 35 to 44 Years | 1,126 (94.3%) | 35 (3.1%) |
| 45 to 54 Years | 1,196 (81.6%) | 72 (6.0%) |
| 55 to 59 Years | 871 (83.8%) | 68 (7.8%) |
| 60 to 64 Years | 305 (48.3%) | 18 (5.9%) |
| 65 to 74 Years | 340 (43.5%) | 0 (0.0%) |
| 75 Years and over | 64 (9.5%) | 0 (0.0%) |
| Total | 6,650 (71.4%) | 838 (12.6%) |
Employment Status by Educational Attainment in Baker
According to labor force statistics for Baker, 84.6% of individuals (5,386) out of the total population between 25 and 64 years of age (6,367) are in the labor force, with 10.2% or 549 of them being unemployed. The group with the highest labor force participation rate are those with the educational attainment of high school diploma, with 89.6% or 2,331 individuals in the labor force. Within the labor force, individuals with less than high school education have the highest percentage of unemployment, with 20.8% or 76 of them being unemployed.
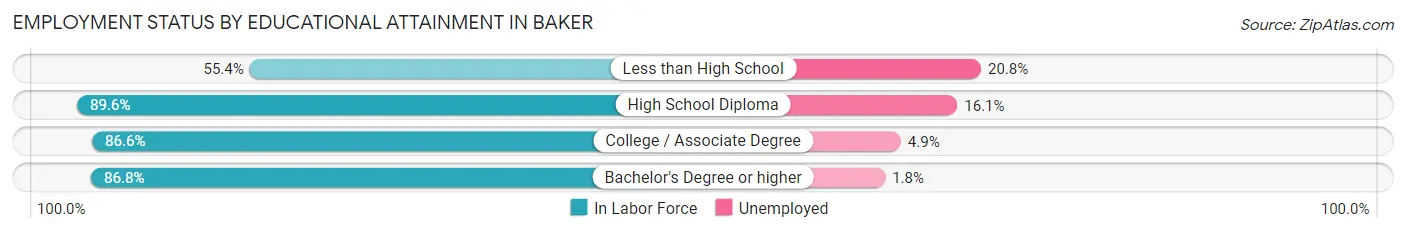
| Educational Attainment | In Labor Force | Unemployed |
| Less than High School | 366 (55.4%) | 137 (20.8%) |
| High School Diploma | 2,331 (89.6%) | 419 (16.1%) |
| College / Associate Degree | 1,699 (86.6%) | 96 (4.9%) |
| Bachelor's Degree or higher | 991 (86.8%) | 21 (1.8%) |
| Total | 5,386 (84.6%) | 649 (10.2%) |
Employment Occupations by Sex in Baker
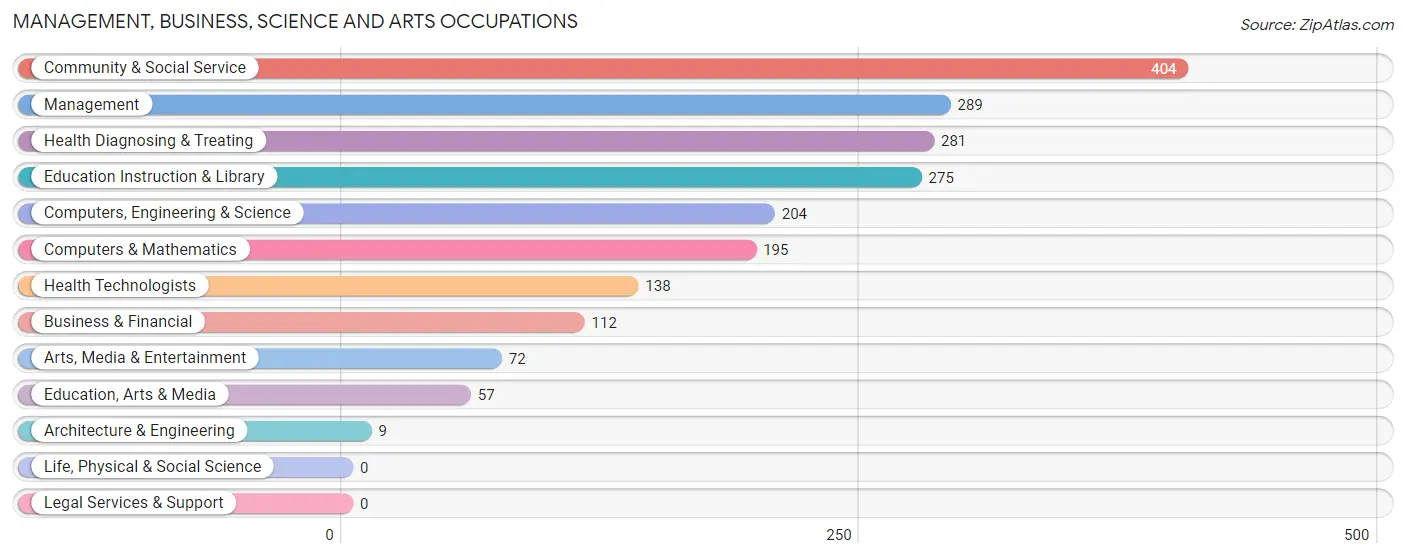
Management, Business, Science and Arts Occupations
The most common Management, Business, Science and Arts occupations in Baker are Community & Social Service (404 | 7.0%), Management (289 | 5.0%), Health Diagnosing & Treating (281 | 4.8%), Education Instruction & Library (275 | 4.7%), and Computers, Engineering & Science (204 | 3.5%).
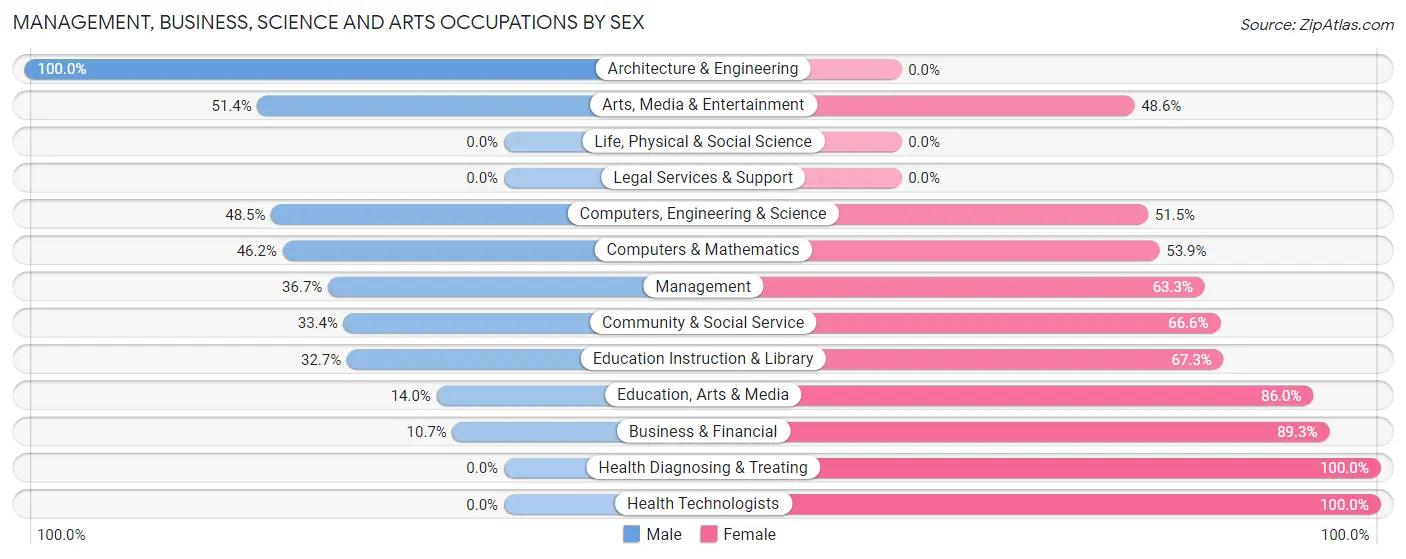
Management, Business, Science and Arts Occupations by Sex
Within the Management, Business, Science and Arts occupations in Baker, the most male-oriented occupations are Architecture & Engineering (100.0%), Arts, Media & Entertainment (51.4%), and Computers, Engineering & Science (48.5%), while the most female-oriented occupations are Health Diagnosing & Treating (100.0%), Health Technologists (100.0%), and Business & Financial (89.3%).
| Occupation | Male | Female |
| Management | 106 (36.7%) | 183 (63.3%) |
| Business & Financial | 12 (10.7%) | 100 (89.3%) |
| Computers, Engineering & Science | 99 (48.5%) | 105 (51.5%) |
| Computers & Mathematics | 90 (46.2%) | 105 (53.8%) |
| Architecture & Engineering | 9 (100.0%) | 0 (0.0%) |
| Life, Physical & Social Science | 0 (0.0%) | 0 (0.0%) |
| Community & Social Service | 135 (33.4%) | 269 (66.6%) |
| Education, Arts & Media | 8 (14.0%) | 49 (86.0%) |
| Legal Services & Support | 0 (0.0%) | 0 (0.0%) |
| Education Instruction & Library | 90 (32.7%) | 185 (67.3%) |
| Arts, Media & Entertainment | 37 (51.4%) | 35 (48.6%) |
| Health Diagnosing & Treating | 0 (0.0%) | 281 (100.0%) |
| Health Technologists | 0 (0.0%) | 138 (100.0%) |
| Total (Category) | 352 (27.3%) | 938 (72.7%) |
| Total (Overall) | 3,179 (54.7%) | 2,632 (45.3%) |
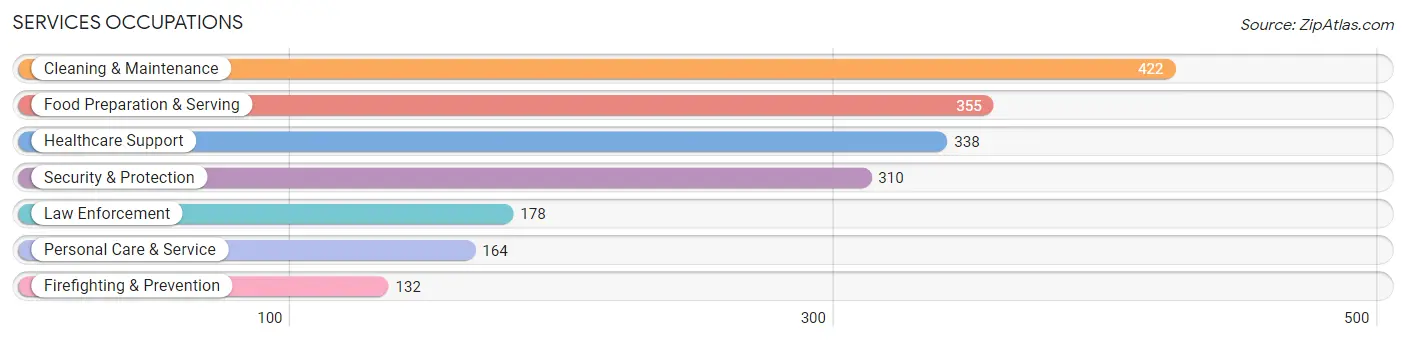
Services Occupations
The most common Services occupations in Baker are Cleaning & Maintenance (422 | 7.3%), Food Preparation & Serving (355 | 6.1%), Healthcare Support (338 | 5.8%), Security & Protection (310 | 5.3%), and Law Enforcement (178 | 3.1%).
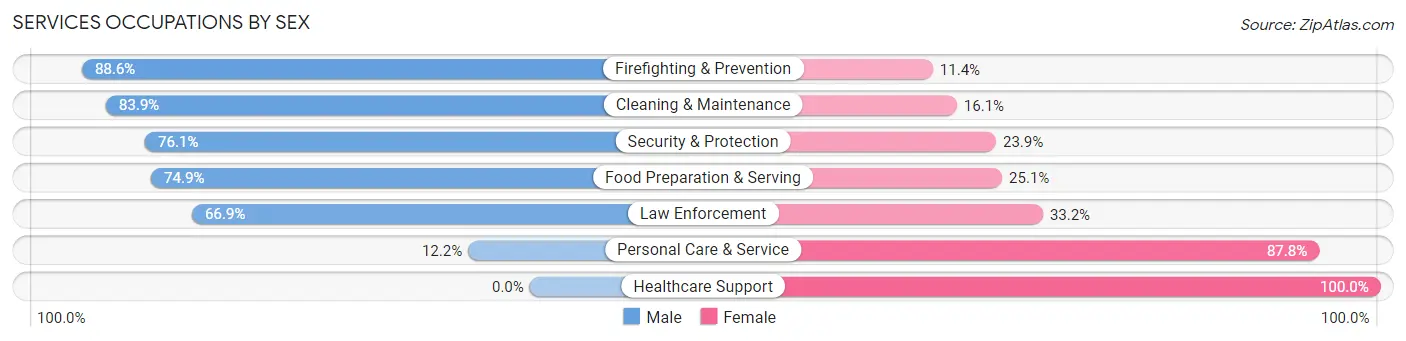
Services Occupations by Sex
Within the Services occupations in Baker, the most male-oriented occupations are Firefighting & Prevention (88.6%), Cleaning & Maintenance (83.9%), and Security & Protection (76.1%), while the most female-oriented occupations are Healthcare Support (100.0%), Personal Care & Service (87.8%), and Law Enforcement (33.2%).
| Occupation | Male | Female |
| Healthcare Support | 0 (0.0%) | 338 (100.0%) |
| Security & Protection | 236 (76.1%) | 74 (23.9%) |
| Firefighting & Prevention | 117 (88.6%) | 15 (11.4%) |
| Law Enforcement | 119 (66.8%) | 59 (33.2%) |
| Food Preparation & Serving | 266 (74.9%) | 89 (25.1%) |
| Cleaning & Maintenance | 354 (83.9%) | 68 (16.1%) |
| Personal Care & Service | 20 (12.2%) | 144 (87.8%) |
| Total (Category) | 876 (55.1%) | 713 (44.9%) |
| Total (Overall) | 3,179 (54.7%) | 2,632 (45.3%) |
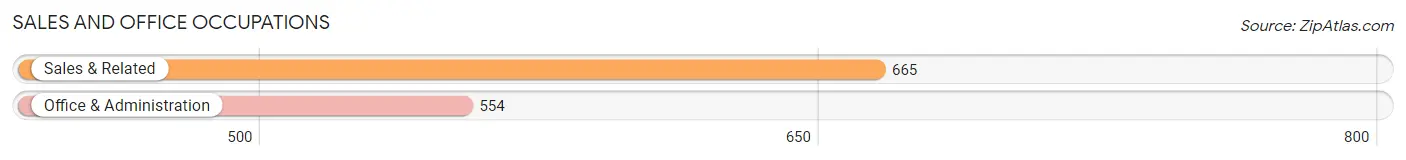
Sales and Office Occupations
The most common Sales and Office occupations in Baker are Sales & Related (665 | 11.4%), and Office & Administration (554 | 9.5%).
Sales and Office Occupations by Sex
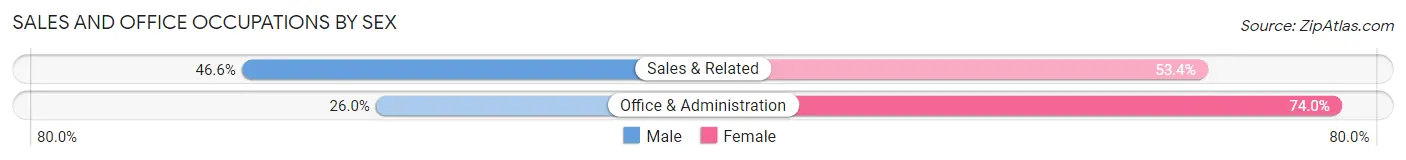
| Occupation | Male | Female |
| Sales & Related | 310 (46.6%) | 355 (53.4%) |
| Office & Administration | 144 (26.0%) | 410 (74.0%) |
| Total (Category) | 454 (37.2%) | 765 (62.8%) |
| Total (Overall) | 3,179 (54.7%) | 2,632 (45.3%) |
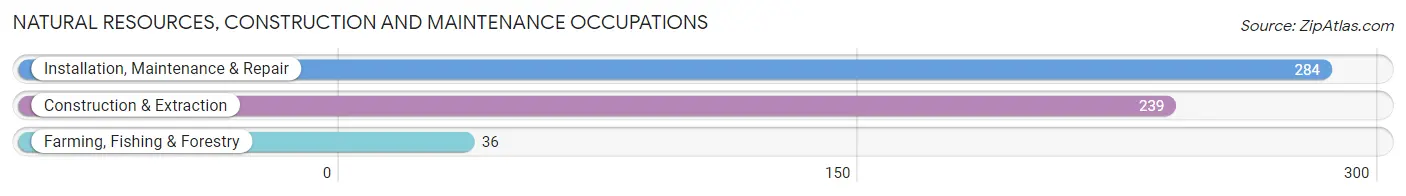
Natural Resources, Construction and Maintenance Occupations
The most common Natural Resources, Construction and Maintenance occupations in Baker are Installation, Maintenance & Repair (284 | 4.9%), Construction & Extraction (239 | 4.1%), and Farming, Fishing & Forestry (36 | 0.6%).
Natural Resources, Construction and Maintenance Occupations by Sex
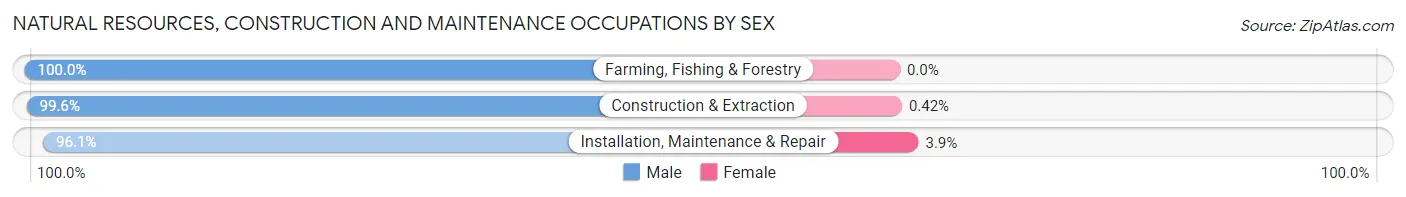
| Occupation | Male | Female |
| Farming, Fishing & Forestry | 36 (100.0%) | 0 (0.0%) |
| Construction & Extraction | 238 (99.6%) | 1 (0.4%) |
| Installation, Maintenance & Repair | 273 (96.1%) | 11 (3.9%) |
| Total (Category) | 547 (97.9%) | 12 (2.1%) |
| Total (Overall) | 3,179 (54.7%) | 2,632 (45.3%) |
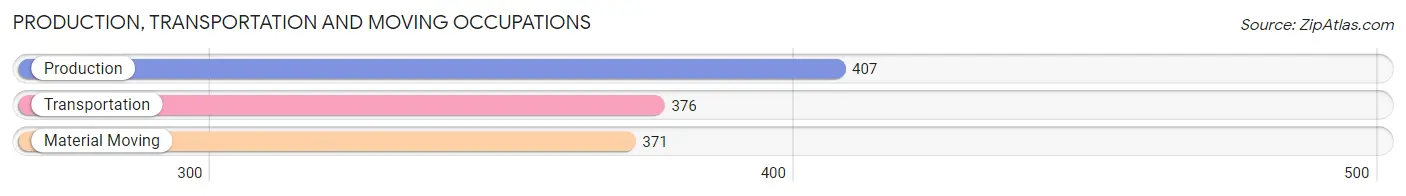
Production, Transportation and Moving Occupations
The most common Production, Transportation and Moving occupations in Baker are Production (407 | 7.0%), Transportation (376 | 6.5%), and Material Moving (371 | 6.4%).
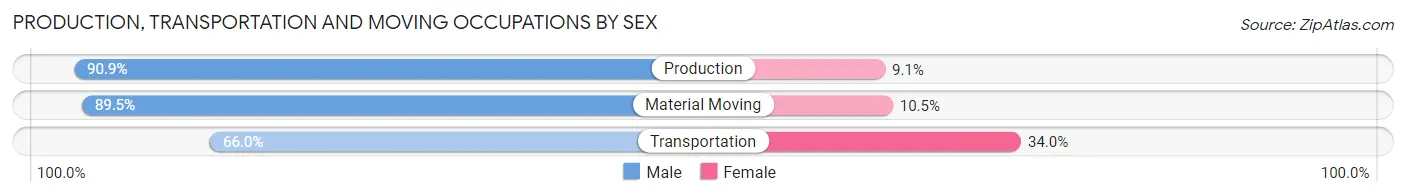
Production, Transportation and Moving Occupations by Sex
| Occupation | Male | Female |
| Production | 370 (90.9%) | 37 (9.1%) |
| Transportation | 248 (66.0%) | 128 (34.0%) |
| Material Moving | 332 (89.5%) | 39 (10.5%) |
| Total (Category) | 950 (82.3%) | 204 (17.7%) |
| Total (Overall) | 3,179 (54.7%) | 2,632 (45.3%) |
Employment Industries by Sex in Baker
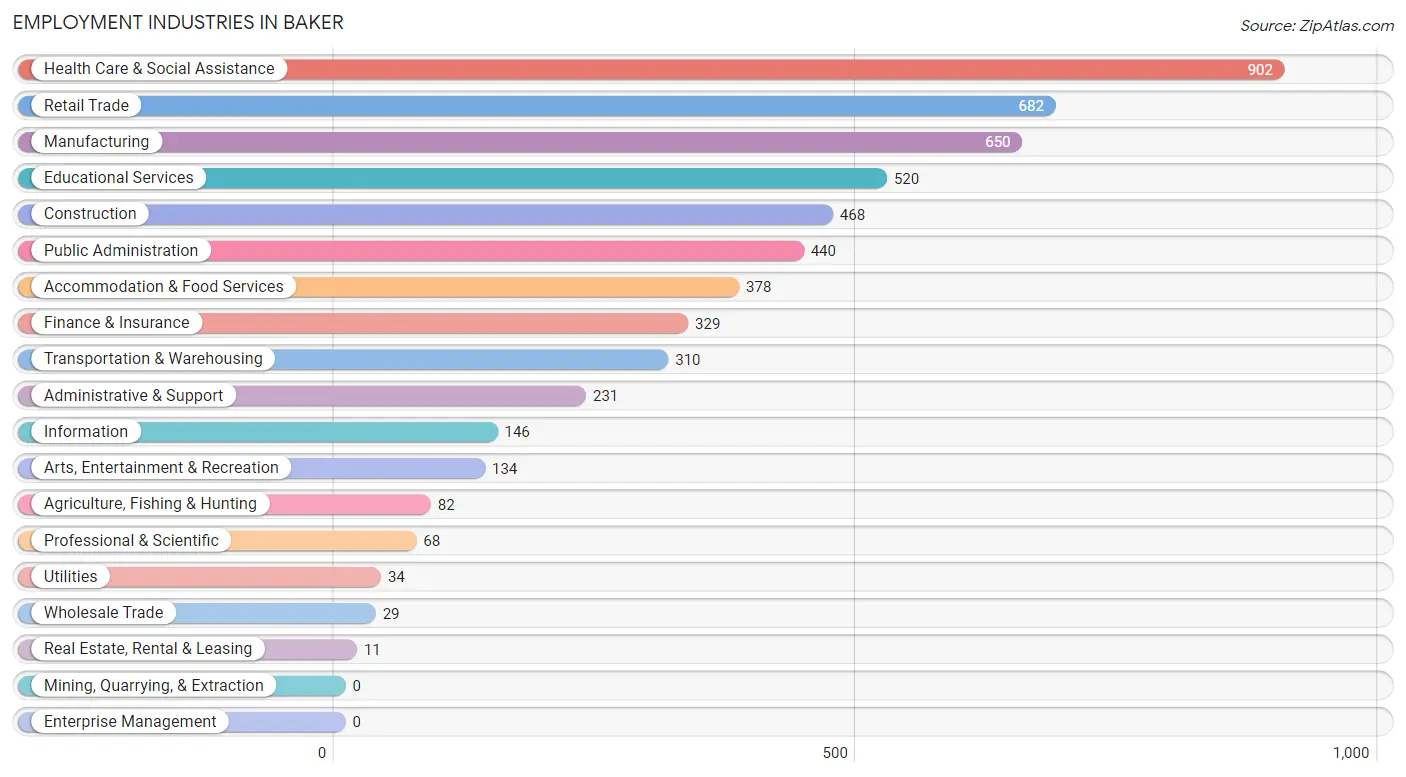
Employment Industries in Baker
The major employment industries in Baker include Health Care & Social Assistance (902 | 15.5%), Retail Trade (682 | 11.7%), Manufacturing (650 | 11.2%), Educational Services (520 | 8.9%), and Construction (468 | 8.1%).
Employment Industries by Sex in Baker
The Baker industries that see more men than women are Agriculture, Fishing & Hunting (100.0%), Wholesale Trade (100.0%), and Utilities (100.0%), whereas the industries that tend to have a higher number of women are Real Estate, Rental & Leasing (100.0%), Arts, Entertainment & Recreation (94.8%), and Health Care & Social Assistance (87.5%).
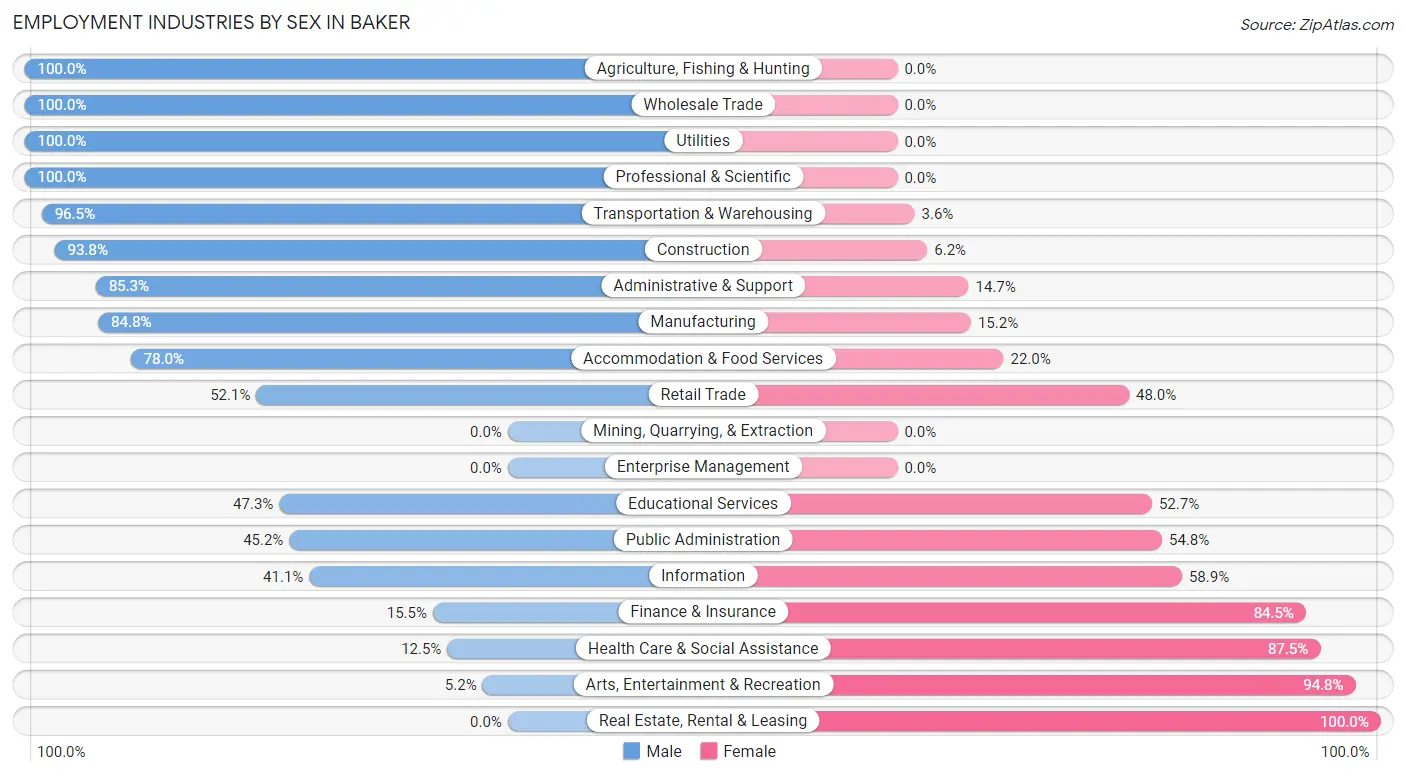
| Industry | Male | Female |
| Agriculture, Fishing & Hunting | 82 (100.0%) | 0 (0.0%) |
| Mining, Quarrying, & Extraction | 0 (0.0%) | 0 (0.0%) |
| Construction | 439 (93.8%) | 29 (6.2%) |
| Manufacturing | 551 (84.8%) | 99 (15.2%) |
| Wholesale Trade | 29 (100.0%) | 0 (0.0%) |
| Retail Trade | 355 (52.0%) | 327 (47.9%) |
| Transportation & Warehousing | 299 (96.5%) | 11 (3.5%) |
| Utilities | 34 (100.0%) | 0 (0.0%) |
| Information | 60 (41.1%) | 86 (58.9%) |
| Finance & Insurance | 51 (15.5%) | 278 (84.5%) |
| Real Estate, Rental & Leasing | 0 (0.0%) | 11 (100.0%) |
| Professional & Scientific | 68 (100.0%) | 0 (0.0%) |
| Enterprise Management | 0 (0.0%) | 0 (0.0%) |
| Administrative & Support | 197 (85.3%) | 34 (14.7%) |
| Educational Services | 246 (47.3%) | 274 (52.7%) |
| Health Care & Social Assistance | 113 (12.5%) | 789 (87.5%) |
| Arts, Entertainment & Recreation | 7 (5.2%) | 127 (94.8%) |
| Accommodation & Food Services | 295 (78.0%) | 83 (22.0%) |
| Public Administration | 199 (45.2%) | 241 (54.8%) |
| Total | 3,179 (54.7%) | 2,632 (45.3%) |
Education in Baker
School Enrollment in Baker
The most common levels of schooling among the 2,738 students in Baker are elementary school (816 | 29.8%), middle school (618 | 22.6%), and high school (493 | 18.0%).
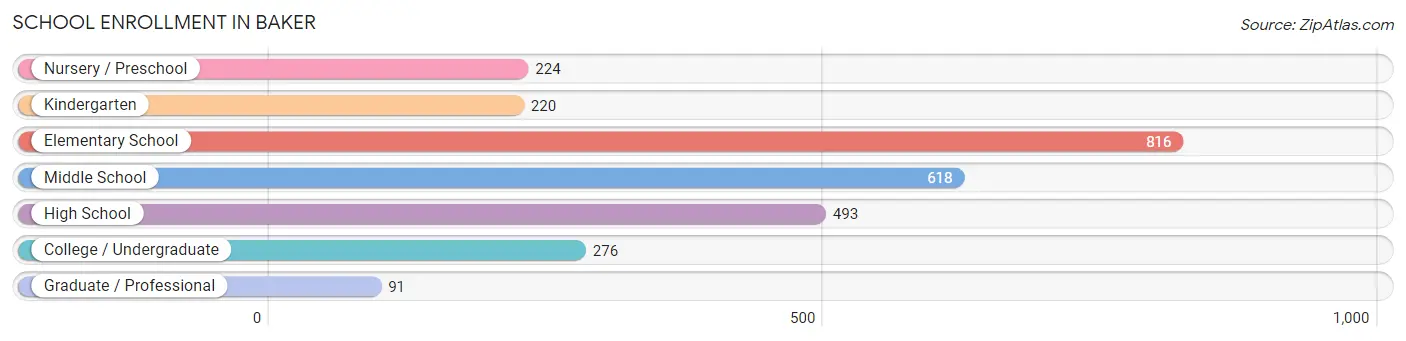
| School Level | # Students | % Students |
| Nursery / Preschool | 224 | 8.2% |
| Kindergarten | 220 | 8.0% |
| Elementary School | 816 | 29.8% |
| Middle School | 618 | 22.6% |
| High School | 493 | 18.0% |
| College / Undergraduate | 276 | 10.1% |
| Graduate / Professional | 91 | 3.3% |
| Total | 2,738 | 100.0% |
School Enrollment by Age by Funding Source in Baker
Out of a total of 2,738 students who are enrolled in schools in Baker, 230 (8.4%) attend a private institution, while the remaining 2,508 (91.6%) are enrolled in public schools. The age group of 3 to 4 year olds has the highest likelihood of being enrolled in private schools, with 52 (31.1% in the age bracket) enrolled. Conversely, the age group of 18 to 19 year olds has the lowest likelihood of being enrolled in a private school, with 248 (100.0% in the age bracket) attending a public institution.
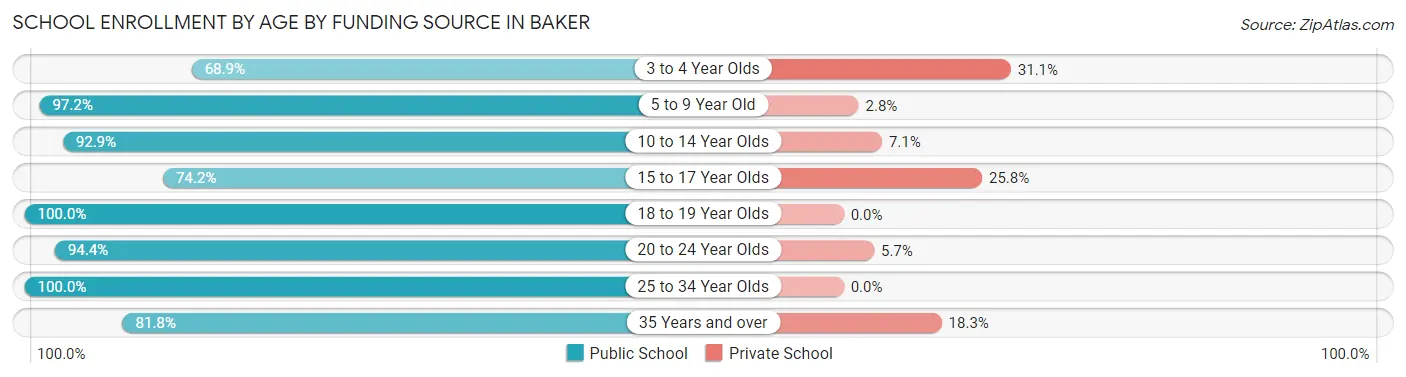
| Age Bracket | Public School | Private School |
| 3 to 4 Year Olds | 115 (68.9%) | 52 (31.1%) |
| 5 to 9 Year Old | 981 (97.2%) | 28 (2.8%) |
| 10 to 14 Year Olds | 651 (92.9%) | 50 (7.1%) |
| 15 to 17 Year Olds | 190 (74.2%) | 66 (25.8%) |
| 18 to 19 Year Olds | 248 (100.0%) | 0 (0.0%) |
| 20 to 24 Year Olds | 167 (94.4%) | 10 (5.7%) |
| 25 to 34 Year Olds | 43 (100.0%) | 0 (0.0%) |
| 35 Years and over | 112 (81.8%) | 25 (18.2%) |
| Total | 2,508 (91.6%) | 230 (8.4%) |
Educational Attainment by Field of Study in Baker
Education (358 | 22.7%), arts & humanities (275 | 17.4%), science & technology (199 | 12.6%), business (198 | 12.6%), and social sciences (112 | 7.1%) are the most common fields of study among 1,578 individuals in Baker who have obtained a bachelor's degree or higher.
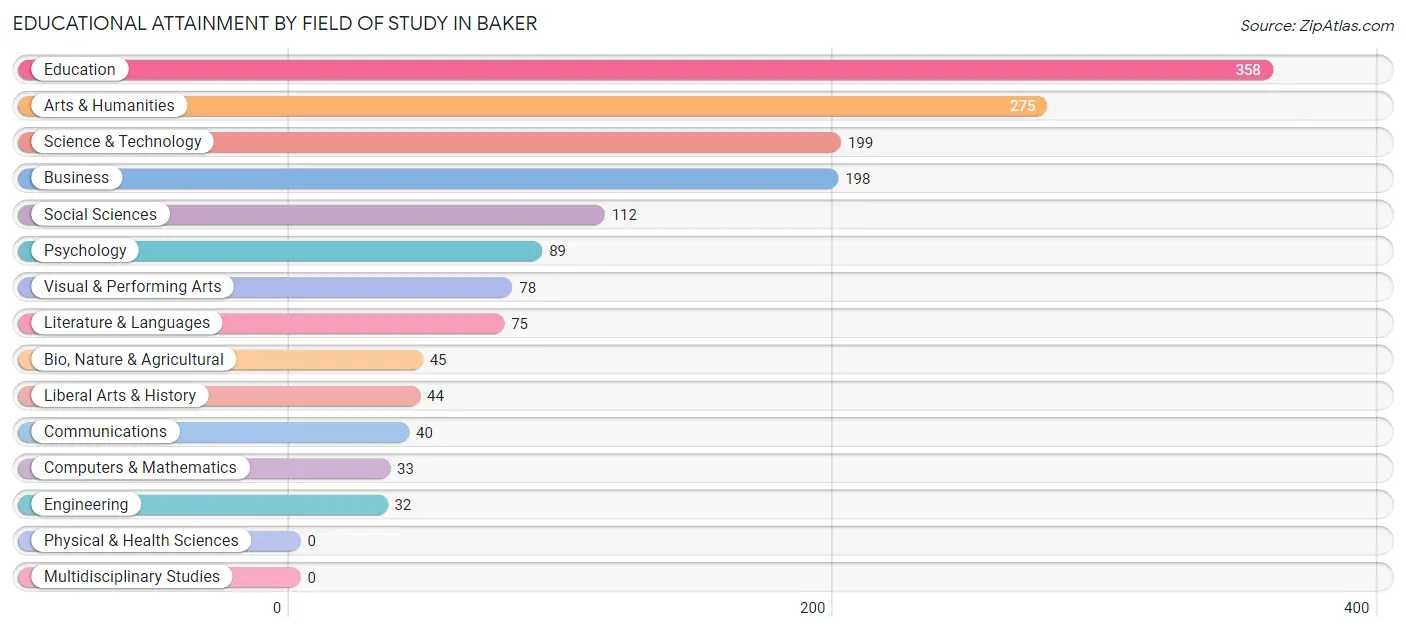
| Field of Study | # Graduates | % Graduates |
| Computers & Mathematics | 33 | 2.1% |
| Bio, Nature & Agricultural | 45 | 2.9% |
| Physical & Health Sciences | 0 | 0.0% |
| Psychology | 89 | 5.6% |
| Social Sciences | 112 | 7.1% |
| Engineering | 32 | 2.0% |
| Multidisciplinary Studies | 0 | 0.0% |
| Science & Technology | 199 | 12.6% |
| Business | 198 | 12.6% |
| Education | 358 | 22.7% |
| Literature & Languages | 75 | 4.8% |
| Liberal Arts & History | 44 | 2.8% |
| Visual & Performing Arts | 78 | 4.9% |
| Communications | 40 | 2.5% |
| Arts & Humanities | 275 | 17.4% |
| Total | 1,578 | 100.0% |
Transportation & Commute in Baker
Vehicle Availability by Sex in Baker
The most prevalent vehicle ownership categories in Baker are males with 2 vehicles (1,145, accounting for 37.7%) and females with 2 vehicles (940, making up 43.6%).
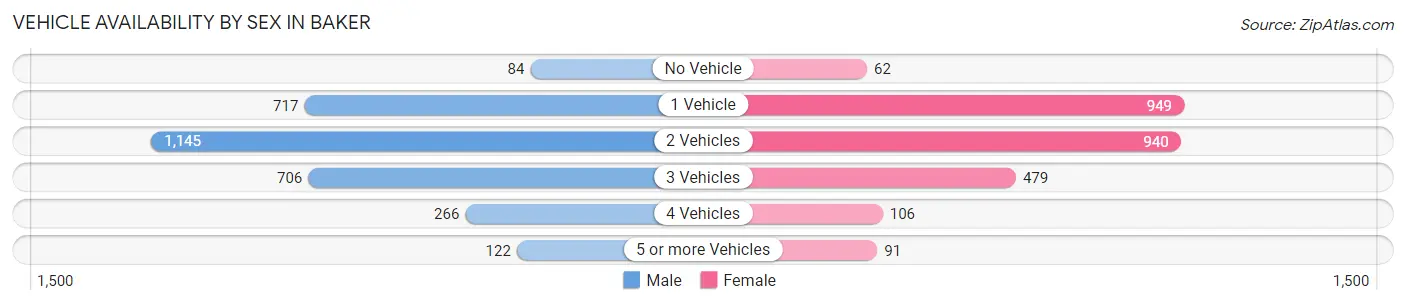
| Vehicles Available | Male | Female |
| No Vehicle | 84 (2.8%) | 62 (2.4%) |
| 1 Vehicle | 717 (23.6%) | 949 (36.1%) |
| 2 Vehicles | 1,145 (37.7%) | 940 (35.8%) |
| 3 Vehicles | 706 (23.2%) | 479 (18.2%) |
| 4 Vehicles | 266 (8.7%) | 106 (4.0%) |
| 5 or more Vehicles | 122 (4.0%) | 91 (3.5%) |
| Total | 3,040 (100.0%) | 2,627 (100.0%) |
Commute Time in Baker
The most frequently occuring commute durations in Baker are 20 to 24 minutes (1,166 commuters, 21.1%), 30 to 34 minutes (1,109 commuters, 20.0%), and 15 to 19 minutes (822 commuters, 14.8%).
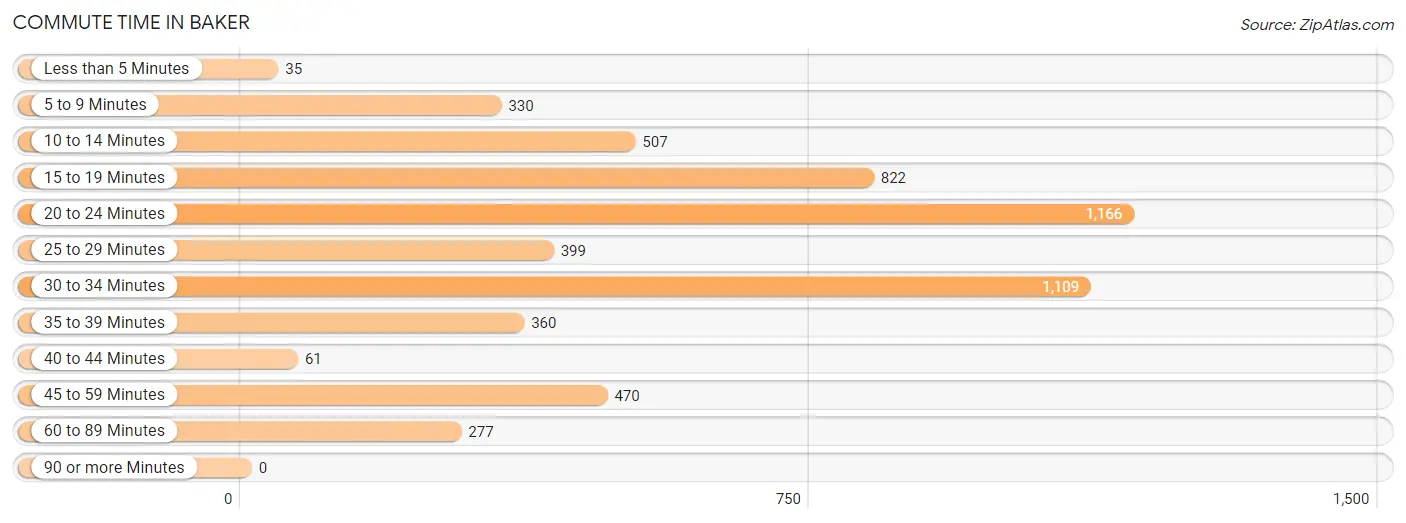
| Commute Time | # Commuters | % Commuters |
| Less than 5 Minutes | 35 | 0.6% |
| 5 to 9 Minutes | 330 | 6.0% |
| 10 to 14 Minutes | 507 | 9.2% |
| 15 to 19 Minutes | 822 | 14.8% |
| 20 to 24 Minutes | 1,166 | 21.1% |
| 25 to 29 Minutes | 399 | 7.2% |
| 30 to 34 Minutes | 1,109 | 20.0% |
| 35 to 39 Minutes | 360 | 6.5% |
| 40 to 44 Minutes | 61 | 1.1% |
| 45 to 59 Minutes | 470 | 8.5% |
| 60 to 89 Minutes | 277 | 5.0% |
| 90 or more Minutes | 0 | 0.0% |
Commute Time by Sex in Baker
The most common commute times in Baker are 20 to 24 minutes (741 commuters, 24.9%) for males and 30 to 34 minutes (511 commuters, 19.9%) for females.
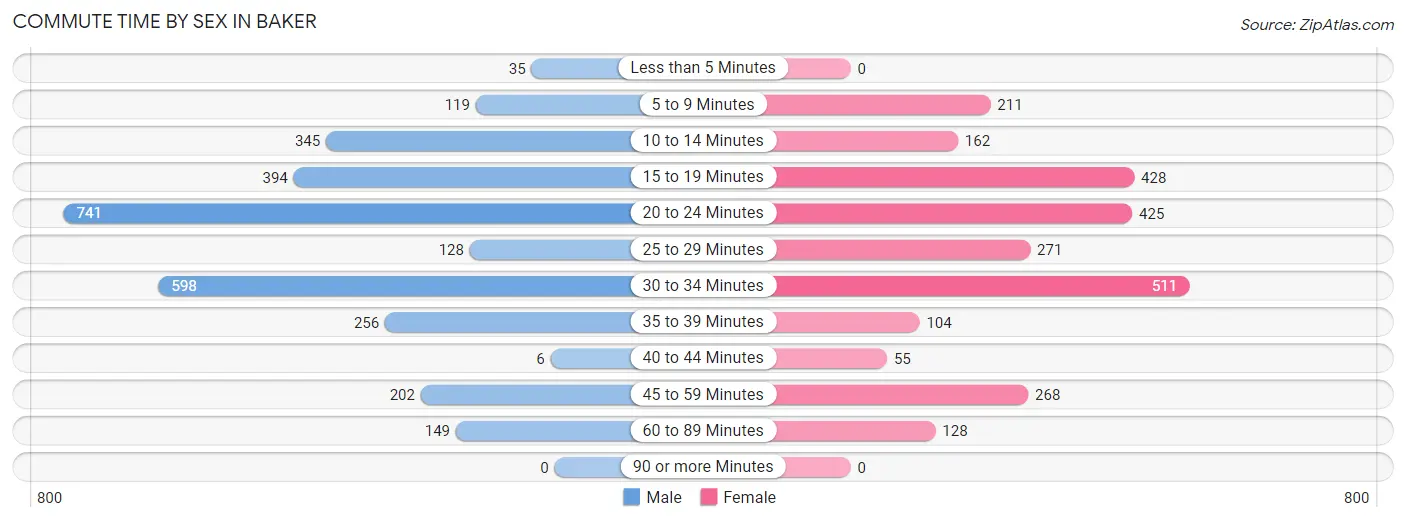
| Commute Time | Male | Female |
| Less than 5 Minutes | 35 (1.2%) | 0 (0.0%) |
| 5 to 9 Minutes | 119 (4.0%) | 211 (8.2%) |
| 10 to 14 Minutes | 345 (11.6%) | 162 (6.3%) |
| 15 to 19 Minutes | 394 (13.3%) | 428 (16.7%) |
| 20 to 24 Minutes | 741 (24.9%) | 425 (16.6%) |
| 25 to 29 Minutes | 128 (4.3%) | 271 (10.6%) |
| 30 to 34 Minutes | 598 (20.1%) | 511 (19.9%) |
| 35 to 39 Minutes | 256 (8.6%) | 104 (4.1%) |
| 40 to 44 Minutes | 6 (0.2%) | 55 (2.1%) |
| 45 to 59 Minutes | 202 (6.8%) | 268 (10.5%) |
| 60 to 89 Minutes | 149 (5.0%) | 128 (5.0%) |
| 90 or more Minutes | 0 (0.0%) | 0 (0.0%) |
Time of Departure to Work by Sex in Baker
The most frequent times of departure to work in Baker are 12:00 AM to 4:59 AM (737, 24.8%) for males and 7:30 AM to 7:59 AM (541, 21.1%) for females.
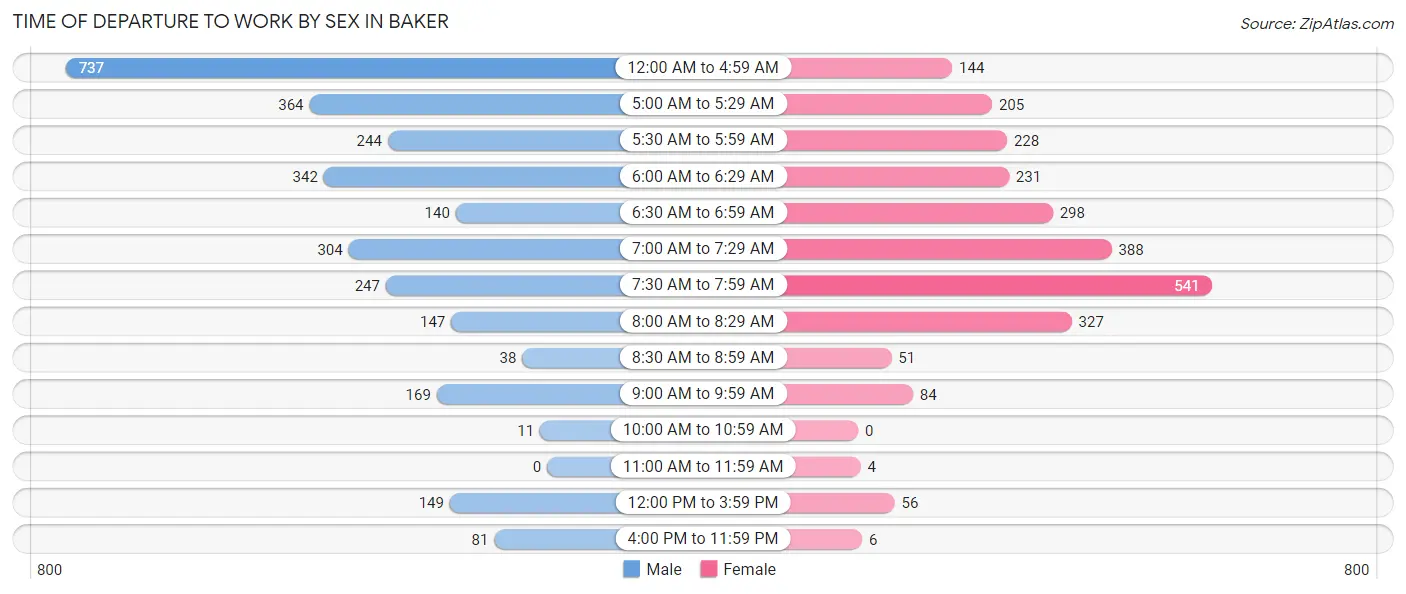
| Time of Departure | Male | Female |
| 12:00 AM to 4:59 AM | 737 (24.8%) | 144 (5.6%) |
| 5:00 AM to 5:29 AM | 364 (12.2%) | 205 (8.0%) |
| 5:30 AM to 5:59 AM | 244 (8.2%) | 228 (8.9%) |
| 6:00 AM to 6:29 AM | 342 (11.5%) | 231 (9.0%) |
| 6:30 AM to 6:59 AM | 140 (4.7%) | 298 (11.6%) |
| 7:00 AM to 7:29 AM | 304 (10.2%) | 388 (15.1%) |
| 7:30 AM to 7:59 AM | 247 (8.3%) | 541 (21.1%) |
| 8:00 AM to 8:29 AM | 147 (4.9%) | 327 (12.8%) |
| 8:30 AM to 8:59 AM | 38 (1.3%) | 51 (2.0%) |
| 9:00 AM to 9:59 AM | 169 (5.7%) | 84 (3.3%) |
| 10:00 AM to 10:59 AM | 11 (0.4%) | 0 (0.0%) |
| 11:00 AM to 11:59 AM | 0 (0.0%) | 4 (0.2%) |
| 12:00 PM to 3:59 PM | 149 (5.0%) | 56 (2.2%) |
| 4:00 PM to 11:59 PM | 81 (2.7%) | 6 (0.2%) |
| Total | 2,973 (100.0%) | 2,563 (100.0%) |
Housing Occupancy in Baker
Occupancy by Ownership in Baker
Of the total 4,227 dwellings in Baker, owner-occupied units account for 3,052 (72.2%), while renter-occupied units make up 1,175 (27.8%).
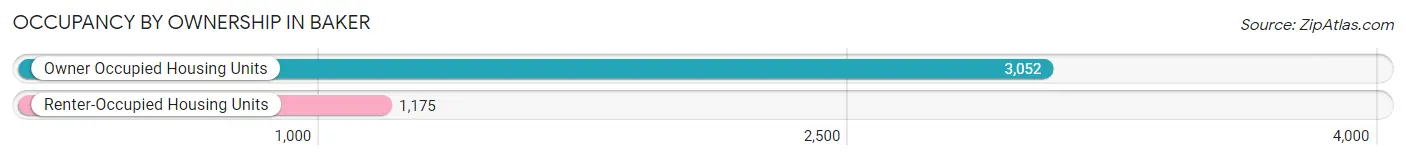
| Occupancy | # Housing Units | % Housing Units |
| Owner Occupied Housing Units | 3,052 | 72.2% |
| Renter-Occupied Housing Units | 1,175 | 27.8% |
| Total Occupied Housing Units | 4,227 | 100.0% |
Occupancy by Household Size in Baker
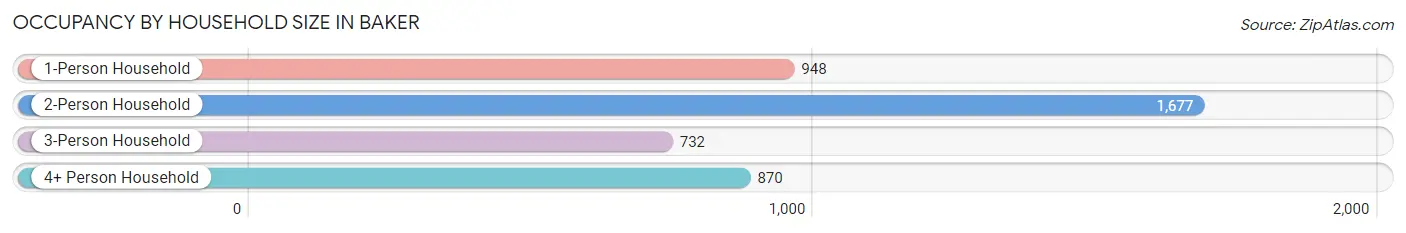
| Household Size | # Housing Units | % Housing Units |
| 1-Person Household | 948 | 22.4% |
| 2-Person Household | 1,677 | 39.7% |
| 3-Person Household | 732 | 17.3% |
| 4+ Person Household | 870 | 20.6% |
| Total Housing Units | 4,227 | 100.0% |
Occupancy by Ownership by Household Size in Baker
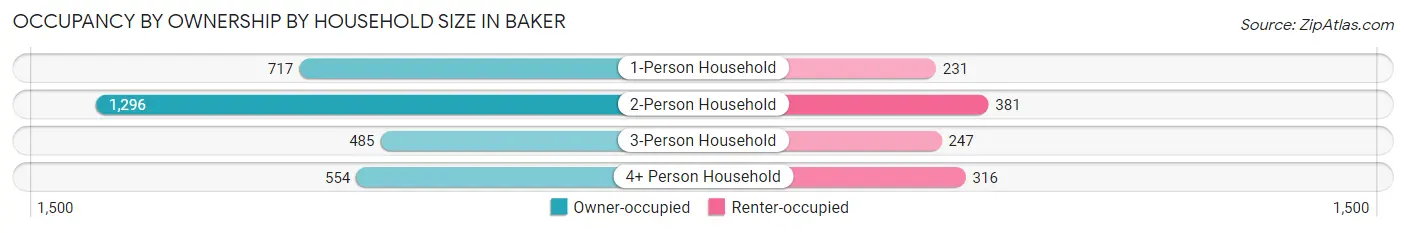
| Household Size | Owner-occupied | Renter-occupied |
| 1-Person Household | 717 (75.6%) | 231 (24.4%) |
| 2-Person Household | 1,296 (77.3%) | 381 (22.7%) |
| 3-Person Household | 485 (66.3%) | 247 (33.7%) |
| 4+ Person Household | 554 (63.7%) | 316 (36.3%) |
| Total Housing Units | 3,052 (72.2%) | 1,175 (27.8%) |
Occupancy by Educational Attainment in Baker
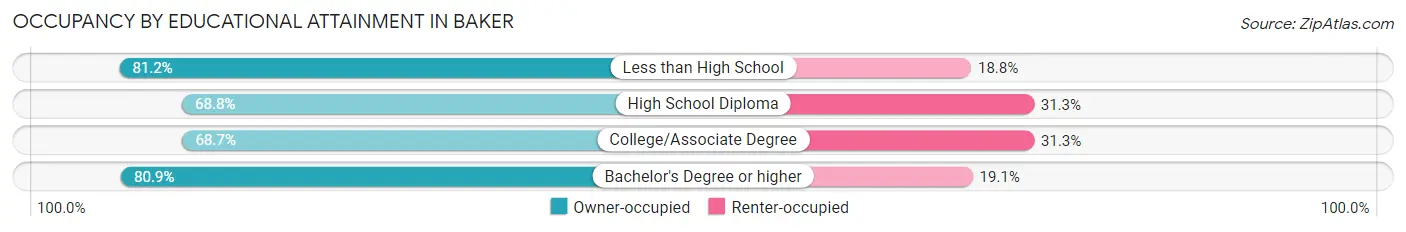
| Household Size | Owner-occupied | Renter-occupied |
| Less than High School | 341 (81.2%) | 79 (18.8%) |
| High School Diploma | 1,164 (68.8%) | 529 (31.2%) |
| College/Associate Degree | 917 (68.7%) | 418 (31.3%) |
| Bachelor's Degree or higher | 630 (80.9%) | 149 (19.1%) |
Occupancy by Age of Householder in Baker
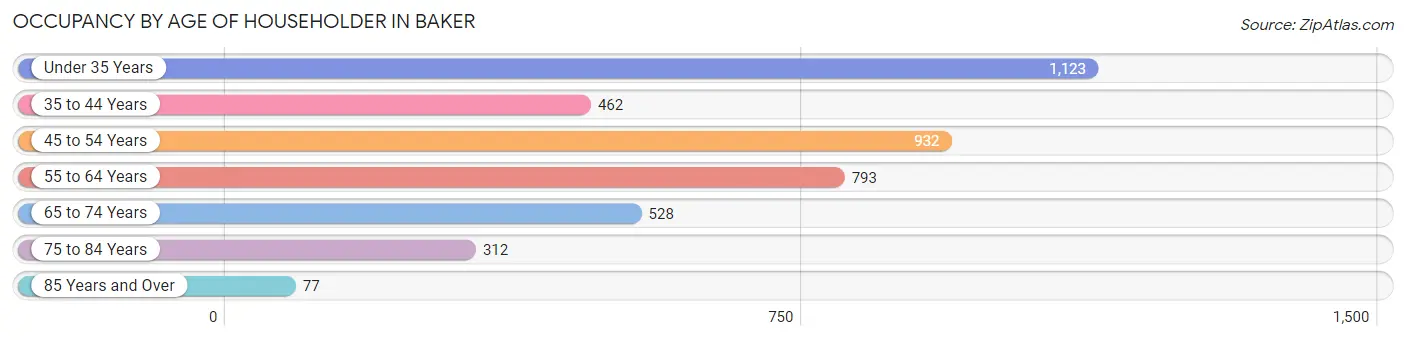
| Age Bracket | # Households | % Households |
| Under 35 Years | 1,123 | 26.6% |
| 35 to 44 Years | 462 | 10.9% |
| 45 to 54 Years | 932 | 22.1% |
| 55 to 64 Years | 793 | 18.8% |
| 65 to 74 Years | 528 | 12.5% |
| 75 to 84 Years | 312 | 7.4% |
| 85 Years and Over | 77 | 1.8% |
| Total | 4,227 | 100.0% |
Housing Finances in Baker
Median Income by Occupancy in Baker
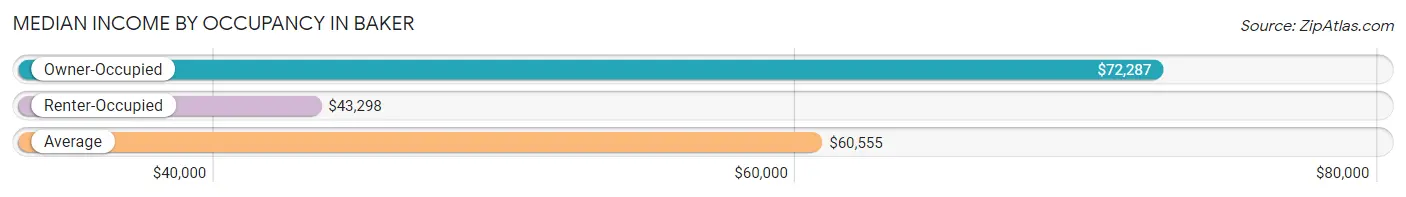
| Occupancy Type | # Households | Median Income |
| Owner-Occupied | 3,052 (72.2%) | $72,287 |
| Renter-Occupied | 1,175 (27.8%) | $43,298 |
| Average | 4,227 (100.0%) | $60,555 |
Occupancy by Householder Income Bracket in Baker
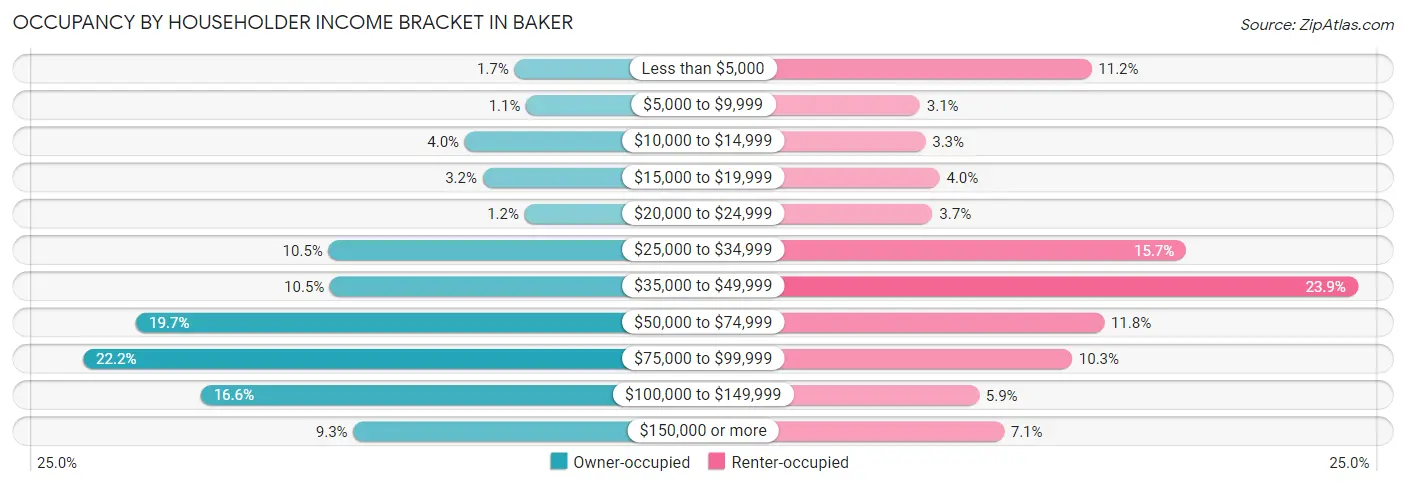
| Income Bracket | Owner-occupied | Renter-occupied |
| Less than $5,000 | 51 (1.7%) | 132 (11.2%) |
| $5,000 to $9,999 | 34 (1.1%) | 36 (3.1%) |
| $10,000 to $14,999 | 123 (4.0%) | 39 (3.3%) |
| $15,000 to $19,999 | 97 (3.2%) | 47 (4.0%) |
| $20,000 to $24,999 | 36 (1.2%) | 43 (3.7%) |
| $25,000 to $34,999 | 321 (10.5%) | 185 (15.7%) |
| $35,000 to $49,999 | 319 (10.4%) | 281 (23.9%) |
| $50,000 to $74,999 | 601 (19.7%) | 139 (11.8%) |
| $75,000 to $99,999 | 678 (22.2%) | 121 (10.3%) |
| $100,000 to $149,999 | 507 (16.6%) | 69 (5.9%) |
| $150,000 or more | 285 (9.3%) | 83 (7.1%) |
| Total | 3,052 (100.0%) | 1,175 (100.0%) |
Monthly Housing Cost Tiers in Baker
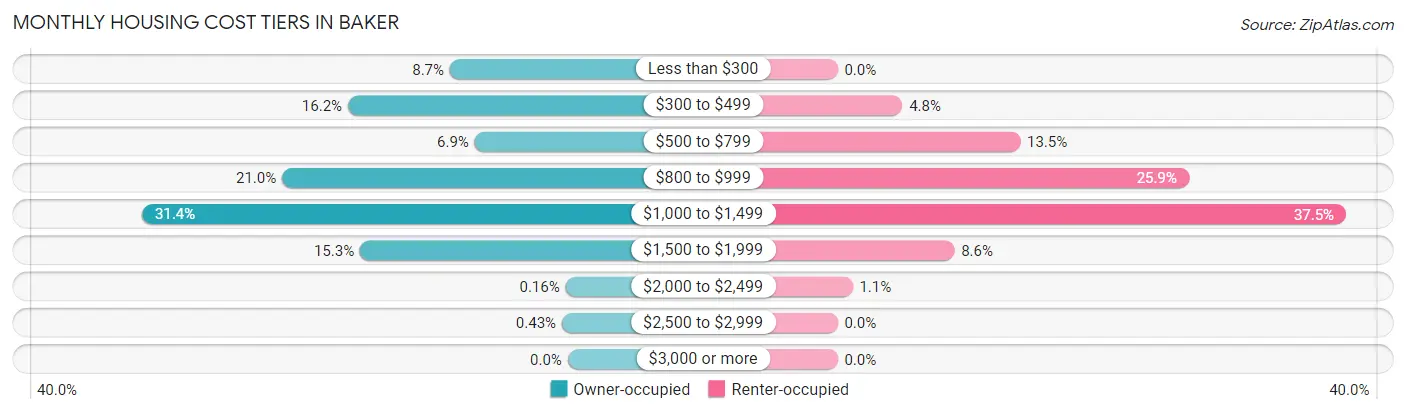
| Monthly Cost | Owner-occupied | Renter-occupied |
| Less than $300 | 265 (8.7%) | 0 (0.0%) |
| $300 to $499 | 494 (16.2%) | 56 (4.8%) |
| $500 to $799 | 209 (6.9%) | 158 (13.5%) |
| $800 to $999 | 642 (21.0%) | 304 (25.9%) |
| $1,000 to $1,499 | 957 (31.4%) | 440 (37.4%) |
| $1,500 to $1,999 | 467 (15.3%) | 101 (8.6%) |
| $2,000 to $2,499 | 5 (0.2%) | 13 (1.1%) |
| $2,500 to $2,999 | 13 (0.4%) | 0 (0.0%) |
| $3,000 or more | 0 (0.0%) | 0 (0.0%) |
| Total | 3,052 (100.0%) | 1,175 (100.0%) |
Physical Housing Characteristics in Baker
Housing Structures in Baker
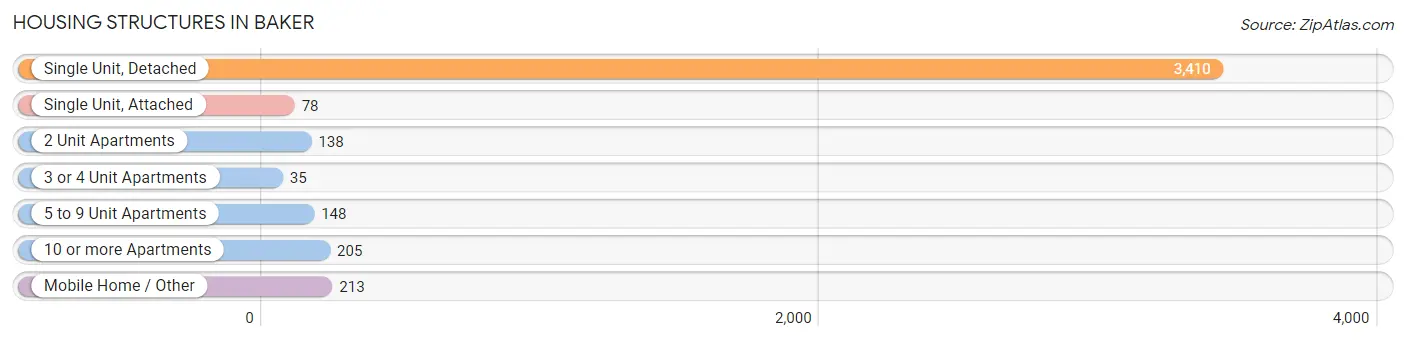
| Structure Type | # Housing Units | % Housing Units |
| Single Unit, Detached | 3,410 | 80.7% |
| Single Unit, Attached | 78 | 1.8% |
| 2 Unit Apartments | 138 | 3.3% |
| 3 or 4 Unit Apartments | 35 | 0.8% |
| 5 to 9 Unit Apartments | 148 | 3.5% |
| 10 or more Apartments | 205 | 4.9% |
| Mobile Home / Other | 213 | 5.0% |
| Total | 4,227 | 100.0% |
Housing Structures by Occupancy in Baker
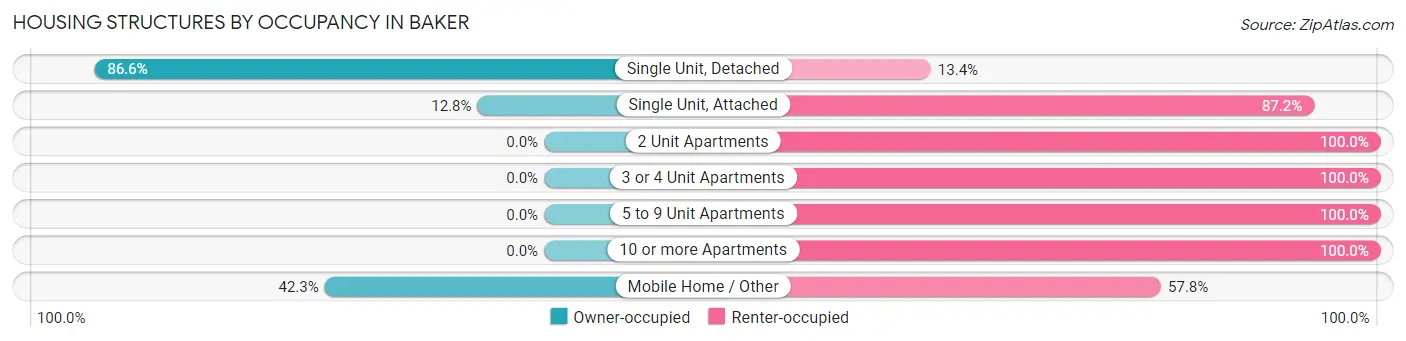
| Structure Type | Owner-occupied | Renter-occupied |
| Single Unit, Detached | 2,952 (86.6%) | 458 (13.4%) |
| Single Unit, Attached | 10 (12.8%) | 68 (87.2%) |
| 2 Unit Apartments | 0 (0.0%) | 138 (100.0%) |
| 3 or 4 Unit Apartments | 0 (0.0%) | 35 (100.0%) |
| 5 to 9 Unit Apartments | 0 (0.0%) | 148 (100.0%) |
| 10 or more Apartments | 0 (0.0%) | 205 (100.0%) |
| Mobile Home / Other | 90 (42.2%) | 123 (57.8%) |
| Total | 3,052 (72.2%) | 1,175 (27.8%) |
Housing Structures by Number of Rooms in Baker
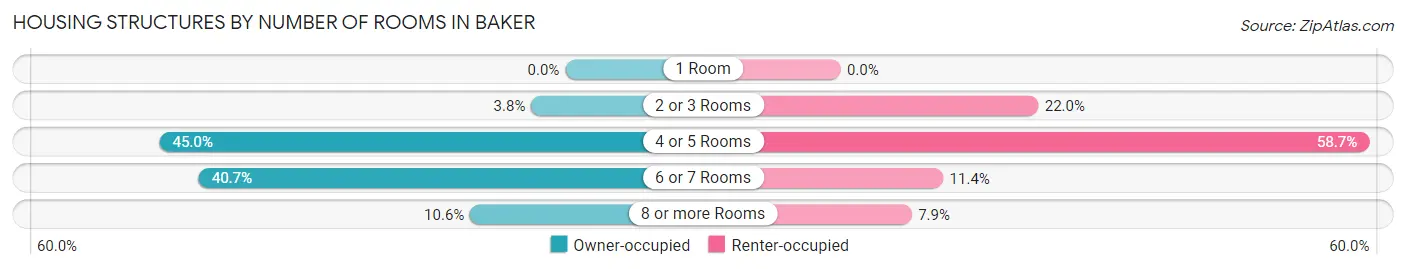
| Number of Rooms | Owner-occupied | Renter-occupied |
| 1 Room | 0 (0.0%) | 0 (0.0%) |
| 2 or 3 Rooms | 115 (3.8%) | 258 (22.0%) |
| 4 or 5 Rooms | 1,374 (45.0%) | 690 (58.7%) |
| 6 or 7 Rooms | 1,241 (40.7%) | 134 (11.4%) |
| 8 or more Rooms | 322 (10.5%) | 93 (7.9%) |
| Total | 3,052 (100.0%) | 1,175 (100.0%) |
Housing Structure by Heating Type in Baker
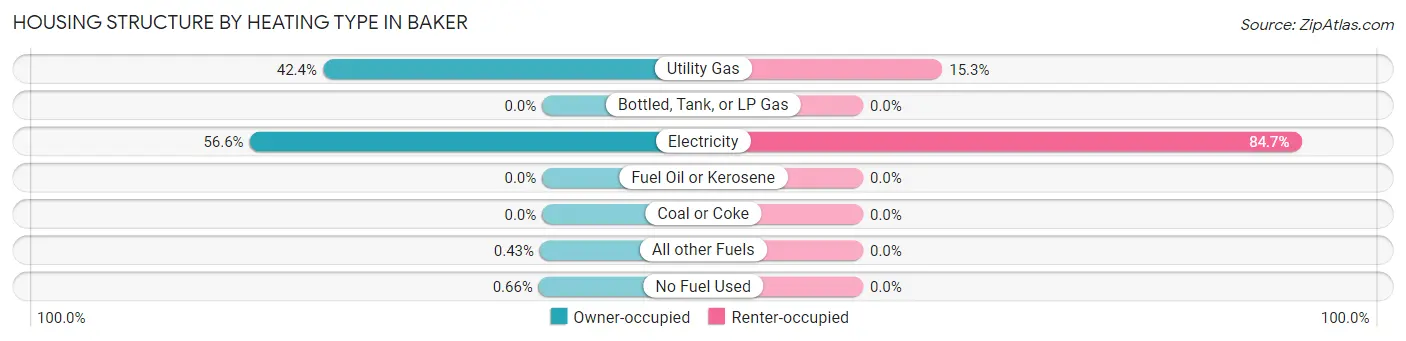
| Heating Type | Owner-occupied | Renter-occupied |
| Utility Gas | 1,293 (42.4%) | 180 (15.3%) |
| Bottled, Tank, or LP Gas | 0 (0.0%) | 0 (0.0%) |
| Electricity | 1,726 (56.6%) | 995 (84.7%) |
| Fuel Oil or Kerosene | 0 (0.0%) | 0 (0.0%) |
| Coal or Coke | 0 (0.0%) | 0 (0.0%) |
| All other Fuels | 13 (0.4%) | 0 (0.0%) |
| No Fuel Used | 20 (0.7%) | 0 (0.0%) |
| Total | 3,052 (100.0%) | 1,175 (100.0%) |
Household Vehicle Usage in Baker
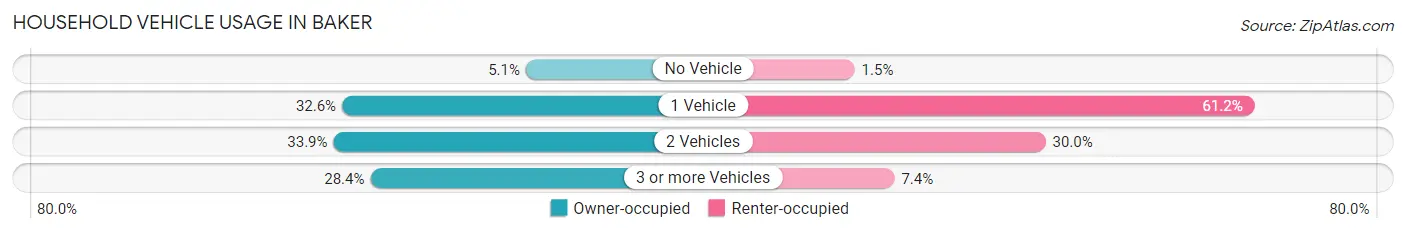
| Vehicles per Household | Owner-occupied | Renter-occupied |
| No Vehicle | 157 (5.1%) | 17 (1.5%) |
| 1 Vehicle | 995 (32.6%) | 719 (61.2%) |
| 2 Vehicles | 1,034 (33.9%) | 352 (30.0%) |
| 3 or more Vehicles | 866 (28.4%) | 87 (7.4%) |
| Total | 3,052 (100.0%) | 1,175 (100.0%) |
Real Estate & Mortgages in Baker
Real Estate and Mortgage Overview in Baker
| Characteristic | Without Mortgage | With Mortgage |
| Housing Units | 880 | 2,172 |
| Median Property Value | $109,400 | $151,700 |
| Median Household Income | $52,135 | $178 |
| Monthly Housing Costs | $361 | $0 |
| Real Estate Taxes | $199 | $244 |
Property Value by Mortgage Status in Baker
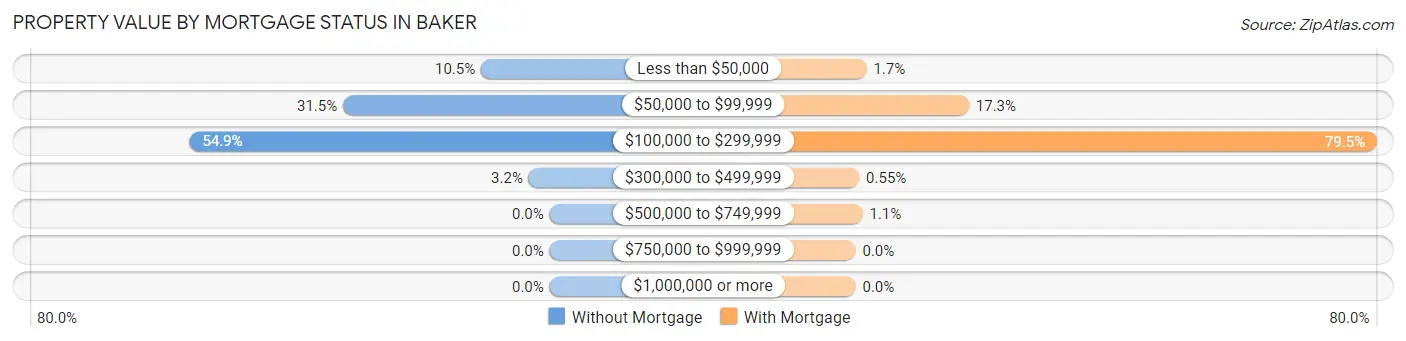
| Property Value | Without Mortgage | With Mortgage |
| Less than $50,000 | 92 (10.4%) | 36 (1.7%) |
| $50,000 to $99,999 | 277 (31.5%) | 375 (17.3%) |
| $100,000 to $299,999 | 483 (54.9%) | 1,726 (79.5%) |
| $300,000 to $499,999 | 28 (3.2%) | 12 (0.5%) |
| $500,000 to $749,999 | 0 (0.0%) | 23 (1.1%) |
| $750,000 to $999,999 | 0 (0.0%) | 0 (0.0%) |
| $1,000,000 or more | 0 (0.0%) | 0 (0.0%) |
| Total | 880 (100.0%) | 2,172 (100.0%) |
Household Income by Mortgage Status in Baker
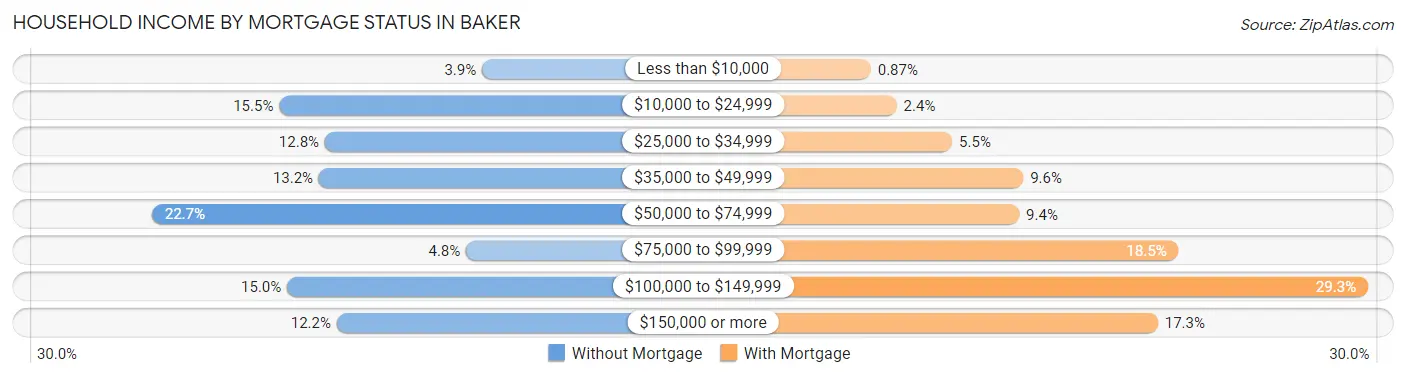
| Household Income | Without Mortgage | With Mortgage |
| Less than $10,000 | 34 (3.9%) | 19 (0.9%) |
| $10,000 to $24,999 | 136 (15.4%) | 51 (2.4%) |
| $25,000 to $34,999 | 113 (12.8%) | 120 (5.5%) |
| $35,000 to $49,999 | 116 (13.2%) | 208 (9.6%) |
| $50,000 to $74,999 | 200 (22.7%) | 203 (9.3%) |
| $75,000 to $99,999 | 42 (4.8%) | 401 (18.5%) |
| $100,000 to $149,999 | 132 (15.0%) | 636 (29.3%) |
| $150,000 or more | 107 (12.2%) | 375 (17.3%) |
| Total | 880 (100.0%) | 2,172 (100.0%) |
Property Value to Household Income Ratio in Baker
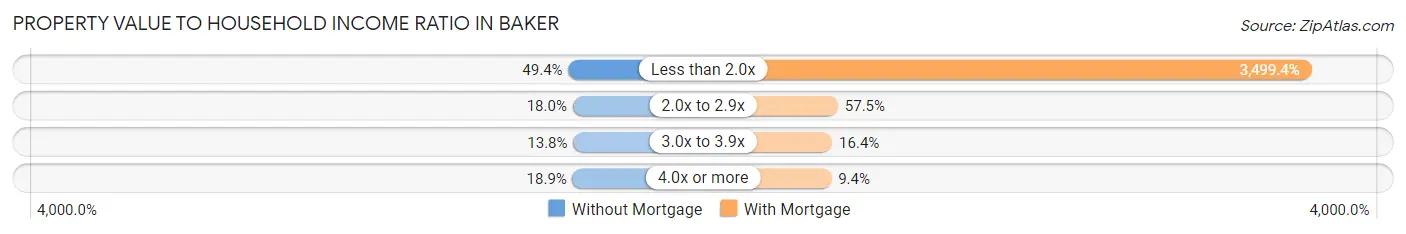
| Value-to-Income Ratio | Without Mortgage | With Mortgage |
| Less than 2.0x | 435 (49.4%) | 76,006 (3,499.4%) |
| 2.0x to 2.9x | 158 (17.9%) | 1,249 (57.5%) |
| 3.0x to 3.9x | 121 (13.8%) | 357 (16.4%) |
| 4.0x or more | 166 (18.9%) | 203 (9.3%) |
| Total | 880 (100.0%) | 2,172 (100.0%) |
Real Estate Taxes by Mortgage Status in Baker
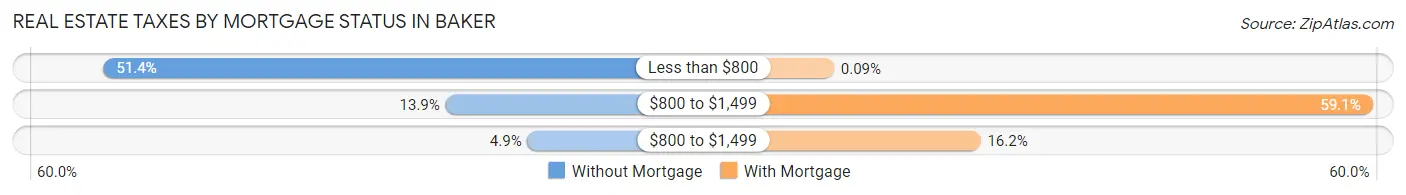
| Property Taxes | Without Mortgage | With Mortgage |
| Less than $800 | 452 (51.4%) | 2 (0.1%) |
| $800 to $1,499 | 122 (13.9%) | 1,284 (59.1%) |
| $800 to $1,499 | 43 (4.9%) | 351 (16.2%) |
| Total | 880 (100.0%) | 2,172 (100.0%) |
Health & Disability in Baker
Health Insurance Coverage by Age in Baker
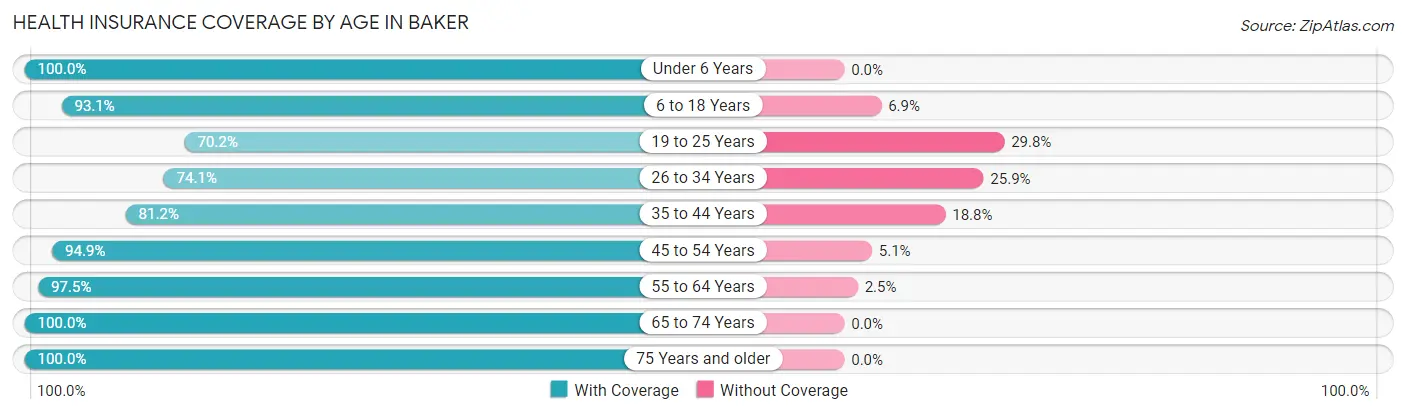
| Age Bracket | With Coverage | Without Coverage |
| Under 6 Years | 1,328 (100.0%) | 0 (0.0%) |
| 6 to 18 Years | 2,018 (93.1%) | 149 (6.9%) |
| 19 to 25 Years | 880 (70.2%) | 374 (29.8%) |
| 26 to 34 Years | 1,419 (74.1%) | 497 (25.9%) |
| 35 to 44 Years | 969 (81.2%) | 225 (18.8%) |
| 45 to 54 Years | 1,383 (94.9%) | 75 (5.1%) |
| 55 to 64 Years | 1,597 (97.5%) | 41 (2.5%) |
| 65 to 74 Years | 773 (100.0%) | 0 (0.0%) |
| 75 Years and older | 627 (100.0%) | 0 (0.0%) |
| Total | 10,994 (89.0%) | 1,361 (11.0%) |
Health Insurance Coverage by Citizenship Status in Baker
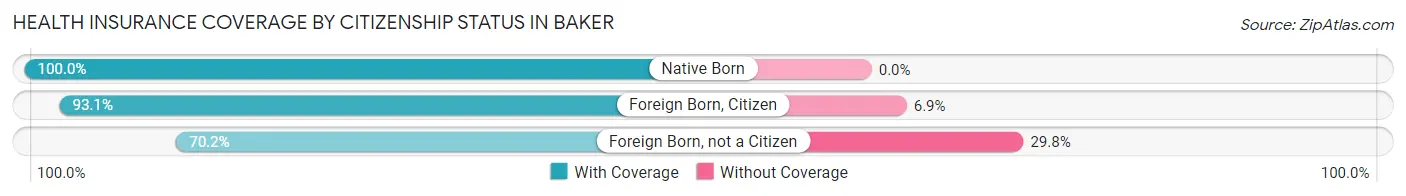
| Citizenship Status | With Coverage | Without Coverage |
| Native Born | 1,328 (100.0%) | 0 (0.0%) |
| Foreign Born, Citizen | 2,018 (93.1%) | 149 (6.9%) |
| Foreign Born, not a Citizen | 880 (70.2%) | 374 (29.8%) |
Health Insurance Coverage by Household Income in Baker
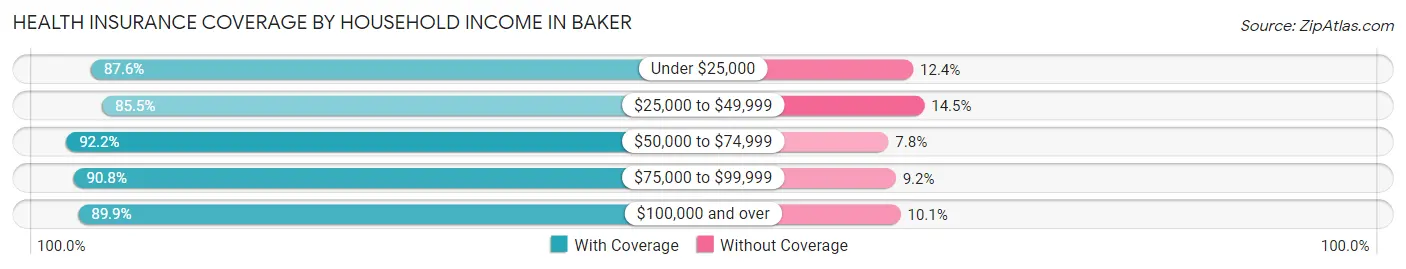
| Household Income | With Coverage | Without Coverage |
| Under $25,000 | 1,275 (87.6%) | 181 (12.4%) |
| $25,000 to $49,999 | 2,785 (85.5%) | 473 (14.5%) |
| $50,000 to $74,999 | 1,656 (92.2%) | 140 (7.8%) |
| $75,000 to $99,999 | 2,101 (90.8%) | 212 (9.2%) |
| $100,000 and over | 3,152 (89.9%) | 353 (10.1%) |
Public vs Private Health Insurance Coverage by Age in Baker
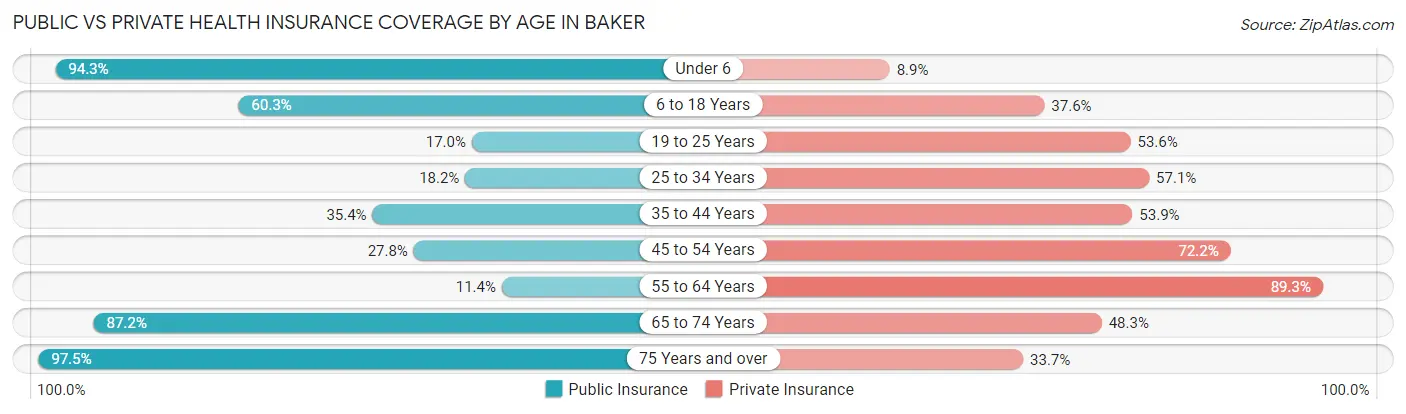
| Age Bracket | Public Insurance | Private Insurance |
| Under 6 | 1,252 (94.3%) | 118 (8.9%) |
| 6 to 18 Years | 1,307 (60.3%) | 815 (37.6%) |
| 19 to 25 Years | 213 (17.0%) | 672 (53.6%) |
| 25 to 34 Years | 349 (18.2%) | 1,093 (57.1%) |
| 35 to 44 Years | 423 (35.4%) | 644 (53.9%) |
| 45 to 54 Years | 405 (27.8%) | 1,052 (72.2%) |
| 55 to 64 Years | 187 (11.4%) | 1,462 (89.3%) |
| 65 to 74 Years | 674 (87.2%) | 373 (48.2%) |
| 75 Years and over | 611 (97.5%) | 211 (33.7%) |
| Total | 5,421 (43.9%) | 6,440 (52.1%) |
Disability Status by Sex by Age in Baker
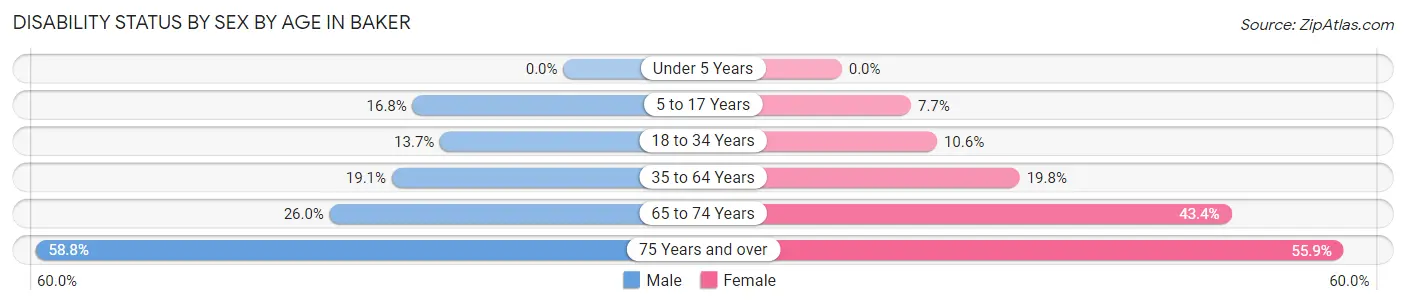
| Age Bracket | Male | Female |
| Under 5 Years | 0 (0.0%) | 0 (0.0%) |
| 5 to 17 Years | 176 (16.8%) | 80 (7.7%) |
| 18 to 34 Years | 234 (13.7%) | 178 (10.6%) |
| 35 to 64 Years | 406 (19.1%) | 429 (19.8%) |
| 65 to 74 Years | 83 (26.0%) | 197 (43.4%) |
| 75 Years and over | 154 (58.8%) | 204 (55.9%) |
Disability Class by Sex by Age in Baker
Disability Class: Hearing Difficulty
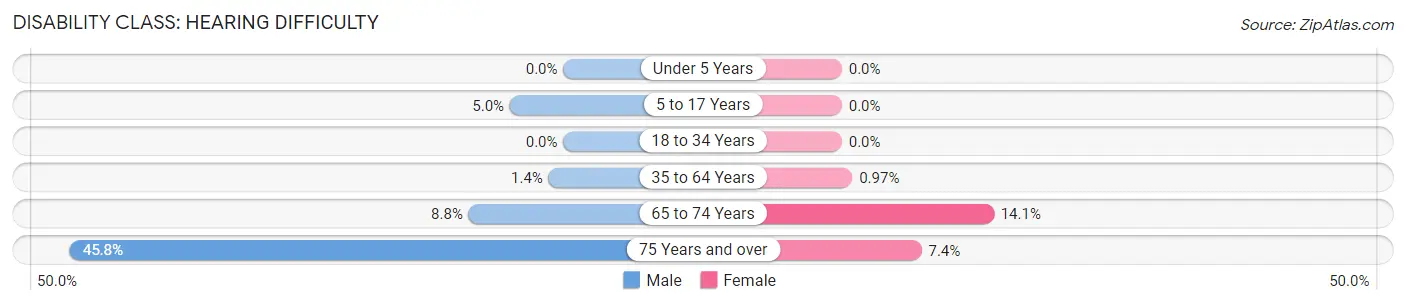
| Age Bracket | Male | Female |
| Under 5 Years | 0 (0.0%) | 0 (0.0%) |
| 5 to 17 Years | 52 (5.0%) | 0 (0.0%) |
| 18 to 34 Years | 0 (0.0%) | 0 (0.0%) |
| 35 to 64 Years | 29 (1.4%) | 21 (1.0%) |
| 65 to 74 Years | 28 (8.8%) | 64 (14.1%) |
| 75 Years and over | 120 (45.8%) | 27 (7.4%) |
Disability Class: Vision Difficulty
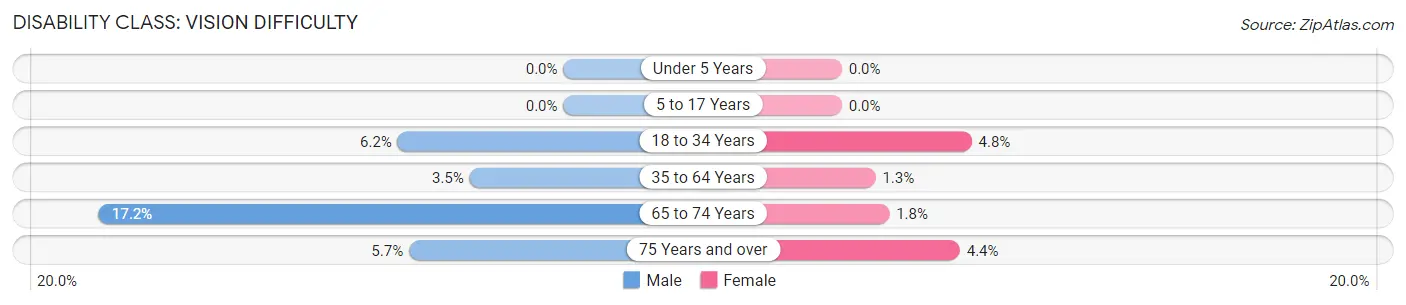
| Age Bracket | Male | Female |
| Under 5 Years | 0 (0.0%) | 0 (0.0%) |
| 5 to 17 Years | 0 (0.0%) | 0 (0.0%) |
| 18 to 34 Years | 105 (6.1%) | 81 (4.8%) |
| 35 to 64 Years | 74 (3.5%) | 27 (1.3%) |
| 65 to 74 Years | 55 (17.2%) | 8 (1.8%) |
| 75 Years and over | 15 (5.7%) | 16 (4.4%) |
Disability Class: Cognitive Difficulty
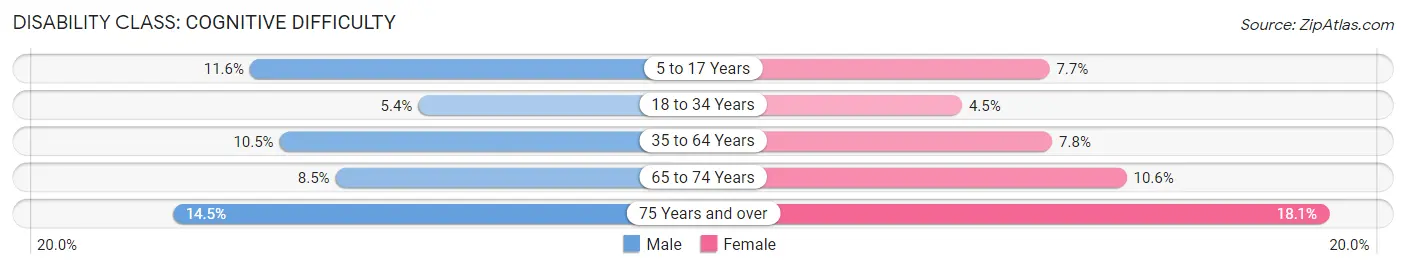
| Age Bracket | Male | Female |
| 5 to 17 Years | 122 (11.6%) | 80 (7.7%) |
| 18 to 34 Years | 92 (5.4%) | 75 (4.5%) |
| 35 to 64 Years | 224 (10.5%) | 169 (7.8%) |
| 65 to 74 Years | 27 (8.5%) | 48 (10.6%) |
| 75 Years and over | 38 (14.5%) | 66 (18.1%) |
Disability Class: Ambulatory Difficulty
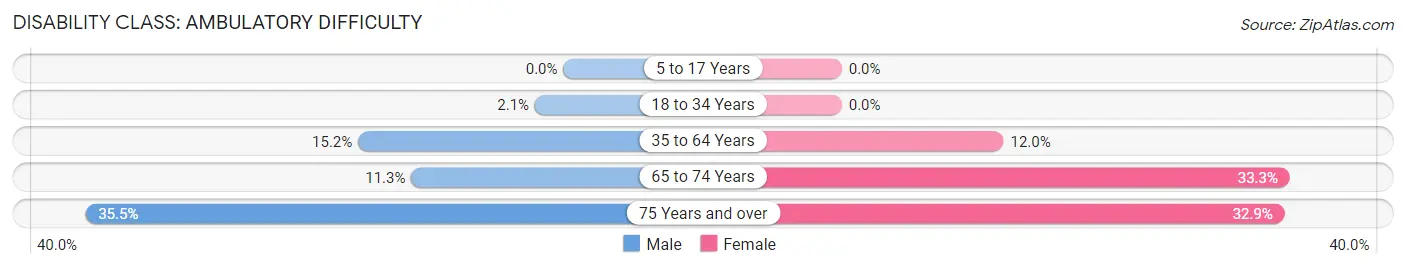
| Age Bracket | Male | Female |
| 5 to 17 Years | 0 (0.0%) | 0 (0.0%) |
| 18 to 34 Years | 36 (2.1%) | 0 (0.0%) |
| 35 to 64 Years | 324 (15.2%) | 260 (12.0%) |
| 65 to 74 Years | 36 (11.3%) | 151 (33.3%) |
| 75 Years and over | 93 (35.5%) | 120 (32.9%) |
Disability Class: Self-Care Difficulty
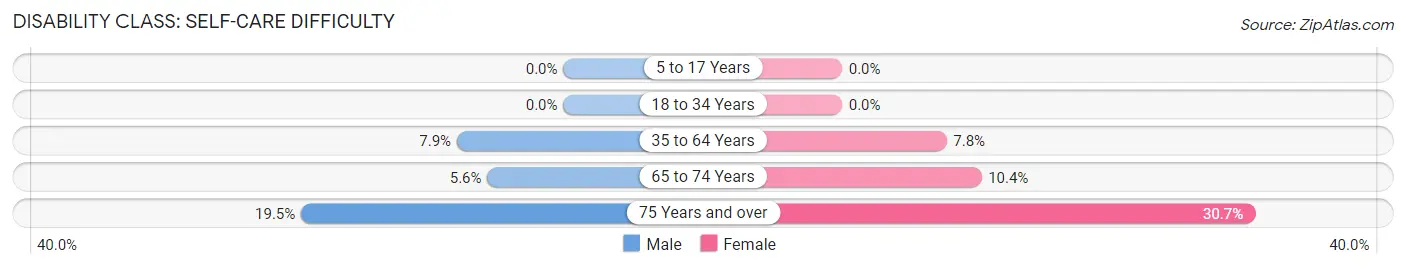
| Age Bracket | Male | Female |
| 5 to 17 Years | 0 (0.0%) | 0 (0.0%) |
| 18 to 34 Years | 0 (0.0%) | 0 (0.0%) |
| 35 to 64 Years | 168 (7.9%) | 168 (7.8%) |
| 65 to 74 Years | 18 (5.6%) | 47 (10.3%) |
| 75 Years and over | 51 (19.5%) | 112 (30.7%) |
Technology Access in Baker
Computing Device Access in Baker
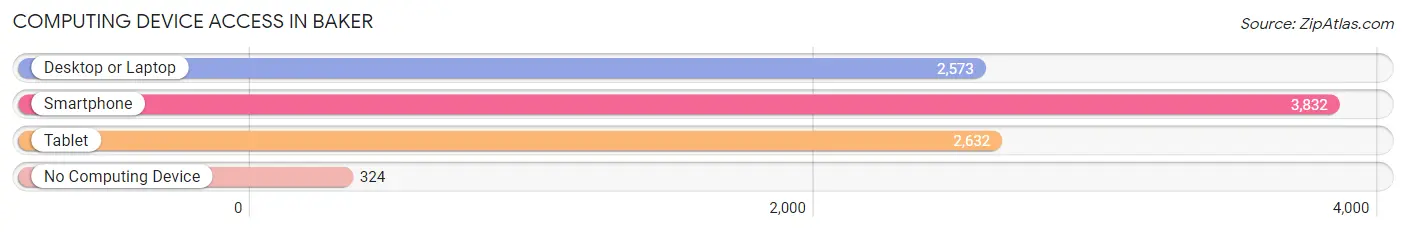
| Device Type | # Households | % Households |
| Desktop or Laptop | 2,573 | 60.9% |
| Smartphone | 3,832 | 90.7% |
| Tablet | 2,632 | 62.3% |
| No Computing Device | 324 | 7.7% |
| Total | 4,227 | 100.0% |
Internet Access in Baker
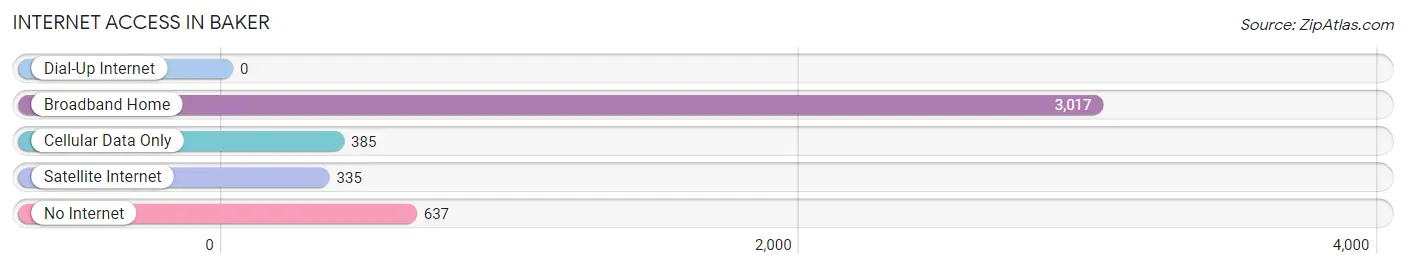
| Internet Type | # Households | % Households |
| Dial-Up Internet | 0 | 0.0% |
| Broadband Home | 3,017 | 71.4% |
| Cellular Data Only | 385 | 9.1% |
| Satellite Internet | 335 | 7.9% |
| No Internet | 637 | 15.1% |
| Total | 4,227 | 100.0% |
Baker Summary
Baker is a city located in East Baton Rouge Parish, Louisiana. It is part of the Baton Rouge Metropolitan Statistical Area. The population was 13,895 at the 2010 census, an increase of more than 50% since 2000.
History
Baker was founded in 1868 by a group of settlers from the nearby town of Clinton. The town was named after Captain John Baker, a Confederate soldier who was killed in the Battle of Baton Rouge during the Civil War. The town was incorporated in 1878 and has grown steadily since then.
Geography
Baker is located at 30°33'25" North, 91°7'25" West (30.556944, -91.123611). It is situated on the east bank of the Mississippi River, about 10 miles north of downtown Baton Rouge. The city has a total area of 8.2 square miles, of which 8.1 square miles is land and 0.1 square miles is water.
Economy
Baker is home to a variety of businesses, including manufacturing, retail, and service industries. The city is also home to several large employers, including ExxonMobil, Dow Chemical, and Entergy. The city also has a thriving tourism industry, with many attractions such as the Louisiana State Capitol, the USS Kidd Veterans Memorial, and the Louisiana State Museum.
Demographics
As of the 2010 census, there were 13,895 people, 5,093 households, and 3,541 families residing in the city. The population density was 1,711.3 people per square mile. The racial makeup of the city was 57.2% African American, 37.3% White, 0.5% Native American, 0.7% Asian, 0.1% Pacific Islander, 1.7% from other races, and 2.5% from two or more races. Hispanic or Latino of any race were 4.2% of the population.
The median income for a household in the city was $37,945, and the median income for a family was $45,945. Males had a median income of $35,945 versus $27,945 for females. The per capita income for the city was $17,945. About 16.2% of families and 19.2% of the population were below the poverty line, including 28.2% of those under age 18 and 11.2% of those age 65 or over.
Conclusion
Baker is a city located in East Baton Rouge Parish, Louisiana. It is part of the Baton Rouge Metropolitan Statistical Area and has a population of 13,895. The city was founded in 1868 and has grown steadily since then. It is home to a variety of businesses, including manufacturing, retail, and service industries. The city also has a thriving tourism industry, with many attractions such as the Louisiana State Capitol, the USS Kidd Veterans Memorial, and the Louisiana State Museum. The population is 57.2% African American, 37.3% White, 0.5% Native American, 0.7% Asian, 0.1% Pacific Islander, 1.7% from other races, and 2.5% from two or more races. The median income for a household in the city was $37,945, and the median income for a family was $45,945. About 16.2% of families and 19.2% of the population were below the poverty line.
Common Questions
What is the Total Population of Baker?
Total Population of Baker is 12,463.
What is the Total Male Population of Baker?
Total Male Population of Baker is 5,777.
What is the Total Female Population of Baker?
Total Female Population of Baker is 6,686.
What is the Ratio of Males per 100 Females in Baker?
There are 86.40 Males per 100 Females in Baker.
What is the Ratio of Females per 100 Males in Baker?
There are 115.73 Females per 100 Males in Baker.
What is the Median Population Age in Baker?
Median Population Age in Baker is 32.8 Years.
What is the Average Family Size in Baker
Average Family Size in Baker is 3.5 People.
What is the Average Household Size in Baker
Average Household Size in Baker is 2.9 People.
What is Per Capita Income in Baker?
Per Capita income in Baker is $26,252.
What is the Median Family Income in Baker?
Median Family Income in Baker is $62,333.
What is the Median Household income in Baker?
Median Household Income in Baker is $60,555.
What is Income or Wage Gap in Baker?
Income or Wage Gap in Baker is 14.4%.
Women in Baker earn 85.6 cents for every dollar earned by a man.
What is Inequality or Gini Index in Baker?
Inequality or Gini Index in Baker is 0.39.
How Large is the Labor Force in Baker?
There are 6,650 People in the Labor Forcein in Baker.
What is the Percentage of People in the Labor Force in Baker?
71.4% of People are in the Labor Force in Baker.
What is the Unemployment Rate in Baker?
Unemployment Rate in Baker is 12.6%.