Whitley County, KY
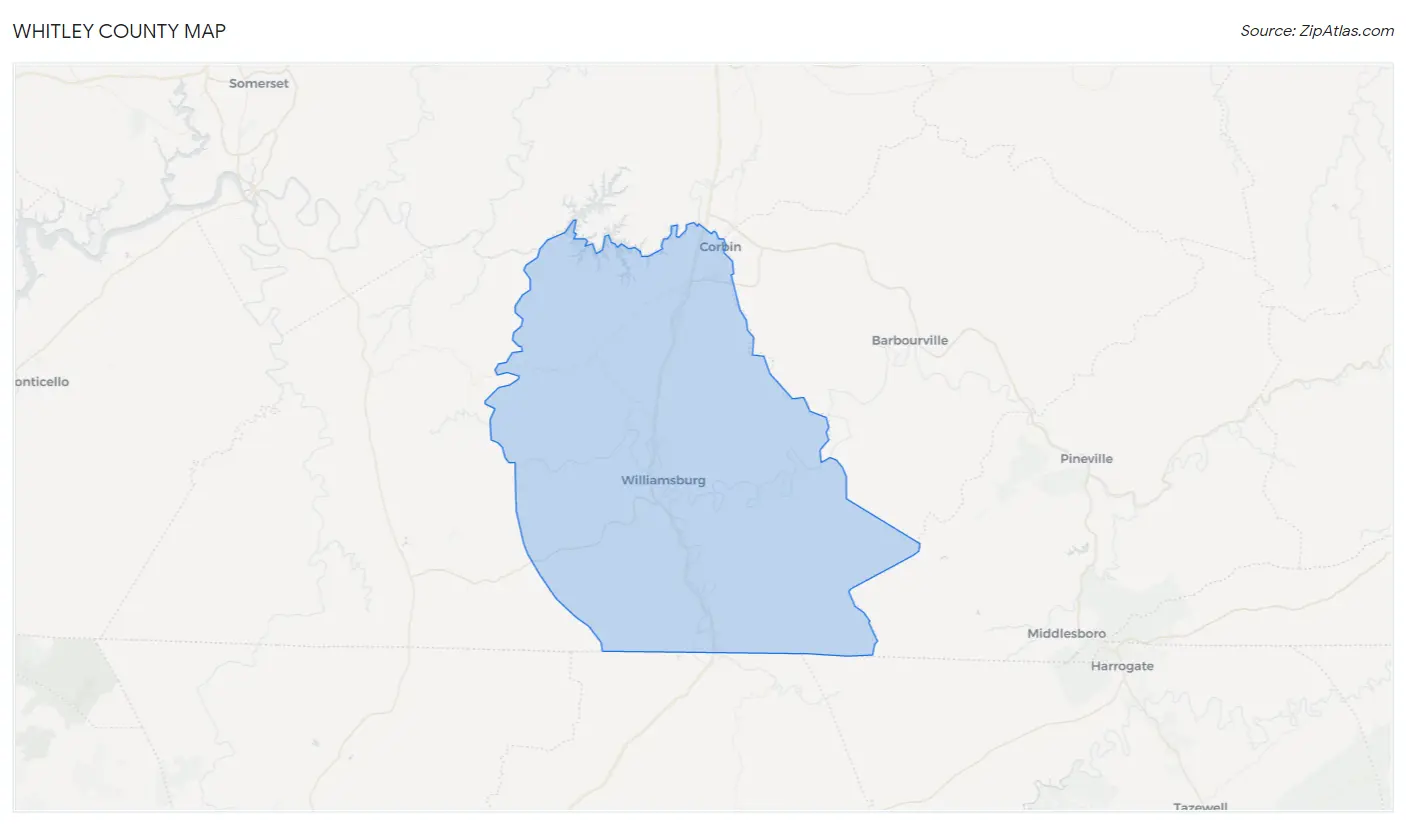
Whitley County Map
Whitley County Overview
36,648
TOTAL POPULATION
18,114
MALE POPULATION
18,534
FEMALE POPULATION
97.73
MALES / 100 FEMALES
102.32
FEMALES / 100 MALES
36.1
MEDIAN AGE
3.1
AVG FAMILY SIZE
2.7
AVG HOUSEHOLD SIZE
$22,310
PER CAPITA INCOME
$53,387
AVG FAMILY INCOME
$44,332
AVG HOUSEHOLD INCOME
29.3%
WAGE / INCOME GAP [ % ]
70.7¢/ $1
WAGE / INCOME GAP [ $ ]
$10,803
FAMILY INCOME DEFICIT
0.49
INEQUALITY / GINI INDEX
14,171
LABOR FORCE [ PEOPLE ]
50.4%
PERCENT IN LABOR FORCE
6.4%
UNEMPLOYMENT RATE
Whitley County Area Codes
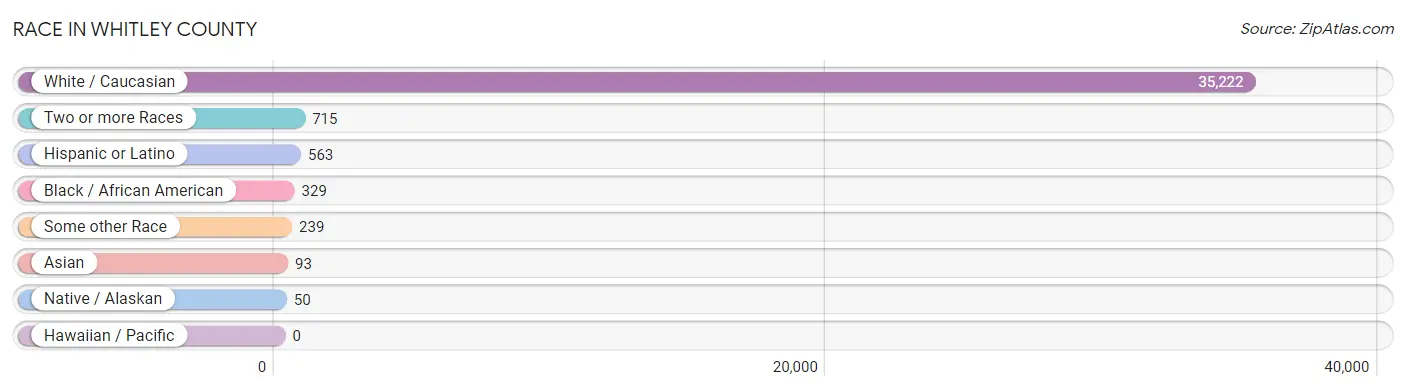
Race in Whitley County
The most populous races in Whitley County are White / Caucasian (35,222 | 96.1%), Two or more Races (715 | 1.9%), and Hispanic or Latino (563 | 1.5%).
| Race | # Population | % Population |
| Asian | 93 | 0.3% |
| Black / African American | 329 | 0.9% |
| Hawaiian / Pacific | 0 | 0.0% |
| Hispanic or Latino | 563 | 1.5% |
| Native / Alaskan | 50 | 0.1% |
| White / Caucasian | 35,222 | 96.1% |
| Two or more Races | 715 | 1.9% |
| Some other Race | 239 | 0.6% |
| Total | 36,648 | 100.0% |
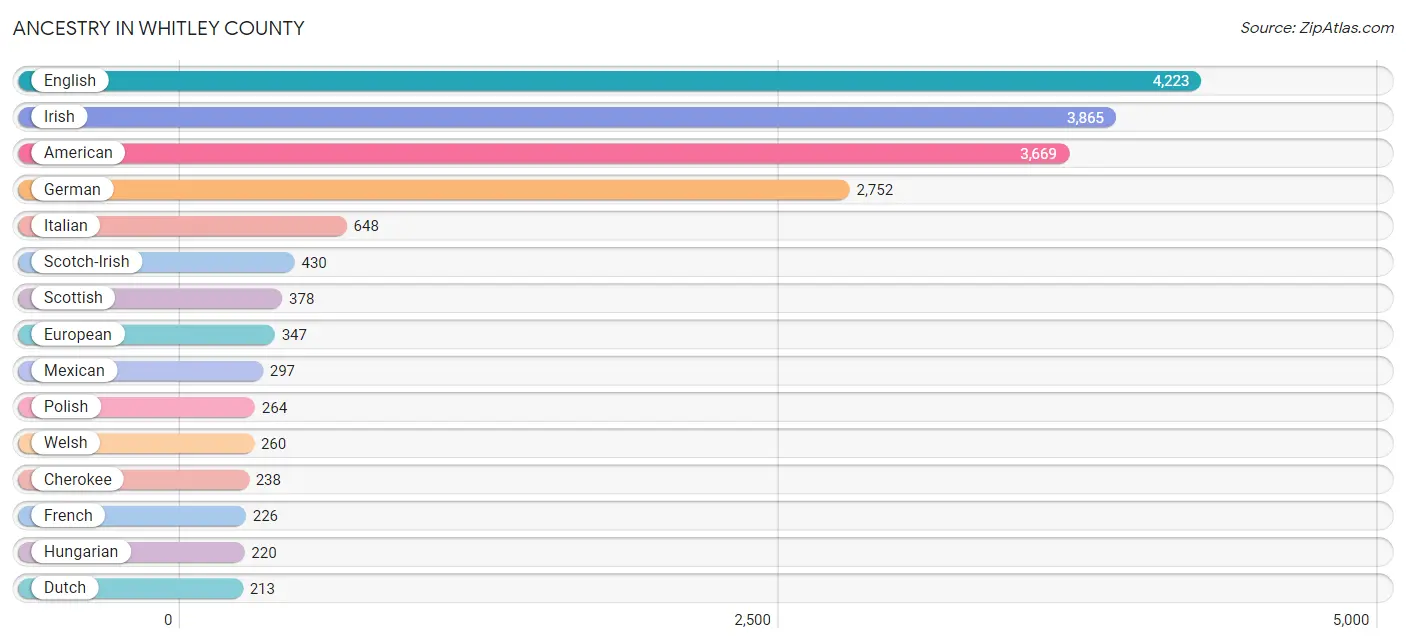
Ancestry in Whitley County
The most populous ancestries reported in Whitley County are English (4,223 | 11.5%), Irish (3,865 | 10.5%), American (3,669 | 10.0%), German (2,752 | 7.5%), and Italian (648 | 1.8%), together accounting for 41.4% of all Whitley County residents.
| Ancestry | # Population | % Population |
| African | 51 | 0.1% |
| American | 3,669 | 10.0% |
| Arab | 28 | 0.1% |
| Argentinean | 4 | 0.0% |
| Belgian | 13 | 0.0% |
| Bhutanese | 17 | 0.1% |
| Blackfeet | 5 | 0.0% |
| British | 170 | 0.5% |
| Burmese | 5 | 0.0% |
| Canadian | 7 | 0.0% |
| Central American | 22 | 0.1% |
| Central American Indian | 6 | 0.0% |
| Cherokee | 238 | 0.6% |
| Chippewa | 9 | 0.0% |
| Croatian | 7 | 0.0% |
| Czech | 97 | 0.3% |
| Czechoslovakian | 22 | 0.1% |
| Dutch | 213 | 0.6% |
| Eastern European | 44 | 0.1% |
| English | 4,223 | 11.5% |
| European | 347 | 0.9% |
| Finnish | 61 | 0.2% |
| French | 226 | 0.6% |
| German | 2,752 | 7.5% |
| Guatemalan | 7 | 0.0% |
| Honduran | 15 | 0.0% |
| Hungarian | 220 | 0.6% |
| Indian (Asian) | 25 | 0.1% |
| Irish | 3,865 | 10.5% |
| Italian | 648 | 1.8% |
| Korean | 50 | 0.1% |
| Lebanese | 9 | 0.0% |
| Lithuanian | 25 | 0.1% |
| Mexican | 297 | 0.8% |
| Nigerian | 4 | 0.0% |
| Northern European | 15 | 0.0% |
| Norwegian | 156 | 0.4% |
| Pakistani | 88 | 0.2% |
| Polish | 264 | 0.7% |
| Portuguese | 6 | 0.0% |
| Puerto Rican | 167 | 0.5% |
| Romanian | 4 | 0.0% |
| Scandinavian | 94 | 0.3% |
| Scotch-Irish | 430 | 1.2% |
| Scottish | 378 | 1.0% |
| South American | 4 | 0.0% |
| Spaniard | 57 | 0.2% |
| Spanish | 16 | 0.0% |
| Subsaharan African | 68 | 0.2% |
| Sudanese | 13 | 0.0% |
| Swedish | 158 | 0.4% |
| Swiss | 18 | 0.1% |
| Syrian | 4 | 0.0% |
| Thai | 26 | 0.1% |
| Ukrainian | 161 | 0.4% |
| Welsh | 260 | 0.7% |
| West Indian | 4 | 0.0% | View All 57 Rows |
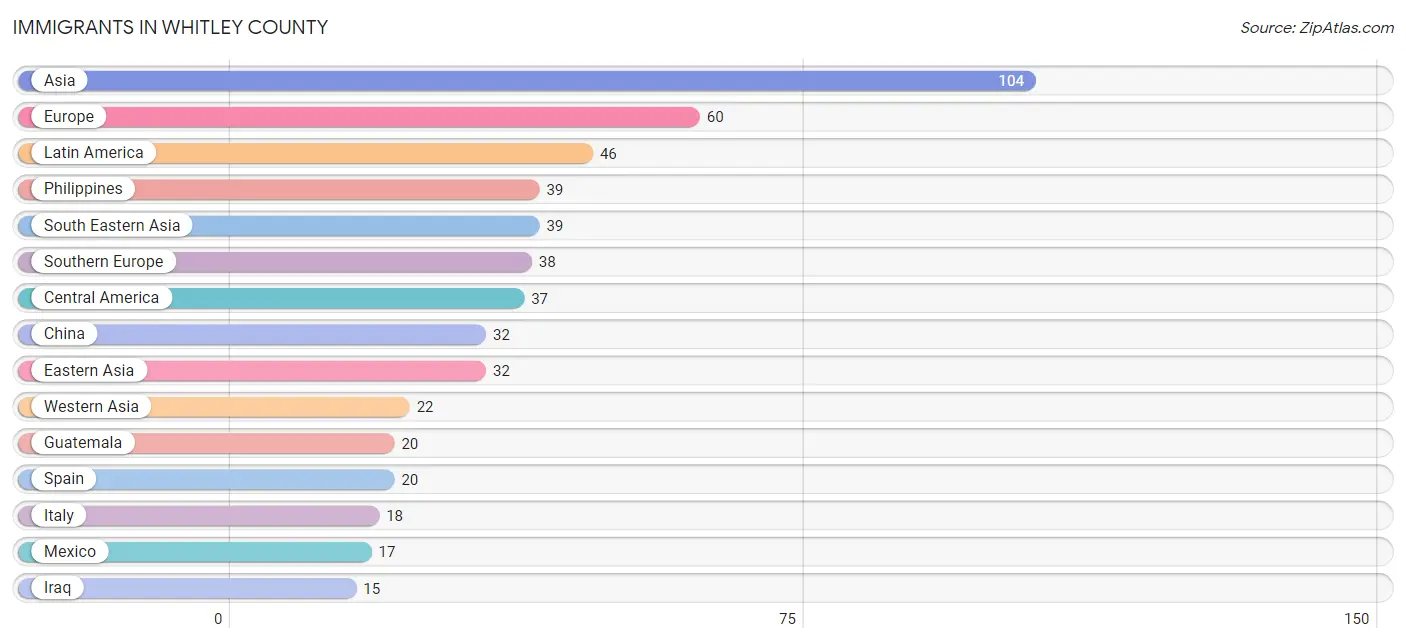
Immigrants in Whitley County
The most numerous immigrant groups reported in Whitley County came from Asia (104 | 0.3%), Europe (60 | 0.2%), Latin America (46 | 0.1%), Philippines (39 | 0.1%), and South Eastern Asia (39 | 0.1%), together accounting for 0.8% of all Whitley County residents.
| Immigration Origin | # Population | % Population |
| Africa | 13 | 0.0% |
| Asia | 104 | 0.3% |
| Brazil | 5 | 0.0% |
| Canada | 10 | 0.0% |
| Caribbean | 4 | 0.0% |
| Central America | 37 | 0.1% |
| China | 32 | 0.1% |
| Eastern Asia | 32 | 0.1% |
| Eastern Europe | 4 | 0.0% |
| Europe | 60 | 0.2% |
| France | 3 | 0.0% |
| Germany | 4 | 0.0% |
| Guatemala | 20 | 0.1% |
| India | 11 | 0.0% |
| Iraq | 15 | 0.0% |
| Italy | 18 | 0.1% |
| Latin America | 46 | 0.1% |
| Mexico | 17 | 0.1% |
| Middle Africa | 9 | 0.0% |
| Moldova | 4 | 0.0% |
| Netherlands | 3 | 0.0% |
| Nigeria | 4 | 0.0% |
| Northern Europe | 8 | 0.0% |
| Philippines | 39 | 0.1% |
| Saudi Arabia | 7 | 0.0% |
| South America | 5 | 0.0% |
| South Central Asia | 11 | 0.0% |
| South Eastern Asia | 39 | 0.1% |
| Southern Europe | 38 | 0.1% |
| Spain | 20 | 0.1% |
| Sweden | 4 | 0.0% |
| Trinidad and Tobago | 4 | 0.0% |
| Western Africa | 4 | 0.0% |
| Western Asia | 22 | 0.1% |
| Western Europe | 10 | 0.0% |
| Zaire | 9 | 0.0% | View All 36 Rows |
Sex and Age in Whitley County
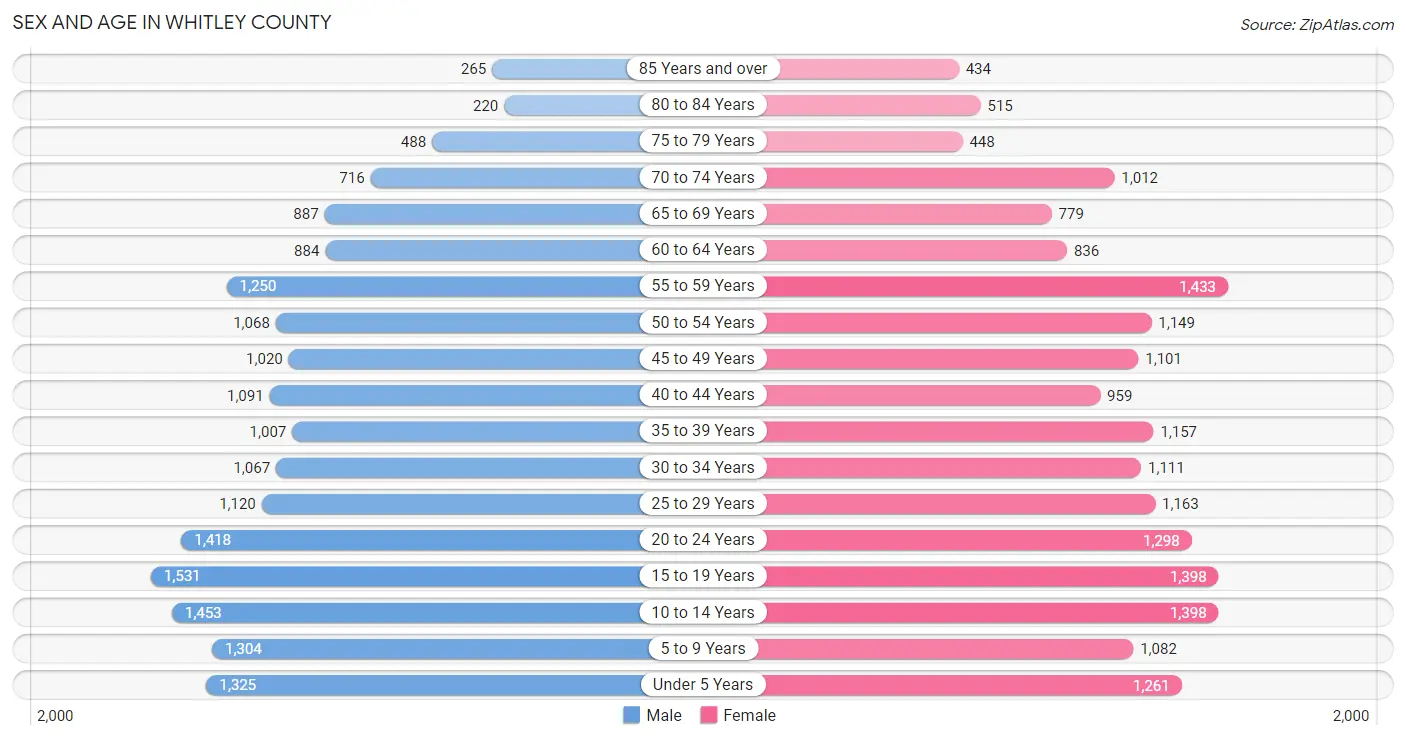
Sex and Age in Whitley County
The most populous age groups in Whitley County are 15 to 19 Years (1,531 | 8.5%) for men and 55 to 59 Years (1,433 | 7.7%) for women.
| Age Bracket | Male | Female |
| Under 5 Years | 1,325 (7.3%) | 1,261 (6.8%) |
| 5 to 9 Years | 1,304 (7.2%) | 1,082 (5.8%) |
| 10 to 14 Years | 1,453 (8.0%) | 1,398 (7.5%) |
| 15 to 19 Years | 1,531 (8.5%) | 1,398 (7.5%) |
| 20 to 24 Years | 1,418 (7.8%) | 1,298 (7.0%) |
| 25 to 29 Years | 1,120 (6.2%) | 1,163 (6.3%) |
| 30 to 34 Years | 1,067 (5.9%) | 1,111 (6.0%) |
| 35 to 39 Years | 1,007 (5.6%) | 1,157 (6.2%) |
| 40 to 44 Years | 1,091 (6.0%) | 959 (5.2%) |
| 45 to 49 Years | 1,020 (5.6%) | 1,101 (5.9%) |
| 50 to 54 Years | 1,068 (5.9%) | 1,149 (6.2%) |
| 55 to 59 Years | 1,250 (6.9%) | 1,433 (7.7%) |
| 60 to 64 Years | 884 (4.9%) | 836 (4.5%) |
| 65 to 69 Years | 887 (4.9%) | 779 (4.2%) |
| 70 to 74 Years | 716 (4.0%) | 1,012 (5.5%) |
| 75 to 79 Years | 488 (2.7%) | 448 (2.4%) |
| 80 to 84 Years | 220 (1.2%) | 515 (2.8%) |
| 85 Years and over | 265 (1.5%) | 434 (2.3%) |
| Total | 18,114 (100.0%) | 18,534 (100.0%) |
Families and Households in Whitley County
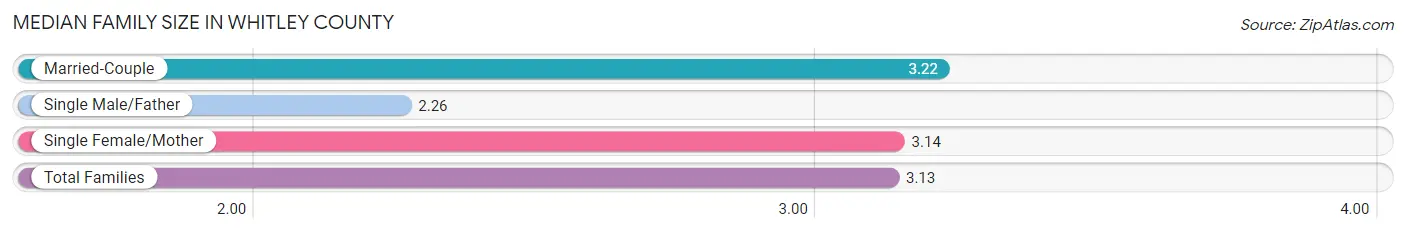
Median Family Size in Whitley County
The median family size in Whitley County is 3.13 persons per family, with married-couple families (6,929 | 75.6%) accounting for the largest median family size of 3.22 persons per family. On the other hand, single male/father families (670 | 7.3%) represent the smallest median family size with 2.26 persons per family.
| Family Type | # Families | Family Size |
| Married-Couple | 6,929 (75.6%) | 3.22 |
| Single Male/Father | 670 (7.3%) | 2.26 |
| Single Female/Mother | 1,565 (17.1%) | 3.14 |
| Total Families | 9,164 (100.0%) | 3.13 |
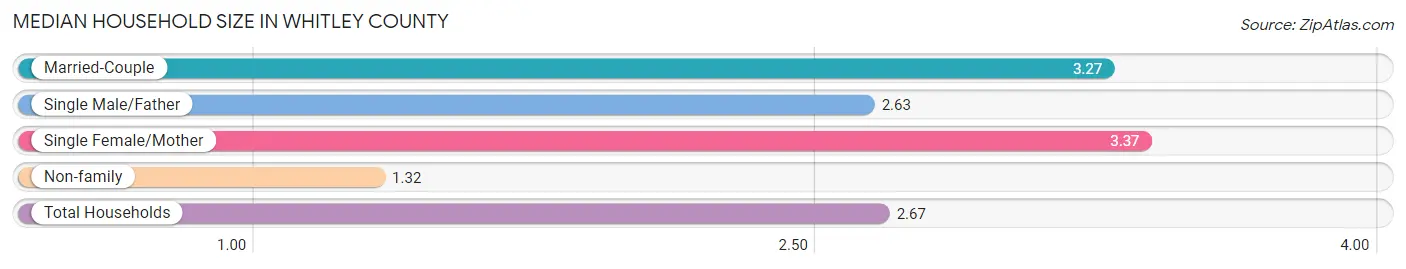
Median Household Size in Whitley County
The median household size in Whitley County is 2.67 persons per household, with single female/mother households (1,565 | 12.0%) accounting for the largest median household size of 3.37 persons per household. non-family households (3,912 | 29.9%) represent the smallest median household size with 1.32 persons per household.
| Household Type | # Households | Household Size |
| Married-Couple | 6,929 (53.0%) | 3.27 |
| Single Male/Father | 670 (5.1%) | 2.63 |
| Single Female/Mother | 1,565 (12.0%) | 3.37 |
| Non-family | 3,912 (29.9%) | 1.32 |
| Total Households | 13,076 (100.0%) | 2.67 |
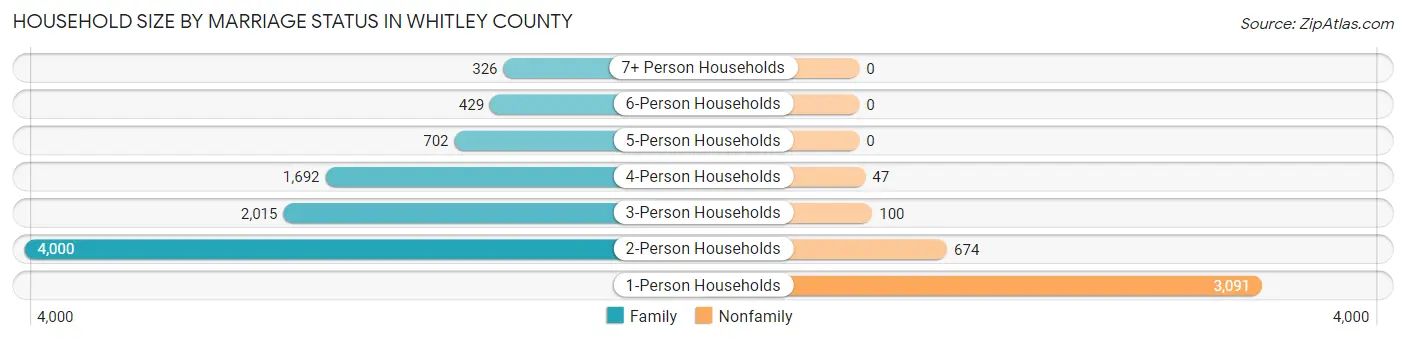
Household Size by Marriage Status in Whitley County
Out of a total of 13,076 households in Whitley County, 9,164 (70.1%) are family households, while 3,912 (29.9%) are nonfamily households. The most numerous type of family households are 2-person households, comprising 4,000, and the most common type of nonfamily households are 1-person households, comprising 3,091.
| Household Size | Family Households | Nonfamily Households |
| 1-Person Households | - | 3,091 (23.6%) |
| 2-Person Households | 4,000 (30.6%) | 674 (5.1%) |
| 3-Person Households | 2,015 (15.4%) | 100 (0.8%) |
| 4-Person Households | 1,692 (12.9%) | 47 (0.4%) |
| 5-Person Households | 702 (5.4%) | 0 (0.0%) |
| 6-Person Households | 429 (3.3%) | 0 (0.0%) |
| 7+ Person Households | 326 (2.5%) | 0 (0.0%) |
| Total | 9,164 (70.1%) | 3,912 (29.9%) |
Female Fertility in Whitley County
Fertility by Age in Whitley County
Average fertility rate in Whitley County is 57.0 births per 1,000 women. Women in the age bracket of 20 to 34 years have the highest fertility rate with 115.0 births per 1,000 women. Women in the age bracket of 20 to 34 years acount for 85.1% of all women with births.
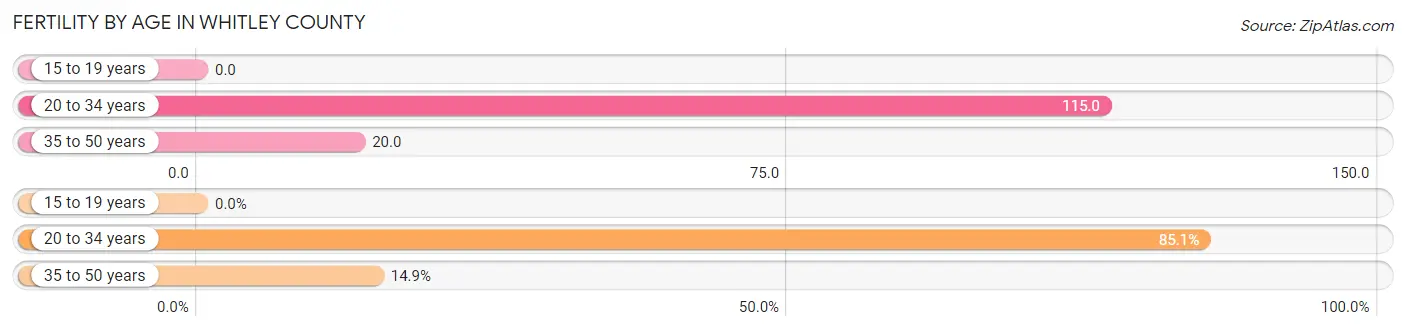
| Age Bracket | Women with Births | Births / 1,000 Women |
| 15 to 19 years | 0 (0.0%) | 0.0 |
| 20 to 34 years | 411 (85.1%) | 115.0 |
| 35 to 50 years | 72 (14.9%) | 20.0 |
| Total | 483 (100.0%) | 57.0 |
Fertility by Age by Marriage Status in Whitley County
82.0% of women with births (483) in Whitley County are married. The highest percentage of unmarried women with births falls into 35 to 50 years age bracket with 36.1% of them unmarried at the time of birth, while the lowest percentage of unmarried women with births belong to 20 to 34 years age bracket with 14.8% of them unmarried.
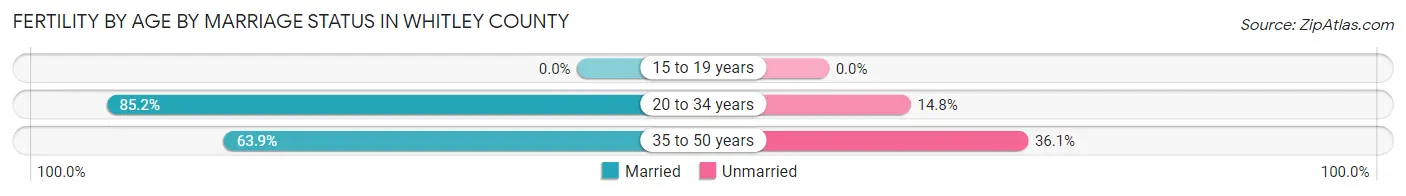
| Age Bracket | Married | Unmarried |
| 15 to 19 years | 0 (0.0%) | 0 (0.0%) |
| 20 to 34 years | 350 (85.2%) | 61 (14.8%) |
| 35 to 50 years | 46 (63.9%) | 26 (36.1%) |
| Total | 396 (82.0%) | 87 (18.0%) |
Fertility by Education in Whitley County
Average fertility rate in Whitley County is 57.0 births per 1,000 women. Women with the education attainment of bachelor's degree have the highest fertility rate of 227.0 births per 1,000 women, while women with the education attainment of less than high school have the lowest fertility at 14.0 births per 1,000 women. Women with the education attainment of bachelor's degree represent 48.4% of all women with births.
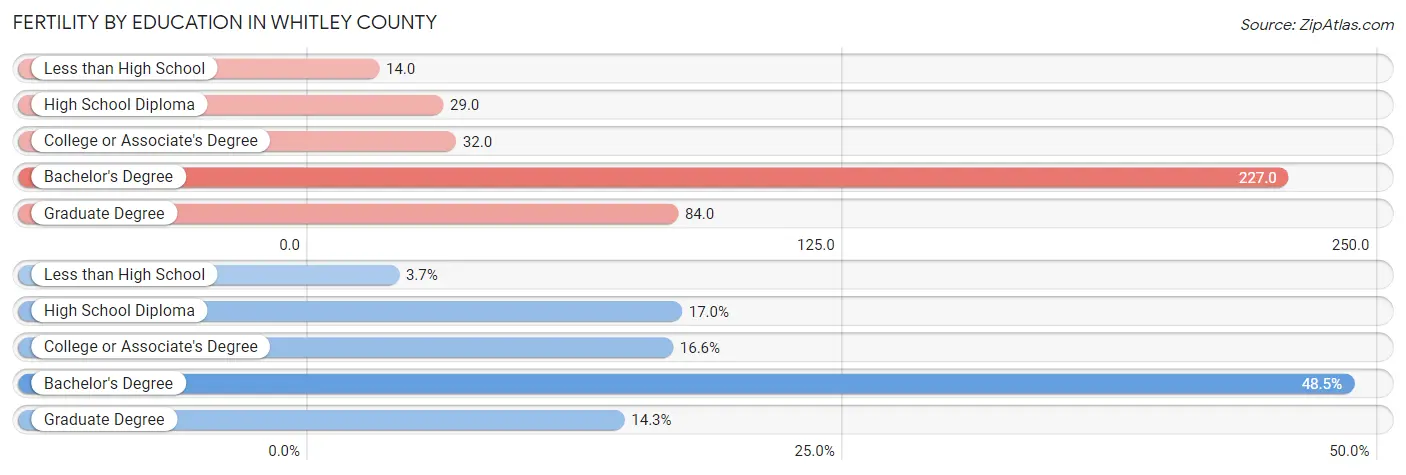
| Educational Attainment | Women with Births | Births / 1,000 Women |
| Less than High School | 18 (3.7%) | 14.0 |
| High School Diploma | 82 (17.0%) | 29.0 |
| College or Associate's Degree | 80 (16.6%) | 32.0 |
| Bachelor's Degree | 234 (48.4%) | 227.0 |
| Graduate Degree | 69 (14.3%) | 84.0 |
| Total | 483 (100.0%) | 57.0 |
Fertility by Education by Marriage Status in Whitley County
18.0% of women with births in Whitley County are unmarried. Women with the educational attainment of less than high school are most likely to be married with 100.0% of them married at childbirth, while women with the educational attainment of high school diploma are least likely to be married with 57.3% of them unmarried at childbirth.
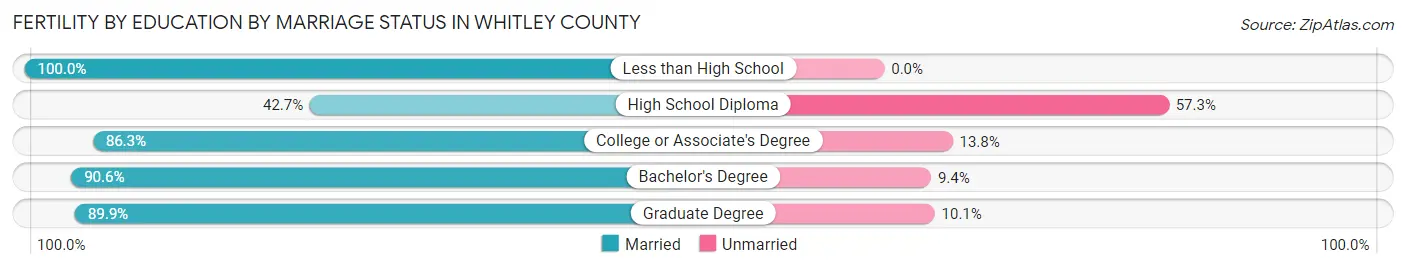
| Educational Attainment | Married | Unmarried |
| Less than High School | 18 (100.0%) | 0 (0.0%) |
| High School Diploma | 35 (42.7%) | 47 (57.3%) |
| College or Associate's Degree | 69 (86.3%) | 11 (13.8%) |
| Bachelor's Degree | 212 (90.6%) | 22 (9.4%) |
| Graduate Degree | 62 (89.9%) | 7 (10.1%) |
| Total | 396 (82.0%) | 87 (18.0%) |
Income in Whitley County
Income Overview in Whitley County
Per Capita Income in Whitley County is $22,310, while median incomes of families and households are $53,387 and $44,332 respectively.
| Characteristic | Number | Measure |
| Per Capita Income | 36,648 | $22,310 |
| Median Family Income | 9,164 | $53,387 |
| Mean Family Income | 9,164 | $70,467 |
| Median Household Income | 13,076 | $44,332 |
| Mean Household Income | 13,076 | $61,934 |
| Income Deficit | 9,164 | $10,803 |
| Wage / Income Gap (%) | 36,648 | 29.32% |
| Wage / Income Gap ($) | 36,648 | 70.68¢ per $1 |
| Gini / Inequality Index | 36,648 | 0.49 |
Earnings by Sex in Whitley County
Average Earnings in Whitley County are $26,450, $32,571 for men and $23,020 for women, a difference of 29.3%.
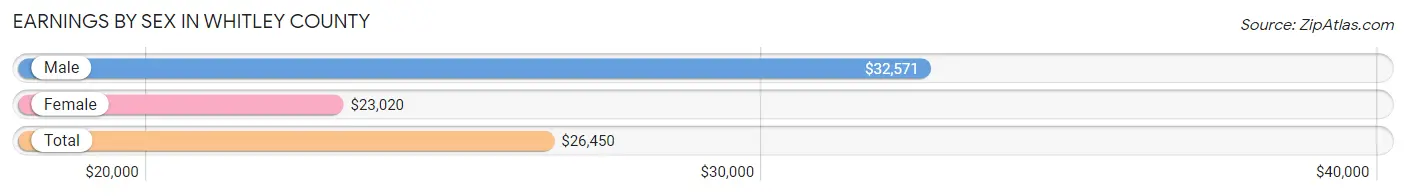
| Sex | Number | Average Earnings |
| Male | 7,820 (50.3%) | $32,571 |
| Female | 7,714 (49.7%) | $23,020 |
| Total | 15,534 (100.0%) | $26,450 |
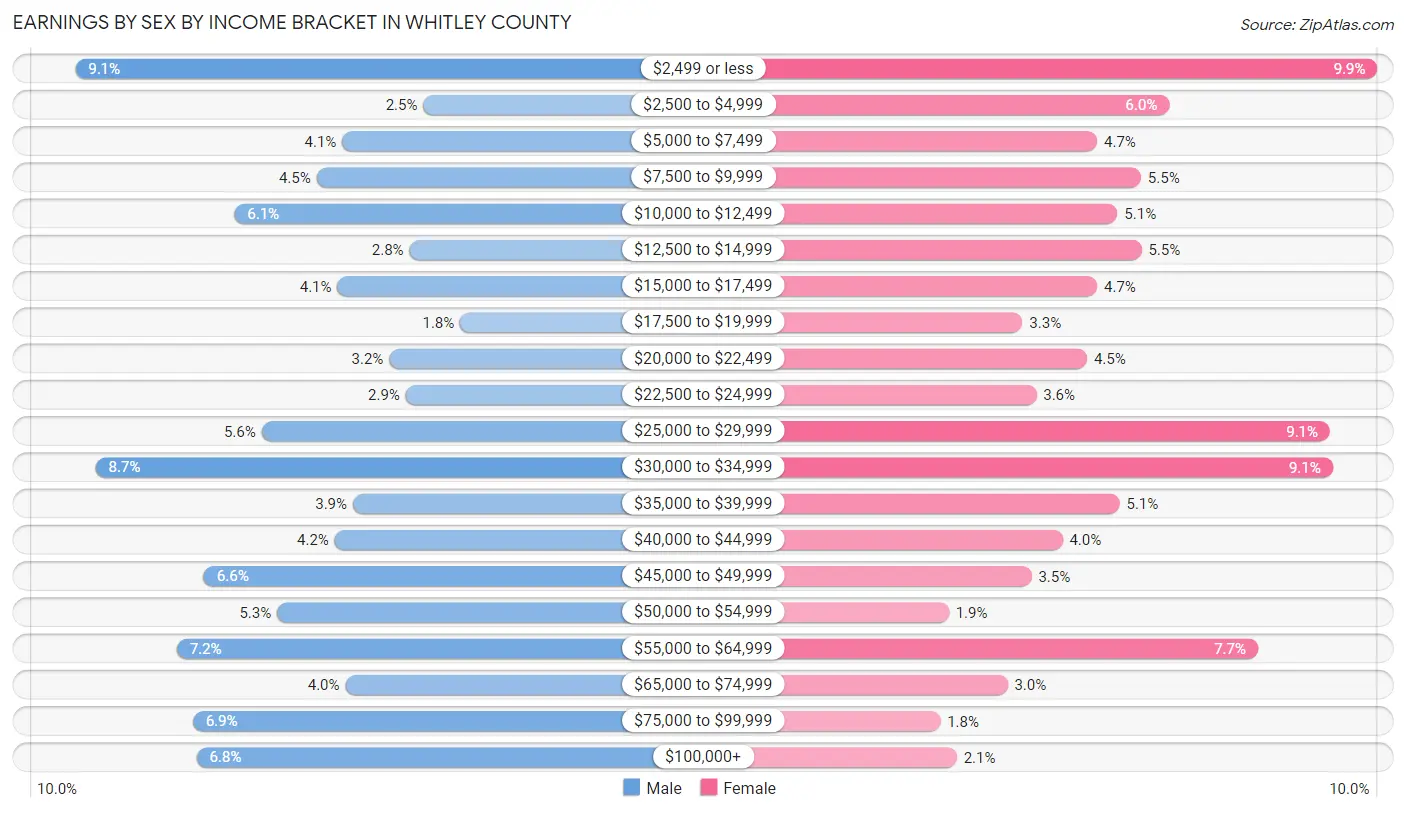
Earnings by Sex by Income Bracket in Whitley County
The most common earnings brackets in Whitley County are $2,499 or less for men (708 | 9.0%) and $2,499 or less for women (767 | 9.9%).
| Income | Male | Female |
| $2,499 or less | 708 (9.0%) | 767 (9.9%) |
| $2,500 to $4,999 | 198 (2.5%) | 466 (6.0%) |
| $5,000 to $7,499 | 317 (4.1%) | 362 (4.7%) |
| $7,500 to $9,999 | 354 (4.5%) | 425 (5.5%) |
| $10,000 to $12,499 | 475 (6.1%) | 391 (5.1%) |
| $12,500 to $14,999 | 218 (2.8%) | 426 (5.5%) |
| $15,000 to $17,499 | 324 (4.1%) | 362 (4.7%) |
| $17,500 to $19,999 | 144 (1.8%) | 254 (3.3%) |
| $20,000 to $22,499 | 248 (3.2%) | 347 (4.5%) |
| $22,500 to $24,999 | 224 (2.9%) | 274 (3.5%) |
| $25,000 to $29,999 | 435 (5.6%) | 698 (9.0%) |
| $30,000 to $34,999 | 678 (8.7%) | 702 (9.1%) |
| $35,000 to $39,999 | 301 (3.8%) | 394 (5.1%) |
| $40,000 to $44,999 | 328 (4.2%) | 312 (4.0%) |
| $45,000 to $49,999 | 519 (6.6%) | 267 (3.5%) |
| $50,000 to $54,999 | 412 (5.3%) | 147 (1.9%) |
| $55,000 to $64,999 | 559 (7.1%) | 594 (7.7%) |
| $65,000 to $74,999 | 312 (4.0%) | 232 (3.0%) |
| $75,000 to $99,999 | 536 (6.9%) | 135 (1.8%) |
| $100,000+ | 530 (6.8%) | 159 (2.1%) |
| Total | 7,820 (100.0%) | 7,714 (100.0%) |
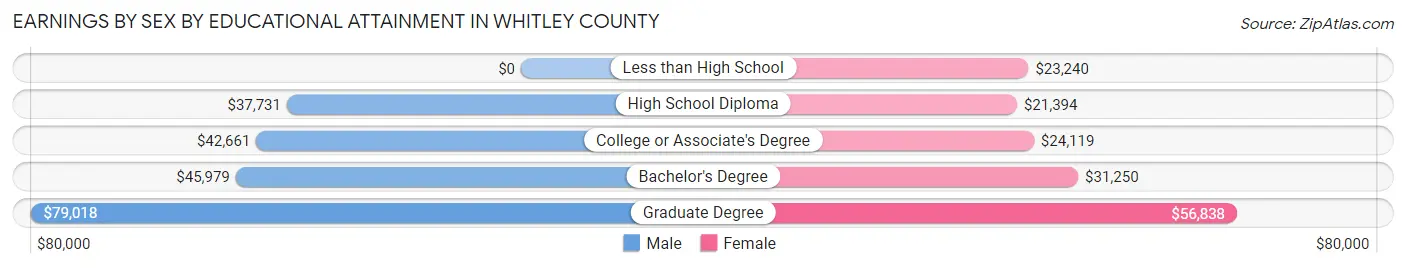
Earnings by Sex by Educational Attainment in Whitley County
Average earnings in Whitley County are $42,066 for men and $27,033 for women, a difference of 35.7%. Men with an educational attainment of graduate degree enjoy the highest average annual earnings of $79,018, while those with high school diploma education earn the least with $37,731. Women with an educational attainment of graduate degree earn the most with the average annual earnings of $56,838, while those with high school diploma education have the smallest earnings of $21,394.
| Educational Attainment | Male Income | Female Income |
| Less than High School | - | - |
| High School Diploma | $37,731 | $21,394 |
| College or Associate's Degree | $42,661 | $24,119 |
| Bachelor's Degree | $45,979 | $31,250 |
| Graduate Degree | $79,018 | $56,838 |
| Total | $42,066 | $27,033 |
Family Income in Whitley County
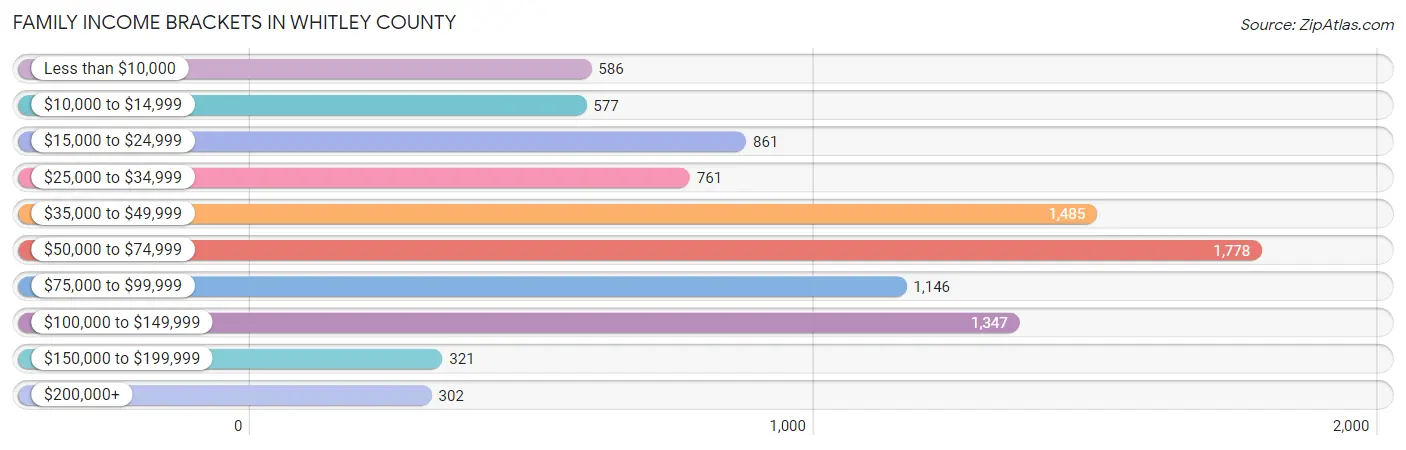
Family Income Brackets in Whitley County
According to the Whitley County family income data, there are 1,778 families falling into the $50,000 to $74,999 income range, which is the most common income bracket and makes up 19.4% of all families. Conversely, the $200,000+ income bracket is the least frequent group with only 302 families (3.3%) belonging to this category.
| Income Bracket | # Families | % Families |
| Less than $10,000 | 586 | 6.4% |
| $10,000 to $14,999 | 577 | 6.3% |
| $15,000 to $24,999 | 861 | 9.4% |
| $25,000 to $34,999 | 761 | 8.3% |
| $35,000 to $49,999 | 1,485 | 16.2% |
| $50,000 to $74,999 | 1,778 | 19.4% |
| $75,000 to $99,999 | 1,146 | 12.5% |
| $100,000 to $149,999 | 1,347 | 14.7% |
| $150,000 to $199,999 | 321 | 3.5% |
| $200,000+ | 302 | 3.3% |
Family Income by Famaliy Size in Whitley County
6-person families (357 | 3.9%) account for the highest median family income in Whitley County with $89,625 per family, while 2-person families (4,318 | 47.1%) have the highest median income of $22,464 per family member.
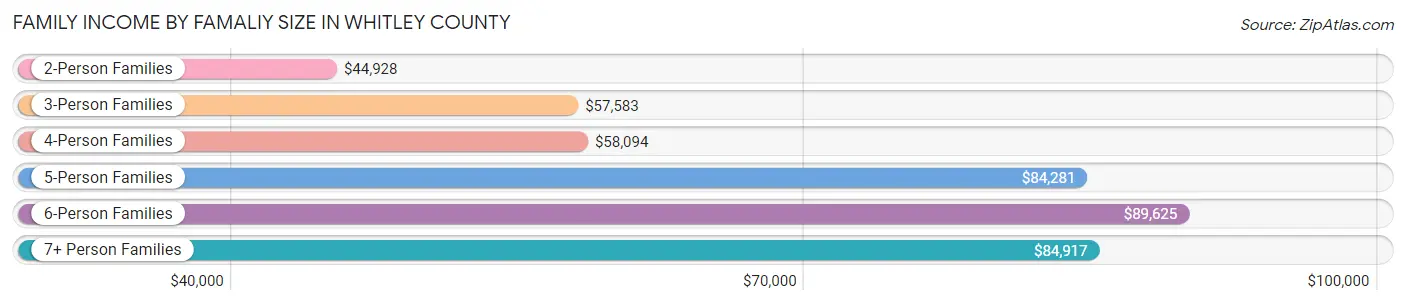
| Income Bracket | # Families | Median Income |
| 2-Person Families | 4,318 (47.1%) | $44,928 |
| 3-Person Families | 1,932 (21.1%) | $57,583 |
| 4-Person Families | 1,665 (18.2%) | $58,094 |
| 5-Person Families | 573 (6.2%) | $84,281 |
| 6-Person Families | 357 (3.9%) | $89,625 |
| 7+ Person Families | 319 (3.5%) | $84,917 |
| Total | 9,164 (100.0%) | $53,387 |
Family Income by Number of Earners in Whitley County
The median family income in Whitley County is $53,387, with families comprising 3+ earners (685) having the highest median family income of $106,917, while families with no earners (2,295) have the lowest median family income of $22,752, accounting for 7.5% and 25.0% of families, respectively.
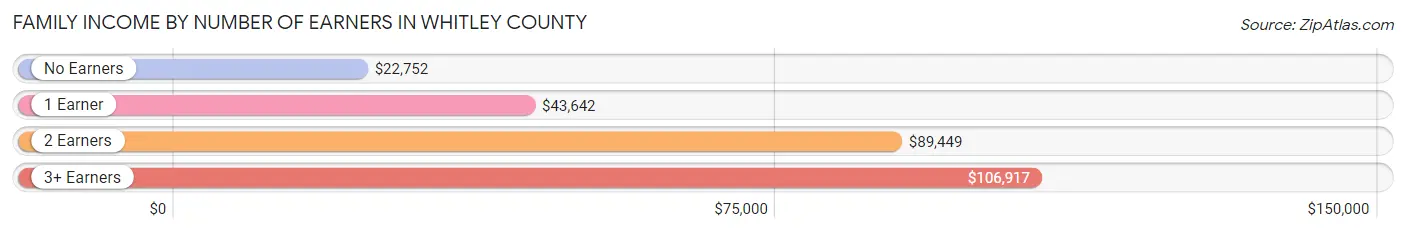
| Number of Earners | # Families | Median Income |
| No Earners | 2,295 (25.0%) | $22,752 |
| 1 Earner | 3,013 (32.9%) | $43,642 |
| 2 Earners | 3,171 (34.6%) | $89,449 |
| 3+ Earners | 685 (7.5%) | $106,917 |
| Total | 9,164 (100.0%) | $53,387 |
Household Income in Whitley County
Household Income Brackets in Whitley County
With 2,249 households falling in the category, the $50,000 to $74,999 income range is the most frequent in Whitley County, accounting for 17.2% of all households. In contrast, only 340 households (2.6%) fall into the $150,000 to $199,999 income bracket, making it the least populous group.
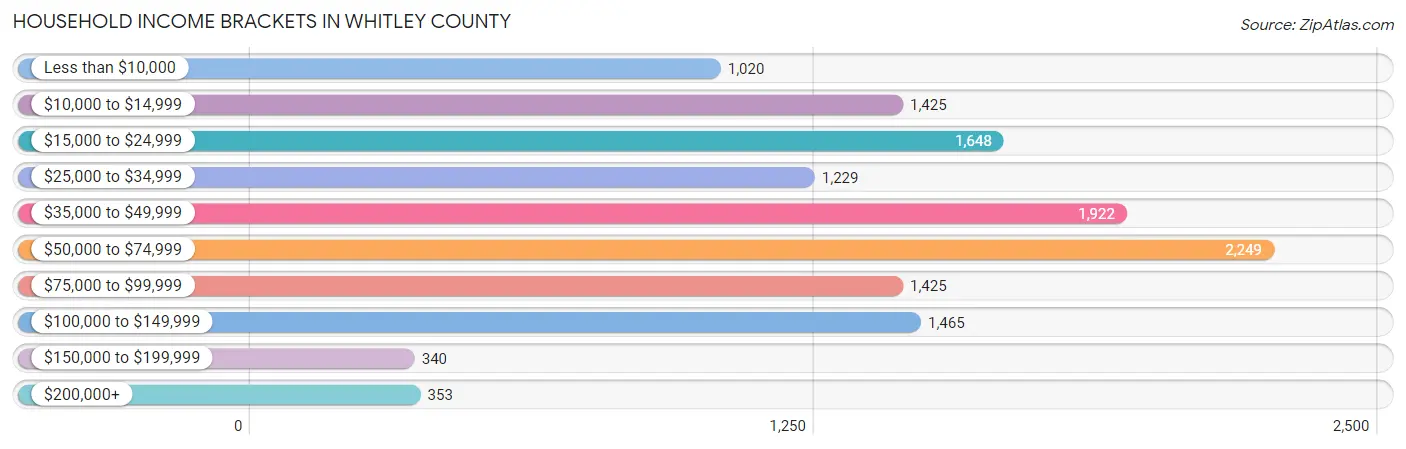
| Income Bracket | # Households | % Households |
| Less than $10,000 | 1,020 | 7.8% |
| $10,000 to $14,999 | 1,425 | 10.9% |
| $15,000 to $24,999 | 1,648 | 12.6% |
| $25,000 to $34,999 | 1,229 | 9.4% |
| $35,000 to $49,999 | 1,922 | 14.7% |
| $50,000 to $74,999 | 2,249 | 17.2% |
| $75,000 to $99,999 | 1,425 | 10.9% |
| $100,000 to $149,999 | 1,465 | 11.2% |
| $150,000 to $199,999 | 340 | 2.6% |
| $200,000+ | 353 | 2.7% |
Household Income by Householder Age in Whitley County
The median household income in Whitley County is $44,332, with the highest median household income of $51,898 found in the 25 to 44 years age bracket for the primary householder. A total of 3,927 households (30.0%) fall into this category. Meanwhile, the 65+ years age bracket for the primary householder has the lowest median household income of $29,021, with 3,675 households (28.1%) in this group.
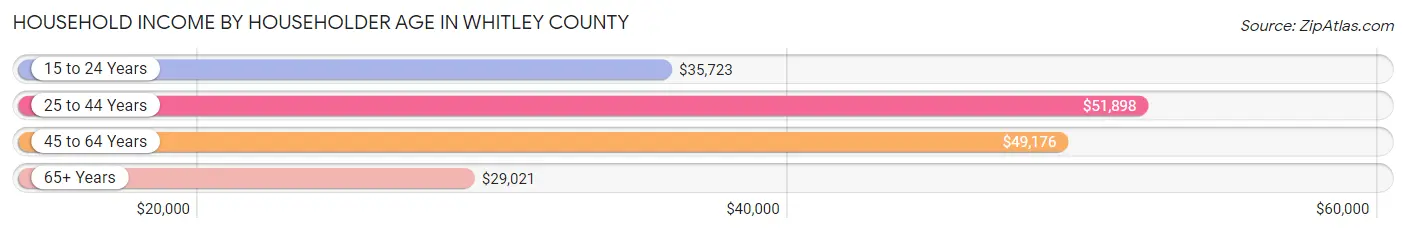
| Income Bracket | # Households | Median Income |
| 15 to 24 Years | 612 (4.7%) | $35,723 |
| 25 to 44 Years | 3,927 (30.0%) | $51,898 |
| 45 to 64 Years | 4,862 (37.2%) | $49,176 |
| 65+ Years | 3,675 (28.1%) | $29,021 |
| Total | 13,076 (100.0%) | $44,332 |
Poverty in Whitley County
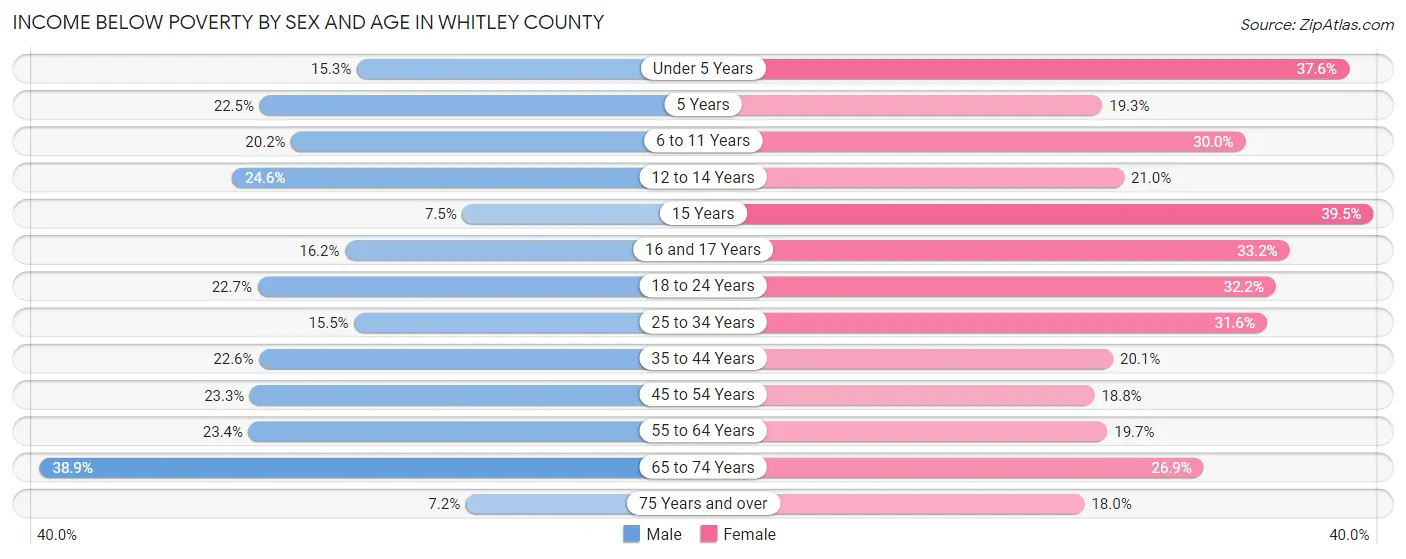
Income Below Poverty by Sex and Age in Whitley County
With 21.5% poverty level for males and 25.5% for females among the residents of Whitley County, 65 to 74 year old males and 15 year old females are the most vulnerable to poverty, with 614 males (38.9%) and 163 females (39.5%) in their respective age groups living below the poverty level.
| Age Bracket | Male | Female |
| Under 5 Years | 203 (15.3%) | 452 (37.6%) |
| 5 Years | 87 (22.5%) | 35 (19.3%) |
| 6 to 11 Years | 301 (20.2%) | 415 (30.0%) |
| 12 to 14 Years | 210 (24.6%) | 185 (20.9%) |
| 15 Years | 22 (7.5%) | 163 (39.5%) |
| 16 and 17 Years | 80 (16.2%) | 105 (33.2%) |
| 18 to 24 Years | 368 (22.7%) | 425 (32.2%) |
| 25 to 34 Years | 330 (15.5%) | 713 (31.6%) |
| 35 to 44 Years | 460 (22.6%) | 425 (20.1%) |
| 45 to 54 Years | 473 (23.3%) | 421 (18.8%) |
| 55 to 64 Years | 494 (23.4%) | 444 (19.7%) |
| 65 to 74 Years | 614 (38.9%) | 470 (26.9%) |
| 75 Years and over | 67 (7.2%) | 227 (18.0%) |
| Total | 3,709 (21.5%) | 4,480 (25.5%) |
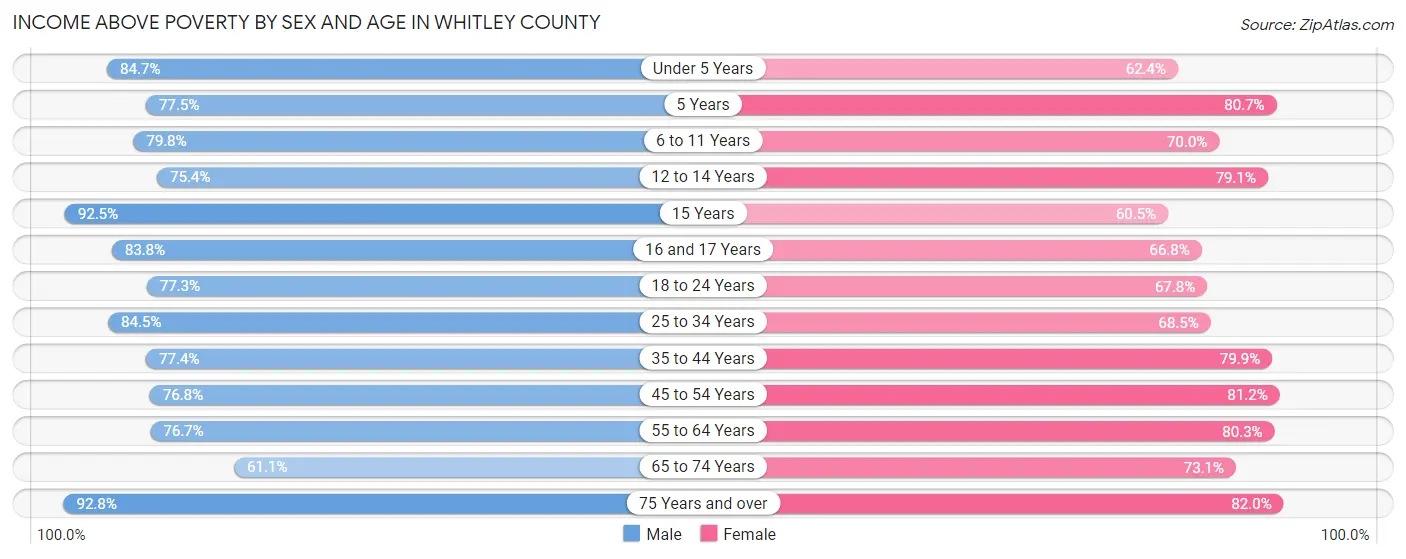
Income Above Poverty by Sex and Age in Whitley County
According to the poverty statistics in Whitley County, males aged 75 years and over and females aged 75 years and over are the age groups that are most secure financially, with 92.8% of males and 82.0% of females in these age groups living above the poverty line.
| Age Bracket | Male | Female |
| Under 5 Years | 1,122 (84.7%) | 749 (62.4%) |
| 5 Years | 299 (77.5%) | 146 (80.7%) |
| 6 to 11 Years | 1,190 (79.8%) | 970 (70.0%) |
| 12 to 14 Years | 644 (75.4%) | 698 (79.0%) |
| 15 Years | 272 (92.5%) | 250 (60.5%) |
| 16 and 17 Years | 414 (83.8%) | 211 (66.8%) |
| 18 to 24 Years | 1,254 (77.3%) | 894 (67.8%) |
| 25 to 34 Years | 1,797 (84.5%) | 1,547 (68.4%) |
| 35 to 44 Years | 1,578 (77.4%) | 1,685 (79.9%) |
| 45 to 54 Years | 1,561 (76.7%) | 1,823 (81.2%) |
| 55 to 64 Years | 1,622 (76.6%) | 1,809 (80.3%) |
| 65 to 74 Years | 965 (61.1%) | 1,280 (73.1%) |
| 75 Years and over | 860 (92.8%) | 1,033 (82.0%) |
| Total | 13,578 (78.5%) | 13,095 (74.5%) |
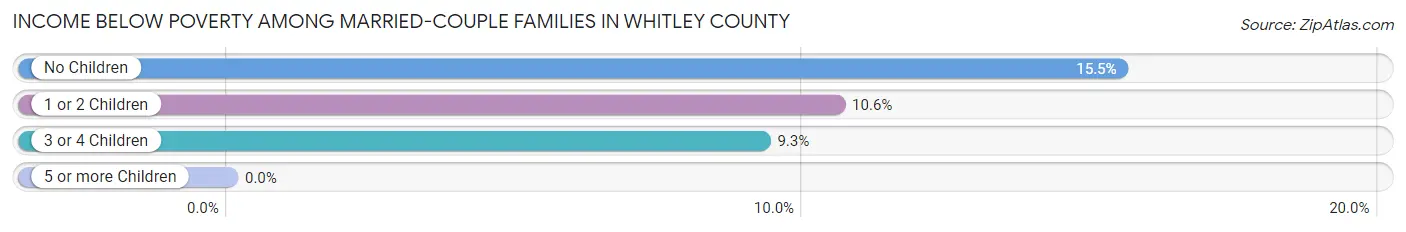
Income Below Poverty Among Married-Couple Families in Whitley County
The poverty statistics for married-couple families in Whitley County show that 12.9% or 892 of the total 6,929 families live below the poverty line. Families with no children have the highest poverty rate of 15.5%, comprising of 584 families. On the other hand, families with 5 or more children have the lowest poverty rate of 0.0%, which includes 0 families.
| Children | Above Poverty | Below Poverty |
| No Children | 3,183 (84.5%) | 584 (15.5%) |
| 1 or 2 Children | 2,132 (89.4%) | 252 (10.6%) |
| 3 or 4 Children | 548 (90.7%) | 56 (9.3%) |
| 5 or more Children | 174 (100.0%) | 0 (0.0%) |
| Total | 6,037 (87.1%) | 892 (12.9%) |
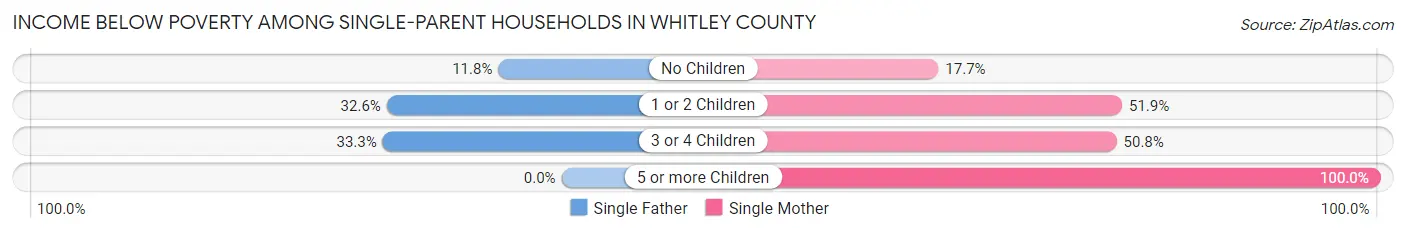
Income Below Poverty Among Single-Parent Households in Whitley County
According to the poverty data in Whitley County, 22.8% or 153 single-father households and 41.1% or 644 single-mother households are living below the poverty line. Among single-father households, those with 3 or 4 children have the highest poverty rate, with 4 households (33.3%) experiencing poverty. Likewise, among single-mother households, those with 5 or more children have the highest poverty rate, with 69 households (100.0%) falling below the poverty line.
| Children | Single Father | Single Mother |
| No Children | 37 (11.8%) | 102 (17.6%) |
| 1 or 2 Children | 112 (32.6%) | 322 (51.8%) |
| 3 or 4 Children | 4 (33.3%) | 151 (50.8%) |
| 5 or more Children | 0 (0.0%) | 69 (100.0%) |
| Total | 153 (22.8%) | 644 (41.1%) |
Income Below Poverty Among Married-Couple vs Single-Parent Households in Whitley County
The poverty data for Whitley County shows that 892 of the married-couple family households (12.9%) and 797 of the single-parent households (35.7%) are living below the poverty level. Within the married-couple family households, those with no children have the highest poverty rate, with 584 households (15.5%) falling below the poverty line. Among the single-parent households, those with 5 or more children have the highest poverty rate, with 69 household (100.0%) living below poverty.
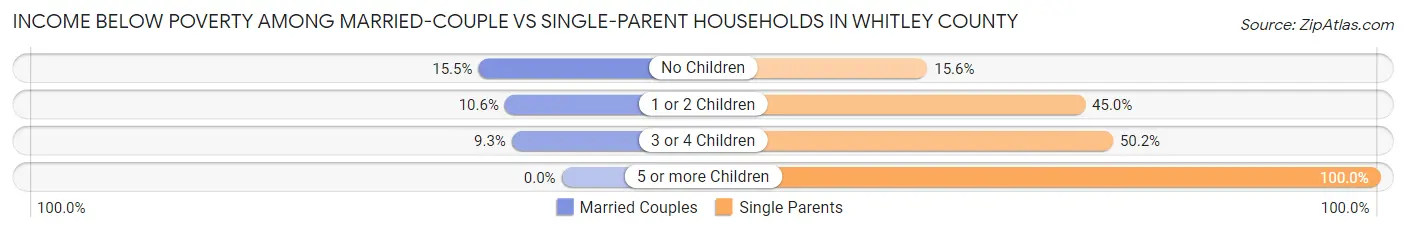
| Children | Married-Couple Families | Single-Parent Households |
| No Children | 584 (15.5%) | 139 (15.6%) |
| 1 or 2 Children | 252 (10.6%) | 434 (45.0%) |
| 3 or 4 Children | 56 (9.3%) | 155 (50.2%) |
| 5 or more Children | 0 (0.0%) | 69 (100.0%) |
| Total | 892 (12.9%) | 797 (35.7%) |
Employment Characteristics in Whitley County
Employment by Class of Employer in Whitley County
Among the 12,974 employed individuals in Whitley County, private company employees (7,893 | 60.8%), not-for-profit organizations (1,638 | 12.6%), and local government employees (1,232 | 9.5%) make up the most common classes of employment.
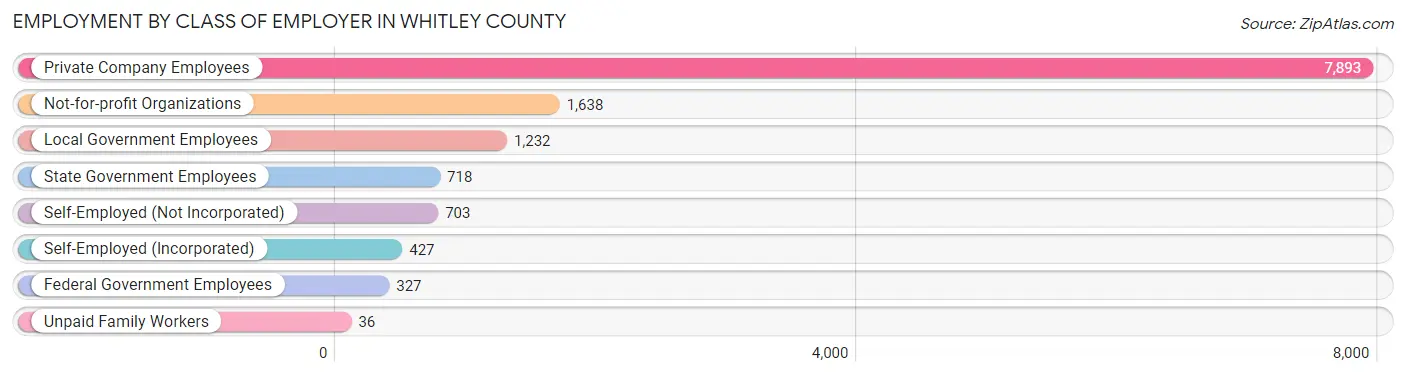
| Employer Class | # Employees | % Employees |
| Private Company Employees | 7,893 | 60.8% |
| Self-Employed (Incorporated) | 427 | 3.3% |
| Self-Employed (Not Incorporated) | 703 | 5.4% |
| Not-for-profit Organizations | 1,638 | 12.6% |
| Local Government Employees | 1,232 | 9.5% |
| State Government Employees | 718 | 5.5% |
| Federal Government Employees | 327 | 2.5% |
| Unpaid Family Workers | 36 | 0.3% |
| Total | 12,974 | 100.0% |
Employment Status by Age in Whitley County
According to the labor force statistics for Whitley County, out of the total population over 16 years of age (28,118), 50.4% or 14,171 individuals are in the labor force, with 6.4% or 907 of them unemployed. The age group with the highest labor force participation rate is 35 to 44 years, with 73.2% or 3,085 individuals in the labor force. Within the labor force, the 20 to 24 years age range has the highest percentage of unemployed individuals, with 13.3% or 261 of them being unemployed.
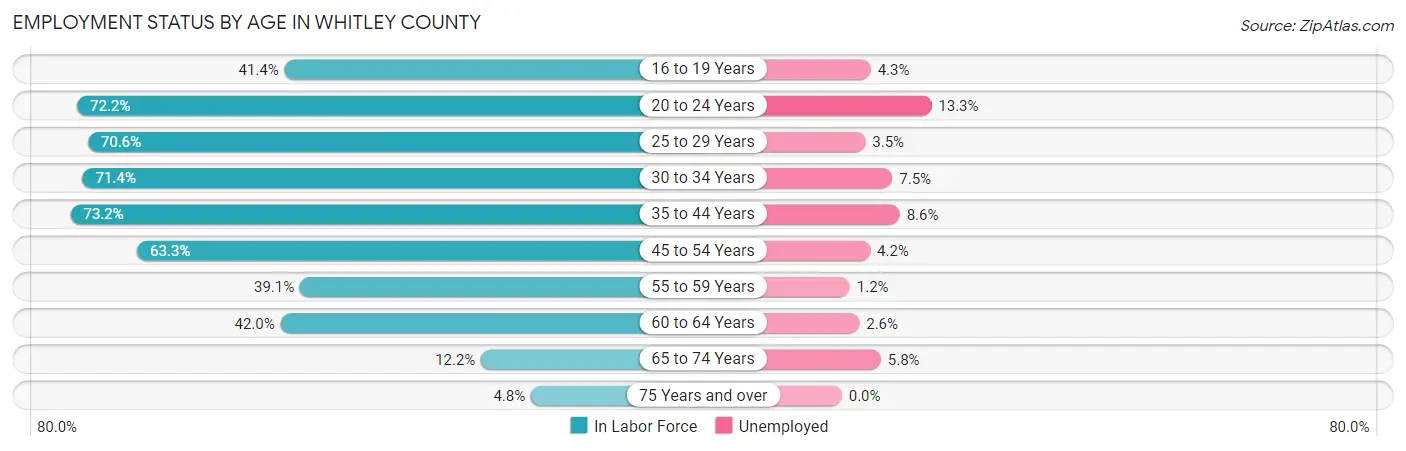
| Age Bracket | In Labor Force | Unemployed |
| 16 to 19 Years | 920 (41.4%) | 40 (4.3%) |
| 20 to 24 Years | 1,961 (72.2%) | 261 (13.3%) |
| 25 to 29 Years | 1,612 (70.6%) | 56 (3.5%) |
| 30 to 34 Years | 1,555 (71.4%) | 117 (7.5%) |
| 35 to 44 Years | 3,085 (73.2%) | 265 (8.6%) |
| 45 to 54 Years | 2,746 (63.3%) | 115 (4.2%) |
| 55 to 59 Years | 1,049 (39.1%) | 13 (1.2%) |
| 60 to 64 Years | 722 (42.0%) | 19 (2.6%) |
| 65 to 74 Years | 414 (12.2%) | 24 (5.8%) |
| 75 Years and over | 114 (4.8%) | 0 (0.0%) |
| Total | 14,171 (50.4%) | 907 (6.4%) |
Employment Status by Educational Attainment in Whitley County
According to labor force statistics for Whitley County, 61.8% of individuals (10,763) out of the total population between 25 and 64 years of age (17,416) are in the labor force, with 5.4% or 581 of them being unemployed. The group with the highest labor force participation rate are those with the educational attainment of bachelor's degree or higher, with 84.8% or 3,042 individuals in the labor force. Within the labor force, individuals with less than high school education have the highest percentage of unemployment, with 11.7% or 121 of them being unemployed.
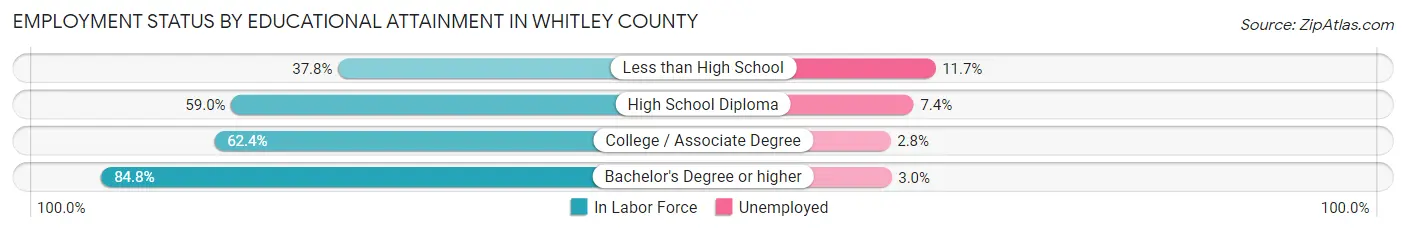
| Educational Attainment | In Labor Force | Unemployed |
| Less than High School | 1,037 (37.8%) | 321 (11.7%) |
| High School Diploma | 3,977 (59.0%) | 499 (7.4%) |
| College / Associate Degree | 2,711 (62.4%) | 122 (2.8%) |
| Bachelor's Degree or higher | 3,042 (84.8%) | 108 (3.0%) |
| Total | 10,763 (61.8%) | 940 (5.4%) |
Employment Occupations by Sex in Whitley County
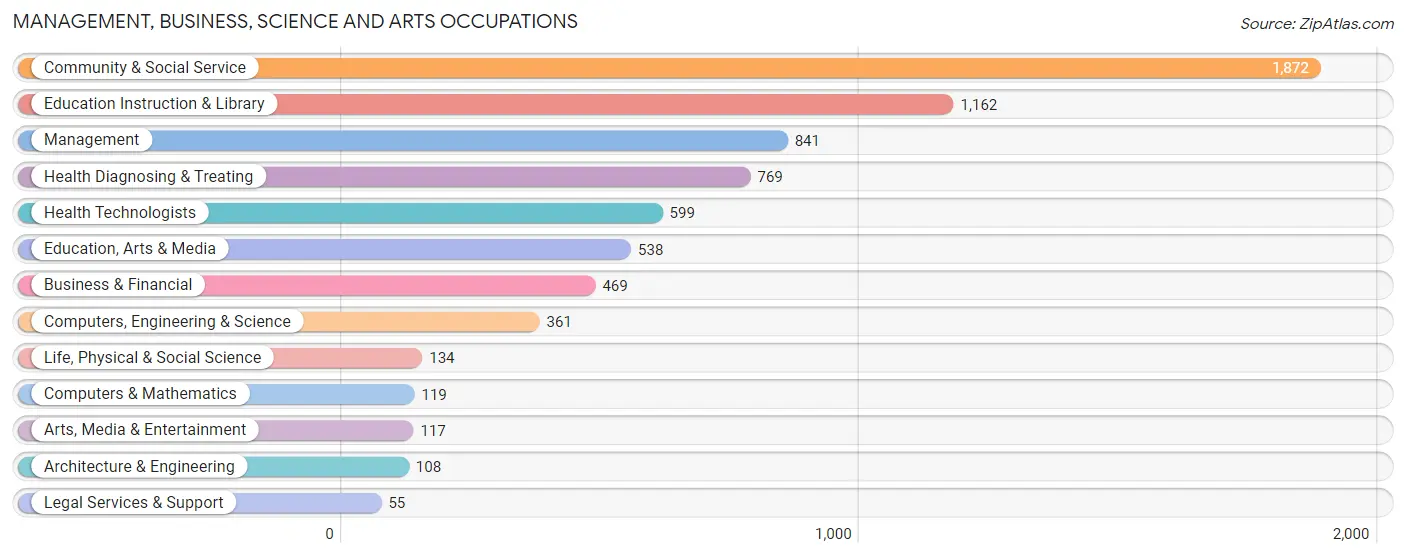
Management, Business, Science and Arts Occupations
The most common Management, Business, Science and Arts occupations in Whitley County are Community & Social Service (1,872 | 14.1%), Education Instruction & Library (1,162 | 8.8%), Management (841 | 6.4%), Health Diagnosing & Treating (769 | 5.8%), and Health Technologists (599 | 4.5%).
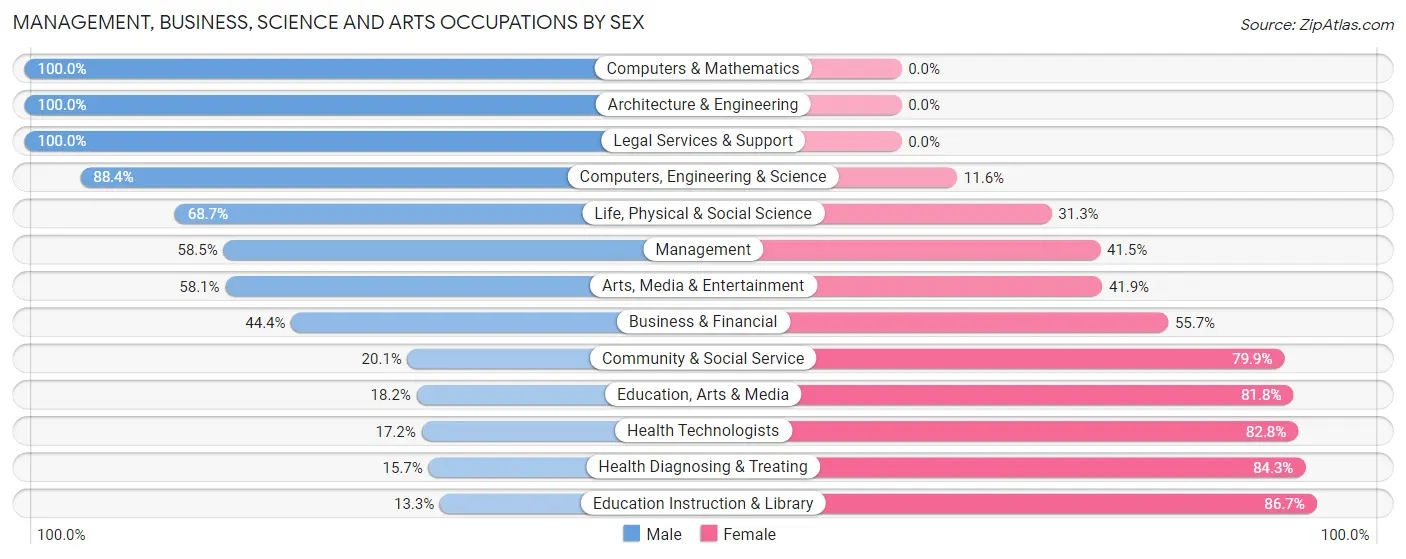
Management, Business, Science and Arts Occupations by Sex
Within the Management, Business, Science and Arts occupations in Whitley County, the most male-oriented occupations are Computers & Mathematics (100.0%), Architecture & Engineering (100.0%), and Legal Services & Support (100.0%), while the most female-oriented occupations are Education Instruction & Library (86.7%), Health Diagnosing & Treating (84.3%), and Health Technologists (82.8%).
| Occupation | Male | Female |
| Management | 492 (58.5%) | 349 (41.5%) |
| Business & Financial | 208 (44.4%) | 261 (55.6%) |
| Computers, Engineering & Science | 319 (88.4%) | 42 (11.6%) |
| Computers & Mathematics | 119 (100.0%) | 0 (0.0%) |
| Architecture & Engineering | 108 (100.0%) | 0 (0.0%) |
| Life, Physical & Social Science | 92 (68.7%) | 42 (31.3%) |
| Community & Social Service | 376 (20.1%) | 1,496 (79.9%) |
| Education, Arts & Media | 98 (18.2%) | 440 (81.8%) |
| Legal Services & Support | 55 (100.0%) | 0 (0.0%) |
| Education Instruction & Library | 155 (13.3%) | 1,007 (86.7%) |
| Arts, Media & Entertainment | 68 (58.1%) | 49 (41.9%) |
| Health Diagnosing & Treating | 121 (15.7%) | 648 (84.3%) |
| Health Technologists | 103 (17.2%) | 496 (82.8%) |
| Total (Category) | 1,516 (35.2%) | 2,796 (64.8%) |
| Total (Overall) | 6,627 (50.0%) | 6,619 (50.0%) |
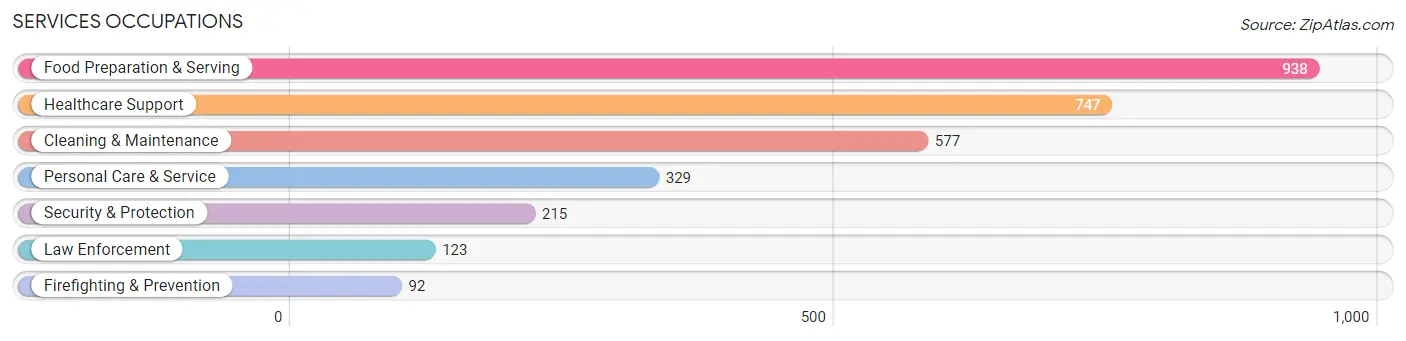
Services Occupations
The most common Services occupations in Whitley County are Food Preparation & Serving (938 | 7.1%), Healthcare Support (747 | 5.6%), Cleaning & Maintenance (577 | 4.4%), Personal Care & Service (329 | 2.5%), and Security & Protection (215 | 1.6%).
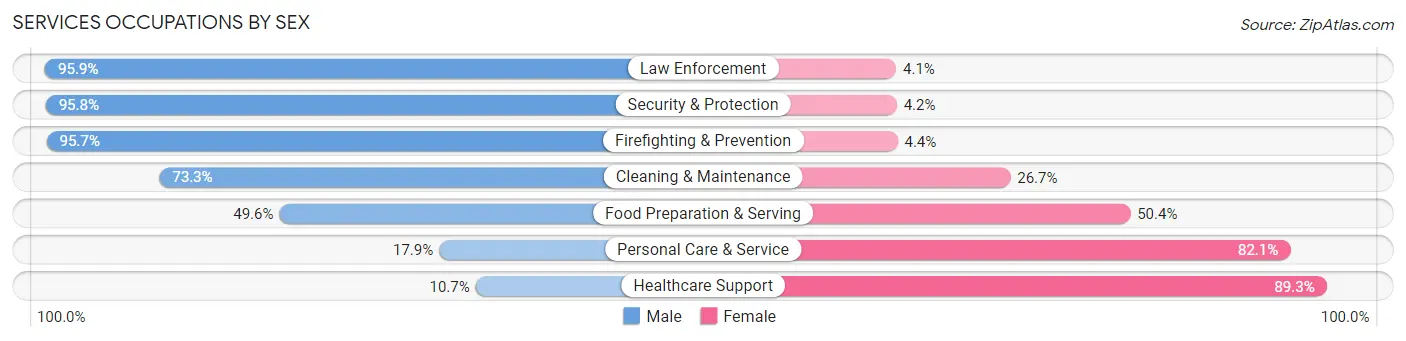
Services Occupations by Sex
Within the Services occupations in Whitley County, the most male-oriented occupations are Law Enforcement (95.9%), Security & Protection (95.8%), and Firefighting & Prevention (95.7%), while the most female-oriented occupations are Healthcare Support (89.3%), Personal Care & Service (82.1%), and Food Preparation & Serving (50.4%).
| Occupation | Male | Female |
| Healthcare Support | 80 (10.7%) | 667 (89.3%) |
| Security & Protection | 206 (95.8%) | 9 (4.2%) |
| Firefighting & Prevention | 88 (95.7%) | 4 (4.3%) |
| Law Enforcement | 118 (95.9%) | 5 (4.1%) |
| Food Preparation & Serving | 465 (49.6%) | 473 (50.4%) |
| Cleaning & Maintenance | 423 (73.3%) | 154 (26.7%) |
| Personal Care & Service | 59 (17.9%) | 270 (82.1%) |
| Total (Category) | 1,233 (43.9%) | 1,573 (56.1%) |
| Total (Overall) | 6,627 (50.0%) | 6,619 (50.0%) |
Sales and Office Occupations
The most common Sales and Office occupations in Whitley County are Sales & Related (1,319 | 10.0%), and Office & Administration (1,305 | 9.9%).
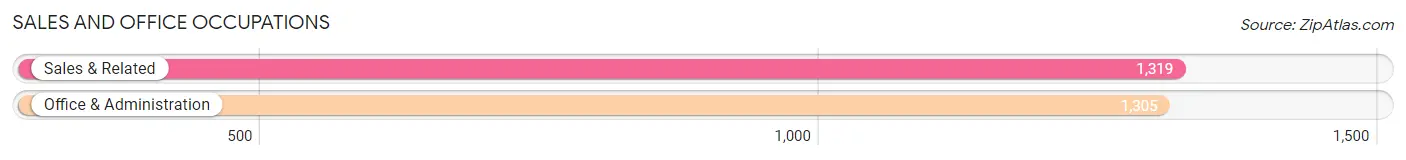
Sales and Office Occupations by Sex
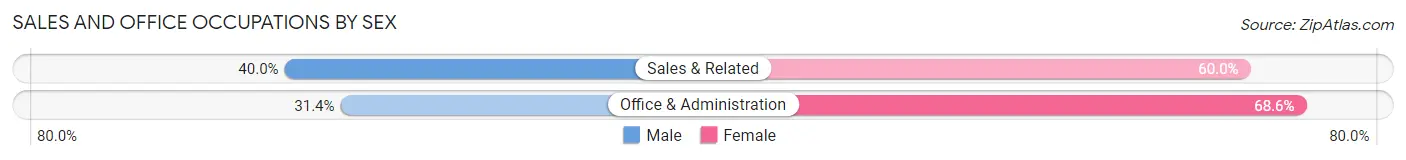
| Occupation | Male | Female |
| Sales & Related | 528 (40.0%) | 791 (60.0%) |
| Office & Administration | 410 (31.4%) | 895 (68.6%) |
| Total (Category) | 938 (35.7%) | 1,686 (64.2%) |
| Total (Overall) | 6,627 (50.0%) | 6,619 (50.0%) |
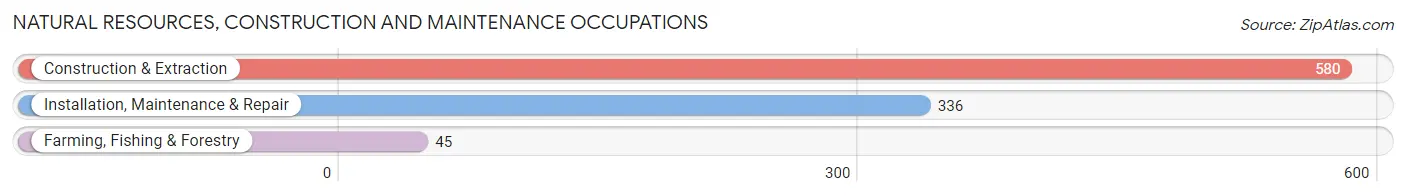
Natural Resources, Construction and Maintenance Occupations
The most common Natural Resources, Construction and Maintenance occupations in Whitley County are Construction & Extraction (580 | 4.4%), Installation, Maintenance & Repair (336 | 2.5%), and Farming, Fishing & Forestry (45 | 0.3%).
Natural Resources, Construction and Maintenance Occupations by Sex
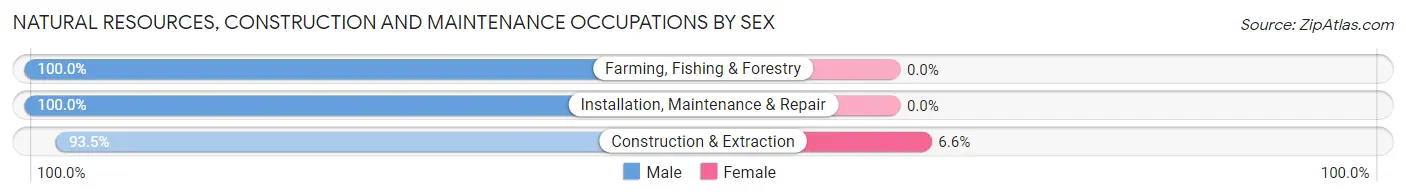
| Occupation | Male | Female |
| Farming, Fishing & Forestry | 45 (100.0%) | 0 (0.0%) |
| Construction & Extraction | 542 (93.4%) | 38 (6.6%) |
| Installation, Maintenance & Repair | 336 (100.0%) | 0 (0.0%) |
| Total (Category) | 923 (96.1%) | 38 (4.0%) |
| Total (Overall) | 6,627 (50.0%) | 6,619 (50.0%) |
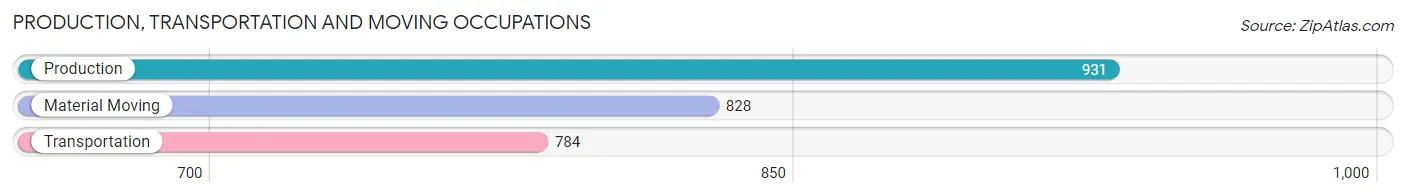
Production, Transportation and Moving Occupations
The most common Production, Transportation and Moving occupations in Whitley County are Production (931 | 7.0%), Material Moving (828 | 6.2%), and Transportation (784 | 5.9%).
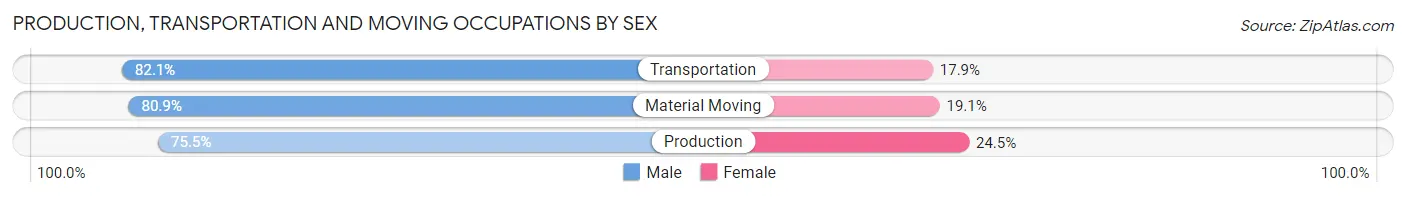
Production, Transportation and Moving Occupations by Sex
| Occupation | Male | Female |
| Production | 703 (75.5%) | 228 (24.5%) |
| Transportation | 644 (82.1%) | 140 (17.9%) |
| Material Moving | 670 (80.9%) | 158 (19.1%) |
| Total (Category) | 2,017 (79.3%) | 526 (20.7%) |
| Total (Overall) | 6,627 (50.0%) | 6,619 (50.0%) |
Employment Industries by Sex in Whitley County
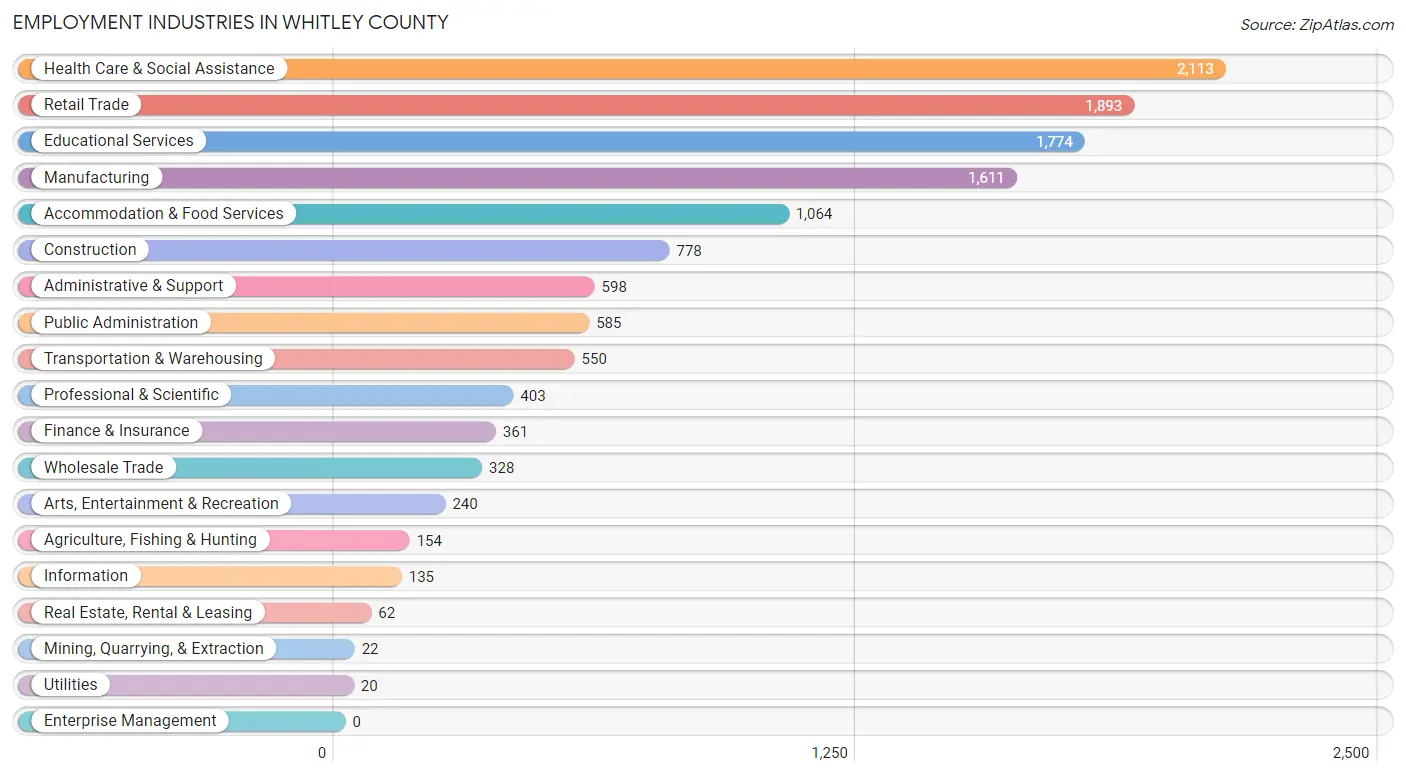
Employment Industries in Whitley County
The major employment industries in Whitley County include Health Care & Social Assistance (2,113 | 16.0%), Retail Trade (1,893 | 14.3%), Educational Services (1,774 | 13.4%), Manufacturing (1,611 | 12.2%), and Accommodation & Food Services (1,064 | 8.0%).
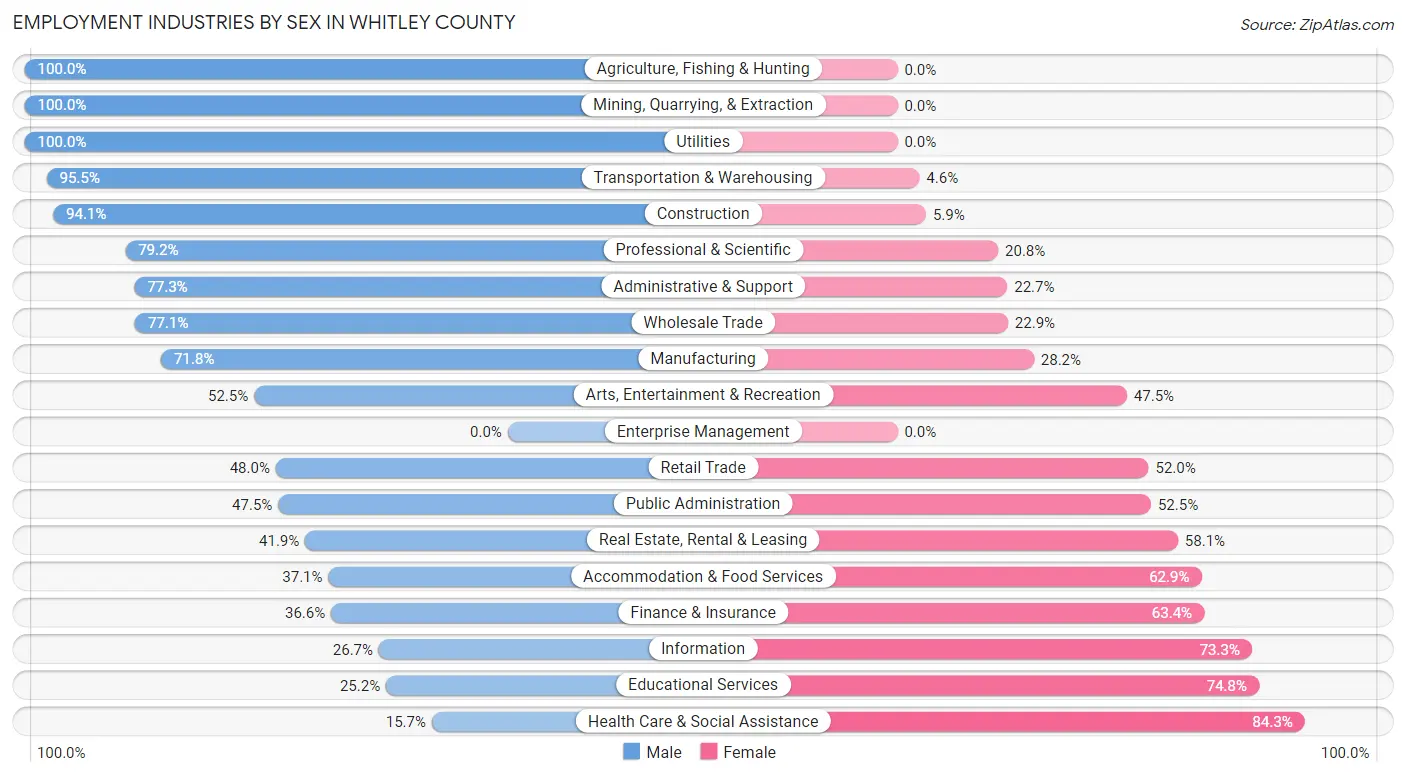
Employment Industries by Sex in Whitley County
The Whitley County industries that see more men than women are Agriculture, Fishing & Hunting (100.0%), Mining, Quarrying, & Extraction (100.0%), and Utilities (100.0%), whereas the industries that tend to have a higher number of women are Health Care & Social Assistance (84.3%), Educational Services (74.8%), and Information (73.3%).
| Industry | Male | Female |
| Agriculture, Fishing & Hunting | 154 (100.0%) | 0 (0.0%) |
| Mining, Quarrying, & Extraction | 22 (100.0%) | 0 (0.0%) |
| Construction | 732 (94.1%) | 46 (5.9%) |
| Manufacturing | 1,156 (71.8%) | 455 (28.2%) |
| Wholesale Trade | 253 (77.1%) | 75 (22.9%) |
| Retail Trade | 909 (48.0%) | 984 (52.0%) |
| Transportation & Warehousing | 525 (95.5%) | 25 (4.5%) |
| Utilities | 20 (100.0%) | 0 (0.0%) |
| Information | 36 (26.7%) | 99 (73.3%) |
| Finance & Insurance | 132 (36.6%) | 229 (63.4%) |
| Real Estate, Rental & Leasing | 26 (41.9%) | 36 (58.1%) |
| Professional & Scientific | 319 (79.2%) | 84 (20.8%) |
| Enterprise Management | 0 (0.0%) | 0 (0.0%) |
| Administrative & Support | 462 (77.3%) | 136 (22.7%) |
| Educational Services | 447 (25.2%) | 1,327 (74.8%) |
| Health Care & Social Assistance | 332 (15.7%) | 1,781 (84.3%) |
| Arts, Entertainment & Recreation | 126 (52.5%) | 114 (47.5%) |
| Accommodation & Food Services | 395 (37.1%) | 669 (62.9%) |
| Public Administration | 278 (47.5%) | 307 (52.5%) |
| Total | 6,627 (50.0%) | 6,619 (50.0%) |
Education in Whitley County
School Enrollment in Whitley County
The most common levels of schooling among the 9,466 students in Whitley County are middle school (2,458 | 26.0%), elementary school (1,859 | 19.6%), and college / undergraduate (1,851 | 19.6%).
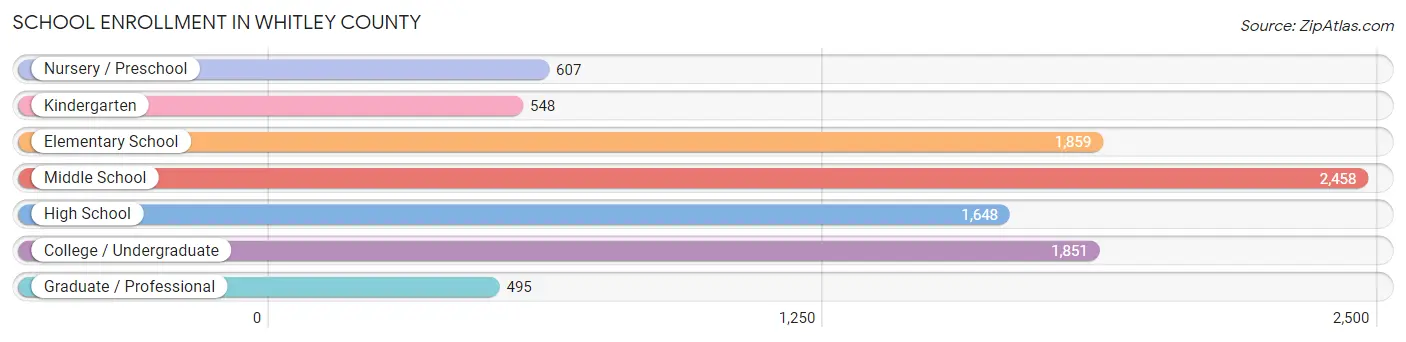
| School Level | # Students | % Students |
| Nursery / Preschool | 607 | 6.4% |
| Kindergarten | 548 | 5.8% |
| Elementary School | 1,859 | 19.6% |
| Middle School | 2,458 | 26.0% |
| High School | 1,648 | 17.4% |
| College / Undergraduate | 1,851 | 19.6% |
| Graduate / Professional | 495 | 5.2% |
| Total | 9,466 | 100.0% |
School Enrollment by Age by Funding Source in Whitley County
Out of a total of 9,466 students who are enrolled in schools in Whitley County, 1,817 (19.2%) attend a private institution, while the remaining 7,649 (80.8%) are enrolled in public schools. The age group of 20 to 24 year olds has the highest likelihood of being enrolled in private schools, with 500 (63.8% in the age bracket) enrolled. Conversely, the age group of 5 to 9 year old has the lowest likelihood of being enrolled in a private school, with 2,257 (97.0% in the age bracket) attending a public institution.
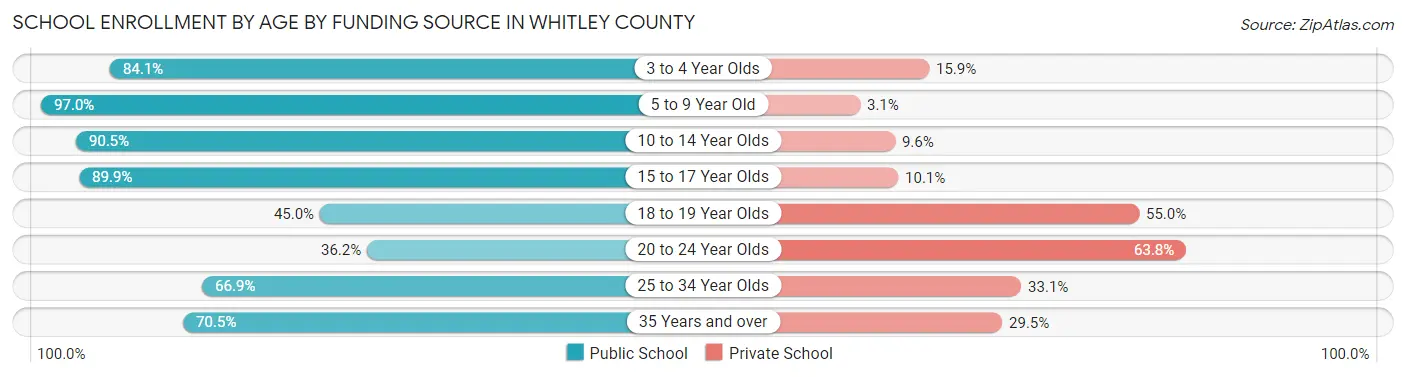
| Age Bracket | Public School | Private School |
| 3 to 4 Year Olds | 328 (84.1%) | 62 (15.9%) |
| 5 to 9 Year Old | 2,257 (97.0%) | 71 (3.0%) |
| 10 to 14 Year Olds | 2,499 (90.4%) | 264 (9.6%) |
| 15 to 17 Year Olds | 1,356 (89.9%) | 153 (10.1%) |
| 18 to 19 Year Olds | 458 (45.0%) | 560 (55.0%) |
| 20 to 24 Year Olds | 284 (36.2%) | 500 (63.8%) |
| 25 to 34 Year Olds | 247 (66.9%) | 122 (33.1%) |
| 35 Years and over | 215 (70.5%) | 90 (29.5%) |
| Total | 7,649 (80.8%) | 1,817 (19.2%) |
Educational Attainment by Field of Study in Whitley County
Education (1,245 | 26.4%), business (716 | 15.2%), science & technology (532 | 11.3%), arts & humanities (417 | 8.8%), and psychology (415 | 8.8%) are the most common fields of study among 4,719 individuals in Whitley County who have obtained a bachelor's degree or higher.
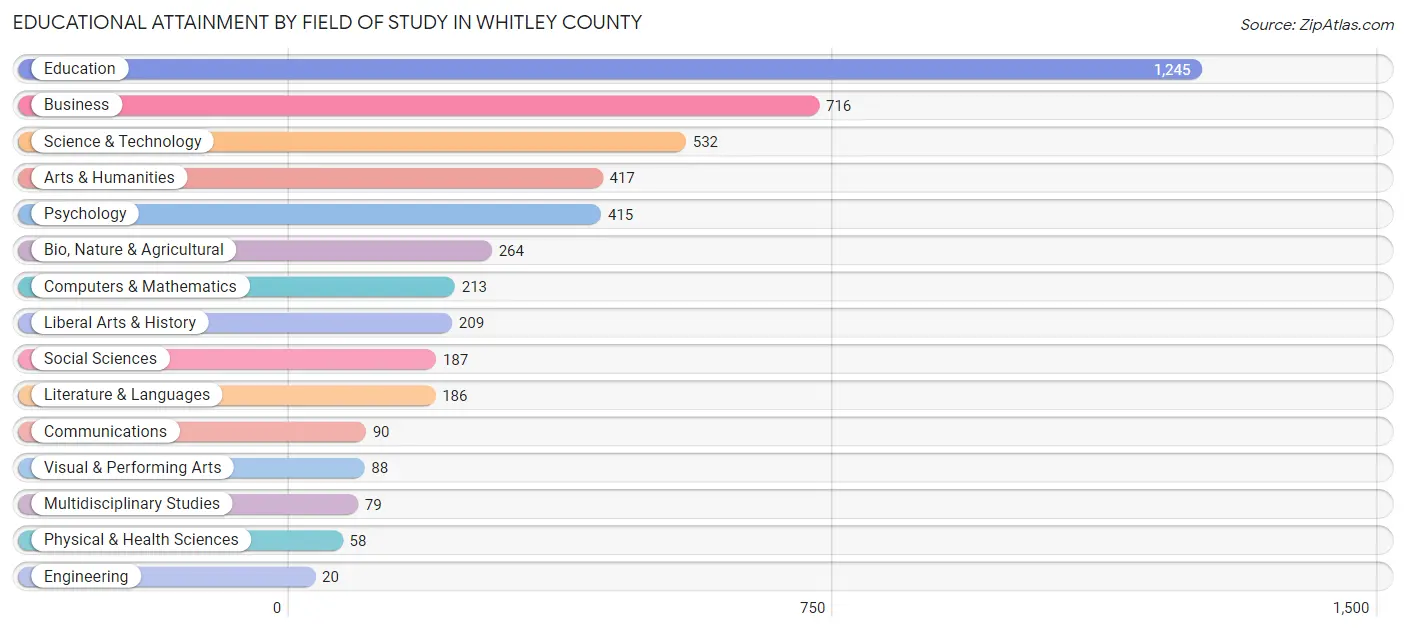
| Field of Study | # Graduates | % Graduates |
| Computers & Mathematics | 213 | 4.5% |
| Bio, Nature & Agricultural | 264 | 5.6% |
| Physical & Health Sciences | 58 | 1.2% |
| Psychology | 415 | 8.8% |
| Social Sciences | 187 | 4.0% |
| Engineering | 20 | 0.4% |
| Multidisciplinary Studies | 79 | 1.7% |
| Science & Technology | 532 | 11.3% |
| Business | 716 | 15.2% |
| Education | 1,245 | 26.4% |
| Literature & Languages | 186 | 3.9% |
| Liberal Arts & History | 209 | 4.4% |
| Visual & Performing Arts | 88 | 1.9% |
| Communications | 90 | 1.9% |
| Arts & Humanities | 417 | 8.8% |
| Total | 4,719 | 100.0% |
Transportation & Commute in Whitley County
Vehicle Availability by Sex in Whitley County
The most prevalent vehicle ownership categories in Whitley County are males with 2 vehicles (2,458, accounting for 38.7%) and females with 2 vehicles (2,300, making up 39.6%).
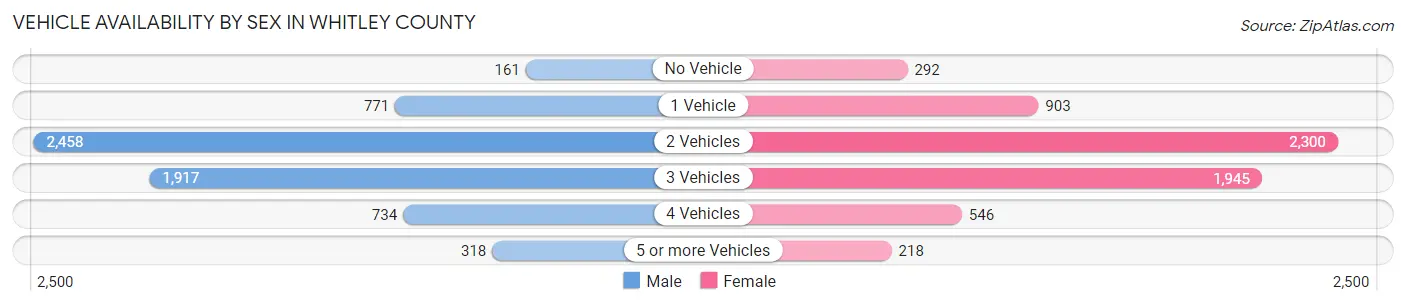
| Vehicles Available | Male | Female |
| No Vehicle | 161 (2.5%) | 292 (4.7%) |
| 1 Vehicle | 771 (12.1%) | 903 (14.6%) |
| 2 Vehicles | 2,458 (38.7%) | 2,300 (37.1%) |
| 3 Vehicles | 1,917 (30.1%) | 1,945 (31.4%) |
| 4 Vehicles | 734 (11.5%) | 546 (8.8%) |
| 5 or more Vehicles | 318 (5.0%) | 218 (3.5%) |
| Total | 6,359 (100.0%) | 6,204 (100.0%) |
Commute Time in Whitley County
The most frequently occuring commute durations in Whitley County are 30 to 34 minutes (2,055 commuters, 17.1%), 15 to 19 minutes (1,863 commuters, 15.5%), and 5 to 9 minutes (1,780 commuters, 14.8%).
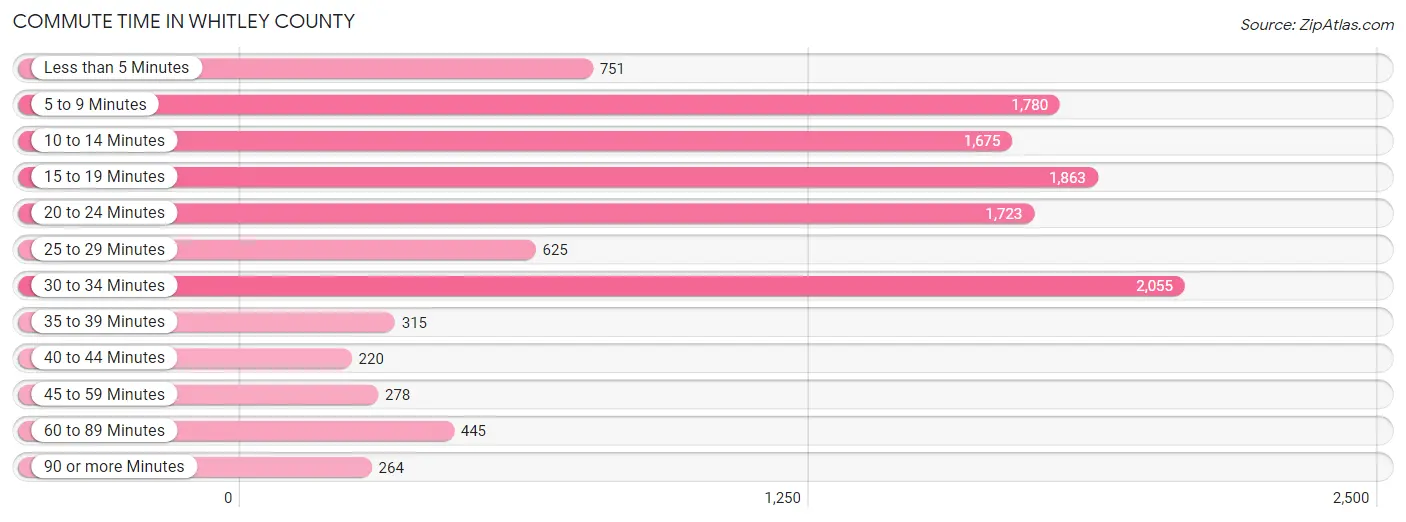
| Commute Time | # Commuters | % Commuters |
| Less than 5 Minutes | 751 | 6.3% |
| 5 to 9 Minutes | 1,780 | 14.8% |
| 10 to 14 Minutes | 1,675 | 14.0% |
| 15 to 19 Minutes | 1,863 | 15.5% |
| 20 to 24 Minutes | 1,723 | 14.4% |
| 25 to 29 Minutes | 625 | 5.2% |
| 30 to 34 Minutes | 2,055 | 17.1% |
| 35 to 39 Minutes | 315 | 2.6% |
| 40 to 44 Minutes | 220 | 1.8% |
| 45 to 59 Minutes | 278 | 2.3% |
| 60 to 89 Minutes | 445 | 3.7% |
| 90 or more Minutes | 264 | 2.2% |
Commute Time by Sex in Whitley County
The most common commute times in Whitley County are 30 to 34 minutes (1,191 commuters, 19.8%) for males and 15 to 19 minutes (1,071 commuters, 17.9%) for females.
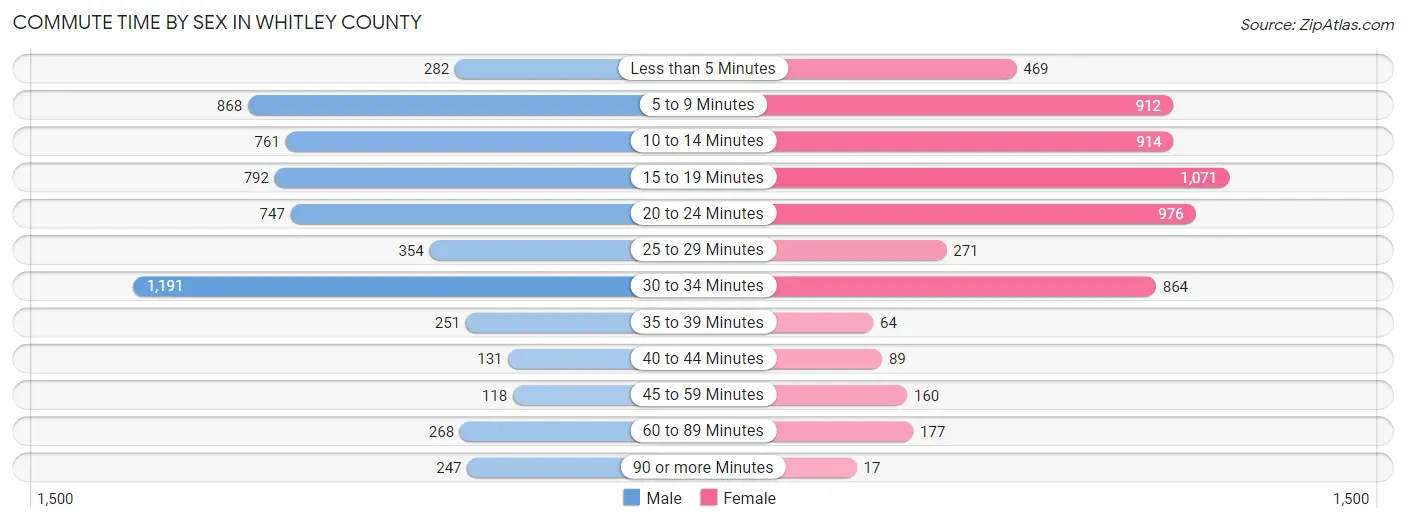
| Commute Time | Male | Female |
| Less than 5 Minutes | 282 (4.7%) | 469 (7.8%) |
| 5 to 9 Minutes | 868 (14.4%) | 912 (15.2%) |
| 10 to 14 Minutes | 761 (12.7%) | 914 (15.3%) |
| 15 to 19 Minutes | 792 (13.2%) | 1,071 (17.9%) |
| 20 to 24 Minutes | 747 (12.4%) | 976 (16.3%) |
| 25 to 29 Minutes | 354 (5.9%) | 271 (4.5%) |
| 30 to 34 Minutes | 1,191 (19.8%) | 864 (14.4%) |
| 35 to 39 Minutes | 251 (4.2%) | 64 (1.1%) |
| 40 to 44 Minutes | 131 (2.2%) | 89 (1.5%) |
| 45 to 59 Minutes | 118 (2.0%) | 160 (2.7%) |
| 60 to 89 Minutes | 268 (4.5%) | 177 (3.0%) |
| 90 or more Minutes | 247 (4.1%) | 17 (0.3%) |
Time of Departure to Work by Sex in Whitley County
The most frequent times of departure to work in Whitley County are 7:30 AM to 7:59 AM (890, 14.8%) for males and 7:30 AM to 7:59 AM (958, 16.0%) for females.
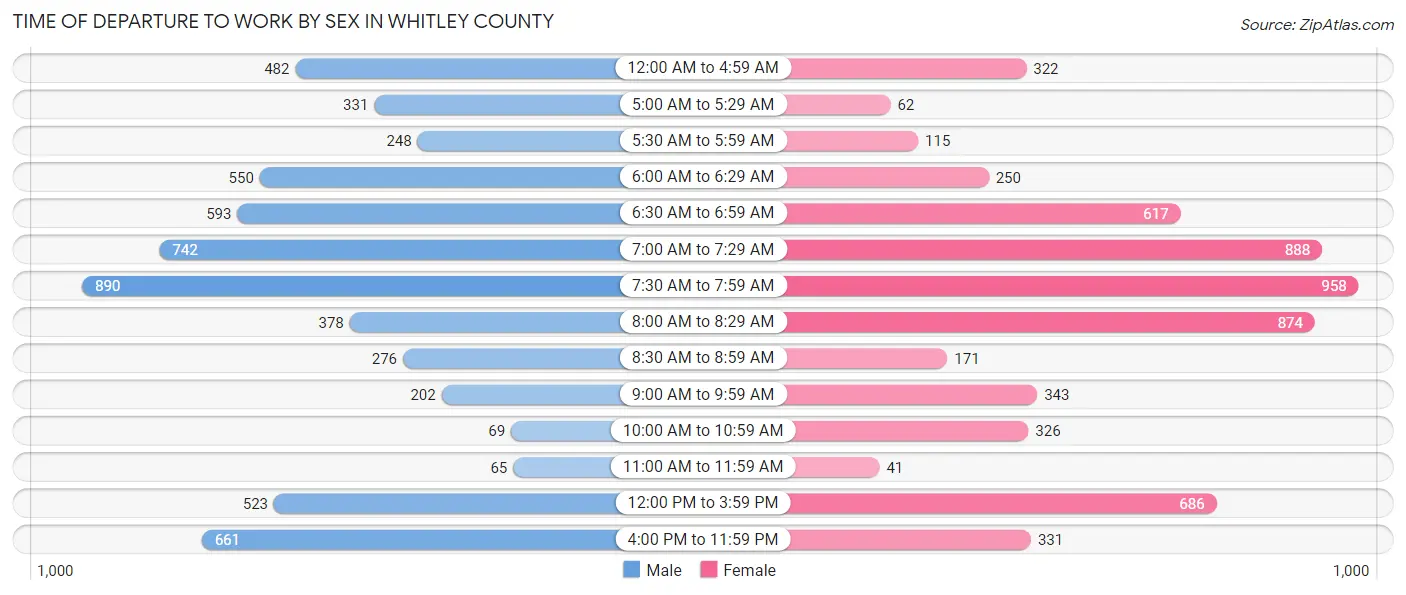
| Time of Departure | Male | Female |
| 12:00 AM to 4:59 AM | 482 (8.0%) | 322 (5.4%) |
| 5:00 AM to 5:29 AM | 331 (5.5%) | 62 (1.0%) |
| 5:30 AM to 5:59 AM | 248 (4.1%) | 115 (1.9%) |
| 6:00 AM to 6:29 AM | 550 (9.1%) | 250 (4.2%) |
| 6:30 AM to 6:59 AM | 593 (9.9%) | 617 (10.3%) |
| 7:00 AM to 7:29 AM | 742 (12.3%) | 888 (14.8%) |
| 7:30 AM to 7:59 AM | 890 (14.8%) | 958 (16.0%) |
| 8:00 AM to 8:29 AM | 378 (6.3%) | 874 (14.6%) |
| 8:30 AM to 8:59 AM | 276 (4.6%) | 171 (2.9%) |
| 9:00 AM to 9:59 AM | 202 (3.4%) | 343 (5.7%) |
| 10:00 AM to 10:59 AM | 69 (1.1%) | 326 (5.4%) |
| 11:00 AM to 11:59 AM | 65 (1.1%) | 41 (0.7%) |
| 12:00 PM to 3:59 PM | 523 (8.7%) | 686 (11.5%) |
| 4:00 PM to 11:59 PM | 661 (11.0%) | 331 (5.5%) |
| Total | 6,010 (100.0%) | 5,984 (100.0%) |
Housing Occupancy in Whitley County
Occupancy by Ownership in Whitley County
Of the total 13,076 dwellings in Whitley County, owner-occupied units account for 8,718 (66.7%), while renter-occupied units make up 4,358 (33.3%).
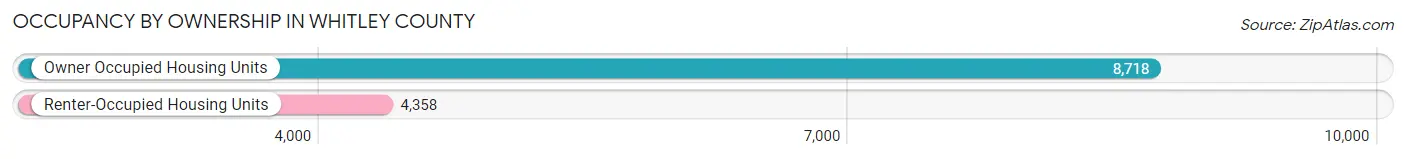
| Occupancy | # Housing Units | % Housing Units |
| Owner Occupied Housing Units | 8,718 | 66.7% |
| Renter-Occupied Housing Units | 4,358 | 33.3% |
| Total Occupied Housing Units | 13,076 | 100.0% |
Occupancy by Household Size in Whitley County
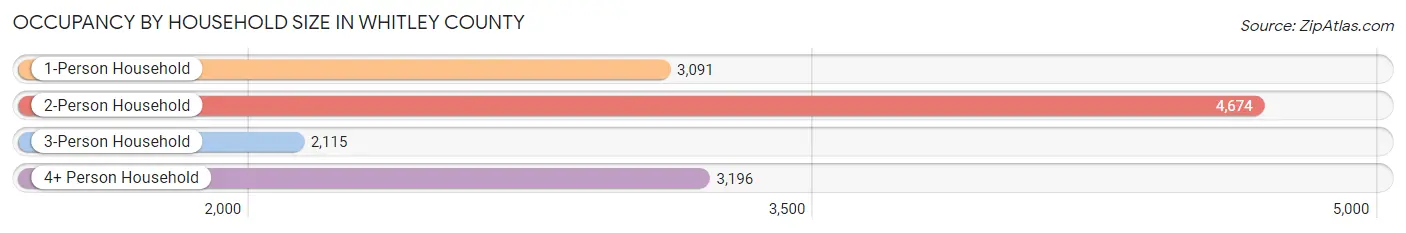
| Household Size | # Housing Units | % Housing Units |
| 1-Person Household | 3,091 | 23.6% |
| 2-Person Household | 4,674 | 35.7% |
| 3-Person Household | 2,115 | 16.2% |
| 4+ Person Household | 3,196 | 24.4% |
| Total Housing Units | 13,076 | 100.0% |
Occupancy by Ownership by Household Size in Whitley County
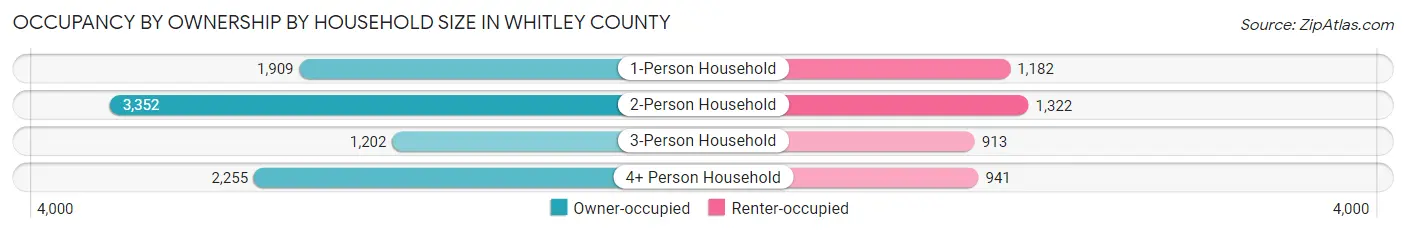
| Household Size | Owner-occupied | Renter-occupied |
| 1-Person Household | 1,909 (61.8%) | 1,182 (38.2%) |
| 2-Person Household | 3,352 (71.7%) | 1,322 (28.3%) |
| 3-Person Household | 1,202 (56.8%) | 913 (43.2%) |
| 4+ Person Household | 2,255 (70.6%) | 941 (29.4%) |
| Total Housing Units | 8,718 (66.7%) | 4,358 (33.3%) |
Occupancy by Educational Attainment in Whitley County
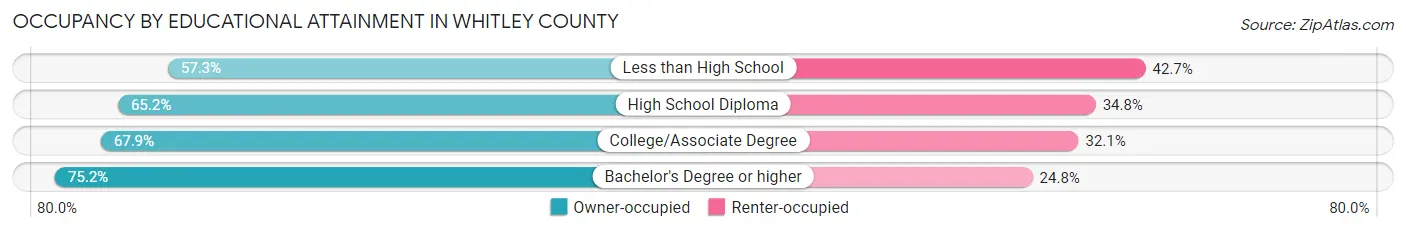
| Household Size | Owner-occupied | Renter-occupied |
| Less than High School | 1,245 (57.3%) | 929 (42.7%) |
| High School Diploma | 3,223 (65.2%) | 1,722 (34.8%) |
| College/Associate Degree | 2,130 (67.9%) | 1,007 (32.1%) |
| Bachelor's Degree or higher | 2,120 (75.2%) | 700 (24.8%) |
Occupancy by Age of Householder in Whitley County
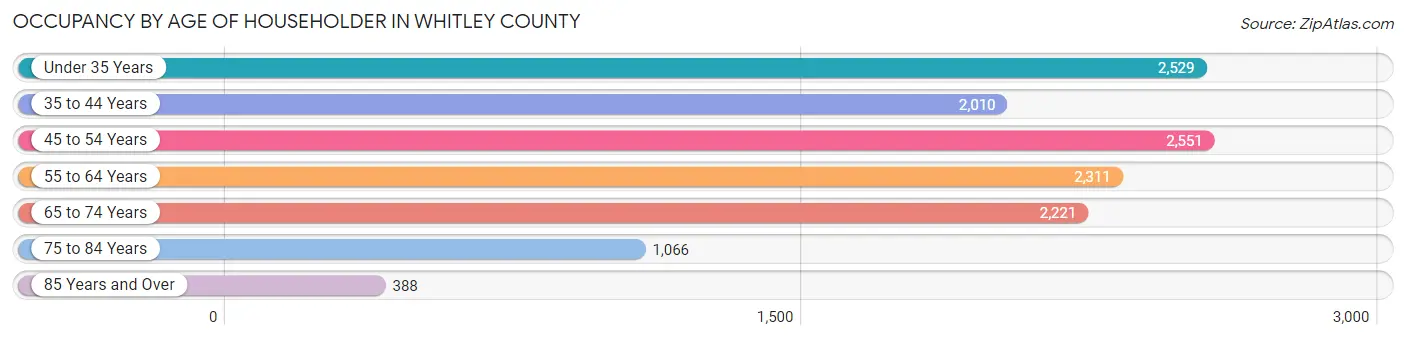
| Age Bracket | # Households | % Households |
| Under 35 Years | 2,529 | 19.3% |
| 35 to 44 Years | 2,010 | 15.4% |
| 45 to 54 Years | 2,551 | 19.5% |
| 55 to 64 Years | 2,311 | 17.7% |
| 65 to 74 Years | 2,221 | 17.0% |
| 75 to 84 Years | 1,066 | 8.2% |
| 85 Years and Over | 388 | 3.0% |
| Total | 13,076 | 100.0% |
Housing Finances in Whitley County
Median Income by Occupancy in Whitley County
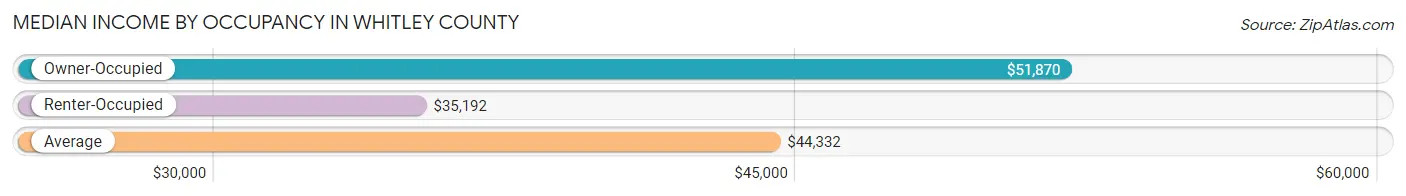
| Occupancy Type | # Households | Median Income |
| Owner-Occupied | 8,718 (66.7%) | $51,870 |
| Renter-Occupied | 4,358 (33.3%) | $35,192 |
| Average | 13,076 (100.0%) | $44,332 |
Occupancy by Householder Income Bracket in Whitley County
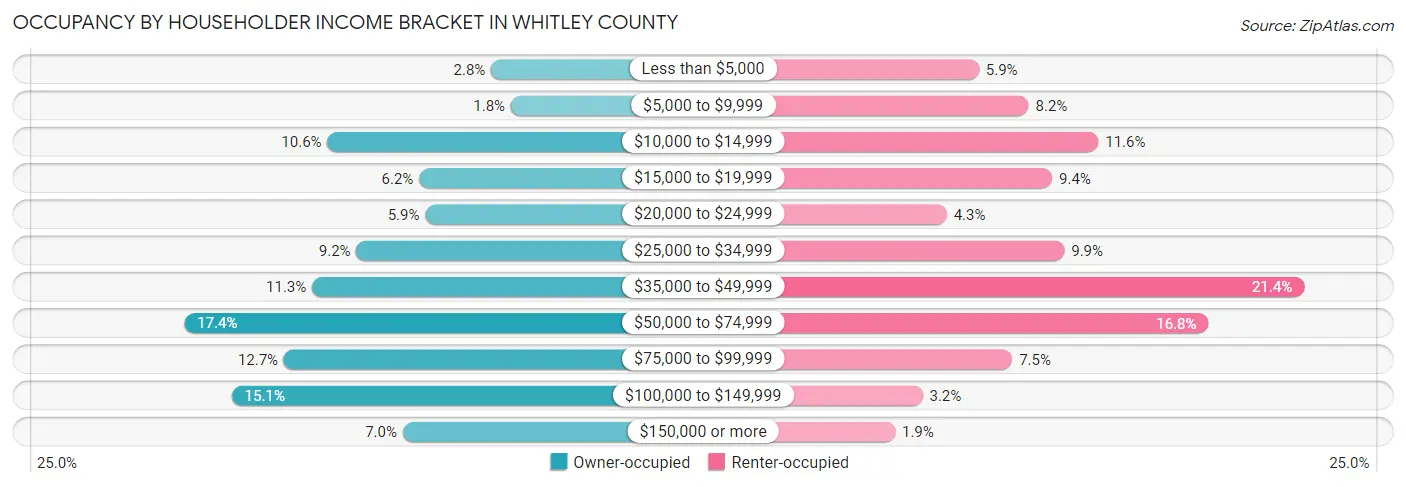
| Income Bracket | Owner-occupied | Renter-occupied |
| Less than $5,000 | 242 (2.8%) | 256 (5.9%) |
| $5,000 to $9,999 | 160 (1.8%) | 359 (8.2%) |
| $10,000 to $14,999 | 922 (10.6%) | 504 (11.6%) |
| $15,000 to $19,999 | 541 (6.2%) | 408 (9.4%) |
| $20,000 to $24,999 | 516 (5.9%) | 189 (4.3%) |
| $25,000 to $34,999 | 802 (9.2%) | 433 (9.9%) |
| $35,000 to $49,999 | 986 (11.3%) | 931 (21.4%) |
| $50,000 to $74,999 | 1,517 (17.4%) | 732 (16.8%) |
| $75,000 to $99,999 | 1,103 (12.7%) | 325 (7.5%) |
| $100,000 to $149,999 | 1,320 (15.1%) | 139 (3.2%) |
| $150,000 or more | 609 (7.0%) | 82 (1.9%) |
| Total | 8,718 (100.0%) | 4,358 (100.0%) |
Monthly Housing Cost Tiers in Whitley County
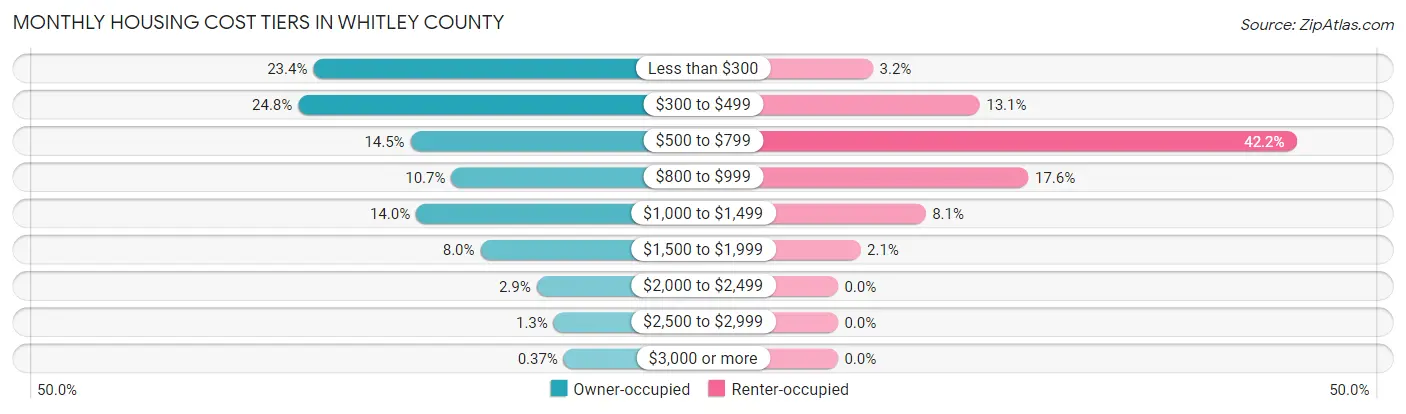
| Monthly Cost | Owner-occupied | Renter-occupied |
| Less than $300 | 2,043 (23.4%) | 141 (3.2%) |
| $300 to $499 | 2,164 (24.8%) | 569 (13.1%) |
| $500 to $799 | 1,262 (14.5%) | 1,841 (42.2%) |
| $800 to $999 | 935 (10.7%) | 765 (17.5%) |
| $1,000 to $1,499 | 1,218 (14.0%) | 352 (8.1%) |
| $1,500 to $1,999 | 701 (8.0%) | 91 (2.1%) |
| $2,000 to $2,499 | 250 (2.9%) | 0 (0.0%) |
| $2,500 to $2,999 | 113 (1.3%) | 0 (0.0%) |
| $3,000 or more | 32 (0.4%) | 0 (0.0%) |
| Total | 8,718 (100.0%) | 4,358 (100.0%) |
Physical Housing Characteristics in Whitley County
Housing Structures in Whitley County
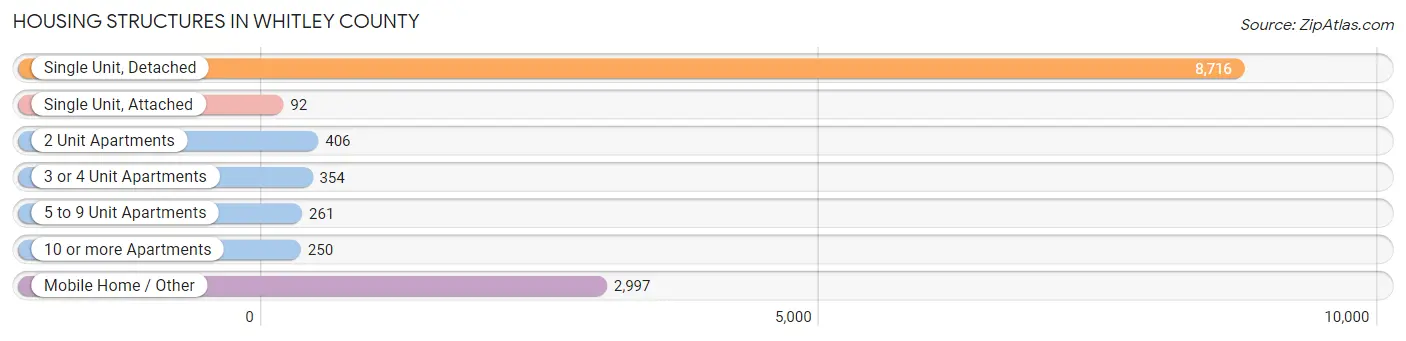
| Structure Type | # Housing Units | % Housing Units |
| Single Unit, Detached | 8,716 | 66.7% |
| Single Unit, Attached | 92 | 0.7% |
| 2 Unit Apartments | 406 | 3.1% |
| 3 or 4 Unit Apartments | 354 | 2.7% |
| 5 to 9 Unit Apartments | 261 | 2.0% |
| 10 or more Apartments | 250 | 1.9% |
| Mobile Home / Other | 2,997 | 22.9% |
| Total | 13,076 | 100.0% |
Housing Structures by Occupancy in Whitley County
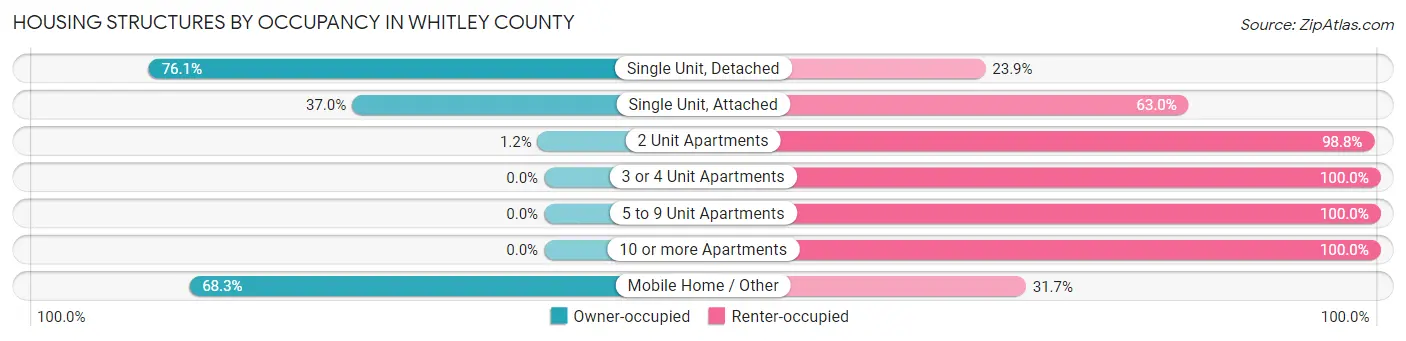
| Structure Type | Owner-occupied | Renter-occupied |
| Single Unit, Detached | 6,632 (76.1%) | 2,084 (23.9%) |
| Single Unit, Attached | 34 (37.0%) | 58 (63.0%) |
| 2 Unit Apartments | 5 (1.2%) | 401 (98.8%) |
| 3 or 4 Unit Apartments | 0 (0.0%) | 354 (100.0%) |
| 5 to 9 Unit Apartments | 0 (0.0%) | 261 (100.0%) |
| 10 or more Apartments | 0 (0.0%) | 250 (100.0%) |
| Mobile Home / Other | 2,047 (68.3%) | 950 (31.7%) |
| Total | 8,718 (66.7%) | 4,358 (33.3%) |
Housing Structures by Number of Rooms in Whitley County
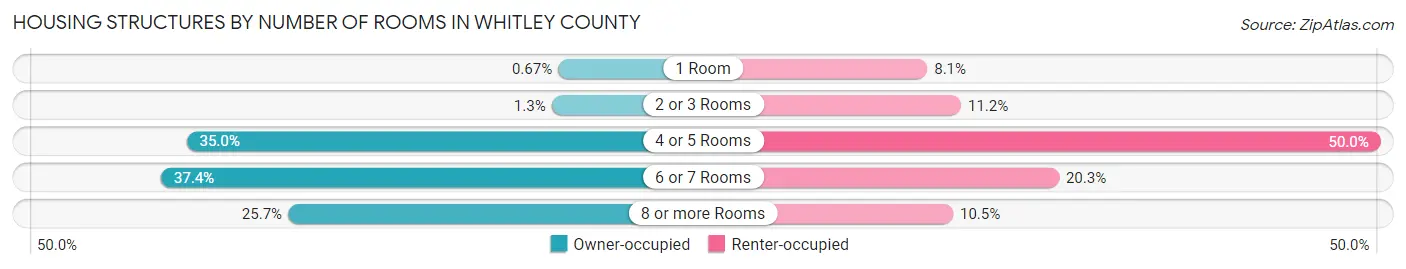
| Number of Rooms | Owner-occupied | Renter-occupied |
| 1 Room | 58 (0.7%) | 352 (8.1%) |
| 2 or 3 Rooms | 111 (1.3%) | 488 (11.2%) |
| 4 or 5 Rooms | 3,053 (35.0%) | 2,179 (50.0%) |
| 6 or 7 Rooms | 3,260 (37.4%) | 883 (20.3%) |
| 8 or more Rooms | 2,236 (25.7%) | 456 (10.5%) |
| Total | 8,718 (100.0%) | 4,358 (100.0%) |
Housing Structure by Heating Type in Whitley County
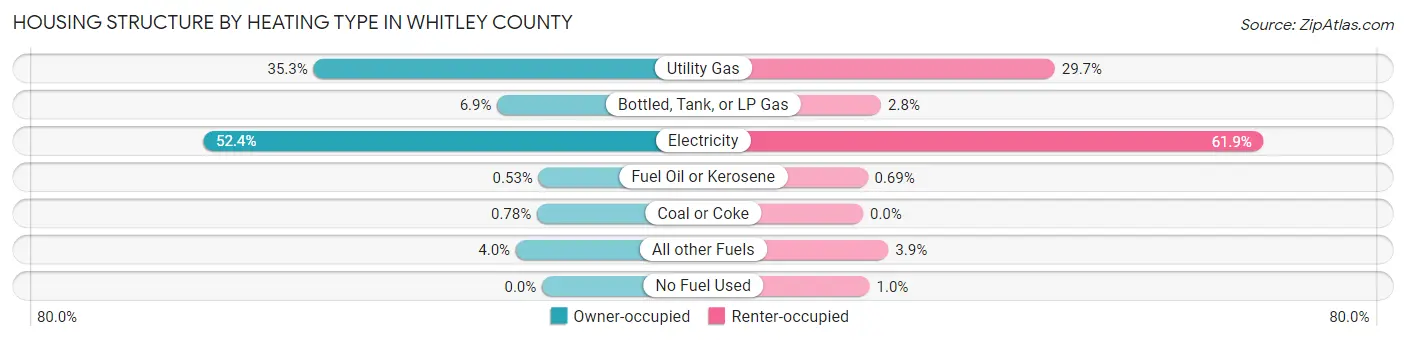
| Heating Type | Owner-occupied | Renter-occupied |
| Utility Gas | 3,079 (35.3%) | 1,292 (29.6%) |
| Bottled, Tank, or LP Gas | 604 (6.9%) | 122 (2.8%) |
| Electricity | 4,569 (52.4%) | 2,699 (61.9%) |
| Fuel Oil or Kerosene | 46 (0.5%) | 30 (0.7%) |
| Coal or Coke | 68 (0.8%) | 0 (0.0%) |
| All other Fuels | 352 (4.0%) | 171 (3.9%) |
| No Fuel Used | 0 (0.0%) | 44 (1.0%) |
| Total | 8,718 (100.0%) | 4,358 (100.0%) |
Household Vehicle Usage in Whitley County
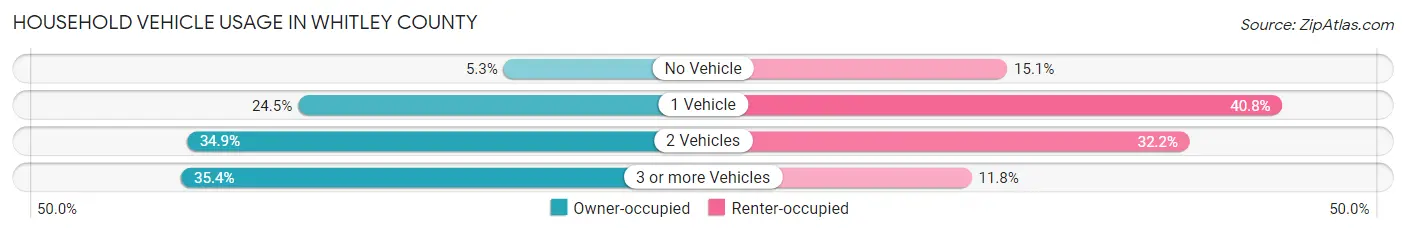
| Vehicles per Household | Owner-occupied | Renter-occupied |
| No Vehicle | 461 (5.3%) | 660 (15.1%) |
| 1 Vehicle | 2,134 (24.5%) | 1,780 (40.8%) |
| 2 Vehicles | 3,039 (34.9%) | 1,403 (32.2%) |
| 3 or more Vehicles | 3,084 (35.4%) | 515 (11.8%) |
| Total | 8,718 (100.0%) | 4,358 (100.0%) |
Real Estate & Mortgages in Whitley County
Real Estate and Mortgage Overview in Whitley County
| Characteristic | Without Mortgage | With Mortgage |
| Housing Units | 4,859 | 3,859 |
| Median Property Value | $90,700 | $144,000 |
| Median Household Income | $35,693 | $380 |
| Monthly Housing Costs | $331 | $32 |
| Real Estate Taxes | $602 | $251 |
Property Value by Mortgage Status in Whitley County
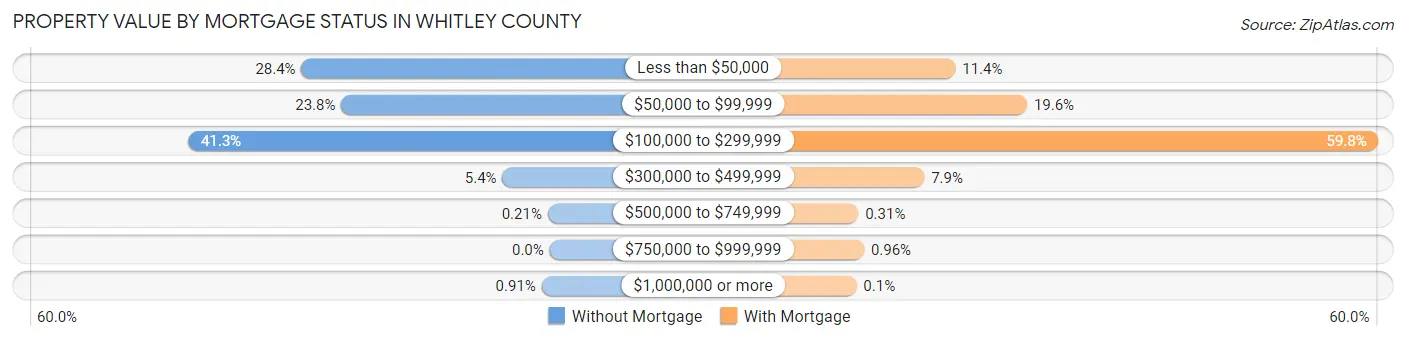
| Property Value | Without Mortgage | With Mortgage |
| Less than $50,000 | 1,378 (28.4%) | 440 (11.4%) |
| $50,000 to $99,999 | 1,157 (23.8%) | 756 (19.6%) |
| $100,000 to $299,999 | 2,008 (41.3%) | 2,307 (59.8%) |
| $300,000 to $499,999 | 262 (5.4%) | 303 (7.9%) |
| $500,000 to $749,999 | 10 (0.2%) | 12 (0.3%) |
| $750,000 to $999,999 | 0 (0.0%) | 37 (1.0%) |
| $1,000,000 or more | 44 (0.9%) | 4 (0.1%) |
| Total | 4,859 (100.0%) | 3,859 (100.0%) |
Household Income by Mortgage Status in Whitley County
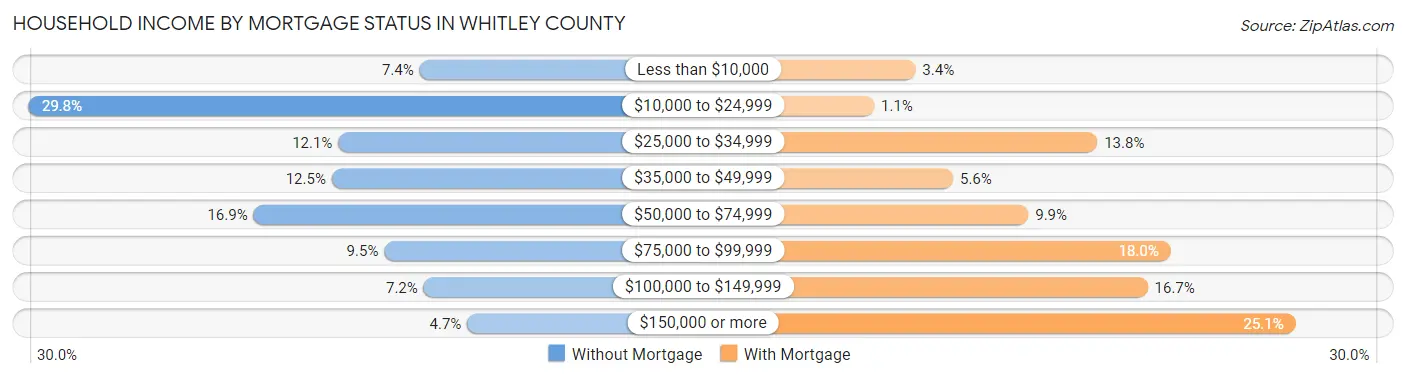
| Household Income | Without Mortgage | With Mortgage |
| Less than $10,000 | 361 (7.4%) | 132 (3.4%) |
| $10,000 to $24,999 | 1,446 (29.8%) | 41 (1.1%) |
| $25,000 to $34,999 | 587 (12.1%) | 533 (13.8%) |
| $35,000 to $49,999 | 605 (12.4%) | 215 (5.6%) |
| $50,000 to $74,999 | 822 (16.9%) | 381 (9.9%) |
| $75,000 to $99,999 | 459 (9.5%) | 695 (18.0%) |
| $100,000 to $149,999 | 350 (7.2%) | 644 (16.7%) |
| $150,000 or more | 229 (4.7%) | 970 (25.1%) |
| Total | 4,859 (100.0%) | 3,859 (100.0%) |
Property Value to Household Income Ratio in Whitley County
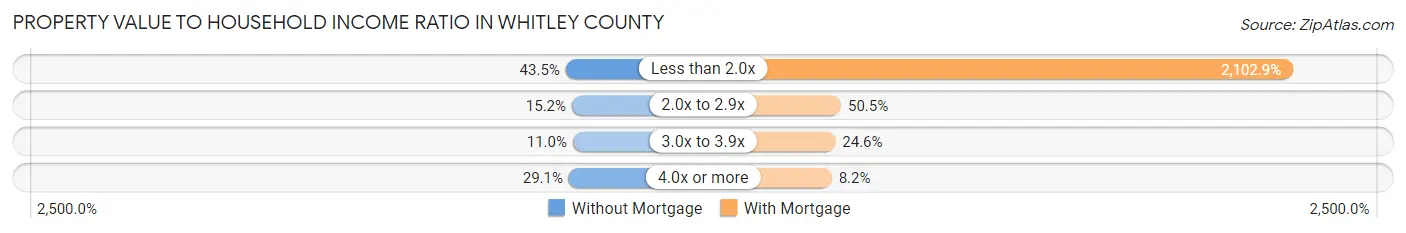
| Value-to-Income Ratio | Without Mortgage | With Mortgage |
| Less than 2.0x | 2,112 (43.5%) | 81,149 (2,102.9%) |
| 2.0x to 2.9x | 738 (15.2%) | 1,949 (50.5%) |
| 3.0x to 3.9x | 535 (11.0%) | 950 (24.6%) |
| 4.0x or more | 1,416 (29.1%) | 315 (8.2%) |
| Total | 4,859 (100.0%) | 3,859 (100.0%) |
Real Estate Taxes by Mortgage Status in Whitley County
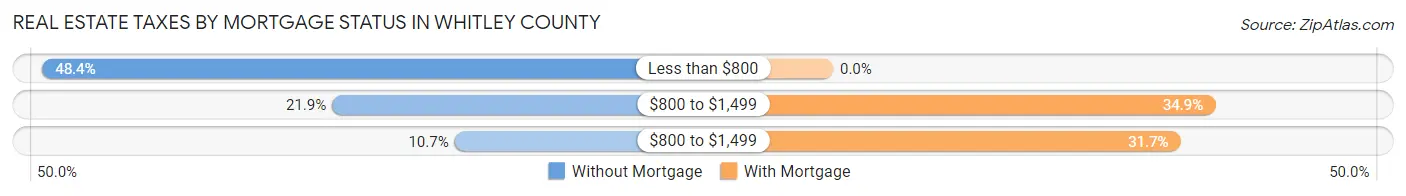
| Property Taxes | Without Mortgage | With Mortgage |
| Less than $800 | 2,351 (48.4%) | 0 (0.0%) |
| $800 to $1,499 | 1,065 (21.9%) | 1,346 (34.9%) |
| $800 to $1,499 | 522 (10.7%) | 1,224 (31.7%) |
| Total | 4,859 (100.0%) | 3,859 (100.0%) |
Health & Disability in Whitley County
Health Insurance Coverage by Age in Whitley County
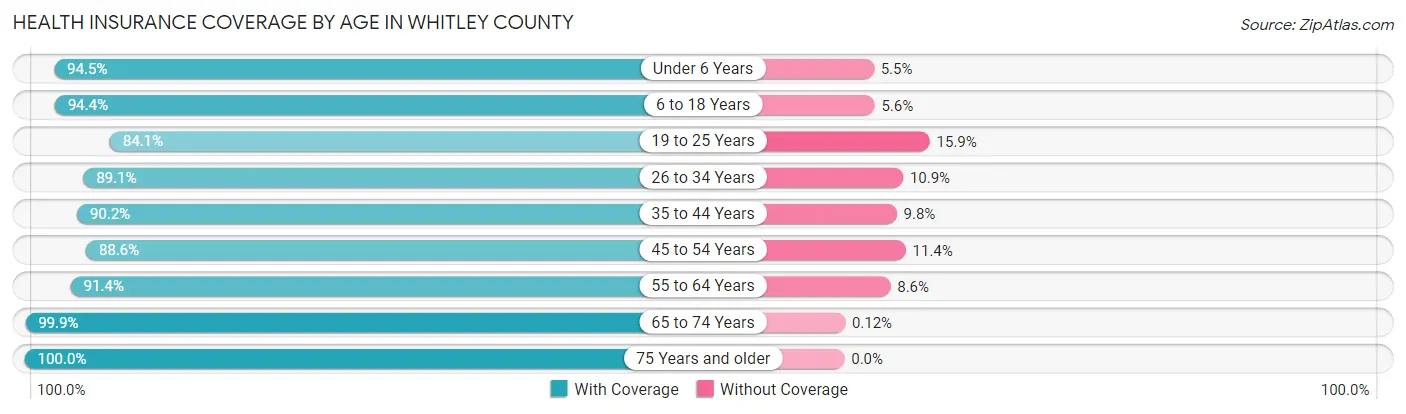
| Age Bracket | With Coverage | Without Coverage |
| Under 6 Years | 2,980 (94.5%) | 173 (5.5%) |
| 6 to 18 Years | 6,341 (94.4%) | 378 (5.6%) |
| 19 to 25 Years | 3,349 (84.1%) | 633 (15.9%) |
| 26 to 34 Years | 3,526 (89.1%) | 433 (10.9%) |
| 35 to 44 Years | 3,743 (90.2%) | 405 (9.8%) |
| 45 to 54 Years | 3,789 (88.6%) | 489 (11.4%) |
| 55 to 64 Years | 3,994 (91.4%) | 375 (8.6%) |
| 65 to 74 Years | 3,325 (99.9%) | 4 (0.1%) |
| 75 Years and older | 2,187 (100.0%) | 0 (0.0%) |
| Total | 33,234 (92.0%) | 2,890 (8.0%) |
Health Insurance Coverage by Citizenship Status in Whitley County
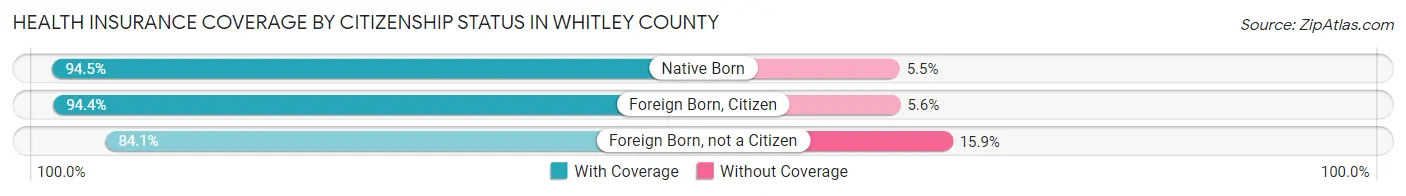
| Citizenship Status | With Coverage | Without Coverage |
| Native Born | 2,980 (94.5%) | 173 (5.5%) |
| Foreign Born, Citizen | 6,341 (94.4%) | 378 (5.6%) |
| Foreign Born, not a Citizen | 3,349 (84.1%) | 633 (15.9%) |
Health Insurance Coverage by Household Income in Whitley County
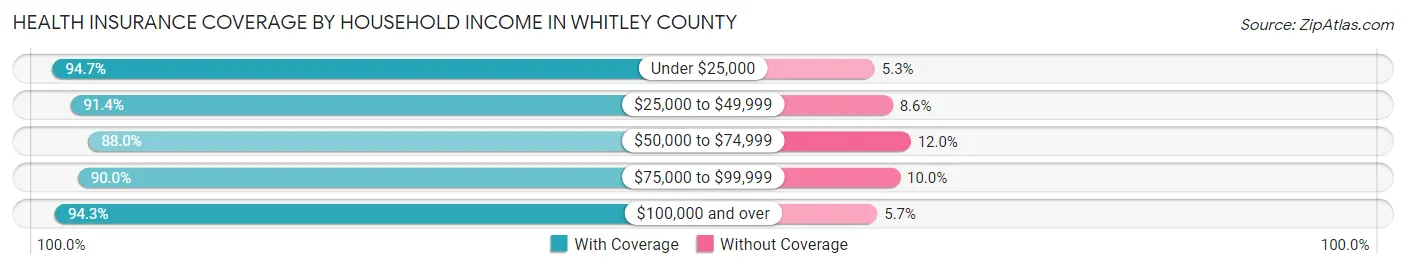
| Household Income | With Coverage | Without Coverage |
| Under $25,000 | 7,872 (94.7%) | 437 (5.3%) |
| $25,000 to $49,999 | 7,391 (91.4%) | 695 (8.6%) |
| $50,000 to $74,999 | 5,435 (88.0%) | 739 (12.0%) |
| $75,000 to $99,999 | 4,471 (90.0%) | 495 (10.0%) |
| $100,000 and over | 6,918 (94.3%) | 419 (5.7%) |
Public vs Private Health Insurance Coverage by Age in Whitley County
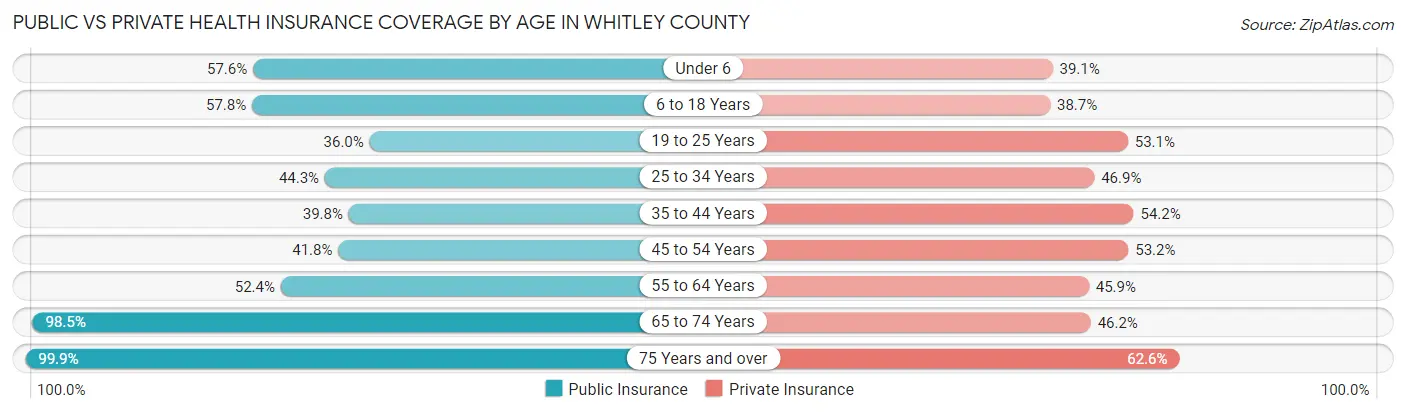
| Age Bracket | Public Insurance | Private Insurance |
| Under 6 | 1,816 (57.6%) | 1,233 (39.1%) |
| 6 to 18 Years | 3,883 (57.8%) | 2,597 (38.7%) |
| 19 to 25 Years | 1,432 (36.0%) | 2,114 (53.1%) |
| 25 to 34 Years | 1,752 (44.3%) | 1,855 (46.9%) |
| 35 to 44 Years | 1,652 (39.8%) | 2,246 (54.1%) |
| 45 to 54 Years | 1,787 (41.8%) | 2,275 (53.2%) |
| 55 to 64 Years | 2,291 (52.4%) | 2,003 (45.9%) |
| 65 to 74 Years | 3,280 (98.5%) | 1,538 (46.2%) |
| 75 Years and over | 2,184 (99.9%) | 1,370 (62.6%) |
| Total | 20,077 (55.6%) | 17,231 (47.7%) |
Disability Status by Sex by Age in Whitley County
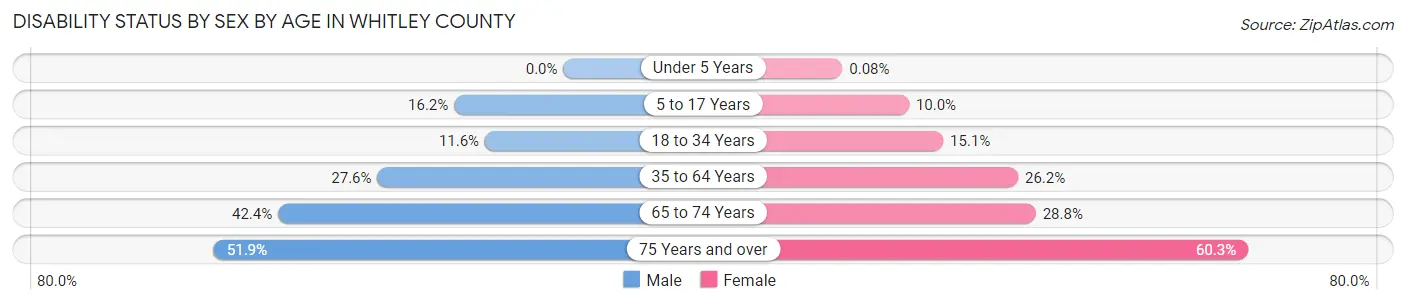
| Age Bracket | Male | Female |
| Under 5 Years | 0 (0.0%) | 1 (0.1%) |
| 5 to 17 Years | 575 (16.2%) | 320 (10.0%) |
| 18 to 34 Years | 495 (11.6%) | 635 (15.0%) |
| 35 to 64 Years | 1,709 (27.6%) | 1,729 (26.2%) |
| 65 to 74 Years | 669 (42.4%) | 504 (28.8%) |
| 75 Years and over | 481 (51.9%) | 760 (60.3%) |
Disability Class by Sex by Age in Whitley County
Disability Class: Hearing Difficulty
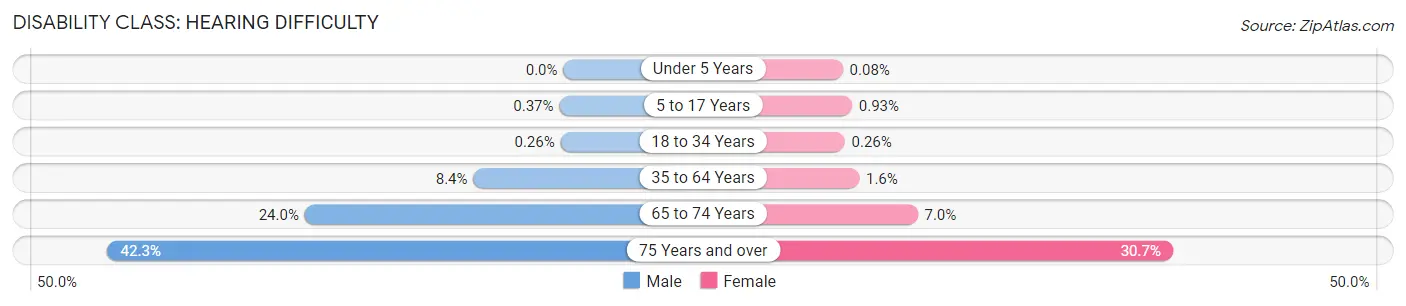
| Age Bracket | Male | Female |
| Under 5 Years | 0 (0.0%) | 1 (0.1%) |
| 5 to 17 Years | 13 (0.4%) | 30 (0.9%) |
| 18 to 34 Years | 11 (0.3%) | 11 (0.3%) |
| 35 to 64 Years | 517 (8.4%) | 106 (1.6%) |
| 65 to 74 Years | 379 (24.0%) | 123 (7.0%) |
| 75 Years and over | 392 (42.3%) | 387 (30.7%) |
Disability Class: Vision Difficulty
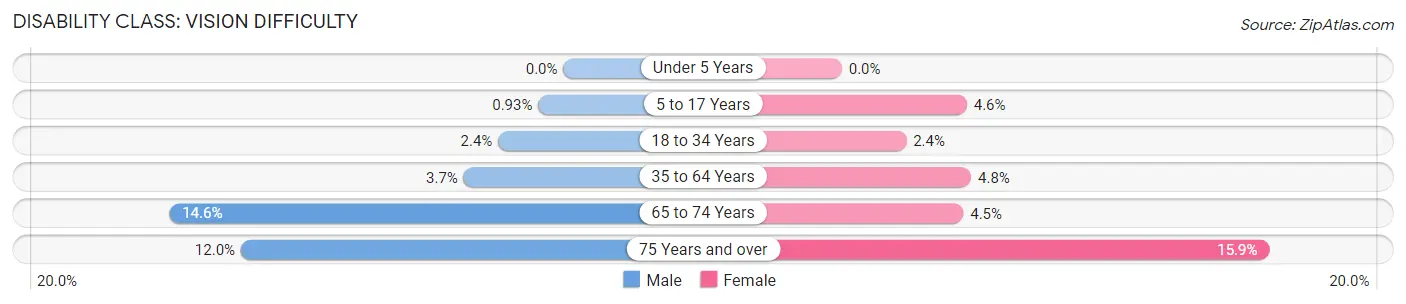
| Age Bracket | Male | Female |
| Under 5 Years | 0 (0.0%) | 0 (0.0%) |
| 5 to 17 Years | 33 (0.9%) | 149 (4.6%) |
| 18 to 34 Years | 103 (2.4%) | 101 (2.4%) |
| 35 to 64 Years | 229 (3.7%) | 317 (4.8%) |
| 65 to 74 Years | 231 (14.6%) | 79 (4.5%) |
| 75 Years and over | 111 (12.0%) | 200 (15.9%) |
Disability Class: Cognitive Difficulty
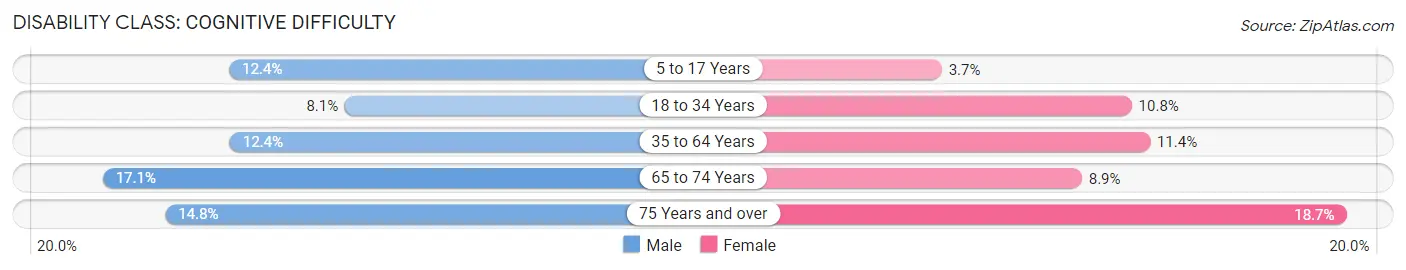
| Age Bracket | Male | Female |
| 5 to 17 Years | 440 (12.4%) | 119 (3.7%) |
| 18 to 34 Years | 346 (8.1%) | 454 (10.8%) |
| 35 to 64 Years | 766 (12.4%) | 756 (11.4%) |
| 65 to 74 Years | 270 (17.1%) | 156 (8.9%) |
| 75 Years and over | 137 (14.8%) | 236 (18.7%) |
Disability Class: Ambulatory Difficulty
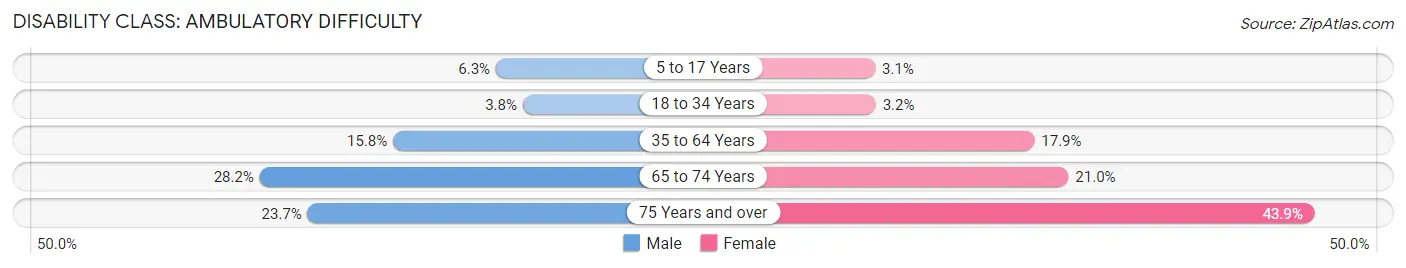
| Age Bracket | Male | Female |
| 5 to 17 Years | 222 (6.3%) | 99 (3.1%) |
| 18 to 34 Years | 160 (3.8%) | 133 (3.2%) |
| 35 to 64 Years | 978 (15.8%) | 1,181 (17.9%) |
| 65 to 74 Years | 445 (28.2%) | 368 (21.0%) |
| 75 Years and over | 220 (23.7%) | 553 (43.9%) |
Disability Class: Self-Care Difficulty
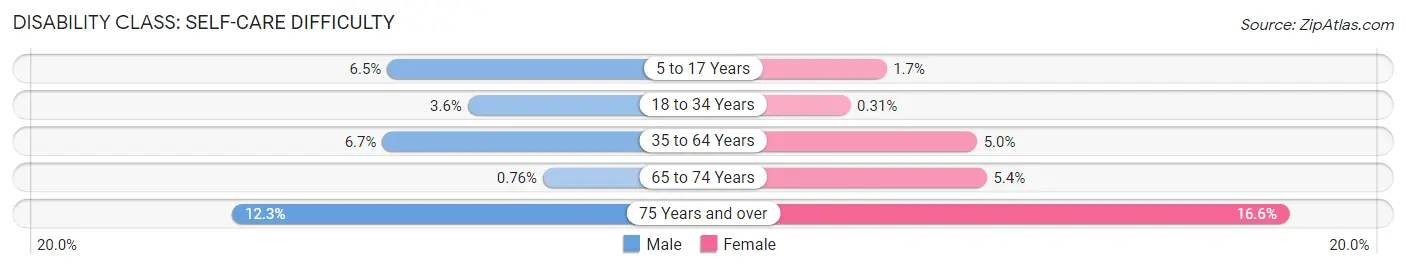
| Age Bracket | Male | Female |
| 5 to 17 Years | 232 (6.5%) | 53 (1.7%) |
| 18 to 34 Years | 151 (3.5%) | 13 (0.3%) |
| 35 to 64 Years | 416 (6.7%) | 331 (5.0%) |
| 65 to 74 Years | 12 (0.8%) | 94 (5.4%) |
| 75 Years and over | 114 (12.3%) | 209 (16.6%) |
Technology Access in Whitley County
Computing Device Access in Whitley County
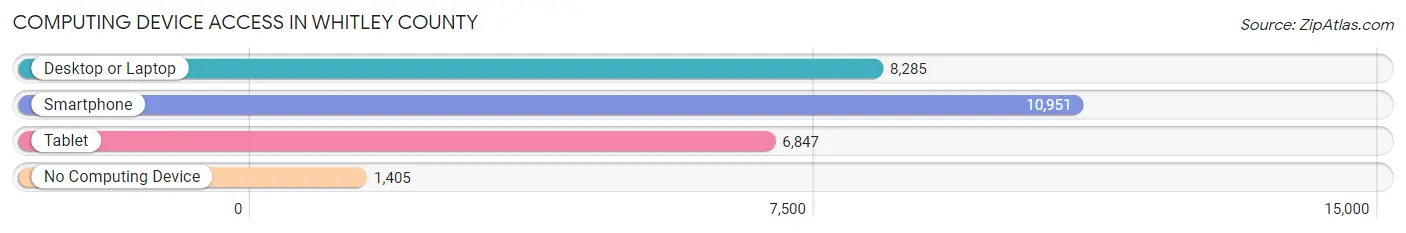
| Device Type | # Households | % Households |
| Desktop or Laptop | 8,285 | 63.4% |
| Smartphone | 10,951 | 83.8% |
| Tablet | 6,847 | 52.4% |
| No Computing Device | 1,405 | 10.7% |
| Total | 13,076 | 100.0% |
Internet Access in Whitley County
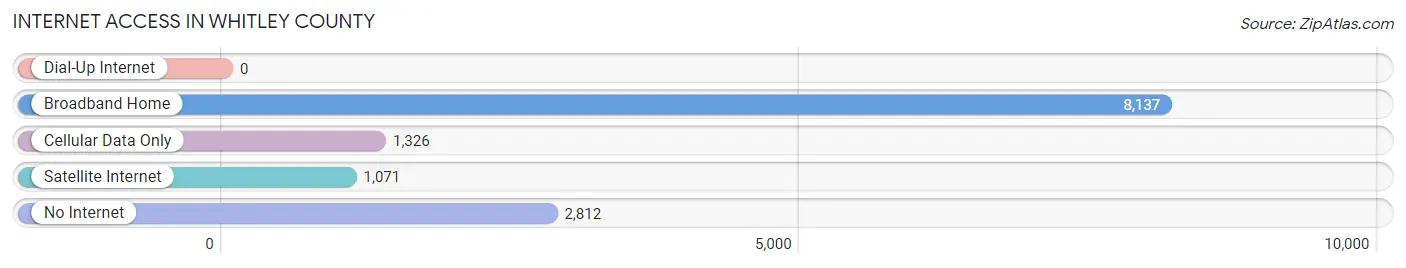
| Internet Type | # Households | % Households |
| Dial-Up Internet | 0 | 0.0% |
| Broadband Home | 8,137 | 62.2% |
| Cellular Data Only | 1,326 | 10.1% |
| Satellite Internet | 1,071 | 8.2% |
| No Internet | 2,812 | 21.5% |
| Total | 13,076 | 100.0% |
Whitley County Summary
Whitley County is located in the southeastern corner of Kentucky, and is part of the Cumberland Plateau region. It is bordered by McCreary County to the north, Knox County to the east, Laurel County to the south, and Clay County to the west. The county seat is Williamsburg, and the county was formed in 1818 from parts of Knox and Pulaski counties. The county is named for William Whitley, a Revolutionary War soldier and early settler of the area.
Geography
Whitley County covers an area of 437 square miles, and is located in the Appalachian Mountains. The terrain is mostly hilly, with some flat areas in the valleys. The highest point in the county is Big Black Mountain, at 2,890 feet. The county is drained by the Cumberland River, which forms the northern border, and the Rockcastle River, which flows through the county. The county is mostly forested, with some agricultural land in the valleys.
Climate
Whitley County has a humid subtropical climate, with hot, humid summers and mild winters. The average annual temperature is 57°F, and the average annual precipitation is 45 inches.
Demographics
As of the 2010 census, the population of Whitley County was 35,637. The population density was 81 people per square mile. The racial makeup of the county was 95.3% White, 2.3% Black or African American, 0.3% Native American, 0.3% Asian, 0.2% from other races, and 1.5% from two or more races. 1.7% of the population were Hispanic or Latino of any race.
The median household income was $30,845, and the median family income was $37,945. The per capita income was $16,845. About 17.2% of the population was below the poverty line.
Economy
The economy of Whitley County is largely based on agriculture and tourism. The county is home to several large farms, and the main crops are corn, soybeans, and tobacco. The county is also home to several tourist attractions, including the Cumberland Falls State Resort Park, the Big South Fork National River and Recreation Area, and the Daniel Boone National Forest.
The county is also home to several manufacturing companies, including a large paper mill in Williamsburg. The county is served by two major highways, US 25 and US 27, and is home to the Corbin-London Airport.
Conclusion
Whitley County is a rural county in southeastern Kentucky, located in the Appalachian Mountains. The county is mostly forested, with some agricultural land in the valleys. The economy is largely based on agriculture and tourism, and the county is home to several tourist attractions. The population of the county is mostly white, and the median household income is below the national average.
Common Questions
What is the Total Population of Whitley County?
Total Population of Whitley County is 36,648.
What is the Total Male Population of Whitley County?
Total Male Population of Whitley County is 18,114.
What is the Total Female Population of Whitley County?
Total Female Population of Whitley County is 18,534.
What is the Ratio of Males per 100 Females in Whitley County?
There are 97.73 Males per 100 Females in Whitley County.
What is the Ratio of Females per 100 Males in Whitley County?
There are 102.32 Females per 100 Males in Whitley County.
What is the Median Population Age in Whitley County?
Median Population Age in Whitley County is 36.1 Years.
What is the Average Family Size in Whitley County
Average Family Size in Whitley County is 3.1 People.
What is the Average Household Size in Whitley County
Average Household Size in Whitley County is 2.7 People.
What is Per Capita Income in Whitley County?
Per Capita income in Whitley County is $22,310.
What is the Median Family Income in Whitley County?
Median Family Income in Whitley County is $53,387.
What is the Median Household income in Whitley County?
Median Household Income in Whitley County is $44,332.
What is Income or Wage Gap in Whitley County?
Income or Wage Gap in Whitley County is 29.3%.
Women in Whitley County earn 70.7 cents for every dollar earned by a man.
What is Family Income Deficit in Whitley County?
Family Income Deficit in Whitley County is $10,803.
Families that are below poverty line in Whitley County earn $10,803 less on average than the poverty threshold level.
What is Inequality or Gini Index in Whitley County?
Inequality or Gini Index in Whitley County is 0.49.
How Large is the Labor Force in Whitley County?
There are 14,171 People in the Labor Forcein in Whitley County.
What is the Percentage of People in the Labor Force in Whitley County?
50.4% of People are in the Labor Force in Whitley County.
What is the Unemployment Rate in Whitley County?
Unemployment Rate in Whitley County is 6.4%.