Shelby County, KY
Shelby County Map
Shelby County Overview
48,105
TOTAL POPULATION
23,719
MALE POPULATION
24,386
FEMALE POPULATION
97.26
MALES / 100 FEMALES
102.81
FEMALES / 100 MALES
40.6
MEDIAN AGE
3.1
AVG FAMILY SIZE
2.7
AVG HOUSEHOLD SIZE
$37,918
PER CAPITA INCOME
$94,658
AVG FAMILY INCOME
$81,012
AVG HOUSEHOLD INCOME
26.4%
WAGE / INCOME GAP [ % ]
73.6¢/ $1
WAGE / INCOME GAP [ $ ]
$12,534
FAMILY INCOME DEFICIT
0.43
INEQUALITY / GINI INDEX
25,186
LABOR FORCE [ PEOPLE ]
65.0%
PERCENT IN LABOR FORCE
3.3%
UNEMPLOYMENT RATE
Shelby County Area Codes
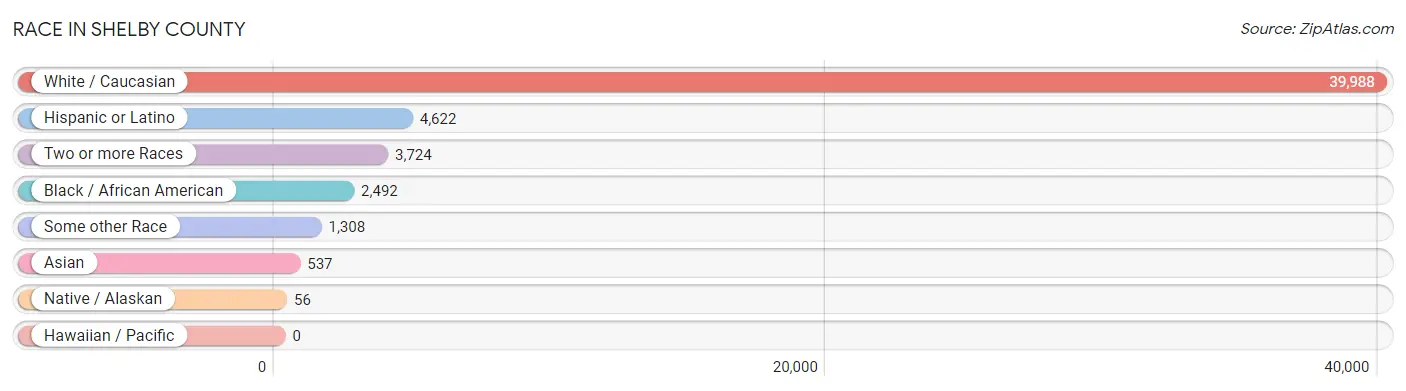
Race in Shelby County
The most populous races in Shelby County are White / Caucasian (39,988 | 83.1%), Hispanic or Latino (4,622 | 9.6%), and Two or more Races (3,724 | 7.7%).
| Race | # Population | % Population |
| Asian | 537 | 1.1% |
| Black / African American | 2,492 | 5.2% |
| Hawaiian / Pacific | 0 | 0.0% |
| Hispanic or Latino | 4,622 | 9.6% |
| Native / Alaskan | 56 | 0.1% |
| White / Caucasian | 39,988 | 83.1% |
| Two or more Races | 3,724 | 7.7% |
| Some other Race | 1,308 | 2.7% |
| Total | 48,105 | 100.0% |
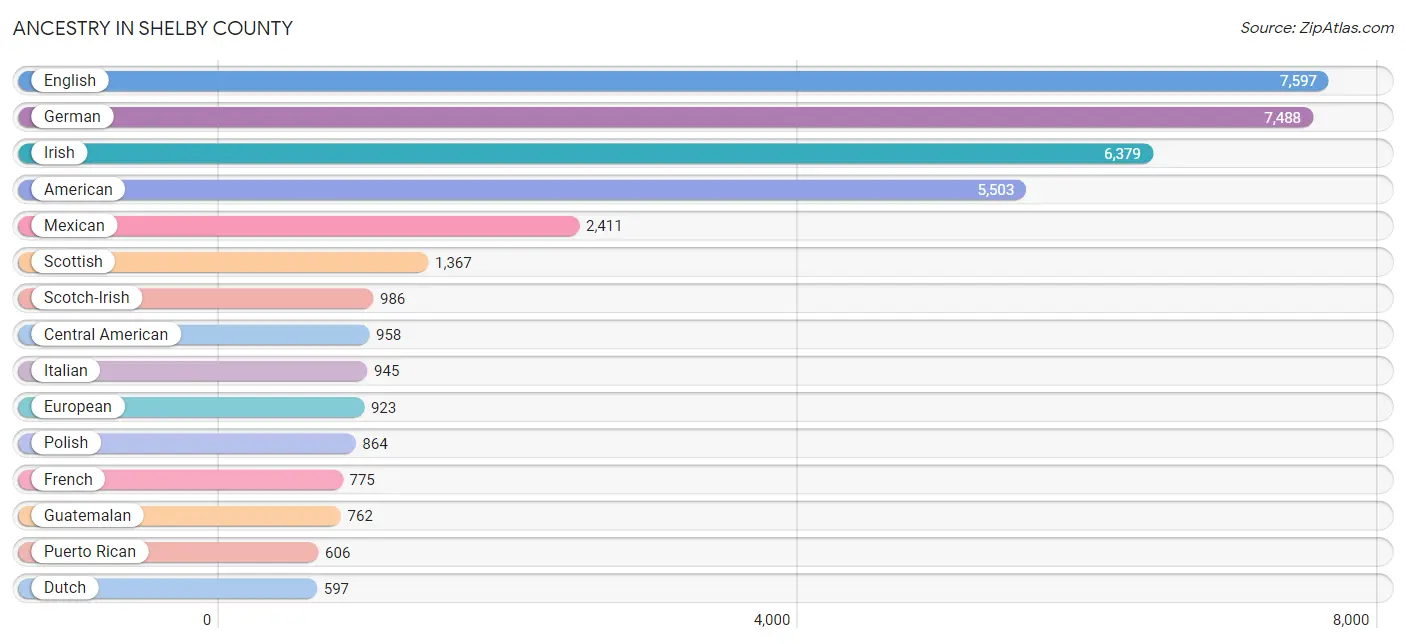
Ancestry in Shelby County
The most populous ancestries reported in Shelby County are English (7,597 | 15.8%), German (7,488 | 15.6%), Irish (6,379 | 13.3%), American (5,503 | 11.4%), and Mexican (2,411 | 5.0%), together accounting for 61.1% of all Shelby County residents.
| Ancestry | # Population | % Population |
| African | 41 | 0.1% |
| American | 5,503 | 11.4% |
| Arab | 52 | 0.1% |
| Armenian | 27 | 0.1% |
| Austrian | 118 | 0.3% |
| Belgian | 37 | 0.1% |
| Bermudan | 5 | 0.0% |
| Bhutanese | 30 | 0.1% |
| Blackfeet | 35 | 0.1% |
| Brazilian | 14 | 0.0% |
| British | 426 | 0.9% |
| Bulgarian | 14 | 0.0% |
| Burmese | 24 | 0.1% |
| Canadian | 18 | 0.0% |
| Central American | 958 | 2.0% |
| Cherokee | 321 | 0.7% |
| Costa Rican | 15 | 0.0% |
| Cuban | 419 | 0.9% |
| Czech | 39 | 0.1% |
| Danish | 38 | 0.1% |
| Delaware | 9 | 0.0% |
| Dutch | 597 | 1.2% |
| Eastern European | 117 | 0.2% |
| Ecuadorian | 12 | 0.0% |
| Egyptian | 5 | 0.0% |
| English | 7,597 | 15.8% |
| Ethiopian | 28 | 0.1% |
| European | 923 | 1.9% |
| Filipino | 69 | 0.1% |
| Finnish | 8 | 0.0% |
| French | 775 | 1.6% |
| French Canadian | 66 | 0.1% |
| German | 7,488 | 15.6% |
| Greek | 53 | 0.1% |
| Guatemalan | 762 | 1.6% |
| Honduran | 80 | 0.2% |
| Hungarian | 88 | 0.2% |
| Indian (Asian) | 240 | 0.5% |
| Indonesian | 15 | 0.0% |
| Irish | 6,379 | 13.3% |
| Iroquois | 56 | 0.1% |
| Italian | 945 | 2.0% |
| Jamaican | 192 | 0.4% |
| Japanese | 54 | 0.1% |
| Kiowa | 4 | 0.0% |
| Korean | 156 | 0.3% |
| Lebanese | 7 | 0.0% |
| Lithuanian | 47 | 0.1% |
| Mexican | 2,411 | 5.0% |
| Moroccan | 31 | 0.1% |
| Native Hawaiian | 51 | 0.1% |
| Northern European | 56 | 0.1% |
| Norwegian | 280 | 0.6% |
| Polish | 864 | 1.8% |
| Portuguese | 70 | 0.2% |
| Pueblo | 7 | 0.0% |
| Puerto Rican | 606 | 1.3% |
| Romanian | 29 | 0.1% |
| Russian | 159 | 0.3% |
| Salvadoran | 93 | 0.2% |
| Samoan | 8 | 0.0% |
| Scandinavian | 104 | 0.2% |
| Scotch-Irish | 986 | 2.1% |
| Scottish | 1,367 | 2.8% |
| Senegalese | 162 | 0.3% |
| Slovak | 19 | 0.0% |
| Slovene | 4 | 0.0% |
| South African | 45 | 0.1% |
| South American | 115 | 0.2% |
| Spaniard | 58 | 0.1% |
| Spanish | 48 | 0.1% |
| Sri Lankan | 8 | 0.0% |
| Subsaharan African | 338 | 0.7% |
| Swedish | 481 | 1.0% |
| Swiss | 162 | 0.3% |
| Thai | 149 | 0.3% |
| Ugandan | 62 | 0.1% |
| Ukrainian | 30 | 0.1% |
| Uruguayan | 14 | 0.0% |
| Venezuelan | 89 | 0.2% |
| Welsh | 246 | 0.5% |
| West Indian | 7 | 0.0% | View All 82 Rows |
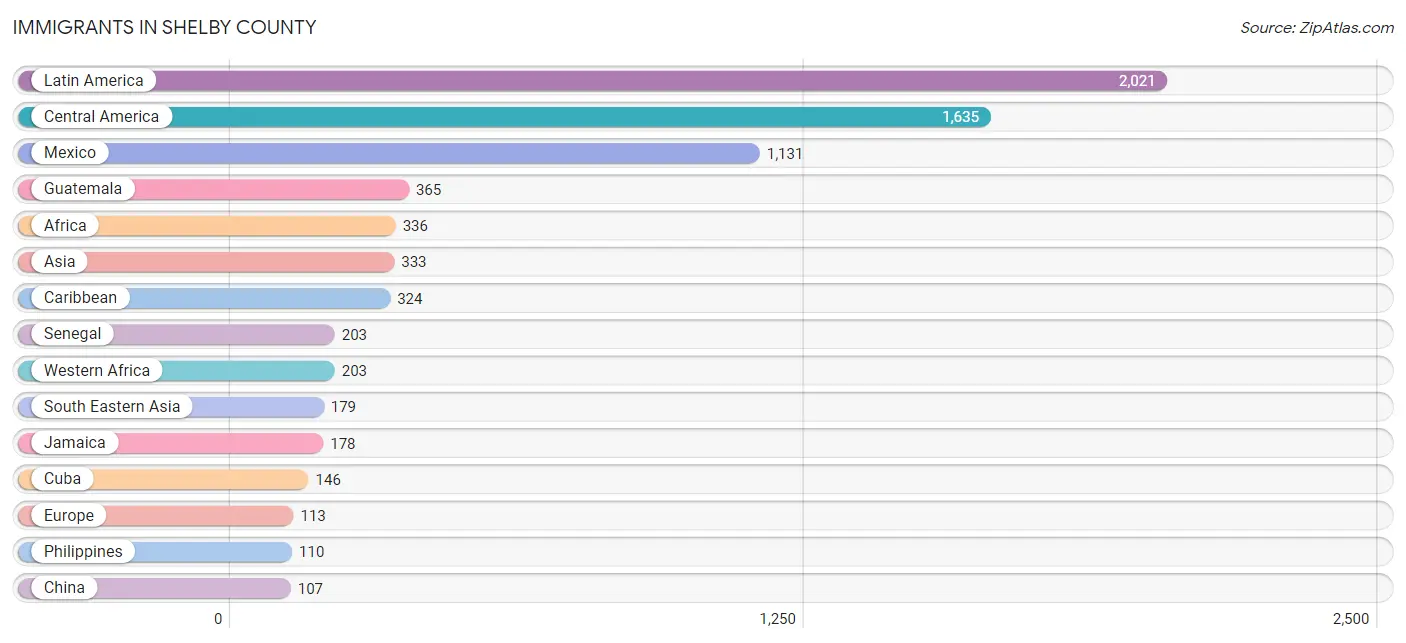
Immigrants in Shelby County
The most numerous immigrant groups reported in Shelby County came from Latin America (2,021 | 4.2%), Central America (1,635 | 3.4%), Mexico (1,131 | 2.4%), Guatemala (365 | 0.8%), and Africa (336 | 0.7%), together accounting for 11.4% of all Shelby County residents.
| Immigration Origin | # Population | % Population |
| Africa | 336 | 0.7% |
| Asia | 333 | 0.7% |
| Australia | 17 | 0.0% |
| Belgium | 24 | 0.1% |
| Brazil | 14 | 0.0% |
| Bulgaria | 6 | 0.0% |
| Cambodia | 54 | 0.1% |
| Canada | 15 | 0.0% |
| Caribbean | 324 | 0.7% |
| Central America | 1,635 | 3.4% |
| China | 107 | 0.2% |
| Congo | 14 | 0.0% |
| Cuba | 146 | 0.3% |
| Eastern Africa | 79 | 0.2% |
| Eastern Asia | 107 | 0.2% |
| Eastern Europe | 34 | 0.1% |
| El Salvador | 51 | 0.1% |
| Ethiopia | 28 | 0.1% |
| Europe | 113 | 0.2% |
| Germany | 38 | 0.1% |
| Guatemala | 365 | 0.8% |
| Honduras | 80 | 0.2% |
| India | 7 | 0.0% |
| Jamaica | 178 | 0.4% |
| Kazakhstan | 31 | 0.1% |
| Latin America | 2,021 | 4.2% |
| Mexico | 1,131 | 2.4% |
| Middle Africa | 14 | 0.0% |
| Oceania | 17 | 0.0% |
| Philippines | 110 | 0.2% |
| Russia | 16 | 0.0% |
| Senegal | 203 | 0.4% |
| South Africa | 40 | 0.1% |
| South America | 62 | 0.1% |
| South Central Asia | 38 | 0.1% |
| South Eastern Asia | 179 | 0.4% |
| Turkey | 9 | 0.0% |
| Uganda | 16 | 0.0% |
| Ukraine | 12 | 0.0% |
| Uruguay | 11 | 0.0% |
| Venezuela | 37 | 0.1% |
| Western Africa | 203 | 0.4% |
| Western Asia | 9 | 0.0% |
| Western Europe | 62 | 0.1% |
| Zimbabwe | 29 | 0.1% | View All 45 Rows |
Sex and Age in Shelby County
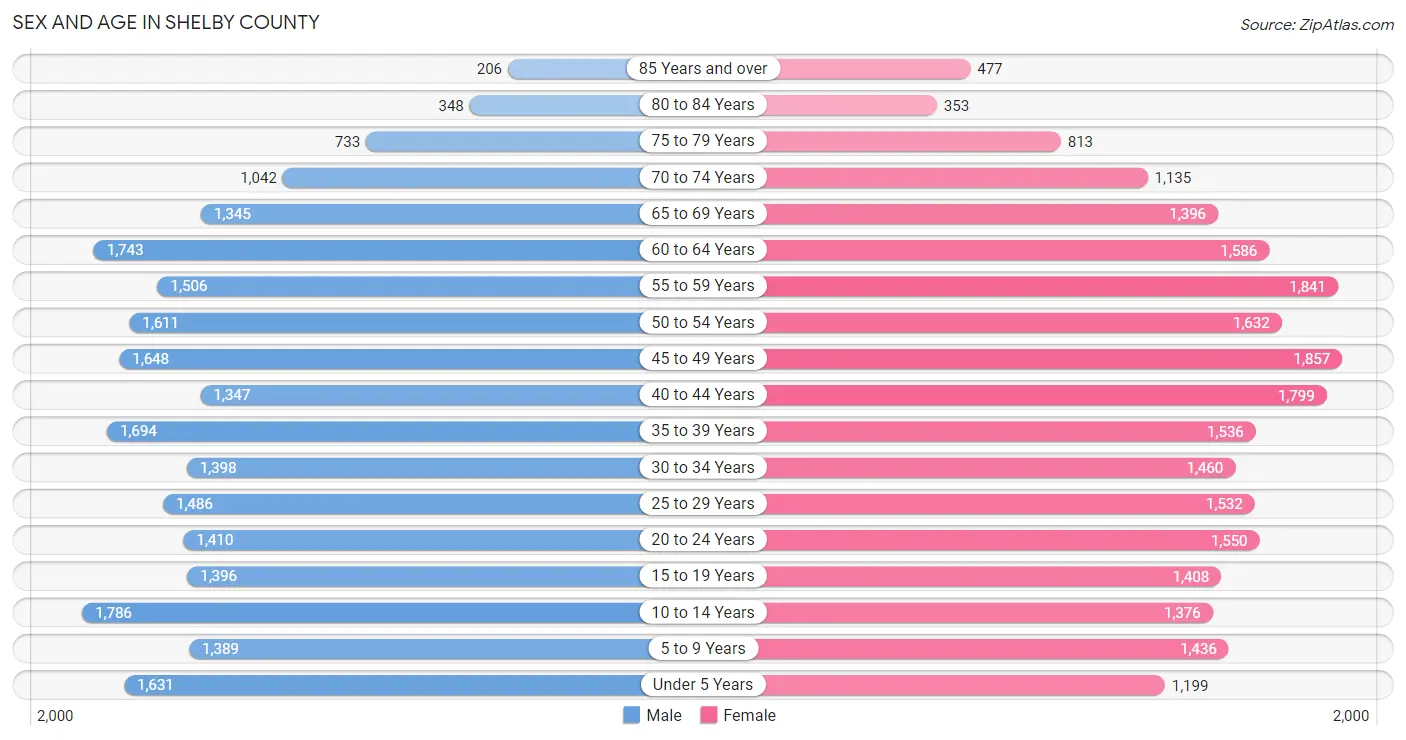
Sex and Age in Shelby County
The most populous age groups in Shelby County are 10 to 14 Years (1,786 | 7.5%) for men and 45 to 49 Years (1,857 | 7.6%) for women.
| Age Bracket | Male | Female |
| Under 5 Years | 1,631 (6.9%) | 1,199 (4.9%) |
| 5 to 9 Years | 1,389 (5.9%) | 1,436 (5.9%) |
| 10 to 14 Years | 1,786 (7.5%) | 1,376 (5.6%) |
| 15 to 19 Years | 1,396 (5.9%) | 1,408 (5.8%) |
| 20 to 24 Years | 1,410 (5.9%) | 1,550 (6.4%) |
| 25 to 29 Years | 1,486 (6.3%) | 1,532 (6.3%) |
| 30 to 34 Years | 1,398 (5.9%) | 1,460 (6.0%) |
| 35 to 39 Years | 1,694 (7.1%) | 1,536 (6.3%) |
| 40 to 44 Years | 1,347 (5.7%) | 1,799 (7.4%) |
| 45 to 49 Years | 1,648 (7.0%) | 1,857 (7.6%) |
| 50 to 54 Years | 1,611 (6.8%) | 1,632 (6.7%) |
| 55 to 59 Years | 1,506 (6.4%) | 1,841 (7.5%) |
| 60 to 64 Years | 1,743 (7.3%) | 1,586 (6.5%) |
| 65 to 69 Years | 1,345 (5.7%) | 1,396 (5.7%) |
| 70 to 74 Years | 1,042 (4.4%) | 1,135 (4.6%) |
| 75 to 79 Years | 733 (3.1%) | 813 (3.3%) |
| 80 to 84 Years | 348 (1.5%) | 353 (1.5%) |
| 85 Years and over | 206 (0.9%) | 477 (2.0%) |
| Total | 23,719 (100.0%) | 24,386 (100.0%) |
Families and Households in Shelby County
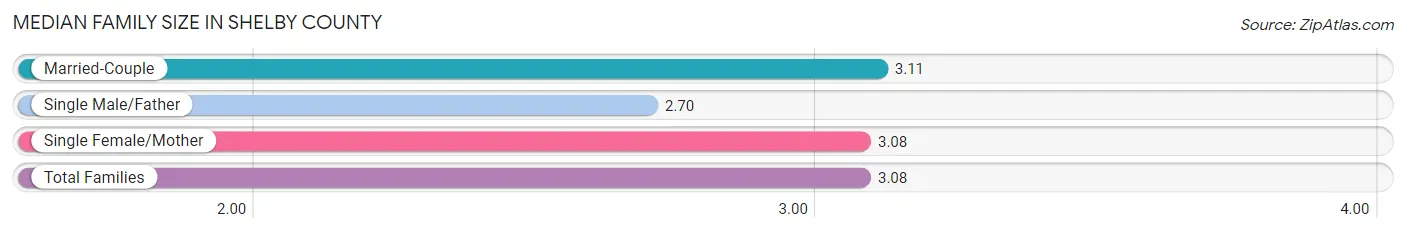
Median Family Size in Shelby County
The median family size in Shelby County is 3.08 persons per family, with married-couple families (10,466 | 81.1%) accounting for the largest median family size of 3.11 persons per family. On the other hand, single male/father families (816 | 6.3%) represent the smallest median family size with 2.70 persons per family.
| Family Type | # Families | Family Size |
| Married-Couple | 10,466 (81.1%) | 3.11 |
| Single Male/Father | 816 (6.3%) | 2.70 |
| Single Female/Mother | 1,625 (12.6%) | 3.08 |
| Total Families | 12,907 (100.0%) | 3.08 |
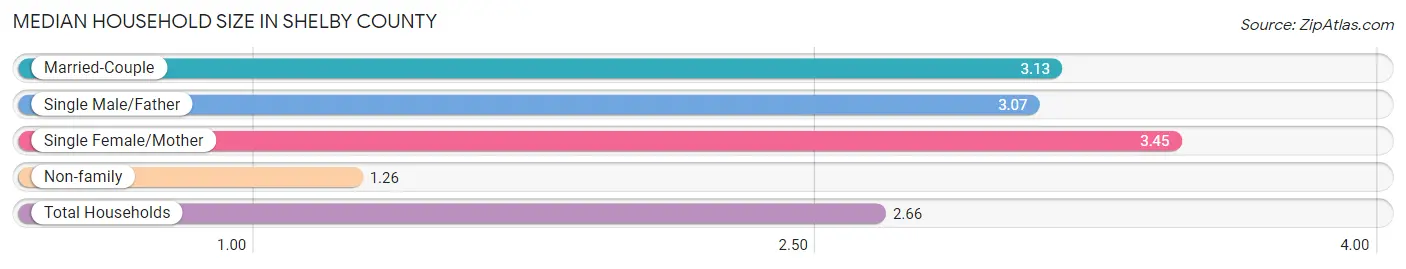
Median Household Size in Shelby County
The median household size in Shelby County is 2.66 persons per household, with single female/mother households (1,625 | 9.2%) accounting for the largest median household size of 3.45 persons per household. non-family households (4,683 | 26.6%) represent the smallest median household size with 1.26 persons per household.
| Household Type | # Households | Household Size |
| Married-Couple | 10,466 (59.5%) | 3.13 |
| Single Male/Father | 816 (4.6%) | 3.07 |
| Single Female/Mother | 1,625 (9.2%) | 3.45 |
| Non-family | 4,683 (26.6%) | 1.26 |
| Total Households | 17,590 (100.0%) | 2.66 |
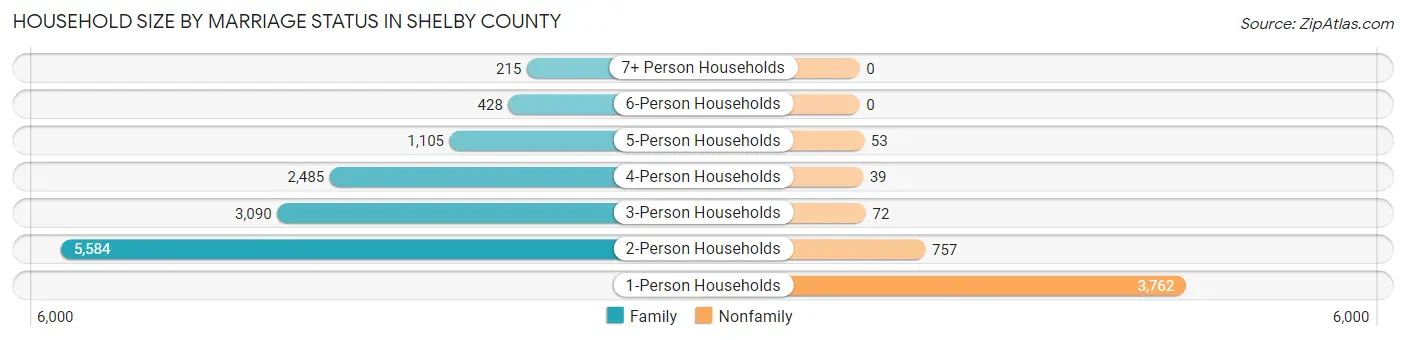
Household Size by Marriage Status in Shelby County
Out of a total of 17,590 households in Shelby County, 12,907 (73.4%) are family households, while 4,683 (26.6%) are nonfamily households. The most numerous type of family households are 2-person households, comprising 5,584, and the most common type of nonfamily households are 1-person households, comprising 3,762.
| Household Size | Family Households | Nonfamily Households |
| 1-Person Households | - | 3,762 (21.4%) |
| 2-Person Households | 5,584 (31.8%) | 757 (4.3%) |
| 3-Person Households | 3,090 (17.6%) | 72 (0.4%) |
| 4-Person Households | 2,485 (14.1%) | 39 (0.2%) |
| 5-Person Households | 1,105 (6.3%) | 53 (0.3%) |
| 6-Person Households | 428 (2.4%) | 0 (0.0%) |
| 7+ Person Households | 215 (1.2%) | 0 (0.0%) |
| Total | 12,907 (73.4%) | 4,683 (26.6%) |
Female Fertility in Shelby County
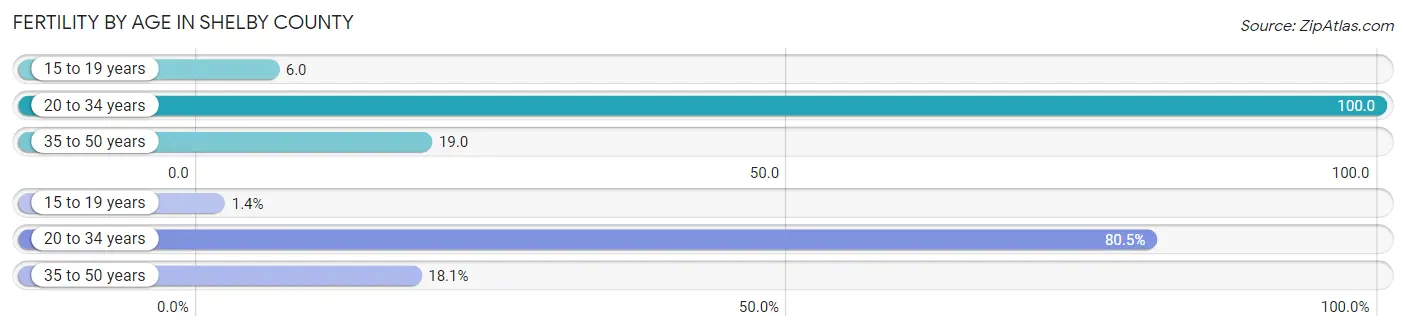
Fertility by Age in Shelby County
Average fertility rate in Shelby County is 49.0 births per 1,000 women. Women in the age bracket of 20 to 34 years have the highest fertility rate with 100.0 births per 1,000 women. Women in the age bracket of 20 to 34 years acount for 80.5% of all women with births.
| Age Bracket | Women with Births | Births / 1,000 Women |
| 15 to 19 years | 8 (1.4%) | 6.0 |
| 20 to 34 years | 454 (80.5%) | 100.0 |
| 35 to 50 years | 102 (18.1%) | 19.0 |
| Total | 564 (100.0%) | 49.0 |
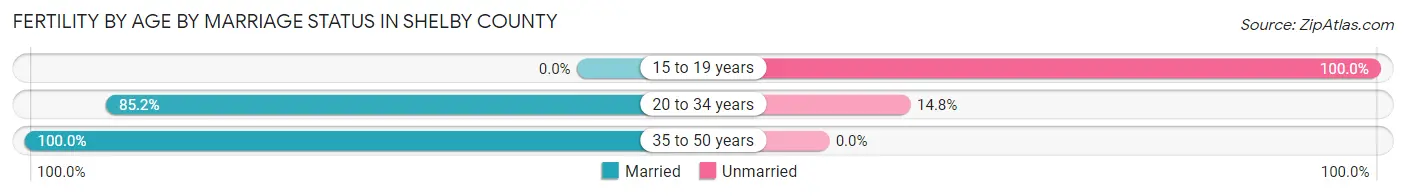
Fertility by Age by Marriage Status in Shelby County
86.7% of women with births (564) in Shelby County are married. The highest percentage of unmarried women with births falls into 15 to 19 years age bracket with 100.0% of them unmarried at the time of birth, while the lowest percentage of unmarried women with births belong to 35 to 50 years age bracket with 0.0% of them unmarried.
| Age Bracket | Married | Unmarried |
| 15 to 19 years | 0 (0.0%) | 8 (100.0%) |
| 20 to 34 years | 387 (85.2%) | 67 (14.8%) |
| 35 to 50 years | 102 (100.0%) | 0 (0.0%) |
| Total | 489 (86.7%) | 75 (13.3%) |
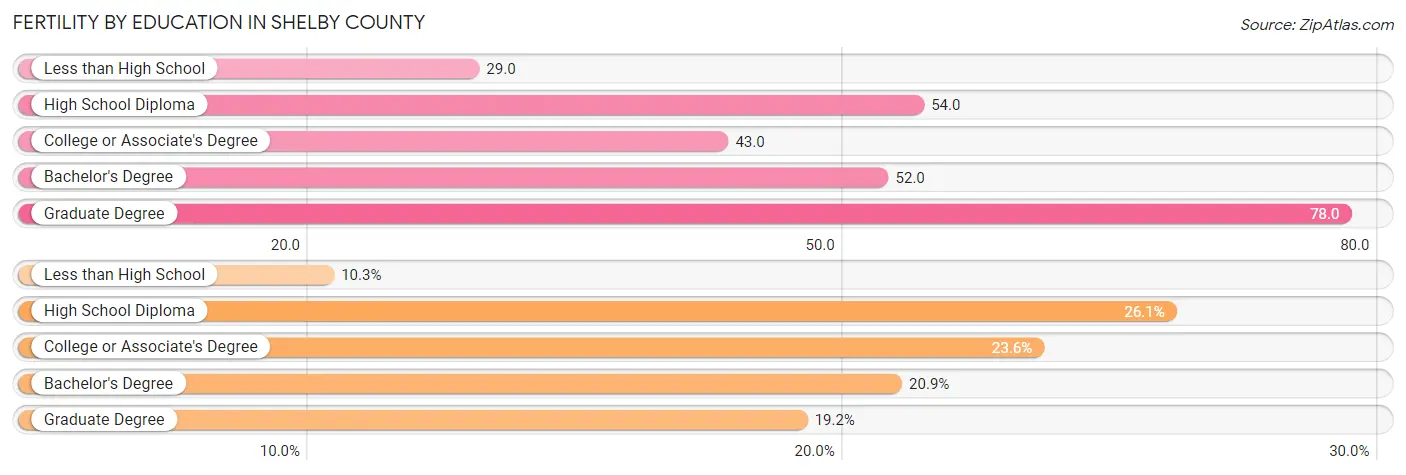
Fertility by Education in Shelby County
Average fertility rate in Shelby County is 49.0 births per 1,000 women. Women with the education attainment of graduate degree have the highest fertility rate of 78.0 births per 1,000 women, while women with the education attainment of less than high school have the lowest fertility at 29.0 births per 1,000 women. Women with the education attainment of high school diploma represent 26.1% of all women with births.
| Educational Attainment | Women with Births | Births / 1,000 Women |
| Less than High School | 58 (10.3%) | 29.0 |
| High School Diploma | 147 (26.1%) | 54.0 |
| College or Associate's Degree | 133 (23.6%) | 43.0 |
| Bachelor's Degree | 118 (20.9%) | 52.0 |
| Graduate Degree | 108 (19.2%) | 78.0 |
| Total | 564 (100.0%) | 49.0 |
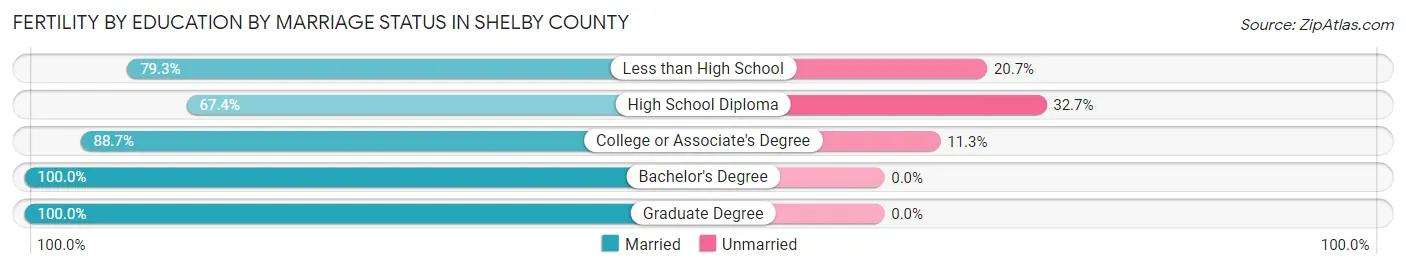
Fertility by Education by Marriage Status in Shelby County
13.3% of women with births in Shelby County are unmarried. Women with the educational attainment of bachelor's degree are most likely to be married with 100.0% of them married at childbirth, while women with the educational attainment of high school diploma are least likely to be married with 32.7% of them unmarried at childbirth.
| Educational Attainment | Married | Unmarried |
| Less than High School | 46 (79.3%) | 12 (20.7%) |
| High School Diploma | 99 (67.3%) | 48 (32.7%) |
| College or Associate's Degree | 118 (88.7%) | 15 (11.3%) |
| Bachelor's Degree | 118 (100.0%) | 0 (0.0%) |
| Graduate Degree | 108 (100.0%) | 0 (0.0%) |
| Total | 489 (86.7%) | 75 (13.3%) |
Income in Shelby County
Income Overview in Shelby County
Per Capita Income in Shelby County is $37,918, while median incomes of families and households are $94,658 and $81,012 respectively.
| Characteristic | Number | Measure |
| Per Capita Income | 48,105 | $37,918 |
| Median Family Income | 12,907 | $94,658 |
| Mean Family Income | 12,907 | $113,790 |
| Median Household Income | 17,590 | $81,012 |
| Mean Household Income | 17,590 | $100,473 |
| Income Deficit | 12,907 | $12,534 |
| Wage / Income Gap (%) | 48,105 | 26.42% |
| Wage / Income Gap ($) | 48,105 | 73.58¢ per $1 |
| Gini / Inequality Index | 48,105 | 0.43 |
Earnings by Sex in Shelby County
Average Earnings in Shelby County are $39,492, $46,313 for men and $34,077 for women, a difference of 26.4%.
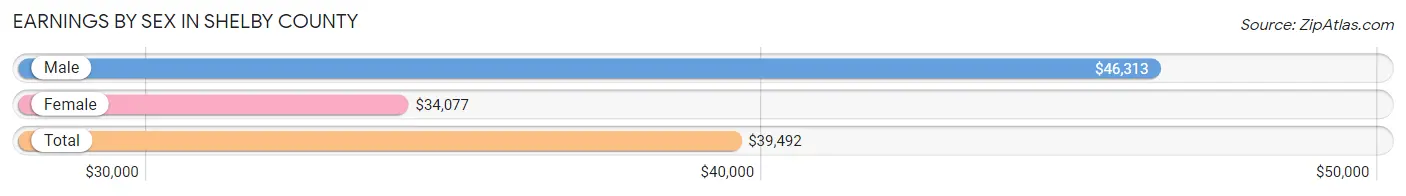
| Sex | Number | Average Earnings |
| Male | 13,912 (51.8%) | $46,313 |
| Female | 12,926 (48.2%) | $34,077 |
| Total | 26,838 (100.0%) | $39,492 |
Earnings by Sex by Income Bracket in Shelby County
The most common earnings brackets in Shelby County are $100,000+ for men (2,380 | 17.1%) and $35,000 to $39,999 for women (1,043 | 8.1%).
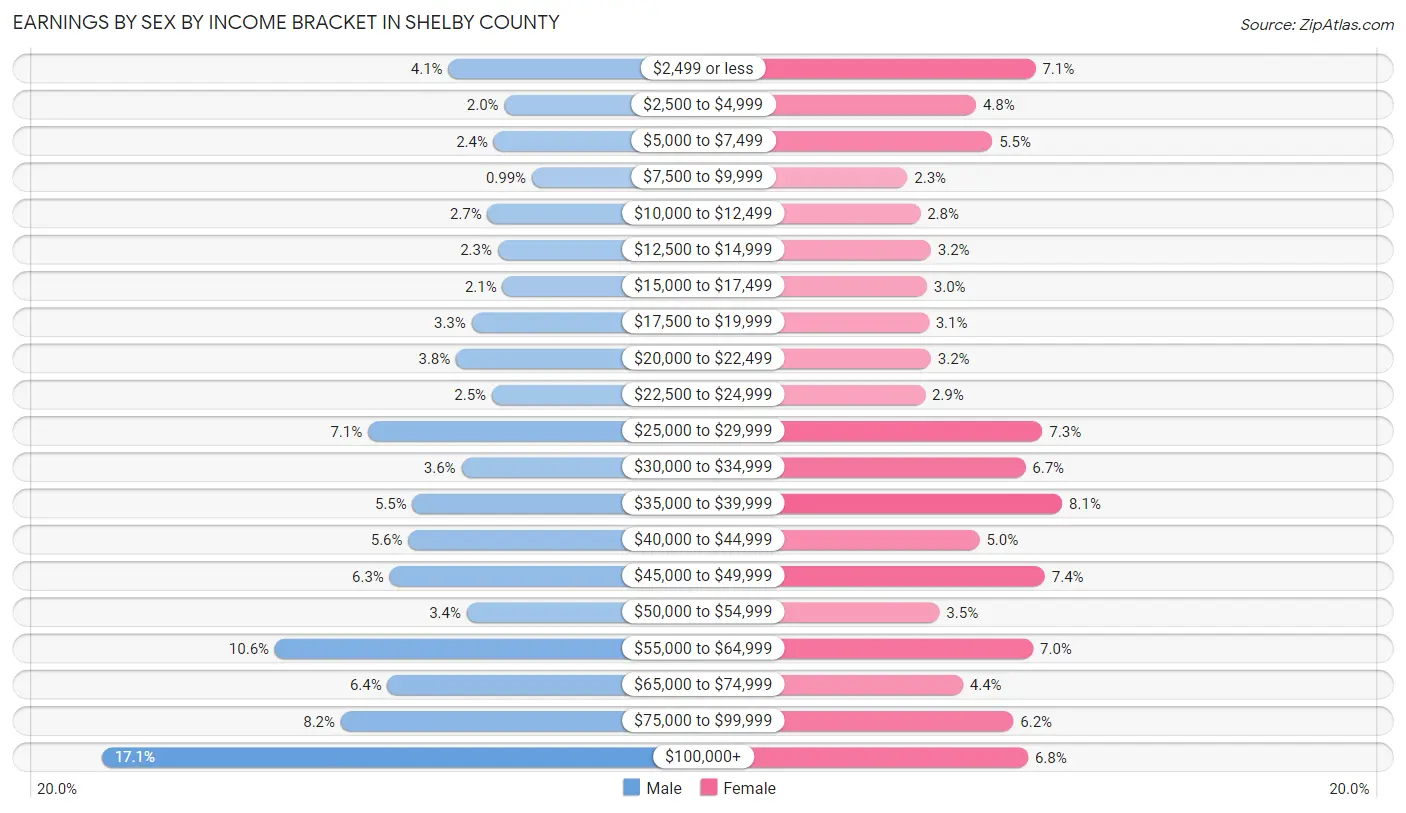
| Income | Male | Female |
| $2,499 or less | 573 (4.1%) | 914 (7.1%) |
| $2,500 to $4,999 | 281 (2.0%) | 626 (4.8%) |
| $5,000 to $7,499 | 337 (2.4%) | 704 (5.4%) |
| $7,500 to $9,999 | 138 (1.0%) | 294 (2.3%) |
| $10,000 to $12,499 | 369 (2.6%) | 356 (2.8%) |
| $12,500 to $14,999 | 316 (2.3%) | 407 (3.2%) |
| $15,000 to $17,499 | 291 (2.1%) | 388 (3.0%) |
| $17,500 to $19,999 | 452 (3.3%) | 397 (3.1%) |
| $20,000 to $22,499 | 533 (3.8%) | 407 (3.2%) |
| $22,500 to $24,999 | 346 (2.5%) | 379 (2.9%) |
| $25,000 to $29,999 | 992 (7.1%) | 948 (7.3%) |
| $30,000 to $34,999 | 505 (3.6%) | 865 (6.7%) |
| $35,000 to $39,999 | 760 (5.5%) | 1,043 (8.1%) |
| $40,000 to $44,999 | 782 (5.6%) | 643 (5.0%) |
| $45,000 to $49,999 | 879 (6.3%) | 959 (7.4%) |
| $50,000 to $54,999 | 477 (3.4%) | 448 (3.5%) |
| $55,000 to $64,999 | 1,477 (10.6%) | 902 (7.0%) |
| $65,000 to $74,999 | 890 (6.4%) | 562 (4.3%) |
| $75,000 to $99,999 | 1,134 (8.2%) | 806 (6.2%) |
| $100,000+ | 2,380 (17.1%) | 878 (6.8%) |
| Total | 13,912 (100.0%) | 12,926 (100.0%) |
Earnings by Sex by Educational Attainment in Shelby County
Average earnings in Shelby County are $52,415 for men and $37,770 for women, a difference of 27.9%. Men with an educational attainment of graduate degree enjoy the highest average annual earnings of $102,121, while those with less than high school education earn the least with $26,509. Women with an educational attainment of graduate degree earn the most with the average annual earnings of $55,838, while those with less than high school education have the smallest earnings of $26,162.
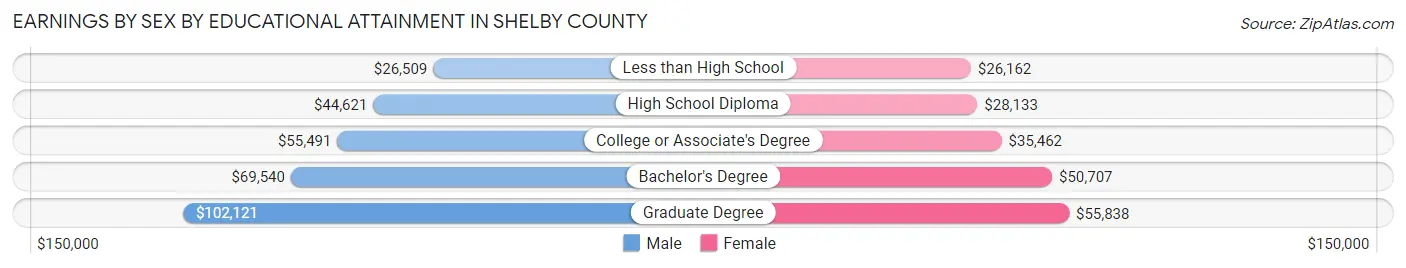
| Educational Attainment | Male Income | Female Income |
| Less than High School | $26,509 | $26,162 |
| High School Diploma | $44,621 | $28,133 |
| College or Associate's Degree | $55,491 | $35,462 |
| Bachelor's Degree | $69,540 | $50,707 |
| Graduate Degree | $102,121 | $55,838 |
| Total | $52,415 | $37,770 |
Family Income in Shelby County
Family Income Brackets in Shelby County
According to the Shelby County family income data, there are 3,175 families falling into the $100,000 to $149,999 income range, which is the most common income bracket and makes up 24.6% of all families. Conversely, the $10,000 to $14,999 income bracket is the least frequent group with only 155 families (1.2%) belonging to this category.
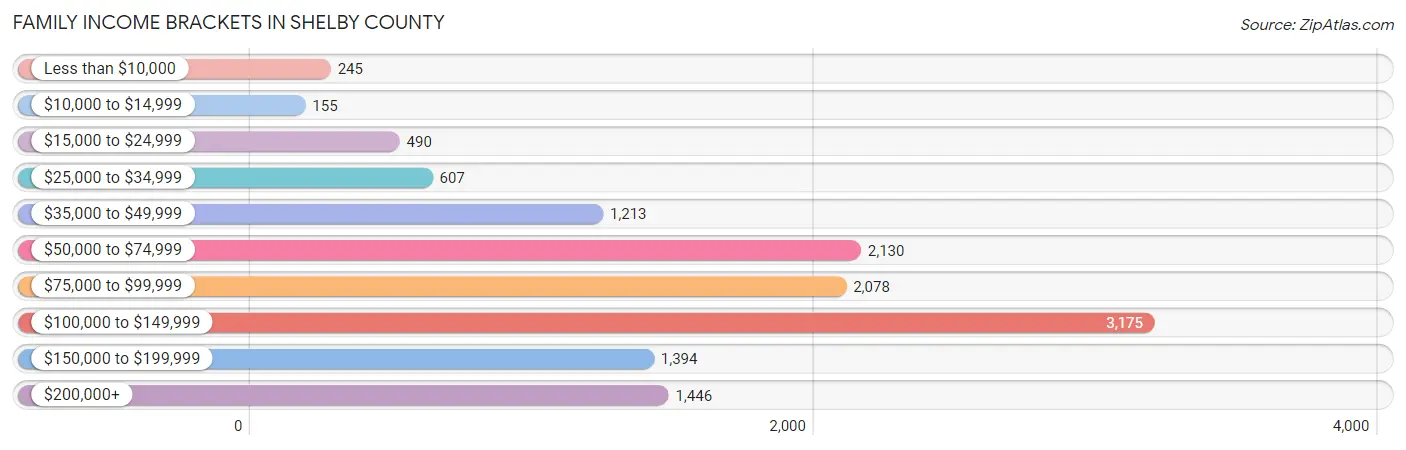
| Income Bracket | # Families | % Families |
| Less than $10,000 | 245 | 1.9% |
| $10,000 to $14,999 | 155 | 1.2% |
| $15,000 to $24,999 | 490 | 3.8% |
| $25,000 to $34,999 | 607 | 4.7% |
| $35,000 to $49,999 | 1,213 | 9.4% |
| $50,000 to $74,999 | 2,130 | 16.5% |
| $75,000 to $99,999 | 2,078 | 16.1% |
| $100,000 to $149,999 | 3,175 | 24.6% |
| $150,000 to $199,999 | 1,394 | 10.8% |
| $200,000+ | 1,446 | 11.2% |
Family Income by Famaliy Size in Shelby County
5-person families (958 | 7.4%) account for the highest median family income in Shelby County with $115,100 per family, while 2-person families (6,005 | 46.5%) have the highest median income of $40,732 per family member.
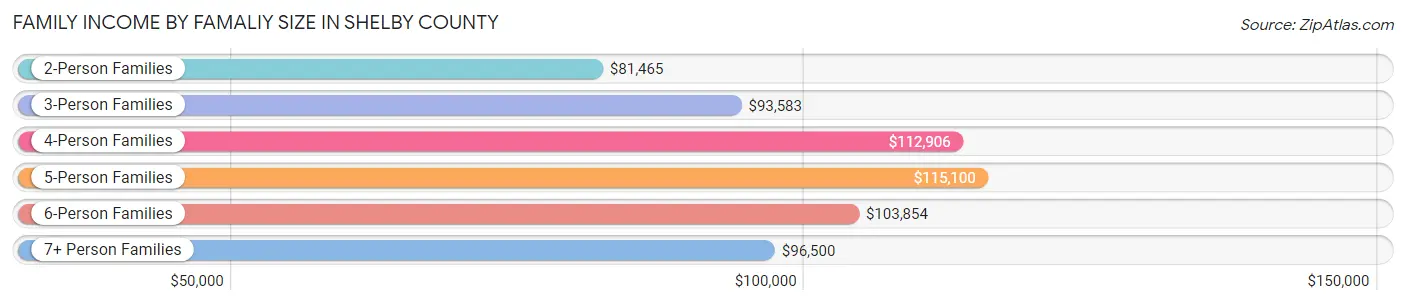
| Income Bracket | # Families | Median Income |
| 2-Person Families | 6,005 (46.5%) | $81,465 |
| 3-Person Families | 2,950 (22.9%) | $93,583 |
| 4-Person Families | 2,422 (18.8%) | $112,906 |
| 5-Person Families | 958 (7.4%) | $115,100 |
| 6-Person Families | 370 (2.9%) | $103,854 |
| 7+ Person Families | 202 (1.6%) | $96,500 |
| Total | 12,907 (100.0%) | $94,658 |
Family Income by Number of Earners in Shelby County
The median family income in Shelby County is $94,658, with families comprising 3+ earners (1,753) having the highest median family income of $134,421, while families with no earners (1,664) have the lowest median family income of $61,389, accounting for 13.6% and 12.9% of families, respectively.
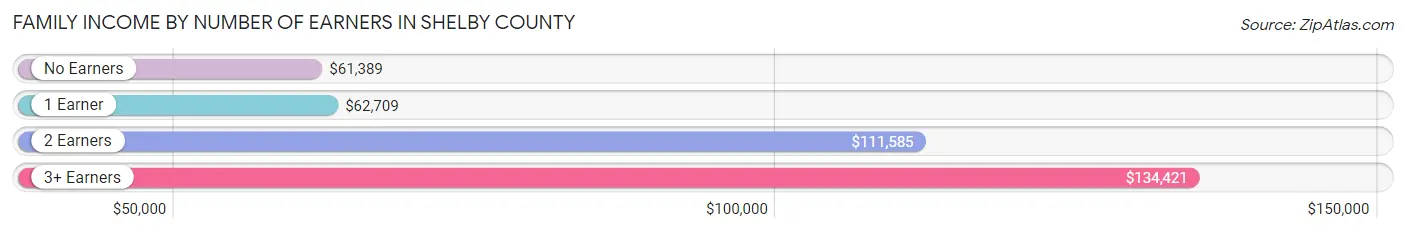
| Number of Earners | # Families | Median Income |
| No Earners | 1,664 (12.9%) | $61,389 |
| 1 Earner | 3,368 (26.1%) | $62,709 |
| 2 Earners | 6,122 (47.4%) | $111,585 |
| 3+ Earners | 1,753 (13.6%) | $134,421 |
| Total | 12,907 (100.0%) | $94,658 |
Household Income in Shelby County
Household Income Brackets in Shelby County
With 3,852 households falling in the category, the $100,000 to $149,999 income range is the most frequent in Shelby County, accounting for 21.9% of all households. In contrast, only 387 households (2.2%) fall into the $10,000 to $14,999 income bracket, making it the least populous group.
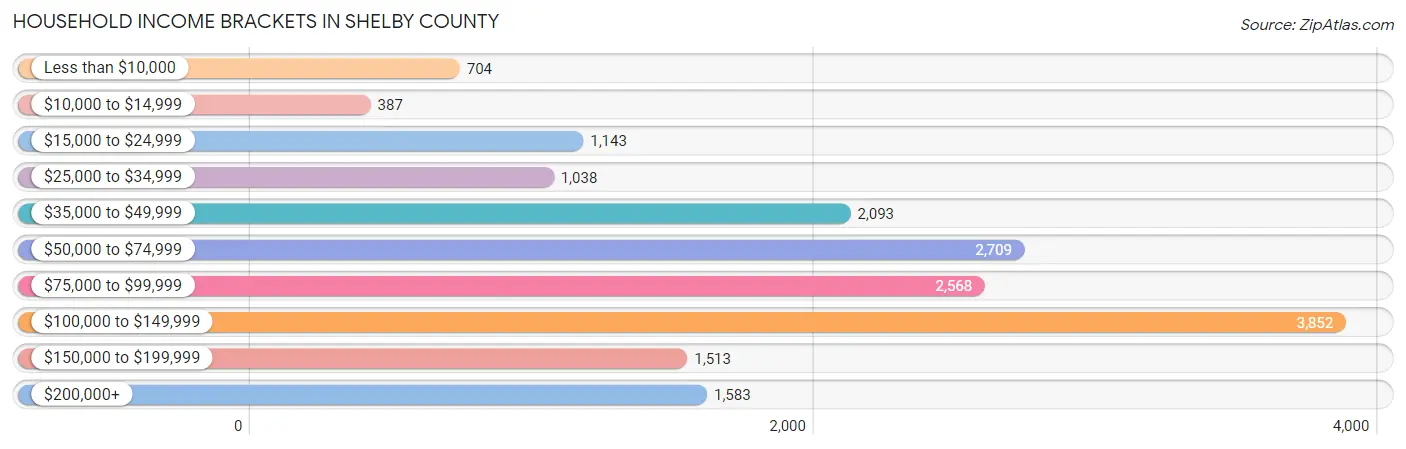
| Income Bracket | # Households | % Households |
| Less than $10,000 | 704 | 4.0% |
| $10,000 to $14,999 | 387 | 2.2% |
| $15,000 to $24,999 | 1,143 | 6.5% |
| $25,000 to $34,999 | 1,038 | 5.9% |
| $35,000 to $49,999 | 2,093 | 11.9% |
| $50,000 to $74,999 | 2,709 | 15.4% |
| $75,000 to $99,999 | 2,568 | 14.6% |
| $100,000 to $149,999 | 3,852 | 21.9% |
| $150,000 to $199,999 | 1,513 | 8.6% |
| $200,000+ | 1,583 | 9.0% |
Household Income by Householder Age in Shelby County
The median household income in Shelby County is $81,012, with the highest median household income of $96,207 found in the 25 to 44 years age bracket for the primary householder. A total of 5,512 households (31.3%) fall into this category. Meanwhile, the 15 to 24 years age bracket for the primary householder has the lowest median household income of $47,576, with 556 households (3.2%) in this group.
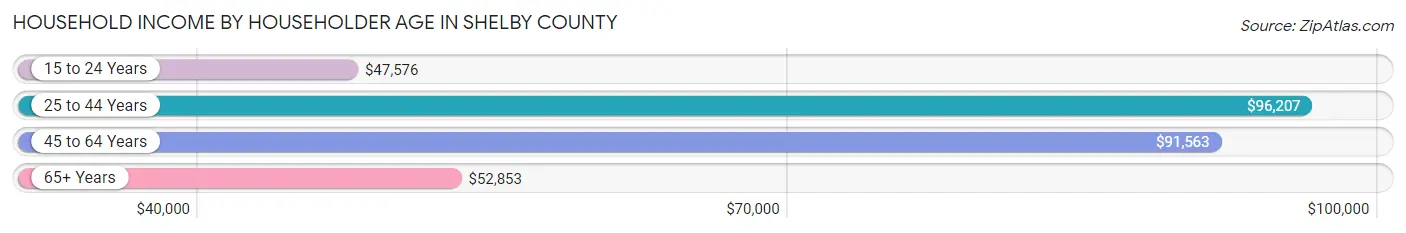
| Income Bracket | # Households | Median Income |
| 15 to 24 Years | 556 (3.2%) | $47,576 |
| 25 to 44 Years | 5,512 (31.3%) | $96,207 |
| 45 to 64 Years | 7,052 (40.1%) | $91,563 |
| 65+ Years | 4,470 (25.4%) | $52,853 |
| Total | 17,590 (100.0%) | $81,012 |
Poverty in Shelby County
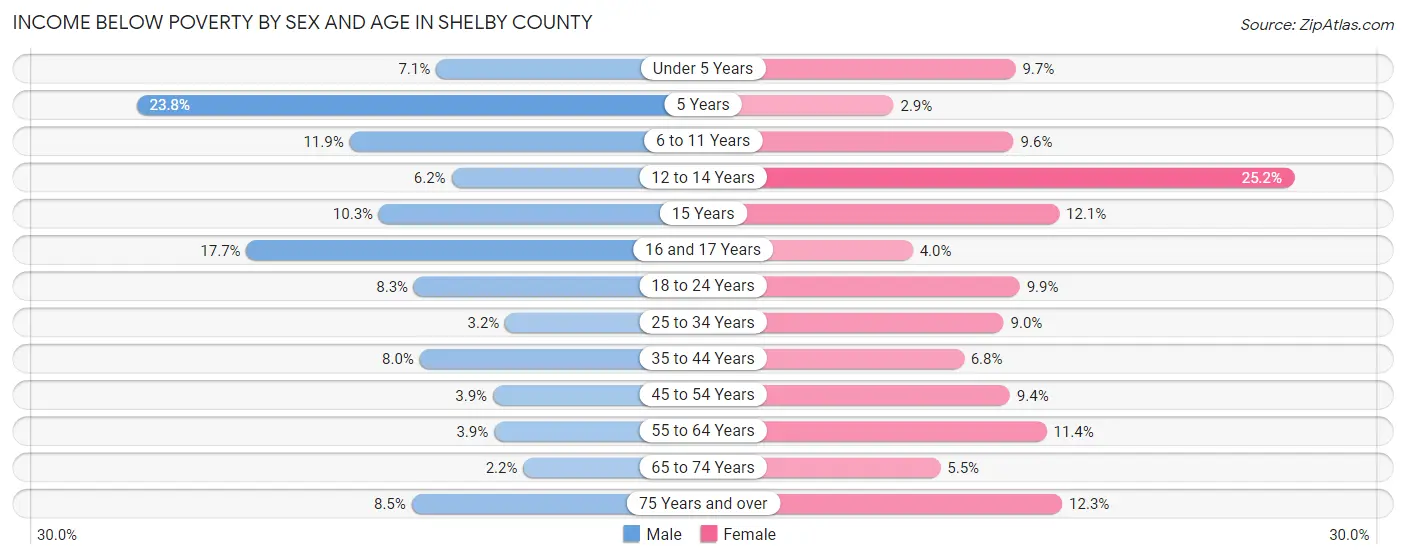
Income Below Poverty by Sex and Age in Shelby County
With 6.3% poverty level for males and 9.5% for females among the residents of Shelby County, 5 year old males and 12 to 14 year old females are the most vulnerable to poverty, with 48 males (23.8%) and 226 females (25.2%) in their respective age groups living below the poverty level.
| Age Bracket | Male | Female |
| Under 5 Years | 113 (7.1%) | 116 (9.7%) |
| 5 Years | 48 (23.8%) | 9 (2.9%) |
| 6 to 11 Years | 197 (11.9%) | 148 (9.6%) |
| 12 to 14 Years | 72 (6.2%) | 226 (25.2%) |
| 15 Years | 30 (10.3%) | 30 (12.1%) |
| 16 and 17 Years | 117 (17.6%) | 26 (4.0%) |
| 18 to 24 Years | 153 (8.3%) | 203 (9.9%) |
| 25 to 34 Years | 92 (3.2%) | 248 (9.0%) |
| 35 to 44 Years | 240 (8.0%) | 212 (6.8%) |
| 45 to 54 Years | 127 (3.9%) | 312 (9.4%) |
| 55 to 64 Years | 125 (3.9%) | 378 (11.4%) |
| 65 to 74 Years | 52 (2.2%) | 138 (5.5%) |
| 75 Years and over | 107 (8.5%) | 187 (12.3%) |
| Total | 1,473 (6.3%) | 2,233 (9.5%) |
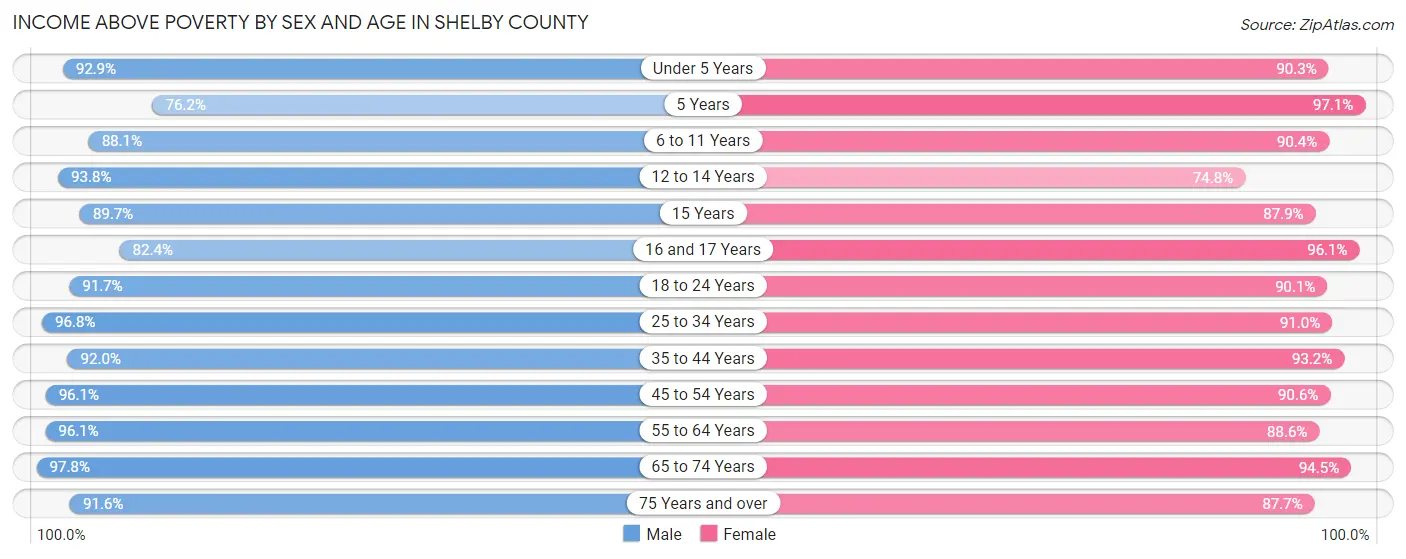
Income Above Poverty by Sex and Age in Shelby County
According to the poverty statistics in Shelby County, males aged 65 to 74 years and females aged 5 years are the age groups that are most secure financially, with 97.8% of males and 97.1% of females in these age groups living above the poverty line.
| Age Bracket | Male | Female |
| Under 5 Years | 1,481 (92.9%) | 1,083 (90.3%) |
| 5 Years | 154 (76.2%) | 303 (97.1%) |
| 6 to 11 Years | 1,457 (88.1%) | 1,399 (90.4%) |
| 12 to 14 Years | 1,083 (93.8%) | 672 (74.8%) |
| 15 Years | 262 (89.7%) | 218 (87.9%) |
| 16 and 17 Years | 546 (82.4%) | 632 (96.1%) |
| 18 to 24 Years | 1,686 (91.7%) | 1,845 (90.1%) |
| 25 to 34 Years | 2,751 (96.8%) | 2,504 (91.0%) |
| 35 to 44 Years | 2,761 (92.0%) | 2,912 (93.2%) |
| 45 to 54 Years | 3,113 (96.1%) | 3,021 (90.6%) |
| 55 to 64 Years | 3,110 (96.1%) | 2,937 (88.6%) |
| 65 to 74 Years | 2,277 (97.8%) | 2,377 (94.5%) |
| 75 Years and over | 1,160 (91.5%) | 1,337 (87.7%) |
| Total | 21,841 (93.7%) | 21,240 (90.5%) |
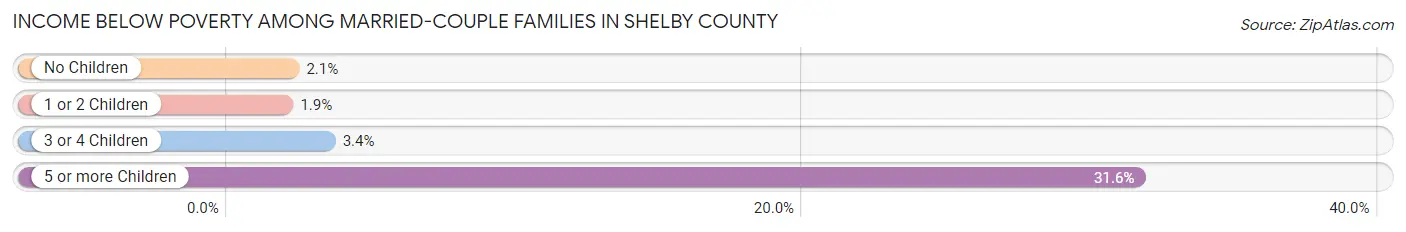
Income Below Poverty Among Married-Couple Families in Shelby County
The poverty statistics for married-couple families in Shelby County show that 2.5% or 261 of the total 10,466 families live below the poverty line. Families with 5 or more children have the highest poverty rate of 31.6%, comprising of 37 families. On the other hand, families with 1 or 2 children have the lowest poverty rate of 1.9%, which includes 66 families.
| Children | Above Poverty | Below Poverty |
| No Children | 6,034 (97.9%) | 132 (2.1%) |
| 1 or 2 Children | 3,352 (98.1%) | 66 (1.9%) |
| 3 or 4 Children | 739 (96.6%) | 26 (3.4%) |
| 5 or more Children | 80 (68.4%) | 37 (31.6%) |
| Total | 10,205 (97.5%) | 261 (2.5%) |
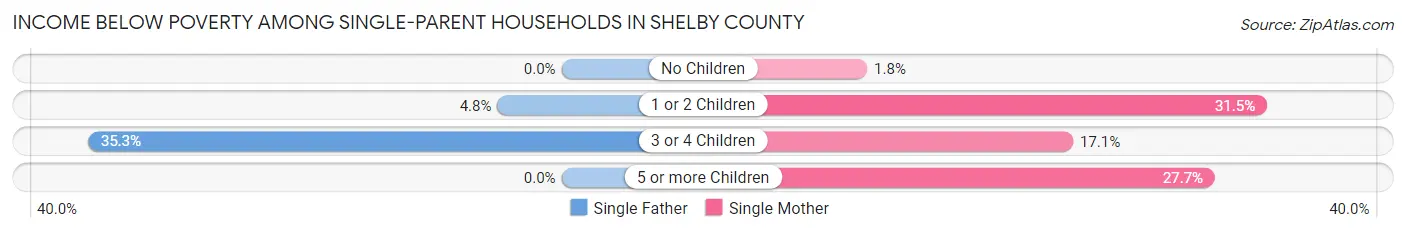
Income Below Poverty Among Single-Parent Households in Shelby County
According to the poverty data in Shelby County, 6.1% or 50 single-father households and 21.0% or 341 single-mother households are living below the poverty line. Among single-father households, those with 3 or 4 children have the highest poverty rate, with 36 households (35.3%) experiencing poverty. Likewise, among single-mother households, those with 1 or 2 children have the highest poverty rate, with 299 households (31.5%) falling below the poverty line.
| Children | Single Father | Single Mother |
| No Children | 0 (0.0%) | 9 (1.8%) |
| 1 or 2 Children | 14 (4.8%) | 299 (31.5%) |
| 3 or 4 Children | 36 (35.3%) | 20 (17.1%) |
| 5 or more Children | 0 (0.0%) | 13 (27.7%) |
| Total | 50 (6.1%) | 341 (21.0%) |
Income Below Poverty Among Married-Couple vs Single-Parent Households in Shelby County
The poverty data for Shelby County shows that 261 of the married-couple family households (2.5%) and 391 of the single-parent households (16.0%) are living below the poverty level. Within the married-couple family households, those with 5 or more children have the highest poverty rate, with 37 households (31.6%) falling below the poverty line. Among the single-parent households, those with 5 or more children have the highest poverty rate, with 13 household (27.7%) living below poverty.
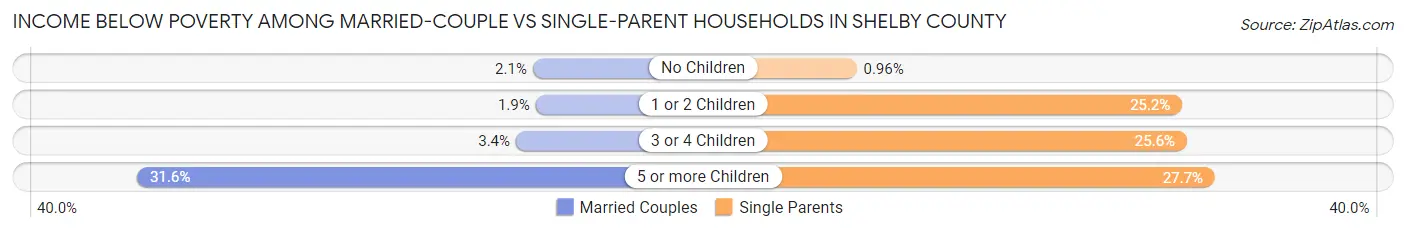
| Children | Married-Couple Families | Single-Parent Households |
| No Children | 132 (2.1%) | 9 (1.0%) |
| 1 or 2 Children | 66 (1.9%) | 313 (25.2%) |
| 3 or 4 Children | 26 (3.4%) | 56 (25.6%) |
| 5 or more Children | 37 (31.6%) | 13 (27.7%) |
| Total | 261 (2.5%) | 391 (16.0%) |
Employment Characteristics in Shelby County
Employment by Class of Employer in Shelby County
Among the 23,908 employed individuals in Shelby County, private company employees (16,876 | 70.6%), state government employees (1,387 | 5.8%), and local government employees (1,362 | 5.7%) make up the most common classes of employment.
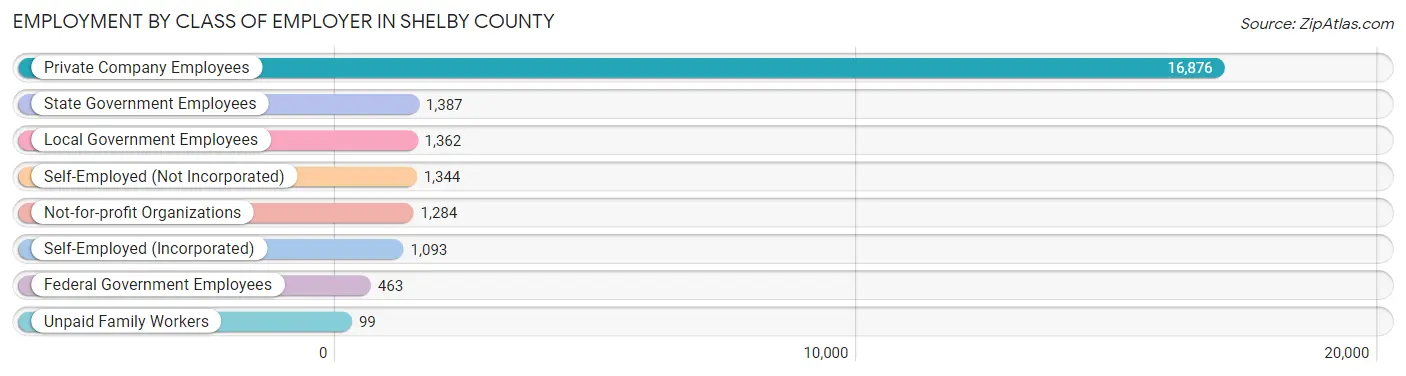
| Employer Class | # Employees | % Employees |
| Private Company Employees | 16,876 | 70.6% |
| Self-Employed (Incorporated) | 1,093 | 4.6% |
| Self-Employed (Not Incorporated) | 1,344 | 5.6% |
| Not-for-profit Organizations | 1,284 | 5.4% |
| Local Government Employees | 1,362 | 5.7% |
| State Government Employees | 1,387 | 5.8% |
| Federal Government Employees | 463 | 1.9% |
| Unpaid Family Workers | 99 | 0.4% |
| Total | 23,908 | 100.0% |
Employment Status by Age in Shelby County
According to the labor force statistics for Shelby County, out of the total population over 16 years of age (38,748), 65.0% or 25,186 individuals are in the labor force, with 3.3% or 831 of them unemployed. The age group with the highest labor force participation rate is 30 to 34 years, with 84.8% or 2,424 individuals in the labor force. Within the labor force, the 16 to 19 years age range has the highest percentage of unemployed individuals, with 13.7% or 134 of them being unemployed.
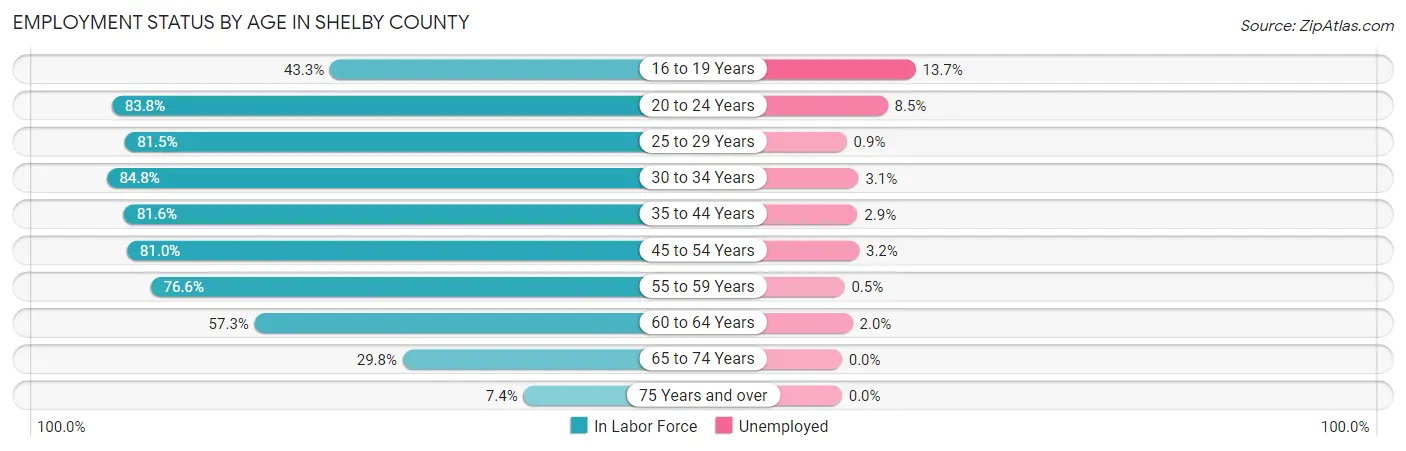
| Age Bracket | In Labor Force | Unemployed |
| 16 to 19 Years | 980 (43.3%) | 134 (13.7%) |
| 20 to 24 Years | 2,480 (83.8%) | 211 (8.5%) |
| 25 to 29 Years | 2,460 (81.5%) | 22 (0.9%) |
| 30 to 34 Years | 2,424 (84.8%) | 75 (3.1%) |
| 35 to 44 Years | 5,203 (81.6%) | 151 (2.9%) |
| 45 to 54 Years | 5,466 (81.0%) | 175 (3.2%) |
| 55 to 59 Years | 2,564 (76.6%) | 13 (0.5%) |
| 60 to 64 Years | 1,908 (57.3%) | 38 (2.0%) |
| 65 to 74 Years | 1,466 (29.8%) | 0 (0.0%) |
| 75 Years and over | 217 (7.4%) | 0 (0.0%) |
| Total | 25,186 (65.0%) | 831 (3.3%) |
Employment Status by Educational Attainment in Shelby County
According to labor force statistics for Shelby County, 78.0% of individuals (20,027) out of the total population between 25 and 64 years of age (25,676) are in the labor force, with 2.4% or 481 of them being unemployed. The group with the highest labor force participation rate are those with the educational attainment of bachelor's degree or higher, with 86.1% or 7,070 individuals in the labor force. Within the labor force, individuals with less than high school education have the highest percentage of unemployment, with 4.8% or 88 of them being unemployed.
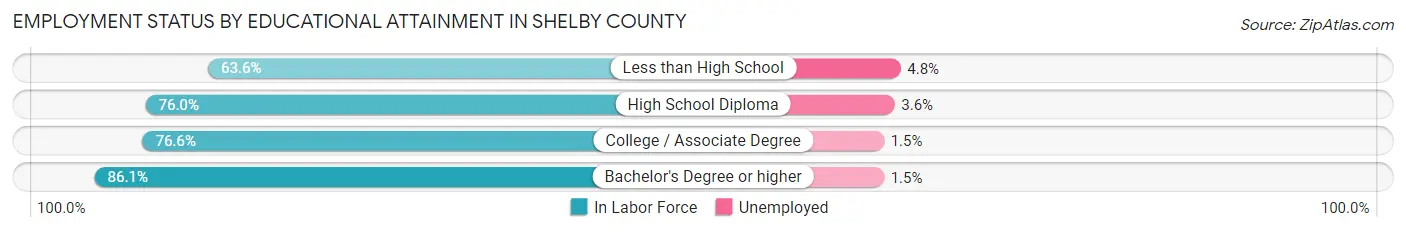
| Educational Attainment | In Labor Force | Unemployed |
| Less than High School | 1,836 (63.6%) | 139 (4.8%) |
| High School Diploma | 5,489 (76.0%) | 260 (3.6%) |
| College / Associate Degree | 5,634 (76.6%) | 110 (1.5%) |
| Bachelor's Degree or higher | 7,070 (86.1%) | 123 (1.5%) |
| Total | 20,027 (78.0%) | 616 (2.4%) |
Employment Occupations by Sex in Shelby County
Management, Business, Science and Arts Occupations
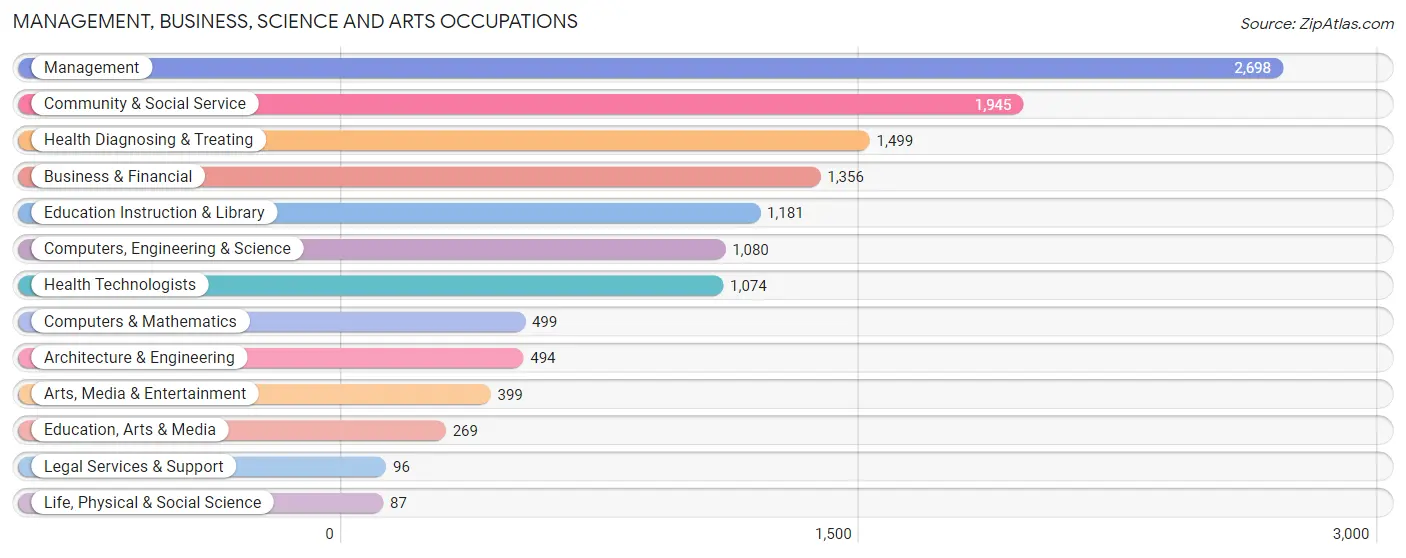
The most common Management, Business, Science and Arts occupations in Shelby County are Management (2,698 | 11.1%), Community & Social Service (1,945 | 8.0%), Health Diagnosing & Treating (1,499 | 6.2%), Business & Financial (1,356 | 5.6%), and Education Instruction & Library (1,181 | 4.9%).
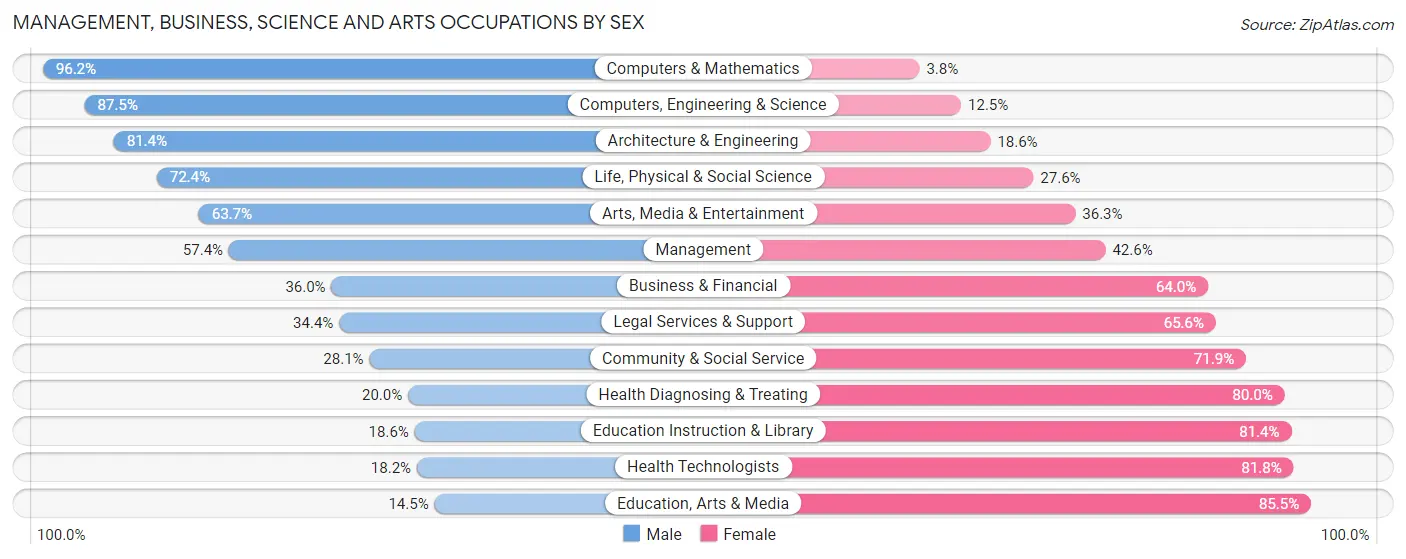
Management, Business, Science and Arts Occupations by Sex
Within the Management, Business, Science and Arts occupations in Shelby County, the most male-oriented occupations are Computers & Mathematics (96.2%), Computers, Engineering & Science (87.5%), and Architecture & Engineering (81.4%), while the most female-oriented occupations are Education, Arts & Media (85.5%), Health Technologists (81.8%), and Education Instruction & Library (81.4%).
| Occupation | Male | Female |
| Management | 1,548 (57.4%) | 1,150 (42.6%) |
| Business & Financial | 488 (36.0%) | 868 (64.0%) |
| Computers, Engineering & Science | 945 (87.5%) | 135 (12.5%) |
| Computers & Mathematics | 480 (96.2%) | 19 (3.8%) |
| Architecture & Engineering | 402 (81.4%) | 92 (18.6%) |
| Life, Physical & Social Science | 63 (72.4%) | 24 (27.6%) |
| Community & Social Service | 546 (28.1%) | 1,399 (71.9%) |
| Education, Arts & Media | 39 (14.5%) | 230 (85.5%) |
| Legal Services & Support | 33 (34.4%) | 63 (65.6%) |
| Education Instruction & Library | 220 (18.6%) | 961 (81.4%) |
| Arts, Media & Entertainment | 254 (63.7%) | 145 (36.3%) |
| Health Diagnosing & Treating | 300 (20.0%) | 1,199 (80.0%) |
| Health Technologists | 195 (18.2%) | 879 (81.8%) |
| Total (Category) | 3,827 (44.6%) | 4,751 (55.4%) |
| Total (Overall) | 12,613 (52.0%) | 11,625 (48.0%) |
Services Occupations
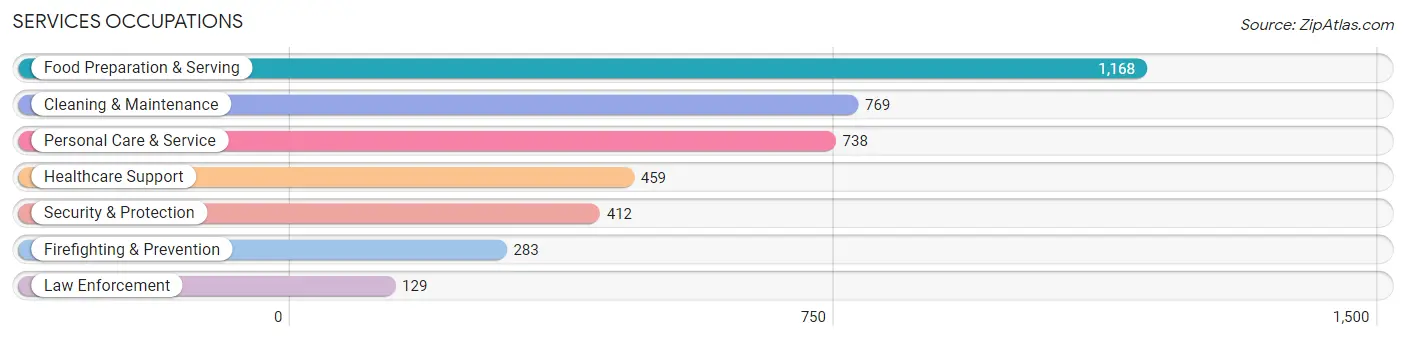
The most common Services occupations in Shelby County are Food Preparation & Serving (1,168 | 4.8%), Cleaning & Maintenance (769 | 3.2%), Personal Care & Service (738 | 3.0%), Healthcare Support (459 | 1.9%), and Security & Protection (412 | 1.7%).
Services Occupations by Sex
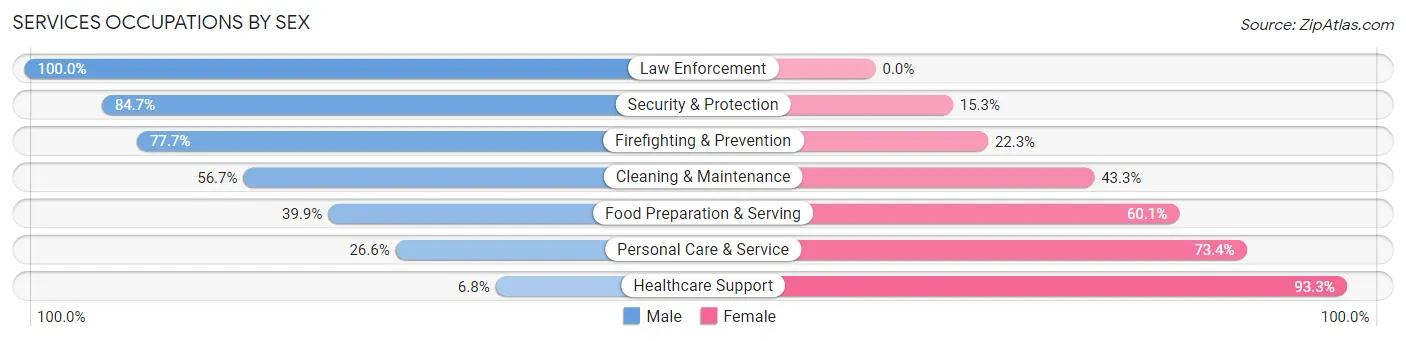
Within the Services occupations in Shelby County, the most male-oriented occupations are Law Enforcement (100.0%), Security & Protection (84.7%), and Firefighting & Prevention (77.7%), while the most female-oriented occupations are Healthcare Support (93.2%), Personal Care & Service (73.4%), and Food Preparation & Serving (60.1%).
| Occupation | Male | Female |
| Healthcare Support | 31 (6.8%) | 428 (93.2%) |
| Security & Protection | 349 (84.7%) | 63 (15.3%) |
| Firefighting & Prevention | 220 (77.7%) | 63 (22.3%) |
| Law Enforcement | 129 (100.0%) | 0 (0.0%) |
| Food Preparation & Serving | 466 (39.9%) | 702 (60.1%) |
| Cleaning & Maintenance | 436 (56.7%) | 333 (43.3%) |
| Personal Care & Service | 196 (26.6%) | 542 (73.4%) |
| Total (Category) | 1,478 (41.7%) | 2,068 (58.3%) |
| Total (Overall) | 12,613 (52.0%) | 11,625 (48.0%) |
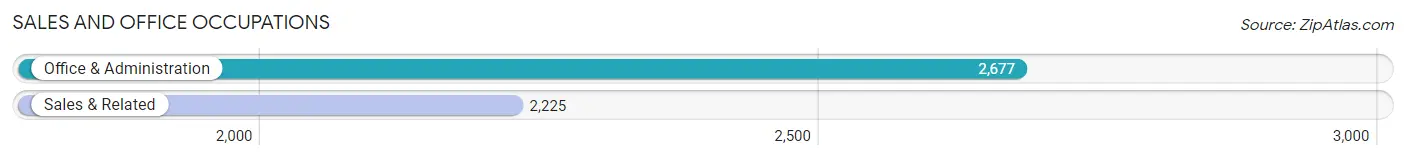
Sales and Office Occupations
The most common Sales and Office occupations in Shelby County are Office & Administration (2,677 | 11.0%), and Sales & Related (2,225 | 9.2%).
Sales and Office Occupations by Sex
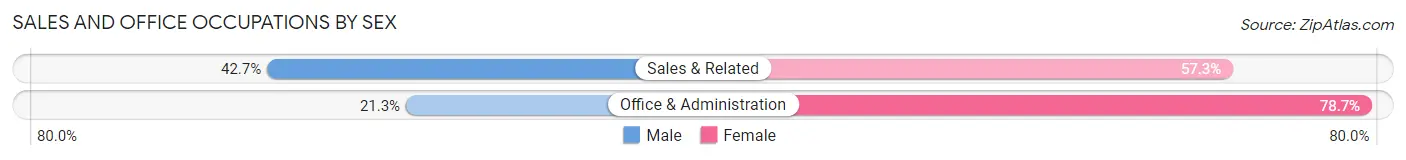
| Occupation | Male | Female |
| Sales & Related | 950 (42.7%) | 1,275 (57.3%) |
| Office & Administration | 571 (21.3%) | 2,106 (78.7%) |
| Total (Category) | 1,521 (31.0%) | 3,381 (69.0%) |
| Total (Overall) | 12,613 (52.0%) | 11,625 (48.0%) |
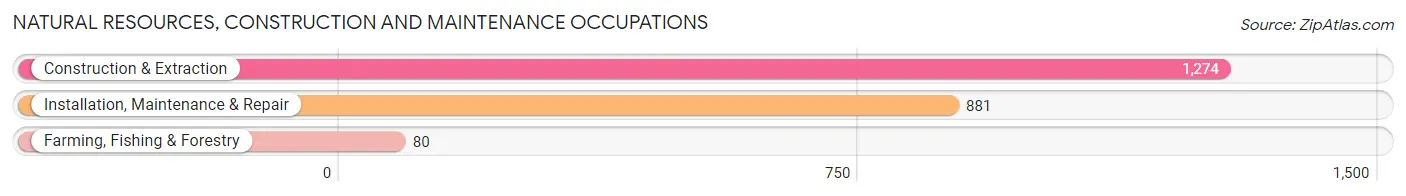
Natural Resources, Construction and Maintenance Occupations
The most common Natural Resources, Construction and Maintenance occupations in Shelby County are Construction & Extraction (1,274 | 5.3%), Installation, Maintenance & Repair (881 | 3.6%), and Farming, Fishing & Forestry (80 | 0.3%).
Natural Resources, Construction and Maintenance Occupations by Sex
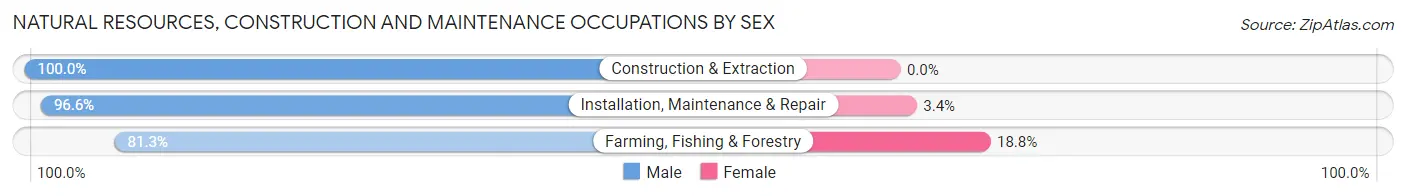
| Occupation | Male | Female |
| Farming, Fishing & Forestry | 65 (81.2%) | 15 (18.8%) |
| Construction & Extraction | 1,274 (100.0%) | 0 (0.0%) |
| Installation, Maintenance & Repair | 851 (96.6%) | 30 (3.4%) |
| Total (Category) | 2,190 (98.0%) | 45 (2.0%) |
| Total (Overall) | 12,613 (52.0%) | 11,625 (48.0%) |
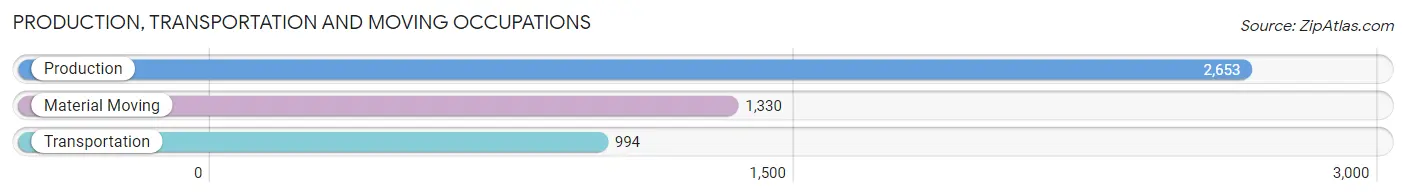
Production, Transportation and Moving Occupations
The most common Production, Transportation and Moving occupations in Shelby County are Production (2,653 | 11.0%), Material Moving (1,330 | 5.5%), and Transportation (994 | 4.1%).
Production, Transportation and Moving Occupations by Sex
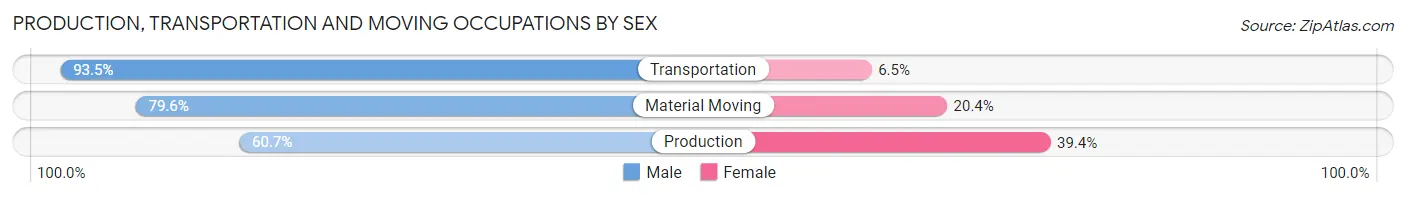
| Occupation | Male | Female |
| Production | 1,609 (60.7%) | 1,044 (39.4%) |
| Transportation | 929 (93.5%) | 65 (6.5%) |
| Material Moving | 1,059 (79.6%) | 271 (20.4%) |
| Total (Category) | 3,597 (72.3%) | 1,380 (27.7%) |
| Total (Overall) | 12,613 (52.0%) | 11,625 (48.0%) |
Employment Industries by Sex in Shelby County
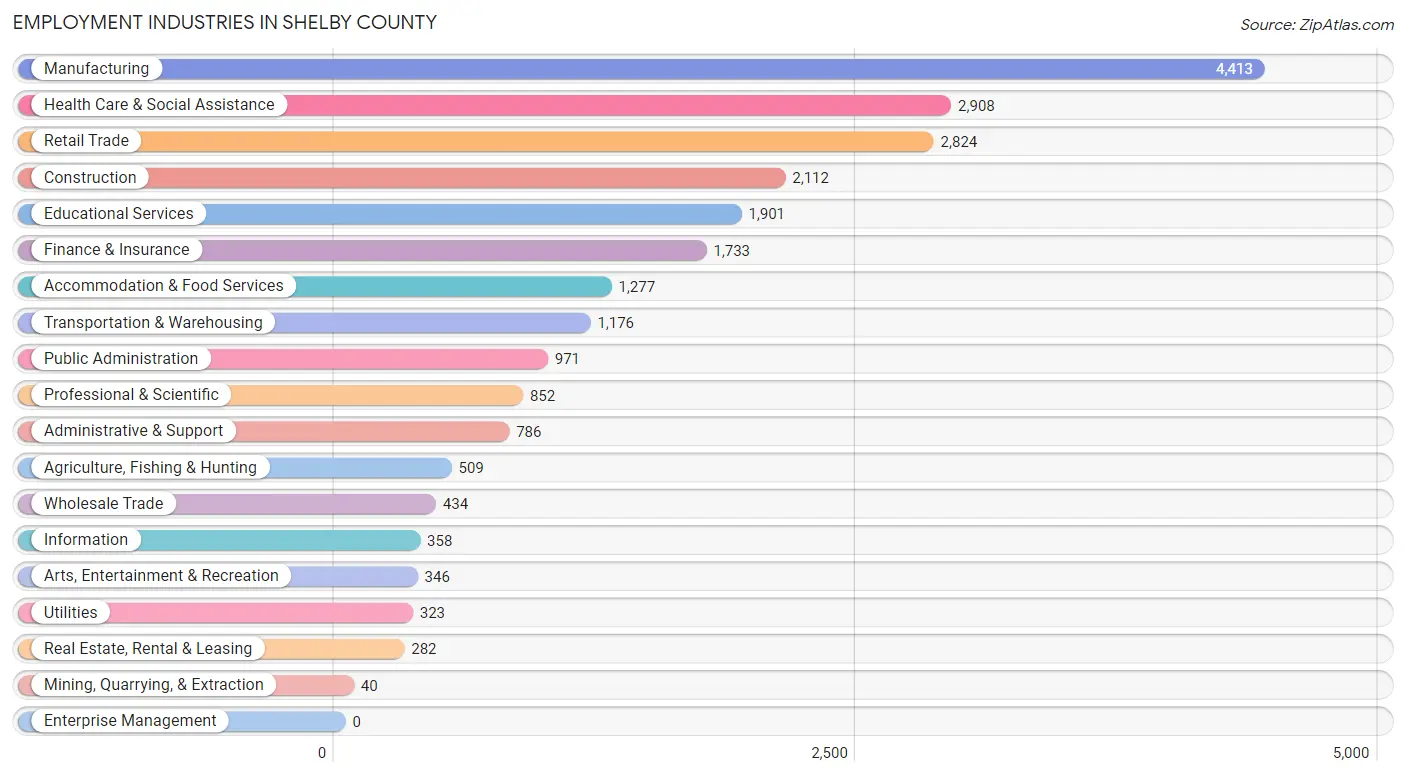
Employment Industries in Shelby County
The major employment industries in Shelby County include Manufacturing (4,413 | 18.2%), Health Care & Social Assistance (2,908 | 12.0%), Retail Trade (2,824 | 11.7%), Construction (2,112 | 8.7%), and Educational Services (1,901 | 7.8%).
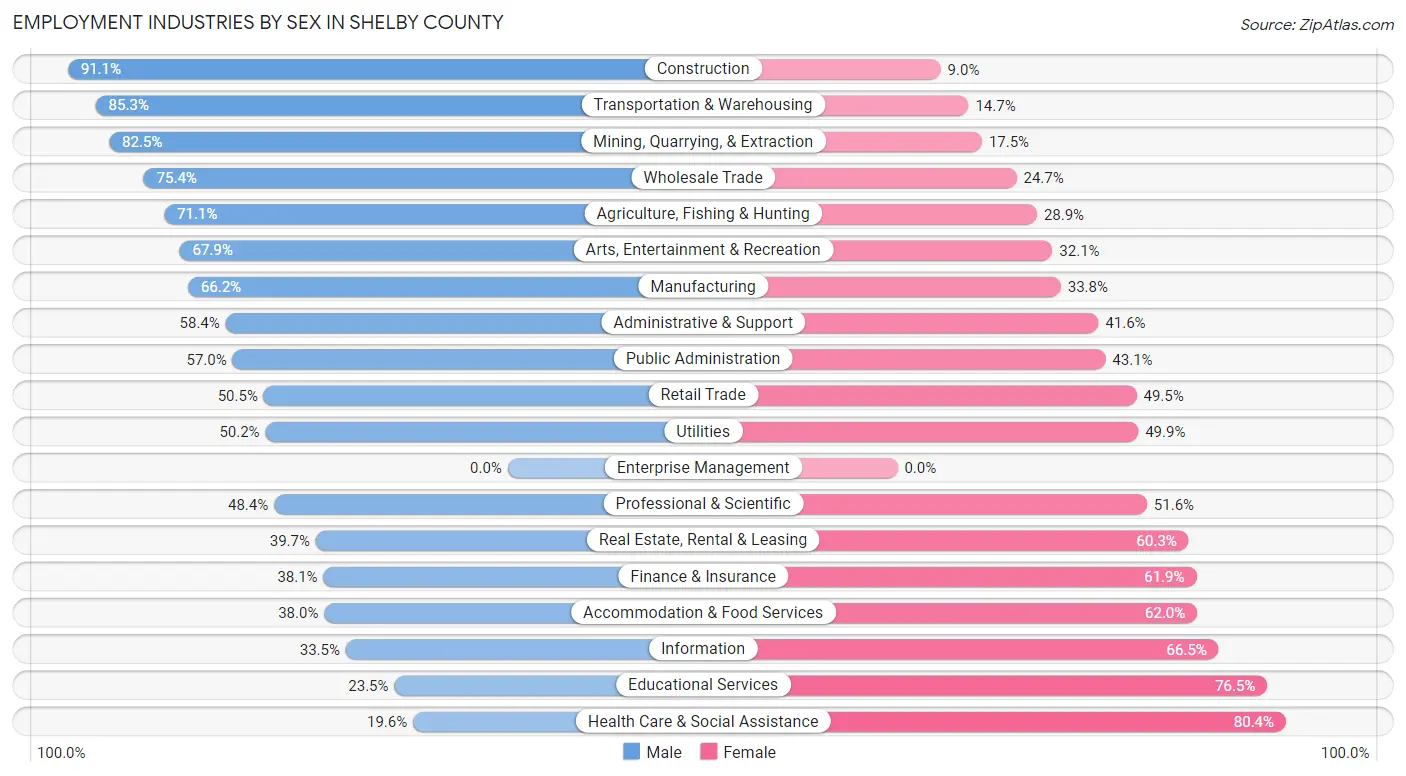
Employment Industries by Sex in Shelby County
The Shelby County industries that see more men than women are Construction (91.0%), Transportation & Warehousing (85.3%), and Mining, Quarrying, & Extraction (82.5%), whereas the industries that tend to have a higher number of women are Health Care & Social Assistance (80.4%), Educational Services (76.5%), and Information (66.5%).
| Industry | Male | Female |
| Agriculture, Fishing & Hunting | 362 (71.1%) | 147 (28.9%) |
| Mining, Quarrying, & Extraction | 33 (82.5%) | 7 (17.5%) |
| Construction | 1,923 (91.0%) | 189 (8.9%) |
| Manufacturing | 2,921 (66.2%) | 1,492 (33.8%) |
| Wholesale Trade | 327 (75.3%) | 107 (24.6%) |
| Retail Trade | 1,426 (50.5%) | 1,398 (49.5%) |
| Transportation & Warehousing | 1,003 (85.3%) | 173 (14.7%) |
| Utilities | 162 (50.1%) | 161 (49.8%) |
| Information | 120 (33.5%) | 238 (66.5%) |
| Finance & Insurance | 661 (38.1%) | 1,072 (61.9%) |
| Real Estate, Rental & Leasing | 112 (39.7%) | 170 (60.3%) |
| Professional & Scientific | 412 (48.4%) | 440 (51.6%) |
| Enterprise Management | 0 (0.0%) | 0 (0.0%) |
| Administrative & Support | 459 (58.4%) | 327 (41.6%) |
| Educational Services | 446 (23.5%) | 1,455 (76.5%) |
| Health Care & Social Assistance | 570 (19.6%) | 2,338 (80.4%) |
| Arts, Entertainment & Recreation | 235 (67.9%) | 111 (32.1%) |
| Accommodation & Food Services | 485 (38.0%) | 792 (62.0%) |
| Public Administration | 553 (57.0%) | 418 (43.0%) |
| Total | 12,613 (52.0%) | 11,625 (48.0%) |
Education in Shelby County
School Enrollment in Shelby County
The most common levels of schooling among the 10,605 students in Shelby County are high school (2,543 | 24.0%), middle school (2,437 | 23.0%), and elementary school (2,110 | 19.9%).
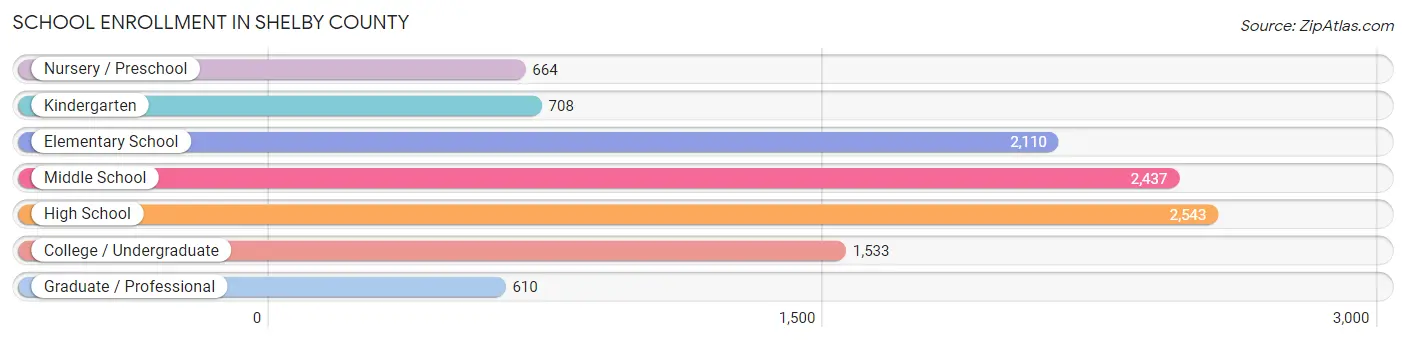
| School Level | # Students | % Students |
| Nursery / Preschool | 664 | 6.3% |
| Kindergarten | 708 | 6.7% |
| Elementary School | 2,110 | 19.9% |
| Middle School | 2,437 | 23.0% |
| High School | 2,543 | 24.0% |
| College / Undergraduate | 1,533 | 14.5% |
| Graduate / Professional | 610 | 5.8% |
| Total | 10,605 | 100.0% |
School Enrollment by Age by Funding Source in Shelby County
Out of a total of 10,605 students who are enrolled in schools in Shelby County, 2,216 (20.9%) attend a private institution, while the remaining 8,389 (79.1%) are enrolled in public schools. The age group of 3 to 4 year olds has the highest likelihood of being enrolled in private schools, with 258 (49.2% in the age bracket) enrolled. Conversely, the age group of 10 to 14 year olds has the lowest likelihood of being enrolled in a private school, with 2,708 (86.6% in the age bracket) attending a public institution.
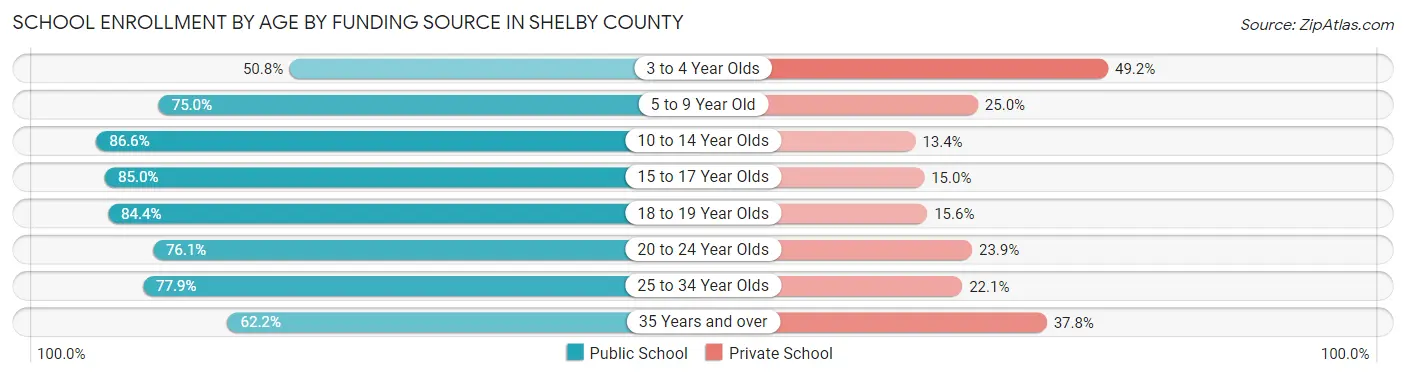
| Age Bracket | Public School | Private School |
| 3 to 4 Year Olds | 266 (50.8%) | 258 (49.2%) |
| 5 to 9 Year Old | 1,962 (75.0%) | 654 (25.0%) |
| 10 to 14 Year Olds | 2,708 (86.6%) | 418 (13.4%) |
| 15 to 17 Year Olds | 1,535 (85.0%) | 271 (15.0%) |
| 18 to 19 Year Olds | 461 (84.4%) | 85 (15.6%) |
| 20 to 24 Year Olds | 646 (76.1%) | 203 (23.9%) |
| 25 to 34 Year Olds | 487 (77.9%) | 138 (22.1%) |
| 35 Years and over | 319 (62.2%) | 194 (37.8%) |
| Total | 8,389 (79.1%) | 2,216 (20.9%) |
Educational Attainment by Field of Study in Shelby County
Business (2,306 | 21.2%), education (1,671 | 15.4%), science & technology (1,198 | 11.0%), liberal arts & history (811 | 7.5%), and bio, nature & agricultural (756 | 7.0%) are the most common fields of study among 10,850 individuals in Shelby County who have obtained a bachelor's degree or higher.
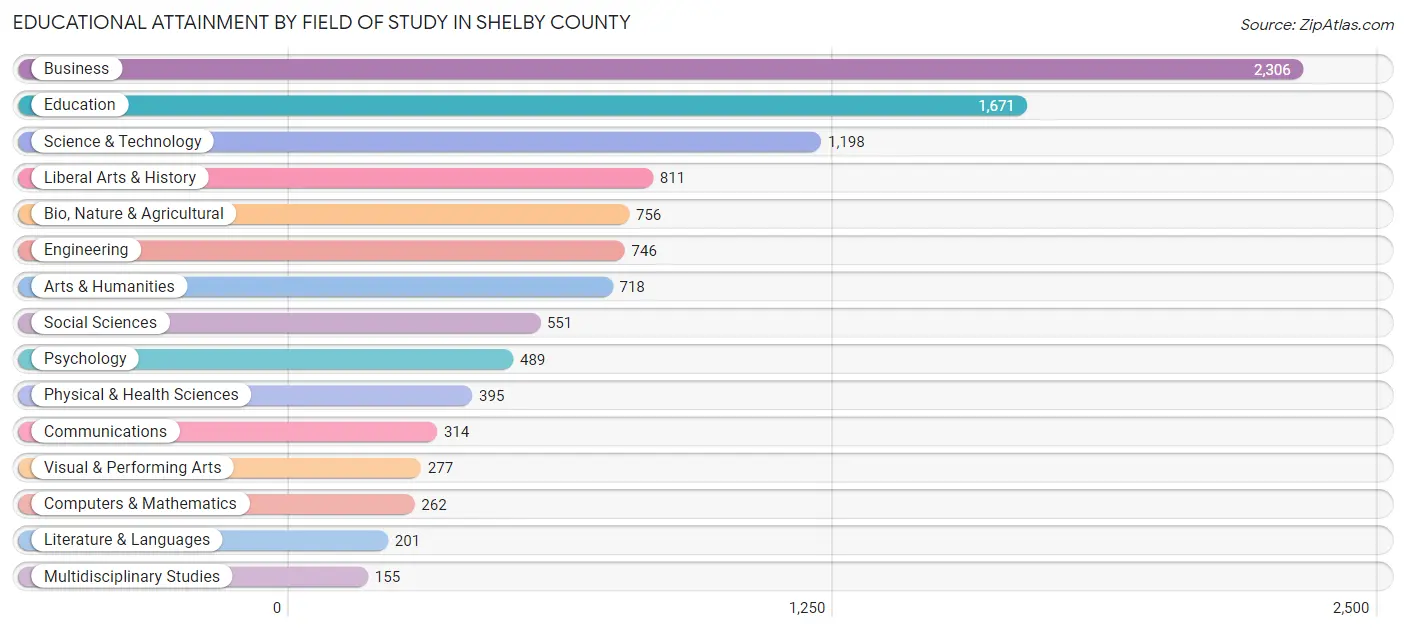
| Field of Study | # Graduates | % Graduates |
| Computers & Mathematics | 262 | 2.4% |
| Bio, Nature & Agricultural | 756 | 7.0% |
| Physical & Health Sciences | 395 | 3.6% |
| Psychology | 489 | 4.5% |
| Social Sciences | 551 | 5.1% |
| Engineering | 746 | 6.9% |
| Multidisciplinary Studies | 155 | 1.4% |
| Science & Technology | 1,198 | 11.0% |
| Business | 2,306 | 21.2% |
| Education | 1,671 | 15.4% |
| Literature & Languages | 201 | 1.8% |
| Liberal Arts & History | 811 | 7.5% |
| Visual & Performing Arts | 277 | 2.5% |
| Communications | 314 | 2.9% |
| Arts & Humanities | 718 | 6.6% |
| Total | 10,850 | 100.0% |
Transportation & Commute in Shelby County
Vehicle Availability by Sex in Shelby County
The most prevalent vehicle ownership categories in Shelby County are males with 2 vehicles (5,554, accounting for 44.8%) and females with 2 vehicles (4,705, making up 48.4%).
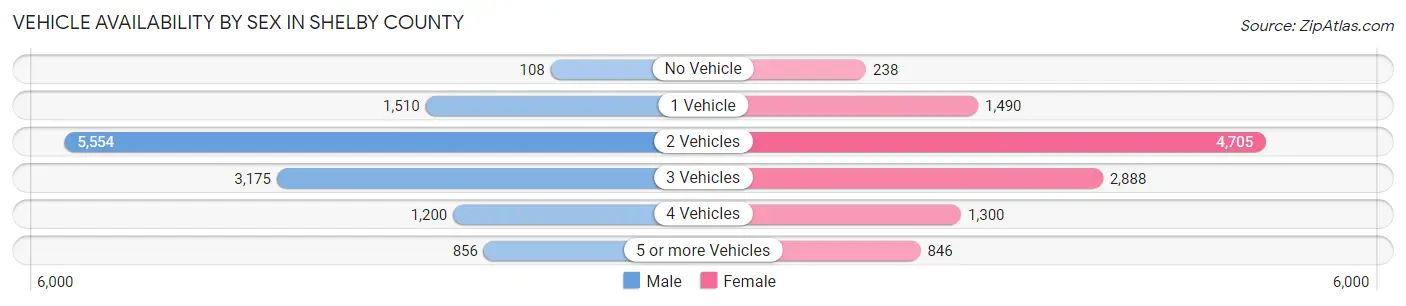
| Vehicles Available | Male | Female |
| No Vehicle | 108 (0.9%) | 238 (2.1%) |
| 1 Vehicle | 1,510 (12.2%) | 1,490 (13.0%) |
| 2 Vehicles | 5,554 (44.8%) | 4,705 (41.0%) |
| 3 Vehicles | 3,175 (25.6%) | 2,888 (25.2%) |
| 4 Vehicles | 1,200 (9.7%) | 1,300 (11.3%) |
| 5 or more Vehicles | 856 (6.9%) | 846 (7.4%) |
| Total | 12,403 (100.0%) | 11,467 (100.0%) |
Commute Time in Shelby County
The most frequently occuring commute durations in Shelby County are 30 to 34 minutes (3,456 commuters, 16.1%), 15 to 19 minutes (3,248 commuters, 15.1%), and 10 to 14 minutes (2,640 commuters, 12.3%).
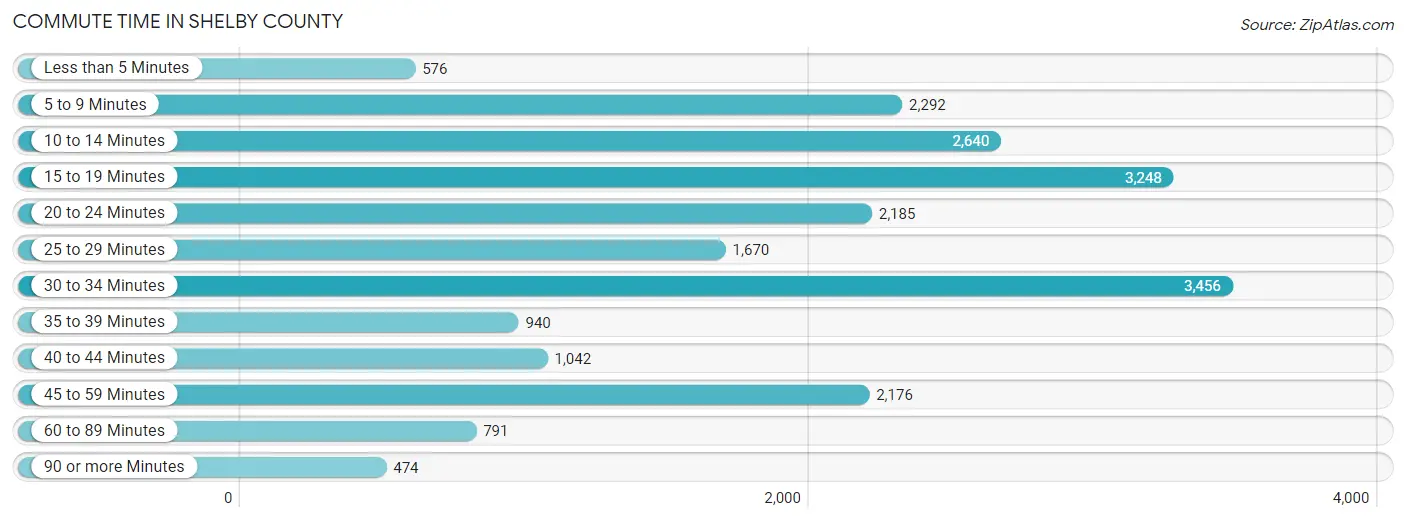
| Commute Time | # Commuters | % Commuters |
| Less than 5 Minutes | 576 | 2.7% |
| 5 to 9 Minutes | 2,292 | 10.7% |
| 10 to 14 Minutes | 2,640 | 12.3% |
| 15 to 19 Minutes | 3,248 | 15.1% |
| 20 to 24 Minutes | 2,185 | 10.2% |
| 25 to 29 Minutes | 1,670 | 7.8% |
| 30 to 34 Minutes | 3,456 | 16.1% |
| 35 to 39 Minutes | 940 | 4.4% |
| 40 to 44 Minutes | 1,042 | 4.9% |
| 45 to 59 Minutes | 2,176 | 10.1% |
| 60 to 89 Minutes | 791 | 3.7% |
| 90 or more Minutes | 474 | 2.2% |
Commute Time by Sex in Shelby County
The most common commute times in Shelby County are 15 to 19 minutes (1,801 commuters, 15.9%) for males and 30 to 34 minutes (1,745 commuters, 17.1%) for females.
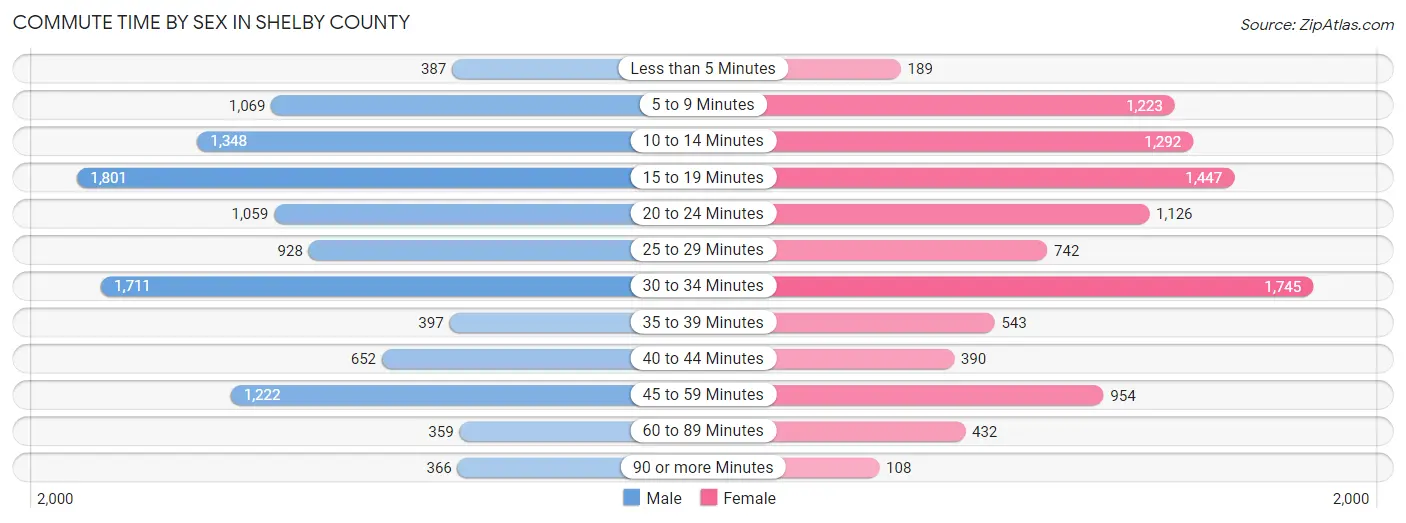
| Commute Time | Male | Female |
| Less than 5 Minutes | 387 (3.4%) | 189 (1.8%) |
| 5 to 9 Minutes | 1,069 (9.5%) | 1,223 (12.0%) |
| 10 to 14 Minutes | 1,348 (11.9%) | 1,292 (12.7%) |
| 15 to 19 Minutes | 1,801 (15.9%) | 1,447 (14.2%) |
| 20 to 24 Minutes | 1,059 (9.4%) | 1,126 (11.1%) |
| 25 to 29 Minutes | 928 (8.2%) | 742 (7.3%) |
| 30 to 34 Minutes | 1,711 (15.1%) | 1,745 (17.1%) |
| 35 to 39 Minutes | 397 (3.5%) | 543 (5.3%) |
| 40 to 44 Minutes | 652 (5.8%) | 390 (3.8%) |
| 45 to 59 Minutes | 1,222 (10.8%) | 954 (9.4%) |
| 60 to 89 Minutes | 359 (3.2%) | 432 (4.2%) |
| 90 or more Minutes | 366 (3.2%) | 108 (1.1%) |
Time of Departure to Work by Sex in Shelby County
The most frequent times of departure to work in Shelby County are 7:00 AM to 7:29 AM (1,606, 14.2%) for males and 7:00 AM to 7:29 AM (1,665, 16.3%) for females.
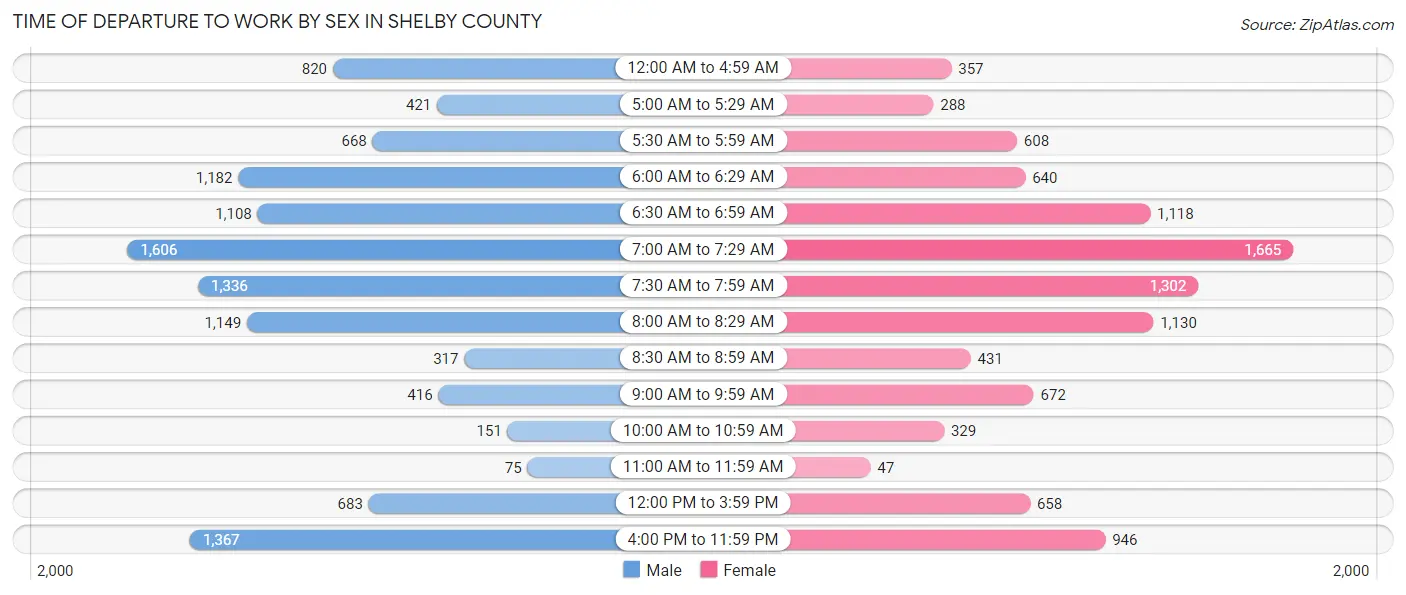
| Time of Departure | Male | Female |
| 12:00 AM to 4:59 AM | 820 (7.3%) | 357 (3.5%) |
| 5:00 AM to 5:29 AM | 421 (3.7%) | 288 (2.8%) |
| 5:30 AM to 5:59 AM | 668 (5.9%) | 608 (6.0%) |
| 6:00 AM to 6:29 AM | 1,182 (10.5%) | 640 (6.3%) |
| 6:30 AM to 6:59 AM | 1,108 (9.8%) | 1,118 (11.0%) |
| 7:00 AM to 7:29 AM | 1,606 (14.2%) | 1,665 (16.3%) |
| 7:30 AM to 7:59 AM | 1,336 (11.8%) | 1,302 (12.8%) |
| 8:00 AM to 8:29 AM | 1,149 (10.2%) | 1,130 (11.1%) |
| 8:30 AM to 8:59 AM | 317 (2.8%) | 431 (4.2%) |
| 9:00 AM to 9:59 AM | 416 (3.7%) | 672 (6.6%) |
| 10:00 AM to 10:59 AM | 151 (1.3%) | 329 (3.2%) |
| 11:00 AM to 11:59 AM | 75 (0.7%) | 47 (0.5%) |
| 12:00 PM to 3:59 PM | 683 (6.0%) | 658 (6.5%) |
| 4:00 PM to 11:59 PM | 1,367 (12.1%) | 946 (9.3%) |
| Total | 11,299 (100.0%) | 10,191 (100.0%) |
Housing Occupancy in Shelby County
Occupancy by Ownership in Shelby County
Of the total 17,590 dwellings in Shelby County, owner-occupied units account for 12,819 (72.9%), while renter-occupied units make up 4,771 (27.1%).
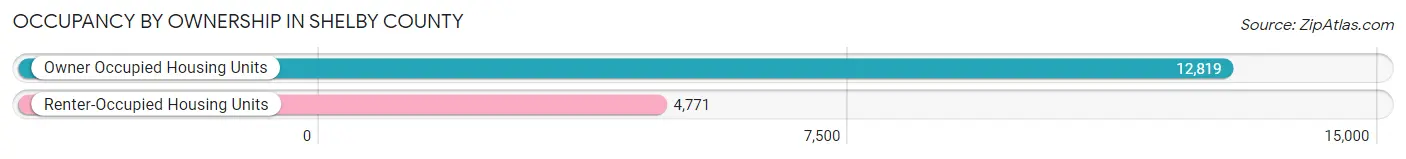
| Occupancy | # Housing Units | % Housing Units |
| Owner Occupied Housing Units | 12,819 | 72.9% |
| Renter-Occupied Housing Units | 4,771 | 27.1% |
| Total Occupied Housing Units | 17,590 | 100.0% |
Occupancy by Household Size in Shelby County
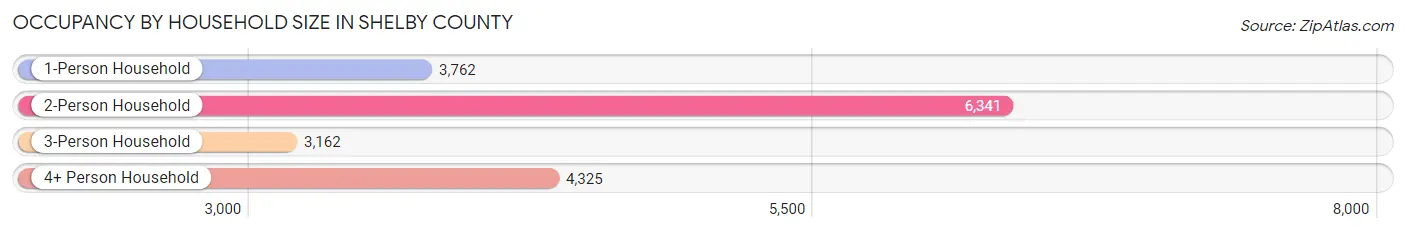
| Household Size | # Housing Units | % Housing Units |
| 1-Person Household | 3,762 | 21.4% |
| 2-Person Household | 6,341 | 36.0% |
| 3-Person Household | 3,162 | 18.0% |
| 4+ Person Household | 4,325 | 24.6% |
| Total Housing Units | 17,590 | 100.0% |
Occupancy by Ownership by Household Size in Shelby County
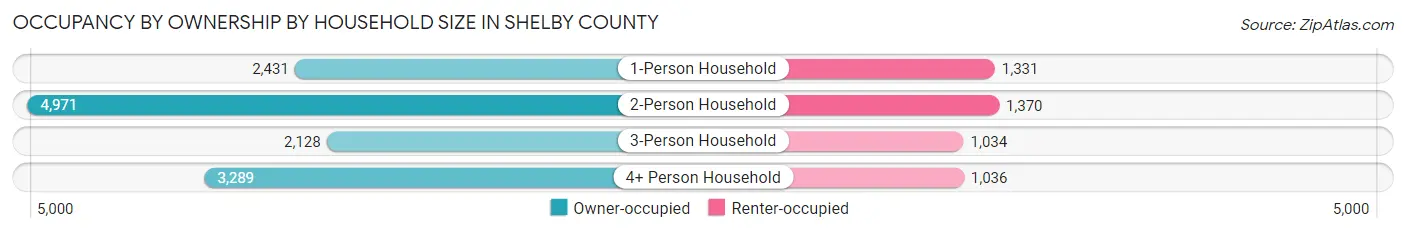
| Household Size | Owner-occupied | Renter-occupied |
| 1-Person Household | 2,431 (64.6%) | 1,331 (35.4%) |
| 2-Person Household | 4,971 (78.4%) | 1,370 (21.6%) |
| 3-Person Household | 2,128 (67.3%) | 1,034 (32.7%) |
| 4+ Person Household | 3,289 (76.0%) | 1,036 (23.9%) |
| Total Housing Units | 12,819 (72.9%) | 4,771 (27.1%) |
Occupancy by Educational Attainment in Shelby County
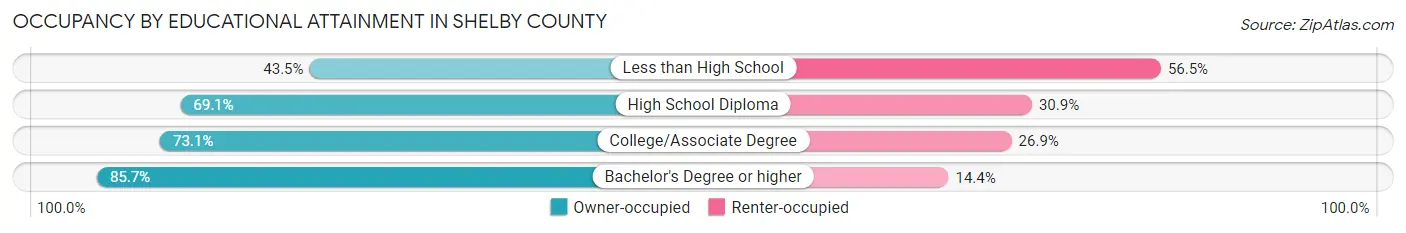
| Household Size | Owner-occupied | Renter-occupied |
| Less than High School | 823 (43.5%) | 1,067 (56.5%) |
| High School Diploma | 3,483 (69.1%) | 1,557 (30.9%) |
| College/Associate Degree | 3,611 (73.1%) | 1,326 (26.9%) |
| Bachelor's Degree or higher | 4,902 (85.7%) | 821 (14.3%) |
Occupancy by Age of Householder in Shelby County
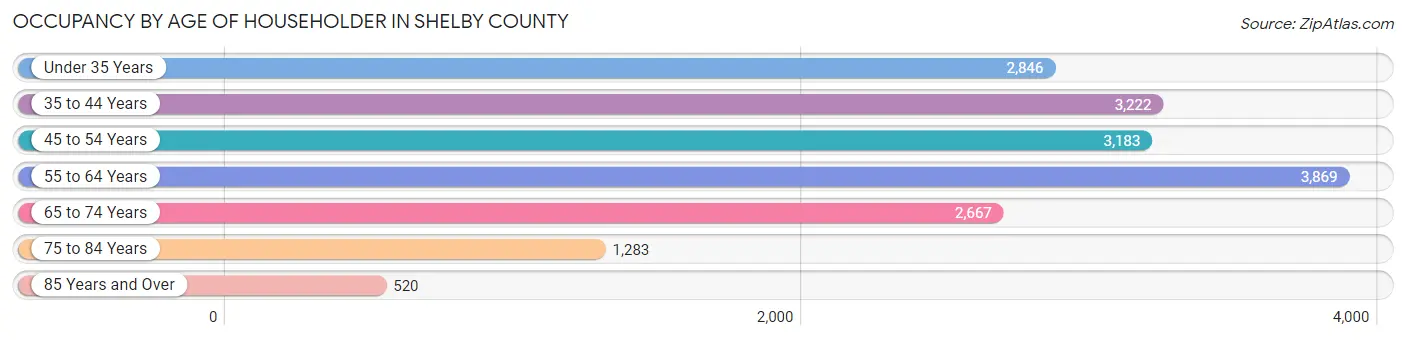
| Age Bracket | # Households | % Households |
| Under 35 Years | 2,846 | 16.2% |
| 35 to 44 Years | 3,222 | 18.3% |
| 45 to 54 Years | 3,183 | 18.1% |
| 55 to 64 Years | 3,869 | 22.0% |
| 65 to 74 Years | 2,667 | 15.2% |
| 75 to 84 Years | 1,283 | 7.3% |
| 85 Years and Over | 520 | 3.0% |
| Total | 17,590 | 100.0% |
Housing Finances in Shelby County
Median Income by Occupancy in Shelby County
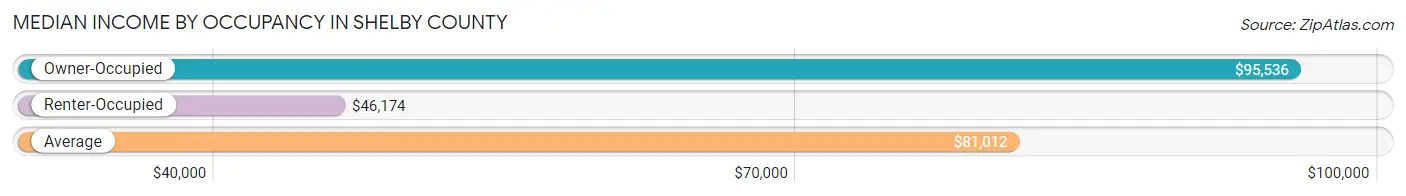
| Occupancy Type | # Households | Median Income |
| Owner-Occupied | 12,819 (72.9%) | $95,536 |
| Renter-Occupied | 4,771 (27.1%) | $46,174 |
| Average | 17,590 (100.0%) | $81,012 |
Occupancy by Householder Income Bracket in Shelby County
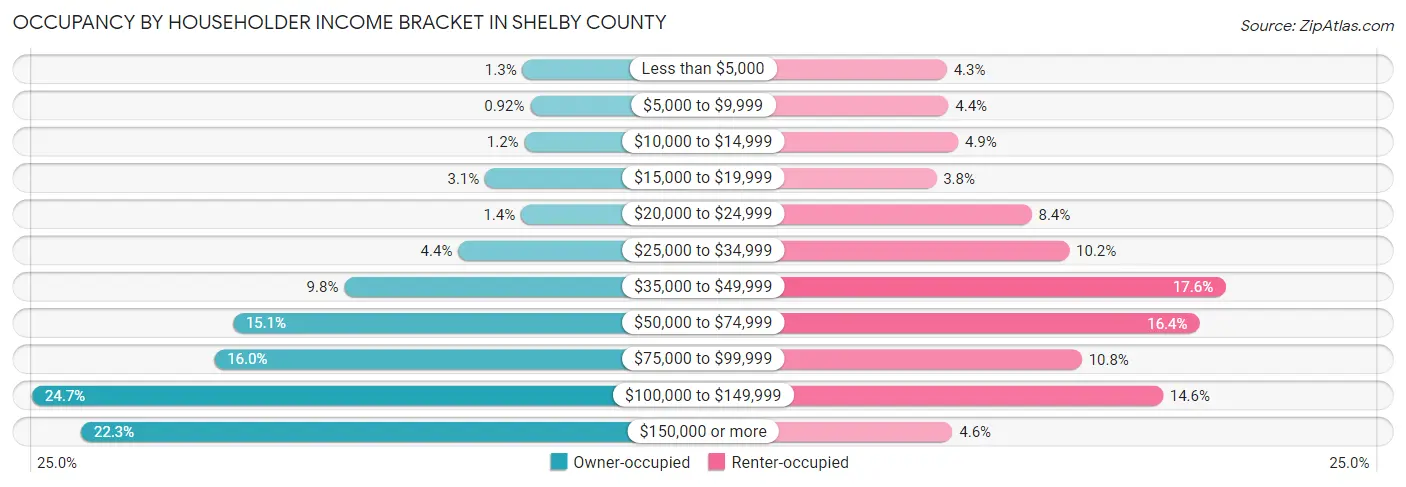
| Income Bracket | Owner-occupied | Renter-occupied |
| Less than $5,000 | 166 (1.3%) | 207 (4.3%) |
| $5,000 to $9,999 | 118 (0.9%) | 211 (4.4%) |
| $10,000 to $14,999 | 154 (1.2%) | 233 (4.9%) |
| $15,000 to $19,999 | 394 (3.1%) | 183 (3.8%) |
| $20,000 to $24,999 | 174 (1.4%) | 400 (8.4%) |
| $25,000 to $34,999 | 557 (4.3%) | 485 (10.2%) |
| $35,000 to $49,999 | 1,254 (9.8%) | 839 (17.6%) |
| $50,000 to $74,999 | 1,934 (15.1%) | 781 (16.4%) |
| $75,000 to $99,999 | 2,047 (16.0%) | 514 (10.8%) |
| $100,000 to $149,999 | 3,160 (24.6%) | 698 (14.6%) |
| $150,000 or more | 2,861 (22.3%) | 220 (4.6%) |
| Total | 12,819 (100.0%) | 4,771 (100.0%) |
Monthly Housing Cost Tiers in Shelby County
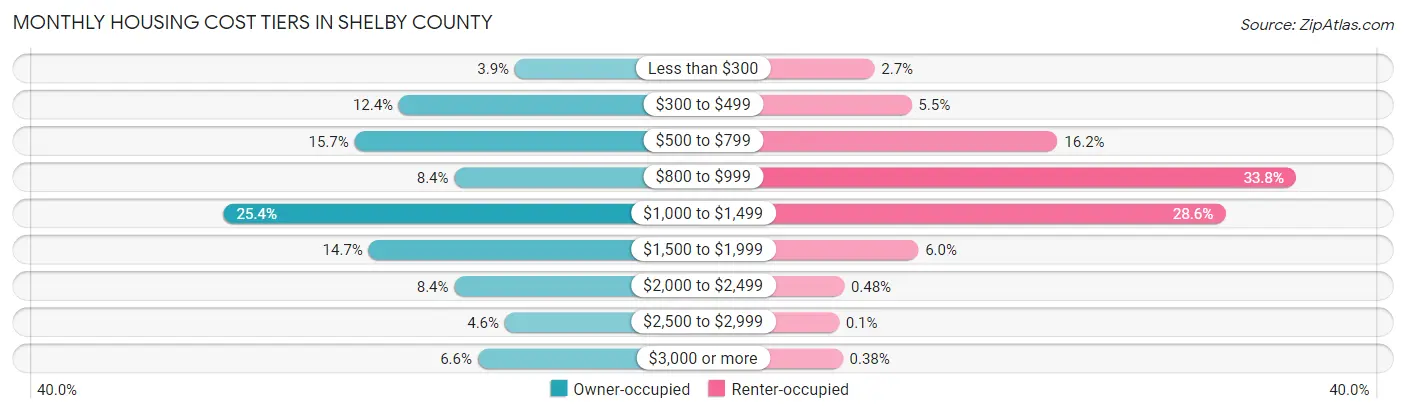
| Monthly Cost | Owner-occupied | Renter-occupied |
| Less than $300 | 499 (3.9%) | 130 (2.7%) |
| $300 to $499 | 1,593 (12.4%) | 260 (5.4%) |
| $500 to $799 | 2,013 (15.7%) | 773 (16.2%) |
| $800 to $999 | 1,071 (8.4%) | 1,610 (33.8%) |
| $1,000 to $1,499 | 3,250 (25.4%) | 1,362 (28.5%) |
| $1,500 to $1,999 | 1,879 (14.7%) | 284 (5.9%) |
| $2,000 to $2,499 | 1,071 (8.4%) | 23 (0.5%) |
| $2,500 to $2,999 | 594 (4.6%) | 5 (0.1%) |
| $3,000 or more | 849 (6.6%) | 18 (0.4%) |
| Total | 12,819 (100.0%) | 4,771 (100.0%) |
Physical Housing Characteristics in Shelby County
Housing Structures in Shelby County
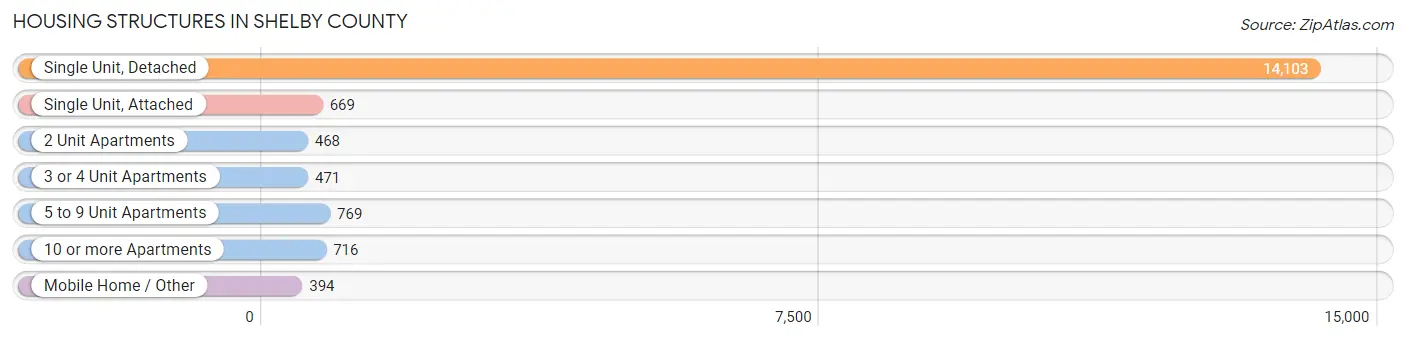
| Structure Type | # Housing Units | % Housing Units |
| Single Unit, Detached | 14,103 | 80.2% |
| Single Unit, Attached | 669 | 3.8% |
| 2 Unit Apartments | 468 | 2.7% |
| 3 or 4 Unit Apartments | 471 | 2.7% |
| 5 to 9 Unit Apartments | 769 | 4.4% |
| 10 or more Apartments | 716 | 4.1% |
| Mobile Home / Other | 394 | 2.2% |
| Total | 17,590 | 100.0% |
Housing Structures by Occupancy in Shelby County
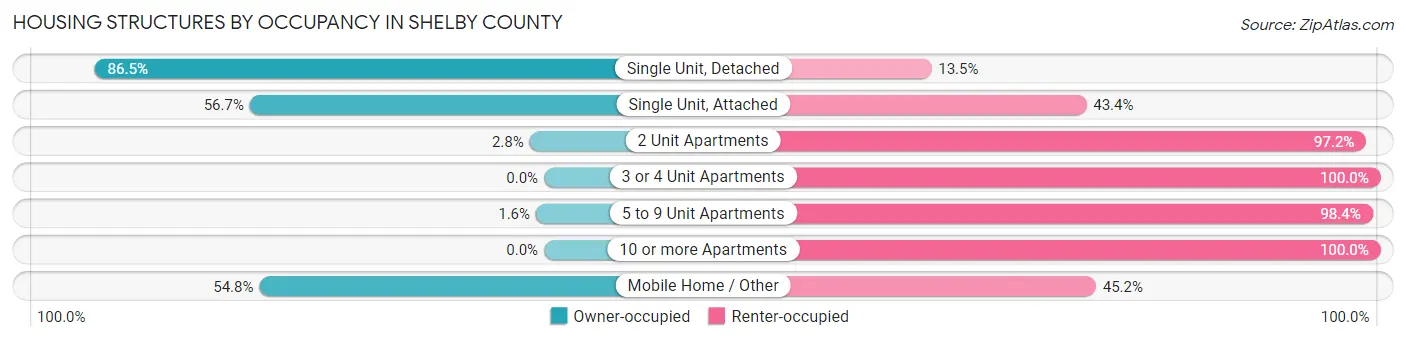
| Structure Type | Owner-occupied | Renter-occupied |
| Single Unit, Detached | 12,199 (86.5%) | 1,904 (13.5%) |
| Single Unit, Attached | 379 (56.7%) | 290 (43.3%) |
| 2 Unit Apartments | 13 (2.8%) | 455 (97.2%) |
| 3 or 4 Unit Apartments | 0 (0.0%) | 471 (100.0%) |
| 5 to 9 Unit Apartments | 12 (1.6%) | 757 (98.4%) |
| 10 or more Apartments | 0 (0.0%) | 716 (100.0%) |
| Mobile Home / Other | 216 (54.8%) | 178 (45.2%) |
| Total | 12,819 (72.9%) | 4,771 (27.1%) |
Housing Structures by Number of Rooms in Shelby County
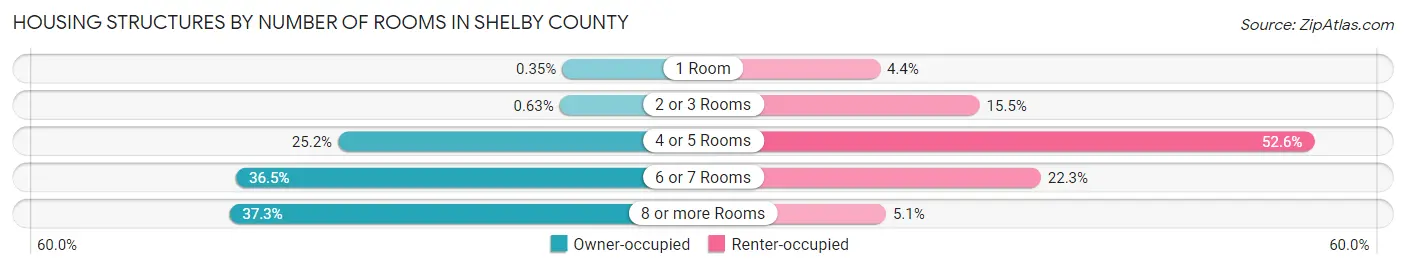
| Number of Rooms | Owner-occupied | Renter-occupied |
| 1 Room | 45 (0.4%) | 212 (4.4%) |
| 2 or 3 Rooms | 81 (0.6%) | 740 (15.5%) |
| 4 or 5 Rooms | 3,234 (25.2%) | 2,511 (52.6%) |
| 6 or 7 Rooms | 4,681 (36.5%) | 1,064 (22.3%) |
| 8 or more Rooms | 4,778 (37.3%) | 244 (5.1%) |
| Total | 12,819 (100.0%) | 4,771 (100.0%) |
Housing Structure by Heating Type in Shelby County
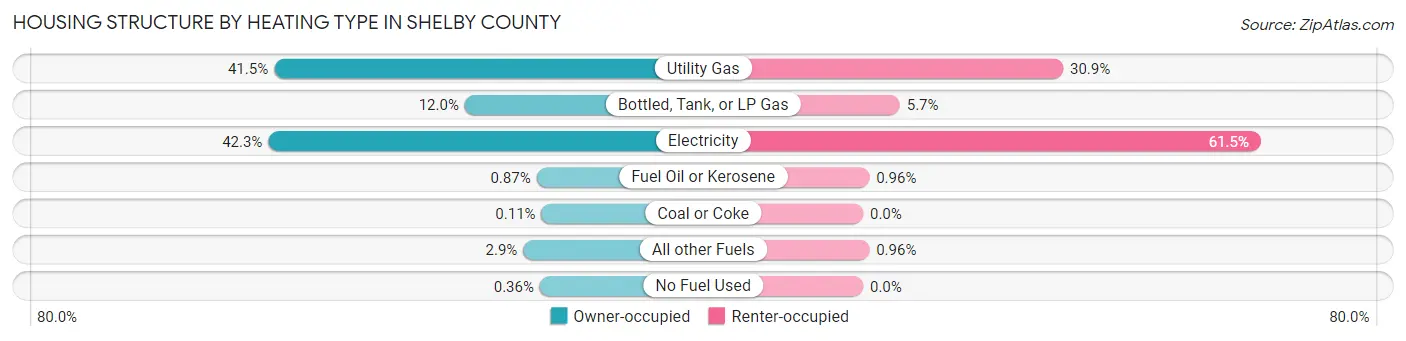
| Heating Type | Owner-occupied | Renter-occupied |
| Utility Gas | 5,313 (41.4%) | 1,475 (30.9%) |
| Bottled, Tank, or LP Gas | 1,533 (12.0%) | 271 (5.7%) |
| Electricity | 5,427 (42.3%) | 2,933 (61.5%) |
| Fuel Oil or Kerosene | 112 (0.9%) | 46 (1.0%) |
| Coal or Coke | 14 (0.1%) | 0 (0.0%) |
| All other Fuels | 374 (2.9%) | 46 (1.0%) |
| No Fuel Used | 46 (0.4%) | 0 (0.0%) |
| Total | 12,819 (100.0%) | 4,771 (100.0%) |
Household Vehicle Usage in Shelby County
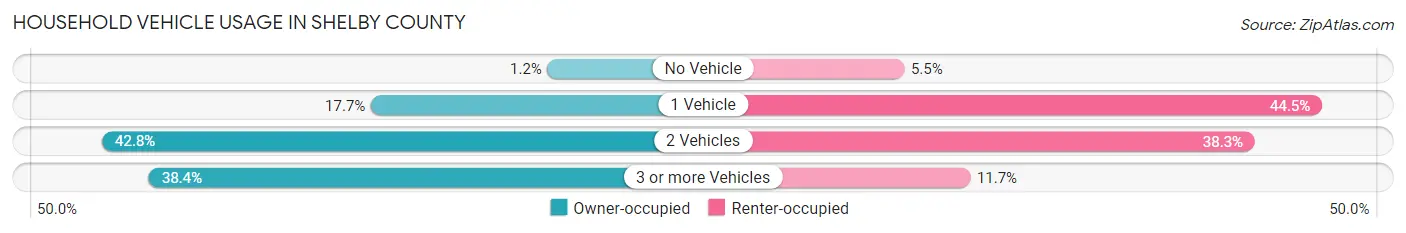
| Vehicles per Household | Owner-occupied | Renter-occupied |
| No Vehicle | 150 (1.2%) | 263 (5.5%) |
| 1 Vehicle | 2,262 (17.6%) | 2,125 (44.5%) |
| 2 Vehicles | 5,484 (42.8%) | 1,826 (38.3%) |
| 3 or more Vehicles | 4,923 (38.4%) | 557 (11.7%) |
| Total | 12,819 (100.0%) | 4,771 (100.0%) |
Real Estate & Mortgages in Shelby County
Real Estate and Mortgage Overview in Shelby County
| Characteristic | Without Mortgage | With Mortgage |
| Housing Units | 4,206 | 8,613 |
| Median Property Value | $238,800 | $252,200 |
| Median Household Income | $66,195 | $2,223 |
| Monthly Housing Costs | $504 | $849 |
| Real Estate Taxes | $1,707 | $71 |
Property Value by Mortgage Status in Shelby County
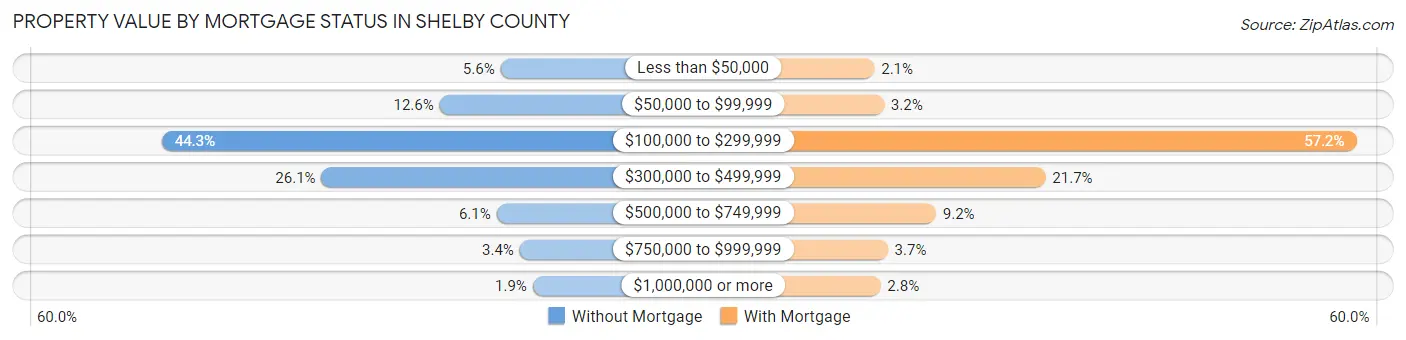
| Property Value | Without Mortgage | With Mortgage |
| Less than $50,000 | 236 (5.6%) | 184 (2.1%) |
| $50,000 to $99,999 | 529 (12.6%) | 279 (3.2%) |
| $100,000 to $299,999 | 1,864 (44.3%) | 4,929 (57.2%) |
| $300,000 to $499,999 | 1,097 (26.1%) | 1,869 (21.7%) |
| $500,000 to $749,999 | 255 (6.1%) | 791 (9.2%) |
| $750,000 to $999,999 | 144 (3.4%) | 316 (3.7%) |
| $1,000,000 or more | 81 (1.9%) | 245 (2.8%) |
| Total | 4,206 (100.0%) | 8,613 (100.0%) |
Household Income by Mortgage Status in Shelby County
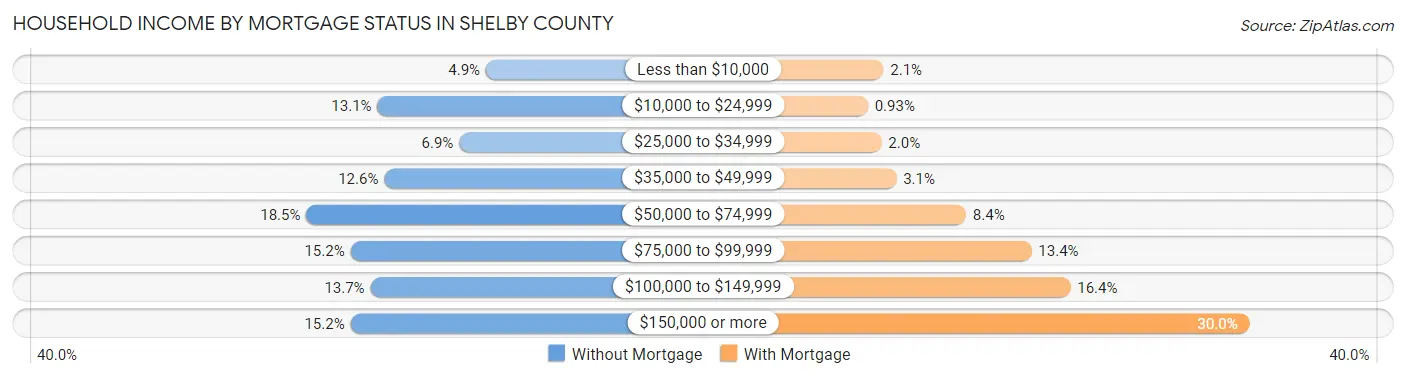
| Household Income | Without Mortgage | With Mortgage |
| Less than $10,000 | 204 (4.9%) | 183 (2.1%) |
| $10,000 to $24,999 | 552 (13.1%) | 80 (0.9%) |
| $25,000 to $34,999 | 290 (6.9%) | 170 (2.0%) |
| $35,000 to $49,999 | 530 (12.6%) | 267 (3.1%) |
| $50,000 to $74,999 | 780 (18.5%) | 724 (8.4%) |
| $75,000 to $99,999 | 638 (15.2%) | 1,154 (13.4%) |
| $100,000 to $149,999 | 574 (13.7%) | 1,409 (16.4%) |
| $150,000 or more | 638 (15.2%) | 2,586 (30.0%) |
| Total | 4,206 (100.0%) | 8,613 (100.0%) |
Property Value to Household Income Ratio in Shelby County
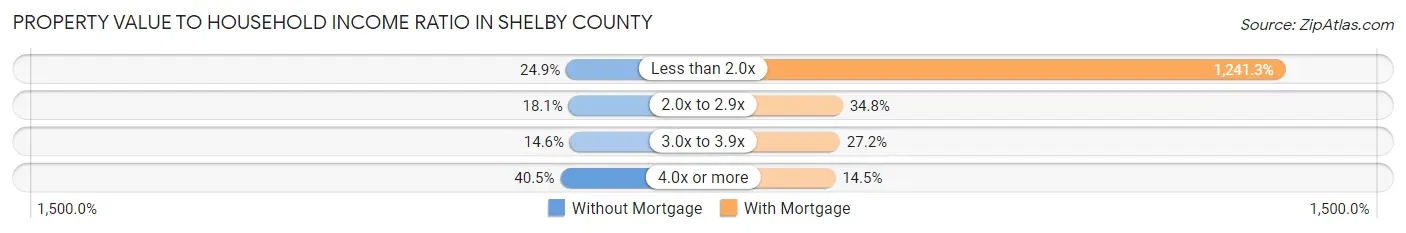
| Value-to-Income Ratio | Without Mortgage | With Mortgage |
| Less than 2.0x | 1,046 (24.9%) | 106,910 (1,241.3%) |
| 2.0x to 2.9x | 760 (18.1%) | 3,000 (34.8%) |
| 3.0x to 3.9x | 615 (14.6%) | 2,342 (27.2%) |
| 4.0x or more | 1,705 (40.5%) | 1,248 (14.5%) |
| Total | 4,206 (100.0%) | 8,613 (100.0%) |
Real Estate Taxes by Mortgage Status in Shelby County
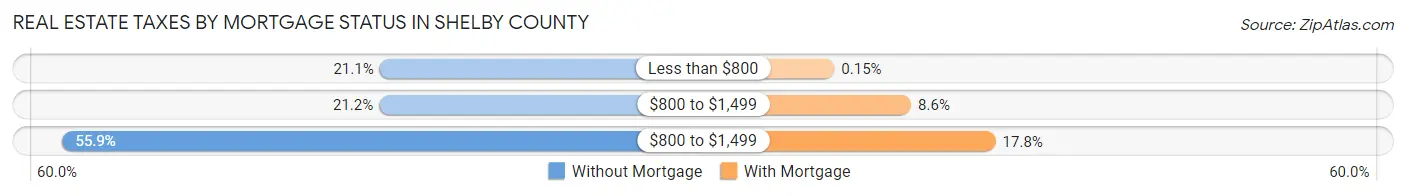
| Property Taxes | Without Mortgage | With Mortgage |
| Less than $800 | 888 (21.1%) | 13 (0.2%) |
| $800 to $1,499 | 890 (21.2%) | 737 (8.6%) |
| $800 to $1,499 | 2,349 (55.8%) | 1,535 (17.8%) |
| Total | 4,206 (100.0%) | 8,613 (100.0%) |
Health & Disability in Shelby County
Health Insurance Coverage by Age in Shelby County
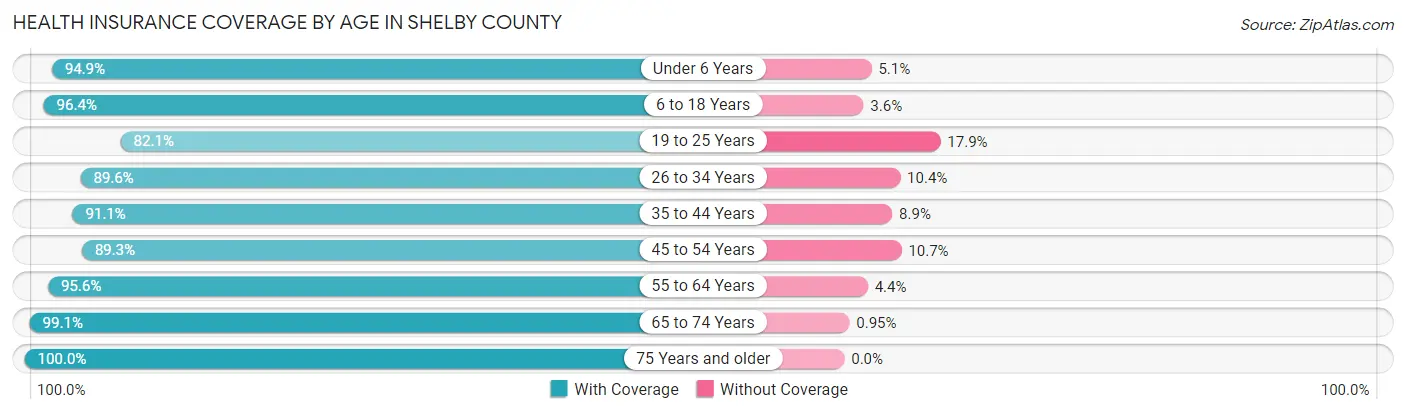
| Age Bracket | With Coverage | Without Coverage |
| Under 6 Years | 3,180 (94.9%) | 170 (5.1%) |
| 6 to 18 Years | 7,525 (96.4%) | 278 (3.6%) |
| 19 to 25 Years | 3,289 (82.1%) | 718 (17.9%) |
| 26 to 34 Years | 4,438 (89.6%) | 516 (10.4%) |
| 35 to 44 Years | 5,565 (91.1%) | 546 (8.9%) |
| 45 to 54 Years | 5,872 (89.3%) | 701 (10.7%) |
| 55 to 64 Years | 6,213 (95.6%) | 284 (4.4%) |
| 65 to 74 Years | 4,798 (99.1%) | 46 (0.9%) |
| 75 Years and older | 2,791 (100.0%) | 0 (0.0%) |
| Total | 43,671 (93.1%) | 3,259 (6.9%) |
Health Insurance Coverage by Citizenship Status in Shelby County
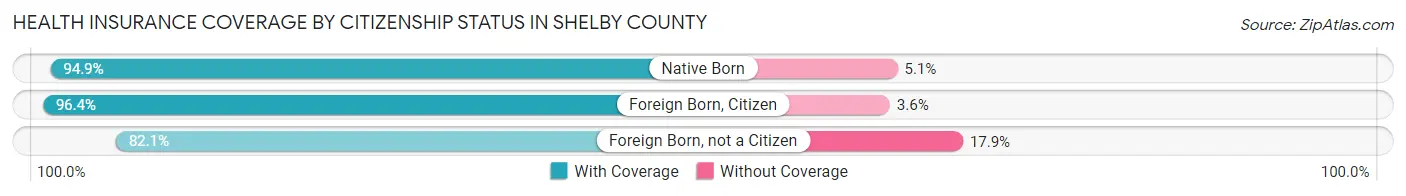
| Citizenship Status | With Coverage | Without Coverage |
| Native Born | 3,180 (94.9%) | 170 (5.1%) |
| Foreign Born, Citizen | 7,525 (96.4%) | 278 (3.6%) |
| Foreign Born, not a Citizen | 3,289 (82.1%) | 718 (17.9%) |
Health Insurance Coverage by Household Income in Shelby County
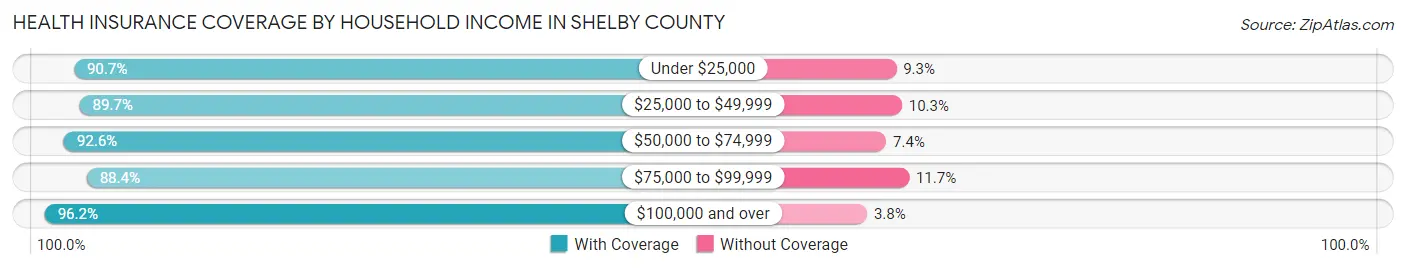
| Household Income | With Coverage | Without Coverage |
| Under $25,000 | 3,361 (90.7%) | 343 (9.3%) |
| $25,000 to $49,999 | 5,731 (89.7%) | 658 (10.3%) |
| $50,000 to $74,999 | 6,500 (92.6%) | 517 (7.4%) |
| $75,000 to $99,999 | 6,187 (88.3%) | 816 (11.7%) |
| $100,000 and over | 21,636 (96.2%) | 851 (3.8%) |
Public vs Private Health Insurance Coverage by Age in Shelby County
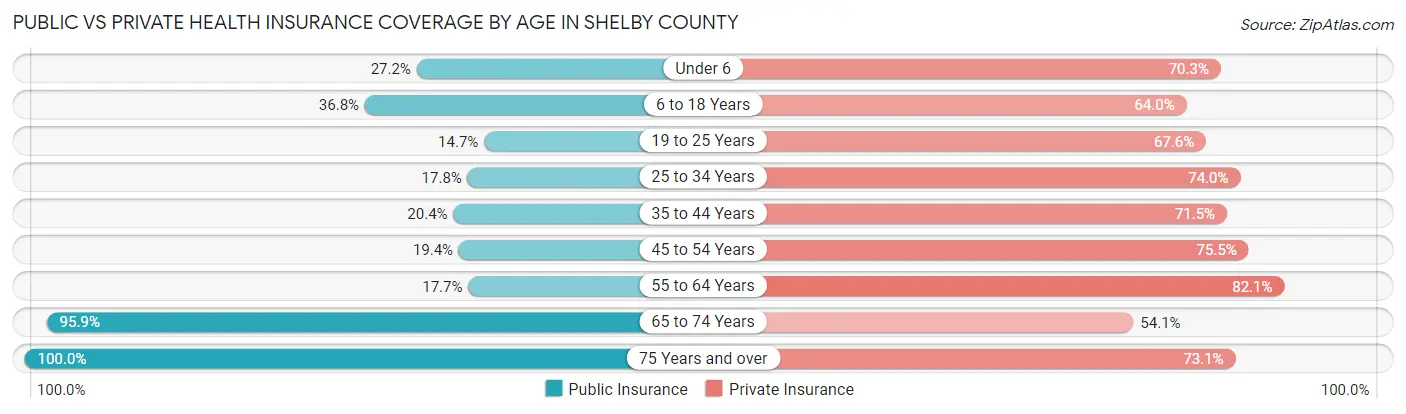
| Age Bracket | Public Insurance | Private Insurance |
| Under 6 | 912 (27.2%) | 2,356 (70.3%) |
| 6 to 18 Years | 2,874 (36.8%) | 4,992 (64.0%) |
| 19 to 25 Years | 589 (14.7%) | 2,709 (67.6%) |
| 25 to 34 Years | 880 (17.8%) | 3,664 (74.0%) |
| 35 to 44 Years | 1,247 (20.4%) | 4,368 (71.5%) |
| 45 to 54 Years | 1,274 (19.4%) | 4,963 (75.5%) |
| 55 to 64 Years | 1,147 (17.6%) | 5,336 (82.1%) |
| 65 to 74 Years | 4,646 (95.9%) | 2,622 (54.1%) |
| 75 Years and over | 2,791 (100.0%) | 2,039 (73.1%) |
| Total | 16,360 (34.9%) | 33,049 (70.4%) |
Disability Status by Sex by Age in Shelby County
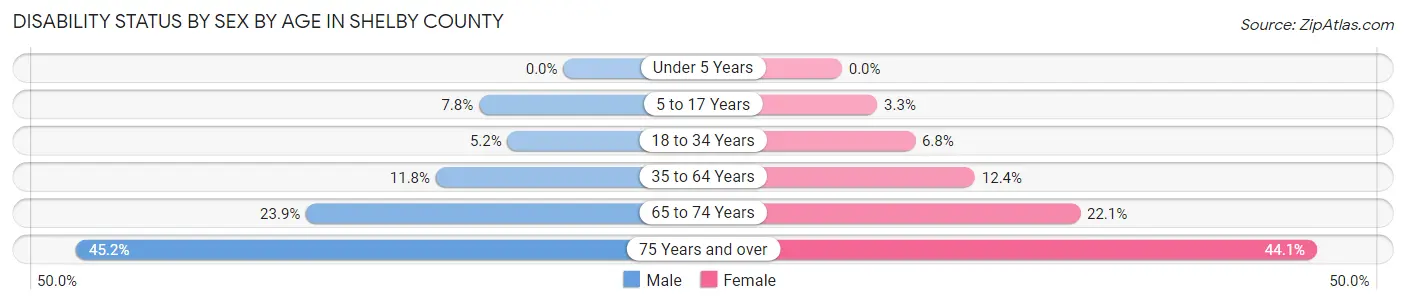
| Age Bracket | Male | Female |
| Under 5 Years | 0 (0.0%) | 0 (0.0%) |
| 5 to 17 Years | 323 (7.8%) | 122 (3.3%) |
| 18 to 34 Years | 240 (5.2%) | 326 (6.8%) |
| 35 to 64 Years | 1,113 (11.8%) | 1,207 (12.3%) |
| 65 to 74 Years | 556 (23.9%) | 556 (22.1%) |
| 75 Years and over | 573 (45.2%) | 672 (44.1%) |
Disability Class by Sex by Age in Shelby County
Disability Class: Hearing Difficulty
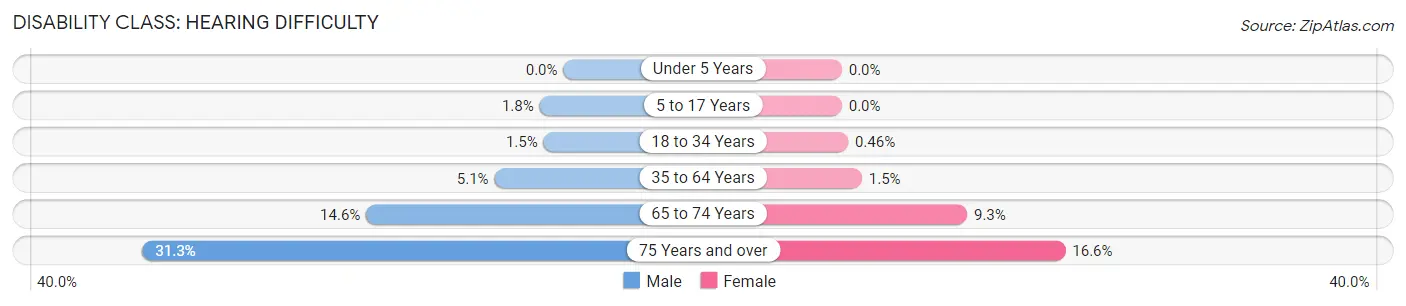
| Age Bracket | Male | Female |
| Under 5 Years | 0 (0.0%) | 0 (0.0%) |
| 5 to 17 Years | 73 (1.8%) | 0 (0.0%) |
| 18 to 34 Years | 68 (1.5%) | 22 (0.5%) |
| 35 to 64 Years | 482 (5.1%) | 146 (1.5%) |
| 65 to 74 Years | 341 (14.6%) | 234 (9.3%) |
| 75 Years and over | 396 (31.2%) | 253 (16.6%) |
Disability Class: Vision Difficulty
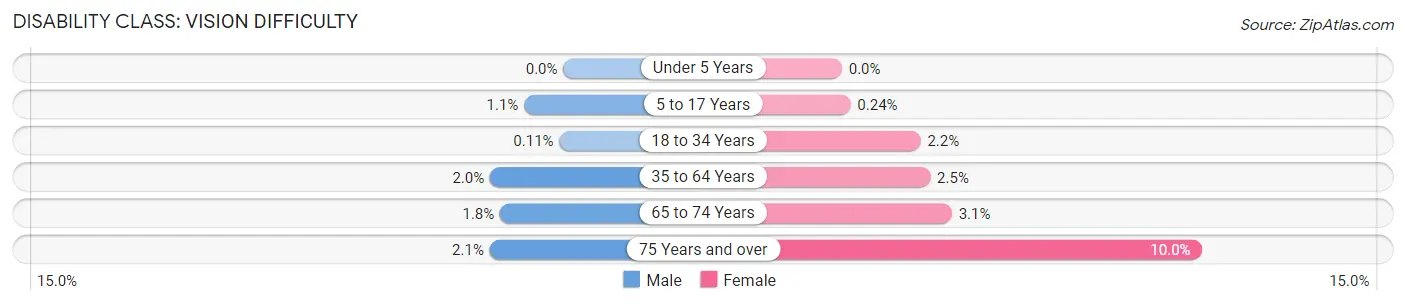
| Age Bracket | Male | Female |
| Under 5 Years | 0 (0.0%) | 0 (0.0%) |
| 5 to 17 Years | 45 (1.1%) | 9 (0.2%) |
| 18 to 34 Years | 5 (0.1%) | 105 (2.2%) |
| 35 to 64 Years | 192 (2.0%) | 240 (2.5%) |
| 65 to 74 Years | 41 (1.8%) | 77 (3.1%) |
| 75 Years and over | 26 (2.1%) | 153 (10.0%) |
Disability Class: Cognitive Difficulty
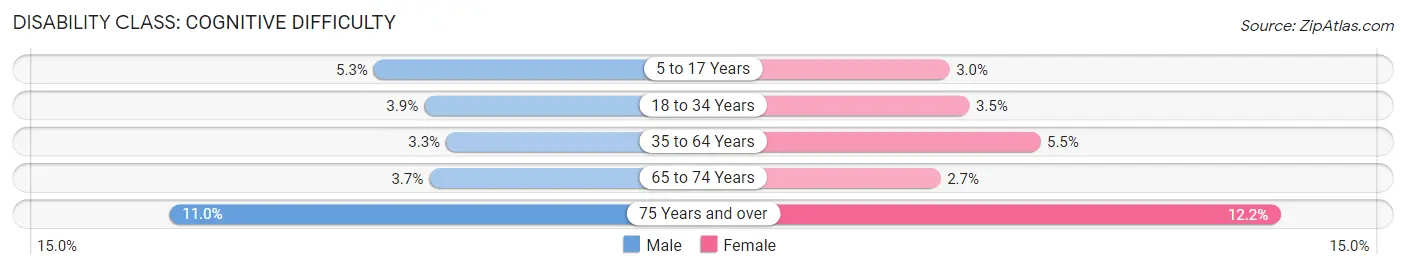
| Age Bracket | Male | Female |
| 5 to 17 Years | 218 (5.3%) | 111 (3.0%) |
| 18 to 34 Years | 180 (3.9%) | 170 (3.5%) |
| 35 to 64 Years | 308 (3.3%) | 539 (5.5%) |
| 65 to 74 Years | 87 (3.7%) | 69 (2.7%) |
| 75 Years and over | 139 (11.0%) | 186 (12.2%) |
Disability Class: Ambulatory Difficulty
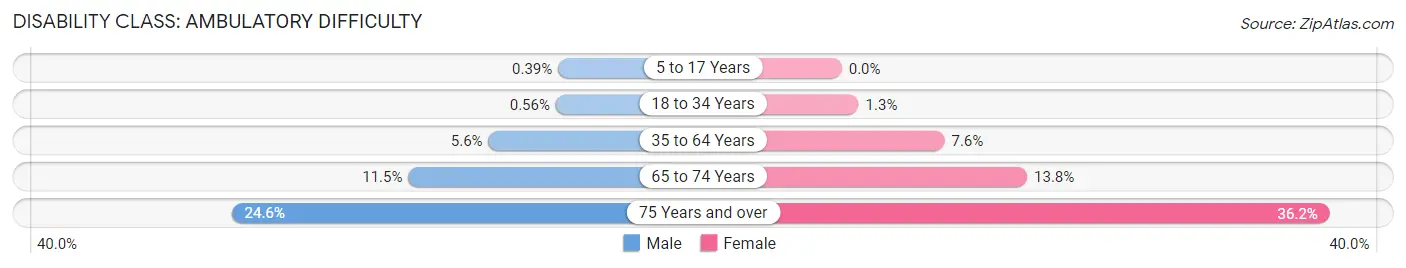
| Age Bracket | Male | Female |
| 5 to 17 Years | 16 (0.4%) | 0 (0.0%) |
| 18 to 34 Years | 26 (0.6%) | 60 (1.3%) |
| 35 to 64 Years | 523 (5.6%) | 746 (7.6%) |
| 65 to 74 Years | 268 (11.5%) | 346 (13.8%) |
| 75 Years and over | 312 (24.6%) | 552 (36.2%) |
Disability Class: Self-Care Difficulty
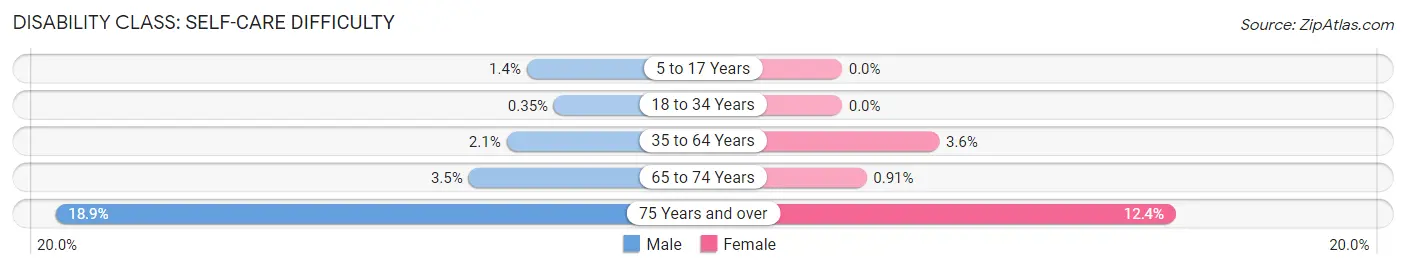
| Age Bracket | Male | Female |
| 5 to 17 Years | 56 (1.4%) | 0 (0.0%) |
| 18 to 34 Years | 16 (0.4%) | 0 (0.0%) |
| 35 to 64 Years | 199 (2.1%) | 353 (3.6%) |
| 65 to 74 Years | 82 (3.5%) | 23 (0.9%) |
| 75 Years and over | 239 (18.9%) | 189 (12.4%) |
Technology Access in Shelby County
Computing Device Access in Shelby County
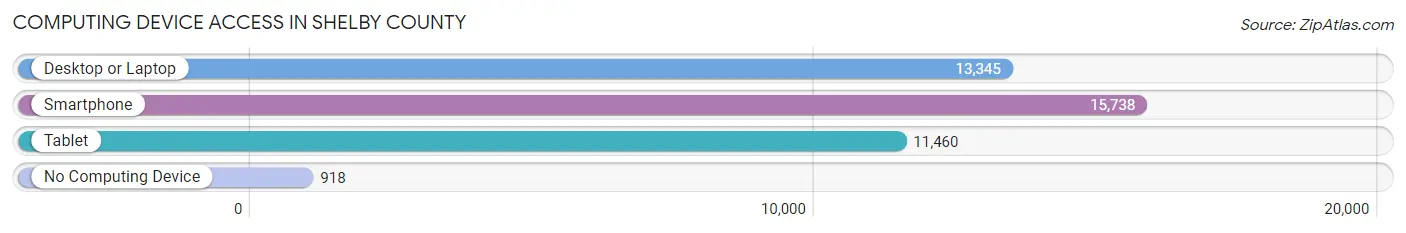
| Device Type | # Households | % Households |
| Desktop or Laptop | 13,345 | 75.9% |
| Smartphone | 15,738 | 89.5% |
| Tablet | 11,460 | 65.1% |
| No Computing Device | 918 | 5.2% |
| Total | 17,590 | 100.0% |
Internet Access in Shelby County
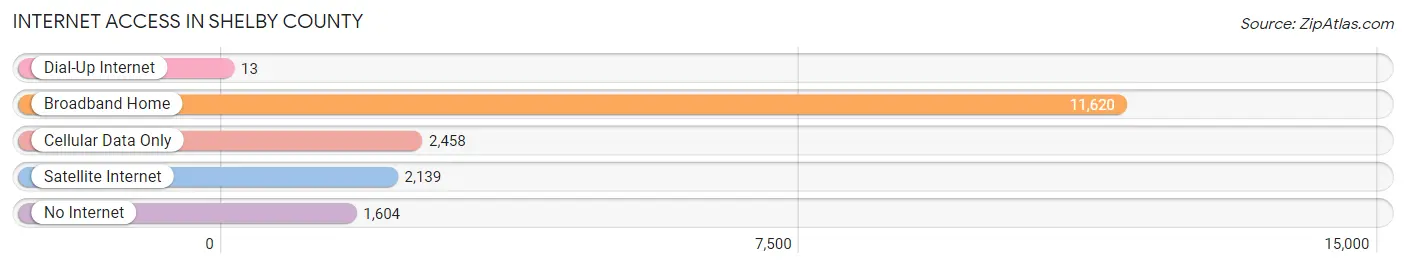
| Internet Type | # Households | % Households |
| Dial-Up Internet | 13 | 0.1% |
| Broadband Home | 11,620 | 66.1% |
| Cellular Data Only | 2,458 | 14.0% |
| Satellite Internet | 2,139 | 12.2% |
| No Internet | 1,604 | 9.1% |
| Total | 17,590 | 100.0% |
Shelby County Summary
Shelby County is located in the state of Kentucky, in the United States of America. It is part of the Louisville/Jefferson County Metropolitan Statistical Area. The county was established in 1792 and named after Isaac Shelby, the first Governor of Kentucky. The county seat is Shelbyville.
Geography
Shelby County is located in the central part of Kentucky, in the Bluegrass region. It is bordered by Anderson County to the north, Franklin County to the east, Spencer County to the south, and Jefferson County to the west. The county has a total area of 441 square miles, of which 437 square miles is land and 4.2 square miles is water. The county is drained by the Salt and Rolling Fork Rivers. The highest point in the county is located in the northwest corner, at an elevation of 890 feet.
The county is mostly rural, with a few small towns and villages. The largest town is Shelbyville, with a population of 14,045 in 2010. Other towns include Waddy, Simpsonville, Finchville, and Bagdad.
Economy
Shelby County has a diverse economy, with a mix of agriculture, manufacturing, and services. The county is home to several large employers, including the Shelby County Public Schools, Shelby County Hospital, and the Shelby County Government.
Agriculture is an important part of the county's economy. The county is home to several large farms, including the Shelby County Farm Bureau, which is the largest farm in the county. The county is also home to several wineries and distilleries, including the Four Roses Distillery and the Maker's Mark Distillery.
Manufacturing is also an important part of the county's economy. The county is home to several large factories, including the Shelby County Manufacturing Company, which produces automotive parts.
The county is also home to several service-based businesses, including banks, insurance companies, and real estate firms.
Demographics
As of the 2010 census, Shelby County had a population of 42,074. The racial makeup of the county was 94.3% White, 3.2% Black or African American, 0.3% Native American, 0.5% Asian, 0.1% Pacific Islander, 0.7% from other races, and 1.0% from two or more races. Hispanic or Latino of any race were 1.7% of the population.
The median income for a household in the county was $45,837, and the median income for a family was $54,837. The per capita income for the county was $21,945. About 8.7% of families and 11.2% of the population were below the poverty line, including 15.2% of those under age 18 and 8.2% of those age 65 or over.
Conclusion
Shelby County is a rural county located in the Bluegrass region of Kentucky. It has a diverse economy, with a mix of agriculture, manufacturing, and services. The county has a population of 42,074, with a median income of $45,837. The county is home to several large employers, including the Shelby County Public Schools, Shelby County Hospital, and the Shelby County Government.
Common Questions
What is the Total Population of Shelby County?
Total Population of Shelby County is 48,105.
What is the Total Male Population of Shelby County?
Total Male Population of Shelby County is 23,719.
What is the Total Female Population of Shelby County?
Total Female Population of Shelby County is 24,386.
What is the Ratio of Males per 100 Females in Shelby County?
There are 97.26 Males per 100 Females in Shelby County.
What is the Ratio of Females per 100 Males in Shelby County?
There are 102.81 Females per 100 Males in Shelby County.
What is the Median Population Age in Shelby County?
Median Population Age in Shelby County is 40.6 Years.
What is the Average Family Size in Shelby County
Average Family Size in Shelby County is 3.1 People.
What is the Average Household Size in Shelby County
Average Household Size in Shelby County is 2.7 People.
What is Per Capita Income in Shelby County?
Per Capita income in Shelby County is $37,918.
What is the Median Family Income in Shelby County?
Median Family Income in Shelby County is $94,658.
What is the Median Household income in Shelby County?
Median Household Income in Shelby County is $81,012.
What is Income or Wage Gap in Shelby County?
Income or Wage Gap in Shelby County is 26.4%.
Women in Shelby County earn 73.6 cents for every dollar earned by a man.
What is Family Income Deficit in Shelby County?
Family Income Deficit in Shelby County is $12,534.
Families that are below poverty line in Shelby County earn $12,534 less on average than the poverty threshold level.
What is Inequality or Gini Index in Shelby County?
Inequality or Gini Index in Shelby County is 0.43.
How Large is the Labor Force in Shelby County?
There are 25,186 People in the Labor Forcein in Shelby County.
What is the Percentage of People in the Labor Force in Shelby County?
65.0% of People are in the Labor Force in Shelby County.
What is the Unemployment Rate in Shelby County?
Unemployment Rate in Shelby County is 3.3%.