Scott County, KY
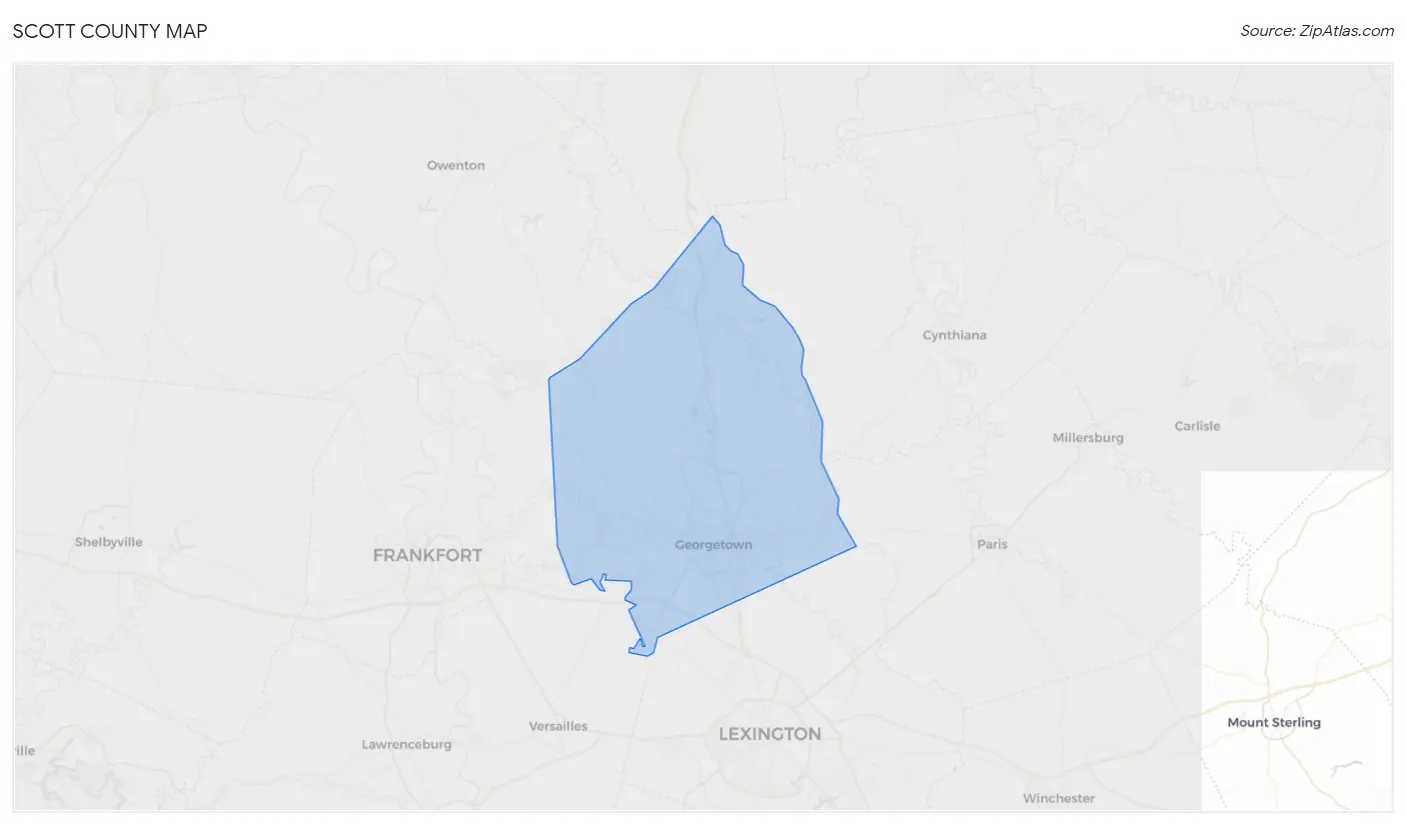
Scott County Map
Scott County Overview
57,286
TOTAL POPULATION
28,239
MALE POPULATION
29,047
FEMALE POPULATION
97.22
MALES / 100 FEMALES
102.86
FEMALES / 100 MALES
36.1
MEDIAN AGE
3.0
AVG FAMILY SIZE
2.6
AVG HOUSEHOLD SIZE
$38,391
PER CAPITA INCOME
$94,286
AVG FAMILY INCOME
$80,782
AVG HOUSEHOLD INCOME
36.9%
WAGE / INCOME GAP [ % ]
63.1¢/ $1
WAGE / INCOME GAP [ $ ]
$11,415
FAMILY INCOME DEFICIT
0.40
INEQUALITY / GINI INDEX
30,560
LABOR FORCE [ PEOPLE ]
68.8%
PERCENT IN LABOR FORCE
3.7%
UNEMPLOYMENT RATE
Scott County Area Codes
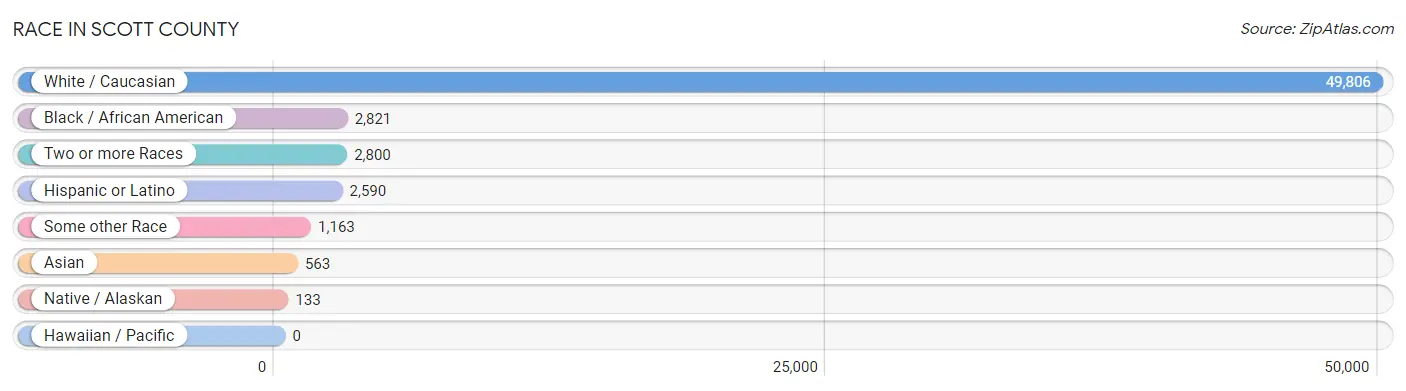
Race in Scott County
The most populous races in Scott County are White / Caucasian (49,806 | 86.9%), Black / African American (2,821 | 4.9%), and Two or more Races (2,800 | 4.9%).
| Race | # Population | % Population |
| Asian | 563 | 1.0% |
| Black / African American | 2,821 | 4.9% |
| Hawaiian / Pacific | 0 | 0.0% |
| Hispanic or Latino | 2,590 | 4.5% |
| Native / Alaskan | 133 | 0.2% |
| White / Caucasian | 49,806 | 86.9% |
| Two or more Races | 2,800 | 4.9% |
| Some other Race | 1,163 | 2.0% |
| Total | 57,286 | 100.0% |
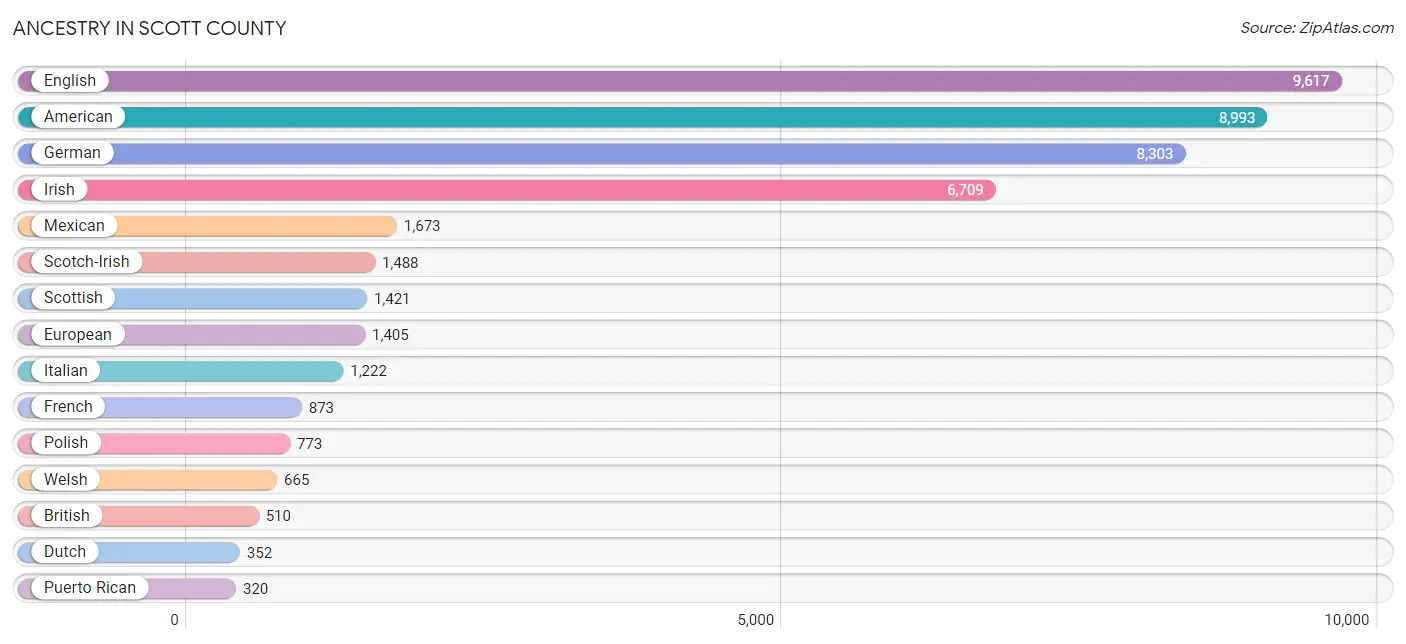
Ancestry in Scott County
The most populous ancestries reported in Scott County are English (9,617 | 16.8%), American (8,993 | 15.7%), German (8,303 | 14.5%), Irish (6,709 | 11.7%), and Mexican (1,673 | 2.9%), together accounting for 61.6% of all Scott County residents.
| Ancestry | # Population | % Population |
| Afghan | 33 | 0.1% |
| African | 62 | 0.1% |
| American | 8,993 | 15.7% |
| Apache | 27 | 0.1% |
| Arab | 56 | 0.1% |
| Argentinean | 32 | 0.1% |
| Australian | 18 | 0.0% |
| Austrian | 11 | 0.0% |
| Belgian | 8 | 0.0% |
| Bhutanese | 140 | 0.2% |
| Blackfeet | 13 | 0.0% |
| Bolivian | 9 | 0.0% |
| Brazilian | 4 | 0.0% |
| British | 510 | 0.9% |
| Burmese | 197 | 0.3% |
| Canadian | 109 | 0.2% |
| Celtic | 5 | 0.0% |
| Central American | 254 | 0.4% |
| Cherokee | 220 | 0.4% |
| Chilean | 9 | 0.0% |
| Chippewa | 15 | 0.0% |
| Choctaw | 30 | 0.1% |
| Colombian | 22 | 0.0% |
| Croatian | 11 | 0.0% |
| Cuban | 150 | 0.3% |
| Czech | 96 | 0.2% |
| Czechoslovakian | 49 | 0.1% |
| Danish | 157 | 0.3% |
| Dutch | 352 | 0.6% |
| Eastern European | 39 | 0.1% |
| English | 9,617 | 16.8% |
| European | 1,405 | 2.5% |
| Finnish | 22 | 0.0% |
| French | 873 | 1.5% |
| French American Indian | 12 | 0.0% |
| French Canadian | 246 | 0.4% |
| German | 8,303 | 14.5% |
| Greek | 21 | 0.0% |
| Guatemalan | 167 | 0.3% |
| Honduran | 50 | 0.1% |
| Hungarian | 67 | 0.1% |
| Icelander | 7 | 0.0% |
| Indian (Asian) | 244 | 0.4% |
| Iraqi | 10 | 0.0% |
| Irish | 6,709 | 11.7% |
| Italian | 1,222 | 2.1% |
| Korean | 232 | 0.4% |
| Lebanese | 46 | 0.1% |
| Lumbee | 21 | 0.0% |
| Malaysian | 23 | 0.0% |
| Mexican | 1,673 | 2.9% |
| Mexican American Indian | 50 | 0.1% |
| Native Hawaiian | 10 | 0.0% |
| Navajo | 11 | 0.0% |
| Nigerian | 79 | 0.1% |
| Northern European | 12 | 0.0% |
| Norwegian | 229 | 0.4% |
| Polish | 773 | 1.3% |
| Portuguese | 53 | 0.1% |
| Puerto Rican | 320 | 0.6% |
| Romanian | 19 | 0.0% |
| Russian | 61 | 0.1% |
| Salvadoran | 37 | 0.1% |
| Scandinavian | 205 | 0.4% |
| Scotch-Irish | 1,488 | 2.6% |
| Scottish | 1,421 | 2.5% |
| Sioux | 12 | 0.0% |
| Slovak | 65 | 0.1% |
| South American | 72 | 0.1% |
| Spaniard | 67 | 0.1% |
| Sri Lankan | 55 | 0.1% |
| Subsaharan African | 141 | 0.3% |
| Swedish | 295 | 0.5% |
| Swiss | 91 | 0.2% |
| Thai | 43 | 0.1% |
| Ukrainian | 6 | 0.0% |
| Welsh | 665 | 1.2% | View All 77 Rows |
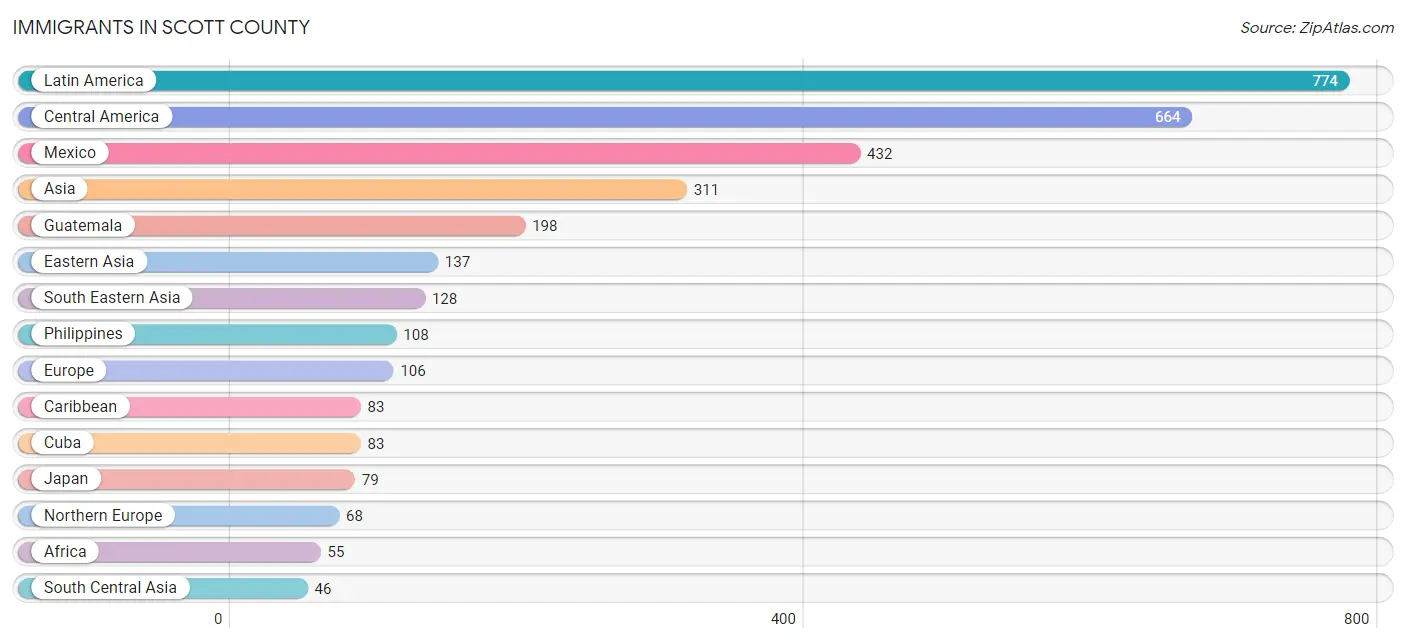
Immigrants in Scott County
The most numerous immigrant groups reported in Scott County came from Latin America (774 | 1.3%), Central America (664 | 1.2%), Mexico (432 | 0.7%), Asia (311 | 0.5%), and Guatemala (198 | 0.4%), together accounting for 4.2% of all Scott County residents.
| Immigration Origin | # Population | % Population |
| Afghanistan | 22 | 0.0% |
| Africa | 55 | 0.1% |
| Argentina | 14 | 0.0% |
| Asia | 311 | 0.5% |
| Australia | 18 | 0.0% |
| Brazil | 4 | 0.0% |
| Canada | 24 | 0.0% |
| Caribbean | 83 | 0.1% |
| Central America | 664 | 1.2% |
| Chile | 9 | 0.0% |
| China | 43 | 0.1% |
| Cuba | 83 | 0.1% |
| Czechoslovakia | 15 | 0.0% |
| Eastern Africa | 29 | 0.1% |
| Eastern Asia | 137 | 0.2% |
| Eastern Europe | 16 | 0.0% |
| El Salvador | 21 | 0.0% |
| England | 15 | 0.0% |
| Europe | 106 | 0.2% |
| France | 5 | 0.0% |
| Germany | 17 | 0.0% |
| Guatemala | 198 | 0.4% |
| Honduras | 13 | 0.0% |
| India | 17 | 0.0% |
| Ireland | 42 | 0.1% |
| Japan | 79 | 0.1% |
| Kenya | 17 | 0.0% |
| Korea | 15 | 0.0% |
| Latin America | 774 | 1.3% |
| Mexico | 432 | 0.7% |
| Middle Africa | 26 | 0.1% |
| Nepal | 7 | 0.0% |
| Northern Europe | 68 | 0.1% |
| Oceania | 18 | 0.0% |
| Philippines | 108 | 0.2% |
| South America | 27 | 0.1% |
| South Central Asia | 46 | 0.1% |
| South Eastern Asia | 128 | 0.2% |
| Ukraine | 1 | 0.0% |
| Vietnam | 20 | 0.0% |
| Western Europe | 22 | 0.0% |
| Zaire | 26 | 0.1% | View All 42 Rows |
Sex and Age in Scott County
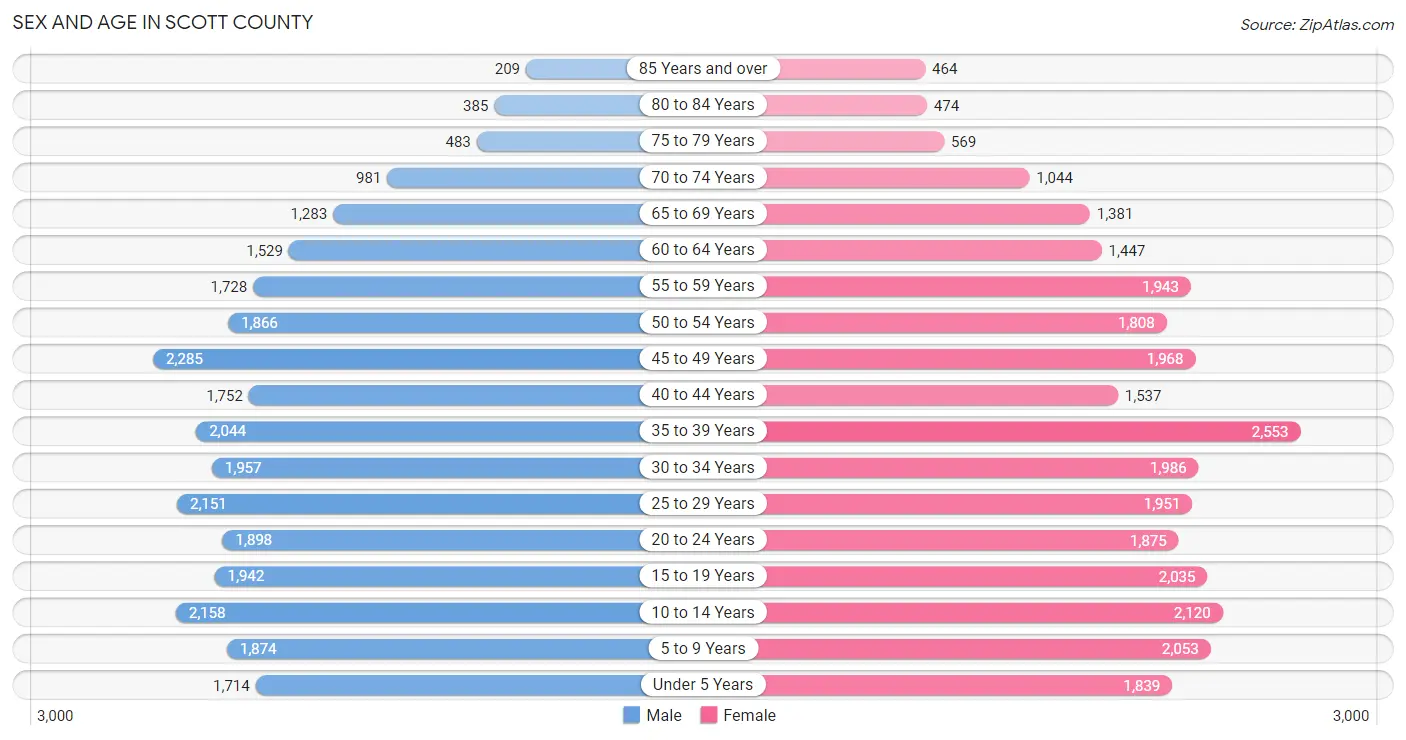
Sex and Age in Scott County
The most populous age groups in Scott County are 45 to 49 Years (2,285 | 8.1%) for men and 35 to 39 Years (2,553 | 8.8%) for women.
| Age Bracket | Male | Female |
| Under 5 Years | 1,714 (6.1%) | 1,839 (6.3%) |
| 5 to 9 Years | 1,874 (6.6%) | 2,053 (7.1%) |
| 10 to 14 Years | 2,158 (7.6%) | 2,120 (7.3%) |
| 15 to 19 Years | 1,942 (6.9%) | 2,035 (7.0%) |
| 20 to 24 Years | 1,898 (6.7%) | 1,875 (6.5%) |
| 25 to 29 Years | 2,151 (7.6%) | 1,951 (6.7%) |
| 30 to 34 Years | 1,957 (6.9%) | 1,986 (6.8%) |
| 35 to 39 Years | 2,044 (7.2%) | 2,553 (8.8%) |
| 40 to 44 Years | 1,752 (6.2%) | 1,537 (5.3%) |
| 45 to 49 Years | 2,285 (8.1%) | 1,968 (6.8%) |
| 50 to 54 Years | 1,866 (6.6%) | 1,808 (6.2%) |
| 55 to 59 Years | 1,728 (6.1%) | 1,943 (6.7%) |
| 60 to 64 Years | 1,529 (5.4%) | 1,447 (5.0%) |
| 65 to 69 Years | 1,283 (4.5%) | 1,381 (4.8%) |
| 70 to 74 Years | 981 (3.5%) | 1,044 (3.6%) |
| 75 to 79 Years | 483 (1.7%) | 569 (2.0%) |
| 80 to 84 Years | 385 (1.4%) | 474 (1.6%) |
| 85 Years and over | 209 (0.7%) | 464 (1.6%) |
| Total | 28,239 (100.0%) | 29,047 (100.0%) |
Families and Households in Scott County
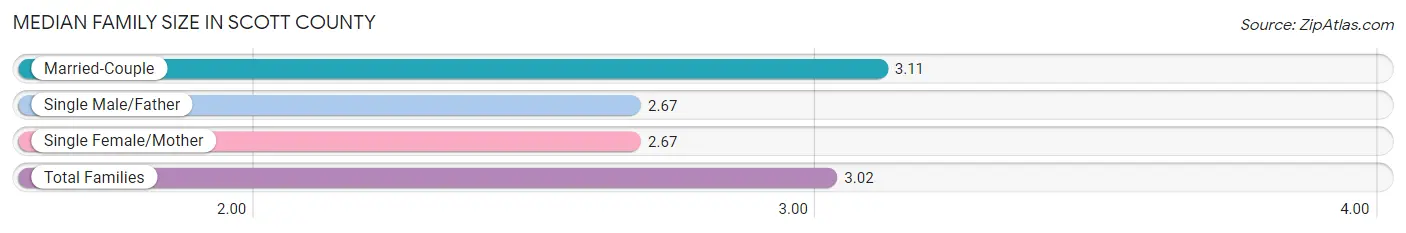
Median Family Size in Scott County
The median family size in Scott County is 3.02 persons per family, with married-couple families (12,051 | 77.9%) accounting for the largest median family size of 3.11 persons per family. On the other hand, single male/father families (975 | 6.3%) represent the smallest median family size with 2.67 persons per family.
| Family Type | # Families | Family Size |
| Married-Couple | 12,051 (77.9%) | 3.11 |
| Single Male/Father | 975 (6.3%) | 2.67 |
| Single Female/Mother | 2,436 (15.8%) | 2.67 |
| Total Families | 15,462 (100.0%) | 3.02 |
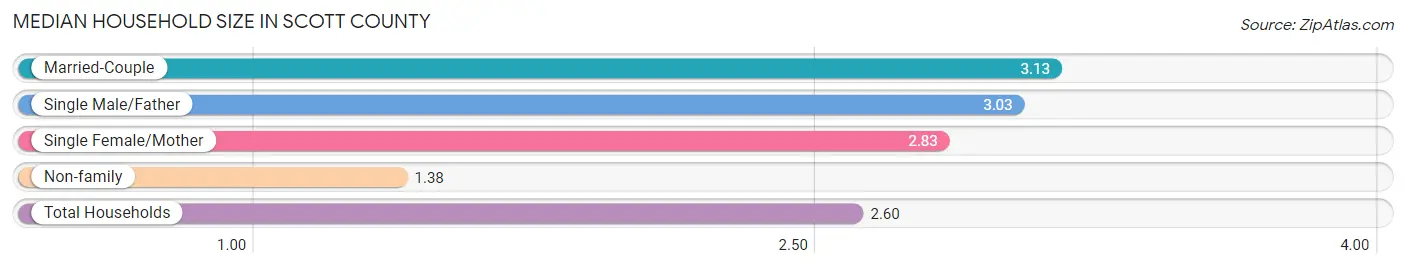
Median Household Size in Scott County
The median household size in Scott County is 2.60 persons per household, with married-couple households (12,051 | 55.8%) accounting for the largest median household size of 3.13 persons per household. non-family households (6,141 | 28.4%) represent the smallest median household size with 1.38 persons per household.
| Household Type | # Households | Household Size |
| Married-Couple | 12,051 (55.8%) | 3.13 |
| Single Male/Father | 975 (4.5%) | 3.03 |
| Single Female/Mother | 2,436 (11.3%) | 2.83 |
| Non-family | 6,141 (28.4%) | 1.38 |
| Total Households | 21,603 (100.0%) | 2.60 |
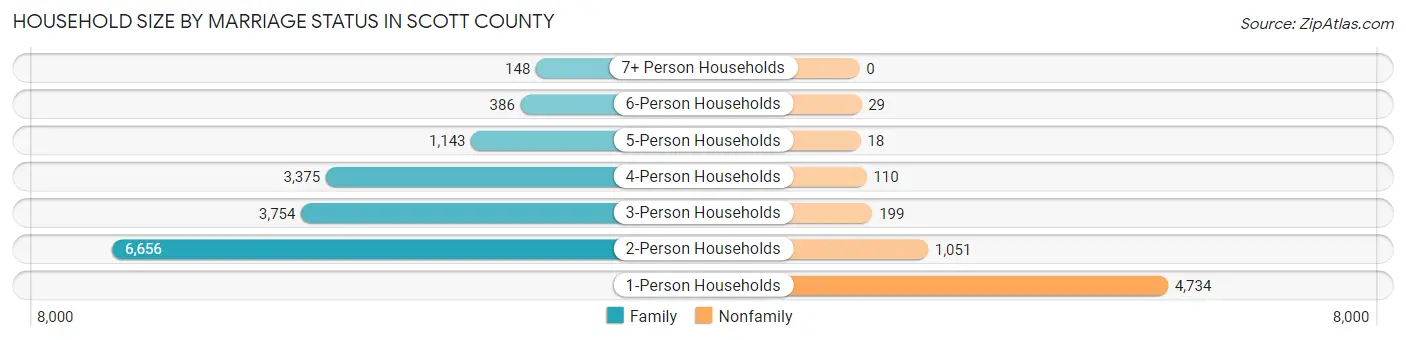
Household Size by Marriage Status in Scott County
Out of a total of 21,603 households in Scott County, 15,462 (71.6%) are family households, while 6,141 (28.4%) are nonfamily households. The most numerous type of family households are 2-person households, comprising 6,656, and the most common type of nonfamily households are 1-person households, comprising 4,734.
| Household Size | Family Households | Nonfamily Households |
| 1-Person Households | - | 4,734 (21.9%) |
| 2-Person Households | 6,656 (30.8%) | 1,051 (4.9%) |
| 3-Person Households | 3,754 (17.4%) | 199 (0.9%) |
| 4-Person Households | 3,375 (15.6%) | 110 (0.5%) |
| 5-Person Households | 1,143 (5.3%) | 18 (0.1%) |
| 6-Person Households | 386 (1.8%) | 29 (0.1%) |
| 7+ Person Households | 148 (0.7%) | 0 (0.0%) |
| Total | 15,462 (71.6%) | 6,141 (28.4%) |
Female Fertility in Scott County
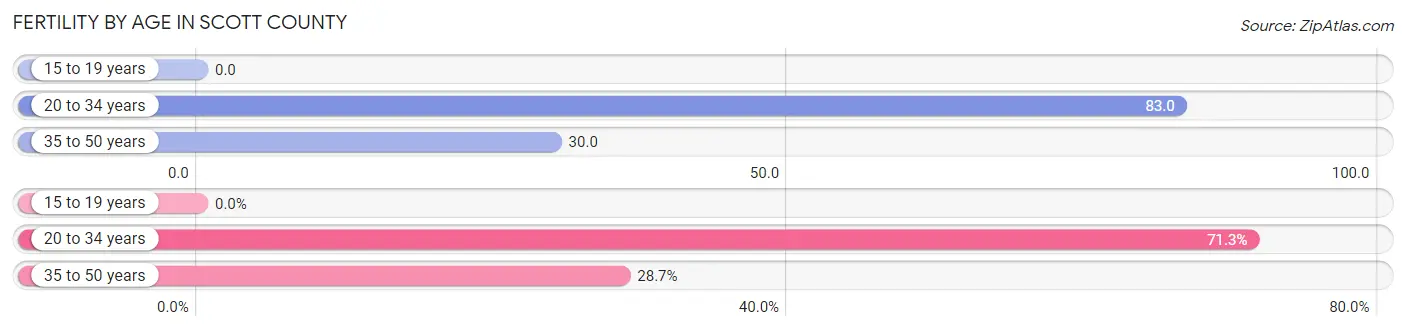
Fertility by Age in Scott County
Average fertility rate in Scott County is 47.0 births per 1,000 women. Women in the age bracket of 20 to 34 years have the highest fertility rate with 83.0 births per 1,000 women. Women in the age bracket of 20 to 34 years acount for 71.3% of all women with births.
| Age Bracket | Women with Births | Births / 1,000 Women |
| 15 to 19 years | 0 (0.0%) | 0.0 |
| 20 to 34 years | 483 (71.3%) | 83.0 |
| 35 to 50 years | 194 (28.7%) | 30.0 |
| Total | 677 (100.0%) | 47.0 |
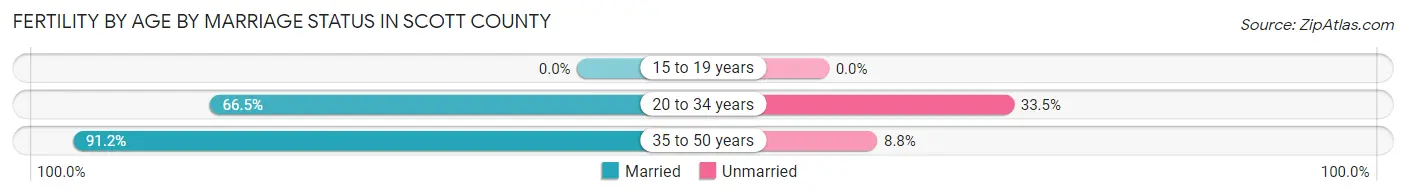
Fertility by Age by Marriage Status in Scott County
73.6% of women with births (677) in Scott County are married. The highest percentage of unmarried women with births falls into 20 to 34 years age bracket with 33.5% of them unmarried at the time of birth, while the lowest percentage of unmarried women with births belong to 35 to 50 years age bracket with 8.8% of them unmarried.
| Age Bracket | Married | Unmarried |
| 15 to 19 years | 0 (0.0%) | 0 (0.0%) |
| 20 to 34 years | 321 (66.5%) | 162 (33.5%) |
| 35 to 50 years | 177 (91.2%) | 17 (8.8%) |
| Total | 498 (73.6%) | 179 (26.4%) |
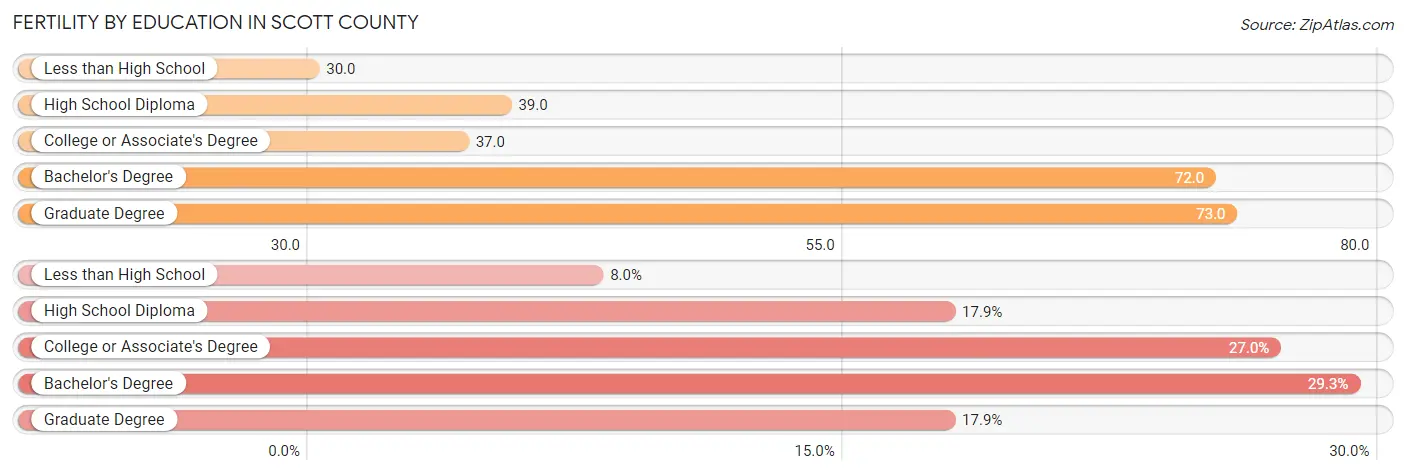
Fertility by Education in Scott County
Average fertility rate in Scott County is 47.0 births per 1,000 women. Women with the education attainment of graduate degree have the highest fertility rate of 73.0 births per 1,000 women, while women with the education attainment of less than high school have the lowest fertility at 30.0 births per 1,000 women. Women with the education attainment of bachelor's degree represent 29.2% of all women with births.
| Educational Attainment | Women with Births | Births / 1,000 Women |
| Less than High School | 54 (8.0%) | 30.0 |
| High School Diploma | 121 (17.9%) | 39.0 |
| College or Associate's Degree | 183 (27.0%) | 37.0 |
| Bachelor's Degree | 198 (29.2%) | 72.0 |
| Graduate Degree | 121 (17.9%) | 73.0 |
| Total | 677 (100.0%) | 47.0 |
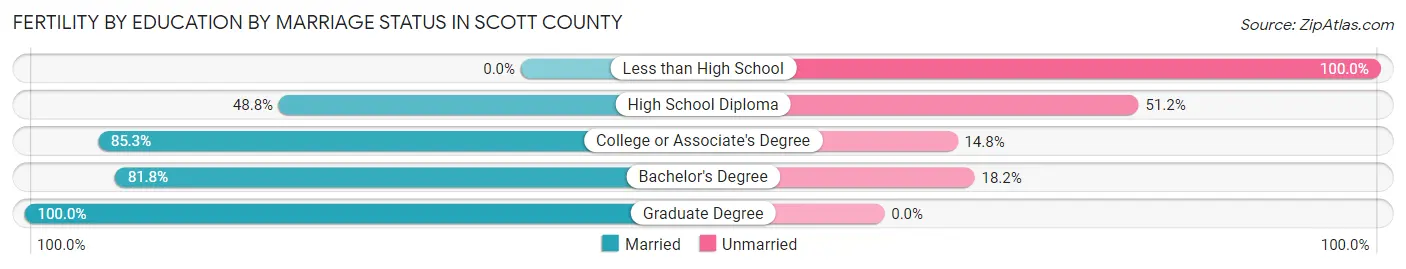
Fertility by Education by Marriage Status in Scott County
26.4% of women with births in Scott County are unmarried. Women with the educational attainment of graduate degree are most likely to be married with 100.0% of them married at childbirth, while women with the educational attainment of less than high school are least likely to be married with 100.0% of them unmarried at childbirth.
| Educational Attainment | Married | Unmarried |
| Less than High School | 0 (0.0%) | 54 (100.0%) |
| High School Diploma | 59 (48.8%) | 62 (51.2%) |
| College or Associate's Degree | 156 (85.3%) | 27 (14.7%) |
| Bachelor's Degree | 162 (81.8%) | 36 (18.2%) |
| Graduate Degree | 121 (100.0%) | 0 (0.0%) |
| Total | 498 (73.6%) | 179 (26.4%) |
Income in Scott County
Income Overview in Scott County
Per Capita Income in Scott County is $38,391, while median incomes of families and households are $94,286 and $80,782 respectively.
| Characteristic | Number | Measure |
| Per Capita Income | 57,286 | $38,391 |
| Median Family Income | 15,462 | $94,286 |
| Mean Family Income | 15,462 | $111,064 |
| Median Household Income | 21,603 | $80,782 |
| Mean Household Income | 21,603 | $99,498 |
| Income Deficit | 15,462 | $11,415 |
| Wage / Income Gap (%) | 57,286 | 36.94% |
| Wage / Income Gap ($) | 57,286 | 63.06¢ per $1 |
| Gini / Inequality Index | 57,286 | 0.40 |
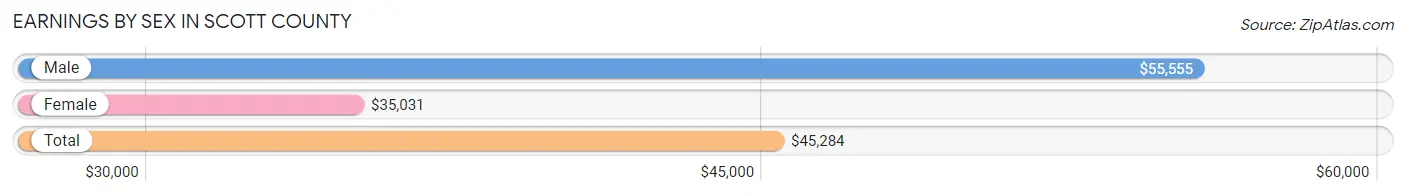
Earnings by Sex in Scott County
Average Earnings in Scott County are $45,284, $55,555 for men and $35,031 for women, a difference of 36.9%.
| Sex | Number | Average Earnings |
| Male | 16,963 (53.0%) | $55,555 |
| Female | 15,038 (47.0%) | $35,031 |
| Total | 32,001 (100.0%) | $45,284 |
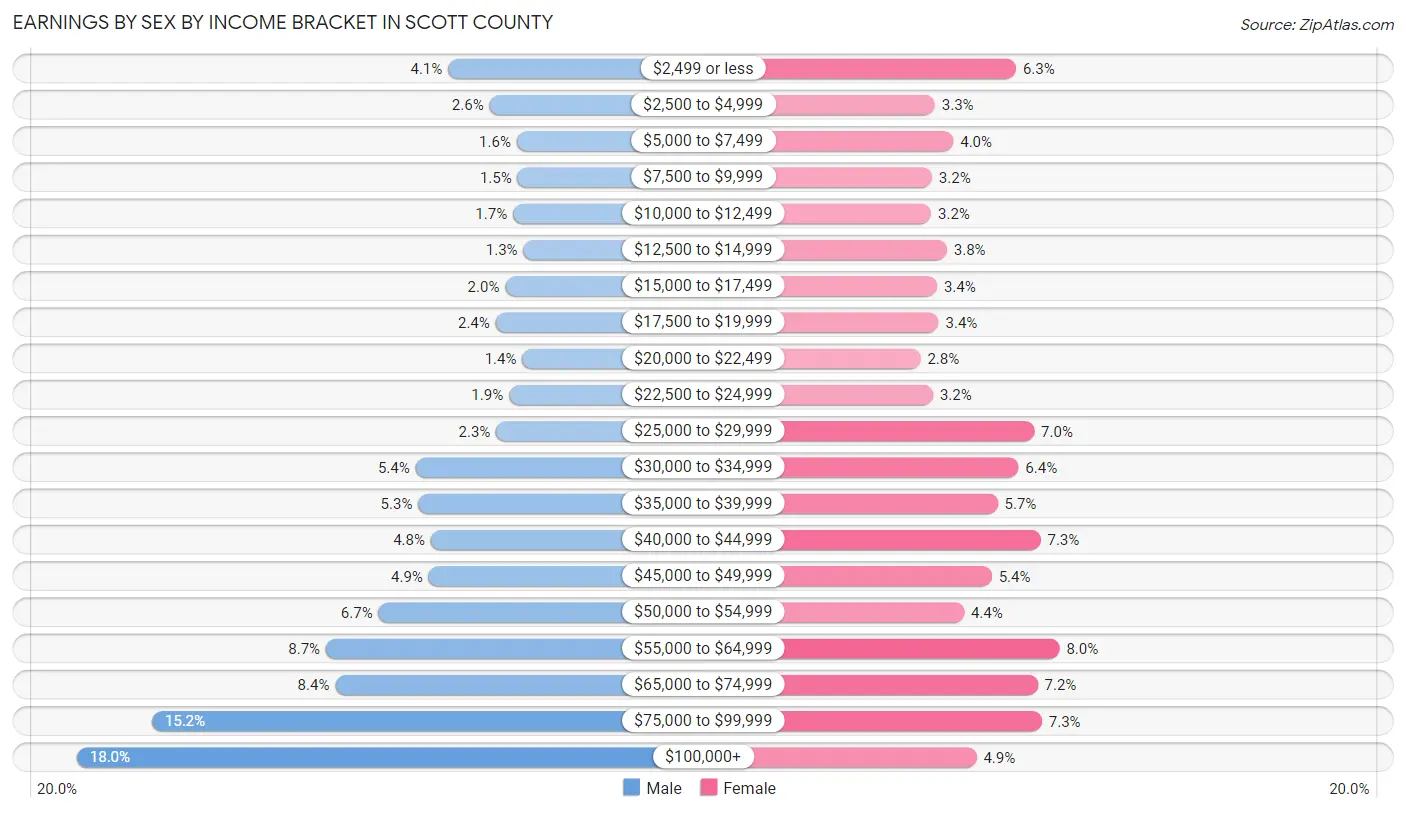
Earnings by Sex by Income Bracket in Scott County
The most common earnings brackets in Scott County are $100,000+ for men (3,060 | 18.0%) and $55,000 to $64,999 for women (1,199 | 8.0%).
| Income | Male | Female |
| $2,499 or less | 700 (4.1%) | 953 (6.3%) |
| $2,500 to $4,999 | 438 (2.6%) | 496 (3.3%) |
| $5,000 to $7,499 | 264 (1.6%) | 600 (4.0%) |
| $7,500 to $9,999 | 260 (1.5%) | 479 (3.2%) |
| $10,000 to $12,499 | 288 (1.7%) | 475 (3.2%) |
| $12,500 to $14,999 | 223 (1.3%) | 564 (3.7%) |
| $15,000 to $17,499 | 338 (2.0%) | 508 (3.4%) |
| $17,500 to $19,999 | 398 (2.4%) | 517 (3.4%) |
| $20,000 to $22,499 | 229 (1.3%) | 415 (2.8%) |
| $22,500 to $24,999 | 313 (1.8%) | 485 (3.2%) |
| $25,000 to $29,999 | 396 (2.3%) | 1,055 (7.0%) |
| $30,000 to $34,999 | 908 (5.3%) | 967 (6.4%) |
| $35,000 to $39,999 | 891 (5.2%) | 850 (5.7%) |
| $40,000 to $44,999 | 811 (4.8%) | 1,092 (7.3%) |
| $45,000 to $49,999 | 824 (4.9%) | 817 (5.4%) |
| $50,000 to $54,999 | 1,143 (6.7%) | 660 (4.4%) |
| $55,000 to $64,999 | 1,478 (8.7%) | 1,199 (8.0%) |
| $65,000 to $74,999 | 1,418 (8.4%) | 1,075 (7.1%) |
| $75,000 to $99,999 | 2,583 (15.2%) | 1,100 (7.3%) |
| $100,000+ | 3,060 (18.0%) | 731 (4.9%) |
| Total | 16,963 (100.0%) | 15,038 (100.0%) |
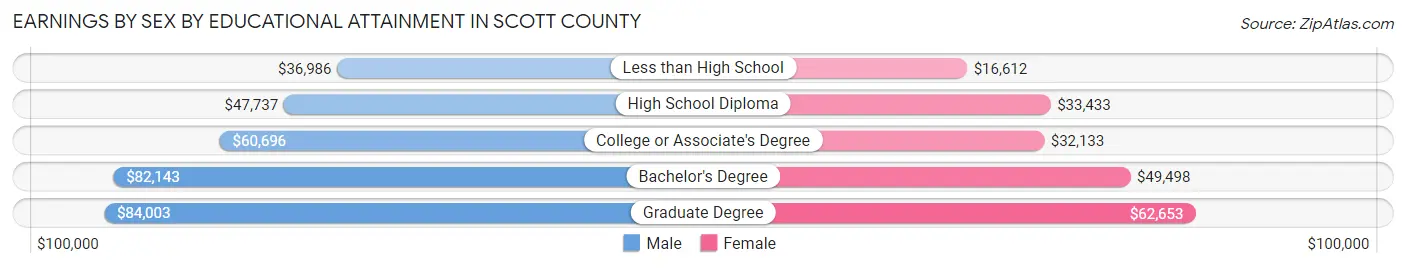
Earnings by Sex by Educational Attainment in Scott County
Average earnings in Scott County are $61,551 for men and $40,089 for women, a difference of 34.9%. Men with an educational attainment of graduate degree enjoy the highest average annual earnings of $84,003, while those with less than high school education earn the least with $36,986. Women with an educational attainment of graduate degree earn the most with the average annual earnings of $62,653, while those with less than high school education have the smallest earnings of $16,612.
| Educational Attainment | Male Income | Female Income |
| Less than High School | $36,986 | $16,612 |
| High School Diploma | $47,737 | $33,433 |
| College or Associate's Degree | $60,696 | $32,133 |
| Bachelor's Degree | $82,143 | $49,498 |
| Graduate Degree | $84,003 | $62,653 |
| Total | $61,551 | $40,089 |
Family Income in Scott County
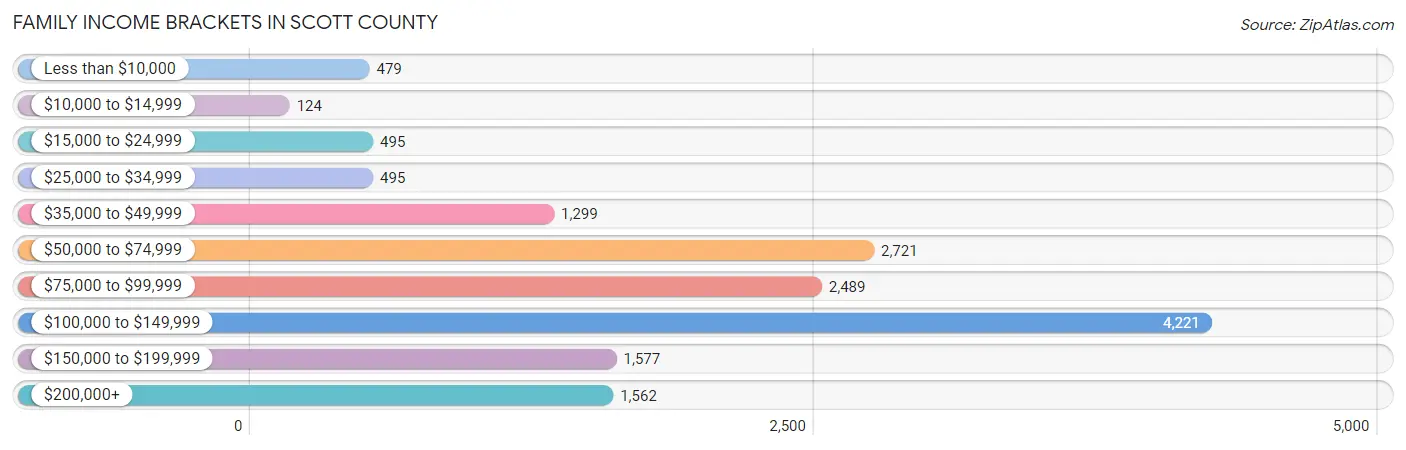
Family Income Brackets in Scott County
According to the Scott County family income data, there are 4,221 families falling into the $100,000 to $149,999 income range, which is the most common income bracket and makes up 27.3% of all families. Conversely, the $10,000 to $14,999 income bracket is the least frequent group with only 124 families (0.8%) belonging to this category.
| Income Bracket | # Families | % Families |
| Less than $10,000 | 479 | 3.1% |
| $10,000 to $14,999 | 124 | 0.8% |
| $15,000 to $24,999 | 495 | 3.2% |
| $25,000 to $34,999 | 495 | 3.2% |
| $35,000 to $49,999 | 1,299 | 8.4% |
| $50,000 to $74,999 | 2,721 | 17.6% |
| $75,000 to $99,999 | 2,489 | 16.1% |
| $100,000 to $149,999 | 4,221 | 27.3% |
| $150,000 to $199,999 | 1,577 | 10.2% |
| $200,000+ | 1,562 | 10.1% |
Family Income by Famaliy Size in Scott County
7+ person families (135 | 0.9%) account for the highest median family income in Scott County with $166,164 per family, while 2-person families (7,060 | 45.7%) have the highest median income of $42,671 per family member.

| Income Bracket | # Families | Median Income |
| 2-Person Families | 7,060 (45.7%) | $85,342 |
| 3-Person Families | 3,617 (23.4%) | $97,083 |
| 4-Person Families | 3,231 (20.9%) | $112,894 |
| 5-Person Families | 1,152 (7.4%) | $106,439 |
| 6-Person Families | 267 (1.7%) | $99,792 |
| 7+ Person Families | 135 (0.9%) | $166,164 |
| Total | 15,462 (100.0%) | $94,286 |
Family Income by Number of Earners in Scott County
The median family income in Scott County is $94,286, with families comprising 3+ earners (1,404) having the highest median family income of $146,154, while families with no earners (1,506) have the lowest median family income of $53,667, accounting for 9.1% and 9.7% of families, respectively.
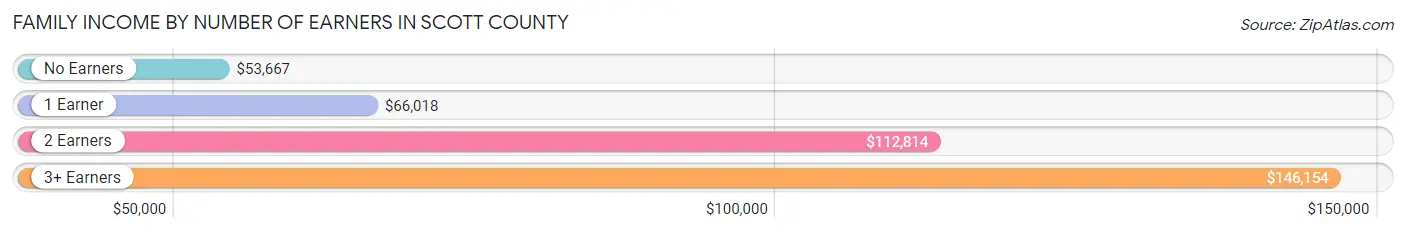
| Number of Earners | # Families | Median Income |
| No Earners | 1,506 (9.7%) | $53,667 |
| 1 Earner | 4,703 (30.4%) | $66,018 |
| 2 Earners | 7,849 (50.8%) | $112,814 |
| 3+ Earners | 1,404 (9.1%) | $146,154 |
| Total | 15,462 (100.0%) | $94,286 |
Household Income in Scott County
Household Income Brackets in Scott County
With 5,055 households falling in the category, the $100,000 to $149,999 income range is the most frequent in Scott County, accounting for 23.4% of all households. In contrast, only 475 households (2.2%) fall into the $10,000 to $14,999 income bracket, making it the least populous group.
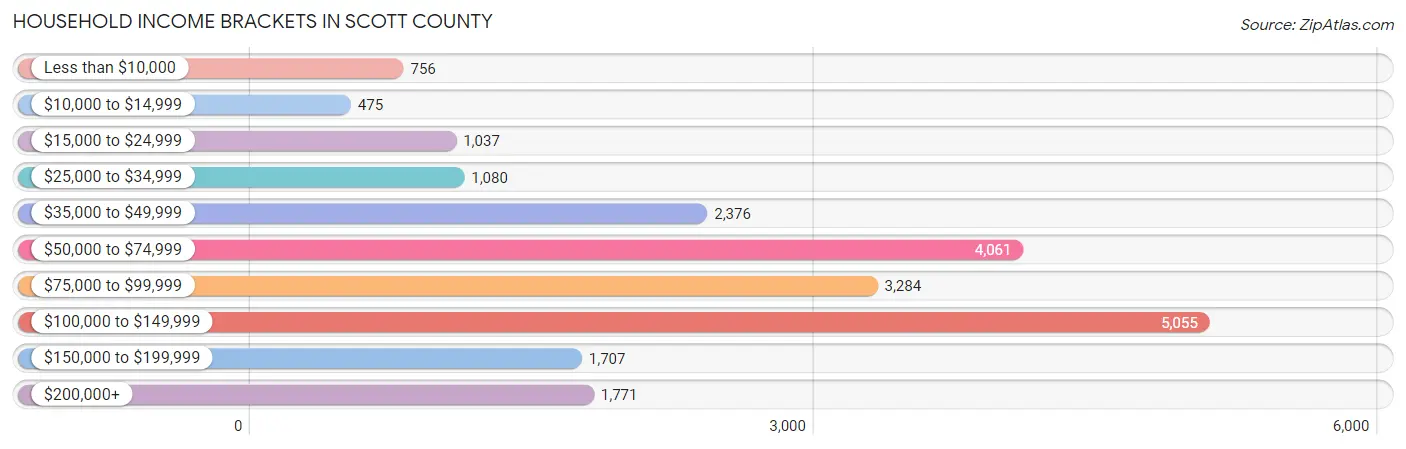
| Income Bracket | # Households | % Households |
| Less than $10,000 | 756 | 3.5% |
| $10,000 to $14,999 | 475 | 2.2% |
| $15,000 to $24,999 | 1,037 | 4.8% |
| $25,000 to $34,999 | 1,080 | 5.0% |
| $35,000 to $49,999 | 2,376 | 11.0% |
| $50,000 to $74,999 | 4,061 | 18.8% |
| $75,000 to $99,999 | 3,284 | 15.2% |
| $100,000 to $149,999 | 5,055 | 23.4% |
| $150,000 to $199,999 | 1,707 | 7.9% |
| $200,000+ | 1,771 | 8.2% |
Household Income by Householder Age in Scott County
The median household income in Scott County is $80,782, with the highest median household income of $91,597 found in the 45 to 64 years age bracket for the primary householder. A total of 8,104 households (37.5%) fall into this category. Meanwhile, the 65+ years age bracket for the primary householder has the lowest median household income of $56,744, with 4,537 households (21.0%) in this group.
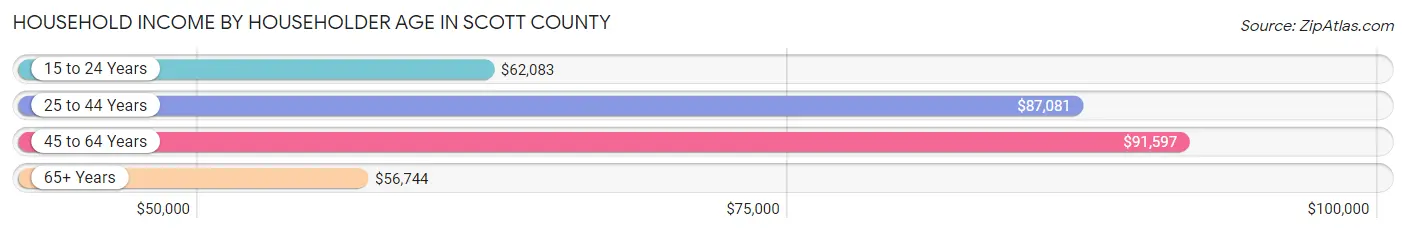
| Income Bracket | # Households | Median Income |
| 15 to 24 Years | 1,104 (5.1%) | $62,083 |
| 25 to 44 Years | 7,858 (36.4%) | $87,081 |
| 45 to 64 Years | 8,104 (37.5%) | $91,597 |
| 65+ Years | 4,537 (21.0%) | $56,744 |
| Total | 21,603 (100.0%) | $80,782 |
Poverty in Scott County
Income Below Poverty by Sex and Age in Scott County
With 7.8% poverty level for males and 10.7% for females among the residents of Scott County, 15 year old males and 18 to 24 year old females are the most vulnerable to poverty, with 159 males (26.3%) and 414 females (18.1%) in their respective age groups living below the poverty level.
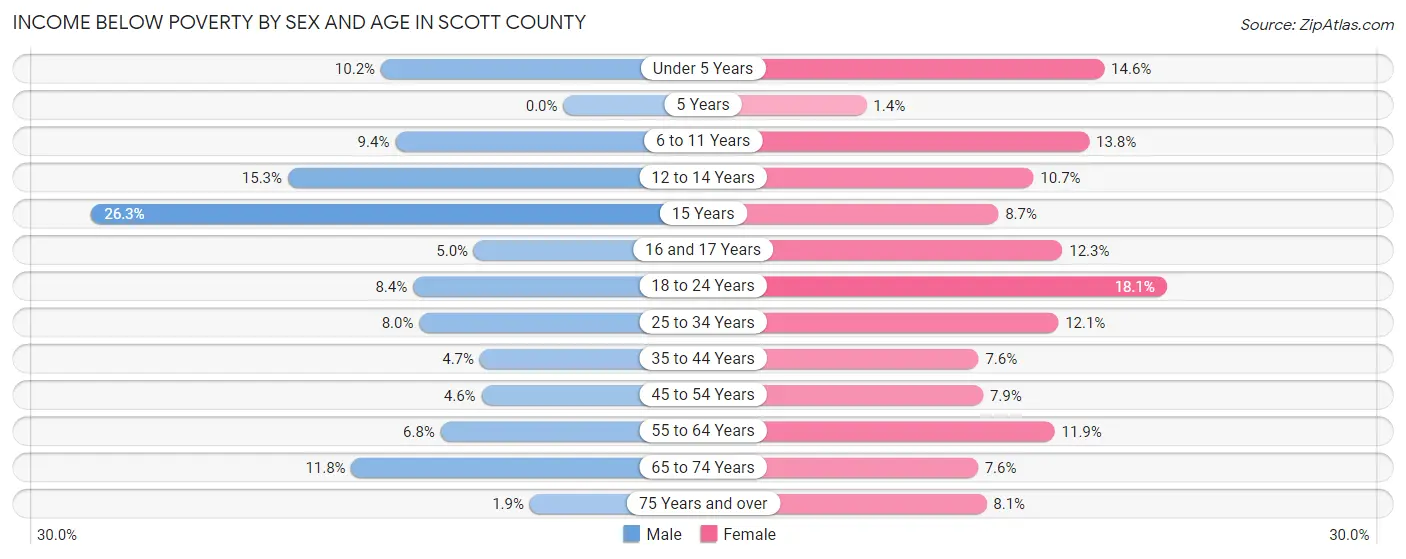
| Age Bracket | Male | Female |
| Under 5 Years | 170 (10.2%) | 262 (14.6%) |
| 5 Years | 0 (0.0%) | 8 (1.4%) |
| 6 to 11 Years | 209 (9.4%) | 288 (13.8%) |
| 12 to 14 Years | 202 (15.3%) | 144 (10.7%) |
| 15 Years | 159 (26.3%) | 44 (8.7%) |
| 16 and 17 Years | 28 (5.0%) | 83 (12.3%) |
| 18 to 24 Years | 186 (8.4%) | 414 (18.1%) |
| 25 to 34 Years | 329 (8.0%) | 473 (12.0%) |
| 35 to 44 Years | 175 (4.6%) | 311 (7.6%) |
| 45 to 54 Years | 189 (4.6%) | 296 (7.9%) |
| 55 to 64 Years | 222 (6.8%) | 399 (11.8%) |
| 65 to 74 Years | 266 (11.8%) | 181 (7.6%) |
| 75 Years and over | 20 (1.9%) | 115 (8.1%) |
| Total | 2,155 (7.8%) | 3,018 (10.7%) |
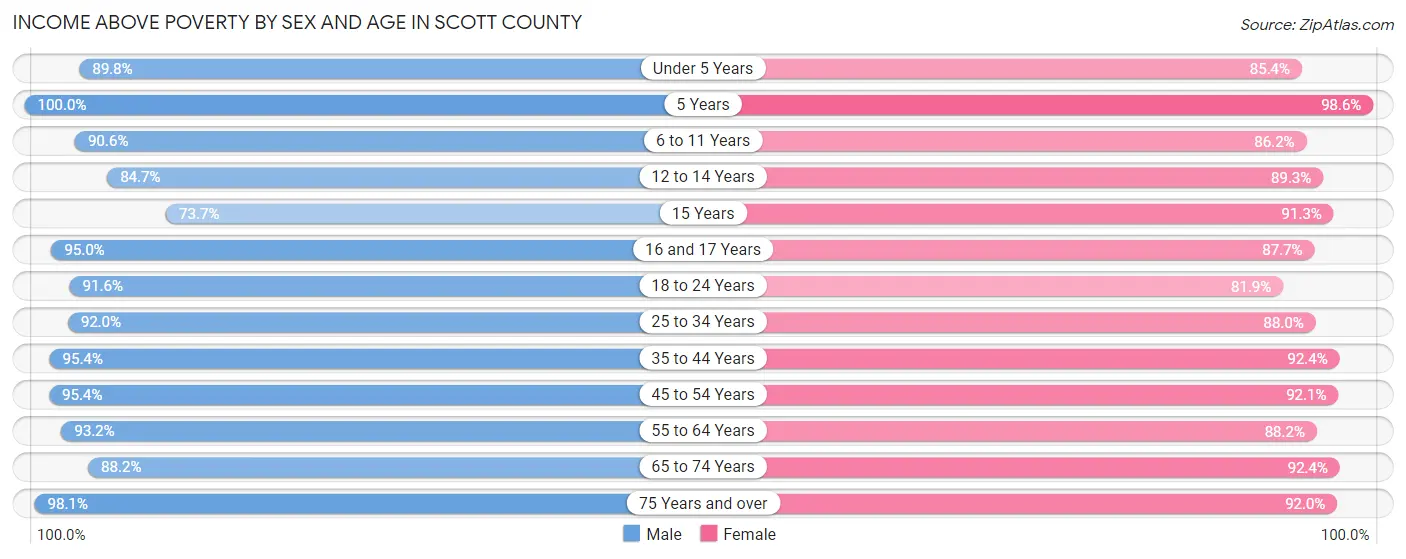
Income Above Poverty by Sex and Age in Scott County
According to the poverty statistics in Scott County, males aged 5 years and females aged 5 years are the age groups that are most secure financially, with 100.0% of males and 98.6% of females in these age groups living above the poverty line.
| Age Bracket | Male | Female |
| Under 5 Years | 1,503 (89.8%) | 1,531 (85.4%) |
| 5 Years | 284 (100.0%) | 575 (98.6%) |
| 6 to 11 Years | 2,025 (90.6%) | 1,803 (86.2%) |
| 12 to 14 Years | 1,115 (84.7%) | 1,205 (89.3%) |
| 15 Years | 446 (73.7%) | 461 (91.3%) |
| 16 and 17 Years | 534 (95.0%) | 593 (87.7%) |
| 18 to 24 Years | 2,037 (91.6%) | 1,874 (81.9%) |
| 25 to 34 Years | 3,774 (92.0%) | 3,453 (87.9%) |
| 35 to 44 Years | 3,586 (95.4%) | 3,774 (92.4%) |
| 45 to 54 Years | 3,954 (95.4%) | 3,468 (92.1%) |
| 55 to 64 Years | 3,029 (93.2%) | 2,968 (88.1%) |
| 65 to 74 Years | 1,989 (88.2%) | 2,210 (92.4%) |
| 75 Years and over | 1,050 (98.1%) | 1,313 (91.9%) |
| Total | 25,326 (92.2%) | 25,228 (89.3%) |
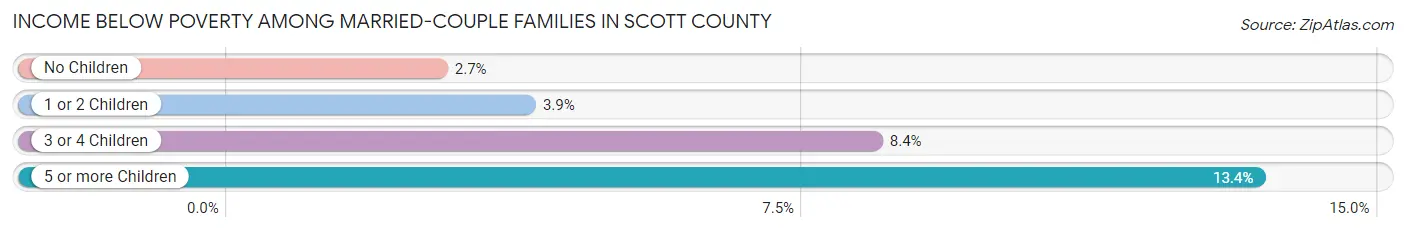
Income Below Poverty Among Married-Couple Families in Scott County
The poverty statistics for married-couple families in Scott County show that 3.7% or 444 of the total 12,051 families live below the poverty line. Families with 5 or more children have the highest poverty rate of 13.4%, comprising of 11 families. On the other hand, families with no children have the lowest poverty rate of 2.7%, which includes 177 families.
| Children | Above Poverty | Below Poverty |
| No Children | 6,276 (97.3%) | 177 (2.7%) |
| 1 or 2 Children | 4,423 (96.1%) | 179 (3.9%) |
| 3 or 4 Children | 837 (91.6%) | 77 (8.4%) |
| 5 or more Children | 71 (86.6%) | 11 (13.4%) |
| Total | 11,607 (96.3%) | 444 (3.7%) |
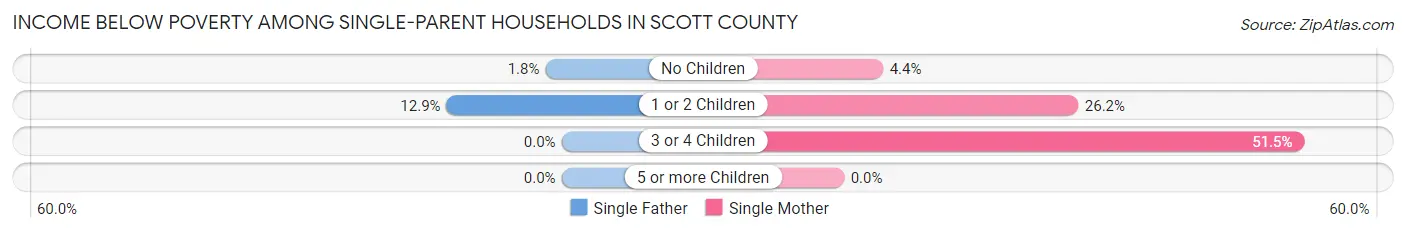
Income Below Poverty Among Single-Parent Households in Scott County
According to the poverty data in Scott County, 6.5% or 63 single-father households and 21.9% or 534 single-mother households are living below the poverty line. Among single-father households, those with 1 or 2 children have the highest poverty rate, with 54 households (12.9%) experiencing poverty. Likewise, among single-mother households, those with 3 or 4 children have the highest poverty rate, with 105 households (51.5%) falling below the poverty line.
| Children | Single Father | Single Mother |
| No Children | 9 (1.8%) | 31 (4.4%) |
| 1 or 2 Children | 54 (12.9%) | 398 (26.2%) |
| 3 or 4 Children | 0 (0.0%) | 105 (51.5%) |
| 5 or more Children | 0 (0.0%) | 0 (0.0%) |
| Total | 63 (6.5%) | 534 (21.9%) |
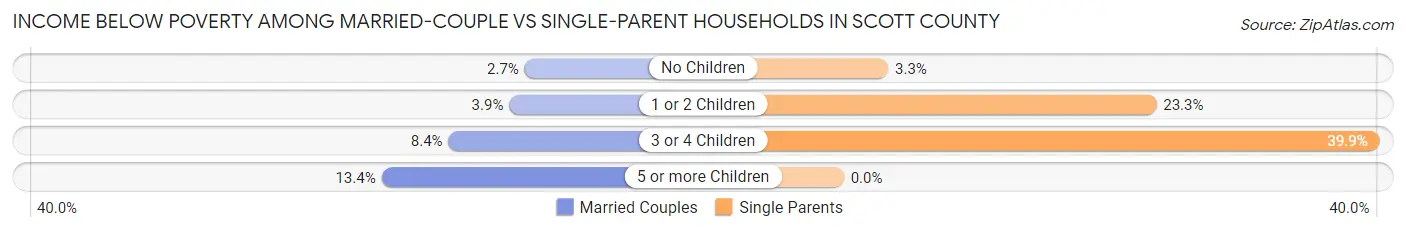
Income Below Poverty Among Married-Couple vs Single-Parent Households in Scott County
The poverty data for Scott County shows that 444 of the married-couple family households (3.7%) and 597 of the single-parent households (17.5%) are living below the poverty level. Within the married-couple family households, those with 5 or more children have the highest poverty rate, with 11 households (13.4%) falling below the poverty line. Among the single-parent households, those with 3 or 4 children have the highest poverty rate, with 105 household (39.9%) living below poverty.
| Children | Married-Couple Families | Single-Parent Households |
| No Children | 177 (2.7%) | 40 (3.3%) |
| 1 or 2 Children | 179 (3.9%) | 452 (23.3%) |
| 3 or 4 Children | 77 (8.4%) | 105 (39.9%) |
| 5 or more Children | 11 (13.4%) | 0 (0.0%) |
| Total | 444 (3.7%) | 597 (17.5%) |
Employment Characteristics in Scott County
Employment by Class of Employer in Scott County
Among the 28,795 employed individuals in Scott County, private company employees (20,768 | 72.1%), local government employees (1,961 | 6.8%), and state government employees (1,749 | 6.1%) make up the most common classes of employment.
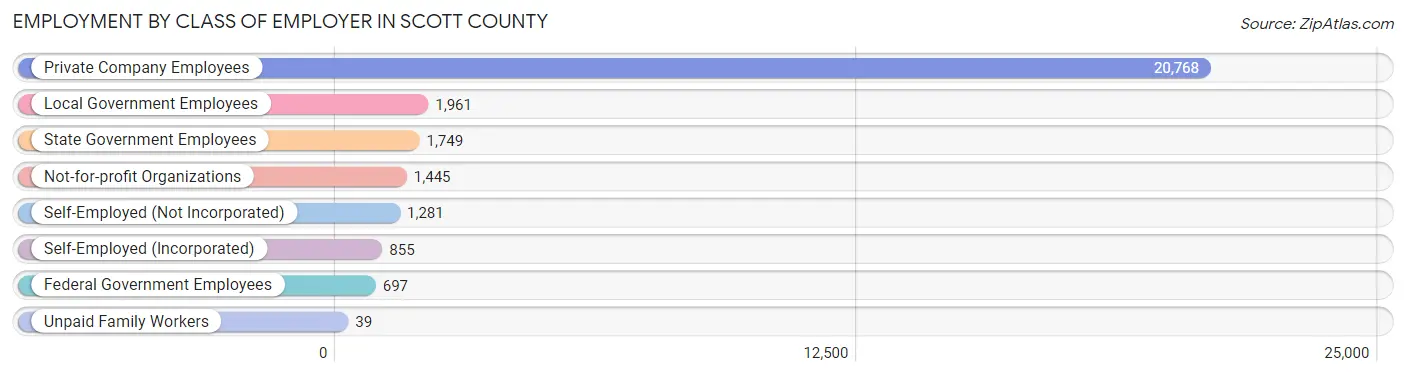
| Employer Class | # Employees | % Employees |
| Private Company Employees | 20,768 | 72.1% |
| Self-Employed (Incorporated) | 855 | 3.0% |
| Self-Employed (Not Incorporated) | 1,281 | 4.4% |
| Not-for-profit Organizations | 1,445 | 5.0% |
| Local Government Employees | 1,961 | 6.8% |
| State Government Employees | 1,749 | 6.1% |
| Federal Government Employees | 697 | 2.4% |
| Unpaid Family Workers | 39 | 0.1% |
| Total | 28,795 | 100.0% |
Employment Status by Age in Scott County
According to the labor force statistics for Scott County, out of the total population over 16 years of age (44,418), 68.8% or 30,560 individuals are in the labor force, with 3.7% or 1,131 of them unemployed. The age group with the highest labor force participation rate is 35 to 44 years, with 89.1% or 7,026 individuals in the labor force. Within the labor force, the 16 to 19 years age range has the highest percentage of unemployed individuals, with 6.7% or 85 of them being unemployed.
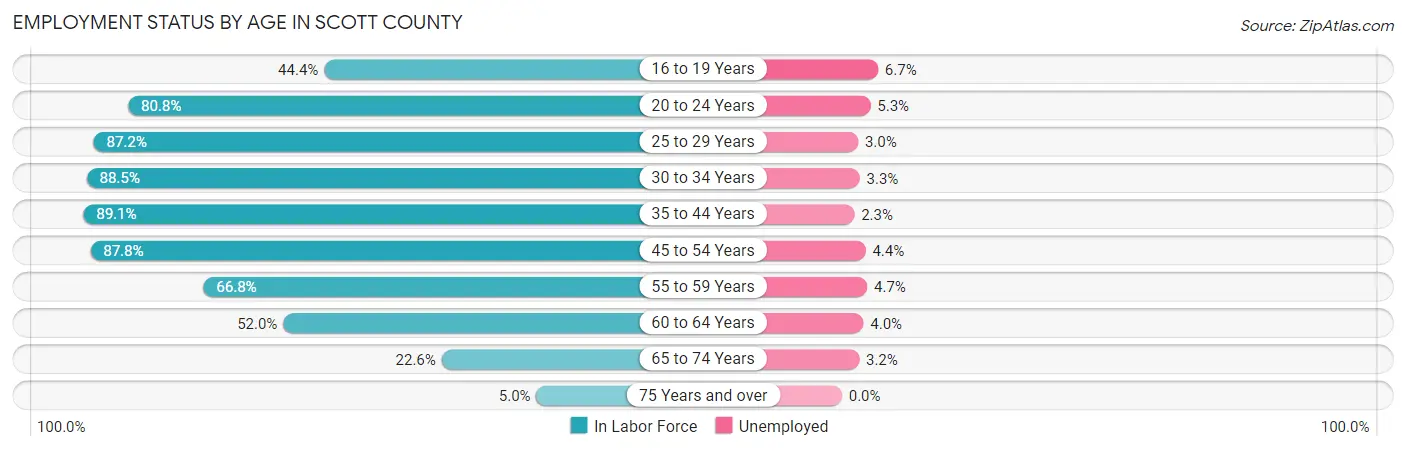
| Age Bracket | In Labor Force | Unemployed |
| 16 to 19 Years | 1,273 (44.4%) | 85 (6.7%) |
| 20 to 24 Years | 3,049 (80.8%) | 162 (5.3%) |
| 25 to 29 Years | 3,577 (87.2%) | 107 (3.0%) |
| 30 to 34 Years | 3,490 (88.5%) | 115 (3.3%) |
| 35 to 44 Years | 7,026 (89.1%) | 162 (2.3%) |
| 45 to 54 Years | 6,960 (87.8%) | 306 (4.4%) |
| 55 to 59 Years | 2,452 (66.8%) | 115 (4.7%) |
| 60 to 64 Years | 1,548 (52.0%) | 62 (4.0%) |
| 65 to 74 Years | 1,060 (22.6%) | 34 (3.2%) |
| 75 Years and over | 129 (5.0%) | 0 (0.0%) |
| Total | 30,560 (68.8%) | 1,131 (3.7%) |
Employment Status by Educational Attainment in Scott County
According to labor force statistics for Scott County, 82.1% of individuals (25,045) out of the total population between 25 and 64 years of age (30,505) are in the labor force, with 3.4% or 852 of them being unemployed. The group with the highest labor force participation rate are those with the educational attainment of bachelor's degree or higher, with 87.0% or 8,671 individuals in the labor force. Within the labor force, individuals with high school diploma education have the highest percentage of unemployment, with 4.2% or 268 of them being unemployed.
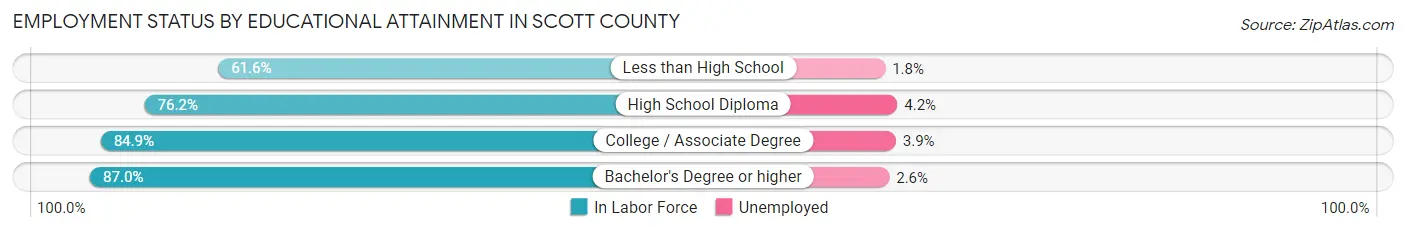
| Educational Attainment | In Labor Force | Unemployed |
| Less than High School | 875 (61.6%) | 26 (1.8%) |
| High School Diploma | 6,371 (76.2%) | 351 (4.2%) |
| College / Associate Degree | 9,132 (84.9%) | 419 (3.9%) |
| Bachelor's Degree or higher | 8,671 (87.0%) | 259 (2.6%) |
| Total | 25,045 (82.1%) | 1,037 (3.4%) |
Employment Occupations by Sex in Scott County
Management, Business, Science and Arts Occupations
The most common Management, Business, Science and Arts occupations in Scott County are Community & Social Service (2,928 | 10.0%), Management (2,925 | 10.0%), Computers, Engineering & Science (1,892 | 6.4%), Health Diagnosing & Treating (1,866 | 6.4%), and Education Instruction & Library (1,710 | 5.8%).
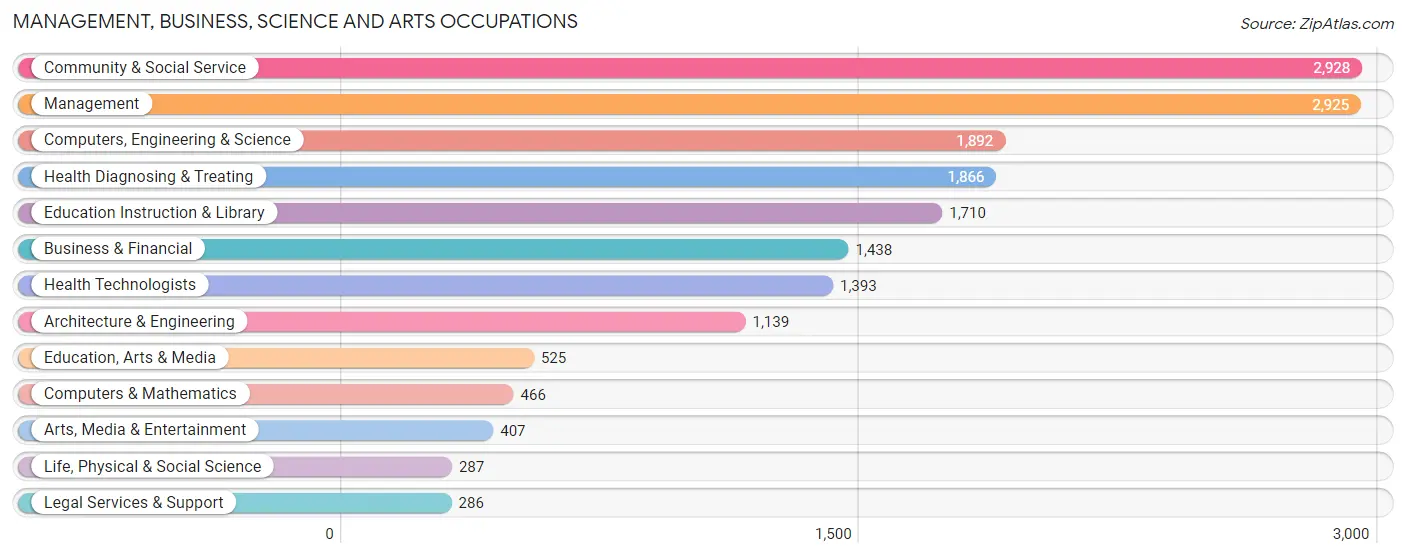
Management, Business, Science and Arts Occupations by Sex
Within the Management, Business, Science and Arts occupations in Scott County, the most male-oriented occupations are Computers & Mathematics (85.4%), Computers, Engineering & Science (73.3%), and Architecture & Engineering (73.1%), while the most female-oriented occupations are Health Diagnosing & Treating (81.3%), Education Instruction & Library (80.2%), and Health Technologists (78.9%).
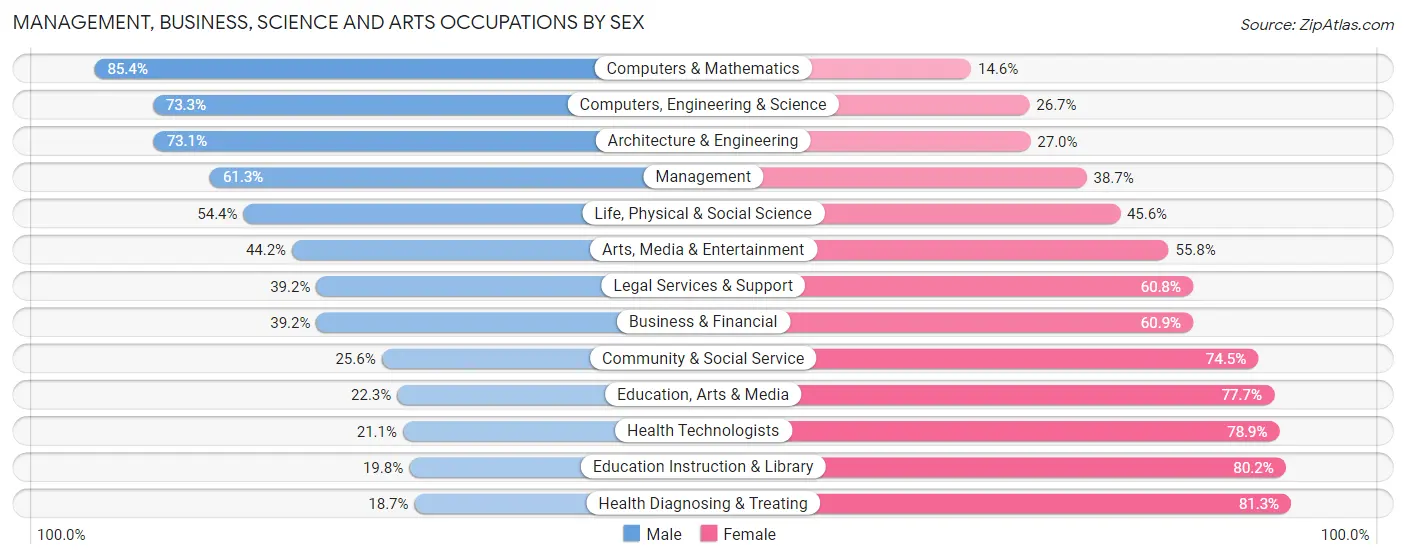
| Occupation | Male | Female |
| Management | 1,794 (61.3%) | 1,131 (38.7%) |
| Business & Financial | 563 (39.2%) | 875 (60.9%) |
| Computers, Engineering & Science | 1,386 (73.3%) | 506 (26.7%) |
| Computers & Mathematics | 398 (85.4%) | 68 (14.6%) |
| Architecture & Engineering | 832 (73.1%) | 307 (27.0%) |
| Life, Physical & Social Science | 156 (54.4%) | 131 (45.6%) |
| Community & Social Service | 748 (25.6%) | 2,180 (74.5%) |
| Education, Arts & Media | 117 (22.3%) | 408 (77.7%) |
| Legal Services & Support | 112 (39.2%) | 174 (60.8%) |
| Education Instruction & Library | 339 (19.8%) | 1,371 (80.2%) |
| Arts, Media & Entertainment | 180 (44.2%) | 227 (55.8%) |
| Health Diagnosing & Treating | 349 (18.7%) | 1,517 (81.3%) |
| Health Technologists | 294 (21.1%) | 1,099 (78.9%) |
| Total (Category) | 4,840 (43.8%) | 6,209 (56.2%) |
| Total (Overall) | 15,645 (53.2%) | 13,750 (46.8%) |
Services Occupations
The most common Services occupations in Scott County are Food Preparation & Serving (1,070 | 3.6%), Cleaning & Maintenance (766 | 2.6%), Security & Protection (739 | 2.5%), Personal Care & Service (696 | 2.4%), and Healthcare Support (603 | 2.1%).
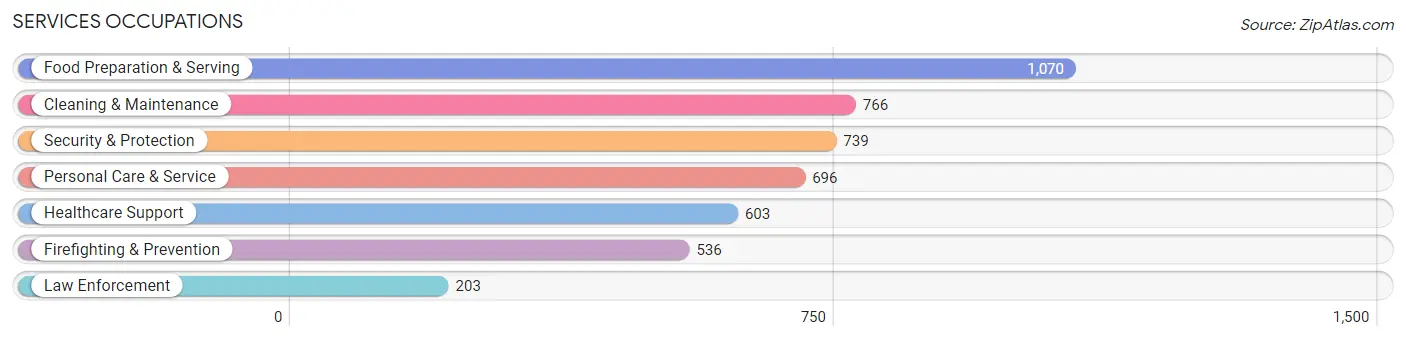
Services Occupations by Sex
Within the Services occupations in Scott County, the most male-oriented occupations are Law Enforcement (86.2%), Security & Protection (75.6%), and Firefighting & Prevention (71.6%), while the most female-oriented occupations are Personal Care & Service (89.2%), Healthcare Support (85.4%), and Food Preparation & Serving (64.9%).

| Occupation | Male | Female |
| Healthcare Support | 88 (14.6%) | 515 (85.4%) |
| Security & Protection | 559 (75.6%) | 180 (24.4%) |
| Firefighting & Prevention | 384 (71.6%) | 152 (28.4%) |
| Law Enforcement | 175 (86.2%) | 28 (13.8%) |
| Food Preparation & Serving | 375 (35.0%) | 695 (64.9%) |
| Cleaning & Maintenance | 432 (56.4%) | 334 (43.6%) |
| Personal Care & Service | 75 (10.8%) | 621 (89.2%) |
| Total (Category) | 1,529 (39.5%) | 2,345 (60.5%) |
| Total (Overall) | 15,645 (53.2%) | 13,750 (46.8%) |
Sales and Office Occupations
The most common Sales and Office occupations in Scott County are Office & Administration (3,039 | 10.3%), and Sales & Related (2,356 | 8.0%).

Sales and Office Occupations by Sex
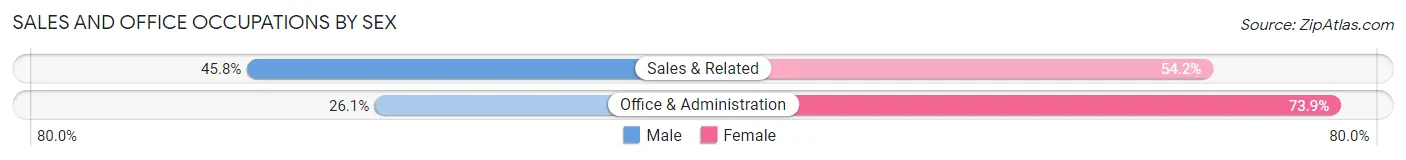
| Occupation | Male | Female |
| Sales & Related | 1,078 (45.8%) | 1,278 (54.2%) |
| Office & Administration | 793 (26.1%) | 2,246 (73.9%) |
| Total (Category) | 1,871 (34.7%) | 3,524 (65.3%) |
| Total (Overall) | 15,645 (53.2%) | 13,750 (46.8%) |
Natural Resources, Construction and Maintenance Occupations
The most common Natural Resources, Construction and Maintenance occupations in Scott County are Installation, Maintenance & Repair (1,039 | 3.5%), Construction & Extraction (977 | 3.3%), and Farming, Fishing & Forestry (98 | 0.3%).
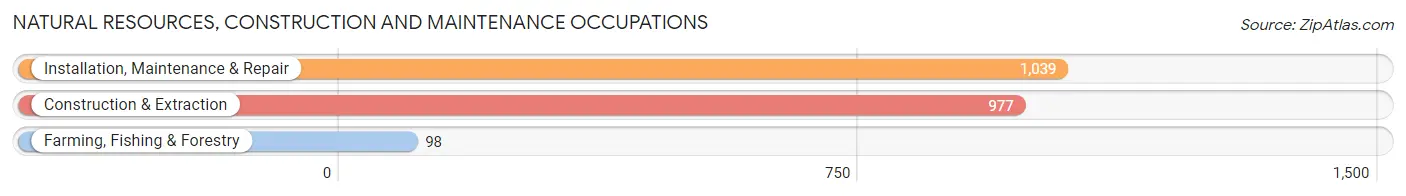
Natural Resources, Construction and Maintenance Occupations by Sex
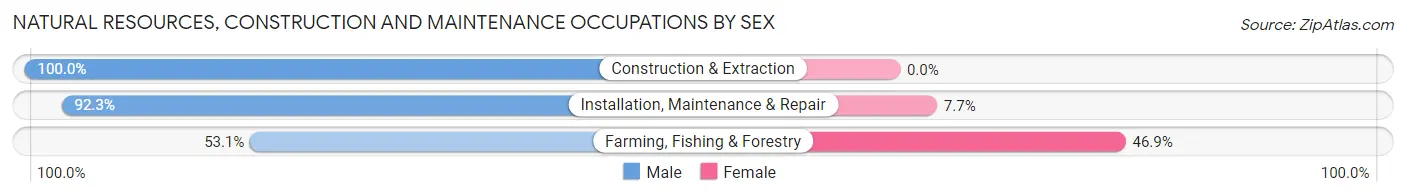
| Occupation | Male | Female |
| Farming, Fishing & Forestry | 52 (53.1%) | 46 (46.9%) |
| Construction & Extraction | 977 (100.0%) | 0 (0.0%) |
| Installation, Maintenance & Repair | 959 (92.3%) | 80 (7.7%) |
| Total (Category) | 1,988 (94.0%) | 126 (6.0%) |
| Total (Overall) | 15,645 (53.2%) | 13,750 (46.8%) |
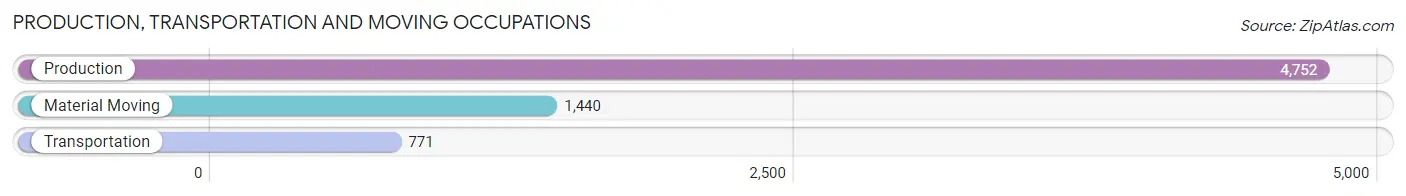
Production, Transportation and Moving Occupations
The most common Production, Transportation and Moving occupations in Scott County are Production (4,752 | 16.2%), Material Moving (1,440 | 4.9%), and Transportation (771 | 2.6%).
Production, Transportation and Moving Occupations by Sex
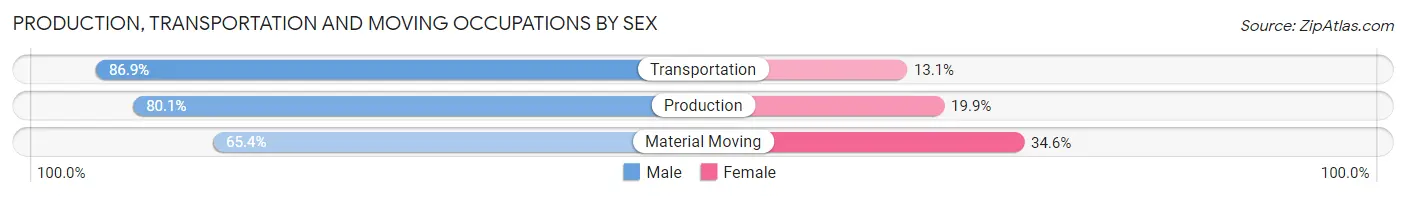
| Occupation | Male | Female |
| Production | 3,805 (80.1%) | 947 (19.9%) |
| Transportation | 670 (86.9%) | 101 (13.1%) |
| Material Moving | 942 (65.4%) | 498 (34.6%) |
| Total (Category) | 5,417 (77.8%) | 1,546 (22.2%) |
| Total (Overall) | 15,645 (53.2%) | 13,750 (46.8%) |
Employment Industries by Sex in Scott County
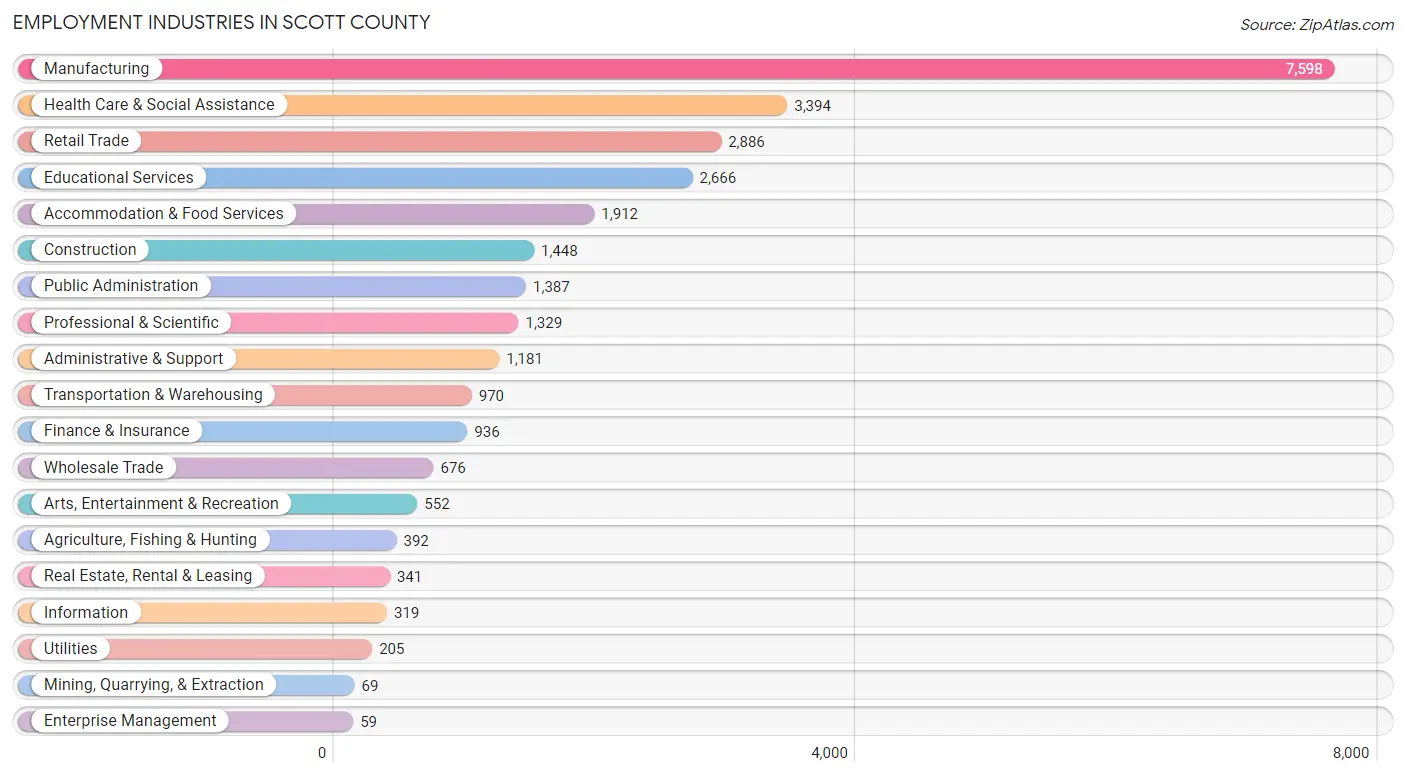
Employment Industries in Scott County
The major employment industries in Scott County include Manufacturing (7,598 | 25.9%), Health Care & Social Assistance (3,394 | 11.6%), Retail Trade (2,886 | 9.8%), Educational Services (2,666 | 9.1%), and Accommodation & Food Services (1,912 | 6.5%).
Employment Industries by Sex in Scott County
The Scott County industries that see more men than women are Construction (97.4%), Mining, Quarrying, & Extraction (85.5%), and Manufacturing (76.3%), whereas the industries that tend to have a higher number of women are Enterprise Management (100.0%), Health Care & Social Assistance (82.6%), and Educational Services (73.0%).
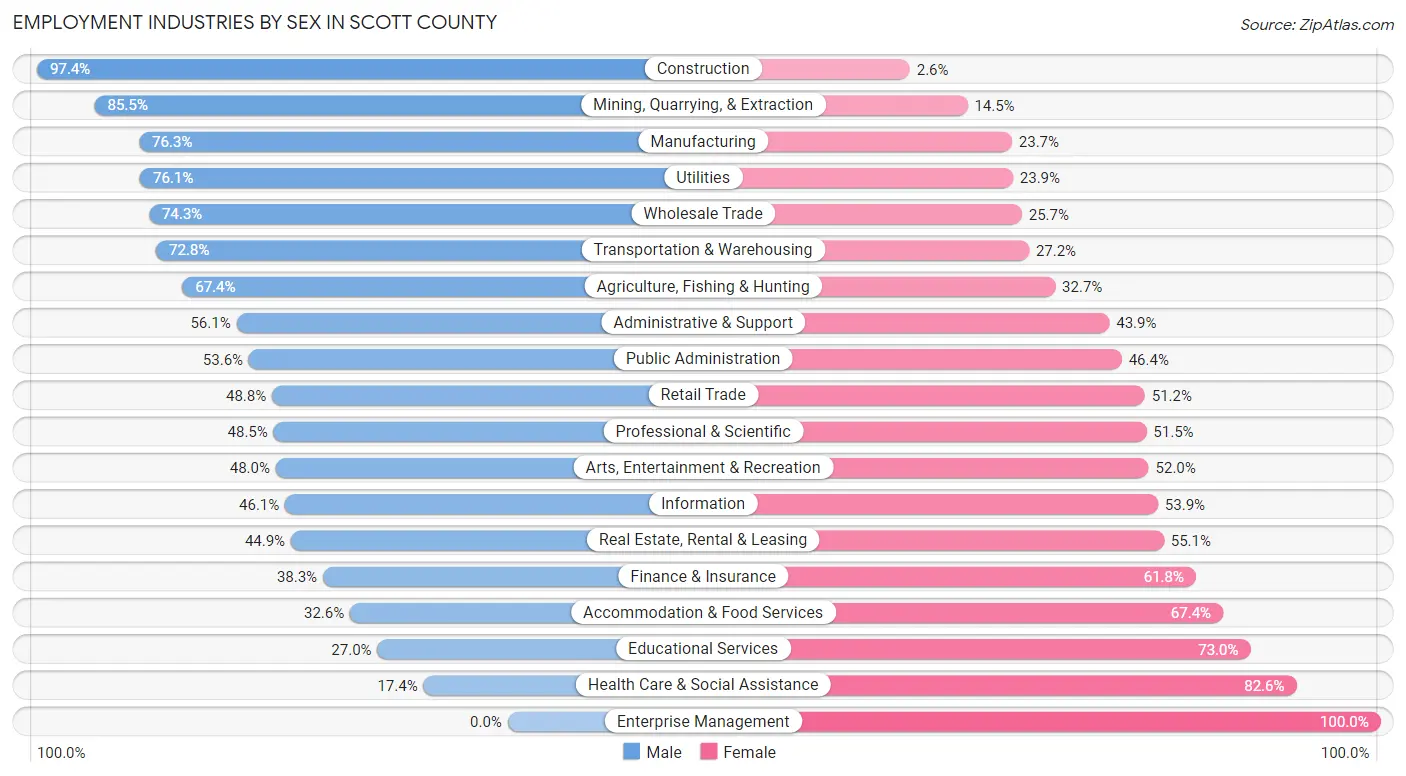
| Industry | Male | Female |
| Agriculture, Fishing & Hunting | 264 (67.3%) | 128 (32.7%) |
| Mining, Quarrying, & Extraction | 59 (85.5%) | 10 (14.5%) |
| Construction | 1,411 (97.4%) | 37 (2.6%) |
| Manufacturing | 5,798 (76.3%) | 1,800 (23.7%) |
| Wholesale Trade | 502 (74.3%) | 174 (25.7%) |
| Retail Trade | 1,408 (48.8%) | 1,478 (51.2%) |
| Transportation & Warehousing | 706 (72.8%) | 264 (27.2%) |
| Utilities | 156 (76.1%) | 49 (23.9%) |
| Information | 147 (46.1%) | 172 (53.9%) |
| Finance & Insurance | 358 (38.3%) | 578 (61.8%) |
| Real Estate, Rental & Leasing | 153 (44.9%) | 188 (55.1%) |
| Professional & Scientific | 644 (48.5%) | 685 (51.5%) |
| Enterprise Management | 0 (0.0%) | 59 (100.0%) |
| Administrative & Support | 663 (56.1%) | 518 (43.9%) |
| Educational Services | 719 (27.0%) | 1,947 (73.0%) |
| Health Care & Social Assistance | 592 (17.4%) | 2,802 (82.6%) |
| Arts, Entertainment & Recreation | 265 (48.0%) | 287 (52.0%) |
| Accommodation & Food Services | 624 (32.6%) | 1,288 (67.4%) |
| Public Administration | 743 (53.6%) | 644 (46.4%) |
| Total | 15,645 (53.2%) | 13,750 (46.8%) |
Education in Scott County
School Enrollment in Scott County
The most common levels of schooling among the 14,612 students in Scott County are middle school (3,579 | 24.5%), elementary school (3,097 | 21.2%), and college / undergraduate (2,794 | 19.1%).
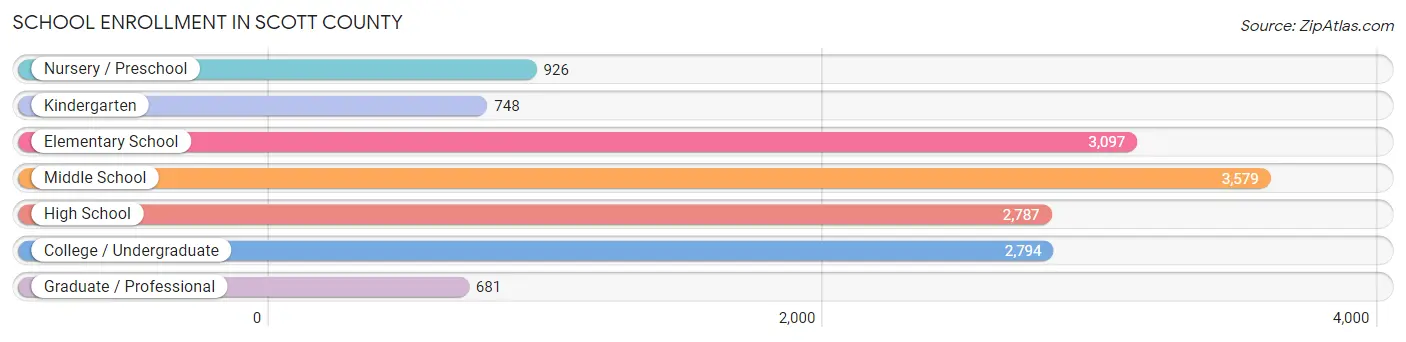
| School Level | # Students | % Students |
| Nursery / Preschool | 926 | 6.3% |
| Kindergarten | 748 | 5.1% |
| Elementary School | 3,097 | 21.2% |
| Middle School | 3,579 | 24.5% |
| High School | 2,787 | 19.1% |
| College / Undergraduate | 2,794 | 19.1% |
| Graduate / Professional | 681 | 4.7% |
| Total | 14,612 | 100.0% |
School Enrollment by Age by Funding Source in Scott County
Out of a total of 14,612 students who are enrolled in schools in Scott County, 3,010 (20.6%) attend a private institution, while the remaining 11,602 (79.4%) are enrolled in public schools. The age group of 3 to 4 year olds has the highest likelihood of being enrolled in private schools, with 394 (60.6% in the age bracket) enrolled. Conversely, the age group of 15 to 17 year olds has the lowest likelihood of being enrolled in a private school, with 2,035 (88.7% in the age bracket) attending a public institution.
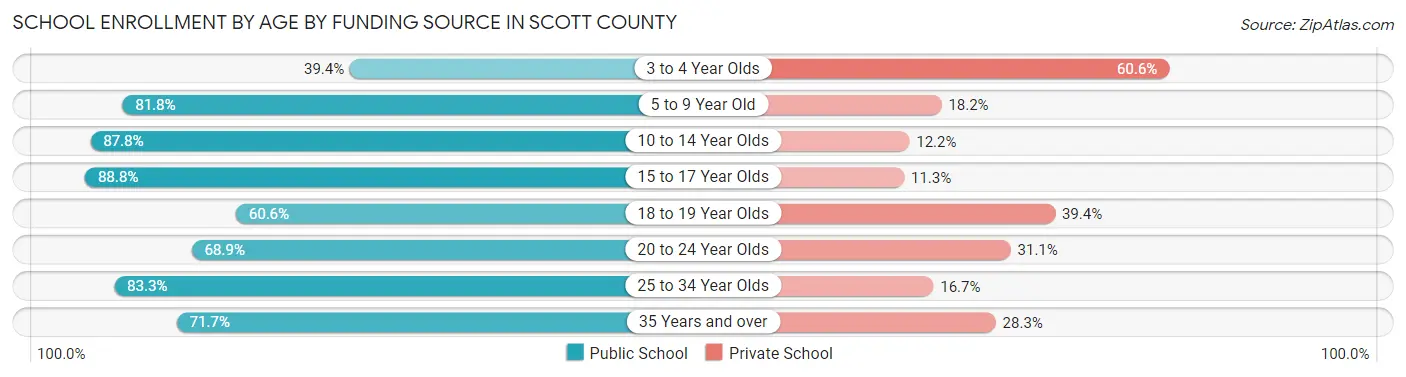
| Age Bracket | Public School | Private School |
| 3 to 4 Year Olds | 256 (39.4%) | 394 (60.6%) |
| 5 to 9 Year Old | 2,987 (81.8%) | 665 (18.2%) |
| 10 to 14 Year Olds | 3,680 (87.8%) | 513 (12.2%) |
| 15 to 17 Year Olds | 2,035 (88.7%) | 258 (11.3%) |
| 18 to 19 Year Olds | 809 (60.6%) | 525 (39.4%) |
| 20 to 24 Year Olds | 800 (68.9%) | 361 (31.1%) |
| 25 to 34 Year Olds | 604 (83.3%) | 121 (16.7%) |
| 35 Years and over | 433 (71.7%) | 171 (28.3%) |
| Total | 11,602 (79.4%) | 3,010 (20.6%) |
Educational Attainment by Field of Study in Scott County
Business (2,488 | 19.7%), education (1,881 | 14.9%), science & technology (1,333 | 10.6%), engineering (1,005 | 8.0%), and social sciences (960 | 7.6%) are the most common fields of study among 12,614 individuals in Scott County who have obtained a bachelor's degree or higher.
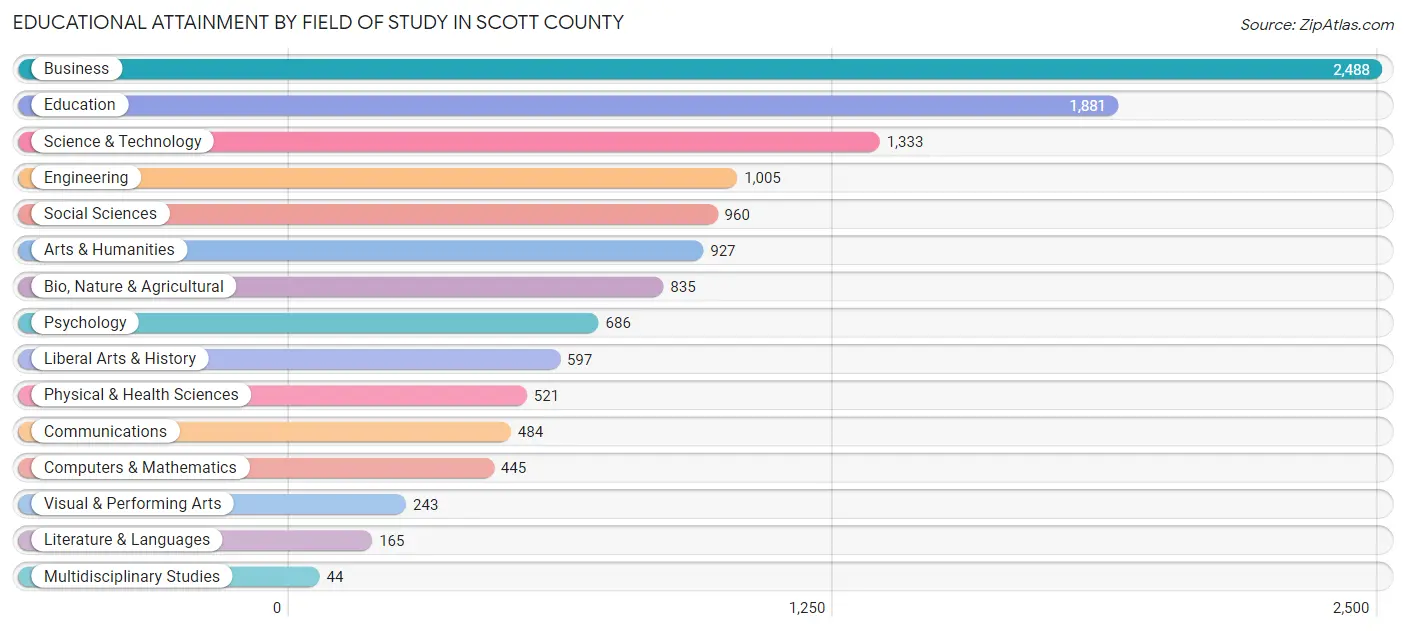
| Field of Study | # Graduates | % Graduates |
| Computers & Mathematics | 445 | 3.5% |
| Bio, Nature & Agricultural | 835 | 6.6% |
| Physical & Health Sciences | 521 | 4.1% |
| Psychology | 686 | 5.4% |
| Social Sciences | 960 | 7.6% |
| Engineering | 1,005 | 8.0% |
| Multidisciplinary Studies | 44 | 0.4% |
| Science & Technology | 1,333 | 10.6% |
| Business | 2,488 | 19.7% |
| Education | 1,881 | 14.9% |
| Literature & Languages | 165 | 1.3% |
| Liberal Arts & History | 597 | 4.7% |
| Visual & Performing Arts | 243 | 1.9% |
| Communications | 484 | 3.8% |
| Arts & Humanities | 927 | 7.3% |
| Total | 12,614 | 100.0% |
Transportation & Commute in Scott County
Vehicle Availability by Sex in Scott County
The most prevalent vehicle ownership categories in Scott County are males with 2 vehicles (6,978, accounting for 46.0%) and females with 2 vehicles (6,117, making up 52.5%).
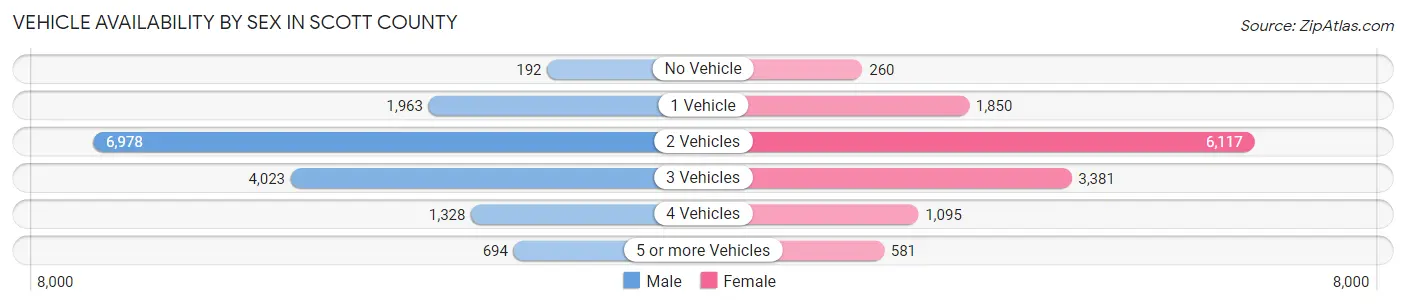
| Vehicles Available | Male | Female |
| No Vehicle | 192 (1.3%) | 260 (2.0%) |
| 1 Vehicle | 1,963 (12.9%) | 1,850 (13.9%) |
| 2 Vehicles | 6,978 (46.0%) | 6,117 (46.1%) |
| 3 Vehicles | 4,023 (26.5%) | 3,381 (25.5%) |
| 4 Vehicles | 1,328 (8.7%) | 1,095 (8.2%) |
| 5 or more Vehicles | 694 (4.6%) | 581 (4.4%) |
| Total | 15,178 (100.0%) | 13,284 (100.0%) |
Commute Time in Scott County
The most frequently occuring commute durations in Scott County are 10 to 14 minutes (4,691 commuters, 17.8%), 15 to 19 minutes (4,429 commuters, 16.8%), and 20 to 24 minutes (3,851 commuters, 14.6%).
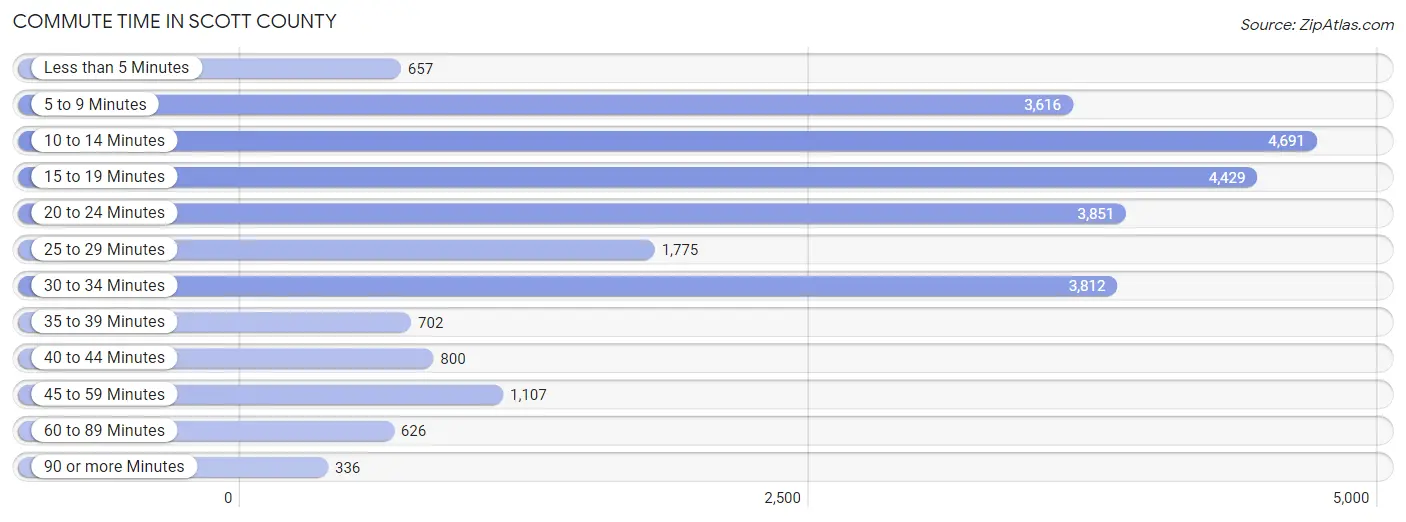
| Commute Time | # Commuters | % Commuters |
| Less than 5 Minutes | 657 | 2.5% |
| 5 to 9 Minutes | 3,616 | 13.7% |
| 10 to 14 Minutes | 4,691 | 17.8% |
| 15 to 19 Minutes | 4,429 | 16.8% |
| 20 to 24 Minutes | 3,851 | 14.6% |
| 25 to 29 Minutes | 1,775 | 6.7% |
| 30 to 34 Minutes | 3,812 | 14.4% |
| 35 to 39 Minutes | 702 | 2.7% |
| 40 to 44 Minutes | 800 | 3.0% |
| 45 to 59 Minutes | 1,107 | 4.2% |
| 60 to 89 Minutes | 626 | 2.4% |
| 90 or more Minutes | 336 | 1.3% |
Commute Time by Sex in Scott County
The most common commute times in Scott County are 15 to 19 minutes (2,879 commuters, 20.3%) for males and 10 to 14 minutes (2,276 commuters, 18.7%) for females.
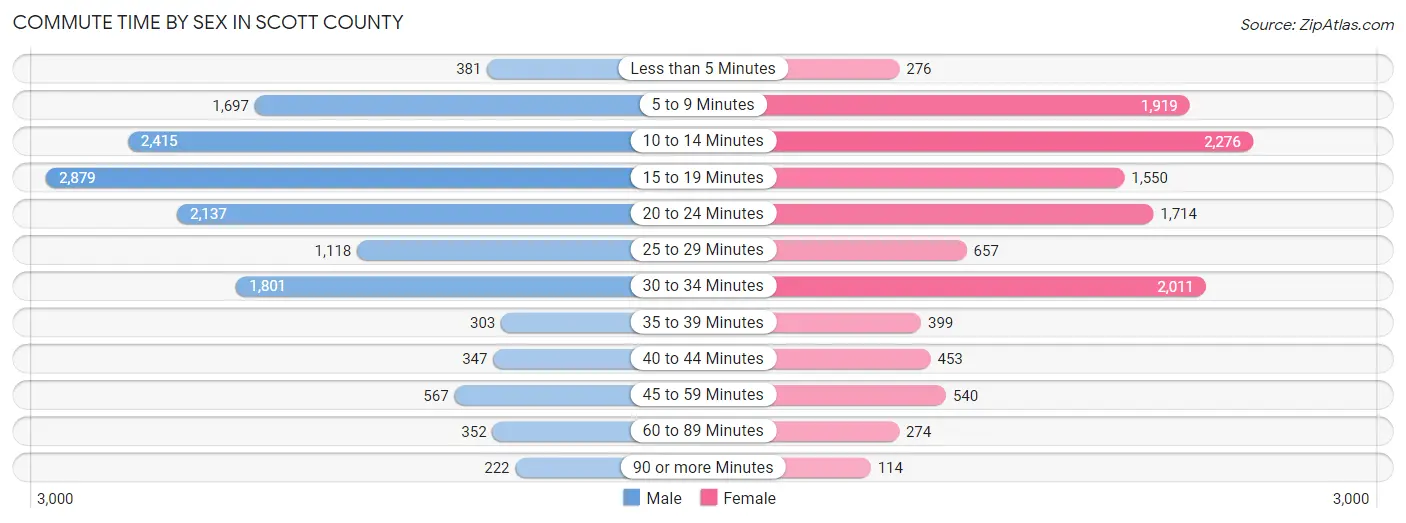
| Commute Time | Male | Female |
| Less than 5 Minutes | 381 (2.7%) | 276 (2.3%) |
| 5 to 9 Minutes | 1,697 (11.9%) | 1,919 (15.8%) |
| 10 to 14 Minutes | 2,415 (17.0%) | 2,276 (18.7%) |
| 15 to 19 Minutes | 2,879 (20.3%) | 1,550 (12.7%) |
| 20 to 24 Minutes | 2,137 (15.0%) | 1,714 (14.1%) |
| 25 to 29 Minutes | 1,118 (7.9%) | 657 (5.4%) |
| 30 to 34 Minutes | 1,801 (12.7%) | 2,011 (16.5%) |
| 35 to 39 Minutes | 303 (2.1%) | 399 (3.3%) |
| 40 to 44 Minutes | 347 (2.4%) | 453 (3.7%) |
| 45 to 59 Minutes | 567 (4.0%) | 540 (4.4%) |
| 60 to 89 Minutes | 352 (2.5%) | 274 (2.2%) |
| 90 or more Minutes | 222 (1.6%) | 114 (0.9%) |
Time of Departure to Work by Sex in Scott County
The most frequent times of departure to work in Scott County are 7:00 AM to 7:29 AM (2,232, 15.7%) for males and 7:00 AM to 7:29 AM (2,105, 17.3%) for females.
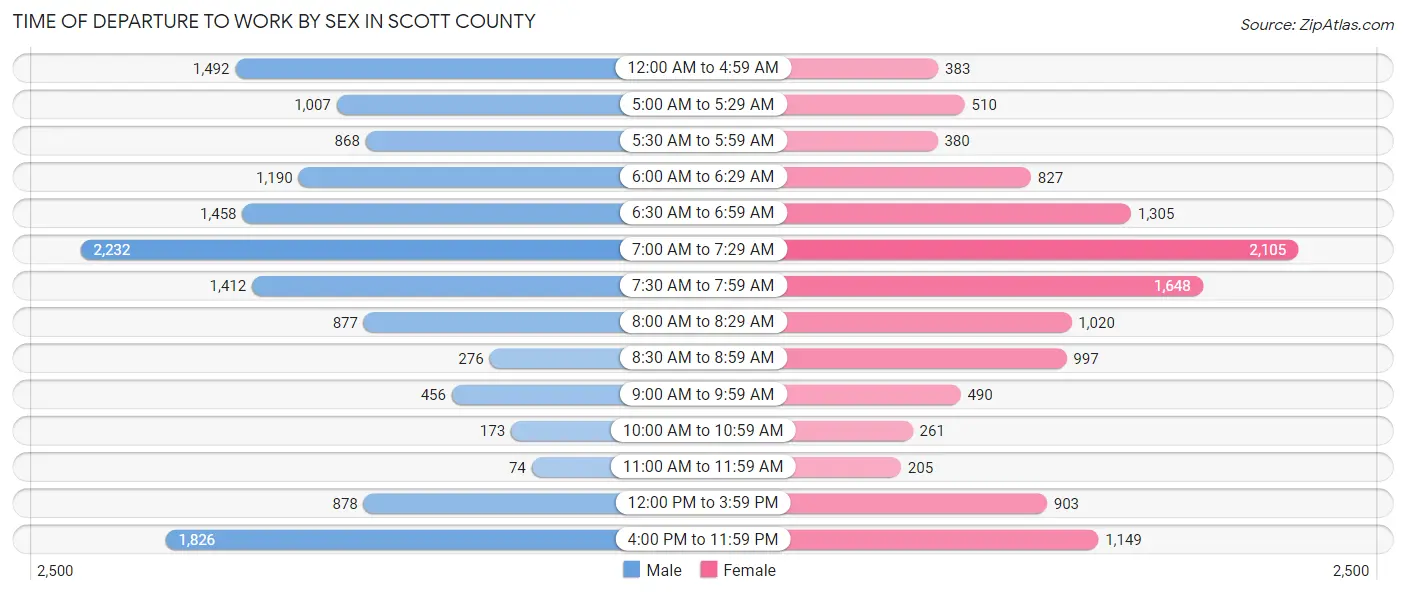
| Time of Departure | Male | Female |
| 12:00 AM to 4:59 AM | 1,492 (10.5%) | 383 (3.1%) |
| 5:00 AM to 5:29 AM | 1,007 (7.1%) | 510 (4.2%) |
| 5:30 AM to 5:59 AM | 868 (6.1%) | 380 (3.1%) |
| 6:00 AM to 6:29 AM | 1,190 (8.4%) | 827 (6.8%) |
| 6:30 AM to 6:59 AM | 1,458 (10.2%) | 1,305 (10.7%) |
| 7:00 AM to 7:29 AM | 2,232 (15.7%) | 2,105 (17.3%) |
| 7:30 AM to 7:59 AM | 1,412 (9.9%) | 1,648 (13.5%) |
| 8:00 AM to 8:29 AM | 877 (6.2%) | 1,020 (8.4%) |
| 8:30 AM to 8:59 AM | 276 (1.9%) | 997 (8.2%) |
| 9:00 AM to 9:59 AM | 456 (3.2%) | 490 (4.0%) |
| 10:00 AM to 10:59 AM | 173 (1.2%) | 261 (2.1%) |
| 11:00 AM to 11:59 AM | 74 (0.5%) | 205 (1.7%) |
| 12:00 PM to 3:59 PM | 878 (6.2%) | 903 (7.4%) |
| 4:00 PM to 11:59 PM | 1,826 (12.8%) | 1,149 (9.4%) |
| Total | 14,219 (100.0%) | 12,183 (100.0%) |
Housing Occupancy in Scott County
Occupancy by Ownership in Scott County
Of the total 21,603 dwellings in Scott County, owner-occupied units account for 15,863 (73.4%), while renter-occupied units make up 5,740 (26.6%).
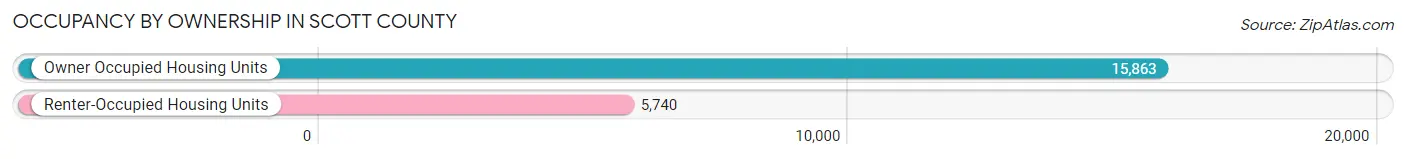
| Occupancy | # Housing Units | % Housing Units |
| Owner Occupied Housing Units | 15,863 | 73.4% |
| Renter-Occupied Housing Units | 5,740 | 26.6% |
| Total Occupied Housing Units | 21,603 | 100.0% |
Occupancy by Household Size in Scott County
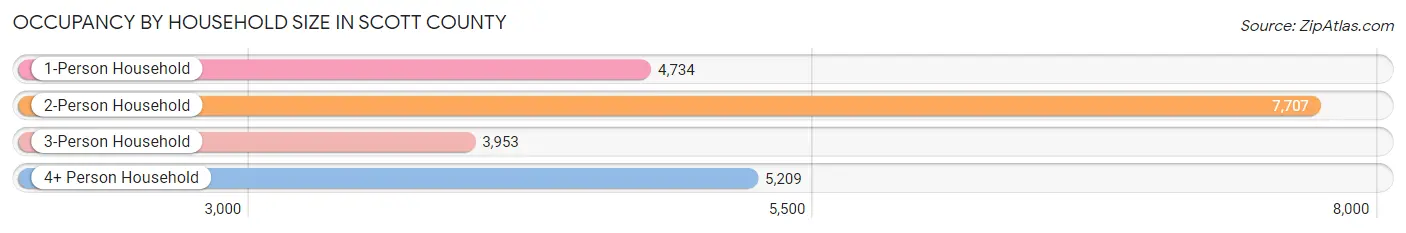
| Household Size | # Housing Units | % Housing Units |
| 1-Person Household | 4,734 | 21.9% |
| 2-Person Household | 7,707 | 35.7% |
| 3-Person Household | 3,953 | 18.3% |
| 4+ Person Household | 5,209 | 24.1% |
| Total Housing Units | 21,603 | 100.0% |
Occupancy by Ownership by Household Size in Scott County
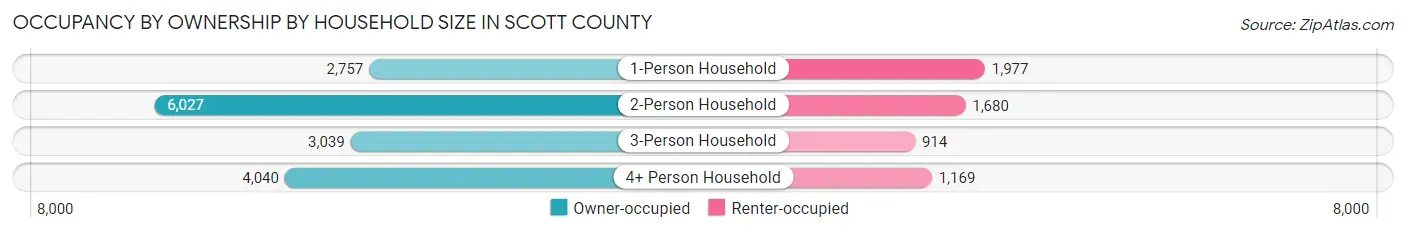
| Household Size | Owner-occupied | Renter-occupied |
| 1-Person Household | 2,757 (58.2%) | 1,977 (41.8%) |
| 2-Person Household | 6,027 (78.2%) | 1,680 (21.8%) |
| 3-Person Household | 3,039 (76.9%) | 914 (23.1%) |
| 4+ Person Household | 4,040 (77.6%) | 1,169 (22.4%) |
| Total Housing Units | 15,863 (73.4%) | 5,740 (26.6%) |
Occupancy by Educational Attainment in Scott County
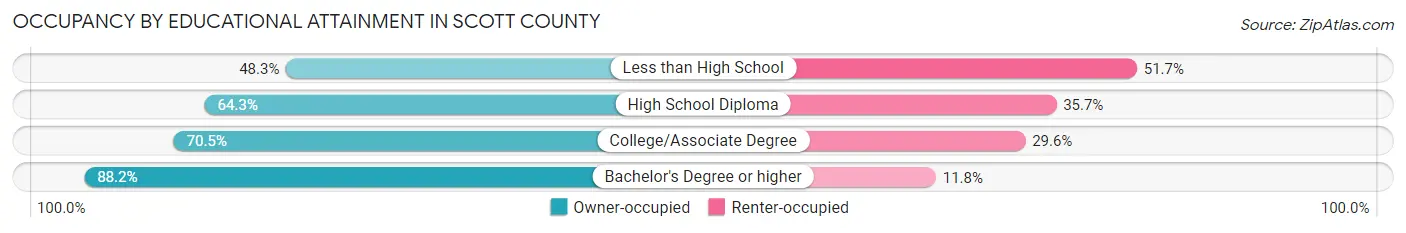
| Household Size | Owner-occupied | Renter-occupied |
| Less than High School | 520 (48.3%) | 556 (51.7%) |
| High School Diploma | 3,956 (64.3%) | 2,195 (35.7%) |
| College/Associate Degree | 5,121 (70.5%) | 2,148 (29.5%) |
| Bachelor's Degree or higher | 6,266 (88.2%) | 841 (11.8%) |
Occupancy by Age of Householder in Scott County
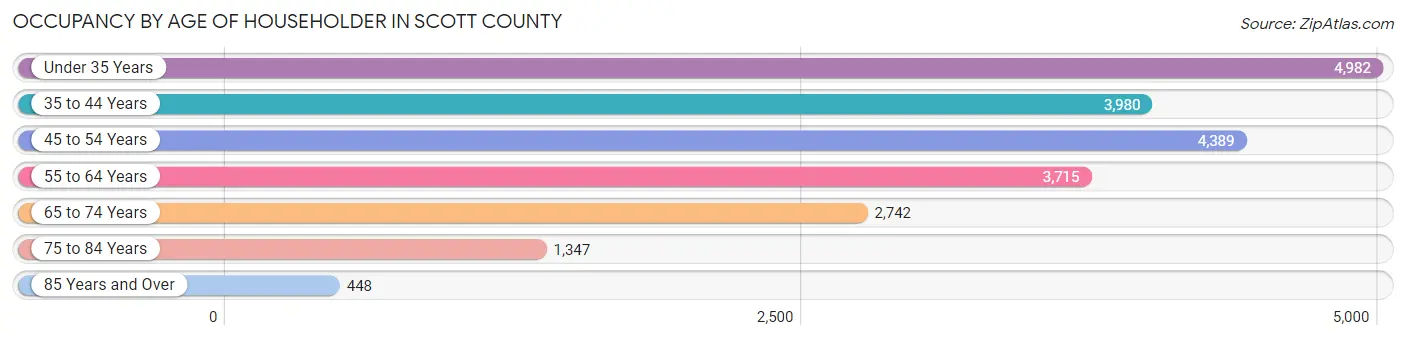
| Age Bracket | # Households | % Households |
| Under 35 Years | 4,982 | 23.1% |
| 35 to 44 Years | 3,980 | 18.4% |
| 45 to 54 Years | 4,389 | 20.3% |
| 55 to 64 Years | 3,715 | 17.2% |
| 65 to 74 Years | 2,742 | 12.7% |
| 75 to 84 Years | 1,347 | 6.2% |
| 85 Years and Over | 448 | 2.1% |
| Total | 21,603 | 100.0% |
Housing Finances in Scott County
Median Income by Occupancy in Scott County
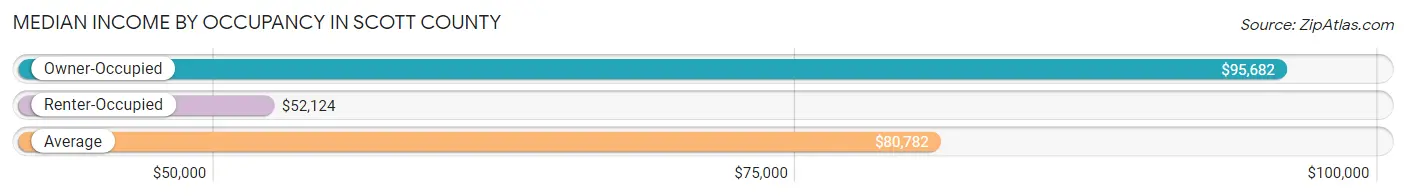
| Occupancy Type | # Households | Median Income |
| Owner-Occupied | 15,863 (73.4%) | $95,682 |
| Renter-Occupied | 5,740 (26.6%) | $52,124 |
| Average | 21,603 (100.0%) | $80,782 |
Occupancy by Householder Income Bracket in Scott County
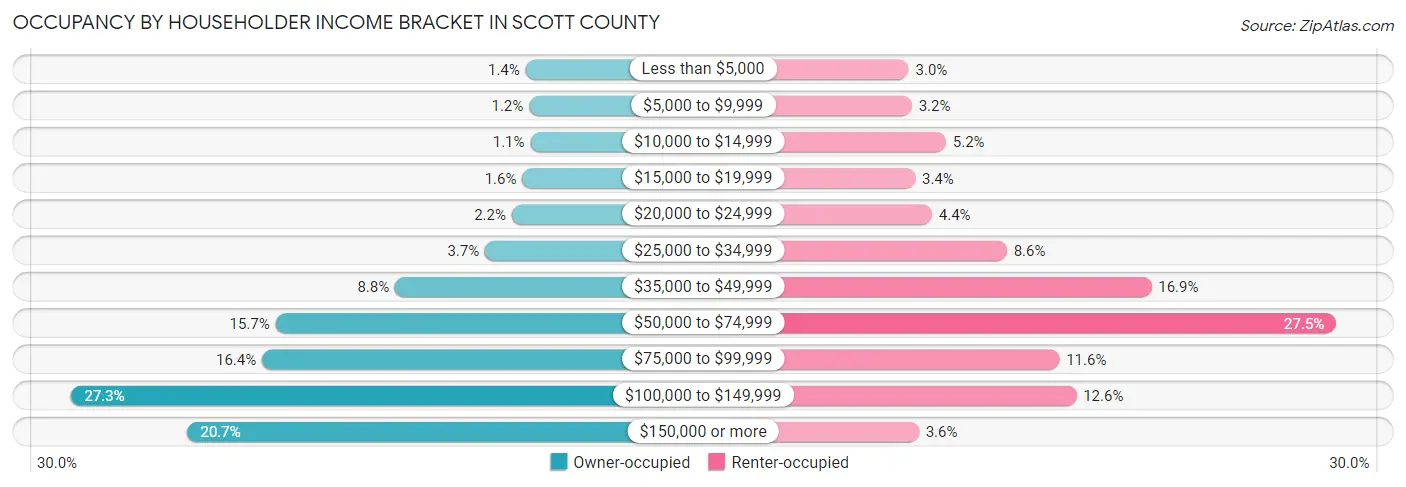
| Income Bracket | Owner-occupied | Renter-occupied |
| Less than $5,000 | 217 (1.4%) | 174 (3.0%) |
| $5,000 to $9,999 | 186 (1.2%) | 184 (3.2%) |
| $10,000 to $14,999 | 175 (1.1%) | 296 (5.2%) |
| $15,000 to $19,999 | 248 (1.6%) | 195 (3.4%) |
| $20,000 to $24,999 | 342 (2.2%) | 250 (4.4%) |
| $25,000 to $34,999 | 586 (3.7%) | 496 (8.6%) |
| $35,000 to $49,999 | 1,401 (8.8%) | 970 (16.9%) |
| $50,000 to $74,999 | 2,484 (15.7%) | 1,576 (27.5%) |
| $75,000 to $99,999 | 2,606 (16.4%) | 668 (11.6%) |
| $100,000 to $149,999 | 4,335 (27.3%) | 724 (12.6%) |
| $150,000 or more | 3,283 (20.7%) | 207 (3.6%) |
| Total | 15,863 (100.0%) | 5,740 (100.0%) |
Monthly Housing Cost Tiers in Scott County
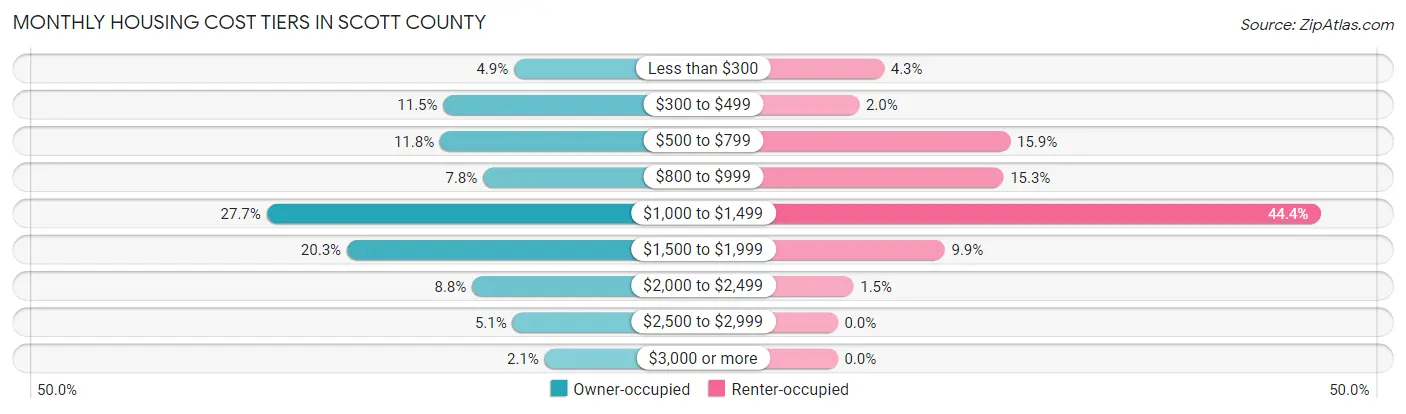
| Monthly Cost | Owner-occupied | Renter-occupied |
| Less than $300 | 784 (4.9%) | 245 (4.3%) |
| $300 to $499 | 1,816 (11.5%) | 114 (2.0%) |
| $500 to $799 | 1,865 (11.8%) | 912 (15.9%) |
| $800 to $999 | 1,236 (7.8%) | 876 (15.3%) |
| $1,000 to $1,499 | 4,397 (27.7%) | 2,551 (44.4%) |
| $1,500 to $1,999 | 3,225 (20.3%) | 566 (9.9%) |
| $2,000 to $2,499 | 1,396 (8.8%) | 84 (1.5%) |
| $2,500 to $2,999 | 806 (5.1%) | 0 (0.0%) |
| $3,000 or more | 338 (2.1%) | 0 (0.0%) |
| Total | 15,863 (100.0%) | 5,740 (100.0%) |
Physical Housing Characteristics in Scott County
Housing Structures in Scott County
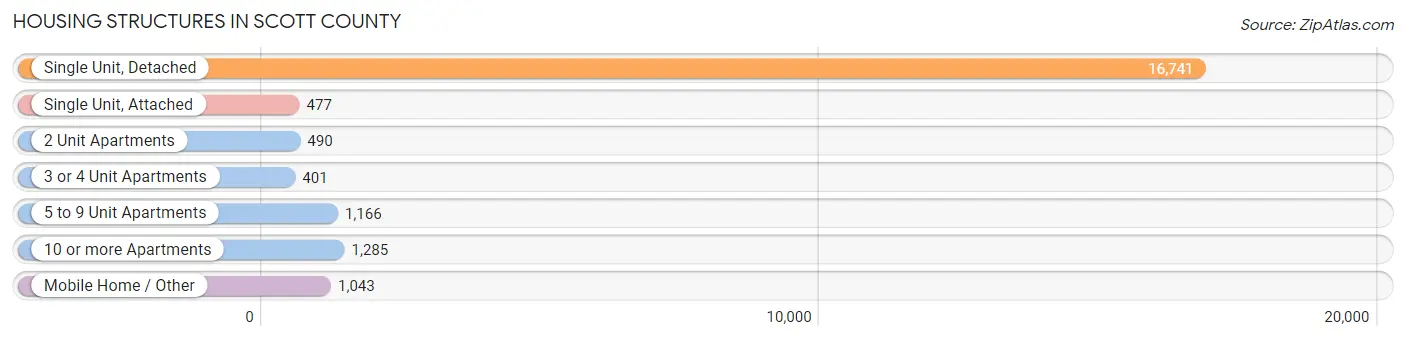
| Structure Type | # Housing Units | % Housing Units |
| Single Unit, Detached | 16,741 | 77.5% |
| Single Unit, Attached | 477 | 2.2% |
| 2 Unit Apartments | 490 | 2.3% |
| 3 or 4 Unit Apartments | 401 | 1.9% |
| 5 to 9 Unit Apartments | 1,166 | 5.4% |
| 10 or more Apartments | 1,285 | 5.9% |
| Mobile Home / Other | 1,043 | 4.8% |
| Total | 21,603 | 100.0% |
Housing Structures by Occupancy in Scott County
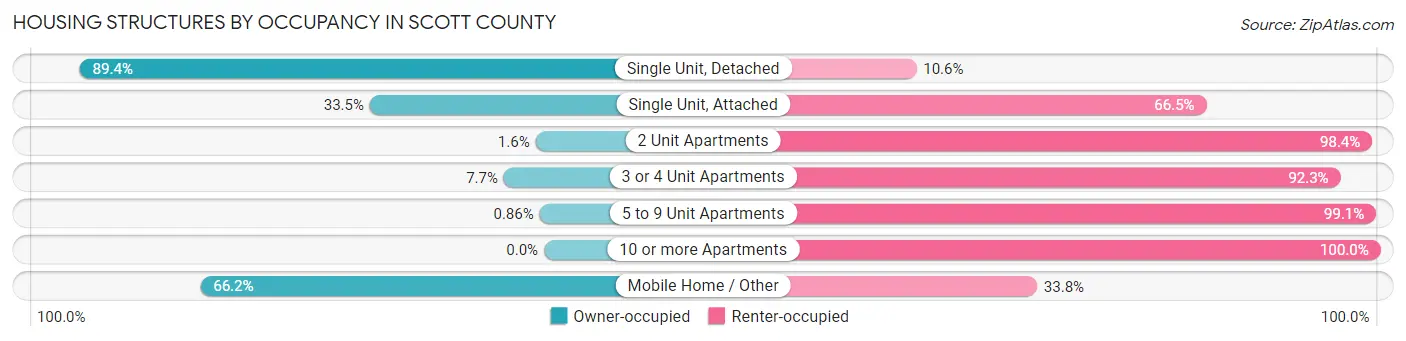
| Structure Type | Owner-occupied | Renter-occupied |
| Single Unit, Detached | 14,964 (89.4%) | 1,777 (10.6%) |
| Single Unit, Attached | 160 (33.5%) | 317 (66.5%) |
| 2 Unit Apartments | 8 (1.6%) | 482 (98.4%) |
| 3 or 4 Unit Apartments | 31 (7.7%) | 370 (92.3%) |
| 5 to 9 Unit Apartments | 10 (0.9%) | 1,156 (99.1%) |
| 10 or more Apartments | 0 (0.0%) | 1,285 (100.0%) |
| Mobile Home / Other | 690 (66.2%) | 353 (33.8%) |
| Total | 15,863 (73.4%) | 5,740 (26.6%) |
Housing Structures by Number of Rooms in Scott County
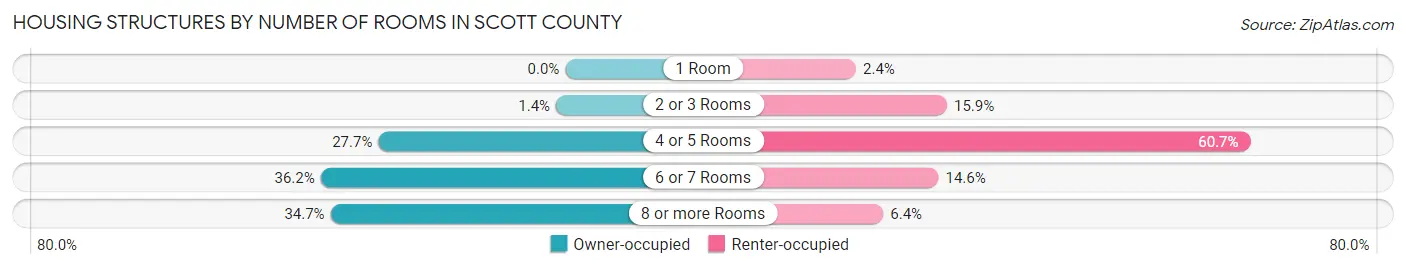
| Number of Rooms | Owner-occupied | Renter-occupied |
| 1 Room | 0 (0.0%) | 137 (2.4%) |
| 2 or 3 Rooms | 219 (1.4%) | 910 (15.9%) |
| 4 or 5 Rooms | 4,389 (27.7%) | 3,486 (60.7%) |
| 6 or 7 Rooms | 5,744 (36.2%) | 838 (14.6%) |
| 8 or more Rooms | 5,511 (34.7%) | 369 (6.4%) |
| Total | 15,863 (100.0%) | 5,740 (100.0%) |
Housing Structure by Heating Type in Scott County
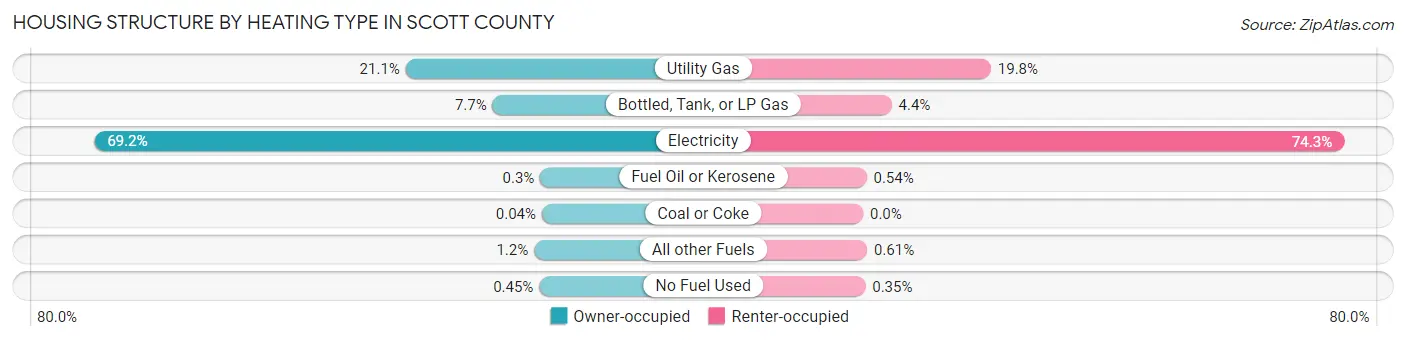
| Heating Type | Owner-occupied | Renter-occupied |
| Utility Gas | 3,345 (21.1%) | 1,134 (19.8%) |
| Bottled, Tank, or LP Gas | 1,215 (7.7%) | 253 (4.4%) |
| Electricity | 10,982 (69.2%) | 4,267 (74.3%) |
| Fuel Oil or Kerosene | 47 (0.3%) | 31 (0.5%) |
| Coal or Coke | 6 (0.0%) | 0 (0.0%) |
| All other Fuels | 196 (1.2%) | 35 (0.6%) |
| No Fuel Used | 72 (0.4%) | 20 (0.4%) |
| Total | 15,863 (100.0%) | 5,740 (100.0%) |
Household Vehicle Usage in Scott County
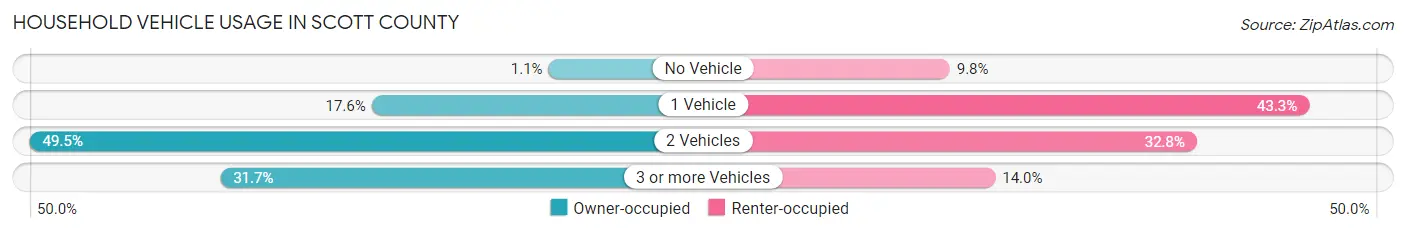
| Vehicles per Household | Owner-occupied | Renter-occupied |
| No Vehicle | 175 (1.1%) | 562 (9.8%) |
| 1 Vehicle | 2,794 (17.6%) | 2,487 (43.3%) |
| 2 Vehicles | 7,859 (49.5%) | 1,885 (32.8%) |
| 3 or more Vehicles | 5,035 (31.7%) | 806 (14.0%) |
| Total | 15,863 (100.0%) | 5,740 (100.0%) |
Real Estate & Mortgages in Scott County
Real Estate and Mortgage Overview in Scott County
| Characteristic | Without Mortgage | With Mortgage |
| Housing Units | 4,368 | 11,495 |
| Median Property Value | $214,100 | $251,700 |
| Median Household Income | $63,543 | $2,661 |
| Monthly Housing Costs | $461 | $338 |
| Real Estate Taxes | $1,291 | $349 |
Property Value by Mortgage Status in Scott County
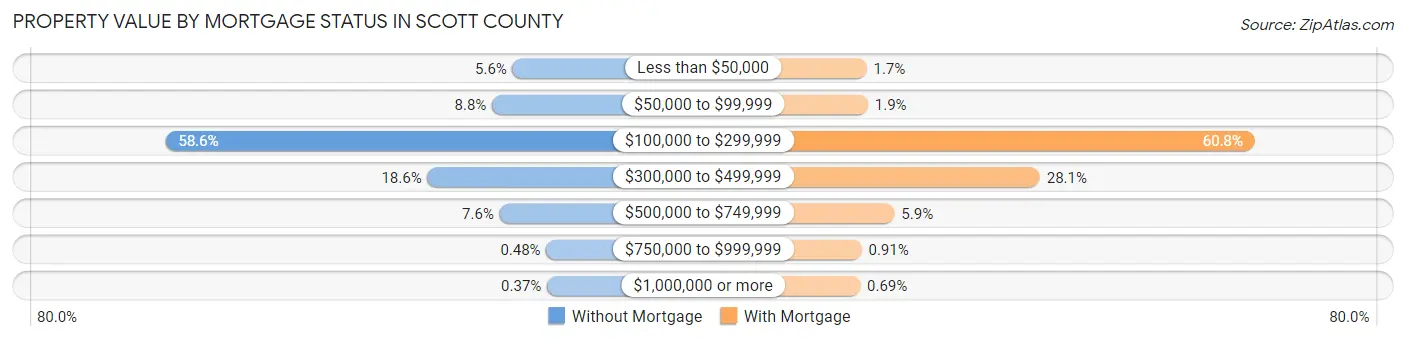
| Property Value | Without Mortgage | With Mortgage |
| Less than $50,000 | 246 (5.6%) | 192 (1.7%) |
| $50,000 to $99,999 | 382 (8.7%) | 216 (1.9%) |
| $100,000 to $299,999 | 2,558 (58.6%) | 6,994 (60.8%) |
| $300,000 to $499,999 | 813 (18.6%) | 3,228 (28.1%) |
| $500,000 to $749,999 | 332 (7.6%) | 681 (5.9%) |
| $750,000 to $999,999 | 21 (0.5%) | 105 (0.9%) |
| $1,000,000 or more | 16 (0.4%) | 79 (0.7%) |
| Total | 4,368 (100.0%) | 11,495 (100.0%) |
Household Income by Mortgage Status in Scott County
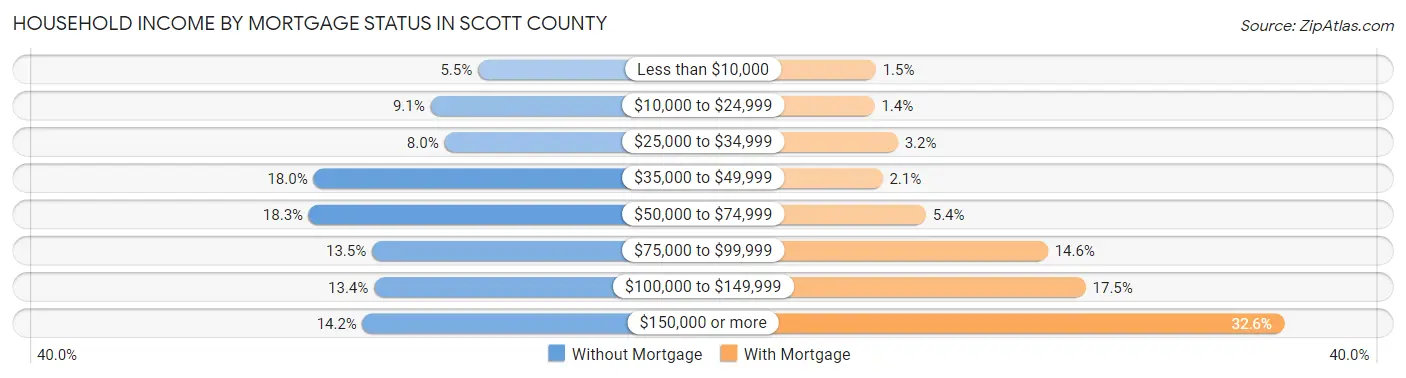
| Household Income | Without Mortgage | With Mortgage |
| Less than $10,000 | 238 (5.4%) | 177 (1.5%) |
| $10,000 to $24,999 | 396 (9.1%) | 165 (1.4%) |
| $25,000 to $34,999 | 350 (8.0%) | 369 (3.2%) |
| $35,000 to $49,999 | 786 (18.0%) | 236 (2.1%) |
| $50,000 to $74,999 | 801 (18.3%) | 615 (5.3%) |
| $75,000 to $99,999 | 591 (13.5%) | 1,683 (14.6%) |
| $100,000 to $149,999 | 584 (13.4%) | 2,015 (17.5%) |
| $150,000 or more | 622 (14.2%) | 3,751 (32.6%) |
| Total | 4,368 (100.0%) | 11,495 (100.0%) |
Property Value to Household Income Ratio in Scott County
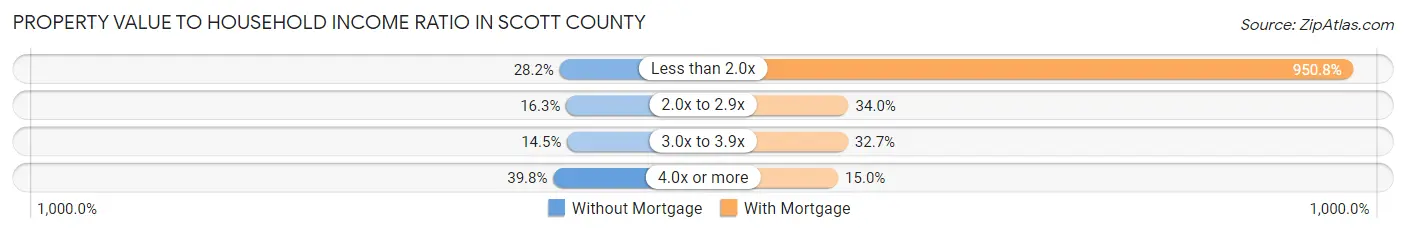
| Value-to-Income Ratio | Without Mortgage | With Mortgage |
| Less than 2.0x | 1,231 (28.2%) | 109,293 (950.8%) |
| 2.0x to 2.9x | 712 (16.3%) | 3,909 (34.0%) |
| 3.0x to 3.9x | 633 (14.5%) | 3,759 (32.7%) |
| 4.0x or more | 1,738 (39.8%) | 1,720 (15.0%) |
| Total | 4,368 (100.0%) | 11,495 (100.0%) |
Real Estate Taxes by Mortgage Status in Scott County
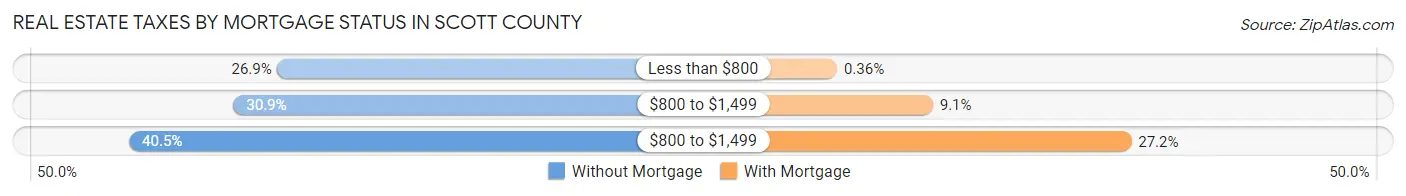
| Property Taxes | Without Mortgage | With Mortgage |
| Less than $800 | 1,175 (26.9%) | 41 (0.4%) |
| $800 to $1,499 | 1,351 (30.9%) | 1,047 (9.1%) |
| $800 to $1,499 | 1,767 (40.5%) | 3,131 (27.2%) |
| Total | 4,368 (100.0%) | 11,495 (100.0%) |
Health & Disability in Scott County
Health Insurance Coverage by Age in Scott County
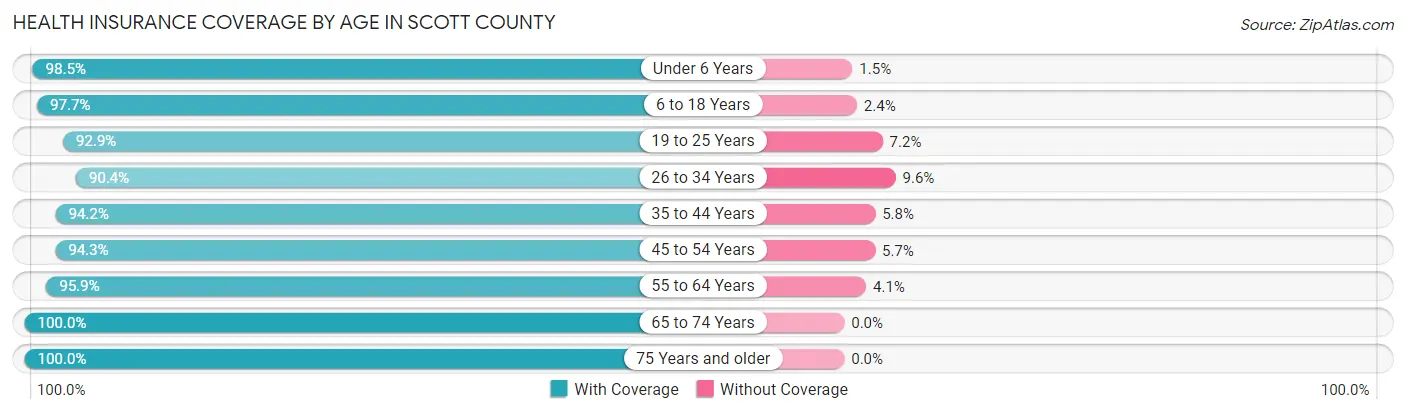
| Age Bracket | With Coverage | Without Coverage |
| Under 6 Years | 4,369 (98.5%) | 67 (1.5%) |
| 6 to 18 Years | 10,097 (97.7%) | 243 (2.4%) |
| 19 to 25 Years | 4,950 (92.8%) | 381 (7.1%) |
| 26 to 34 Years | 6,710 (90.4%) | 710 (9.6%) |
| 35 to 44 Years | 7,375 (94.2%) | 452 (5.8%) |
| 45 to 54 Years | 7,454 (94.3%) | 453 (5.7%) |
| 55 to 64 Years | 6,349 (95.9%) | 269 (4.1%) |
| 65 to 74 Years | 4,646 (100.0%) | 0 (0.0%) |
| 75 Years and older | 2,498 (100.0%) | 0 (0.0%) |
| Total | 54,448 (95.5%) | 2,575 (4.5%) |
Health Insurance Coverage by Citizenship Status in Scott County
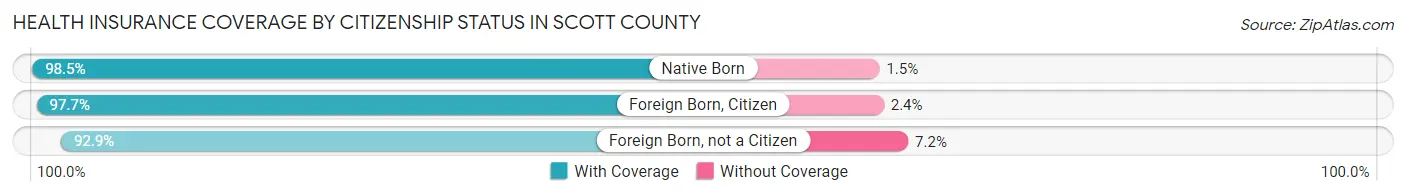
| Citizenship Status | With Coverage | Without Coverage |
| Native Born | 4,369 (98.5%) | 67 (1.5%) |
| Foreign Born, Citizen | 10,097 (97.7%) | 243 (2.4%) |
| Foreign Born, not a Citizen | 4,950 (92.8%) | 381 (7.1%) |
Health Insurance Coverage by Household Income in Scott County
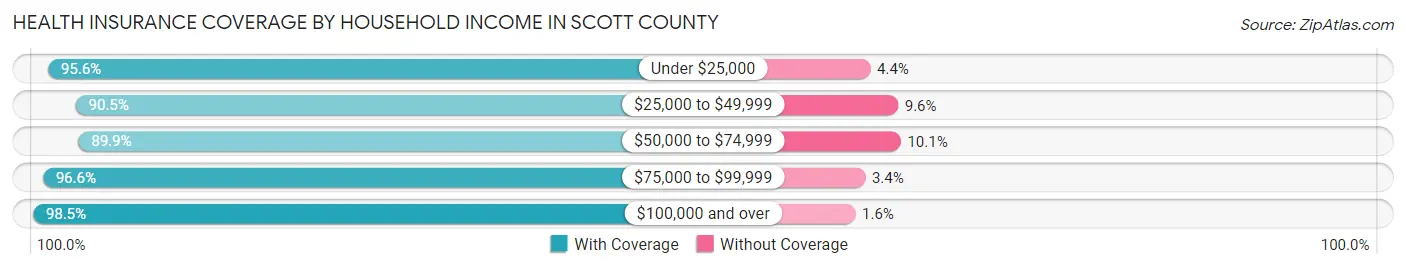
| Household Income | With Coverage | Without Coverage |
| Under $25,000 | 4,250 (95.6%) | 194 (4.4%) |
| $25,000 to $49,999 | 6,166 (90.4%) | 651 (9.6%) |
| $50,000 to $74,999 | 8,701 (89.9%) | 973 (10.1%) |
| $75,000 to $99,999 | 8,620 (96.6%) | 303 (3.4%) |
| $100,000 and over | 25,809 (98.5%) | 407 (1.5%) |
Public vs Private Health Insurance Coverage by Age in Scott County
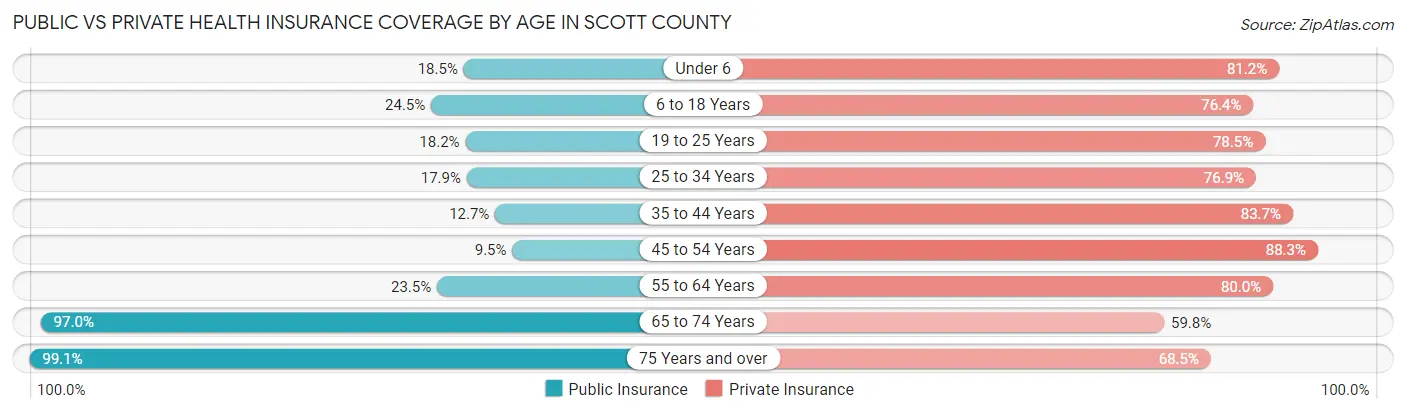
| Age Bracket | Public Insurance | Private Insurance |
| Under 6 | 820 (18.5%) | 3,600 (81.1%) |
| 6 to 18 Years | 2,537 (24.5%) | 7,899 (76.4%) |
| 19 to 25 Years | 969 (18.2%) | 4,187 (78.5%) |
| 25 to 34 Years | 1,330 (17.9%) | 5,703 (76.9%) |
| 35 to 44 Years | 990 (12.7%) | 6,552 (83.7%) |
| 45 to 54 Years | 748 (9.5%) | 6,985 (88.3%) |
| 55 to 64 Years | 1,552 (23.4%) | 5,297 (80.0%) |
| 65 to 74 Years | 4,507 (97.0%) | 2,779 (59.8%) |
| 75 Years and over | 2,476 (99.1%) | 1,711 (68.5%) |
| Total | 15,929 (27.9%) | 44,713 (78.4%) |
Disability Status by Sex by Age in Scott County
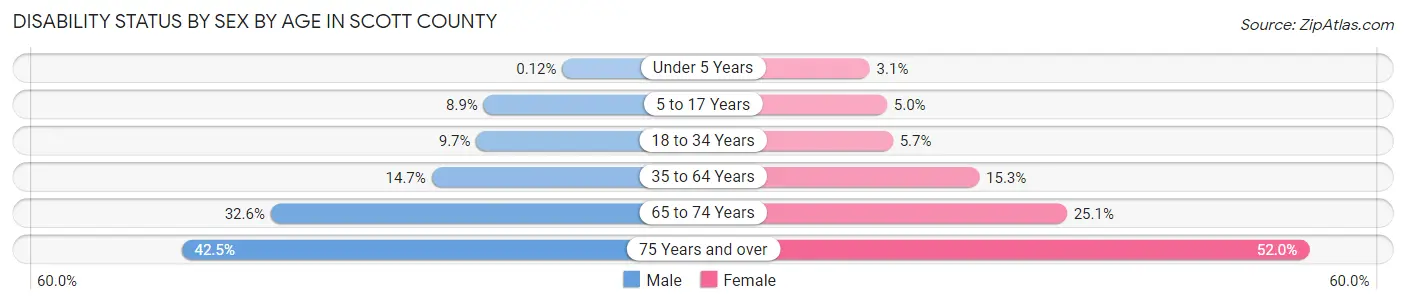
| Age Bracket | Male | Female |
| Under 5 Years | 2 (0.1%) | 57 (3.1%) |
| 5 to 17 Years | 462 (8.9%) | 269 (5.0%) |
| 18 to 34 Years | 655 (9.7%) | 377 (5.7%) |
| 35 to 64 Years | 1,634 (14.7%) | 1,714 (15.3%) |
| 65 to 74 Years | 735 (32.6%) | 599 (25.1%) |
| 75 Years and over | 455 (42.5%) | 743 (52.0%) |
Disability Class by Sex by Age in Scott County
Disability Class: Hearing Difficulty
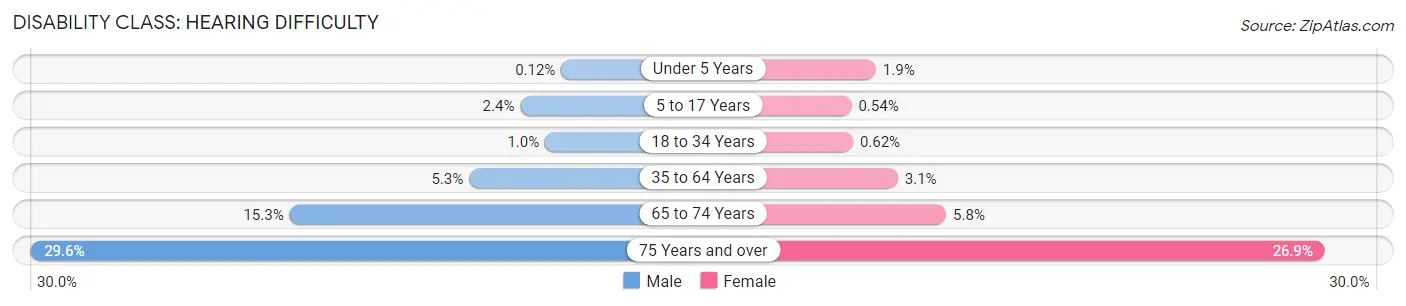
| Age Bracket | Male | Female |
| Under 5 Years | 2 (0.1%) | 35 (1.9%) |
| 5 to 17 Years | 125 (2.4%) | 29 (0.5%) |
| 18 to 34 Years | 69 (1.0%) | 41 (0.6%) |
| 35 to 64 Years | 585 (5.2%) | 350 (3.1%) |
| 65 to 74 Years | 344 (15.2%) | 139 (5.8%) |
| 75 Years and over | 317 (29.6%) | 384 (26.9%) |
Disability Class: Vision Difficulty
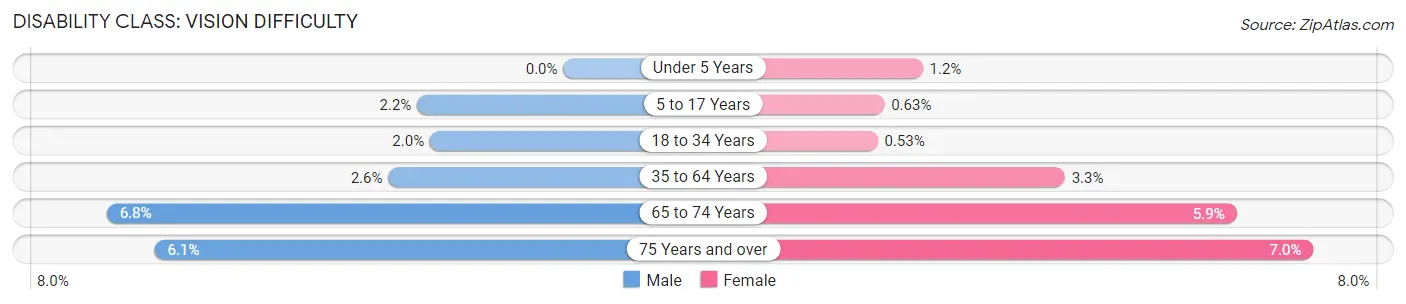
| Age Bracket | Male | Female |
| Under 5 Years | 0 (0.0%) | 22 (1.2%) |
| 5 to 17 Years | 113 (2.2%) | 34 (0.6%) |
| 18 to 34 Years | 134 (2.0%) | 35 (0.5%) |
| 35 to 64 Years | 290 (2.6%) | 371 (3.3%) |
| 65 to 74 Years | 153 (6.8%) | 140 (5.9%) |
| 75 Years and over | 65 (6.1%) | 100 (7.0%) |
Disability Class: Cognitive Difficulty
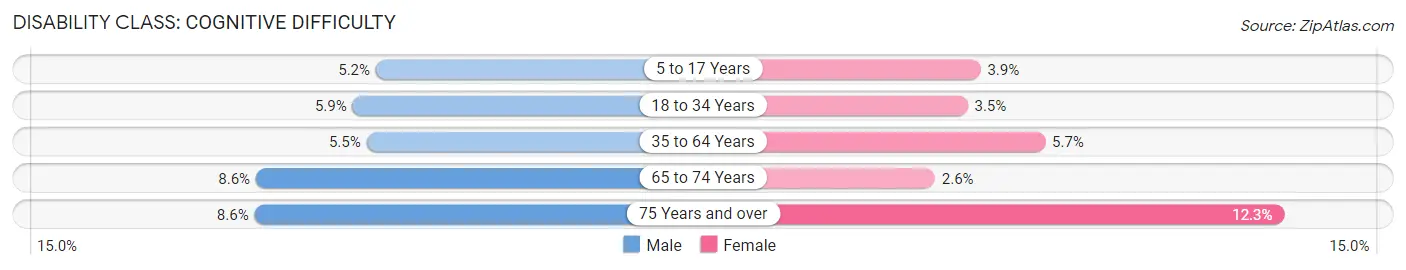
| Age Bracket | Male | Female |
| 5 to 17 Years | 272 (5.2%) | 207 (3.9%) |
| 18 to 34 Years | 397 (5.9%) | 233 (3.5%) |
| 35 to 64 Years | 611 (5.5%) | 634 (5.7%) |
| 65 to 74 Years | 193 (8.6%) | 62 (2.6%) |
| 75 Years and over | 92 (8.6%) | 176 (12.3%) |
Disability Class: Ambulatory Difficulty
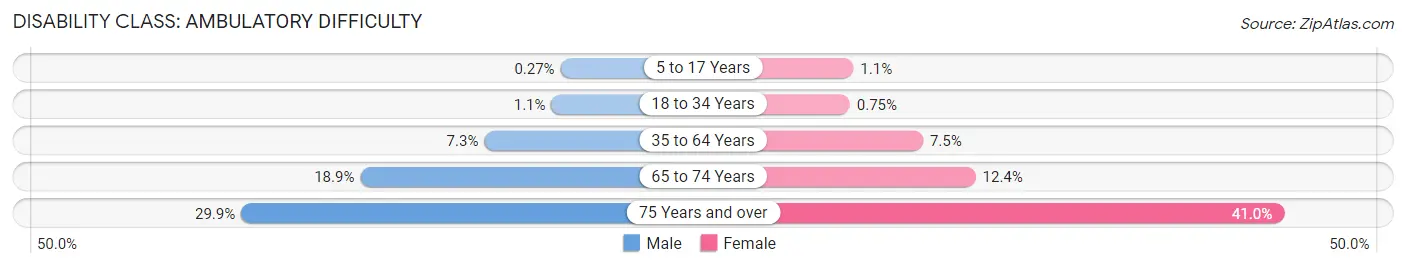
| Age Bracket | Male | Female |
| 5 to 17 Years | 14 (0.3%) | 58 (1.1%) |
| 18 to 34 Years | 75 (1.1%) | 50 (0.7%) |
| 35 to 64 Years | 818 (7.3%) | 844 (7.5%) |
| 65 to 74 Years | 425 (18.9%) | 297 (12.4%) |
| 75 Years and over | 320 (29.9%) | 586 (41.0%) |
Disability Class: Self-Care Difficulty
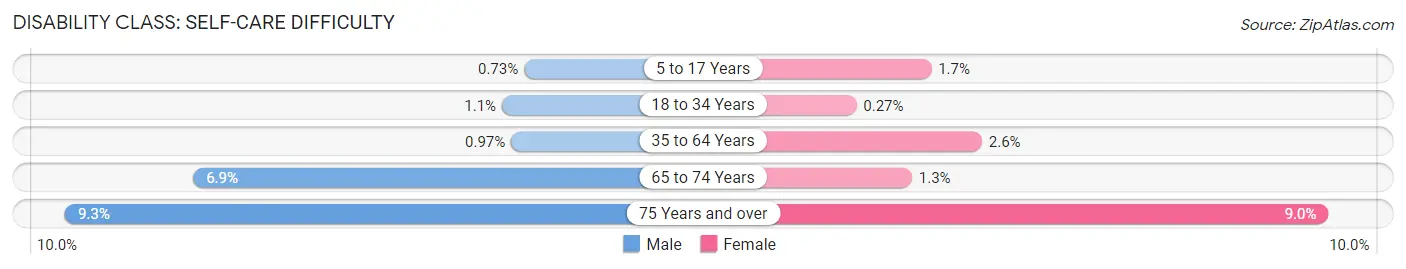
| Age Bracket | Male | Female |
| 5 to 17 Years | 38 (0.7%) | 89 (1.7%) |
| 18 to 34 Years | 77 (1.1%) | 18 (0.3%) |
| 35 to 64 Years | 108 (1.0%) | 292 (2.6%) |
| 65 to 74 Years | 155 (6.9%) | 31 (1.3%) |
| 75 Years and over | 99 (9.2%) | 129 (9.0%) |
Technology Access in Scott County
Computing Device Access in Scott County
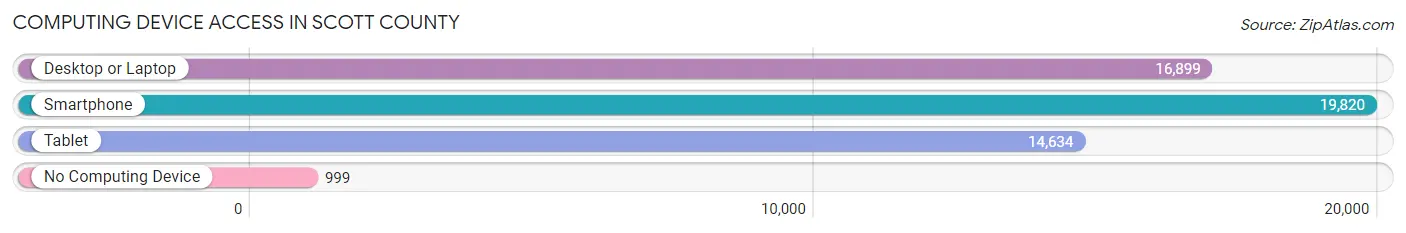
| Device Type | # Households | % Households |
| Desktop or Laptop | 16,899 | 78.2% |
| Smartphone | 19,820 | 91.7% |
| Tablet | 14,634 | 67.7% |
| No Computing Device | 999 | 4.6% |
| Total | 21,603 | 100.0% |
Internet Access in Scott County
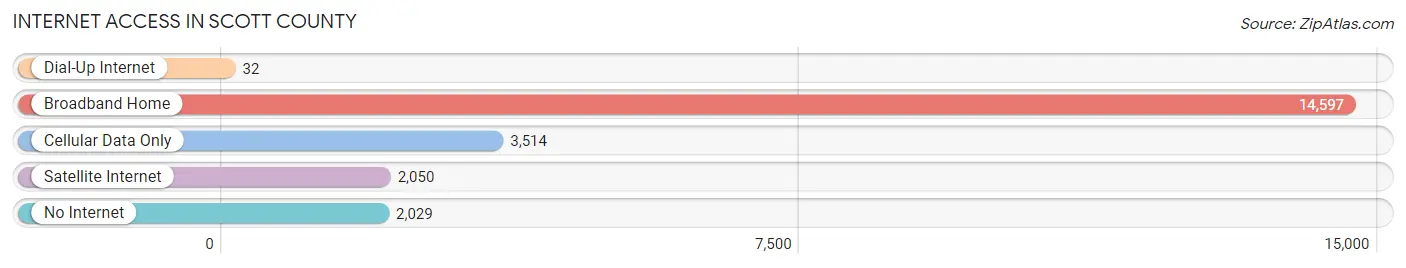
| Internet Type | # Households | % Households |
| Dial-Up Internet | 32 | 0.2% |
| Broadband Home | 14,597 | 67.6% |
| Cellular Data Only | 3,514 | 16.3% |
| Satellite Internet | 2,050 | 9.5% |
| No Internet | 2,029 | 9.4% |
| Total | 21,603 | 100.0% |
Scott County Summary
Scott County is located in the northeastern part of Kentucky, and is part of the Lexington-Fayette Metropolitan Statistical Area. It is bordered by Fayette, Woodford, Bourbon, Harrison, and Nicholas counties. The county seat is Georgetown.
Geography
Scott County is located in the Inner Bluegrass region of Kentucky. It is mostly composed of rolling hills and valleys, with the Kentucky River running through the county. The county has a total area of 437 square miles, of which 434 square miles is land and 3 square miles is water.
The county is home to several state parks, including the Kentucky River Palisades, which is a National Natural Landmark. Other parks include the Raven Run Nature Sanctuary, the McConnell Springs, and the Kentucky Horse Park.
Demographics
As of the 2010 census, Scott County had a population of 47,173. The racial makeup of the county was 94.2% White, 3.2% Black or African American, 0.3% Native American, 0.7% Asian, 0.1% Pacific Islander, 0.7% from other races, and 0.9% from two or more races. 1.7% of the population were Hispanic or Latino of any race.
The median household income in Scott County was $45,945, and the median family income was $54,945. The per capita income was $22,945. About 8.7% of families and 11.2% of the population were below the poverty line, including 15.2% of those under age 18 and 8.7% of those age 65 or over.
Economy
Scott County is home to several major employers, including Toyota Motor Manufacturing Kentucky, which is the largest private employer in the state. Other major employers include Amazon, GE Appliances, and the University of Kentucky.
The county is also home to several small businesses, including wineries, distilleries, and craft breweries. Agriculture is also an important part of the economy, with corn, soybeans, and hay being the main crops.
Scott County is also home to several tourist attractions, including the Kentucky Horse Park, the Kentucky River Palisades, and the McConnell Springs. These attractions bring in visitors from all over the state and country, and help to boost the local economy.
Conclusion
Scott County is a rural county located in the northeastern part of Kentucky. It is home to several major employers, as well as small businesses and tourist attractions. The county has a diverse population and a strong economy, and is a great place to live and work.
Common Questions
What is the Total Population of Scott County?
Total Population of Scott County is 57,286.
What is the Total Male Population of Scott County?
Total Male Population of Scott County is 28,239.
What is the Total Female Population of Scott County?
Total Female Population of Scott County is 29,047.
What is the Ratio of Males per 100 Females in Scott County?
There are 97.22 Males per 100 Females in Scott County.
What is the Ratio of Females per 100 Males in Scott County?
There are 102.86 Females per 100 Males in Scott County.
What is the Median Population Age in Scott County?
Median Population Age in Scott County is 36.1 Years.
What is the Average Family Size in Scott County
Average Family Size in Scott County is 3.0 People.
What is the Average Household Size in Scott County
Average Household Size in Scott County is 2.6 People.
What is Per Capita Income in Scott County?
Per Capita income in Scott County is $38,391.
What is the Median Family Income in Scott County?
Median Family Income in Scott County is $94,286.
What is the Median Household income in Scott County?
Median Household Income in Scott County is $80,782.
What is Income or Wage Gap in Scott County?
Income or Wage Gap in Scott County is 36.9%.
Women in Scott County earn 63.1 cents for every dollar earned by a man.
What is Family Income Deficit in Scott County?
Family Income Deficit in Scott County is $11,415.
Families that are below poverty line in Scott County earn $11,415 less on average than the poverty threshold level.
What is Inequality or Gini Index in Scott County?
Inequality or Gini Index in Scott County is 0.40.
How Large is the Labor Force in Scott County?
There are 30,560 People in the Labor Forcein in Scott County.
What is the Percentage of People in the Labor Force in Scott County?
68.8% of People are in the Labor Force in Scott County.
What is the Unemployment Rate in Scott County?
Unemployment Rate in Scott County is 3.7%.