Rockcastle County, KY
Rockcastle County Map

Rockcastle County Overview
16,171
TOTAL POPULATION
8,035
MALE POPULATION
8,136
FEMALE POPULATION
98.76
MALES / 100 FEMALES
101.26
FEMALES / 100 MALES
42.9
MEDIAN AGE
3.0
AVG FAMILY SIZE
2.5
AVG HOUSEHOLD SIZE
$26,640
PER CAPITA INCOME
$58,289
AVG FAMILY INCOME
$45,693
AVG HOUSEHOLD INCOME
37.1%
WAGE / INCOME GAP [ % ]
62.9¢/ $1
WAGE / INCOME GAP [ $ ]
$11,362
FAMILY INCOME DEFICIT
0.50
INEQUALITY / GINI INDEX
6,487
LABOR FORCE [ PEOPLE ]
49.3%
PERCENT IN LABOR FORCE
6.6%
UNEMPLOYMENT RATE
Rockcastle County Area Codes
Race in Rockcastle County
The most populous races in Rockcastle County are White / Caucasian (15,742 | 97.4%), Two or more Races (361 | 2.2%), and Hispanic or Latino (177 | 1.1%).

| Race | # Population | % Population |
| Asian | 13 | 0.1% |
| Black / African American | 16 | 0.1% |
| Hawaiian / Pacific | 0 | 0.0% |
| Hispanic or Latino | 177 | 1.1% |
| Native / Alaskan | 9 | 0.1% |
| White / Caucasian | 15,742 | 97.4% |
| Two or more Races | 361 | 2.2% |
| Some other Race | 30 | 0.2% |
| Total | 16,171 | 100.0% |
Ancestry in Rockcastle County
The most populous ancestries reported in Rockcastle County are American (3,823 | 23.6%), English (1,651 | 10.2%), German (1,105 | 6.8%), Irish (985 | 6.1%), and European (388 | 2.4%), together accounting for 49.2% of all Rockcastle County residents.

| Ancestry | # Population | % Population |
| American | 3,823 | 23.6% |
| British | 110 | 0.7% |
| Celtic | 13 | 0.1% |
| Central American | 29 | 0.2% |
| Cherokee | 23 | 0.1% |
| Cuban | 13 | 0.1% |
| Czech | 6 | 0.0% |
| Dutch | 21 | 0.1% |
| Eastern European | 17 | 0.1% |
| English | 1,651 | 10.2% |
| European | 388 | 2.4% |
| French | 29 | 0.2% |
| French Canadian | 5 | 0.0% |
| German | 1,105 | 6.8% |
| Guatemalan | 29 | 0.2% |
| Irish | 985 | 6.1% |
| Iroquois | 6 | 0.0% |
| Italian | 114 | 0.7% |
| Mexican | 119 | 0.7% |
| Norwegian | 40 | 0.3% |
| Scandinavian | 19 | 0.1% |
| Scotch-Irish | 236 | 1.5% |
| Scottish | 270 | 1.7% |
| Sioux | 1 | 0.0% |
| Slovak | 9 | 0.1% |
| Sri Lankan | 25 | 0.2% |
| Swedish | 20 | 0.1% |
| Thai | 5 | 0.0% |
| Welsh | 25 | 0.2% | View All 29 Rows |
Immigrants in Rockcastle County
The most numerous immigrant groups reported in Rockcastle County came from Central America (15 | 0.1%), Guatemala (15 | 0.1%), Latin America (15 | 0.1%), Czechoslovakia (9 | 0.1%), and Eastern Europe (9 | 0.1%), together accounting for 0.4% of all Rockcastle County residents.
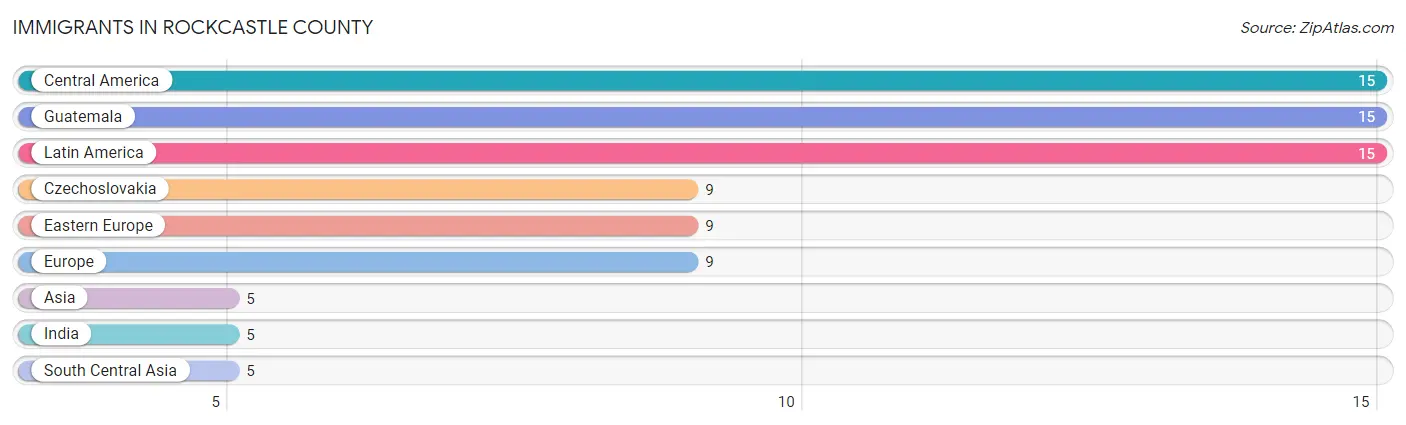
| Immigration Origin | # Population | % Population |
| Asia | 5 | 0.0% |
| Central America | 15 | 0.1% |
| Czechoslovakia | 9 | 0.1% |
| Eastern Europe | 9 | 0.1% |
| Europe | 9 | 0.1% |
| Guatemala | 15 | 0.1% |
| India | 5 | 0.0% |
| Latin America | 15 | 0.1% |
| South Central Asia | 5 | 0.0% | View All 9 Rows |
Sex and Age in Rockcastle County
Sex and Age in Rockcastle County
The most populous age groups in Rockcastle County are 60 to 64 Years (711 | 8.8%) for men and 55 to 59 Years (649 | 8.0%) for women.
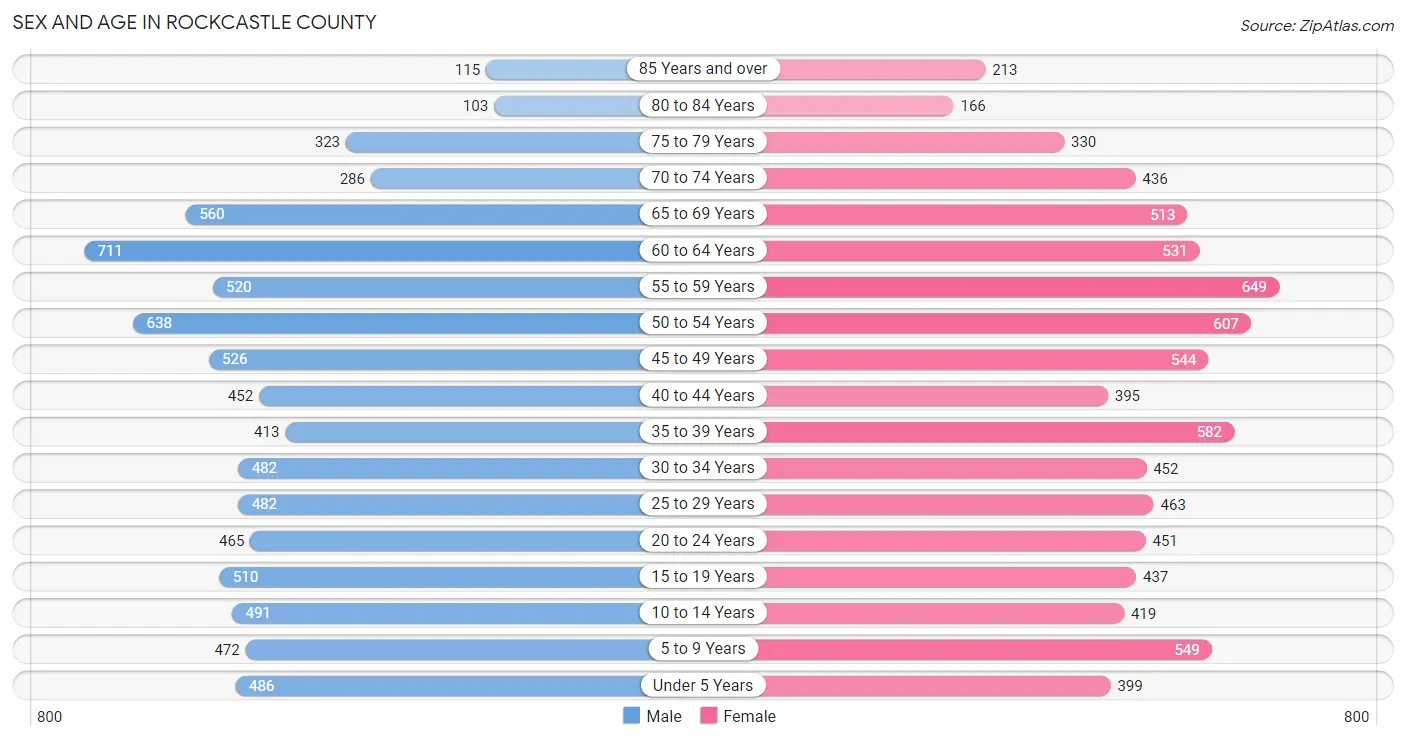
| Age Bracket | Male | Female |
| Under 5 Years | 486 (6.0%) | 399 (4.9%) |
| 5 to 9 Years | 472 (5.9%) | 549 (6.8%) |
| 10 to 14 Years | 491 (6.1%) | 419 (5.1%) |
| 15 to 19 Years | 510 (6.4%) | 437 (5.4%) |
| 20 to 24 Years | 465 (5.8%) | 451 (5.5%) |
| 25 to 29 Years | 482 (6.0%) | 463 (5.7%) |
| 30 to 34 Years | 482 (6.0%) | 452 (5.6%) |
| 35 to 39 Years | 413 (5.1%) | 582 (7.1%) |
| 40 to 44 Years | 452 (5.6%) | 395 (4.9%) |
| 45 to 49 Years | 526 (6.6%) | 544 (6.7%) |
| 50 to 54 Years | 638 (7.9%) | 607 (7.5%) |
| 55 to 59 Years | 520 (6.5%) | 649 (8.0%) |
| 60 to 64 Years | 711 (8.8%) | 531 (6.5%) |
| 65 to 69 Years | 560 (7.0%) | 513 (6.3%) |
| 70 to 74 Years | 286 (3.6%) | 436 (5.4%) |
| 75 to 79 Years | 323 (4.0%) | 330 (4.1%) |
| 80 to 84 Years | 103 (1.3%) | 166 (2.0%) |
| 85 Years and over | 115 (1.4%) | 213 (2.6%) |
| Total | 8,035 (100.0%) | 8,136 (100.0%) |
Families and Households in Rockcastle County
Median Family Size in Rockcastle County
The median family size in Rockcastle County is 3.00 persons per family, with married-couple families (3,410 | 78.2%) accounting for the largest median family size of 3.01 persons per family. On the other hand, single female/mother families (711 | 16.3%) represent the smallest median family size with 2.92 persons per family.

| Family Type | # Families | Family Size |
| Married-Couple | 3,410 (78.2%) | 3.01 |
| Single Male/Father | 241 (5.5%) | 2.98 |
| Single Female/Mother | 711 (16.3%) | 2.92 |
| Total Families | 4,362 (100.0%) | 3.00 |
Median Household Size in Rockcastle County
The median household size in Rockcastle County is 2.48 persons per household, with single male/father households (241 | 3.8%) accounting for the largest median household size of 3.21 persons per household. non-family households (2,018 | 31.6%) represent the smallest median household size with 1.22 persons per household.
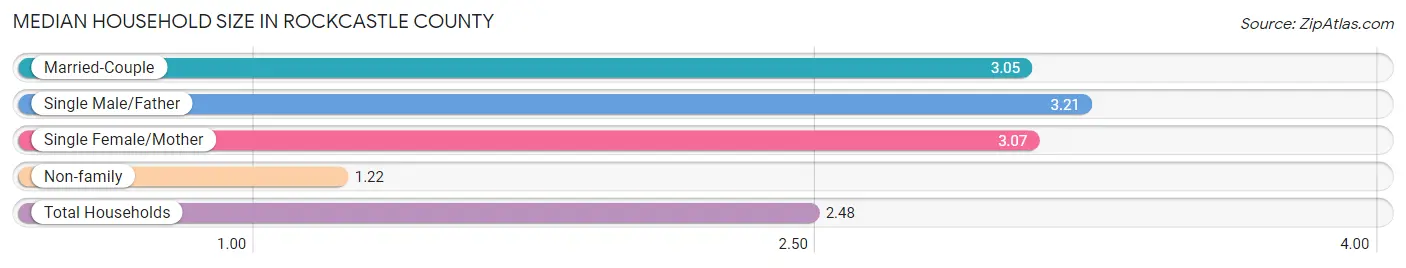
| Household Type | # Households | Household Size |
| Married-Couple | 3,410 (53.4%) | 3.05 |
| Single Male/Father | 241 (3.8%) | 3.21 |
| Single Female/Mother | 711 (11.1%) | 3.07 |
| Non-family | 2,018 (31.6%) | 1.22 |
| Total Households | 6,380 (100.0%) | 2.48 |
Household Size by Marriage Status in Rockcastle County
Out of a total of 6,380 households in Rockcastle County, 4,362 (68.4%) are family households, while 2,018 (31.6%) are nonfamily households. The most numerous type of family households are 2-person households, comprising 1,926, and the most common type of nonfamily households are 1-person households, comprising 1,781.

| Household Size | Family Households | Nonfamily Households |
| 1-Person Households | - | 1,781 (27.9%) |
| 2-Person Households | 1,926 (30.2%) | 145 (2.3%) |
| 3-Person Households | 1,031 (16.2%) | 21 (0.3%) |
| 4-Person Households | 803 (12.6%) | 71 (1.1%) |
| 5-Person Households | 461 (7.2%) | 0 (0.0%) |
| 6-Person Households | 116 (1.8%) | 0 (0.0%) |
| 7+ Person Households | 25 (0.4%) | 0 (0.0%) |
| Total | 4,362 (68.4%) | 2,018 (31.6%) |
Female Fertility in Rockcastle County
Fertility by Age in Rockcastle County
Average fertility rate in Rockcastle County is 58.0 births per 1,000 women. Women in the age bracket of 20 to 34 years have the highest fertility rate with 112.0 births per 1,000 women. Women in the age bracket of 20 to 34 years acount for 76.9% of all women with births.
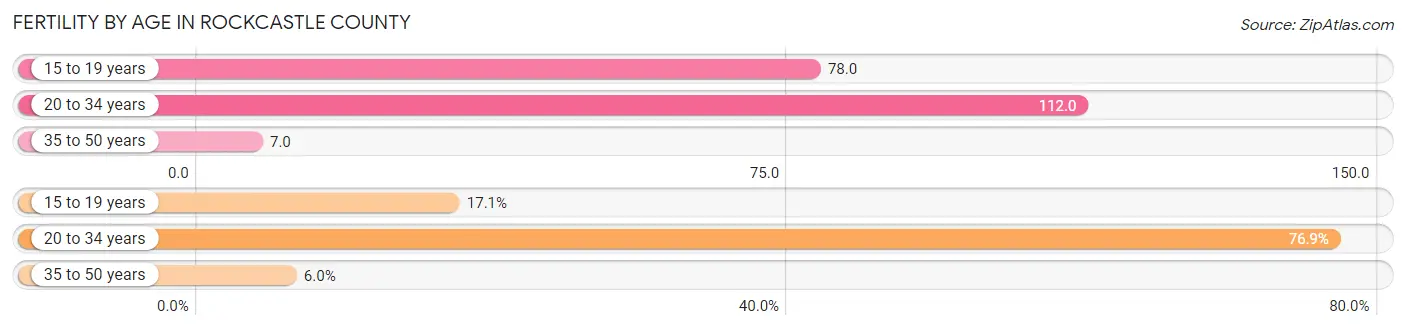
| Age Bracket | Women with Births | Births / 1,000 Women |
| 15 to 19 years | 34 (17.1%) | 78.0 |
| 20 to 34 years | 153 (76.9%) | 112.0 |
| 35 to 50 years | 12 (6.0%) | 7.0 |
| Total | 199 (100.0%) | 58.0 |
Fertility by Age by Marriage Status in Rockcastle County
37.7% of women with births (199) in Rockcastle County are married. The highest percentage of unmarried women with births falls into 15 to 19 years age bracket with 100.0% of them unmarried at the time of birth, while the lowest percentage of unmarried women with births belong to 35 to 50 years age bracket with 0.0% of them unmarried.
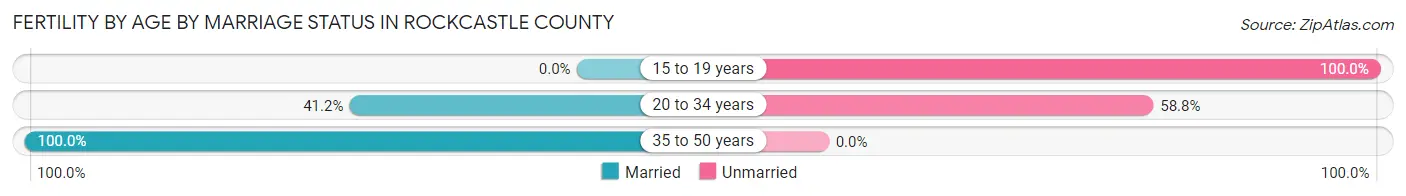
| Age Bracket | Married | Unmarried |
| 15 to 19 years | 0 (0.0%) | 34 (100.0%) |
| 20 to 34 years | 63 (41.2%) | 90 (58.8%) |
| 35 to 50 years | 12 (100.0%) | 0 (0.0%) |
| Total | 75 (37.7%) | 124 (62.3%) |
Fertility by Education in Rockcastle County
Average fertility rate in Rockcastle County is 58.0 births per 1,000 women. Women with the education attainment of college or associate's degree have the highest fertility rate of 101.0 births per 1,000 women, while women with the education attainment of bachelor's degree have the lowest fertility at 9.0 births per 1,000 women. Women with the education attainment of college or associate's degree represent 50.2% of all women with births.
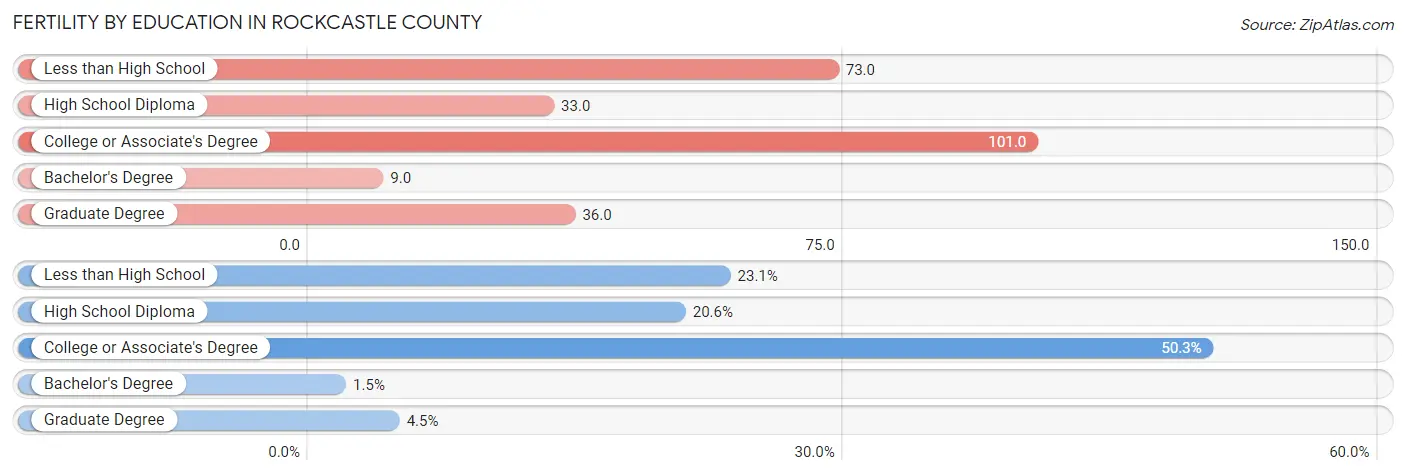
| Educational Attainment | Women with Births | Births / 1,000 Women |
| Less than High School | 46 (23.1%) | 73.0 |
| High School Diploma | 41 (20.6%) | 33.0 |
| College or Associate's Degree | 100 (50.2%) | 101.0 |
| Bachelor's Degree | 3 (1.5%) | 9.0 |
| Graduate Degree | 9 (4.5%) | 36.0 |
| Total | 199 (100.0%) | 58.0 |
Fertility by Education by Marriage Status in Rockcastle County
62.3% of women with births in Rockcastle County are unmarried. Women with the educational attainment of bachelor's degree are most likely to be married with 100.0% of them married at childbirth, while women with the educational attainment of less than high school are least likely to be married with 73.9% of them unmarried at childbirth.
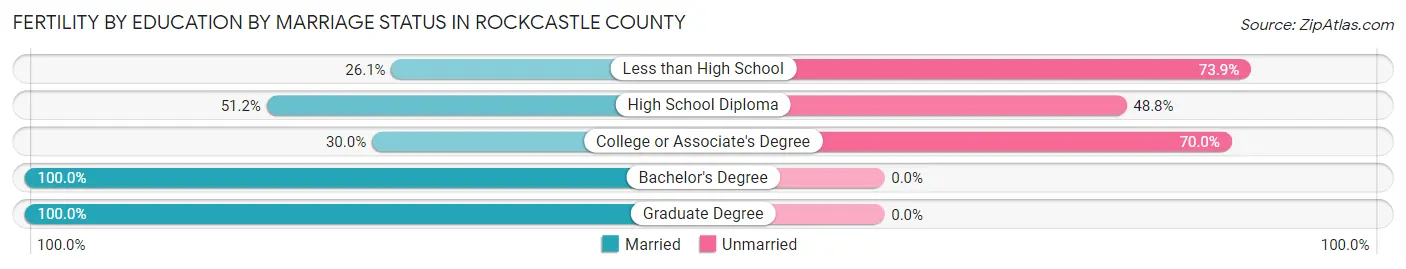
| Educational Attainment | Married | Unmarried |
| Less than High School | 12 (26.1%) | 34 (73.9%) |
| High School Diploma | 21 (51.2%) | 20 (48.8%) |
| College or Associate's Degree | 30 (30.0%) | 70 (70.0%) |
| Bachelor's Degree | 3 (100.0%) | 0 (0.0%) |
| Graduate Degree | 9 (100.0%) | 0 (0.0%) |
| Total | 75 (37.7%) | 124 (62.3%) |
Income in Rockcastle County
Income Overview in Rockcastle County
Per Capita Income in Rockcastle County is $26,640, while median incomes of families and households are $58,289 and $45,693 respectively.
| Characteristic | Number | Measure |
| Per Capita Income | 16,171 | $26,640 |
| Median Family Income | 4,362 | $58,289 |
| Mean Family Income | 4,362 | $77,061 |
| Median Household Income | 6,380 | $45,693 |
| Mean Household Income | 6,380 | $63,530 |
| Income Deficit | 4,362 | $11,362 |
| Wage / Income Gap (%) | 16,171 | 37.05% |
| Wage / Income Gap ($) | 16,171 | 62.95¢ per $1 |
| Gini / Inequality Index | 16,171 | 0.50 |
Earnings by Sex in Rockcastle County
Average Earnings in Rockcastle County are $33,948, $42,500 for men and $26,753 for women, a difference of 37.0%.
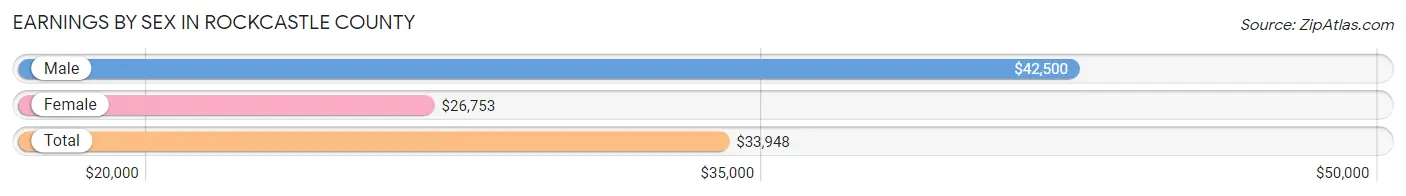
| Sex | Number | Average Earnings |
| Male | 3,832 (56.4%) | $42,500 |
| Female | 2,958 (43.6%) | $26,753 |
| Total | 6,790 (100.0%) | $33,948 |
Earnings by Sex by Income Bracket in Rockcastle County
The most common earnings brackets in Rockcastle County are $45,000 to $49,999 for men (367 | 9.6%) and $25,000 to $29,999 for women (358 | 12.1%).

| Income | Male | Female |
| $2,499 or less | 143 (3.7%) | 188 (6.4%) |
| $2,500 to $4,999 | 168 (4.4%) | 74 (2.5%) |
| $5,000 to $7,499 | 119 (3.1%) | 112 (3.8%) |
| $7,500 to $9,999 | 57 (1.5%) | 64 (2.2%) |
| $10,000 to $12,499 | 69 (1.8%) | 186 (6.3%) |
| $12,500 to $14,999 | 83 (2.2%) | 102 (3.5%) |
| $15,000 to $17,499 | 100 (2.6%) | 101 (3.4%) |
| $17,500 to $19,999 | 38 (1.0%) | 200 (6.8%) |
| $20,000 to $22,499 | 70 (1.8%) | 132 (4.5%) |
| $22,500 to $24,999 | 223 (5.8%) | 151 (5.1%) |
| $25,000 to $29,999 | 226 (5.9%) | 358 (12.1%) |
| $30,000 to $34,999 | 296 (7.7%) | 260 (8.8%) |
| $35,000 to $39,999 | 179 (4.7%) | 256 (8.6%) |
| $40,000 to $44,999 | 284 (7.4%) | 122 (4.1%) |
| $45,000 to $49,999 | 367 (9.6%) | 67 (2.3%) |
| $50,000 to $54,999 | 192 (5.0%) | 98 (3.3%) |
| $55,000 to $64,999 | 365 (9.5%) | 220 (7.4%) |
| $65,000 to $74,999 | 307 (8.0%) | 121 (4.1%) |
| $75,000 to $99,999 | 225 (5.9%) | 38 (1.3%) |
| $100,000+ | 321 (8.4%) | 108 (3.6%) |
| Total | 3,832 (100.0%) | 2,958 (100.0%) |
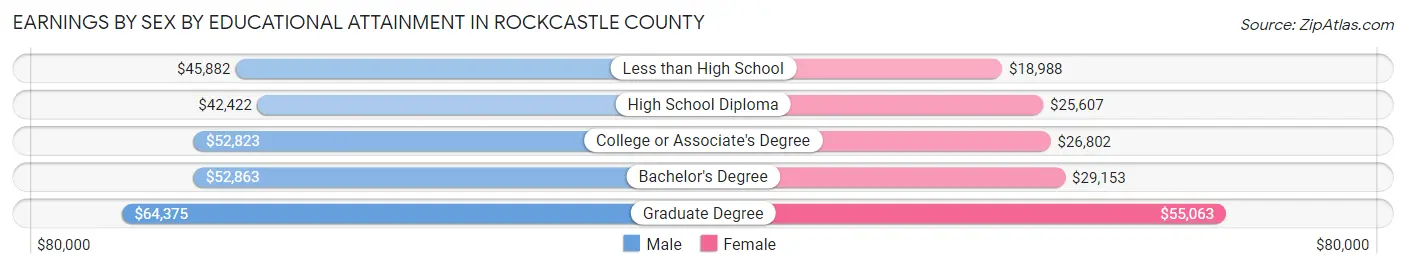
Earnings by Sex by Educational Attainment in Rockcastle County
Average earnings in Rockcastle County are $45,941 for men and $28,310 for women, a difference of 38.4%. Men with an educational attainment of graduate degree enjoy the highest average annual earnings of $64,375, while those with high school diploma education earn the least with $42,422. Women with an educational attainment of graduate degree earn the most with the average annual earnings of $55,063, while those with less than high school education have the smallest earnings of $18,988.
| Educational Attainment | Male Income | Female Income |
| Less than High School | $45,882 | $18,988 |
| High School Diploma | $42,422 | $25,607 |
| College or Associate's Degree | $52,823 | $26,802 |
| Bachelor's Degree | $52,863 | $29,153 |
| Graduate Degree | $64,375 | $55,063 |
| Total | $45,941 | $28,310 |
Family Income in Rockcastle County
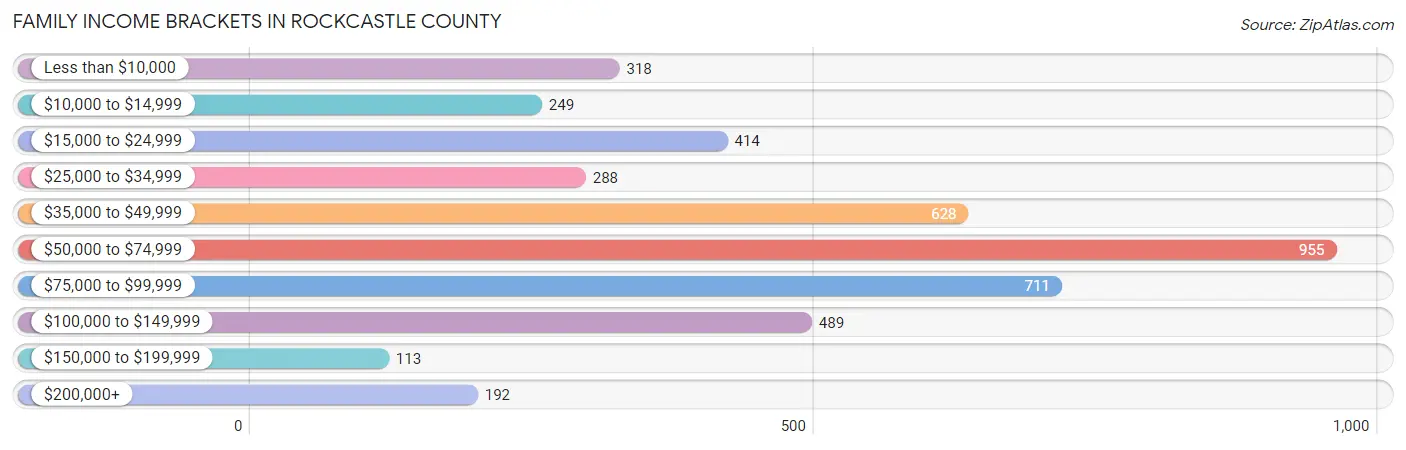
Family Income Brackets in Rockcastle County
According to the Rockcastle County family income data, there are 955 families falling into the $50,000 to $74,999 income range, which is the most common income bracket and makes up 21.9% of all families. Conversely, the $150,000 to $199,999 income bracket is the least frequent group with only 113 families (2.6%) belonging to this category.
| Income Bracket | # Families | % Families |
| Less than $10,000 | 318 | 7.3% |
| $10,000 to $14,999 | 249 | 5.7% |
| $15,000 to $24,999 | 414 | 9.5% |
| $25,000 to $34,999 | 288 | 6.6% |
| $35,000 to $49,999 | 628 | 14.4% |
| $50,000 to $74,999 | 955 | 21.9% |
| $75,000 to $99,999 | 711 | 16.3% |
| $100,000 to $149,999 | 489 | 11.2% |
| $150,000 to $199,999 | 113 | 2.6% |
| $200,000+ | 192 | 4.4% |
Family Income by Famaliy Size in Rockcastle County
6-person families (91 | 2.1%) account for the highest median family income in Rockcastle County with $105,724 per family, while 2-person families (2,043 | 46.8%) have the highest median income of $23,286 per family member.

| Income Bracket | # Families | Median Income |
| 2-Person Families | 2,043 (46.8%) | $46,572 |
| 3-Person Families | 977 (22.4%) | $57,036 |
| 4-Person Families | 789 (18.1%) | $69,308 |
| 5-Person Families | 440 (10.1%) | $92,639 |
| 6-Person Families | 91 (2.1%) | $105,724 |
| 7+ Person Families | 22 (0.5%) | $0 |
| Total | 4,362 (100.0%) | $58,289 |
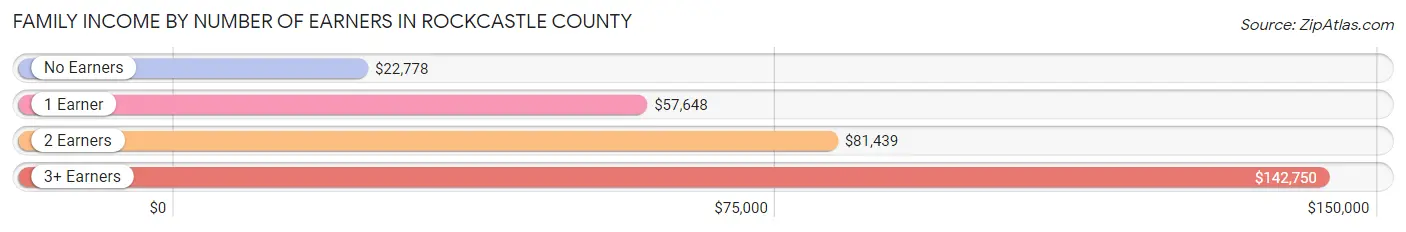
Family Income by Number of Earners in Rockcastle County
The median family income in Rockcastle County is $58,289, with families comprising 3+ earners (226) having the highest median family income of $142,750, while families with no earners (1,176) have the lowest median family income of $22,778, accounting for 5.2% and 27.0% of families, respectively.
| Number of Earners | # Families | Median Income |
| No Earners | 1,176 (27.0%) | $22,778 |
| 1 Earner | 1,393 (31.9%) | $57,648 |
| 2 Earners | 1,567 (35.9%) | $81,439 |
| 3+ Earners | 226 (5.2%) | $142,750 |
| Total | 4,362 (100.0%) | $58,289 |
Household Income in Rockcastle County
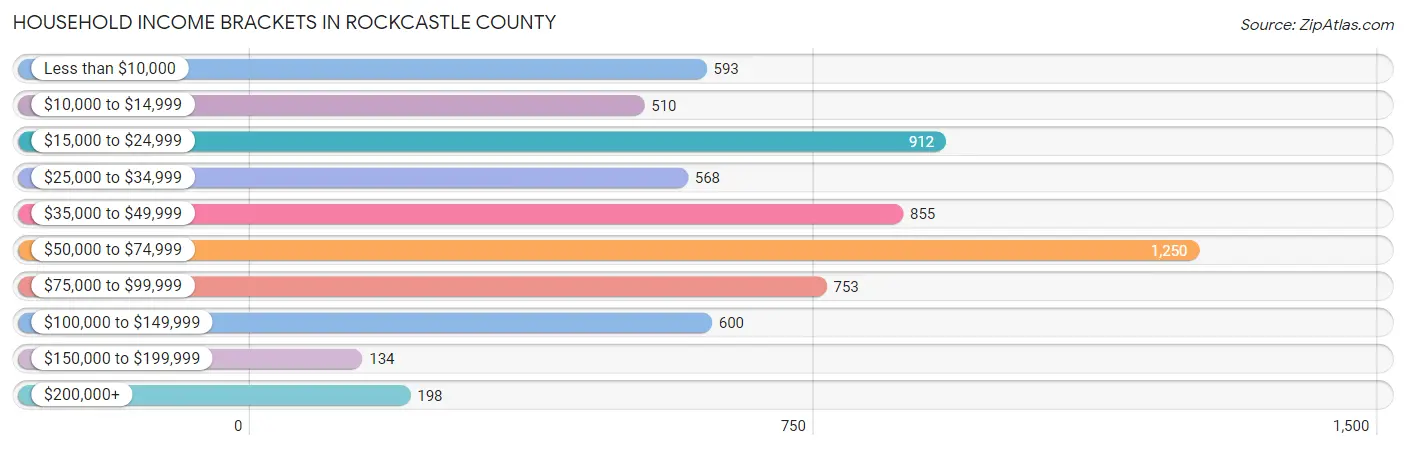
Household Income Brackets in Rockcastle County
With 1,250 households falling in the category, the $50,000 to $74,999 income range is the most frequent in Rockcastle County, accounting for 19.6% of all households. In contrast, only 134 households (2.1%) fall into the $150,000 to $199,999 income bracket, making it the least populous group.
| Income Bracket | # Households | % Households |
| Less than $10,000 | 593 | 9.3% |
| $10,000 to $14,999 | 510 | 8.0% |
| $15,000 to $24,999 | 912 | 14.3% |
| $25,000 to $34,999 | 568 | 8.9% |
| $35,000 to $49,999 | 855 | 13.4% |
| $50,000 to $74,999 | 1,250 | 19.6% |
| $75,000 to $99,999 | 753 | 11.8% |
| $100,000 to $149,999 | 600 | 9.4% |
| $150,000 to $199,999 | 134 | 2.1% |
| $200,000+ | 198 | 3.1% |
Household Income by Householder Age in Rockcastle County
The median household income in Rockcastle County is $45,693, with the highest median household income of $66,649 found in the 25 to 44 years age bracket for the primary householder. A total of 1,474 households (23.1%) fall into this category. Meanwhile, the 65+ years age bracket for the primary householder has the lowest median household income of $27,482, with 2,013 households (31.6%) in this group.
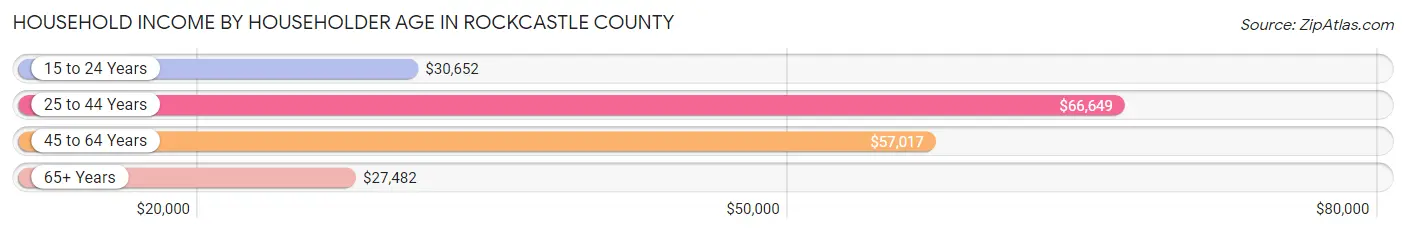
| Income Bracket | # Households | Median Income |
| 15 to 24 Years | 244 (3.8%) | $30,652 |
| 25 to 44 Years | 1,474 (23.1%) | $66,649 |
| 45 to 64 Years | 2,649 (41.5%) | $57,017 |
| 65+ Years | 2,013 (31.6%) | $27,482 |
| Total | 6,380 (100.0%) | $45,693 |
Poverty in Rockcastle County
Income Below Poverty by Sex and Age in Rockcastle County
With 21.6% poverty level for males and 25.4% for females among the residents of Rockcastle County, 6 to 11 year old males and under 5 year old females are the most vulnerable to poverty, with 257 males (41.5%) and 186 females (46.6%) in their respective age groups living below the poverty level.

| Age Bracket | Male | Female |
| Under 5 Years | 108 (26.1%) | 186 (46.6%) |
| 5 Years | 0 (0.0%) | 23 (19.3%) |
| 6 to 11 Years | 257 (41.5%) | 169 (32.3%) |
| 12 to 14 Years | 85 (37.1%) | 88 (35.2%) |
| 15 Years | 0 (0.0%) | 27 (26.2%) |
| 16 and 17 Years | 89 (38.9%) | 75 (32.1%) |
| 18 to 24 Years | 78 (12.0%) | 198 (35.9%) |
| 25 to 34 Years | 197 (20.9%) | 243 (26.6%) |
| 35 to 44 Years | 96 (11.4%) | 214 (22.3%) |
| 45 to 54 Years | 323 (28.1%) | 217 (19.0%) |
| 55 to 64 Years | 192 (15.8%) | 226 (19.6%) |
| 65 to 74 Years | 150 (18.6%) | 180 (19.4%) |
| 75 Years and over | 112 (21.6%) | 160 (26.5%) |
| Total | 1,687 (21.6%) | 2,006 (25.4%) |
Income Above Poverty by Sex and Age in Rockcastle County
According to the poverty statistics in Rockcastle County, males aged 5 years and females aged 45 to 54 years are the age groups that are most secure financially, with 100.0% of males and 81.0% of females in these age groups living above the poverty line.
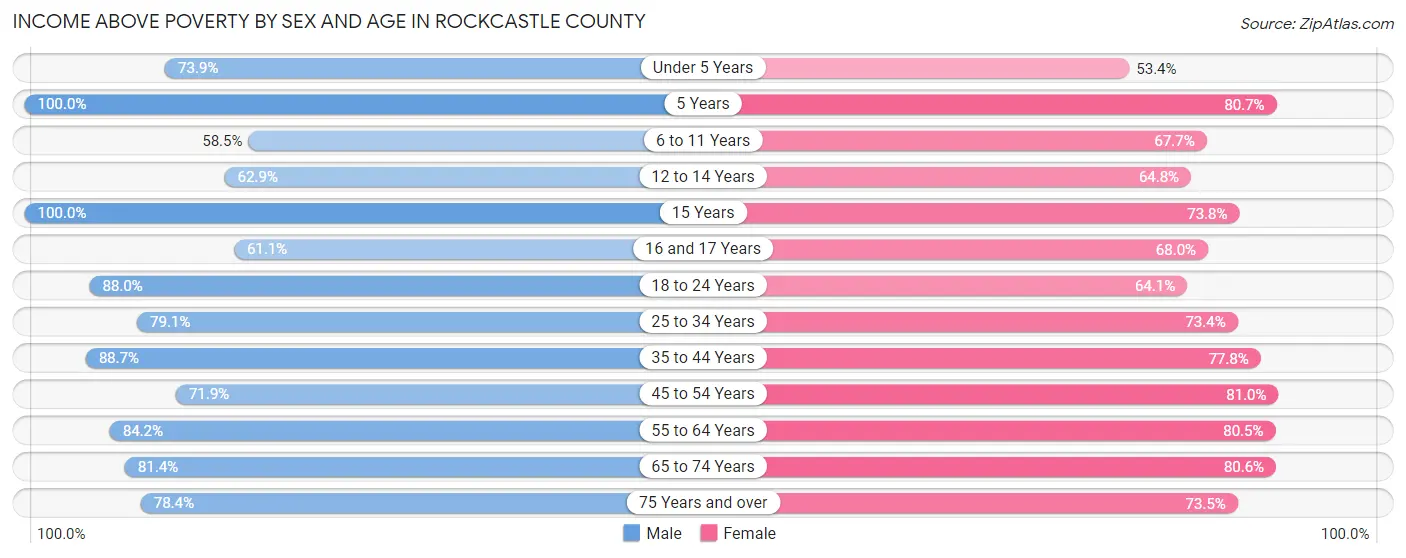
| Age Bracket | Male | Female |
| Under 5 Years | 306 (73.9%) | 213 (53.4%) |
| 5 Years | 84 (100.0%) | 96 (80.7%) |
| 6 to 11 Years | 362 (58.5%) | 354 (67.7%) |
| 12 to 14 Years | 144 (62.9%) | 162 (64.8%) |
| 15 Years | 93 (100.0%) | 76 (73.8%) |
| 16 and 17 Years | 140 (61.1%) | 159 (67.9%) |
| 18 to 24 Years | 570 (88.0%) | 353 (64.1%) |
| 25 to 34 Years | 746 (79.1%) | 672 (73.4%) |
| 35 to 44 Years | 750 (88.6%) | 748 (77.7%) |
| 45 to 54 Years | 827 (71.9%) | 927 (81.0%) |
| 55 to 64 Years | 1,022 (84.2%) | 930 (80.4%) |
| 65 to 74 Years | 655 (81.4%) | 747 (80.6%) |
| 75 Years and over | 407 (78.4%) | 443 (73.5%) |
| Total | 6,106 (78.3%) | 5,880 (74.6%) |
Income Below Poverty Among Married-Couple Families in Rockcastle County
The poverty statistics for married-couple families in Rockcastle County show that 13.2% or 450 of the total 3,410 families live below the poverty line. Families with 1 or 2 children have the highest poverty rate of 19.3%, comprising of 201 families. On the other hand, families with 5 or more children have the lowest poverty rate of 0.0%, which includes 0 families.
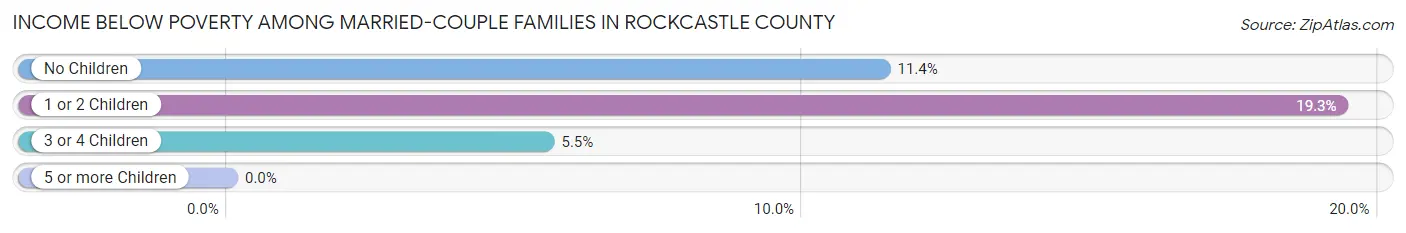
| Children | Above Poverty | Below Poverty |
| No Children | 1,794 (88.6%) | 230 (11.4%) |
| 1 or 2 Children | 839 (80.7%) | 201 (19.3%) |
| 3 or 4 Children | 326 (94.5%) | 19 (5.5%) |
| 5 or more Children | 1 (100.0%) | 0 (0.0%) |
| Total | 2,960 (86.8%) | 450 (13.2%) |
Income Below Poverty Among Single-Parent Households in Rockcastle County
According to the poverty data in Rockcastle County, 22.8% or 55 single-father households and 51.0% or 363 single-mother households are living below the poverty line. Among single-father households, those with 1 or 2 children have the highest poverty rate, with 55 households (38.5%) experiencing poverty. Likewise, among single-mother households, those with 3 or 4 children have the highest poverty rate, with 76 households (100.0%) falling below the poverty line.
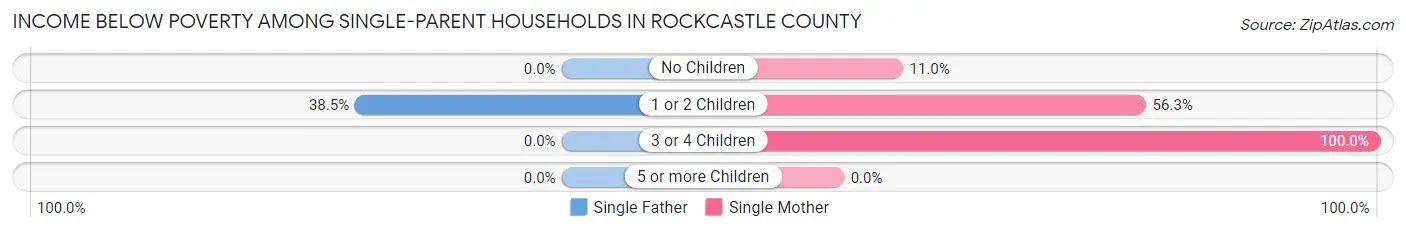
| Children | Single Father | Single Mother |
| No Children | 0 (0.0%) | 17 (11.0%) |
| 1 or 2 Children | 55 (38.5%) | 270 (56.2%) |
| 3 or 4 Children | 0 (0.0%) | 76 (100.0%) |
| 5 or more Children | 0 (0.0%) | 0 (0.0%) |
| Total | 55 (22.8%) | 363 (51.0%) |
Income Below Poverty Among Married-Couple vs Single-Parent Households in Rockcastle County
The poverty data for Rockcastle County shows that 450 of the married-couple family households (13.2%) and 418 of the single-parent households (43.9%) are living below the poverty level. Within the married-couple family households, those with 1 or 2 children have the highest poverty rate, with 201 households (19.3%) falling below the poverty line. Among the single-parent households, those with 3 or 4 children have the highest poverty rate, with 76 household (88.4%) living below poverty.
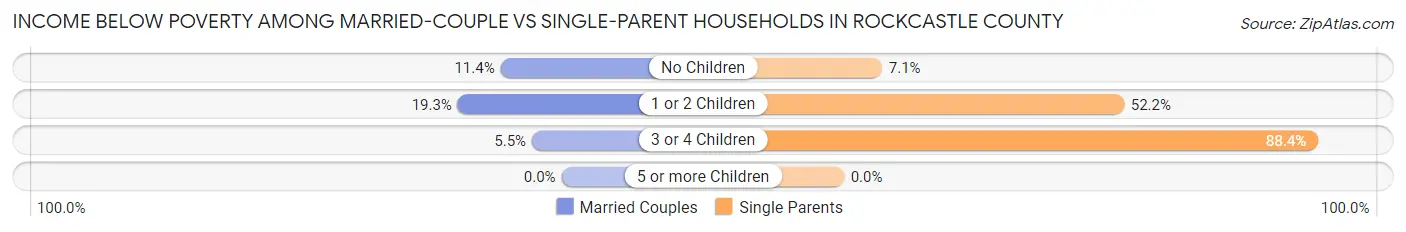
| Children | Married-Couple Families | Single-Parent Households |
| No Children | 230 (11.4%) | 17 (7.1%) |
| 1 or 2 Children | 201 (19.3%) | 325 (52.2%) |
| 3 or 4 Children | 19 (5.5%) | 76 (88.4%) |
| 5 or more Children | 0 (0.0%) | 0 (0.0%) |
| Total | 450 (13.2%) | 418 (43.9%) |
Employment Characteristics in Rockcastle County
Employment by Class of Employer in Rockcastle County
Among the 5,875 employed individuals in Rockcastle County, private company employees (3,919 | 66.7%), not-for-profit organizations (450 | 7.7%), and local government employees (431 | 7.3%) make up the most common classes of employment.

| Employer Class | # Employees | % Employees |
| Private Company Employees | 3,919 | 66.7% |
| Self-Employed (Incorporated) | 56 | 0.9% |
| Self-Employed (Not Incorporated) | 384 | 6.5% |
| Not-for-profit Organizations | 450 | 7.7% |
| Local Government Employees | 431 | 7.3% |
| State Government Employees | 368 | 6.3% |
| Federal Government Employees | 260 | 4.4% |
| Unpaid Family Workers | 7 | 0.1% |
| Total | 5,875 | 100.0% |
Employment Status by Age in Rockcastle County
According to the labor force statistics for Rockcastle County, out of the total population over 16 years of age (13,159), 49.3% or 6,487 individuals are in the labor force, with 6.6% or 428 of them unemployed. The age group with the highest labor force participation rate is 25 to 29 years, with 79.0% or 747 individuals in the labor force. Within the labor force, the 16 to 19 years age range has the highest percentage of unemployed individuals, with 22.4% or 38 of them being unemployed.
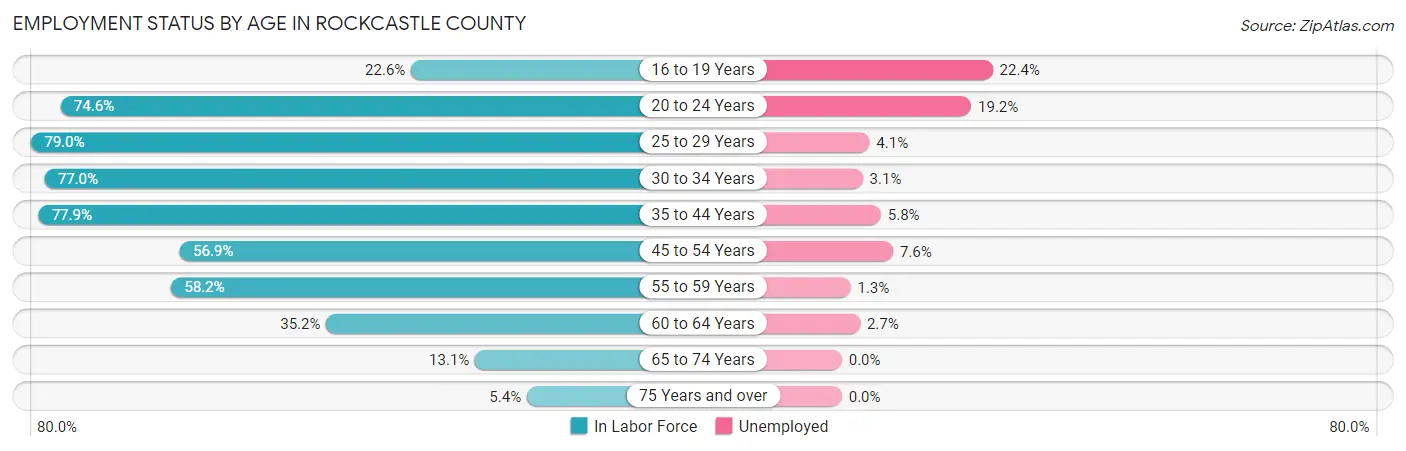
| Age Bracket | In Labor Force | Unemployed |
| 16 to 19 Years | 170 (22.6%) | 38 (22.4%) |
| 20 to 24 Years | 683 (74.6%) | 131 (19.2%) |
| 25 to 29 Years | 747 (79.0%) | 31 (4.1%) |
| 30 to 34 Years | 719 (77.0%) | 22 (3.1%) |
| 35 to 44 Years | 1,435 (77.9%) | 83 (5.8%) |
| 45 to 54 Years | 1,317 (56.9%) | 100 (7.6%) |
| 55 to 59 Years | 680 (58.2%) | 9 (1.3%) |
| 60 to 64 Years | 437 (35.2%) | 12 (2.7%) |
| 65 to 74 Years | 235 (13.1%) | 0 (0.0%) |
| 75 Years and over | 68 (5.4%) | 0 (0.0%) |
| Total | 6,487 (49.3%) | 428 (6.6%) |
Employment Status by Educational Attainment in Rockcastle County
According to labor force statistics for Rockcastle County, 63.2% of individuals (5,339) out of the total population between 25 and 64 years of age (8,447) are in the labor force, with 4.8% or 256 of them being unemployed. The group with the highest labor force participation rate are those with the educational attainment of bachelor's degree or higher, with 87.1% or 1,000 individuals in the labor force. Within the labor force, individuals with college / associate degree education have the highest percentage of unemployment, with 6.8% or 110 of them being unemployed.
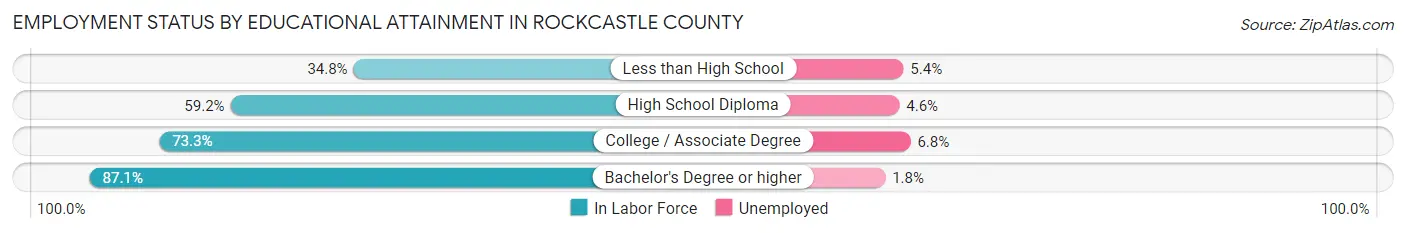
| Educational Attainment | In Labor Force | Unemployed |
| Less than High School | 427 (34.8%) | 66 (5.4%) |
| High School Diploma | 2,285 (59.2%) | 178 (4.6%) |
| College / Associate Degree | 1,623 (73.3%) | 151 (6.8%) |
| Bachelor's Degree or higher | 1,000 (87.1%) | 21 (1.8%) |
| Total | 5,339 (63.2%) | 405 (4.8%) |
Employment Occupations by Sex in Rockcastle County
Management, Business, Science and Arts Occupations
The most common Management, Business, Science and Arts occupations in Rockcastle County are Community & Social Service (558 | 9.2%), Education Instruction & Library (476 | 7.9%), Management (388 | 6.4%), Health Diagnosing & Treating (358 | 5.9%), and Health Technologists (244 | 4.0%).

Management, Business, Science and Arts Occupations by Sex
Within the Management, Business, Science and Arts occupations in Rockcastle County, the most male-oriented occupations are Architecture & Engineering (100.0%), Legal Services & Support (100.0%), and Computers, Engineering & Science (84.4%), while the most female-oriented occupations are Arts, Media & Entertainment (100.0%), Health Technologists (81.6%), and Education Instruction & Library (73.7%).
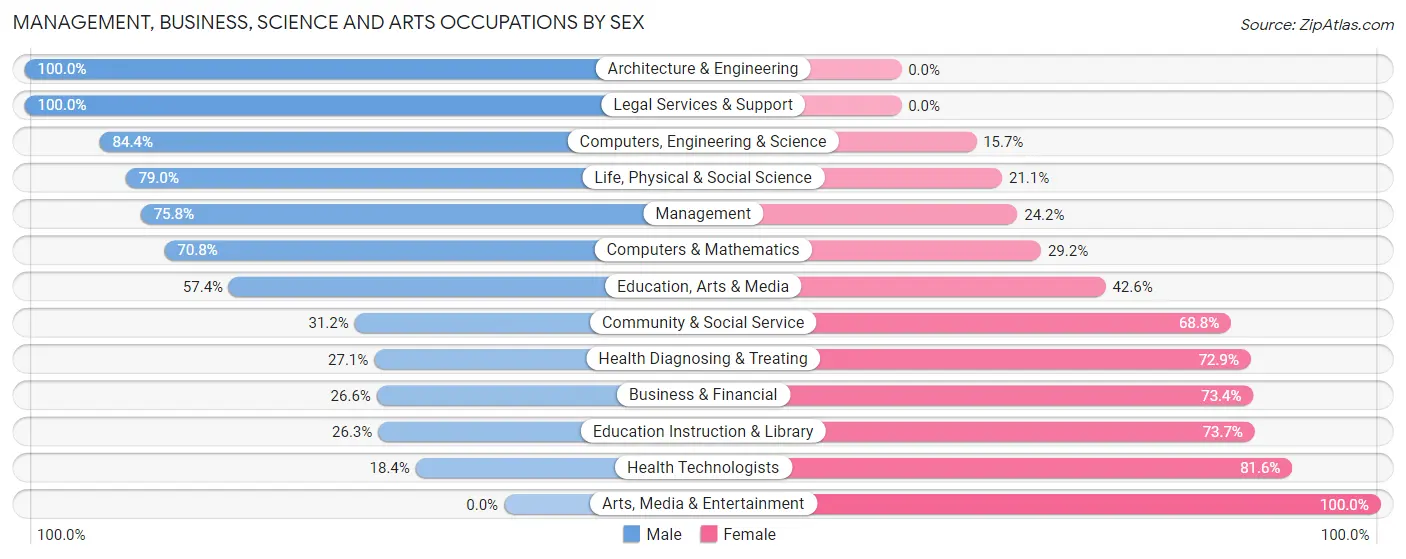
| Occupation | Male | Female |
| Management | 294 (75.8%) | 94 (24.2%) |
| Business & Financial | 51 (26.6%) | 141 (73.4%) |
| Computers, Engineering & Science | 194 (84.4%) | 36 (15.7%) |
| Computers & Mathematics | 68 (70.8%) | 28 (29.2%) |
| Architecture & Engineering | 96 (100.0%) | 0 (0.0%) |
| Life, Physical & Social Science | 30 (78.9%) | 8 (21.0%) |
| Community & Social Service | 174 (31.2%) | 384 (68.8%) |
| Education, Arts & Media | 35 (57.4%) | 26 (42.6%) |
| Legal Services & Support | 14 (100.0%) | 0 (0.0%) |
| Education Instruction & Library | 125 (26.3%) | 351 (73.7%) |
| Arts, Media & Entertainment | 0 (0.0%) | 7 (100.0%) |
| Health Diagnosing & Treating | 97 (27.1%) | 261 (72.9%) |
| Health Technologists | 45 (18.4%) | 199 (81.6%) |
| Total (Category) | 810 (46.9%) | 916 (53.1%) |
| Total (Overall) | 3,482 (57.4%) | 2,584 (42.6%) |
Services Occupations
The most common Services occupations in Rockcastle County are Food Preparation & Serving (296 | 4.9%), Cleaning & Maintenance (238 | 3.9%), Healthcare Support (158 | 2.6%), Security & Protection (96 | 1.6%), and Personal Care & Service (88 | 1.5%).

Services Occupations by Sex
Within the Services occupations in Rockcastle County, the most male-oriented occupations are Firefighting & Prevention (100.0%), Security & Protection (87.5%), and Food Preparation & Serving (40.9%), while the most female-oriented occupations are Healthcare Support (100.0%), Law Enforcement (100.0%), and Cleaning & Maintenance (90.8%).
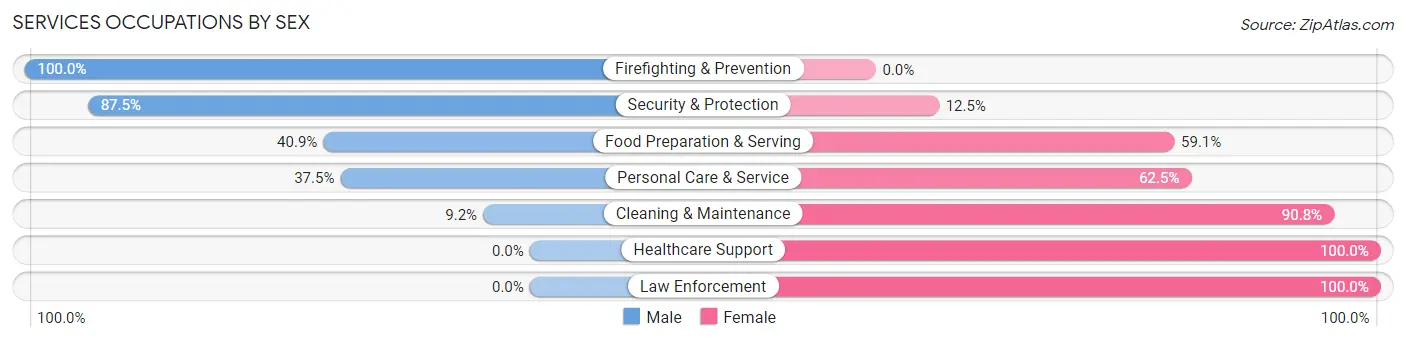
| Occupation | Male | Female |
| Healthcare Support | 0 (0.0%) | 158 (100.0%) |
| Security & Protection | 84 (87.5%) | 12 (12.5%) |
| Firefighting & Prevention | 84 (100.0%) | 0 (0.0%) |
| Law Enforcement | 0 (0.0%) | 12 (100.0%) |
| Food Preparation & Serving | 121 (40.9%) | 175 (59.1%) |
| Cleaning & Maintenance | 22 (9.2%) | 216 (90.8%) |
| Personal Care & Service | 33 (37.5%) | 55 (62.5%) |
| Total (Category) | 260 (29.7%) | 616 (70.3%) |
| Total (Overall) | 3,482 (57.4%) | 2,584 (42.6%) |
Sales and Office Occupations
The most common Sales and Office occupations in Rockcastle County are Office & Administration (955 | 15.7%), and Sales & Related (368 | 6.1%).
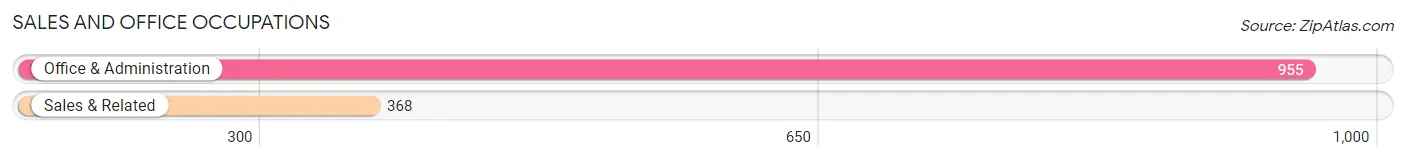
Sales and Office Occupations by Sex

| Occupation | Male | Female |
| Sales & Related | 237 (64.4%) | 131 (35.6%) |
| Office & Administration | 234 (24.5%) | 721 (75.5%) |
| Total (Category) | 471 (35.6%) | 852 (64.4%) |
| Total (Overall) | 3,482 (57.4%) | 2,584 (42.6%) |
Natural Resources, Construction and Maintenance Occupations
The most common Natural Resources, Construction and Maintenance occupations in Rockcastle County are Construction & Extraction (474 | 7.8%), Installation, Maintenance & Repair (237 | 3.9%), and Farming, Fishing & Forestry (3 | 0.1%).

Natural Resources, Construction and Maintenance Occupations by Sex
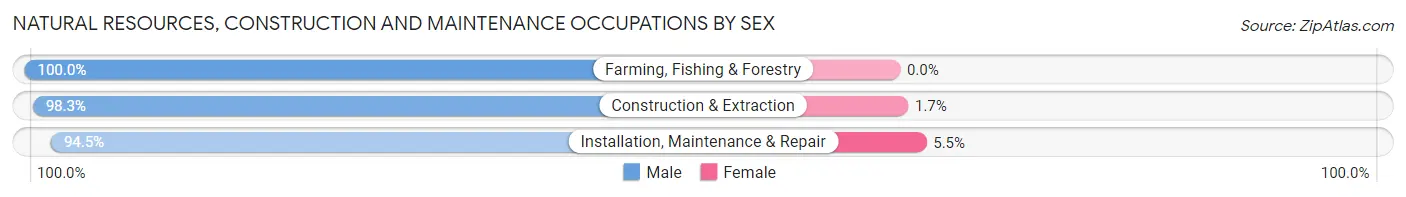
| Occupation | Male | Female |
| Farming, Fishing & Forestry | 3 (100.0%) | 0 (0.0%) |
| Construction & Extraction | 466 (98.3%) | 8 (1.7%) |
| Installation, Maintenance & Repair | 224 (94.5%) | 13 (5.5%) |
| Total (Category) | 693 (97.1%) | 21 (2.9%) |
| Total (Overall) | 3,482 (57.4%) | 2,584 (42.6%) |
Production, Transportation and Moving Occupations
The most common Production, Transportation and Moving occupations in Rockcastle County are Production (806 | 13.3%), Material Moving (401 | 6.6%), and Transportation (220 | 3.6%).
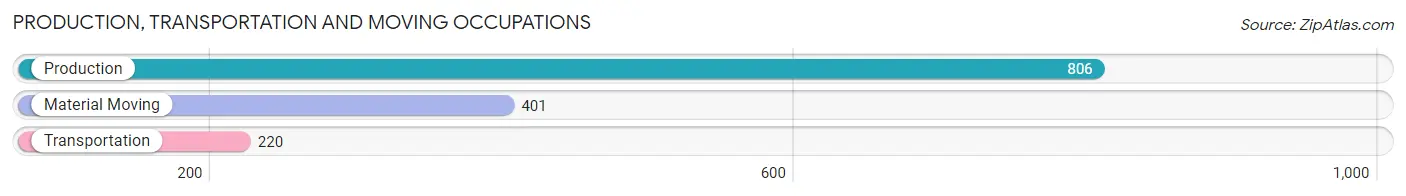
Production, Transportation and Moving Occupations by Sex
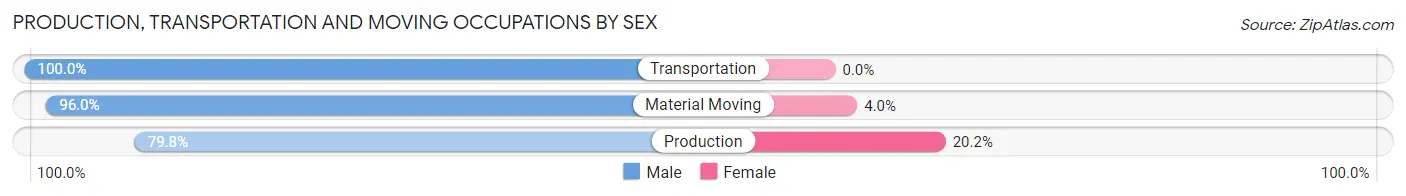
| Occupation | Male | Female |
| Production | 643 (79.8%) | 163 (20.2%) |
| Transportation | 220 (100.0%) | 0 (0.0%) |
| Material Moving | 385 (96.0%) | 16 (4.0%) |
| Total (Category) | 1,248 (87.5%) | 179 (12.5%) |
| Total (Overall) | 3,482 (57.4%) | 2,584 (42.6%) |
Employment Industries by Sex in Rockcastle County
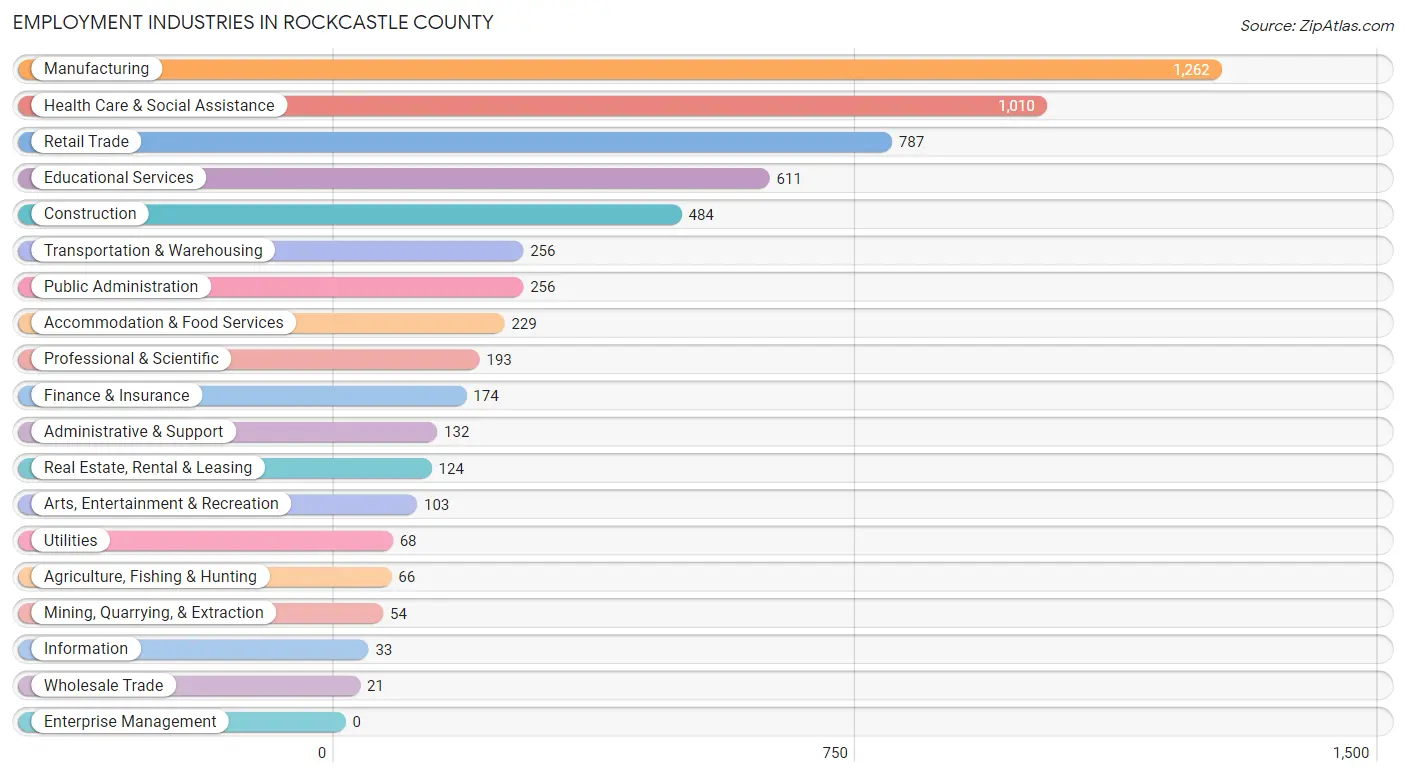
Employment Industries in Rockcastle County
The major employment industries in Rockcastle County include Manufacturing (1,262 | 20.8%), Health Care & Social Assistance (1,010 | 16.7%), Retail Trade (787 | 13.0%), Educational Services (611 | 10.1%), and Construction (484 | 8.0%).
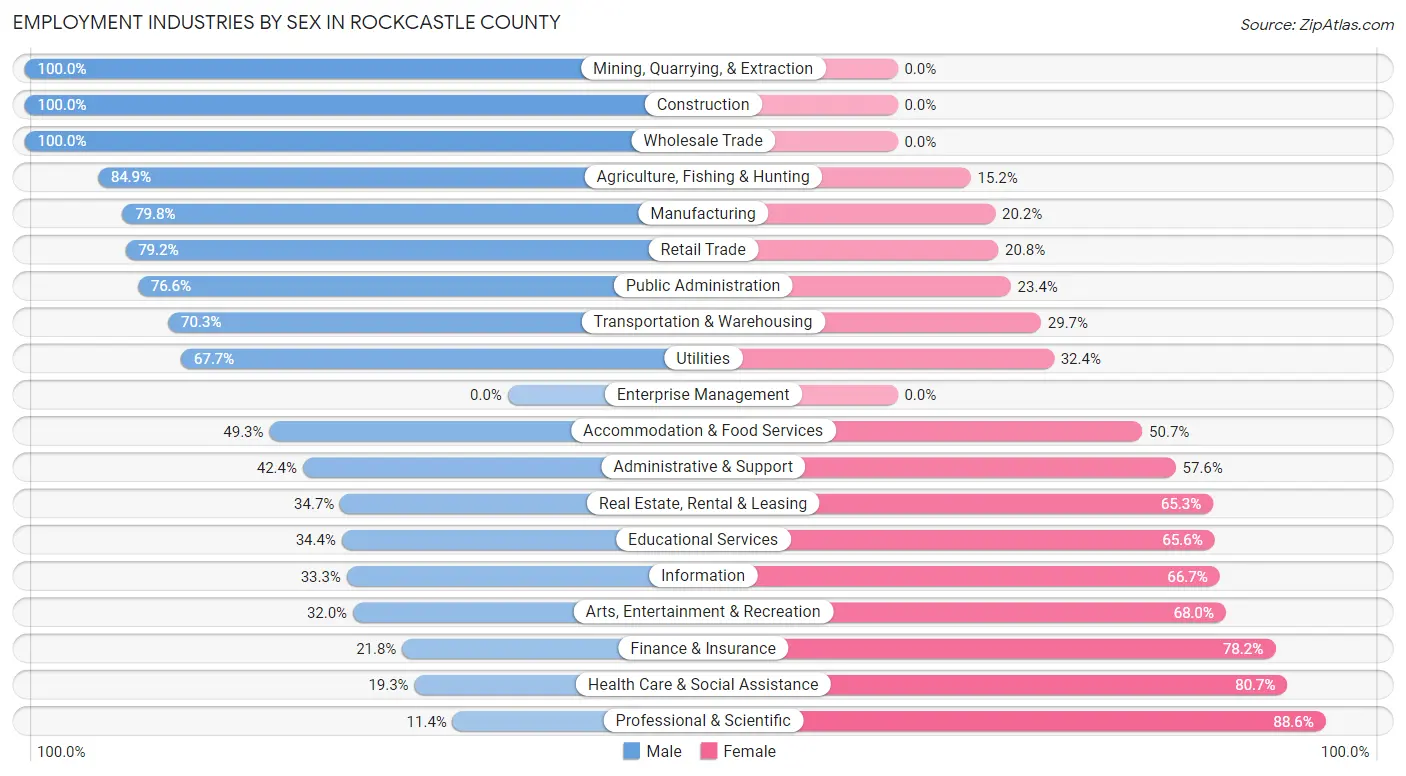
Employment Industries by Sex in Rockcastle County
The Rockcastle County industries that see more men than women are Mining, Quarrying, & Extraction (100.0%), Construction (100.0%), and Wholesale Trade (100.0%), whereas the industries that tend to have a higher number of women are Professional & Scientific (88.6%), Health Care & Social Assistance (80.7%), and Finance & Insurance (78.2%).
| Industry | Male | Female |
| Agriculture, Fishing & Hunting | 56 (84.9%) | 10 (15.1%) |
| Mining, Quarrying, & Extraction | 54 (100.0%) | 0 (0.0%) |
| Construction | 484 (100.0%) | 0 (0.0%) |
| Manufacturing | 1,007 (79.8%) | 255 (20.2%) |
| Wholesale Trade | 21 (100.0%) | 0 (0.0%) |
| Retail Trade | 623 (79.2%) | 164 (20.8%) |
| Transportation & Warehousing | 180 (70.3%) | 76 (29.7%) |
| Utilities | 46 (67.6%) | 22 (32.4%) |
| Information | 11 (33.3%) | 22 (66.7%) |
| Finance & Insurance | 38 (21.8%) | 136 (78.2%) |
| Real Estate, Rental & Leasing | 43 (34.7%) | 81 (65.3%) |
| Professional & Scientific | 22 (11.4%) | 171 (88.6%) |
| Enterprise Management | 0 (0.0%) | 0 (0.0%) |
| Administrative & Support | 56 (42.4%) | 76 (57.6%) |
| Educational Services | 210 (34.4%) | 401 (65.6%) |
| Health Care & Social Assistance | 195 (19.3%) | 815 (80.7%) |
| Arts, Entertainment & Recreation | 33 (32.0%) | 70 (68.0%) |
| Accommodation & Food Services | 113 (49.3%) | 116 (50.7%) |
| Public Administration | 196 (76.6%) | 60 (23.4%) |
| Total | 3,482 (57.4%) | 2,584 (42.6%) |
Education in Rockcastle County
School Enrollment in Rockcastle County
The most common levels of schooling among the 3,235 students in Rockcastle County are middle school (830 | 25.7%), high school (770 | 23.8%), and elementary school (758 | 23.4%).

| School Level | # Students | % Students |
| Nursery / Preschool | 158 | 4.9% |
| Kindergarten | 196 | 6.1% |
| Elementary School | 758 | 23.4% |
| Middle School | 830 | 25.7% |
| High School | 770 | 23.8% |
| College / Undergraduate | 457 | 14.1% |
| Graduate / Professional | 66 | 2.0% |
| Total | 3,235 | 100.0% |
School Enrollment by Age by Funding Source in Rockcastle County
Out of a total of 3,235 students who are enrolled in schools in Rockcastle County, 249 (7.7%) attend a private institution, while the remaining 2,986 (92.3%) are enrolled in public schools. The age group of 35 years and over has the highest likelihood of being enrolled in private schools, with 162 (73.0% in the age bracket) enrolled. Conversely, the age group of 3 to 4 year olds has the lowest likelihood of being enrolled in a private school, with 110 (100.0% in the age bracket) attending a public institution.

| Age Bracket | Public School | Private School |
| 3 to 4 Year Olds | 110 (100.0%) | 0 (0.0%) |
| 5 to 9 Year Old | 974 (98.4%) | 16 (1.6%) |
| 10 to 14 Year Olds | 802 (100.0%) | 0 (0.0%) |
| 15 to 17 Year Olds | 659 (100.0%) | 0 (0.0%) |
| 18 to 19 Year Olds | 185 (92.0%) | 16 (8.0%) |
| 20 to 24 Year Olds | 143 (94.1%) | 9 (5.9%) |
| 25 to 34 Year Olds | 52 (52.5%) | 47 (47.5%) |
| 35 Years and over | 60 (27.0%) | 162 (73.0%) |
| Total | 2,986 (92.3%) | 249 (7.7%) |
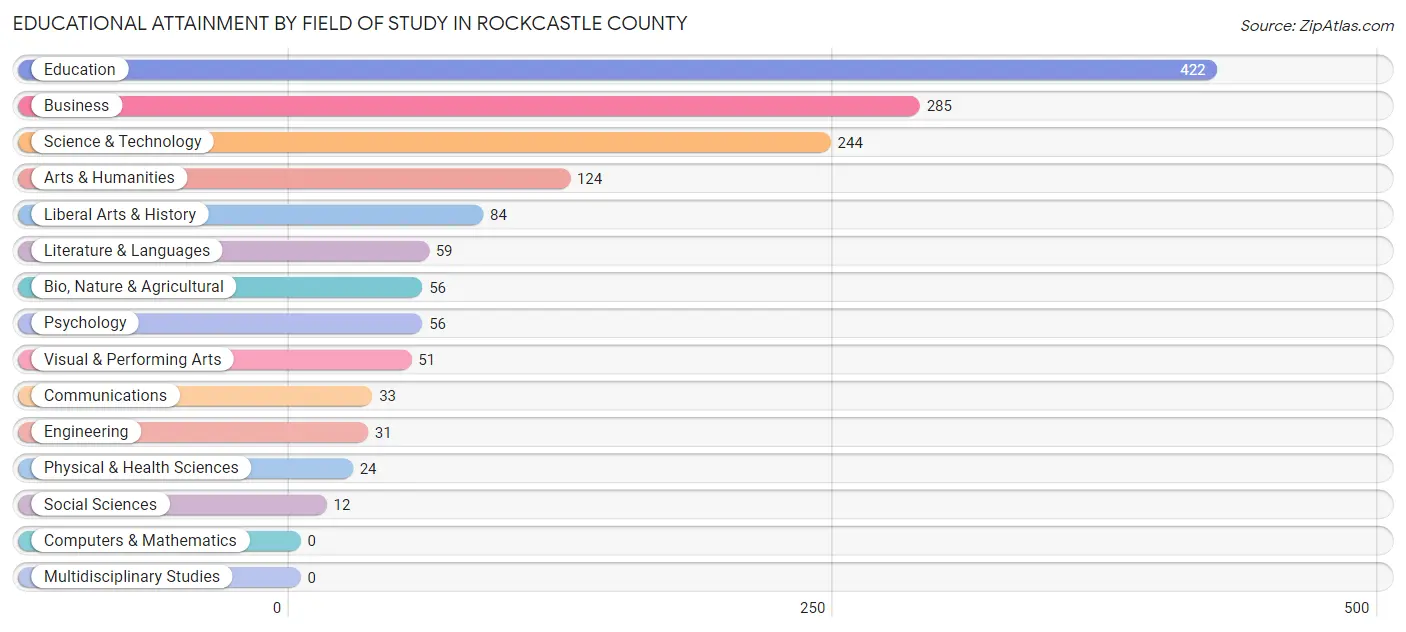
Educational Attainment by Field of Study in Rockcastle County
Education (422 | 28.5%), business (285 | 19.2%), science & technology (244 | 16.5%), arts & humanities (124 | 8.4%), and liberal arts & history (84 | 5.7%) are the most common fields of study among 1,481 individuals in Rockcastle County who have obtained a bachelor's degree or higher.
| Field of Study | # Graduates | % Graduates |
| Computers & Mathematics | 0 | 0.0% |
| Bio, Nature & Agricultural | 56 | 3.8% |
| Physical & Health Sciences | 24 | 1.6% |
| Psychology | 56 | 3.8% |
| Social Sciences | 12 | 0.8% |
| Engineering | 31 | 2.1% |
| Multidisciplinary Studies | 0 | 0.0% |
| Science & Technology | 244 | 16.5% |
| Business | 285 | 19.2% |
| Education | 422 | 28.5% |
| Literature & Languages | 59 | 4.0% |
| Liberal Arts & History | 84 | 5.7% |
| Visual & Performing Arts | 51 | 3.4% |
| Communications | 33 | 2.2% |
| Arts & Humanities | 124 | 8.4% |
| Total | 1,481 | 100.0% |
Transportation & Commute in Rockcastle County
Vehicle Availability by Sex in Rockcastle County
The most prevalent vehicle ownership categories in Rockcastle County are males with 2 vehicles (1,325, accounting for 39.1%) and females with 2 vehicles (915, making up 53.6%).

| Vehicles Available | Male | Female |
| No Vehicle | 79 (2.3%) | 62 (2.5%) |
| 1 Vehicle | 345 (10.2%) | 341 (13.8%) |
| 2 Vehicles | 1,325 (39.1%) | 915 (37.0%) |
| 3 Vehicles | 1,091 (32.2%) | 695 (28.1%) |
| 4 Vehicles | 443 (13.1%) | 358 (14.5%) |
| 5 or more Vehicles | 106 (3.1%) | 100 (4.1%) |
| Total | 3,389 (100.0%) | 2,471 (100.0%) |
Commute Time in Rockcastle County
The most frequently occuring commute durations in Rockcastle County are 10 to 14 minutes (833 commuters, 15.4%), 20 to 24 minutes (809 commuters, 15.0%), and 15 to 19 minutes (769 commuters, 14.2%).
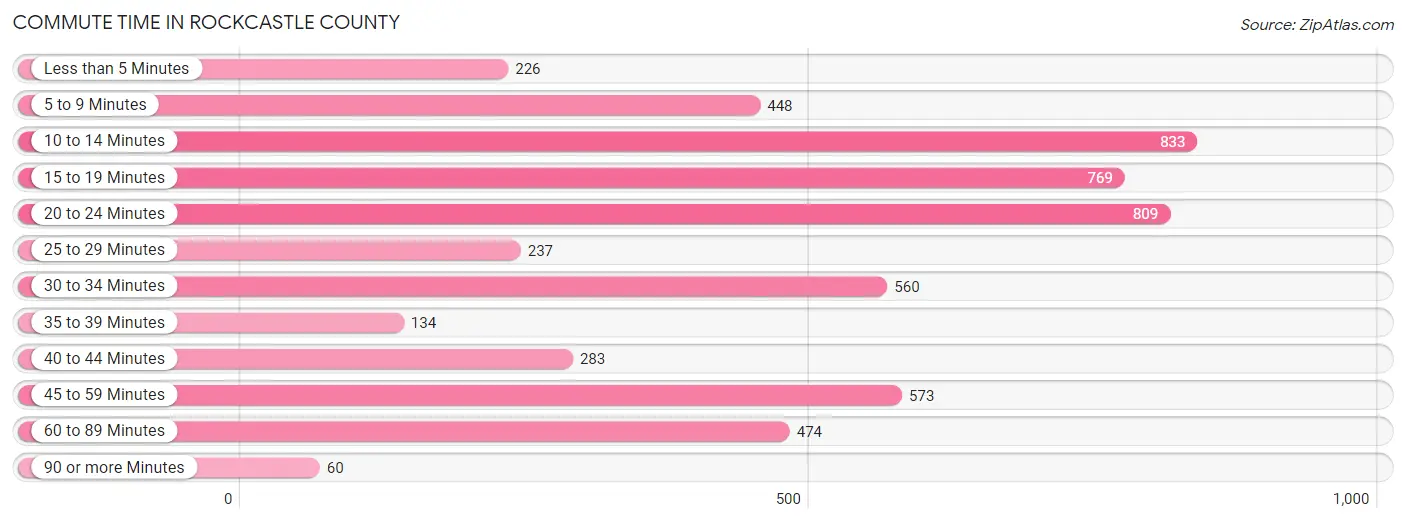
| Commute Time | # Commuters | % Commuters |
| Less than 5 Minutes | 226 | 4.2% |
| 5 to 9 Minutes | 448 | 8.3% |
| 10 to 14 Minutes | 833 | 15.4% |
| 15 to 19 Minutes | 769 | 14.2% |
| 20 to 24 Minutes | 809 | 15.0% |
| 25 to 29 Minutes | 237 | 4.4% |
| 30 to 34 Minutes | 560 | 10.4% |
| 35 to 39 Minutes | 134 | 2.5% |
| 40 to 44 Minutes | 283 | 5.2% |
| 45 to 59 Minutes | 573 | 10.6% |
| 60 to 89 Minutes | 474 | 8.8% |
| 90 or more Minutes | 60 | 1.1% |
Commute Time by Sex in Rockcastle County
The most common commute times in Rockcastle County are 45 to 59 minutes (423 commuters, 13.4%) for males and 10 to 14 minutes (476 commuters, 21.1%) for females.
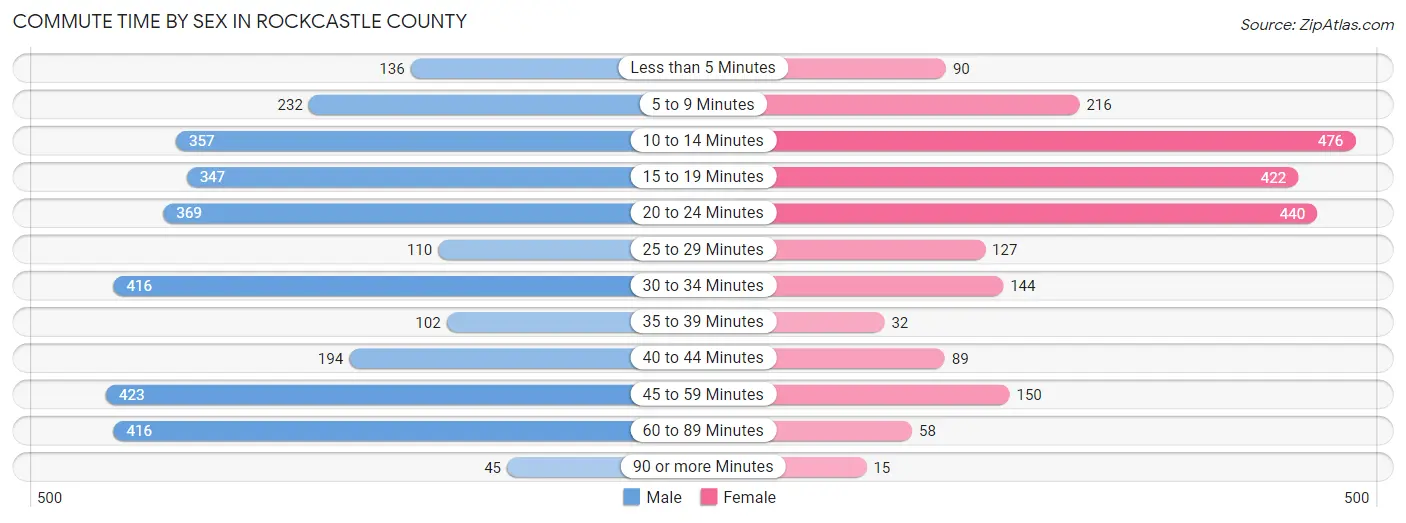
| Commute Time | Male | Female |
| Less than 5 Minutes | 136 (4.3%) | 90 (4.0%) |
| 5 to 9 Minutes | 232 (7.4%) | 216 (9.6%) |
| 10 to 14 Minutes | 357 (11.3%) | 476 (21.1%) |
| 15 to 19 Minutes | 347 (11.0%) | 422 (18.7%) |
| 20 to 24 Minutes | 369 (11.7%) | 440 (19.5%) |
| 25 to 29 Minutes | 110 (3.5%) | 127 (5.6%) |
| 30 to 34 Minutes | 416 (13.2%) | 144 (6.4%) |
| 35 to 39 Minutes | 102 (3.2%) | 32 (1.4%) |
| 40 to 44 Minutes | 194 (6.2%) | 89 (3.9%) |
| 45 to 59 Minutes | 423 (13.4%) | 150 (6.6%) |
| 60 to 89 Minutes | 416 (13.2%) | 58 (2.6%) |
| 90 or more Minutes | 45 (1.4%) | 15 (0.7%) |
Time of Departure to Work by Sex in Rockcastle County
The most frequent times of departure to work in Rockcastle County are 12:00 AM to 4:59 AM (579, 18.4%) for males and 7:00 AM to 7:29 AM (380, 16.8%) for females.

| Time of Departure | Male | Female |
| 12:00 AM to 4:59 AM | 579 (18.4%) | 204 (9.0%) |
| 5:00 AM to 5:29 AM | 289 (9.2%) | 70 (3.1%) |
| 5:30 AM to 5:59 AM | 155 (4.9%) | 303 (13.4%) |
| 6:00 AM to 6:29 AM | 309 (9.8%) | 160 (7.1%) |
| 6:30 AM to 6:59 AM | 144 (4.6%) | 164 (7.3%) |
| 7:00 AM to 7:29 AM | 462 (14.7%) | 380 (16.8%) |
| 7:30 AM to 7:59 AM | 200 (6.4%) | 239 (10.6%) |
| 8:00 AM to 8:29 AM | 315 (10.0%) | 175 (7.7%) |
| 8:30 AM to 8:59 AM | 75 (2.4%) | 115 (5.1%) |
| 9:00 AM to 9:59 AM | 60 (1.9%) | 153 (6.8%) |
| 10:00 AM to 10:59 AM | 26 (0.8%) | 91 (4.0%) |
| 11:00 AM to 11:59 AM | 23 (0.7%) | 35 (1.5%) |
| 12:00 PM to 3:59 PM | 370 (11.8%) | 83 (3.7%) |
| 4:00 PM to 11:59 PM | 140 (4.4%) | 87 (3.8%) |
| Total | 3,147 (100.0%) | 2,259 (100.0%) |
Housing Occupancy in Rockcastle County
Occupancy by Ownership in Rockcastle County
Of the total 6,380 dwellings in Rockcastle County, owner-occupied units account for 4,851 (76.0%), while renter-occupied units make up 1,529 (24.0%).
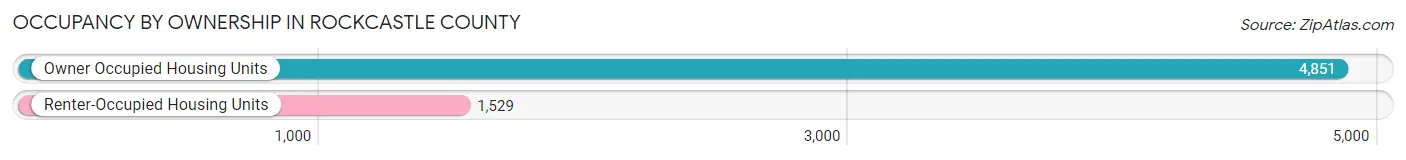
| Occupancy | # Housing Units | % Housing Units |
| Owner Occupied Housing Units | 4,851 | 76.0% |
| Renter-Occupied Housing Units | 1,529 | 24.0% |
| Total Occupied Housing Units | 6,380 | 100.0% |
Occupancy by Household Size in Rockcastle County
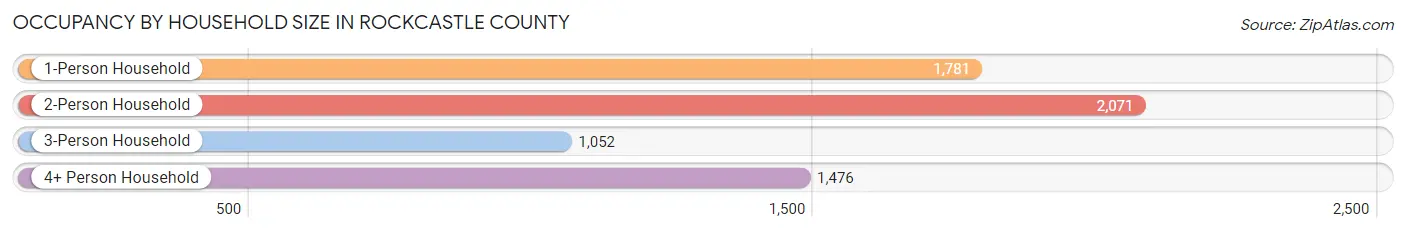
| Household Size | # Housing Units | % Housing Units |
| 1-Person Household | 1,781 | 27.9% |
| 2-Person Household | 2,071 | 32.5% |
| 3-Person Household | 1,052 | 16.5% |
| 4+ Person Household | 1,476 | 23.1% |
| Total Housing Units | 6,380 | 100.0% |
Occupancy by Ownership by Household Size in Rockcastle County

| Household Size | Owner-occupied | Renter-occupied |
| 1-Person Household | 1,274 (71.5%) | 507 (28.5%) |
| 2-Person Household | 1,774 (85.7%) | 297 (14.3%) |
| 3-Person Household | 699 (66.4%) | 353 (33.6%) |
| 4+ Person Household | 1,104 (74.8%) | 372 (25.2%) |
| Total Housing Units | 4,851 (76.0%) | 1,529 (24.0%) |
Occupancy by Educational Attainment in Rockcastle County

| Household Size | Owner-occupied | Renter-occupied |
| Less than High School | 833 (70.2%) | 354 (29.8%) |
| High School Diploma | 2,021 (76.7%) | 613 (23.3%) |
| College/Associate Degree | 1,238 (73.2%) | 454 (26.8%) |
| Bachelor's Degree or higher | 759 (87.5%) | 108 (12.5%) |
Occupancy by Age of Householder in Rockcastle County

| Age Bracket | # Households | % Households |
| Under 35 Years | 924 | 14.5% |
| 35 to 44 Years | 794 | 12.4% |
| 45 to 54 Years | 1,219 | 19.1% |
| 55 to 64 Years | 1,430 | 22.4% |
| 65 to 74 Years | 1,217 | 19.1% |
| 75 to 84 Years | 595 | 9.3% |
| 85 Years and Over | 201 | 3.2% |
| Total | 6,380 | 100.0% |
Housing Finances in Rockcastle County
Median Income by Occupancy in Rockcastle County

| Occupancy Type | # Households | Median Income |
| Owner-Occupied | 4,851 (76.0%) | $48,329 |
| Renter-Occupied | 1,529 (24.0%) | $30,775 |
| Average | 6,380 (100.0%) | $45,693 |
Occupancy by Householder Income Bracket in Rockcastle County
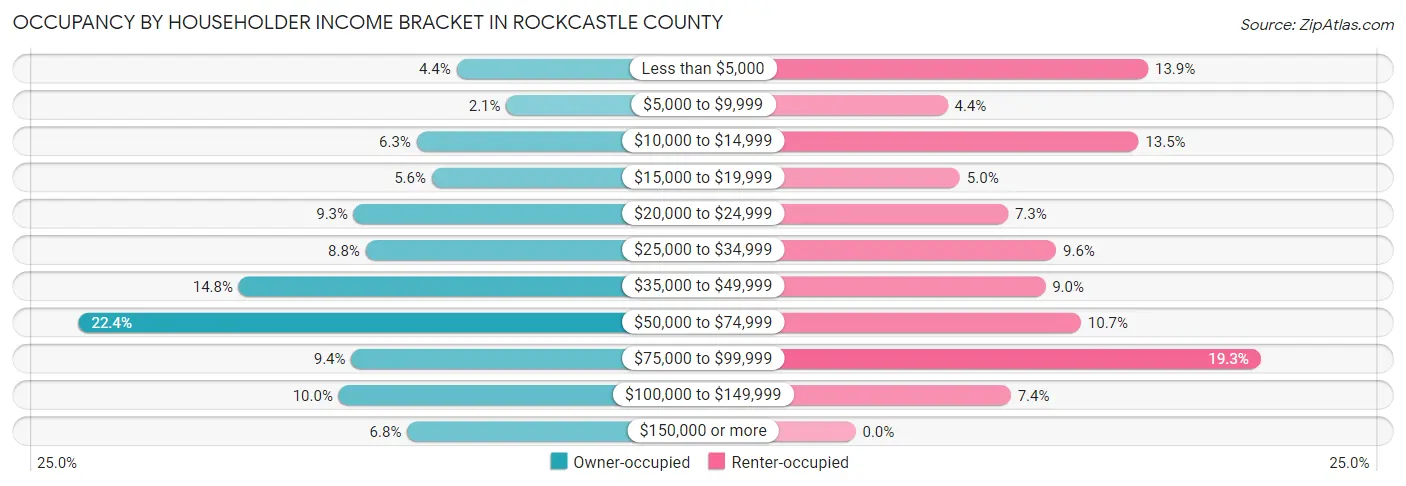
| Income Bracket | Owner-occupied | Renter-occupied |
| Less than $5,000 | 215 (4.4%) | 213 (13.9%) |
| $5,000 to $9,999 | 100 (2.1%) | 67 (4.4%) |
| $10,000 to $14,999 | 307 (6.3%) | 206 (13.5%) |
| $15,000 to $19,999 | 272 (5.6%) | 76 (5.0%) |
| $20,000 to $24,999 | 452 (9.3%) | 111 (7.3%) |
| $25,000 to $34,999 | 425 (8.8%) | 146 (9.6%) |
| $35,000 to $49,999 | 718 (14.8%) | 138 (9.0%) |
| $50,000 to $74,999 | 1,088 (22.4%) | 164 (10.7%) |
| $75,000 to $99,999 | 458 (9.4%) | 295 (19.3%) |
| $100,000 to $149,999 | 487 (10.0%) | 113 (7.4%) |
| $150,000 or more | 329 (6.8%) | 0 (0.0%) |
| Total | 4,851 (100.0%) | 1,529 (100.0%) |
Monthly Housing Cost Tiers in Rockcastle County
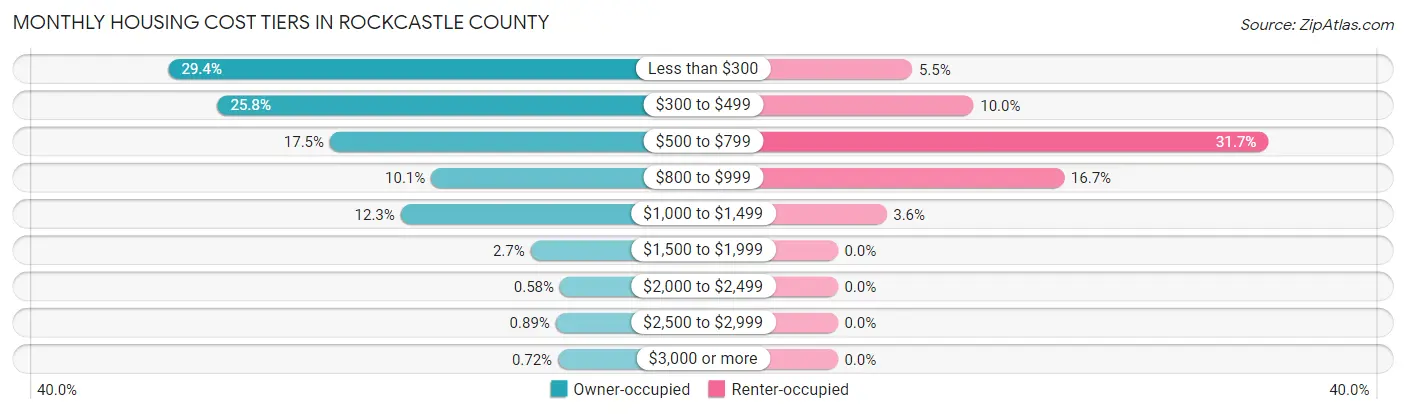
| Monthly Cost | Owner-occupied | Renter-occupied |
| Less than $300 | 1,426 (29.4%) | 84 (5.5%) |
| $300 to $499 | 1,251 (25.8%) | 153 (10.0%) |
| $500 to $799 | 850 (17.5%) | 485 (31.7%) |
| $800 to $999 | 488 (10.1%) | 255 (16.7%) |
| $1,000 to $1,499 | 597 (12.3%) | 55 (3.6%) |
| $1,500 to $1,999 | 133 (2.7%) | 0 (0.0%) |
| $2,000 to $2,499 | 28 (0.6%) | 0 (0.0%) |
| $2,500 to $2,999 | 43 (0.9%) | 0 (0.0%) |
| $3,000 or more | 35 (0.7%) | 0 (0.0%) |
| Total | 4,851 (100.0%) | 1,529 (100.0%) |
Physical Housing Characteristics in Rockcastle County
Housing Structures in Rockcastle County

| Structure Type | # Housing Units | % Housing Units |
| Single Unit, Detached | 4,261 | 66.8% |
| Single Unit, Attached | 25 | 0.4% |
| 2 Unit Apartments | 65 | 1.0% |
| 3 or 4 Unit Apartments | 125 | 2.0% |
| 5 to 9 Unit Apartments | 256 | 4.0% |
| 10 or more Apartments | 41 | 0.6% |
| Mobile Home / Other | 1,607 | 25.2% |
| Total | 6,380 | 100.0% |
Housing Structures by Occupancy in Rockcastle County
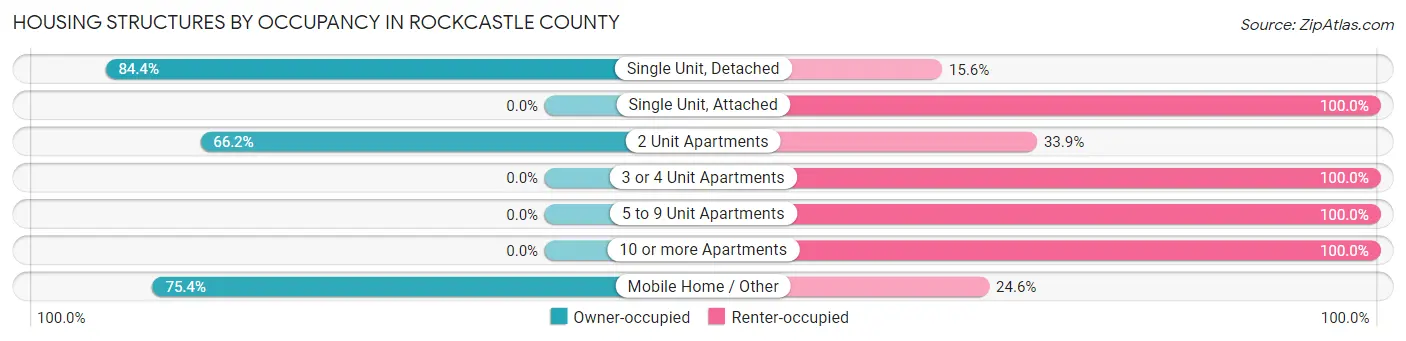
| Structure Type | Owner-occupied | Renter-occupied |
| Single Unit, Detached | 3,597 (84.4%) | 664 (15.6%) |
| Single Unit, Attached | 0 (0.0%) | 25 (100.0%) |
| 2 Unit Apartments | 43 (66.1%) | 22 (33.9%) |
| 3 or 4 Unit Apartments | 0 (0.0%) | 125 (100.0%) |
| 5 to 9 Unit Apartments | 0 (0.0%) | 256 (100.0%) |
| 10 or more Apartments | 0 (0.0%) | 41 (100.0%) |
| Mobile Home / Other | 1,211 (75.4%) | 396 (24.6%) |
| Total | 4,851 (76.0%) | 1,529 (24.0%) |
Housing Structures by Number of Rooms in Rockcastle County
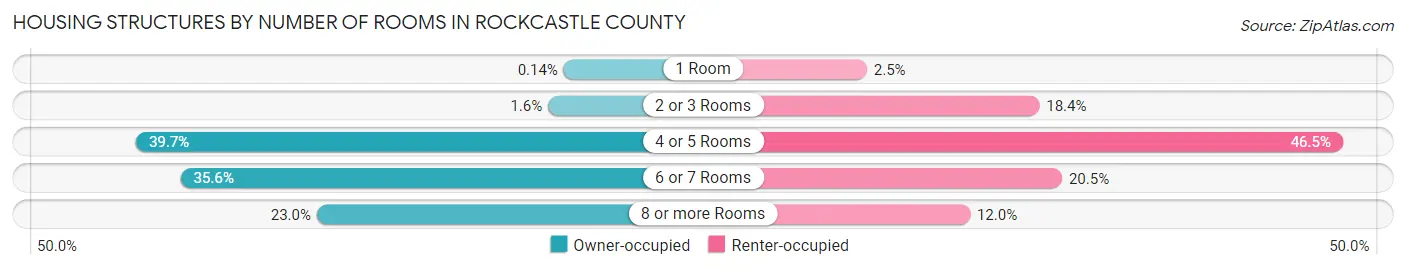
| Number of Rooms | Owner-occupied | Renter-occupied |
| 1 Room | 7 (0.1%) | 38 (2.5%) |
| 2 or 3 Rooms | 77 (1.6%) | 282 (18.4%) |
| 4 or 5 Rooms | 1,926 (39.7%) | 711 (46.5%) |
| 6 or 7 Rooms | 1,726 (35.6%) | 314 (20.5%) |
| 8 or more Rooms | 1,115 (23.0%) | 184 (12.0%) |
| Total | 4,851 (100.0%) | 1,529 (100.0%) |
Housing Structure by Heating Type in Rockcastle County
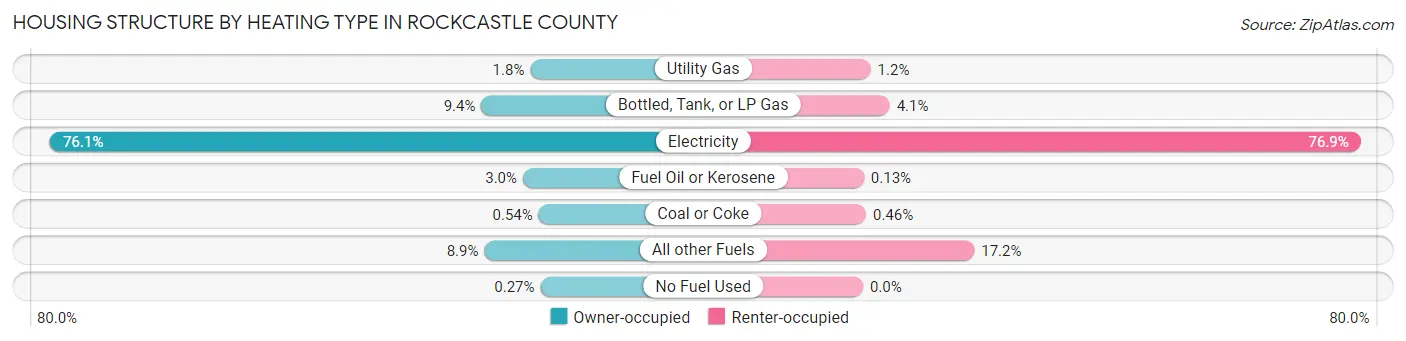
| Heating Type | Owner-occupied | Renter-occupied |
| Utility Gas | 89 (1.8%) | 18 (1.2%) |
| Bottled, Tank, or LP Gas | 456 (9.4%) | 63 (4.1%) |
| Electricity | 3,690 (76.1%) | 1,176 (76.9%) |
| Fuel Oil or Kerosene | 144 (3.0%) | 2 (0.1%) |
| Coal or Coke | 26 (0.5%) | 7 (0.5%) |
| All other Fuels | 433 (8.9%) | 263 (17.2%) |
| No Fuel Used | 13 (0.3%) | 0 (0.0%) |
| Total | 4,851 (100.0%) | 1,529 (100.0%) |
Household Vehicle Usage in Rockcastle County
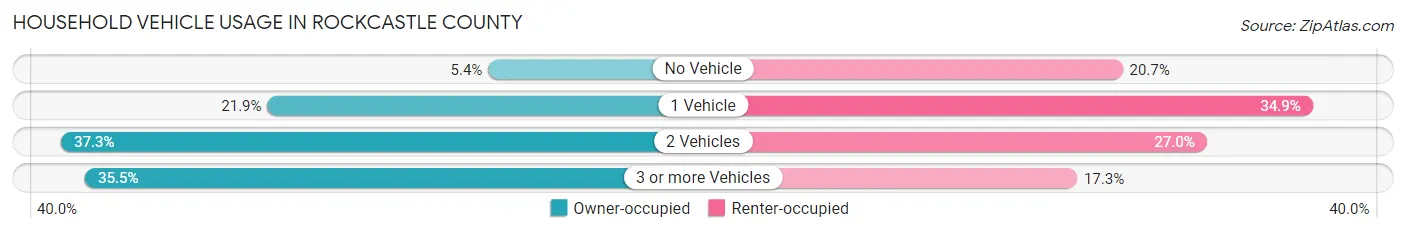
| Vehicles per Household | Owner-occupied | Renter-occupied |
| No Vehicle | 261 (5.4%) | 317 (20.7%) |
| 1 Vehicle | 1,061 (21.9%) | 534 (34.9%) |
| 2 Vehicles | 1,808 (37.3%) | 413 (27.0%) |
| 3 or more Vehicles | 1,721 (35.5%) | 265 (17.3%) |
| Total | 4,851 (100.0%) | 1,529 (100.0%) |
Real Estate & Mortgages in Rockcastle County
Real Estate and Mortgage Overview in Rockcastle County
| Characteristic | Without Mortgage | With Mortgage |
| Housing Units | 3,208 | 1,643 |
| Median Property Value | $83,300 | $123,200 |
| Median Household Income | $43,606 | $112 |
| Monthly Housing Costs | $327 | $28 |
| Real Estate Taxes | $438 | $81 |
Property Value by Mortgage Status in Rockcastle County
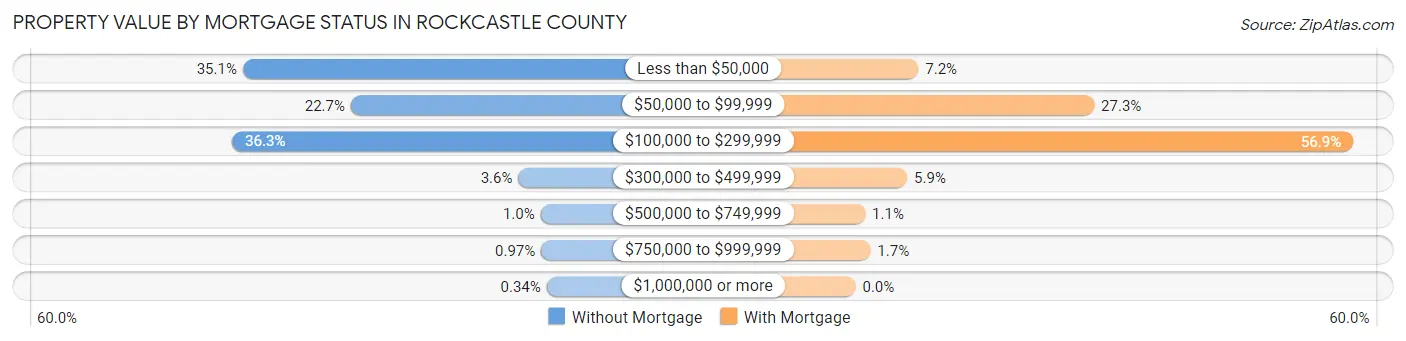
| Property Value | Without Mortgage | With Mortgage |
| Less than $50,000 | 1,125 (35.1%) | 118 (7.2%) |
| $50,000 to $99,999 | 729 (22.7%) | 448 (27.3%) |
| $100,000 to $299,999 | 1,164 (36.3%) | 934 (56.9%) |
| $300,000 to $499,999 | 115 (3.6%) | 97 (5.9%) |
| $500,000 to $749,999 | 33 (1.0%) | 18 (1.1%) |
| $750,000 to $999,999 | 31 (1.0%) | 28 (1.7%) |
| $1,000,000 or more | 11 (0.3%) | 0 (0.0%) |
| Total | 3,208 (100.0%) | 1,643 (100.0%) |
Household Income by Mortgage Status in Rockcastle County

| Household Income | Without Mortgage | With Mortgage |
| Less than $10,000 | 288 (9.0%) | 20 (1.2%) |
| $10,000 to $24,999 | 821 (25.6%) | 27 (1.6%) |
| $25,000 to $34,999 | 226 (7.0%) | 210 (12.8%) |
| $35,000 to $49,999 | 530 (16.5%) | 199 (12.1%) |
| $50,000 to $74,999 | 762 (23.7%) | 188 (11.4%) |
| $75,000 to $99,999 | 187 (5.8%) | 326 (19.8%) |
| $100,000 to $149,999 | 177 (5.5%) | 271 (16.5%) |
| $150,000 or more | 217 (6.8%) | 310 (18.9%) |
| Total | 3,208 (100.0%) | 1,643 (100.0%) |
Property Value to Household Income Ratio in Rockcastle County

| Value-to-Income Ratio | Without Mortgage | With Mortgage |
| Less than 2.0x | 1,620 (50.5%) | 67,014 (4,078.8%) |
| 2.0x to 2.9x | 381 (11.9%) | 756 (46.0%) |
| 3.0x to 3.9x | 368 (11.5%) | 354 (21.5%) |
| 4.0x or more | 755 (23.5%) | 227 (13.8%) |
| Total | 3,208 (100.0%) | 1,643 (100.0%) |
Real Estate Taxes by Mortgage Status in Rockcastle County
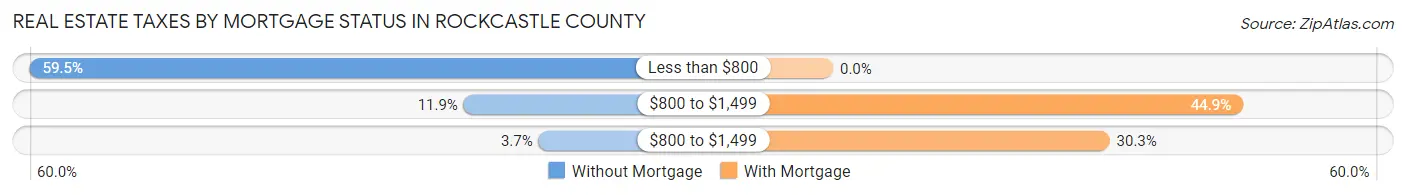
| Property Taxes | Without Mortgage | With Mortgage |
| Less than $800 | 1,907 (59.5%) | 0 (0.0%) |
| $800 to $1,499 | 381 (11.9%) | 738 (44.9%) |
| $800 to $1,499 | 118 (3.7%) | 498 (30.3%) |
| Total | 3,208 (100.0%) | 1,643 (100.0%) |
Health & Disability in Rockcastle County
Health Insurance Coverage by Age in Rockcastle County
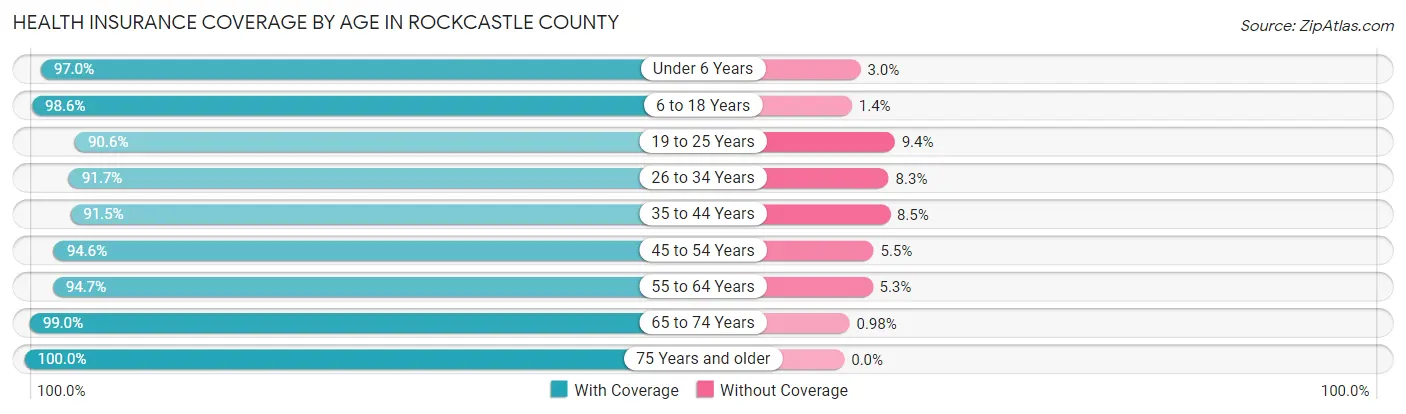
| Age Bracket | With Coverage | Without Coverage |
| Under 6 Years | 1,055 (97.0%) | 33 (3.0%) |
| 6 to 18 Years | 2,524 (98.6%) | 36 (1.4%) |
| 19 to 25 Years | 1,079 (90.6%) | 112 (9.4%) |
| 26 to 34 Years | 1,553 (91.7%) | 140 (8.3%) |
| 35 to 44 Years | 1,654 (91.5%) | 154 (8.5%) |
| 45 to 54 Years | 2,169 (94.6%) | 125 (5.4%) |
| 55 to 64 Years | 2,245 (94.7%) | 125 (5.3%) |
| 65 to 74 Years | 1,715 (99.0%) | 17 (1.0%) |
| 75 Years and older | 1,122 (100.0%) | 0 (0.0%) |
| Total | 15,116 (95.3%) | 742 (4.7%) |
Health Insurance Coverage by Citizenship Status in Rockcastle County
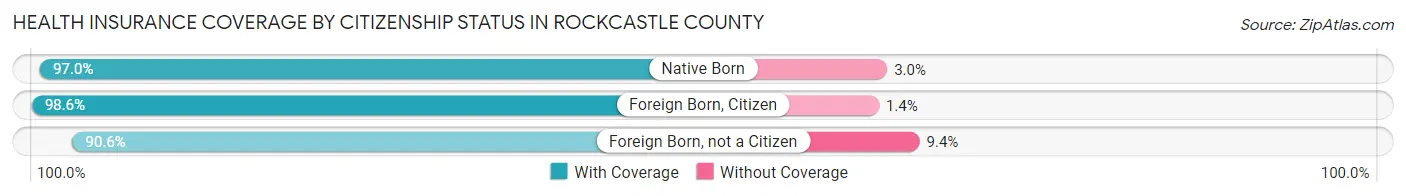
| Citizenship Status | With Coverage | Without Coverage |
| Native Born | 1,055 (97.0%) | 33 (3.0%) |
| Foreign Born, Citizen | 2,524 (98.6%) | 36 (1.4%) |
| Foreign Born, not a Citizen | 1,079 (90.6%) | 112 (9.4%) |
Health Insurance Coverage by Household Income in Rockcastle County

| Household Income | With Coverage | Without Coverage |
| Under $25,000 | 3,539 (97.0%) | 109 (3.0%) |
| $25,000 to $49,999 | 3,195 (94.0%) | 205 (6.0%) |
| $50,000 to $74,999 | 3,346 (94.5%) | 195 (5.5%) |
| $75,000 to $99,999 | 2,361 (94.0%) | 150 (6.0%) |
| $100,000 and over | 2,636 (97.0%) | 83 (3.0%) |
Public vs Private Health Insurance Coverage by Age in Rockcastle County
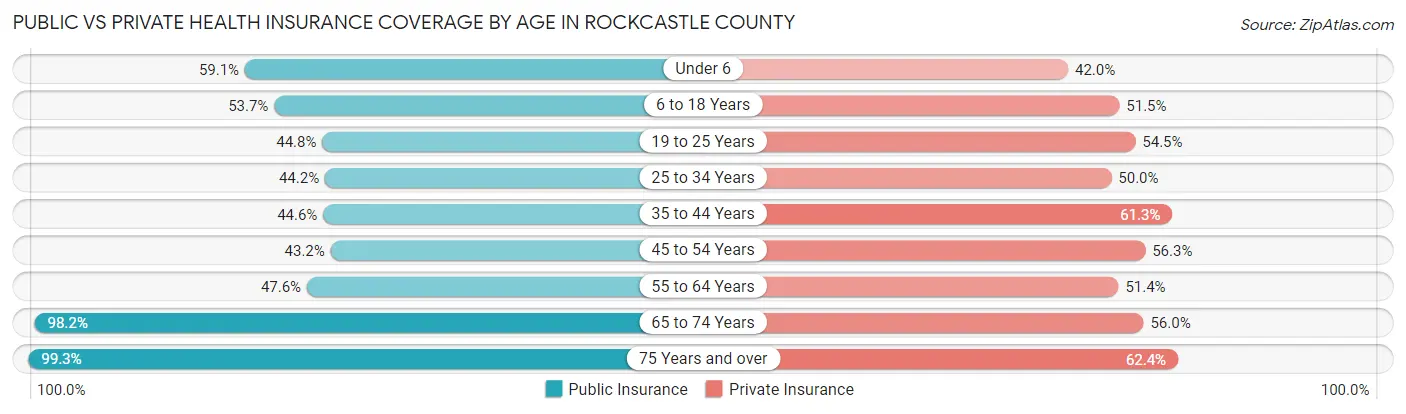
| Age Bracket | Public Insurance | Private Insurance |
| Under 6 | 643 (59.1%) | 457 (42.0%) |
| 6 to 18 Years | 1,374 (53.7%) | 1,319 (51.5%) |
| 19 to 25 Years | 533 (44.8%) | 649 (54.5%) |
| 25 to 34 Years | 749 (44.2%) | 847 (50.0%) |
| 35 to 44 Years | 806 (44.6%) | 1,109 (61.3%) |
| 45 to 54 Years | 991 (43.2%) | 1,292 (56.3%) |
| 55 to 64 Years | 1,128 (47.6%) | 1,217 (51.3%) |
| 65 to 74 Years | 1,700 (98.2%) | 970 (56.0%) |
| 75 Years and over | 1,114 (99.3%) | 700 (62.4%) |
| Total | 9,038 (57.0%) | 8,560 (54.0%) |
Disability Status by Sex by Age in Rockcastle County
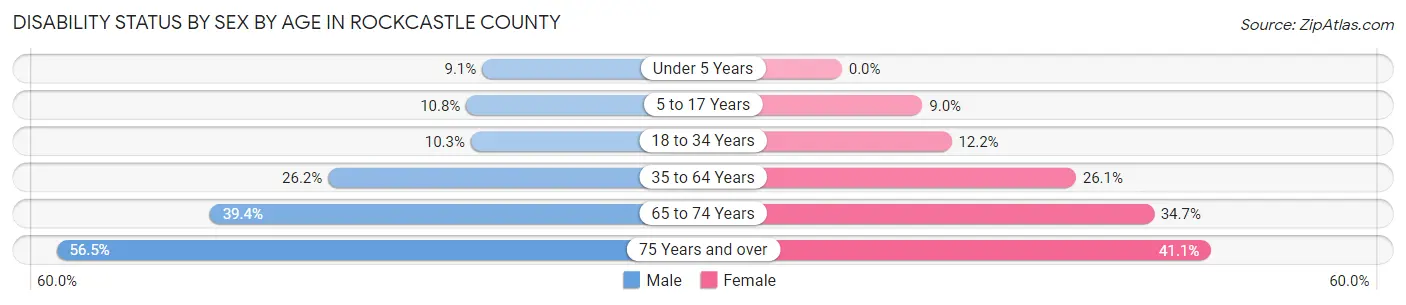
| Age Bracket | Male | Female |
| Under 5 Years | 44 (9.0%) | 0 (0.0%) |
| 5 to 17 Years | 139 (10.8%) | 117 (9.0%) |
| 18 to 34 Years | 164 (10.3%) | 179 (12.2%) |
| 35 to 64 Years | 841 (26.2%) | 850 (26.1%) |
| 65 to 74 Years | 317 (39.4%) | 322 (34.7%) |
| 75 Years and over | 293 (56.5%) | 248 (41.1%) |
Disability Class by Sex by Age in Rockcastle County
Disability Class: Hearing Difficulty
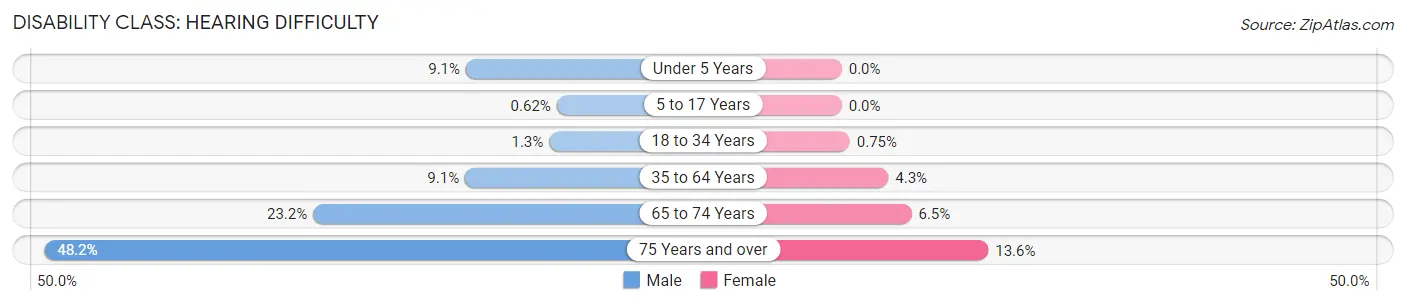
| Age Bracket | Male | Female |
| Under 5 Years | 44 (9.0%) | 0 (0.0%) |
| 5 to 17 Years | 8 (0.6%) | 0 (0.0%) |
| 18 to 34 Years | 21 (1.3%) | 11 (0.7%) |
| 35 to 64 Years | 293 (9.1%) | 141 (4.3%) |
| 65 to 74 Years | 187 (23.2%) | 60 (6.5%) |
| 75 Years and over | 250 (48.2%) | 82 (13.6%) |
Disability Class: Vision Difficulty
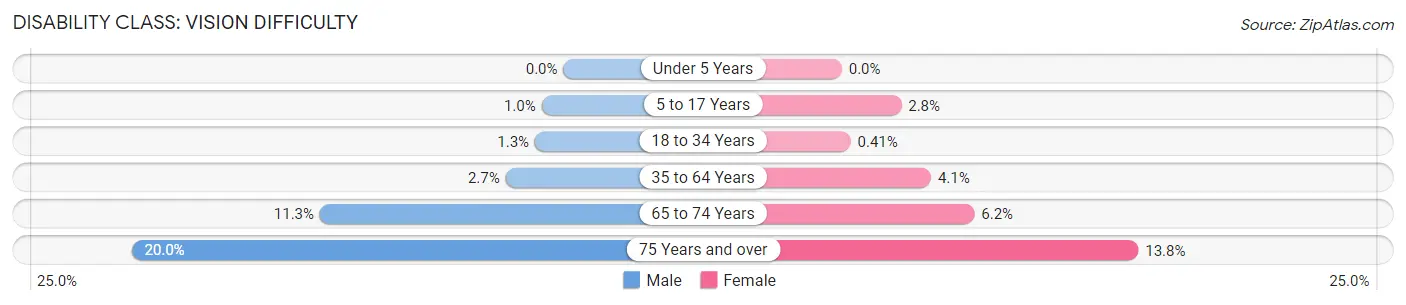
| Age Bracket | Male | Female |
| Under 5 Years | 0 (0.0%) | 0 (0.0%) |
| 5 to 17 Years | 13 (1.0%) | 36 (2.8%) |
| 18 to 34 Years | 21 (1.3%) | 6 (0.4%) |
| 35 to 64 Years | 86 (2.7%) | 135 (4.1%) |
| 65 to 74 Years | 91 (11.3%) | 57 (6.1%) |
| 75 Years and over | 104 (20.0%) | 83 (13.8%) |
Disability Class: Cognitive Difficulty
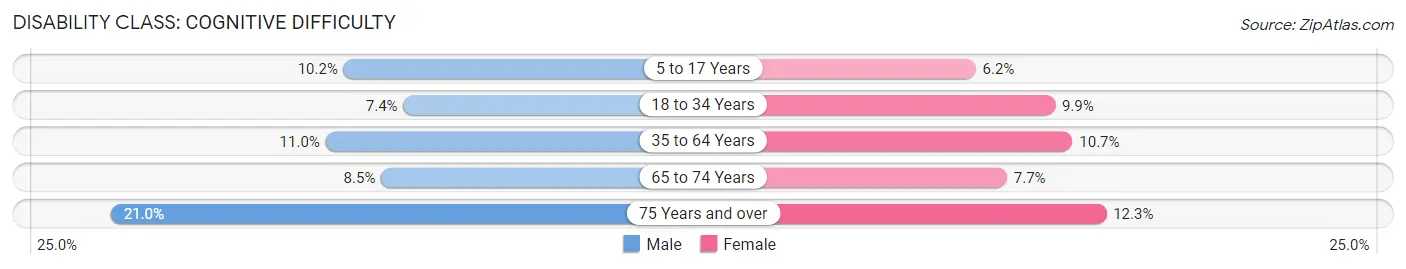
| Age Bracket | Male | Female |
| 5 to 17 Years | 131 (10.2%) | 81 (6.2%) |
| 18 to 34 Years | 118 (7.4%) | 145 (9.9%) |
| 35 to 64 Years | 354 (11.0%) | 349 (10.7%) |
| 65 to 74 Years | 68 (8.5%) | 71 (7.7%) |
| 75 Years and over | 109 (21.0%) | 74 (12.3%) |
Disability Class: Ambulatory Difficulty
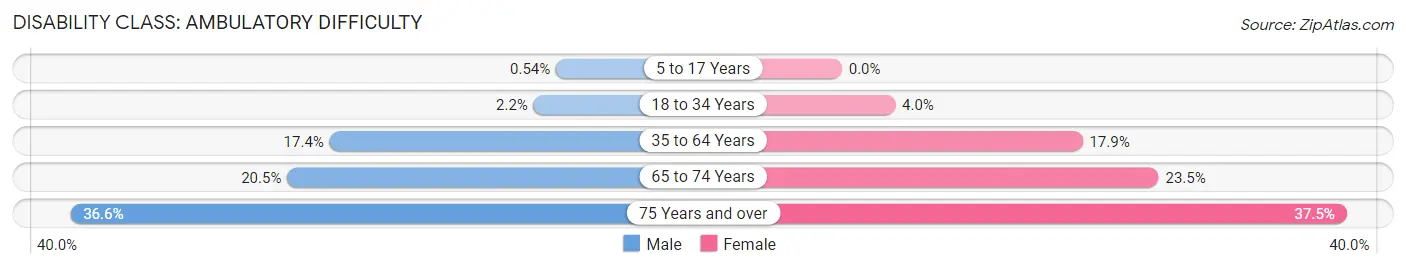
| Age Bracket | Male | Female |
| 5 to 17 Years | 7 (0.5%) | 0 (0.0%) |
| 18 to 34 Years | 35 (2.2%) | 58 (4.0%) |
| 35 to 64 Years | 557 (17.3%) | 583 (17.9%) |
| 65 to 74 Years | 165 (20.5%) | 218 (23.5%) |
| 75 Years and over | 190 (36.6%) | 226 (37.5%) |
Disability Class: Self-Care Difficulty
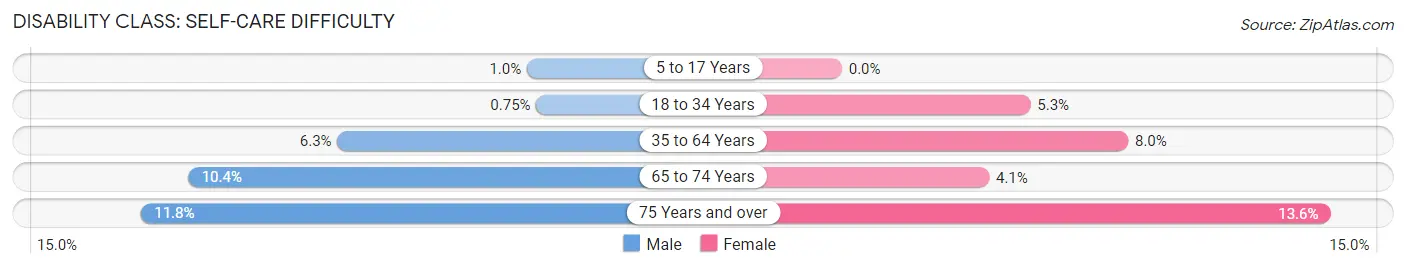
| Age Bracket | Male | Female |
| 5 to 17 Years | 13 (1.0%) | 0 (0.0%) |
| 18 to 34 Years | 12 (0.7%) | 77 (5.2%) |
| 35 to 64 Years | 202 (6.3%) | 260 (8.0%) |
| 65 to 74 Years | 84 (10.4%) | 38 (4.1%) |
| 75 Years and over | 61 (11.7%) | 82 (13.6%) |
Technology Access in Rockcastle County
Computing Device Access in Rockcastle County

| Device Type | # Households | % Households |
| Desktop or Laptop | 4,021 | 63.0% |
| Smartphone | 4,906 | 76.9% |
| Tablet | 3,443 | 54.0% |
| No Computing Device | 897 | 14.1% |
| Total | 6,380 | 100.0% |
Internet Access in Rockcastle County
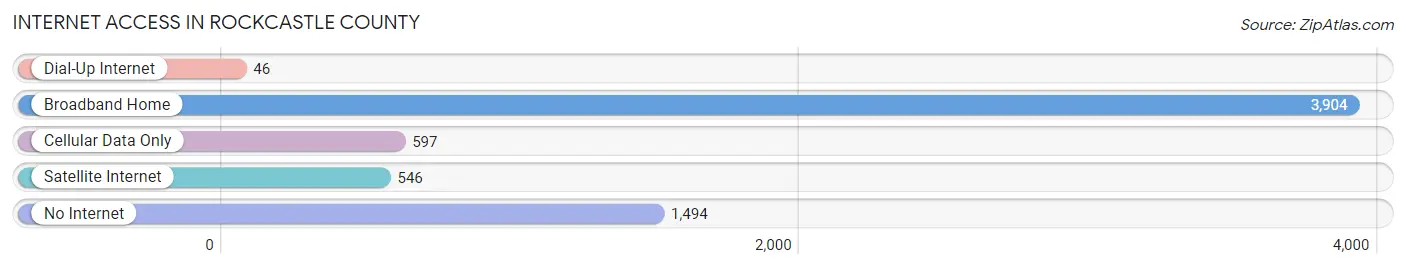
| Internet Type | # Households | % Households |
| Dial-Up Internet | 46 | 0.7% |
| Broadband Home | 3,904 | 61.2% |
| Cellular Data Only | 597 | 9.4% |
| Satellite Internet | 546 | 8.6% |
| No Internet | 1,494 | 23.4% |
| Total | 6,380 | 100.0% |
Rockcastle County Summary
Rockcastle County is located in the eastern part of Kentucky, in the Appalachian Mountains. It is bordered by Laurel County to the north, Pulaski County to the east, Lincoln County to the south, and Jackson County to the west. The county seat is Mount Vernon, and the county was formed in 1810 from parts of Pulaski and Lincoln counties.
Geography
Rockcastle County is located in the Appalachian Mountains, and is part of the Cumberland Plateau. The county is mostly mountainous, with the highest point being the summit of Pine Mountain at 2,890 feet. The county is drained by the Rockcastle River, which flows through the county from north to south. The county is also home to several natural lakes, including Lake Linville, Lake Cumberland, and Lake Laurel.
The county has a total area of 437 square miles, of which 434 square miles is land and 3 square miles is water.
Demographics
As of the 2010 census, the population of Rockcastle County was 17,056. The population density was 39.2 people per square mile. The racial makeup of the county was 97.2% White, 0.9% Black or African American, 0.2% Native American, 0.2% Asian, 0.2% from other races, and 1.3% from two or more races. 1.7% of the population were Hispanic or Latino of any race.
The median income for a household in the county was $30,945, and the median income for a family was $37,945. The per capita income for the county was $16,845. About 17.2% of the population were below the poverty line.
Economy
Rockcastle County is largely rural, and the economy is based on agriculture and forestry. The county is home to several large farms, and the main crops grown are corn, soybeans, and hay. The county is also home to several timber companies, and the main products harvested are oak, poplar, and pine.
The county is also home to several manufacturing companies, including a furniture factory, a plastics factory, and a metal fabrication plant. The county is also home to several small businesses, including restaurants, retail stores, and service providers.
The county is served by two major highways, US 25 and US 150. The county is also served by the Rockcastle County Airport, which offers general aviation services.
Conclusion
Rockcastle County is a rural county located in the Appalachian Mountains of eastern Kentucky. The county is largely agricultural, with the main crops being corn, soybeans, and hay. The county is also home to several timber companies, and several manufacturing companies. The county is served by two major highways, US 25 and US 150, and the Rockcastle County Airport. The population of the county was 17,056 as of the 2010 census, and the median income for a household was $30,945.
Common Questions
What is the Total Population of Rockcastle County?
Total Population of Rockcastle County is 16,171.
What is the Total Male Population of Rockcastle County?
Total Male Population of Rockcastle County is 8,035.
What is the Total Female Population of Rockcastle County?
Total Female Population of Rockcastle County is 8,136.
What is the Ratio of Males per 100 Females in Rockcastle County?
There are 98.76 Males per 100 Females in Rockcastle County.
What is the Ratio of Females per 100 Males in Rockcastle County?
There are 101.26 Females per 100 Males in Rockcastle County.
What is the Median Population Age in Rockcastle County?
Median Population Age in Rockcastle County is 42.9 Years.
What is the Average Family Size in Rockcastle County
Average Family Size in Rockcastle County is 3.0 People.
What is the Average Household Size in Rockcastle County
Average Household Size in Rockcastle County is 2.5 People.
What is Per Capita Income in Rockcastle County?
Per Capita income in Rockcastle County is $26,640.
What is the Median Family Income in Rockcastle County?
Median Family Income in Rockcastle County is $58,289.
What is the Median Household income in Rockcastle County?
Median Household Income in Rockcastle County is $45,693.
What is Income or Wage Gap in Rockcastle County?
Income or Wage Gap in Rockcastle County is 37.1%.
Women in Rockcastle County earn 62.9 cents for every dollar earned by a man.
What is Family Income Deficit in Rockcastle County?
Family Income Deficit in Rockcastle County is $11,362.
Families that are below poverty line in Rockcastle County earn $11,362 less on average than the poverty threshold level.
What is Inequality or Gini Index in Rockcastle County?
Inequality or Gini Index in Rockcastle County is 0.50.
How Large is the Labor Force in Rockcastle County?
There are 6,487 People in the Labor Forcein in Rockcastle County.
What is the Percentage of People in the Labor Force in Rockcastle County?
49.3% of People are in the Labor Force in Rockcastle County.
What is the Unemployment Rate in Rockcastle County?
Unemployment Rate in Rockcastle County is 6.6%.