Pulaski County, KY
Pulaski County Map
Pulaski County Overview
65,145
TOTAL POPULATION
32,025
MALE POPULATION
33,120
FEMALE POPULATION
96.69
MALES / 100 FEMALES
103.42
FEMALES / 100 MALES
41.8
MEDIAN AGE
3.0
AVG FAMILY SIZE
2.5
AVG HOUSEHOLD SIZE
$29,215
PER CAPITA INCOME
$61,737
AVG FAMILY INCOME
$48,768
AVG HOUSEHOLD INCOME
34.2%
WAGE / INCOME GAP [ % ]
65.8¢/ $1
WAGE / INCOME GAP [ $ ]
$9,639
FAMILY INCOME DEFICIT
0.50
INEQUALITY / GINI INDEX
28,674
LABOR FORCE [ PEOPLE ]
54.6%
PERCENT IN LABOR FORCE
4.9%
UNEMPLOYMENT RATE
Pulaski County Area Codes
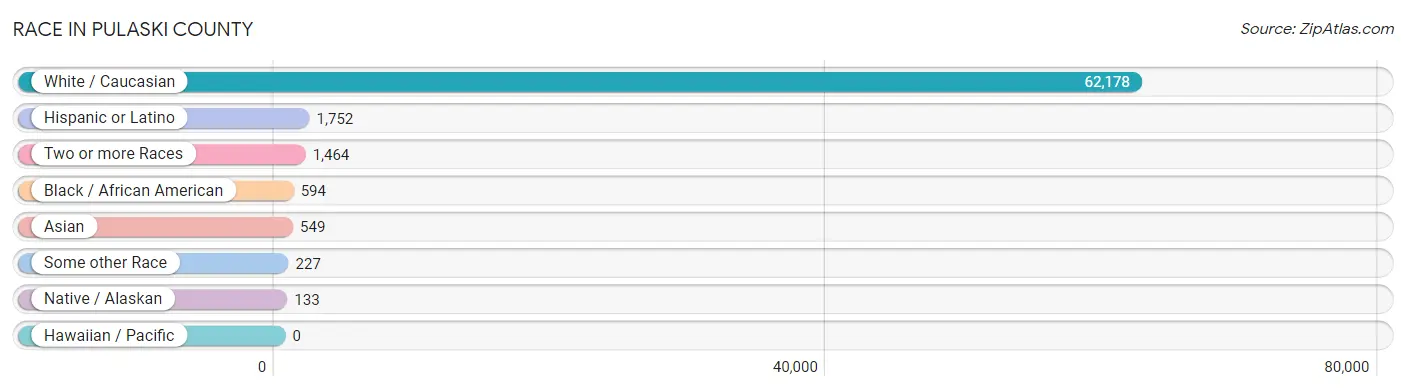
Race in Pulaski County
The most populous races in Pulaski County are White / Caucasian (62,178 | 95.5%), Hispanic or Latino (1,752 | 2.7%), and Two or more Races (1,464 | 2.2%).
| Race | # Population | % Population |
| Asian | 549 | 0.8% |
| Black / African American | 594 | 0.9% |
| Hawaiian / Pacific | 0 | 0.0% |
| Hispanic or Latino | 1,752 | 2.7% |
| Native / Alaskan | 133 | 0.2% |
| White / Caucasian | 62,178 | 95.5% |
| Two or more Races | 1,464 | 2.2% |
| Some other Race | 227 | 0.4% |
| Total | 65,145 | 100.0% |
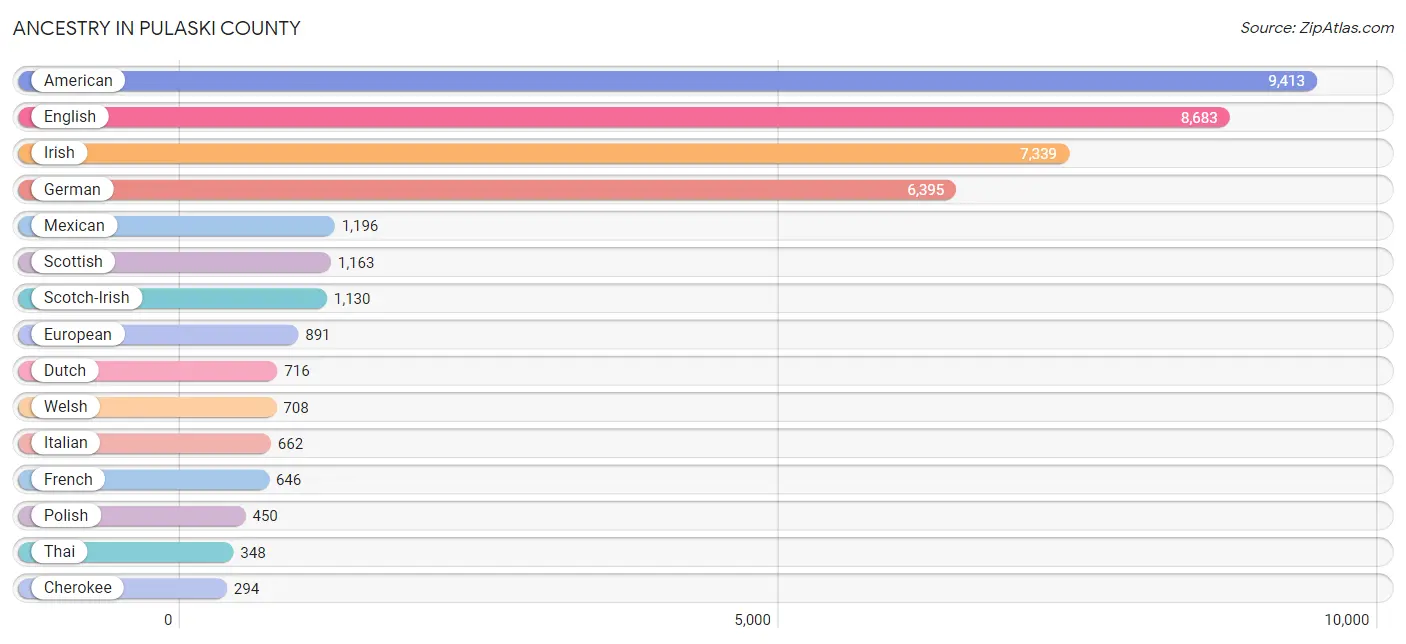
Ancestry in Pulaski County
The most populous ancestries reported in Pulaski County are American (9,413 | 14.4%), English (8,683 | 13.3%), Irish (7,339 | 11.3%), German (6,395 | 9.8%), and Mexican (1,196 | 1.8%), together accounting for 50.7% of all Pulaski County residents.
| Ancestry | # Population | % Population |
| African | 51 | 0.1% |
| American | 9,413 | 14.4% |
| Apache | 8 | 0.0% |
| Arab | 15 | 0.0% |
| Australian | 65 | 0.1% |
| Austrian | 49 | 0.1% |
| Belgian | 12 | 0.0% |
| Blackfeet | 33 | 0.1% |
| British | 193 | 0.3% |
| Burmese | 53 | 0.1% |
| Canadian | 22 | 0.0% |
| Central American | 116 | 0.2% |
| Central American Indian | 47 | 0.1% |
| Cherokee | 294 | 0.4% |
| Chippewa | 3 | 0.0% |
| Creek | 1 | 0.0% |
| Croatian | 3 | 0.0% |
| Cuban | 91 | 0.1% |
| Czech | 7 | 0.0% |
| Danish | 25 | 0.0% |
| Dominican | 178 | 0.3% |
| Dutch | 716 | 1.1% |
| Eastern European | 12 | 0.0% |
| Ecuadorian | 2 | 0.0% |
| Egyptian | 15 | 0.0% |
| English | 8,683 | 13.3% |
| European | 891 | 1.4% |
| French | 646 | 1.0% |
| French Canadian | 88 | 0.1% |
| German | 6,395 | 9.8% |
| Guatemalan | 96 | 0.2% |
| Haitian | 9 | 0.0% |
| Honduran | 15 | 0.0% |
| Hungarian | 45 | 0.1% |
| Indian (Asian) | 13 | 0.0% |
| Iranian | 20 | 0.0% |
| Irish | 7,339 | 11.3% |
| Italian | 662 | 1.0% |
| Jamaican | 10 | 0.0% |
| Japanese | 162 | 0.3% |
| Korean | 28 | 0.0% |
| Macedonian | 7 | 0.0% |
| Mexican | 1,196 | 1.8% |
| Nigerian | 42 | 0.1% |
| Northern European | 58 | 0.1% |
| Norwegian | 177 | 0.3% |
| Panamanian | 5 | 0.0% |
| Peruvian | 67 | 0.1% |
| Polish | 450 | 0.7% |
| Portuguese | 58 | 0.1% |
| Puerto Rican | 17 | 0.0% |
| Russian | 78 | 0.1% |
| Scandinavian | 62 | 0.1% |
| Scotch-Irish | 1,130 | 1.7% |
| Scottish | 1,163 | 1.8% |
| Shoshone | 2 | 0.0% |
| Slavic | 9 | 0.0% |
| South African | 6 | 0.0% |
| South American | 69 | 0.1% |
| South American Indian | 2 | 0.0% |
| Spanish | 21 | 0.0% |
| Subsaharan African | 99 | 0.2% |
| Swedish | 204 | 0.3% |
| Swiss | 35 | 0.1% |
| Thai | 348 | 0.5% |
| Ukrainian | 6 | 0.0% |
| Welsh | 708 | 1.1% | View All 67 Rows |
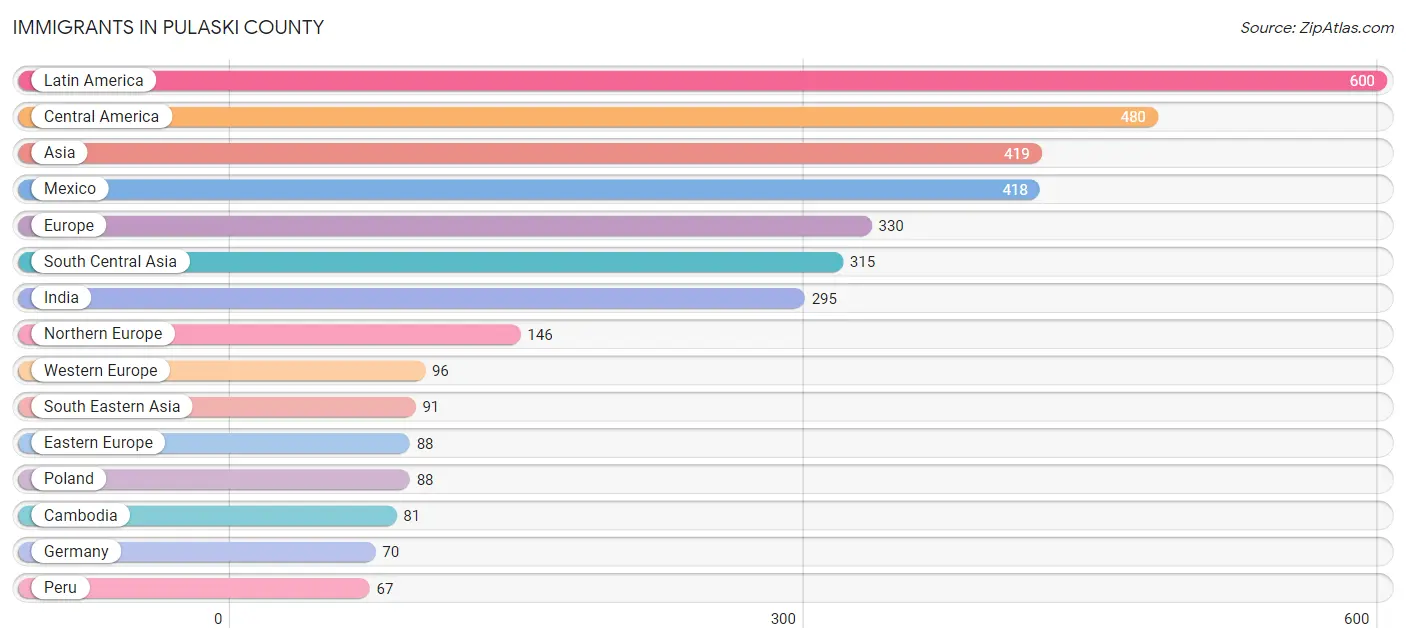
Immigrants in Pulaski County
The most numerous immigrant groups reported in Pulaski County came from Latin America (600 | 0.9%), Central America (480 | 0.7%), Asia (419 | 0.6%), Mexico (418 | 0.6%), and Europe (330 | 0.5%), together accounting for 3.5% of all Pulaski County residents.
| Immigration Origin | # Population | % Population |
| Africa | 44 | 0.1% |
| Asia | 419 | 0.6% |
| Belgium | 10 | 0.0% |
| Cambodia | 81 | 0.1% |
| Canada | 10 | 0.0% |
| Caribbean | 53 | 0.1% |
| Central America | 480 | 0.7% |
| China | 13 | 0.0% |
| Cuba | 53 | 0.1% |
| Eastern Asia | 13 | 0.0% |
| Eastern Europe | 88 | 0.1% |
| Egypt | 15 | 0.0% |
| England | 12 | 0.0% |
| Europe | 330 | 0.5% |
| France | 16 | 0.0% |
| Germany | 70 | 0.1% |
| Guatemala | 48 | 0.1% |
| Honduras | 9 | 0.0% |
| India | 295 | 0.4% |
| Iran | 20 | 0.0% |
| Ireland | 8 | 0.0% |
| Latin America | 600 | 0.9% |
| Mexico | 418 | 0.6% |
| Nigeria | 23 | 0.0% |
| Northern Africa | 15 | 0.0% |
| Northern Europe | 146 | 0.2% |
| Panama | 5 | 0.0% |
| Peru | 67 | 0.1% |
| Philippines | 10 | 0.0% |
| Poland | 88 | 0.1% |
| Scotland | 20 | 0.0% |
| South Africa | 6 | 0.0% |
| South America | 67 | 0.1% |
| South Central Asia | 315 | 0.5% |
| South Eastern Asia | 91 | 0.1% |
| Sweden | 16 | 0.0% |
| Western Africa | 23 | 0.0% |
| Western Europe | 96 | 0.2% | View All 38 Rows |
Sex and Age in Pulaski County
Sex and Age in Pulaski County
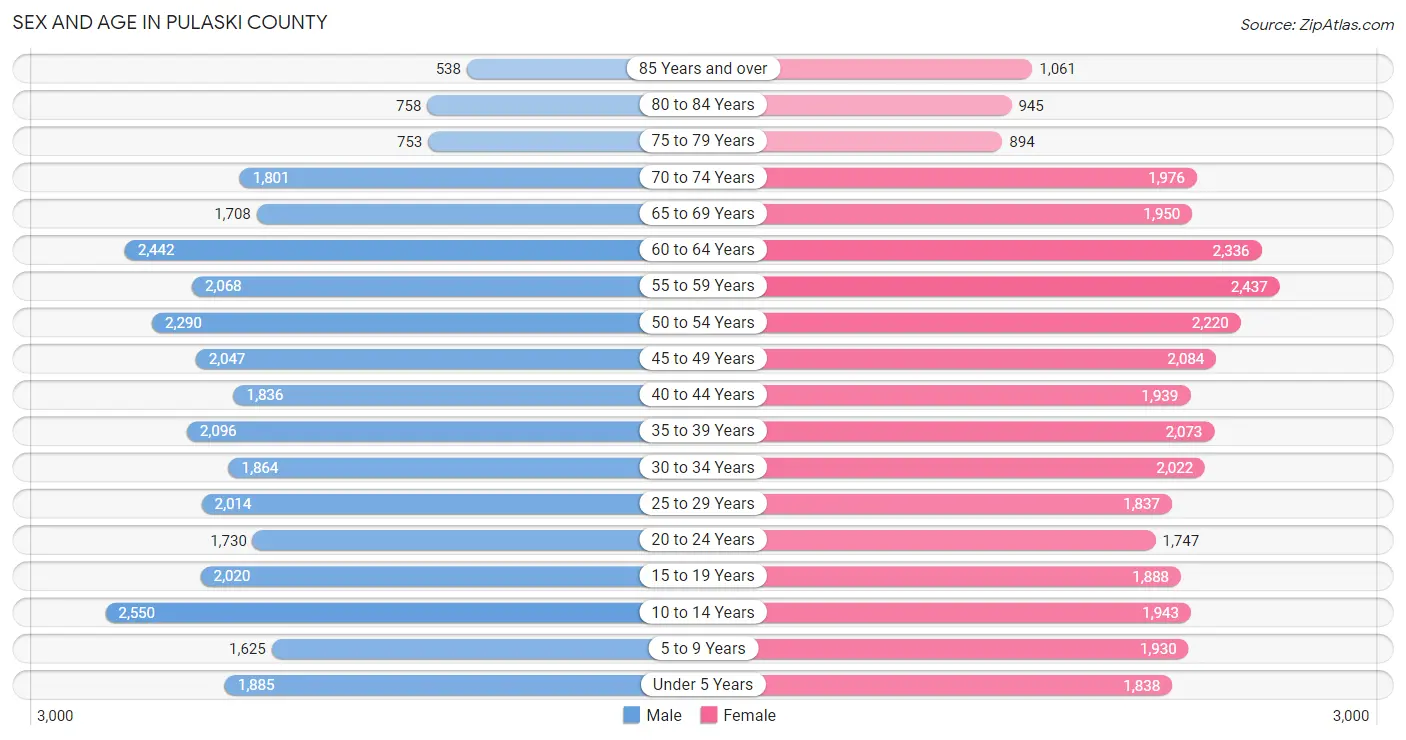
The most populous age groups in Pulaski County are 10 to 14 Years (2,550 | 8.0%) for men and 55 to 59 Years (2,437 | 7.4%) for women.
| Age Bracket | Male | Female |
| Under 5 Years | 1,885 (5.9%) | 1,838 (5.6%) |
| 5 to 9 Years | 1,625 (5.1%) | 1,930 (5.8%) |
| 10 to 14 Years | 2,550 (8.0%) | 1,943 (5.9%) |
| 15 to 19 Years | 2,020 (6.3%) | 1,888 (5.7%) |
| 20 to 24 Years | 1,730 (5.4%) | 1,747 (5.3%) |
| 25 to 29 Years | 2,014 (6.3%) | 1,837 (5.6%) |
| 30 to 34 Years | 1,864 (5.8%) | 2,022 (6.1%) |
| 35 to 39 Years | 2,096 (6.5%) | 2,073 (6.3%) |
| 40 to 44 Years | 1,836 (5.7%) | 1,939 (5.9%) |
| 45 to 49 Years | 2,047 (6.4%) | 2,084 (6.3%) |
| 50 to 54 Years | 2,290 (7.1%) | 2,220 (6.7%) |
| 55 to 59 Years | 2,068 (6.5%) | 2,437 (7.4%) |
| 60 to 64 Years | 2,442 (7.6%) | 2,336 (7.0%) |
| 65 to 69 Years | 1,708 (5.3%) | 1,950 (5.9%) |
| 70 to 74 Years | 1,801 (5.6%) | 1,976 (6.0%) |
| 75 to 79 Years | 753 (2.4%) | 894 (2.7%) |
| 80 to 84 Years | 758 (2.4%) | 945 (2.9%) |
| 85 Years and over | 538 (1.7%) | 1,061 (3.2%) |
| Total | 32,025 (100.0%) | 33,120 (100.0%) |
Families and Households in Pulaski County
Median Family Size in Pulaski County
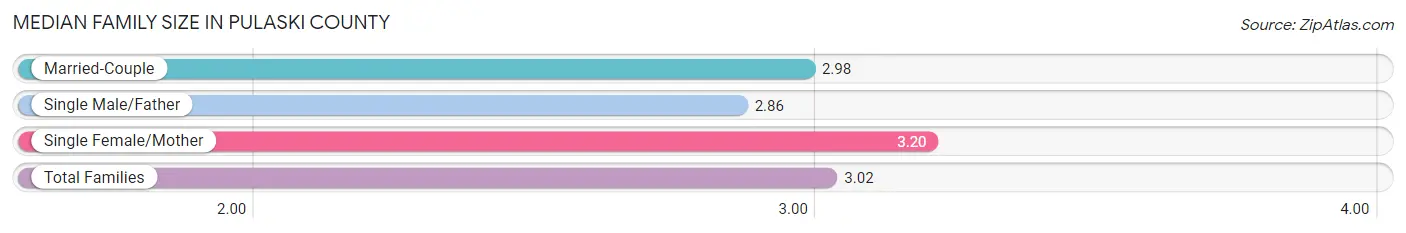
The median family size in Pulaski County is 3.02 persons per family, with single female/mother families (3,433 | 20.0%) accounting for the largest median family size of 3.2 persons per family. On the other hand, single male/father families (1,226 | 7.1%) represent the smallest median family size with 2.86 persons per family.
| Family Type | # Families | Family Size |
| Married-Couple | 12,494 (72.8%) | 2.98 |
| Single Male/Father | 1,226 (7.1%) | 2.86 |
| Single Female/Mother | 3,433 (20.0%) | 3.20 |
| Total Families | 17,153 (100.0%) | 3.02 |
Median Household Size in Pulaski County
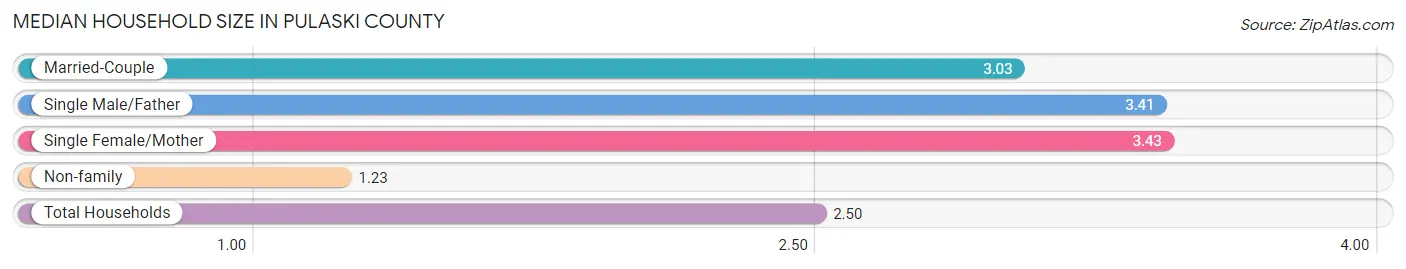
The median household size in Pulaski County is 2.50 persons per household, with single female/mother households (3,433 | 13.4%) accounting for the largest median household size of 3.43 persons per household. non-family households (8,558 | 33.3%) represent the smallest median household size with 1.23 persons per household.
| Household Type | # Households | Household Size |
| Married-Couple | 12,494 (48.6%) | 3.03 |
| Single Male/Father | 1,226 (4.8%) | 3.41 |
| Single Female/Mother | 3,433 (13.4%) | 3.43 |
| Non-family | 8,558 (33.3%) | 1.23 |
| Total Households | 25,711 (100.0%) | 2.50 |
Household Size by Marriage Status in Pulaski County
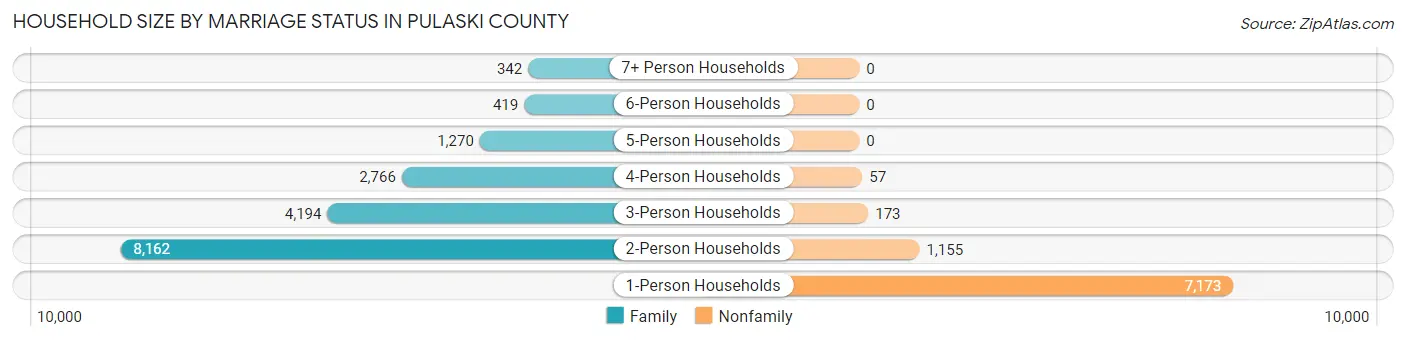
Out of a total of 25,711 households in Pulaski County, 17,153 (66.7%) are family households, while 8,558 (33.3%) are nonfamily households. The most numerous type of family households are 2-person households, comprising 8,162, and the most common type of nonfamily households are 1-person households, comprising 7,173.
| Household Size | Family Households | Nonfamily Households |
| 1-Person Households | - | 7,173 (27.9%) |
| 2-Person Households | 8,162 (31.8%) | 1,155 (4.5%) |
| 3-Person Households | 4,194 (16.3%) | 173 (0.7%) |
| 4-Person Households | 2,766 (10.8%) | 57 (0.2%) |
| 5-Person Households | 1,270 (4.9%) | 0 (0.0%) |
| 6-Person Households | 419 (1.6%) | 0 (0.0%) |
| 7+ Person Households | 342 (1.3%) | 0 (0.0%) |
| Total | 17,153 (66.7%) | 8,558 (33.3%) |
Female Fertility in Pulaski County
Fertility by Age in Pulaski County
Average fertility rate in Pulaski County is 65.0 births per 1,000 women. Women in the age bracket of 20 to 34 years have the highest fertility rate with 139.0 births per 1,000 women. Women in the age bracket of 20 to 34 years acount for 85.2% of all women with births.
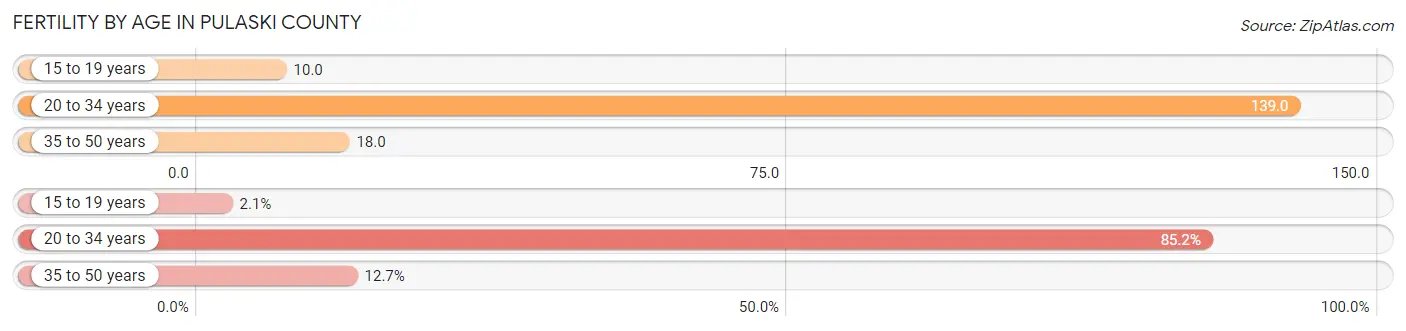
| Age Bracket | Women with Births | Births / 1,000 Women |
| 15 to 19 years | 19 (2.1%) | 10.0 |
| 20 to 34 years | 779 (85.2%) | 139.0 |
| 35 to 50 years | 116 (12.7%) | 18.0 |
| Total | 914 (100.0%) | 65.0 |
Fertility by Age by Marriage Status in Pulaski County
62.8% of women with births (914) in Pulaski County are married. The highest percentage of unmarried women with births falls into 15 to 19 years age bracket with 100.0% of them unmarried at the time of birth, while the lowest percentage of unmarried women with births belong to 35 to 50 years age bracket with 5.2% of them unmarried.
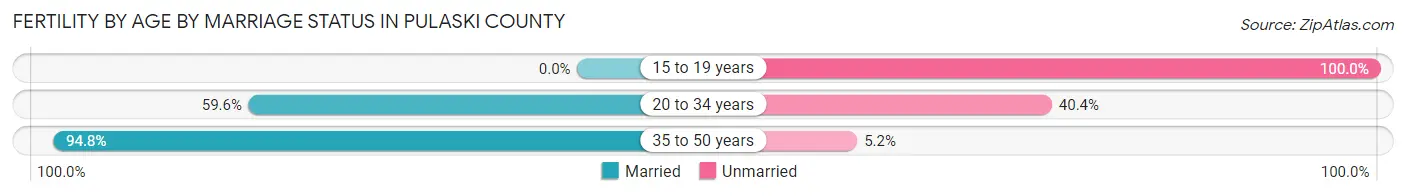
| Age Bracket | Married | Unmarried |
| 15 to 19 years | 0 (0.0%) | 19 (100.0%) |
| 20 to 34 years | 464 (59.6%) | 315 (40.4%) |
| 35 to 50 years | 110 (94.8%) | 6 (5.2%) |
| Total | 574 (62.8%) | 340 (37.2%) |
Fertility by Education in Pulaski County
Average fertility rate in Pulaski County is 65.0 births per 1,000 women. Women with the education attainment of bachelor's degree have the highest fertility rate of 93.0 births per 1,000 women, while women with the education attainment of less than high school have the lowest fertility at 9.0 births per 1,000 women. Women with the education attainment of college or associate's degree represent 39.7% of all women with births.
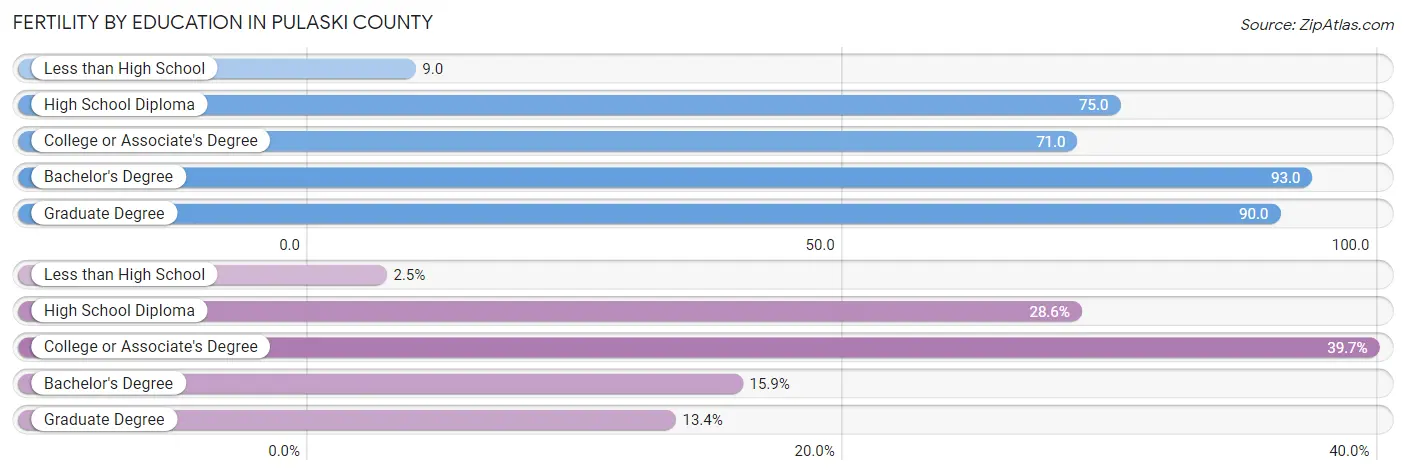
| Educational Attainment | Women with Births | Births / 1,000 Women |
| Less than High School | 23 (2.5%) | 9.0 |
| High School Diploma | 261 (28.6%) | 75.0 |
| College or Associate's Degree | 363 (39.7%) | 71.0 |
| Bachelor's Degree | 145 (15.9%) | 93.0 |
| Graduate Degree | 122 (13.4%) | 90.0 |
| Total | 914 (100.0%) | 65.0 |
Fertility by Education by Marriage Status in Pulaski County
37.2% of women with births in Pulaski County are unmarried. Women with the educational attainment of graduate degree are most likely to be married with 100.0% of them married at childbirth, while women with the educational attainment of less than high school are least likely to be married with 56.5% of them unmarried at childbirth.
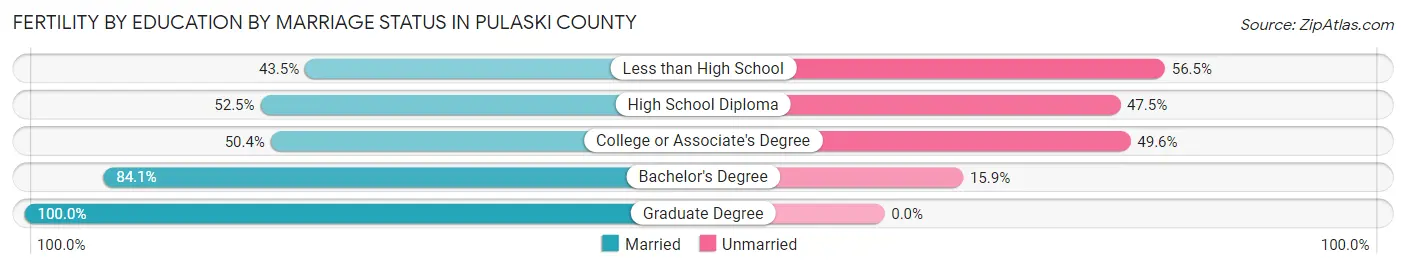
| Educational Attainment | Married | Unmarried |
| Less than High School | 10 (43.5%) | 13 (56.5%) |
| High School Diploma | 137 (52.5%) | 124 (47.5%) |
| College or Associate's Degree | 183 (50.4%) | 180 (49.6%) |
| Bachelor's Degree | 122 (84.1%) | 23 (15.9%) |
| Graduate Degree | 122 (100.0%) | 0 (0.0%) |
| Total | 574 (62.8%) | 340 (37.2%) |
Income in Pulaski County
Income Overview in Pulaski County
Per Capita Income in Pulaski County is $29,215, while median incomes of families and households are $61,737 and $48,768 respectively.
| Characteristic | Number | Measure |
| Per Capita Income | 65,145 | $29,215 |
| Median Family Income | 17,153 | $61,737 |
| Mean Family Income | 17,153 | $79,316 |
| Median Household Income | 25,711 | $48,768 |
| Mean Household Income | 25,711 | $70,298 |
| Income Deficit | 17,153 | $9,639 |
| Wage / Income Gap (%) | 65,145 | 34.20% |
| Wage / Income Gap ($) | 65,145 | 65.80¢ per $1 |
| Gini / Inequality Index | 65,145 | 0.50 |
Earnings by Sex in Pulaski County
Average Earnings in Pulaski County are $32,945, $40,014 for men and $26,331 for women, a difference of 34.2%.
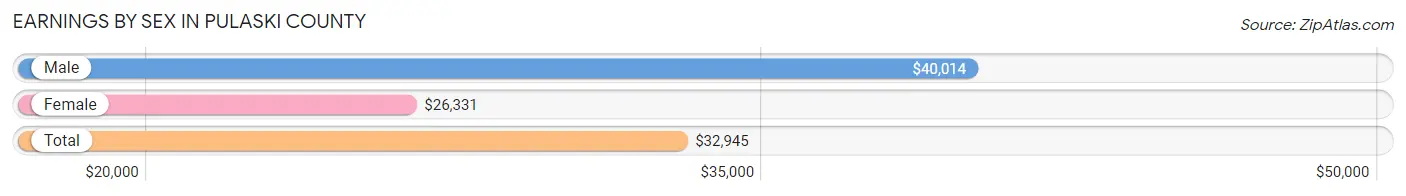
| Sex | Number | Average Earnings |
| Male | 15,746 (52.1%) | $40,014 |
| Female | 14,480 (47.9%) | $26,331 |
| Total | 30,226 (100.0%) | $32,945 |
Earnings by Sex by Income Bracket in Pulaski County
The most common earnings brackets in Pulaski County are $100,000+ for men (1,391 | 8.8%) and $12,500 to $14,999 for women (1,069 | 7.4%).
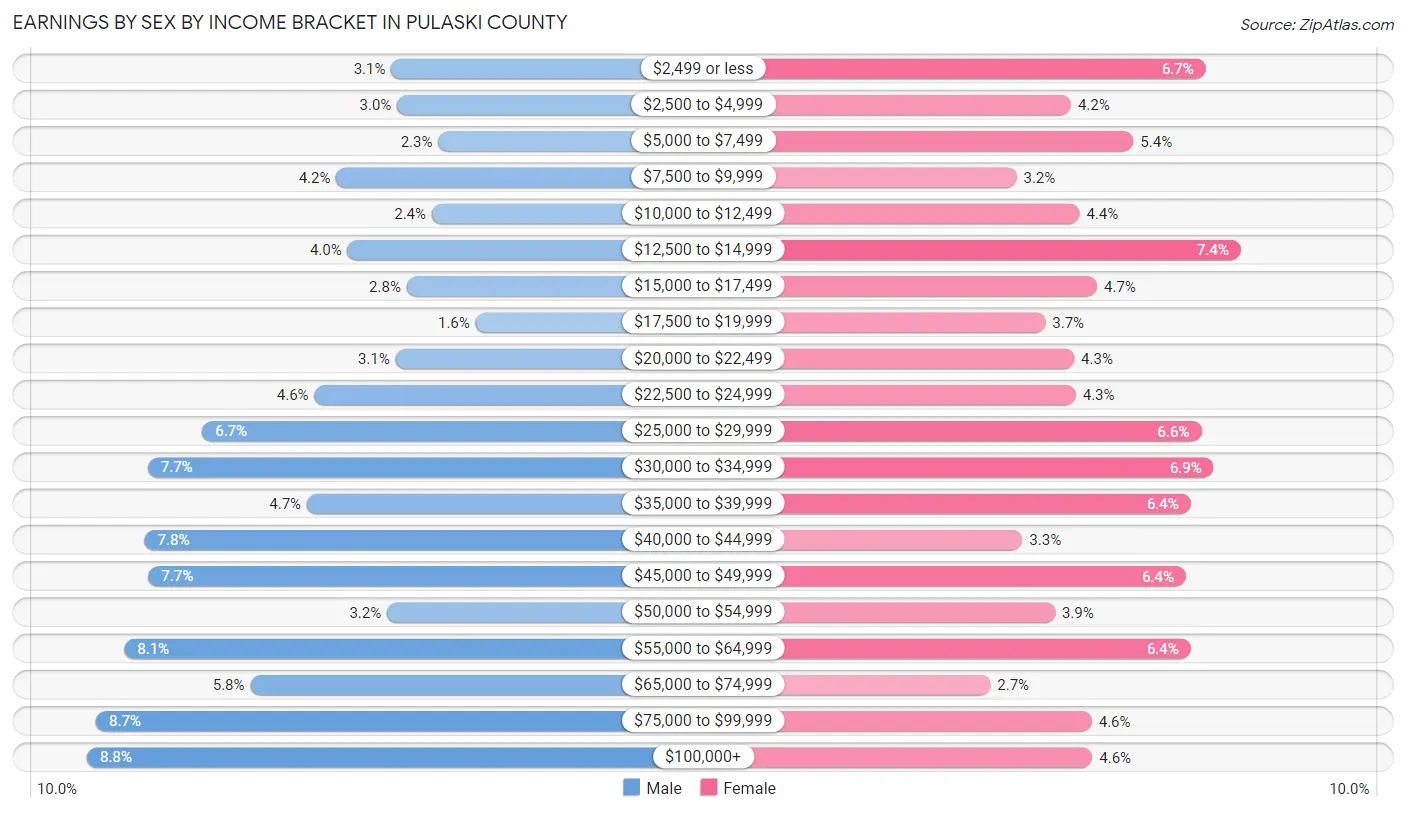
| Income | Male | Female |
| $2,499 or less | 493 (3.1%) | 973 (6.7%) |
| $2,500 to $4,999 | 475 (3.0%) | 608 (4.2%) |
| $5,000 to $7,499 | 355 (2.2%) | 777 (5.4%) |
| $7,500 to $9,999 | 655 (4.2%) | 461 (3.2%) |
| $10,000 to $12,499 | 373 (2.4%) | 632 (4.4%) |
| $12,500 to $14,999 | 622 (4.0%) | 1,069 (7.4%) |
| $15,000 to $17,499 | 447 (2.8%) | 679 (4.7%) |
| $17,500 to $19,999 | 244 (1.5%) | 539 (3.7%) |
| $20,000 to $22,499 | 481 (3.0%) | 617 (4.3%) |
| $22,500 to $24,999 | 720 (4.6%) | 621 (4.3%) |
| $25,000 to $29,999 | 1,051 (6.7%) | 962 (6.6%) |
| $30,000 to $34,999 | 1,211 (7.7%) | 995 (6.9%) |
| $35,000 to $39,999 | 742 (4.7%) | 932 (6.4%) |
| $40,000 to $44,999 | 1,220 (7.7%) | 477 (3.3%) |
| $45,000 to $49,999 | 1,210 (7.7%) | 920 (6.4%) |
| $50,000 to $54,999 | 505 (3.2%) | 565 (3.9%) |
| $55,000 to $64,999 | 1,280 (8.1%) | 932 (6.4%) |
| $65,000 to $74,999 | 908 (5.8%) | 390 (2.7%) |
| $75,000 to $99,999 | 1,363 (8.7%) | 665 (4.6%) |
| $100,000+ | 1,391 (8.8%) | 666 (4.6%) |
| Total | 15,746 (100.0%) | 14,480 (100.0%) |
Earnings by Sex by Educational Attainment in Pulaski County
Average earnings in Pulaski County are $43,579 for men and $30,621 for women, a difference of 29.7%. Men with an educational attainment of graduate degree enjoy the highest average annual earnings of $76,686, while those with less than high school education earn the least with $24,233. Women with an educational attainment of graduate degree earn the most with the average annual earnings of $58,671, while those with less than high school education have the smallest earnings of $19,519.
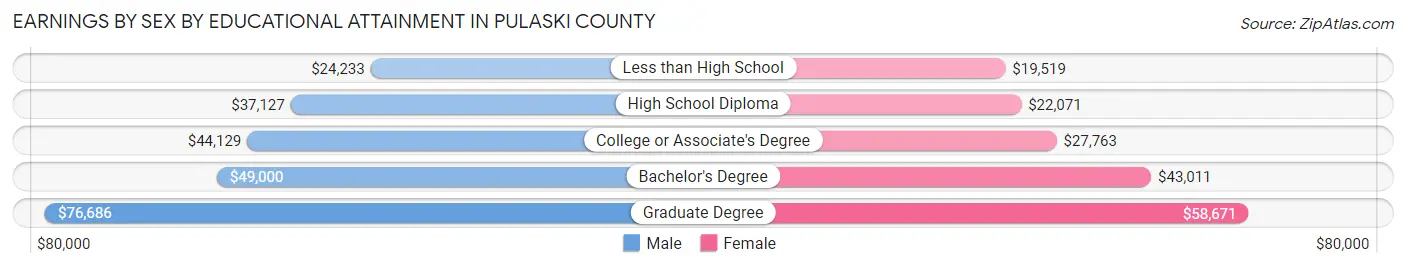
| Educational Attainment | Male Income | Female Income |
| Less than High School | $24,233 | $19,519 |
| High School Diploma | $37,127 | $22,071 |
| College or Associate's Degree | $44,129 | $27,763 |
| Bachelor's Degree | $49,000 | $43,011 |
| Graduate Degree | $76,686 | $58,671 |
| Total | $43,579 | $30,621 |
Family Income in Pulaski County
Family Income Brackets in Pulaski County
According to the Pulaski County family income data, there are 2,899 families falling into the $50,000 to $74,999 income range, which is the most common income bracket and makes up 16.9% of all families. Conversely, the less than $10,000 income bracket is the least frequent group with only 755 families (4.4%) belonging to this category.
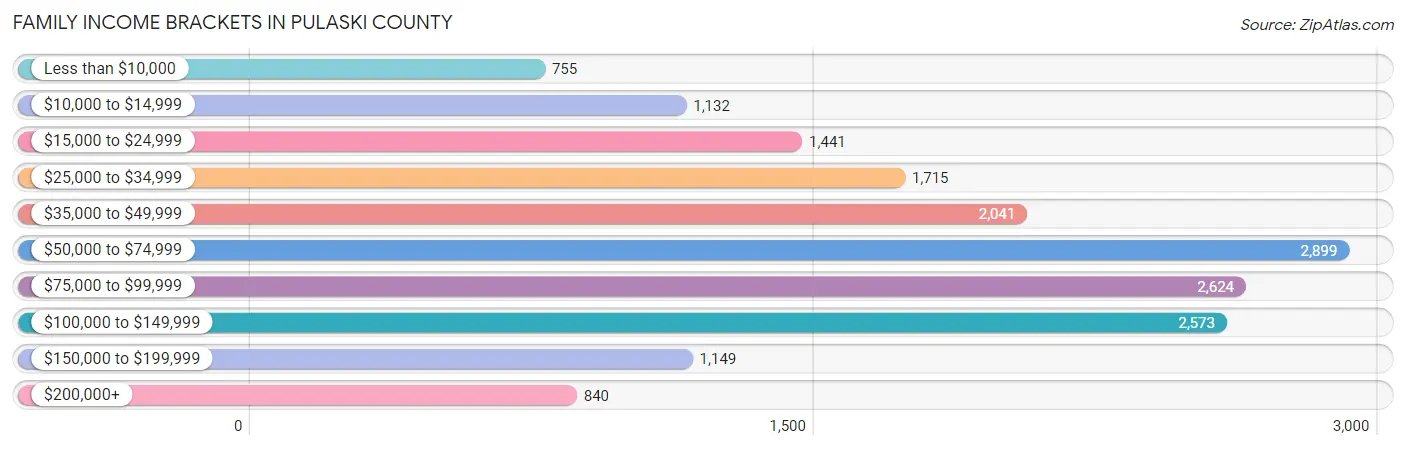
| Income Bracket | # Families | % Families |
| Less than $10,000 | 755 | 4.4% |
| $10,000 to $14,999 | 1,132 | 6.6% |
| $15,000 to $24,999 | 1,441 | 8.4% |
| $25,000 to $34,999 | 1,715 | 10.0% |
| $35,000 to $49,999 | 2,041 | 11.9% |
| $50,000 to $74,999 | 2,899 | 16.9% |
| $75,000 to $99,999 | 2,624 | 15.3% |
| $100,000 to $149,999 | 2,573 | 15.0% |
| $150,000 to $199,999 | 1,149 | 6.7% |
| $200,000+ | 840 | 4.9% |
Family Income by Famaliy Size in Pulaski County
4-person families (2,671 | 15.6%) account for the highest median family income in Pulaski County with $89,425 per family, while 2-person families (8,741 | 51.0%) have the highest median income of $26,590 per family member.
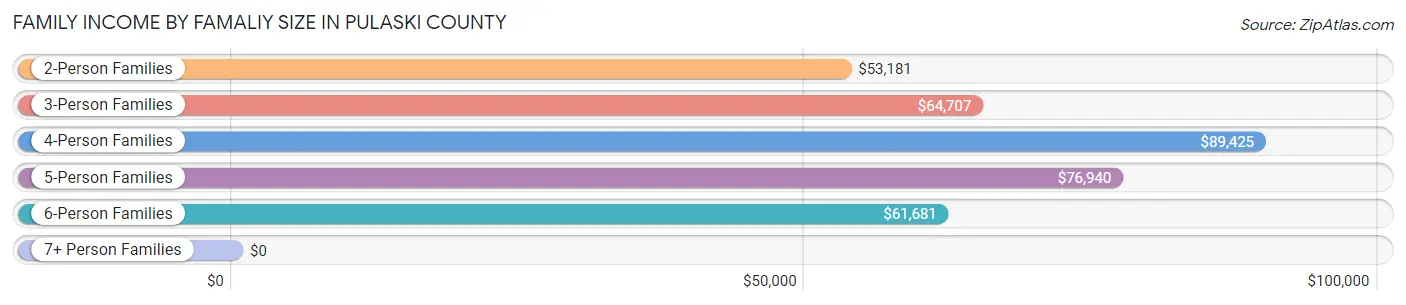
| Income Bracket | # Families | Median Income |
| 2-Person Families | 8,741 (51.0%) | $53,181 |
| 3-Person Families | 4,101 (23.9%) | $64,707 |
| 4-Person Families | 2,671 (15.6%) | $89,425 |
| 5-Person Families | 1,057 (6.2%) | $76,940 |
| 6-Person Families | 338 (2.0%) | $61,681 |
| 7+ Person Families | 245 (1.4%) | $0 |
| Total | 17,153 (100.0%) | $61,737 |
Family Income by Number of Earners in Pulaski County
The median family income in Pulaski County is $61,737, with families comprising 3+ earners (1,211) having the highest median family income of $103,767, while families with no earners (3,522) have the lowest median family income of $29,023, accounting for 7.1% and 20.5% of families, respectively.
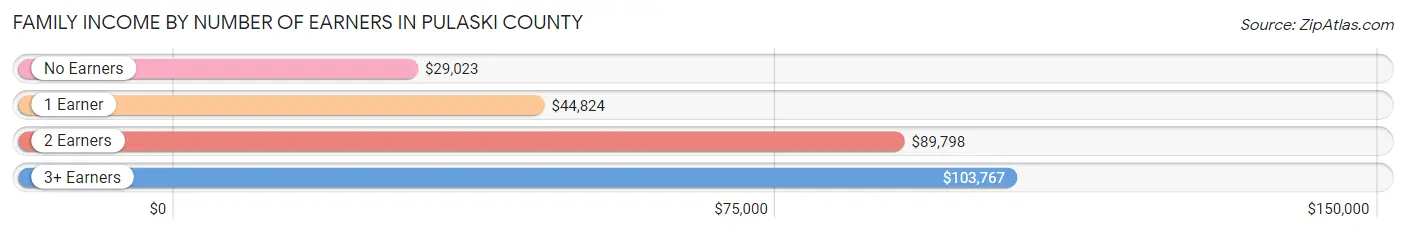
| Number of Earners | # Families | Median Income |
| No Earners | 3,522 (20.5%) | $29,023 |
| 1 Earner | 5,887 (34.3%) | $44,824 |
| 2 Earners | 6,533 (38.1%) | $89,798 |
| 3+ Earners | 1,211 (7.1%) | $103,767 |
| Total | 17,153 (100.0%) | $61,737 |
Household Income in Pulaski County
Household Income Brackets in Pulaski County
With 3,934 households falling in the category, the $50,000 to $74,999 income range is the most frequent in Pulaski County, accounting for 15.3% of all households. In contrast, only 951 households (3.7%) fall into the $200,000+ income bracket, making it the least populous group.
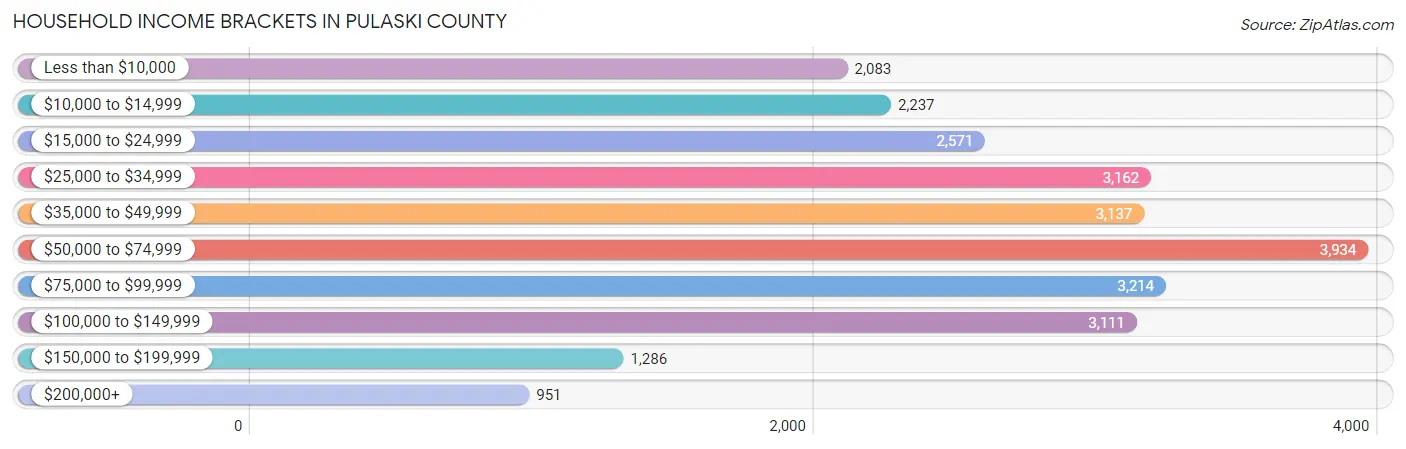
| Income Bracket | # Households | % Households |
| Less than $10,000 | 2,083 | 8.1% |
| $10,000 to $14,999 | 2,237 | 8.7% |
| $15,000 to $24,999 | 2,571 | 10.0% |
| $25,000 to $34,999 | 3,162 | 12.3% |
| $35,000 to $49,999 | 3,137 | 12.2% |
| $50,000 to $74,999 | 3,934 | 15.3% |
| $75,000 to $99,999 | 3,214 | 12.5% |
| $100,000 to $149,999 | 3,111 | 12.1% |
| $150,000 to $199,999 | 1,286 | 5.0% |
| $200,000+ | 951 | 3.7% |
Household Income by Householder Age in Pulaski County
The median household income in Pulaski County is $48,768, with the highest median household income of $64,135 found in the 25 to 44 years age bracket for the primary householder. A total of 7,447 households (29.0%) fall into this category. Meanwhile, the 65+ years age bracket for the primary householder has the lowest median household income of $34,556, with 7,736 households (30.1%) in this group.
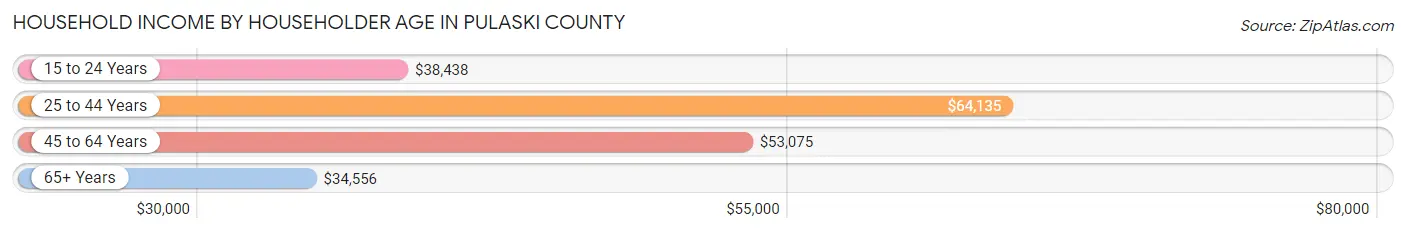
| Income Bracket | # Households | Median Income |
| 15 to 24 Years | 885 (3.4%) | $38,438 |
| 25 to 44 Years | 7,447 (29.0%) | $64,135 |
| 45 to 64 Years | 9,643 (37.5%) | $53,075 |
| 65+ Years | 7,736 (30.1%) | $34,556 |
| Total | 25,711 (100.0%) | $48,768 |
Poverty in Pulaski County
Income Below Poverty by Sex and Age in Pulaski County
With 18.4% poverty level for males and 24.3% for females among the residents of Pulaski County, 16 and 17 year old males and 5 year old females are the most vulnerable to poverty, with 295 males (34.4%) and 189 females (45.1%) in their respective age groups living below the poverty level.
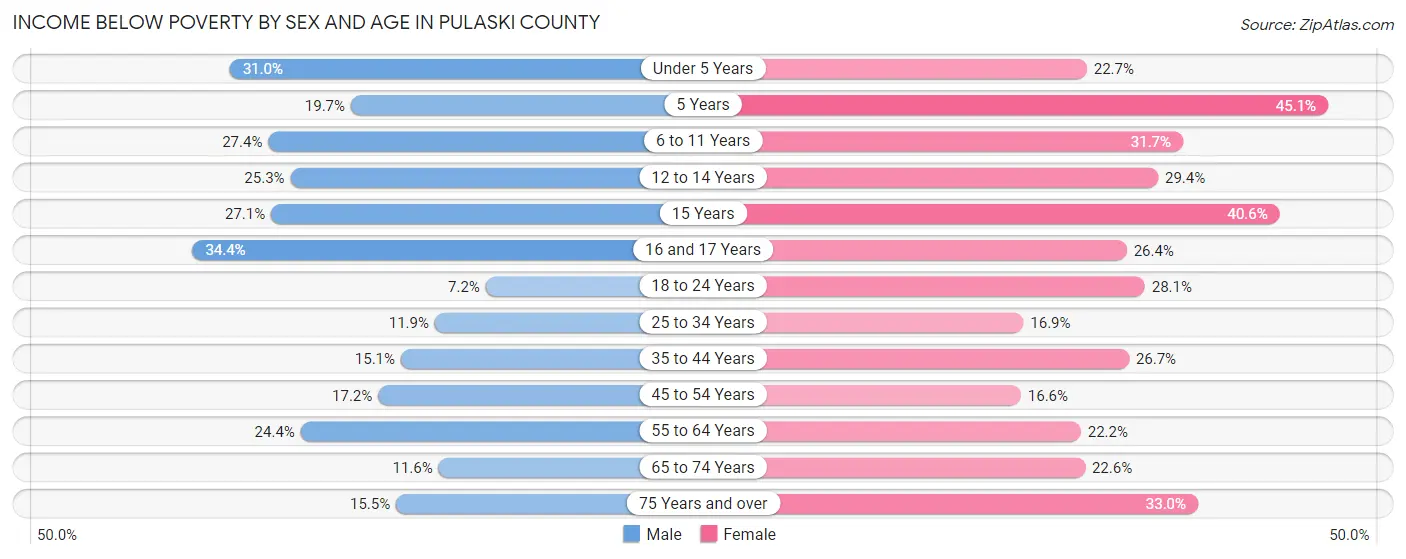
| Age Bracket | Male | Female |
| Under 5 Years | 569 (31.0%) | 407 (22.7%) |
| 5 Years | 56 (19.7%) | 189 (45.1%) |
| 6 to 11 Years | 588 (27.4%) | 614 (31.7%) |
| 12 to 14 Years | 405 (25.3%) | 366 (29.3%) |
| 15 Years | 118 (27.1%) | 171 (40.6%) |
| 16 and 17 Years | 295 (34.4%) | 229 (26.4%) |
| 18 to 24 Years | 173 (7.2%) | 656 (28.1%) |
| 25 to 34 Years | 451 (11.9%) | 645 (16.9%) |
| 35 to 44 Years | 580 (15.1%) | 1,062 (26.7%) |
| 45 to 54 Years | 733 (17.2%) | 714 (16.6%) |
| 55 to 64 Years | 1,089 (24.4%) | 1,055 (22.2%) |
| 65 to 74 Years | 404 (11.6%) | 872 (22.6%) |
| 75 Years and over | 307 (15.5%) | 888 (33.0%) |
| Total | 5,768 (18.4%) | 7,868 (24.3%) |
Income Above Poverty by Sex and Age in Pulaski County
According to the poverty statistics in Pulaski County, males aged 18 to 24 years and females aged 45 to 54 years are the age groups that are most secure financially, with 92.8% of males and 83.4% of females in these age groups living above the poverty line.
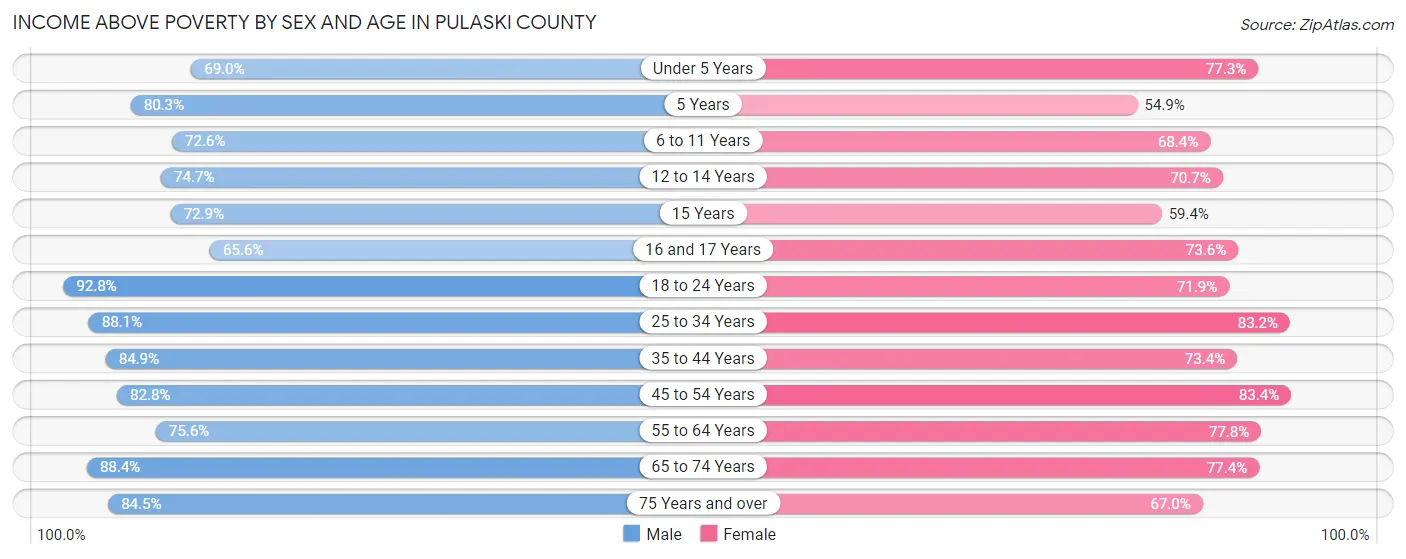
| Age Bracket | Male | Female |
| Under 5 Years | 1,269 (69.0%) | 1,383 (77.3%) |
| 5 Years | 228 (80.3%) | 230 (54.9%) |
| 6 to 11 Years | 1,559 (72.6%) | 1,326 (68.3%) |
| 12 to 14 Years | 1,194 (74.7%) | 881 (70.7%) |
| 15 Years | 317 (72.9%) | 250 (59.4%) |
| 16 and 17 Years | 562 (65.6%) | 637 (73.6%) |
| 18 to 24 Years | 2,226 (92.8%) | 1,677 (71.9%) |
| 25 to 34 Years | 3,330 (88.1%) | 3,183 (83.2%) |
| 35 to 44 Years | 3,265 (84.9%) | 2,923 (73.4%) |
| 45 to 54 Years | 3,530 (82.8%) | 3,582 (83.4%) |
| 55 to 64 Years | 3,378 (75.6%) | 3,702 (77.8%) |
| 65 to 74 Years | 3,084 (88.4%) | 2,991 (77.4%) |
| 75 Years and over | 1,670 (84.5%) | 1,800 (67.0%) |
| Total | 25,612 (81.6%) | 24,565 (75.7%) |
Income Below Poverty Among Married-Couple Families in Pulaski County
The poverty statistics for married-couple families in Pulaski County show that 10.2% or 1,270 of the total 12,494 families live below the poverty line. Families with 5 or more children have the highest poverty rate of 70.3%, comprising of 45 families. On the other hand, families with 3 or 4 children have the lowest poverty rate of 6.8%, which includes 51 families.
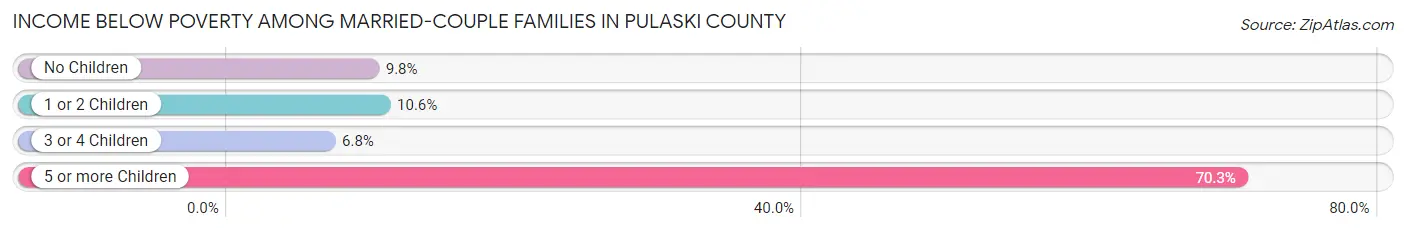
| Children | Above Poverty | Below Poverty |
| No Children | 7,115 (90.2%) | 773 (9.8%) |
| 1 or 2 Children | 3,387 (89.4%) | 401 (10.6%) |
| 3 or 4 Children | 703 (93.2%) | 51 (6.8%) |
| 5 or more Children | 19 (29.7%) | 45 (70.3%) |
| Total | 11,224 (89.8%) | 1,270 (10.2%) |
Income Below Poverty Among Single-Parent Households in Pulaski County
According to the poverty data in Pulaski County, 27.7% or 340 single-father households and 42.4% or 1,457 single-mother households are living below the poverty line. Among single-father households, those with 3 or 4 children have the highest poverty rate, with 116 households (52.0%) experiencing poverty. Likewise, among single-mother households, those with 5 or more children have the highest poverty rate, with 70 households (95.9%) falling below the poverty line.
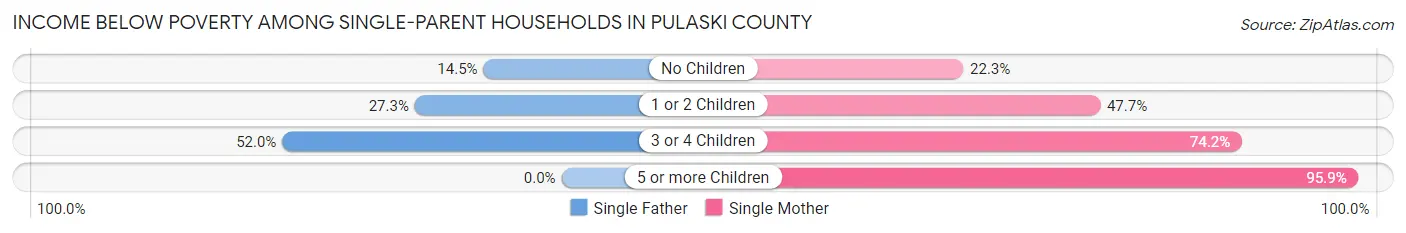
| Children | Single Father | Single Mother |
| No Children | 57 (14.5%) | 263 (22.3%) |
| 1 or 2 Children | 167 (27.3%) | 888 (47.7%) |
| 3 or 4 Children | 116 (52.0%) | 236 (74.2%) |
| 5 or more Children | 0 (0.0%) | 70 (95.9%) |
| Total | 340 (27.7%) | 1,457 (42.4%) |
Income Below Poverty Among Married-Couple vs Single-Parent Households in Pulaski County
The poverty data for Pulaski County shows that 1,270 of the married-couple family households (10.2%) and 1,797 of the single-parent households (38.6%) are living below the poverty level. Within the married-couple family households, those with 5 or more children have the highest poverty rate, with 45 households (70.3%) falling below the poverty line. Among the single-parent households, those with 5 or more children have the highest poverty rate, with 70 household (95.9%) living below poverty.
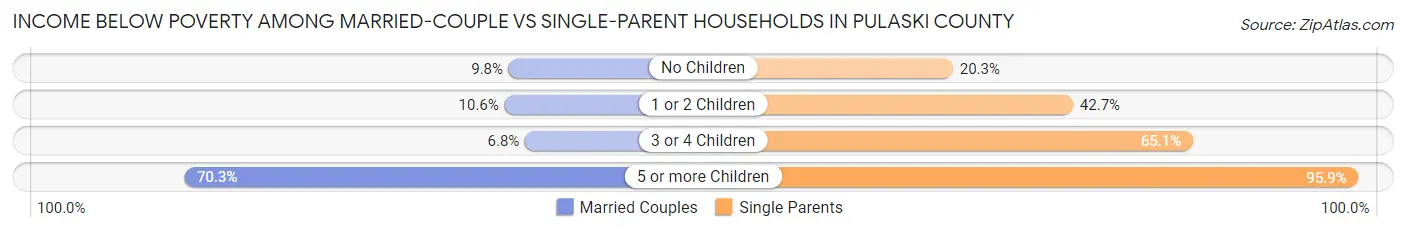
| Children | Married-Couple Families | Single-Parent Households |
| No Children | 773 (9.8%) | 320 (20.3%) |
| 1 or 2 Children | 401 (10.6%) | 1,055 (42.7%) |
| 3 or 4 Children | 51 (6.8%) | 352 (65.1%) |
| 5 or more Children | 45 (70.3%) | 70 (95.9%) |
| Total | 1,270 (10.2%) | 1,797 (38.6%) |
Employment Characteristics in Pulaski County
Employment by Class of Employer in Pulaski County
Among the 26,510 employed individuals in Pulaski County, private company employees (17,418 | 65.7%), local government employees (2,022 | 7.6%), and not-for-profit organizations (2,010 | 7.6%) make up the most common classes of employment.
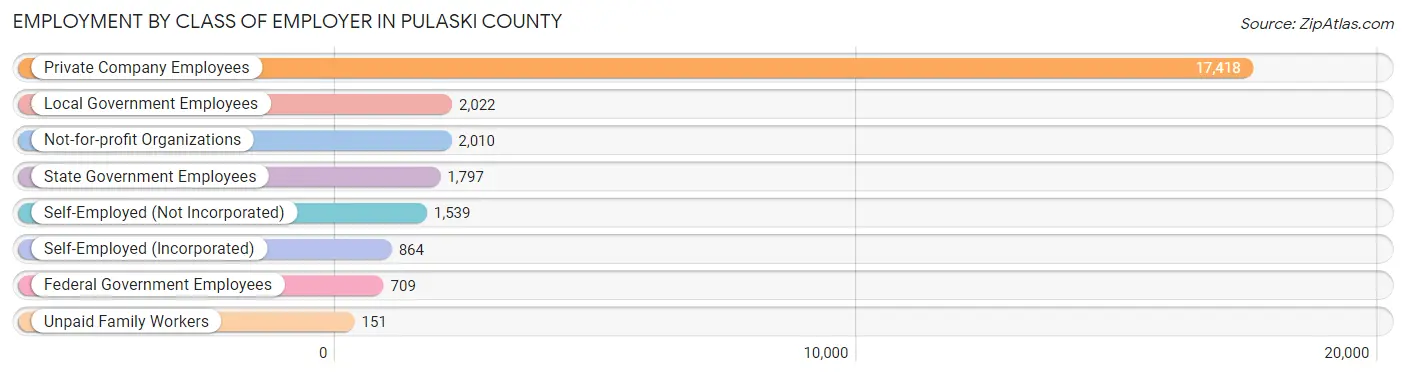
| Employer Class | # Employees | % Employees |
| Private Company Employees | 17,418 | 65.7% |
| Self-Employed (Incorporated) | 864 | 3.3% |
| Self-Employed (Not Incorporated) | 1,539 | 5.8% |
| Not-for-profit Organizations | 2,010 | 7.6% |
| Local Government Employees | 2,022 | 7.6% |
| State Government Employees | 1,797 | 6.8% |
| Federal Government Employees | 709 | 2.7% |
| Unpaid Family Workers | 151 | 0.6% |
| Total | 26,510 | 100.0% |
Employment Status by Age in Pulaski County
According to the labor force statistics for Pulaski County, out of the total population over 16 years of age (52,517), 54.6% or 28,674 individuals are in the labor force, with 4.9% or 1,405 of them unemployed. The age group with the highest labor force participation rate is 25 to 29 years, with 83.5% or 3,216 individuals in the labor force. Within the labor force, the 16 to 19 years age range has the highest percentage of unemployed individuals, with 10.7% or 149 of them being unemployed.
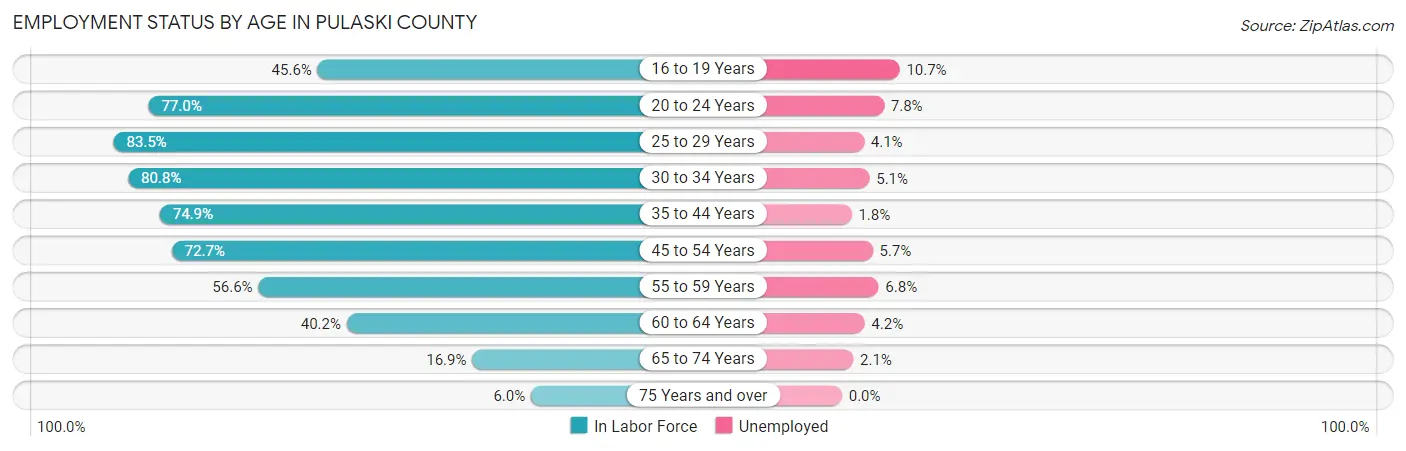
| Age Bracket | In Labor Force | Unemployed |
| 16 to 19 Years | 1,391 (45.6%) | 149 (10.7%) |
| 20 to 24 Years | 2,677 (77.0%) | 209 (7.8%) |
| 25 to 29 Years | 3,216 (83.5%) | 132 (4.1%) |
| 30 to 34 Years | 3,140 (80.8%) | 160 (5.1%) |
| 35 to 44 Years | 5,950 (74.9%) | 107 (1.8%) |
| 45 to 54 Years | 6,282 (72.7%) | 358 (5.7%) |
| 55 to 59 Years | 2,550 (56.6%) | 173 (6.8%) |
| 60 to 64 Years | 1,921 (40.2%) | 81 (4.2%) |
| 65 to 74 Years | 1,257 (16.9%) | 26 (2.1%) |
| 75 Years and over | 297 (6.0%) | 0 (0.0%) |
| Total | 28,674 (54.6%) | 1,405 (4.9%) |
Employment Status by Educational Attainment in Pulaski County
According to labor force statistics for Pulaski County, 68.6% of individuals (23,053) out of the total population between 25 and 64 years of age (33,605) are in the labor force, with 4.4% or 1,014 of them being unemployed. The group with the highest labor force participation rate are those with the educational attainment of bachelor's degree or higher, with 82.9% or 5,615 individuals in the labor force. Within the labor force, individuals with less than high school education have the highest percentage of unemployment, with 9.2% or 181 of them being unemployed.
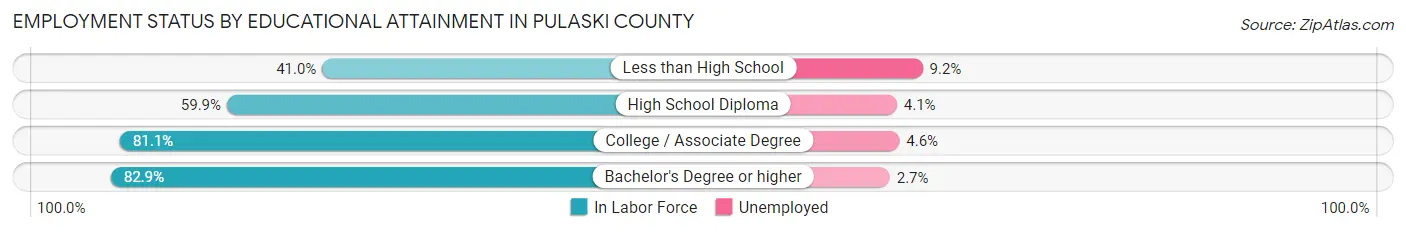
| Educational Attainment | In Labor Force | Unemployed |
| Less than High School | 1,962 (41.0%) | 440 (9.2%) |
| High School Diploma | 6,803 (59.9%) | 466 (4.1%) |
| College / Associate Degree | 8,668 (81.1%) | 492 (4.6%) |
| Bachelor's Degree or higher | 5,615 (82.9%) | 183 (2.7%) |
| Total | 23,053 (68.6%) | 1,479 (4.4%) |
Employment Occupations by Sex in Pulaski County
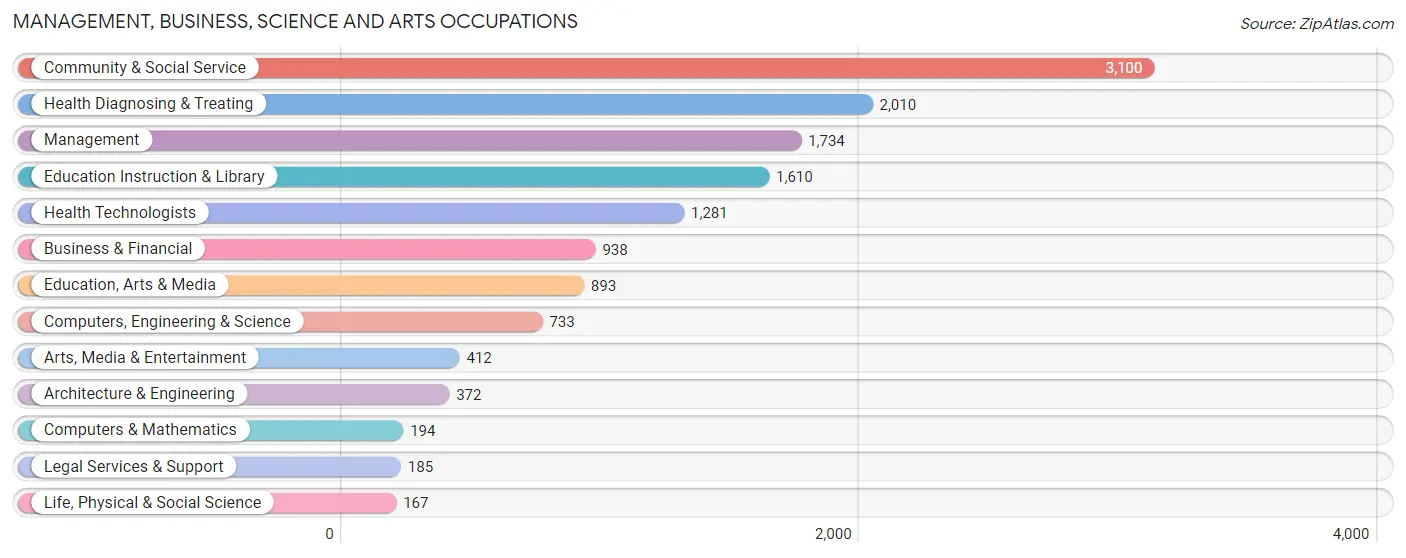
Management, Business, Science and Arts Occupations
The most common Management, Business, Science and Arts occupations in Pulaski County are Community & Social Service (3,100 | 11.4%), Health Diagnosing & Treating (2,010 | 7.4%), Management (1,734 | 6.4%), Education Instruction & Library (1,610 | 5.9%), and Health Technologists (1,281 | 4.7%).
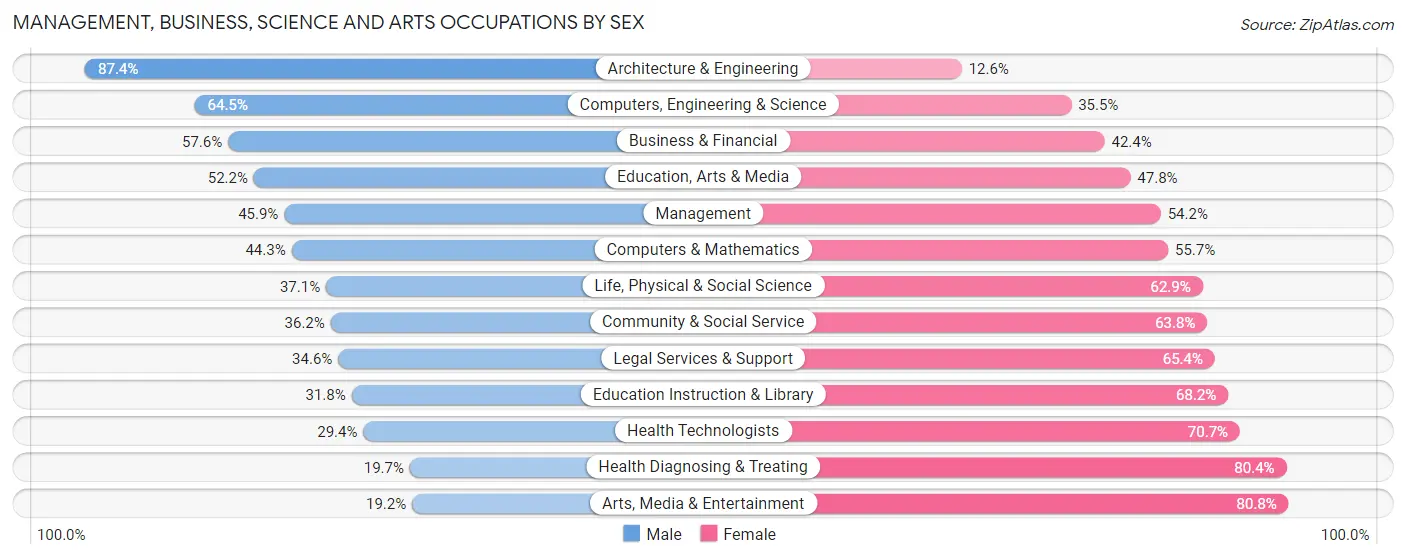
Management, Business, Science and Arts Occupations by Sex
Within the Management, Business, Science and Arts occupations in Pulaski County, the most male-oriented occupations are Architecture & Engineering (87.4%), Computers, Engineering & Science (64.5%), and Business & Financial (57.6%), while the most female-oriented occupations are Arts, Media & Entertainment (80.8%), Health Diagnosing & Treating (80.3%), and Health Technologists (70.7%).
| Occupation | Male | Female |
| Management | 795 (45.9%) | 939 (54.1%) |
| Business & Financial | 540 (57.6%) | 398 (42.4%) |
| Computers, Engineering & Science | 473 (64.5%) | 260 (35.5%) |
| Computers & Mathematics | 86 (44.3%) | 108 (55.7%) |
| Architecture & Engineering | 325 (87.4%) | 47 (12.6%) |
| Life, Physical & Social Science | 62 (37.1%) | 105 (62.9%) |
| Community & Social Service | 1,121 (36.2%) | 1,979 (63.8%) |
| Education, Arts & Media | 466 (52.2%) | 427 (47.8%) |
| Legal Services & Support | 64 (34.6%) | 121 (65.4%) |
| Education Instruction & Library | 512 (31.8%) | 1,098 (68.2%) |
| Arts, Media & Entertainment | 79 (19.2%) | 333 (80.8%) |
| Health Diagnosing & Treating | 395 (19.7%) | 1,615 (80.3%) |
| Health Technologists | 376 (29.3%) | 905 (70.7%) |
| Total (Category) | 3,324 (39.0%) | 5,191 (61.0%) |
| Total (Overall) | 14,231 (52.2%) | 13,037 (47.8%) |
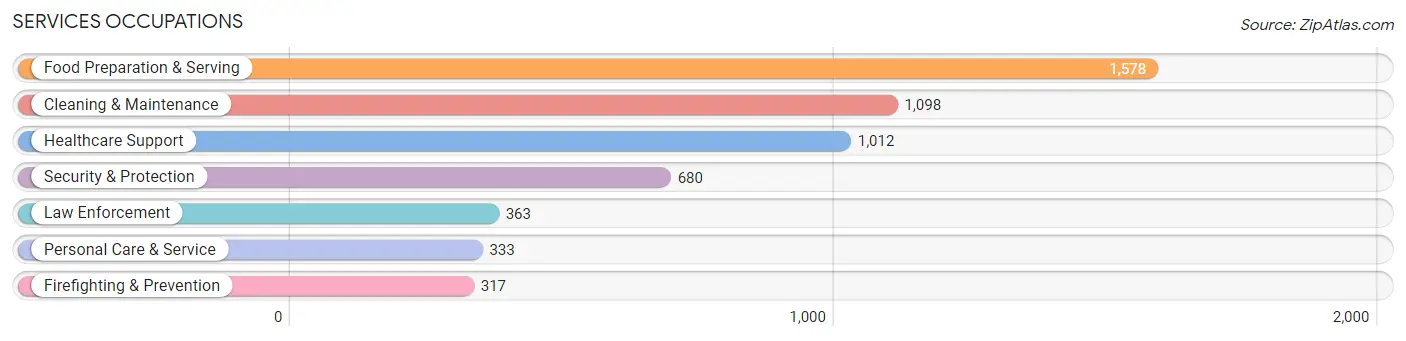
Services Occupations
The most common Services occupations in Pulaski County are Food Preparation & Serving (1,578 | 5.8%), Cleaning & Maintenance (1,098 | 4.0%), Healthcare Support (1,012 | 3.7%), Security & Protection (680 | 2.5%), and Law Enforcement (363 | 1.3%).
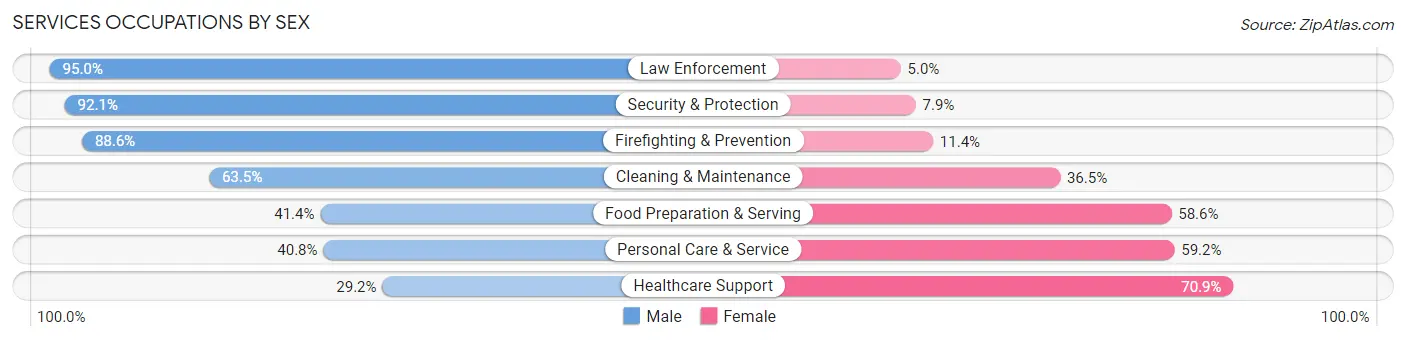
Services Occupations by Sex
Within the Services occupations in Pulaski County, the most male-oriented occupations are Law Enforcement (95.0%), Security & Protection (92.1%), and Firefighting & Prevention (88.6%), while the most female-oriented occupations are Healthcare Support (70.9%), Personal Care & Service (59.2%), and Food Preparation & Serving (58.6%).
| Occupation | Male | Female |
| Healthcare Support | 295 (29.1%) | 717 (70.9%) |
| Security & Protection | 626 (92.1%) | 54 (7.9%) |
| Firefighting & Prevention | 281 (88.6%) | 36 (11.4%) |
| Law Enforcement | 345 (95.0%) | 18 (5.0%) |
| Food Preparation & Serving | 654 (41.4%) | 924 (58.6%) |
| Cleaning & Maintenance | 697 (63.5%) | 401 (36.5%) |
| Personal Care & Service | 136 (40.8%) | 197 (59.2%) |
| Total (Category) | 2,408 (51.2%) | 2,293 (48.8%) |
| Total (Overall) | 14,231 (52.2%) | 13,037 (47.8%) |
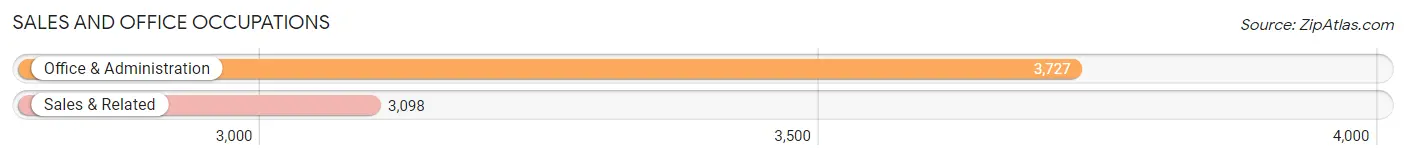
Sales and Office Occupations
The most common Sales and Office occupations in Pulaski County are Office & Administration (3,727 | 13.7%), and Sales & Related (3,098 | 11.4%).
Sales and Office Occupations by Sex
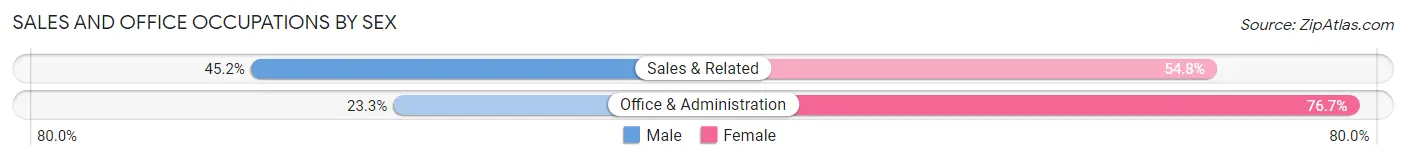
| Occupation | Male | Female |
| Sales & Related | 1,401 (45.2%) | 1,697 (54.8%) |
| Office & Administration | 869 (23.3%) | 2,858 (76.7%) |
| Total (Category) | 2,270 (33.3%) | 4,555 (66.7%) |
| Total (Overall) | 14,231 (52.2%) | 13,037 (47.8%) |
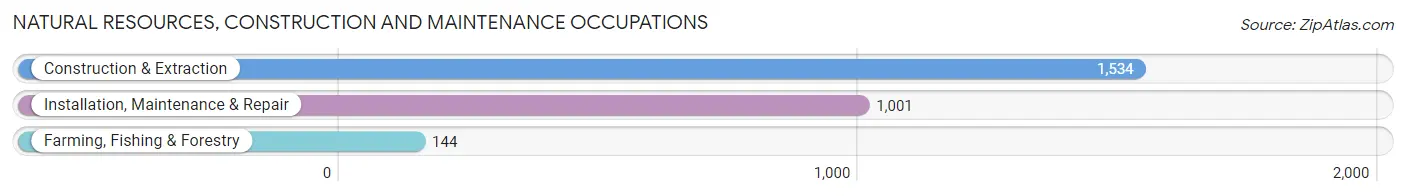
Natural Resources, Construction and Maintenance Occupations
The most common Natural Resources, Construction and Maintenance occupations in Pulaski County are Construction & Extraction (1,534 | 5.6%), Installation, Maintenance & Repair (1,001 | 3.7%), and Farming, Fishing & Forestry (144 | 0.5%).
Natural Resources, Construction and Maintenance Occupations by Sex
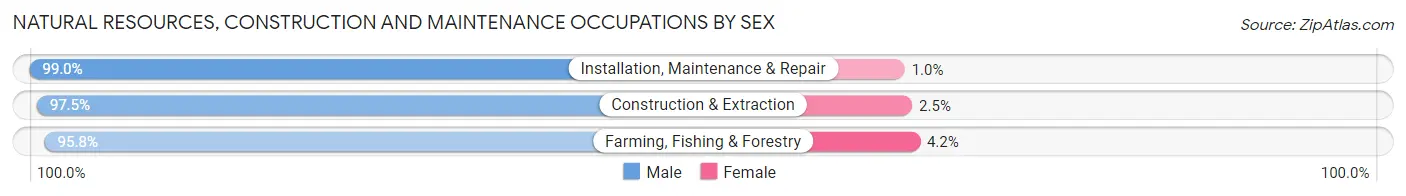
| Occupation | Male | Female |
| Farming, Fishing & Forestry | 138 (95.8%) | 6 (4.2%) |
| Construction & Extraction | 1,495 (97.5%) | 39 (2.5%) |
| Installation, Maintenance & Repair | 991 (99.0%) | 10 (1.0%) |
| Total (Category) | 2,624 (98.0%) | 55 (2.1%) |
| Total (Overall) | 14,231 (52.2%) | 13,037 (47.8%) |
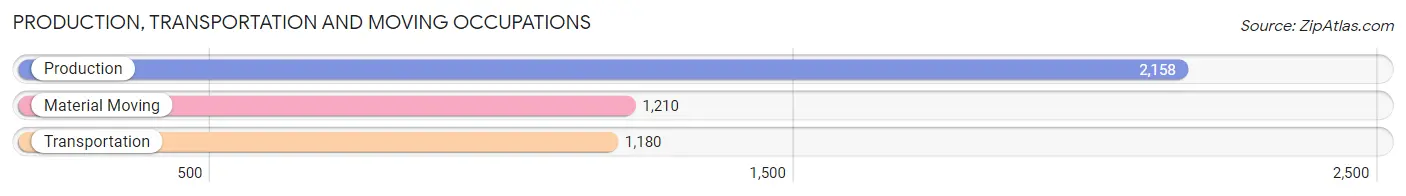
Production, Transportation and Moving Occupations
The most common Production, Transportation and Moving occupations in Pulaski County are Production (2,158 | 7.9%), Material Moving (1,210 | 4.4%), and Transportation (1,180 | 4.3%).
Production, Transportation and Moving Occupations by Sex
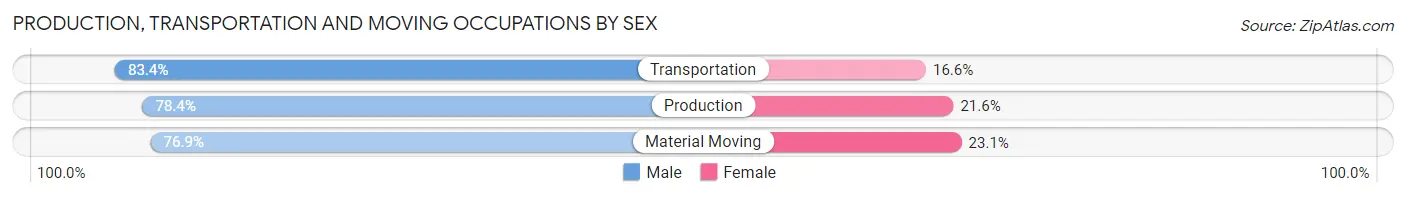
| Occupation | Male | Female |
| Production | 1,691 (78.4%) | 467 (21.6%) |
| Transportation | 984 (83.4%) | 196 (16.6%) |
| Material Moving | 930 (76.9%) | 280 (23.1%) |
| Total (Category) | 3,605 (79.3%) | 943 (20.7%) |
| Total (Overall) | 14,231 (52.2%) | 13,037 (47.8%) |
Employment Industries by Sex in Pulaski County
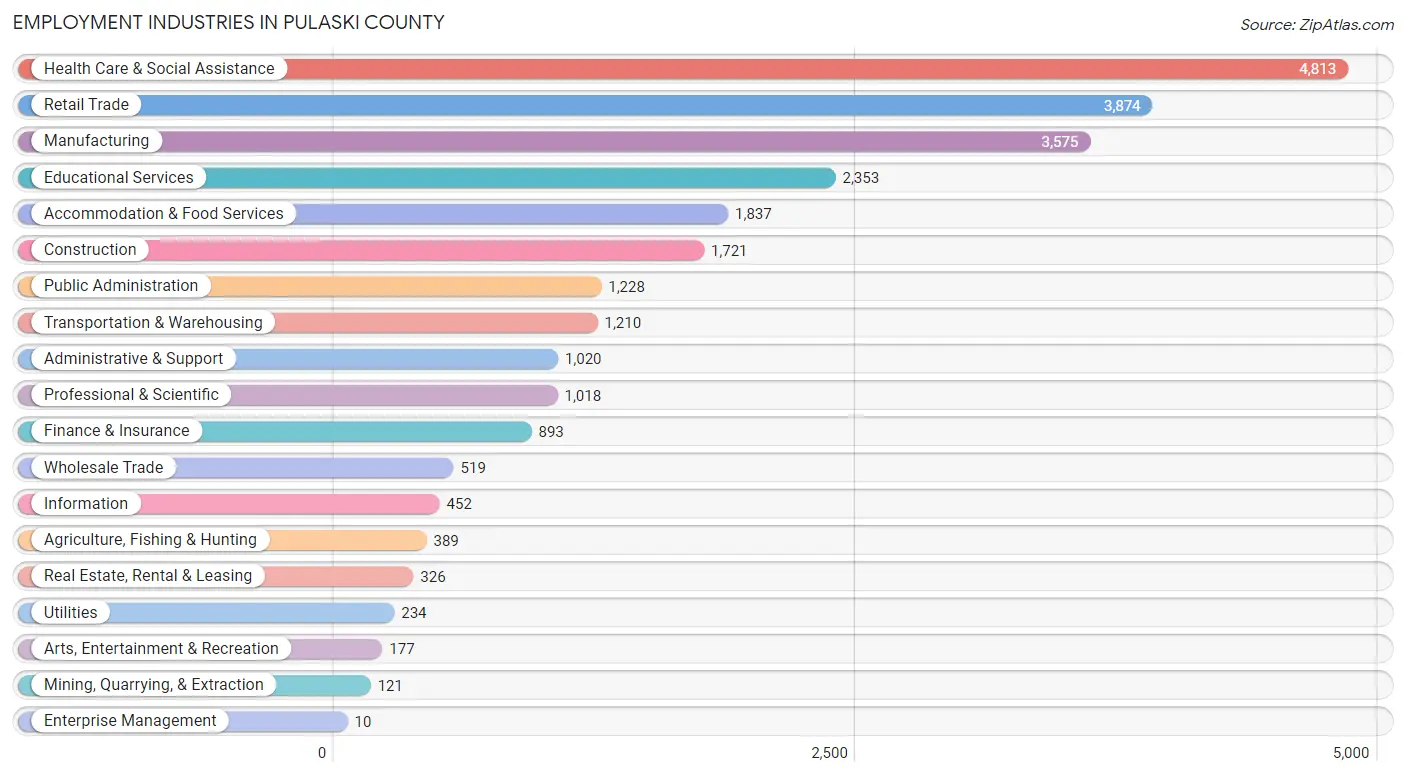
Employment Industries in Pulaski County
The major employment industries in Pulaski County include Health Care & Social Assistance (4,813 | 17.6%), Retail Trade (3,874 | 14.2%), Manufacturing (3,575 | 13.1%), Educational Services (2,353 | 8.6%), and Accommodation & Food Services (1,837 | 6.7%).
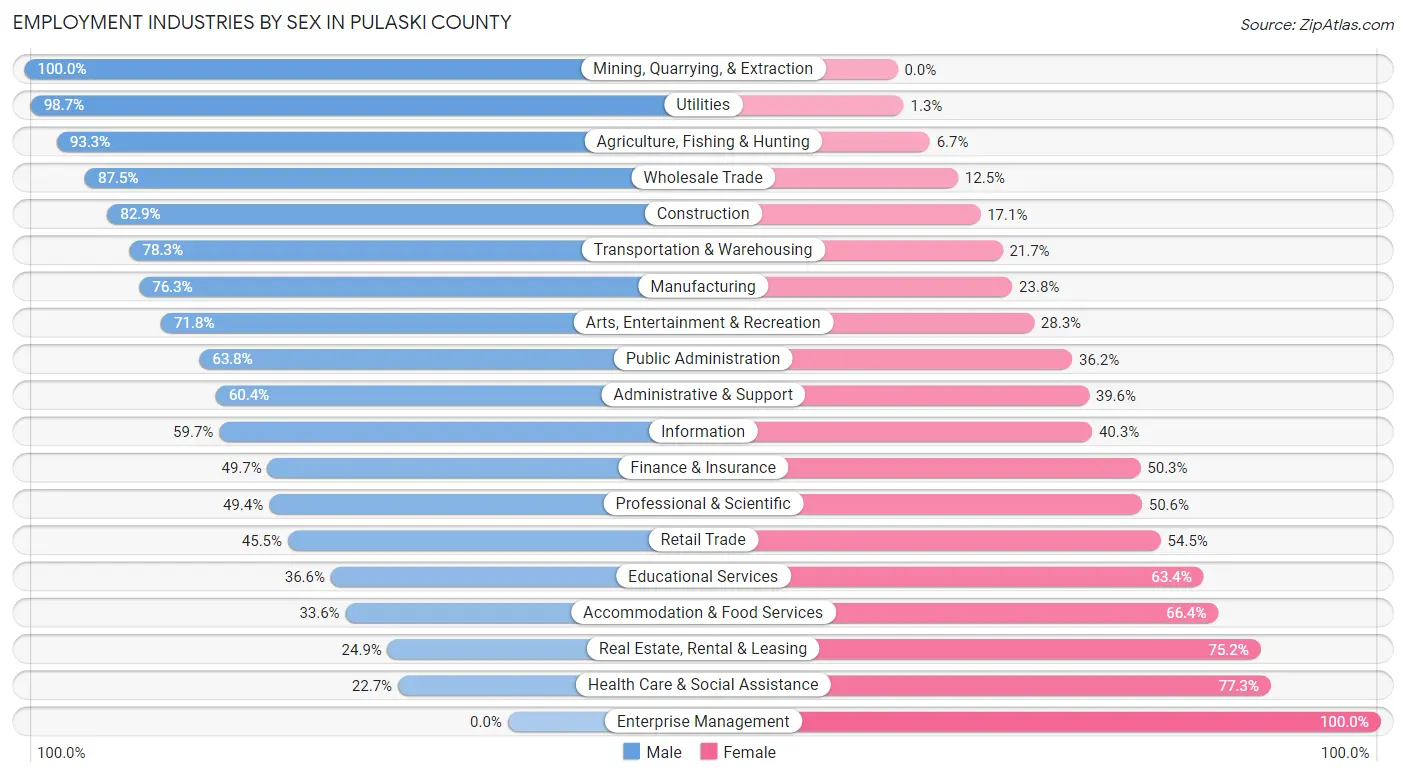
Employment Industries by Sex in Pulaski County
The Pulaski County industries that see more men than women are Mining, Quarrying, & Extraction (100.0%), Utilities (98.7%), and Agriculture, Fishing & Hunting (93.3%), whereas the industries that tend to have a higher number of women are Enterprise Management (100.0%), Health Care & Social Assistance (77.3%), and Real Estate, Rental & Leasing (75.1%).
| Industry | Male | Female |
| Agriculture, Fishing & Hunting | 363 (93.3%) | 26 (6.7%) |
| Mining, Quarrying, & Extraction | 121 (100.0%) | 0 (0.0%) |
| Construction | 1,426 (82.9%) | 295 (17.1%) |
| Manufacturing | 2,726 (76.2%) | 849 (23.7%) |
| Wholesale Trade | 454 (87.5%) | 65 (12.5%) |
| Retail Trade | 1,763 (45.5%) | 2,111 (54.5%) |
| Transportation & Warehousing | 947 (78.3%) | 263 (21.7%) |
| Utilities | 231 (98.7%) | 3 (1.3%) |
| Information | 270 (59.7%) | 182 (40.3%) |
| Finance & Insurance | 444 (49.7%) | 449 (50.3%) |
| Real Estate, Rental & Leasing | 81 (24.8%) | 245 (75.1%) |
| Professional & Scientific | 503 (49.4%) | 515 (50.6%) |
| Enterprise Management | 0 (0.0%) | 10 (100.0%) |
| Administrative & Support | 616 (60.4%) | 404 (39.6%) |
| Educational Services | 862 (36.6%) | 1,491 (63.4%) |
| Health Care & Social Assistance | 1,094 (22.7%) | 3,719 (77.3%) |
| Arts, Entertainment & Recreation | 127 (71.8%) | 50 (28.2%) |
| Accommodation & Food Services | 617 (33.6%) | 1,220 (66.4%) |
| Public Administration | 784 (63.8%) | 444 (36.2%) |
| Total | 14,231 (52.2%) | 13,037 (47.8%) |
Education in Pulaski County
School Enrollment in Pulaski County
The most common levels of schooling among the 13,417 students in Pulaski County are middle school (3,431 | 25.6%), high school (3,317 | 24.7%), and elementary school (2,821 | 21.0%).
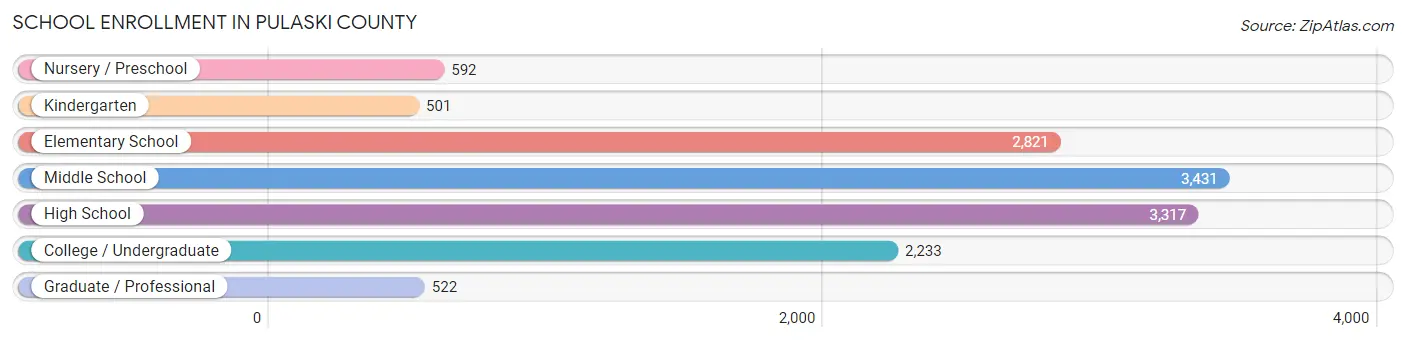
| School Level | # Students | % Students |
| Nursery / Preschool | 592 | 4.4% |
| Kindergarten | 501 | 3.7% |
| Elementary School | 2,821 | 21.0% |
| Middle School | 3,431 | 25.6% |
| High School | 3,317 | 24.7% |
| College / Undergraduate | 2,233 | 16.6% |
| Graduate / Professional | 522 | 3.9% |
| Total | 13,417 | 100.0% |
School Enrollment by Age by Funding Source in Pulaski County
Out of a total of 13,417 students who are enrolled in schools in Pulaski County, 1,261 (9.4%) attend a private institution, while the remaining 12,156 (90.6%) are enrolled in public schools. The age group of 3 to 4 year olds has the highest likelihood of being enrolled in private schools, with 177 (46.7% in the age bracket) enrolled. Conversely, the age group of 18 to 19 year olds has the lowest likelihood of being enrolled in a private school, with 719 (95.4% in the age bracket) attending a public institution.
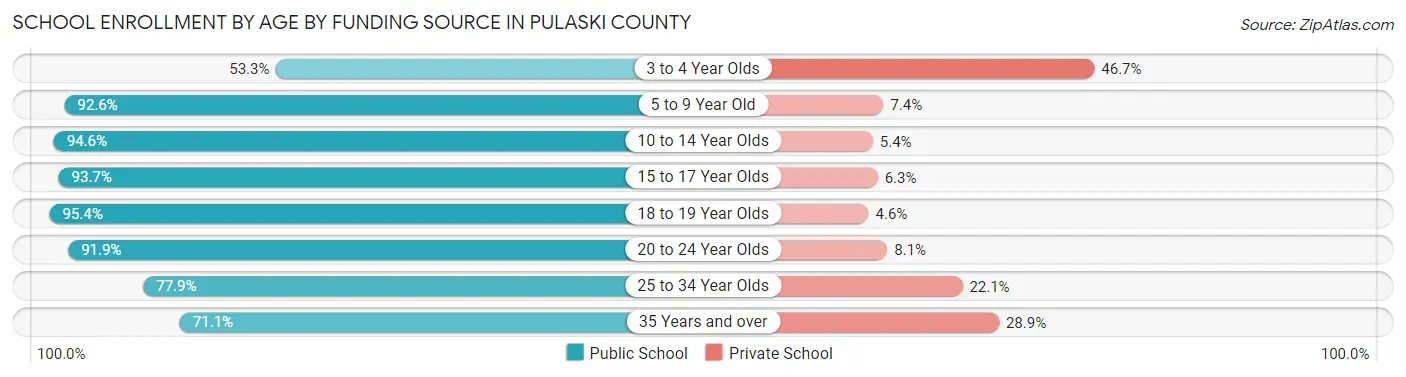
| Age Bracket | Public School | Private School |
| 3 to 4 Year Olds | 202 (53.3%) | 177 (46.7%) |
| 5 to 9 Year Old | 2,906 (92.6%) | 233 (7.4%) |
| 10 to 14 Year Olds | 4,186 (94.6%) | 241 (5.4%) |
| 15 to 17 Year Olds | 2,333 (93.7%) | 158 (6.3%) |
| 18 to 19 Year Olds | 719 (95.4%) | 35 (4.6%) |
| 20 to 24 Year Olds | 848 (91.9%) | 75 (8.1%) |
| 25 to 34 Year Olds | 426 (77.9%) | 121 (22.1%) |
| 35 Years and over | 538 (71.1%) | 219 (28.9%) |
| Total | 12,156 (90.6%) | 1,261 (9.4%) |
Educational Attainment by Field of Study in Pulaski County
Education (1,592 | 18.0%), business (1,511 | 17.1%), science & technology (1,145 | 13.0%), arts & humanities (1,070 | 12.1%), and bio, nature & agricultural (688 | 7.8%) are the most common fields of study among 8,840 individuals in Pulaski County who have obtained a bachelor's degree or higher.
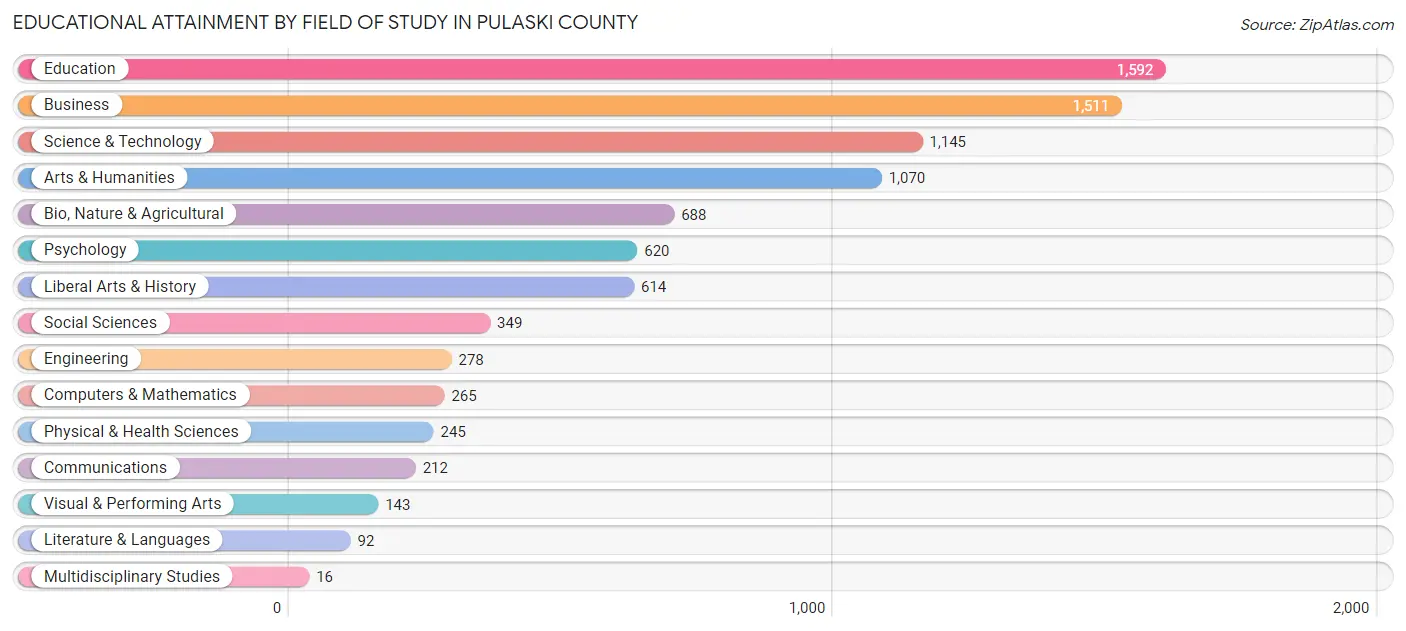
| Field of Study | # Graduates | % Graduates |
| Computers & Mathematics | 265 | 3.0% |
| Bio, Nature & Agricultural | 688 | 7.8% |
| Physical & Health Sciences | 245 | 2.8% |
| Psychology | 620 | 7.0% |
| Social Sciences | 349 | 4.0% |
| Engineering | 278 | 3.1% |
| Multidisciplinary Studies | 16 | 0.2% |
| Science & Technology | 1,145 | 13.0% |
| Business | 1,511 | 17.1% |
| Education | 1,592 | 18.0% |
| Literature & Languages | 92 | 1.0% |
| Liberal Arts & History | 614 | 7.0% |
| Visual & Performing Arts | 143 | 1.6% |
| Communications | 212 | 2.4% |
| Arts & Humanities | 1,070 | 12.1% |
| Total | 8,840 | 100.0% |
Transportation & Commute in Pulaski County
Vehicle Availability by Sex in Pulaski County
The most prevalent vehicle ownership categories in Pulaski County are males with 2 vehicles (6,042, accounting for 43.1%) and females with 2 vehicles (4,960, making up 48.3%).
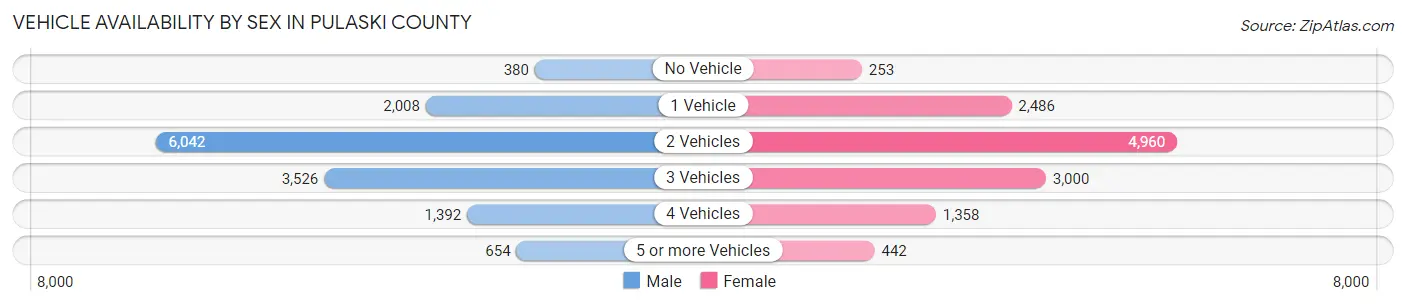
| Vehicles Available | Male | Female |
| No Vehicle | 380 (2.7%) | 253 (2.0%) |
| 1 Vehicle | 2,008 (14.3%) | 2,486 (19.9%) |
| 2 Vehicles | 6,042 (43.1%) | 4,960 (39.7%) |
| 3 Vehicles | 3,526 (25.2%) | 3,000 (24.0%) |
| 4 Vehicles | 1,392 (9.9%) | 1,358 (10.9%) |
| 5 or more Vehicles | 654 (4.7%) | 442 (3.5%) |
| Total | 14,002 (100.0%) | 12,499 (100.0%) |
Commute Time in Pulaski County
The most frequently occuring commute durations in Pulaski County are 15 to 19 minutes (5,478 commuters, 21.4%), 10 to 14 minutes (5,065 commuters, 19.8%), and 20 to 24 minutes (3,619 commuters, 14.2%).
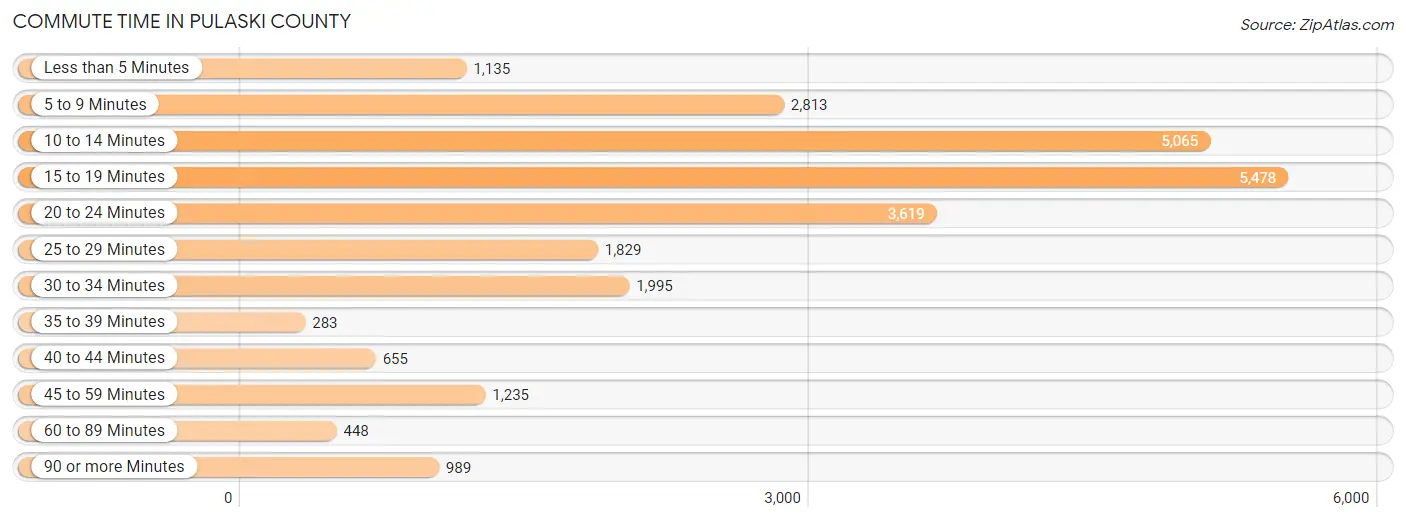
| Commute Time | # Commuters | % Commuters |
| Less than 5 Minutes | 1,135 | 4.4% |
| 5 to 9 Minutes | 2,813 | 11.0% |
| 10 to 14 Minutes | 5,065 | 19.8% |
| 15 to 19 Minutes | 5,478 | 21.4% |
| 20 to 24 Minutes | 3,619 | 14.2% |
| 25 to 29 Minutes | 1,829 | 7.2% |
| 30 to 34 Minutes | 1,995 | 7.8% |
| 35 to 39 Minutes | 283 | 1.1% |
| 40 to 44 Minutes | 655 | 2.6% |
| 45 to 59 Minutes | 1,235 | 4.8% |
| 60 to 89 Minutes | 448 | 1.8% |
| 90 or more Minutes | 989 | 3.9% |
Commute Time by Sex in Pulaski County
The most common commute times in Pulaski County are 15 to 19 minutes (2,728 commuters, 20.2%) for males and 10 to 14 minutes (2,785 commuters, 23.2%) for females.
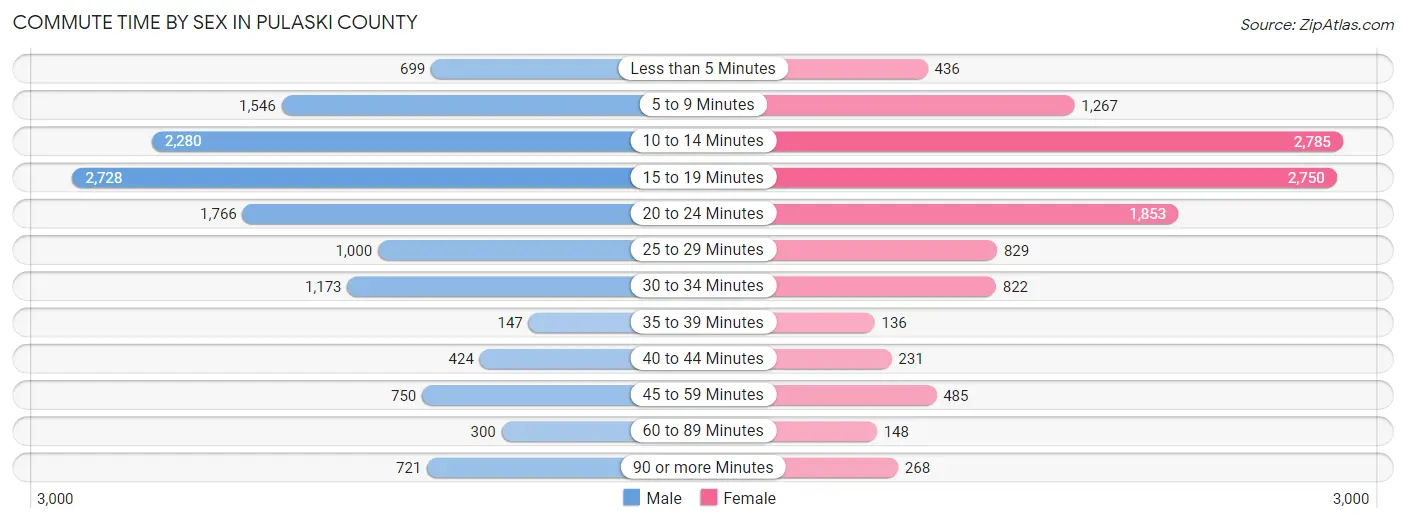
| Commute Time | Male | Female |
| Less than 5 Minutes | 699 (5.2%) | 436 (3.6%) |
| 5 to 9 Minutes | 1,546 (11.4%) | 1,267 (10.5%) |
| 10 to 14 Minutes | 2,280 (16.9%) | 2,785 (23.2%) |
| 15 to 19 Minutes | 2,728 (20.2%) | 2,750 (22.9%) |
| 20 to 24 Minutes | 1,766 (13.1%) | 1,853 (15.4%) |
| 25 to 29 Minutes | 1,000 (7.4%) | 829 (6.9%) |
| 30 to 34 Minutes | 1,173 (8.7%) | 822 (6.8%) |
| 35 to 39 Minutes | 147 (1.1%) | 136 (1.1%) |
| 40 to 44 Minutes | 424 (3.1%) | 231 (1.9%) |
| 45 to 59 Minutes | 750 (5.5%) | 485 (4.0%) |
| 60 to 89 Minutes | 300 (2.2%) | 148 (1.2%) |
| 90 or more Minutes | 721 (5.3%) | 268 (2.2%) |
Time of Departure to Work by Sex in Pulaski County
The most frequent times of departure to work in Pulaski County are 7:30 AM to 7:59 AM (2,150, 15.9%) for males and 7:30 AM to 7:59 AM (2,346, 19.5%) for females.
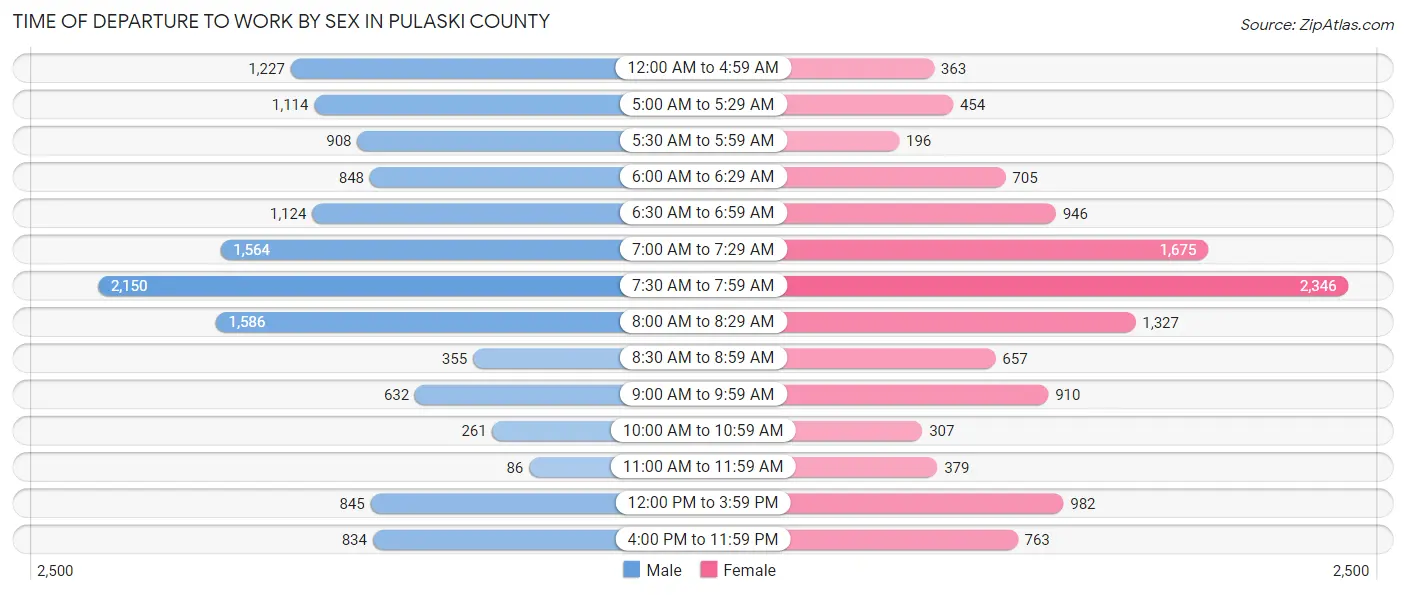
| Time of Departure | Male | Female |
| 12:00 AM to 4:59 AM | 1,227 (9.1%) | 363 (3.0%) |
| 5:00 AM to 5:29 AM | 1,114 (8.2%) | 454 (3.8%) |
| 5:30 AM to 5:59 AM | 908 (6.7%) | 196 (1.6%) |
| 6:00 AM to 6:29 AM | 848 (6.3%) | 705 (5.9%) |
| 6:30 AM to 6:59 AM | 1,124 (8.3%) | 946 (7.9%) |
| 7:00 AM to 7:29 AM | 1,564 (11.6%) | 1,675 (14.0%) |
| 7:30 AM to 7:59 AM | 2,150 (15.9%) | 2,346 (19.5%) |
| 8:00 AM to 8:29 AM | 1,586 (11.7%) | 1,327 (11.1%) |
| 8:30 AM to 8:59 AM | 355 (2.6%) | 657 (5.5%) |
| 9:00 AM to 9:59 AM | 632 (4.7%) | 910 (7.6%) |
| 10:00 AM to 10:59 AM | 261 (1.9%) | 307 (2.6%) |
| 11:00 AM to 11:59 AM | 86 (0.6%) | 379 (3.2%) |
| 12:00 PM to 3:59 PM | 845 (6.2%) | 982 (8.2%) |
| 4:00 PM to 11:59 PM | 834 (6.2%) | 763 (6.4%) |
| Total | 13,534 (100.0%) | 12,010 (100.0%) |
Housing Occupancy in Pulaski County
Occupancy by Ownership in Pulaski County
Of the total 25,711 dwellings in Pulaski County, owner-occupied units account for 18,576 (72.3%), while renter-occupied units make up 7,135 (27.8%).
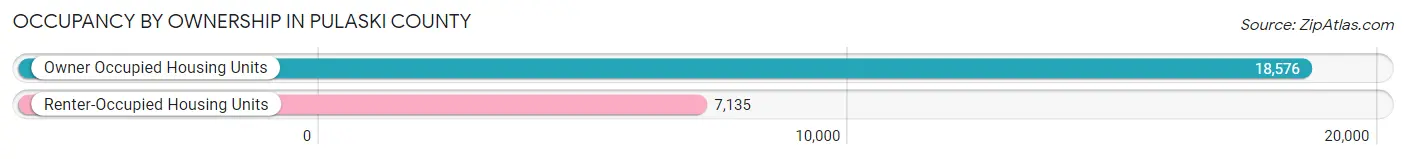
| Occupancy | # Housing Units | % Housing Units |
| Owner Occupied Housing Units | 18,576 | 72.3% |
| Renter-Occupied Housing Units | 7,135 | 27.8% |
| Total Occupied Housing Units | 25,711 | 100.0% |
Occupancy by Household Size in Pulaski County
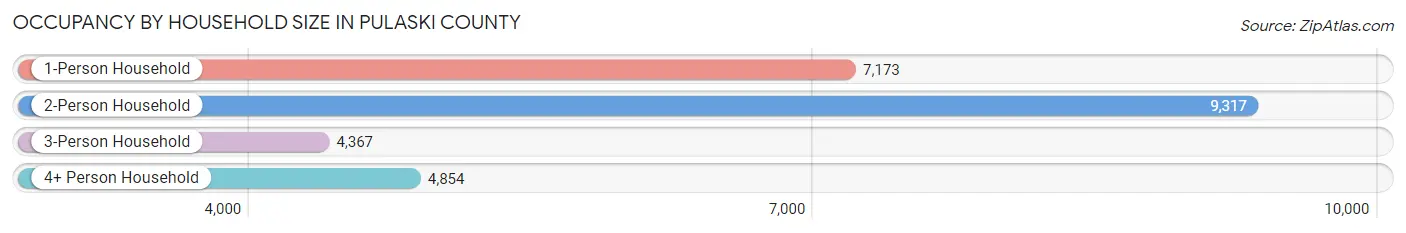
| Household Size | # Housing Units | % Housing Units |
| 1-Person Household | 7,173 | 27.9% |
| 2-Person Household | 9,317 | 36.2% |
| 3-Person Household | 4,367 | 17.0% |
| 4+ Person Household | 4,854 | 18.9% |
| Total Housing Units | 25,711 | 100.0% |
Occupancy by Ownership by Household Size in Pulaski County
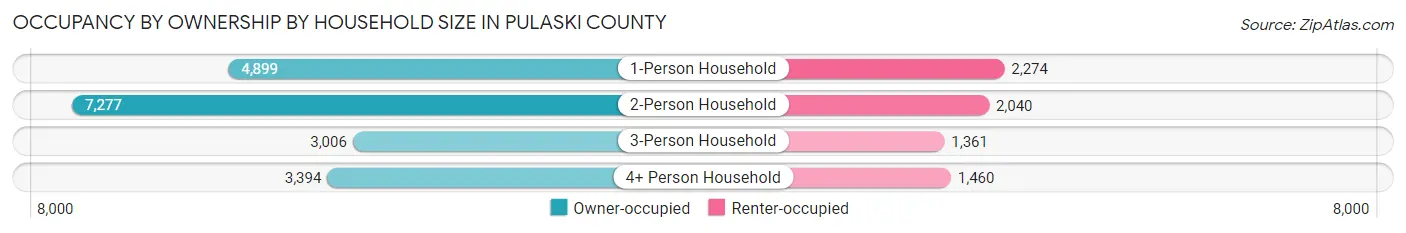
| Household Size | Owner-occupied | Renter-occupied |
| 1-Person Household | 4,899 (68.3%) | 2,274 (31.7%) |
| 2-Person Household | 7,277 (78.1%) | 2,040 (21.9%) |
| 3-Person Household | 3,006 (68.8%) | 1,361 (31.2%) |
| 4+ Person Household | 3,394 (69.9%) | 1,460 (30.1%) |
| Total Housing Units | 18,576 (72.3%) | 7,135 (27.8%) |
Occupancy by Educational Attainment in Pulaski County
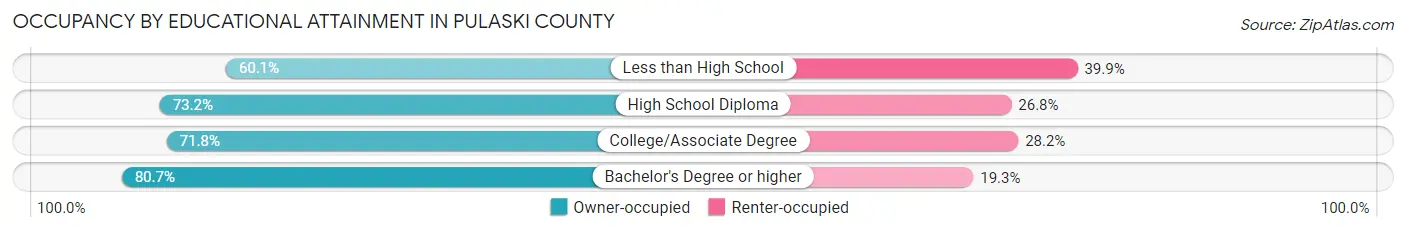
| Household Size | Owner-occupied | Renter-occupied |
| Less than High School | 2,260 (60.1%) | 1,501 (39.9%) |
| High School Diploma | 5,869 (73.2%) | 2,149 (26.8%) |
| College/Associate Degree | 6,469 (71.8%) | 2,536 (28.2%) |
| Bachelor's Degree or higher | 3,978 (80.7%) | 949 (19.3%) |
Occupancy by Age of Householder in Pulaski County
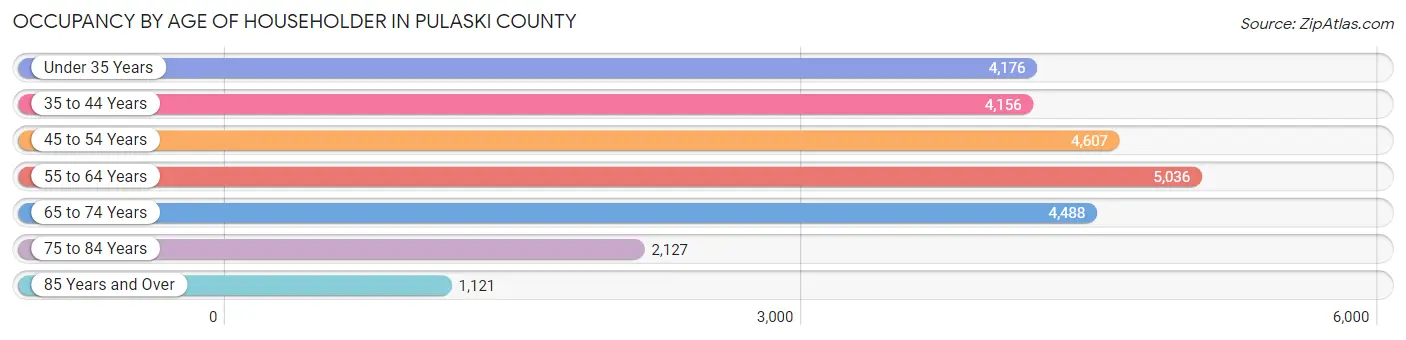
| Age Bracket | # Households | % Households |
| Under 35 Years | 4,176 | 16.2% |
| 35 to 44 Years | 4,156 | 16.2% |
| 45 to 54 Years | 4,607 | 17.9% |
| 55 to 64 Years | 5,036 | 19.6% |
| 65 to 74 Years | 4,488 | 17.5% |
| 75 to 84 Years | 2,127 | 8.3% |
| 85 Years and Over | 1,121 | 4.4% |
| Total | 25,711 | 100.0% |
Housing Finances in Pulaski County
Median Income by Occupancy in Pulaski County
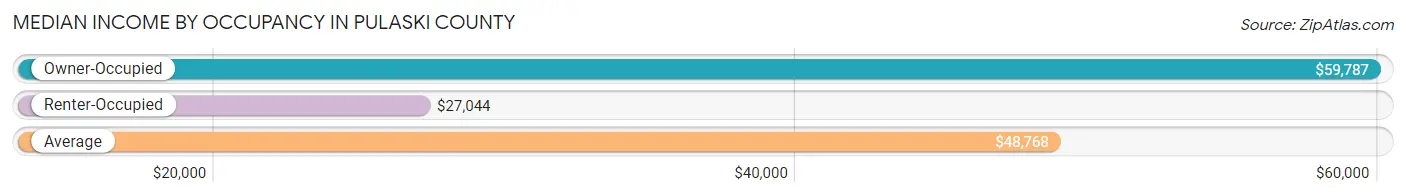
| Occupancy Type | # Households | Median Income |
| Owner-Occupied | 18,576 (72.3%) | $59,787 |
| Renter-Occupied | 7,135 (27.8%) | $27,044 |
| Average | 25,711 (100.0%) | $48,768 |
Occupancy by Householder Income Bracket in Pulaski County
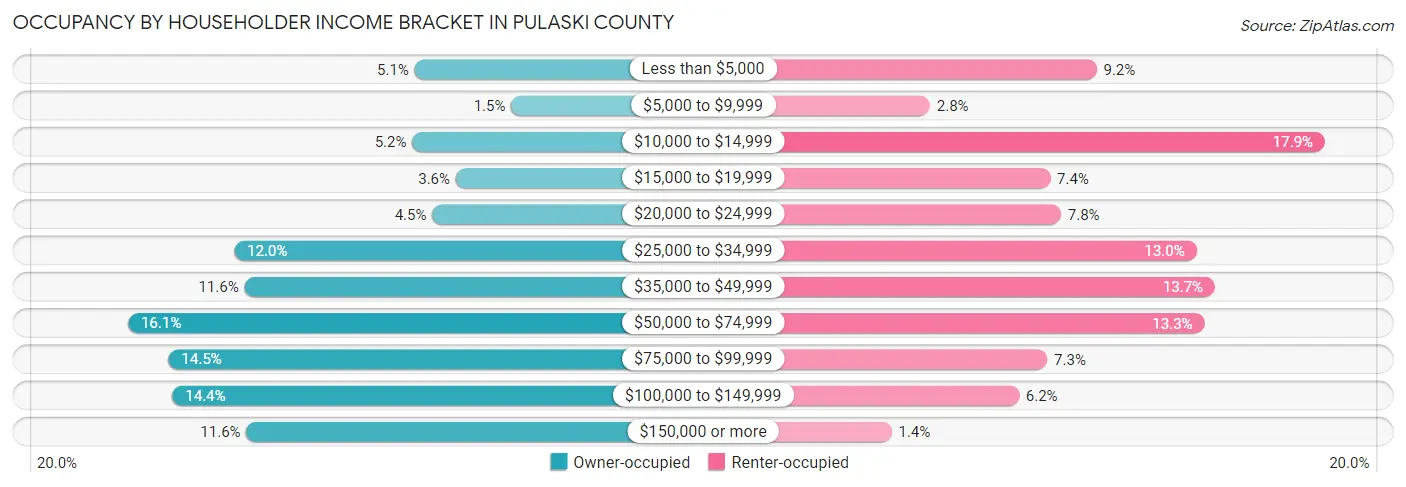
| Income Bracket | Owner-occupied | Renter-occupied |
| Less than $5,000 | 954 (5.1%) | 655 (9.2%) |
| $5,000 to $9,999 | 271 (1.5%) | 202 (2.8%) |
| $10,000 to $14,999 | 972 (5.2%) | 1,276 (17.9%) |
| $15,000 to $19,999 | 663 (3.6%) | 529 (7.4%) |
| $20,000 to $24,999 | 830 (4.5%) | 558 (7.8%) |
| $25,000 to $34,999 | 2,232 (12.0%) | 927 (13.0%) |
| $35,000 to $49,999 | 2,158 (11.6%) | 977 (13.7%) |
| $50,000 to $74,999 | 2,984 (16.1%) | 948 (13.3%) |
| $75,000 to $99,999 | 2,697 (14.5%) | 521 (7.3%) |
| $100,000 to $149,999 | 2,670 (14.4%) | 444 (6.2%) |
| $150,000 or more | 2,145 (11.6%) | 98 (1.4%) |
| Total | 18,576 (100.0%) | 7,135 (100.0%) |
Monthly Housing Cost Tiers in Pulaski County
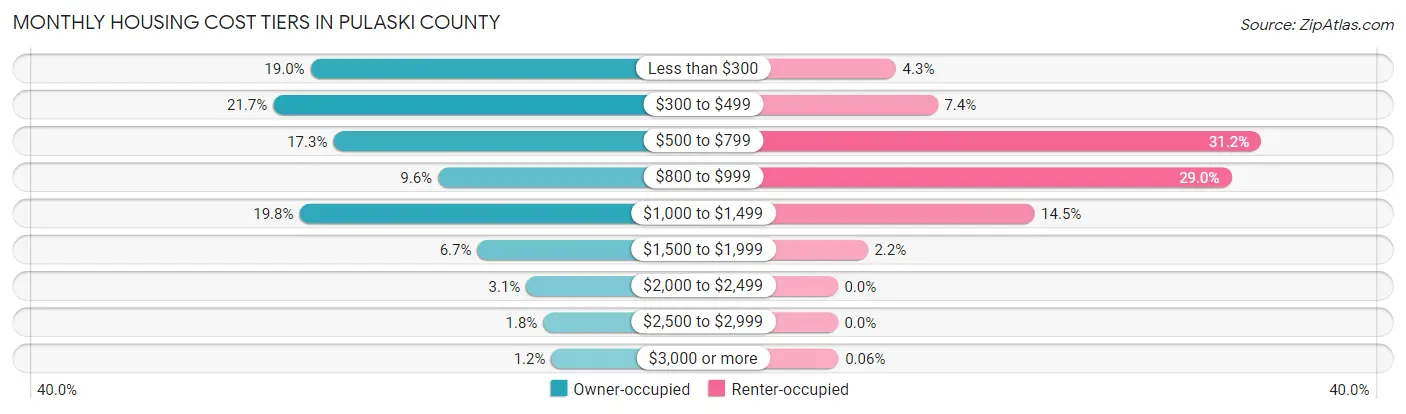
| Monthly Cost | Owner-occupied | Renter-occupied |
| Less than $300 | 3,521 (19.0%) | 306 (4.3%) |
| $300 to $499 | 4,031 (21.7%) | 526 (7.4%) |
| $500 to $799 | 3,209 (17.3%) | 2,226 (31.2%) |
| $800 to $999 | 1,776 (9.6%) | 2,069 (29.0%) |
| $1,000 to $1,499 | 3,672 (19.8%) | 1,034 (14.5%) |
| $1,500 to $1,999 | 1,238 (6.7%) | 158 (2.2%) |
| $2,000 to $2,499 | 569 (3.1%) | 0 (0.0%) |
| $2,500 to $2,999 | 336 (1.8%) | 0 (0.0%) |
| $3,000 or more | 224 (1.2%) | 4 (0.1%) |
| Total | 18,576 (100.0%) | 7,135 (100.0%) |
Physical Housing Characteristics in Pulaski County
Housing Structures in Pulaski County
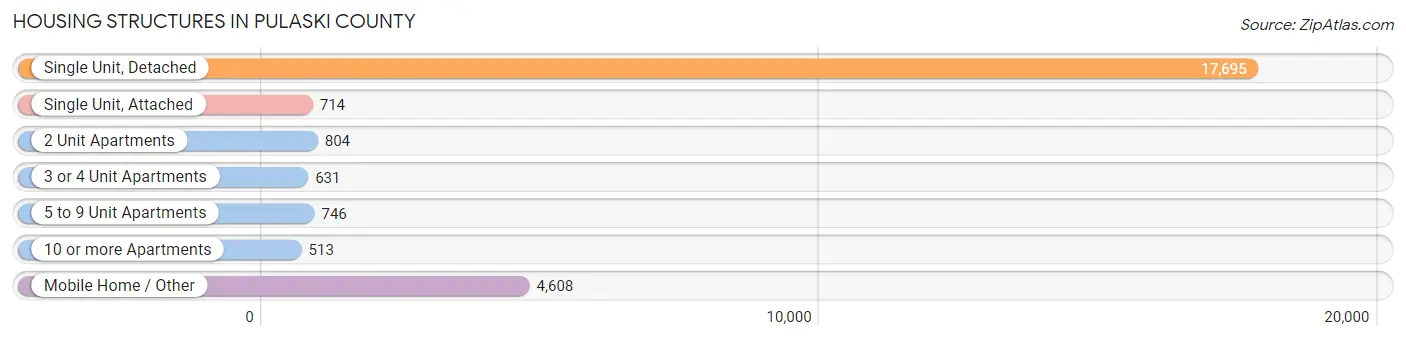
| Structure Type | # Housing Units | % Housing Units |
| Single Unit, Detached | 17,695 | 68.8% |
| Single Unit, Attached | 714 | 2.8% |
| 2 Unit Apartments | 804 | 3.1% |
| 3 or 4 Unit Apartments | 631 | 2.5% |
| 5 to 9 Unit Apartments | 746 | 2.9% |
| 10 or more Apartments | 513 | 2.0% |
| Mobile Home / Other | 4,608 | 17.9% |
| Total | 25,711 | 100.0% |
Housing Structures by Occupancy in Pulaski County
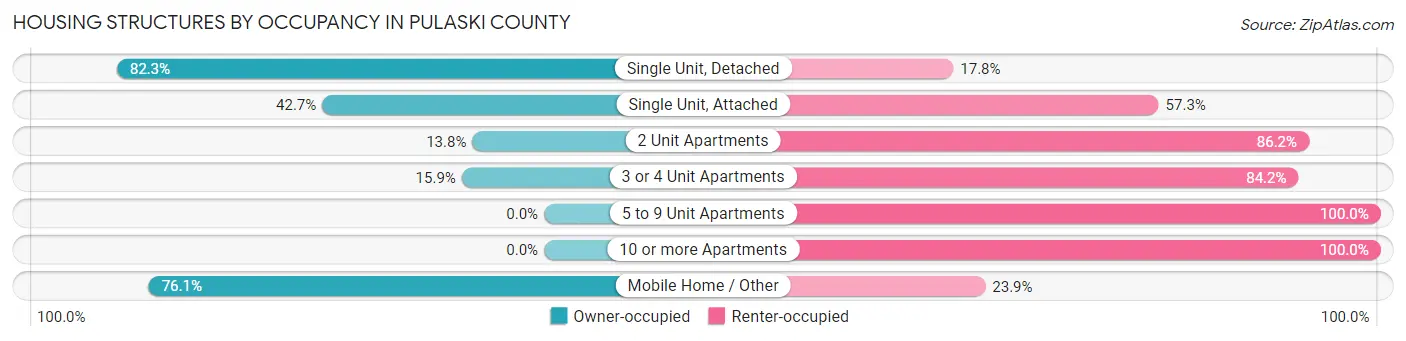
| Structure Type | Owner-occupied | Renter-occupied |
| Single Unit, Detached | 14,554 (82.3%) | 3,141 (17.7%) |
| Single Unit, Attached | 305 (42.7%) | 409 (57.3%) |
| 2 Unit Apartments | 111 (13.8%) | 693 (86.2%) |
| 3 or 4 Unit Apartments | 100 (15.9%) | 531 (84.2%) |
| 5 to 9 Unit Apartments | 0 (0.0%) | 746 (100.0%) |
| 10 or more Apartments | 0 (0.0%) | 513 (100.0%) |
| Mobile Home / Other | 3,506 (76.1%) | 1,102 (23.9%) |
| Total | 18,576 (72.3%) | 7,135 (27.8%) |
Housing Structures by Number of Rooms in Pulaski County
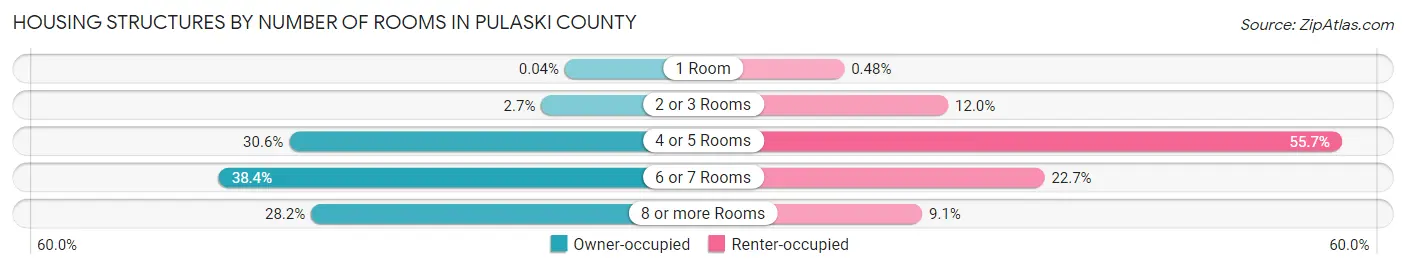
| Number of Rooms | Owner-occupied | Renter-occupied |
| 1 Room | 8 (0.0%) | 34 (0.5%) |
| 2 or 3 Rooms | 495 (2.7%) | 857 (12.0%) |
| 4 or 5 Rooms | 5,691 (30.6%) | 3,973 (55.7%) |
| 6 or 7 Rooms | 7,141 (38.4%) | 1,620 (22.7%) |
| 8 or more Rooms | 5,241 (28.2%) | 651 (9.1%) |
| Total | 18,576 (100.0%) | 7,135 (100.0%) |
Housing Structure by Heating Type in Pulaski County
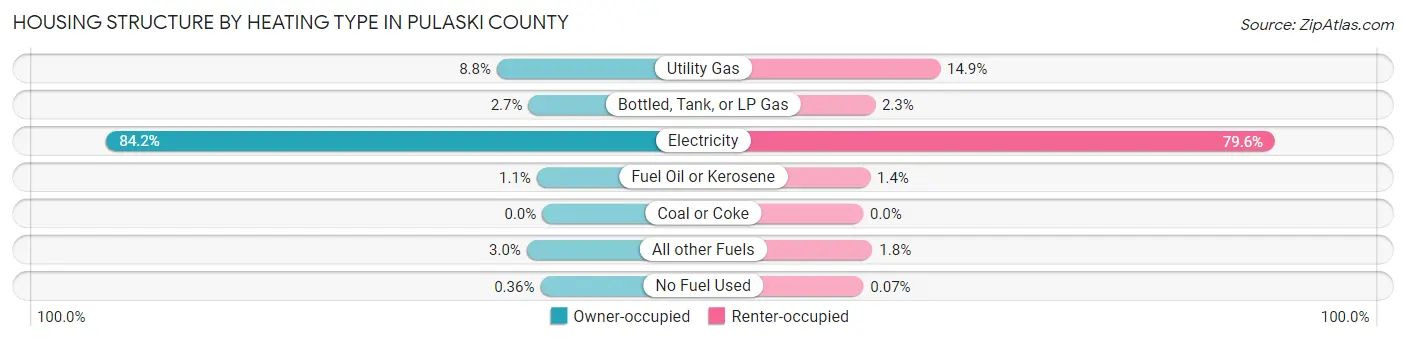
| Heating Type | Owner-occupied | Renter-occupied |
| Utility Gas | 1,626 (8.7%) | 1,062 (14.9%) |
| Bottled, Tank, or LP Gas | 496 (2.7%) | 164 (2.3%) |
| Electricity | 15,640 (84.2%) | 5,678 (79.6%) |
| Fuel Oil or Kerosene | 195 (1.1%) | 97 (1.4%) |
| Coal or Coke | 0 (0.0%) | 0 (0.0%) |
| All other Fuels | 553 (3.0%) | 129 (1.8%) |
| No Fuel Used | 66 (0.4%) | 5 (0.1%) |
| Total | 18,576 (100.0%) | 7,135 (100.0%) |
Household Vehicle Usage in Pulaski County
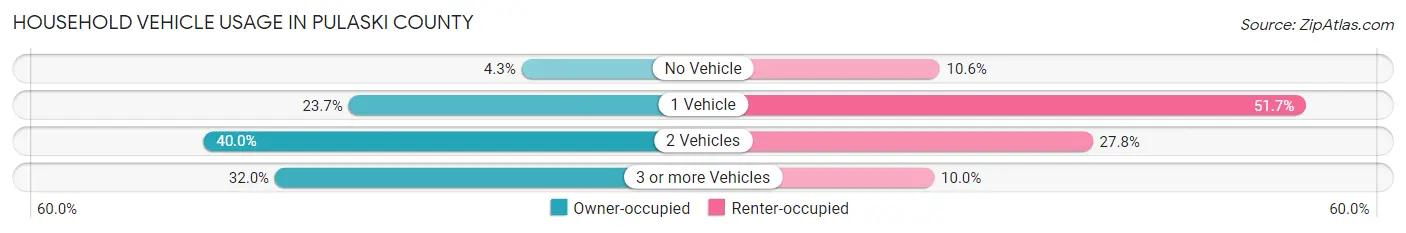
| Vehicles per Household | Owner-occupied | Renter-occupied |
| No Vehicle | 807 (4.3%) | 757 (10.6%) |
| 1 Vehicle | 4,407 (23.7%) | 3,685 (51.6%) |
| 2 Vehicles | 7,426 (40.0%) | 1,980 (27.8%) |
| 3 or more Vehicles | 5,936 (32.0%) | 713 (10.0%) |
| Total | 18,576 (100.0%) | 7,135 (100.0%) |
Real Estate & Mortgages in Pulaski County
Real Estate and Mortgage Overview in Pulaski County
| Characteristic | Without Mortgage | With Mortgage |
| Housing Units | 9,370 | 9,206 |
| Median Property Value | $118,600 | $157,300 |
| Median Household Income | $43,418 | $1,440 |
| Monthly Housing Costs | $353 | $224 |
| Real Estate Taxes | $767 | $480 |
Property Value by Mortgage Status in Pulaski County
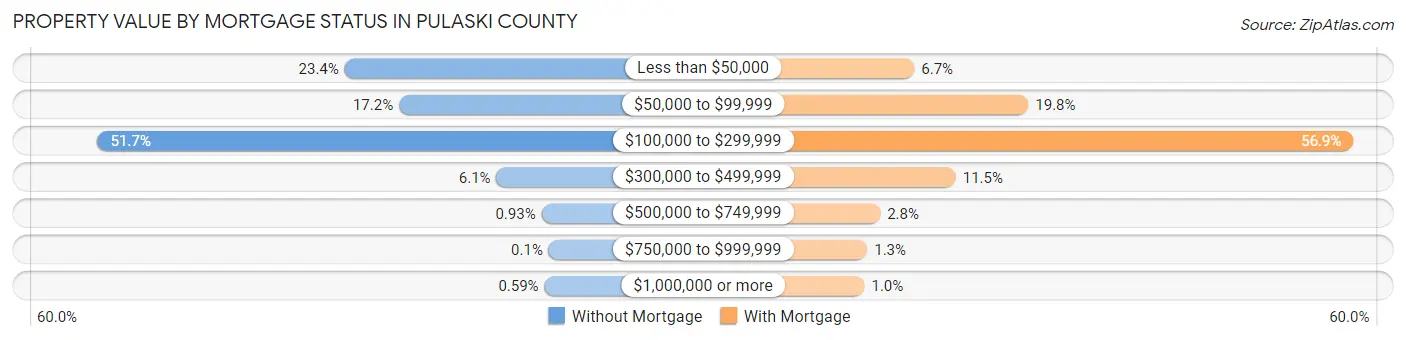
| Property Value | Without Mortgage | With Mortgage |
| Less than $50,000 | 2,195 (23.4%) | 619 (6.7%) |
| $50,000 to $99,999 | 1,613 (17.2%) | 1,818 (19.8%) |
| $100,000 to $299,999 | 4,841 (51.7%) | 5,236 (56.9%) |
| $300,000 to $499,999 | 570 (6.1%) | 1,055 (11.5%) |
| $500,000 to $749,999 | 87 (0.9%) | 260 (2.8%) |
| $750,000 to $999,999 | 9 (0.1%) | 123 (1.3%) |
| $1,000,000 or more | 55 (0.6%) | 95 (1.0%) |
| Total | 9,370 (100.0%) | 9,206 (100.0%) |
Household Income by Mortgage Status in Pulaski County
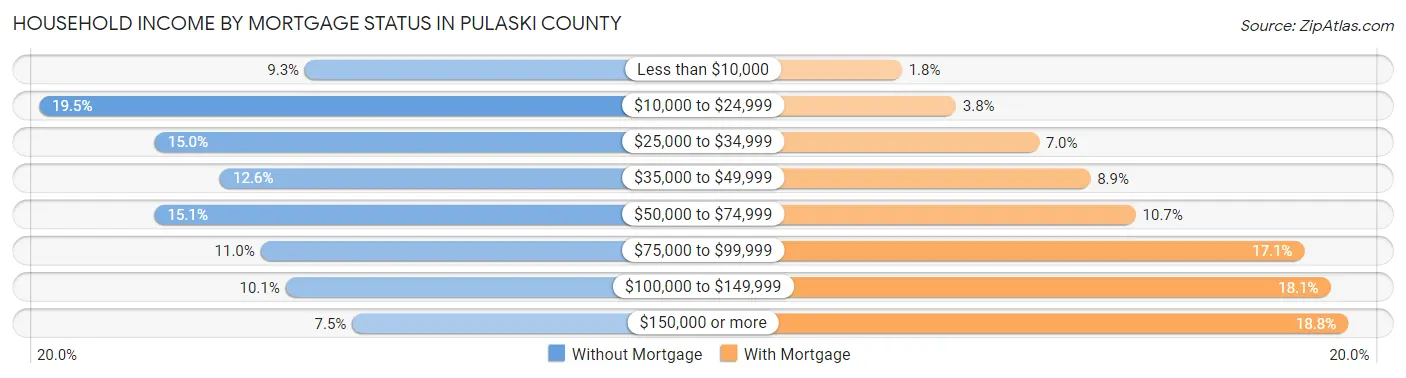
| Household Income | Without Mortgage | With Mortgage |
| Less than $10,000 | 873 (9.3%) | 162 (1.8%) |
| $10,000 to $24,999 | 1,822 (19.5%) | 352 (3.8%) |
| $25,000 to $34,999 | 1,409 (15.0%) | 643 (7.0%) |
| $35,000 to $49,999 | 1,176 (12.6%) | 823 (8.9%) |
| $50,000 to $74,999 | 1,410 (15.0%) | 982 (10.7%) |
| $75,000 to $99,999 | 1,032 (11.0%) | 1,574 (17.1%) |
| $100,000 to $149,999 | 943 (10.1%) | 1,665 (18.1%) |
| $150,000 or more | 705 (7.5%) | 1,727 (18.8%) |
| Total | 9,370 (100.0%) | 9,206 (100.0%) |
Property Value to Household Income Ratio in Pulaski County
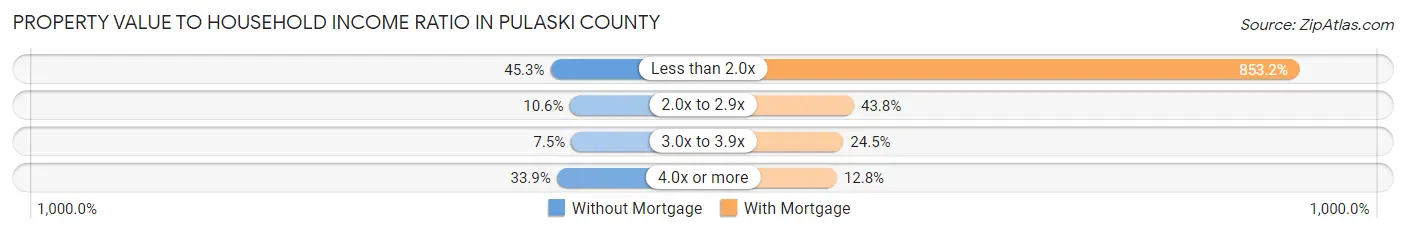
| Value-to-Income Ratio | Without Mortgage | With Mortgage |
| Less than 2.0x | 4,241 (45.3%) | 78,545 (853.2%) |
| 2.0x to 2.9x | 997 (10.6%) | 4,034 (43.8%) |
| 3.0x to 3.9x | 700 (7.5%) | 2,256 (24.5%) |
| 4.0x or more | 3,180 (33.9%) | 1,174 (12.8%) |
| Total | 9,370 (100.0%) | 9,206 (100.0%) |
Real Estate Taxes by Mortgage Status in Pulaski County
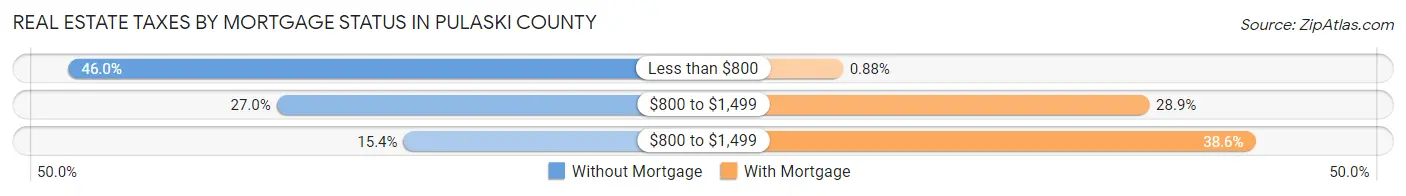
| Property Taxes | Without Mortgage | With Mortgage |
| Less than $800 | 4,308 (46.0%) | 81 (0.9%) |
| $800 to $1,499 | 2,529 (27.0%) | 2,658 (28.9%) |
| $800 to $1,499 | 1,444 (15.4%) | 3,550 (38.6%) |
| Total | 9,370 (100.0%) | 9,206 (100.0%) |
Health & Disability in Pulaski County
Health Insurance Coverage by Age in Pulaski County
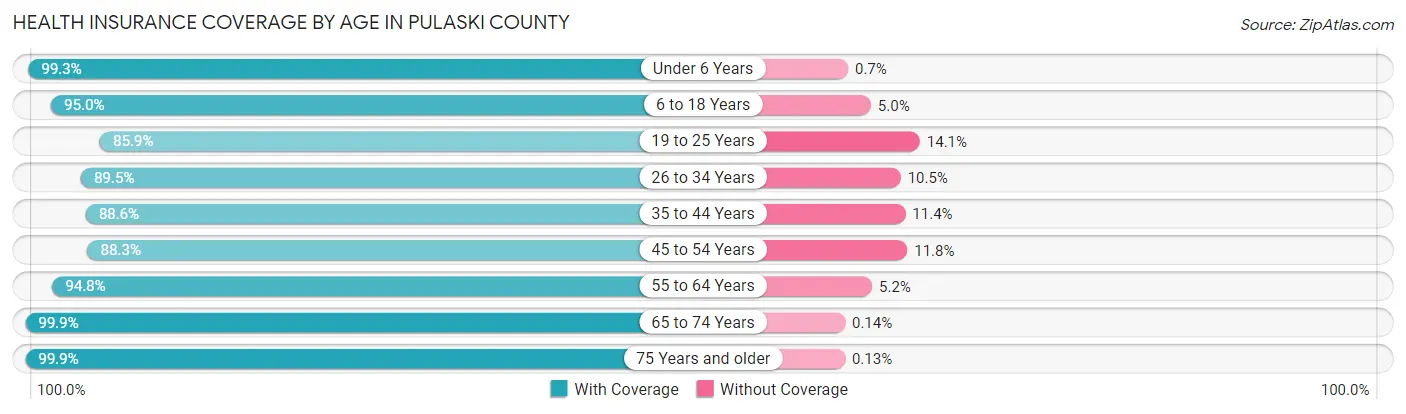
| Age Bracket | With Coverage | Without Coverage |
| Under 6 Years | 4,404 (99.3%) | 31 (0.7%) |
| 6 to 18 Years | 10,200 (95.0%) | 532 (5.0%) |
| 19 to 25 Years | 3,884 (85.9%) | 637 (14.1%) |
| 26 to 34 Years | 6,250 (89.5%) | 735 (10.5%) |
| 35 to 44 Years | 6,937 (88.6%) | 893 (11.4%) |
| 45 to 54 Years | 7,553 (88.2%) | 1,006 (11.7%) |
| 55 to 64 Years | 8,743 (94.8%) | 478 (5.2%) |
| 65 to 74 Years | 7,341 (99.9%) | 10 (0.1%) |
| 75 Years and older | 4,659 (99.9%) | 6 (0.1%) |
| Total | 59,971 (93.3%) | 4,328 (6.7%) |
Health Insurance Coverage by Citizenship Status in Pulaski County
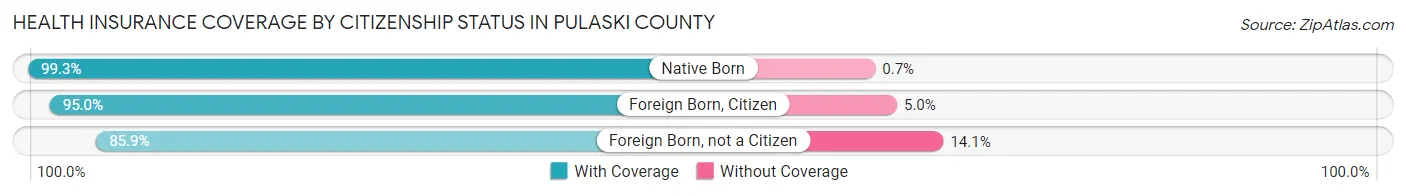
| Citizenship Status | With Coverage | Without Coverage |
| Native Born | 4,404 (99.3%) | 31 (0.7%) |
| Foreign Born, Citizen | 10,200 (95.0%) | 532 (5.0%) |
| Foreign Born, not a Citizen | 3,884 (85.9%) | 637 (14.1%) |
Health Insurance Coverage by Household Income in Pulaski County
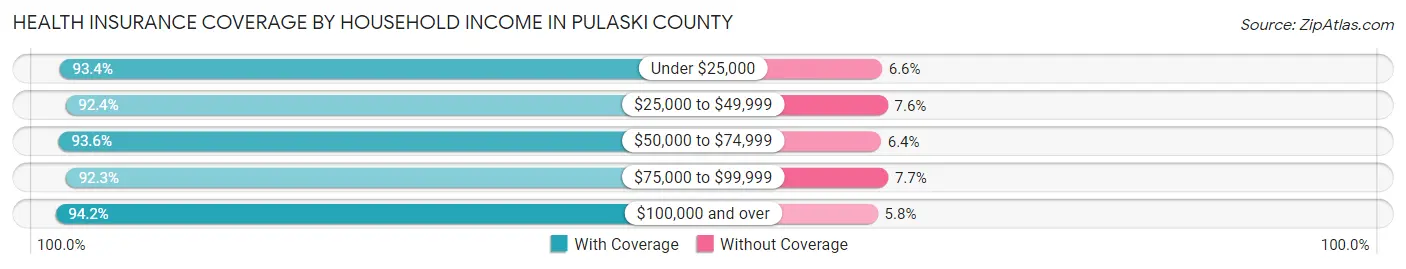
| Household Income | With Coverage | Without Coverage |
| Under $25,000 | 11,650 (93.4%) | 818 (6.6%) |
| $25,000 to $49,999 | 12,913 (92.4%) | 1,068 (7.6%) |
| $50,000 to $74,999 | 10,905 (93.6%) | 742 (6.4%) |
| $75,000 to $99,999 | 8,821 (92.3%) | 737 (7.7%) |
| $100,000 and over | 15,633 (94.2%) | 959 (5.8%) |
Public vs Private Health Insurance Coverage by Age in Pulaski County
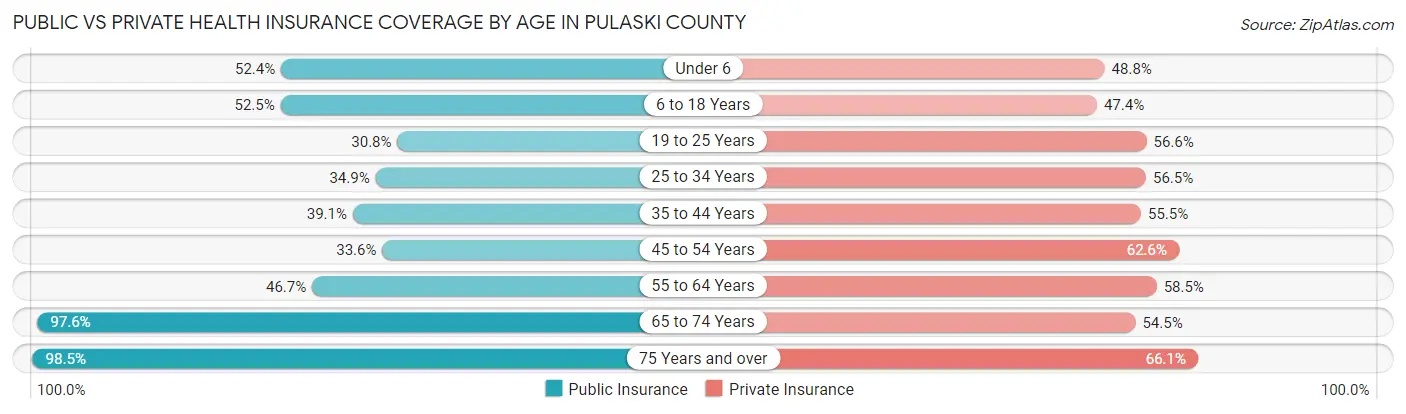
| Age Bracket | Public Insurance | Private Insurance |
| Under 6 | 2,324 (52.4%) | 2,164 (48.8%) |
| 6 to 18 Years | 5,633 (52.5%) | 5,084 (47.4%) |
| 19 to 25 Years | 1,393 (30.8%) | 2,557 (56.6%) |
| 25 to 34 Years | 2,436 (34.9%) | 3,945 (56.5%) |
| 35 to 44 Years | 3,060 (39.1%) | 4,349 (55.5%) |
| 45 to 54 Years | 2,876 (33.6%) | 5,354 (62.5%) |
| 55 to 64 Years | 4,302 (46.7%) | 5,390 (58.5%) |
| 65 to 74 Years | 7,176 (97.6%) | 4,007 (54.5%) |
| 75 Years and over | 4,595 (98.5%) | 3,082 (66.1%) |
| Total | 33,795 (52.6%) | 35,932 (55.9%) |
Disability Status by Sex by Age in Pulaski County
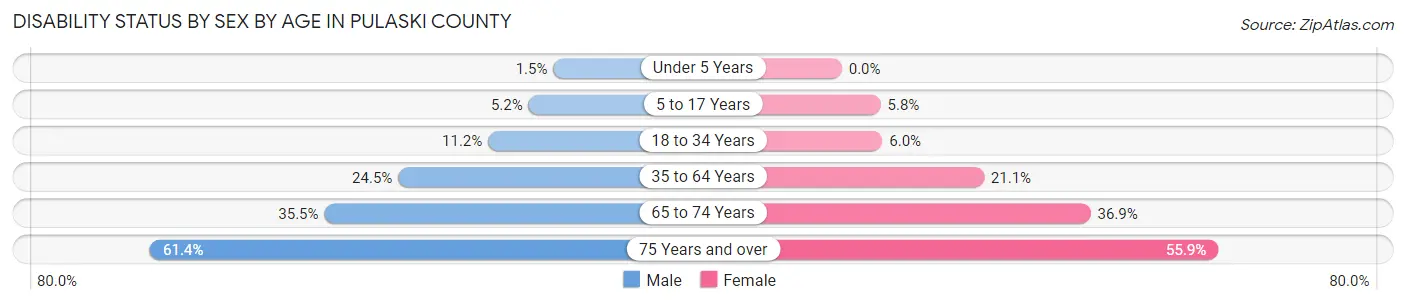
| Age Bracket | Male | Female |
| Under 5 Years | 28 (1.5%) | 0 (0.0%) |
| 5 to 17 Years | 282 (5.2%) | 297 (5.8%) |
| 18 to 34 Years | 689 (11.2%) | 371 (6.0%) |
| 35 to 64 Years | 3,085 (24.5%) | 2,750 (21.1%) |
| 65 to 74 Years | 1,238 (35.5%) | 1,427 (36.9%) |
| 75 Years and over | 1,213 (61.4%) | 1,502 (55.9%) |
Disability Class by Sex by Age in Pulaski County
Disability Class: Hearing Difficulty
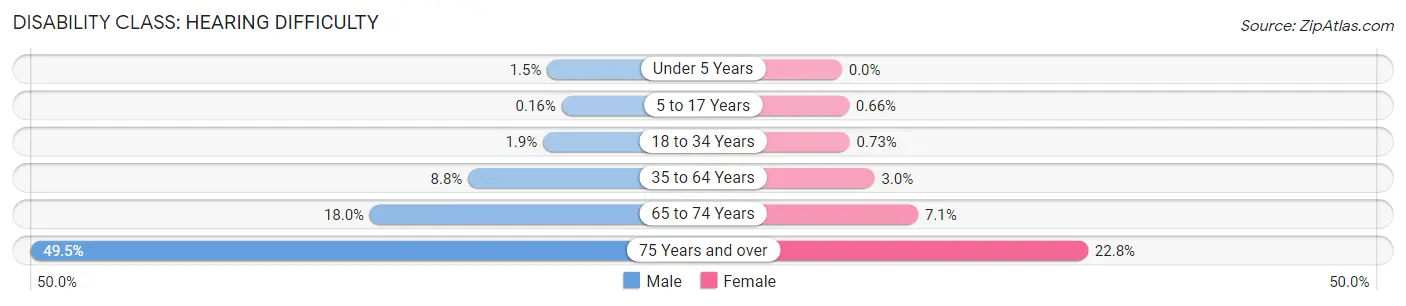
| Age Bracket | Male | Female |
| Under 5 Years | 28 (1.5%) | 0 (0.0%) |
| 5 to 17 Years | 9 (0.2%) | 34 (0.7%) |
| 18 to 34 Years | 116 (1.9%) | 45 (0.7%) |
| 35 to 64 Years | 1,110 (8.8%) | 395 (3.0%) |
| 65 to 74 Years | 626 (17.9%) | 273 (7.1%) |
| 75 Years and over | 978 (49.5%) | 614 (22.8%) |
Disability Class: Vision Difficulty
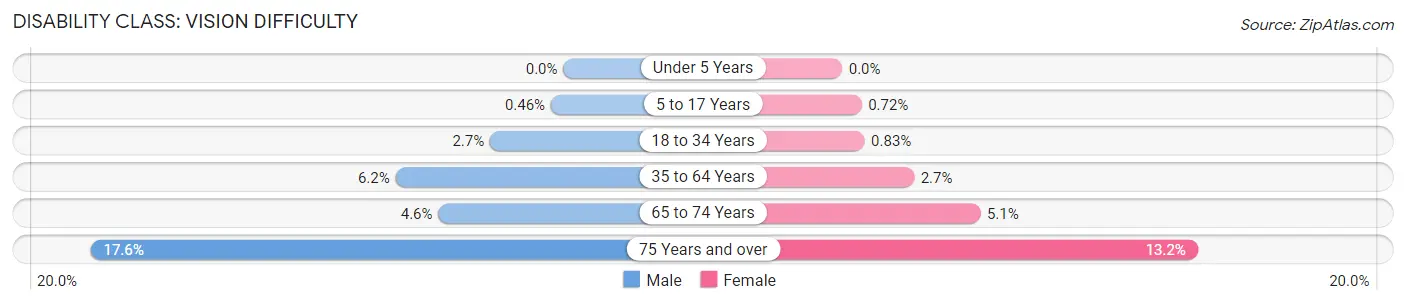
| Age Bracket | Male | Female |
| Under 5 Years | 0 (0.0%) | 0 (0.0%) |
| 5 to 17 Years | 25 (0.5%) | 37 (0.7%) |
| 18 to 34 Years | 168 (2.7%) | 51 (0.8%) |
| 35 to 64 Years | 783 (6.2%) | 348 (2.7%) |
| 65 to 74 Years | 162 (4.6%) | 198 (5.1%) |
| 75 Years and over | 347 (17.5%) | 355 (13.2%) |
Disability Class: Cognitive Difficulty
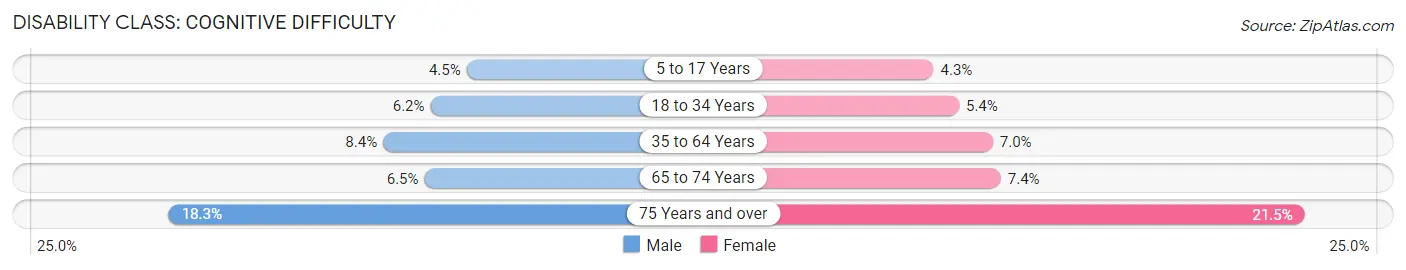
| Age Bracket | Male | Female |
| 5 to 17 Years | 245 (4.5%) | 220 (4.3%) |
| 18 to 34 Years | 381 (6.2%) | 335 (5.4%) |
| 35 to 64 Years | 1,052 (8.4%) | 914 (7.0%) |
| 65 to 74 Years | 225 (6.5%) | 285 (7.4%) |
| 75 Years and over | 362 (18.3%) | 577 (21.5%) |
Disability Class: Ambulatory Difficulty
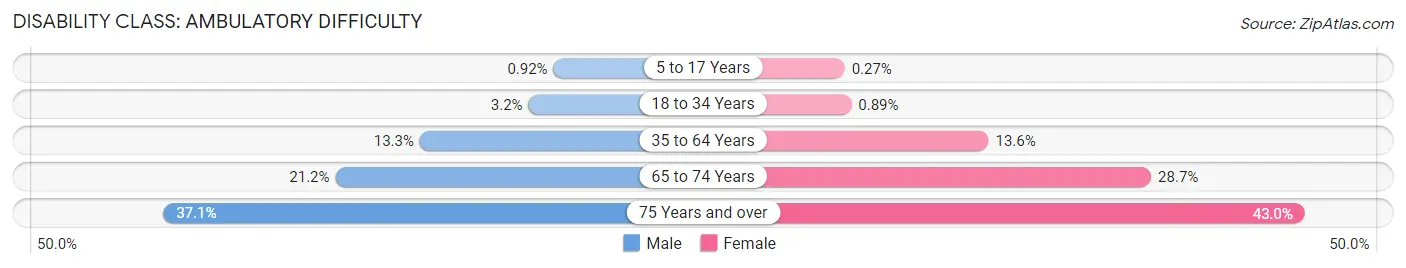
| Age Bracket | Male | Female |
| 5 to 17 Years | 50 (0.9%) | 14 (0.3%) |
| 18 to 34 Years | 200 (3.2%) | 55 (0.9%) |
| 35 to 64 Years | 1,675 (13.3%) | 1,775 (13.6%) |
| 65 to 74 Years | 738 (21.2%) | 1,109 (28.7%) |
| 75 Years and over | 734 (37.1%) | 1,155 (43.0%) |
Disability Class: Self-Care Difficulty
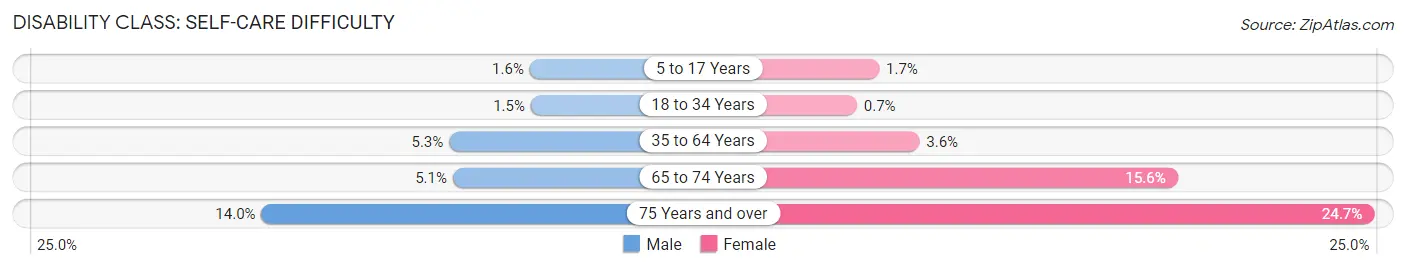
| Age Bracket | Male | Female |
| 5 to 17 Years | 85 (1.6%) | 89 (1.7%) |
| 18 to 34 Years | 93 (1.5%) | 43 (0.7%) |
| 35 to 64 Years | 667 (5.3%) | 469 (3.6%) |
| 65 to 74 Years | 179 (5.1%) | 602 (15.6%) |
| 75 Years and over | 277 (14.0%) | 664 (24.7%) |
Technology Access in Pulaski County
Computing Device Access in Pulaski County
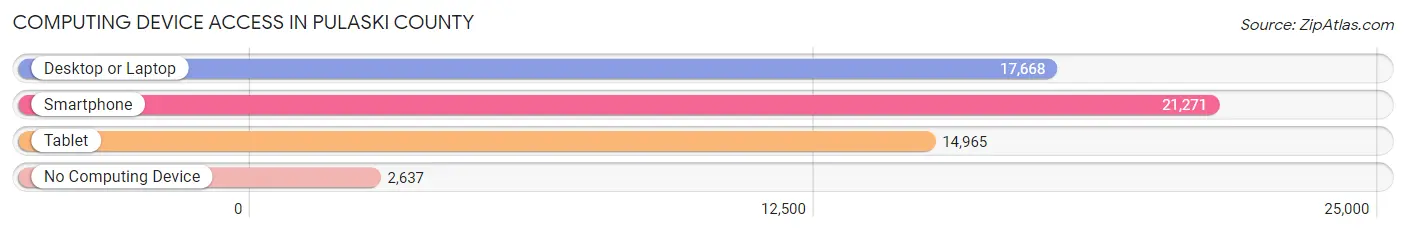
| Device Type | # Households | % Households |
| Desktop or Laptop | 17,668 | 68.7% |
| Smartphone | 21,271 | 82.7% |
| Tablet | 14,965 | 58.2% |
| No Computing Device | 2,637 | 10.3% |
| Total | 25,711 | 100.0% |
Internet Access in Pulaski County
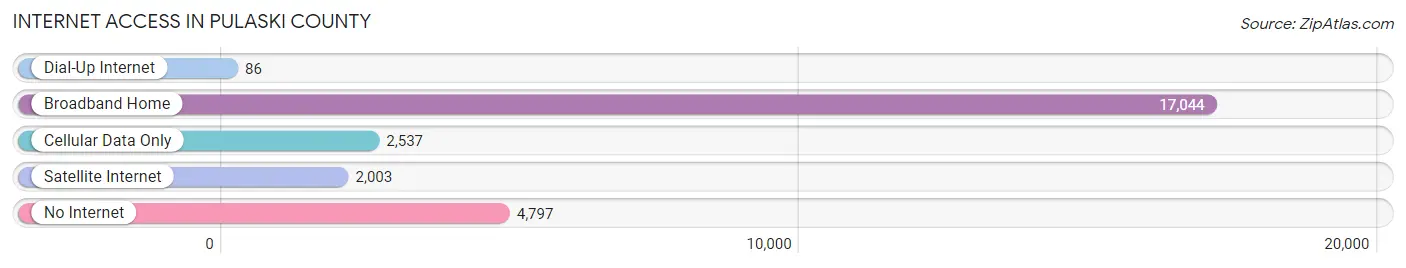
| Internet Type | # Households | % Households |
| Dial-Up Internet | 86 | 0.3% |
| Broadband Home | 17,044 | 66.3% |
| Cellular Data Only | 2,537 | 9.9% |
| Satellite Internet | 2,003 | 7.8% |
| No Internet | 4,797 | 18.7% |
| Total | 25,711 | 100.0% |
Pulaski County Summary
Pulaski County, Kentucky is located in the south-central region of the state and is part of the Cumberland Plateau. It is bordered by Laurel County to the north, Rockcastle County to the east, Wayne County to the south, and McCreary County to the west. The county seat is Somerset, and the county was formed in 1798 from parts of Lincoln and Green Counties. The county is named for Count Casimir Pulaski, a Polish-born Revolutionary War hero.
Geography
Pulaski County is located in the Appalachian Mountains and is part of the Cumberland Plateau. The county is mostly mountainous, with the highest point being Pine Mountain at 2,039 feet. The county is drained by the Cumberland River and its tributaries, including the South Fork of the Cumberland River, the Rockcastle River, and the Little South Fork of the Cumberland River. The county is also home to several natural lakes, including Lake Cumberland, which is the largest man-made lake in the eastern United States.
The county has a total area of 545 square miles, of which 543 square miles is land and 2.2 square miles is water. The county is home to several state parks, including Cumberland Falls State Resort Park, which is home to the largest waterfall in the state.
Demographics
As of the 2010 census, the population of Pulaski County was 63,063. The population density was 115.7 people per square mile. The racial makeup of the county was 94.2% White, 3.3% Black or African American, 0.3% Native American, 0.5% Asian, 0.2% Pacific Islander, 0.7% from other races, and 0.9% from two or more races. Hispanic or Latino of any race were 1.7% of the population.
The median income for a household in the county was $30,945, and the median income for a family was $37,945. The per capita income for the county was $17,845. About 17.2% of families and 21.2% of the population were below the poverty line, including 28.2% of those under age 18 and 16.2% of those age 65 or over.
Economy
Pulaski County’s economy is largely based on agriculture and tourism. The county is home to several large farms, including tobacco, corn, and soybean farms. The county is also home to several large manufacturing companies, including General Electric, which has a large plant in the county.
The county is also home to several tourist attractions, including Lake Cumberland, which is a popular destination for fishing, boating, and other recreational activities. The county is also home to several state parks, including Cumberland Falls State Resort Park, which is home to the largest waterfall in the state.
Conclusion
Pulaski County, Kentucky is a rural county located in the south-central region of the state. The county is mostly mountainous and is part of the Cumberland Plateau. The county is home to several large farms and manufacturing companies, as well as several tourist attractions. The population of the county was 63,063 as of the 2010 census, and the median income for a household was $30,945. The county’s economy is largely based on agriculture and tourism.
Common Questions
What is the Total Population of Pulaski County?
Total Population of Pulaski County is 65,145.
What is the Total Male Population of Pulaski County?
Total Male Population of Pulaski County is 32,025.
What is the Total Female Population of Pulaski County?
Total Female Population of Pulaski County is 33,120.
What is the Ratio of Males per 100 Females in Pulaski County?
There are 96.69 Males per 100 Females in Pulaski County.
What is the Ratio of Females per 100 Males in Pulaski County?
There are 103.42 Females per 100 Males in Pulaski County.
What is the Median Population Age in Pulaski County?
Median Population Age in Pulaski County is 41.8 Years.
What is the Average Family Size in Pulaski County
Average Family Size in Pulaski County is 3.0 People.
What is the Average Household Size in Pulaski County
Average Household Size in Pulaski County is 2.5 People.
What is Per Capita Income in Pulaski County?
Per Capita income in Pulaski County is $29,215.
What is the Median Family Income in Pulaski County?
Median Family Income in Pulaski County is $61,737.
What is the Median Household income in Pulaski County?
Median Household Income in Pulaski County is $48,768.
What is Income or Wage Gap in Pulaski County?
Income or Wage Gap in Pulaski County is 34.2%.
Women in Pulaski County earn 65.8 cents for every dollar earned by a man.
What is Family Income Deficit in Pulaski County?
Family Income Deficit in Pulaski County is $9,639.
Families that are below poverty line in Pulaski County earn $9,639 less on average than the poverty threshold level.
What is Inequality or Gini Index in Pulaski County?
Inequality or Gini Index in Pulaski County is 0.50.
How Large is the Labor Force in Pulaski County?
There are 28,674 People in the Labor Forcein in Pulaski County.
What is the Percentage of People in the Labor Force in Pulaski County?
54.6% of People are in the Labor Force in Pulaski County.
What is the Unemployment Rate in Pulaski County?
Unemployment Rate in Pulaski County is 4.9%.