Oldham County, KY
Oldham County Map
Oldham County Overview
67,997
TOTAL POPULATION
35,607
MALE POPULATION
32,390
FEMALE POPULATION
109.93
MALES / 100 FEMALES
90.97
FEMALES / 100 MALES
39.5
MEDIAN AGE
3.2
AVG FAMILY SIZE
2.9
AVG HOUSEHOLD SIZE
$50,534
PER CAPITA INCOME
$131,807
AVG FAMILY INCOME
$117,334
AVG HOUSEHOLD INCOME
39.0%
WAGE / INCOME GAP [ % ]
61.0¢/ $1
WAGE / INCOME GAP [ $ ]
0.44
INEQUALITY / GINI INDEX
34,182
LABOR FORCE [ PEOPLE ]
64.7%
PERCENT IN LABOR FORCE
3.9%
UNEMPLOYMENT RATE
Oldham County Area Codes
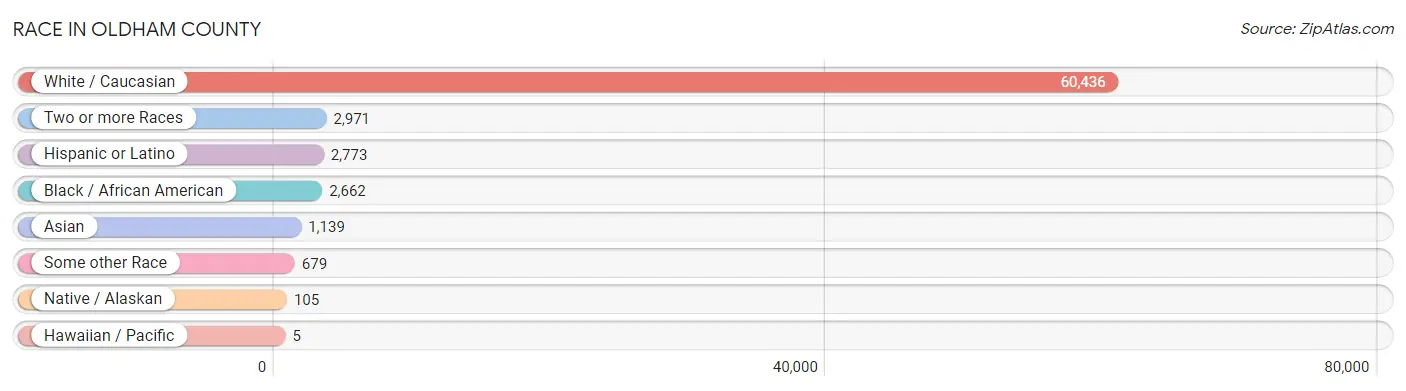
Race in Oldham County
The most populous races in Oldham County are White / Caucasian (60,436 | 88.9%), Two or more Races (2,971 | 4.4%), and Hispanic or Latino (2,773 | 4.1%).
| Race | # Population | % Population |
| Asian | 1,139 | 1.7% |
| Black / African American | 2,662 | 3.9% |
| Hawaiian / Pacific | 5 | 0.0% |
| Hispanic or Latino | 2,773 | 4.1% |
| Native / Alaskan | 105 | 0.2% |
| White / Caucasian | 60,436 | 88.9% |
| Two or more Races | 2,971 | 4.4% |
| Some other Race | 679 | 1.0% |
| Total | 67,997 | 100.0% |
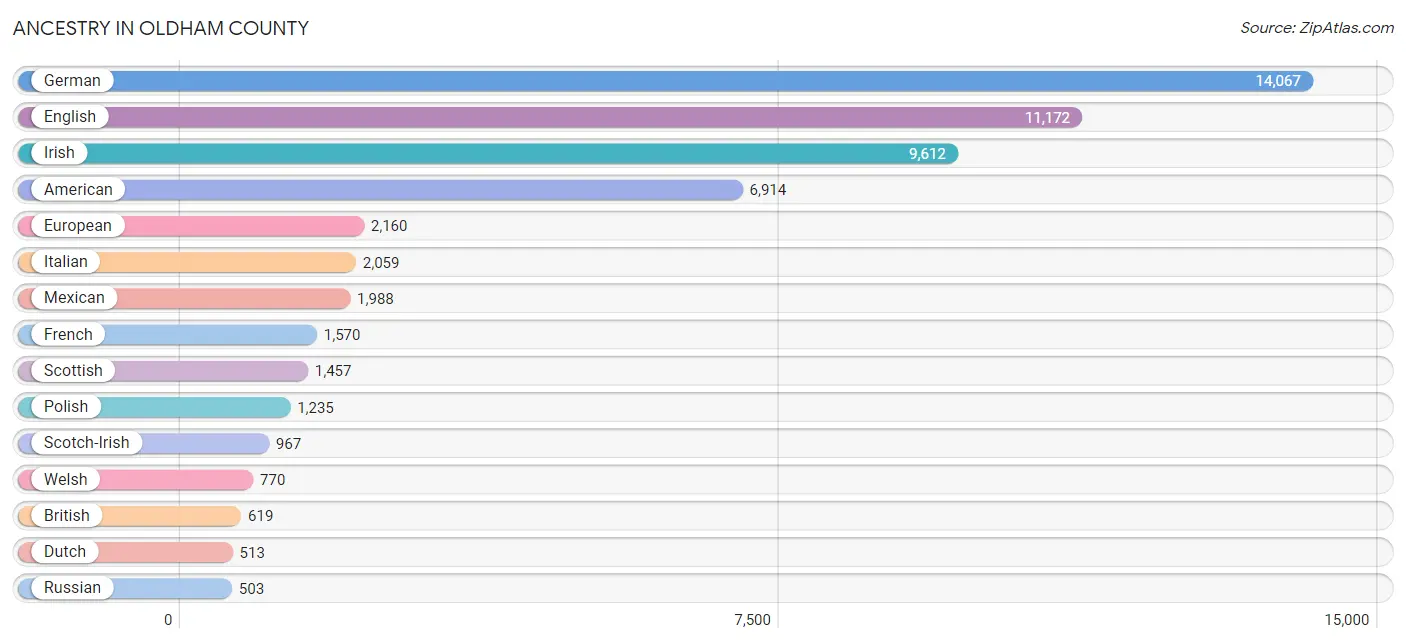
Ancestry in Oldham County
The most populous ancestries reported in Oldham County are German (14,067 | 20.7%), English (11,172 | 16.4%), Irish (9,612 | 14.1%), American (6,914 | 10.2%), and European (2,160 | 3.2%), together accounting for 64.6% of all Oldham County residents.
| Ancestry | # Population | % Population |
| African | 84 | 0.1% |
| American | 6,914 | 10.2% |
| Arab | 296 | 0.4% |
| Argentinean | 15 | 0.0% |
| Australian | 4 | 0.0% |
| Austrian | 150 | 0.2% |
| Belgian | 37 | 0.1% |
| Bhutanese | 89 | 0.1% |
| Blackfeet | 19 | 0.0% |
| Brazilian | 4 | 0.0% |
| British | 619 | 0.9% |
| British West Indian | 58 | 0.1% |
| Burmese | 247 | 0.4% |
| Canadian | 206 | 0.3% |
| Celtic | 13 | 0.0% |
| Central American | 239 | 0.4% |
| Central American Indian | 53 | 0.1% |
| Cherokee | 246 | 0.4% |
| Choctaw | 7 | 0.0% |
| Colombian | 132 | 0.2% |
| Croatian | 86 | 0.1% |
| Cuban | 66 | 0.1% |
| Czech | 216 | 0.3% |
| Czechoslovakian | 54 | 0.1% |
| Danish | 185 | 0.3% |
| Dutch | 513 | 0.7% |
| Eastern European | 218 | 0.3% |
| English | 11,172 | 16.4% |
| Ethiopian | 84 | 0.1% |
| European | 2,160 | 3.2% |
| Filipino | 69 | 0.1% |
| Finnish | 182 | 0.3% |
| French | 1,570 | 2.3% |
| French Canadian | 265 | 0.4% |
| German | 14,067 | 20.7% |
| Greek | 131 | 0.2% |
| Guatemalan | 157 | 0.2% |
| Haitian | 6 | 0.0% |
| Honduran | 23 | 0.0% |
| Hungarian | 191 | 0.3% |
| Indian (Asian) | 353 | 0.5% |
| Iranian | 96 | 0.1% |
| Irish | 9,612 | 14.1% |
| Israeli | 4 | 0.0% |
| Italian | 2,059 | 3.0% |
| Jamaican | 50 | 0.1% |
| Japanese | 21 | 0.0% |
| Jordanian | 43 | 0.1% |
| Kenyan | 25 | 0.0% |
| Korean | 202 | 0.3% |
| Latvian | 5 | 0.0% |
| Lebanese | 196 | 0.3% |
| Lithuanian | 154 | 0.2% |
| Maltese | 14 | 0.0% |
| Mexican | 1,988 | 2.9% |
| Moroccan | 15 | 0.0% |
| Native Hawaiian | 17 | 0.0% |
| Nicaraguan | 19 | 0.0% |
| Northern European | 62 | 0.1% |
| Norwegian | 460 | 0.7% |
| Palestinian | 21 | 0.0% |
| Polish | 1,235 | 1.8% |
| Portuguese | 159 | 0.2% |
| Puerto Rican | 233 | 0.3% |
| Romanian | 5 | 0.0% |
| Russian | 503 | 0.7% |
| Salvadoran | 40 | 0.1% |
| Scandinavian | 243 | 0.4% |
| Scotch-Irish | 967 | 1.4% |
| Scottish | 1,457 | 2.1% |
| Serbian | 34 | 0.1% |
| Slavic | 7 | 0.0% |
| Slovak | 172 | 0.3% |
| Slovene | 42 | 0.1% |
| Somali | 7 | 0.0% |
| South African | 9 | 0.0% |
| South American | 186 | 0.3% |
| Spaniard | 23 | 0.0% |
| Spanish | 26 | 0.0% |
| Sri Lankan | 43 | 0.1% |
| Subsaharan African | 209 | 0.3% |
| Swedish | 394 | 0.6% |
| Swiss | 240 | 0.4% |
| Thai | 397 | 0.6% |
| Ukrainian | 115 | 0.2% |
| Venezuelan | 39 | 0.1% |
| Welsh | 770 | 1.1% |
| Yugoslavian | 87 | 0.1% | View All 88 Rows |
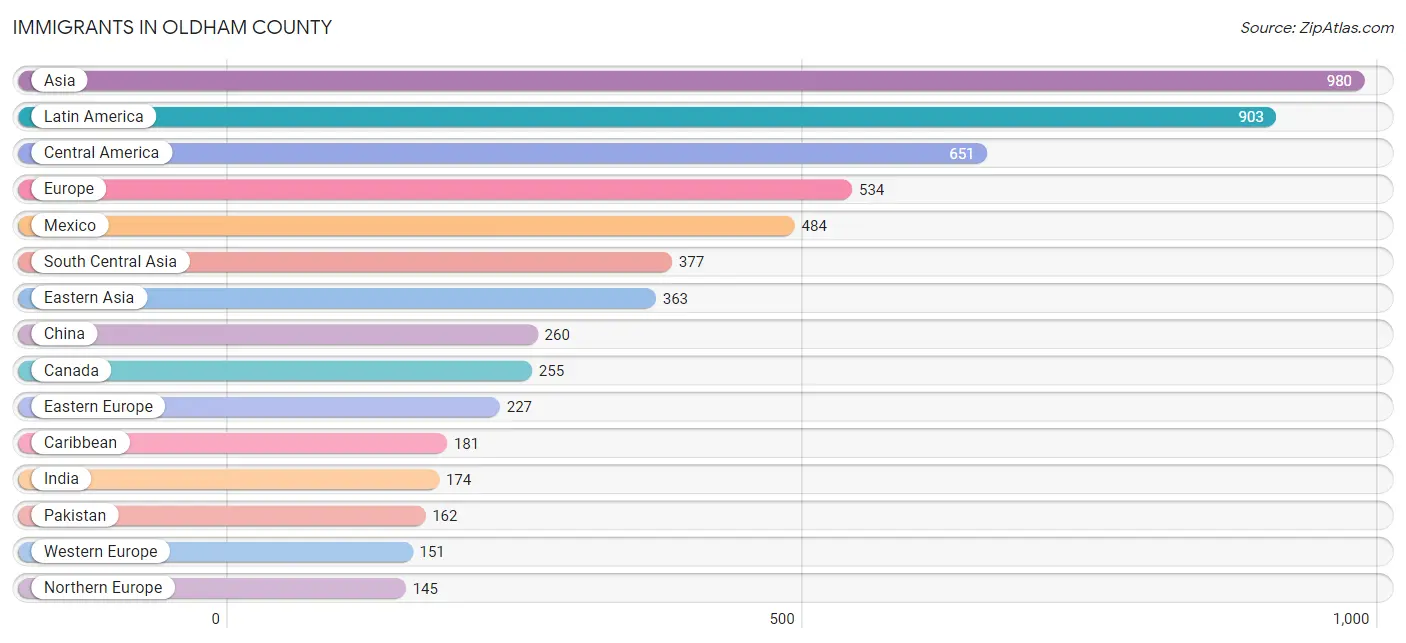
Immigrants in Oldham County
The most numerous immigrant groups reported in Oldham County came from Asia (980 | 1.4%), Latin America (903 | 1.3%), Central America (651 | 1.0%), Europe (534 | 0.8%), and Mexico (484 | 0.7%), together accounting for 5.2% of all Oldham County residents.
| Immigration Origin | # Population | % Population |
| Africa | 134 | 0.2% |
| Argentina | 4 | 0.0% |
| Asia | 980 | 1.4% |
| Australia | 17 | 0.0% |
| Bosnia and Herzegovina | 24 | 0.0% |
| Brazil | 4 | 0.0% |
| Cambodia | 21 | 0.0% |
| Canada | 255 | 0.4% |
| Caribbean | 181 | 0.3% |
| Central America | 651 | 1.0% |
| China | 260 | 0.4% |
| Colombia | 52 | 0.1% |
| Congo | 1 | 0.0% |
| Cuba | 106 | 0.2% |
| Eastern Africa | 116 | 0.2% |
| Eastern Asia | 363 | 0.5% |
| Eastern Europe | 227 | 0.3% |
| El Salvador | 23 | 0.0% |
| England | 19 | 0.0% |
| Ethiopia | 84 | 0.1% |
| Europe | 534 | 0.8% |
| France | 49 | 0.1% |
| Germany | 84 | 0.1% |
| Guatemala | 142 | 0.2% |
| Haiti | 6 | 0.0% |
| Honduras | 2 | 0.0% |
| India | 174 | 0.3% |
| Iran | 41 | 0.1% |
| Ireland | 17 | 0.0% |
| Jamaica | 22 | 0.0% |
| Japan | 45 | 0.1% |
| Jordan | 27 | 0.0% |
| Kenya | 25 | 0.0% |
| Korea | 58 | 0.1% |
| Kuwait | 9 | 0.0% |
| Latin America | 903 | 1.3% |
| Lebanon | 54 | 0.1% |
| Mexico | 484 | 0.7% |
| Middle Africa | 1 | 0.0% |
| Northern Europe | 145 | 0.2% |
| Oceania | 36 | 0.1% |
| Pakistan | 162 | 0.2% |
| Philippines | 86 | 0.1% |
| Poland | 21 | 0.0% |
| Portugal | 11 | 0.0% |
| Russia | 95 | 0.1% |
| Scotland | 23 | 0.0% |
| Somalia | 7 | 0.0% |
| South Africa | 17 | 0.0% |
| South America | 71 | 0.1% |
| South Central Asia | 377 | 0.5% |
| South Eastern Asia | 135 | 0.2% |
| Southern Europe | 11 | 0.0% |
| Switzerland | 10 | 0.0% |
| Taiwan | 69 | 0.1% |
| Ukraine | 87 | 0.1% |
| Venezuela | 11 | 0.0% |
| Vietnam | 28 | 0.0% |
| Western Asia | 90 | 0.1% |
| Western Europe | 151 | 0.2% | View All 60 Rows |
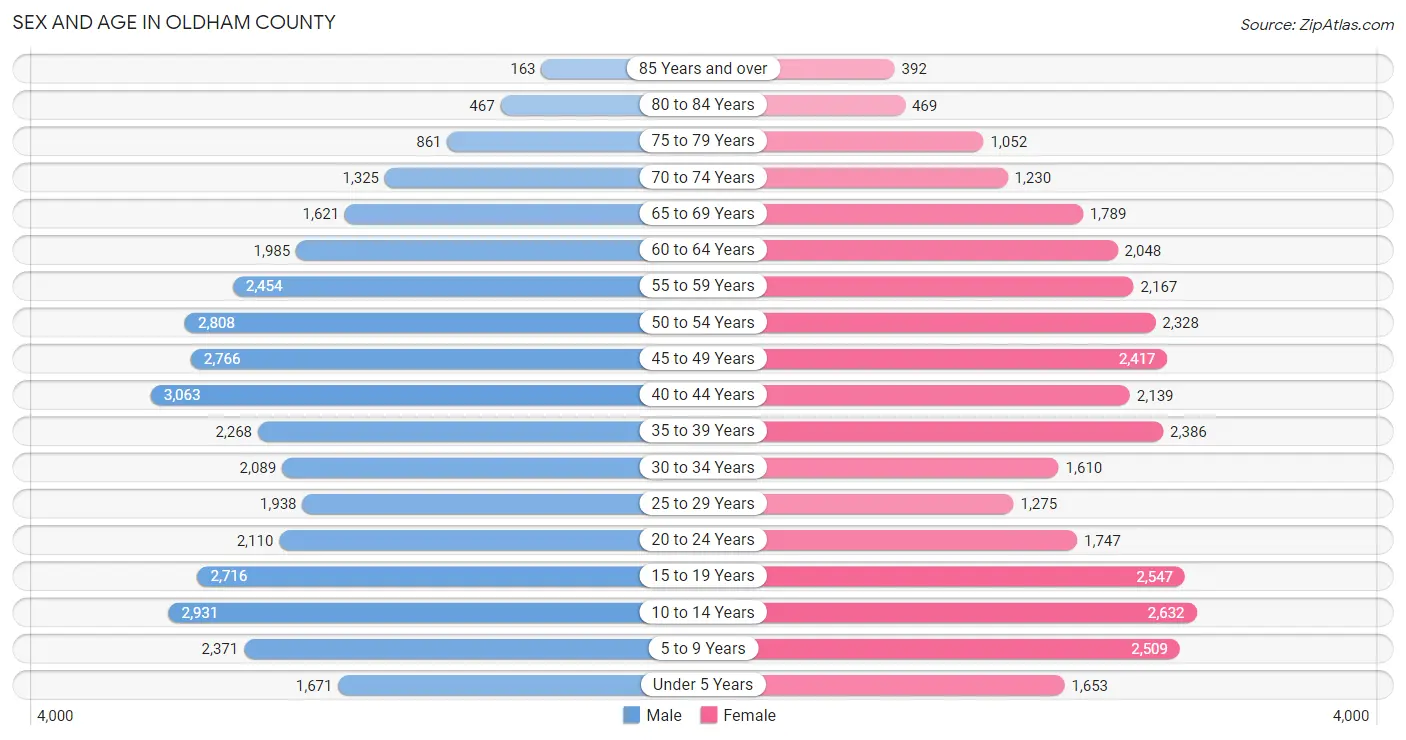
Sex and Age in Oldham County
Sex and Age in Oldham County
The most populous age groups in Oldham County are 40 to 44 Years (3,063 | 8.6%) for men and 10 to 14 Years (2,632 | 8.1%) for women.
| Age Bracket | Male | Female |
| Under 5 Years | 1,671 (4.7%) | 1,653 (5.1%) |
| 5 to 9 Years | 2,371 (6.7%) | 2,509 (7.7%) |
| 10 to 14 Years | 2,931 (8.2%) | 2,632 (8.1%) |
| 15 to 19 Years | 2,716 (7.6%) | 2,547 (7.9%) |
| 20 to 24 Years | 2,110 (5.9%) | 1,747 (5.4%) |
| 25 to 29 Years | 1,938 (5.4%) | 1,275 (3.9%) |
| 30 to 34 Years | 2,089 (5.9%) | 1,610 (5.0%) |
| 35 to 39 Years | 2,268 (6.4%) | 2,386 (7.4%) |
| 40 to 44 Years | 3,063 (8.6%) | 2,139 (6.6%) |
| 45 to 49 Years | 2,766 (7.8%) | 2,417 (7.5%) |
| 50 to 54 Years | 2,808 (7.9%) | 2,328 (7.2%) |
| 55 to 59 Years | 2,454 (6.9%) | 2,167 (6.7%) |
| 60 to 64 Years | 1,985 (5.6%) | 2,048 (6.3%) |
| 65 to 69 Years | 1,621 (4.5%) | 1,789 (5.5%) |
| 70 to 74 Years | 1,325 (3.7%) | 1,230 (3.8%) |
| 75 to 79 Years | 861 (2.4%) | 1,052 (3.3%) |
| 80 to 84 Years | 467 (1.3%) | 469 (1.5%) |
| 85 Years and over | 163 (0.5%) | 392 (1.2%) |
| Total | 35,607 (100.0%) | 32,390 (100.0%) |
Families and Households in Oldham County
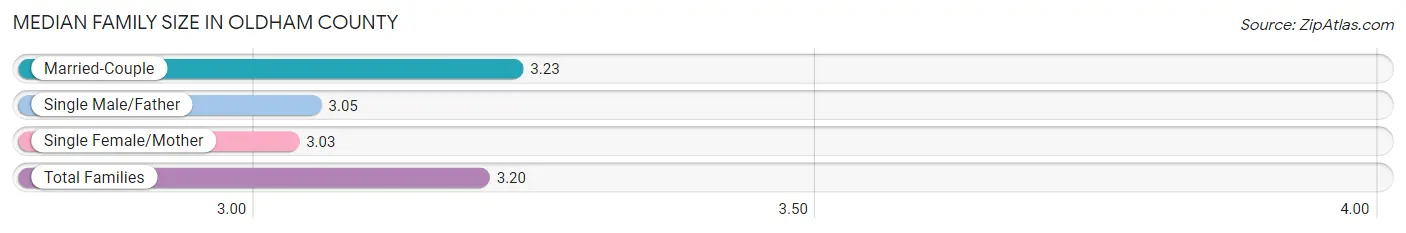
Median Family Size in Oldham County
The median family size in Oldham County is 3.20 persons per family, with married-couple families (15,361 | 84.5%) accounting for the largest median family size of 3.23 persons per family. On the other hand, single female/mother families (1,870 | 10.3%) represent the smallest median family size with 3.03 persons per family.
| Family Type | # Families | Family Size |
| Married-Couple | 15,361 (84.5%) | 3.23 |
| Single Male/Father | 954 (5.2%) | 3.05 |
| Single Female/Mother | 1,870 (10.3%) | 3.03 |
| Total Families | 18,185 (100.0%) | 3.20 |
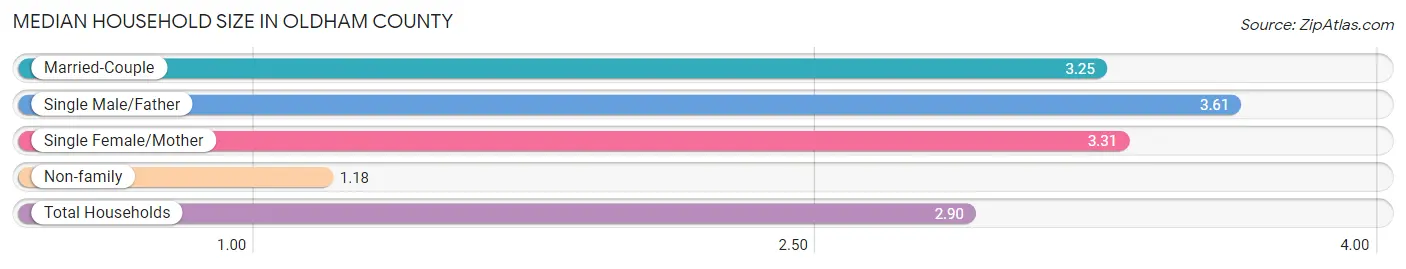
Median Household Size in Oldham County
The median household size in Oldham County is 2.90 persons per household, with single male/father households (954 | 4.3%) accounting for the largest median household size of 3.61 persons per household. non-family households (3,943 | 17.8%) represent the smallest median household size with 1.18 persons per household.
| Household Type | # Households | Household Size |
| Married-Couple | 15,361 (69.4%) | 3.25 |
| Single Male/Father | 954 (4.3%) | 3.61 |
| Single Female/Mother | 1,870 (8.5%) | 3.31 |
| Non-family | 3,943 (17.8%) | 1.18 |
| Total Households | 22,128 (100.0%) | 2.90 |
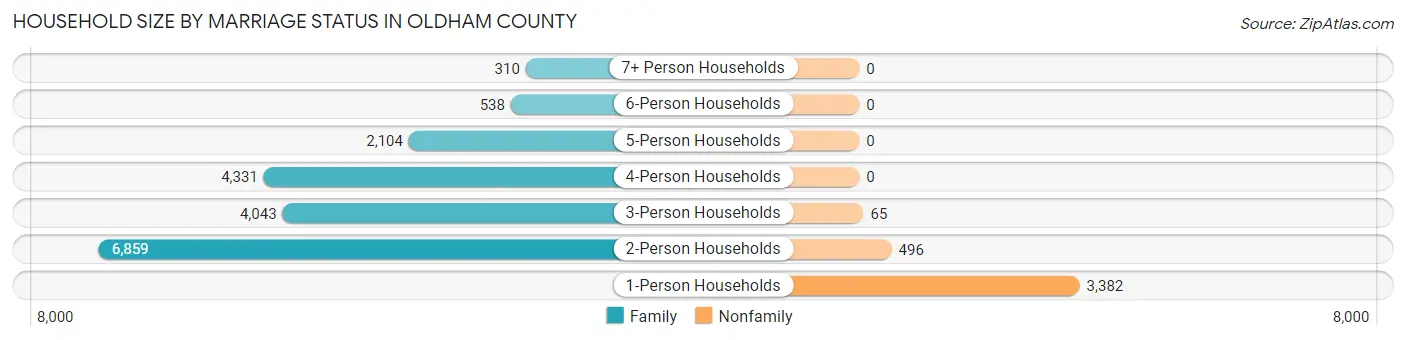
Household Size by Marriage Status in Oldham County
Out of a total of 22,128 households in Oldham County, 18,185 (82.2%) are family households, while 3,943 (17.8%) are nonfamily households. The most numerous type of family households are 2-person households, comprising 6,859, and the most common type of nonfamily households are 1-person households, comprising 3,382.
| Household Size | Family Households | Nonfamily Households |
| 1-Person Households | - | 3,382 (15.3%) |
| 2-Person Households | 6,859 (31.0%) | 496 (2.2%) |
| 3-Person Households | 4,043 (18.3%) | 65 (0.3%) |
| 4-Person Households | 4,331 (19.6%) | 0 (0.0%) |
| 5-Person Households | 2,104 (9.5%) | 0 (0.0%) |
| 6-Person Households | 538 (2.4%) | 0 (0.0%) |
| 7+ Person Households | 310 (1.4%) | 0 (0.0%) |
| Total | 18,185 (82.2%) | 3,943 (17.8%) |
Female Fertility in Oldham County
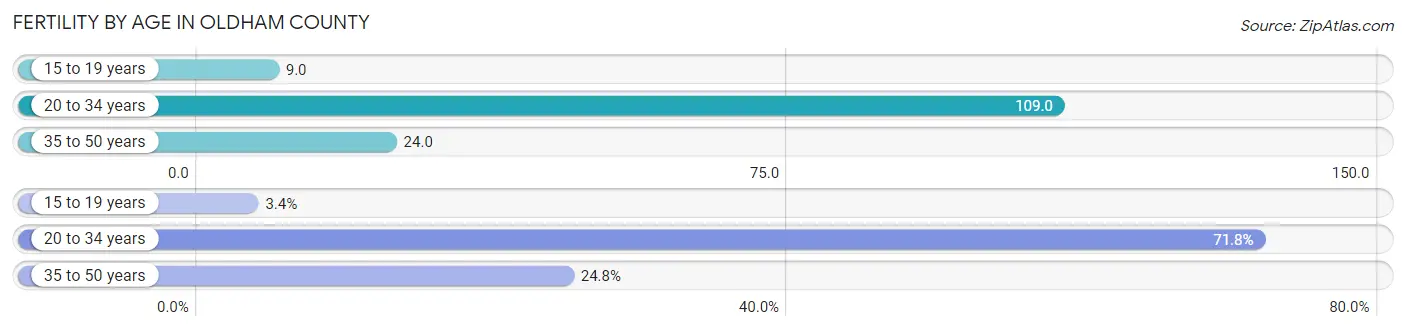
Fertility by Age in Oldham County
Average fertility rate in Oldham County is 48.0 births per 1,000 women. Women in the age bracket of 20 to 34 years have the highest fertility rate with 109.0 births per 1,000 women. Women in the age bracket of 20 to 34 years acount for 71.8% of all women with births.
| Age Bracket | Women with Births | Births / 1,000 Women |
| 15 to 19 years | 24 (3.4%) | 9.0 |
| 20 to 34 years | 503 (71.8%) | 109.0 |
| 35 to 50 years | 174 (24.8%) | 24.0 |
| Total | 701 (100.0%) | 48.0 |
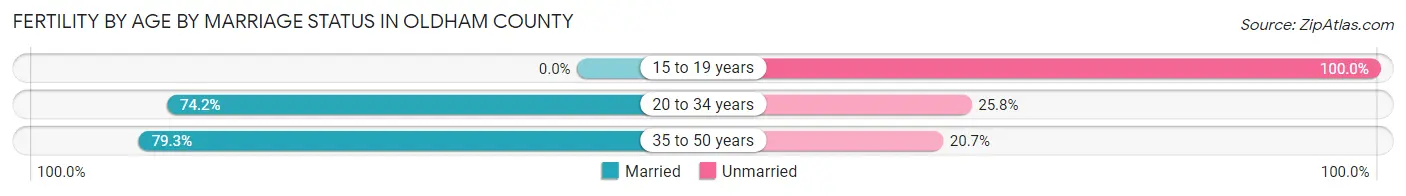
Fertility by Age by Marriage Status in Oldham County
72.9% of women with births (701) in Oldham County are married. The highest percentage of unmarried women with births falls into 15 to 19 years age bracket with 100.0% of them unmarried at the time of birth, while the lowest percentage of unmarried women with births belong to 35 to 50 years age bracket with 20.7% of them unmarried.
| Age Bracket | Married | Unmarried |
| 15 to 19 years | 0 (0.0%) | 24 (100.0%) |
| 20 to 34 years | 373 (74.2%) | 130 (25.8%) |
| 35 to 50 years | 138 (79.3%) | 36 (20.7%) |
| Total | 511 (72.9%) | 190 (27.1%) |
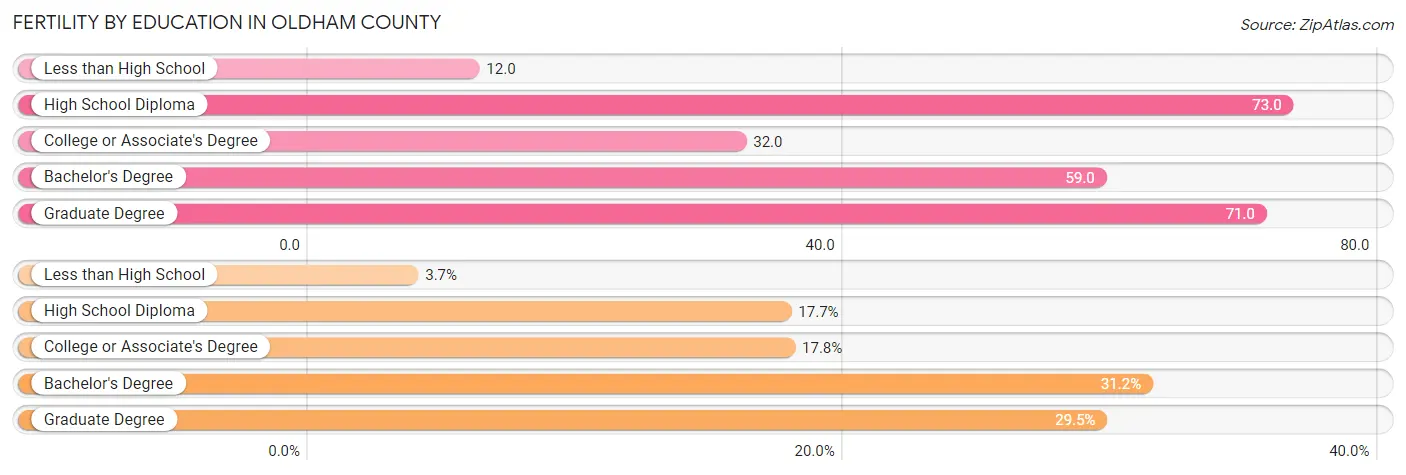
Fertility by Education in Oldham County
Average fertility rate in Oldham County is 48.0 births per 1,000 women. Women with the education attainment of high school diploma have the highest fertility rate of 73.0 births per 1,000 women, while women with the education attainment of less than high school have the lowest fertility at 12.0 births per 1,000 women. Women with the education attainment of bachelor's degree represent 31.2% of all women with births.
| Educational Attainment | Women with Births | Births / 1,000 Women |
| Less than High School | 26 (3.7%) | 12.0 |
| High School Diploma | 124 (17.7%) | 73.0 |
| College or Associate's Degree | 125 (17.8%) | 32.0 |
| Bachelor's Degree | 219 (31.2%) | 59.0 |
| Graduate Degree | 207 (29.5%) | 71.0 |
| Total | 701 (100.0%) | 48.0 |
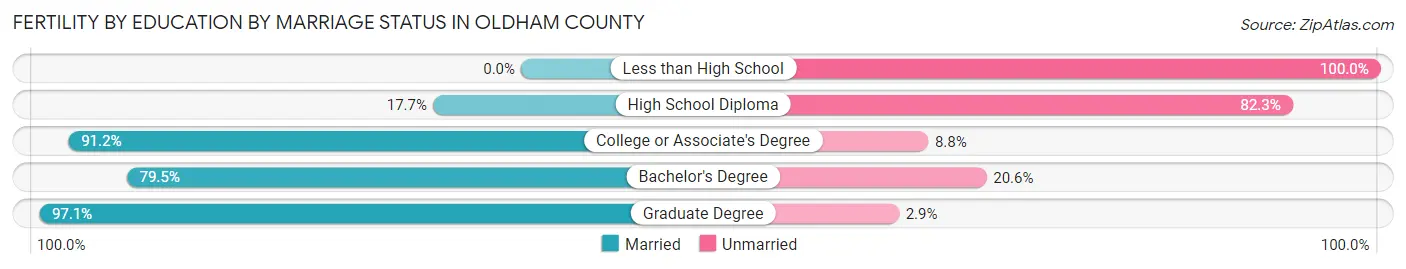
Fertility by Education by Marriage Status in Oldham County
27.1% of women with births in Oldham County are unmarried. Women with the educational attainment of graduate degree are most likely to be married with 97.1% of them married at childbirth, while women with the educational attainment of less than high school are least likely to be married with 100.0% of them unmarried at childbirth.
| Educational Attainment | Married | Unmarried |
| Less than High School | 0 (0.0%) | 26 (100.0%) |
| High School Diploma | 22 (17.7%) | 102 (82.3%) |
| College or Associate's Degree | 114 (91.2%) | 11 (8.8%) |
| Bachelor's Degree | 174 (79.4%) | 45 (20.5%) |
| Graduate Degree | 201 (97.1%) | 6 (2.9%) |
| Total | 511 (72.9%) | 190 (27.1%) |
Income in Oldham County
Income Overview in Oldham County
Per Capita Income in Oldham County is $50,534, while median incomes of families and households are $131,807 and $117,334 respectively.
| Characteristic | Number | Measure |
| Per Capita Income | 67,997 | $50,534 |
| Median Family Income | 18,185 | $131,807 |
| Mean Family Income | 18,185 | $170,283 |
| Median Household Income | 22,128 | $117,334 |
| Mean Household Income | 22,128 | $153,498 |
| Income Deficit | 18,185 | $0 |
| Wage / Income Gap (%) | 67,997 | 39.01% |
| Wage / Income Gap ($) | 67,997 | 60.99¢ per $1 |
| Gini / Inequality Index | 67,997 | 0.44 |
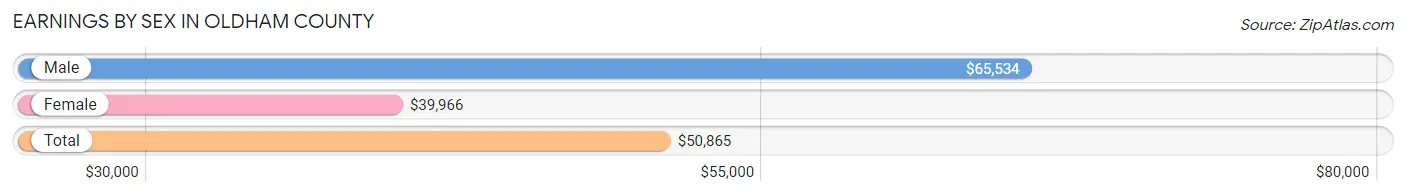
Earnings by Sex in Oldham County
Average Earnings in Oldham County are $50,865, $65,534 for men and $39,966 for women, a difference of 39.0%.
| Sex | Number | Average Earnings |
| Male | 19,628 (54.2%) | $65,534 |
| Female | 16,581 (45.8%) | $39,966 |
| Total | 36,209 (100.0%) | $50,865 |
Earnings by Sex by Income Bracket in Oldham County
The most common earnings brackets in Oldham County are $100,000+ for men (6,471 | 33.0%) and $100,000+ for women (2,473 | 14.9%).
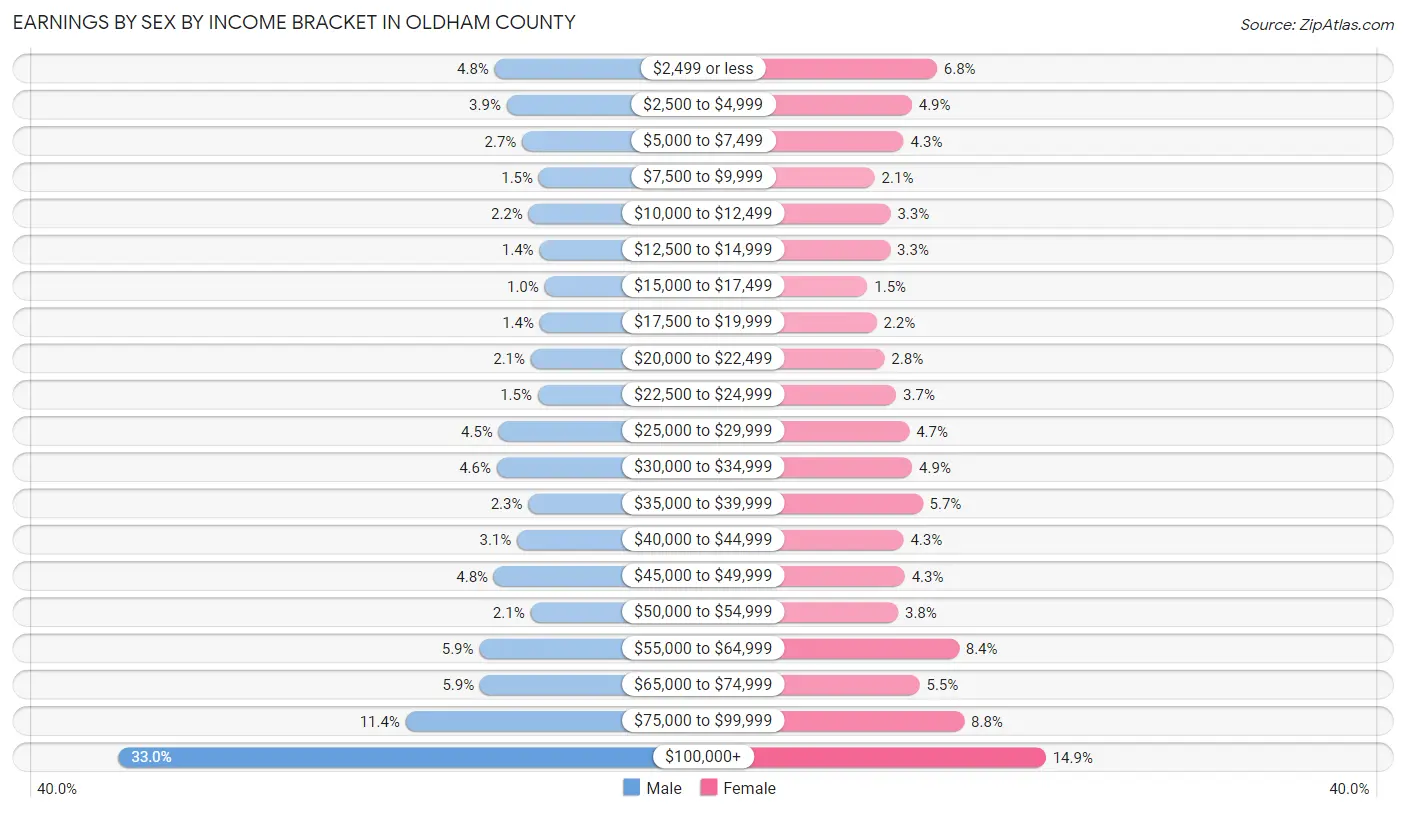
| Income | Male | Female |
| $2,499 or less | 937 (4.8%) | 1,119 (6.8%) |
| $2,500 to $4,999 | 759 (3.9%) | 808 (4.9%) |
| $5,000 to $7,499 | 531 (2.7%) | 706 (4.3%) |
| $7,500 to $9,999 | 286 (1.5%) | 346 (2.1%) |
| $10,000 to $12,499 | 438 (2.2%) | 543 (3.3%) |
| $12,500 to $14,999 | 278 (1.4%) | 539 (3.3%) |
| $15,000 to $17,499 | 202 (1.0%) | 255 (1.5%) |
| $17,500 to $19,999 | 272 (1.4%) | 370 (2.2%) |
| $20,000 to $22,499 | 405 (2.1%) | 467 (2.8%) |
| $22,500 to $24,999 | 302 (1.5%) | 613 (3.7%) |
| $25,000 to $29,999 | 877 (4.5%) | 776 (4.7%) |
| $30,000 to $34,999 | 904 (4.6%) | 812 (4.9%) |
| $35,000 to $39,999 | 442 (2.2%) | 941 (5.7%) |
| $40,000 to $44,999 | 607 (3.1%) | 704 (4.3%) |
| $45,000 to $49,999 | 949 (4.8%) | 720 (4.3%) |
| $50,000 to $54,999 | 410 (2.1%) | 637 (3.8%) |
| $55,000 to $64,999 | 1,161 (5.9%) | 1,391 (8.4%) |
| $65,000 to $74,999 | 1,152 (5.9%) | 904 (5.4%) |
| $75,000 to $99,999 | 2,245 (11.4%) | 1,457 (8.8%) |
| $100,000+ | 6,471 (33.0%) | 2,473 (14.9%) |
| Total | 19,628 (100.0%) | 16,581 (100.0%) |
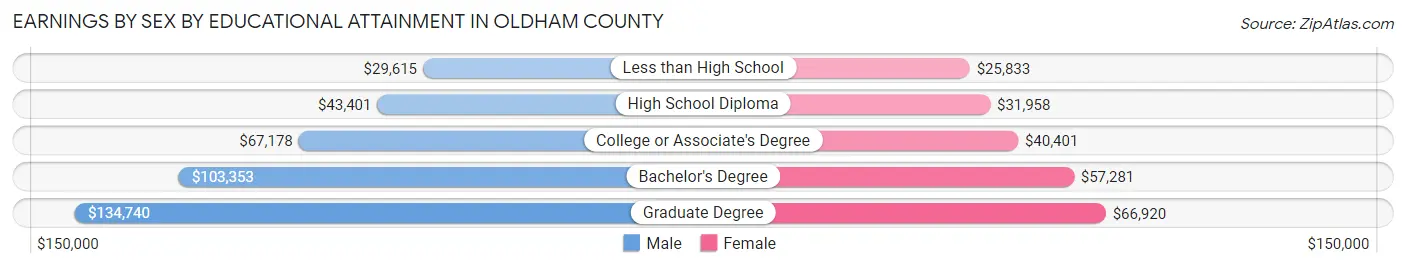
Earnings by Sex by Educational Attainment in Oldham County
Average earnings in Oldham County are $78,672 for men and $49,276 for women, a difference of 37.4%. Men with an educational attainment of graduate degree enjoy the highest average annual earnings of $134,740, while those with less than high school education earn the least with $29,615. Women with an educational attainment of graduate degree earn the most with the average annual earnings of $66,920, while those with less than high school education have the smallest earnings of $25,833.
| Educational Attainment | Male Income | Female Income |
| Less than High School | $29,615 | $25,833 |
| High School Diploma | $43,401 | $31,958 |
| College or Associate's Degree | $67,178 | $40,401 |
| Bachelor's Degree | $103,353 | $57,281 |
| Graduate Degree | $134,740 | $66,920 |
| Total | $78,672 | $49,276 |
Family Income in Oldham County
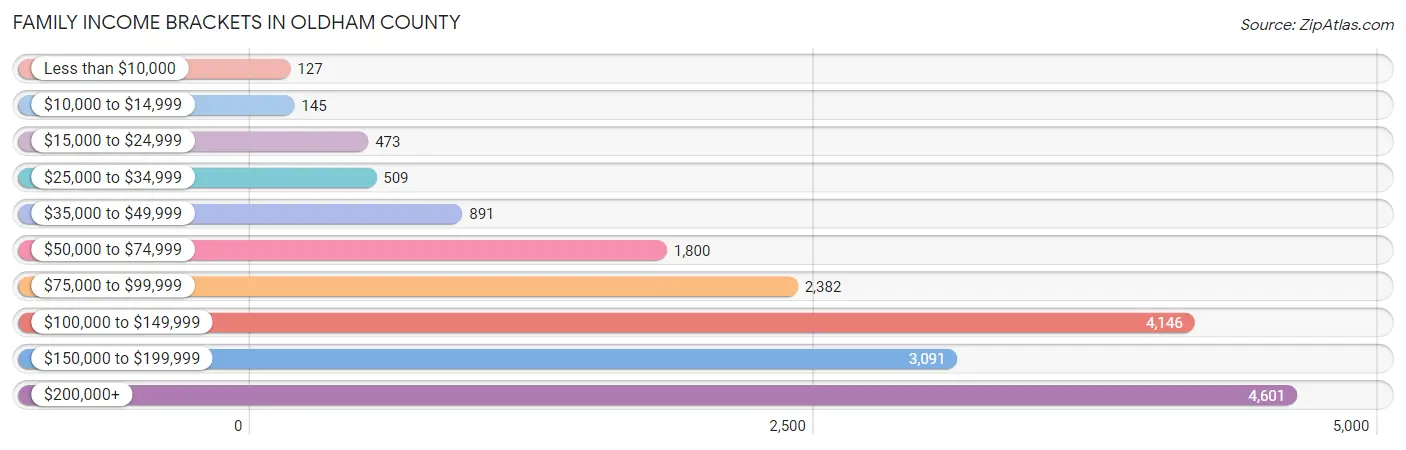
Family Income Brackets in Oldham County
According to the Oldham County family income data, there are 4,601 families falling into the $200,000+ income range, which is the most common income bracket and makes up 25.3% of all families. Conversely, the less than $10,000 income bracket is the least frequent group with only 127 families (0.7%) belonging to this category.
| Income Bracket | # Families | % Families |
| Less than $10,000 | 127 | 0.7% |
| $10,000 to $14,999 | 145 | 0.8% |
| $15,000 to $24,999 | 473 | 2.6% |
| $25,000 to $34,999 | 509 | 2.8% |
| $35,000 to $49,999 | 891 | 4.9% |
| $50,000 to $74,999 | 1,800 | 9.9% |
| $75,000 to $99,999 | 2,382 | 13.1% |
| $100,000 to $149,999 | 4,146 | 22.8% |
| $150,000 to $199,999 | 3,091 | 17.0% |
| $200,000+ | 4,601 | 25.3% |
Family Income by Famaliy Size in Oldham County
5-person families (1,966 | 10.8%) account for the highest median family income in Oldham County with $170,284 per family, while 2-person families (7,165 | 39.4%) have the highest median income of $50,531 per family member.
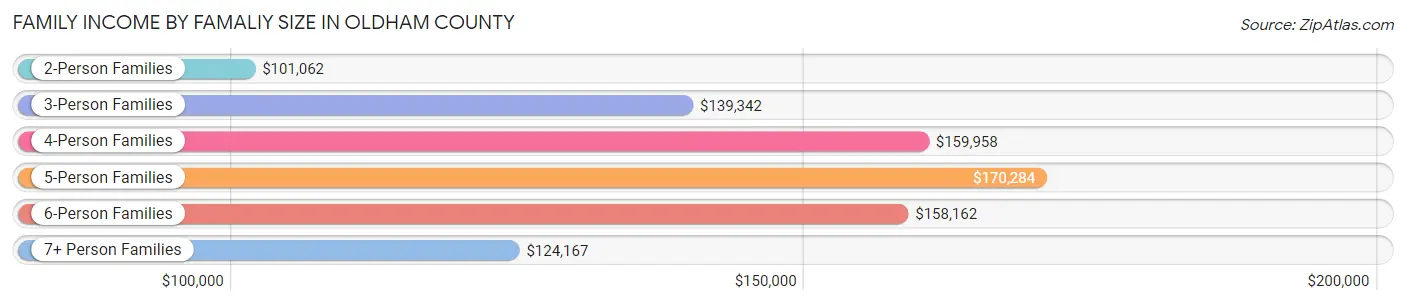
| Income Bracket | # Families | Median Income |
| 2-Person Families | 7,165 (39.4%) | $101,062 |
| 3-Person Families | 4,176 (23.0%) | $139,342 |
| 4-Person Families | 4,107 (22.6%) | $159,958 |
| 5-Person Families | 1,966 (10.8%) | $170,284 |
| 6-Person Families | 461 (2.5%) | $158,162 |
| 7+ Person Families | 310 (1.7%) | $124,167 |
| Total | 18,185 (100.0%) | $131,807 |
Family Income by Number of Earners in Oldham County
The median family income in Oldham County is $131,807, with families comprising 3+ earners (2,289) having the highest median family income of $171,741, while families with no earners (2,198) have the lowest median family income of $74,912, accounting for 12.6% and 12.1% of families, respectively.
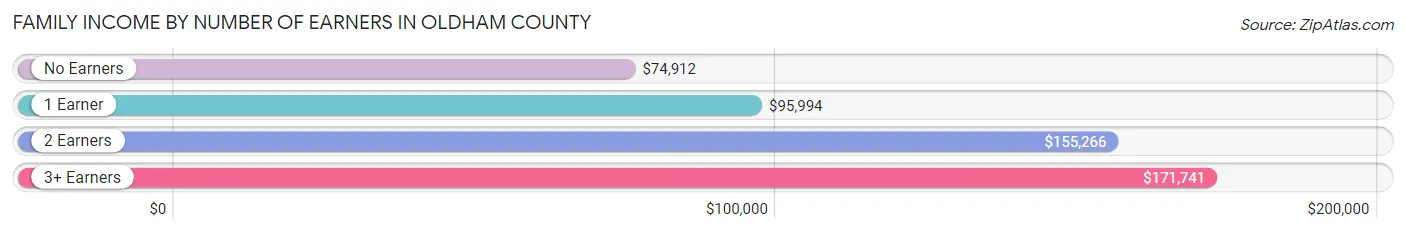
| Number of Earners | # Families | Median Income |
| No Earners | 2,198 (12.1%) | $74,912 |
| 1 Earner | 5,178 (28.5%) | $95,994 |
| 2 Earners | 8,520 (46.9%) | $155,266 |
| 3+ Earners | 2,289 (12.6%) | $171,741 |
| Total | 18,185 (100.0%) | $131,807 |
Household Income in Oldham County
Household Income Brackets in Oldham County
With 4,780 households falling in the category, the $200,000+ income range is the most frequent in Oldham County, accounting for 21.6% of all households. In contrast, only 288 households (1.3%) fall into the less than $10,000 income bracket, making it the least populous group.
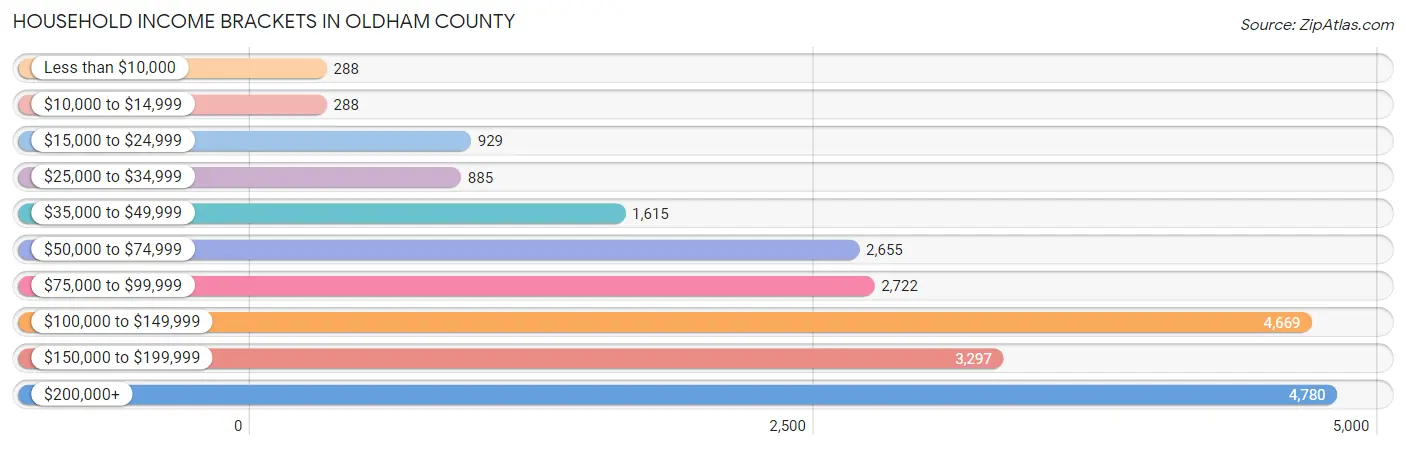
| Income Bracket | # Households | % Households |
| Less than $10,000 | 288 | 1.3% |
| $10,000 to $14,999 | 288 | 1.3% |
| $15,000 to $24,999 | 929 | 4.2% |
| $25,000 to $34,999 | 885 | 4.0% |
| $35,000 to $49,999 | 1,615 | 7.3% |
| $50,000 to $74,999 | 2,655 | 12.0% |
| $75,000 to $99,999 | 2,722 | 12.3% |
| $100,000 to $149,999 | 4,669 | 21.1% |
| $150,000 to $199,999 | 3,297 | 14.9% |
| $200,000+ | 4,780 | 21.6% |
Household Income by Householder Age in Oldham County
The median household income in Oldham County is $117,334, with the highest median household income of $136,807 found in the 45 to 64 years age bracket for the primary householder. A total of 9,901 households (44.7%) fall into this category. Meanwhile, the 15 to 24 years age bracket for the primary householder has the lowest median household income of $63,488, with 435 households (2.0%) in this group.
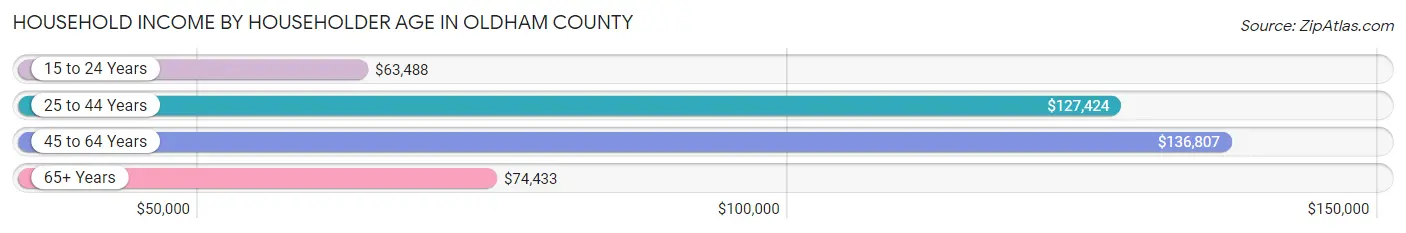
| Income Bracket | # Households | Median Income |
| 15 to 24 Years | 435 (2.0%) | $63,488 |
| 25 to 44 Years | 6,748 (30.5%) | $127,424 |
| 45 to 64 Years | 9,901 (44.7%) | $136,807 |
| 65+ Years | 5,044 (22.8%) | $74,433 |
| Total | 22,128 (100.0%) | $117,334 |
Poverty in Oldham County
Income Below Poverty by Sex and Age in Oldham County
With 3.6% poverty level for males and 4.4% for females among the residents of Oldham County, 6 to 11 year old males and under 5 year old females are the most vulnerable to poverty, with 223 males (7.3%) and 172 females (10.4%) in their respective age groups living below the poverty level.
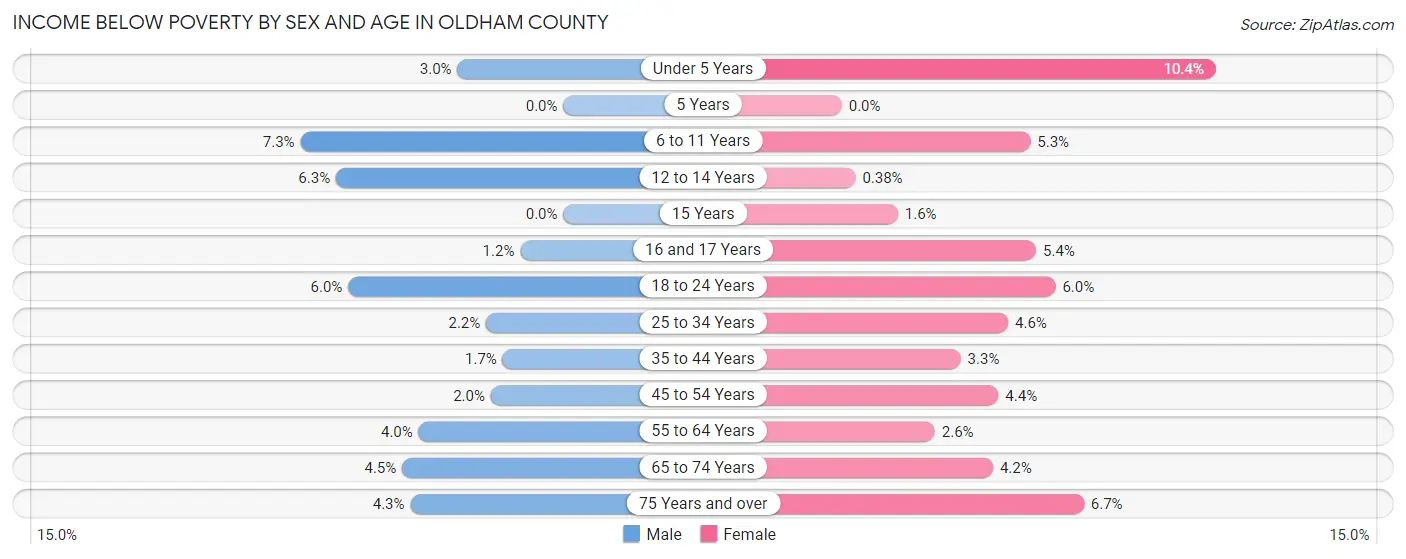
| Age Bracket | Male | Female |
| Under 5 Years | 47 (2.9%) | 172 (10.4%) |
| 5 Years | 0 (0.0%) | 0 (0.0%) |
| 6 to 11 Years | 223 (7.3%) | 166 (5.2%) |
| 12 to 14 Years | 113 (6.3%) | 6 (0.4%) |
| 15 Years | 0 (0.0%) | 12 (1.6%) |
| 16 and 17 Years | 13 (1.2%) | 48 (5.4%) |
| 18 to 24 Years | 178 (6.0%) | 157 (5.9%) |
| 25 to 34 Years | 66 (2.1%) | 132 (4.6%) |
| 35 to 44 Years | 74 (1.7%) | 149 (3.3%) |
| 45 to 54 Years | 101 (2.0%) | 206 (4.4%) |
| 55 to 64 Years | 162 (4.0%) | 108 (2.6%) |
| 65 to 74 Years | 121 (4.5%) | 126 (4.2%) |
| 75 Years and over | 60 (4.3%) | 121 (6.7%) |
| Total | 1,158 (3.6%) | 1,403 (4.4%) |
Income Above Poverty by Sex and Age in Oldham County
According to the poverty statistics in Oldham County, males aged 5 years and females aged 5 years are the age groups that are most secure financially, with 100.0% of males and 100.0% of females in these age groups living above the poverty line.
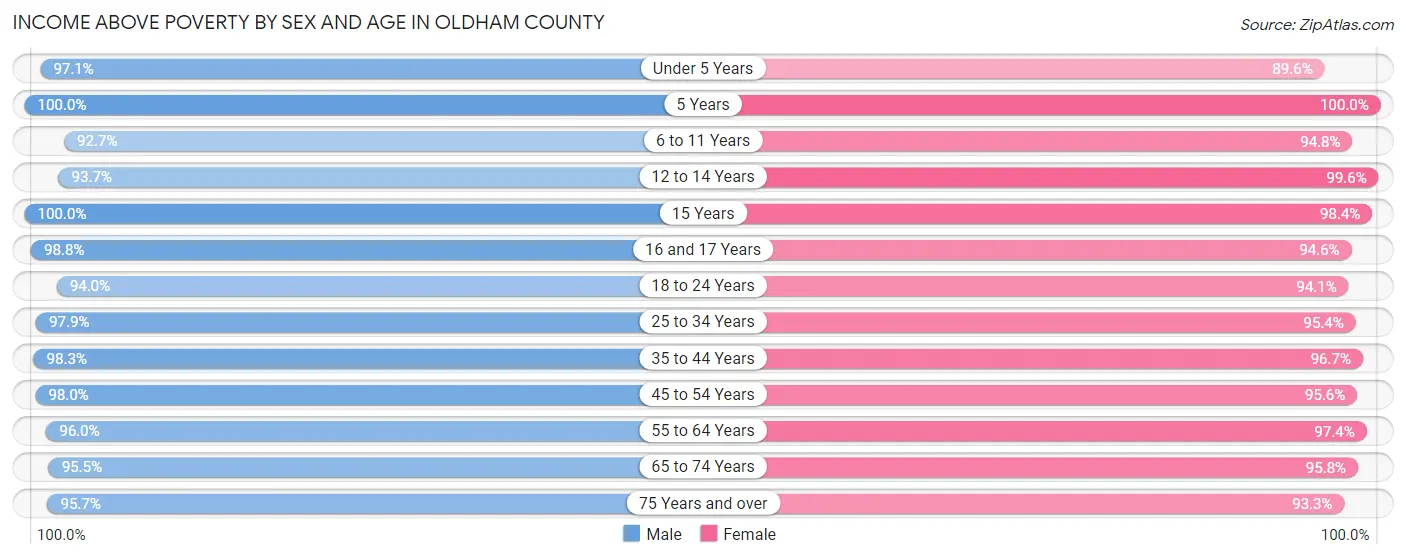
| Age Bracket | Male | Female |
| Under 5 Years | 1,546 (97.1%) | 1,480 (89.6%) |
| 5 Years | 422 (100.0%) | 369 (100.0%) |
| 6 to 11 Years | 2,824 (92.7%) | 2,994 (94.8%) |
| 12 to 14 Years | 1,673 (93.7%) | 1,567 (99.6%) |
| 15 Years | 628 (100.0%) | 758 (98.4%) |
| 16 and 17 Years | 1,074 (98.8%) | 839 (94.6%) |
| 18 to 24 Years | 2,793 (94.0%) | 2,480 (94.1%) |
| 25 to 34 Years | 3,001 (97.9%) | 2,716 (95.4%) |
| 35 to 44 Years | 4,297 (98.3%) | 4,359 (96.7%) |
| 45 to 54 Years | 4,899 (98.0%) | 4,523 (95.6%) |
| 55 to 64 Years | 3,859 (96.0%) | 4,067 (97.4%) |
| 65 to 74 Years | 2,572 (95.5%) | 2,864 (95.8%) |
| 75 Years and over | 1,350 (95.7%) | 1,673 (93.3%) |
| Total | 30,938 (96.4%) | 30,689 (95.6%) |
Income Below Poverty Among Married-Couple Families in Oldham County
The poverty statistics for married-couple families in Oldham County show that 1.5% or 225 of the total 15,361 families live below the poverty line. Families with 3 or 4 children have the highest poverty rate of 2.1%, comprising of 31 families. On the other hand, families with 5 or more children have the lowest poverty rate of 0.0%, which includes 0 families.
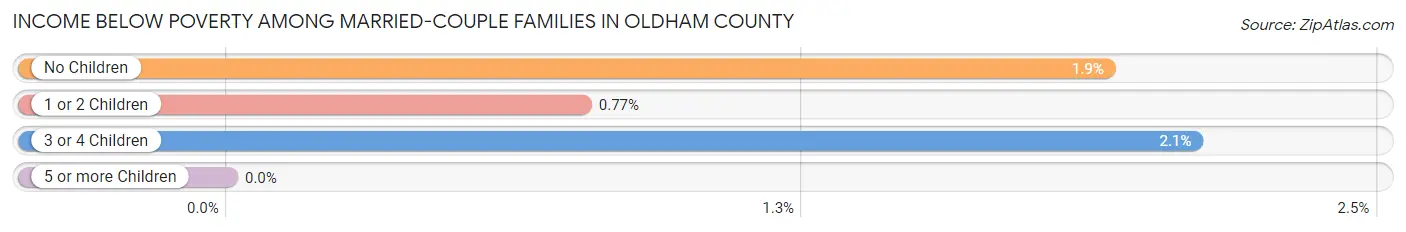
| Children | Above Poverty | Below Poverty |
| No Children | 7,609 (98.1%) | 148 (1.9%) |
| 1 or 2 Children | 5,904 (99.2%) | 46 (0.8%) |
| 3 or 4 Children | 1,444 (97.9%) | 31 (2.1%) |
| 5 or more Children | 179 (100.0%) | 0 (0.0%) |
| Total | 15,136 (98.5%) | 225 (1.5%) |
Income Below Poverty Among Single-Parent Households in Oldham County
According to the poverty data in Oldham County, 2.3% or 22 single-father households and 16.0% or 300 single-mother households are living below the poverty line. Among single-father households, those with 3 or 4 children have the highest poverty rate, with 18 households (34.6%) experiencing poverty. Likewise, among single-mother households, those with 3 or 4 children have the highest poverty rate, with 105 households (34.1%) falling below the poverty line.
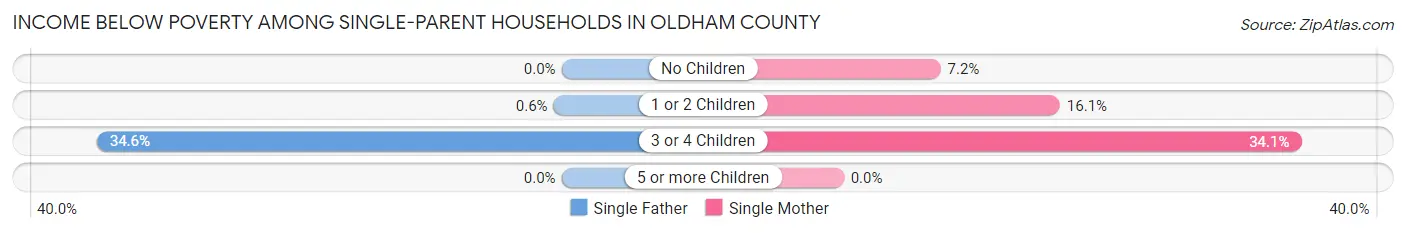
| Children | Single Father | Single Mother |
| No Children | 0 (0.0%) | 46 (7.2%) |
| 1 or 2 Children | 4 (0.6%) | 149 (16.1%) |
| 3 or 4 Children | 18 (34.6%) | 105 (34.1%) |
| 5 or more Children | 0 (0.0%) | 0 (0.0%) |
| Total | 22 (2.3%) | 300 (16.0%) |
Income Below Poverty Among Married-Couple vs Single-Parent Households in Oldham County
The poverty data for Oldham County shows that 225 of the married-couple family households (1.5%) and 322 of the single-parent households (11.4%) are living below the poverty level. Within the married-couple family households, those with 3 or 4 children have the highest poverty rate, with 31 households (2.1%) falling below the poverty line. Among the single-parent households, those with 3 or 4 children have the highest poverty rate, with 123 household (34.2%) living below poverty.
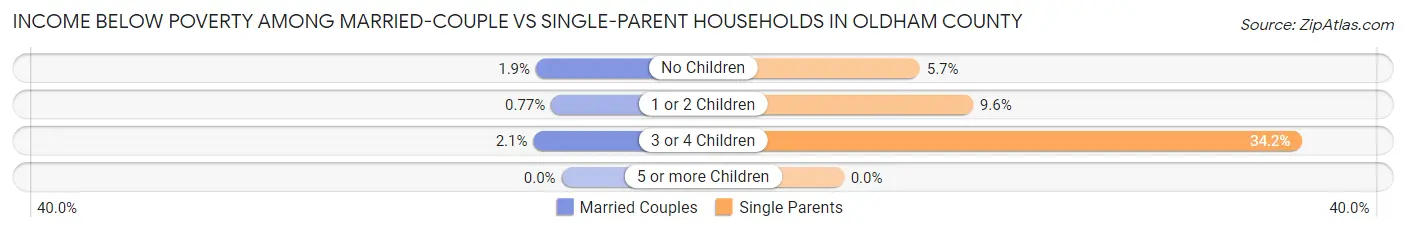
| Children | Married-Couple Families | Single-Parent Households |
| No Children | 148 (1.9%) | 46 (5.7%) |
| 1 or 2 Children | 46 (0.8%) | 153 (9.6%) |
| 3 or 4 Children | 31 (2.1%) | 123 (34.2%) |
| 5 or more Children | 0 (0.0%) | 0 (0.0%) |
| Total | 225 (1.5%) | 322 (11.4%) |
Employment Characteristics in Oldham County
Employment by Class of Employer in Oldham County
Among the 32,388 employed individuals in Oldham County, private company employees (22,277 | 68.8%), not-for-profit organizations (2,686 | 8.3%), and local government employees (2,244 | 6.9%) make up the most common classes of employment.
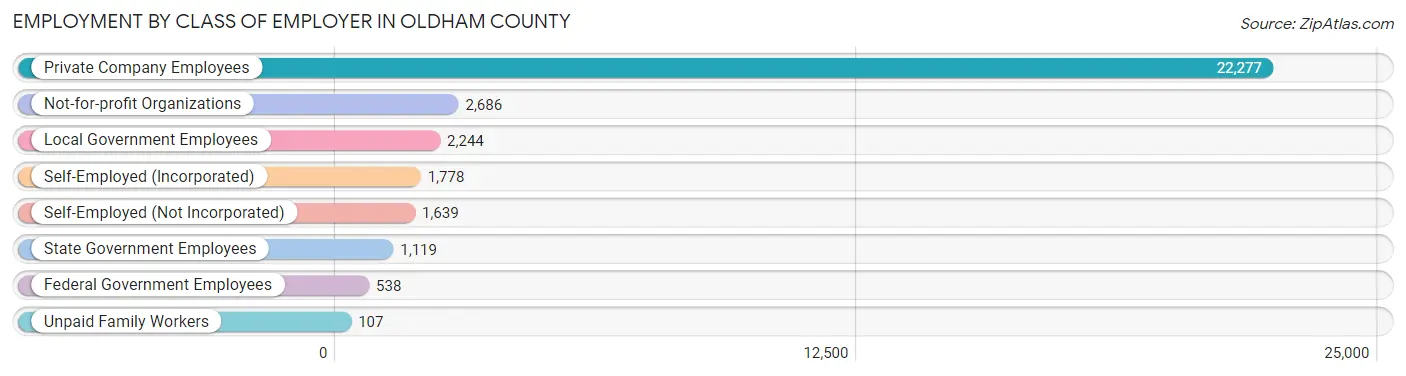
| Employer Class | # Employees | % Employees |
| Private Company Employees | 22,277 | 68.8% |
| Self-Employed (Incorporated) | 1,778 | 5.5% |
| Self-Employed (Not Incorporated) | 1,639 | 5.1% |
| Not-for-profit Organizations | 2,686 | 8.3% |
| Local Government Employees | 2,244 | 6.9% |
| State Government Employees | 1,119 | 3.5% |
| Federal Government Employees | 538 | 1.7% |
| Unpaid Family Workers | 107 | 0.3% |
| Total | 32,388 | 100.0% |
Employment Status by Age in Oldham County
According to the labor force statistics for Oldham County, out of the total population over 16 years of age (52,832), 64.7% or 34,182 individuals are in the labor force, with 3.9% or 1,333 of them unemployed. The age group with the highest labor force participation rate is 20 to 24 years, with 81.2% or 3,132 individuals in the labor force. Within the labor force, the 20 to 24 years age range has the highest percentage of unemployed individuals, with 12.3% or 385 of them being unemployed.
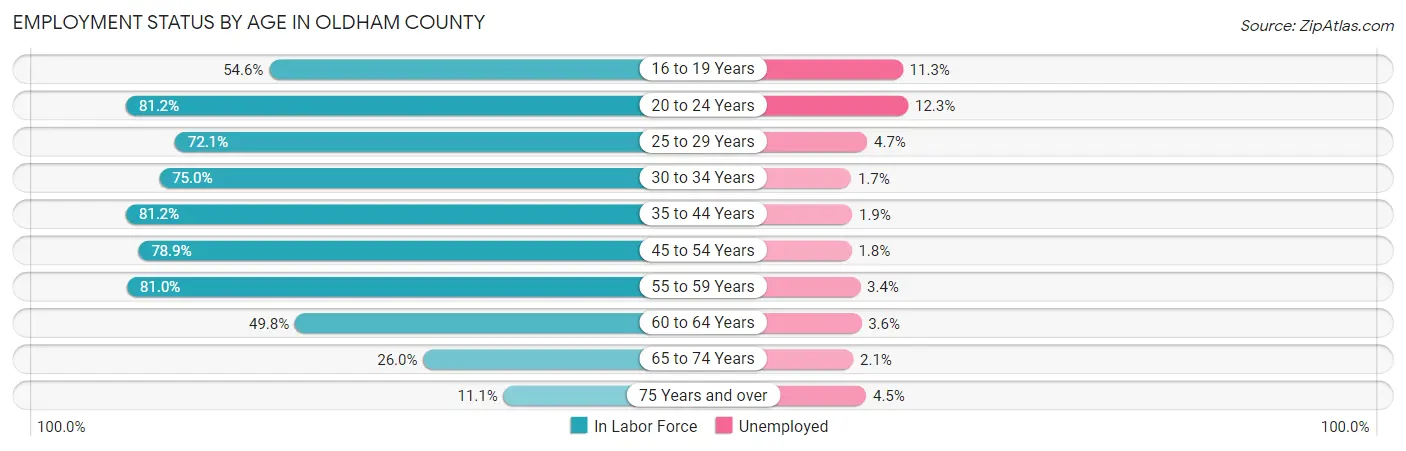
| Age Bracket | In Labor Force | Unemployed |
| 16 to 19 Years | 2,110 (54.6%) | 238 (11.3%) |
| 20 to 24 Years | 3,132 (81.2%) | 385 (12.3%) |
| 25 to 29 Years | 2,317 (72.1%) | 109 (4.7%) |
| 30 to 34 Years | 2,774 (75.0%) | 47 (1.7%) |
| 35 to 44 Years | 8,003 (81.2%) | 152 (1.9%) |
| 45 to 54 Years | 8,142 (78.9%) | 147 (1.8%) |
| 55 to 59 Years | 3,743 (81.0%) | 127 (3.4%) |
| 60 to 64 Years | 2,008 (49.8%) | 72 (3.6%) |
| 65 to 74 Years | 1,551 (26.0%) | 33 (2.1%) |
| 75 Years and over | 378 (11.1%) | 17 (4.5%) |
| Total | 34,182 (64.7%) | 1,333 (3.9%) |
Employment Status by Educational Attainment in Oldham County
According to labor force statistics for Oldham County, 75.5% of individuals (26,984) out of the total population between 25 and 64 years of age (35,741) are in the labor force, with 2.4% or 648 of them being unemployed. The group with the highest labor force participation rate are those with the educational attainment of bachelor's degree or higher, with 87.0% or 14,839 individuals in the labor force. Within the labor force, individuals with high school diploma education have the highest percentage of unemployment, with 4.0% or 151 of them being unemployed.
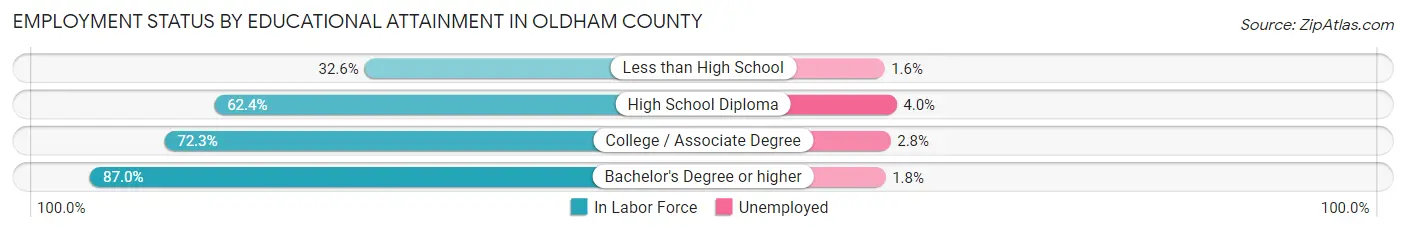
| Educational Attainment | In Labor Force | Unemployed |
| Less than High School | 632 (32.6%) | 31 (1.6%) |
| High School Diploma | 3,782 (62.4%) | 242 (4.0%) |
| College / Associate Degree | 7,726 (72.3%) | 299 (2.8%) |
| Bachelor's Degree or higher | 14,839 (87.0%) | 307 (1.8%) |
| Total | 26,984 (75.5%) | 858 (2.4%) |
Employment Occupations by Sex in Oldham County
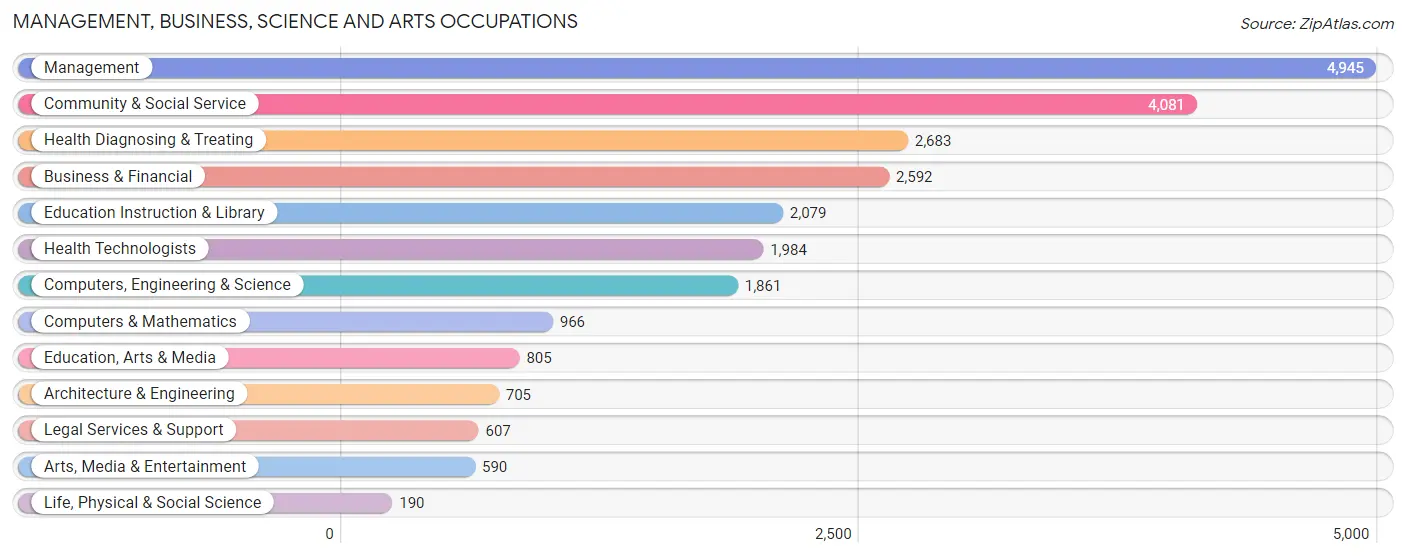
Management, Business, Science and Arts Occupations
The most common Management, Business, Science and Arts occupations in Oldham County are Management (4,945 | 15.1%), Community & Social Service (4,081 | 12.5%), Health Diagnosing & Treating (2,683 | 8.2%), Business & Financial (2,592 | 7.9%), and Education Instruction & Library (2,079 | 6.4%).
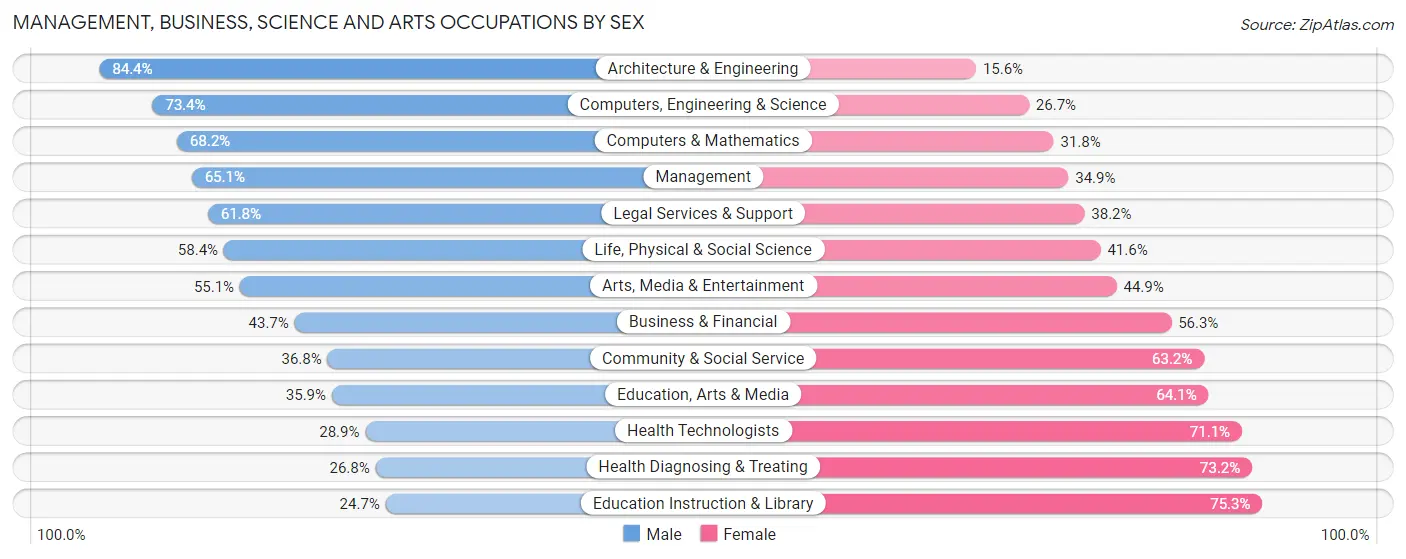
Management, Business, Science and Arts Occupations by Sex
Within the Management, Business, Science and Arts occupations in Oldham County, the most male-oriented occupations are Architecture & Engineering (84.4%), Computers, Engineering & Science (73.4%), and Computers & Mathematics (68.2%), while the most female-oriented occupations are Education Instruction & Library (75.3%), Health Diagnosing & Treating (73.2%), and Health Technologists (71.1%).
| Occupation | Male | Female |
| Management | 3,221 (65.1%) | 1,724 (34.9%) |
| Business & Financial | 1,132 (43.7%) | 1,460 (56.3%) |
| Computers, Engineering & Science | 1,365 (73.4%) | 496 (26.7%) |
| Computers & Mathematics | 659 (68.2%) | 307 (31.8%) |
| Architecture & Engineering | 595 (84.4%) | 110 (15.6%) |
| Life, Physical & Social Science | 111 (58.4%) | 79 (41.6%) |
| Community & Social Service | 1,502 (36.8%) | 2,579 (63.2%) |
| Education, Arts & Media | 289 (35.9%) | 516 (64.1%) |
| Legal Services & Support | 375 (61.8%) | 232 (38.2%) |
| Education Instruction & Library | 513 (24.7%) | 1,566 (75.3%) |
| Arts, Media & Entertainment | 325 (55.1%) | 265 (44.9%) |
| Health Diagnosing & Treating | 719 (26.8%) | 1,964 (73.2%) |
| Health Technologists | 574 (28.9%) | 1,410 (71.1%) |
| Total (Category) | 7,939 (49.1%) | 8,223 (50.9%) |
| Total (Overall) | 17,801 (54.3%) | 14,960 (45.7%) |
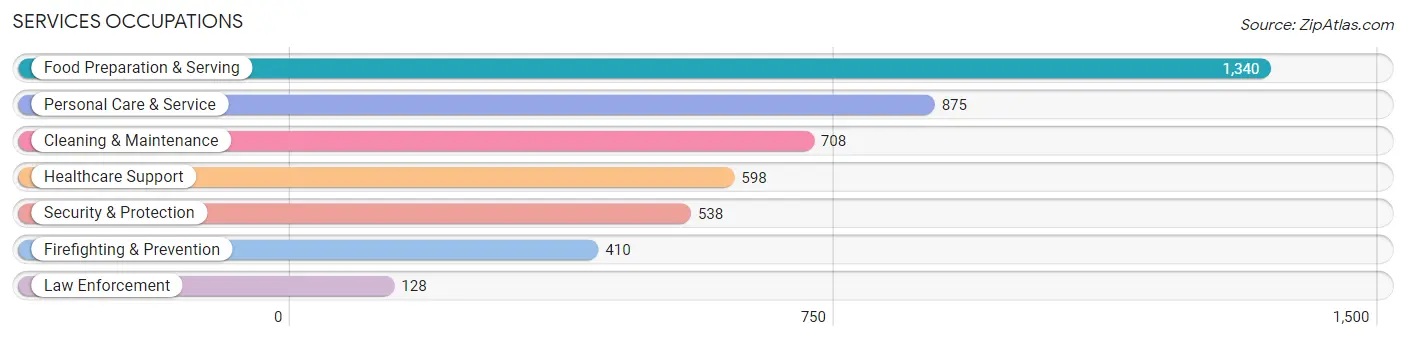
Services Occupations
The most common Services occupations in Oldham County are Food Preparation & Serving (1,340 | 4.1%), Personal Care & Service (875 | 2.7%), Cleaning & Maintenance (708 | 2.2%), Healthcare Support (598 | 1.8%), and Security & Protection (538 | 1.6%).
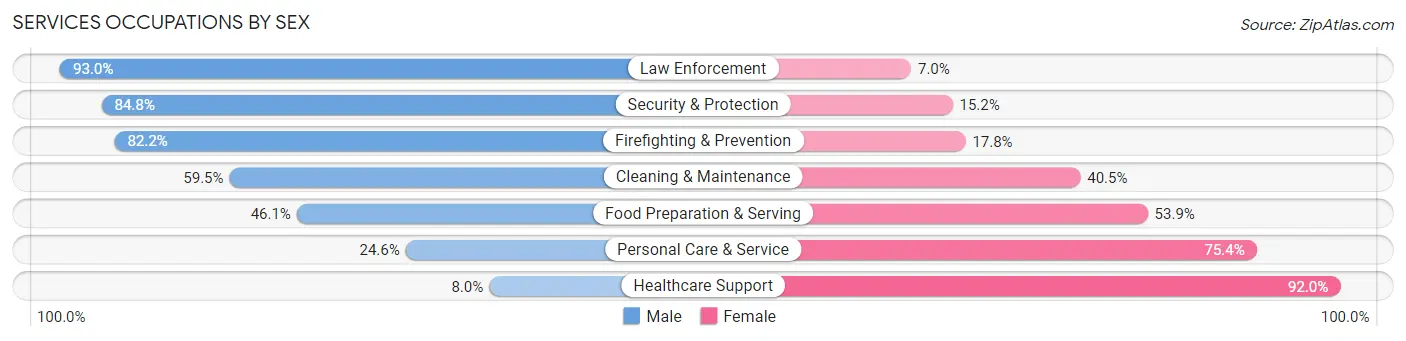
Services Occupations by Sex
Within the Services occupations in Oldham County, the most male-oriented occupations are Law Enforcement (93.0%), Security & Protection (84.8%), and Firefighting & Prevention (82.2%), while the most female-oriented occupations are Healthcare Support (92.0%), Personal Care & Service (75.4%), and Food Preparation & Serving (53.9%).
| Occupation | Male | Female |
| Healthcare Support | 48 (8.0%) | 550 (92.0%) |
| Security & Protection | 456 (84.8%) | 82 (15.2%) |
| Firefighting & Prevention | 337 (82.2%) | 73 (17.8%) |
| Law Enforcement | 119 (93.0%) | 9 (7.0%) |
| Food Preparation & Serving | 618 (46.1%) | 722 (53.9%) |
| Cleaning & Maintenance | 421 (59.5%) | 287 (40.5%) |
| Personal Care & Service | 215 (24.6%) | 660 (75.4%) |
| Total (Category) | 1,758 (43.3%) | 2,301 (56.7%) |
| Total (Overall) | 17,801 (54.3%) | 14,960 (45.7%) |
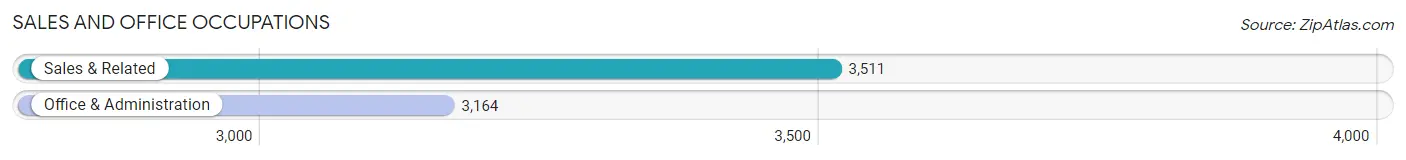
Sales and Office Occupations
The most common Sales and Office occupations in Oldham County are Sales & Related (3,511 | 10.7%), and Office & Administration (3,164 | 9.7%).
Sales and Office Occupations by Sex
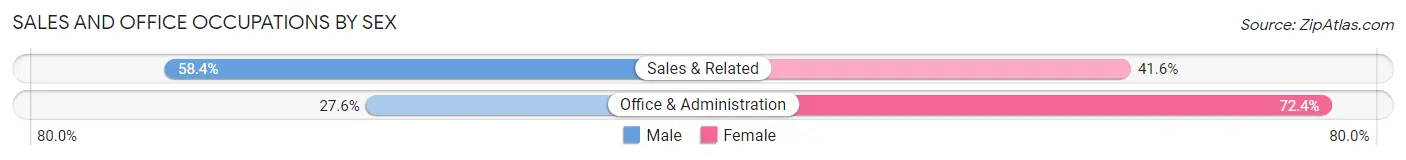
| Occupation | Male | Female |
| Sales & Related | 2,050 (58.4%) | 1,461 (41.6%) |
| Office & Administration | 872 (27.6%) | 2,292 (72.4%) |
| Total (Category) | 2,922 (43.8%) | 3,753 (56.2%) |
| Total (Overall) | 17,801 (54.3%) | 14,960 (45.7%) |
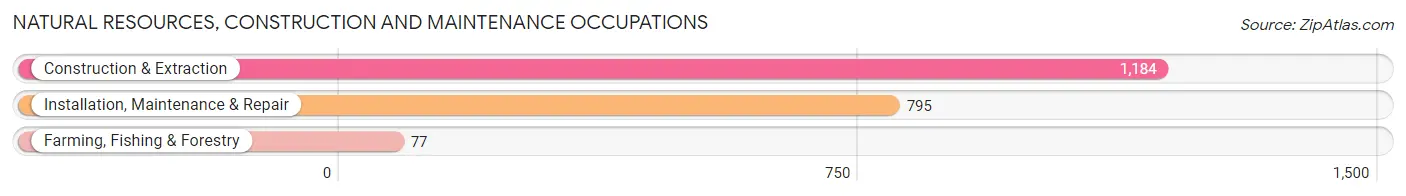
Natural Resources, Construction and Maintenance Occupations
The most common Natural Resources, Construction and Maintenance occupations in Oldham County are Construction & Extraction (1,184 | 3.6%), Installation, Maintenance & Repair (795 | 2.4%), and Farming, Fishing & Forestry (77 | 0.2%).
Natural Resources, Construction and Maintenance Occupations by Sex
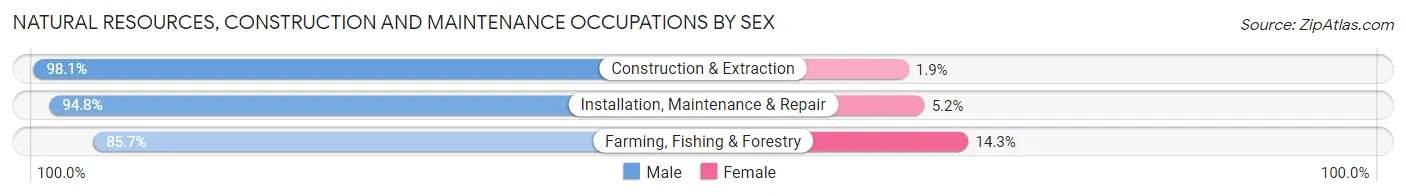
| Occupation | Male | Female |
| Farming, Fishing & Forestry | 66 (85.7%) | 11 (14.3%) |
| Construction & Extraction | 1,162 (98.1%) | 22 (1.9%) |
| Installation, Maintenance & Repair | 754 (94.8%) | 41 (5.2%) |
| Total (Category) | 1,982 (96.4%) | 74 (3.6%) |
| Total (Overall) | 17,801 (54.3%) | 14,960 (45.7%) |
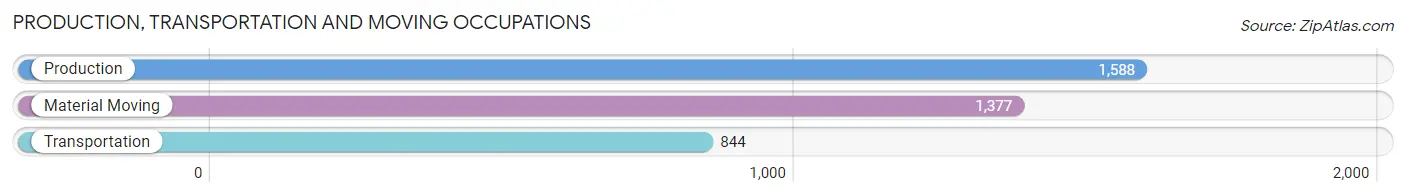
Production, Transportation and Moving Occupations
The most common Production, Transportation and Moving occupations in Oldham County are Production (1,588 | 4.9%), Material Moving (1,377 | 4.2%), and Transportation (844 | 2.6%).
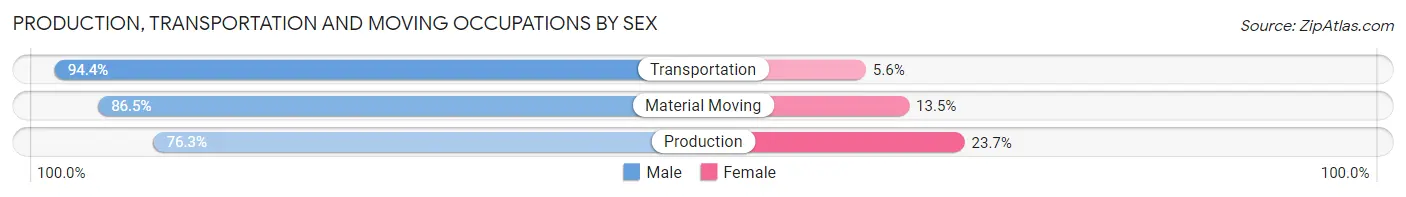
Production, Transportation and Moving Occupations by Sex
| Occupation | Male | Female |
| Production | 1,212 (76.3%) | 376 (23.7%) |
| Transportation | 797 (94.4%) | 47 (5.6%) |
| Material Moving | 1,191 (86.5%) | 186 (13.5%) |
| Total (Category) | 3,200 (84.0%) | 609 (16.0%) |
| Total (Overall) | 17,801 (54.3%) | 14,960 (45.7%) |
Employment Industries by Sex in Oldham County
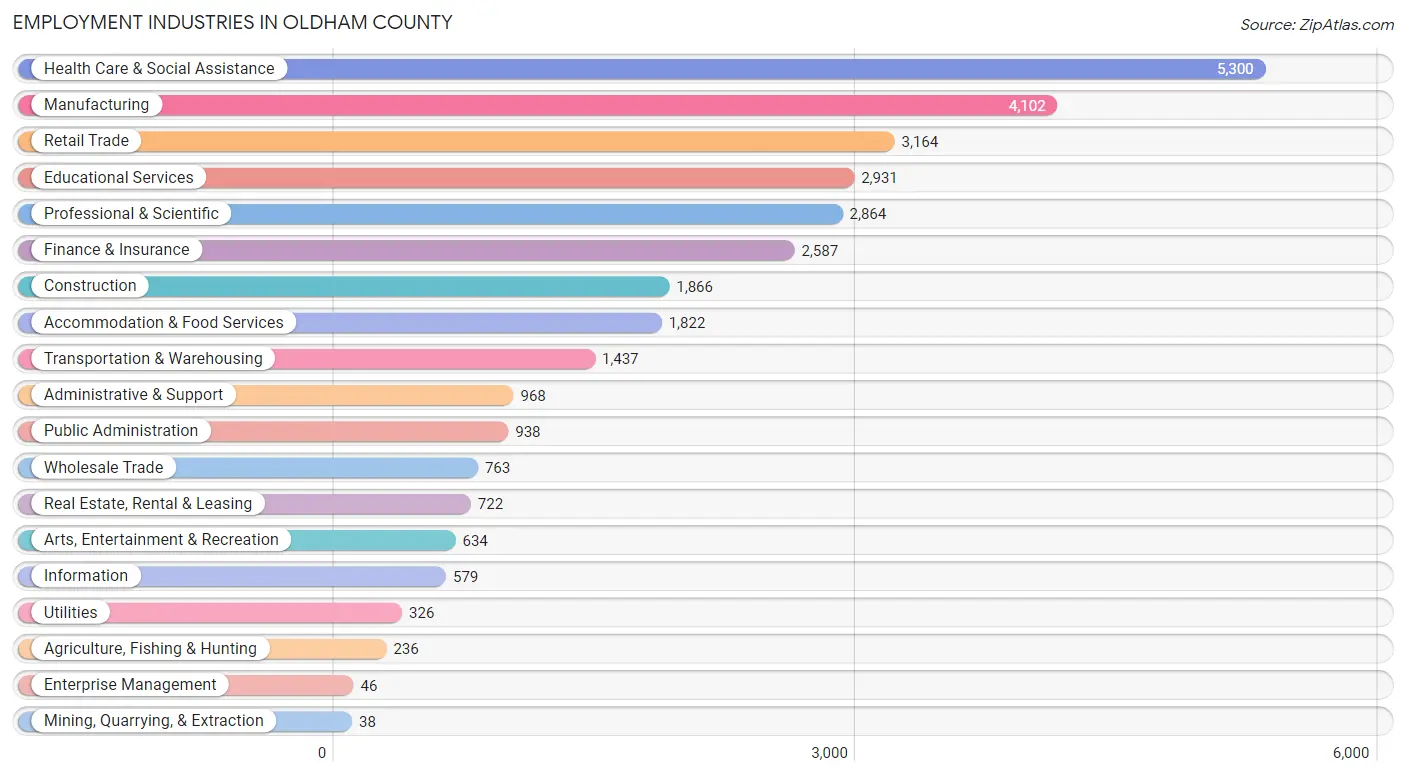
Employment Industries in Oldham County
The major employment industries in Oldham County include Health Care & Social Assistance (5,300 | 16.2%), Manufacturing (4,102 | 12.5%), Retail Trade (3,164 | 9.7%), Educational Services (2,931 | 8.9%), and Professional & Scientific (2,864 | 8.7%).
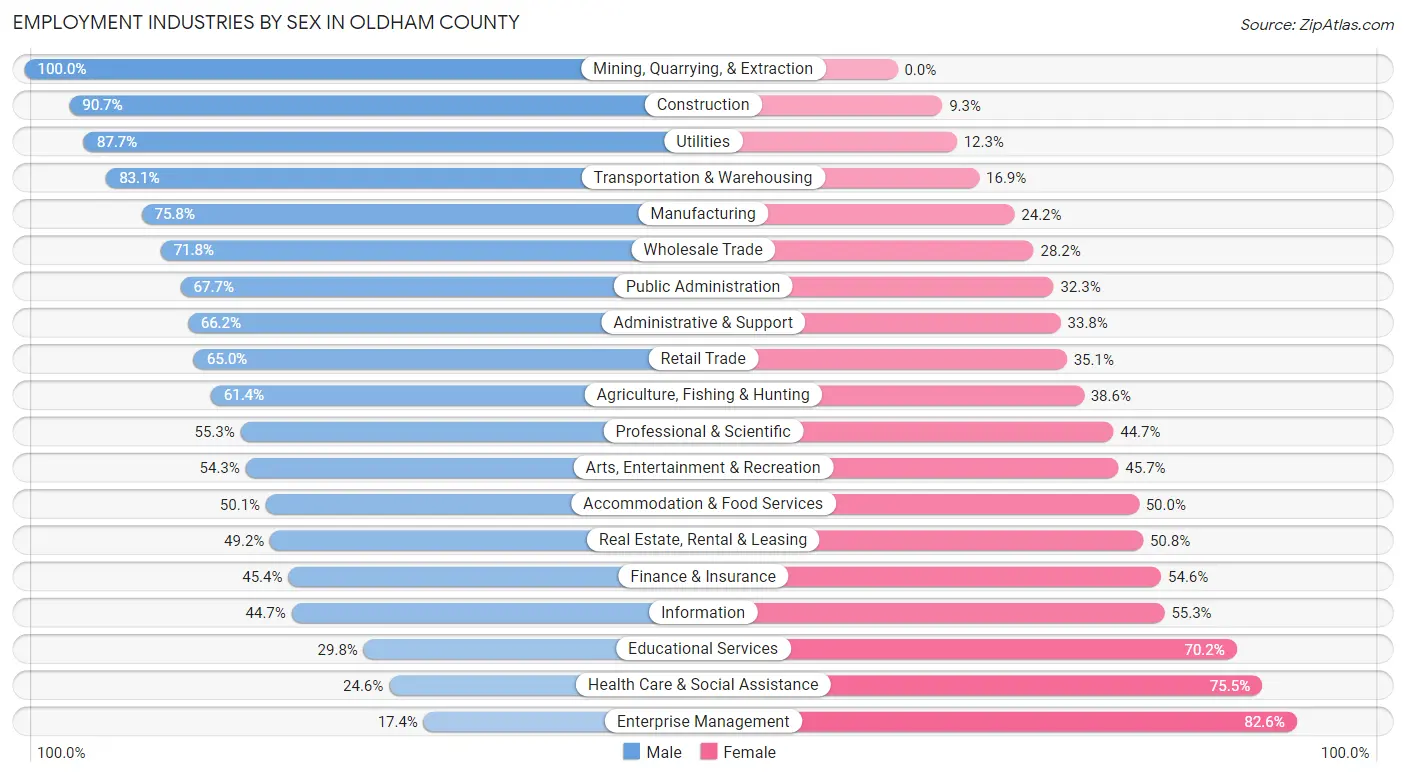
Employment Industries by Sex in Oldham County
The Oldham County industries that see more men than women are Mining, Quarrying, & Extraction (100.0%), Construction (90.7%), and Utilities (87.7%), whereas the industries that tend to have a higher number of women are Enterprise Management (82.6%), Health Care & Social Assistance (75.4%), and Educational Services (70.2%).
| Industry | Male | Female |
| Agriculture, Fishing & Hunting | 145 (61.4%) | 91 (38.6%) |
| Mining, Quarrying, & Extraction | 38 (100.0%) | 0 (0.0%) |
| Construction | 1,693 (90.7%) | 173 (9.3%) |
| Manufacturing | 3,109 (75.8%) | 993 (24.2%) |
| Wholesale Trade | 548 (71.8%) | 215 (28.2%) |
| Retail Trade | 2,055 (64.9%) | 1,109 (35.0%) |
| Transportation & Warehousing | 1,194 (83.1%) | 243 (16.9%) |
| Utilities | 286 (87.7%) | 40 (12.3%) |
| Information | 259 (44.7%) | 320 (55.3%) |
| Finance & Insurance | 1,175 (45.4%) | 1,412 (54.6%) |
| Real Estate, Rental & Leasing | 355 (49.2%) | 367 (50.8%) |
| Professional & Scientific | 1,584 (55.3%) | 1,280 (44.7%) |
| Enterprise Management | 8 (17.4%) | 38 (82.6%) |
| Administrative & Support | 641 (66.2%) | 327 (33.8%) |
| Educational Services | 874 (29.8%) | 2,057 (70.2%) |
| Health Care & Social Assistance | 1,301 (24.5%) | 3,999 (75.4%) |
| Arts, Entertainment & Recreation | 344 (54.3%) | 290 (45.7%) |
| Accommodation & Food Services | 912 (50.0%) | 910 (49.9%) |
| Public Administration | 635 (67.7%) | 303 (32.3%) |
| Total | 17,801 (54.3%) | 14,960 (45.7%) |
Education in Oldham County
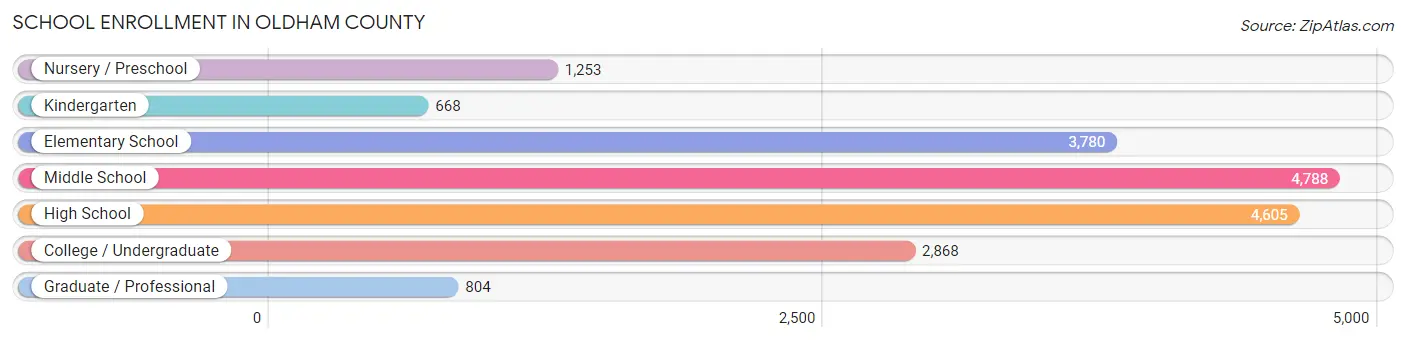
School Enrollment in Oldham County
The most common levels of schooling among the 18,766 students in Oldham County are middle school (4,788 | 25.5%), high school (4,605 | 24.5%), and elementary school (3,780 | 20.1%).
| School Level | # Students | % Students |
| Nursery / Preschool | 1,253 | 6.7% |
| Kindergarten | 668 | 3.6% |
| Elementary School | 3,780 | 20.1% |
| Middle School | 4,788 | 25.5% |
| High School | 4,605 | 24.5% |
| College / Undergraduate | 2,868 | 15.3% |
| Graduate / Professional | 804 | 4.3% |
| Total | 18,766 | 100.0% |
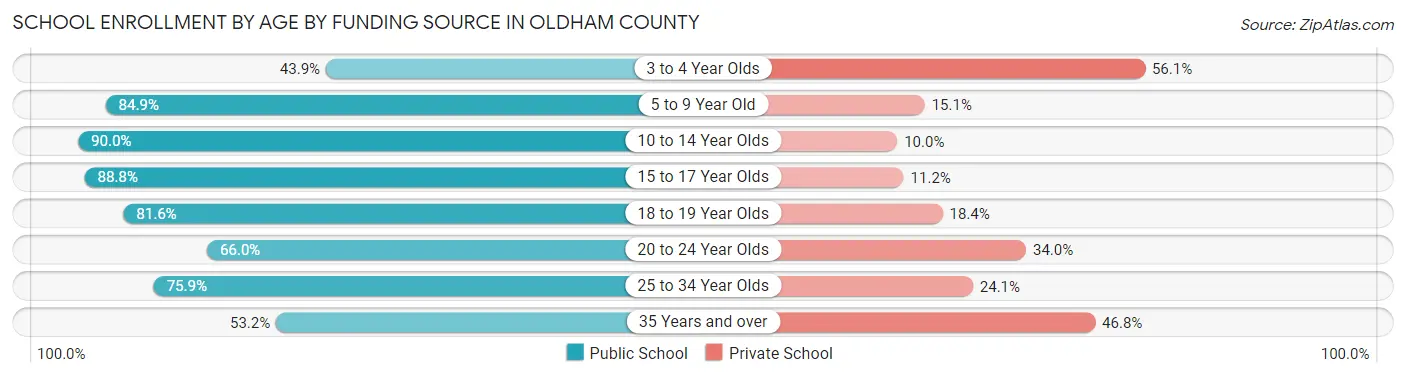
School Enrollment by Age by Funding Source in Oldham County
Out of a total of 18,766 students who are enrolled in schools in Oldham County, 3,434 (18.3%) attend a private institution, while the remaining 15,332 (81.7%) are enrolled in public schools. The age group of 3 to 4 year olds has the highest likelihood of being enrolled in private schools, with 477 (56.1% in the age bracket) enrolled. Conversely, the age group of 10 to 14 year olds has the lowest likelihood of being enrolled in a private school, with 4,969 (90.0% in the age bracket) attending a public institution.
| Age Bracket | Public School | Private School |
| 3 to 4 Year Olds | 373 (43.9%) | 477 (56.1%) |
| 5 to 9 Year Old | 3,920 (84.9%) | 697 (15.1%) |
| 10 to 14 Year Olds | 4,969 (90.0%) | 551 (10.0%) |
| 15 to 17 Year Olds | 2,951 (88.8%) | 371 (11.2%) |
| 18 to 19 Year Olds | 1,188 (81.6%) | 268 (18.4%) |
| 20 to 24 Year Olds | 894 (66.0%) | 460 (34.0%) |
| 25 to 34 Year Olds | 565 (75.9%) | 179 (24.1%) |
| 35 Years and over | 480 (53.2%) | 423 (46.8%) |
| Total | 15,332 (81.7%) | 3,434 (18.3%) |
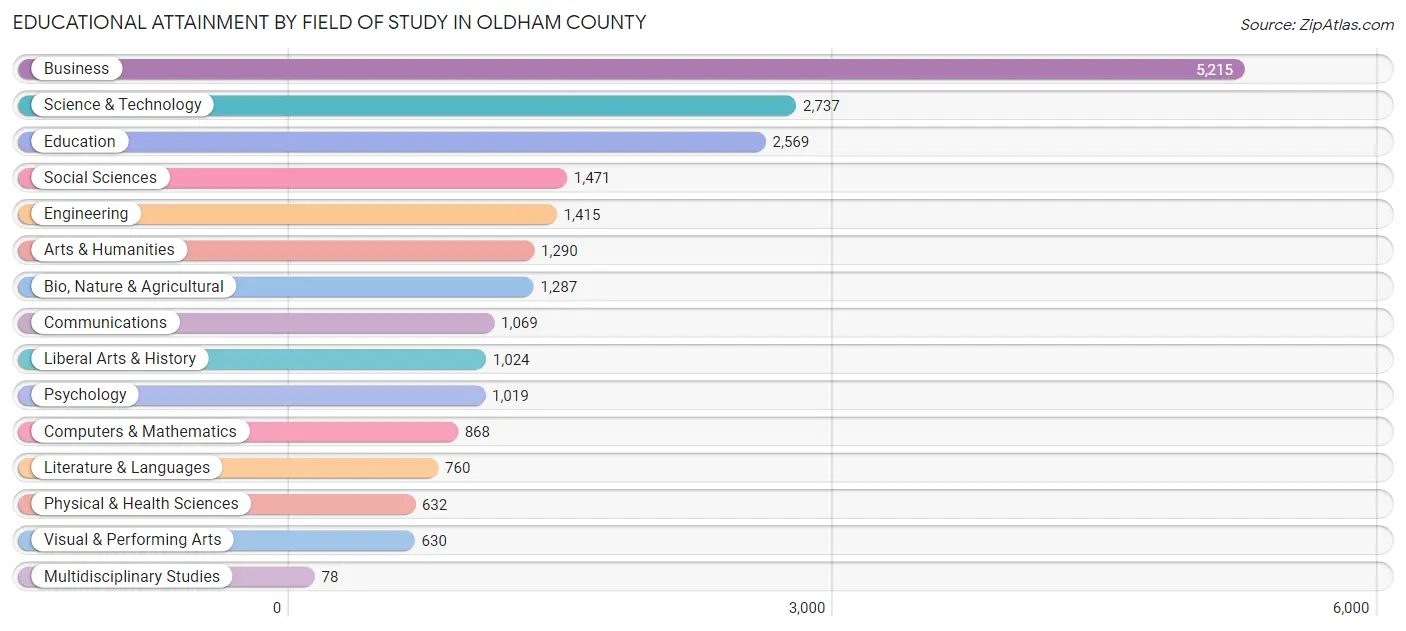
Educational Attainment by Field of Study in Oldham County
Business (5,215 | 23.6%), science & technology (2,737 | 12.4%), education (2,569 | 11.6%), social sciences (1,471 | 6.7%), and engineering (1,415 | 6.4%) are the most common fields of study among 22,064 individuals in Oldham County who have obtained a bachelor's degree or higher.
| Field of Study | # Graduates | % Graduates |
| Computers & Mathematics | 868 | 3.9% |
| Bio, Nature & Agricultural | 1,287 | 5.8% |
| Physical & Health Sciences | 632 | 2.9% |
| Psychology | 1,019 | 4.6% |
| Social Sciences | 1,471 | 6.7% |
| Engineering | 1,415 | 6.4% |
| Multidisciplinary Studies | 78 | 0.4% |
| Science & Technology | 2,737 | 12.4% |
| Business | 5,215 | 23.6% |
| Education | 2,569 | 11.6% |
| Literature & Languages | 760 | 3.4% |
| Liberal Arts & History | 1,024 | 4.6% |
| Visual & Performing Arts | 630 | 2.9% |
| Communications | 1,069 | 4.8% |
| Arts & Humanities | 1,290 | 5.9% |
| Total | 22,064 | 100.0% |
Transportation & Commute in Oldham County
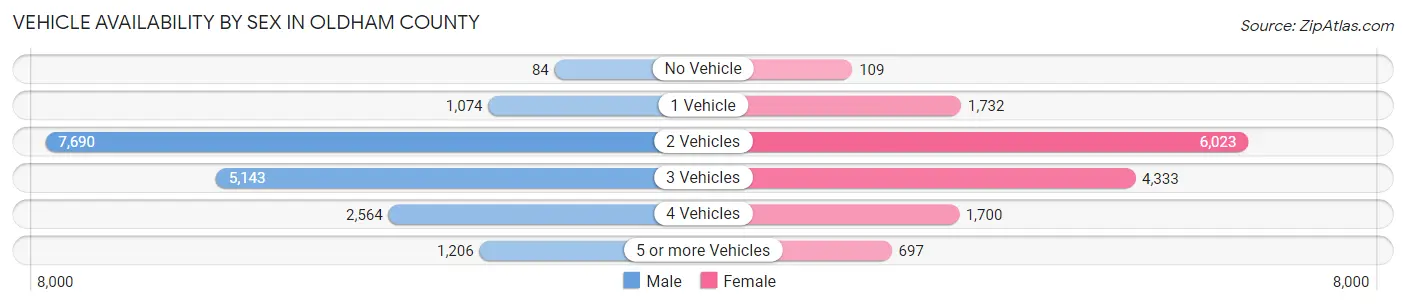
Vehicle Availability by Sex in Oldham County
The most prevalent vehicle ownership categories in Oldham County are males with 2 vehicles (7,690, accounting for 43.3%) and females with 2 vehicles (6,023, making up 52.7%).
| Vehicles Available | Male | Female |
| No Vehicle | 84 (0.5%) | 109 (0.7%) |
| 1 Vehicle | 1,074 (6.0%) | 1,732 (11.9%) |
| 2 Vehicles | 7,690 (43.3%) | 6,023 (41.3%) |
| 3 Vehicles | 5,143 (29.0%) | 4,333 (29.7%) |
| 4 Vehicles | 2,564 (14.4%) | 1,700 (11.7%) |
| 5 or more Vehicles | 1,206 (6.8%) | 697 (4.8%) |
| Total | 17,761 (100.0%) | 14,594 (100.0%) |
Commute Time in Oldham County
The most frequently occuring commute durations in Oldham County are 30 to 34 minutes (6,338 commuters, 22.8%), 20 to 24 minutes (4,510 commuters, 16.2%), and 25 to 29 minutes (2,918 commuters, 10.5%).
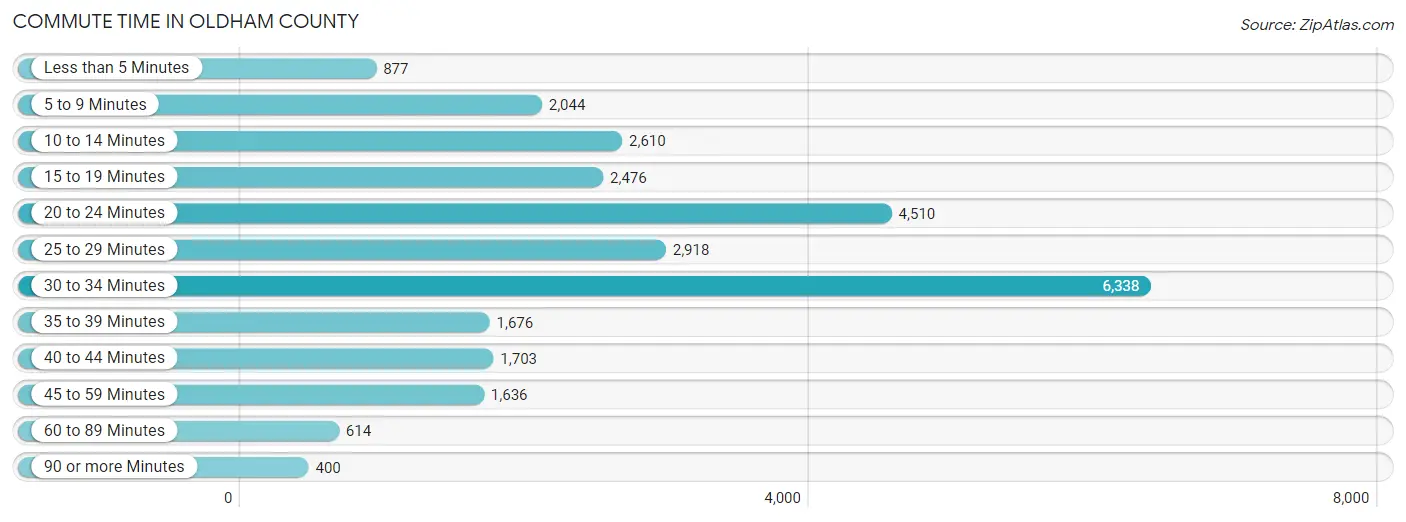
| Commute Time | # Commuters | % Commuters |
| Less than 5 Minutes | 877 | 3.2% |
| 5 to 9 Minutes | 2,044 | 7.3% |
| 10 to 14 Minutes | 2,610 | 9.4% |
| 15 to 19 Minutes | 2,476 | 8.9% |
| 20 to 24 Minutes | 4,510 | 16.2% |
| 25 to 29 Minutes | 2,918 | 10.5% |
| 30 to 34 Minutes | 6,338 | 22.8% |
| 35 to 39 Minutes | 1,676 | 6.0% |
| 40 to 44 Minutes | 1,703 | 6.1% |
| 45 to 59 Minutes | 1,636 | 5.9% |
| 60 to 89 Minutes | 614 | 2.2% |
| 90 or more Minutes | 400 | 1.4% |
Commute Time by Sex in Oldham County
The most common commute times in Oldham County are 30 to 34 minutes (3,956 commuters, 25.4%) for males and 30 to 34 minutes (2,382 commuters, 19.5%) for females.
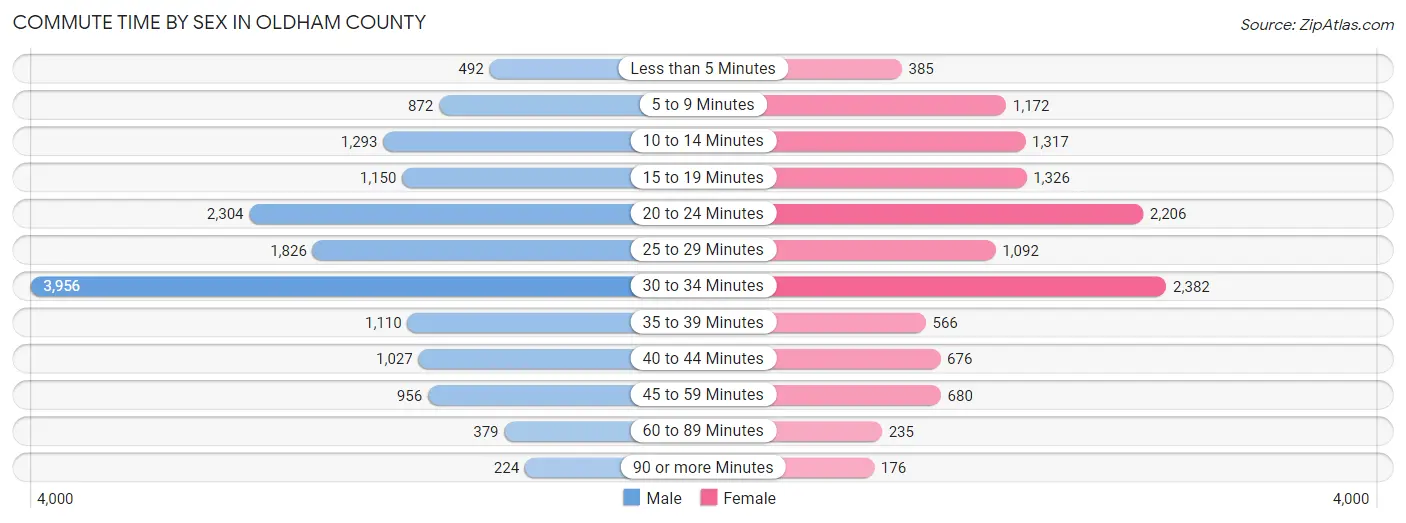
| Commute Time | Male | Female |
| Less than 5 Minutes | 492 (3.2%) | 385 (3.2%) |
| 5 to 9 Minutes | 872 (5.6%) | 1,172 (9.6%) |
| 10 to 14 Minutes | 1,293 (8.3%) | 1,317 (10.8%) |
| 15 to 19 Minutes | 1,150 (7.4%) | 1,326 (10.9%) |
| 20 to 24 Minutes | 2,304 (14.8%) | 2,206 (18.1%) |
| 25 to 29 Minutes | 1,826 (11.7%) | 1,092 (8.9%) |
| 30 to 34 Minutes | 3,956 (25.4%) | 2,382 (19.5%) |
| 35 to 39 Minutes | 1,110 (7.1%) | 566 (4.6%) |
| 40 to 44 Minutes | 1,027 (6.6%) | 676 (5.5%) |
| 45 to 59 Minutes | 956 (6.1%) | 680 (5.6%) |
| 60 to 89 Minutes | 379 (2.4%) | 235 (1.9%) |
| 90 or more Minutes | 224 (1.4%) | 176 (1.4%) |
Time of Departure to Work by Sex in Oldham County
The most frequent times of departure to work in Oldham County are 7:00 AM to 7:29 AM (2,757, 17.7%) for males and 7:00 AM to 7:29 AM (2,343, 19.2%) for females.
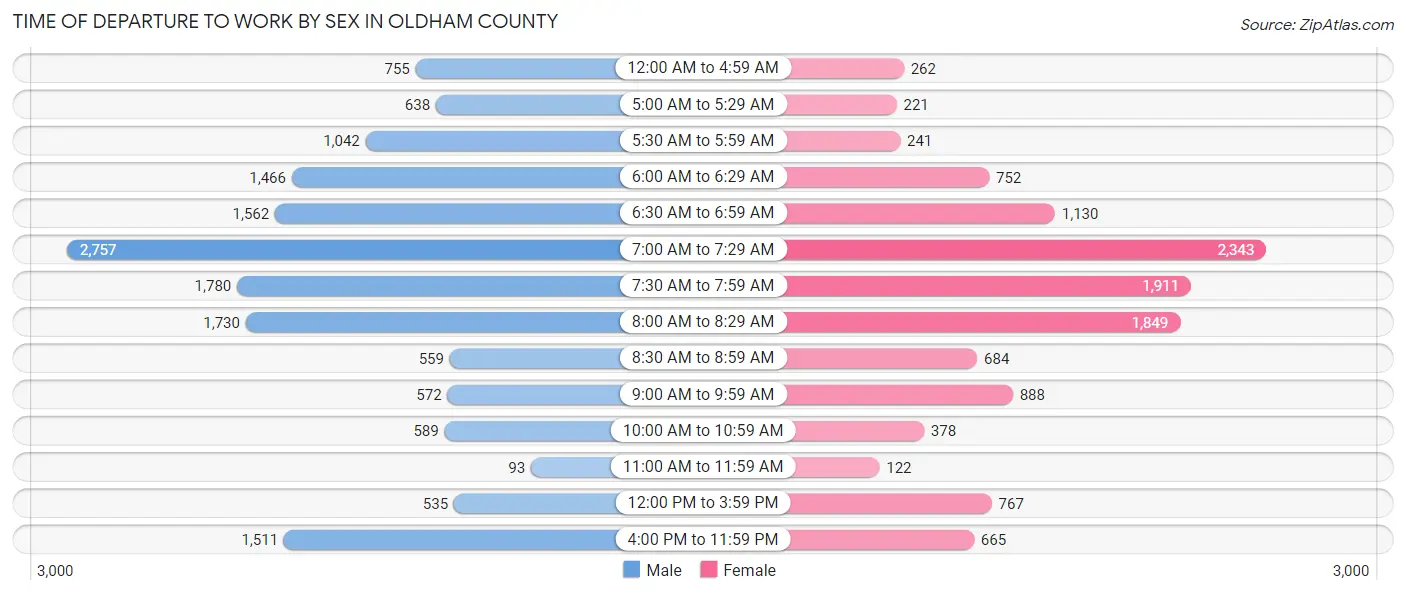
| Time of Departure | Male | Female |
| 12:00 AM to 4:59 AM | 755 (4.8%) | 262 (2.1%) |
| 5:00 AM to 5:29 AM | 638 (4.1%) | 221 (1.8%) |
| 5:30 AM to 5:59 AM | 1,042 (6.7%) | 241 (2.0%) |
| 6:00 AM to 6:29 AM | 1,466 (9.4%) | 752 (6.2%) |
| 6:30 AM to 6:59 AM | 1,562 (10.0%) | 1,130 (9.2%) |
| 7:00 AM to 7:29 AM | 2,757 (17.7%) | 2,343 (19.2%) |
| 7:30 AM to 7:59 AM | 1,780 (11.4%) | 1,911 (15.7%) |
| 8:00 AM to 8:29 AM | 1,730 (11.1%) | 1,849 (15.1%) |
| 8:30 AM to 8:59 AM | 559 (3.6%) | 684 (5.6%) |
| 9:00 AM to 9:59 AM | 572 (3.7%) | 888 (7.3%) |
| 10:00 AM to 10:59 AM | 589 (3.8%) | 378 (3.1%) |
| 11:00 AM to 11:59 AM | 93 (0.6%) | 122 (1.0%) |
| 12:00 PM to 3:59 PM | 535 (3.4%) | 767 (6.3%) |
| 4:00 PM to 11:59 PM | 1,511 (9.7%) | 665 (5.4%) |
| Total | 15,589 (100.0%) | 12,213 (100.0%) |
Housing Occupancy in Oldham County
Occupancy by Ownership in Oldham County
Of the total 22,128 dwellings in Oldham County, owner-occupied units account for 19,220 (86.9%), while renter-occupied units make up 2,908 (13.1%).
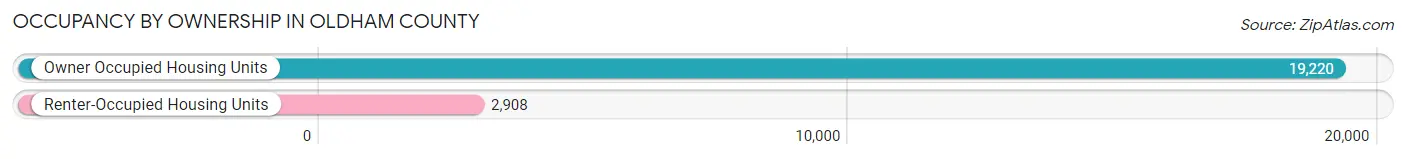
| Occupancy | # Housing Units | % Housing Units |
| Owner Occupied Housing Units | 19,220 | 86.9% |
| Renter-Occupied Housing Units | 2,908 | 13.1% |
| Total Occupied Housing Units | 22,128 | 100.0% |
Occupancy by Household Size in Oldham County
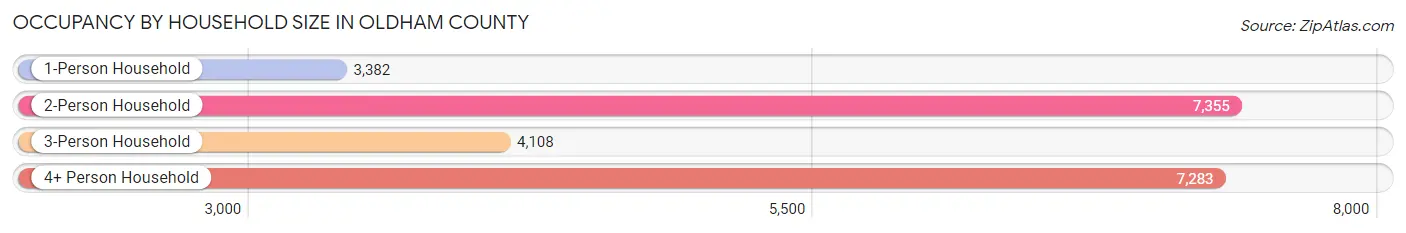
| Household Size | # Housing Units | % Housing Units |
| 1-Person Household | 3,382 | 15.3% |
| 2-Person Household | 7,355 | 33.2% |
| 3-Person Household | 4,108 | 18.6% |
| 4+ Person Household | 7,283 | 32.9% |
| Total Housing Units | 22,128 | 100.0% |
Occupancy by Ownership by Household Size in Oldham County
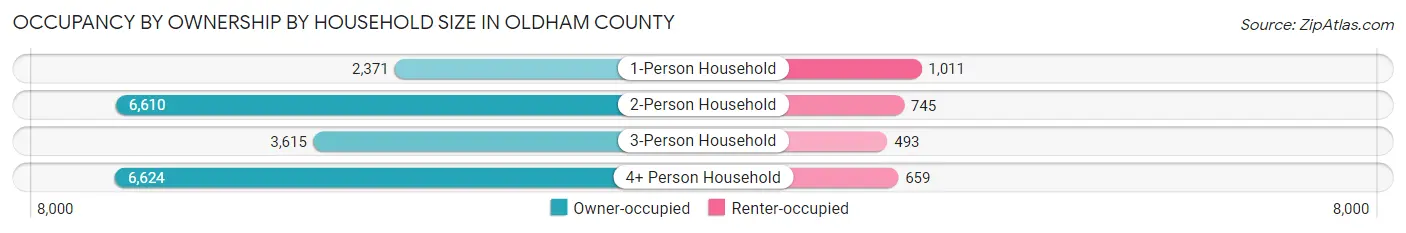
| Household Size | Owner-occupied | Renter-occupied |
| 1-Person Household | 2,371 (70.1%) | 1,011 (29.9%) |
| 2-Person Household | 6,610 (89.9%) | 745 (10.1%) |
| 3-Person Household | 3,615 (88.0%) | 493 (12.0%) |
| 4+ Person Household | 6,624 (90.9%) | 659 (9.0%) |
| Total Housing Units | 19,220 (86.9%) | 2,908 (13.1%) |
Occupancy by Educational Attainment in Oldham County
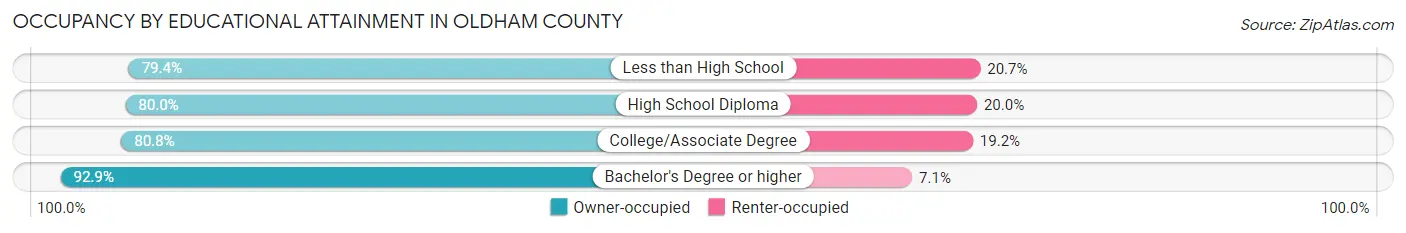
| Household Size | Owner-occupied | Renter-occupied |
| Less than High School | 565 (79.3%) | 147 (20.6%) |
| High School Diploma | 2,757 (80.0%) | 689 (20.0%) |
| College/Associate Degree | 5,293 (80.8%) | 1,256 (19.2%) |
| Bachelor's Degree or higher | 10,605 (92.9%) | 816 (7.1%) |
Occupancy by Age of Householder in Oldham County
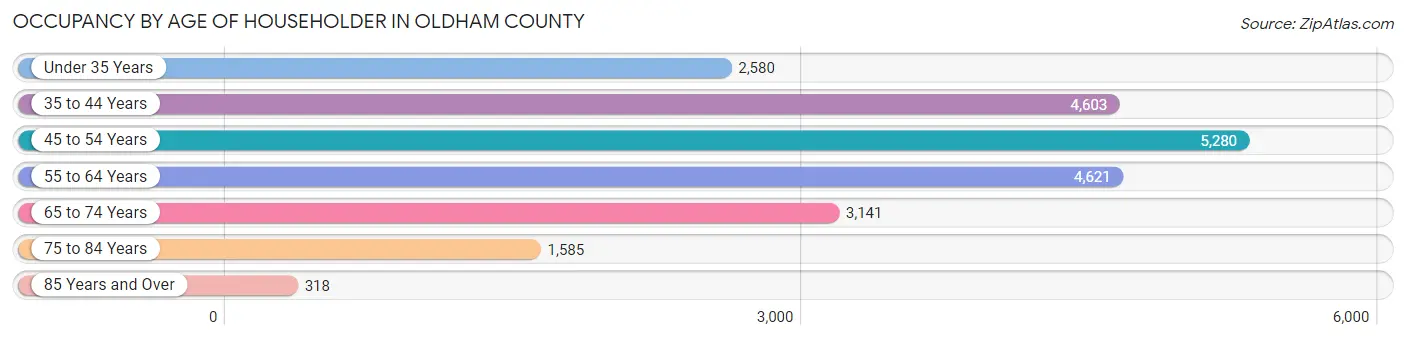
| Age Bracket | # Households | % Households |
| Under 35 Years | 2,580 | 11.7% |
| 35 to 44 Years | 4,603 | 20.8% |
| 45 to 54 Years | 5,280 | 23.9% |
| 55 to 64 Years | 4,621 | 20.9% |
| 65 to 74 Years | 3,141 | 14.2% |
| 75 to 84 Years | 1,585 | 7.2% |
| 85 Years and Over | 318 | 1.4% |
| Total | 22,128 | 100.0% |
Housing Finances in Oldham County
Median Income by Occupancy in Oldham County
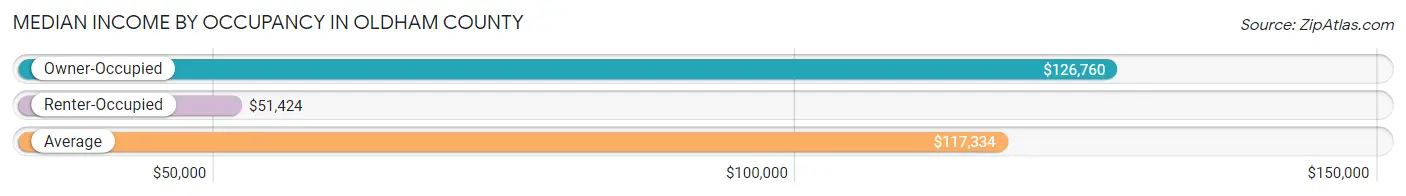
| Occupancy Type | # Households | Median Income |
| Owner-Occupied | 19,220 (86.9%) | $126,760 |
| Renter-Occupied | 2,908 (13.1%) | $51,424 |
| Average | 22,128 (100.0%) | $117,334 |
Occupancy by Householder Income Bracket in Oldham County
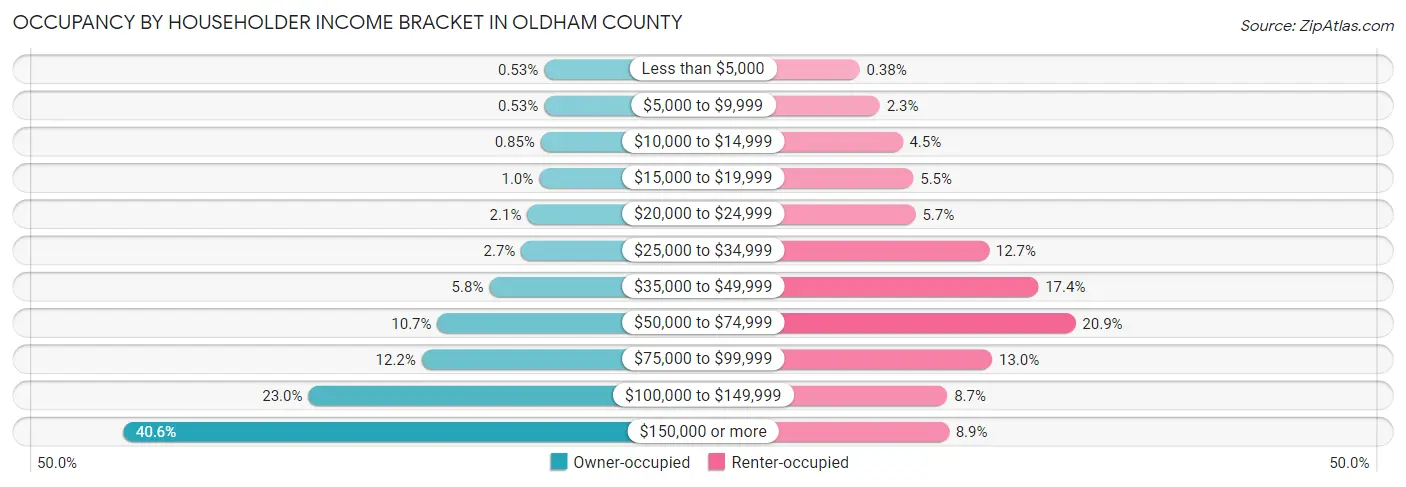
| Income Bracket | Owner-occupied | Renter-occupied |
| Less than $5,000 | 101 (0.5%) | 11 (0.4%) |
| $5,000 to $9,999 | 101 (0.5%) | 67 (2.3%) |
| $10,000 to $14,999 | 164 (0.9%) | 130 (4.5%) |
| $15,000 to $19,999 | 193 (1.0%) | 160 (5.5%) |
| $20,000 to $24,999 | 409 (2.1%) | 166 (5.7%) |
| $25,000 to $34,999 | 521 (2.7%) | 369 (12.7%) |
| $35,000 to $49,999 | 1,106 (5.8%) | 506 (17.4%) |
| $50,000 to $74,999 | 2,055 (10.7%) | 609 (20.9%) |
| $75,000 to $99,999 | 2,343 (12.2%) | 378 (13.0%) |
| $100,000 to $149,999 | 4,416 (23.0%) | 254 (8.7%) |
| $150,000 or more | 7,811 (40.6%) | 258 (8.9%) |
| Total | 19,220 (100.0%) | 2,908 (100.0%) |
Monthly Housing Cost Tiers in Oldham County
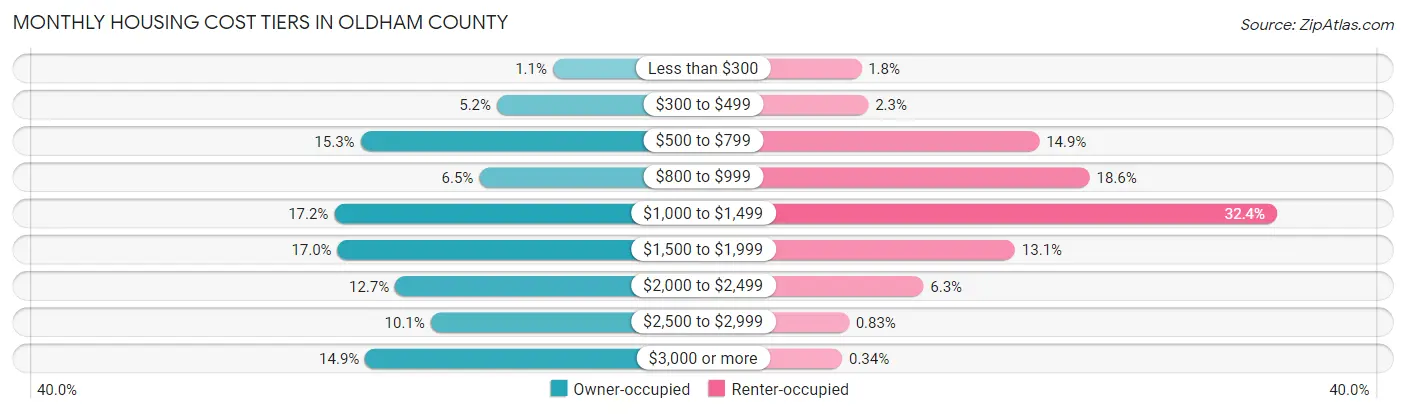
| Monthly Cost | Owner-occupied | Renter-occupied |
| Less than $300 | 211 (1.1%) | 51 (1.8%) |
| $300 to $499 | 1,003 (5.2%) | 66 (2.3%) |
| $500 to $799 | 2,935 (15.3%) | 432 (14.9%) |
| $800 to $999 | 1,254 (6.5%) | 540 (18.6%) |
| $1,000 to $1,499 | 3,305 (17.2%) | 941 (32.4%) |
| $1,500 to $1,999 | 3,259 (17.0%) | 380 (13.1%) |
| $2,000 to $2,499 | 2,444 (12.7%) | 184 (6.3%) |
| $2,500 to $2,999 | 1,941 (10.1%) | 24 (0.8%) |
| $3,000 or more | 2,868 (14.9%) | 10 (0.3%) |
| Total | 19,220 (100.0%) | 2,908 (100.0%) |
Physical Housing Characteristics in Oldham County
Housing Structures in Oldham County
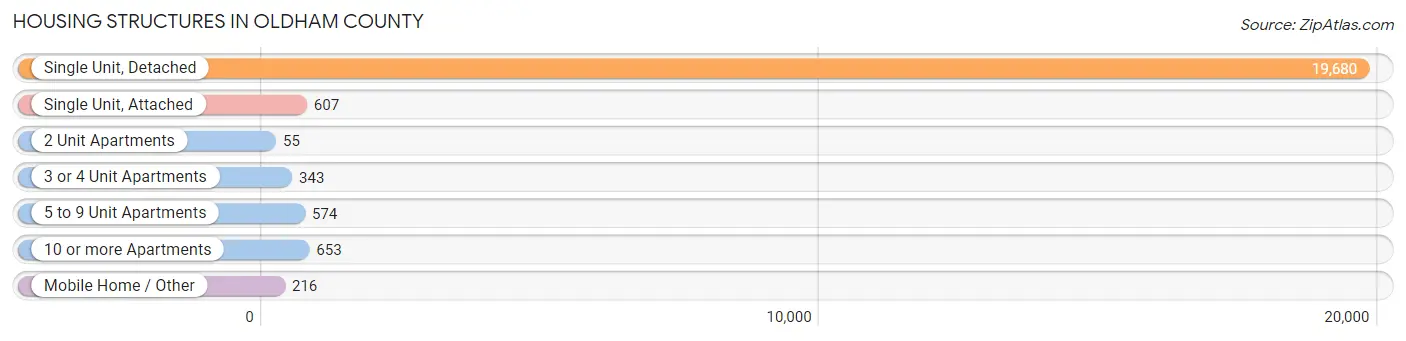
| Structure Type | # Housing Units | % Housing Units |
| Single Unit, Detached | 19,680 | 88.9% |
| Single Unit, Attached | 607 | 2.7% |
| 2 Unit Apartments | 55 | 0.3% |
| 3 or 4 Unit Apartments | 343 | 1.5% |
| 5 to 9 Unit Apartments | 574 | 2.6% |
| 10 or more Apartments | 653 | 2.9% |
| Mobile Home / Other | 216 | 1.0% |
| Total | 22,128 | 100.0% |
Housing Structures by Occupancy in Oldham County
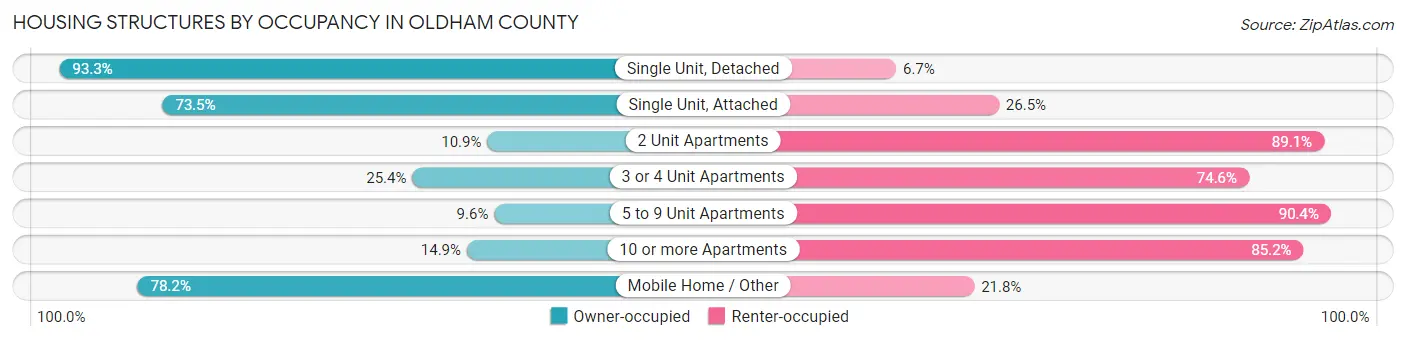
| Structure Type | Owner-occupied | Renter-occupied |
| Single Unit, Detached | 18,360 (93.3%) | 1,320 (6.7%) |
| Single Unit, Attached | 446 (73.5%) | 161 (26.5%) |
| 2 Unit Apartments | 6 (10.9%) | 49 (89.1%) |
| 3 or 4 Unit Apartments | 87 (25.4%) | 256 (74.6%) |
| 5 to 9 Unit Apartments | 55 (9.6%) | 519 (90.4%) |
| 10 or more Apartments | 97 (14.8%) | 556 (85.2%) |
| Mobile Home / Other | 169 (78.2%) | 47 (21.8%) |
| Total | 19,220 (86.9%) | 2,908 (13.1%) |
Housing Structures by Number of Rooms in Oldham County
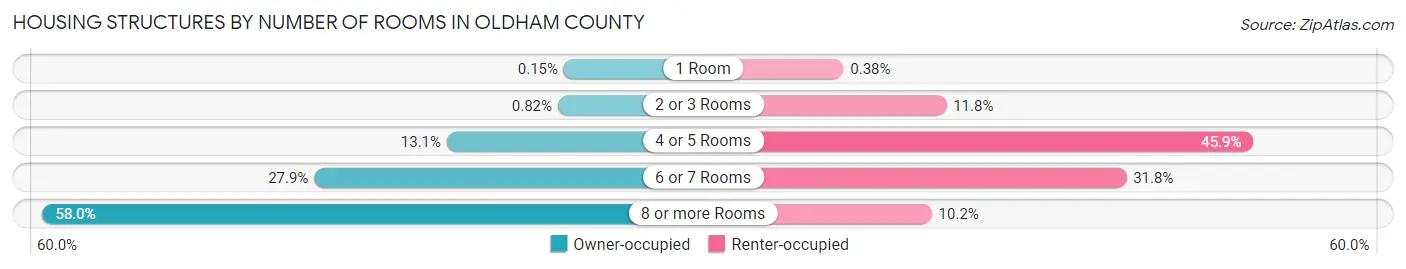
| Number of Rooms | Owner-occupied | Renter-occupied |
| 1 Room | 29 (0.2%) | 11 (0.4%) |
| 2 or 3 Rooms | 158 (0.8%) | 343 (11.8%) |
| 4 or 5 Rooms | 2,525 (13.1%) | 1,334 (45.9%) |
| 6 or 7 Rooms | 5,354 (27.9%) | 924 (31.8%) |
| 8 or more Rooms | 11,154 (58.0%) | 296 (10.2%) |
| Total | 19,220 (100.0%) | 2,908 (100.0%) |
Housing Structure by Heating Type in Oldham County
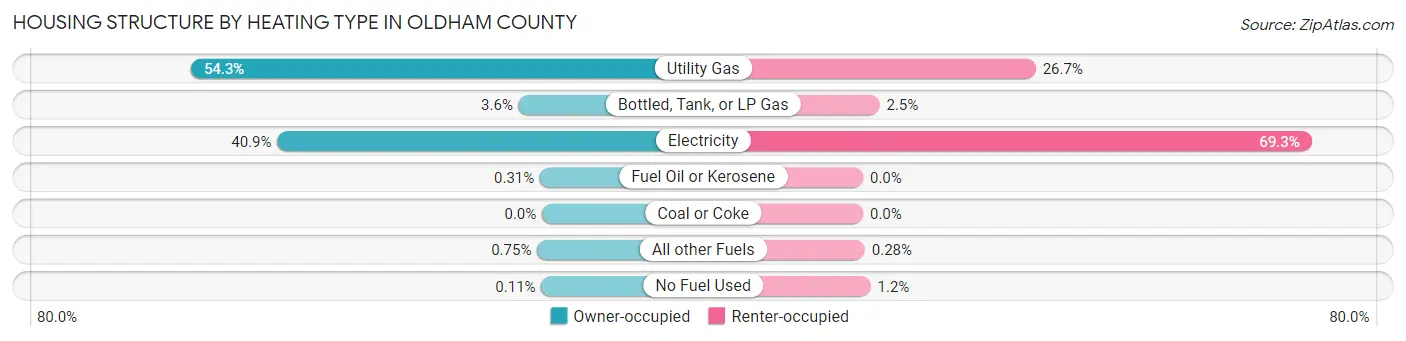
| Heating Type | Owner-occupied | Renter-occupied |
| Utility Gas | 10,432 (54.3%) | 776 (26.7%) |
| Bottled, Tank, or LP Gas | 693 (3.6%) | 74 (2.5%) |
| Electricity | 7,869 (40.9%) | 2,016 (69.3%) |
| Fuel Oil or Kerosene | 60 (0.3%) | 0 (0.0%) |
| Coal or Coke | 0 (0.0%) | 0 (0.0%) |
| All other Fuels | 144 (0.7%) | 8 (0.3%) |
| No Fuel Used | 22 (0.1%) | 34 (1.2%) |
| Total | 19,220 (100.0%) | 2,908 (100.0%) |
Household Vehicle Usage in Oldham County
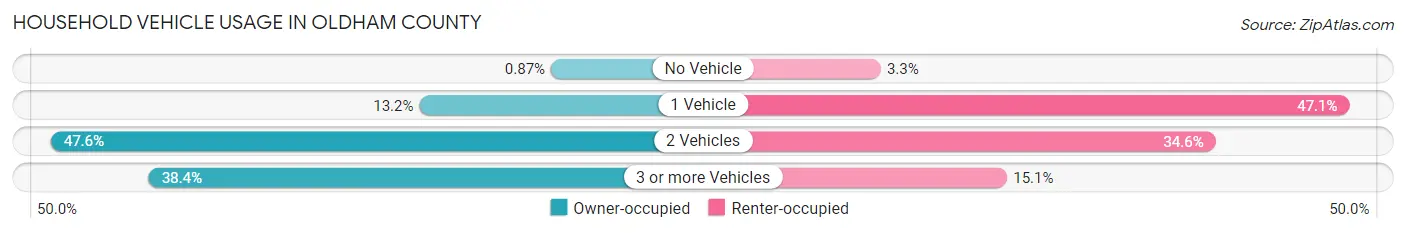
| Vehicles per Household | Owner-occupied | Renter-occupied |
| No Vehicle | 167 (0.9%) | 95 (3.3%) |
| 1 Vehicle | 2,530 (13.2%) | 1,369 (47.1%) |
| 2 Vehicles | 9,140 (47.5%) | 1,006 (34.6%) |
| 3 or more Vehicles | 7,383 (38.4%) | 438 (15.1%) |
| Total | 19,220 (100.0%) | 2,908 (100.0%) |
Real Estate & Mortgages in Oldham County
Real Estate and Mortgage Overview in Oldham County
| Characteristic | Without Mortgage | With Mortgage |
| Housing Units | 5,540 | 13,680 |
| Median Property Value | $336,600 | $364,500 |
| Median Household Income | $92,500 | $6,350 |
| Monthly Housing Costs | $675 | $2,868 |
| Real Estate Taxes | $2,945 | $77 |
Property Value by Mortgage Status in Oldham County
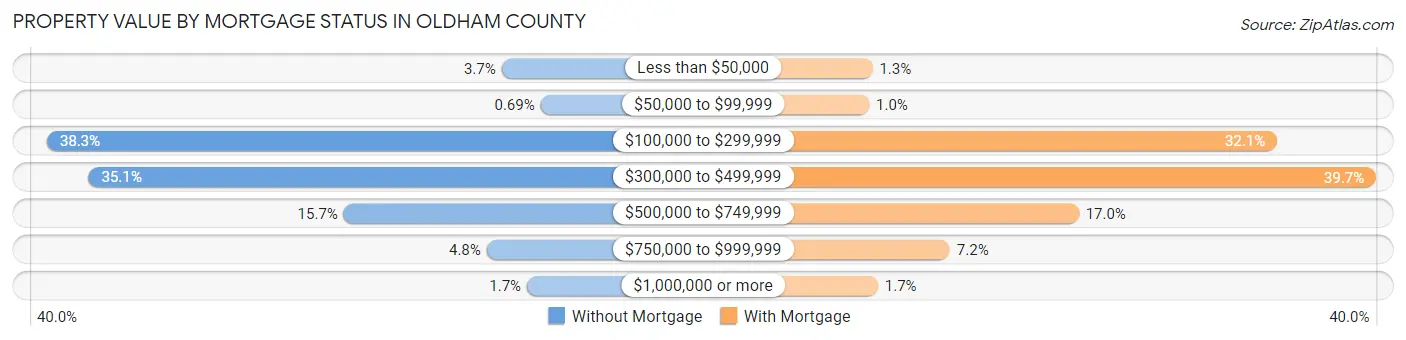
| Property Value | Without Mortgage | With Mortgage |
| Less than $50,000 | 203 (3.7%) | 177 (1.3%) |
| $50,000 to $99,999 | 38 (0.7%) | 141 (1.0%) |
| $100,000 to $299,999 | 2,122 (38.3%) | 4,394 (32.1%) |
| $300,000 to $499,999 | 1,946 (35.1%) | 5,426 (39.7%) |
| $500,000 to $749,999 | 869 (15.7%) | 2,326 (17.0%) |
| $750,000 to $999,999 | 266 (4.8%) | 983 (7.2%) |
| $1,000,000 or more | 96 (1.7%) | 233 (1.7%) |
| Total | 5,540 (100.0%) | 13,680 (100.0%) |
Household Income by Mortgage Status in Oldham County
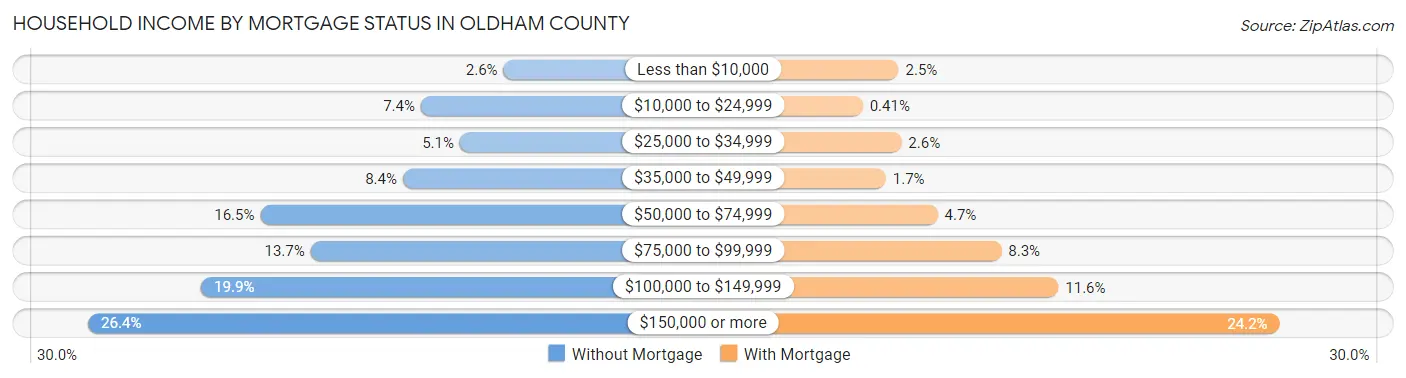
| Household Income | Without Mortgage | With Mortgage |
| Less than $10,000 | 146 (2.6%) | 337 (2.5%) |
| $10,000 to $24,999 | 408 (7.4%) | 56 (0.4%) |
| $25,000 to $34,999 | 284 (5.1%) | 358 (2.6%) |
| $35,000 to $49,999 | 465 (8.4%) | 237 (1.7%) |
| $50,000 to $74,999 | 916 (16.5%) | 641 (4.7%) |
| $75,000 to $99,999 | 757 (13.7%) | 1,139 (8.3%) |
| $100,000 to $149,999 | 1,103 (19.9%) | 1,586 (11.6%) |
| $150,000 or more | 1,461 (26.4%) | 3,313 (24.2%) |
| Total | 5,540 (100.0%) | 13,680 (100.0%) |
Property Value to Household Income Ratio in Oldham County
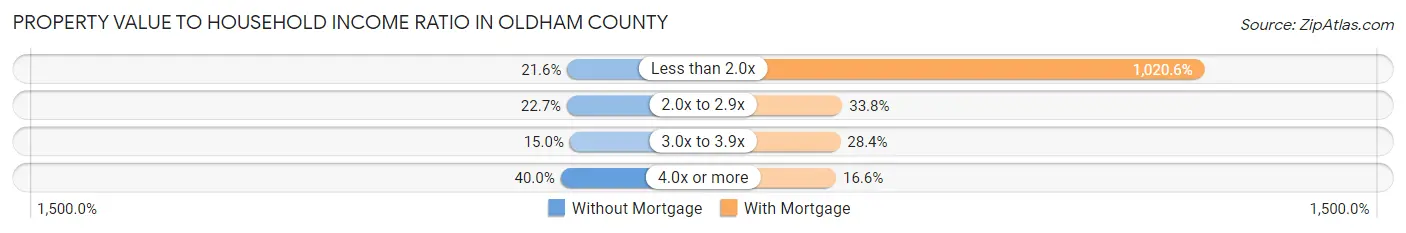
| Value-to-Income Ratio | Without Mortgage | With Mortgage |
| Less than 2.0x | 1,196 (21.6%) | 139,618 (1,020.6%) |
| 2.0x to 2.9x | 1,255 (22.7%) | 4,619 (33.8%) |
| 3.0x to 3.9x | 831 (15.0%) | 3,883 (28.4%) |
| 4.0x or more | 2,218 (40.0%) | 2,275 (16.6%) |
| Total | 5,540 (100.0%) | 13,680 (100.0%) |
Real Estate Taxes by Mortgage Status in Oldham County
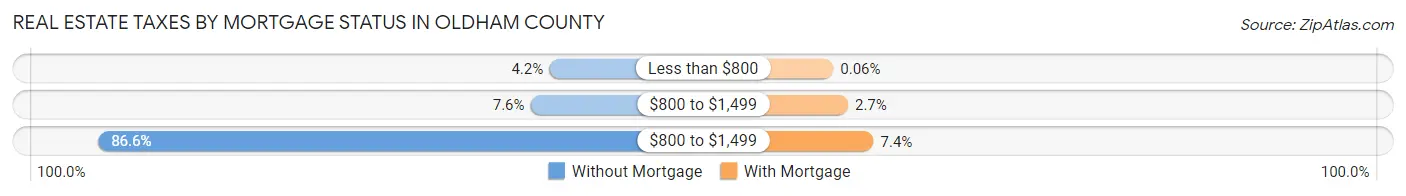
| Property Taxes | Without Mortgage | With Mortgage |
| Less than $800 | 233 (4.2%) | 8 (0.1%) |
| $800 to $1,499 | 422 (7.6%) | 375 (2.7%) |
| $800 to $1,499 | 4,795 (86.6%) | 1,013 (7.4%) |
| Total | 5,540 (100.0%) | 13,680 (100.0%) |
Health & Disability in Oldham County
Health Insurance Coverage by Age in Oldham County
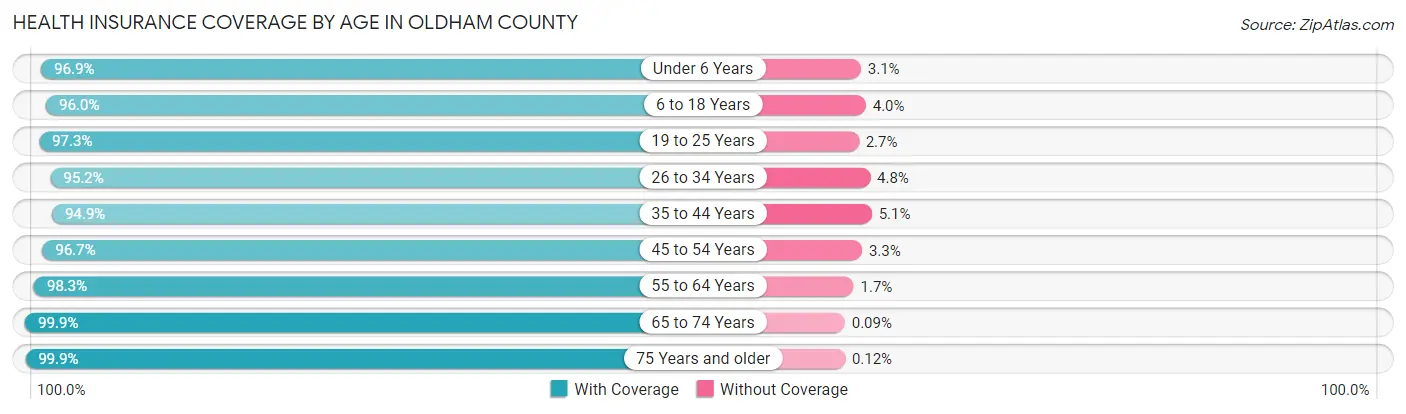
| Age Bracket | With Coverage | Without Coverage |
| Under 6 Years | 3,988 (96.9%) | 127 (3.1%) |
| 6 to 18 Years | 13,458 (96.0%) | 562 (4.0%) |
| 19 to 25 Years | 5,098 (97.3%) | 141 (2.7%) |
| 26 to 34 Years | 5,005 (95.2%) | 253 (4.8%) |
| 35 to 44 Years | 8,425 (94.9%) | 454 (5.1%) |
| 45 to 54 Years | 9,365 (96.7%) | 320 (3.3%) |
| 55 to 64 Years | 8,043 (98.3%) | 142 (1.7%) |
| 65 to 74 Years | 5,678 (99.9%) | 5 (0.1%) |
| 75 Years and older | 3,200 (99.9%) | 4 (0.1%) |
| Total | 62,260 (96.9%) | 2,008 (3.1%) |
Health Insurance Coverage by Citizenship Status in Oldham County
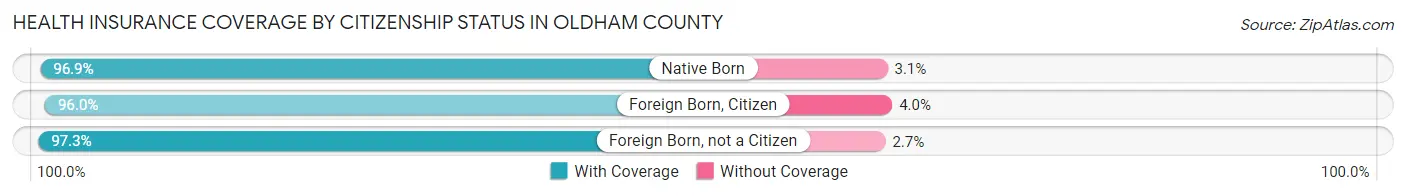
| Citizenship Status | With Coverage | Without Coverage |
| Native Born | 3,988 (96.9%) | 127 (3.1%) |
| Foreign Born, Citizen | 13,458 (96.0%) | 562 (4.0%) |
| Foreign Born, not a Citizen | 5,098 (97.3%) | 141 (2.7%) |
Health Insurance Coverage by Household Income in Oldham County
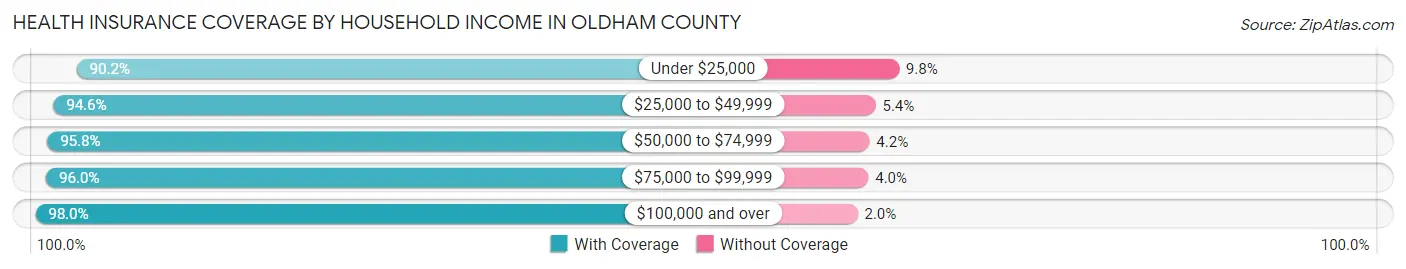
| Household Income | With Coverage | Without Coverage |
| Under $25,000 | 2,802 (90.2%) | 303 (9.8%) |
| $25,000 to $49,999 | 4,259 (94.6%) | 242 (5.4%) |
| $50,000 to $74,999 | 6,118 (95.8%) | 271 (4.2%) |
| $75,000 to $99,999 | 7,452 (96.0%) | 313 (4.0%) |
| $100,000 and over | 41,583 (98.0%) | 852 (2.0%) |
Public vs Private Health Insurance Coverage by Age in Oldham County
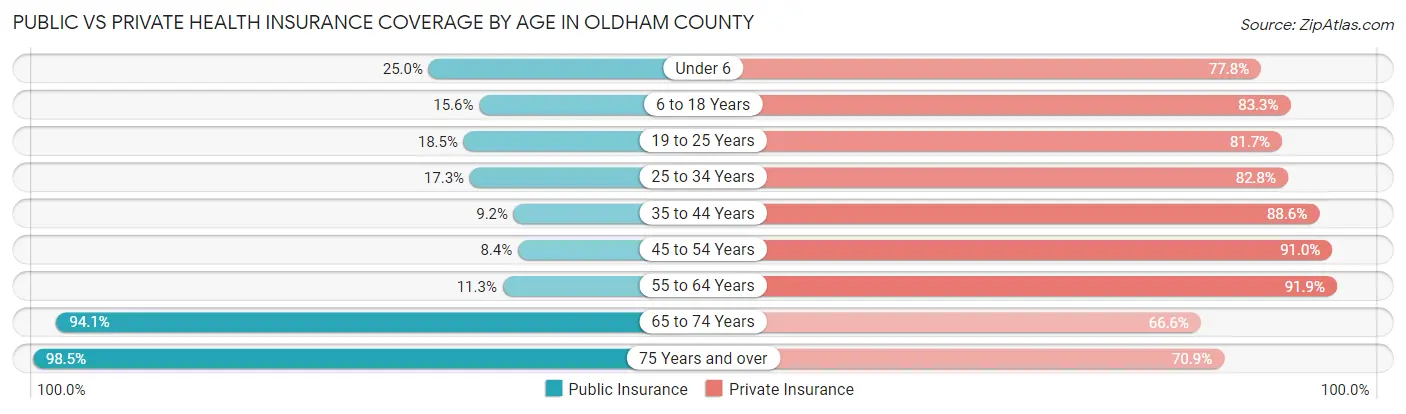
| Age Bracket | Public Insurance | Private Insurance |
| Under 6 | 1,028 (25.0%) | 3,202 (77.8%) |
| 6 to 18 Years | 2,187 (15.6%) | 11,671 (83.3%) |
| 19 to 25 Years | 968 (18.5%) | 4,280 (81.7%) |
| 25 to 34 Years | 912 (17.3%) | 4,352 (82.8%) |
| 35 to 44 Years | 816 (9.2%) | 7,866 (88.6%) |
| 45 to 54 Years | 814 (8.4%) | 8,815 (91.0%) |
| 55 to 64 Years | 921 (11.3%) | 7,519 (91.9%) |
| 65 to 74 Years | 5,347 (94.1%) | 3,787 (66.6%) |
| 75 Years and over | 3,155 (98.5%) | 2,273 (70.9%) |
| Total | 16,148 (25.1%) | 53,765 (83.7%) |
Disability Status by Sex by Age in Oldham County
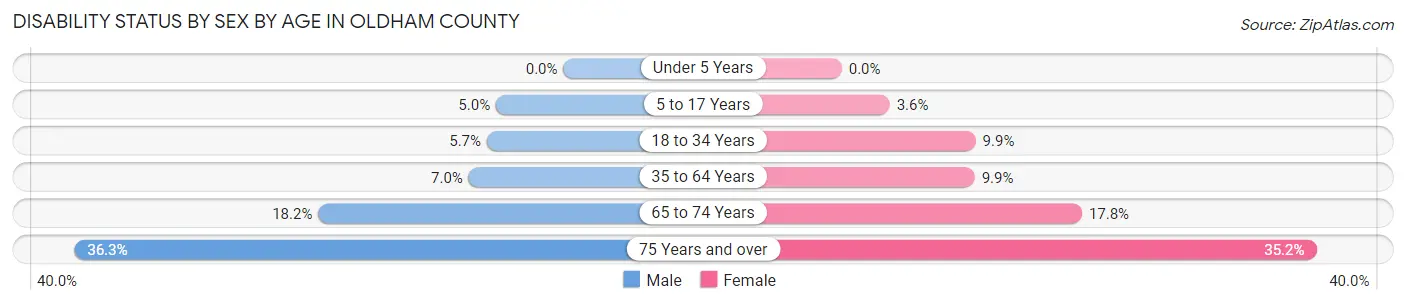
| Age Bracket | Male | Female |
| Under 5 Years | 0 (0.0%) | 0 (0.0%) |
| 5 to 17 Years | 351 (5.0%) | 242 (3.6%) |
| 18 to 34 Years | 341 (5.7%) | 545 (9.9%) |
| 35 to 64 Years | 938 (7.0%) | 1,324 (9.9%) |
| 65 to 74 Years | 490 (18.2%) | 533 (17.8%) |
| 75 Years and over | 512 (36.3%) | 632 (35.2%) |
Disability Class by Sex by Age in Oldham County
Disability Class: Hearing Difficulty
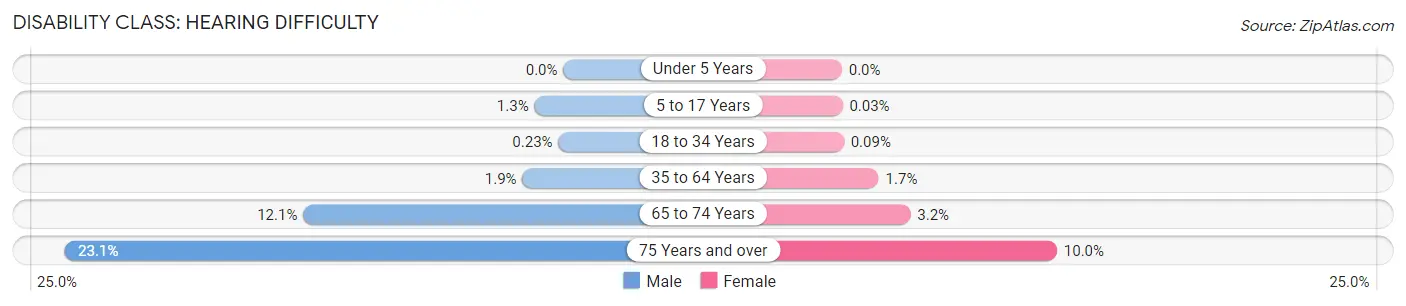
| Age Bracket | Male | Female |
| Under 5 Years | 0 (0.0%) | 0 (0.0%) |
| 5 to 17 Years | 94 (1.3%) | 2 (0.0%) |
| 18 to 34 Years | 14 (0.2%) | 5 (0.1%) |
| 35 to 64 Years | 253 (1.9%) | 229 (1.7%) |
| 65 to 74 Years | 325 (12.1%) | 95 (3.2%) |
| 75 Years and over | 326 (23.1%) | 179 (10.0%) |
Disability Class: Vision Difficulty
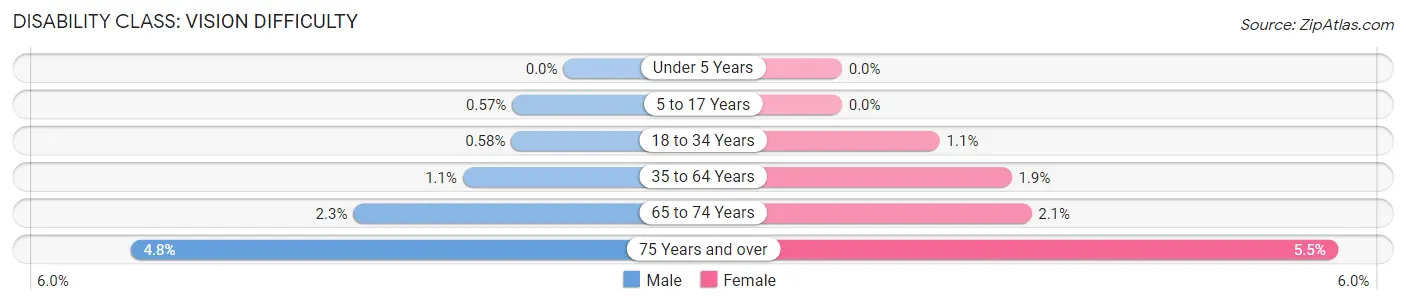
| Age Bracket | Male | Female |
| Under 5 Years | 0 (0.0%) | 0 (0.0%) |
| 5 to 17 Years | 40 (0.6%) | 0 (0.0%) |
| 18 to 34 Years | 35 (0.6%) | 60 (1.1%) |
| 35 to 64 Years | 150 (1.1%) | 253 (1.9%) |
| 65 to 74 Years | 63 (2.3%) | 63 (2.1%) |
| 75 Years and over | 68 (4.8%) | 99 (5.5%) |
Disability Class: Cognitive Difficulty
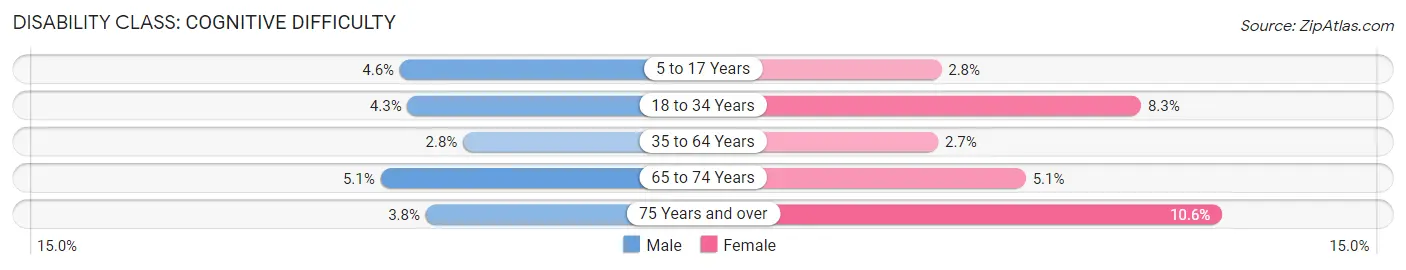
| Age Bracket | Male | Female |
| 5 to 17 Years | 319 (4.5%) | 188 (2.8%) |
| 18 to 34 Years | 261 (4.3%) | 457 (8.3%) |
| 35 to 64 Years | 372 (2.8%) | 360 (2.7%) |
| 65 to 74 Years | 137 (5.1%) | 153 (5.1%) |
| 75 Years and over | 54 (3.8%) | 190 (10.6%) |
Disability Class: Ambulatory Difficulty
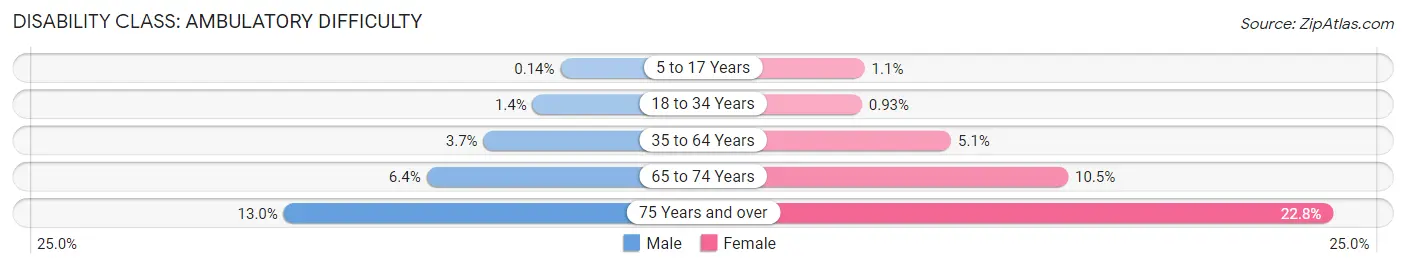
| Age Bracket | Male | Female |
| 5 to 17 Years | 10 (0.1%) | 72 (1.1%) |
| 18 to 34 Years | 86 (1.4%) | 51 (0.9%) |
| 35 to 64 Years | 495 (3.7%) | 680 (5.1%) |
| 65 to 74 Years | 171 (6.4%) | 314 (10.5%) |
| 75 Years and over | 183 (13.0%) | 409 (22.8%) |
Disability Class: Self-Care Difficulty
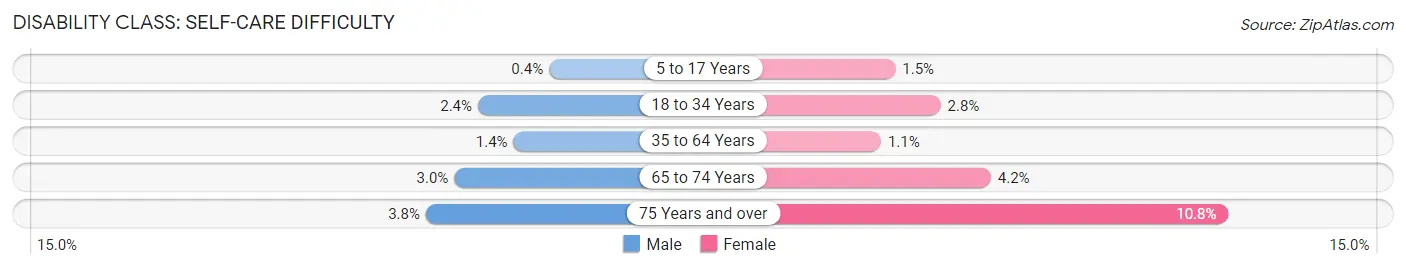
| Age Bracket | Male | Female |
| 5 to 17 Years | 28 (0.4%) | 101 (1.5%) |
| 18 to 34 Years | 143 (2.4%) | 151 (2.8%) |
| 35 to 64 Years | 186 (1.4%) | 146 (1.1%) |
| 65 to 74 Years | 82 (3.0%) | 124 (4.2%) |
| 75 Years and over | 54 (3.8%) | 193 (10.8%) |
Technology Access in Oldham County
Computing Device Access in Oldham County
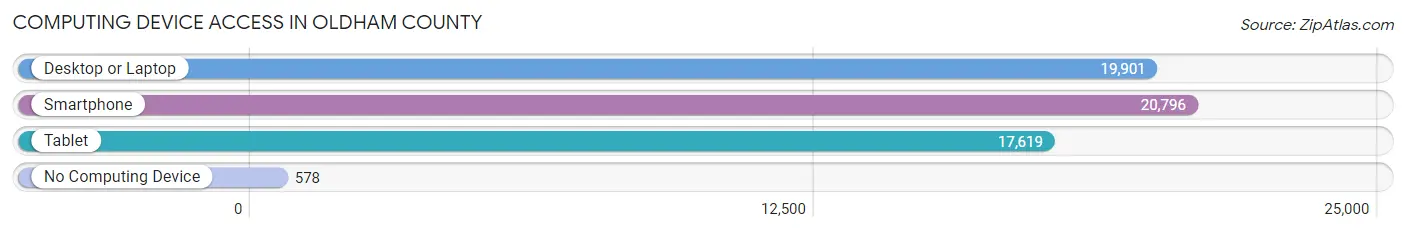
| Device Type | # Households | % Households |
| Desktop or Laptop | 19,901 | 89.9% |
| Smartphone | 20,796 | 94.0% |
| Tablet | 17,619 | 79.6% |
| No Computing Device | 578 | 2.6% |
| Total | 22,128 | 100.0% |
Internet Access in Oldham County
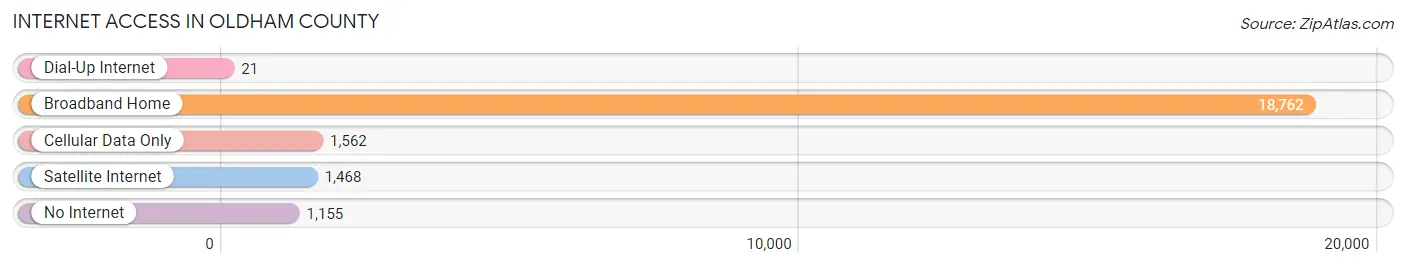
| Internet Type | # Households | % Households |
| Dial-Up Internet | 21 | 0.1% |
| Broadband Home | 18,762 | 84.8% |
| Cellular Data Only | 1,562 | 7.1% |
| Satellite Internet | 1,468 | 6.6% |
| No Internet | 1,155 | 5.2% |
| Total | 22,128 | 100.0% |
Oldham County Summary
Oldham County, Kentucky is located in the north-central part of the state, just south of Louisville. It is bordered by Jefferson County to the north, Shelby County to the east, Henry County to the south, and Trimble County to the west. The county seat is La Grange, and the county is named for Colonel William Oldham, a Revolutionary War veteran.
History
Oldham County was formed in 1824 from parts of Henry, Jefferson, and Shelby counties. It was named for Colonel William Oldham, a Revolutionary War veteran who was killed in the Battle of Blue Licks in 1782. The county was originally part of the original Fincastle County, Virginia, which was formed in 1776.
The first settlers in Oldham County were mostly of English and Scottish descent. They were attracted to the area by its fertile soil and abundant wildlife. The first county seat was located in Westport, but it was moved to La Grange in 1827.
The county was a major center of the Underground Railroad, with many of the county's residents helping to hide and transport escaped slaves. The county was also home to several prominent abolitionists, including the Reverend John G. Fee, who founded Berea College in 1855.
Geography
Oldham County is located in the north-central part of Kentucky, just south of Louisville. It is bordered by Jefferson County to the north, Shelby County to the east, Henry County to the south, and Trimble County to the west. The county has a total area of 437 square miles, of which 434 square miles is land and 3 square miles is water.
The county is mostly flat, with some rolling hills in the northern and western parts. The highest point in the county is located in the northwest corner, at an elevation of 890 feet. The county is drained by the Ohio River, which forms its northern border.
Economy
Oldham County has a diverse economy, with a mix of manufacturing, agriculture, and services. The county is home to several large employers, including the Ford Motor Company, which has a plant in La Grange, and the Brown-Forman Corporation, which has a distillery in Louisville.
Agriculture is also an important part of the county's economy. The county is home to several large farms, which produce corn, soybeans, wheat, hay, and other crops. Livestock production is also important, with cattle, hogs, and poultry being raised in the county.
Demographics
As of the 2010 census, Oldham County had a population of 60,316. The population was spread out, with 24.3% under the age of 18, 8.2% from 18 to 24, 28.2% from 25 to 44, 25.2% from 45 to 64, and 14.1% who were 65 years of age or older. The median age was 38.4 years.
The racial makeup of the county was 94.2% White, 2.7% African American, 0.3% Native American, 1.2% Asian, 0.1% Pacific Islander, 0.7% from other races, and 0.9% from two or more races. Hispanic or Latino of any race were 2.2% of the population.
The median income for a household in the county was $68,945, and the median income for a family was $80,945. The per capita income for the county was $33,945. About 4.2% of families and 5.7% of the population were below the poverty line, including 6.7% of those under age 18 and 5.2% of those age 65 or over.
Common Questions
What is the Total Population of Oldham County?
Total Population of Oldham County is 67,997.
What is the Total Male Population of Oldham County?
Total Male Population of Oldham County is 35,607.
What is the Total Female Population of Oldham County?
Total Female Population of Oldham County is 32,390.
What is the Ratio of Males per 100 Females in Oldham County?
There are 109.93 Males per 100 Females in Oldham County.
What is the Ratio of Females per 100 Males in Oldham County?
There are 90.97 Females per 100 Males in Oldham County.
What is the Median Population Age in Oldham County?
Median Population Age in Oldham County is 39.5 Years.
What is the Average Family Size in Oldham County
Average Family Size in Oldham County is 3.2 People.
What is the Average Household Size in Oldham County
Average Household Size in Oldham County is 2.9 People.
What is Per Capita Income in Oldham County?
Per Capita income in Oldham County is $50,534.
What is the Median Family Income in Oldham County?
Median Family Income in Oldham County is $131,807.
What is the Median Household income in Oldham County?
Median Household Income in Oldham County is $117,334.
What is Income or Wage Gap in Oldham County?
Income or Wage Gap in Oldham County is 39.0%.
Women in Oldham County earn 61.0 cents for every dollar earned by a man.
What is Inequality or Gini Index in Oldham County?
Inequality or Gini Index in Oldham County is 0.44.
How Large is the Labor Force in Oldham County?
There are 34,182 People in the Labor Forcein in Oldham County.
What is the Percentage of People in the Labor Force in Oldham County?
64.7% of People are in the Labor Force in Oldham County.
What is the Unemployment Rate in Oldham County?
Unemployment Rate in Oldham County is 3.9%.