McCracken County, KY
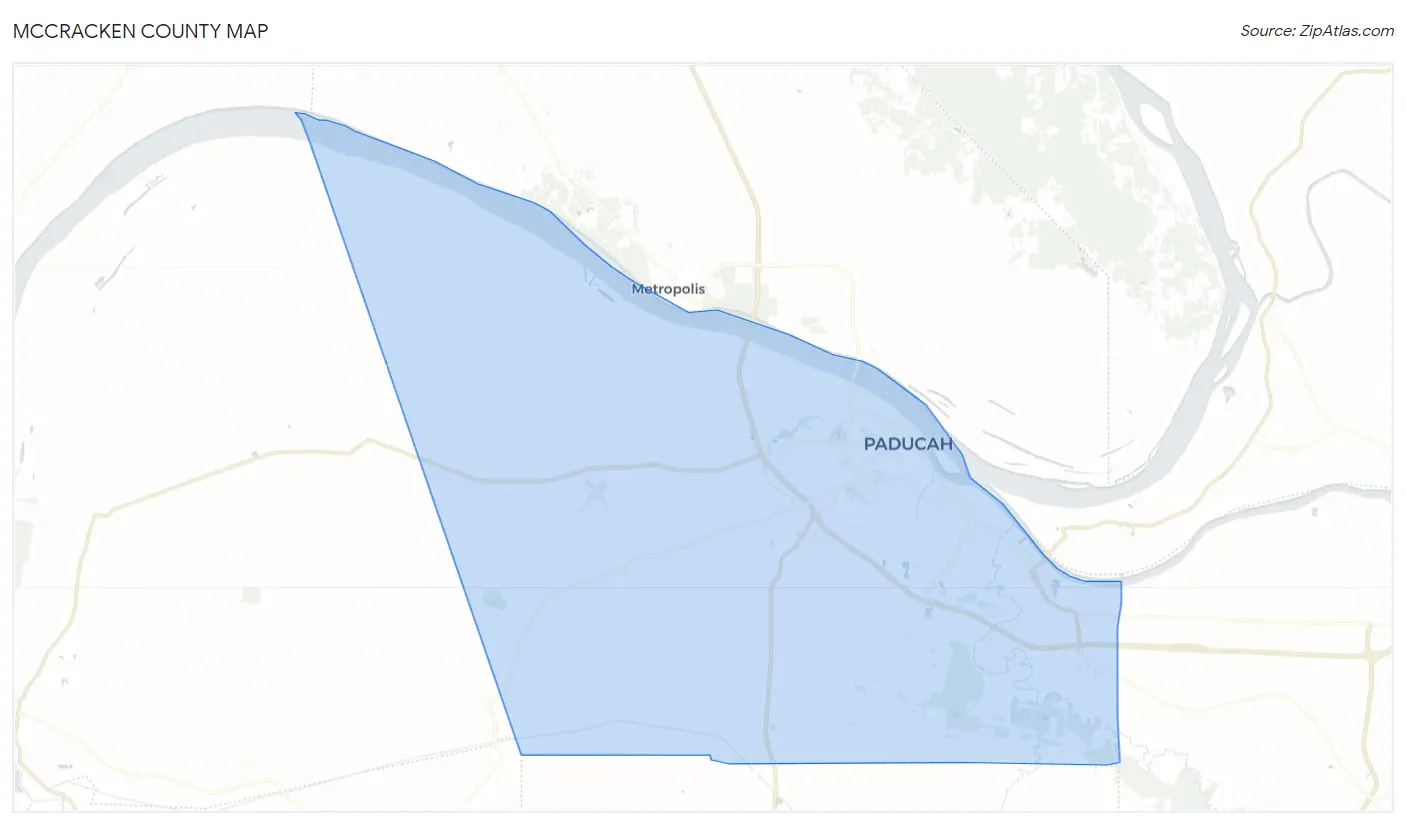
McCracken County Map
McCracken County Overview
67,573
TOTAL POPULATION
32,855
MALE POPULATION
34,718
FEMALE POPULATION
94.63
MALES / 100 FEMALES
105.67
FEMALES / 100 MALES
42.5
MEDIAN AGE
3.1
AVG FAMILY SIZE
2.5
AVG HOUSEHOLD SIZE
$36,401
PER CAPITA INCOME
$76,931
AVG FAMILY INCOME
$58,490
AVG HOUSEHOLD INCOME
35.5%
WAGE / INCOME GAP [ % ]
64.5¢/ $1
WAGE / INCOME GAP [ $ ]
$12,657
FAMILY INCOME DEFICIT
0.51
INEQUALITY / GINI INDEX
31,064
LABOR FORCE [ PEOPLE ]
57.0%
PERCENT IN LABOR FORCE
3.6%
UNEMPLOYMENT RATE
McCracken County Area Codes
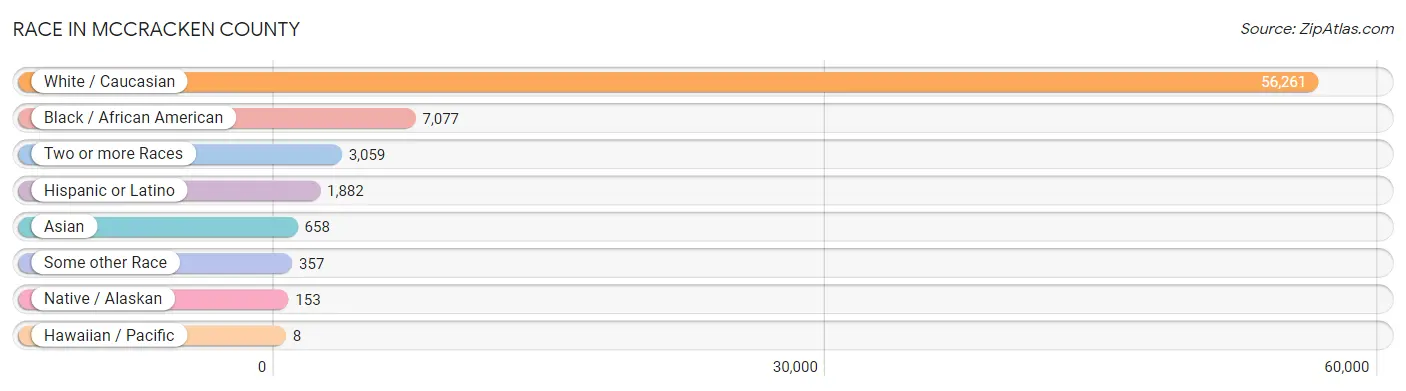
Race in McCracken County
The most populous races in McCracken County are White / Caucasian (56,261 | 83.3%), Black / African American (7,077 | 10.5%), and Two or more Races (3,059 | 4.5%).
| Race | # Population | % Population |
| Asian | 658 | 1.0% |
| Black / African American | 7,077 | 10.5% |
| Hawaiian / Pacific | 8 | 0.0% |
| Hispanic or Latino | 1,882 | 2.8% |
| Native / Alaskan | 153 | 0.2% |
| White / Caucasian | 56,261 | 83.3% |
| Two or more Races | 3,059 | 4.5% |
| Some other Race | 357 | 0.5% |
| Total | 67,573 | 100.0% |
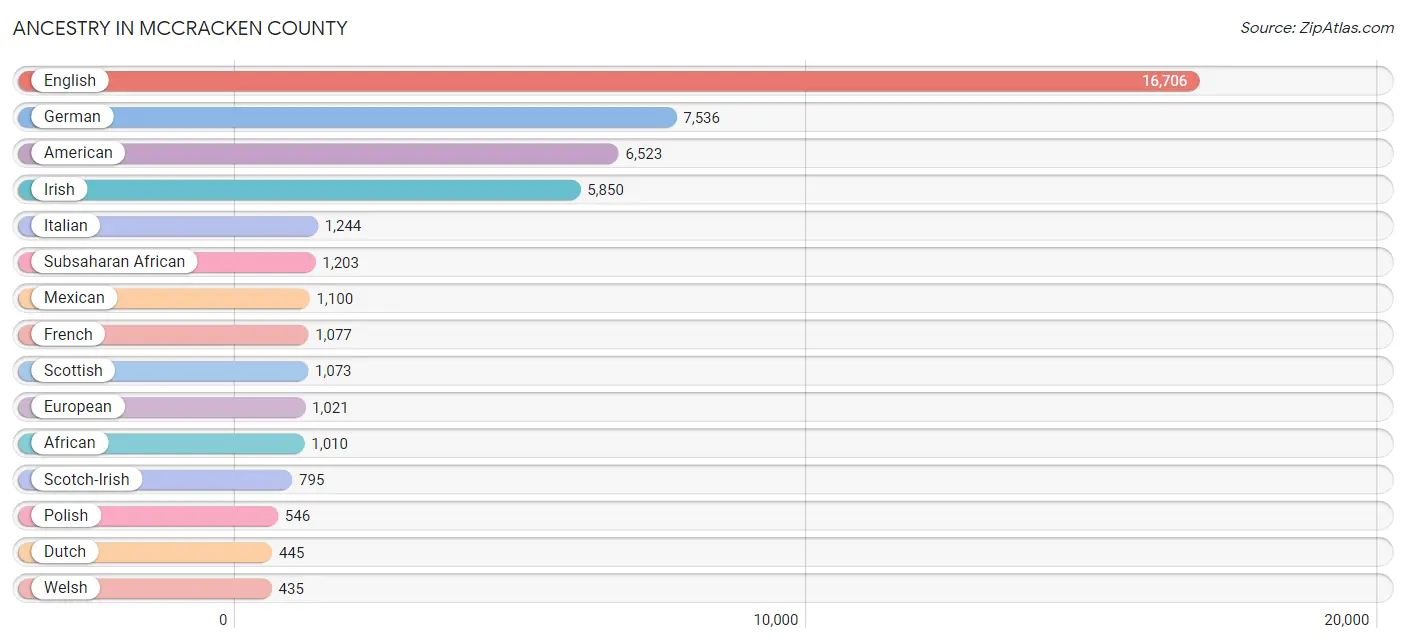
Ancestry in McCracken County
The most populous ancestries reported in McCracken County are English (16,706 | 24.7%), German (7,536 | 11.2%), American (6,523 | 9.7%), Irish (5,850 | 8.7%), and Italian (1,244 | 1.8%), together accounting for 56.0% of all McCracken County residents.
| Ancestry | # Population | % Population |
| African | 1,010 | 1.5% |
| Alaska Native | 4 | 0.0% |
| Alsatian | 17 | 0.0% |
| American | 6,523 | 9.7% |
| Arab | 72 | 0.1% |
| Argentinean | 55 | 0.1% |
| Armenian | 8 | 0.0% |
| Australian | 11 | 0.0% |
| Austrian | 123 | 0.2% |
| Belgian | 14 | 0.0% |
| Bhutanese | 110 | 0.2% |
| Blackfeet | 67 | 0.1% |
| British | 212 | 0.3% |
| Burmese | 72 | 0.1% |
| Canadian | 134 | 0.2% |
| Central American | 136 | 0.2% |
| Cherokee | 404 | 0.6% |
| Chickasaw | 33 | 0.1% |
| Chinese | 33 | 0.1% |
| Choctaw | 21 | 0.0% |
| Colombian | 43 | 0.1% |
| Creek | 17 | 0.0% |
| Croatian | 52 | 0.1% |
| Cuban | 30 | 0.0% |
| Czech | 58 | 0.1% |
| Czechoslovakian | 22 | 0.0% |
| Danish | 48 | 0.1% |
| Dominican | 13 | 0.0% |
| Dutch | 445 | 0.7% |
| Eastern European | 27 | 0.0% |
| English | 16,706 | 24.7% |
| Ethiopian | 168 | 0.3% |
| European | 1,021 | 1.5% |
| Filipino | 5 | 0.0% |
| Finnish | 26 | 0.0% |
| French | 1,077 | 1.6% |
| French Canadian | 81 | 0.1% |
| German | 7,536 | 11.2% |
| Ghanaian | 12 | 0.0% |
| Greek | 46 | 0.1% |
| Guamanian / Chamorro | 8 | 0.0% |
| Guatemalan | 55 | 0.1% |
| Honduran | 49 | 0.1% |
| Hungarian | 45 | 0.1% |
| Indian (Asian) | 83 | 0.1% |
| Iranian | 8 | 0.0% |
| Irish | 5,850 | 8.7% |
| Iroquois | 21 | 0.0% |
| Italian | 1,244 | 1.8% |
| Jamaican | 20 | 0.0% |
| Korean | 111 | 0.2% |
| Lebanese | 44 | 0.1% |
| Lithuanian | 26 | 0.0% |
| Lumbee | 25 | 0.0% |
| Mexican | 1,100 | 1.6% |
| Mexican American Indian | 4 | 0.0% |
| Nicaraguan | 32 | 0.1% |
| Nigerian | 13 | 0.0% |
| Northern European | 65 | 0.1% |
| Norwegian | 358 | 0.5% |
| Polish | 546 | 0.8% |
| Portuguese | 17 | 0.0% |
| Potawatomi | 18 | 0.0% |
| Puerto Rican | 391 | 0.6% |
| Romanian | 7 | 0.0% |
| Russian | 85 | 0.1% |
| Scandinavian | 146 | 0.2% |
| Scotch-Irish | 795 | 1.2% |
| Scottish | 1,073 | 1.6% |
| Sioux | 23 | 0.0% |
| Slovak | 28 | 0.0% |
| South American | 98 | 0.2% |
| Spaniard | 23 | 0.0% |
| Spanish | 3 | 0.0% |
| Sri Lankan | 252 | 0.4% |
| Subsaharan African | 1,203 | 1.8% |
| Swedish | 296 | 0.4% |
| Swiss | 58 | 0.1% |
| Syrian | 18 | 0.0% |
| Thai | 170 | 0.3% |
| Turkish | 34 | 0.1% |
| Ukrainian | 44 | 0.1% |
| Welsh | 435 | 0.6% | View All 83 Rows |
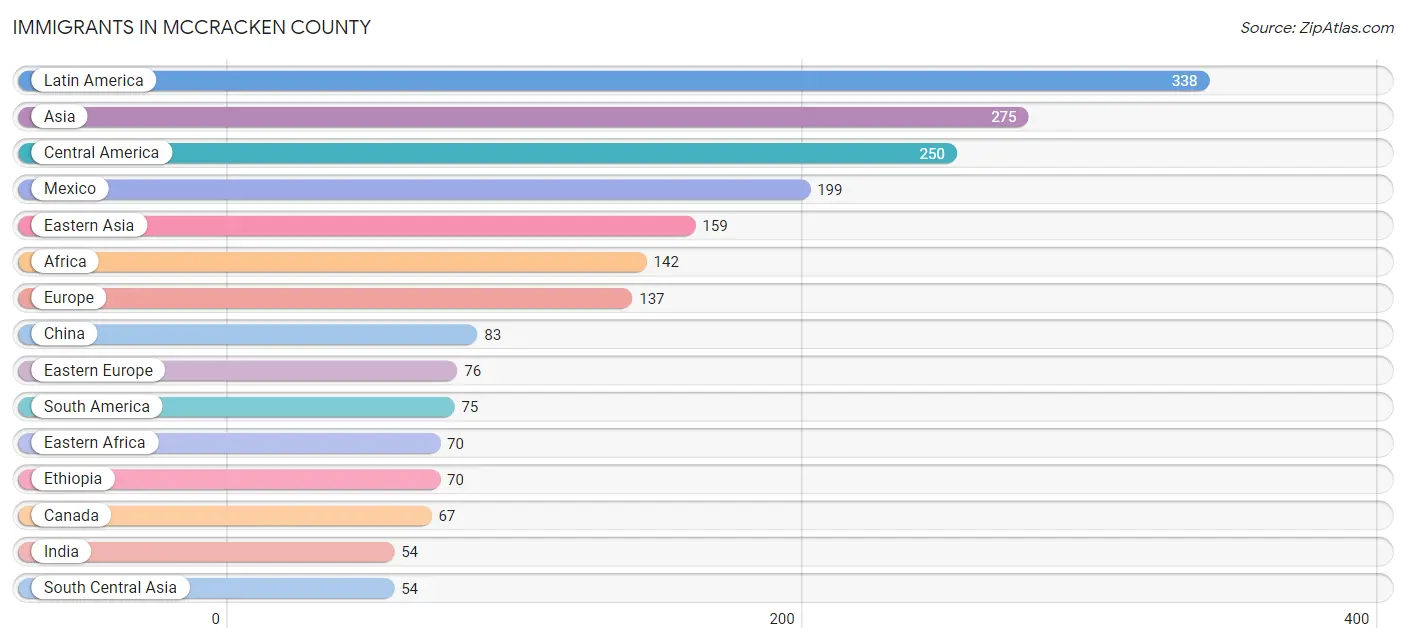
Immigrants in McCracken County
The most numerous immigrant groups reported in McCracken County came from Latin America (338 | 0.5%), Asia (275 | 0.4%), Central America (250 | 0.4%), Mexico (199 | 0.3%), and Eastern Asia (159 | 0.2%), together accounting for 1.8% of all McCracken County residents.
| Immigration Origin | # Population | % Population |
| Africa | 142 | 0.2% |
| Argentina | 41 | 0.1% |
| Asia | 275 | 0.4% |
| Canada | 67 | 0.1% |
| Caribbean | 13 | 0.0% |
| Central America | 250 | 0.4% |
| China | 83 | 0.1% |
| Colombia | 34 | 0.1% |
| Dominican Republic | 13 | 0.0% |
| Eastern Africa | 70 | 0.1% |
| Eastern Asia | 159 | 0.2% |
| Eastern Europe | 76 | 0.1% |
| England | 24 | 0.0% |
| Ethiopia | 70 | 0.1% |
| Europe | 137 | 0.2% |
| Germany | 12 | 0.0% |
| Guatemala | 19 | 0.0% |
| India | 54 | 0.1% |
| Japan | 34 | 0.1% |
| Korea | 42 | 0.1% |
| Latin America | 338 | 0.5% |
| Mexico | 199 | 0.3% |
| Netherlands | 15 | 0.0% |
| Nicaragua | 32 | 0.1% |
| Nigeria | 13 | 0.0% |
| Northern Europe | 34 | 0.1% |
| Philippines | 42 | 0.1% |
| Romania | 7 | 0.0% |
| Russia | 38 | 0.1% |
| Scotland | 10 | 0.0% |
| South America | 75 | 0.1% |
| South Central Asia | 54 | 0.1% |
| South Eastern Asia | 49 | 0.1% |
| Taiwan | 15 | 0.0% |
| Turkey | 13 | 0.0% |
| Ukraine | 31 | 0.1% |
| Vietnam | 7 | 0.0% |
| Western Africa | 13 | 0.0% |
| Western Asia | 13 | 0.0% |
| Western Europe | 27 | 0.0% | View All 40 Rows |
Sex and Age in McCracken County
Sex and Age in McCracken County
The most populous age groups in McCracken County are 60 to 64 Years (2,418 | 7.4%) for men and 60 to 64 Years (2,680 | 7.7%) for women.
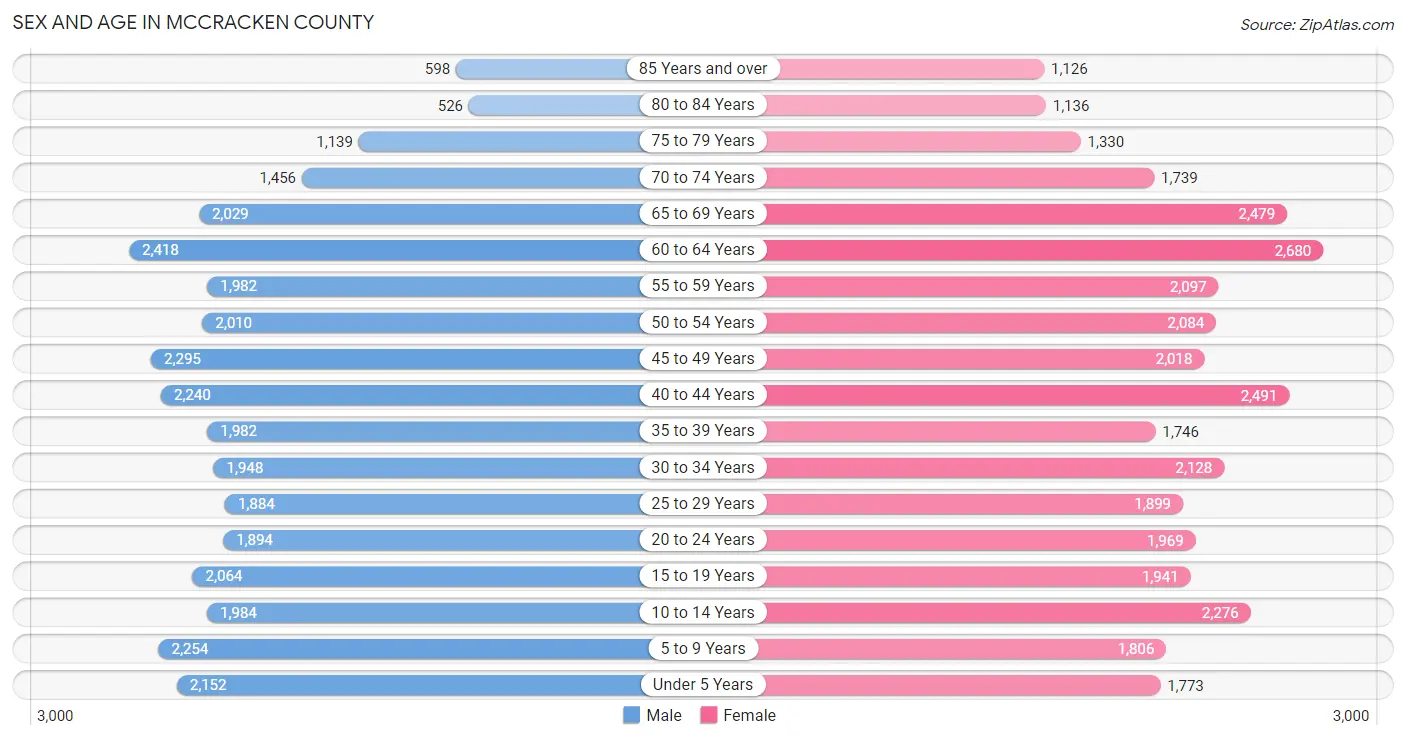
| Age Bracket | Male | Female |
| Under 5 Years | 2,152 (6.6%) | 1,773 (5.1%) |
| 5 to 9 Years | 2,254 (6.9%) | 1,806 (5.2%) |
| 10 to 14 Years | 1,984 (6.0%) | 2,276 (6.6%) |
| 15 to 19 Years | 2,064 (6.3%) | 1,941 (5.6%) |
| 20 to 24 Years | 1,894 (5.8%) | 1,969 (5.7%) |
| 25 to 29 Years | 1,884 (5.7%) | 1,899 (5.5%) |
| 30 to 34 Years | 1,948 (5.9%) | 2,128 (6.1%) |
| 35 to 39 Years | 1,982 (6.0%) | 1,746 (5.0%) |
| 40 to 44 Years | 2,240 (6.8%) | 2,491 (7.2%) |
| 45 to 49 Years | 2,295 (7.0%) | 2,018 (5.8%) |
| 50 to 54 Years | 2,010 (6.1%) | 2,084 (6.0%) |
| 55 to 59 Years | 1,982 (6.0%) | 2,097 (6.0%) |
| 60 to 64 Years | 2,418 (7.4%) | 2,680 (7.7%) |
| 65 to 69 Years | 2,029 (6.2%) | 2,479 (7.1%) |
| 70 to 74 Years | 1,456 (4.4%) | 1,739 (5.0%) |
| 75 to 79 Years | 1,139 (3.5%) | 1,330 (3.8%) |
| 80 to 84 Years | 526 (1.6%) | 1,136 (3.3%) |
| 85 Years and over | 598 (1.8%) | 1,126 (3.2%) |
| Total | 32,855 (100.0%) | 34,718 (100.0%) |
Families and Households in McCracken County
Median Family Size in McCracken County
The median family size in McCracken County is 3.11 persons per family, with single female/mother families (3,142 | 18.7%) accounting for the largest median family size of 3.41 persons per family. On the other hand, single male/father families (921 | 5.5%) represent the smallest median family size with 2.85 persons per family.
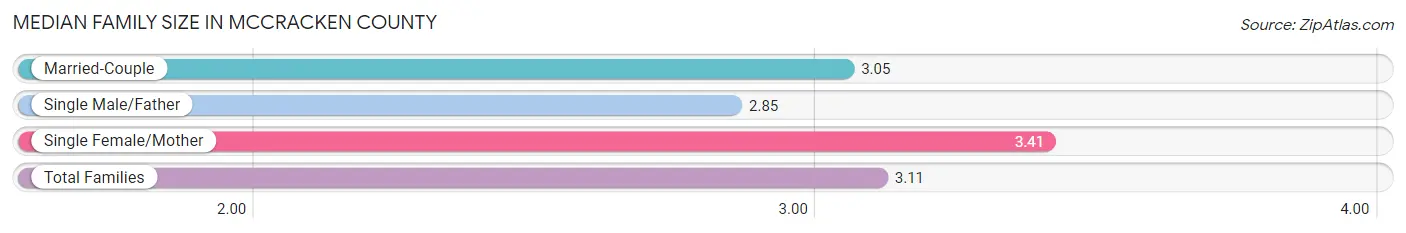
| Family Type | # Families | Family Size |
| Married-Couple | 12,763 (75.8%) | 3.05 |
| Single Male/Father | 921 (5.5%) | 2.85 |
| Single Female/Mother | 3,142 (18.7%) | 3.41 |
| Total Families | 16,826 (100.0%) | 3.11 |
Median Household Size in McCracken County
The median household size in McCracken County is 2.46 persons per household, with single female/mother households (3,142 | 11.6%) accounting for the largest median household size of 3.59 persons per household. non-family households (10,174 | 37.7%) represent the smallest median household size with 1.24 persons per household.
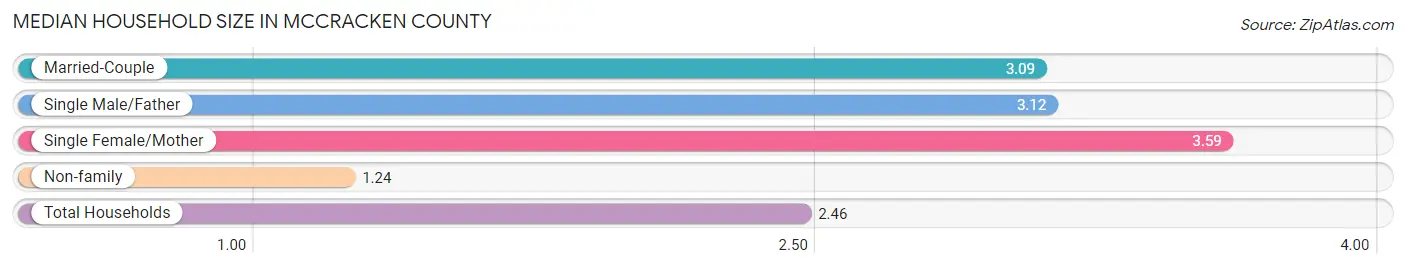
| Household Type | # Households | Household Size |
| Married-Couple | 12,763 (47.3%) | 3.09 |
| Single Male/Father | 921 (3.4%) | 3.12 |
| Single Female/Mother | 3,142 (11.6%) | 3.59 |
| Non-family | 10,174 (37.7%) | 1.24 |
| Total Households | 27,000 (100.0%) | 2.46 |
Household Size by Marriage Status in McCracken County
Out of a total of 27,000 households in McCracken County, 16,826 (62.3%) are family households, while 10,174 (37.7%) are nonfamily households. The most numerous type of family households are 2-person households, comprising 8,744, and the most common type of nonfamily households are 1-person households, comprising 8,359.
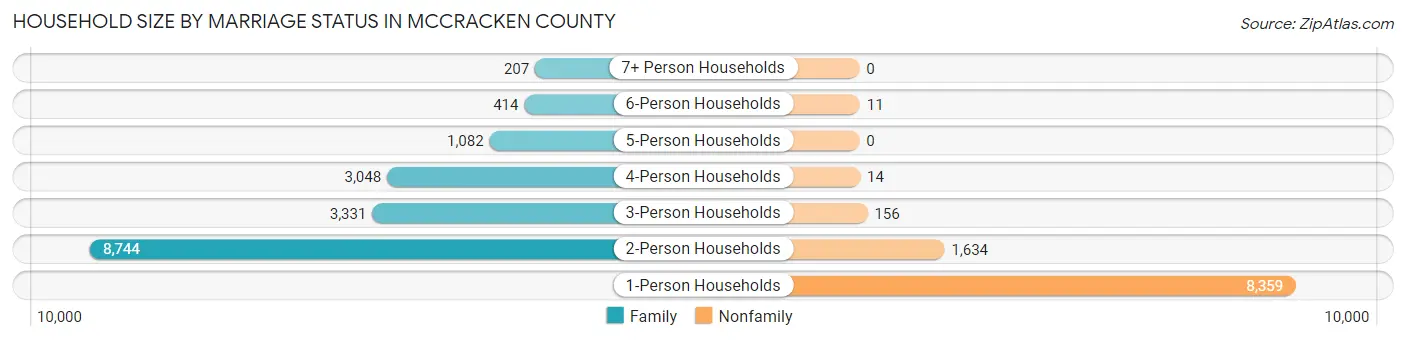
| Household Size | Family Households | Nonfamily Households |
| 1-Person Households | - | 8,359 (31.0%) |
| 2-Person Households | 8,744 (32.4%) | 1,634 (6.0%) |
| 3-Person Households | 3,331 (12.3%) | 156 (0.6%) |
| 4-Person Households | 3,048 (11.3%) | 14 (0.1%) |
| 5-Person Households | 1,082 (4.0%) | 0 (0.0%) |
| 6-Person Households | 414 (1.5%) | 11 (0.0%) |
| 7+ Person Households | 207 (0.8%) | 0 (0.0%) |
| Total | 16,826 (62.3%) | 10,174 (37.7%) |
Female Fertility in McCracken County
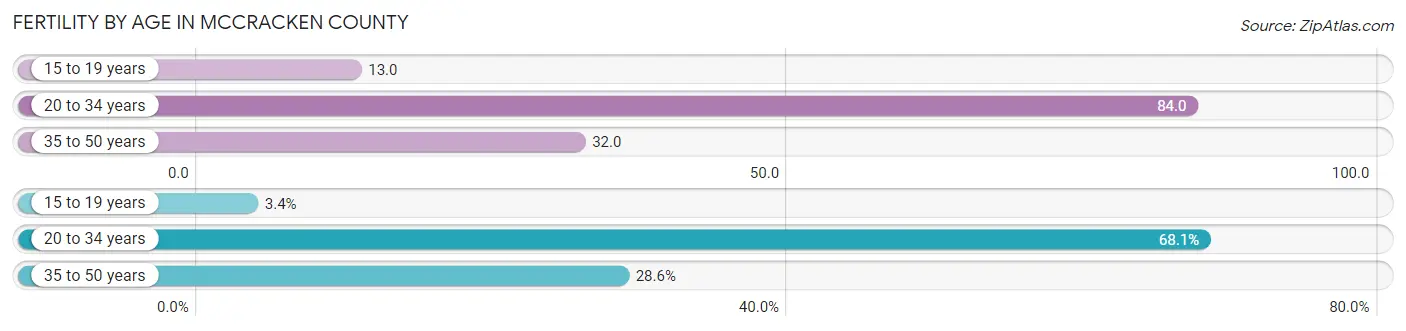
Fertility by Age in McCracken County
Average fertility rate in McCracken County is 51.0 births per 1,000 women. Women in the age bracket of 20 to 34 years have the highest fertility rate with 84.0 births per 1,000 women. Women in the age bracket of 20 to 34 years acount for 68.1% of all women with births.
| Age Bracket | Women with Births | Births / 1,000 Women |
| 15 to 19 years | 25 (3.4%) | 13.0 |
| 20 to 34 years | 503 (68.1%) | 84.0 |
| 35 to 50 years | 211 (28.5%) | 32.0 |
| Total | 739 (100.0%) | 51.0 |
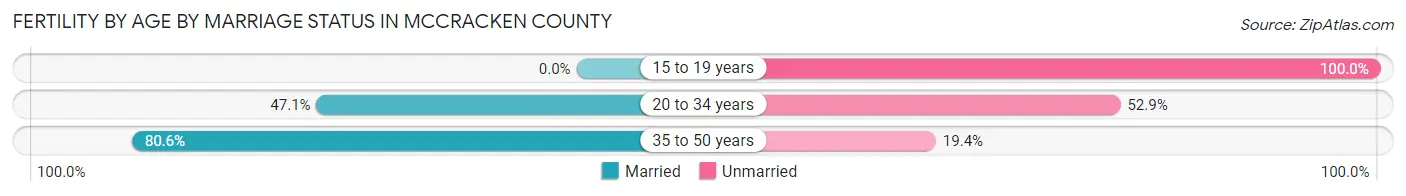
Fertility by Age by Marriage Status in McCracken County
55.1% of women with births (739) in McCracken County are married. The highest percentage of unmarried women with births falls into 15 to 19 years age bracket with 100.0% of them unmarried at the time of birth, while the lowest percentage of unmarried women with births belong to 35 to 50 years age bracket with 19.4% of them unmarried.
| Age Bracket | Married | Unmarried |
| 15 to 19 years | 0 (0.0%) | 25 (100.0%) |
| 20 to 34 years | 237 (47.1%) | 266 (52.9%) |
| 35 to 50 years | 170 (80.6%) | 41 (19.4%) |
| Total | 407 (55.1%) | 332 (44.9%) |
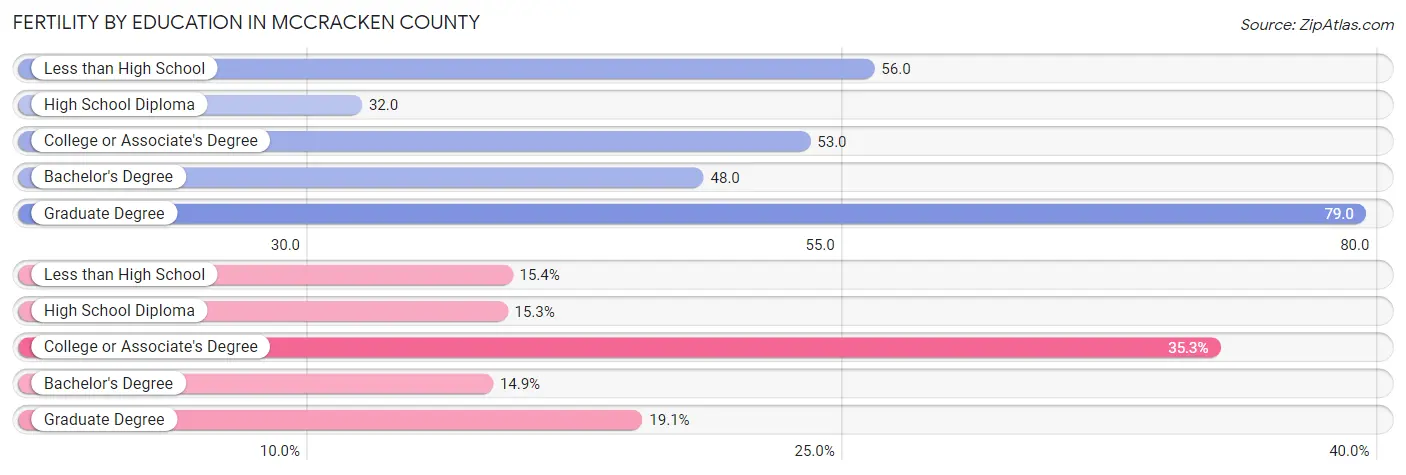
Fertility by Education in McCracken County
Average fertility rate in McCracken County is 51.0 births per 1,000 women. Women with the education attainment of graduate degree have the highest fertility rate of 79.0 births per 1,000 women, while women with the education attainment of high school diploma have the lowest fertility at 32.0 births per 1,000 women. Women with the education attainment of college or associate's degree represent 35.3% of all women with births.
| Educational Attainment | Women with Births | Births / 1,000 Women |
| Less than High School | 114 (15.4%) | 56.0 |
| High School Diploma | 113 (15.3%) | 32.0 |
| College or Associate's Degree | 261 (35.3%) | 53.0 |
| Bachelor's Degree | 110 (14.9%) | 48.0 |
| Graduate Degree | 141 (19.1%) | 79.0 |
| Total | 739 (100.0%) | 51.0 |
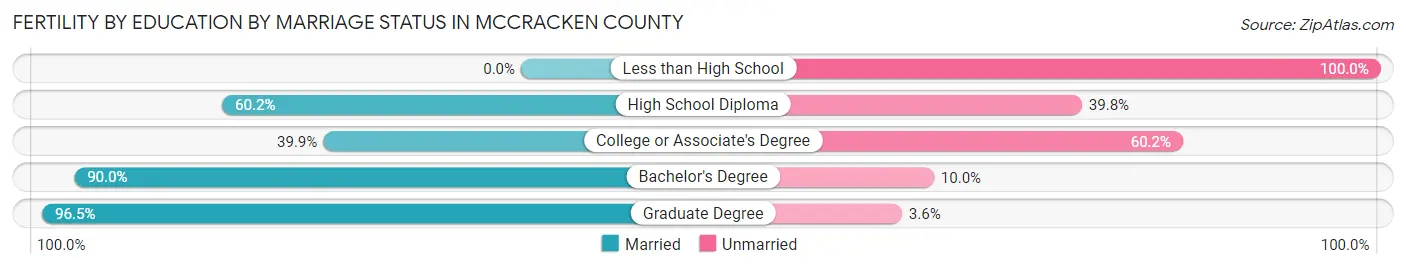
Fertility by Education by Marriage Status in McCracken County
44.9% of women with births in McCracken County are unmarried. Women with the educational attainment of graduate degree are most likely to be married with 96.5% of them married at childbirth, while women with the educational attainment of less than high school are least likely to be married with 100.0% of them unmarried at childbirth.
| Educational Attainment | Married | Unmarried |
| Less than High School | 0 (0.0%) | 114 (100.0%) |
| High School Diploma | 68 (60.2%) | 45 (39.8%) |
| College or Associate's Degree | 104 (39.9%) | 157 (60.2%) |
| Bachelor's Degree | 99 (90.0%) | 11 (10.0%) |
| Graduate Degree | 136 (96.5%) | 5 (3.5%) |
| Total | 407 (55.1%) | 332 (44.9%) |
Income in McCracken County
Income Overview in McCracken County
Per Capita Income in McCracken County is $36,401, while median incomes of families and households are $76,931 and $58,490 respectively.
| Characteristic | Number | Measure |
| Per Capita Income | 67,573 | $36,401 |
| Median Family Income | 16,826 | $76,931 |
| Mean Family Income | 16,826 | $108,780 |
| Median Household Income | 27,000 | $58,490 |
| Mean Household Income | 27,000 | $87,475 |
| Income Deficit | 16,826 | $12,657 |
| Wage / Income Gap (%) | 67,573 | 35.45% |
| Wage / Income Gap ($) | 67,573 | 64.55¢ per $1 |
| Gini / Inequality Index | 67,573 | 0.51 |
Earnings by Sex in McCracken County
Average Earnings in McCracken County are $34,166, $44,697 for men and $28,851 for women, a difference of 35.4%.
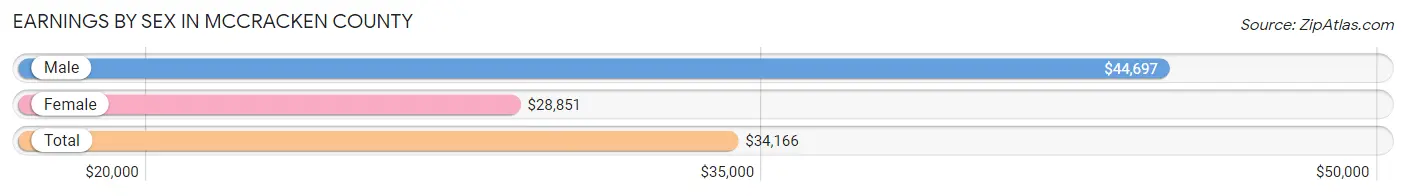
| Sex | Number | Average Earnings |
| Male | 16,900 (51.2%) | $44,697 |
| Female | 16,133 (48.8%) | $28,851 |
| Total | 33,033 (100.0%) | $34,166 |
Earnings by Sex by Income Bracket in McCracken County
The most common earnings brackets in McCracken County are $100,000+ for men (2,757 | 16.3%) and $30,000 to $34,999 for women (1,408 | 8.7%).
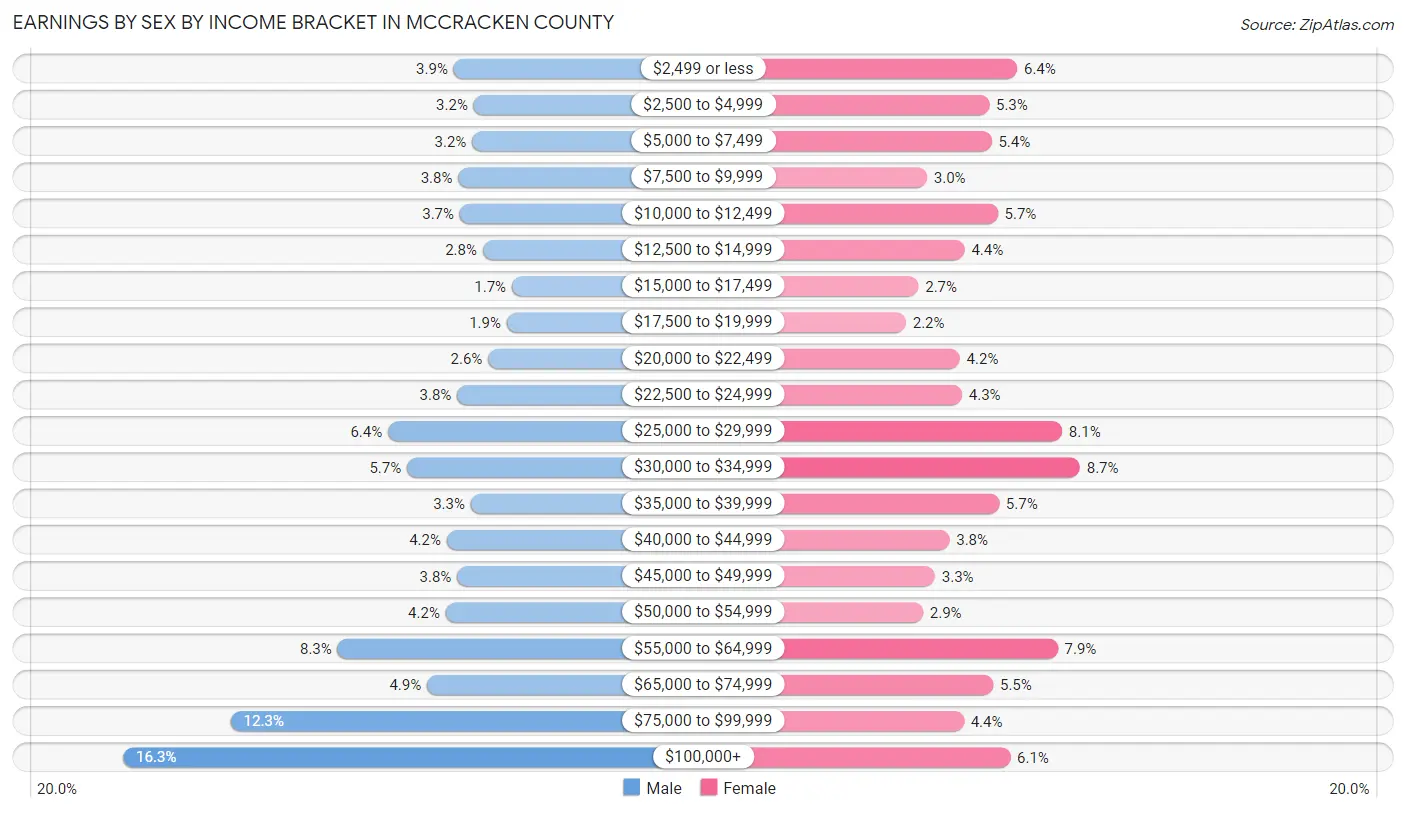
| Income | Male | Female |
| $2,499 or less | 662 (3.9%) | 1,029 (6.4%) |
| $2,500 to $4,999 | 536 (3.2%) | 860 (5.3%) |
| $5,000 to $7,499 | 546 (3.2%) | 875 (5.4%) |
| $7,500 to $9,999 | 634 (3.7%) | 484 (3.0%) |
| $10,000 to $12,499 | 624 (3.7%) | 912 (5.7%) |
| $12,500 to $14,999 | 478 (2.8%) | 712 (4.4%) |
| $15,000 to $17,499 | 294 (1.7%) | 432 (2.7%) |
| $17,500 to $19,999 | 327 (1.9%) | 357 (2.2%) |
| $20,000 to $22,499 | 444 (2.6%) | 682 (4.2%) |
| $22,500 to $24,999 | 640 (3.8%) | 696 (4.3%) |
| $25,000 to $29,999 | 1,079 (6.4%) | 1,300 (8.1%) |
| $30,000 to $34,999 | 959 (5.7%) | 1,408 (8.7%) |
| $35,000 to $39,999 | 555 (3.3%) | 920 (5.7%) |
| $40,000 to $44,999 | 707 (4.2%) | 619 (3.8%) |
| $45,000 to $49,999 | 641 (3.8%) | 533 (3.3%) |
| $50,000 to $54,999 | 713 (4.2%) | 460 (2.9%) |
| $55,000 to $64,999 | 1,397 (8.3%) | 1,275 (7.9%) |
| $65,000 to $74,999 | 831 (4.9%) | 884 (5.5%) |
| $75,000 to $99,999 | 2,076 (12.3%) | 707 (4.4%) |
| $100,000+ | 2,757 (16.3%) | 988 (6.1%) |
| Total | 16,900 (100.0%) | 16,133 (100.0%) |
Earnings by Sex by Educational Attainment in McCracken County
Average earnings in McCracken County are $51,364 for men and $33,427 for women, a difference of 34.9%. Men with an educational attainment of graduate degree enjoy the highest average annual earnings of $95,177, while those with less than high school education earn the least with $25,066. Women with an educational attainment of graduate degree earn the most with the average annual earnings of $59,539, while those with less than high school education have the smallest earnings of $16,250.
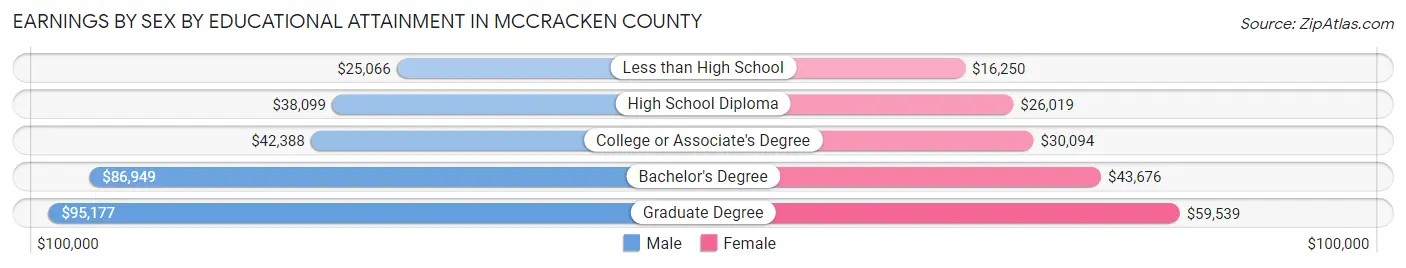
| Educational Attainment | Male Income | Female Income |
| Less than High School | $25,066 | $16,250 |
| High School Diploma | $38,099 | $26,019 |
| College or Associate's Degree | $42,388 | $30,094 |
| Bachelor's Degree | $86,949 | $43,676 |
| Graduate Degree | $95,177 | $59,539 |
| Total | $51,364 | $33,427 |
Family Income in McCracken County
Family Income Brackets in McCracken County
According to the McCracken County family income data, there are 3,163 families falling into the $100,000 to $149,999 income range, which is the most common income bracket and makes up 18.8% of all families. Conversely, the $10,000 to $14,999 income bracket is the least frequent group with only 421 families (2.5%) belonging to this category.
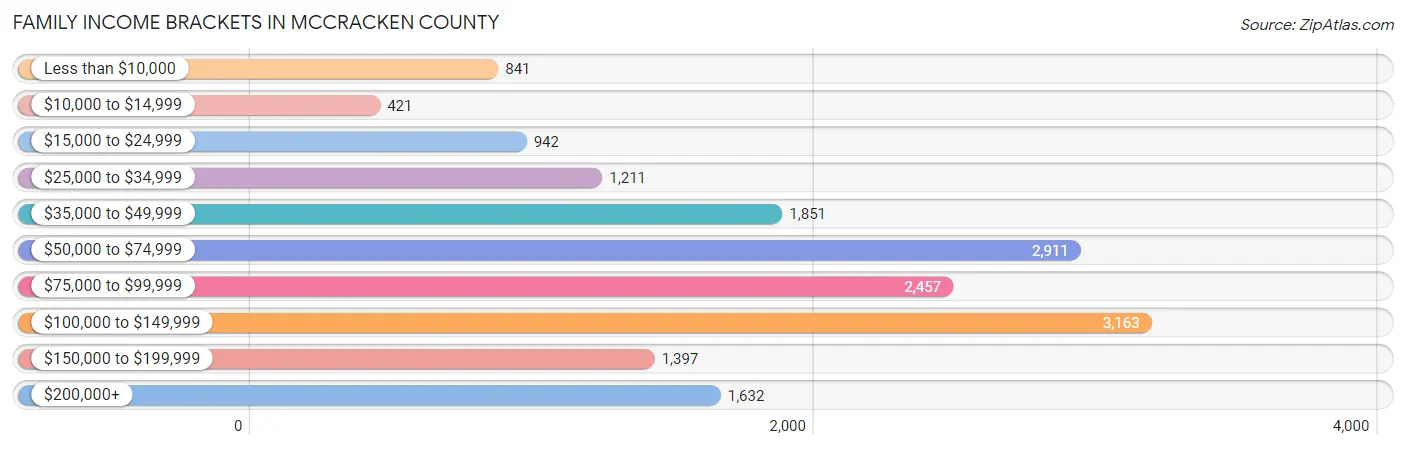
| Income Bracket | # Families | % Families |
| Less than $10,000 | 841 | 5.0% |
| $10,000 to $14,999 | 421 | 2.5% |
| $15,000 to $24,999 | 942 | 5.6% |
| $25,000 to $34,999 | 1,211 | 7.2% |
| $35,000 to $49,999 | 1,851 | 11.0% |
| $50,000 to $74,999 | 2,911 | 17.3% |
| $75,000 to $99,999 | 2,457 | 14.6% |
| $100,000 to $149,999 | 3,163 | 18.8% |
| $150,000 to $199,999 | 1,397 | 8.3% |
| $200,000+ | 1,632 | 9.7% |
Family Income by Famaliy Size in McCracken County
4-person families (2,933 | 17.4%) account for the highest median family income in McCracken County with $98,107 per family, while 2-person families (9,060 | 53.8%) have the highest median income of $35,678 per family member.
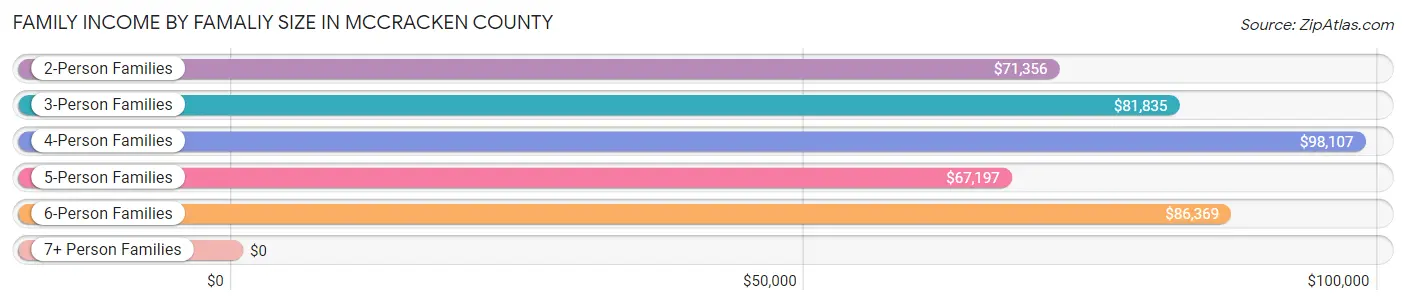
| Income Bracket | # Families | Median Income |
| 2-Person Families | 9,060 (53.8%) | $71,356 |
| 3-Person Families | 3,356 (20.0%) | $81,835 |
| 4-Person Families | 2,933 (17.4%) | $98,107 |
| 5-Person Families | 964 (5.7%) | $67,197 |
| 6-Person Families | 319 (1.9%) | $86,369 |
| 7+ Person Families | 194 (1.1%) | $0 |
| Total | 16,826 (100.0%) | $76,931 |
Family Income by Number of Earners in McCracken County
The median family income in McCracken County is $76,931, with families comprising 3+ earners (1,525) having the highest median family income of $109,933, while families with no earners (3,428) have the lowest median family income of $50,086, accounting for 9.1% and 20.4% of families, respectively.
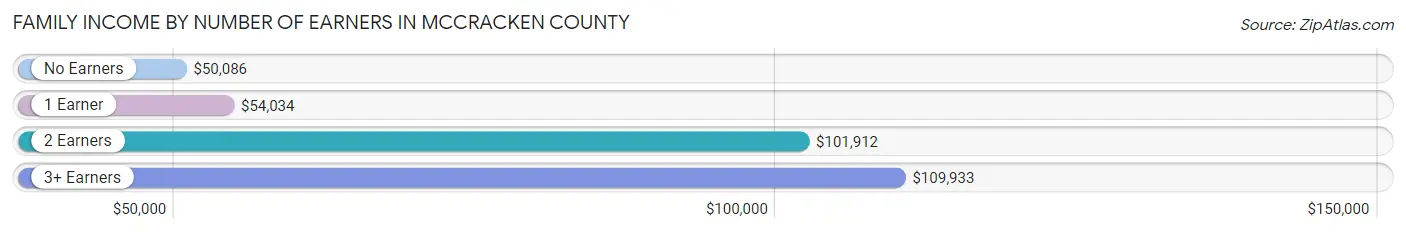
| Number of Earners | # Families | Median Income |
| No Earners | 3,428 (20.4%) | $50,086 |
| 1 Earner | 5,235 (31.1%) | $54,034 |
| 2 Earners | 6,638 (39.5%) | $101,912 |
| 3+ Earners | 1,525 (9.1%) | $109,933 |
| Total | 16,826 (100.0%) | $76,931 |
Household Income in McCracken County
Household Income Brackets in McCracken County
With 4,590 households falling in the category, the $50,000 to $74,999 income range is the most frequent in McCracken County, accounting for 17.0% of all households. In contrast, only 1,296 households (4.8%) fall into the $10,000 to $14,999 income bracket, making it the least populous group.
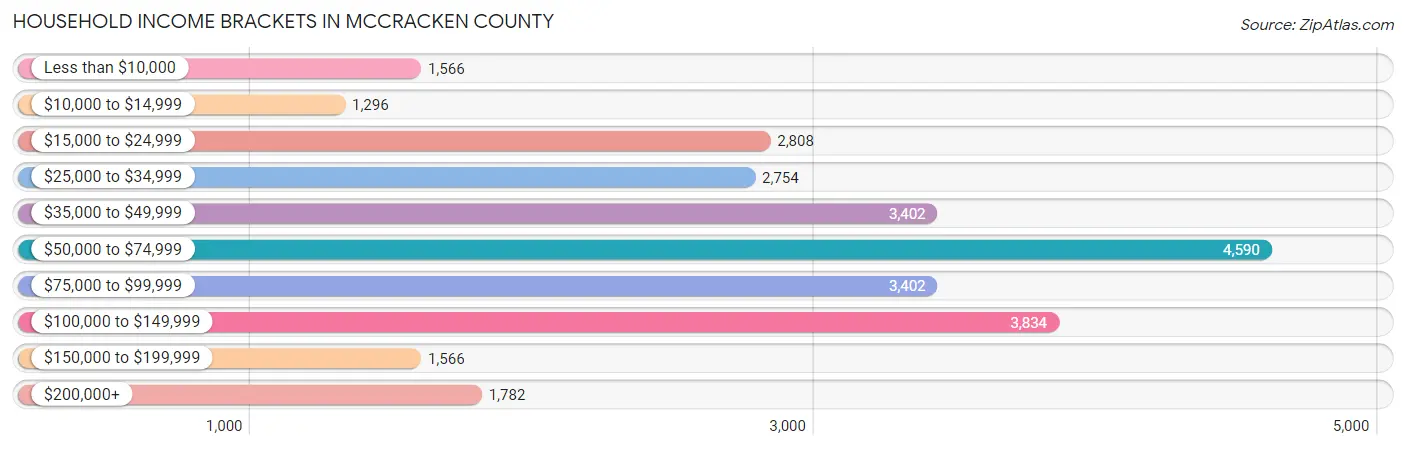
| Income Bracket | # Households | % Households |
| Less than $10,000 | 1,566 | 5.8% |
| $10,000 to $14,999 | 1,296 | 4.8% |
| $15,000 to $24,999 | 2,808 | 10.4% |
| $25,000 to $34,999 | 2,754 | 10.2% |
| $35,000 to $49,999 | 3,402 | 12.6% |
| $50,000 to $74,999 | 4,590 | 17.0% |
| $75,000 to $99,999 | 3,402 | 12.6% |
| $100,000 to $149,999 | 3,834 | 14.2% |
| $150,000 to $199,999 | 1,566 | 5.8% |
| $200,000+ | 1,782 | 6.6% |
Household Income by Householder Age in McCracken County
The median household income in McCracken County is $58,490, with the highest median household income of $78,053 found in the 45 to 64 years age bracket for the primary householder. A total of 9,522 households (35.3%) fall into this category. Meanwhile, the 15 to 24 years age bracket for the primary householder has the lowest median household income of $32,589, with 799 households (3.0%) in this group.
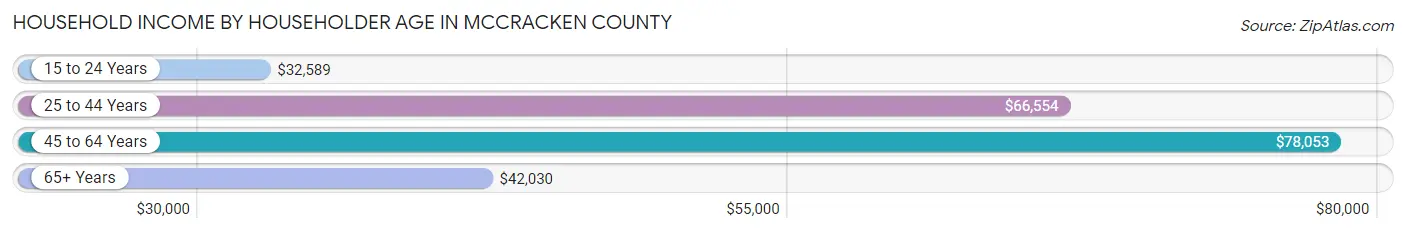
| Income Bracket | # Households | Median Income |
| 15 to 24 Years | 799 (3.0%) | $32,589 |
| 25 to 44 Years | 8,186 (30.3%) | $66,554 |
| 45 to 64 Years | 9,522 (35.3%) | $78,053 |
| 65+ Years | 8,493 (31.5%) | $42,030 |
| Total | 27,000 (100.0%) | $58,490 |
Poverty in McCracken County
Income Below Poverty by Sex and Age in McCracken County
With 14.3% poverty level for males and 16.0% for females among the residents of McCracken County, under 5 year old males and 5 year old females are the most vulnerable to poverty, with 621 males (29.7%) and 113 females (35.1%) in their respective age groups living below the poverty level.
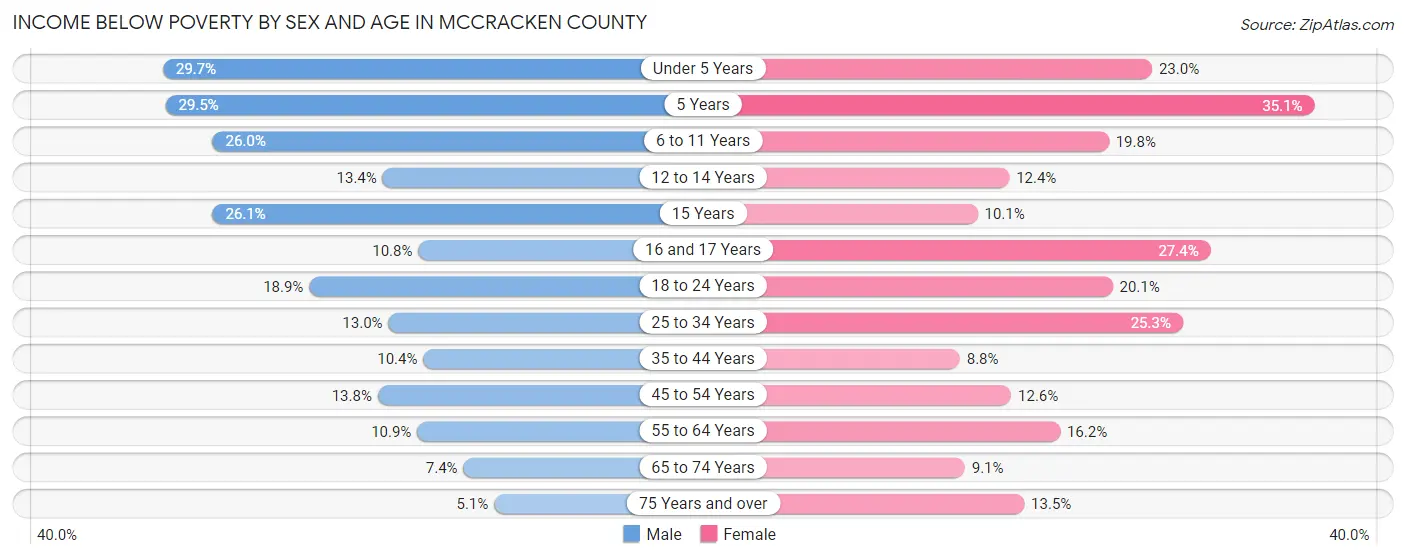
| Age Bracket | Male | Female |
| Under 5 Years | 621 (29.7%) | 391 (23.0%) |
| 5 Years | 161 (29.5%) | 113 (35.1%) |
| 6 to 11 Years | 639 (26.0%) | 483 (19.8%) |
| 12 to 14 Years | 158 (13.4%) | 157 (12.4%) |
| 15 Years | 118 (26.1%) | 38 (10.1%) |
| 16 and 17 Years | 83 (10.8%) | 237 (27.4%) |
| 18 to 24 Years | 505 (18.9%) | 533 (20.1%) |
| 25 to 34 Years | 482 (13.0%) | 1,009 (25.3%) |
| 35 to 44 Years | 429 (10.4%) | 369 (8.8%) |
| 45 to 54 Years | 585 (13.8%) | 509 (12.6%) |
| 55 to 64 Years | 471 (10.8%) | 752 (16.2%) |
| 65 to 74 Years | 256 (7.4%) | 381 (9.1%) |
| 75 Years and over | 110 (5.1%) | 455 (13.5%) |
| Total | 4,618 (14.3%) | 5,427 (16.0%) |
Income Above Poverty by Sex and Age in McCracken County
According to the poverty statistics in McCracken County, males aged 75 years and over and females aged 35 to 44 years are the age groups that are most secure financially, with 94.9% of males and 91.2% of females in these age groups living above the poverty line.
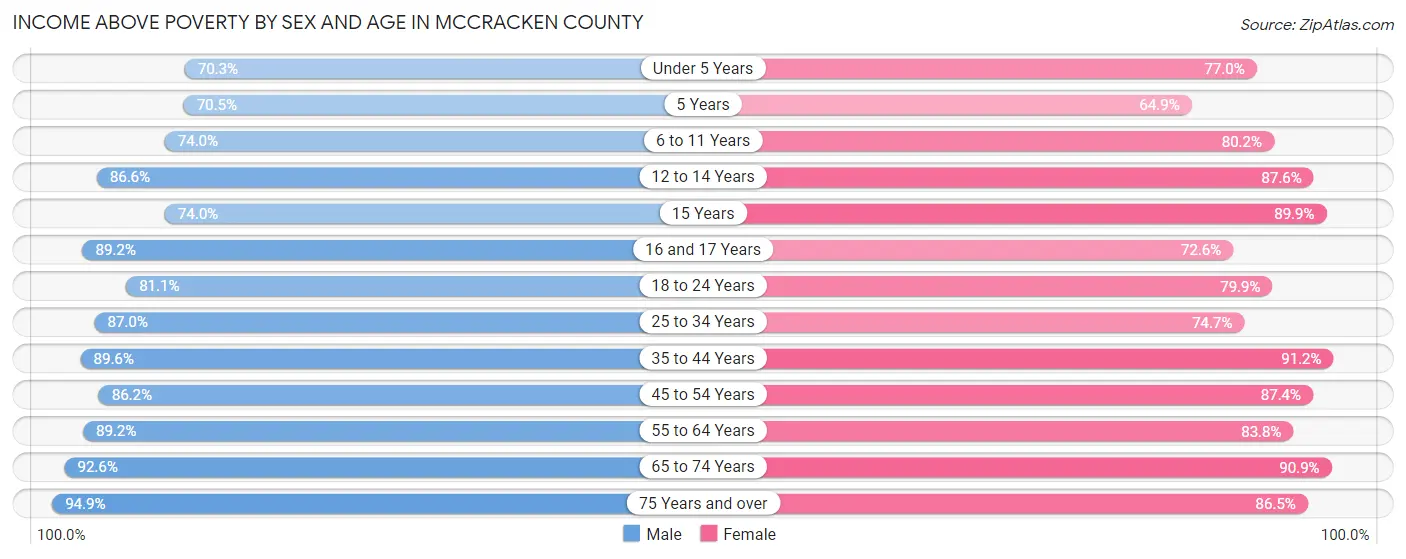
| Age Bracket | Male | Female |
| Under 5 Years | 1,467 (70.3%) | 1,307 (77.0%) |
| 5 Years | 384 (70.5%) | 209 (64.9%) |
| 6 to 11 Years | 1,815 (74.0%) | 1,954 (80.2%) |
| 12 to 14 Years | 1,019 (86.6%) | 1,106 (87.6%) |
| 15 Years | 335 (74.0%) | 339 (89.9%) |
| 16 and 17 Years | 688 (89.2%) | 629 (72.6%) |
| 18 to 24 Years | 2,171 (81.1%) | 2,119 (79.9%) |
| 25 to 34 Years | 3,228 (87.0%) | 2,977 (74.7%) |
| 35 to 44 Years | 3,696 (89.6%) | 3,842 (91.2%) |
| 45 to 54 Years | 3,660 (86.2%) | 3,539 (87.4%) |
| 55 to 64 Years | 3,870 (89.1%) | 3,889 (83.8%) |
| 65 to 74 Years | 3,194 (92.6%) | 3,791 (90.9%) |
| 75 Years and over | 2,030 (94.9%) | 2,906 (86.5%) |
| Total | 27,557 (85.7%) | 28,607 (84.1%) |
Income Below Poverty Among Married-Couple Families in McCracken County
The poverty statistics for married-couple families in McCracken County show that 5.1% or 650 of the total 12,763 families live below the poverty line. Families with 5 or more children have the highest poverty rate of 17.9%, comprising of 17 families. On the other hand, families with no children have the lowest poverty rate of 3.8%, which includes 308 families.
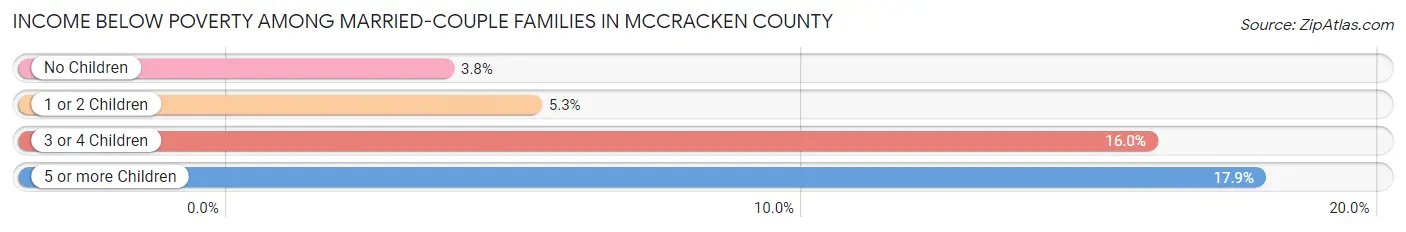
| Children | Above Poverty | Below Poverty |
| No Children | 7,878 (96.2%) | 308 (3.8%) |
| 1 or 2 Children | 3,470 (94.7%) | 194 (5.3%) |
| 3 or 4 Children | 687 (84.0%) | 131 (16.0%) |
| 5 or more Children | 78 (82.1%) | 17 (17.9%) |
| Total | 12,113 (94.9%) | 650 (5.1%) |
Income Below Poverty Among Single-Parent Households in McCracken County
According to the poverty data in McCracken County, 16.0% or 147 single-father households and 34.1% or 1,071 single-mother households are living below the poverty line. Among single-father households, those with 3 or 4 children have the highest poverty rate, with 57 households (75.0%) experiencing poverty. Likewise, among single-mother households, those with 5 or more children have the highest poverty rate, with 18 households (100.0%) falling below the poverty line.
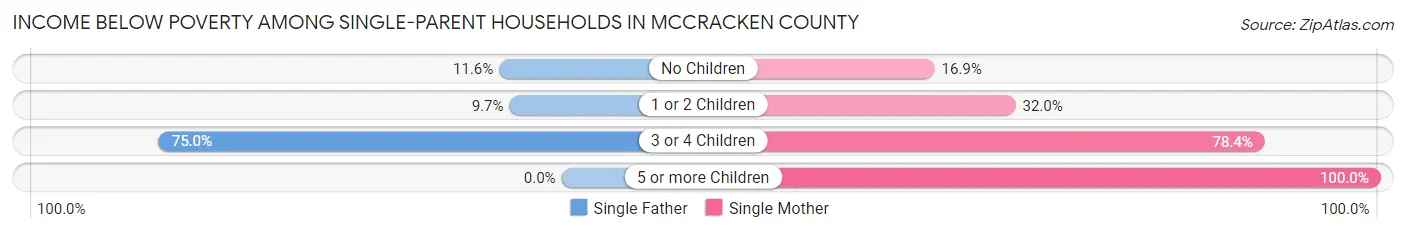
| Children | Single Father | Single Mother |
| No Children | 48 (11.6%) | 170 (16.9%) |
| 1 or 2 Children | 42 (9.7%) | 538 (32.0%) |
| 3 or 4 Children | 57 (75.0%) | 345 (78.4%) |
| 5 or more Children | 0 (0.0%) | 18 (100.0%) |
| Total | 147 (16.0%) | 1,071 (34.1%) |
Income Below Poverty Among Married-Couple vs Single-Parent Households in McCracken County
The poverty data for McCracken County shows that 650 of the married-couple family households (5.1%) and 1,218 of the single-parent households (30.0%) are living below the poverty level. Within the married-couple family households, those with 5 or more children have the highest poverty rate, with 17 households (17.9%) falling below the poverty line. Among the single-parent households, those with 5 or more children have the highest poverty rate, with 18 household (100.0%) living below poverty.
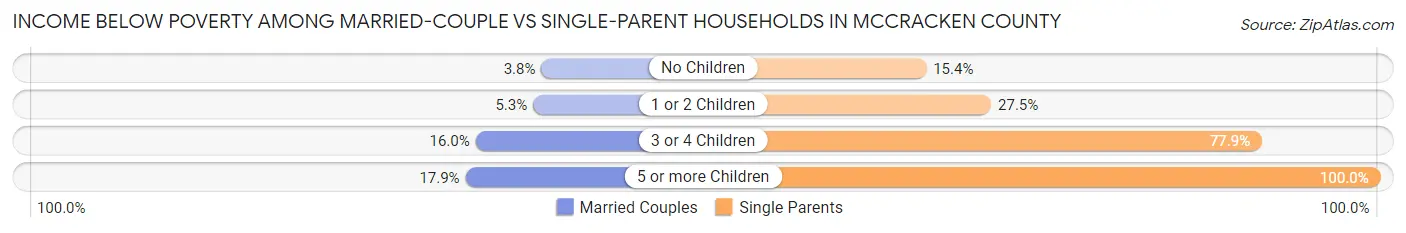
| Children | Married-Couple Families | Single-Parent Households |
| No Children | 308 (3.8%) | 218 (15.4%) |
| 1 or 2 Children | 194 (5.3%) | 580 (27.5%) |
| 3 or 4 Children | 131 (16.0%) | 402 (77.9%) |
| 5 or more Children | 17 (17.9%) | 18 (100.0%) |
| Total | 650 (5.1%) | 1,218 (30.0%) |
Employment Characteristics in McCracken County
Employment by Class of Employer in McCracken County
Among the 29,475 employed individuals in McCracken County, private company employees (21,009 | 71.3%), local government employees (2,038 | 6.9%), and not-for-profit organizations (1,858 | 6.3%) make up the most common classes of employment.
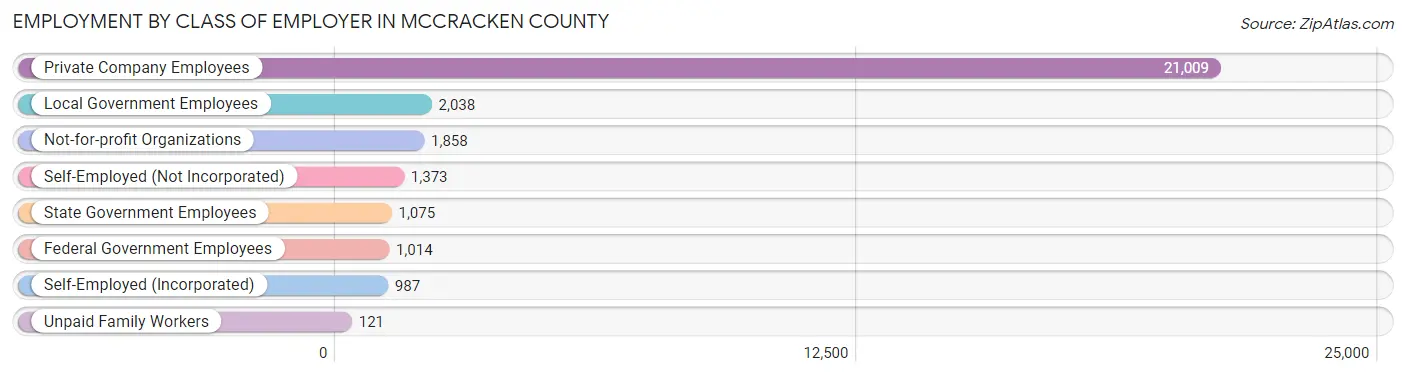
| Employer Class | # Employees | % Employees |
| Private Company Employees | 21,009 | 71.3% |
| Self-Employed (Incorporated) | 987 | 3.4% |
| Self-Employed (Not Incorporated) | 1,373 | 4.7% |
| Not-for-profit Organizations | 1,858 | 6.3% |
| Local Government Employees | 2,038 | 6.9% |
| State Government Employees | 1,075 | 3.6% |
| Federal Government Employees | 1,014 | 3.4% |
| Unpaid Family Workers | 121 | 0.4% |
| Total | 29,475 | 100.0% |
Employment Status by Age in McCracken County
According to the labor force statistics for McCracken County, out of the total population over 16 years of age (54,498), 57.0% or 31,064 individuals are in the labor force, with 3.6% or 1,118 of them unemployed. The age group with the highest labor force participation rate is 25 to 29 years, with 85.0% or 3,216 individuals in the labor force. Within the labor force, the 20 to 24 years age range has the highest percentage of unemployed individuals, with 7.4% or 207 of them being unemployed.
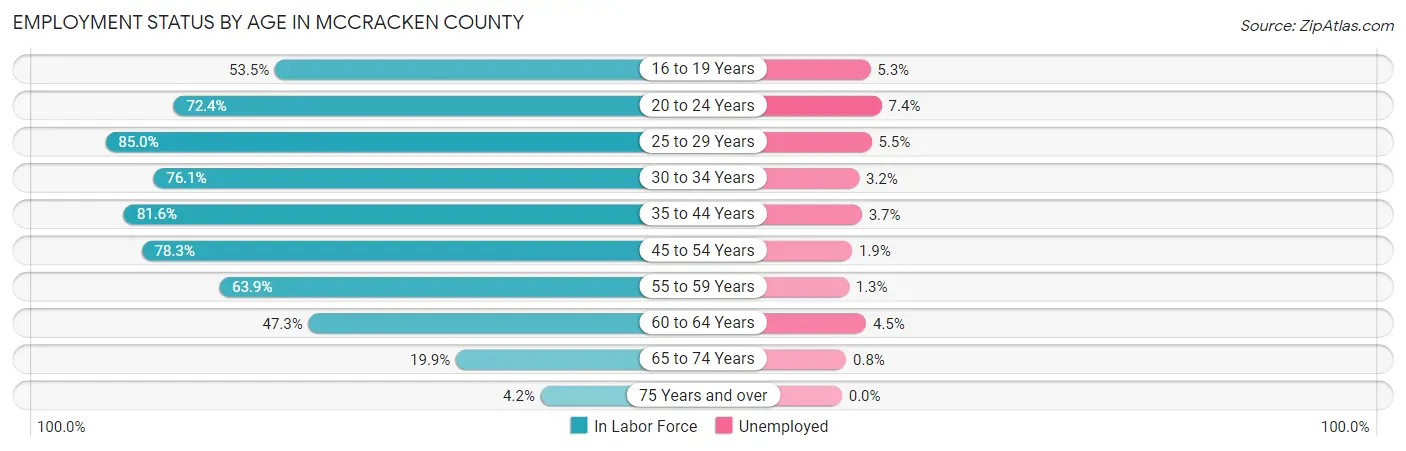
| Age Bracket | In Labor Force | Unemployed |
| 16 to 19 Years | 1,699 (53.5%) | 90 (5.3%) |
| 20 to 24 Years | 2,797 (72.4%) | 207 (7.4%) |
| 25 to 29 Years | 3,216 (85.0%) | 177 (5.5%) |
| 30 to 34 Years | 3,102 (76.1%) | 99 (3.2%) |
| 35 to 44 Years | 6,903 (81.6%) | 255 (3.7%) |
| 45 to 54 Years | 6,583 (78.3%) | 125 (1.9%) |
| 55 to 59 Years | 2,606 (63.9%) | 34 (1.3%) |
| 60 to 64 Years | 2,411 (47.3%) | 108 (4.5%) |
| 65 to 74 Years | 1,533 (19.9%) | 12 (0.8%) |
| 75 Years and over | 246 (4.2%) | 0 (0.0%) |
| Total | 31,064 (57.0%) | 1,118 (3.6%) |
Employment Status by Educational Attainment in McCracken County
According to labor force statistics for McCracken County, 73.2% of individuals (24,816) out of the total population between 25 and 64 years of age (33,902) are in the labor force, with 3.2% or 794 of them being unemployed. The group with the highest labor force participation rate are those with the educational attainment of bachelor's degree or higher, with 86.0% or 8,867 individuals in the labor force. Within the labor force, individuals with less than high school education have the highest percentage of unemployment, with 10.0% or 105 of them being unemployed.
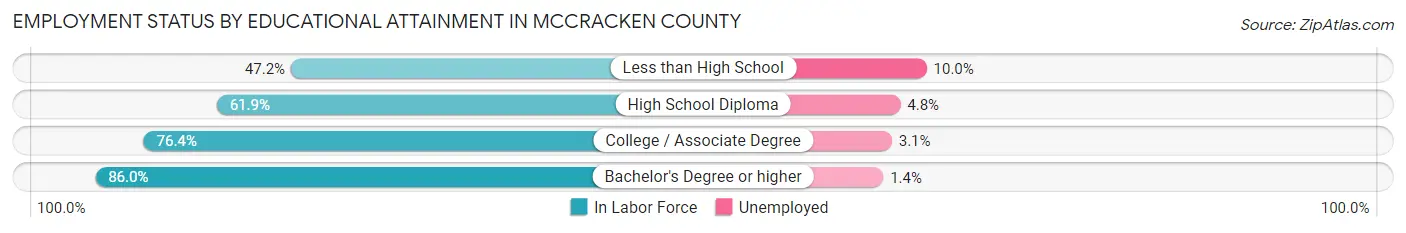
| Educational Attainment | In Labor Force | Unemployed |
| Less than High School | 1,050 (47.2%) | 222 (10.0%) |
| High School Diploma | 6,044 (61.9%) | 469 (4.8%) |
| College / Associate Degree | 8,865 (76.4%) | 360 (3.1%) |
| Bachelor's Degree or higher | 8,867 (86.0%) | 144 (1.4%) |
| Total | 24,816 (73.2%) | 1,085 (3.2%) |
Employment Occupations by Sex in McCracken County
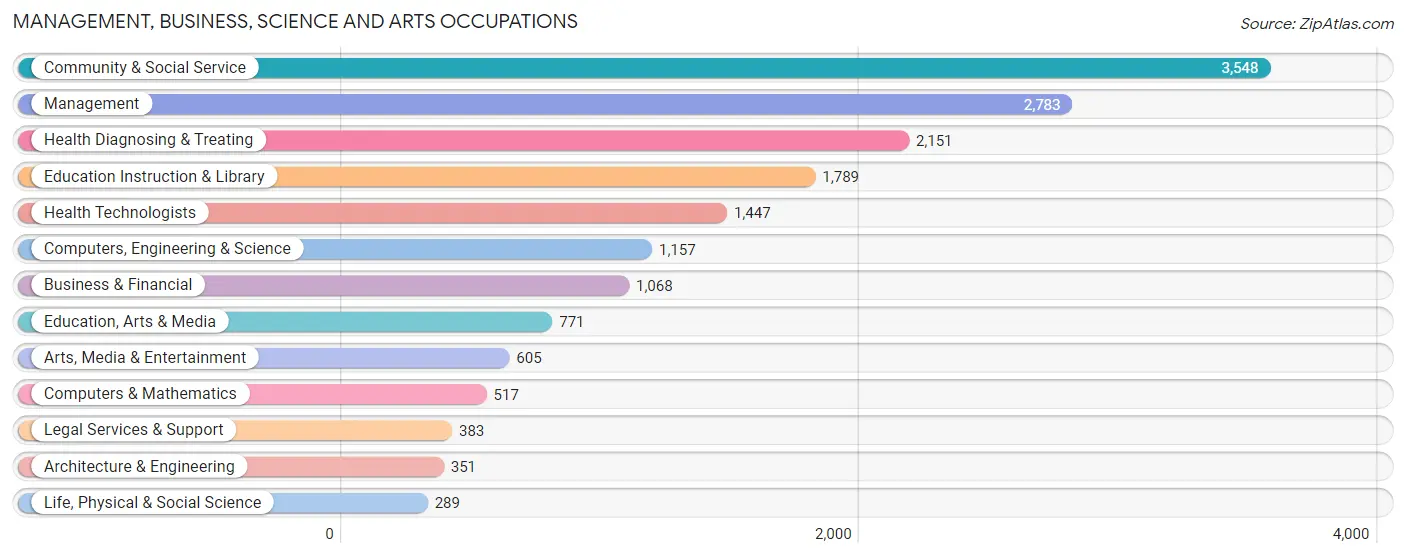
Management, Business, Science and Arts Occupations
The most common Management, Business, Science and Arts occupations in McCracken County are Community & Social Service (3,548 | 11.8%), Management (2,783 | 9.3%), Health Diagnosing & Treating (2,151 | 7.2%), Education Instruction & Library (1,789 | 6.0%), and Health Technologists (1,447 | 4.8%).
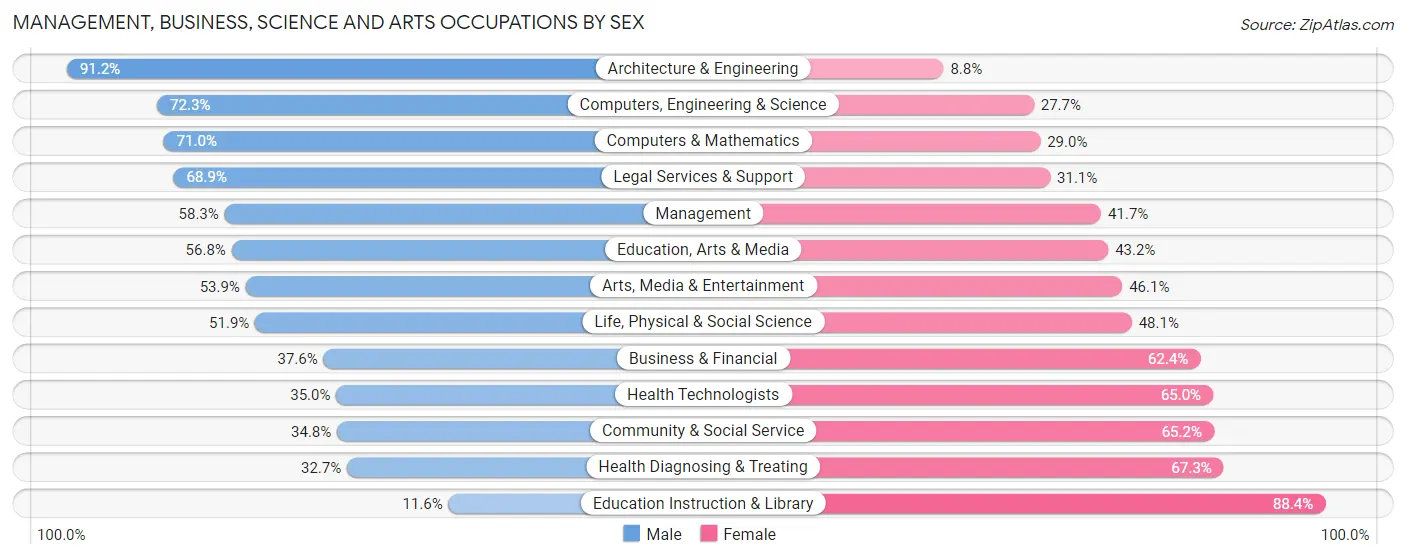
Management, Business, Science and Arts Occupations by Sex
Within the Management, Business, Science and Arts occupations in McCracken County, the most male-oriented occupations are Architecture & Engineering (91.2%), Computers, Engineering & Science (72.3%), and Computers & Mathematics (71.0%), while the most female-oriented occupations are Education Instruction & Library (88.4%), Health Diagnosing & Treating (67.3%), and Community & Social Service (65.2%).
| Occupation | Male | Female |
| Management | 1,622 (58.3%) | 1,161 (41.7%) |
| Business & Financial | 402 (37.6%) | 666 (62.4%) |
| Computers, Engineering & Science | 837 (72.3%) | 320 (27.7%) |
| Computers & Mathematics | 367 (71.0%) | 150 (29.0%) |
| Architecture & Engineering | 320 (91.2%) | 31 (8.8%) |
| Life, Physical & Social Science | 150 (51.9%) | 139 (48.1%) |
| Community & Social Service | 1,235 (34.8%) | 2,313 (65.2%) |
| Education, Arts & Media | 438 (56.8%) | 333 (43.2%) |
| Legal Services & Support | 264 (68.9%) | 119 (31.1%) |
| Education Instruction & Library | 207 (11.6%) | 1,582 (88.4%) |
| Arts, Media & Entertainment | 326 (53.9%) | 279 (46.1%) |
| Health Diagnosing & Treating | 704 (32.7%) | 1,447 (67.3%) |
| Health Technologists | 506 (35.0%) | 941 (65.0%) |
| Total (Category) | 4,800 (44.8%) | 5,907 (55.2%) |
| Total (Overall) | 15,083 (50.3%) | 14,881 (49.7%) |
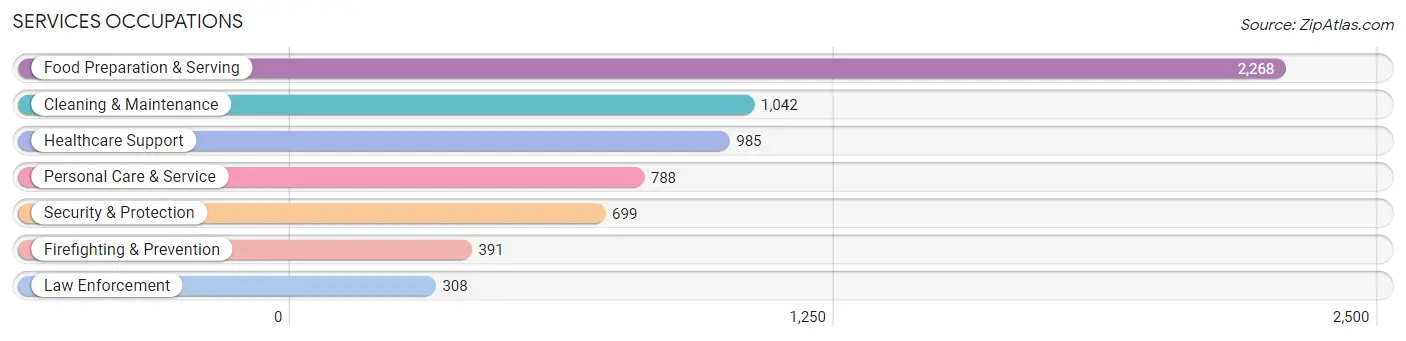
Services Occupations
The most common Services occupations in McCracken County are Food Preparation & Serving (2,268 | 7.6%), Cleaning & Maintenance (1,042 | 3.5%), Healthcare Support (985 | 3.3%), Personal Care & Service (788 | 2.6%), and Security & Protection (699 | 2.3%).
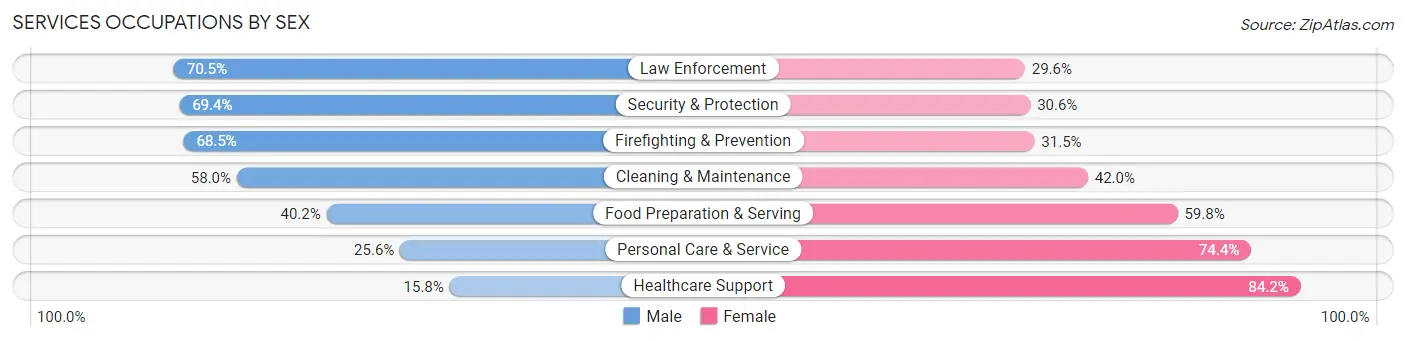
Services Occupations by Sex
Within the Services occupations in McCracken County, the most male-oriented occupations are Law Enforcement (70.5%), Security & Protection (69.4%), and Firefighting & Prevention (68.5%), while the most female-oriented occupations are Healthcare Support (84.2%), Personal Care & Service (74.4%), and Food Preparation & Serving (59.8%).
| Occupation | Male | Female |
| Healthcare Support | 156 (15.8%) | 829 (84.2%) |
| Security & Protection | 485 (69.4%) | 214 (30.6%) |
| Firefighting & Prevention | 268 (68.5%) | 123 (31.5%) |
| Law Enforcement | 217 (70.5%) | 91 (29.5%) |
| Food Preparation & Serving | 912 (40.2%) | 1,356 (59.8%) |
| Cleaning & Maintenance | 604 (58.0%) | 438 (42.0%) |
| Personal Care & Service | 202 (25.6%) | 586 (74.4%) |
| Total (Category) | 2,359 (40.8%) | 3,423 (59.2%) |
| Total (Overall) | 15,083 (50.3%) | 14,881 (49.7%) |
Sales and Office Occupations
The most common Sales and Office occupations in McCracken County are Sales & Related (4,106 | 13.7%), and Office & Administration (3,496 | 11.7%).

Sales and Office Occupations by Sex

| Occupation | Male | Female |
| Sales & Related | 2,171 (52.9%) | 1,935 (47.1%) |
| Office & Administration | 627 (17.9%) | 2,869 (82.1%) |
| Total (Category) | 2,798 (36.8%) | 4,804 (63.2%) |
| Total (Overall) | 15,083 (50.3%) | 14,881 (49.7%) |
Natural Resources, Construction and Maintenance Occupations
The most common Natural Resources, Construction and Maintenance occupations in McCracken County are Construction & Extraction (1,107 | 3.7%), Installation, Maintenance & Repair (939 | 3.1%), and Farming, Fishing & Forestry (51 | 0.2%).
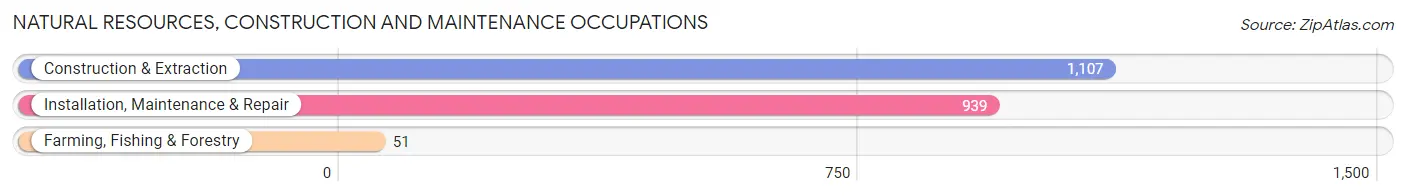
Natural Resources, Construction and Maintenance Occupations by Sex
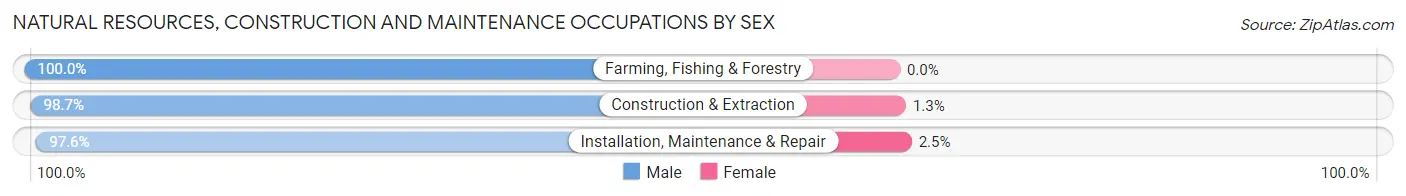
| Occupation | Male | Female |
| Farming, Fishing & Forestry | 51 (100.0%) | 0 (0.0%) |
| Construction & Extraction | 1,093 (98.7%) | 14 (1.3%) |
| Installation, Maintenance & Repair | 916 (97.6%) | 23 (2.5%) |
| Total (Category) | 2,060 (98.2%) | 37 (1.8%) |
| Total (Overall) | 15,083 (50.3%) | 14,881 (49.7%) |
Production, Transportation and Moving Occupations
The most common Production, Transportation and Moving occupations in McCracken County are Production (1,801 | 6.0%), Material Moving (1,226 | 4.1%), and Transportation (749 | 2.5%).
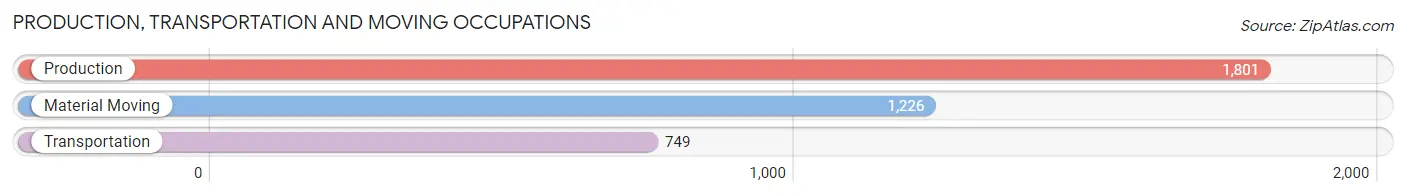
Production, Transportation and Moving Occupations by Sex
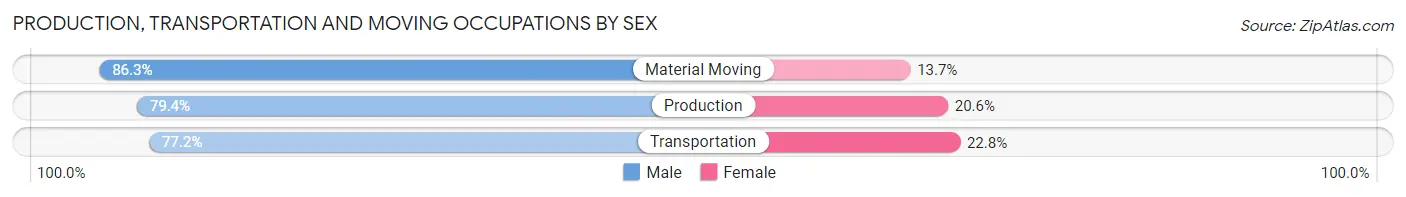
| Occupation | Male | Female |
| Production | 1,430 (79.4%) | 371 (20.6%) |
| Transportation | 578 (77.2%) | 171 (22.8%) |
| Material Moving | 1,058 (86.3%) | 168 (13.7%) |
| Total (Category) | 3,066 (81.2%) | 710 (18.8%) |
| Total (Overall) | 15,083 (50.3%) | 14,881 (49.7%) |
Employment Industries by Sex in McCracken County
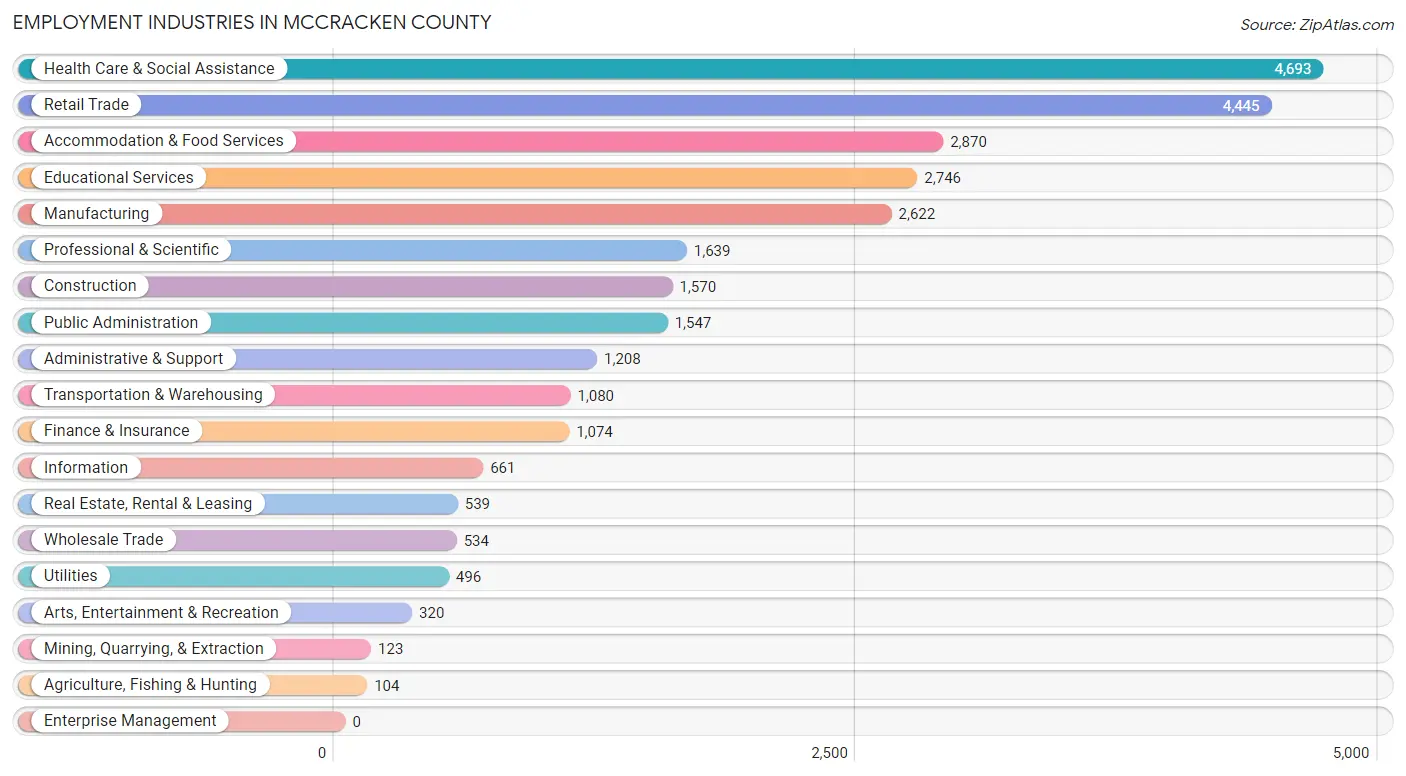
Employment Industries in McCracken County
The major employment industries in McCracken County include Health Care & Social Assistance (4,693 | 15.7%), Retail Trade (4,445 | 14.8%), Accommodation & Food Services (2,870 | 9.6%), Educational Services (2,746 | 9.2%), and Manufacturing (2,622 | 8.7%).
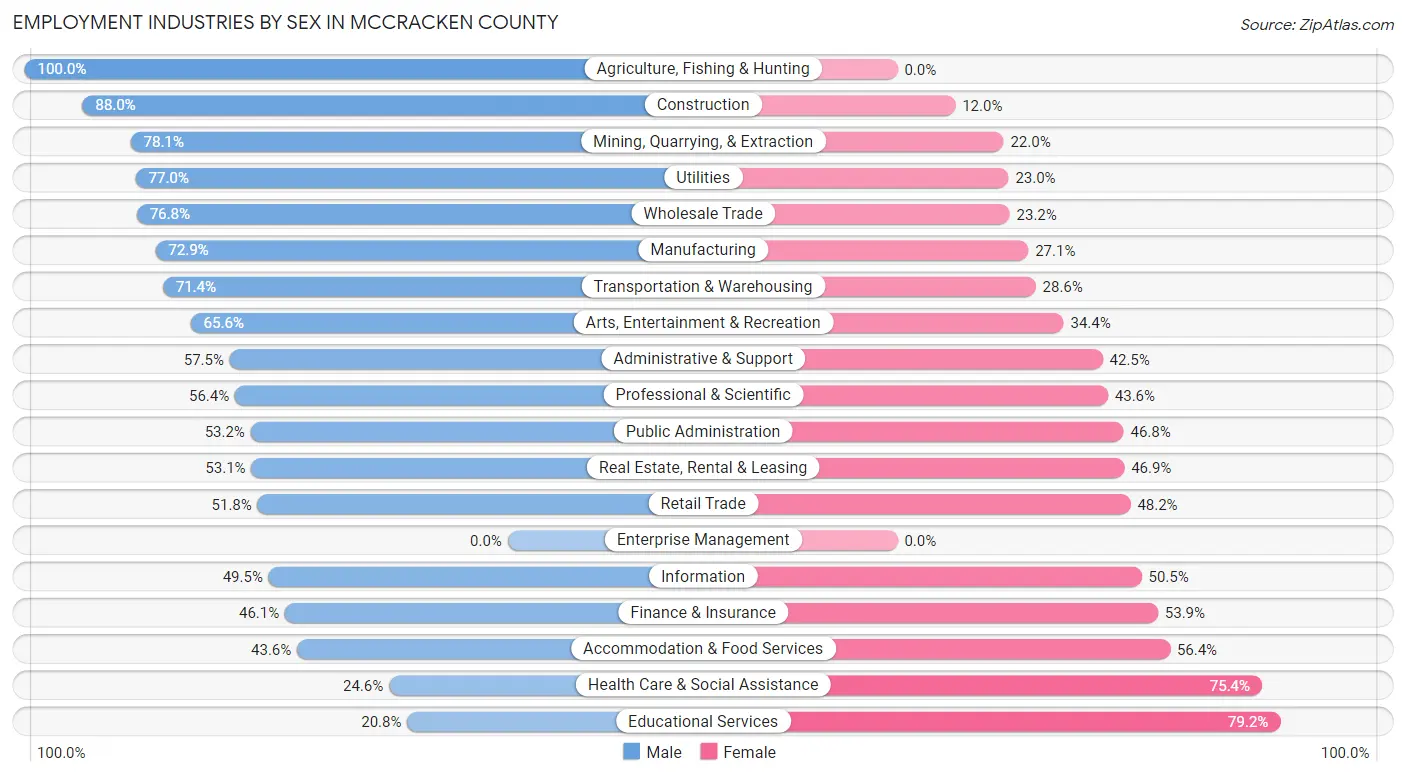
Employment Industries by Sex in McCracken County
The McCracken County industries that see more men than women are Agriculture, Fishing & Hunting (100.0%), Construction (88.0%), and Mining, Quarrying, & Extraction (78.0%), whereas the industries that tend to have a higher number of women are Educational Services (79.2%), Health Care & Social Assistance (75.4%), and Accommodation & Food Services (56.4%).
| Industry | Male | Female |
| Agriculture, Fishing & Hunting | 104 (100.0%) | 0 (0.0%) |
| Mining, Quarrying, & Extraction | 96 (78.0%) | 27 (22.0%) |
| Construction | 1,382 (88.0%) | 188 (12.0%) |
| Manufacturing | 1,912 (72.9%) | 710 (27.1%) |
| Wholesale Trade | 410 (76.8%) | 124 (23.2%) |
| Retail Trade | 2,301 (51.8%) | 2,144 (48.2%) |
| Transportation & Warehousing | 771 (71.4%) | 309 (28.6%) |
| Utilities | 382 (77.0%) | 114 (23.0%) |
| Information | 327 (49.5%) | 334 (50.5%) |
| Finance & Insurance | 495 (46.1%) | 579 (53.9%) |
| Real Estate, Rental & Leasing | 286 (53.1%) | 253 (46.9%) |
| Professional & Scientific | 925 (56.4%) | 714 (43.6%) |
| Enterprise Management | 0 (0.0%) | 0 (0.0%) |
| Administrative & Support | 695 (57.5%) | 513 (42.5%) |
| Educational Services | 571 (20.8%) | 2,175 (79.2%) |
| Health Care & Social Assistance | 1,153 (24.6%) | 3,540 (75.4%) |
| Arts, Entertainment & Recreation | 210 (65.6%) | 110 (34.4%) |
| Accommodation & Food Services | 1,251 (43.6%) | 1,619 (56.4%) |
| Public Administration | 823 (53.2%) | 724 (46.8%) |
| Total | 15,083 (50.3%) | 14,881 (49.7%) |
Education in McCracken County
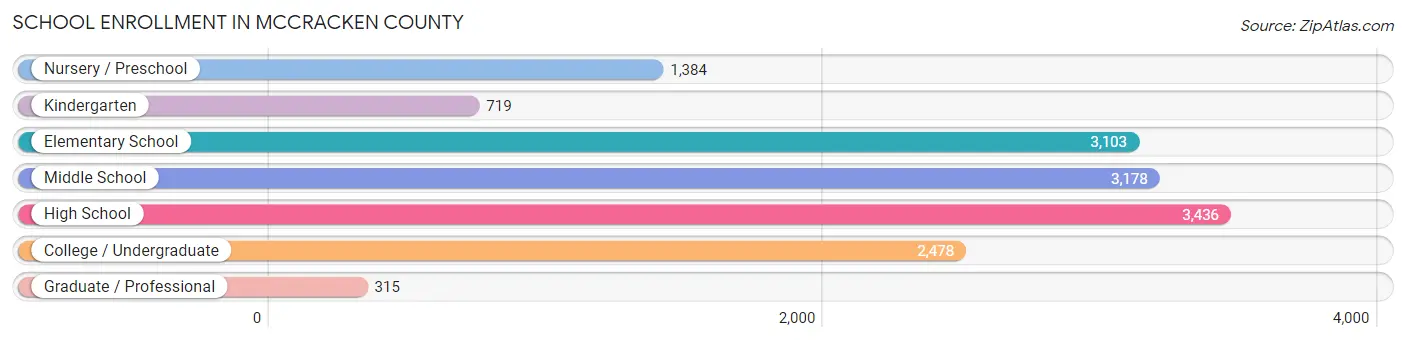
School Enrollment in McCracken County
The most common levels of schooling among the 14,613 students in McCracken County are high school (3,436 | 23.5%), middle school (3,178 | 21.7%), and elementary school (3,103 | 21.2%).
| School Level | # Students | % Students |
| Nursery / Preschool | 1,384 | 9.5% |
| Kindergarten | 719 | 4.9% |
| Elementary School | 3,103 | 21.2% |
| Middle School | 3,178 | 21.7% |
| High School | 3,436 | 23.5% |
| College / Undergraduate | 2,478 | 17.0% |
| Graduate / Professional | 315 | 2.2% |
| Total | 14,613 | 100.0% |
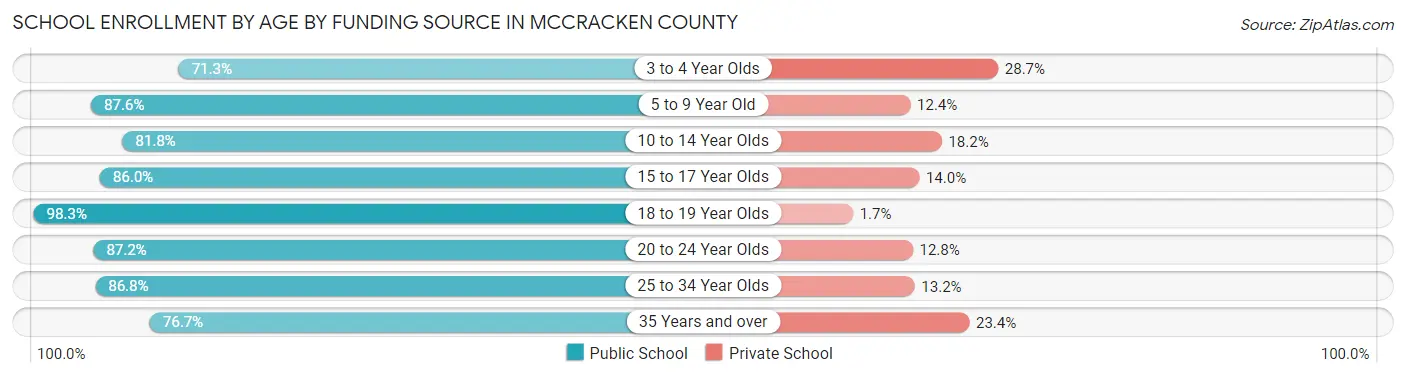
School Enrollment by Age by Funding Source in McCracken County
Out of a total of 14,613 students who are enrolled in schools in McCracken County, 2,177 (14.9%) attend a private institution, while the remaining 12,436 (85.1%) are enrolled in public schools. The age group of 3 to 4 year olds has the highest likelihood of being enrolled in private schools, with 282 (28.7% in the age bracket) enrolled. Conversely, the age group of 18 to 19 year olds has the lowest likelihood of being enrolled in a private school, with 1,172 (98.3% in the age bracket) attending a public institution.
| Age Bracket | Public School | Private School |
| 3 to 4 Year Olds | 700 (71.3%) | 282 (28.7%) |
| 5 to 9 Year Old | 3,316 (87.6%) | 468 (12.4%) |
| 10 to 14 Year Olds | 3,407 (81.8%) | 759 (18.2%) |
| 15 to 17 Year Olds | 2,003 (86.0%) | 327 (14.0%) |
| 18 to 19 Year Olds | 1,172 (98.3%) | 20 (1.7%) |
| 20 to 24 Year Olds | 924 (87.2%) | 136 (12.8%) |
| 25 to 34 Year Olds | 560 (86.8%) | 85 (13.2%) |
| 35 Years and over | 348 (76.6%) | 106 (23.4%) |
| Total | 12,436 (85.1%) | 2,177 (14.9%) |
Educational Attainment by Field of Study in McCracken County
Business (2,569 | 17.6%), education (2,541 | 17.4%), science & technology (1,558 | 10.7%), arts & humanities (1,089 | 7.5%), and bio, nature & agricultural (1,008 | 6.9%) are the most common fields of study among 14,592 individuals in McCracken County who have obtained a bachelor's degree or higher.
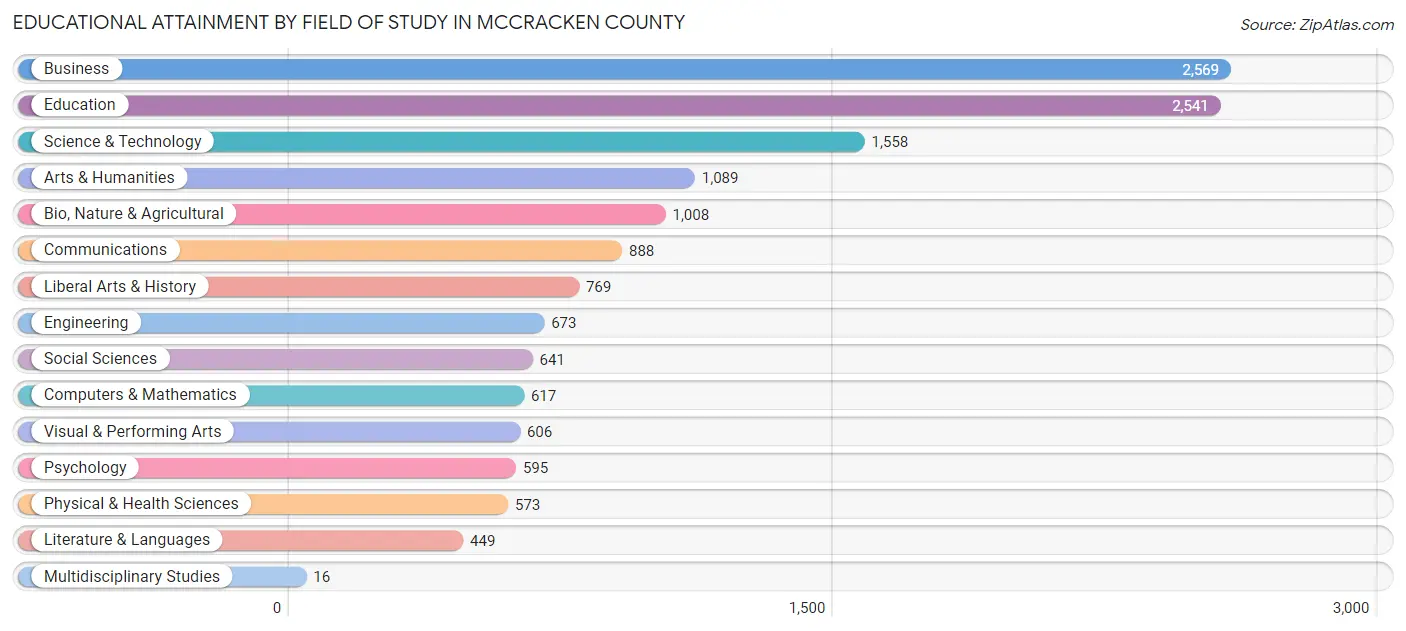
| Field of Study | # Graduates | % Graduates |
| Computers & Mathematics | 617 | 4.2% |
| Bio, Nature & Agricultural | 1,008 | 6.9% |
| Physical & Health Sciences | 573 | 3.9% |
| Psychology | 595 | 4.1% |
| Social Sciences | 641 | 4.4% |
| Engineering | 673 | 4.6% |
| Multidisciplinary Studies | 16 | 0.1% |
| Science & Technology | 1,558 | 10.7% |
| Business | 2,569 | 17.6% |
| Education | 2,541 | 17.4% |
| Literature & Languages | 449 | 3.1% |
| Liberal Arts & History | 769 | 5.3% |
| Visual & Performing Arts | 606 | 4.2% |
| Communications | 888 | 6.1% |
| Arts & Humanities | 1,089 | 7.5% |
| Total | 14,592 | 100.0% |
Transportation & Commute in McCracken County
Vehicle Availability by Sex in McCracken County
The most prevalent vehicle ownership categories in McCracken County are males with 2 vehicles (6,831, accounting for 45.8%) and females with 2 vehicles (6,108, making up 46.9%).
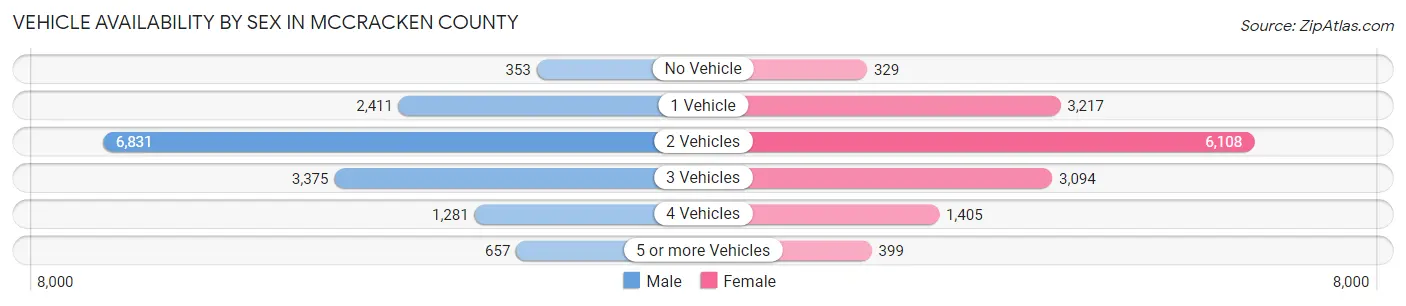
| Vehicles Available | Male | Female |
| No Vehicle | 353 (2.4%) | 329 (2.3%) |
| 1 Vehicle | 2,411 (16.2%) | 3,217 (22.1%) |
| 2 Vehicles | 6,831 (45.8%) | 6,108 (42.0%) |
| 3 Vehicles | 3,375 (22.6%) | 3,094 (21.3%) |
| 4 Vehicles | 1,281 (8.6%) | 1,405 (9.7%) |
| 5 or more Vehicles | 657 (4.4%) | 399 (2.7%) |
| Total | 14,908 (100.0%) | 14,552 (100.0%) |
Commute Time in McCracken County
The most frequently occuring commute durations in McCracken County are 10 to 14 minutes (9,289 commuters, 33.4%), 15 to 19 minutes (5,146 commuters, 18.5%), and 5 to 9 minutes (4,392 commuters, 15.8%).
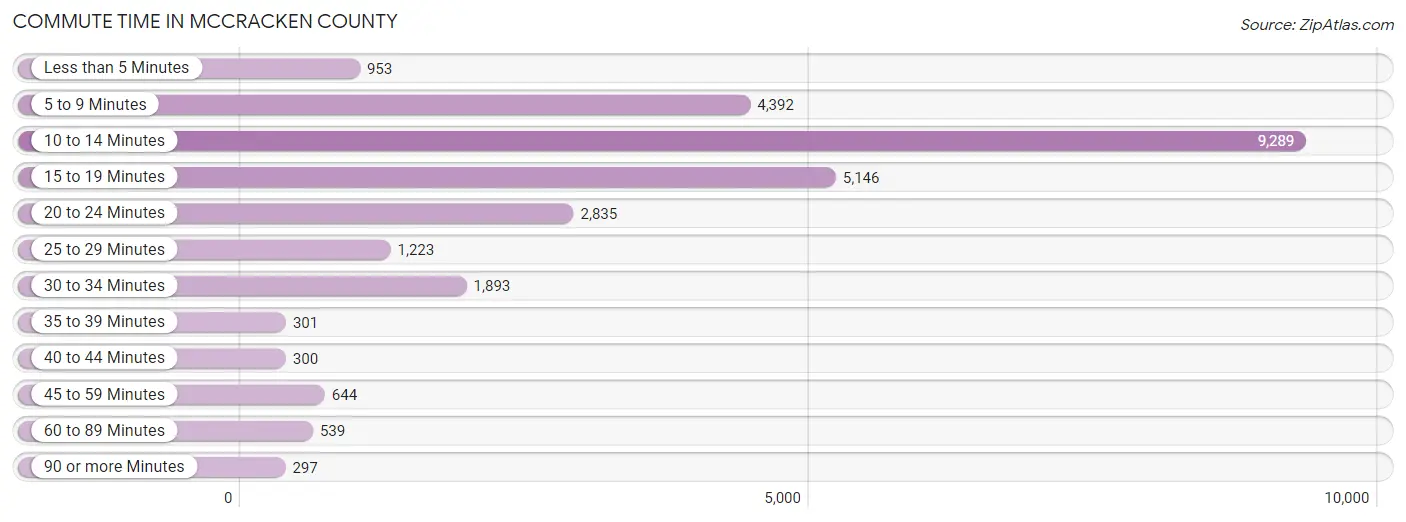
| Commute Time | # Commuters | % Commuters |
| Less than 5 Minutes | 953 | 3.4% |
| 5 to 9 Minutes | 4,392 | 15.8% |
| 10 to 14 Minutes | 9,289 | 33.4% |
| 15 to 19 Minutes | 5,146 | 18.5% |
| 20 to 24 Minutes | 2,835 | 10.2% |
| 25 to 29 Minutes | 1,223 | 4.4% |
| 30 to 34 Minutes | 1,893 | 6.8% |
| 35 to 39 Minutes | 301 | 1.1% |
| 40 to 44 Minutes | 300 | 1.1% |
| 45 to 59 Minutes | 644 | 2.3% |
| 60 to 89 Minutes | 539 | 1.9% |
| 90 or more Minutes | 297 | 1.1% |
Commute Time by Sex in McCracken County
The most common commute times in McCracken County are 10 to 14 minutes (4,873 commuters, 34.3%) for males and 10 to 14 minutes (4,416 commuters, 32.5%) for females.
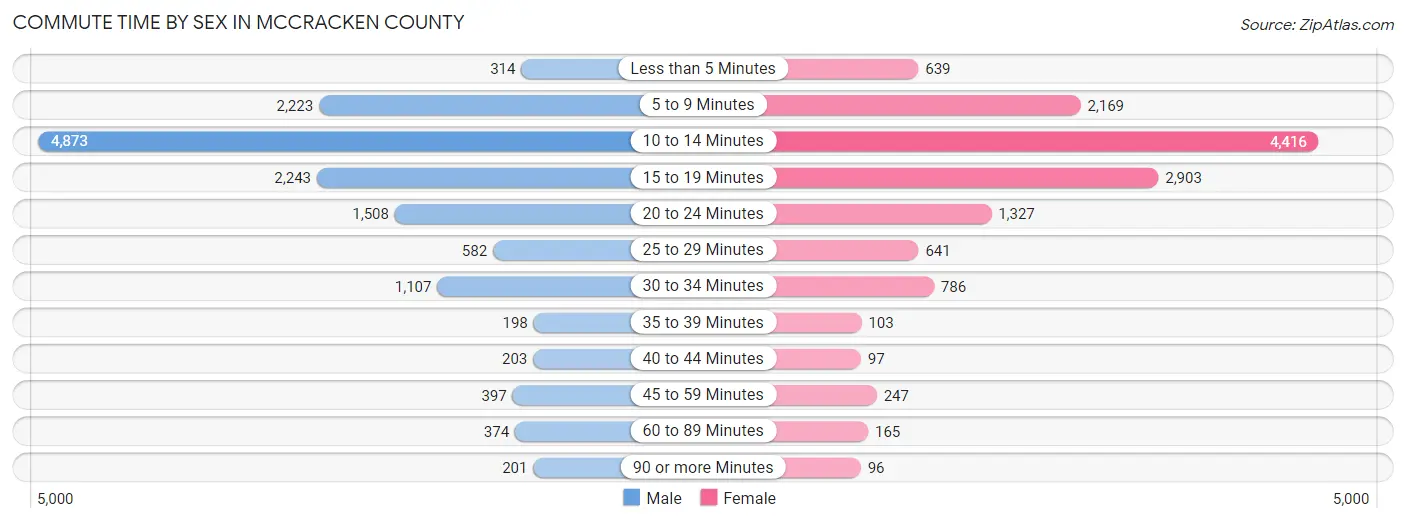
| Commute Time | Male | Female |
| Less than 5 Minutes | 314 (2.2%) | 639 (4.7%) |
| 5 to 9 Minutes | 2,223 (15.6%) | 2,169 (16.0%) |
| 10 to 14 Minutes | 4,873 (34.3%) | 4,416 (32.5%) |
| 15 to 19 Minutes | 2,243 (15.8%) | 2,903 (21.4%) |
| 20 to 24 Minutes | 1,508 (10.6%) | 1,327 (9.8%) |
| 25 to 29 Minutes | 582 (4.1%) | 641 (4.7%) |
| 30 to 34 Minutes | 1,107 (7.8%) | 786 (5.8%) |
| 35 to 39 Minutes | 198 (1.4%) | 103 (0.8%) |
| 40 to 44 Minutes | 203 (1.4%) | 97 (0.7%) |
| 45 to 59 Minutes | 397 (2.8%) | 247 (1.8%) |
| 60 to 89 Minutes | 374 (2.6%) | 165 (1.2%) |
| 90 or more Minutes | 201 (1.4%) | 96 (0.7%) |
Time of Departure to Work by Sex in McCracken County
The most frequent times of departure to work in McCracken County are 7:00 AM to 7:29 AM (2,108, 14.8%) for males and 7:00 AM to 7:29 AM (2,339, 17.2%) for females.
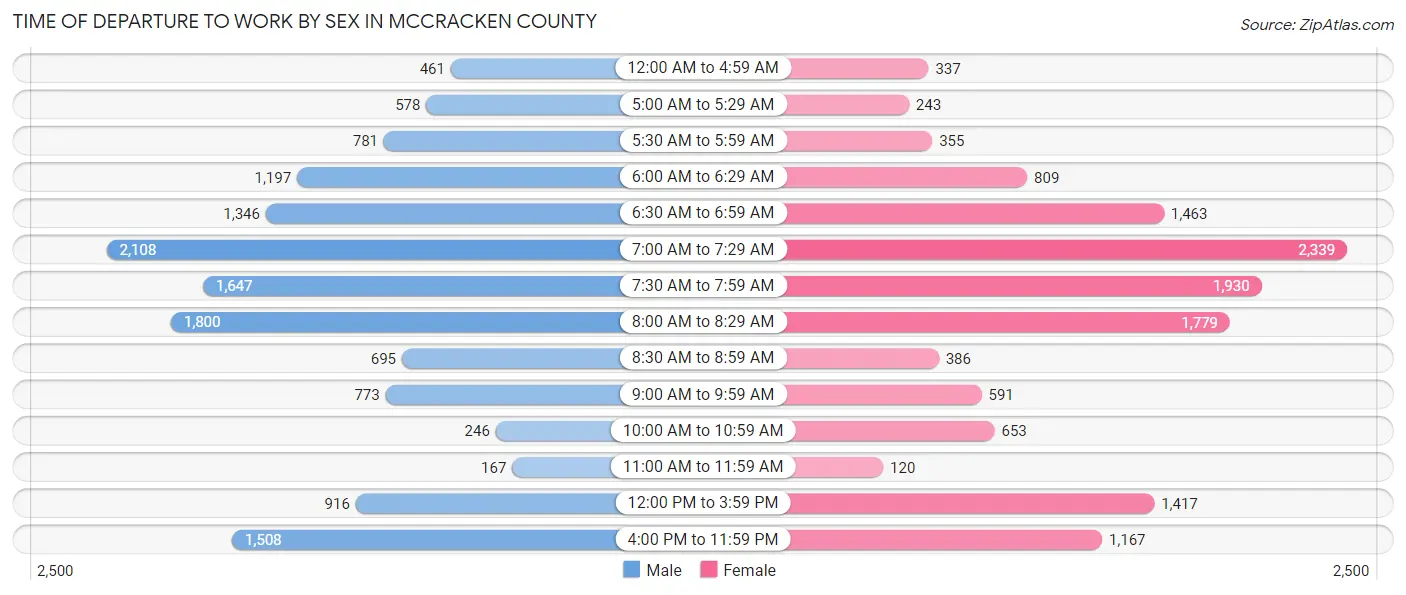
| Time of Departure | Male | Female |
| 12:00 AM to 4:59 AM | 461 (3.2%) | 337 (2.5%) |
| 5:00 AM to 5:29 AM | 578 (4.1%) | 243 (1.8%) |
| 5:30 AM to 5:59 AM | 781 (5.5%) | 355 (2.6%) |
| 6:00 AM to 6:29 AM | 1,197 (8.4%) | 809 (5.9%) |
| 6:30 AM to 6:59 AM | 1,346 (9.5%) | 1,463 (10.8%) |
| 7:00 AM to 7:29 AM | 2,108 (14.8%) | 2,339 (17.2%) |
| 7:30 AM to 7:59 AM | 1,647 (11.6%) | 1,930 (14.2%) |
| 8:00 AM to 8:29 AM | 1,800 (12.7%) | 1,779 (13.1%) |
| 8:30 AM to 8:59 AM | 695 (4.9%) | 386 (2.8%) |
| 9:00 AM to 9:59 AM | 773 (5.4%) | 591 (4.3%) |
| 10:00 AM to 10:59 AM | 246 (1.7%) | 653 (4.8%) |
| 11:00 AM to 11:59 AM | 167 (1.2%) | 120 (0.9%) |
| 12:00 PM to 3:59 PM | 916 (6.4%) | 1,417 (10.4%) |
| 4:00 PM to 11:59 PM | 1,508 (10.6%) | 1,167 (8.6%) |
| Total | 14,223 (100.0%) | 13,589 (100.0%) |
Housing Occupancy in McCracken County
Occupancy by Ownership in McCracken County
Of the total 27,000 dwellings in McCracken County, owner-occupied units account for 18,030 (66.8%), while renter-occupied units make up 8,970 (33.2%).
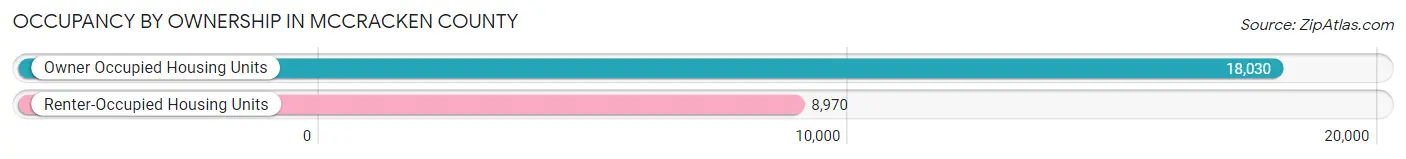
| Occupancy | # Housing Units | % Housing Units |
| Owner Occupied Housing Units | 18,030 | 66.8% |
| Renter-Occupied Housing Units | 8,970 | 33.2% |
| Total Occupied Housing Units | 27,000 | 100.0% |
Occupancy by Household Size in McCracken County
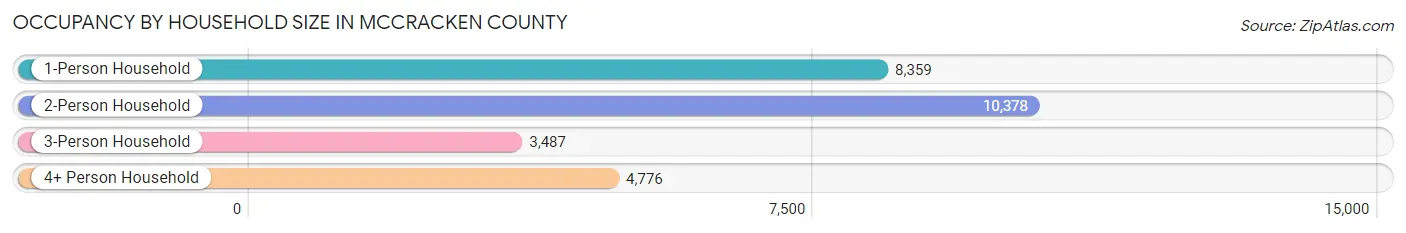
| Household Size | # Housing Units | % Housing Units |
| 1-Person Household | 8,359 | 31.0% |
| 2-Person Household | 10,378 | 38.4% |
| 3-Person Household | 3,487 | 12.9% |
| 4+ Person Household | 4,776 | 17.7% |
| Total Housing Units | 27,000 | 100.0% |
Occupancy by Ownership by Household Size in McCracken County
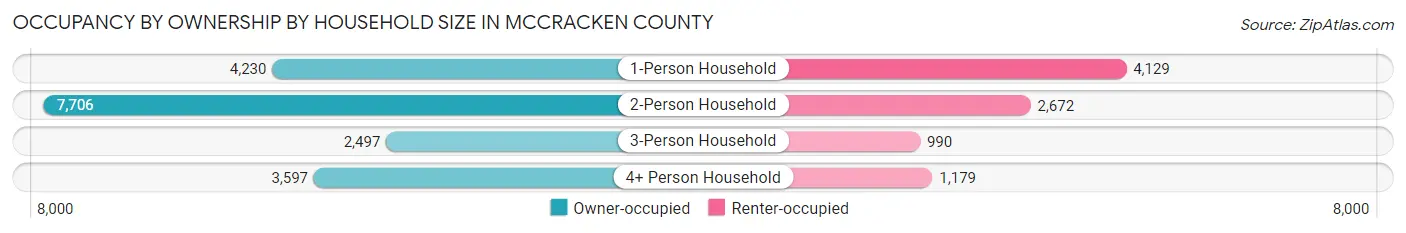
| Household Size | Owner-occupied | Renter-occupied |
| 1-Person Household | 4,230 (50.6%) | 4,129 (49.4%) |
| 2-Person Household | 7,706 (74.3%) | 2,672 (25.8%) |
| 3-Person Household | 2,497 (71.6%) | 990 (28.4%) |
| 4+ Person Household | 3,597 (75.3%) | 1,179 (24.7%) |
| Total Housing Units | 18,030 (66.8%) | 8,970 (33.2%) |
Occupancy by Educational Attainment in McCracken County
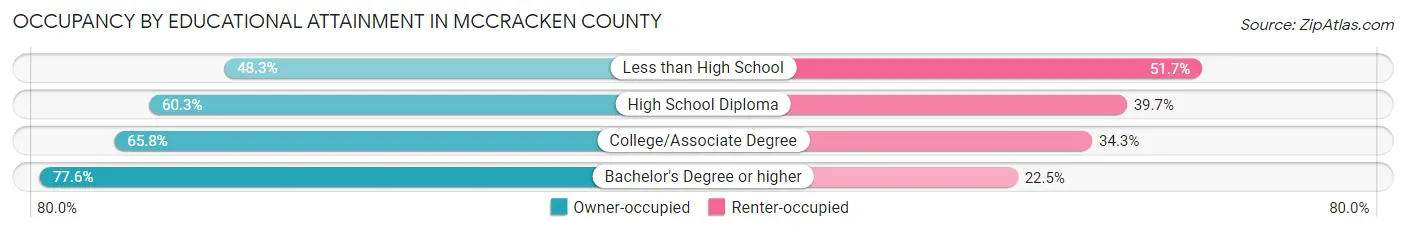
| Household Size | Owner-occupied | Renter-occupied |
| Less than High School | 736 (48.3%) | 787 (51.7%) |
| High School Diploma | 4,756 (60.3%) | 3,137 (39.7%) |
| College/Associate Degree | 6,122 (65.7%) | 3,189 (34.3%) |
| Bachelor's Degree or higher | 6,416 (77.5%) | 1,857 (22.5%) |
Occupancy by Age of Householder in McCracken County
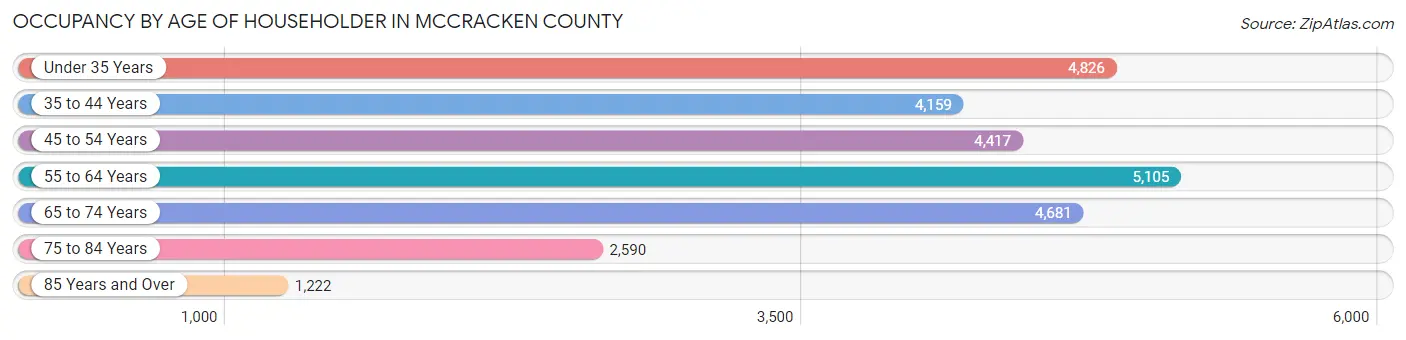
| Age Bracket | # Households | % Households |
| Under 35 Years | 4,826 | 17.9% |
| 35 to 44 Years | 4,159 | 15.4% |
| 45 to 54 Years | 4,417 | 16.4% |
| 55 to 64 Years | 5,105 | 18.9% |
| 65 to 74 Years | 4,681 | 17.3% |
| 75 to 84 Years | 2,590 | 9.6% |
| 85 Years and Over | 1,222 | 4.5% |
| Total | 27,000 | 100.0% |
Housing Finances in McCracken County
Median Income by Occupancy in McCracken County
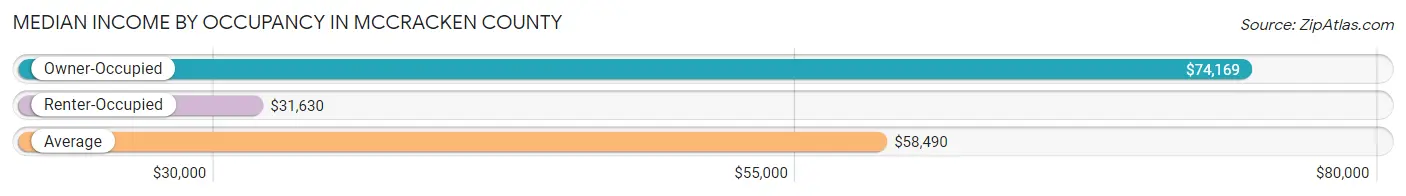
| Occupancy Type | # Households | Median Income |
| Owner-Occupied | 18,030 (66.8%) | $74,169 |
| Renter-Occupied | 8,970 (33.2%) | $31,630 |
| Average | 27,000 (100.0%) | $58,490 |
Occupancy by Householder Income Bracket in McCracken County
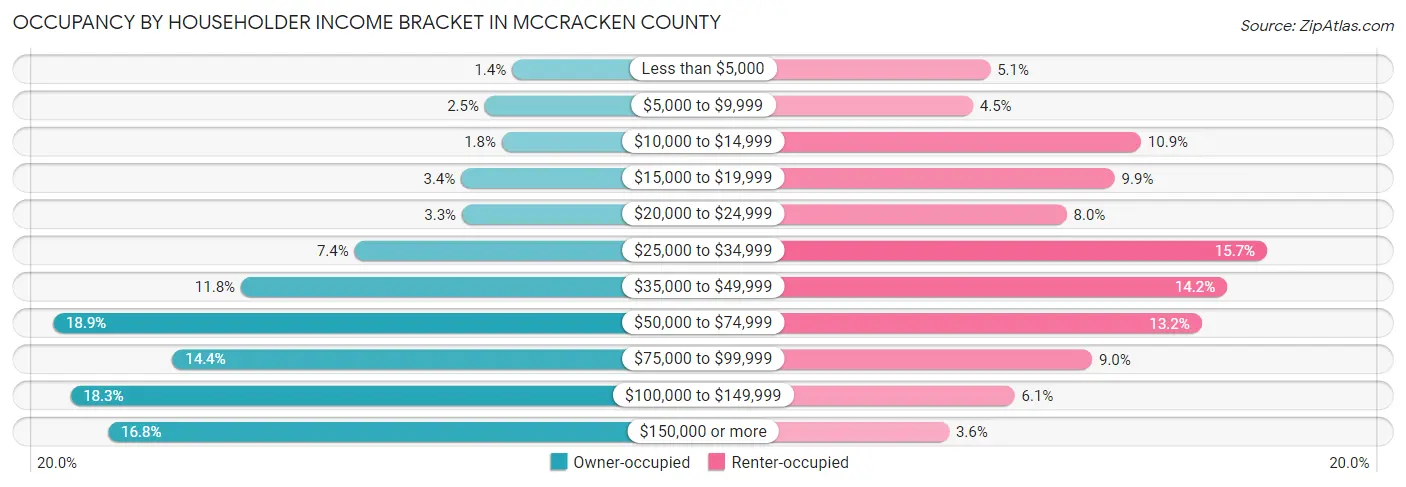
| Income Bracket | Owner-occupied | Renter-occupied |
| Less than $5,000 | 258 (1.4%) | 460 (5.1%) |
| $5,000 to $9,999 | 445 (2.5%) | 401 (4.5%) |
| $10,000 to $14,999 | 329 (1.8%) | 975 (10.9%) |
| $15,000 to $19,999 | 608 (3.4%) | 885 (9.9%) |
| $20,000 to $24,999 | 603 (3.3%) | 721 (8.0%) |
| $25,000 to $34,999 | 1,339 (7.4%) | 1,406 (15.7%) |
| $35,000 to $49,999 | 2,121 (11.8%) | 1,269 (14.1%) |
| $50,000 to $74,999 | 3,412 (18.9%) | 1,182 (13.2%) |
| $75,000 to $99,999 | 2,591 (14.4%) | 808 (9.0%) |
| $100,000 to $149,999 | 3,292 (18.3%) | 544 (6.1%) |
| $150,000 or more | 3,032 (16.8%) | 319 (3.6%) |
| Total | 18,030 (100.0%) | 8,970 (100.0%) |
Monthly Housing Cost Tiers in McCracken County
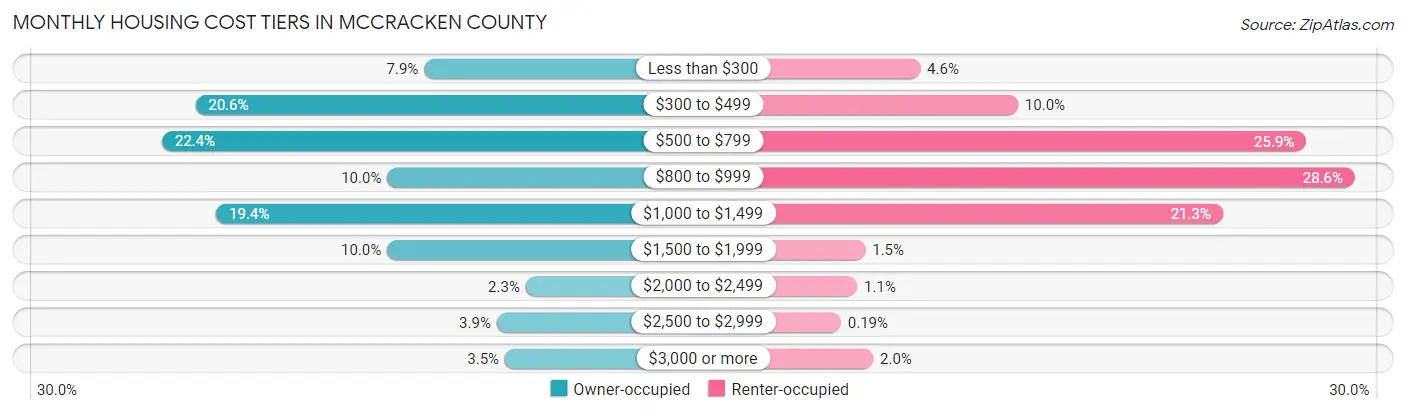
| Monthly Cost | Owner-occupied | Renter-occupied |
| Less than $300 | 1,429 (7.9%) | 410 (4.6%) |
| $300 to $499 | 3,709 (20.6%) | 894 (10.0%) |
| $500 to $799 | 4,043 (22.4%) | 2,322 (25.9%) |
| $800 to $999 | 1,798 (10.0%) | 2,564 (28.6%) |
| $1,000 to $1,499 | 3,501 (19.4%) | 1,909 (21.3%) |
| $1,500 to $1,999 | 1,800 (10.0%) | 138 (1.5%) |
| $2,000 to $2,499 | 418 (2.3%) | 98 (1.1%) |
| $2,500 to $2,999 | 706 (3.9%) | 17 (0.2%) |
| $3,000 or more | 626 (3.5%) | 177 (2.0%) |
| Total | 18,030 (100.0%) | 8,970 (100.0%) |
Physical Housing Characteristics in McCracken County
Housing Structures in McCracken County
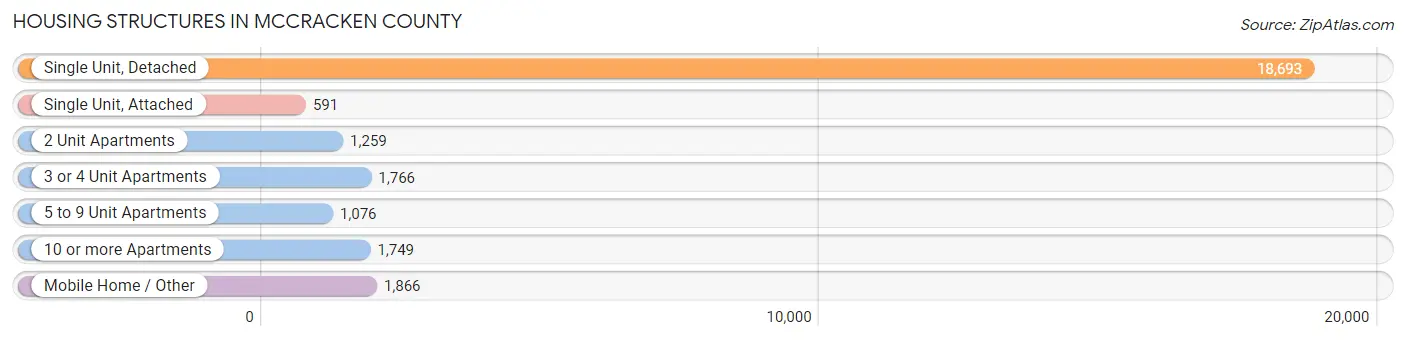
| Structure Type | # Housing Units | % Housing Units |
| Single Unit, Detached | 18,693 | 69.2% |
| Single Unit, Attached | 591 | 2.2% |
| 2 Unit Apartments | 1,259 | 4.7% |
| 3 or 4 Unit Apartments | 1,766 | 6.5% |
| 5 to 9 Unit Apartments | 1,076 | 4.0% |
| 10 or more Apartments | 1,749 | 6.5% |
| Mobile Home / Other | 1,866 | 6.9% |
| Total | 27,000 | 100.0% |
Housing Structures by Occupancy in McCracken County
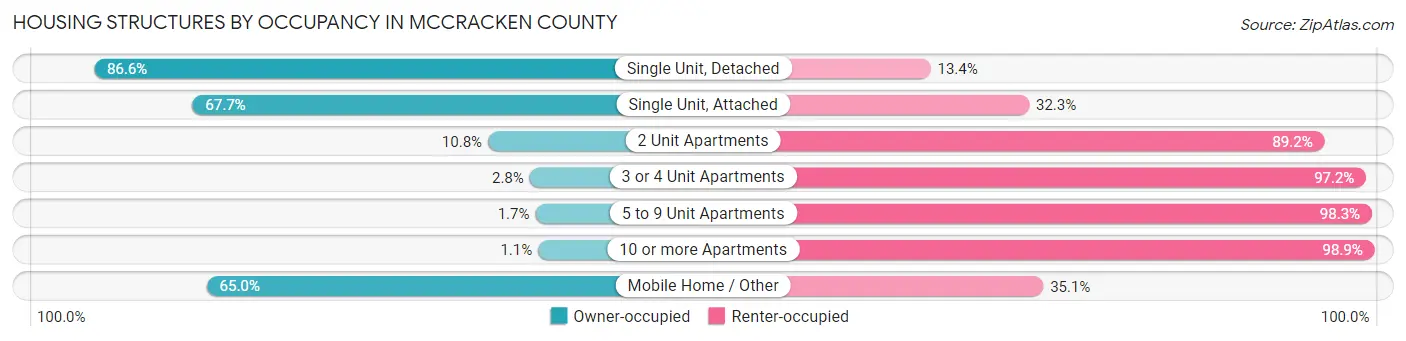
| Structure Type | Owner-occupied | Renter-occupied |
| Single Unit, Detached | 16,195 (86.6%) | 2,498 (13.4%) |
| Single Unit, Attached | 400 (67.7%) | 191 (32.3%) |
| 2 Unit Apartments | 136 (10.8%) | 1,123 (89.2%) |
| 3 or 4 Unit Apartments | 49 (2.8%) | 1,717 (97.2%) |
| 5 to 9 Unit Apartments | 18 (1.7%) | 1,058 (98.3%) |
| 10 or more Apartments | 20 (1.1%) | 1,729 (98.9%) |
| Mobile Home / Other | 1,212 (64.9%) | 654 (35.0%) |
| Total | 18,030 (66.8%) | 8,970 (33.2%) |
Housing Structures by Number of Rooms in McCracken County
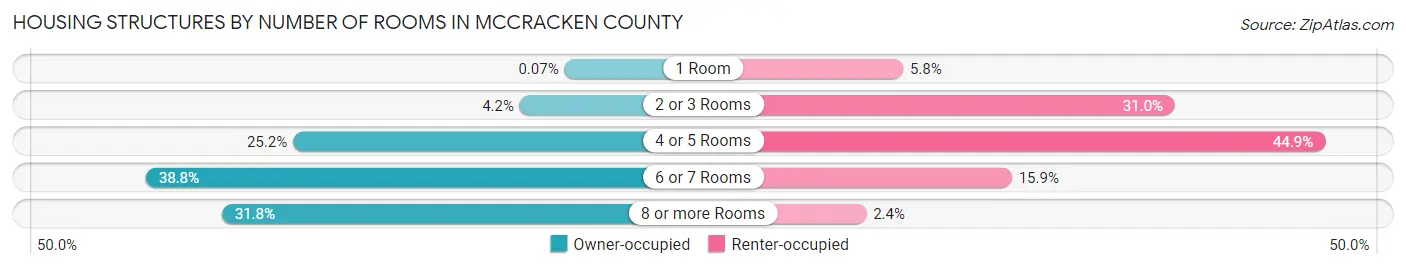
| Number of Rooms | Owner-occupied | Renter-occupied |
| 1 Room | 13 (0.1%) | 523 (5.8%) |
| 2 or 3 Rooms | 757 (4.2%) | 2,779 (31.0%) |
| 4 or 5 Rooms | 4,540 (25.2%) | 4,025 (44.9%) |
| 6 or 7 Rooms | 6,994 (38.8%) | 1,425 (15.9%) |
| 8 or more Rooms | 5,726 (31.8%) | 218 (2.4%) |
| Total | 18,030 (100.0%) | 8,970 (100.0%) |
Housing Structure by Heating Type in McCracken County
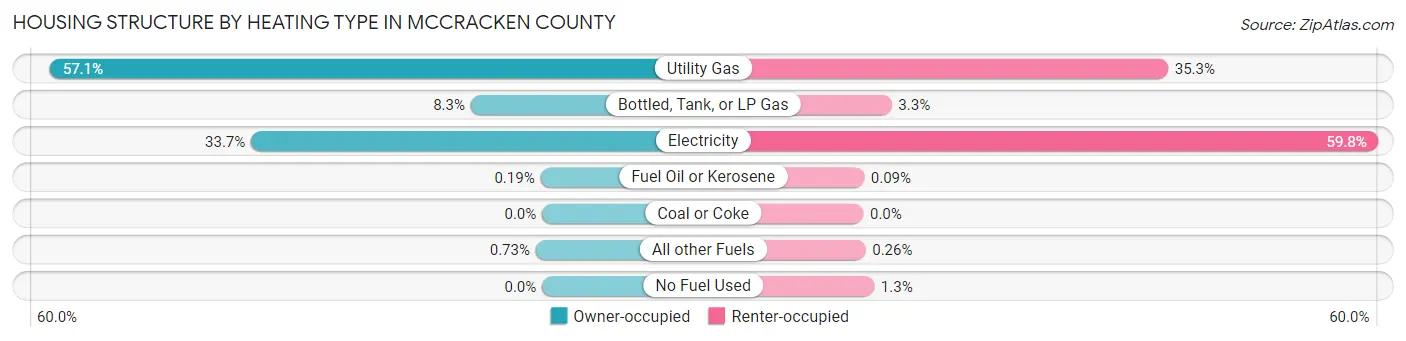
| Heating Type | Owner-occupied | Renter-occupied |
| Utility Gas | 10,289 (57.1%) | 3,169 (35.3%) |
| Bottled, Tank, or LP Gas | 1,491 (8.3%) | 295 (3.3%) |
| Electricity | 6,084 (33.7%) | 5,362 (59.8%) |
| Fuel Oil or Kerosene | 35 (0.2%) | 8 (0.1%) |
| Coal or Coke | 0 (0.0%) | 0 (0.0%) |
| All other Fuels | 131 (0.7%) | 23 (0.3%) |
| No Fuel Used | 0 (0.0%) | 113 (1.3%) |
| Total | 18,030 (100.0%) | 8,970 (100.0%) |
Household Vehicle Usage in McCracken County
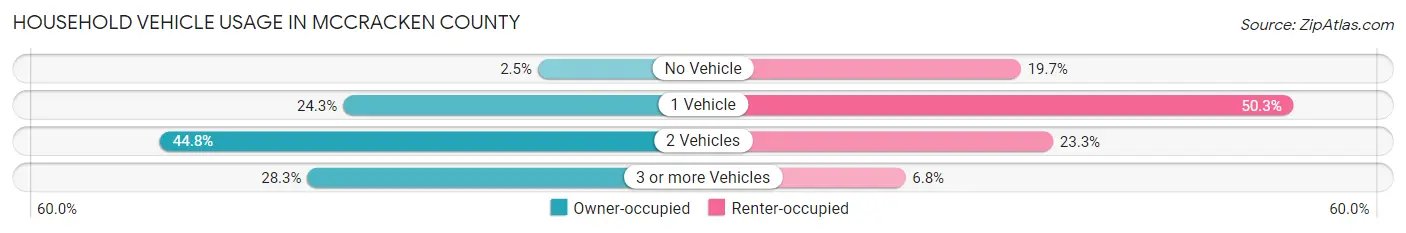
| Vehicles per Household | Owner-occupied | Renter-occupied |
| No Vehicle | 453 (2.5%) | 1,766 (19.7%) |
| 1 Vehicle | 4,386 (24.3%) | 4,507 (50.2%) |
| 2 Vehicles | 8,084 (44.8%) | 2,090 (23.3%) |
| 3 or more Vehicles | 5,107 (28.3%) | 607 (6.8%) |
| Total | 18,030 (100.0%) | 8,970 (100.0%) |
Real Estate & Mortgages in McCracken County
Real Estate and Mortgage Overview in McCracken County
| Characteristic | Without Mortgage | With Mortgage |
| Housing Units | 8,477 | 9,553 |
| Median Property Value | $165,100 | $178,300 |
| Median Household Income | $62,204 | $1,967 |
| Monthly Housing Costs | $469 | $571 |
| Real Estate Taxes | $1,011 | $254 |
Property Value by Mortgage Status in McCracken County
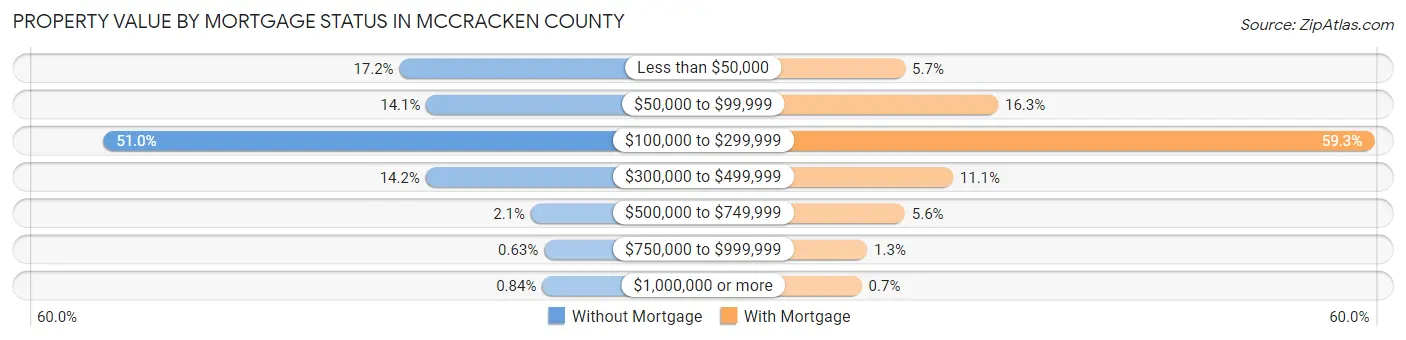
| Property Value | Without Mortgage | With Mortgage |
| Less than $50,000 | 1,455 (17.2%) | 542 (5.7%) |
| $50,000 to $99,999 | 1,194 (14.1%) | 1,556 (16.3%) |
| $100,000 to $299,999 | 4,323 (51.0%) | 5,661 (59.3%) |
| $300,000 to $499,999 | 1,200 (14.2%) | 1,062 (11.1%) |
| $500,000 to $749,999 | 181 (2.1%) | 538 (5.6%) |
| $750,000 to $999,999 | 53 (0.6%) | 127 (1.3%) |
| $1,000,000 or more | 71 (0.8%) | 67 (0.7%) |
| Total | 8,477 (100.0%) | 9,553 (100.0%) |
Household Income by Mortgage Status in McCracken County
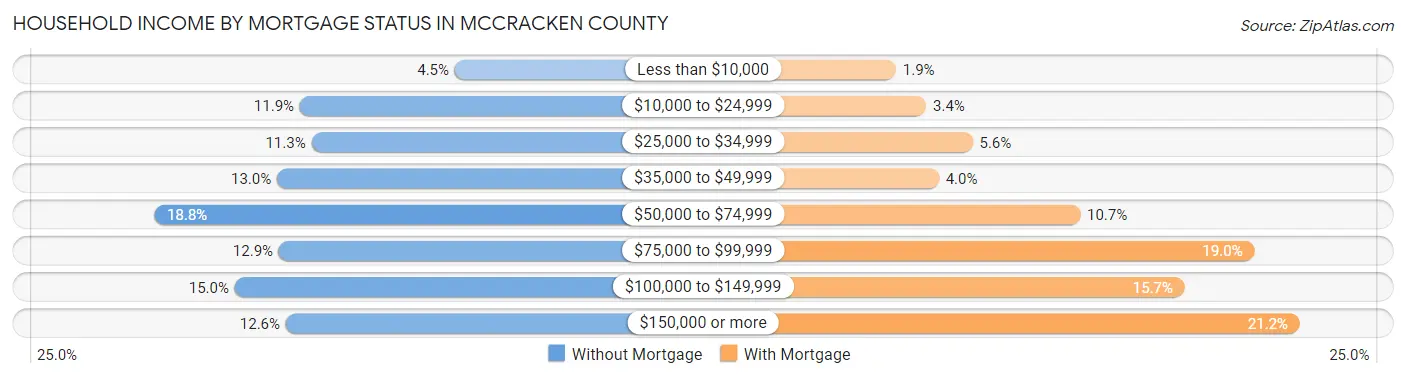
| Household Income | Without Mortgage | With Mortgage |
| Less than $10,000 | 382 (4.5%) | 183 (1.9%) |
| $10,000 to $24,999 | 1,008 (11.9%) | 321 (3.4%) |
| $25,000 to $34,999 | 961 (11.3%) | 532 (5.6%) |
| $35,000 to $49,999 | 1,100 (13.0%) | 378 (4.0%) |
| $50,000 to $74,999 | 1,597 (18.8%) | 1,021 (10.7%) |
| $75,000 to $99,999 | 1,093 (12.9%) | 1,815 (19.0%) |
| $100,000 to $149,999 | 1,271 (15.0%) | 1,498 (15.7%) |
| $150,000 or more | 1,065 (12.6%) | 2,021 (21.2%) |
| Total | 8,477 (100.0%) | 9,553 (100.0%) |
Property Value to Household Income Ratio in McCracken County
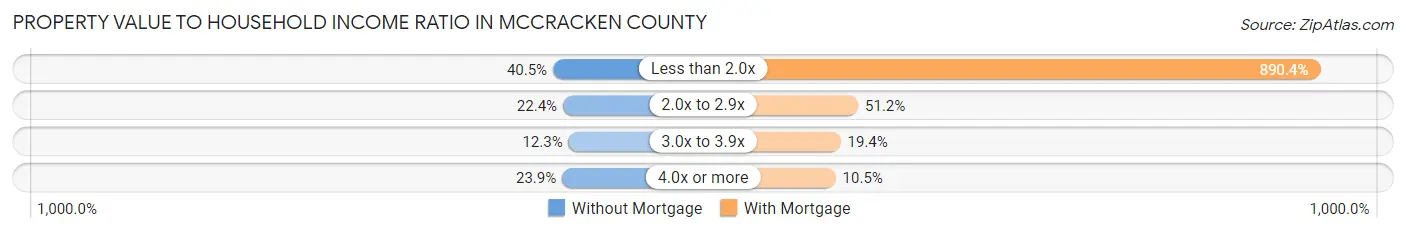
| Value-to-Income Ratio | Without Mortgage | With Mortgage |
| Less than 2.0x | 3,429 (40.5%) | 85,060 (890.4%) |
| 2.0x to 2.9x | 1,897 (22.4%) | 4,895 (51.2%) |
| 3.0x to 3.9x | 1,039 (12.3%) | 1,857 (19.4%) |
| 4.0x or more | 2,027 (23.9%) | 998 (10.4%) |
| Total | 8,477 (100.0%) | 9,553 (100.0%) |
Real Estate Taxes by Mortgage Status in McCracken County
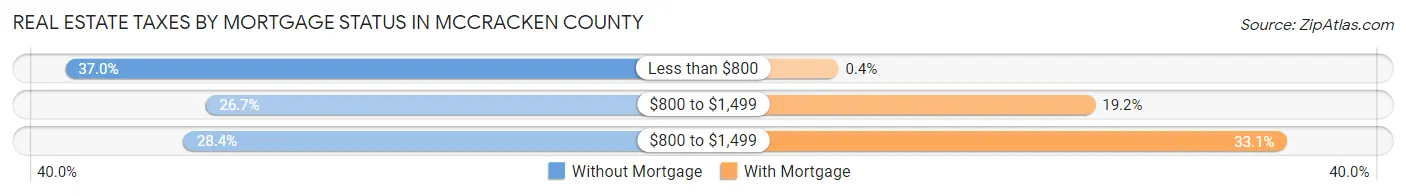
| Property Taxes | Without Mortgage | With Mortgage |
| Less than $800 | 3,139 (37.0%) | 38 (0.4%) |
| $800 to $1,499 | 2,265 (26.7%) | 1,830 (19.2%) |
| $800 to $1,499 | 2,404 (28.4%) | 3,164 (33.1%) |
| Total | 8,477 (100.0%) | 9,553 (100.0%) |
Health & Disability in McCracken County
Health Insurance Coverage by Age in McCracken County
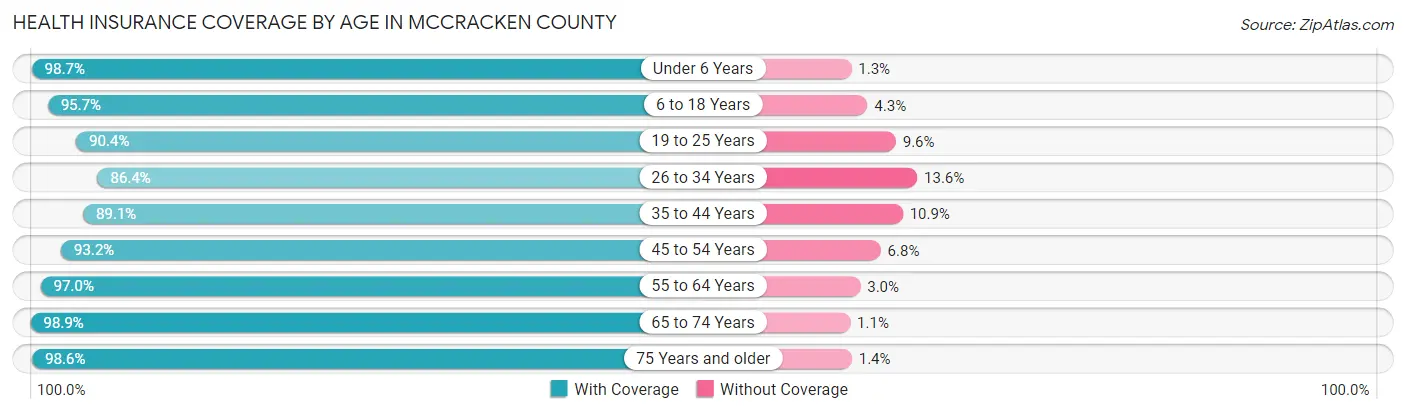
| Age Bracket | With Coverage | Without Coverage |
| Under 6 Years | 4,737 (98.7%) | 63 (1.3%) |
| 6 to 18 Years | 10,207 (95.7%) | 460 (4.3%) |
| 19 to 25 Years | 4,607 (90.4%) | 489 (9.6%) |
| 26 to 34 Years | 6,191 (86.4%) | 973 (13.6%) |
| 35 to 44 Years | 7,417 (89.1%) | 906 (10.9%) |
| 45 to 54 Years | 7,727 (93.2%) | 562 (6.8%) |
| 55 to 64 Years | 8,714 (97.0%) | 268 (3.0%) |
| 65 to 74 Years | 7,539 (98.9%) | 83 (1.1%) |
| 75 Years and older | 5,424 (98.6%) | 77 (1.4%) |
| Total | 62,563 (94.2%) | 3,881 (5.8%) |
Health Insurance Coverage by Citizenship Status in McCracken County
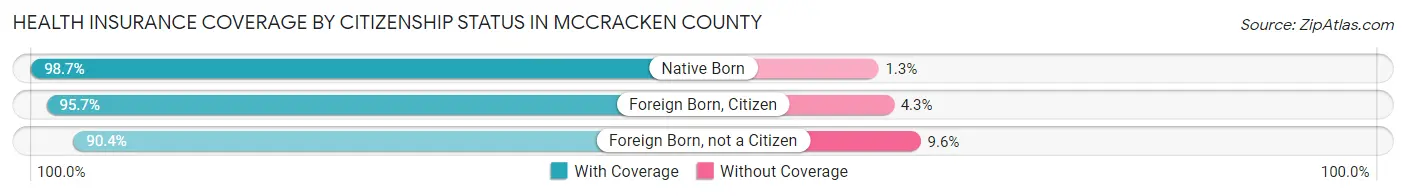
| Citizenship Status | With Coverage | Without Coverage |
| Native Born | 4,737 (98.7%) | 63 (1.3%) |
| Foreign Born, Citizen | 10,207 (95.7%) | 460 (4.3%) |
| Foreign Born, not a Citizen | 4,607 (90.4%) | 489 (9.6%) |
Health Insurance Coverage by Household Income in McCracken County
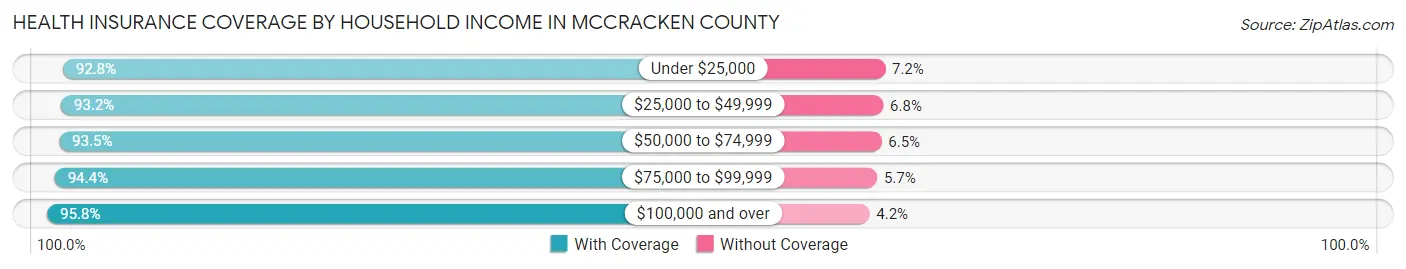
| Household Income | With Coverage | Without Coverage |
| Under $25,000 | 9,687 (92.8%) | 747 (7.2%) |
| $25,000 to $49,999 | 12,502 (93.2%) | 914 (6.8%) |
| $50,000 to $74,999 | 10,459 (93.5%) | 723 (6.5%) |
| $75,000 to $99,999 | 9,227 (94.4%) | 553 (5.7%) |
| $100,000 and over | 20,555 (95.8%) | 907 (4.2%) |
Public vs Private Health Insurance Coverage by Age in McCracken County
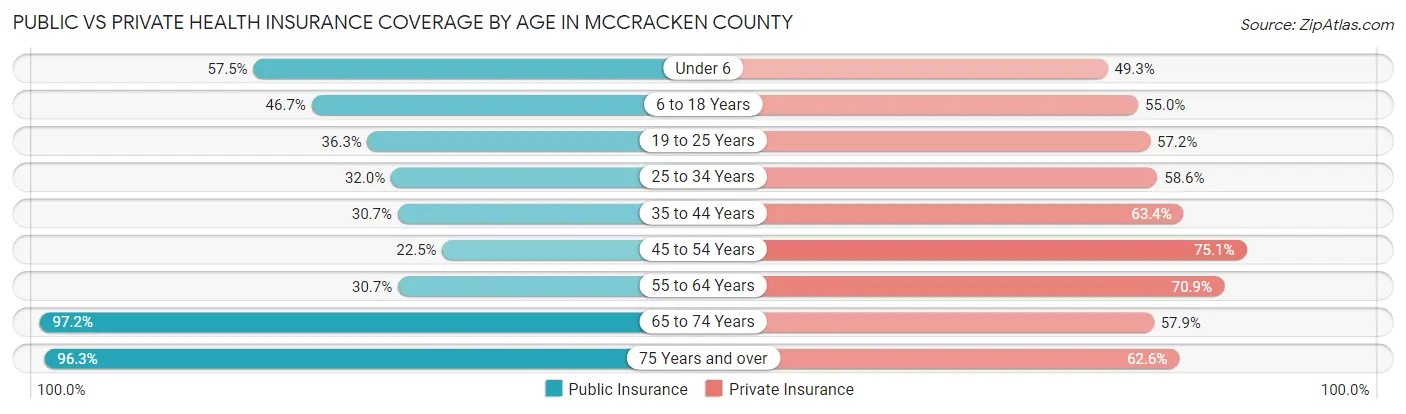
| Age Bracket | Public Insurance | Private Insurance |
| Under 6 | 2,761 (57.5%) | 2,368 (49.3%) |
| 6 to 18 Years | 4,984 (46.7%) | 5,868 (55.0%) |
| 19 to 25 Years | 1,851 (36.3%) | 2,916 (57.2%) |
| 25 to 34 Years | 2,292 (32.0%) | 4,195 (58.6%) |
| 35 to 44 Years | 2,558 (30.7%) | 5,280 (63.4%) |
| 45 to 54 Years | 1,861 (22.5%) | 6,222 (75.1%) |
| 55 to 64 Years | 2,757 (30.7%) | 6,368 (70.9%) |
| 65 to 74 Years | 7,410 (97.2%) | 4,412 (57.9%) |
| 75 Years and over | 5,299 (96.3%) | 3,445 (62.6%) |
| Total | 31,773 (47.8%) | 41,074 (61.8%) |
Disability Status by Sex by Age in McCracken County
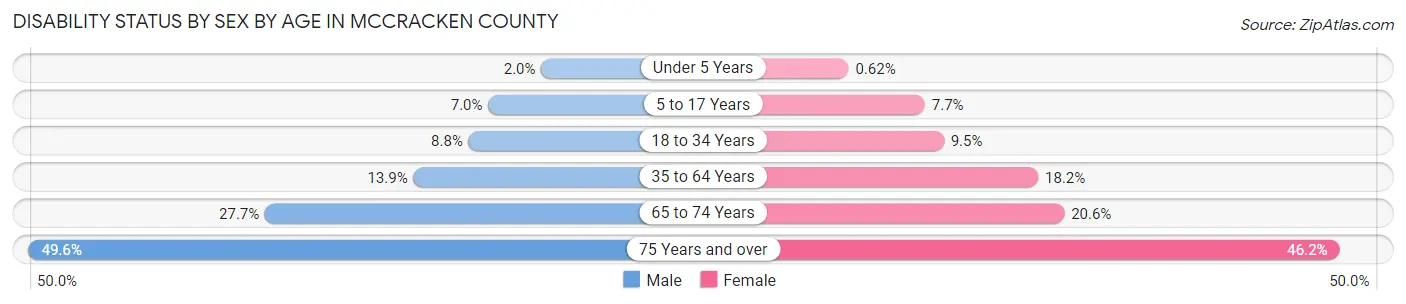
| Age Bracket | Male | Female |
| Under 5 Years | 44 (2.0%) | 11 (0.6%) |
| 5 to 17 Years | 380 (7.0%) | 410 (7.7%) |
| 18 to 34 Years | 561 (8.8%) | 628 (9.5%) |
| 35 to 64 Years | 1,766 (13.9%) | 2,350 (18.2%) |
| 65 to 74 Years | 955 (27.7%) | 861 (20.6%) |
| 75 Years and over | 1,062 (49.6%) | 1,552 (46.2%) |
Disability Class by Sex by Age in McCracken County
Disability Class: Hearing Difficulty
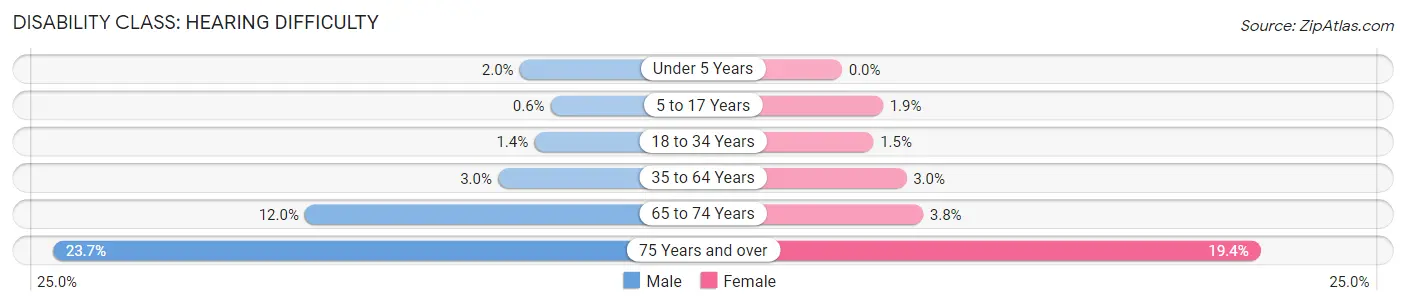
| Age Bracket | Male | Female |
| Under 5 Years | 44 (2.0%) | 0 (0.0%) |
| 5 to 17 Years | 33 (0.6%) | 101 (1.9%) |
| 18 to 34 Years | 87 (1.4%) | 97 (1.5%) |
| 35 to 64 Years | 386 (3.0%) | 386 (3.0%) |
| 65 to 74 Years | 414 (12.0%) | 157 (3.8%) |
| 75 Years and over | 507 (23.7%) | 653 (19.4%) |
Disability Class: Vision Difficulty
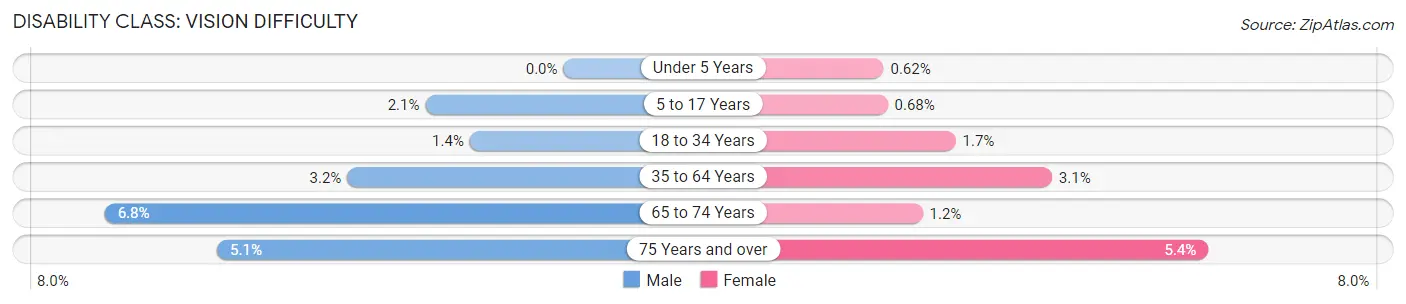
| Age Bracket | Male | Female |
| Under 5 Years | 0 (0.0%) | 11 (0.6%) |
| 5 to 17 Years | 112 (2.1%) | 36 (0.7%) |
| 18 to 34 Years | 89 (1.4%) | 112 (1.7%) |
| 35 to 64 Years | 408 (3.2%) | 402 (3.1%) |
| 65 to 74 Years | 235 (6.8%) | 50 (1.2%) |
| 75 Years and over | 110 (5.1%) | 183 (5.4%) |
Disability Class: Cognitive Difficulty
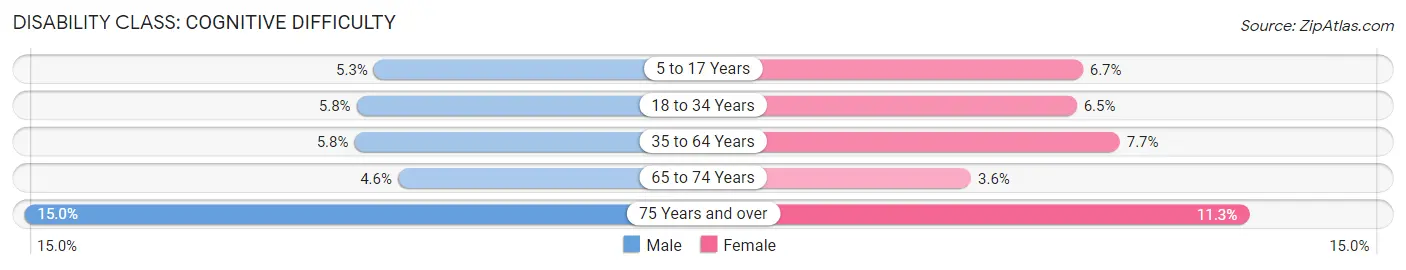
| Age Bracket | Male | Female |
| 5 to 17 Years | 288 (5.3%) | 357 (6.7%) |
| 18 to 34 Years | 368 (5.8%) | 434 (6.5%) |
| 35 to 64 Years | 739 (5.8%) | 998 (7.7%) |
| 65 to 74 Years | 159 (4.6%) | 150 (3.6%) |
| 75 Years and over | 321 (15.0%) | 381 (11.3%) |
Disability Class: Ambulatory Difficulty
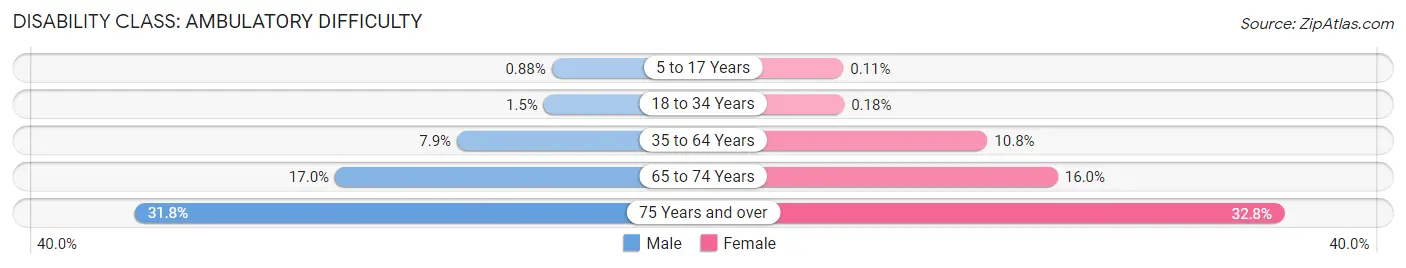
| Age Bracket | Male | Female |
| 5 to 17 Years | 48 (0.9%) | 6 (0.1%) |
| 18 to 34 Years | 93 (1.5%) | 12 (0.2%) |
| 35 to 64 Years | 1,003 (7.9%) | 1,394 (10.8%) |
| 65 to 74 Years | 585 (17.0%) | 669 (16.0%) |
| 75 Years and over | 681 (31.8%) | 1,103 (32.8%) |
Disability Class: Self-Care Difficulty
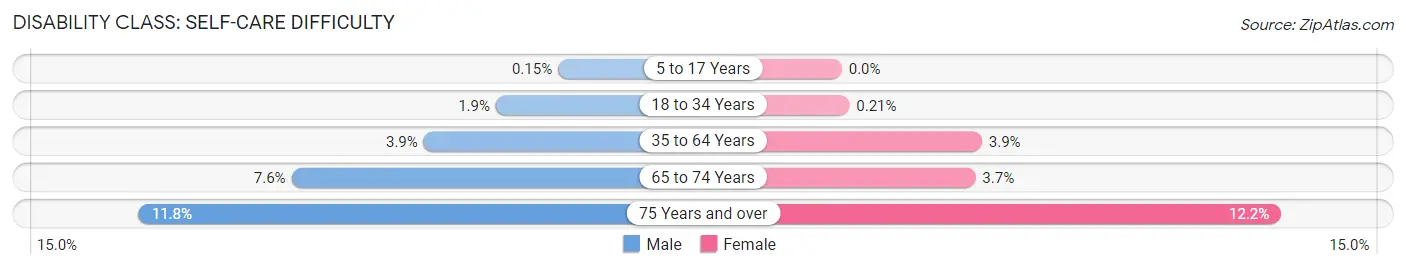
| Age Bracket | Male | Female |
| 5 to 17 Years | 8 (0.2%) | 0 (0.0%) |
| 18 to 34 Years | 120 (1.9%) | 14 (0.2%) |
| 35 to 64 Years | 494 (3.9%) | 503 (3.9%) |
| 65 to 74 Years | 261 (7.6%) | 155 (3.7%) |
| 75 Years and over | 253 (11.8%) | 411 (12.2%) |
Technology Access in McCracken County
Computing Device Access in McCracken County
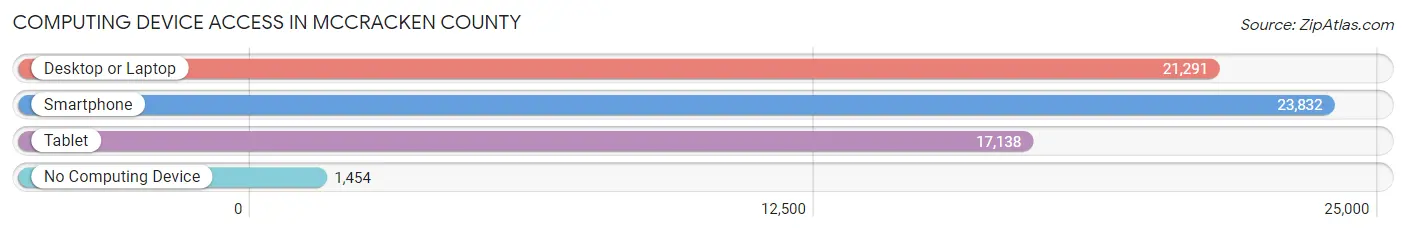
| Device Type | # Households | % Households |
| Desktop or Laptop | 21,291 | 78.9% |
| Smartphone | 23,832 | 88.3% |
| Tablet | 17,138 | 63.5% |
| No Computing Device | 1,454 | 5.4% |
| Total | 27,000 | 100.0% |
Internet Access in McCracken County
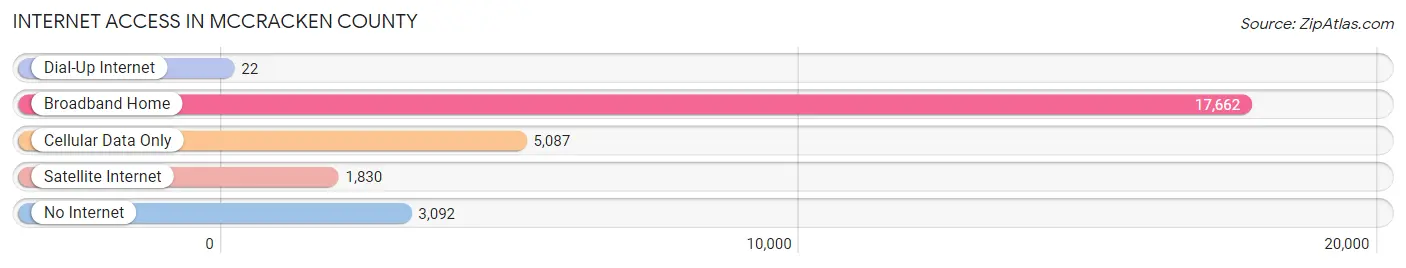
| Internet Type | # Households | % Households |
| Dial-Up Internet | 22 | 0.1% |
| Broadband Home | 17,662 | 65.4% |
| Cellular Data Only | 5,087 | 18.8% |
| Satellite Internet | 1,830 | 6.8% |
| No Internet | 3,092 | 11.5% |
| Total | 27,000 | 100.0% |
McCracken County Summary
Mccracken County, Kentucky is located in the western part of the state, along the Ohio River. It is bordered by Livingston County to the north, Marshall County to the east, Ballard County to the south, and McClean County to the west. The county seat is Paducah, which is also the largest city in the county. The county was established in 1825 and named after Captain Virgil McCracken, a Revolutionary War veteran.
Geography
Mccracken County covers an area of 517 square miles, making it the fourth largest county in Kentucky. The terrain is mostly flat, with some rolling hills in the northern part of the county. The highest point in the county is located in the northern part of the county, at an elevation of 545 feet. The county is drained by the Ohio River, which forms its western border. Other major waterways include the Tennessee River, which forms the eastern border, and the Little River, which flows through the county.
The climate of Mccracken County is humid subtropical, with hot, humid summers and mild winters. The average annual temperature is around 62 degrees Fahrenheit, with an average annual precipitation of around 45 inches.
Demographics
As of the 2010 census, Mccracken County had a population of 65,565. The racial makeup of the county was 87.3% White, 9.2% African American, 0.5% Native American, 0.7% Asian, 0.1% Pacific Islander, 1.2% from other races, and 1.1% from two or more races. Hispanic or Latino of any race were 2.7% of the population.
The median household income in Mccracken County was $41,945, and the median family income was $50,945. The per capita income was $21,945. About 11.2% of families and 14.3% of the population were below the poverty line, including 19.2% of those under age 18 and 10.2% of those age 65 or over.
Economy
Mccracken County’s economy is largely based on manufacturing and services. The county is home to several large manufacturing companies, including Paducah Power, a coal-fired power plant, and the Paducah Gaseous Diffusion Plant, a uranium enrichment facility. The county is also home to several large retail stores, including Walmart, Target, and Lowe’s.
The county is also home to several educational institutions, including West Kentucky Community and Technical College, Murray State University, and the University of Kentucky. The county is also home to several medical facilities, including the Lourdes Hospital and the Paducah VA Medical Center.
The county is served by the Paducah International Airport, which offers flights to several major cities in the United States. The county is also served by several major highways, including Interstate 24, US Route 60, and US Route 45.
Conclusion
Mccracken County, Kentucky is a large county located in the western part of the state, along the Ohio River. The county is home to several large manufacturing companies, educational institutions, and medical facilities. The county is served by the Paducah International Airport and several major highways. The population of the county is largely white, with a small percentage of African Americans, Native Americans, Asians, and other races. The median household income in the county is around $41,945, and the median family income is around $50,945. The county’s economy is largely based on manufacturing and services.
Common Questions
What is the Total Population of McCracken County?
Total Population of McCracken County is 67,573.
What is the Total Male Population of McCracken County?
Total Male Population of McCracken County is 32,855.
What is the Total Female Population of McCracken County?
Total Female Population of McCracken County is 34,718.
What is the Ratio of Males per 100 Females in McCracken County?
There are 94.63 Males per 100 Females in McCracken County.
What is the Ratio of Females per 100 Males in McCracken County?
There are 105.67 Females per 100 Males in McCracken County.
What is the Median Population Age in McCracken County?
Median Population Age in McCracken County is 42.5 Years.
What is the Average Family Size in McCracken County
Average Family Size in McCracken County is 3.1 People.
What is the Average Household Size in McCracken County
Average Household Size in McCracken County is 2.5 People.
What is Per Capita Income in McCracken County?
Per Capita income in McCracken County is $36,401.
What is the Median Family Income in McCracken County?
Median Family Income in McCracken County is $76,931.
What is the Median Household income in McCracken County?
Median Household Income in McCracken County is $58,490.
What is Income or Wage Gap in McCracken County?
Income or Wage Gap in McCracken County is 35.5%.
Women in McCracken County earn 64.5 cents for every dollar earned by a man.
What is Family Income Deficit in McCracken County?
Family Income Deficit in McCracken County is $12,657.
Families that are below poverty line in McCracken County earn $12,657 less on average than the poverty threshold level.
What is Inequality or Gini Index in McCracken County?
Inequality or Gini Index in McCracken County is 0.51.
How Large is the Labor Force in McCracken County?
There are 31,064 People in the Labor Forcein in McCracken County.
What is the Percentage of People in the Labor Force in McCracken County?
57.0% of People are in the Labor Force in McCracken County.
What is the Unemployment Rate in McCracken County?
Unemployment Rate in McCracken County is 3.6%.