Livingston County, KY
Livingston County Map
Livingston County Overview
8,980
TOTAL POPULATION
4,444
MALE POPULATION
4,536
FEMALE POPULATION
97.97
MALES / 100 FEMALES
102.07
FEMALES / 100 MALES
46.0
MEDIAN AGE
3.1
AVG FAMILY SIZE
2.5
AVG HOUSEHOLD SIZE
$31,024
PER CAPITA INCOME
$67,561
AVG FAMILY INCOME
$56,125
AVG HOUSEHOLD INCOME
31.9%
WAGE / INCOME GAP [ % ]
68.1¢/ $1
WAGE / INCOME GAP [ $ ]
$17,924
FAMILY INCOME DEFICIT
0.47
INEQUALITY / GINI INDEX
4,088
LABOR FORCE [ PEOPLE ]
55.0%
PERCENT IN LABOR FORCE
6.1%
UNEMPLOYMENT RATE
Livingston County Area Codes
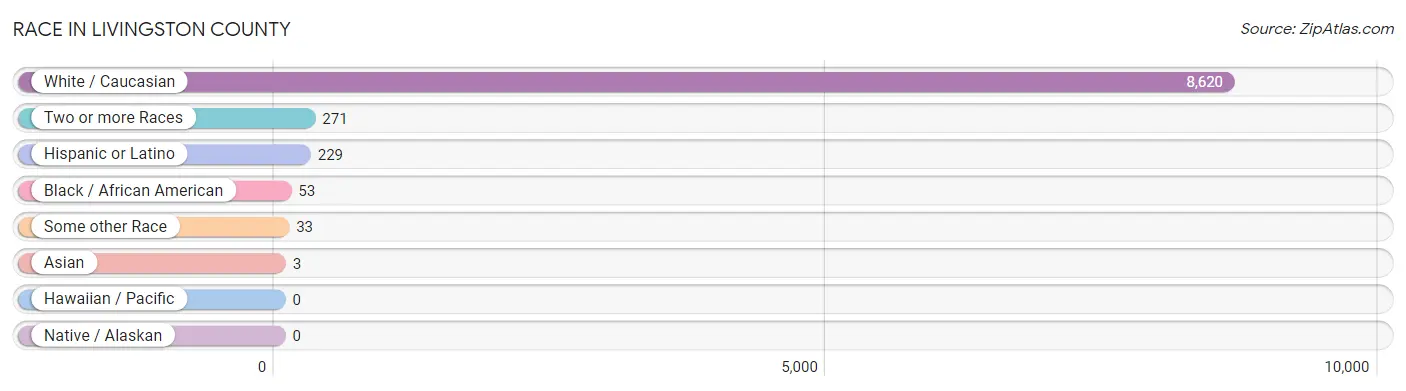
Race in Livingston County
The most populous races in Livingston County are White / Caucasian (8,620 | 96.0%), Two or more Races (271 | 3.0%), and Hispanic or Latino (229 | 2.5%).
| Race | # Population | % Population |
| Asian | 3 | 0.0% |
| Black / African American | 53 | 0.6% |
| Hawaiian / Pacific | 0 | 0.0% |
| Hispanic or Latino | 229 | 2.5% |
| Native / Alaskan | 0 | 0.0% |
| White / Caucasian | 8,620 | 96.0% |
| Two or more Races | 271 | 3.0% |
| Some other Race | 33 | 0.4% |
| Total | 8,980 | 100.0% |
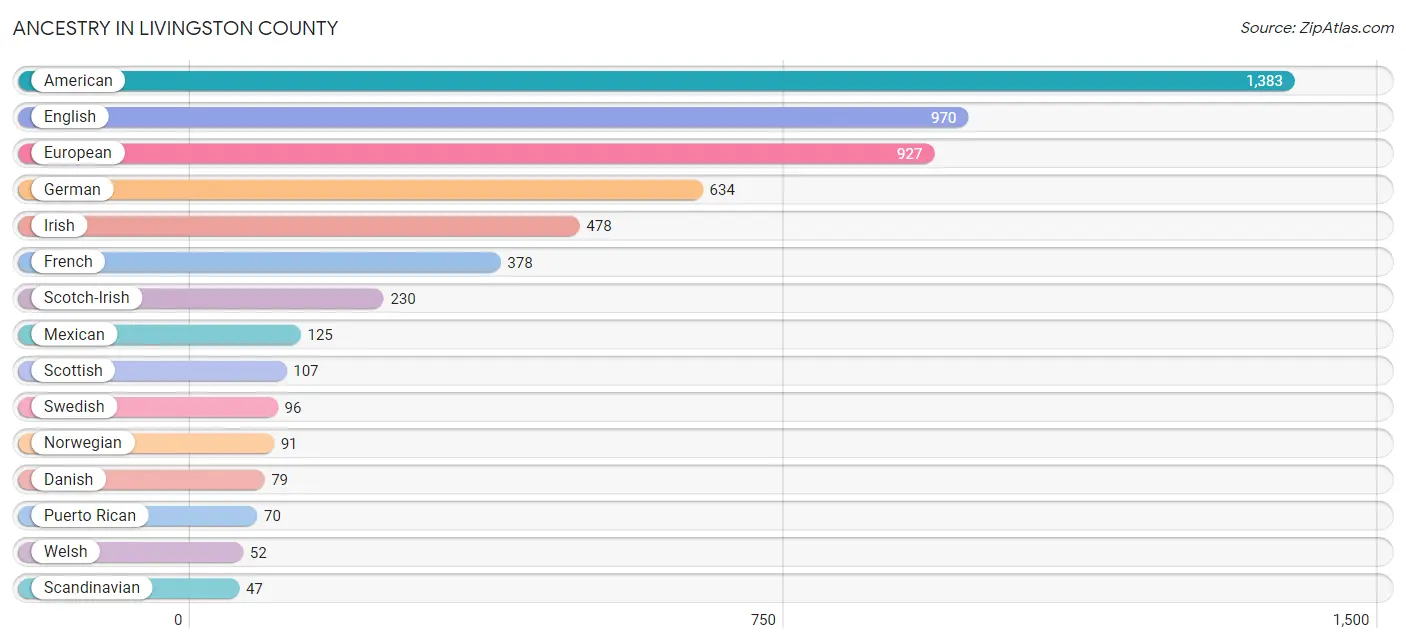
Ancestry in Livingston County
The most populous ancestries reported in Livingston County are American (1,383 | 15.4%), English (970 | 10.8%), European (927 | 10.3%), German (634 | 7.1%), and Irish (478 | 5.3%), together accounting for 48.9% of all Livingston County residents.
| Ancestry | # Population | % Population |
| African | 13 | 0.1% |
| American | 1,383 | 15.4% |
| British | 4 | 0.0% |
| Burmese | 19 | 0.2% |
| Cherokee | 40 | 0.4% |
| Croatian | 16 | 0.2% |
| Czechoslovakian | 22 | 0.2% |
| Danish | 79 | 0.9% |
| Dutch | 12 | 0.1% |
| Eastern European | 2 | 0.0% |
| English | 970 | 10.8% |
| Estonian | 13 | 0.1% |
| European | 927 | 10.3% |
| French | 378 | 4.2% |
| French Canadian | 1 | 0.0% |
| German | 634 | 7.1% |
| Indian (Asian) | 3 | 0.0% |
| Irish | 478 | 5.3% |
| Italian | 33 | 0.4% |
| Lithuanian | 18 | 0.2% |
| Mexican | 125 | 1.4% |
| Northern European | 11 | 0.1% |
| Norwegian | 91 | 1.0% |
| Polish | 4 | 0.0% |
| Portuguese | 32 | 0.4% |
| Puerto Rican | 70 | 0.8% |
| Scandinavian | 47 | 0.5% |
| Scotch-Irish | 230 | 2.6% |
| Scottish | 107 | 1.2% |
| Sioux | 2 | 0.0% |
| Slavic | 1 | 0.0% |
| Slovak | 25 | 0.3% |
| South American | 6 | 0.1% |
| Spaniard | 24 | 0.3% |
| Subsaharan African | 13 | 0.1% |
| Swedish | 96 | 1.1% |
| Swiss | 1 | 0.0% |
| Thai | 17 | 0.2% |
| Ukrainian | 2 | 0.0% |
| Welsh | 52 | 0.6% | View All 40 Rows |
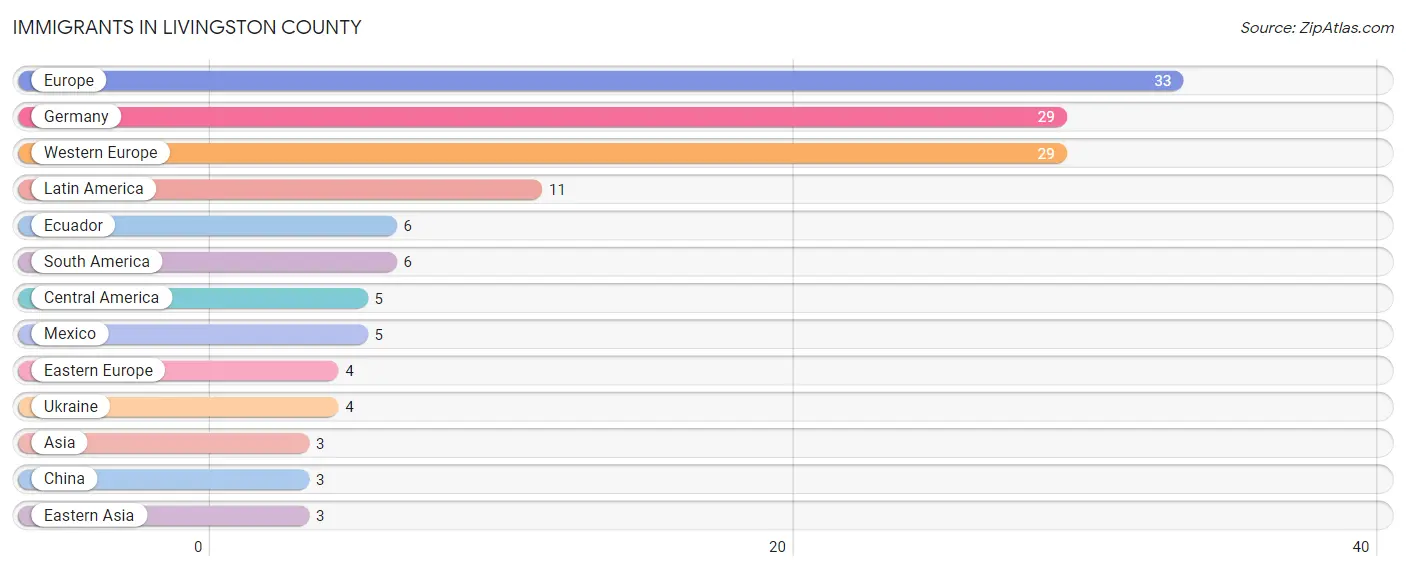
Immigrants in Livingston County
The most numerous immigrant groups reported in Livingston County came from Europe (33 | 0.4%), Germany (29 | 0.3%), Western Europe (29 | 0.3%), Latin America (11 | 0.1%), and Ecuador (6 | 0.1%), together accounting for 1.2% of all Livingston County residents.
| Immigration Origin | # Population | % Population |
| Asia | 3 | 0.0% |
| Central America | 5 | 0.1% |
| China | 3 | 0.0% |
| Eastern Asia | 3 | 0.0% |
| Eastern Europe | 4 | 0.0% |
| Ecuador | 6 | 0.1% |
| Europe | 33 | 0.4% |
| Germany | 29 | 0.3% |
| Latin America | 11 | 0.1% |
| Mexico | 5 | 0.1% |
| South America | 6 | 0.1% |
| Ukraine | 4 | 0.0% |
| Western Europe | 29 | 0.3% | View All 13 Rows |
Sex and Age in Livingston County
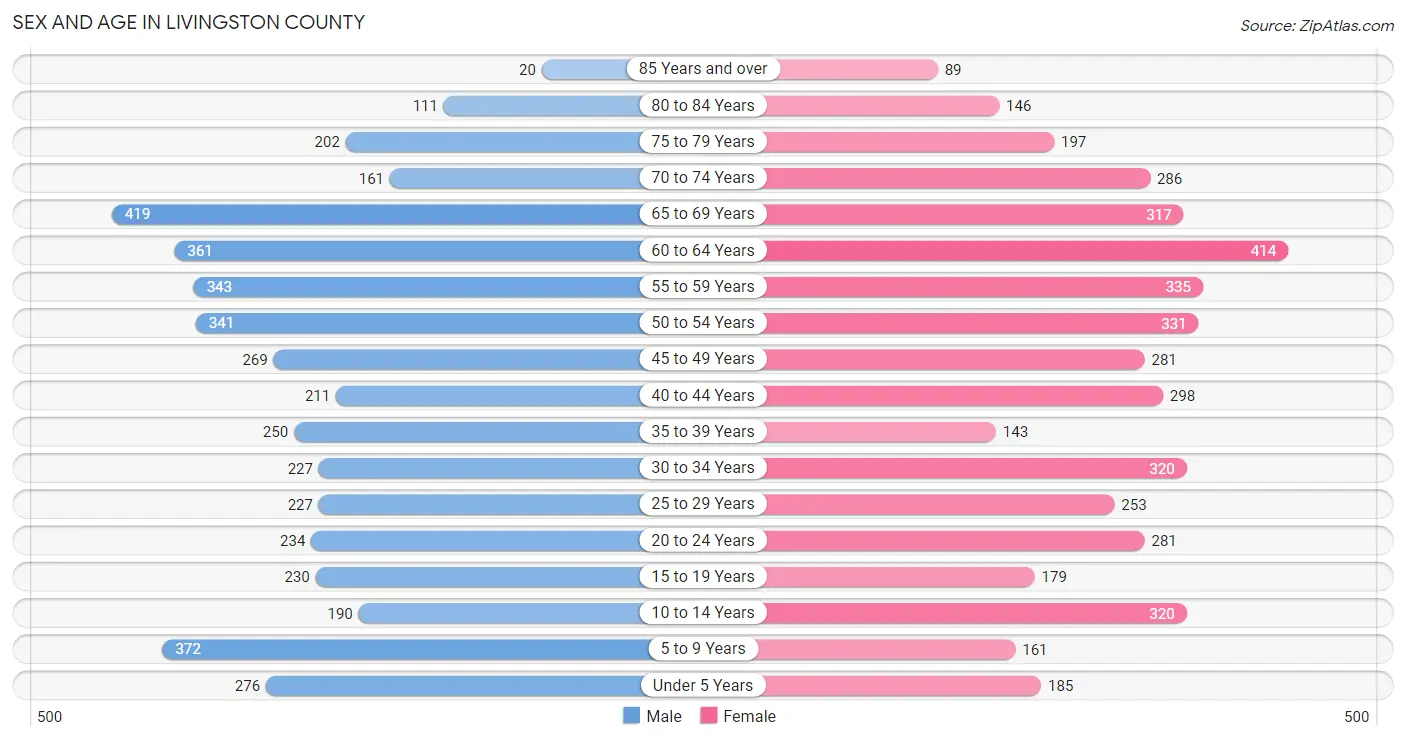
Sex and Age in Livingston County
The most populous age groups in Livingston County are 65 to 69 Years (419 | 9.4%) for men and 60 to 64 Years (414 | 9.1%) for women.
| Age Bracket | Male | Female |
| Under 5 Years | 276 (6.2%) | 185 (4.1%) |
| 5 to 9 Years | 372 (8.4%) | 161 (3.5%) |
| 10 to 14 Years | 190 (4.3%) | 320 (7.0%) |
| 15 to 19 Years | 230 (5.2%) | 179 (4.0%) |
| 20 to 24 Years | 234 (5.3%) | 281 (6.2%) |
| 25 to 29 Years | 227 (5.1%) | 253 (5.6%) |
| 30 to 34 Years | 227 (5.1%) | 320 (7.0%) |
| 35 to 39 Years | 250 (5.6%) | 143 (3.2%) |
| 40 to 44 Years | 211 (4.8%) | 298 (6.6%) |
| 45 to 49 Years | 269 (6.0%) | 281 (6.2%) |
| 50 to 54 Years | 341 (7.7%) | 331 (7.3%) |
| 55 to 59 Years | 343 (7.7%) | 335 (7.4%) |
| 60 to 64 Years | 361 (8.1%) | 414 (9.1%) |
| 65 to 69 Years | 419 (9.4%) | 317 (7.0%) |
| 70 to 74 Years | 161 (3.6%) | 286 (6.3%) |
| 75 to 79 Years | 202 (4.5%) | 197 (4.3%) |
| 80 to 84 Years | 111 (2.5%) | 146 (3.2%) |
| 85 Years and over | 20 (0.4%) | 89 (2.0%) |
| Total | 4,444 (100.0%) | 4,536 (100.0%) |
Families and Households in Livingston County
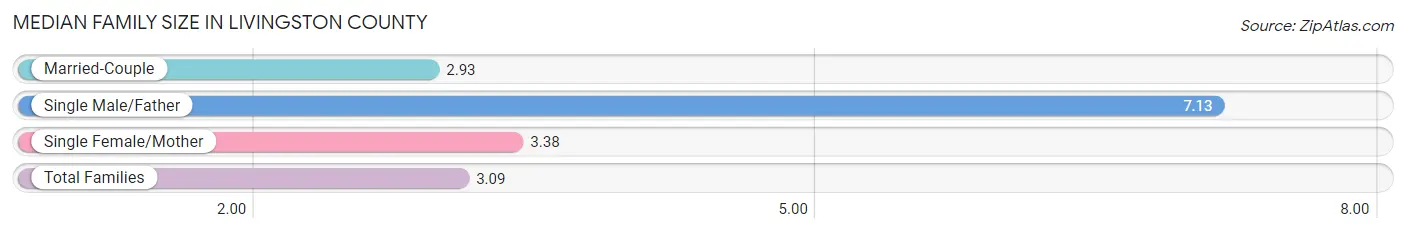
Median Family Size in Livingston County
The median family size in Livingston County is 3.09 persons per family, with single male/father families (39 | 1.6%) accounting for the largest median family size of 7.13 persons per family. On the other hand, married-couple families (1,919 | 79.3%) represent the smallest median family size with 2.93 persons per family.
| Family Type | # Families | Family Size |
| Married-Couple | 1,919 (79.3%) | 2.93 |
| Single Male/Father | 39 (1.6%) | 7.13 |
| Single Female/Mother | 463 (19.1%) | 3.38 |
| Total Families | 2,421 (100.0%) | 3.09 |
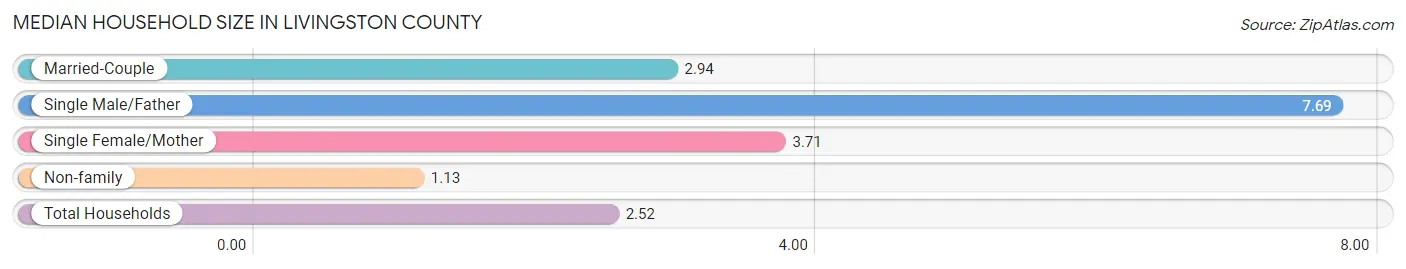
Median Household Size in Livingston County
The median household size in Livingston County is 2.52 persons per household, with single male/father households (39 | 1.1%) accounting for the largest median household size of 7.69 persons per household. non-family households (1,116 | 31.6%) represent the smallest median household size with 1.13 persons per household.
| Household Type | # Households | Household Size |
| Married-Couple | 1,919 (54.3%) | 2.94 |
| Single Male/Father | 39 (1.1%) | 7.69 |
| Single Female/Mother | 463 (13.1%) | 3.71 |
| Non-family | 1,116 (31.6%) | 1.13 |
| Total Households | 3,537 (100.0%) | 2.52 |
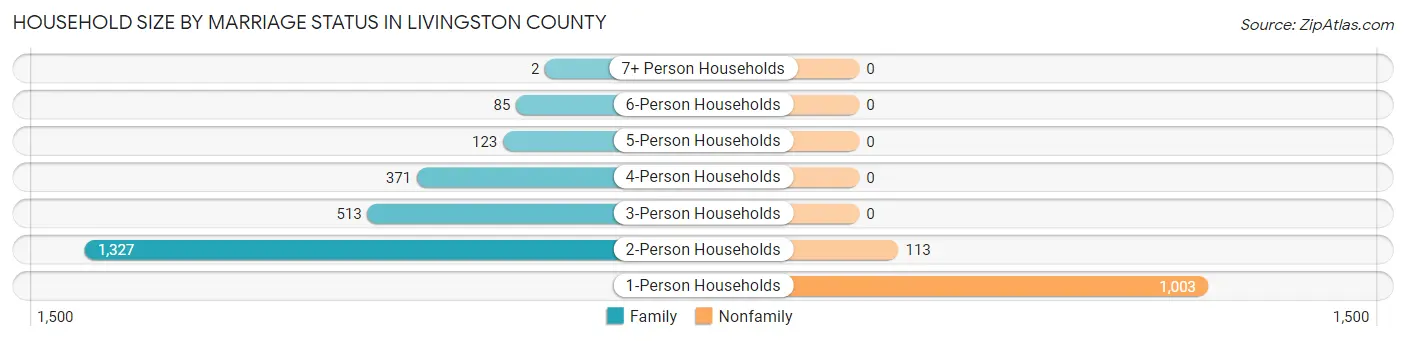
Household Size by Marriage Status in Livingston County
Out of a total of 3,537 households in Livingston County, 2,421 (68.4%) are family households, while 1,116 (31.6%) are nonfamily households. The most numerous type of family households are 2-person households, comprising 1,327, and the most common type of nonfamily households are 1-person households, comprising 1,003.
| Household Size | Family Households | Nonfamily Households |
| 1-Person Households | - | 1,003 (28.4%) |
| 2-Person Households | 1,327 (37.5%) | 113 (3.2%) |
| 3-Person Households | 513 (14.5%) | 0 (0.0%) |
| 4-Person Households | 371 (10.5%) | 0 (0.0%) |
| 5-Person Households | 123 (3.5%) | 0 (0.0%) |
| 6-Person Households | 85 (2.4%) | 0 (0.0%) |
| 7+ Person Households | 2 (0.1%) | 0 (0.0%) |
| Total | 2,421 (68.4%) | 1,116 (31.6%) |
Female Fertility in Livingston County
Fertility by Age in Livingston County
Average fertility rate in Livingston County is 71.0 births per 1,000 women. Women in the age bracket of 35 to 50 years have the highest fertility rate with 125.0 births per 1,000 women. Women in the age bracket of 35 to 50 years acount for 78.6% of all women with births.
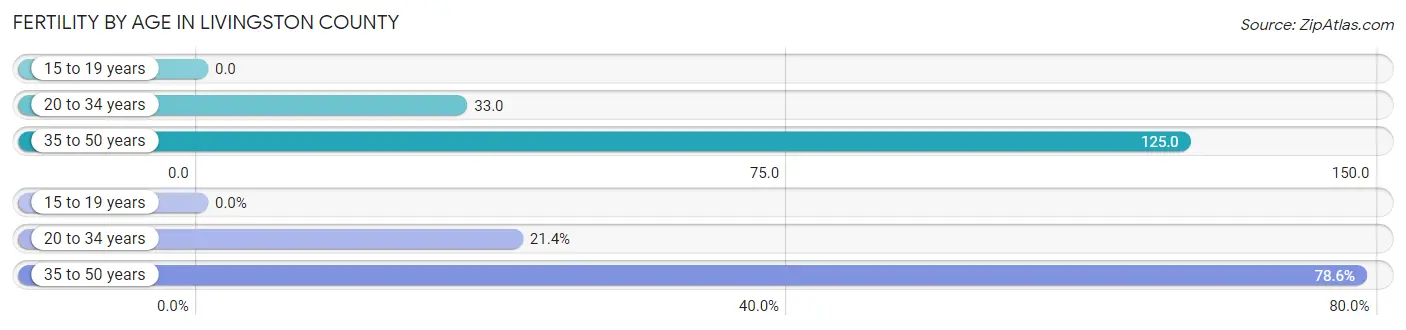
| Age Bracket | Women with Births | Births / 1,000 Women |
| 15 to 19 years | 0 (0.0%) | 0.0 |
| 20 to 34 years | 28 (21.4%) | 33.0 |
| 35 to 50 years | 103 (78.6%) | 125.0 |
| Total | 131 (100.0%) | 71.0 |
Fertility by Age by Marriage Status in Livingston County
39.7% of women with births (131) in Livingston County are married. The highest percentage of unmarried women with births falls into 20 to 34 years age bracket with 75.0% of them unmarried at the time of birth, while the lowest percentage of unmarried women with births belong to 35 to 50 years age bracket with 56.3% of them unmarried.
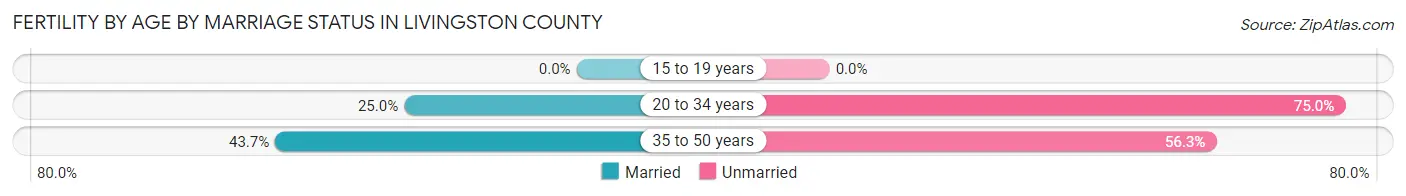
| Age Bracket | Married | Unmarried |
| 15 to 19 years | 0 (0.0%) | 0 (0.0%) |
| 20 to 34 years | 7 (25.0%) | 21 (75.0%) |
| 35 to 50 years | 45 (43.7%) | 58 (56.3%) |
| Total | 52 (39.7%) | 79 (60.3%) |
Fertility by Education in Livingston County
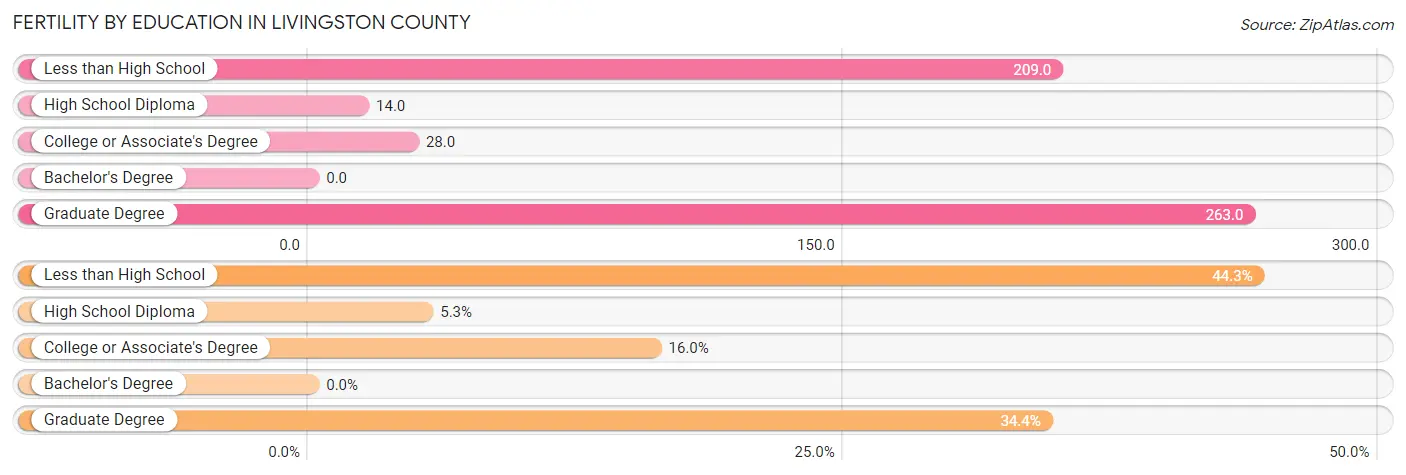
| Educational Attainment | Women with Births | Births / 1,000 Women |
| Less than High School | 58 (44.3%) | 209.0 |
| High School Diploma | 7 (5.3%) | 14.0 |
| College or Associate's Degree | 21 (16.0%) | 28.0 |
| Bachelor's Degree | 0 (0.0%) | 0.0 |
| Graduate Degree | 45 (34.4%) | 263.0 |
| Total | 131 (100.0%) | 71.0 |
Fertility by Education by Marriage Status in Livingston County
60.3% of women with births in Livingston County are unmarried. Women with the educational attainment of high school diploma are most likely to be married with 100.0% of them married at childbirth, while women with the educational attainment of less than high school are least likely to be married with 100.0% of them unmarried at childbirth.
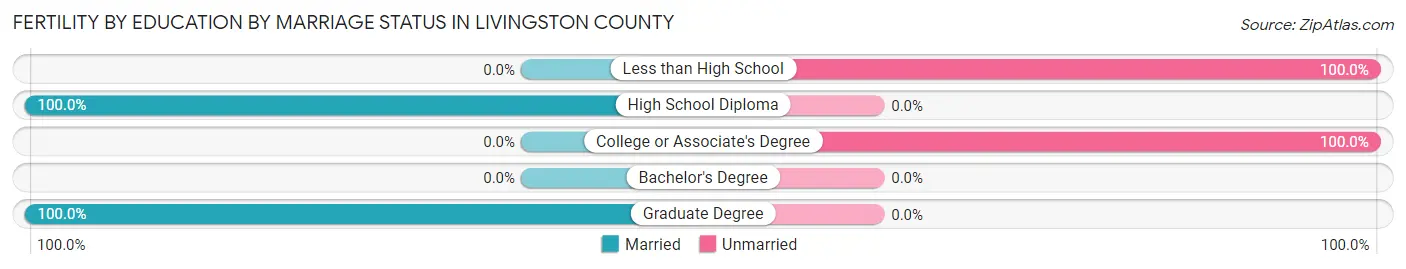
| Educational Attainment | Married | Unmarried |
| Less than High School | 0 (0.0%) | 58 (100.0%) |
| High School Diploma | 7 (100.0%) | 0 (0.0%) |
| College or Associate's Degree | 0 (0.0%) | 21 (100.0%) |
| Bachelor's Degree | 0 (0.0%) | 0 (0.0%) |
| Graduate Degree | 45 (100.0%) | 0 (0.0%) |
| Total | 52 (39.7%) | 79 (60.3%) |
Income in Livingston County
Income Overview in Livingston County
Per Capita Income in Livingston County is $31,024, while median incomes of families and households are $67,561 and $56,125 respectively.
| Characteristic | Number | Measure |
| Per Capita Income | 8,980 | $31,024 |
| Median Family Income | 2,421 | $67,561 |
| Mean Family Income | 2,421 | $80,156 |
| Median Household Income | 3,537 | $56,125 |
| Mean Household Income | 3,537 | $72,767 |
| Income Deficit | 2,421 | $17,924 |
| Wage / Income Gap (%) | 8,980 | 31.86% |
| Wage / Income Gap ($) | 8,980 | 68.14¢ per $1 |
| Gini / Inequality Index | 8,980 | 0.47 |
Earnings by Sex in Livingston County
Average Earnings in Livingston County are $29,368, $38,432 for men and $26,188 for women, a difference of 31.9%.
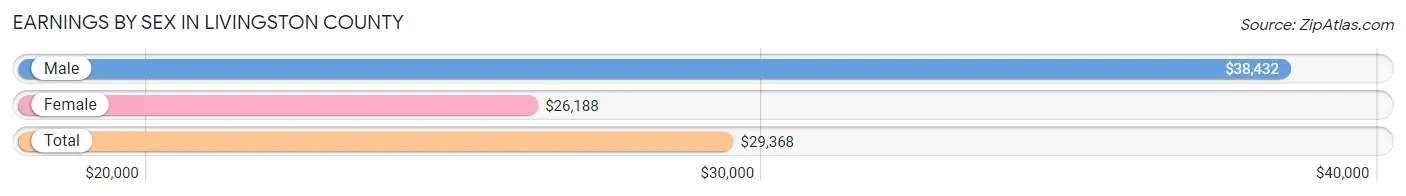
| Sex | Number | Average Earnings |
| Male | 2,232 (52.4%) | $38,432 |
| Female | 2,029 (47.6%) | $26,188 |
| Total | 4,261 (100.0%) | $29,368 |
Earnings by Sex by Income Bracket in Livingston County
The most common earnings brackets in Livingston County are $100,000+ for men (201 | 9.0%) and $25,000 to $29,999 for women (299 | 14.7%).
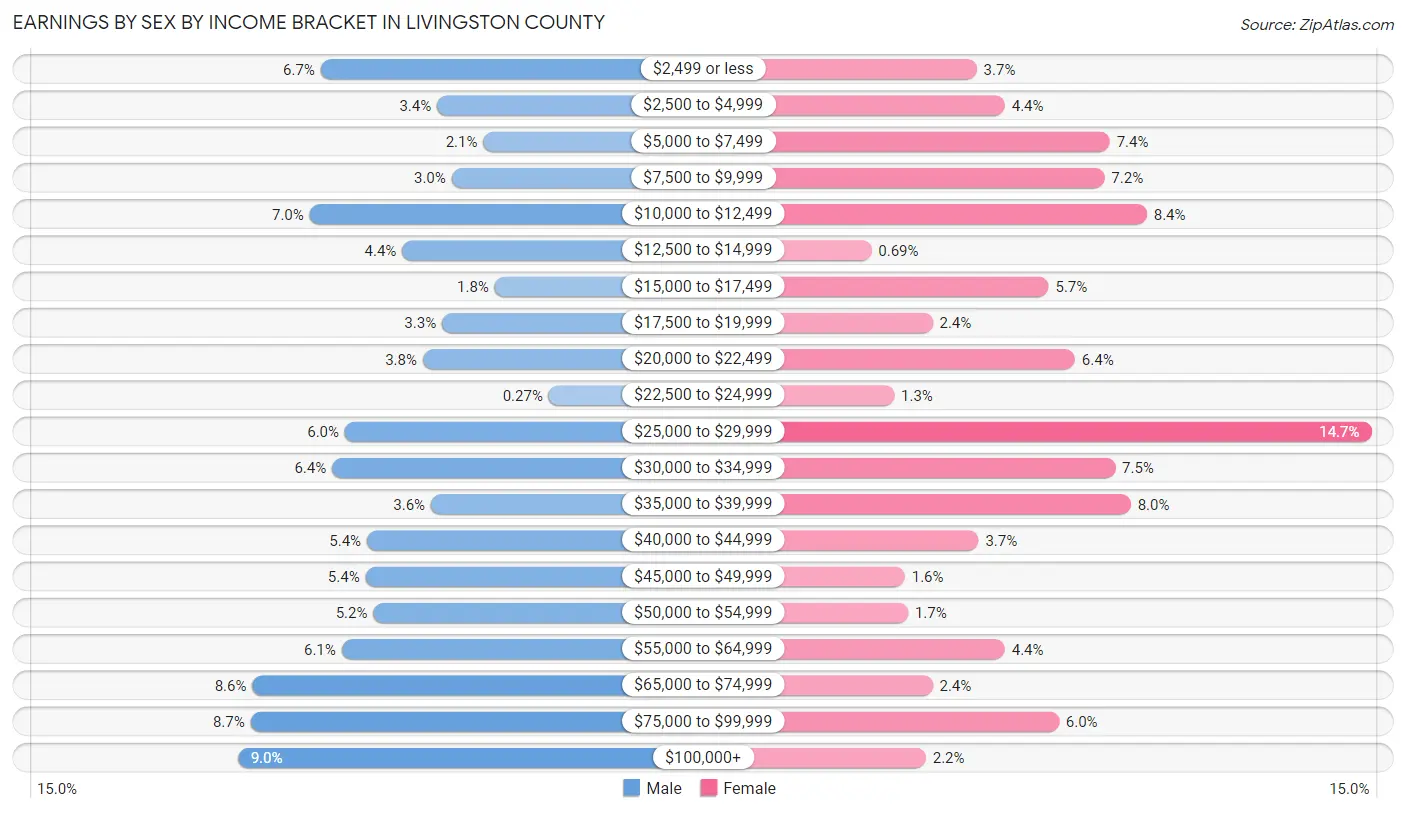
| Income | Male | Female |
| $2,499 or less | 149 (6.7%) | 74 (3.6%) |
| $2,500 to $4,999 | 76 (3.4%) | 90 (4.4%) |
| $5,000 to $7,499 | 47 (2.1%) | 150 (7.4%) |
| $7,500 to $9,999 | 67 (3.0%) | 147 (7.2%) |
| $10,000 to $12,499 | 156 (7.0%) | 171 (8.4%) |
| $12,500 to $14,999 | 98 (4.4%) | 14 (0.7%) |
| $15,000 to $17,499 | 40 (1.8%) | 115 (5.7%) |
| $17,500 to $19,999 | 73 (3.3%) | 49 (2.4%) |
| $20,000 to $22,499 | 85 (3.8%) | 130 (6.4%) |
| $22,500 to $24,999 | 6 (0.3%) | 27 (1.3%) |
| $25,000 to $29,999 | 134 (6.0%) | 299 (14.7%) |
| $30,000 to $34,999 | 142 (6.4%) | 153 (7.5%) |
| $35,000 to $39,999 | 80 (3.6%) | 162 (8.0%) |
| $40,000 to $44,999 | 120 (5.4%) | 75 (3.7%) |
| $45,000 to $49,999 | 121 (5.4%) | 33 (1.6%) |
| $50,000 to $54,999 | 116 (5.2%) | 35 (1.7%) |
| $55,000 to $64,999 | 136 (6.1%) | 90 (4.4%) |
| $65,000 to $74,999 | 192 (8.6%) | 49 (2.4%) |
| $75,000 to $99,999 | 193 (8.6%) | 121 (6.0%) |
| $100,000+ | 201 (9.0%) | 45 (2.2%) |
| Total | 2,232 (100.0%) | 2,029 (100.0%) |
Earnings by Sex by Educational Attainment in Livingston County
Average earnings in Livingston County are $47,434 for men and $28,009 for women, a difference of 40.9%. Men with an educational attainment of bachelor's degree enjoy the highest average annual earnings of $56,071, while those with less than high school education earn the least with $28,315. Women with an educational attainment of graduate degree earn the most with the average annual earnings of $71,250, while those with less than high school education have the smallest earnings of $11,953.
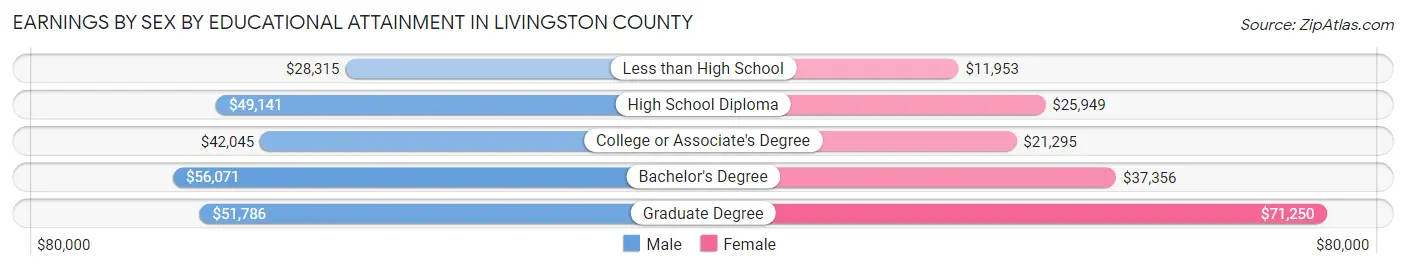
| Educational Attainment | Male Income | Female Income |
| Less than High School | $28,315 | $11,953 |
| High School Diploma | $49,141 | $25,949 |
| College or Associate's Degree | $42,045 | $21,295 |
| Bachelor's Degree | $56,071 | $37,356 |
| Graduate Degree | $51,786 | $71,250 |
| Total | $47,434 | $28,009 |
Family Income in Livingston County
Family Income Brackets in Livingston County
According to the Livingston County family income data, there are 530 families falling into the $50,000 to $74,999 income range, which is the most common income bracket and makes up 21.9% of all families. Conversely, the $200,000+ income bracket is the least frequent group with only 58 families (2.4%) belonging to this category.
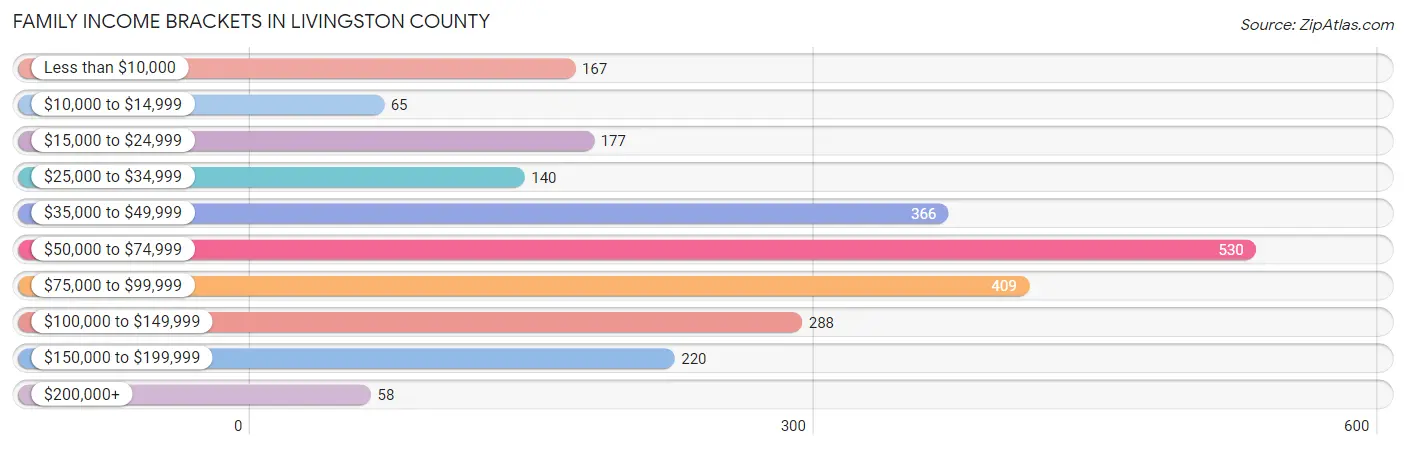
| Income Bracket | # Families | % Families |
| Less than $10,000 | 167 | 6.9% |
| $10,000 to $14,999 | 65 | 2.7% |
| $15,000 to $24,999 | 177 | 7.3% |
| $25,000 to $34,999 | 140 | 5.8% |
| $35,000 to $49,999 | 366 | 15.1% |
| $50,000 to $74,999 | 530 | 21.9% |
| $75,000 to $99,999 | 409 | 16.9% |
| $100,000 to $149,999 | 288 | 11.9% |
| $150,000 to $199,999 | 220 | 9.1% |
| $200,000+ | 58 | 2.4% |
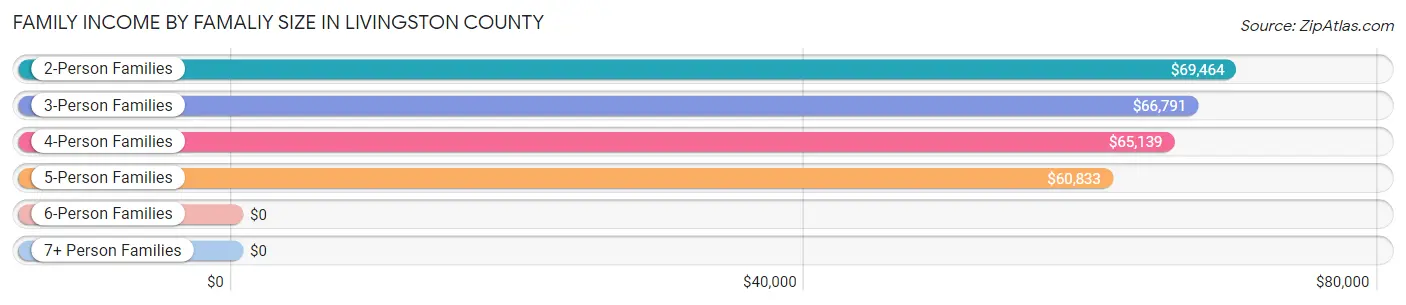
Family Income by Famaliy Size in Livingston County
2-person families (1,354 | 55.9%) account for the highest median family income in Livingston County with $69,464 per family, while 2-person families (1,354 | 55.9%) have the highest median income of $34,732 per family member.
| Income Bracket | # Families | Median Income |
| 2-Person Families | 1,354 (55.9%) | $69,464 |
| 3-Person Families | 513 (21.2%) | $66,791 |
| 4-Person Families | 409 (16.9%) | $65,139 |
| 5-Person Families | 68 (2.8%) | $60,833 |
| 6-Person Families | 75 (3.1%) | $0 |
| 7+ Person Families | 2 (0.1%) | $0 |
| Total | 2,421 (100.0%) | $67,561 |
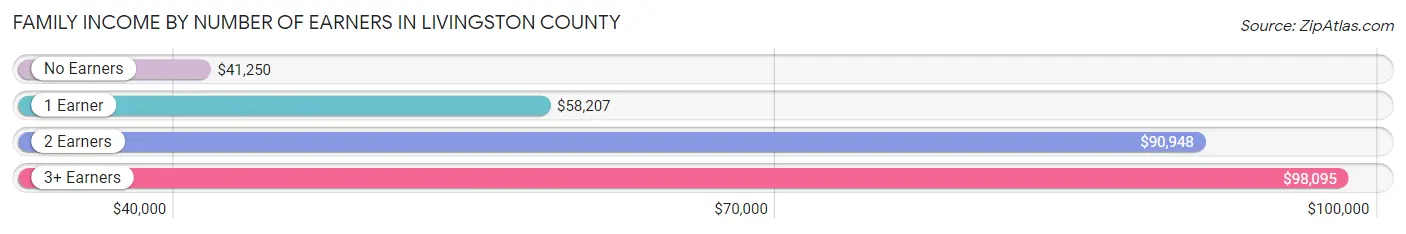
Family Income by Number of Earners in Livingston County
The median family income in Livingston County is $67,561, with families comprising 3+ earners (120) having the highest median family income of $98,095, while families with no earners (612) have the lowest median family income of $41,250, accounting for 5.0% and 25.3% of families, respectively.
| Number of Earners | # Families | Median Income |
| No Earners | 612 (25.3%) | $41,250 |
| 1 Earner | 837 (34.6%) | $58,207 |
| 2 Earners | 852 (35.2%) | $90,948 |
| 3+ Earners | 120 (5.0%) | $98,095 |
| Total | 2,421 (100.0%) | $67,561 |
Household Income in Livingston County
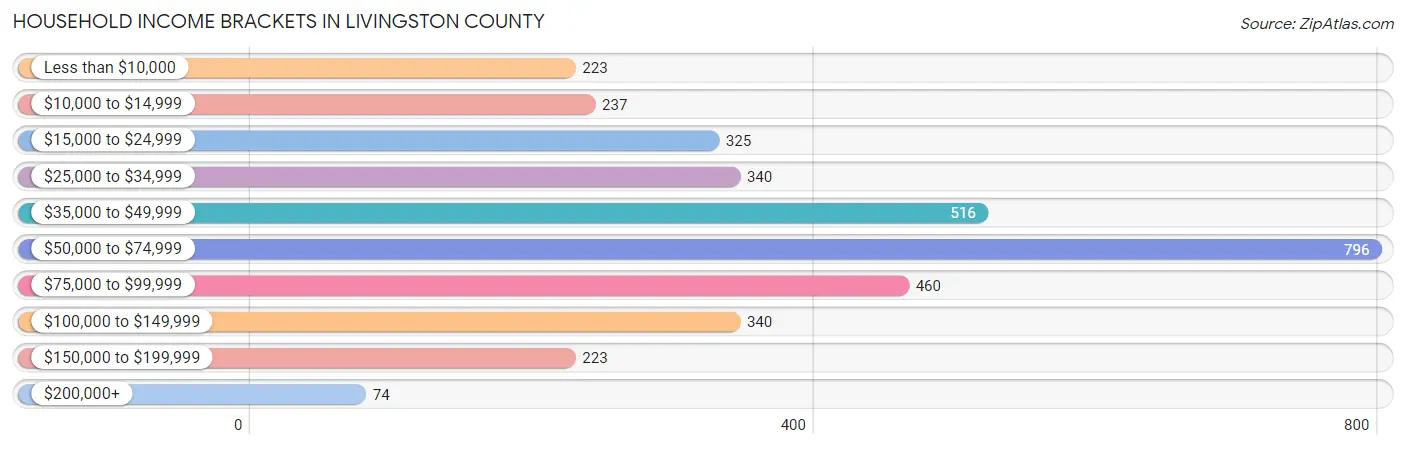
Household Income Brackets in Livingston County
With 796 households falling in the category, the $50,000 to $74,999 income range is the most frequent in Livingston County, accounting for 22.5% of all households. In contrast, only 74 households (2.1%) fall into the $200,000+ income bracket, making it the least populous group.
| Income Bracket | # Households | % Households |
| Less than $10,000 | 223 | 6.3% |
| $10,000 to $14,999 | 237 | 6.7% |
| $15,000 to $24,999 | 325 | 9.2% |
| $25,000 to $34,999 | 340 | 9.6% |
| $35,000 to $49,999 | 516 | 14.6% |
| $50,000 to $74,999 | 796 | 22.5% |
| $75,000 to $99,999 | 460 | 13.0% |
| $100,000 to $149,999 | 340 | 9.6% |
| $150,000 to $199,999 | 223 | 6.3% |
| $200,000+ | 74 | 2.1% |
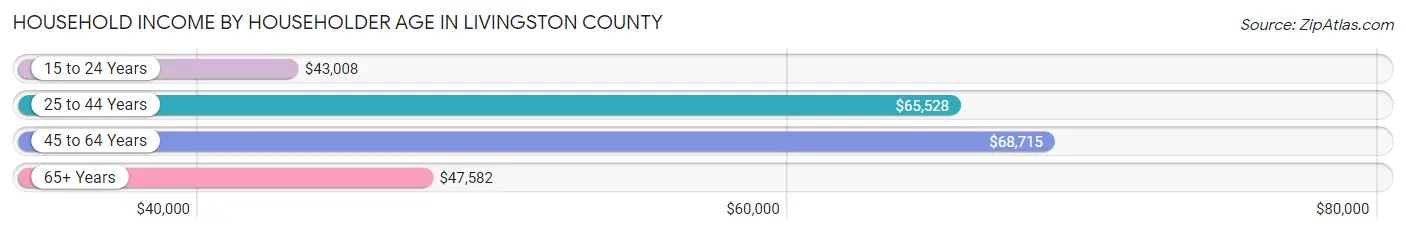
Household Income by Householder Age in Livingston County
The median household income in Livingston County is $56,125, with the highest median household income of $68,715 found in the 45 to 64 years age bracket for the primary householder. A total of 1,480 households (41.8%) fall into this category. Meanwhile, the 15 to 24 years age bracket for the primary householder has the lowest median household income of $43,008, with 127 households (3.6%) in this group.
| Income Bracket | # Households | Median Income |
| 15 to 24 Years | 127 (3.6%) | $43,008 |
| 25 to 44 Years | 613 (17.3%) | $65,528 |
| 45 to 64 Years | 1,480 (41.8%) | $68,715 |
| 65+ Years | 1,317 (37.2%) | $47,582 |
| Total | 3,537 (100.0%) | $56,125 |
Poverty in Livingston County
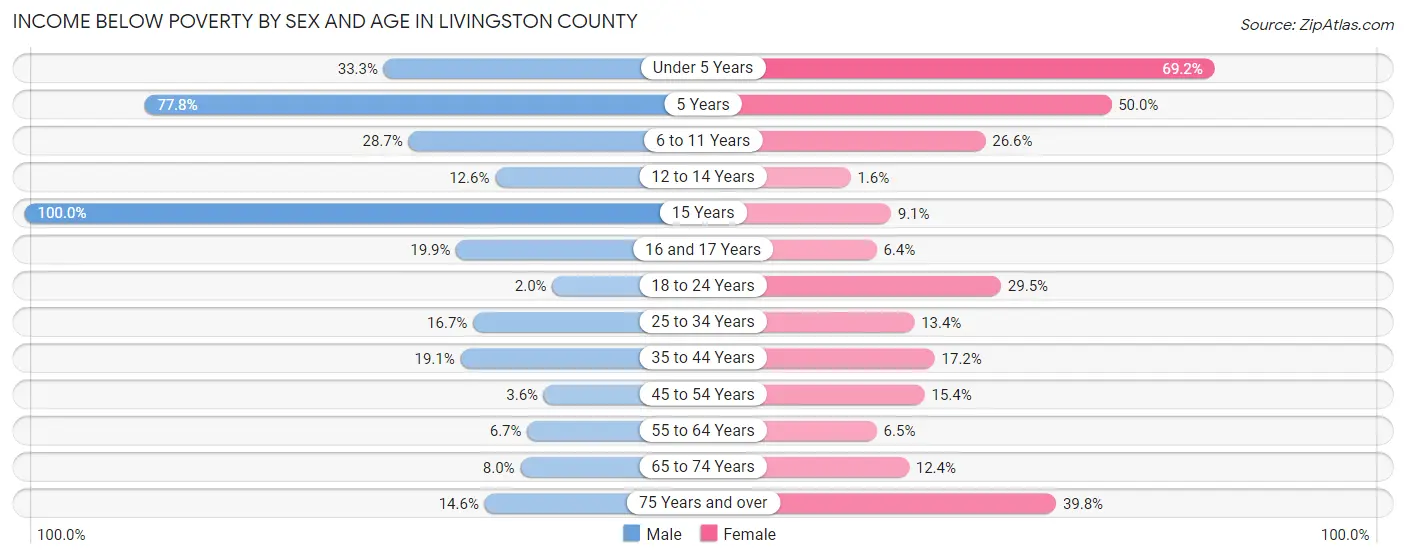
Income Below Poverty by Sex and Age in Livingston County
With 14.6% poverty level for males and 19.0% for females among the residents of Livingston County, 15 year old males and under 5 year old females are the most vulnerable to poverty, with 22 males (100.0%) and 128 females (69.2%) in their respective age groups living below the poverty level.
| Age Bracket | Male | Female |
| Under 5 Years | 92 (33.3%) | 128 (69.2%) |
| 5 Years | 42 (77.8%) | 2 (50.0%) |
| 6 to 11 Years | 121 (28.7%) | 94 (26.6%) |
| 12 to 14 Years | 11 (12.6%) | 2 (1.6%) |
| 15 Years | 22 (100.0%) | 2 (9.1%) |
| 16 and 17 Years | 29 (19.9%) | 9 (6.4%) |
| 18 to 24 Years | 6 (2.0%) | 88 (29.5%) |
| 25 to 34 Years | 76 (16.7%) | 77 (13.4%) |
| 35 to 44 Years | 88 (19.1%) | 76 (17.2%) |
| 45 to 54 Years | 22 (3.6%) | 94 (15.4%) |
| 55 to 64 Years | 47 (6.7%) | 48 (6.5%) |
| 65 to 74 Years | 46 (8.0%) | 74 (12.4%) |
| 75 Years and over | 48 (14.6%) | 159 (39.8%) |
| Total | 650 (14.6%) | 853 (19.0%) |
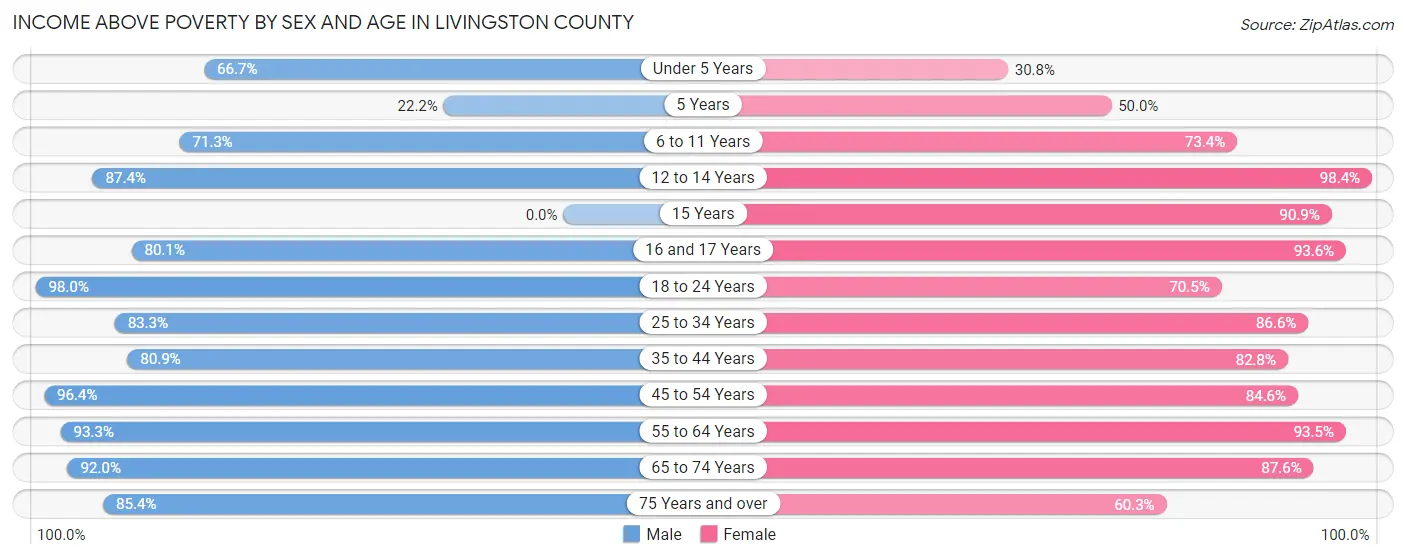
Income Above Poverty by Sex and Age in Livingston County
According to the poverty statistics in Livingston County, males aged 18 to 24 years and females aged 12 to 14 years are the age groups that are most secure financially, with 98.0% of males and 98.4% of females in these age groups living above the poverty line.
| Age Bracket | Male | Female |
| Under 5 Years | 184 (66.7%) | 57 (30.8%) |
| 5 Years | 12 (22.2%) | 2 (50.0%) |
| 6 to 11 Years | 300 (71.3%) | 259 (73.4%) |
| 12 to 14 Years | 76 (87.4%) | 122 (98.4%) |
| 15 Years | 0 (0.0%) | 20 (90.9%) |
| 16 and 17 Years | 117 (80.1%) | 131 (93.6%) |
| 18 to 24 Years | 290 (98.0%) | 210 (70.5%) |
| 25 to 34 Years | 378 (83.3%) | 496 (86.6%) |
| 35 to 44 Years | 373 (80.9%) | 365 (82.8%) |
| 45 to 54 Years | 588 (96.4%) | 518 (84.6%) |
| 55 to 64 Years | 657 (93.3%) | 694 (93.5%) |
| 65 to 74 Years | 531 (92.0%) | 521 (87.6%) |
| 75 Years and over | 281 (85.4%) | 241 (60.3%) |
| Total | 3,787 (85.4%) | 3,636 (81.0%) |
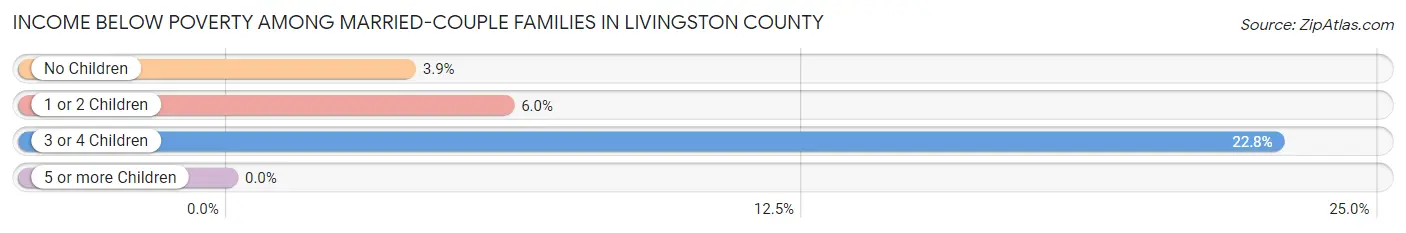
Income Below Poverty Among Married-Couple Families in Livingston County
The poverty statistics for married-couple families in Livingston County show that 5.4% or 103 of the total 1,919 families live below the poverty line. Families with 3 or 4 children have the highest poverty rate of 22.8%, comprising of 23 families. On the other hand, families with no children have the lowest poverty rate of 3.9%, which includes 53 families.
| Children | Above Poverty | Below Poverty |
| No Children | 1,316 (96.1%) | 53 (3.9%) |
| 1 or 2 Children | 422 (94.0%) | 27 (6.0%) |
| 3 or 4 Children | 78 (77.2%) | 23 (22.8%) |
| 5 or more Children | 0 (0.0%) | 0 (0.0%) |
| Total | 1,816 (94.6%) | 103 (5.4%) |
Income Below Poverty Among Single-Parent Households in Livingston County
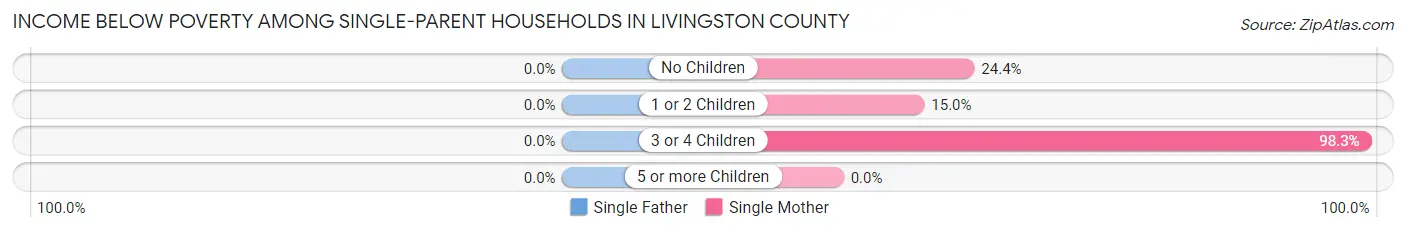
| Children | Single Father | Single Mother |
| No Children | 0 (0.0%) | 47 (24.3%) |
| 1 or 2 Children | 0 (0.0%) | 23 (15.0%) |
| 3 or 4 Children | 0 (0.0%) | 115 (98.3%) |
| 5 or more Children | 0 (0.0%) | 0 (0.0%) |
| Total | 0 (0.0%) | 185 (40.0%) |
Income Below Poverty Among Married-Couple vs Single-Parent Households in Livingston County
The poverty data for Livingston County shows that 103 of the married-couple family households (5.4%) and 185 of the single-parent households (36.8%) are living below the poverty level. Within the married-couple family households, those with 3 or 4 children have the highest poverty rate, with 23 households (22.8%) falling below the poverty line. Among the single-parent households, those with 3 or 4 children have the highest poverty rate, with 115 household (93.5%) living below poverty.
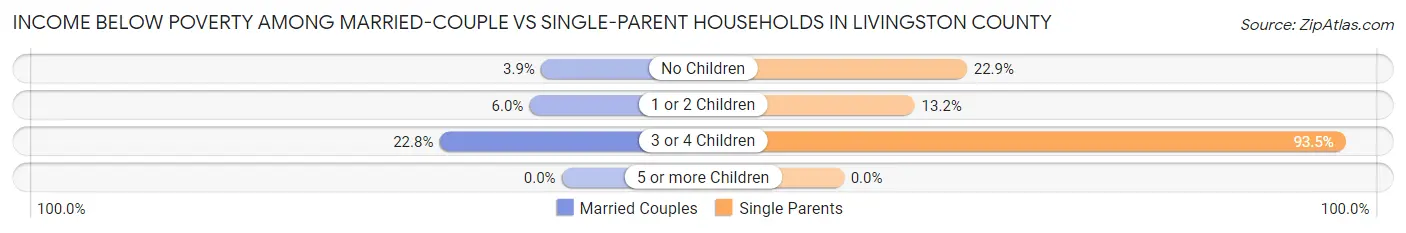
| Children | Married-Couple Families | Single-Parent Households |
| No Children | 53 (3.9%) | 47 (22.9%) |
| 1 or 2 Children | 27 (6.0%) | 23 (13.2%) |
| 3 or 4 Children | 23 (22.8%) | 115 (93.5%) |
| 5 or more Children | 0 (0.0%) | 0 (0.0%) |
| Total | 103 (5.4%) | 185 (36.8%) |
Employment Characteristics in Livingston County
Employment by Class of Employer in Livingston County
Among the 3,797 employed individuals in Livingston County, private company employees (2,609 | 68.7%), state government employees (315 | 8.3%), and self-employed (not incorporated) (310 | 8.2%) make up the most common classes of employment.
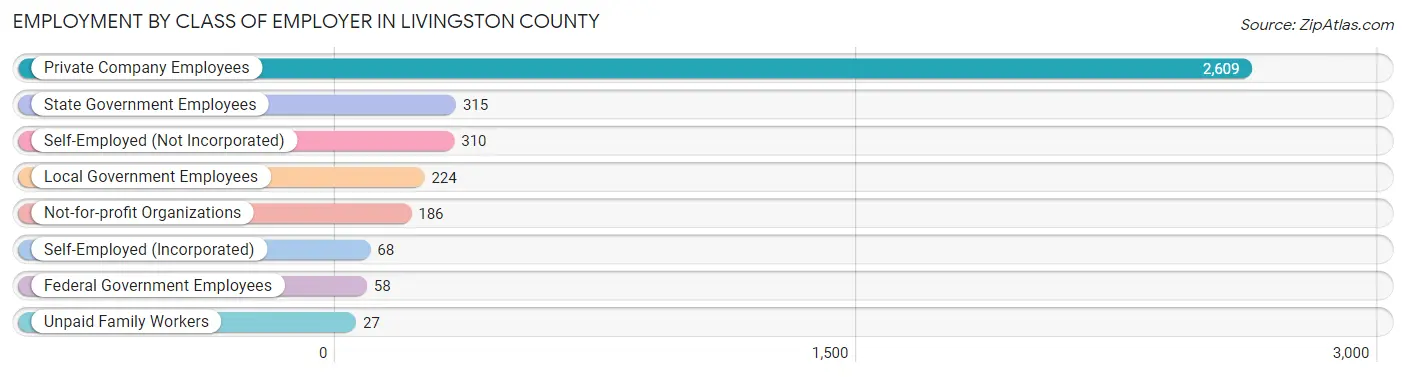
| Employer Class | # Employees | % Employees |
| Private Company Employees | 2,609 | 68.7% |
| Self-Employed (Incorporated) | 68 | 1.8% |
| Self-Employed (Not Incorporated) | 310 | 8.2% |
| Not-for-profit Organizations | 186 | 4.9% |
| Local Government Employees | 224 | 5.9% |
| State Government Employees | 315 | 8.3% |
| Federal Government Employees | 58 | 1.5% |
| Unpaid Family Workers | 27 | 0.7% |
| Total | 3,797 | 100.0% |
Employment Status by Age in Livingston County
According to the labor force statistics for Livingston County, out of the total population over 16 years of age (7,432), 55.0% or 4,088 individuals are in the labor force, with 6.1% or 249 of them unemployed. The age group with the highest labor force participation rate is 20 to 24 years, with 89.9% or 463 individuals in the labor force. Within the labor force, the 25 to 29 years age range has the highest percentage of unemployed individuals, with 18.5% or 74 of them being unemployed.
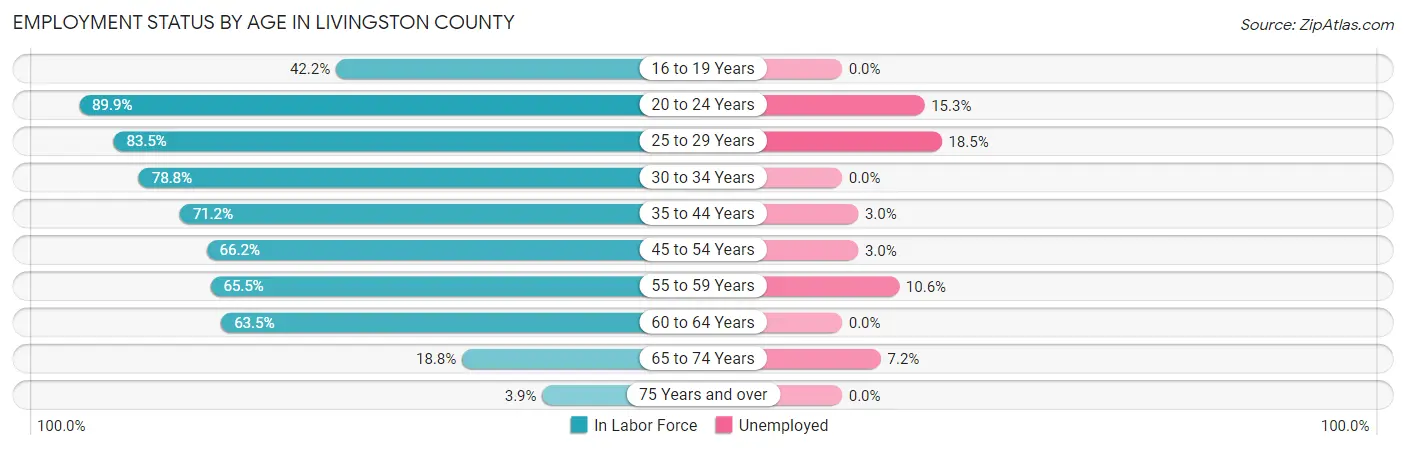
| Age Bracket | In Labor Force | Unemployed |
| 16 to 19 Years | 154 (42.2%) | 0 (0.0%) |
| 20 to 24 Years | 463 (89.9%) | 71 (15.3%) |
| 25 to 29 Years | 401 (83.5%) | 74 (18.5%) |
| 30 to 34 Years | 431 (78.8%) | 0 (0.0%) |
| 35 to 44 Years | 642 (71.2%) | 19 (3.0%) |
| 45 to 54 Years | 809 (66.2%) | 24 (3.0%) |
| 55 to 59 Years | 444 (65.5%) | 47 (10.6%) |
| 60 to 64 Years | 492 (63.5%) | 0 (0.0%) |
| 65 to 74 Years | 222 (18.8%) | 16 (7.2%) |
| 75 Years and over | 30 (3.9%) | 0 (0.0%) |
| Total | 4,088 (55.0%) | 249 (6.1%) |
Employment Status by Educational Attainment in Livingston County
According to labor force statistics for Livingston County, 69.9% of individuals (3,218) out of the total population between 25 and 64 years of age (4,604) are in the labor force, with 5.1% or 164 of them being unemployed. The group with the highest labor force participation rate are those with the educational attainment of bachelor's degree or higher, with 85.9% or 516 individuals in the labor force. Within the labor force, individuals with less than high school education have the highest percentage of unemployment, with 12.7% or 24 of them being unemployed.
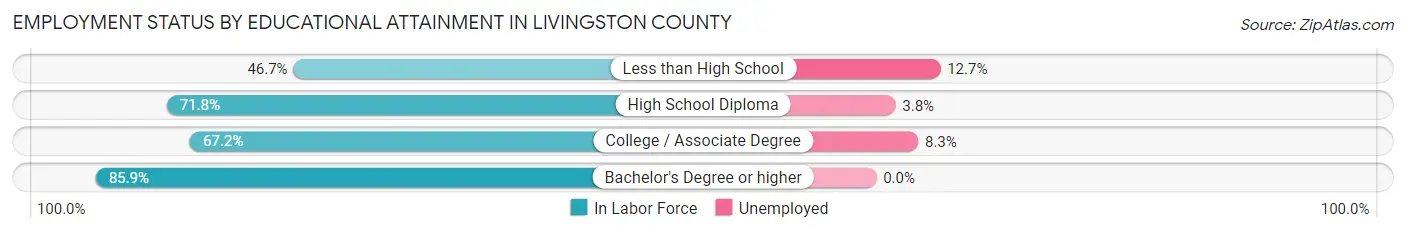
| Educational Attainment | In Labor Force | Unemployed |
| Less than High School | 189 (46.7%) | 51 (12.7%) |
| High School Diploma | 1,519 (71.8%) | 80 (3.8%) |
| College / Associate Degree | 997 (67.2%) | 123 (8.3%) |
| Bachelor's Degree or higher | 516 (85.9%) | 0 (0.0%) |
| Total | 3,218 (69.9%) | 235 (5.1%) |
Employment Occupations by Sex in Livingston County
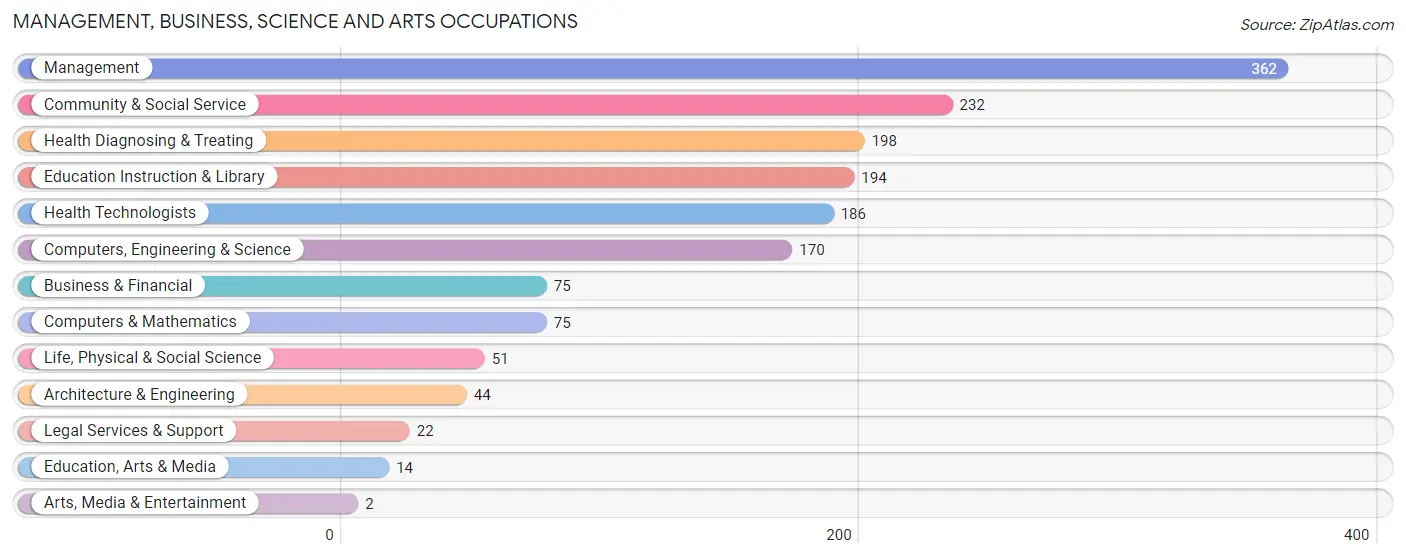
Management, Business, Science and Arts Occupations
The most common Management, Business, Science and Arts occupations in Livingston County are Management (362 | 9.4%), Community & Social Service (232 | 6.0%), Health Diagnosing & Treating (198 | 5.2%), Education Instruction & Library (194 | 5.1%), and Health Technologists (186 | 4.9%).
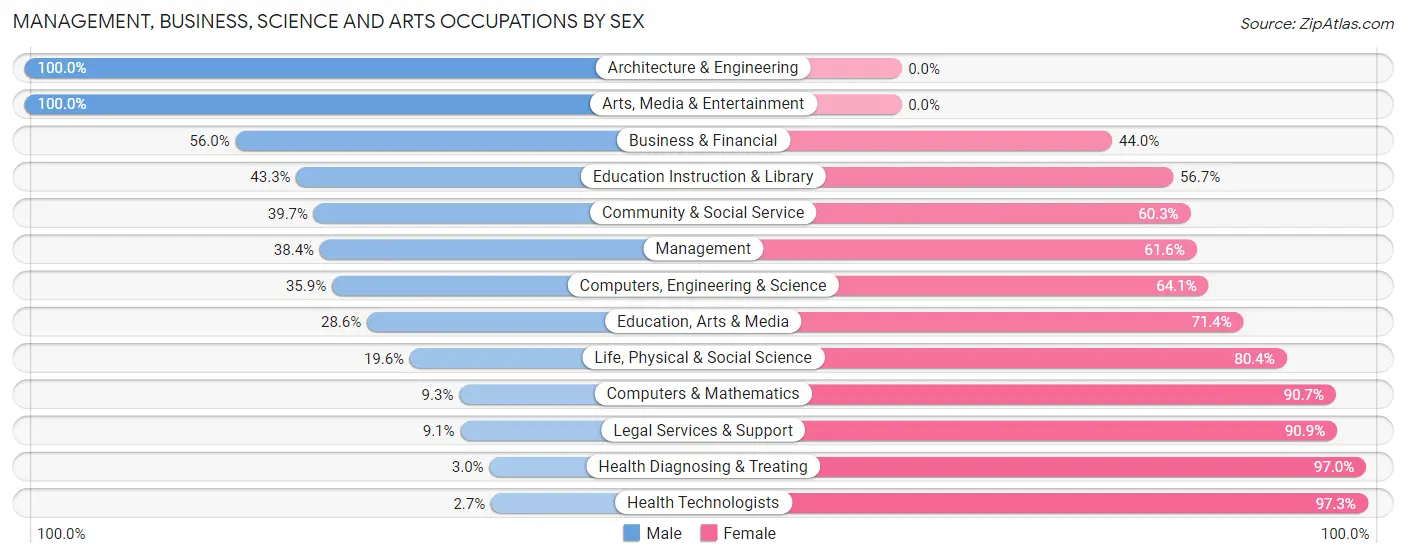
Management, Business, Science and Arts Occupations by Sex
Within the Management, Business, Science and Arts occupations in Livingston County, the most male-oriented occupations are Architecture & Engineering (100.0%), Arts, Media & Entertainment (100.0%), and Business & Financial (56.0%), while the most female-oriented occupations are Health Technologists (97.3%), Health Diagnosing & Treating (97.0%), and Legal Services & Support (90.9%).
| Occupation | Male | Female |
| Management | 139 (38.4%) | 223 (61.6%) |
| Business & Financial | 42 (56.0%) | 33 (44.0%) |
| Computers, Engineering & Science | 61 (35.9%) | 109 (64.1%) |
| Computers & Mathematics | 7 (9.3%) | 68 (90.7%) |
| Architecture & Engineering | 44 (100.0%) | 0 (0.0%) |
| Life, Physical & Social Science | 10 (19.6%) | 41 (80.4%) |
| Community & Social Service | 92 (39.7%) | 140 (60.3%) |
| Education, Arts & Media | 4 (28.6%) | 10 (71.4%) |
| Legal Services & Support | 2 (9.1%) | 20 (90.9%) |
| Education Instruction & Library | 84 (43.3%) | 110 (56.7%) |
| Arts, Media & Entertainment | 2 (100.0%) | 0 (0.0%) |
| Health Diagnosing & Treating | 6 (3.0%) | 192 (97.0%) |
| Health Technologists | 5 (2.7%) | 181 (97.3%) |
| Total (Category) | 340 (32.8%) | 697 (67.2%) |
| Total (Overall) | 2,060 (53.7%) | 1,777 (46.3%) |
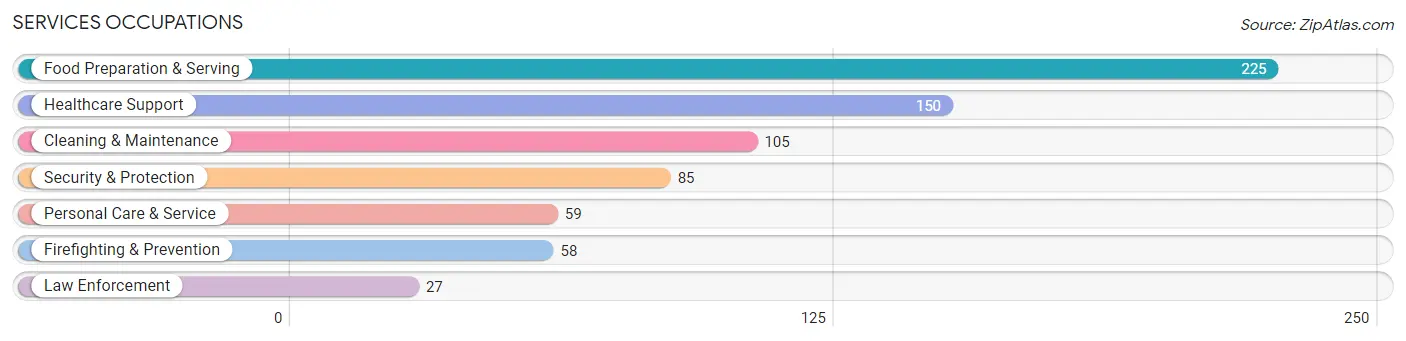
Services Occupations
The most common Services occupations in Livingston County are Food Preparation & Serving (225 | 5.9%), Healthcare Support (150 | 3.9%), Cleaning & Maintenance (105 | 2.7%), Security & Protection (85 | 2.2%), and Personal Care & Service (59 | 1.5%).
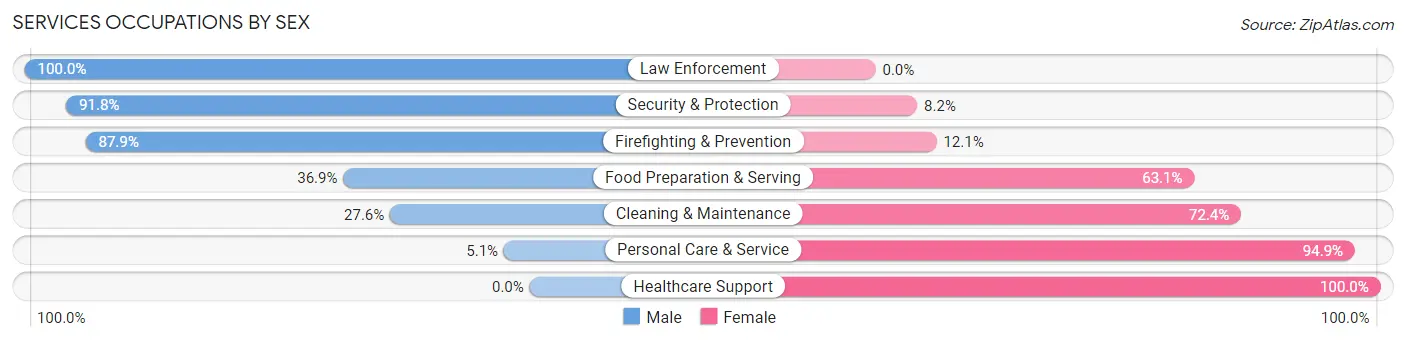
Services Occupations by Sex
Within the Services occupations in Livingston County, the most male-oriented occupations are Law Enforcement (100.0%), Security & Protection (91.8%), and Firefighting & Prevention (87.9%), while the most female-oriented occupations are Healthcare Support (100.0%), Personal Care & Service (94.9%), and Cleaning & Maintenance (72.4%).
| Occupation | Male | Female |
| Healthcare Support | 0 (0.0%) | 150 (100.0%) |
| Security & Protection | 78 (91.8%) | 7 (8.2%) |
| Firefighting & Prevention | 51 (87.9%) | 7 (12.1%) |
| Law Enforcement | 27 (100.0%) | 0 (0.0%) |
| Food Preparation & Serving | 83 (36.9%) | 142 (63.1%) |
| Cleaning & Maintenance | 29 (27.6%) | 76 (72.4%) |
| Personal Care & Service | 3 (5.1%) | 56 (94.9%) |
| Total (Category) | 193 (30.9%) | 431 (69.1%) |
| Total (Overall) | 2,060 (53.7%) | 1,777 (46.3%) |
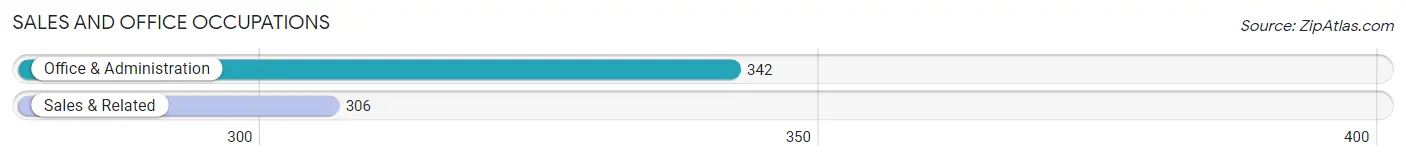
Sales and Office Occupations
The most common Sales and Office occupations in Livingston County are Office & Administration (342 | 8.9%), and Sales & Related (306 | 8.0%).
Sales and Office Occupations by Sex
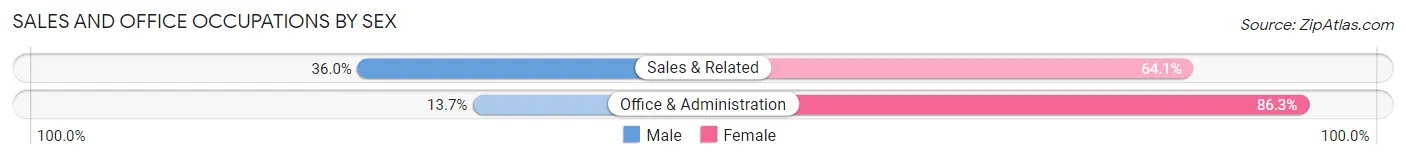
| Occupation | Male | Female |
| Sales & Related | 110 (35.9%) | 196 (64.0%) |
| Office & Administration | 47 (13.7%) | 295 (86.3%) |
| Total (Category) | 157 (24.2%) | 491 (75.8%) |
| Total (Overall) | 2,060 (53.7%) | 1,777 (46.3%) |
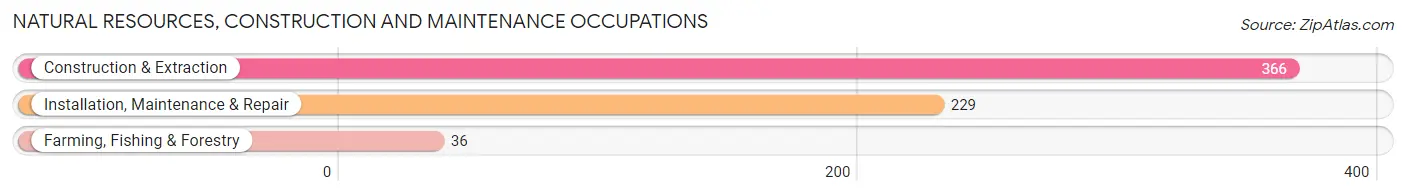
Natural Resources, Construction and Maintenance Occupations
The most common Natural Resources, Construction and Maintenance occupations in Livingston County are Construction & Extraction (366 | 9.5%), Installation, Maintenance & Repair (229 | 6.0%), and Farming, Fishing & Forestry (36 | 0.9%).
Natural Resources, Construction and Maintenance Occupations by Sex
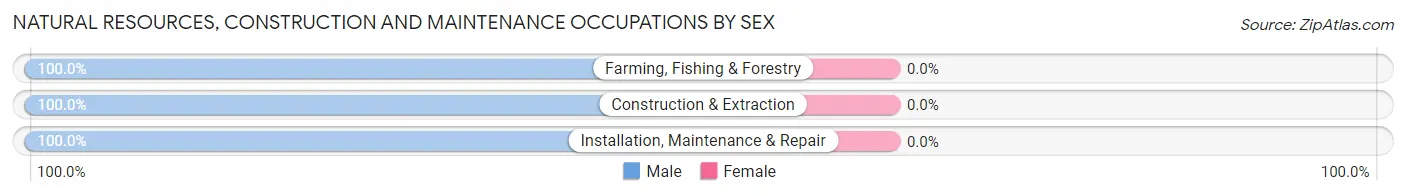
| Occupation | Male | Female |
| Farming, Fishing & Forestry | 36 (100.0%) | 0 (0.0%) |
| Construction & Extraction | 366 (100.0%) | 0 (0.0%) |
| Installation, Maintenance & Repair | 229 (100.0%) | 0 (0.0%) |
| Total (Category) | 631 (100.0%) | 0 (0.0%) |
| Total (Overall) | 2,060 (53.7%) | 1,777 (46.3%) |
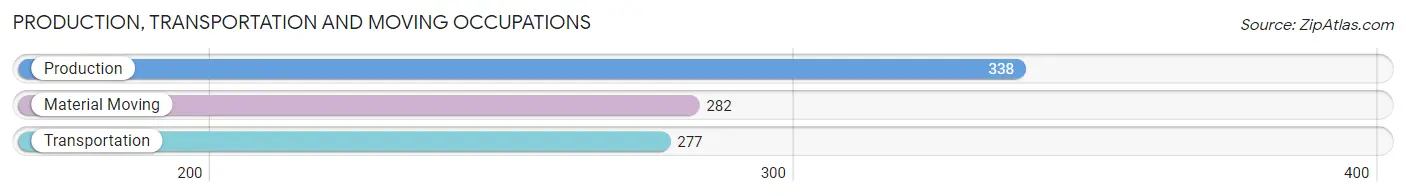
Production, Transportation and Moving Occupations
The most common Production, Transportation and Moving occupations in Livingston County are Production (338 | 8.8%), Material Moving (282 | 7.3%), and Transportation (277 | 7.2%).
Production, Transportation and Moving Occupations by Sex
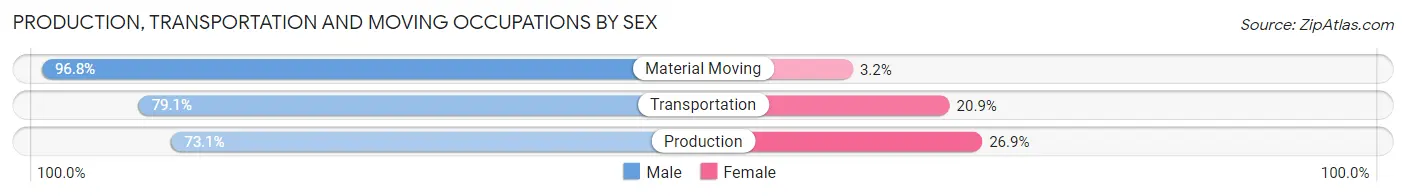
| Occupation | Male | Female |
| Production | 247 (73.1%) | 91 (26.9%) |
| Transportation | 219 (79.1%) | 58 (20.9%) |
| Material Moving | 273 (96.8%) | 9 (3.2%) |
| Total (Category) | 739 (82.4%) | 158 (17.6%) |
| Total (Overall) | 2,060 (53.7%) | 1,777 (46.3%) |
Employment Industries by Sex in Livingston County
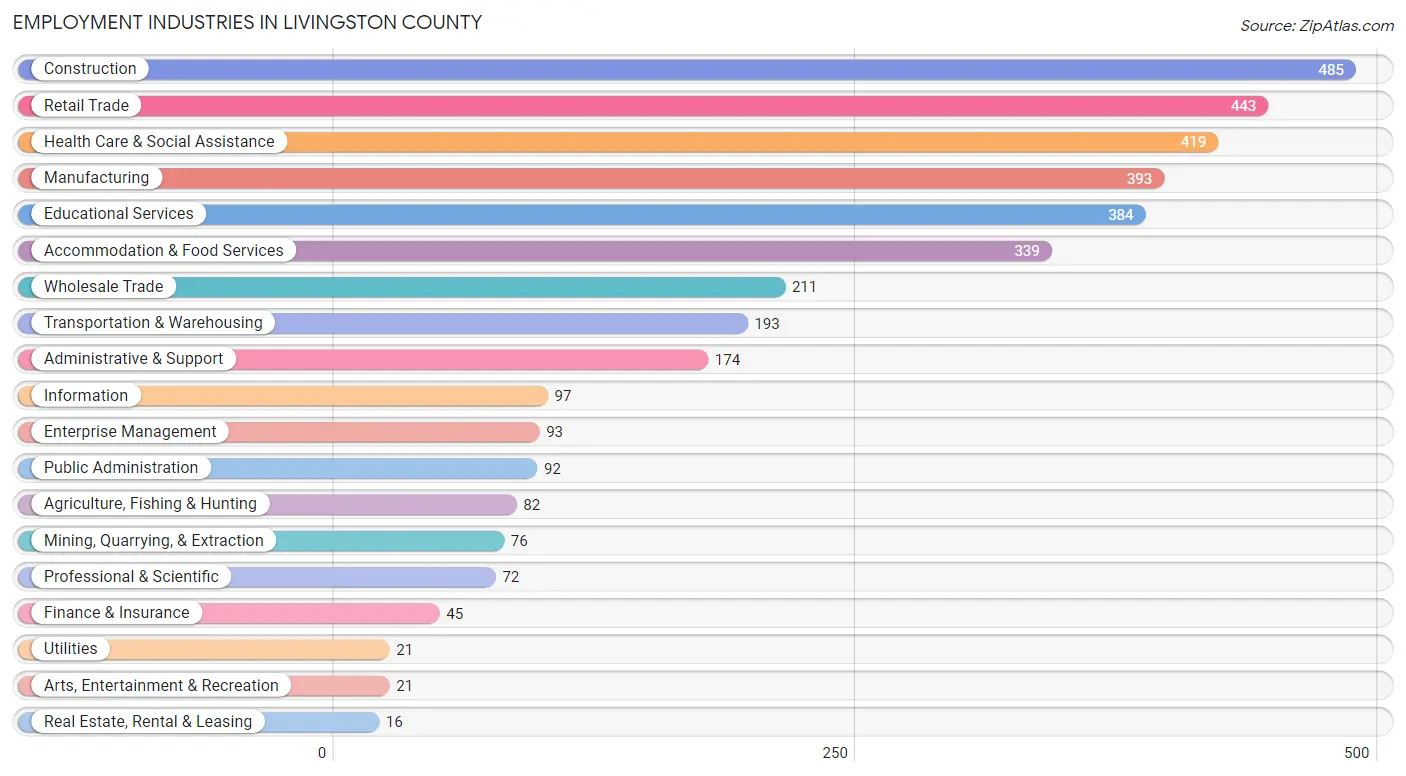
Employment Industries in Livingston County
The major employment industries in Livingston County include Construction (485 | 12.6%), Retail Trade (443 | 11.6%), Health Care & Social Assistance (419 | 10.9%), Manufacturing (393 | 10.2%), and Educational Services (384 | 10.0%).
Employment Industries by Sex in Livingston County
The Livingston County industries that see more men than women are Mining, Quarrying, & Extraction (100.0%), Construction (100.0%), and Utilities (100.0%), whereas the industries that tend to have a higher number of women are Enterprise Management (100.0%), Finance & Insurance (93.3%), and Health Care & Social Assistance (93.1%).
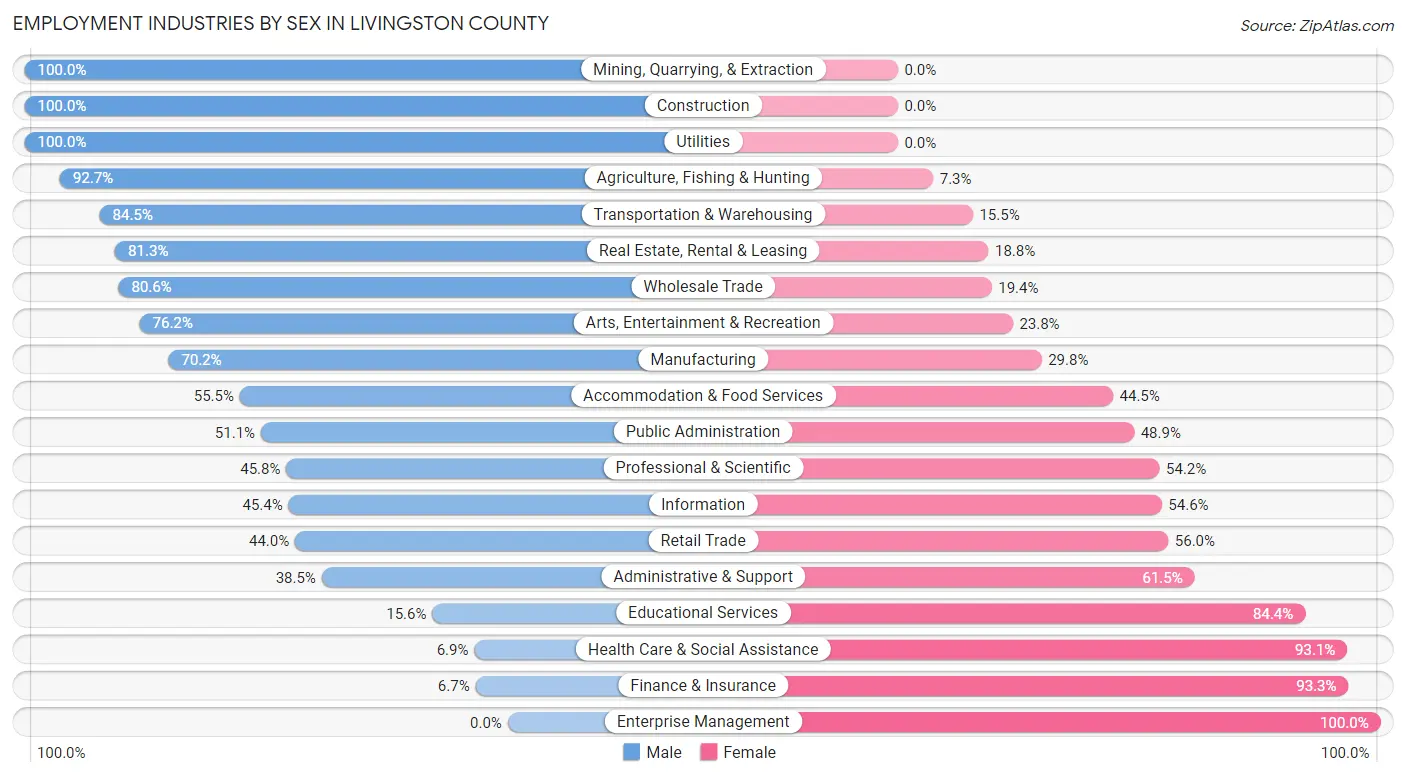
| Industry | Male | Female |
| Agriculture, Fishing & Hunting | 76 (92.7%) | 6 (7.3%) |
| Mining, Quarrying, & Extraction | 76 (100.0%) | 0 (0.0%) |
| Construction | 485 (100.0%) | 0 (0.0%) |
| Manufacturing | 276 (70.2%) | 117 (29.8%) |
| Wholesale Trade | 170 (80.6%) | 41 (19.4%) |
| Retail Trade | 195 (44.0%) | 248 (56.0%) |
| Transportation & Warehousing | 163 (84.5%) | 30 (15.5%) |
| Utilities | 21 (100.0%) | 0 (0.0%) |
| Information | 44 (45.4%) | 53 (54.6%) |
| Finance & Insurance | 3 (6.7%) | 42 (93.3%) |
| Real Estate, Rental & Leasing | 13 (81.2%) | 3 (18.8%) |
| Professional & Scientific | 33 (45.8%) | 39 (54.2%) |
| Enterprise Management | 0 (0.0%) | 93 (100.0%) |
| Administrative & Support | 67 (38.5%) | 107 (61.5%) |
| Educational Services | 60 (15.6%) | 324 (84.4%) |
| Health Care & Social Assistance | 29 (6.9%) | 390 (93.1%) |
| Arts, Entertainment & Recreation | 16 (76.2%) | 5 (23.8%) |
| Accommodation & Food Services | 188 (55.5%) | 151 (44.5%) |
| Public Administration | 47 (51.1%) | 45 (48.9%) |
| Total | 2,060 (53.7%) | 1,777 (46.3%) |
Education in Livingston County
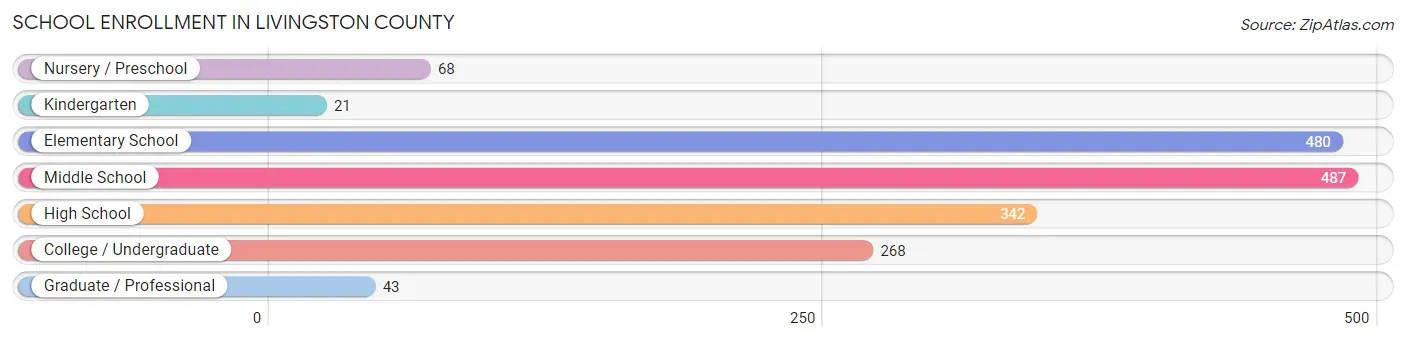
School Enrollment in Livingston County
The most common levels of schooling among the 1,709 students in Livingston County are middle school (487 | 28.5%), elementary school (480 | 28.1%), and high school (342 | 20.0%).
| School Level | # Students | % Students |
| Nursery / Preschool | 68 | 4.0% |
| Kindergarten | 21 | 1.2% |
| Elementary School | 480 | 28.1% |
| Middle School | 487 | 28.5% |
| High School | 342 | 20.0% |
| College / Undergraduate | 268 | 15.7% |
| Graduate / Professional | 43 | 2.5% |
| Total | 1,709 | 100.0% |
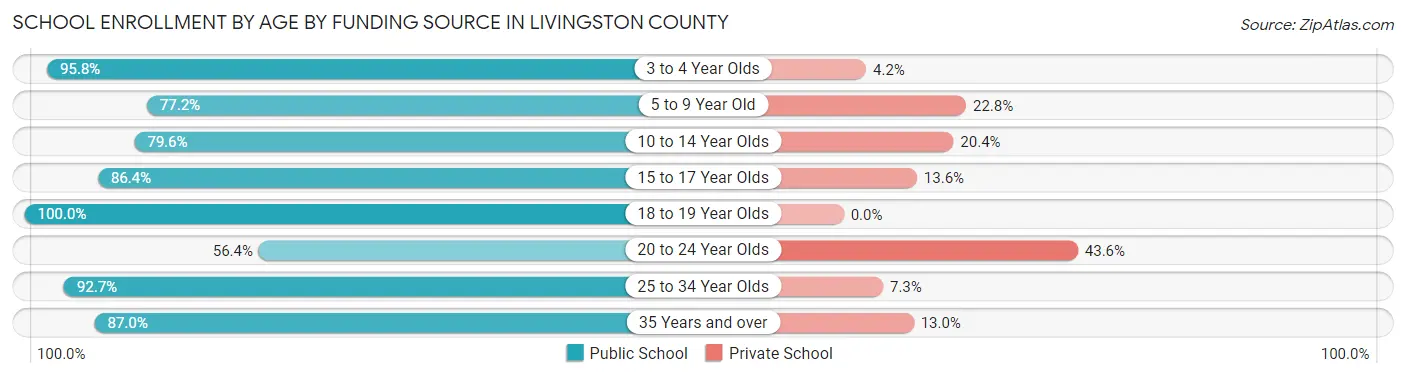
School Enrollment by Age by Funding Source in Livingston County
Out of a total of 1,709 students who are enrolled in schools in Livingston County, 326 (19.1%) attend a private institution, while the remaining 1,383 (80.9%) are enrolled in public schools. The age group of 20 to 24 year olds has the highest likelihood of being enrolled in private schools, with 41 (43.6% in the age bracket) enrolled. Conversely, the age group of 18 to 19 year olds has the lowest likelihood of being enrolled in a private school, with 17 (100.0% in the age bracket) attending a public institution.
| Age Bracket | Public School | Private School |
| 3 to 4 Year Olds | 23 (95.8%) | 1 (4.2%) |
| 5 to 9 Year Old | 410 (77.2%) | 121 (22.8%) |
| 10 to 14 Year Olds | 397 (79.6%) | 102 (20.4%) |
| 15 to 17 Year Olds | 285 (86.4%) | 45 (13.6%) |
| 18 to 19 Year Olds | 17 (100.0%) | 0 (0.0%) |
| 20 to 24 Year Olds | 53 (56.4%) | 41 (43.6%) |
| 25 to 34 Year Olds | 177 (92.7%) | 14 (7.3%) |
| 35 Years and over | 20 (87.0%) | 3 (13.0%) |
| Total | 1,383 (80.9%) | 326 (19.1%) |
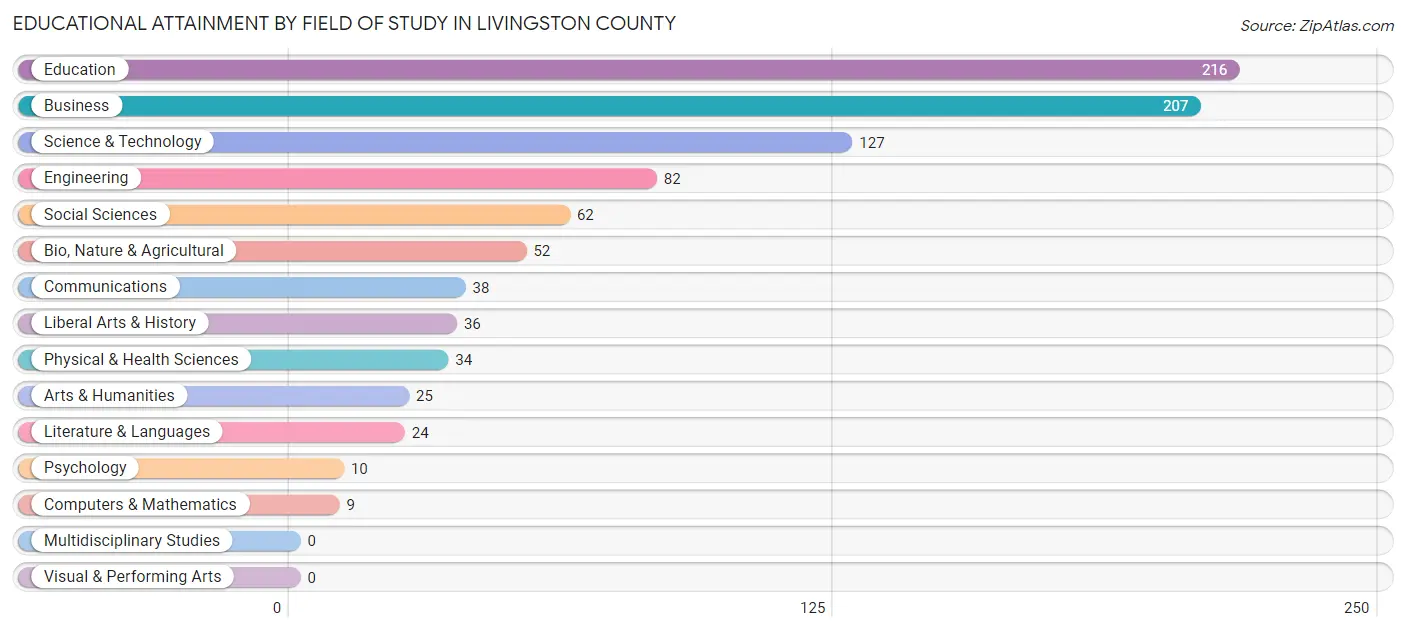
Educational Attainment by Field of Study in Livingston County
Education (216 | 23.4%), business (207 | 22.5%), science & technology (127 | 13.8%), engineering (82 | 8.9%), and social sciences (62 | 6.7%) are the most common fields of study among 922 individuals in Livingston County who have obtained a bachelor's degree or higher.
| Field of Study | # Graduates | % Graduates |
| Computers & Mathematics | 9 | 1.0% |
| Bio, Nature & Agricultural | 52 | 5.6% |
| Physical & Health Sciences | 34 | 3.7% |
| Psychology | 10 | 1.1% |
| Social Sciences | 62 | 6.7% |
| Engineering | 82 | 8.9% |
| Multidisciplinary Studies | 0 | 0.0% |
| Science & Technology | 127 | 13.8% |
| Business | 207 | 22.5% |
| Education | 216 | 23.4% |
| Literature & Languages | 24 | 2.6% |
| Liberal Arts & History | 36 | 3.9% |
| Visual & Performing Arts | 0 | 0.0% |
| Communications | 38 | 4.1% |
| Arts & Humanities | 25 | 2.7% |
| Total | 922 | 100.0% |
Transportation & Commute in Livingston County
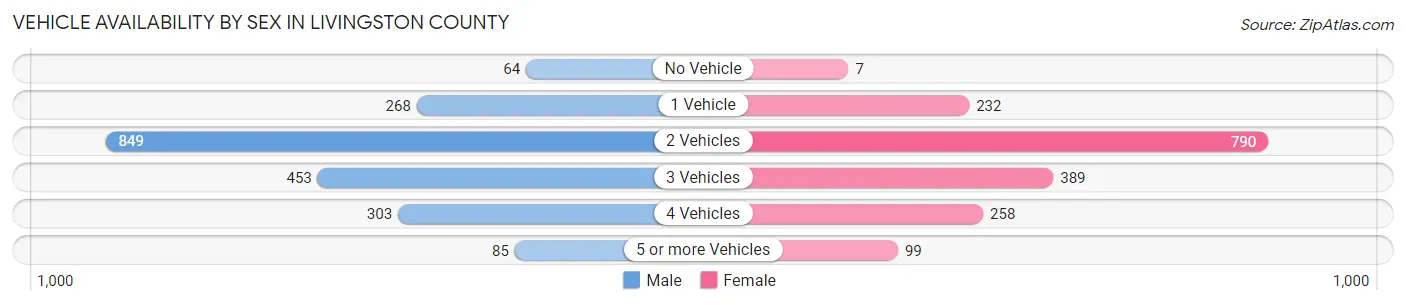
Vehicle Availability by Sex in Livingston County
The most prevalent vehicle ownership categories in Livingston County are males with 2 vehicles (849, accounting for 42.0%) and females with 2 vehicles (790, making up 47.8%).
| Vehicles Available | Male | Female |
| No Vehicle | 64 (3.2%) | 7 (0.4%) |
| 1 Vehicle | 268 (13.3%) | 232 (13.1%) |
| 2 Vehicles | 849 (42.0%) | 790 (44.5%) |
| 3 Vehicles | 453 (22.4%) | 389 (21.9%) |
| 4 Vehicles | 303 (15.0%) | 258 (14.5%) |
| 5 or more Vehicles | 85 (4.2%) | 99 (5.6%) |
| Total | 2,022 (100.0%) | 1,775 (100.0%) |
Commute Time in Livingston County
The most frequently occuring commute durations in Livingston County are 20 to 24 minutes (660 commuters, 18.0%), 15 to 19 minutes (453 commuters, 12.4%), and 30 to 34 minutes (388 commuters, 10.6%).
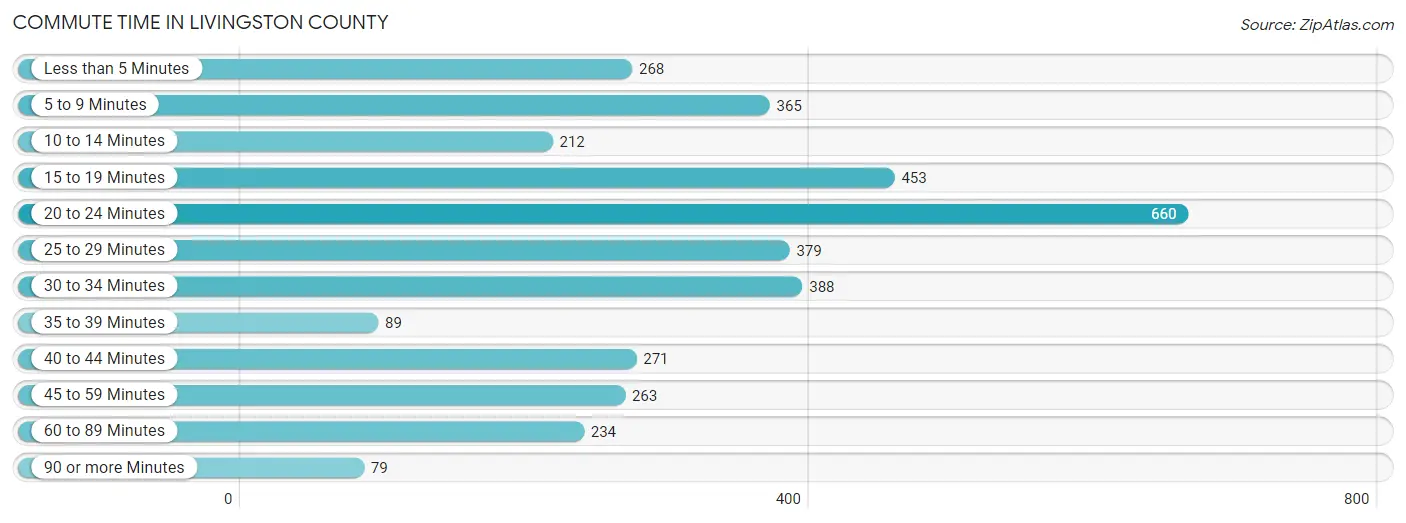
| Commute Time | # Commuters | % Commuters |
| Less than 5 Minutes | 268 | 7.3% |
| 5 to 9 Minutes | 365 | 10.0% |
| 10 to 14 Minutes | 212 | 5.8% |
| 15 to 19 Minutes | 453 | 12.4% |
| 20 to 24 Minutes | 660 | 18.0% |
| 25 to 29 Minutes | 379 | 10.3% |
| 30 to 34 Minutes | 388 | 10.6% |
| 35 to 39 Minutes | 89 | 2.4% |
| 40 to 44 Minutes | 271 | 7.4% |
| 45 to 59 Minutes | 263 | 7.2% |
| 60 to 89 Minutes | 234 | 6.4% |
| 90 or more Minutes | 79 | 2.2% |
Commute Time by Sex in Livingston County
The most common commute times in Livingston County are 20 to 24 minutes (367 commuters, 18.5%) for males and 15 to 19 minutes (330 commuters, 19.7%) for females.
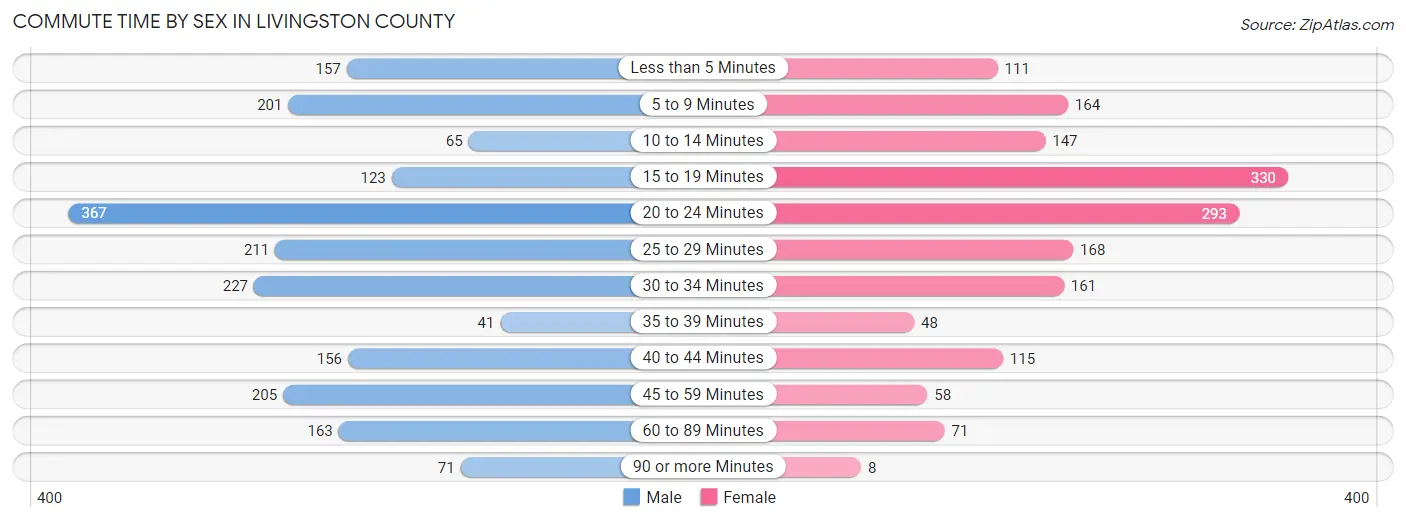
| Commute Time | Male | Female |
| Less than 5 Minutes | 157 (7.9%) | 111 (6.6%) |
| 5 to 9 Minutes | 201 (10.1%) | 164 (9.8%) |
| 10 to 14 Minutes | 65 (3.3%) | 147 (8.8%) |
| 15 to 19 Minutes | 123 (6.2%) | 330 (19.7%) |
| 20 to 24 Minutes | 367 (18.5%) | 293 (17.5%) |
| 25 to 29 Minutes | 211 (10.6%) | 168 (10.0%) |
| 30 to 34 Minutes | 227 (11.4%) | 161 (9.6%) |
| 35 to 39 Minutes | 41 (2.1%) | 48 (2.9%) |
| 40 to 44 Minutes | 156 (7.9%) | 115 (6.9%) |
| 45 to 59 Minutes | 205 (10.3%) | 58 (3.5%) |
| 60 to 89 Minutes | 163 (8.2%) | 71 (4.2%) |
| 90 or more Minutes | 71 (3.6%) | 8 (0.5%) |
Time of Departure to Work by Sex in Livingston County
The most frequent times of departure to work in Livingston County are 7:00 AM to 7:29 AM (427, 21.5%) for males and 7:00 AM to 7:29 AM (330, 19.7%) for females.
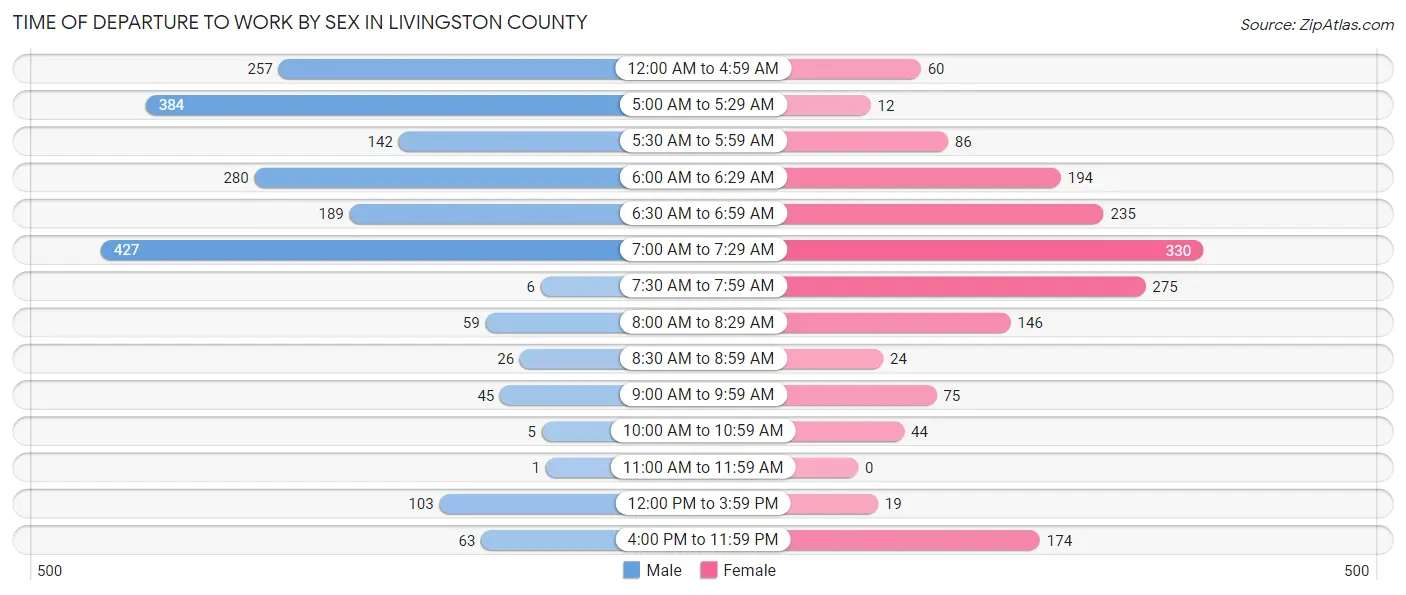
| Time of Departure | Male | Female |
| 12:00 AM to 4:59 AM | 257 (12.9%) | 60 (3.6%) |
| 5:00 AM to 5:29 AM | 384 (19.3%) | 12 (0.7%) |
| 5:30 AM to 5:59 AM | 142 (7.1%) | 86 (5.1%) |
| 6:00 AM to 6:29 AM | 280 (14.1%) | 194 (11.6%) |
| 6:30 AM to 6:59 AM | 189 (9.5%) | 235 (14.0%) |
| 7:00 AM to 7:29 AM | 427 (21.5%) | 330 (19.7%) |
| 7:30 AM to 7:59 AM | 6 (0.3%) | 275 (16.4%) |
| 8:00 AM to 8:29 AM | 59 (3.0%) | 146 (8.7%) |
| 8:30 AM to 8:59 AM | 26 (1.3%) | 24 (1.4%) |
| 9:00 AM to 9:59 AM | 45 (2.3%) | 75 (4.5%) |
| 10:00 AM to 10:59 AM | 5 (0.3%) | 44 (2.6%) |
| 11:00 AM to 11:59 AM | 1 (0.1%) | 0 (0.0%) |
| 12:00 PM to 3:59 PM | 103 (5.2%) | 19 (1.1%) |
| 4:00 PM to 11:59 PM | 63 (3.2%) | 174 (10.4%) |
| Total | 1,987 (100.0%) | 1,674 (100.0%) |
Housing Occupancy in Livingston County
Occupancy by Ownership in Livingston County
Of the total 3,537 dwellings in Livingston County, owner-occupied units account for 2,898 (81.9%), while renter-occupied units make up 639 (18.1%).
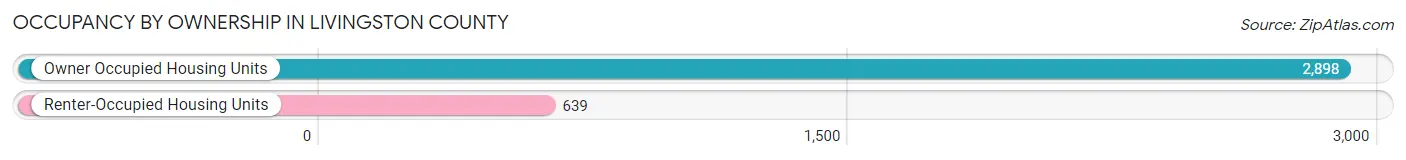
| Occupancy | # Housing Units | % Housing Units |
| Owner Occupied Housing Units | 2,898 | 81.9% |
| Renter-Occupied Housing Units | 639 | 18.1% |
| Total Occupied Housing Units | 3,537 | 100.0% |
Occupancy by Household Size in Livingston County
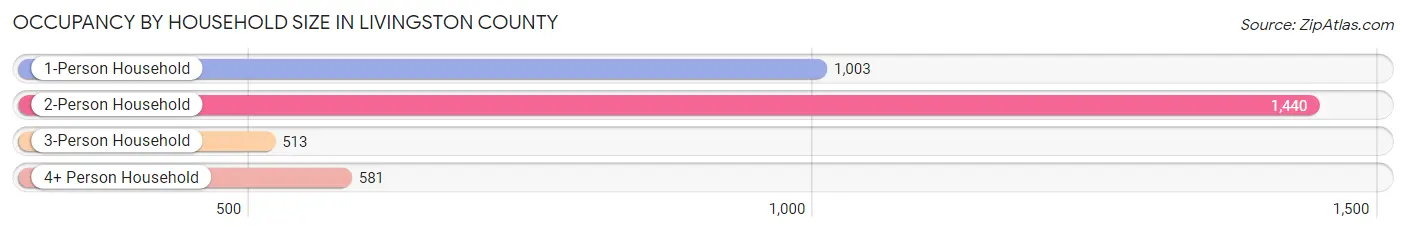
| Household Size | # Housing Units | % Housing Units |
| 1-Person Household | 1,003 | 28.4% |
| 2-Person Household | 1,440 | 40.7% |
| 3-Person Household | 513 | 14.5% |
| 4+ Person Household | 581 | 16.4% |
| Total Housing Units | 3,537 | 100.0% |
Occupancy by Ownership by Household Size in Livingston County
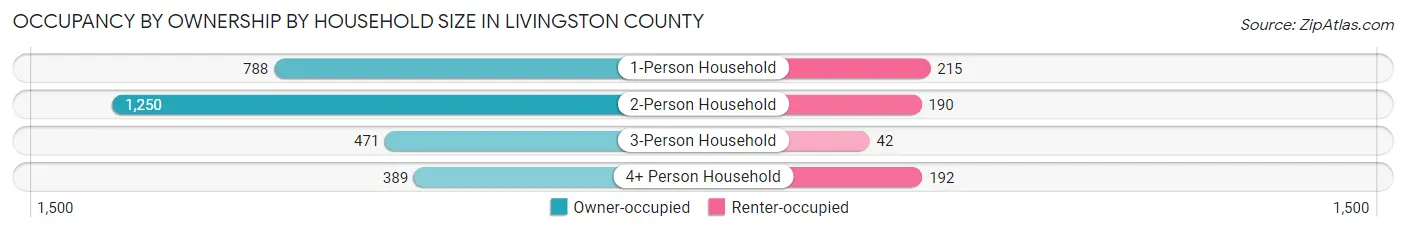
| Household Size | Owner-occupied | Renter-occupied |
| 1-Person Household | 788 (78.6%) | 215 (21.4%) |
| 2-Person Household | 1,250 (86.8%) | 190 (13.2%) |
| 3-Person Household | 471 (91.8%) | 42 (8.2%) |
| 4+ Person Household | 389 (66.9%) | 192 (33.1%) |
| Total Housing Units | 2,898 (81.9%) | 639 (18.1%) |
Occupancy by Educational Attainment in Livingston County
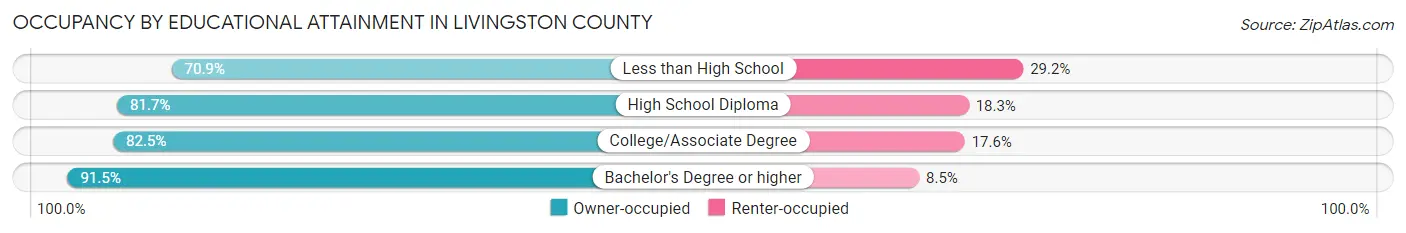
| Household Size | Owner-occupied | Renter-occupied |
| Less than High School | 316 (70.9%) | 130 (29.1%) |
| High School Diploma | 1,260 (81.7%) | 283 (18.3%) |
| College/Associate Degree | 860 (82.5%) | 183 (17.5%) |
| Bachelor's Degree or higher | 462 (91.5%) | 43 (8.5%) |
Occupancy by Age of Householder in Livingston County
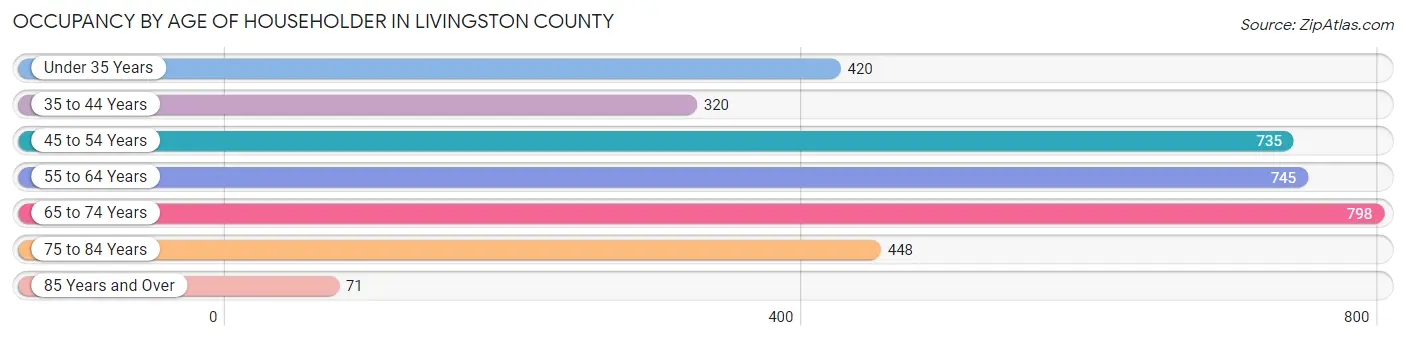
| Age Bracket | # Households | % Households |
| Under 35 Years | 420 | 11.9% |
| 35 to 44 Years | 320 | 9.0% |
| 45 to 54 Years | 735 | 20.8% |
| 55 to 64 Years | 745 | 21.1% |
| 65 to 74 Years | 798 | 22.6% |
| 75 to 84 Years | 448 | 12.7% |
| 85 Years and Over | 71 | 2.0% |
| Total | 3,537 | 100.0% |
Housing Finances in Livingston County
Median Income by Occupancy in Livingston County
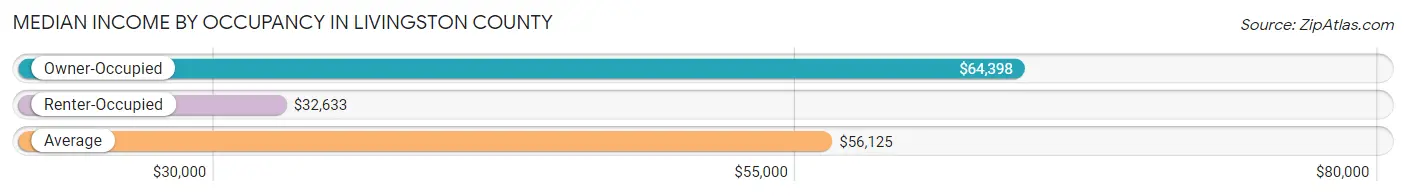
| Occupancy Type | # Households | Median Income |
| Owner-Occupied | 2,898 (81.9%) | $64,398 |
| Renter-Occupied | 639 (18.1%) | $32,633 |
| Average | 3,537 (100.0%) | $56,125 |
Occupancy by Householder Income Bracket in Livingston County
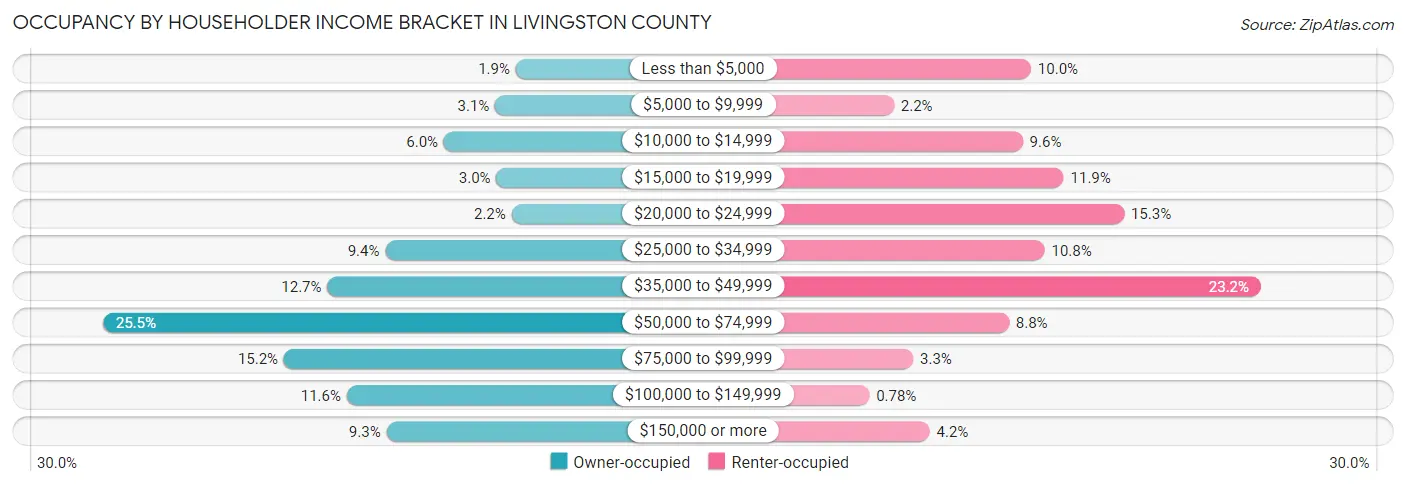
| Income Bracket | Owner-occupied | Renter-occupied |
| Less than $5,000 | 56 (1.9%) | 64 (10.0%) |
| $5,000 to $9,999 | 90 (3.1%) | 14 (2.2%) |
| $10,000 to $14,999 | 175 (6.0%) | 61 (9.6%) |
| $15,000 to $19,999 | 88 (3.0%) | 76 (11.9%) |
| $20,000 to $24,999 | 63 (2.2%) | 98 (15.3%) |
| $25,000 to $34,999 | 272 (9.4%) | 69 (10.8%) |
| $35,000 to $49,999 | 368 (12.7%) | 148 (23.2%) |
| $50,000 to $74,999 | 740 (25.5%) | 56 (8.8%) |
| $75,000 to $99,999 | 440 (15.2%) | 21 (3.3%) |
| $100,000 to $149,999 | 336 (11.6%) | 5 (0.8%) |
| $150,000 or more | 270 (9.3%) | 27 (4.2%) |
| Total | 2,898 (100.0%) | 639 (100.0%) |
Monthly Housing Cost Tiers in Livingston County
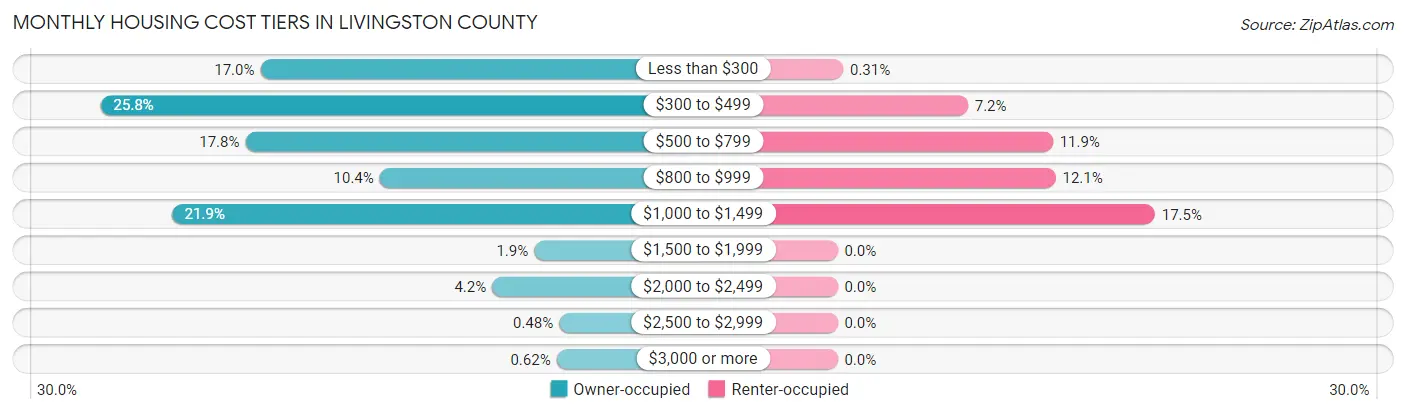
| Monthly Cost | Owner-occupied | Renter-occupied |
| Less than $300 | 492 (17.0%) | 2 (0.3%) |
| $300 to $499 | 748 (25.8%) | 46 (7.2%) |
| $500 to $799 | 516 (17.8%) | 76 (11.9%) |
| $800 to $999 | 301 (10.4%) | 77 (12.0%) |
| $1,000 to $1,499 | 634 (21.9%) | 112 (17.5%) |
| $1,500 to $1,999 | 54 (1.9%) | 0 (0.0%) |
| $2,000 to $2,499 | 121 (4.2%) | 0 (0.0%) |
| $2,500 to $2,999 | 14 (0.5%) | 0 (0.0%) |
| $3,000 or more | 18 (0.6%) | 0 (0.0%) |
| Total | 2,898 (100.0%) | 639 (100.0%) |
Physical Housing Characteristics in Livingston County
Housing Structures in Livingston County
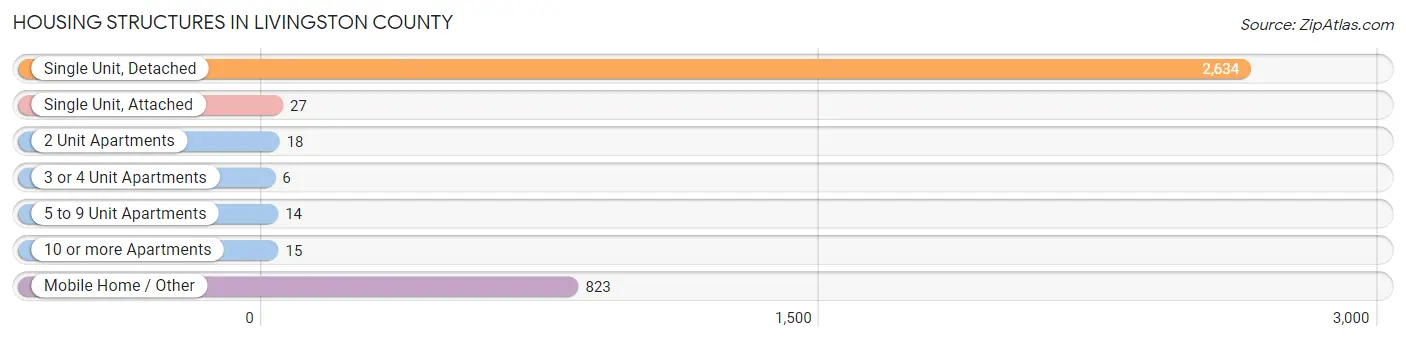
| Structure Type | # Housing Units | % Housing Units |
| Single Unit, Detached | 2,634 | 74.5% |
| Single Unit, Attached | 27 | 0.8% |
| 2 Unit Apartments | 18 | 0.5% |
| 3 or 4 Unit Apartments | 6 | 0.2% |
| 5 to 9 Unit Apartments | 14 | 0.4% |
| 10 or more Apartments | 15 | 0.4% |
| Mobile Home / Other | 823 | 23.3% |
| Total | 3,537 | 100.0% |
Housing Structures by Occupancy in Livingston County
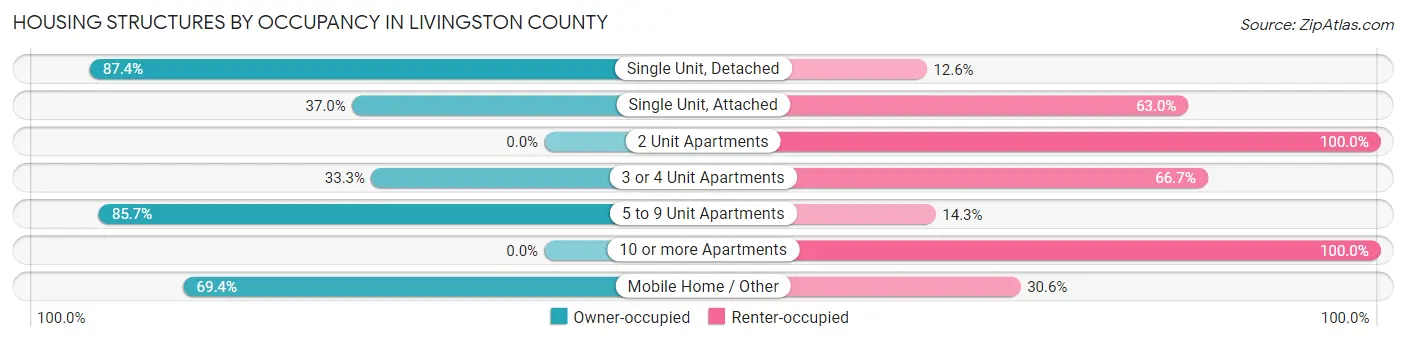
| Structure Type | Owner-occupied | Renter-occupied |
| Single Unit, Detached | 2,303 (87.4%) | 331 (12.6%) |
| Single Unit, Attached | 10 (37.0%) | 17 (63.0%) |
| 2 Unit Apartments | 0 (0.0%) | 18 (100.0%) |
| 3 or 4 Unit Apartments | 2 (33.3%) | 4 (66.7%) |
| 5 to 9 Unit Apartments | 12 (85.7%) | 2 (14.3%) |
| 10 or more Apartments | 0 (0.0%) | 15 (100.0%) |
| Mobile Home / Other | 571 (69.4%) | 252 (30.6%) |
| Total | 2,898 (81.9%) | 639 (18.1%) |
Housing Structures by Number of Rooms in Livingston County
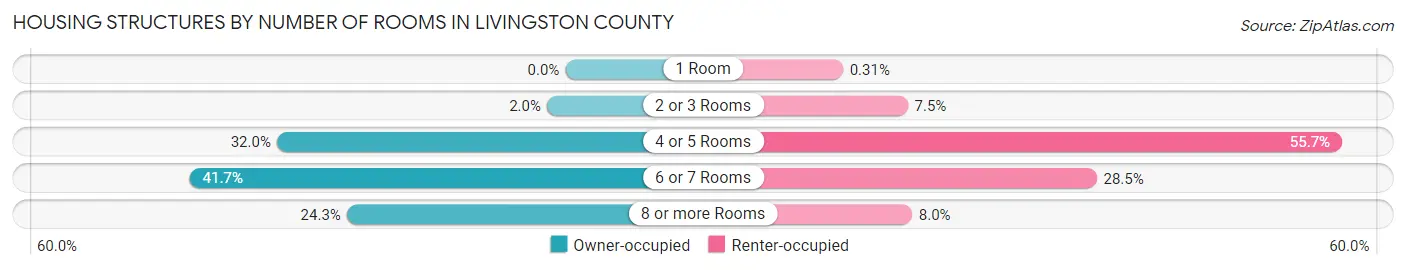
| Number of Rooms | Owner-occupied | Renter-occupied |
| 1 Room | 0 (0.0%) | 2 (0.3%) |
| 2 or 3 Rooms | 59 (2.0%) | 48 (7.5%) |
| 4 or 5 Rooms | 928 (32.0%) | 356 (55.7%) |
| 6 or 7 Rooms | 1,208 (41.7%) | 182 (28.5%) |
| 8 or more Rooms | 703 (24.3%) | 51 (8.0%) |
| Total | 2,898 (100.0%) | 639 (100.0%) |
Housing Structure by Heating Type in Livingston County
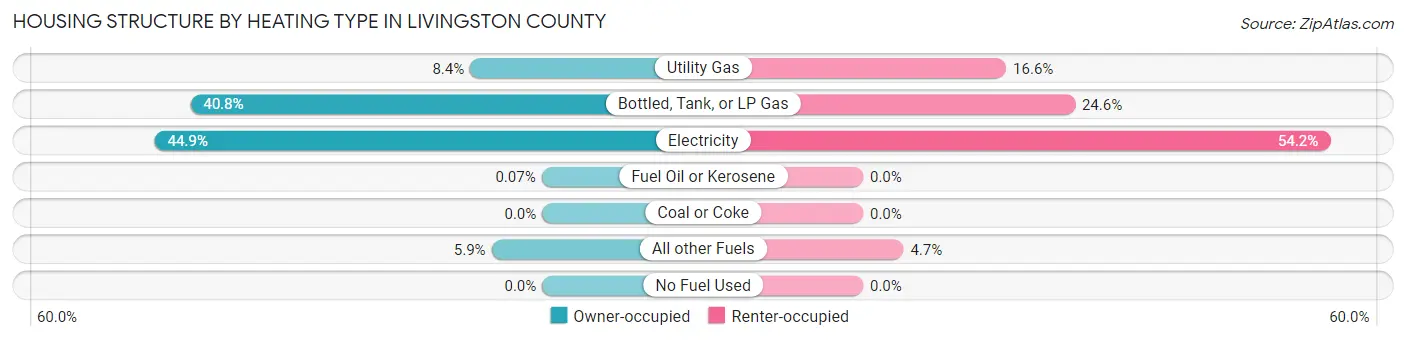
| Heating Type | Owner-occupied | Renter-occupied |
| Utility Gas | 242 (8.4%) | 106 (16.6%) |
| Bottled, Tank, or LP Gas | 1,182 (40.8%) | 157 (24.6%) |
| Electricity | 1,302 (44.9%) | 346 (54.1%) |
| Fuel Oil or Kerosene | 2 (0.1%) | 0 (0.0%) |
| Coal or Coke | 0 (0.0%) | 0 (0.0%) |
| All other Fuels | 170 (5.9%) | 30 (4.7%) |
| No Fuel Used | 0 (0.0%) | 0 (0.0%) |
| Total | 2,898 (100.0%) | 639 (100.0%) |
Household Vehicle Usage in Livingston County
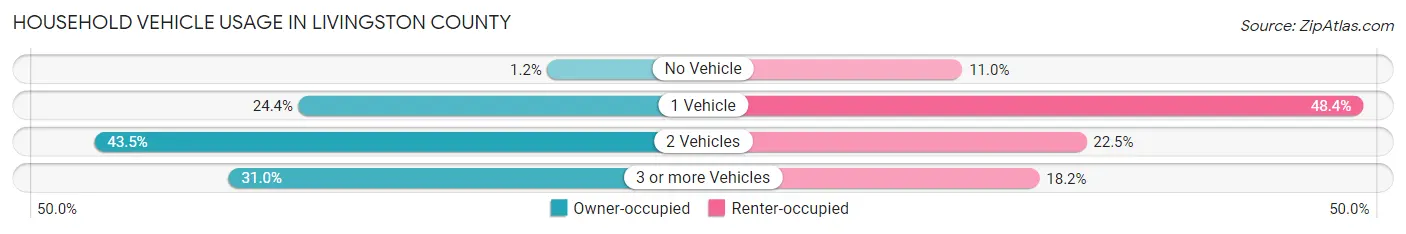
| Vehicles per Household | Owner-occupied | Renter-occupied |
| No Vehicle | 34 (1.2%) | 70 (11.0%) |
| 1 Vehicle | 707 (24.4%) | 309 (48.4%) |
| 2 Vehicles | 1,260 (43.5%) | 144 (22.5%) |
| 3 or more Vehicles | 897 (30.9%) | 116 (18.1%) |
| Total | 2,898 (100.0%) | 639 (100.0%) |
Real Estate & Mortgages in Livingston County
Real Estate and Mortgage Overview in Livingston County
| Characteristic | Without Mortgage | With Mortgage |
| Housing Units | 1,746 | 1,152 |
| Median Property Value | $96,200 | $121,200 |
| Median Household Income | $59,141 | $187 |
| Monthly Housing Costs | $411 | $18 |
| Real Estate Taxes | $534 | $104 |
Property Value by Mortgage Status in Livingston County
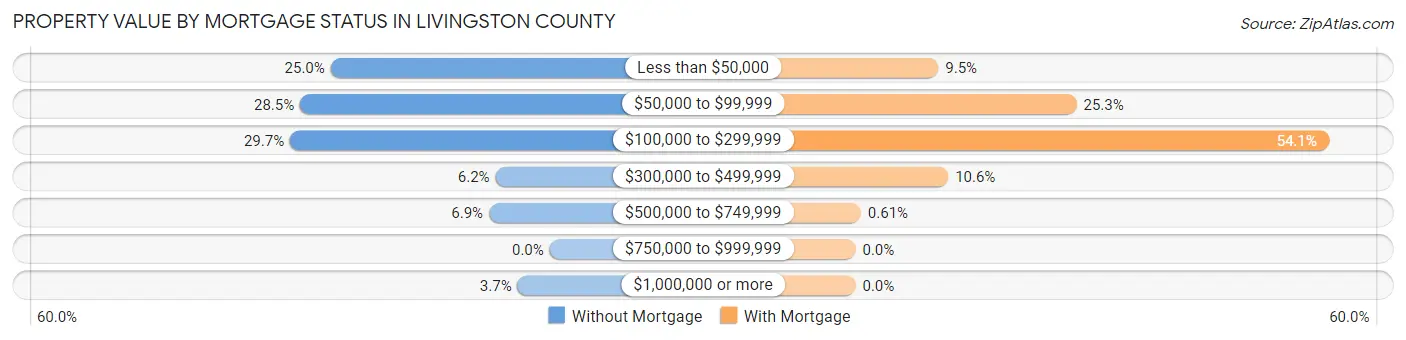
| Property Value | Without Mortgage | With Mortgage |
| Less than $50,000 | 437 (25.0%) | 109 (9.5%) |
| $50,000 to $99,999 | 498 (28.5%) | 291 (25.3%) |
| $100,000 to $299,999 | 518 (29.7%) | 623 (54.1%) |
| $300,000 to $499,999 | 108 (6.2%) | 122 (10.6%) |
| $500,000 to $749,999 | 121 (6.9%) | 7 (0.6%) |
| $750,000 to $999,999 | 0 (0.0%) | 0 (0.0%) |
| $1,000,000 or more | 64 (3.7%) | 0 (0.0%) |
| Total | 1,746 (100.0%) | 1,152 (100.0%) |
Household Income by Mortgage Status in Livingston County
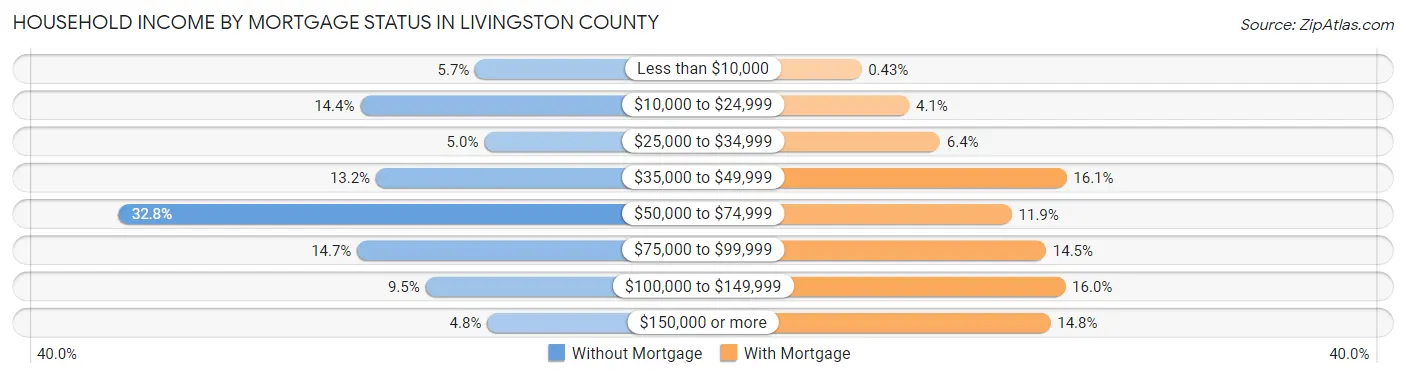
| Household Income | Without Mortgage | With Mortgage |
| Less than $10,000 | 99 (5.7%) | 5 (0.4%) |
| $10,000 to $24,999 | 252 (14.4%) | 47 (4.1%) |
| $25,000 to $34,999 | 87 (5.0%) | 74 (6.4%) |
| $35,000 to $49,999 | 231 (13.2%) | 185 (16.1%) |
| $50,000 to $74,999 | 573 (32.8%) | 137 (11.9%) |
| $75,000 to $99,999 | 256 (14.7%) | 167 (14.5%) |
| $100,000 to $149,999 | 165 (9.5%) | 184 (16.0%) |
| $150,000 or more | 83 (4.8%) | 171 (14.8%) |
| Total | 1,746 (100.0%) | 1,152 (100.0%) |
Property Value to Household Income Ratio in Livingston County
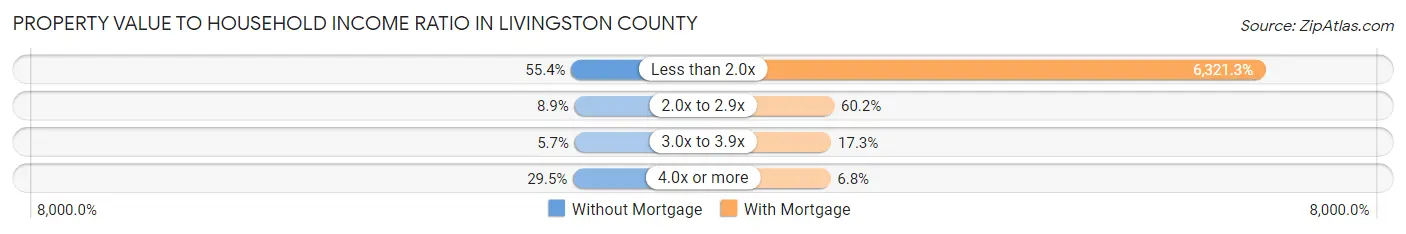
| Value-to-Income Ratio | Without Mortgage | With Mortgage |
| Less than 2.0x | 967 (55.4%) | 72,821 (6,321.3%) |
| 2.0x to 2.9x | 156 (8.9%) | 693 (60.2%) |
| 3.0x to 3.9x | 100 (5.7%) | 199 (17.3%) |
| 4.0x or more | 515 (29.5%) | 78 (6.8%) |
| Total | 1,746 (100.0%) | 1,152 (100.0%) |
Real Estate Taxes by Mortgage Status in Livingston County
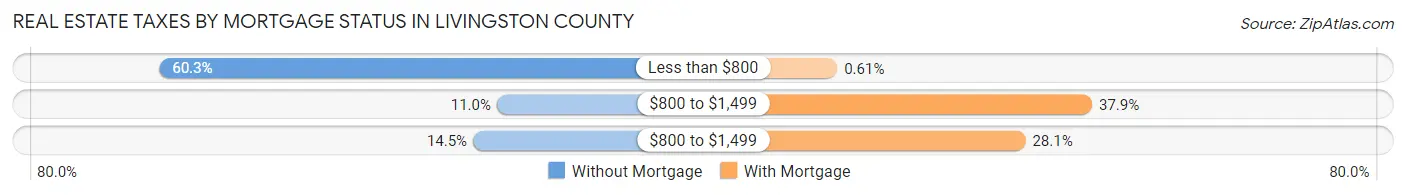
| Property Taxes | Without Mortgage | With Mortgage |
| Less than $800 | 1,053 (60.3%) | 7 (0.6%) |
| $800 to $1,499 | 192 (11.0%) | 436 (37.9%) |
| $800 to $1,499 | 253 (14.5%) | 324 (28.1%) |
| Total | 1,746 (100.0%) | 1,152 (100.0%) |
Health & Disability in Livingston County
Health Insurance Coverage by Age in Livingston County
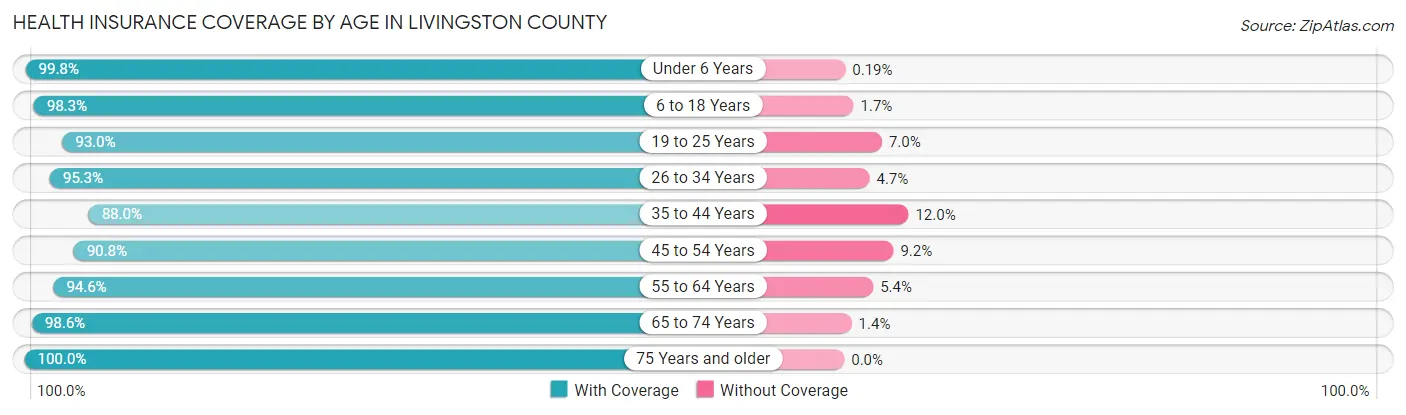
| Age Bracket | With Coverage | Without Coverage |
| Under 6 Years | 518 (99.8%) | 1 (0.2%) |
| 6 to 18 Years | 1,367 (98.3%) | 24 (1.7%) |
| 19 to 25 Years | 608 (93.0%) | 46 (7.0%) |
| 26 to 34 Years | 849 (95.3%) | 42 (4.7%) |
| 35 to 44 Years | 794 (88.0%) | 108 (12.0%) |
| 45 to 54 Years | 1,110 (90.8%) | 112 (9.2%) |
| 55 to 64 Years | 1,368 (94.6%) | 78 (5.4%) |
| 65 to 74 Years | 1,156 (98.6%) | 16 (1.4%) |
| 75 Years and older | 729 (100.0%) | 0 (0.0%) |
| Total | 8,499 (95.2%) | 427 (4.8%) |
Health Insurance Coverage by Citizenship Status in Livingston County
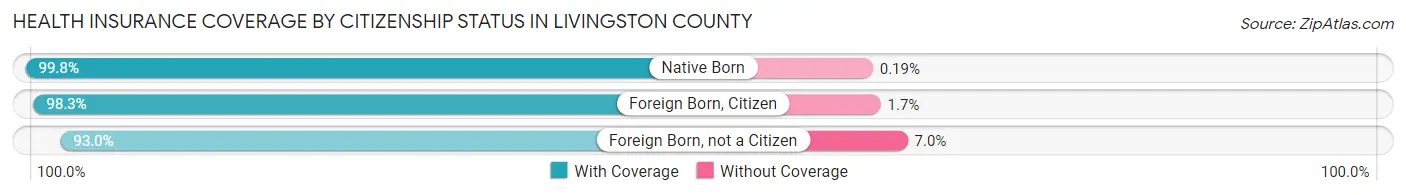
| Citizenship Status | With Coverage | Without Coverage |
| Native Born | 518 (99.8%) | 1 (0.2%) |
| Foreign Born, Citizen | 1,367 (98.3%) | 24 (1.7%) |
| Foreign Born, not a Citizen | 608 (93.0%) | 46 (7.0%) |
Health Insurance Coverage by Household Income in Livingston County
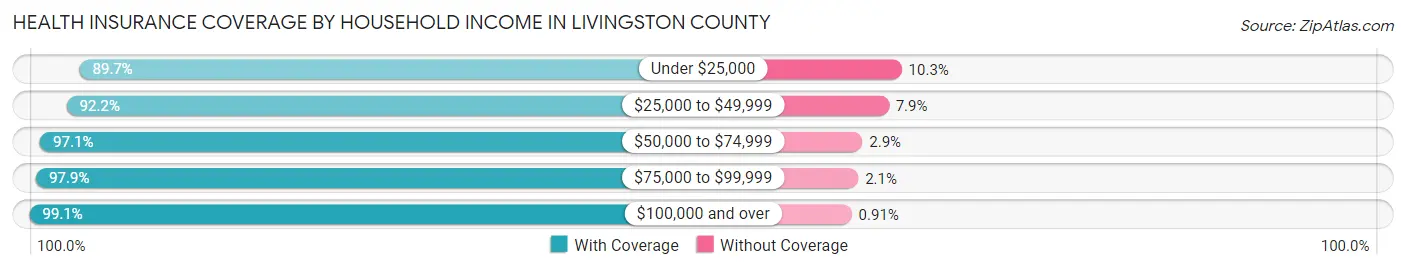
| Household Income | With Coverage | Without Coverage |
| Under $25,000 | 1,379 (89.7%) | 158 (10.3%) |
| $25,000 to $49,999 | 1,914 (92.1%) | 163 (7.9%) |
| $50,000 to $74,999 | 1,892 (97.1%) | 57 (2.9%) |
| $75,000 to $99,999 | 1,460 (97.9%) | 32 (2.1%) |
| $100,000 and over | 1,846 (99.1%) | 17 (0.9%) |
Public vs Private Health Insurance Coverage by Age in Livingston County
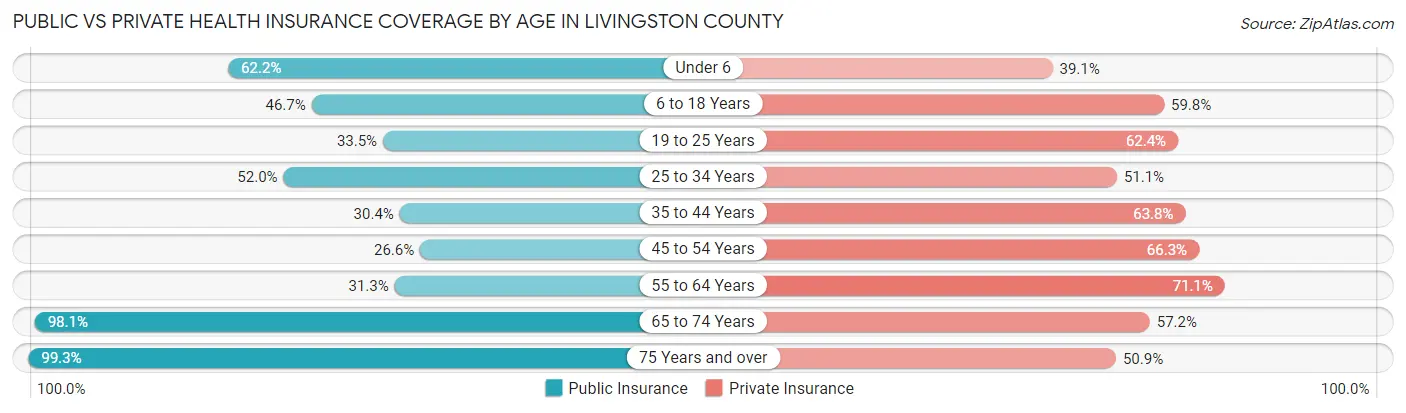
| Age Bracket | Public Insurance | Private Insurance |
| Under 6 | 323 (62.2%) | 203 (39.1%) |
| 6 to 18 Years | 650 (46.7%) | 832 (59.8%) |
| 19 to 25 Years | 219 (33.5%) | 408 (62.4%) |
| 25 to 34 Years | 463 (52.0%) | 455 (51.1%) |
| 35 to 44 Years | 274 (30.4%) | 575 (63.7%) |
| 45 to 54 Years | 325 (26.6%) | 810 (66.3%) |
| 55 to 64 Years | 453 (31.3%) | 1,028 (71.1%) |
| 65 to 74 Years | 1,150 (98.1%) | 670 (57.2%) |
| 75 Years and over | 724 (99.3%) | 371 (50.9%) |
| Total | 4,581 (51.3%) | 5,352 (60.0%) |
Disability Status by Sex by Age in Livingston County
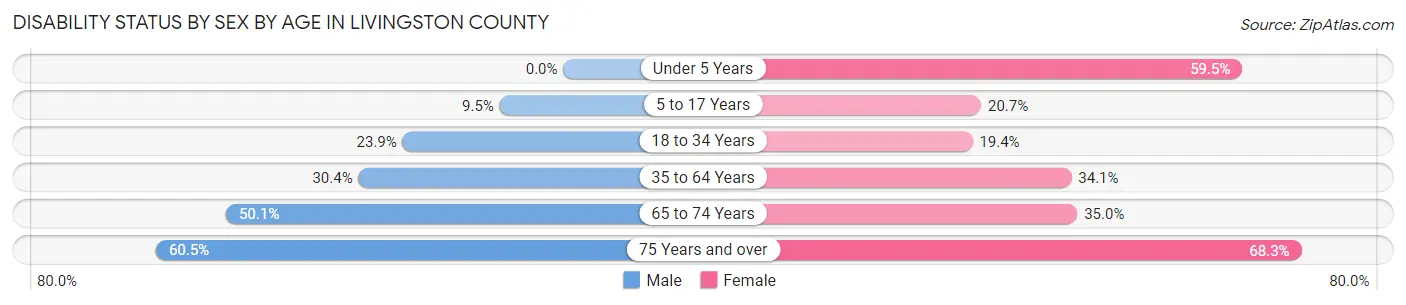
| Age Bracket | Male | Female |
| Under 5 Years | 0 (0.0%) | 110 (59.5%) |
| 5 to 17 Years | 69 (9.5%) | 133 (20.7%) |
| 18 to 34 Years | 179 (23.9%) | 169 (19.4%) |
| 35 to 64 Years | 540 (30.4%) | 612 (34.1%) |
| 65 to 74 Years | 289 (50.1%) | 208 (35.0%) |
| 75 Years and over | 199 (60.5%) | 273 (68.2%) |
Disability Class by Sex by Age in Livingston County
Disability Class: Hearing Difficulty
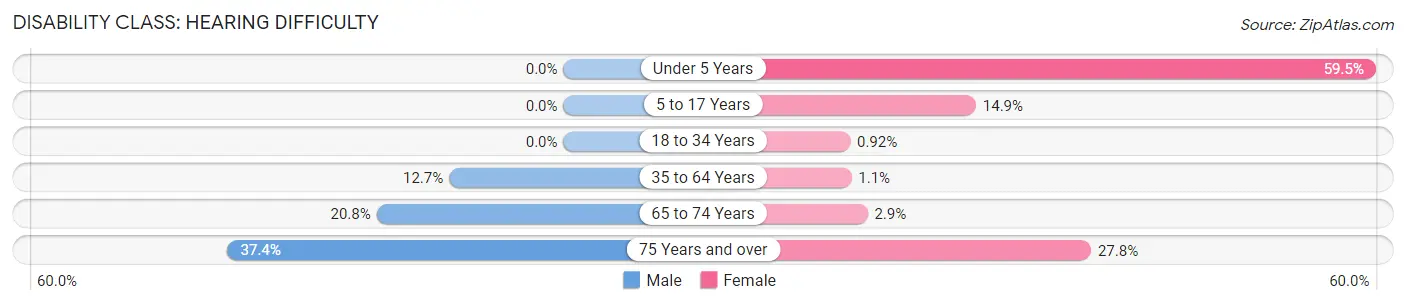
| Age Bracket | Male | Female |
| Under 5 Years | 0 (0.0%) | 110 (59.5%) |
| 5 to 17 Years | 0 (0.0%) | 96 (14.9%) |
| 18 to 34 Years | 0 (0.0%) | 8 (0.9%) |
| 35 to 64 Years | 226 (12.7%) | 19 (1.1%) |
| 65 to 74 Years | 120 (20.8%) | 17 (2.9%) |
| 75 Years and over | 123 (37.4%) | 111 (27.8%) |
Disability Class: Vision Difficulty
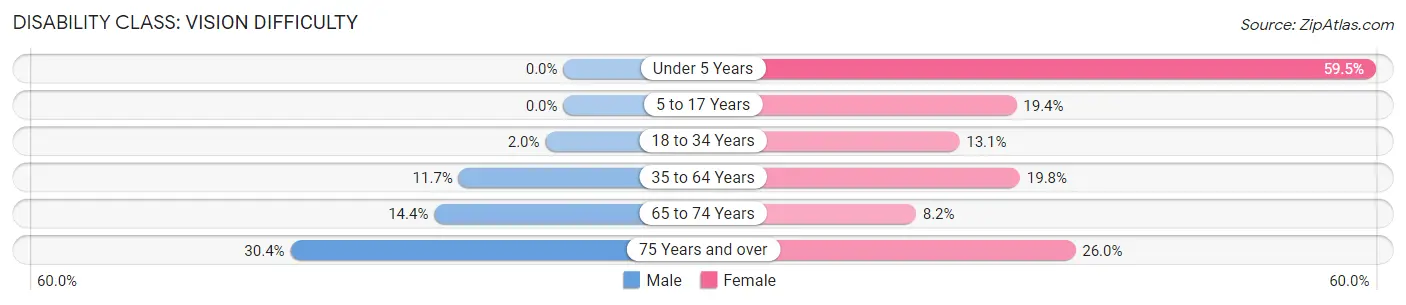
| Age Bracket | Male | Female |
| Under 5 Years | 0 (0.0%) | 110 (59.5%) |
| 5 to 17 Years | 0 (0.0%) | 125 (19.4%) |
| 18 to 34 Years | 15 (2.0%) | 114 (13.1%) |
| 35 to 64 Years | 207 (11.7%) | 356 (19.8%) |
| 65 to 74 Years | 83 (14.4%) | 49 (8.2%) |
| 75 Years and over | 100 (30.4%) | 104 (26.0%) |
Disability Class: Cognitive Difficulty
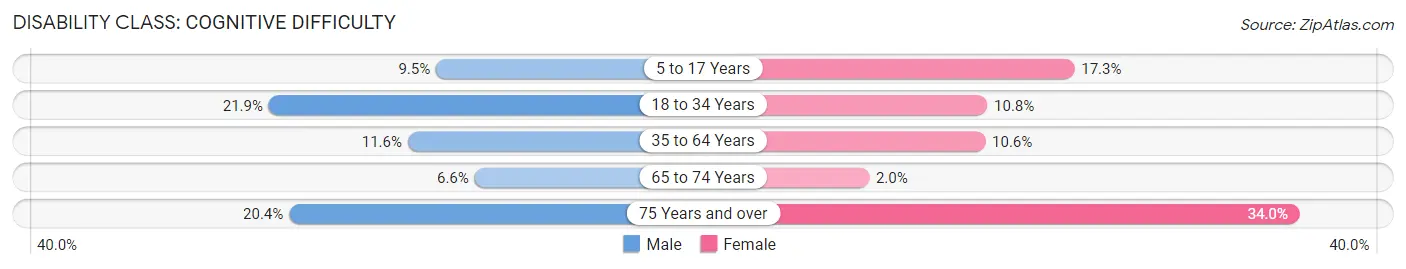
| Age Bracket | Male | Female |
| 5 to 17 Years | 69 (9.5%) | 111 (17.3%) |
| 18 to 34 Years | 164 (21.9%) | 94 (10.8%) |
| 35 to 64 Years | 205 (11.6%) | 191 (10.6%) |
| 65 to 74 Years | 38 (6.6%) | 12 (2.0%) |
| 75 Years and over | 67 (20.4%) | 136 (34.0%) |
Disability Class: Ambulatory Difficulty
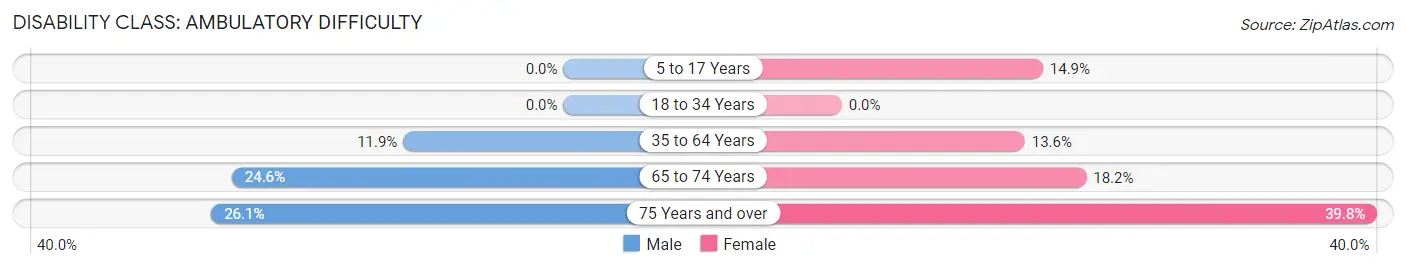
| Age Bracket | Male | Female |
| 5 to 17 Years | 0 (0.0%) | 96 (14.9%) |
| 18 to 34 Years | 0 (0.0%) | 0 (0.0%) |
| 35 to 64 Years | 211 (11.9%) | 244 (13.6%) |
| 65 to 74 Years | 142 (24.6%) | 108 (18.1%) |
| 75 Years and over | 86 (26.1%) | 159 (39.8%) |
Disability Class: Self-Care Difficulty
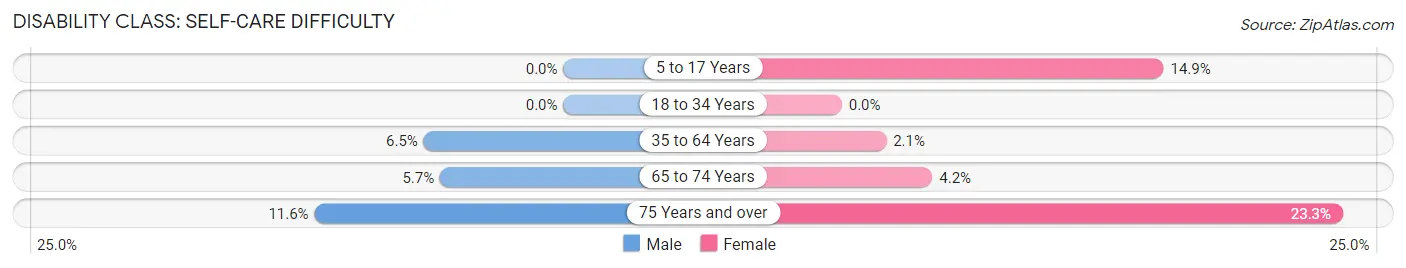
| Age Bracket | Male | Female |
| 5 to 17 Years | 0 (0.0%) | 96 (14.9%) |
| 18 to 34 Years | 0 (0.0%) | 0 (0.0%) |
| 35 to 64 Years | 115 (6.5%) | 37 (2.1%) |
| 65 to 74 Years | 33 (5.7%) | 25 (4.2%) |
| 75 Years and over | 38 (11.6%) | 93 (23.3%) |
Technology Access in Livingston County
Computing Device Access in Livingston County
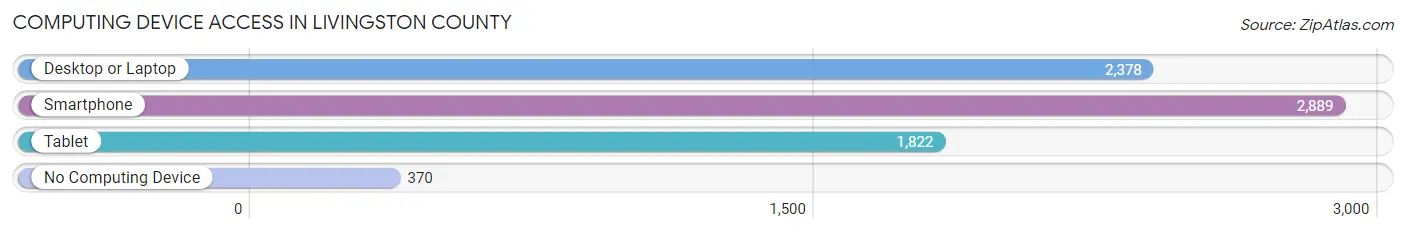
| Device Type | # Households | % Households |
| Desktop or Laptop | 2,378 | 67.2% |
| Smartphone | 2,889 | 81.7% |
| Tablet | 1,822 | 51.5% |
| No Computing Device | 370 | 10.5% |
| Total | 3,537 | 100.0% |
Internet Access in Livingston County
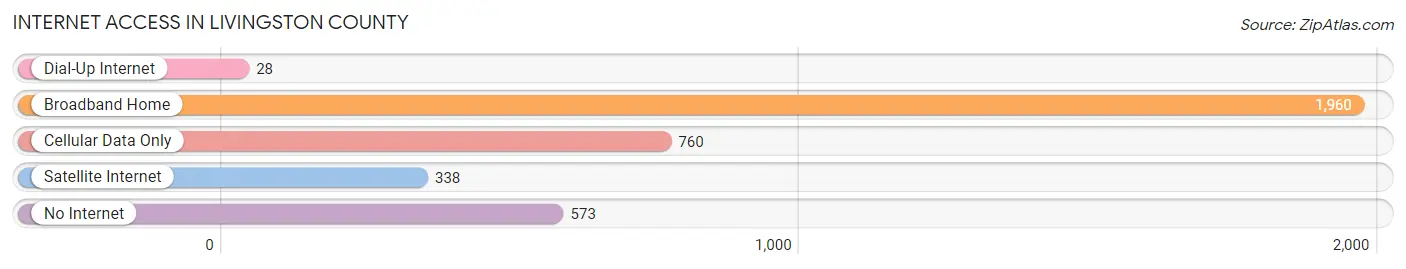
| Internet Type | # Households | % Households |
| Dial-Up Internet | 28 | 0.8% |
| Broadband Home | 1,960 | 55.4% |
| Cellular Data Only | 760 | 21.5% |
| Satellite Internet | 338 | 9.6% |
| No Internet | 573 | 16.2% |
| Total | 3,537 | 100.0% |
Livingston County Summary
Livingston County, Kentucky is located in the western part of the state, and is bordered by Crittenden County to the north, Union County to the east, Caldwell County to the south, and Hopkins County to the west. The county seat is Smithland, and the county was formed in 1798 from parts of Christian and Logan counties. The county is named for Robert R. Livingston, a member of the Continental Congress and the first Secretary of Foreign Affairs.
Geography
Livingston County is located in the Pennyrile region of Kentucky, and is part of the Western Coal Fields. The county has a total area of 441 square miles, of which 437 square miles is land and 4.2 square miles is water. The county is mostly flat, with some rolling hills in the northern part. The highest point in the county is located in the northwest corner, at an elevation of 590 feet. The county is drained by the Tradewater River, which flows through the center of the county.
The county is home to several state parks, including Kenlake State Resort Park, which is located on the shores of Kentucky Lake. The park offers camping, fishing, boating, and other recreational activities. Other parks in the county include the Land Between the Lakes National Recreation Area, which is located on the border between Kentucky and Tennessee, and the Fort Donelson National Battlefield, which is located in the northern part of the county.
Demographics
As of the 2010 census, there were 9,519 people, 3,845 households, and 2,717 families living in the county. The population density was 22 people per square mile. The racial makeup of the county was 95.3% White, 2.7% African American, 0.2% Native American, 0.2% Asian, 0.1% Pacific Islander, 0.4% from other races, and 1.1% from two or more races. Hispanic or Latino of any race were 1.3% of the population.
The median income for a household in the county was $33,945, and the median income for a family was $41,945. The per capita income for the county was $17,845. About 17.2% of families and 21.2% of the population were below the poverty line, including 28.2% of those under age 18 and 16.2% of those age 65 or over.
Economy
The economy of Livingston County is largely based on agriculture and tourism. The county is home to several large farms, which produce corn, soybeans, wheat, and other crops. The county is also home to several wineries, which produce a variety of wines.
Tourism is an important part of the county's economy, with visitors coming to the area to enjoy the many outdoor activities available. The county is home to several state parks, including Kenlake State Resort Park, which offers camping, fishing, boating, and other recreational activities. The Land Between the Lakes National Recreation Area is also located in the county, and offers visitors a variety of outdoor activities, including hiking, biking, and horseback riding.
Livingston County is also home to several manufacturing companies, including a furniture manufacturer, a plastics manufacturer, and a metal fabrication company. The county is also home to several retail stores, restaurants, and other businesses.
Livingston County is a rural county with a strong agricultural and tourism-based economy. The county is home to several state parks, wineries, and other attractions, and is a popular destination for outdoor enthusiasts. The county also has a strong manufacturing sector, and is home to several retail stores, restaurants, and other businesses.
Common Questions
What is the Total Population of Livingston County?
Total Population of Livingston County is 8,980.
What is the Total Male Population of Livingston County?
Total Male Population of Livingston County is 4,444.
What is the Total Female Population of Livingston County?
Total Female Population of Livingston County is 4,536.
What is the Ratio of Males per 100 Females in Livingston County?
There are 97.97 Males per 100 Females in Livingston County.
What is the Ratio of Females per 100 Males in Livingston County?
There are 102.07 Females per 100 Males in Livingston County.
What is the Median Population Age in Livingston County?
Median Population Age in Livingston County is 46.0 Years.
What is the Average Family Size in Livingston County
Average Family Size in Livingston County is 3.1 People.
What is the Average Household Size in Livingston County
Average Household Size in Livingston County is 2.5 People.
What is Per Capita Income in Livingston County?
Per Capita income in Livingston County is $31,024.
What is the Median Family Income in Livingston County?
Median Family Income in Livingston County is $67,561.
What is the Median Household income in Livingston County?
Median Household Income in Livingston County is $56,125.
What is Income or Wage Gap in Livingston County?
Income or Wage Gap in Livingston County is 31.9%.
Women in Livingston County earn 68.1 cents for every dollar earned by a man.
What is Family Income Deficit in Livingston County?
Family Income Deficit in Livingston County is $17,924.
Families that are below poverty line in Livingston County earn $17,924 less on average than the poverty threshold level.
What is Inequality or Gini Index in Livingston County?
Inequality or Gini Index in Livingston County is 0.47.
How Large is the Labor Force in Livingston County?
There are 4,088 People in the Labor Forcein in Livingston County.
What is the Percentage of People in the Labor Force in Livingston County?
55.0% of People are in the Labor Force in Livingston County.
What is the Unemployment Rate in Livingston County?
Unemployment Rate in Livingston County is 6.1%.