Letcher County, KY
Letcher County Map

Letcher County Overview
21,490
TOTAL POPULATION
10,702
MALE POPULATION
10,788
FEMALE POPULATION
99.20
MALES / 100 FEMALES
100.80
FEMALES / 100 MALES
42.7
MEDIAN AGE
3.1
AVG FAMILY SIZE
2.5
AVG HOUSEHOLD SIZE
$23,522
PER CAPITA INCOME
$52,578
AVG FAMILY INCOME
$38,466
AVG HOUSEHOLD INCOME
28.4%
WAGE / INCOME GAP [ % ]
71.6¢/ $1
WAGE / INCOME GAP [ $ ]
$10,143
FAMILY INCOME DEFICIT
0.50
INEQUALITY / GINI INDEX
7,583
LABOR FORCE [ PEOPLE ]
43.6%
PERCENT IN LABOR FORCE
7.7%
UNEMPLOYMENT RATE
Letcher County Area Codes
Race in Letcher County
The most populous races in Letcher County are White / Caucasian (20,950 | 97.5%), Two or more Races (298 | 1.4%), and Hispanic or Latino (199 | 0.9%).

| Race | # Population | % Population |
| Asian | 43 | 0.2% |
| Black / African American | 141 | 0.7% |
| Hawaiian / Pacific | 0 | 0.0% |
| Hispanic or Latino | 199 | 0.9% |
| Native / Alaskan | 8 | 0.0% |
| White / Caucasian | 20,950 | 97.5% |
| Two or more Races | 298 | 1.4% |
| Some other Race | 50 | 0.2% |
| Total | 21,490 | 100.0% |
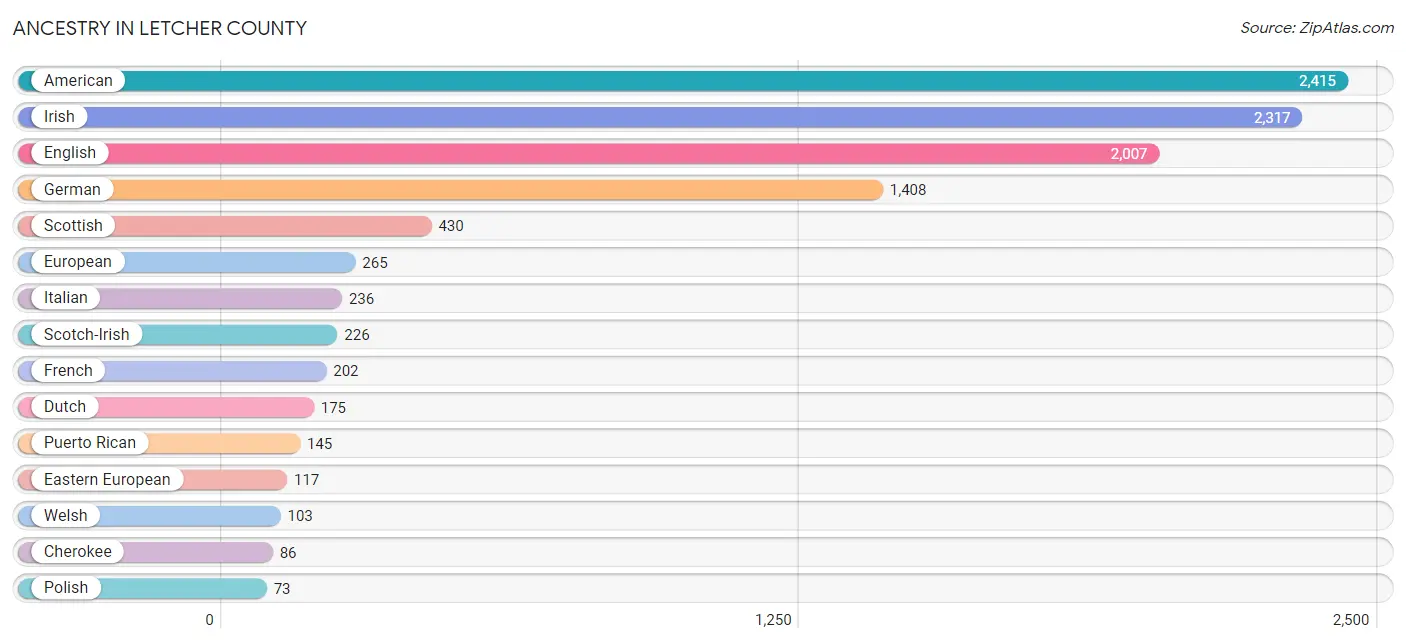
Ancestry in Letcher County
The most populous ancestries reported in Letcher County are American (2,415 | 11.2%), Irish (2,317 | 10.8%), English (2,007 | 9.3%), German (1,408 | 6.6%), and Scottish (430 | 2.0%), together accounting for 39.9% of all Letcher County residents.
| Ancestry | # Population | % Population |
| American | 2,415 | 11.2% |
| Arab | 5 | 0.0% |
| British | 44 | 0.2% |
| Cajun | 18 | 0.1% |
| Cape Verdean | 48 | 0.2% |
| Central American Indian | 43 | 0.2% |
| Cherokee | 86 | 0.4% |
| Chinese | 11 | 0.1% |
| Chippewa | 1 | 0.0% |
| Cuban | 23 | 0.1% |
| Dutch | 175 | 0.8% |
| Eastern European | 117 | 0.5% |
| English | 2,007 | 9.3% |
| European | 265 | 1.2% |
| French | 202 | 0.9% |
| French Canadian | 38 | 0.2% |
| German | 1,408 | 6.6% |
| Greek | 18 | 0.1% |
| Indian (Asian) | 13 | 0.1% |
| Irish | 2,317 | 10.8% |
| Italian | 236 | 1.1% |
| Korean | 2 | 0.0% |
| Laotian | 22 | 0.1% |
| Mexican | 28 | 0.1% |
| Nigerian | 5 | 0.0% |
| Norwegian | 20 | 0.1% |
| Polish | 73 | 0.3% |
| Puerto Rican | 145 | 0.7% |
| Scandinavian | 49 | 0.2% |
| Scotch-Irish | 226 | 1.1% |
| Scottish | 430 | 2.0% |
| Seminole | 14 | 0.1% |
| Sri Lankan | 7 | 0.0% |
| Subsaharan African | 53 | 0.3% |
| Swedish | 30 | 0.1% |
| Swiss | 31 | 0.1% |
| Thai | 24 | 0.1% |
| Welsh | 103 | 0.5% |
| West Indian | 43 | 0.2% | View All 39 Rows |
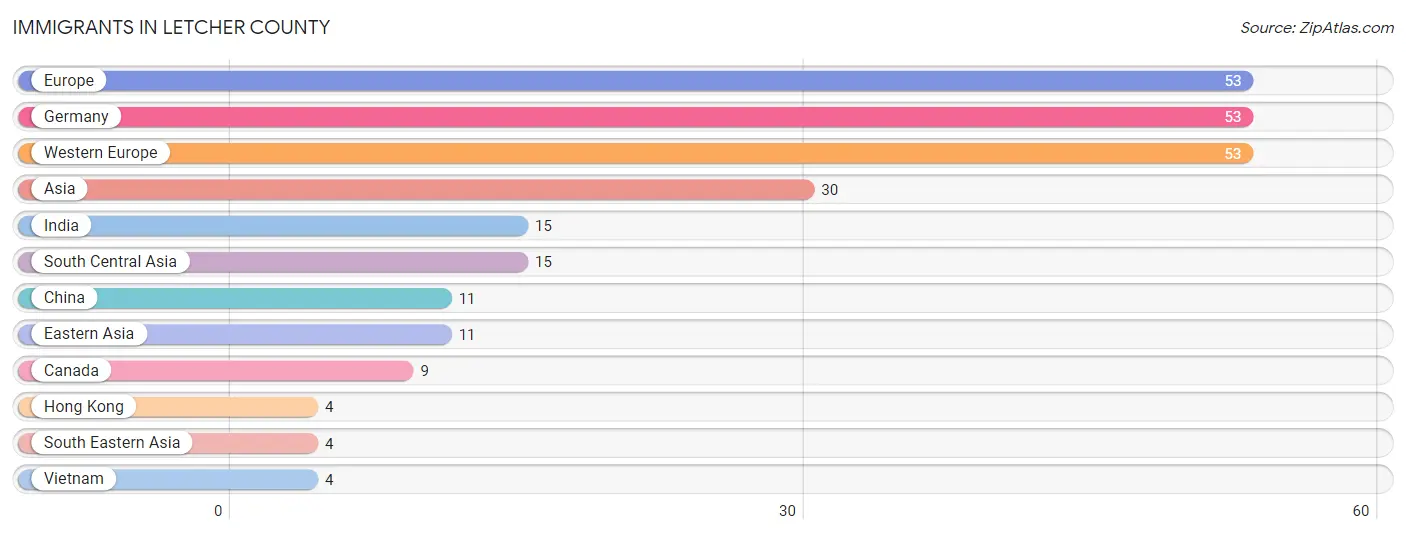
Immigrants in Letcher County
The most numerous immigrant groups reported in Letcher County came from Europe (53 | 0.3%), Germany (53 | 0.3%), Western Europe (53 | 0.3%), Asia (30 | 0.1%), and India (15 | 0.1%), together accounting for 1.0% of all Letcher County residents.
| Immigration Origin | # Population | % Population |
| Asia | 30 | 0.1% |
| Canada | 9 | 0.0% |
| China | 11 | 0.1% |
| Eastern Asia | 11 | 0.1% |
| Europe | 53 | 0.3% |
| Germany | 53 | 0.3% |
| Hong Kong | 4 | 0.0% |
| India | 15 | 0.1% |
| South Central Asia | 15 | 0.1% |
| South Eastern Asia | 4 | 0.0% |
| Vietnam | 4 | 0.0% |
| Western Europe | 53 | 0.3% | View All 12 Rows |
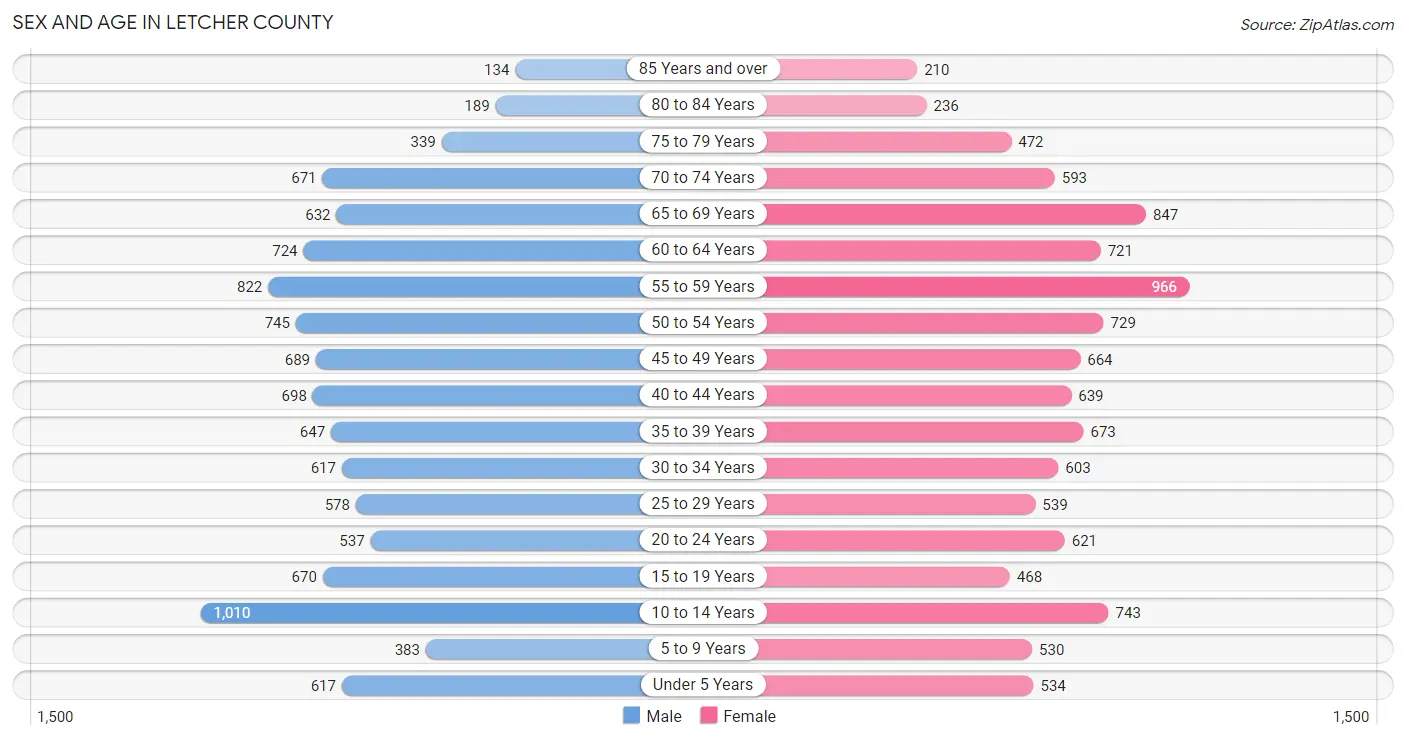
Sex and Age in Letcher County
Sex and Age in Letcher County
The most populous age groups in Letcher County are 10 to 14 Years (1,010 | 9.4%) for men and 55 to 59 Years (966 | 8.9%) for women.
| Age Bracket | Male | Female |
| Under 5 Years | 617 (5.8%) | 534 (5.0%) |
| 5 to 9 Years | 383 (3.6%) | 530 (4.9%) |
| 10 to 14 Years | 1,010 (9.4%) | 743 (6.9%) |
| 15 to 19 Years | 670 (6.3%) | 468 (4.3%) |
| 20 to 24 Years | 537 (5.0%) | 621 (5.8%) |
| 25 to 29 Years | 578 (5.4%) | 539 (5.0%) |
| 30 to 34 Years | 617 (5.8%) | 603 (5.6%) |
| 35 to 39 Years | 647 (6.0%) | 673 (6.2%) |
| 40 to 44 Years | 698 (6.5%) | 639 (5.9%) |
| 45 to 49 Years | 689 (6.4%) | 664 (6.1%) |
| 50 to 54 Years | 745 (7.0%) | 729 (6.8%) |
| 55 to 59 Years | 822 (7.7%) | 966 (8.9%) |
| 60 to 64 Years | 724 (6.8%) | 721 (6.7%) |
| 65 to 69 Years | 632 (5.9%) | 847 (7.9%) |
| 70 to 74 Years | 671 (6.3%) | 593 (5.5%) |
| 75 to 79 Years | 339 (3.2%) | 472 (4.4%) |
| 80 to 84 Years | 189 (1.8%) | 236 (2.2%) |
| 85 Years and over | 134 (1.3%) | 210 (1.9%) |
| Total | 10,702 (100.0%) | 10,788 (100.0%) |
Families and Households in Letcher County
Median Family Size in Letcher County
The median family size in Letcher County is 3.10 persons per family, with single female/mother families (832 | 15.1%) accounting for the largest median family size of 3.19 persons per family. On the other hand, single male/father families (554 | 10.1%) represent the smallest median family size with 2.70 persons per family.

| Family Type | # Families | Family Size |
| Married-Couple | 4,109 (74.8%) | 3.13 |
| Single Male/Father | 554 (10.1%) | 2.70 |
| Single Female/Mother | 832 (15.1%) | 3.19 |
| Total Families | 5,495 (100.0%) | 3.10 |
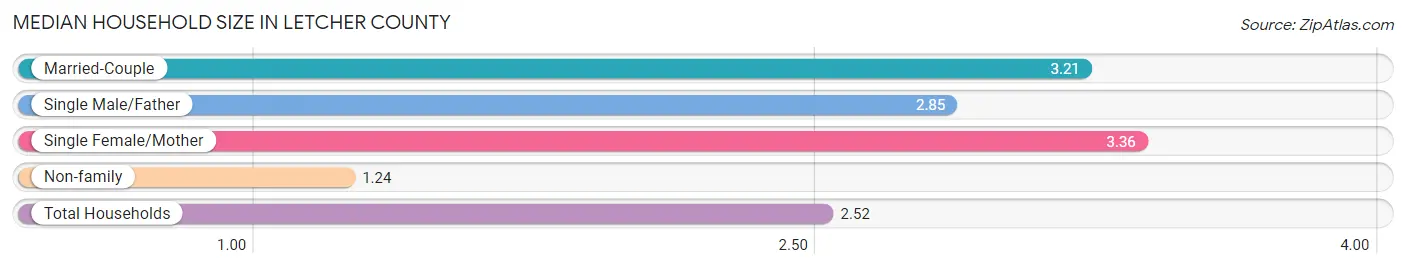
Median Household Size in Letcher County
The median household size in Letcher County is 2.52 persons per household, with single female/mother households (832 | 9.9%) accounting for the largest median household size of 3.36 persons per household. non-family households (2,920 | 34.7%) represent the smallest median household size with 1.24 persons per household.
| Household Type | # Households | Household Size |
| Married-Couple | 4,109 (48.8%) | 3.21 |
| Single Male/Father | 554 (6.6%) | 2.85 |
| Single Female/Mother | 832 (9.9%) | 3.36 |
| Non-family | 2,920 (34.7%) | 1.24 |
| Total Households | 8,415 (100.0%) | 2.52 |
Household Size by Marriage Status in Letcher County
Out of a total of 8,415 households in Letcher County, 5,495 (65.3%) are family households, while 2,920 (34.7%) are nonfamily households. The most numerous type of family households are 2-person households, comprising 2,397, and the most common type of nonfamily households are 1-person households, comprising 2,519.

| Household Size | Family Households | Nonfamily Households |
| 1-Person Households | - | 2,519 (29.9%) |
| 2-Person Households | 2,397 (28.5%) | 292 (3.5%) |
| 3-Person Households | 1,371 (16.3%) | 36 (0.4%) |
| 4-Person Households | 1,022 (12.1%) | 73 (0.9%) |
| 5-Person Households | 452 (5.4%) | 0 (0.0%) |
| 6-Person Households | 224 (2.7%) | 0 (0.0%) |
| 7+ Person Households | 29 (0.3%) | 0 (0.0%) |
| Total | 5,495 (65.3%) | 2,920 (34.7%) |
Female Fertility in Letcher County
Fertility by Age in Letcher County
Average fertility rate in Letcher County is 50.0 births per 1,000 women. Women in the age bracket of 20 to 34 years have the highest fertility rate with 98.0 births per 1,000 women. Women in the age bracket of 20 to 34 years acount for 79.4% of all women with births.
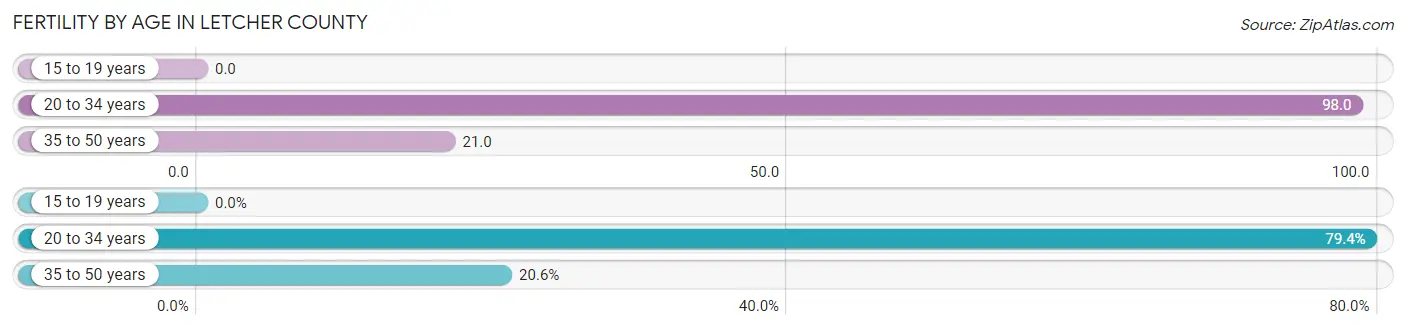
| Age Bracket | Women with Births | Births / 1,000 Women |
| 15 to 19 years | 0 (0.0%) | 0.0 |
| 20 to 34 years | 173 (79.4%) | 98.0 |
| 35 to 50 years | 45 (20.6%) | 21.0 |
| Total | 218 (100.0%) | 50.0 |
Fertility by Age by Marriage Status in Letcher County
87.2% of women with births (218) in Letcher County are married. The highest percentage of unmarried women with births falls into 35 to 50 years age bracket with 28.9% of them unmarried at the time of birth, while the lowest percentage of unmarried women with births belong to 20 to 34 years age bracket with 8.7% of them unmarried.
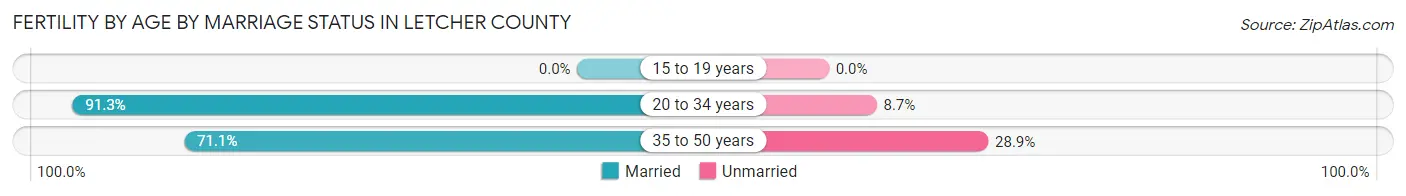
| Age Bracket | Married | Unmarried |
| 15 to 19 years | 0 (0.0%) | 0 (0.0%) |
| 20 to 34 years | 158 (91.3%) | 15 (8.7%) |
| 35 to 50 years | 32 (71.1%) | 13 (28.9%) |
| Total | 190 (87.2%) | 28 (12.8%) |
Fertility by Education in Letcher County
Average fertility rate in Letcher County is 50.0 births per 1,000 women. Women with the education attainment of graduate degree have the highest fertility rate of 147.0 births per 1,000 women, while women with the education attainment of high school diploma have the lowest fertility at 24.0 births per 1,000 women. Women with the education attainment of college or associate's degree represent 37.2% of all women with births.
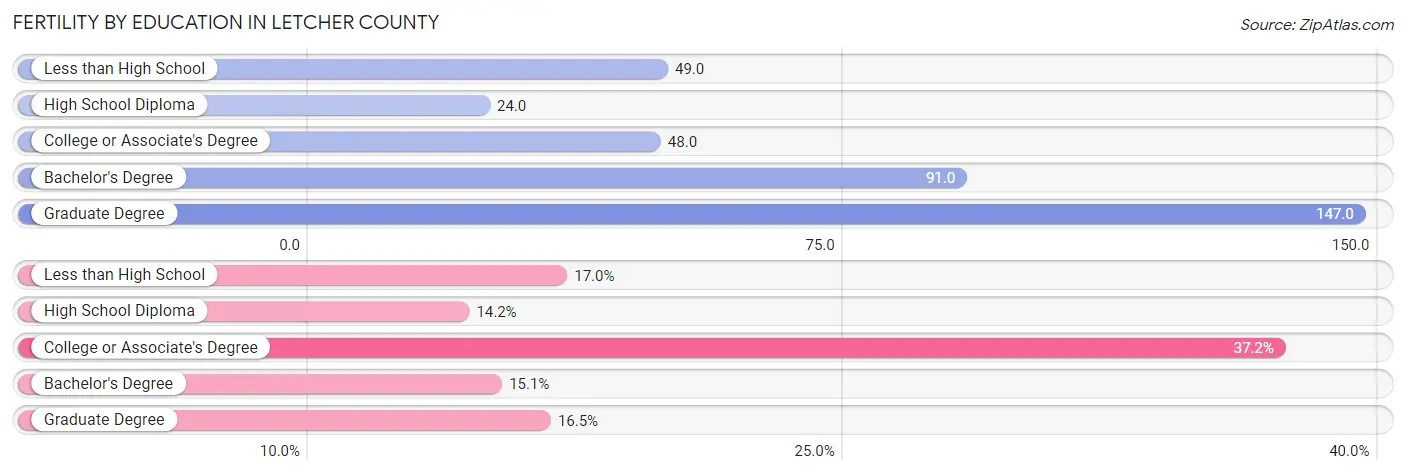
| Educational Attainment | Women with Births | Births / 1,000 Women |
| Less than High School | 37 (17.0%) | 49.0 |
| High School Diploma | 31 (14.2%) | 24.0 |
| College or Associate's Degree | 81 (37.2%) | 48.0 |
| Bachelor's Degree | 33 (15.1%) | 91.0 |
| Graduate Degree | 36 (16.5%) | 147.0 |
| Total | 218 (100.0%) | 50.0 |
Fertility by Education by Marriage Status in Letcher County
12.8% of women with births in Letcher County are unmarried. Women with the educational attainment of less than high school are most likely to be married with 100.0% of them married at childbirth, while women with the educational attainment of high school diploma are least likely to be married with 80.6% of them unmarried at childbirth.

| Educational Attainment | Married | Unmarried |
| Less than High School | 37 (100.0%) | 0 (0.0%) |
| High School Diploma | 6 (19.4%) | 25 (80.6%) |
| College or Associate's Degree | 81 (100.0%) | 0 (0.0%) |
| Bachelor's Degree | 30 (90.9%) | 3 (9.1%) |
| Graduate Degree | 36 (100.0%) | 0 (0.0%) |
| Total | 190 (87.2%) | 28 (12.8%) |
Income in Letcher County
Income Overview in Letcher County
Per Capita Income in Letcher County is $23,522, while median incomes of families and households are $52,578 and $38,466 respectively.
| Characteristic | Number | Measure |
| Per Capita Income | 21,490 | $23,522 |
| Median Family Income | 5,495 | $52,578 |
| Mean Family Income | 5,495 | $64,231 |
| Median Household Income | 8,415 | $38,466 |
| Mean Household Income | 8,415 | $55,991 |
| Income Deficit | 5,495 | $10,143 |
| Wage / Income Gap (%) | 21,490 | 28.37% |
| Wage / Income Gap ($) | 21,490 | 71.63¢ per $1 |
| Gini / Inequality Index | 21,490 | 0.50 |
Earnings by Sex in Letcher County
Average Earnings in Letcher County are $30,125, $36,549 for men and $26,180 for women, a difference of 28.4%.
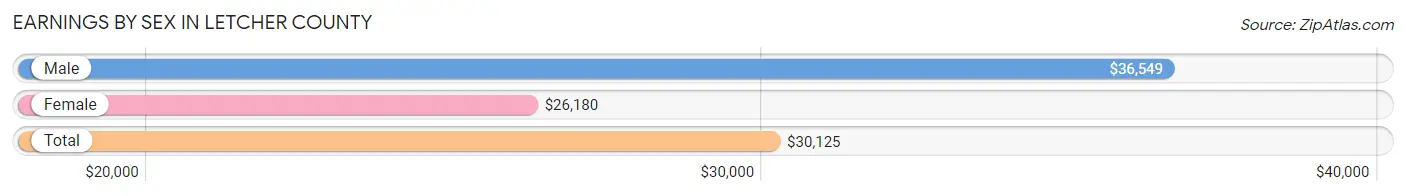
| Sex | Number | Average Earnings |
| Male | 3,888 (49.8%) | $36,549 |
| Female | 3,914 (50.2%) | $26,180 |
| Total | 7,802 (100.0%) | $30,125 |
Earnings by Sex by Income Bracket in Letcher County
The most common earnings brackets in Letcher County are $75,000 to $99,999 for men (435 | 11.2%) and $35,000 to $39,999 for women (403 | 10.3%).
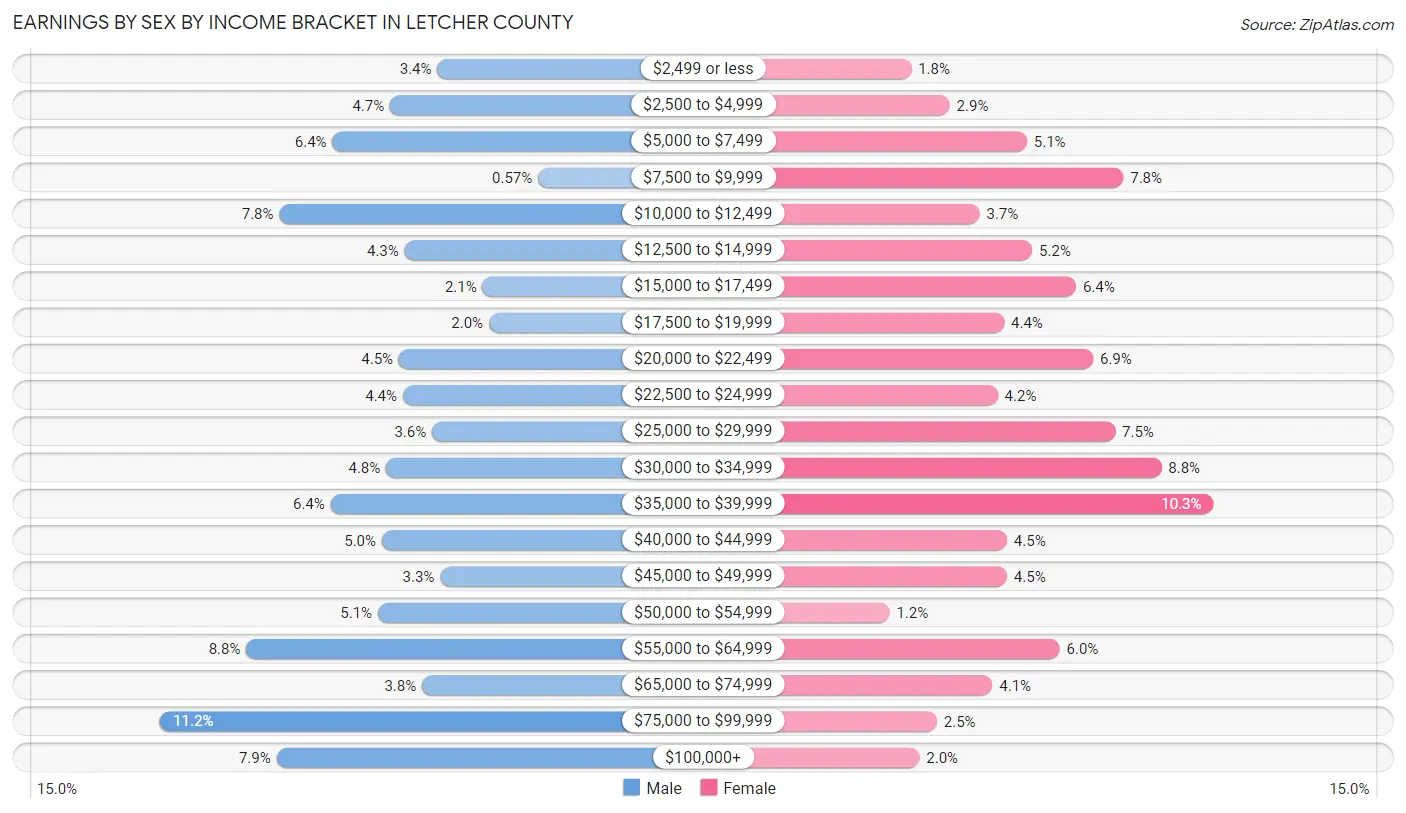
| Income | Male | Female |
| $2,499 or less | 132 (3.4%) | 71 (1.8%) |
| $2,500 to $4,999 | 184 (4.7%) | 113 (2.9%) |
| $5,000 to $7,499 | 247 (6.4%) | 198 (5.1%) |
| $7,500 to $9,999 | 22 (0.6%) | 304 (7.8%) |
| $10,000 to $12,499 | 305 (7.8%) | 146 (3.7%) |
| $12,500 to $14,999 | 168 (4.3%) | 204 (5.2%) |
| $15,000 to $17,499 | 83 (2.1%) | 252 (6.4%) |
| $17,500 to $19,999 | 76 (1.9%) | 173 (4.4%) |
| $20,000 to $22,499 | 174 (4.5%) | 271 (6.9%) |
| $22,500 to $24,999 | 170 (4.4%) | 166 (4.2%) |
| $25,000 to $29,999 | 138 (3.5%) | 295 (7.5%) |
| $30,000 to $34,999 | 188 (4.8%) | 346 (8.8%) |
| $35,000 to $39,999 | 249 (6.4%) | 403 (10.3%) |
| $40,000 to $44,999 | 193 (5.0%) | 176 (4.5%) |
| $45,000 to $49,999 | 129 (3.3%) | 176 (4.5%) |
| $50,000 to $54,999 | 197 (5.1%) | 47 (1.2%) |
| $55,000 to $64,999 | 341 (8.8%) | 234 (6.0%) |
| $65,000 to $74,999 | 149 (3.8%) | 160 (4.1%) |
| $75,000 to $99,999 | 435 (11.2%) | 99 (2.5%) |
| $100,000+ | 308 (7.9%) | 80 (2.0%) |
| Total | 3,888 (100.0%) | 3,914 (100.0%) |
Earnings by Sex by Educational Attainment in Letcher County
Average earnings in Letcher County are $40,358 for men and $28,826 for women, a difference of 28.6%. Men with an educational attainment of graduate degree enjoy the highest average annual earnings of $60,313, while those with less than high school education earn the least with $37,893. Women with an educational attainment of graduate degree earn the most with the average annual earnings of $58,258, while those with less than high school education have the smallest earnings of $15,000.

| Educational Attainment | Male Income | Female Income |
| Less than High School | $37,893 | $15,000 |
| High School Diploma | $41,836 | $20,000 |
| College or Associate's Degree | $38,102 | $31,404 |
| Bachelor's Degree | $56,429 | $35,903 |
| Graduate Degree | $60,313 | $58,258 |
| Total | $40,358 | $28,826 |
Family Income in Letcher County
Family Income Brackets in Letcher County
According to the Letcher County family income data, there are 1,126 families falling into the $50,000 to $74,999 income range, which is the most common income bracket and makes up 20.5% of all families. Conversely, the $200,000+ income bracket is the least frequent group with only 121 families (2.2%) belonging to this category.
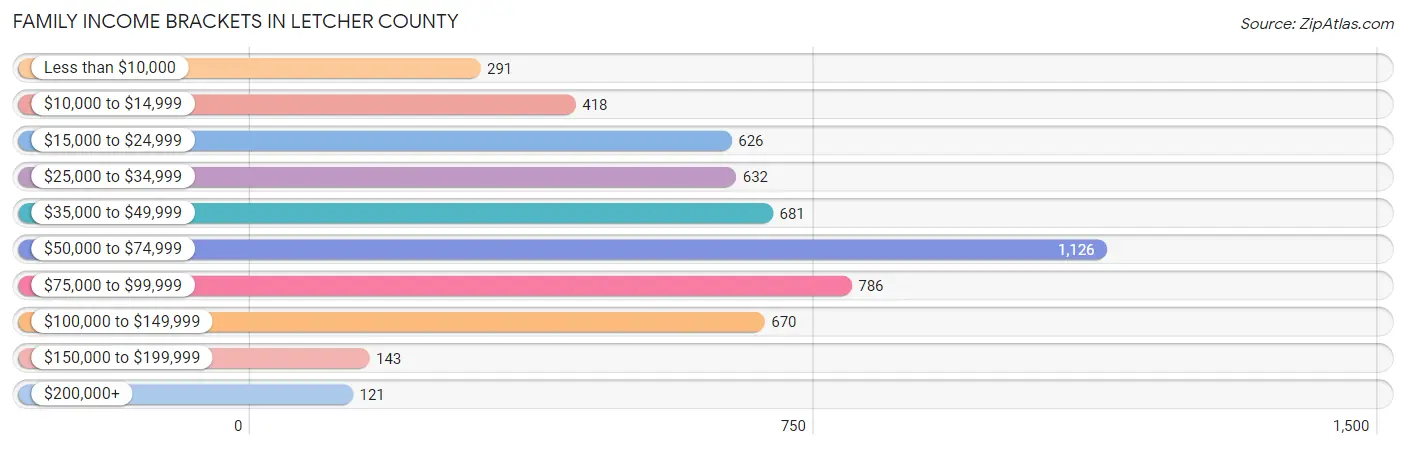
| Income Bracket | # Families | % Families |
| Less than $10,000 | 291 | 5.3% |
| $10,000 to $14,999 | 418 | 7.6% |
| $15,000 to $24,999 | 626 | 11.4% |
| $25,000 to $34,999 | 632 | 11.5% |
| $35,000 to $49,999 | 681 | 12.4% |
| $50,000 to $74,999 | 1,126 | 20.5% |
| $75,000 to $99,999 | 786 | 14.3% |
| $100,000 to $149,999 | 670 | 12.2% |
| $150,000 to $199,999 | 143 | 2.6% |
| $200,000+ | 121 | 2.2% |
Family Income by Famaliy Size in Letcher County
4-person families (966 | 17.6%) account for the highest median family income in Letcher County with $57,917 per family, while 2-person families (2,575 | 46.9%) have the highest median income of $22,938 per family member.

| Income Bracket | # Families | Median Income |
| 2-Person Families | 2,575 (46.9%) | $45,875 |
| 3-Person Families | 1,269 (23.1%) | $57,486 |
| 4-Person Families | 966 (17.6%) | $57,917 |
| 5-Person Families | 575 (10.5%) | $53,208 |
| 6-Person Families | 91 (1.7%) | $0 |
| 7+ Person Families | 19 (0.4%) | $0 |
| Total | 5,495 (100.0%) | $52,578 |
Family Income by Number of Earners in Letcher County
The median family income in Letcher County is $52,578, with families comprising 3+ earners (180) having the highest median family income of $144,261, while families with no earners (1,907) have the lowest median family income of $27,937, accounting for 3.3% and 34.7% of families, respectively.

| Number of Earners | # Families | Median Income |
| No Earners | 1,907 (34.7%) | $27,937 |
| 1 Earner | 1,593 (29.0%) | $42,083 |
| 2 Earners | 1,815 (33.0%) | $79,451 |
| 3+ Earners | 180 (3.3%) | $144,261 |
| Total | 5,495 (100.0%) | $52,578 |
Household Income in Letcher County
Household Income Brackets in Letcher County
With 1,439 households falling in the category, the $50,000 to $74,999 income range is the most frequent in Letcher County, accounting for 17.1% of all households. In contrast, only 143 households (1.7%) fall into the $200,000+ income bracket, making it the least populous group.
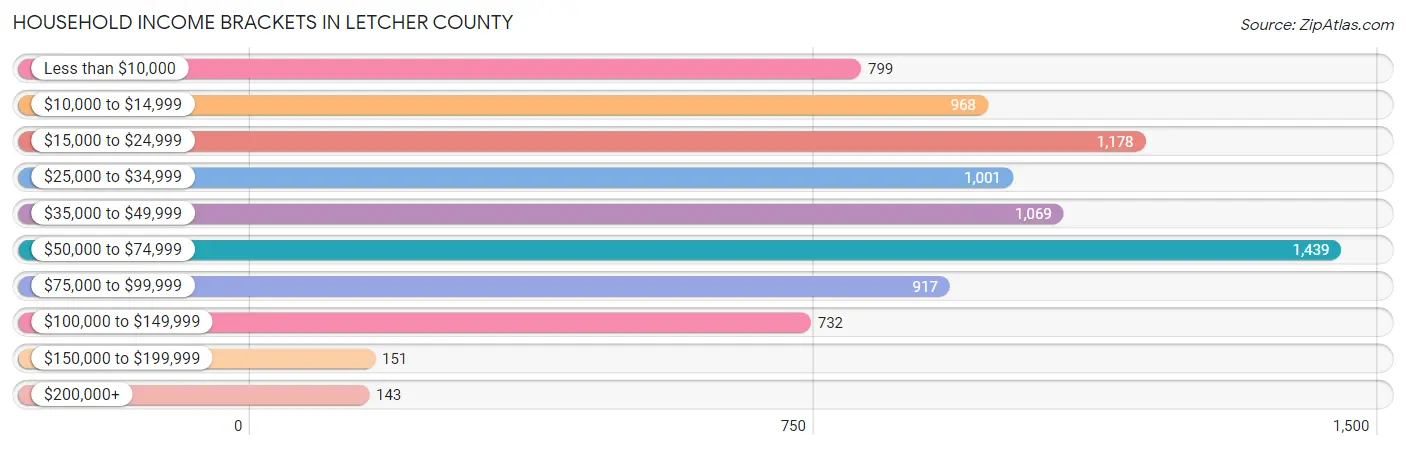
| Income Bracket | # Households | % Households |
| Less than $10,000 | 799 | 9.5% |
| $10,000 to $14,999 | 968 | 11.5% |
| $15,000 to $24,999 | 1,178 | 14.0% |
| $25,000 to $34,999 | 1,001 | 11.9% |
| $35,000 to $49,999 | 1,069 | 12.7% |
| $50,000 to $74,999 | 1,439 | 17.1% |
| $75,000 to $99,999 | 917 | 10.9% |
| $100,000 to $149,999 | 732 | 8.7% |
| $150,000 to $199,999 | 151 | 1.8% |
| $200,000+ | 143 | 1.7% |
Household Income by Householder Age in Letcher County
The median household income in Letcher County is $38,466, with the highest median household income of $40,254 found in the 45 to 64 years age bracket for the primary householder. A total of 3,222 households (38.3%) fall into this category. Meanwhile, the 15 to 24 years age bracket for the primary householder has the lowest median household income of $0, with 155 households (1.8%) in this group.

| Income Bracket | # Households | Median Income |
| 15 to 24 Years | 155 (1.8%) | $0 |
| 25 to 44 Years | 2,270 (27.0%) | $38,862 |
| 45 to 64 Years | 3,222 (38.3%) | $40,254 |
| 65+ Years | 2,768 (32.9%) | $34,517 |
| Total | 8,415 (100.0%) | $38,466 |
Poverty in Letcher County
Income Below Poverty by Sex and Age in Letcher County
With 27.4% poverty level for males and 30.6% for females among the residents of Letcher County, 5 year old males and 18 to 24 year old females are the most vulnerable to poverty, with 10 males (71.4%) and 409 females (57.0%) in their respective age groups living below the poverty level.

| Age Bracket | Male | Female |
| Under 5 Years | 182 (36.2%) | 251 (50.6%) |
| 5 Years | 10 (71.4%) | 48 (55.8%) |
| 6 to 11 Years | 294 (35.6%) | 187 (29.4%) |
| 12 to 14 Years | 136 (33.6%) | 165 (29.9%) |
| 15 Years | 66 (45.2%) | 55 (40.7%) |
| 16 and 17 Years | 28 (10.0%) | 81 (34.2%) |
| 18 to 24 Years | 214 (27.8%) | 409 (57.0%) |
| 25 to 34 Years | 404 (34.4%) | 262 (23.0%) |
| 35 to 44 Years | 328 (24.8%) | 408 (31.6%) |
| 45 to 54 Years | 358 (25.2%) | 342 (24.6%) |
| 55 to 64 Years | 500 (32.7%) | 546 (32.5%) |
| 65 to 74 Years | 159 (12.5%) | 292 (20.6%) |
| 75 Years and over | 148 (22.6%) | 209 (24.1%) |
| Total | 2,827 (27.4%) | 3,255 (30.6%) |
Income Above Poverty by Sex and Age in Letcher County
According to the poverty statistics in Letcher County, males aged 16 and 17 years and females aged 65 to 74 years are the age groups that are most secure financially, with 90.0% of males and 79.4% of females in these age groups living above the poverty line.
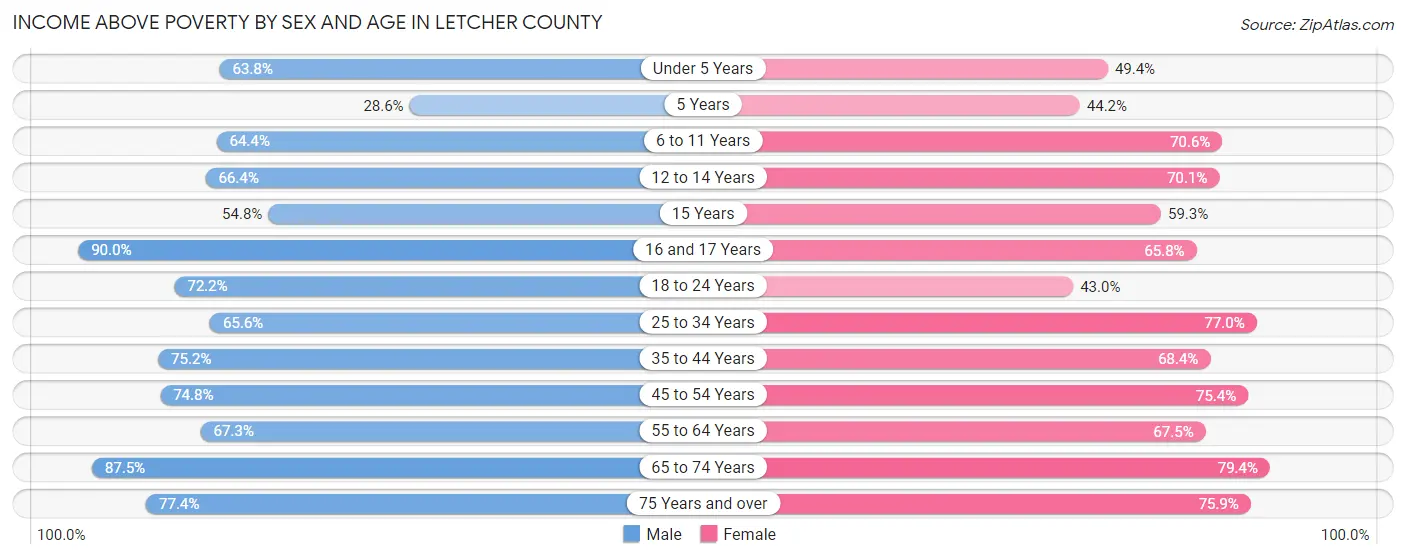
| Age Bracket | Male | Female |
| Under 5 Years | 321 (63.8%) | 245 (49.4%) |
| 5 Years | 4 (28.6%) | 38 (44.2%) |
| 6 to 11 Years | 531 (64.4%) | 449 (70.6%) |
| 12 to 14 Years | 269 (66.4%) | 386 (70.1%) |
| 15 Years | 80 (54.8%) | 80 (59.3%) |
| 16 and 17 Years | 253 (90.0%) | 156 (65.8%) |
| 18 to 24 Years | 556 (72.2%) | 308 (43.0%) |
| 25 to 34 Years | 770 (65.6%) | 876 (77.0%) |
| 35 to 44 Years | 995 (75.2%) | 882 (68.4%) |
| 45 to 54 Years | 1,064 (74.8%) | 1,048 (75.4%) |
| 55 to 64 Years | 1,031 (67.3%) | 1,134 (67.5%) |
| 65 to 74 Years | 1,113 (87.5%) | 1,128 (79.4%) |
| 75 Years and over | 508 (77.4%) | 658 (75.9%) |
| Total | 7,495 (72.6%) | 7,388 (69.4%) |
Income Below Poverty Among Married-Couple Families in Letcher County
The poverty statistics for married-couple families in Letcher County show that 15.4% or 632 of the total 4,109 families live below the poverty line. Families with 5 or more children have the highest poverty rate of 89.5%, comprising of 17 families. On the other hand, families with 3 or 4 children have the lowest poverty rate of 11.6%, which includes 55 families.
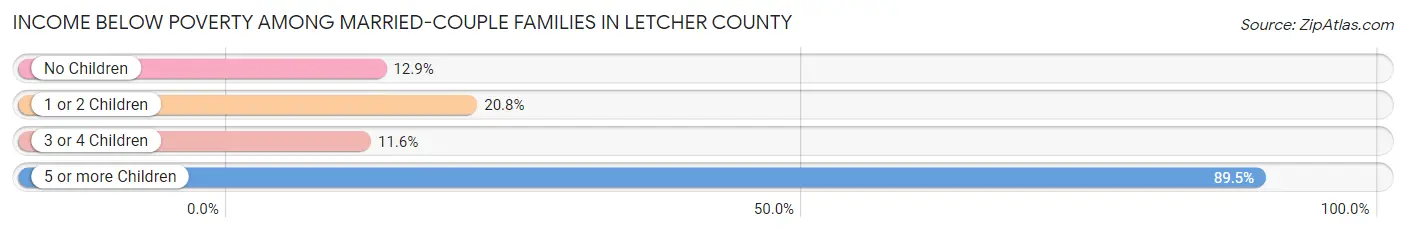
| Children | Above Poverty | Below Poverty |
| No Children | 2,124 (87.1%) | 315 (12.9%) |
| 1 or 2 Children | 931 (79.2%) | 245 (20.8%) |
| 3 or 4 Children | 420 (88.4%) | 55 (11.6%) |
| 5 or more Children | 2 (10.5%) | 17 (89.5%) |
| Total | 3,477 (84.6%) | 632 (15.4%) |
Income Below Poverty Among Single-Parent Households in Letcher County
According to the poverty data in Letcher County, 32.3% or 179 single-father households and 51.8% or 431 single-mother households are living below the poverty line. Among single-father households, those with 3 or 4 children have the highest poverty rate, with 20 households (87.0%) experiencing poverty. Likewise, among single-mother households, those with 3 or 4 children have the highest poverty rate, with 78 households (87.6%) falling below the poverty line.

| Children | Single Father | Single Mother |
| No Children | 79 (34.2%) | 43 (14.9%) |
| 1 or 2 Children | 80 (26.7%) | 310 (68.3%) |
| 3 or 4 Children | 20 (87.0%) | 78 (87.6%) |
| 5 or more Children | 0 (0.0%) | 0 (0.0%) |
| Total | 179 (32.3%) | 431 (51.8%) |
Income Below Poverty Among Married-Couple vs Single-Parent Households in Letcher County
The poverty data for Letcher County shows that 632 of the married-couple family households (15.4%) and 610 of the single-parent households (44.0%) are living below the poverty level. Within the married-couple family households, those with 5 or more children have the highest poverty rate, with 17 households (89.5%) falling below the poverty line. Among the single-parent households, those with 3 or 4 children have the highest poverty rate, with 98 household (87.5%) living below poverty.

| Children | Married-Couple Families | Single-Parent Households |
| No Children | 315 (12.9%) | 122 (23.5%) |
| 1 or 2 Children | 245 (20.8%) | 390 (51.7%) |
| 3 or 4 Children | 55 (11.6%) | 98 (87.5%) |
| 5 or more Children | 17 (89.5%) | 0 (0.0%) |
| Total | 632 (15.4%) | 610 (44.0%) |
Employment Characteristics in Letcher County
Employment by Class of Employer in Letcher County
Among the 6,866 employed individuals in Letcher County, private company employees (3,775 | 55.0%), state government employees (803 | 11.7%), and local government employees (757 | 11.0%) make up the most common classes of employment.

| Employer Class | # Employees | % Employees |
| Private Company Employees | 3,775 | 55.0% |
| Self-Employed (Incorporated) | 135 | 2.0% |
| Self-Employed (Not Incorporated) | 456 | 6.6% |
| Not-for-profit Organizations | 629 | 9.2% |
| Local Government Employees | 757 | 11.0% |
| State Government Employees | 803 | 11.7% |
| Federal Government Employees | 185 | 2.7% |
| Unpaid Family Workers | 126 | 1.8% |
| Total | 6,866 | 100.0% |
Employment Status by Age in Letcher County
According to the labor force statistics for Letcher County, out of the total population over 16 years of age (17,392), 43.6% or 7,583 individuals are in the labor force, with 7.7% or 584 of them unemployed. The age group with the highest labor force participation rate is 25 to 29 years, with 76.4% or 853 individuals in the labor force. Within the labor force, the 16 to 19 years age range has the highest percentage of unemployed individuals, with 21.8% or 49 of them being unemployed.
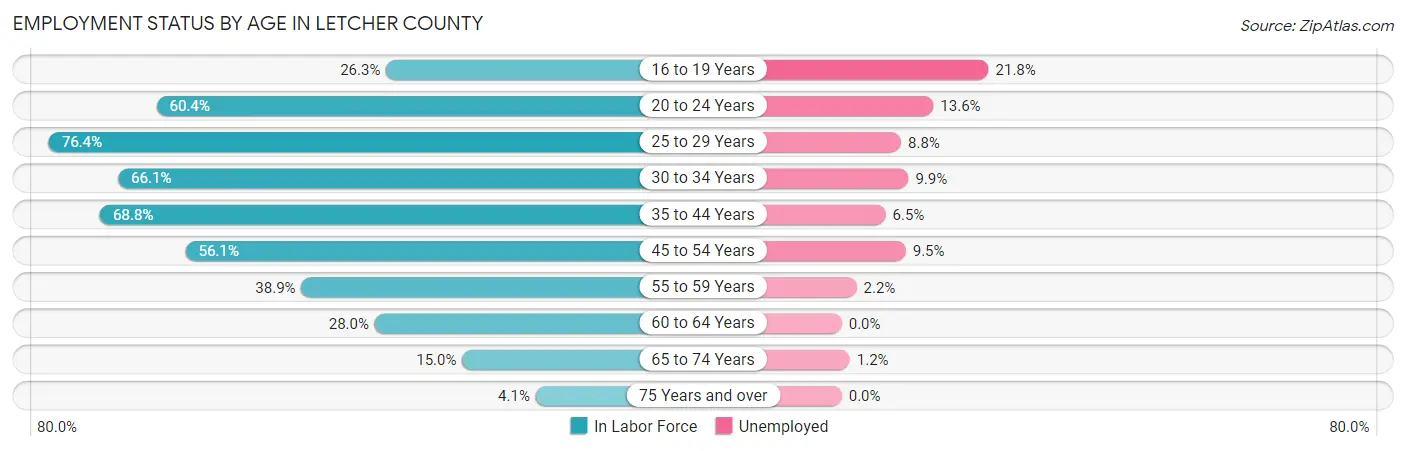
| Age Bracket | In Labor Force | Unemployed |
| 16 to 19 Years | 225 (26.3%) | 49 (21.8%) |
| 20 to 24 Years | 699 (60.4%) | 95 (13.6%) |
| 25 to 29 Years | 853 (76.4%) | 75 (8.8%) |
| 30 to 34 Years | 806 (66.1%) | 80 (9.9%) |
| 35 to 44 Years | 1,828 (68.8%) | 119 (6.5%) |
| 45 to 54 Years | 1,586 (56.1%) | 151 (9.5%) |
| 55 to 59 Years | 696 (38.9%) | 15 (2.2%) |
| 60 to 64 Years | 405 (28.0%) | 0 (0.0%) |
| 65 to 74 Years | 411 (15.0%) | 5 (1.2%) |
| 75 Years and over | 65 (4.1%) | 0 (0.0%) |
| Total | 7,583 (43.6%) | 584 (7.7%) |
Employment Status by Educational Attainment in Letcher County
According to labor force statistics for Letcher County, 55.9% of individuals (6,179) out of the total population between 25 and 64 years of age (11,054) are in the labor force, with 7.1% or 439 of them being unemployed. The group with the highest labor force participation rate are those with the educational attainment of bachelor's degree or higher, with 80.3% or 1,176 individuals in the labor force. Within the labor force, individuals with less than high school education have the highest percentage of unemployment, with 31.5% or 114 of them being unemployed.
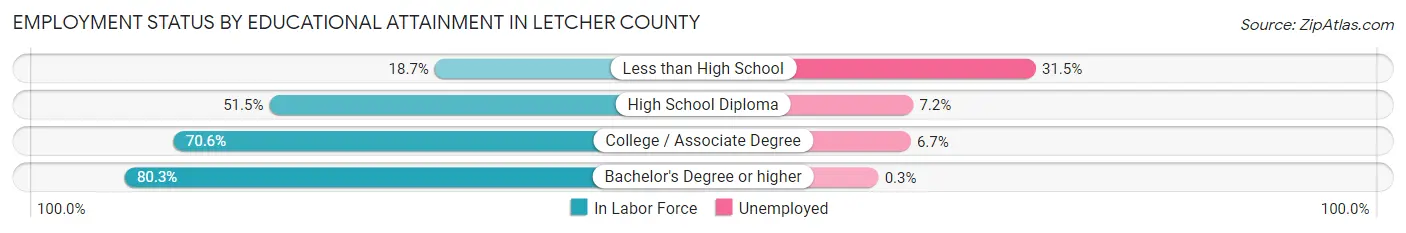
| Educational Attainment | In Labor Force | Unemployed |
| Less than High School | 363 (18.7%) | 611 (31.5%) |
| High School Diploma | 2,054 (51.5%) | 287 (7.2%) |
| College / Associate Degree | 2,584 (70.6%) | 245 (6.7%) |
| Bachelor's Degree or higher | 1,176 (80.3%) | 4 (0.3%) |
| Total | 6,179 (55.9%) | 785 (7.1%) |
Employment Occupations by Sex in Letcher County
Management, Business, Science and Arts Occupations
The most common Management, Business, Science and Arts occupations in Letcher County are Health Diagnosing & Treating (871 | 12.5%), Community & Social Service (807 | 11.6%), Health Technologists (590 | 8.4%), Education Instruction & Library (498 | 7.1%), and Management (484 | 6.9%).

Management, Business, Science and Arts Occupations by Sex
Within the Management, Business, Science and Arts occupations in Letcher County, the most male-oriented occupations are Architecture & Engineering (100.0%), Life, Physical & Social Science (100.0%), and Computers, Engineering & Science (98.3%), while the most female-oriented occupations are Arts, Media & Entertainment (100.0%), Education Instruction & Library (87.0%), and Health Diagnosing & Treating (79.0%).

| Occupation | Male | Female |
| Management | 272 (56.2%) | 212 (43.8%) |
| Business & Financial | 30 (27.5%) | 79 (72.5%) |
| Computers, Engineering & Science | 116 (98.3%) | 2 (1.7%) |
| Computers & Mathematics | 3 (60.0%) | 2 (40.0%) |
| Architecture & Engineering | 20 (100.0%) | 0 (0.0%) |
| Life, Physical & Social Science | 93 (100.0%) | 0 (0.0%) |
| Community & Social Service | 181 (22.4%) | 626 (77.6%) |
| Education, Arts & Media | 49 (31.6%) | 106 (68.4%) |
| Legal Services & Support | 67 (91.8%) | 6 (8.2%) |
| Education Instruction & Library | 65 (13.1%) | 433 (87.0%) |
| Arts, Media & Entertainment | 0 (0.0%) | 81 (100.0%) |
| Health Diagnosing & Treating | 183 (21.0%) | 688 (79.0%) |
| Health Technologists | 155 (26.3%) | 435 (73.7%) |
| Total (Category) | 782 (32.7%) | 1,607 (67.3%) |
| Total (Overall) | 3,463 (49.5%) | 3,526 (50.4%) |
Services Occupations
The most common Services occupations in Letcher County are Healthcare Support (432 | 6.2%), Cleaning & Maintenance (367 | 5.2%), Security & Protection (299 | 4.3%), Law Enforcement (180 | 2.6%), and Personal Care & Service (138 | 2.0%).

Services Occupations by Sex
Within the Services occupations in Letcher County, the most male-oriented occupations are Law Enforcement (100.0%), Security & Protection (89.3%), and Cleaning & Maintenance (82.0%), while the most female-oriented occupations are Healthcare Support (93.3%), Food Preparation & Serving (70.5%), and Personal Care & Service (57.3%).

| Occupation | Male | Female |
| Healthcare Support | 29 (6.7%) | 403 (93.3%) |
| Security & Protection | 267 (89.3%) | 32 (10.7%) |
| Firefighting & Prevention | 87 (73.1%) | 32 (26.9%) |
| Law Enforcement | 180 (100.0%) | 0 (0.0%) |
| Food Preparation & Serving | 28 (29.5%) | 67 (70.5%) |
| Cleaning & Maintenance | 301 (82.0%) | 66 (18.0%) |
| Personal Care & Service | 59 (42.7%) | 79 (57.3%) |
| Total (Category) | 684 (51.4%) | 647 (48.6%) |
| Total (Overall) | 3,463 (49.5%) | 3,526 (50.4%) |
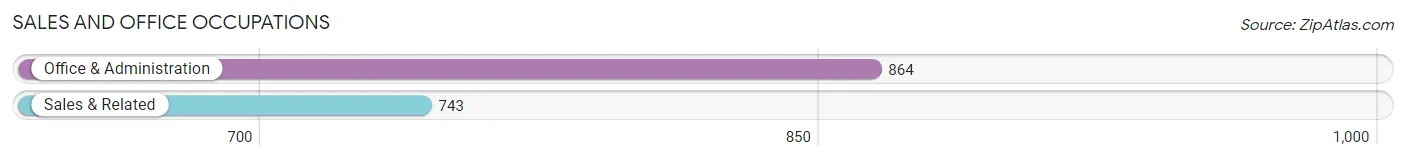
Sales and Office Occupations
The most common Sales and Office occupations in Letcher County are Office & Administration (864 | 12.4%), and Sales & Related (743 | 10.6%).
Sales and Office Occupations by Sex
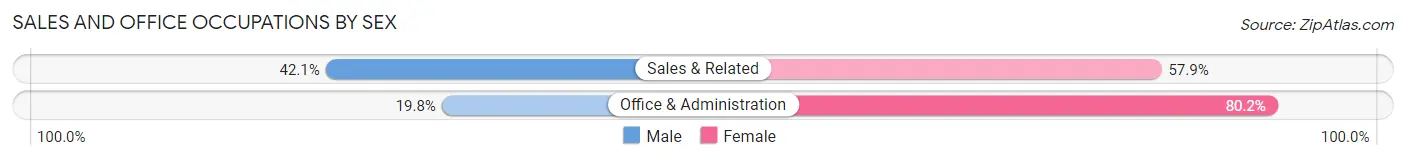
| Occupation | Male | Female |
| Sales & Related | 313 (42.1%) | 430 (57.9%) |
| Office & Administration | 171 (19.8%) | 693 (80.2%) |
| Total (Category) | 484 (30.1%) | 1,123 (69.9%) |
| Total (Overall) | 3,463 (49.5%) | 3,526 (50.4%) |
Natural Resources, Construction and Maintenance Occupations
The most common Natural Resources, Construction and Maintenance occupations in Letcher County are Construction & Extraction (530 | 7.6%), Installation, Maintenance & Repair (179 | 2.6%), and Farming, Fishing & Forestry (8 | 0.1%).

Natural Resources, Construction and Maintenance Occupations by Sex

| Occupation | Male | Female |
| Farming, Fishing & Forestry | 8 (100.0%) | 0 (0.0%) |
| Construction & Extraction | 524 (98.9%) | 6 (1.1%) |
| Installation, Maintenance & Repair | 179 (100.0%) | 0 (0.0%) |
| Total (Category) | 711 (99.2%) | 6 (0.8%) |
| Total (Overall) | 3,463 (49.5%) | 3,526 (50.4%) |
Production, Transportation and Moving Occupations
The most common Production, Transportation and Moving occupations in Letcher County are Transportation (462 | 6.6%), Production (307 | 4.4%), and Material Moving (176 | 2.5%).
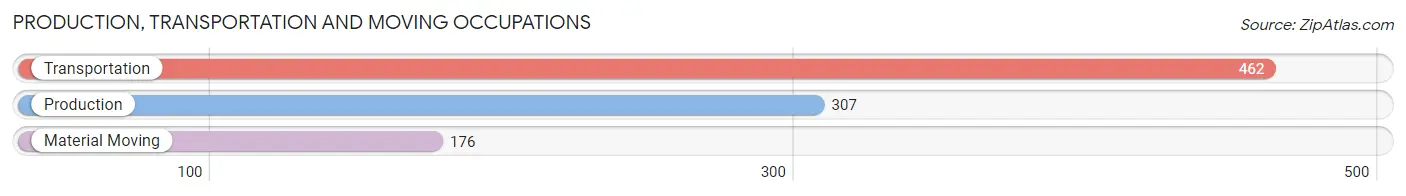
Production, Transportation and Moving Occupations by Sex

| Occupation | Male | Female |
| Production | 286 (93.2%) | 21 (6.8%) |
| Transportation | 374 (80.9%) | 88 (19.1%) |
| Material Moving | 142 (80.7%) | 34 (19.3%) |
| Total (Category) | 802 (84.9%) | 143 (15.1%) |
| Total (Overall) | 3,463 (49.5%) | 3,526 (50.4%) |
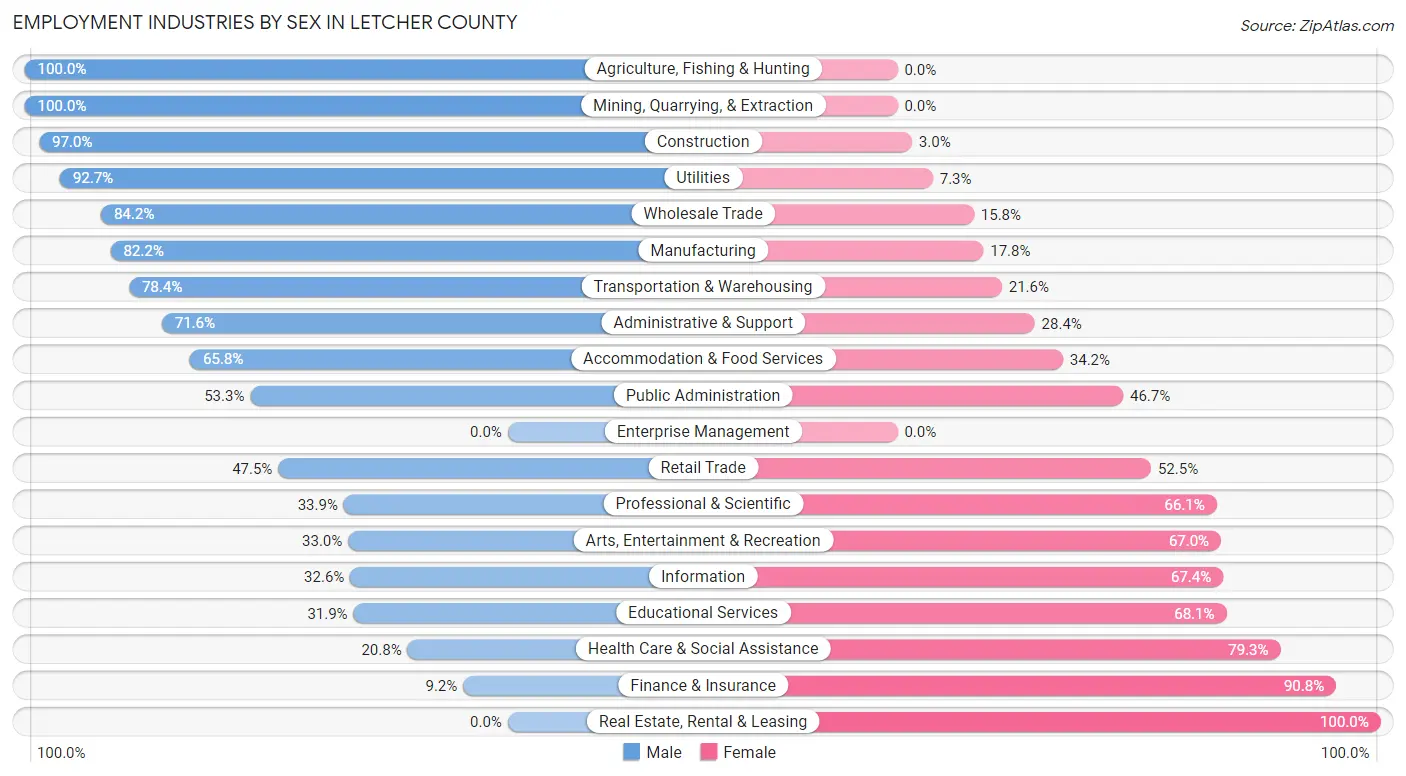
Employment Industries by Sex in Letcher County
Employment Industries in Letcher County
The major employment industries in Letcher County include Health Care & Social Assistance (1,557 | 22.3%), Educational Services (1,046 | 15.0%), Retail Trade (985 | 14.1%), Public Administration (561 | 8.0%), and Construction (400 | 5.7%).

Employment Industries by Sex in Letcher County
The Letcher County industries that see more men than women are Agriculture, Fishing & Hunting (100.0%), Mining, Quarrying, & Extraction (100.0%), and Construction (97.0%), whereas the industries that tend to have a higher number of women are Real Estate, Rental & Leasing (100.0%), Finance & Insurance (90.8%), and Health Care & Social Assistance (79.2%).
| Industry | Male | Female |
| Agriculture, Fishing & Hunting | 11 (100.0%) | 0 (0.0%) |
| Mining, Quarrying, & Extraction | 319 (100.0%) | 0 (0.0%) |
| Construction | 388 (97.0%) | 12 (3.0%) |
| Manufacturing | 148 (82.2%) | 32 (17.8%) |
| Wholesale Trade | 133 (84.2%) | 25 (15.8%) |
| Retail Trade | 468 (47.5%) | 517 (52.5%) |
| Transportation & Warehousing | 301 (78.4%) | 83 (21.6%) |
| Utilities | 76 (92.7%) | 6 (7.3%) |
| Information | 30 (32.6%) | 62 (67.4%) |
| Finance & Insurance | 12 (9.2%) | 118 (90.8%) |
| Real Estate, Rental & Leasing | 0 (0.0%) | 35 (100.0%) |
| Professional & Scientific | 56 (33.9%) | 109 (66.1%) |
| Enterprise Management | 0 (0.0%) | 0 (0.0%) |
| Administrative & Support | 189 (71.6%) | 75 (28.4%) |
| Educational Services | 334 (31.9%) | 712 (68.1%) |
| Health Care & Social Assistance | 323 (20.7%) | 1,234 (79.2%) |
| Arts, Entertainment & Recreation | 38 (33.0%) | 77 (67.0%) |
| Accommodation & Food Services | 169 (65.8%) | 88 (34.2%) |
| Public Administration | 299 (53.3%) | 262 (46.7%) |
| Total | 3,463 (49.5%) | 3,526 (50.4%) |
Education in Letcher County
School Enrollment in Letcher County
The most common levels of schooling among the 4,321 students in Letcher County are middle school (1,312 | 30.4%), high school (1,012 | 23.4%), and elementary school (885 | 20.5%).
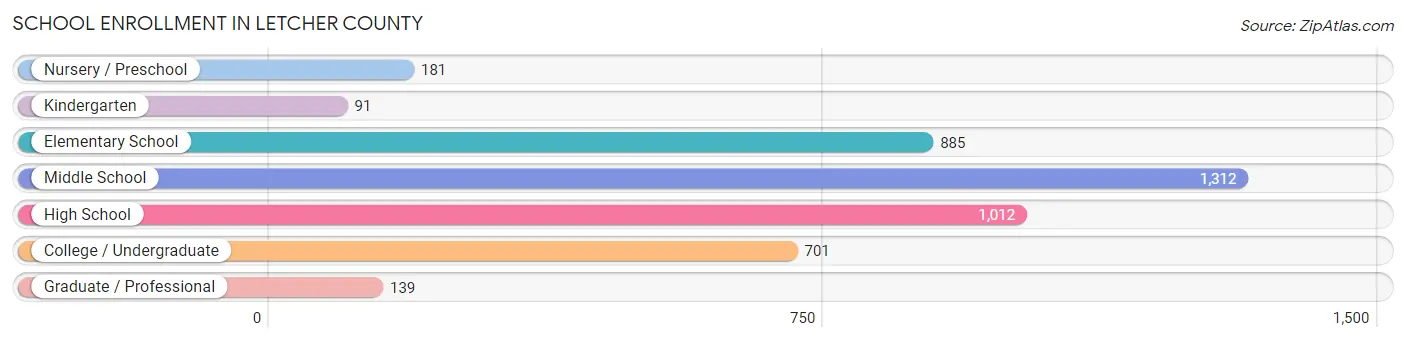
| School Level | # Students | % Students |
| Nursery / Preschool | 181 | 4.2% |
| Kindergarten | 91 | 2.1% |
| Elementary School | 885 | 20.5% |
| Middle School | 1,312 | 30.4% |
| High School | 1,012 | 23.4% |
| College / Undergraduate | 701 | 16.2% |
| Graduate / Professional | 139 | 3.2% |
| Total | 4,321 | 100.0% |
School Enrollment by Age by Funding Source in Letcher County
Out of a total of 4,321 students who are enrolled in schools in Letcher County, 488 (11.3%) attend a private institution, while the remaining 3,833 (88.7%) are enrolled in public schools. The age group of 25 to 34 year olds has the highest likelihood of being enrolled in private schools, with 149 (63.7% in the age bracket) enrolled. Conversely, the age group of 3 to 4 year olds has the lowest likelihood of being enrolled in a private school, with 168 (100.0% in the age bracket) attending a public institution.

| Age Bracket | Public School | Private School |
| 3 to 4 Year Olds | 168 (100.0%) | 0 (0.0%) |
| 5 to 9 Year Old | 776 (97.4%) | 21 (2.6%) |
| 10 to 14 Year Olds | 1,443 (90.6%) | 150 (9.4%) |
| 15 to 17 Year Olds | 700 (94.7%) | 39 (5.3%) |
| 18 to 19 Year Olds | 201 (100.0%) | 0 (0.0%) |
| 20 to 24 Year Olds | 297 (71.6%) | 118 (28.4%) |
| 25 to 34 Year Olds | 85 (36.3%) | 149 (63.7%) |
| 35 Years and over | 164 (94.3%) | 10 (5.8%) |
| Total | 3,833 (88.7%) | 488 (11.3%) |
Educational Attainment by Field of Study in Letcher County
Education (535 | 25.0%), science & technology (323 | 15.1%), business (302 | 14.1%), psychology (169 | 7.9%), and liberal arts & history (145 | 6.8%) are the most common fields of study among 2,142 individuals in Letcher County who have obtained a bachelor's degree or higher.

| Field of Study | # Graduates | % Graduates |
| Computers & Mathematics | 80 | 3.7% |
| Bio, Nature & Agricultural | 139 | 6.5% |
| Physical & Health Sciences | 74 | 3.5% |
| Psychology | 169 | 7.9% |
| Social Sciences | 143 | 6.7% |
| Engineering | 29 | 1.3% |
| Multidisciplinary Studies | 0 | 0.0% |
| Science & Technology | 323 | 15.1% |
| Business | 302 | 14.1% |
| Education | 535 | 25.0% |
| Literature & Languages | 33 | 1.5% |
| Liberal Arts & History | 145 | 6.8% |
| Visual & Performing Arts | 32 | 1.5% |
| Communications | 28 | 1.3% |
| Arts & Humanities | 110 | 5.1% |
| Total | 2,142 | 100.0% |
Transportation & Commute in Letcher County
Vehicle Availability by Sex in Letcher County
The most prevalent vehicle ownership categories in Letcher County are males with 2 vehicles (1,338, accounting for 39.2%) and females with 2 vehicles (1,166, making up 38.9%).

| Vehicles Available | Male | Female |
| No Vehicle | 132 (3.9%) | 26 (0.8%) |
| 1 Vehicle | 583 (17.1%) | 1,053 (30.6%) |
| 2 Vehicles | 1,338 (39.2%) | 1,166 (33.9%) |
| 3 Vehicles | 846 (24.8%) | 703 (20.5%) |
| 4 Vehicles | 366 (10.7%) | 375 (10.9%) |
| 5 or more Vehicles | 145 (4.3%) | 113 (3.3%) |
| Total | 3,410 (100.0%) | 3,436 (100.0%) |
Commute Time in Letcher County
The most frequently occuring commute durations in Letcher County are 15 to 19 minutes (835 commuters, 13.3%), 10 to 14 minutes (726 commuters, 11.6%), and 30 to 34 minutes (724 commuters, 11.6%).

| Commute Time | # Commuters | % Commuters |
| Less than 5 Minutes | 604 | 9.7% |
| 5 to 9 Minutes | 662 | 10.6% |
| 10 to 14 Minutes | 726 | 11.6% |
| 15 to 19 Minutes | 835 | 13.3% |
| 20 to 24 Minutes | 718 | 11.5% |
| 25 to 29 Minutes | 304 | 4.9% |
| 30 to 34 Minutes | 724 | 11.6% |
| 35 to 39 Minutes | 337 | 5.4% |
| 40 to 44 Minutes | 314 | 5.0% |
| 45 to 59 Minutes | 499 | 8.0% |
| 60 to 89 Minutes | 332 | 5.3% |
| 90 or more Minutes | 203 | 3.2% |
Commute Time by Sex in Letcher County
The most common commute times in Letcher County are 10 to 14 minutes (406 commuters, 12.9%) for males and 15 to 19 minutes (506 commuters, 16.2%) for females.

| Commute Time | Male | Female |
| Less than 5 Minutes | 336 (10.7%) | 268 (8.6%) |
| 5 to 9 Minutes | 343 (10.9%) | 319 (10.2%) |
| 10 to 14 Minutes | 406 (12.9%) | 320 (10.3%) |
| 15 to 19 Minutes | 329 (10.5%) | 506 (16.2%) |
| 20 to 24 Minutes | 319 (10.2%) | 399 (12.8%) |
| 25 to 29 Minutes | 74 (2.4%) | 230 (7.4%) |
| 30 to 34 Minutes | 358 (11.4%) | 366 (11.7%) |
| 35 to 39 Minutes | 171 (5.4%) | 166 (5.3%) |
| 40 to 44 Minutes | 127 (4.0%) | 187 (6.0%) |
| 45 to 59 Minutes | 340 (10.8%) | 159 (5.1%) |
| 60 to 89 Minutes | 148 (4.7%) | 184 (5.9%) |
| 90 or more Minutes | 191 (6.1%) | 12 (0.4%) |
Time of Departure to Work by Sex in Letcher County
The most frequent times of departure to work in Letcher County are 7:30 AM to 7:59 AM (553, 17.6%) for males and 7:30 AM to 7:59 AM (560, 18.0%) for females.

| Time of Departure | Male | Female |
| 12:00 AM to 4:59 AM | 211 (6.7%) | 0 (0.0%) |
| 5:00 AM to 5:29 AM | 186 (5.9%) | 84 (2.7%) |
| 5:30 AM to 5:59 AM | 223 (7.1%) | 108 (3.5%) |
| 6:00 AM to 6:29 AM | 279 (8.9%) | 114 (3.7%) |
| 6:30 AM to 6:59 AM | 312 (9.9%) | 395 (12.7%) |
| 7:00 AM to 7:29 AM | 202 (6.4%) | 429 (13.8%) |
| 7:30 AM to 7:59 AM | 553 (17.6%) | 560 (18.0%) |
| 8:00 AM to 8:29 AM | 119 (3.8%) | 400 (12.8%) |
| 8:30 AM to 8:59 AM | 203 (6.5%) | 155 (5.0%) |
| 9:00 AM to 9:59 AM | 120 (3.8%) | 115 (3.7%) |
| 10:00 AM to 10:59 AM | 13 (0.4%) | 82 (2.6%) |
| 11:00 AM to 11:59 AM | 0 (0.0%) | 69 (2.2%) |
| 12:00 PM to 3:59 PM | 318 (10.1%) | 345 (11.1%) |
| 4:00 PM to 11:59 PM | 403 (12.8%) | 260 (8.3%) |
| Total | 3,142 (100.0%) | 3,116 (100.0%) |
Housing Occupancy in Letcher County
Occupancy by Ownership in Letcher County
Of the total 8,415 dwellings in Letcher County, owner-occupied units account for 6,231 (74.1%), while renter-occupied units make up 2,184 (26.0%).
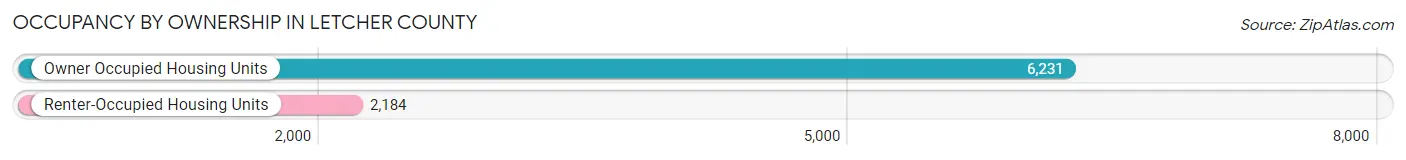
| Occupancy | # Housing Units | % Housing Units |
| Owner Occupied Housing Units | 6,231 | 74.1% |
| Renter-Occupied Housing Units | 2,184 | 26.0% |
| Total Occupied Housing Units | 8,415 | 100.0% |
Occupancy by Household Size in Letcher County

| Household Size | # Housing Units | % Housing Units |
| 1-Person Household | 2,519 | 29.9% |
| 2-Person Household | 2,689 | 32.0% |
| 3-Person Household | 1,407 | 16.7% |
| 4+ Person Household | 1,800 | 21.4% |
| Total Housing Units | 8,415 | 100.0% |
Occupancy by Ownership by Household Size in Letcher County

| Household Size | Owner-occupied | Renter-occupied |
| 1-Person Household | 1,681 (66.7%) | 838 (33.3%) |
| 2-Person Household | 2,188 (81.4%) | 501 (18.6%) |
| 3-Person Household | 1,182 (84.0%) | 225 (16.0%) |
| 4+ Person Household | 1,180 (65.6%) | 620 (34.4%) |
| Total Housing Units | 6,231 (74.1%) | 2,184 (26.0%) |
Occupancy by Educational Attainment in Letcher County
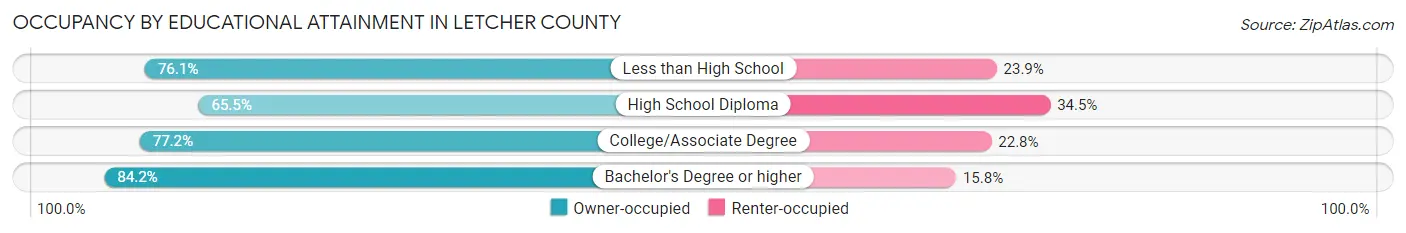
| Household Size | Owner-occupied | Renter-occupied |
| Less than High School | 1,291 (76.1%) | 405 (23.9%) |
| High School Diploma | 1,838 (65.5%) | 968 (34.5%) |
| College/Associate Degree | 2,108 (77.2%) | 624 (22.8%) |
| Bachelor's Degree or higher | 994 (84.2%) | 187 (15.8%) |
Occupancy by Age of Householder in Letcher County

| Age Bracket | # Households | % Households |
| Under 35 Years | 1,145 | 13.6% |
| 35 to 44 Years | 1,280 | 15.2% |
| 45 to 54 Years | 1,261 | 15.0% |
| 55 to 64 Years | 1,961 | 23.3% |
| 65 to 74 Years | 1,833 | 21.8% |
| 75 to 84 Years | 711 | 8.5% |
| 85 Years and Over | 224 | 2.7% |
| Total | 8,415 | 100.0% |
Housing Finances in Letcher County
Median Income by Occupancy in Letcher County

| Occupancy Type | # Households | Median Income |
| Owner-Occupied | 6,231 (74.1%) | $49,745 |
| Renter-Occupied | 2,184 (26.0%) | $22,500 |
| Average | 8,415 (100.0%) | $38,466 |
Occupancy by Householder Income Bracket in Letcher County
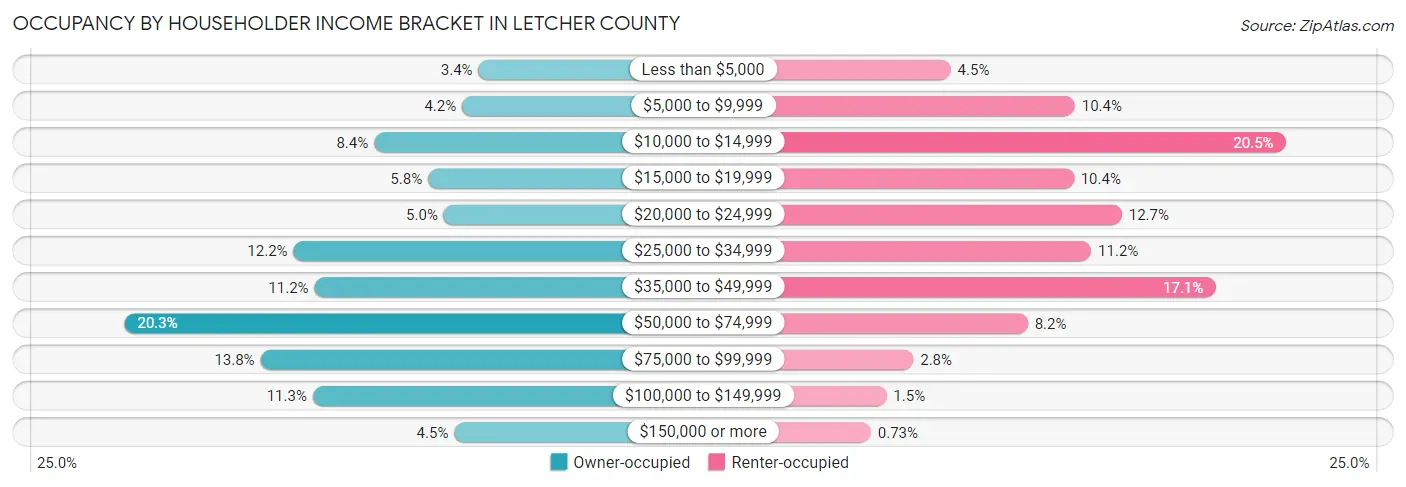
| Income Bracket | Owner-occupied | Renter-occupied |
| Less than $5,000 | 211 (3.4%) | 99 (4.5%) |
| $5,000 to $9,999 | 260 (4.2%) | 228 (10.4%) |
| $10,000 to $14,999 | 521 (8.4%) | 447 (20.5%) |
| $15,000 to $19,999 | 361 (5.8%) | 227 (10.4%) |
| $20,000 to $24,999 | 314 (5.0%) | 277 (12.7%) |
| $25,000 to $34,999 | 760 (12.2%) | 245 (11.2%) |
| $35,000 to $49,999 | 698 (11.2%) | 374 (17.1%) |
| $50,000 to $74,999 | 1,262 (20.3%) | 179 (8.2%) |
| $75,000 to $99,999 | 858 (13.8%) | 60 (2.8%) |
| $100,000 to $149,999 | 703 (11.3%) | 32 (1.5%) |
| $150,000 or more | 283 (4.5%) | 16 (0.7%) |
| Total | 6,231 (100.0%) | 2,184 (100.0%) |
Monthly Housing Cost Tiers in Letcher County

| Monthly Cost | Owner-occupied | Renter-occupied |
| Less than $300 | 1,842 (29.6%) | 61 (2.8%) |
| $300 to $499 | 1,801 (28.9%) | 297 (13.6%) |
| $500 to $799 | 992 (15.9%) | 657 (30.1%) |
| $800 to $999 | 502 (8.1%) | 251 (11.5%) |
| $1,000 to $1,499 | 696 (11.2%) | 143 (6.6%) |
| $1,500 to $1,999 | 255 (4.1%) | 3 (0.1%) |
| $2,000 to $2,499 | 34 (0.5%) | 0 (0.0%) |
| $2,500 to $2,999 | 71 (1.1%) | 0 (0.0%) |
| $3,000 or more | 38 (0.6%) | 0 (0.0%) |
| Total | 6,231 (100.0%) | 2,184 (100.0%) |
Physical Housing Characteristics in Letcher County
Housing Structures in Letcher County
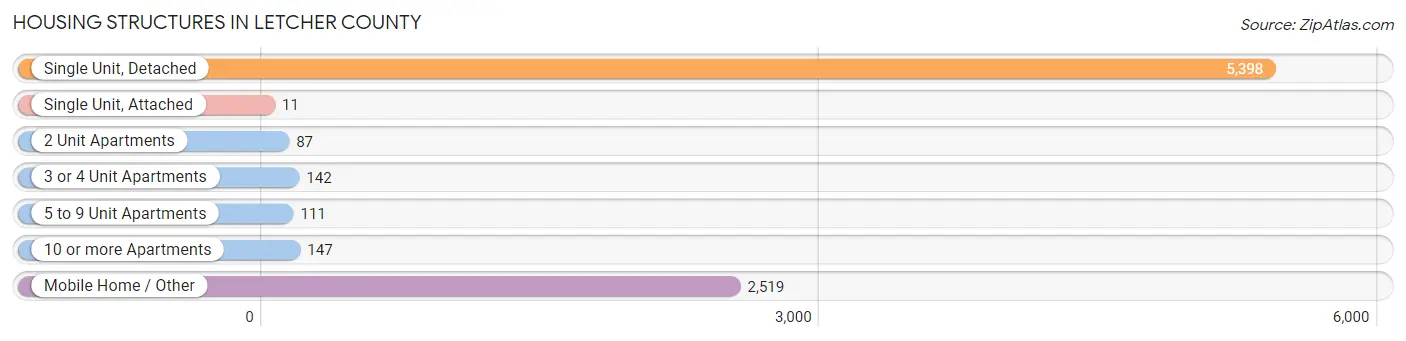
| Structure Type | # Housing Units | % Housing Units |
| Single Unit, Detached | 5,398 | 64.1% |
| Single Unit, Attached | 11 | 0.1% |
| 2 Unit Apartments | 87 | 1.0% |
| 3 or 4 Unit Apartments | 142 | 1.7% |
| 5 to 9 Unit Apartments | 111 | 1.3% |
| 10 or more Apartments | 147 | 1.8% |
| Mobile Home / Other | 2,519 | 29.9% |
| Total | 8,415 | 100.0% |
Housing Structures by Occupancy in Letcher County

| Structure Type | Owner-occupied | Renter-occupied |
| Single Unit, Detached | 4,208 (77.9%) | 1,190 (22.1%) |
| Single Unit, Attached | 8 (72.7%) | 3 (27.3%) |
| 2 Unit Apartments | 0 (0.0%) | 87 (100.0%) |
| 3 or 4 Unit Apartments | 13 (9.1%) | 129 (90.8%) |
| 5 to 9 Unit Apartments | 0 (0.0%) | 111 (100.0%) |
| 10 or more Apartments | 0 (0.0%) | 147 (100.0%) |
| Mobile Home / Other | 2,002 (79.5%) | 517 (20.5%) |
| Total | 6,231 (74.1%) | 2,184 (26.0%) |
Housing Structures by Number of Rooms in Letcher County

| Number of Rooms | Owner-occupied | Renter-occupied |
| 1 Room | 8 (0.1%) | 119 (5.4%) |
| 2 or 3 Rooms | 180 (2.9%) | 371 (17.0%) |
| 4 or 5 Rooms | 2,308 (37.0%) | 880 (40.3%) |
| 6 or 7 Rooms | 2,418 (38.8%) | 618 (28.3%) |
| 8 or more Rooms | 1,317 (21.1%) | 196 (9.0%) |
| Total | 6,231 (100.0%) | 2,184 (100.0%) |
Housing Structure by Heating Type in Letcher County

| Heating Type | Owner-occupied | Renter-occupied |
| Utility Gas | 237 (3.8%) | 96 (4.4%) |
| Bottled, Tank, or LP Gas | 721 (11.6%) | 307 (14.1%) |
| Electricity | 4,838 (77.6%) | 1,674 (76.6%) |
| Fuel Oil or Kerosene | 58 (0.9%) | 25 (1.1%) |
| Coal or Coke | 90 (1.4%) | 0 (0.0%) |
| All other Fuels | 259 (4.2%) | 78 (3.6%) |
| No Fuel Used | 28 (0.4%) | 4 (0.2%) |
| Total | 6,231 (100.0%) | 2,184 (100.0%) |
Household Vehicle Usage in Letcher County

| Vehicles per Household | Owner-occupied | Renter-occupied |
| No Vehicle | 310 (5.0%) | 286 (13.1%) |
| 1 Vehicle | 1,862 (29.9%) | 1,054 (48.3%) |
| 2 Vehicles | 2,234 (35.8%) | 623 (28.5%) |
| 3 or more Vehicles | 1,825 (29.3%) | 221 (10.1%) |
| Total | 6,231 (100.0%) | 2,184 (100.0%) |
Real Estate & Mortgages in Letcher County
Real Estate and Mortgage Overview in Letcher County
| Characteristic | Without Mortgage | With Mortgage |
| Housing Units | 4,401 | 1,830 |
| Median Property Value | $56,400 | $104,700 |
| Median Household Income | $40,271 | $109 |
| Monthly Housing Costs | $339 | $22 |
| Real Estate Taxes | $439 | $213 |
Property Value by Mortgage Status in Letcher County
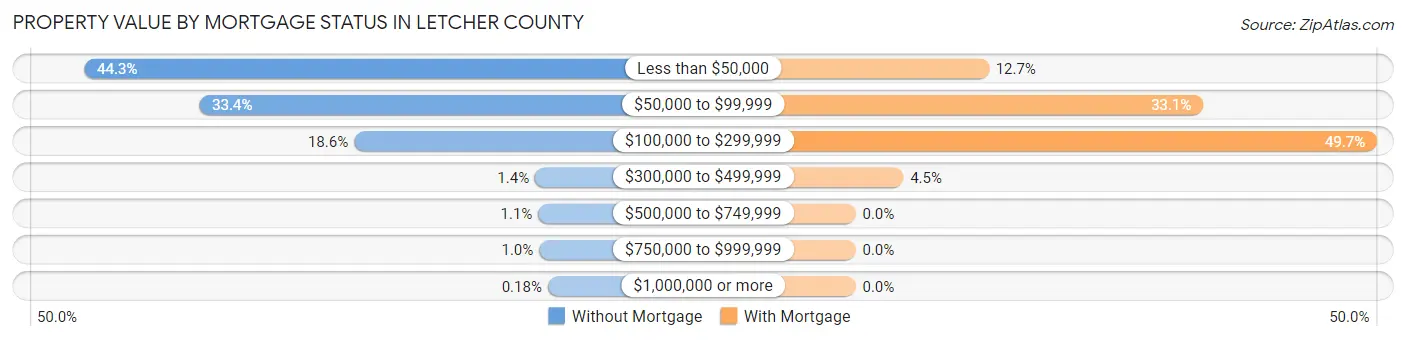
| Property Value | Without Mortgage | With Mortgage |
| Less than $50,000 | 1,951 (44.3%) | 232 (12.7%) |
| $50,000 to $99,999 | 1,469 (33.4%) | 606 (33.1%) |
| $100,000 to $299,999 | 820 (18.6%) | 909 (49.7%) |
| $300,000 to $499,999 | 61 (1.4%) | 83 (4.5%) |
| $500,000 to $749,999 | 48 (1.1%) | 0 (0.0%) |
| $750,000 to $999,999 | 44 (1.0%) | 0 (0.0%) |
| $1,000,000 or more | 8 (0.2%) | 0 (0.0%) |
| Total | 4,401 (100.0%) | 1,830 (100.0%) |
Household Income by Mortgage Status in Letcher County

| Household Income | Without Mortgage | With Mortgage |
| Less than $10,000 | 388 (8.8%) | 4 (0.2%) |
| $10,000 to $24,999 | 1,061 (24.1%) | 83 (4.5%) |
| $25,000 to $34,999 | 595 (13.5%) | 135 (7.4%) |
| $35,000 to $49,999 | 446 (10.1%) | 165 (9.0%) |
| $50,000 to $74,999 | 861 (19.6%) | 252 (13.8%) |
| $75,000 to $99,999 | 419 (9.5%) | 401 (21.9%) |
| $100,000 to $149,999 | 457 (10.4%) | 439 (24.0%) |
| $150,000 or more | 174 (4.0%) | 246 (13.4%) |
| Total | 4,401 (100.0%) | 1,830 (100.0%) |
Property Value to Household Income Ratio in Letcher County

| Value-to-Income Ratio | Without Mortgage | With Mortgage |
| Less than 2.0x | 2,963 (67.3%) | 68,245 (3,729.2%) |
| 2.0x to 2.9x | 308 (7.0%) | 1,198 (65.5%) |
| 3.0x to 3.9x | 279 (6.3%) | 212 (11.6%) |
| 4.0x or more | 728 (16.5%) | 176 (9.6%) |
| Total | 4,401 (100.0%) | 1,830 (100.0%) |
Real Estate Taxes by Mortgage Status in Letcher County

| Property Taxes | Without Mortgage | With Mortgage |
| Less than $800 | 2,071 (47.1%) | 18 (1.0%) |
| $800 to $1,499 | 415 (9.4%) | 766 (41.9%) |
| $800 to $1,499 | 272 (6.2%) | 522 (28.5%) |
| Total | 4,401 (100.0%) | 1,830 (100.0%) |
Health & Disability in Letcher County
Health Insurance Coverage by Age in Letcher County

| Age Bracket | With Coverage | Without Coverage |
| Under 6 Years | 1,251 (100.0%) | 0 (0.0%) |
| 6 to 18 Years | 3,452 (95.7%) | 155 (4.3%) |
| 19 to 25 Years | 1,324 (87.4%) | 191 (12.6%) |
| 26 to 34 Years | 1,890 (92.6%) | 152 (7.4%) |
| 35 to 44 Years | 2,490 (95.3%) | 123 (4.7%) |
| 45 to 54 Years | 2,739 (97.4%) | 73 (2.6%) |
| 55 to 64 Years | 3,135 (97.6%) | 76 (2.4%) |
| 65 to 74 Years | 2,674 (99.3%) | 18 (0.7%) |
| 75 Years and older | 1,505 (98.8%) | 18 (1.2%) |
| Total | 20,460 (96.2%) | 806 (3.8%) |
Health Insurance Coverage by Citizenship Status in Letcher County
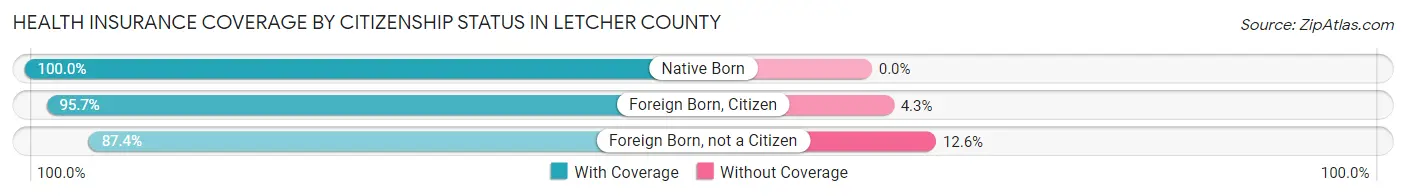
| Citizenship Status | With Coverage | Without Coverage |
| Native Born | 1,251 (100.0%) | 0 (0.0%) |
| Foreign Born, Citizen | 3,452 (95.7%) | 155 (4.3%) |
| Foreign Born, not a Citizen | 1,324 (87.4%) | 191 (12.6%) |
Health Insurance Coverage by Household Income in Letcher County
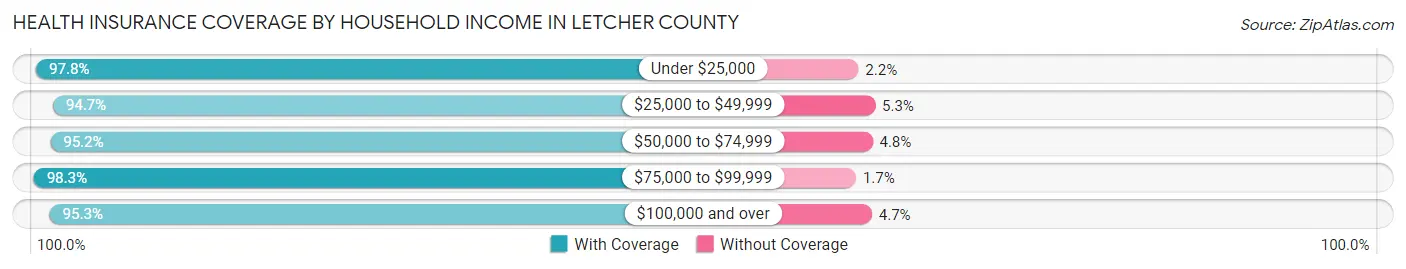
| Household Income | With Coverage | Without Coverage |
| Under $25,000 | 5,501 (97.8%) | 122 (2.2%) |
| $25,000 to $49,999 | 5,151 (94.7%) | 288 (5.3%) |
| $50,000 to $74,999 | 3,893 (95.2%) | 197 (4.8%) |
| $75,000 to $99,999 | 2,808 (98.3%) | 49 (1.7%) |
| $100,000 and over | 3,043 (95.3%) | 150 (4.7%) |
Public vs Private Health Insurance Coverage by Age in Letcher County

| Age Bracket | Public Insurance | Private Insurance |
| Under 6 | 904 (72.3%) | 351 (28.1%) |
| 6 to 18 Years | 2,332 (64.6%) | 1,270 (35.2%) |
| 19 to 25 Years | 871 (57.5%) | 537 (35.4%) |
| 25 to 34 Years | 1,178 (57.7%) | 870 (42.6%) |
| 35 to 44 Years | 1,397 (53.5%) | 1,159 (44.4%) |
| 45 to 54 Years | 1,668 (59.3%) | 1,274 (45.3%) |
| 55 to 64 Years | 2,022 (63.0%) | 1,477 (46.0%) |
| 65 to 74 Years | 2,608 (96.9%) | 1,224 (45.5%) |
| 75 Years and over | 1,505 (98.8%) | 575 (37.8%) |
| Total | 14,485 (68.1%) | 8,737 (41.1%) |
Disability Status by Sex by Age in Letcher County
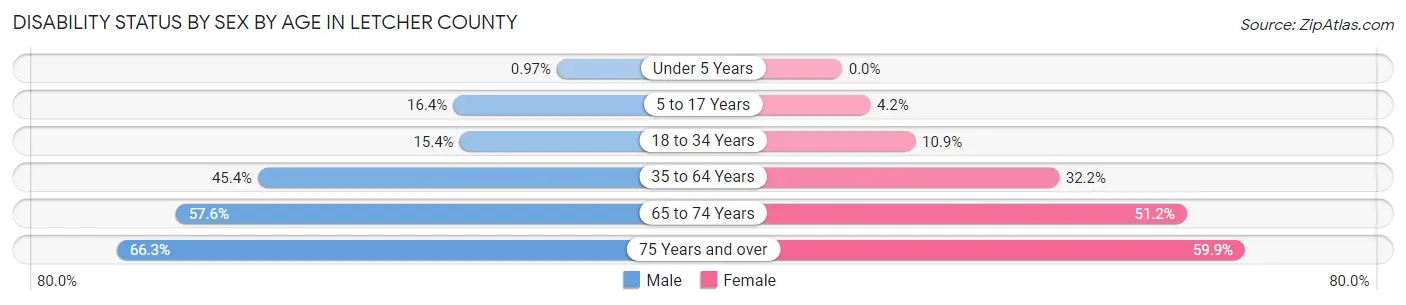
| Age Bracket | Male | Female |
| Under 5 Years | 6 (1.0%) | 0 (0.0%) |
| 5 to 17 Years | 298 (16.4%) | 69 (4.2%) |
| 18 to 34 Years | 300 (15.4%) | 202 (10.9%) |
| 35 to 64 Years | 1,939 (45.4%) | 1,405 (32.2%) |
| 65 to 74 Years | 732 (57.6%) | 727 (51.2%) |
| 75 Years and over | 435 (66.3%) | 519 (59.9%) |
Disability Class by Sex by Age in Letcher County
Disability Class: Hearing Difficulty
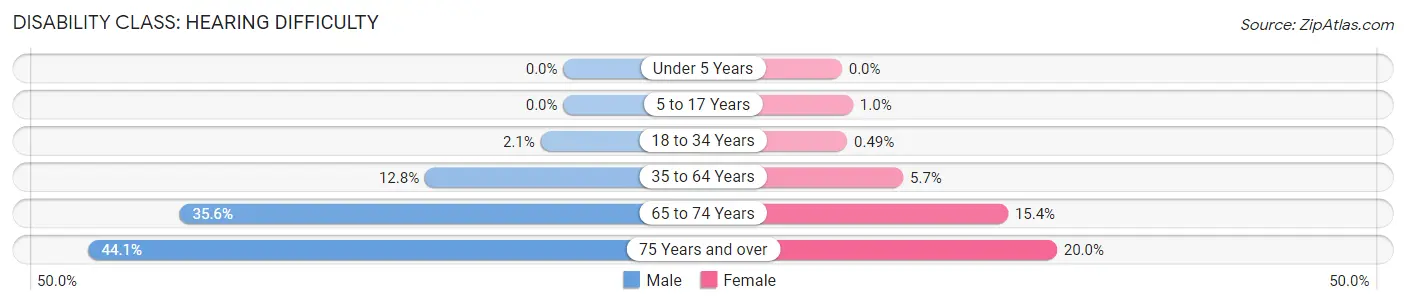
| Age Bracket | Male | Female |
| Under 5 Years | 0 (0.0%) | 0 (0.0%) |
| 5 to 17 Years | 0 (0.0%) | 17 (1.0%) |
| 18 to 34 Years | 41 (2.1%) | 9 (0.5%) |
| 35 to 64 Years | 549 (12.8%) | 248 (5.7%) |
| 65 to 74 Years | 453 (35.6%) | 219 (15.4%) |
| 75 Years and over | 289 (44.1%) | 173 (20.0%) |
Disability Class: Vision Difficulty

| Age Bracket | Male | Female |
| Under 5 Years | 6 (1.0%) | 0 (0.0%) |
| 5 to 17 Years | 30 (1.7%) | 7 (0.4%) |
| 18 to 34 Years | 96 (4.9%) | 29 (1.6%) |
| 35 to 64 Years | 377 (8.8%) | 237 (5.4%) |
| 65 to 74 Years | 106 (8.3%) | 220 (15.5%) |
| 75 Years and over | 117 (17.8%) | 114 (13.2%) |
Disability Class: Cognitive Difficulty
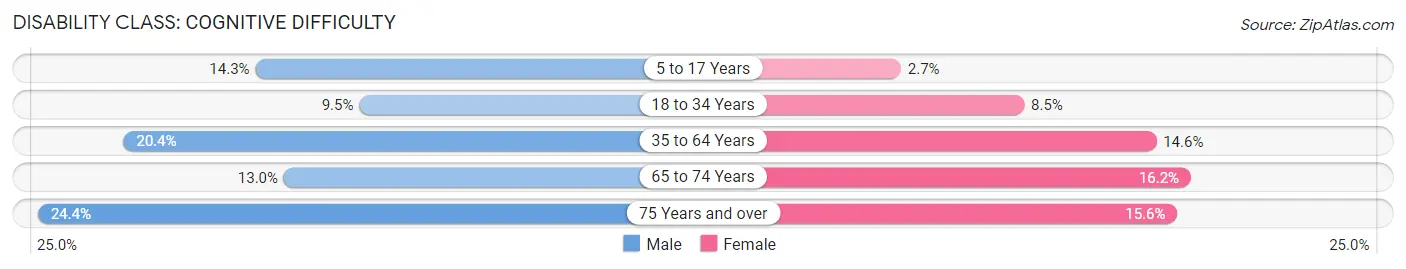
| Age Bracket | Male | Female |
| 5 to 17 Years | 260 (14.3%) | 45 (2.7%) |
| 18 to 34 Years | 184 (9.5%) | 157 (8.5%) |
| 35 to 64 Years | 873 (20.4%) | 636 (14.6%) |
| 65 to 74 Years | 165 (13.0%) | 230 (16.2%) |
| 75 Years and over | 160 (24.4%) | 135 (15.6%) |
Disability Class: Ambulatory Difficulty
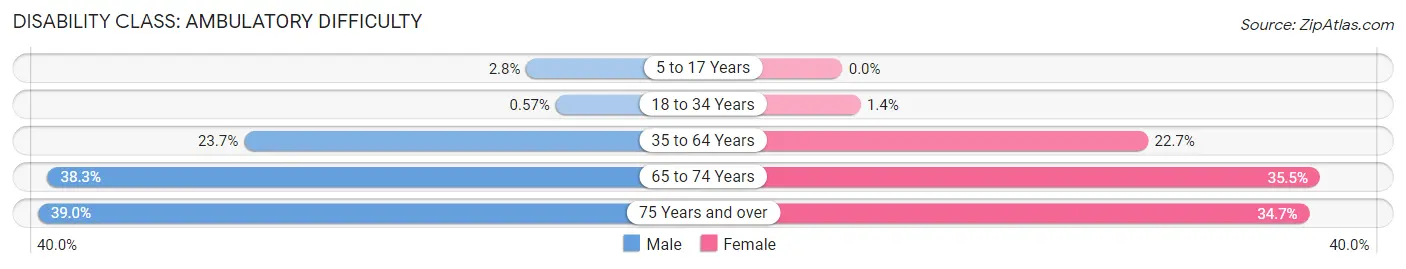
| Age Bracket | Male | Female |
| 5 to 17 Years | 50 (2.8%) | 0 (0.0%) |
| 18 to 34 Years | 11 (0.6%) | 25 (1.3%) |
| 35 to 64 Years | 1,014 (23.7%) | 990 (22.7%) |
| 65 to 74 Years | 487 (38.3%) | 504 (35.5%) |
| 75 Years and over | 256 (39.0%) | 301 (34.7%) |
Disability Class: Self-Care Difficulty
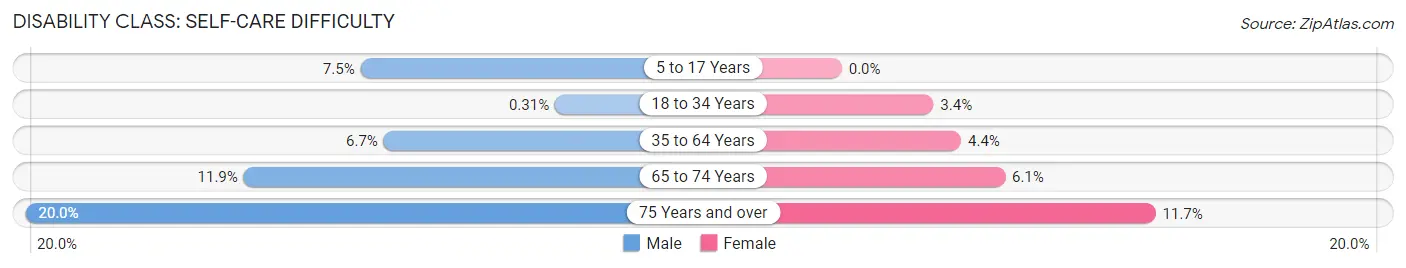
| Age Bracket | Male | Female |
| 5 to 17 Years | 137 (7.5%) | 0 (0.0%) |
| 18 to 34 Years | 6 (0.3%) | 63 (3.4%) |
| 35 to 64 Years | 285 (6.7%) | 193 (4.4%) |
| 65 to 74 Years | 151 (11.9%) | 86 (6.1%) |
| 75 Years and over | 131 (20.0%) | 101 (11.7%) |
Technology Access in Letcher County
Computing Device Access in Letcher County
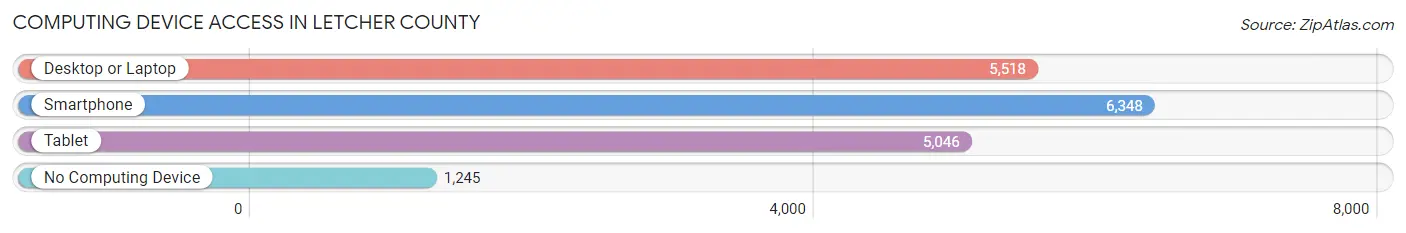
| Device Type | # Households | % Households |
| Desktop or Laptop | 5,518 | 65.6% |
| Smartphone | 6,348 | 75.4% |
| Tablet | 5,046 | 60.0% |
| No Computing Device | 1,245 | 14.8% |
| Total | 8,415 | 100.0% |
Internet Access in Letcher County

| Internet Type | # Households | % Households |
| Dial-Up Internet | 0 | 0.0% |
| Broadband Home | 5,758 | 68.4% |
| Cellular Data Only | 595 | 7.1% |
| Satellite Internet | 446 | 5.3% |
| No Internet | 1,717 | 20.4% |
| Total | 8,415 | 100.0% |
Letcher County Summary
Letcher County is located in the southeastern part of Kentucky, in the Appalachian Mountains. It is bordered by Knott County to the north, Perry County to the east, Harlan County to the south, and Pike County to the west. The county seat is Whitesburg, and the county was formed in 1842 from parts of Harlan and Perry counties. The county has a total area of 437 square miles, and a population of 24,519 as of the 2010 census.
Letcher County has a rich history, beginning with the Native American tribes that inhabited the area prior to European settlement. The Cherokee, Shawnee, and Chickamauga tribes all had settlements in the area. The first European settlers arrived in the late 1700s, and the county was officially formed in 1842. The county was named for Robert P. Letcher, who served as Governor of Kentucky from 1840 to 1844.
The economy of Letcher County is largely based on coal mining and timber harvesting. The county is home to several coal mines, and the coal industry has been a major employer in the area for many years. The timber industry is also important to the local economy, and the county is home to several sawmills and lumber companies. In addition, the county is home to several small businesses, including restaurants, retail stores, and service providers.
The demographics of Letcher County are largely rural and Appalachian. The population is predominantly white, with a small African American population. The median household income is $25,845, and the poverty rate is 28.3%. The unemployment rate is 8.2%, and the median age is 41.7 years.
Letcher County is home to several educational institutions, including the University of Kentucky, Southeast Kentucky Community and Technical College, and the Letcher County School System. The county is also home to several cultural attractions, including the Kentucky Coal Museum, the Kentucky Music Hall of Fame, and the Kentucky Mountain Laurel Festival.
Letcher County is a rural county with a rich history and a strong economy. The county is home to several coal mines and timber companies, and the county is also home to several small businesses. The population is predominantly white, with a small African American population. The median household income is $25,845, and the poverty rate is 28.3%. The county is home to several educational institutions, and several cultural attractions.
Common Questions
What is the Total Population of Letcher County?
Total Population of Letcher County is 21,490.
What is the Total Male Population of Letcher County?
Total Male Population of Letcher County is 10,702.
What is the Total Female Population of Letcher County?
Total Female Population of Letcher County is 10,788.
What is the Ratio of Males per 100 Females in Letcher County?
There are 99.20 Males per 100 Females in Letcher County.
What is the Ratio of Females per 100 Males in Letcher County?
There are 100.80 Females per 100 Males in Letcher County.
What is the Median Population Age in Letcher County?
Median Population Age in Letcher County is 42.7 Years.
What is the Average Family Size in Letcher County
Average Family Size in Letcher County is 3.1 People.
What is the Average Household Size in Letcher County
Average Household Size in Letcher County is 2.5 People.
What is Per Capita Income in Letcher County?
Per Capita income in Letcher County is $23,522.
What is the Median Family Income in Letcher County?
Median Family Income in Letcher County is $52,578.
What is the Median Household income in Letcher County?
Median Household Income in Letcher County is $38,466.
What is Income or Wage Gap in Letcher County?
Income or Wage Gap in Letcher County is 28.4%.
Women in Letcher County earn 71.6 cents for every dollar earned by a man.
What is Family Income Deficit in Letcher County?
Family Income Deficit in Letcher County is $10,143.
Families that are below poverty line in Letcher County earn $10,143 less on average than the poverty threshold level.
What is Inequality or Gini Index in Letcher County?
Inequality or Gini Index in Letcher County is 0.50.
How Large is the Labor Force in Letcher County?
There are 7,583 People in the Labor Forcein in Letcher County.
What is the Percentage of People in the Labor Force in Letcher County?
43.6% of People are in the Labor Force in Letcher County.
What is the Unemployment Rate in Letcher County?
Unemployment Rate in Letcher County is 7.7%.