Laurel County, KY
Laurel County Map
Laurel County Overview
62,442
TOTAL POPULATION
30,964
MALE POPULATION
31,478
FEMALE POPULATION
98.37
MALES / 100 FEMALES
101.66
FEMALES / 100 MALES
39.8
MEDIAN AGE
3.1
AVG FAMILY SIZE
2.6
AVG HOUSEHOLD SIZE
$26,829
PER CAPITA INCOME
$62,278
AVG FAMILY INCOME
$53,693
AVG HOUSEHOLD INCOME
31.9%
WAGE / INCOME GAP [ % ]
68.1¢/ $1
WAGE / INCOME GAP [ $ ]
$11,167
FAMILY INCOME DEFICIT
0.45
INEQUALITY / GINI INDEX
26,939
LABOR FORCE [ PEOPLE ]
53.9%
PERCENT IN LABOR FORCE
3.6%
UNEMPLOYMENT RATE
Laurel County Area Codes
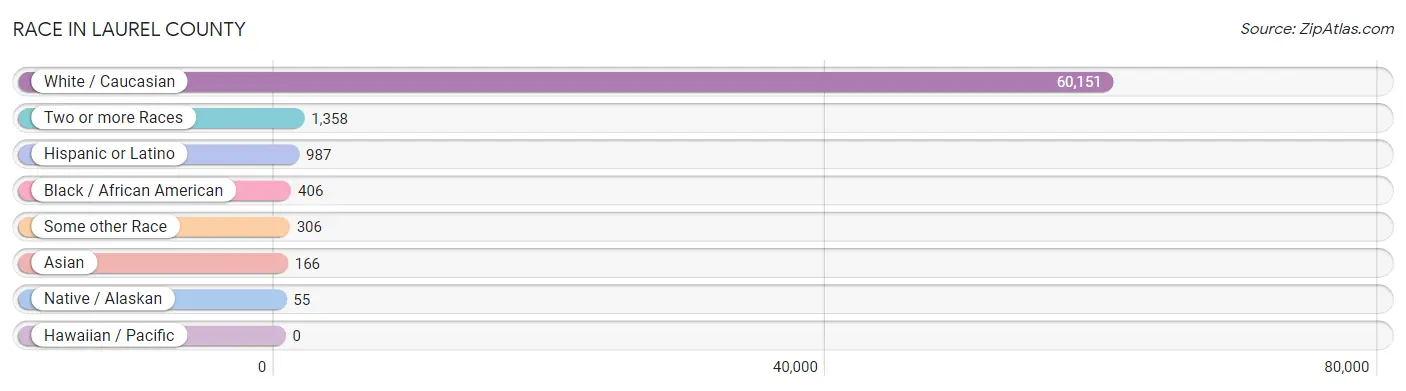
Race in Laurel County
The most populous races in Laurel County are White / Caucasian (60,151 | 96.3%), Two or more Races (1,358 | 2.2%), and Hispanic or Latino (987 | 1.6%).
| Race | # Population | % Population |
| Asian | 166 | 0.3% |
| Black / African American | 406 | 0.6% |
| Hawaiian / Pacific | 0 | 0.0% |
| Hispanic or Latino | 987 | 1.6% |
| Native / Alaskan | 55 | 0.1% |
| White / Caucasian | 60,151 | 96.3% |
| Two or more Races | 1,358 | 2.2% |
| Some other Race | 306 | 0.5% |
| Total | 62,442 | 100.0% |
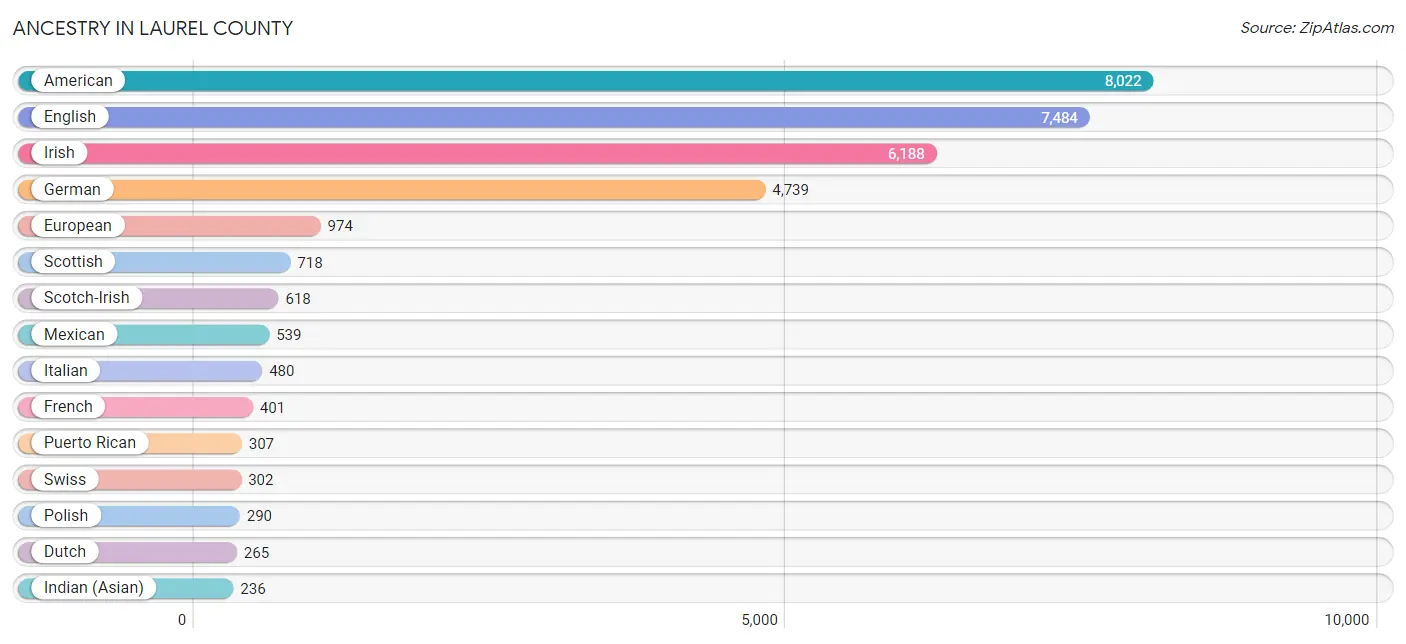
Ancestry in Laurel County
The most populous ancestries reported in Laurel County are American (8,022 | 12.9%), English (7,484 | 12.0%), Irish (6,188 | 9.9%), German (4,739 | 7.6%), and European (974 | 1.6%), together accounting for 43.9% of all Laurel County residents.
| Ancestry | # Population | % Population |
| African | 13 | 0.0% |
| Albanian | 9 | 0.0% |
| American | 8,022 | 12.9% |
| Arab | 41 | 0.1% |
| Austrian | 63 | 0.1% |
| Belgian | 45 | 0.1% |
| Belizean | 26 | 0.0% |
| Bhutanese | 10 | 0.0% |
| Blackfeet | 18 | 0.0% |
| British | 228 | 0.4% |
| Canadian | 9 | 0.0% |
| Celtic | 5 | 0.0% |
| Central American | 20 | 0.0% |
| Cherokee | 207 | 0.3% |
| Chickasaw | 7 | 0.0% |
| Croatian | 9 | 0.0% |
| Czech | 49 | 0.1% |
| Dominican | 41 | 0.1% |
| Dutch | 265 | 0.4% |
| English | 7,484 | 12.0% |
| European | 974 | 1.6% |
| French | 401 | 0.6% |
| French Canadian | 20 | 0.0% |
| German | 4,739 | 7.6% |
| Greek | 18 | 0.0% |
| Guatemalan | 20 | 0.0% |
| Indian (Asian) | 236 | 0.4% |
| Irish | 6,188 | 9.9% |
| Italian | 480 | 0.8% |
| Korean | 41 | 0.1% |
| Lebanese | 41 | 0.1% |
| Mexican | 539 | 0.9% |
| Native Hawaiian | 2 | 0.0% |
| Northern European | 10 | 0.0% |
| Norwegian | 36 | 0.1% |
| Pakistani | 22 | 0.0% |
| Polish | 290 | 0.5% |
| Portuguese | 21 | 0.0% |
| Puerto Rican | 307 | 0.5% |
| Russian | 44 | 0.1% |
| Scandinavian | 32 | 0.1% |
| Scotch-Irish | 618 | 1.0% |
| Scottish | 718 | 1.1% |
| Slovak | 7 | 0.0% |
| Somali | 1 | 0.0% |
| Sri Lankan | 57 | 0.1% |
| Subsaharan African | 14 | 0.0% |
| Swedish | 52 | 0.1% |
| Swiss | 302 | 0.5% |
| Thai | 56 | 0.1% |
| Ukrainian | 63 | 0.1% |
| Welsh | 145 | 0.2% | View All 52 Rows |
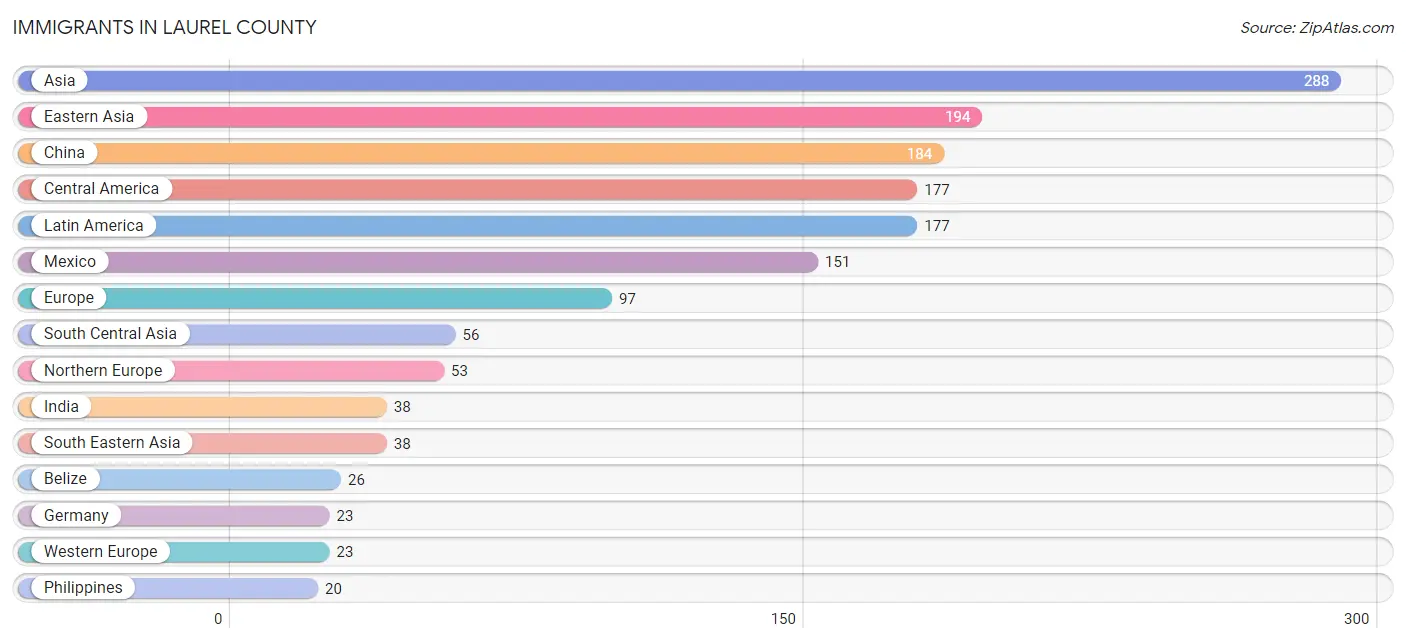
Immigrants in Laurel County
The most numerous immigrant groups reported in Laurel County came from Asia (288 | 0.5%), Eastern Asia (194 | 0.3%), China (184 | 0.3%), Central America (177 | 0.3%), and Latin America (177 | 0.3%), together accounting for 1.6% of all Laurel County residents.
| Immigration Origin | # Population | % Population |
| Africa | 16 | 0.0% |
| Asia | 288 | 0.5% |
| Belize | 26 | 0.0% |
| Canada | 4 | 0.0% |
| Central America | 177 | 0.3% |
| China | 184 | 0.3% |
| Denmark | 13 | 0.0% |
| Eastern Africa | 1 | 0.0% |
| Eastern Asia | 194 | 0.3% |
| Eastern Europe | 16 | 0.0% |
| Europe | 97 | 0.2% |
| Germany | 23 | 0.0% |
| Greece | 5 | 0.0% |
| India | 38 | 0.1% |
| Japan | 10 | 0.0% |
| Latin America | 177 | 0.3% |
| Mexico | 151 | 0.2% |
| Morocco | 15 | 0.0% |
| Northern Africa | 15 | 0.0% |
| Northern Europe | 53 | 0.1% |
| Pakistan | 18 | 0.0% |
| Philippines | 20 | 0.0% |
| South Central Asia | 56 | 0.1% |
| South Eastern Asia | 38 | 0.1% |
| Southern Europe | 5 | 0.0% |
| Ukraine | 16 | 0.0% |
| Vietnam | 18 | 0.0% |
| Western Europe | 23 | 0.0% |
| Zimbabwe | 1 | 0.0% | View All 29 Rows |
Sex and Age in Laurel County
Sex and Age in Laurel County
The most populous age groups in Laurel County are 50 to 54 Years (2,223 | 7.2%) for men and 5 to 9 Years (2,191 | 7.0%) for women.
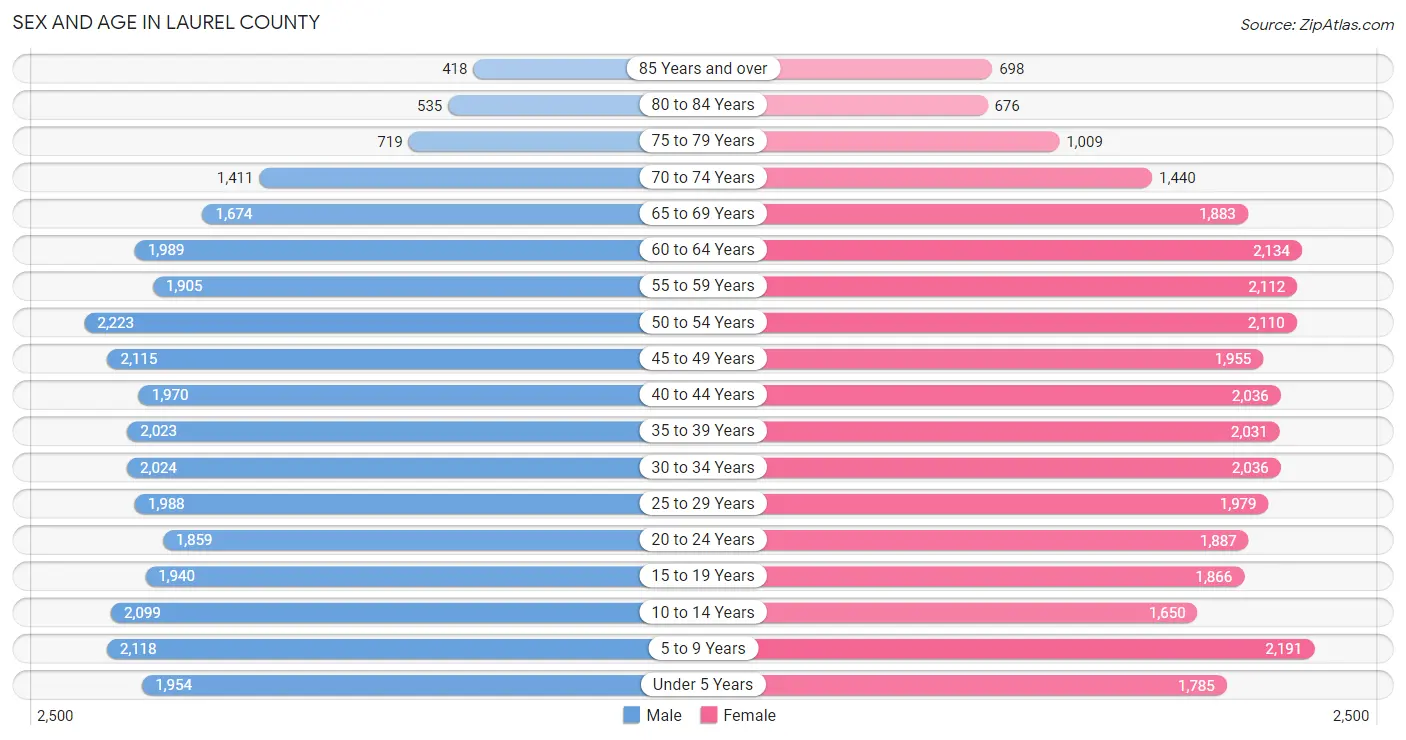
| Age Bracket | Male | Female |
| Under 5 Years | 1,954 (6.3%) | 1,785 (5.7%) |
| 5 to 9 Years | 2,118 (6.8%) | 2,191 (7.0%) |
| 10 to 14 Years | 2,099 (6.8%) | 1,650 (5.2%) |
| 15 to 19 Years | 1,940 (6.3%) | 1,866 (5.9%) |
| 20 to 24 Years | 1,859 (6.0%) | 1,887 (6.0%) |
| 25 to 29 Years | 1,988 (6.4%) | 1,979 (6.3%) |
| 30 to 34 Years | 2,024 (6.5%) | 2,036 (6.5%) |
| 35 to 39 Years | 2,023 (6.5%) | 2,031 (6.5%) |
| 40 to 44 Years | 1,970 (6.4%) | 2,036 (6.5%) |
| 45 to 49 Years | 2,115 (6.8%) | 1,955 (6.2%) |
| 50 to 54 Years | 2,223 (7.2%) | 2,110 (6.7%) |
| 55 to 59 Years | 1,905 (6.1%) | 2,112 (6.7%) |
| 60 to 64 Years | 1,989 (6.4%) | 2,134 (6.8%) |
| 65 to 69 Years | 1,674 (5.4%) | 1,883 (6.0%) |
| 70 to 74 Years | 1,411 (4.6%) | 1,440 (4.6%) |
| 75 to 79 Years | 719 (2.3%) | 1,009 (3.2%) |
| 80 to 84 Years | 535 (1.7%) | 676 (2.1%) |
| 85 Years and over | 418 (1.3%) | 698 (2.2%) |
| Total | 30,964 (100.0%) | 31,478 (100.0%) |
Families and Households in Laurel County
Median Family Size in Laurel County
The median family size in Laurel County is 3.08 persons per family, with married-couple families (12,814 | 75.5%) accounting for the largest median family size of 3.13 persons per family. On the other hand, single male/father families (1,238 | 7.3%) represent the smallest median family size with 2.48 persons per family.
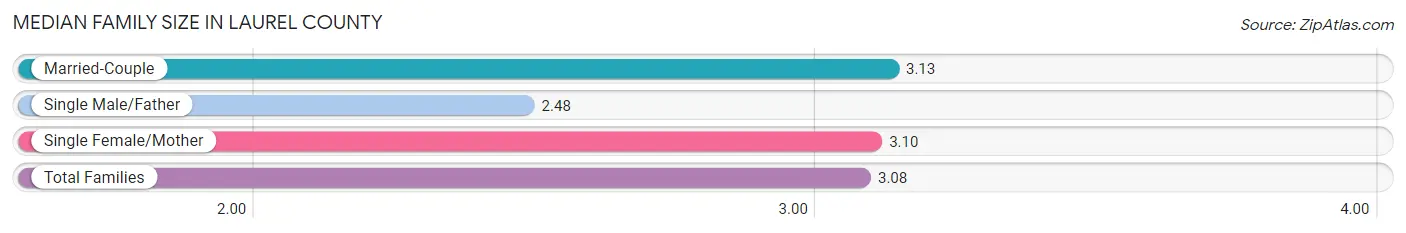
| Family Type | # Families | Family Size |
| Married-Couple | 12,814 (75.5%) | 3.13 |
| Single Male/Father | 1,238 (7.3%) | 2.48 |
| Single Female/Mother | 2,915 (17.2%) | 3.10 |
| Total Families | 16,967 (100.0%) | 3.08 |
Median Household Size in Laurel County
The median household size in Laurel County is 2.62 persons per household, with single female/mother households (2,915 | 12.4%) accounting for the largest median household size of 3.31 persons per household. non-family households (6,457 | 27.6%) represent the smallest median household size with 1.20 persons per household.
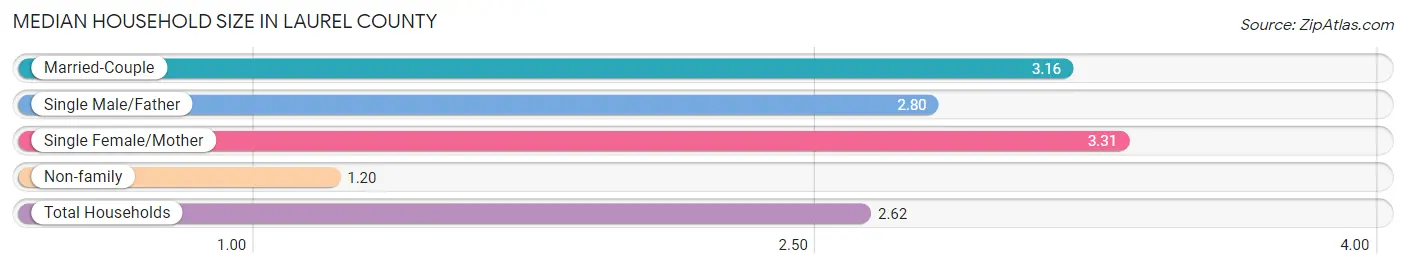
| Household Type | # Households | Household Size |
| Married-Couple | 12,814 (54.7%) | 3.16 |
| Single Male/Father | 1,238 (5.3%) | 2.80 |
| Single Female/Mother | 2,915 (12.4%) | 3.31 |
| Non-family | 6,457 (27.6%) | 1.20 |
| Total Households | 23,424 (100.0%) | 2.62 |
Household Size by Marriage Status in Laurel County
Out of a total of 23,424 households in Laurel County, 16,967 (72.4%) are family households, while 6,457 (27.6%) are nonfamily households. The most numerous type of family households are 2-person households, comprising 7,657, and the most common type of nonfamily households are 1-person households, comprising 5,152.
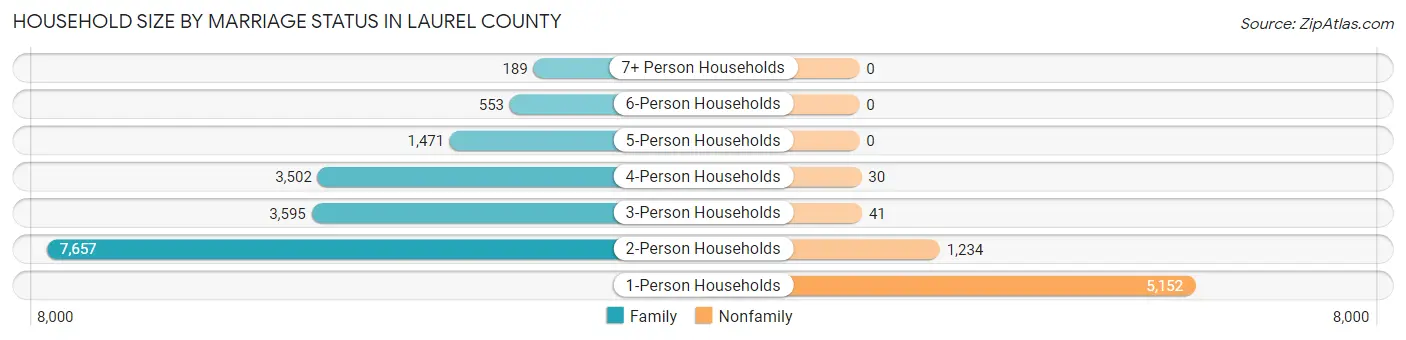
| Household Size | Family Households | Nonfamily Households |
| 1-Person Households | - | 5,152 (22.0%) |
| 2-Person Households | 7,657 (32.7%) | 1,234 (5.3%) |
| 3-Person Households | 3,595 (15.3%) | 41 (0.2%) |
| 4-Person Households | 3,502 (14.9%) | 30 (0.1%) |
| 5-Person Households | 1,471 (6.3%) | 0 (0.0%) |
| 6-Person Households | 553 (2.4%) | 0 (0.0%) |
| 7+ Person Households | 189 (0.8%) | 0 (0.0%) |
| Total | 16,967 (72.4%) | 6,457 (27.6%) |
Female Fertility in Laurel County
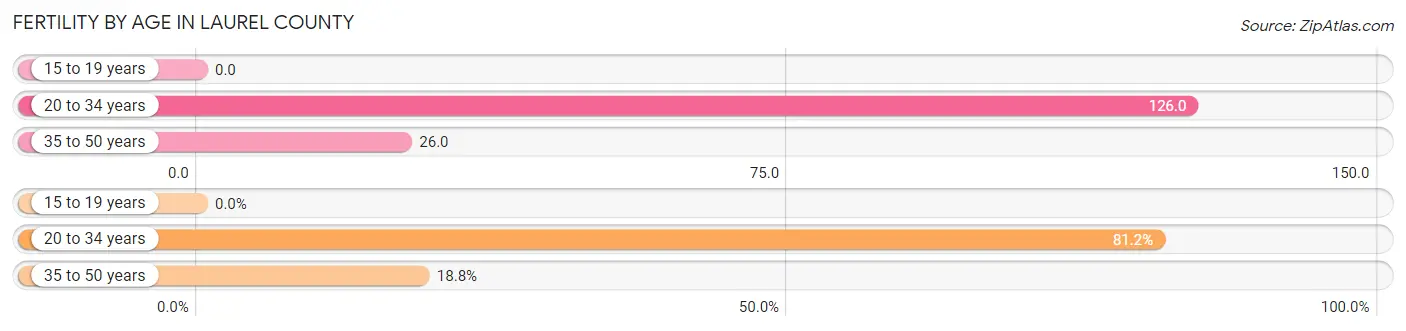
Fertility by Age in Laurel County
Average fertility rate in Laurel County is 64.0 births per 1,000 women. Women in the age bracket of 20 to 34 years have the highest fertility rate with 126.0 births per 1,000 women. Women in the age bracket of 20 to 34 years acount for 81.2% of all women with births.
| Age Bracket | Women with Births | Births / 1,000 Women |
| 15 to 19 years | 0 (0.0%) | 0.0 |
| 20 to 34 years | 742 (81.2%) | 126.0 |
| 35 to 50 years | 172 (18.8%) | 26.0 |
| Total | 914 (100.0%) | 64.0 |
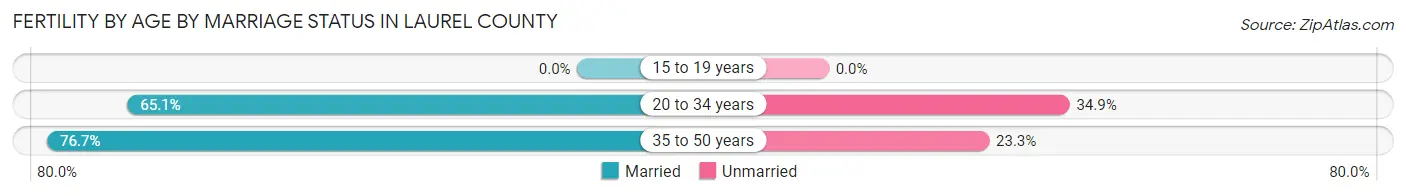
Fertility by Age by Marriage Status in Laurel County
67.3% of women with births (914) in Laurel County are married. The highest percentage of unmarried women with births falls into 20 to 34 years age bracket with 34.9% of them unmarried at the time of birth, while the lowest percentage of unmarried women with births belong to 35 to 50 years age bracket with 23.3% of them unmarried.
| Age Bracket | Married | Unmarried |
| 15 to 19 years | 0 (0.0%) | 0 (0.0%) |
| 20 to 34 years | 483 (65.1%) | 259 (34.9%) |
| 35 to 50 years | 132 (76.7%) | 40 (23.3%) |
| Total | 615 (67.3%) | 299 (32.7%) |
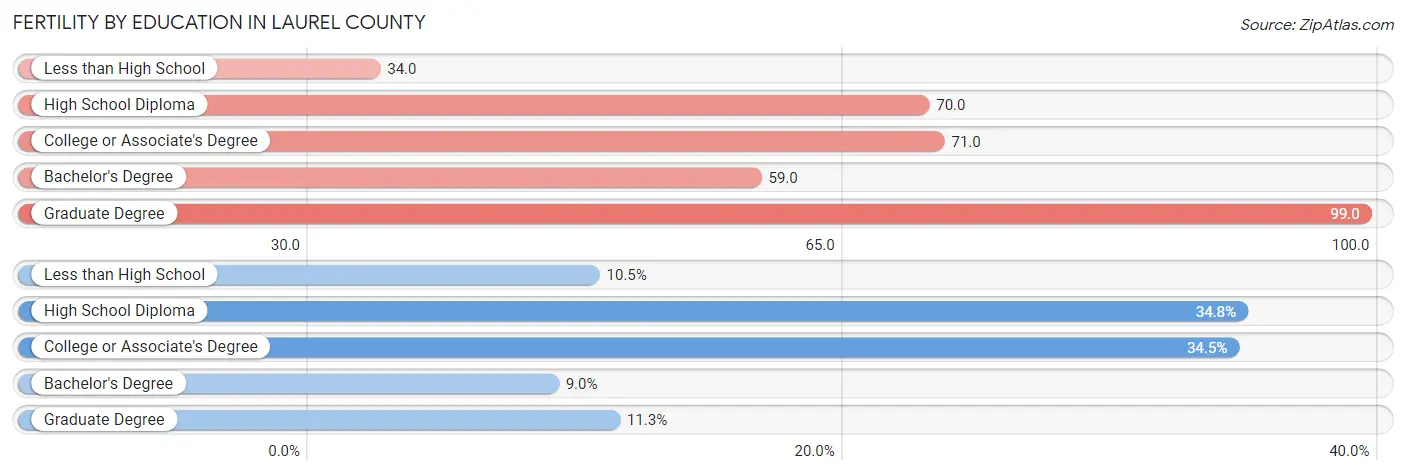
Fertility by Education in Laurel County
Average fertility rate in Laurel County is 64.0 births per 1,000 women. Women with the education attainment of graduate degree have the highest fertility rate of 99.0 births per 1,000 women, while women with the education attainment of less than high school have the lowest fertility at 34.0 births per 1,000 women. Women with the education attainment of high school diploma represent 34.8% of all women with births.
| Educational Attainment | Women with Births | Births / 1,000 Women |
| Less than High School | 96 (10.5%) | 34.0 |
| High School Diploma | 318 (34.8%) | 70.0 |
| College or Associate's Degree | 315 (34.5%) | 71.0 |
| Bachelor's Degree | 82 (9.0%) | 59.0 |
| Graduate Degree | 103 (11.3%) | 99.0 |
| Total | 914 (100.0%) | 64.0 |
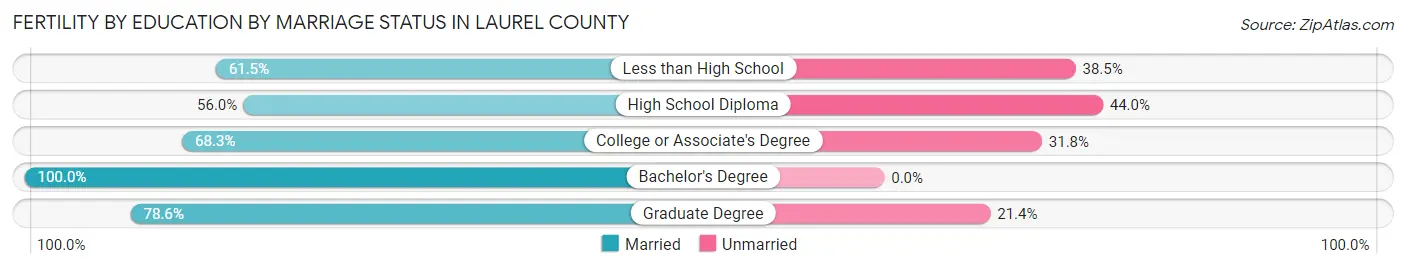
Fertility by Education by Marriage Status in Laurel County
32.7% of women with births in Laurel County are unmarried. Women with the educational attainment of bachelor's degree are most likely to be married with 100.0% of them married at childbirth, while women with the educational attainment of high school diploma are least likely to be married with 44.0% of them unmarried at childbirth.
| Educational Attainment | Married | Unmarried |
| Less than High School | 59 (61.5%) | 37 (38.5%) |
| High School Diploma | 178 (56.0%) | 140 (44.0%) |
| College or Associate's Degree | 215 (68.2%) | 100 (31.8%) |
| Bachelor's Degree | 82 (100.0%) | 0 (0.0%) |
| Graduate Degree | 81 (78.6%) | 22 (21.4%) |
| Total | 615 (67.3%) | 299 (32.7%) |
Income in Laurel County
Income Overview in Laurel County
Per Capita Income in Laurel County is $26,829, while median incomes of families and households are $62,278 and $53,693 respectively.
| Characteristic | Number | Measure |
| Per Capita Income | 62,442 | $26,829 |
| Median Family Income | 16,967 | $62,278 |
| Mean Family Income | 16,967 | $78,051 |
| Median Household Income | 23,424 | $53,693 |
| Mean Household Income | 23,424 | $68,970 |
| Income Deficit | 16,967 | $11,167 |
| Wage / Income Gap (%) | 62,442 | 31.87% |
| Wage / Income Gap ($) | 62,442 | 68.13¢ per $1 |
| Gini / Inequality Index | 62,442 | 0.45 |
Earnings by Sex in Laurel County
Average Earnings in Laurel County are $35,201, $42,355 for men and $28,858 for women, a difference of 31.9%.
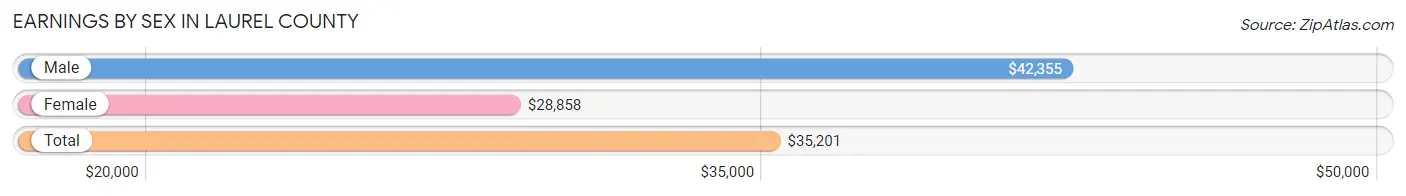
| Sex | Number | Average Earnings |
| Male | 14,865 (52.7%) | $42,355 |
| Female | 13,340 (47.3%) | $28,858 |
| Total | 28,205 (100.0%) | $35,201 |
Earnings by Sex by Income Bracket in Laurel County
The most common earnings brackets in Laurel County are $55,000 to $64,999 for men (1,638 | 11.0%) and $25,000 to $29,999 for women (1,268 | 9.5%).
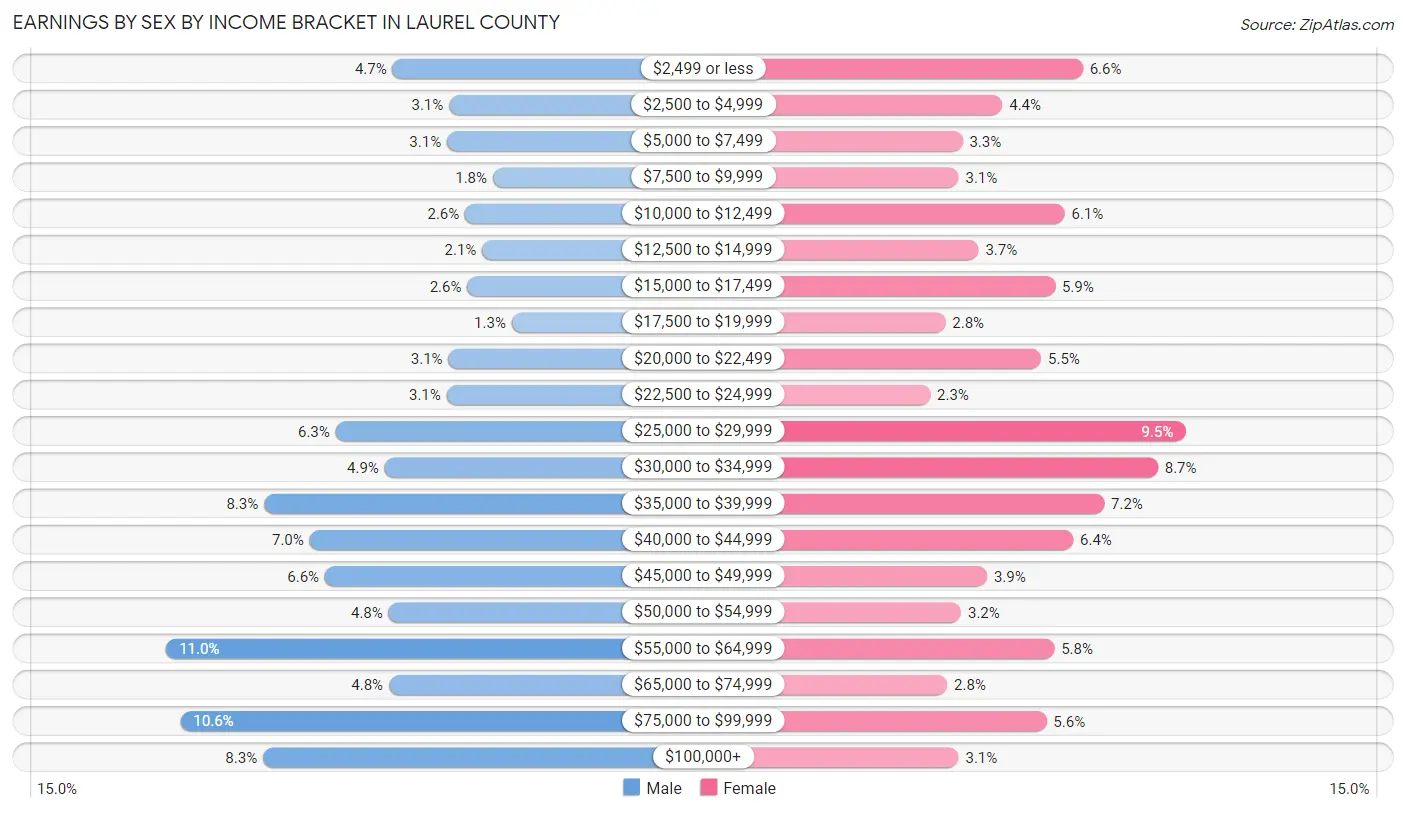
| Income | Male | Female |
| $2,499 or less | 692 (4.7%) | 884 (6.6%) |
| $2,500 to $4,999 | 457 (3.1%) | 583 (4.4%) |
| $5,000 to $7,499 | 466 (3.1%) | 433 (3.3%) |
| $7,500 to $9,999 | 274 (1.8%) | 419 (3.1%) |
| $10,000 to $12,499 | 390 (2.6%) | 817 (6.1%) |
| $12,500 to $14,999 | 318 (2.1%) | 493 (3.7%) |
| $15,000 to $17,499 | 381 (2.6%) | 780 (5.9%) |
| $17,500 to $19,999 | 194 (1.3%) | 370 (2.8%) |
| $20,000 to $22,499 | 460 (3.1%) | 728 (5.5%) |
| $22,500 to $24,999 | 467 (3.1%) | 312 (2.3%) |
| $25,000 to $29,999 | 930 (6.3%) | 1,268 (9.5%) |
| $30,000 to $34,999 | 726 (4.9%) | 1,166 (8.7%) |
| $35,000 to $39,999 | 1,230 (8.3%) | 964 (7.2%) |
| $40,000 to $44,999 | 1,039 (7.0%) | 848 (6.4%) |
| $45,000 to $49,999 | 975 (6.6%) | 525 (3.9%) |
| $50,000 to $54,999 | 709 (4.8%) | 428 (3.2%) |
| $55,000 to $64,999 | 1,638 (11.0%) | 778 (5.8%) |
| $65,000 to $74,999 | 707 (4.8%) | 376 (2.8%) |
| $75,000 to $99,999 | 1,578 (10.6%) | 749 (5.6%) |
| $100,000+ | 1,234 (8.3%) | 419 (3.1%) |
| Total | 14,865 (100.0%) | 13,340 (100.0%) |
Earnings by Sex by Educational Attainment in Laurel County
Average earnings in Laurel County are $47,369 for men and $31,101 for women, a difference of 34.3%. Men with an educational attainment of graduate degree enjoy the highest average annual earnings of $63,750, while those with less than high school education earn the least with $34,730. Women with an educational attainment of graduate degree earn the most with the average annual earnings of $57,125, while those with less than high school education have the smallest earnings of $21,507.
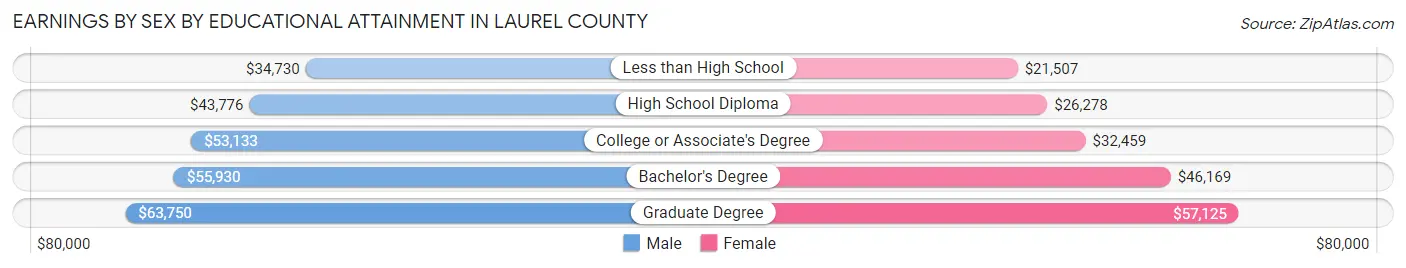
| Educational Attainment | Male Income | Female Income |
| Less than High School | $34,730 | $21,507 |
| High School Diploma | $43,776 | $26,278 |
| College or Associate's Degree | $53,133 | $32,459 |
| Bachelor's Degree | $55,930 | $46,169 |
| Graduate Degree | $63,750 | $57,125 |
| Total | $47,369 | $31,101 |
Family Income in Laurel County
Family Income Brackets in Laurel County
According to the Laurel County family income data, there are 3,037 families falling into the $50,000 to $74,999 income range, which is the most common income bracket and makes up 17.9% of all families. Conversely, the $10,000 to $14,999 income bracket is the least frequent group with only 628 families (3.7%) belonging to this category.
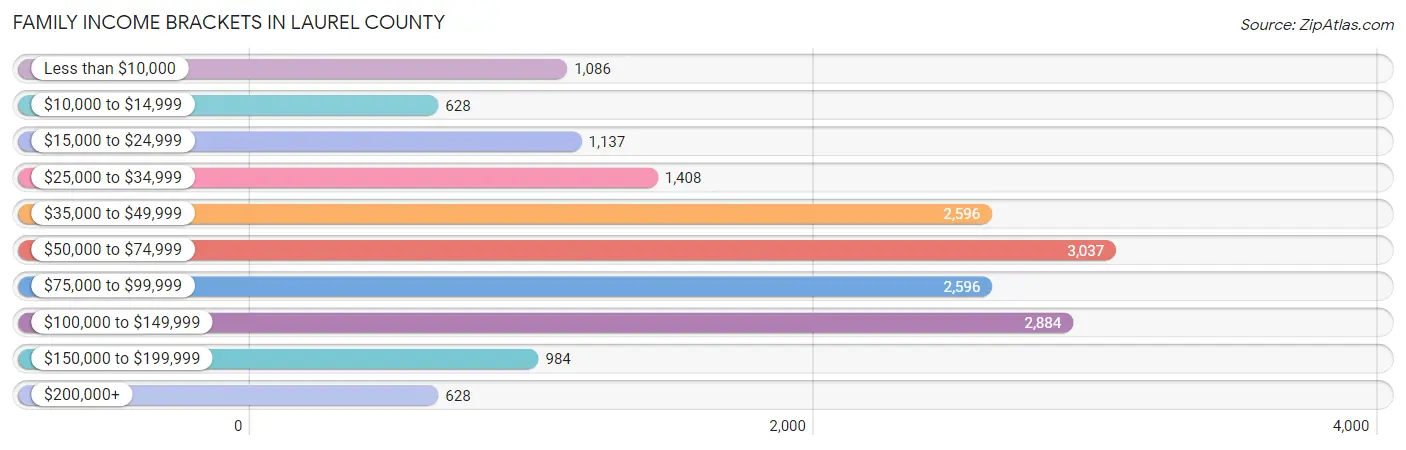
| Income Bracket | # Families | % Families |
| Less than $10,000 | 1,086 | 6.4% |
| $10,000 to $14,999 | 628 | 3.7% |
| $15,000 to $24,999 | 1,137 | 6.7% |
| $25,000 to $34,999 | 1,408 | 8.3% |
| $35,000 to $49,999 | 2,596 | 15.3% |
| $50,000 to $74,999 | 3,037 | 17.9% |
| $75,000 to $99,999 | 2,596 | 15.3% |
| $100,000 to $149,999 | 2,884 | 17.0% |
| $150,000 to $199,999 | 984 | 5.8% |
| $200,000+ | 628 | 3.7% |
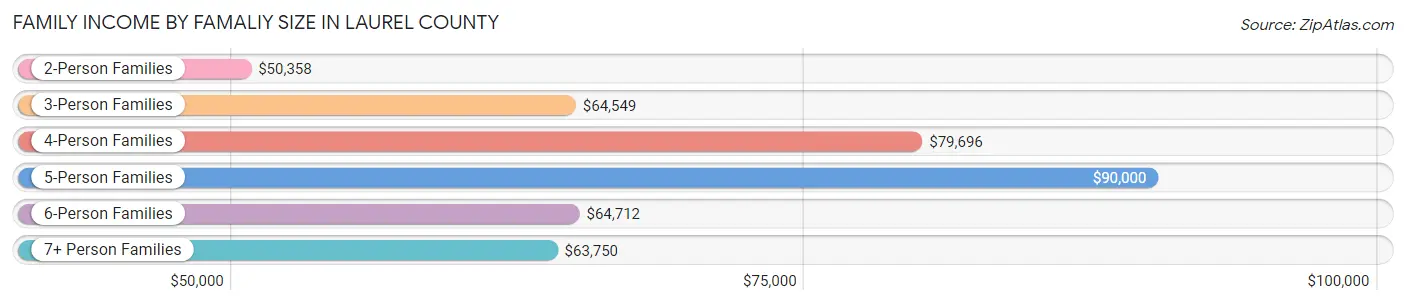
Family Income by Famaliy Size in Laurel County
5-person families (1,436 | 8.5%) account for the highest median family income in Laurel County with $90,000 per family, while 2-person families (8,091 | 47.7%) have the highest median income of $25,179 per family member.
| Income Bracket | # Families | Median Income |
| 2-Person Families | 8,091 (47.7%) | $50,358 |
| 3-Person Families | 3,608 (21.3%) | $64,549 |
| 4-Person Families | 3,228 (19.0%) | $79,696 |
| 5-Person Families | 1,436 (8.5%) | $90,000 |
| 6-Person Families | 453 (2.7%) | $64,712 |
| 7+ Person Families | 151 (0.9%) | $63,750 |
| Total | 16,967 (100.0%) | $62,278 |
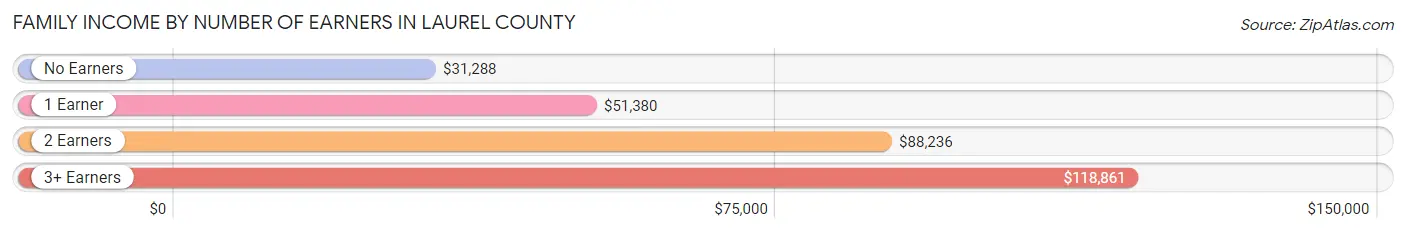
Family Income by Number of Earners in Laurel County
The median family income in Laurel County is $62,278, with families comprising 3+ earners (1,430) having the highest median family income of $118,861, while families with no earners (3,665) have the lowest median family income of $31,288, accounting for 8.4% and 21.6% of families, respectively.
| Number of Earners | # Families | Median Income |
| No Earners | 3,665 (21.6%) | $31,288 |
| 1 Earner | 5,716 (33.7%) | $51,380 |
| 2 Earners | 6,156 (36.3%) | $88,236 |
| 3+ Earners | 1,430 (8.4%) | $118,861 |
| Total | 16,967 (100.0%) | $62,278 |
Household Income in Laurel County
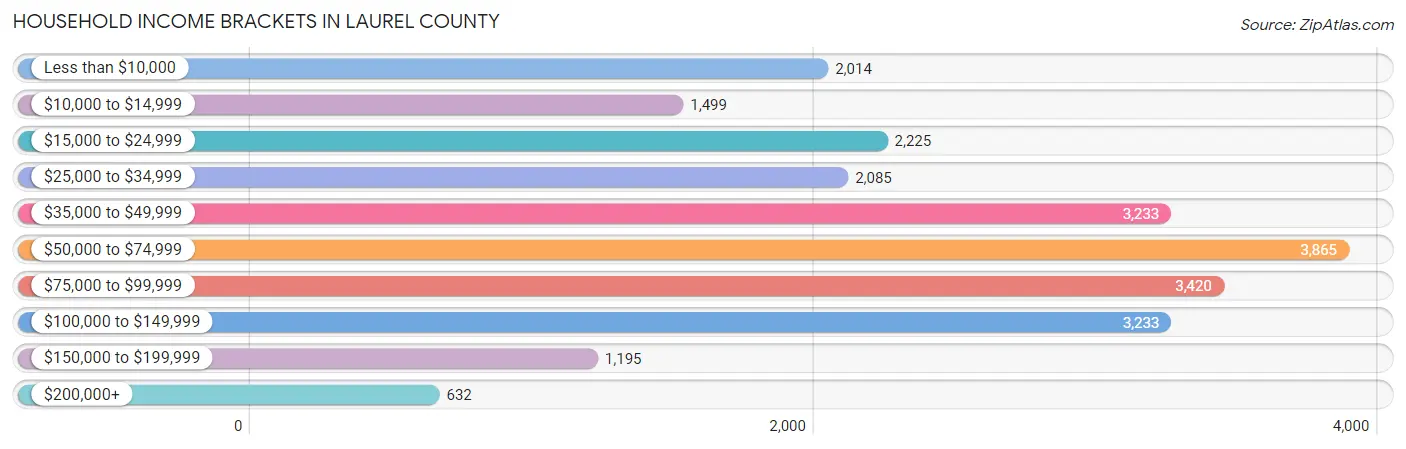
Household Income Brackets in Laurel County
With 3,865 households falling in the category, the $50,000 to $74,999 income range is the most frequent in Laurel County, accounting for 16.5% of all households. In contrast, only 632 households (2.7%) fall into the $200,000+ income bracket, making it the least populous group.
| Income Bracket | # Households | % Households |
| Less than $10,000 | 2,014 | 8.6% |
| $10,000 to $14,999 | 1,499 | 6.4% |
| $15,000 to $24,999 | 2,225 | 9.5% |
| $25,000 to $34,999 | 2,085 | 8.9% |
| $35,000 to $49,999 | 3,233 | 13.8% |
| $50,000 to $74,999 | 3,865 | 16.5% |
| $75,000 to $99,999 | 3,420 | 14.6% |
| $100,000 to $149,999 | 3,233 | 13.8% |
| $150,000 to $199,999 | 1,195 | 5.1% |
| $200,000+ | 632 | 2.7% |
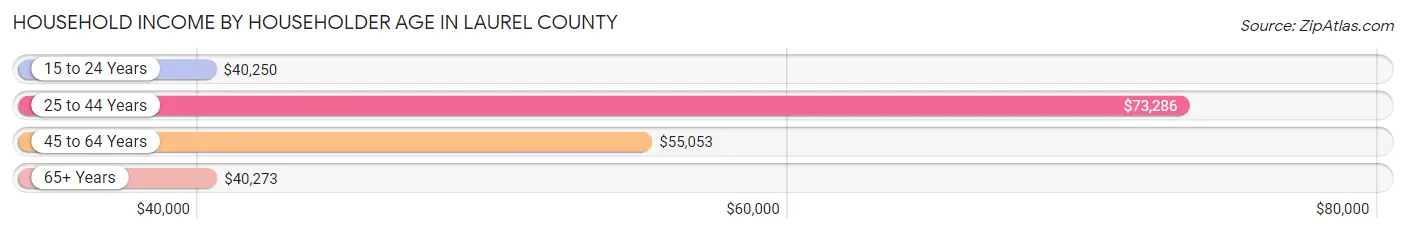
Household Income by Householder Age in Laurel County
The median household income in Laurel County is $53,693, with the highest median household income of $73,286 found in the 25 to 44 years age bracket for the primary householder. A total of 7,177 households (30.6%) fall into this category. Meanwhile, the 15 to 24 years age bracket for the primary householder has the lowest median household income of $40,250, with 807 households (3.5%) in this group.
| Income Bracket | # Households | Median Income |
| 15 to 24 Years | 807 (3.5%) | $40,250 |
| 25 to 44 Years | 7,177 (30.6%) | $73,286 |
| 45 to 64 Years | 9,214 (39.3%) | $55,053 |
| 65+ Years | 6,226 (26.6%) | $40,273 |
| Total | 23,424 (100.0%) | $53,693 |
Poverty in Laurel County
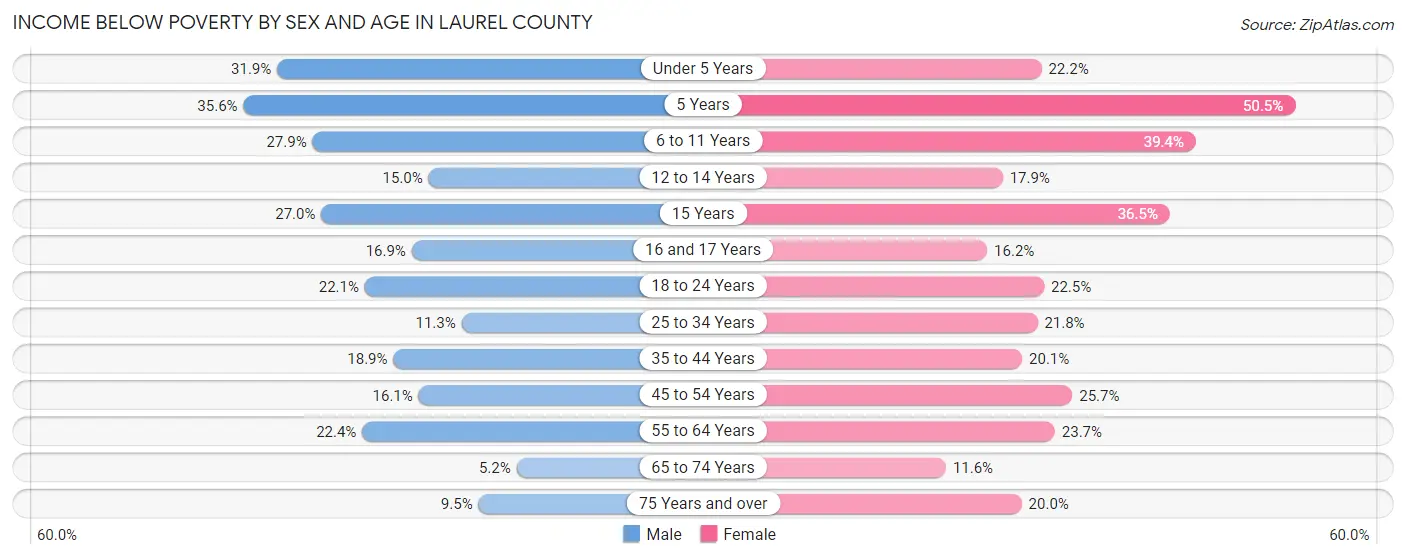
Income Below Poverty by Sex and Age in Laurel County
With 18.2% poverty level for males and 22.9% for females among the residents of Laurel County, 5 year old males and 5 year old females are the most vulnerable to poverty, with 150 males (35.6%) and 210 females (50.5%) in their respective age groups living below the poverty level.
| Age Bracket | Male | Female |
| Under 5 Years | 623 (31.9%) | 385 (22.2%) |
| 5 Years | 150 (35.6%) | 210 (50.5%) |
| 6 to 11 Years | 757 (27.9%) | 976 (39.4%) |
| 12 to 14 Years | 160 (15.0%) | 157 (17.9%) |
| 15 Years | 103 (27.0%) | 103 (36.5%) |
| 16 and 17 Years | 141 (16.9%) | 152 (16.2%) |
| 18 to 24 Years | 565 (22.1%) | 568 (22.5%) |
| 25 to 34 Years | 437 (11.3%) | 861 (21.8%) |
| 35 to 44 Years | 724 (18.9%) | 807 (20.1%) |
| 45 to 54 Years | 682 (16.1%) | 1,042 (25.7%) |
| 55 to 64 Years | 860 (22.4%) | 1,002 (23.7%) |
| 65 to 74 Years | 159 (5.2%) | 378 (11.6%) |
| 75 Years and over | 153 (9.5%) | 453 (20.0%) |
| Total | 5,514 (18.2%) | 7,094 (22.9%) |
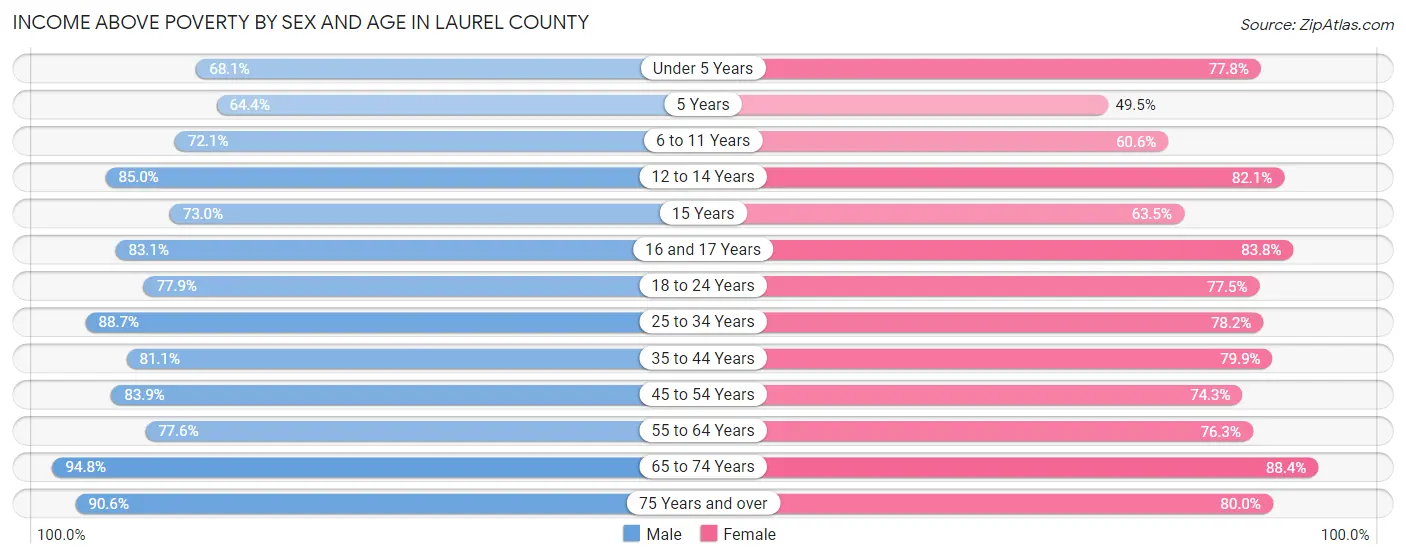
Income Above Poverty by Sex and Age in Laurel County
According to the poverty statistics in Laurel County, males aged 65 to 74 years and females aged 65 to 74 years are the age groups that are most secure financially, with 94.8% of males and 88.4% of females in these age groups living above the poverty line.
| Age Bracket | Male | Female |
| Under 5 Years | 1,331 (68.1%) | 1,346 (77.8%) |
| 5 Years | 271 (64.4%) | 206 (49.5%) |
| 6 to 11 Years | 1,952 (72.1%) | 1,500 (60.6%) |
| 12 to 14 Years | 906 (85.0%) | 719 (82.1%) |
| 15 Years | 279 (73.0%) | 179 (63.5%) |
| 16 and 17 Years | 694 (83.1%) | 787 (83.8%) |
| 18 to 24 Years | 1,990 (77.9%) | 1,954 (77.5%) |
| 25 to 34 Years | 3,417 (88.7%) | 3,090 (78.2%) |
| 35 to 44 Years | 3,100 (81.1%) | 3,212 (79.9%) |
| 45 to 54 Years | 3,548 (83.9%) | 3,018 (74.3%) |
| 55 to 64 Years | 2,979 (77.6%) | 3,220 (76.3%) |
| 65 to 74 Years | 2,894 (94.8%) | 2,881 (88.4%) |
| 75 Years and over | 1,466 (90.5%) | 1,809 (80.0%) |
| Total | 24,827 (81.8%) | 23,921 (77.1%) |
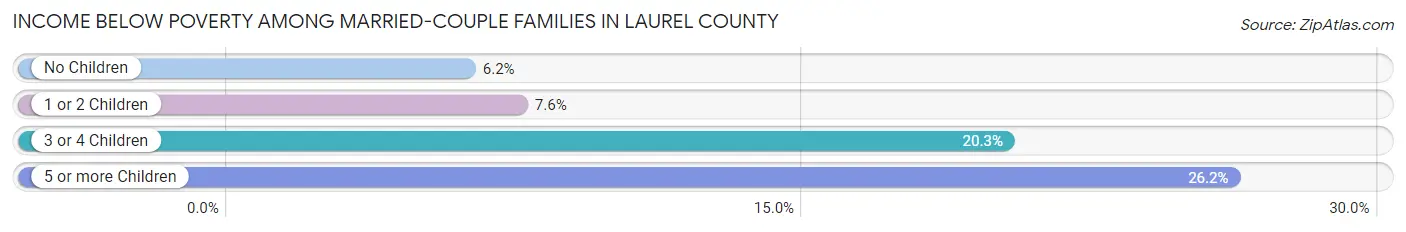
Income Below Poverty Among Married-Couple Families in Laurel County
The poverty statistics for married-couple families in Laurel County show that 7.9% or 1,014 of the total 12,814 families live below the poverty line. Families with 5 or more children have the highest poverty rate of 26.2%, comprising of 28 families. On the other hand, families with no children have the lowest poverty rate of 6.2%, which includes 468 families.
| Children | Above Poverty | Below Poverty |
| No Children | 7,070 (93.8%) | 468 (6.2%) |
| 1 or 2 Children | 3,857 (92.4%) | 316 (7.6%) |
| 3 or 4 Children | 794 (79.7%) | 202 (20.3%) |
| 5 or more Children | 79 (73.8%) | 28 (26.2%) |
| Total | 11,800 (92.1%) | 1,014 (7.9%) |
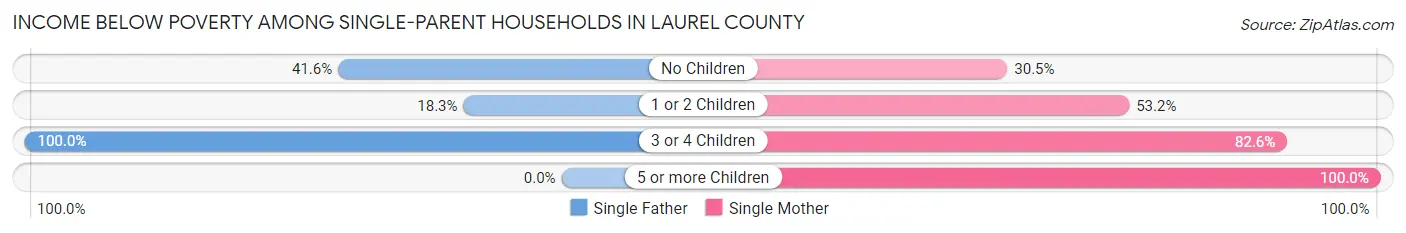
Income Below Poverty Among Single-Parent Households in Laurel County
According to the poverty data in Laurel County, 25.4% or 314 single-father households and 48.8% or 1,422 single-mother households are living below the poverty line. Among single-father households, those with 3 or 4 children have the highest poverty rate, with 12 households (100.0%) experiencing poverty. Likewise, among single-mother households, those with 5 or more children have the highest poverty rate, with 17 households (100.0%) falling below the poverty line.
| Children | Single Father | Single Mother |
| No Children | 139 (41.6%) | 333 (30.5%) |
| 1 or 2 Children | 163 (18.3%) | 759 (53.2%) |
| 3 or 4 Children | 12 (100.0%) | 313 (82.6%) |
| 5 or more Children | 0 (0.0%) | 17 (100.0%) |
| Total | 314 (25.4%) | 1,422 (48.8%) |
Income Below Poverty Among Married-Couple vs Single-Parent Households in Laurel County
The poverty data for Laurel County shows that 1,014 of the married-couple family households (7.9%) and 1,736 of the single-parent households (41.8%) are living below the poverty level. Within the married-couple family households, those with 5 or more children have the highest poverty rate, with 28 households (26.2%) falling below the poverty line. Among the single-parent households, those with 5 or more children have the highest poverty rate, with 17 household (100.0%) living below poverty.
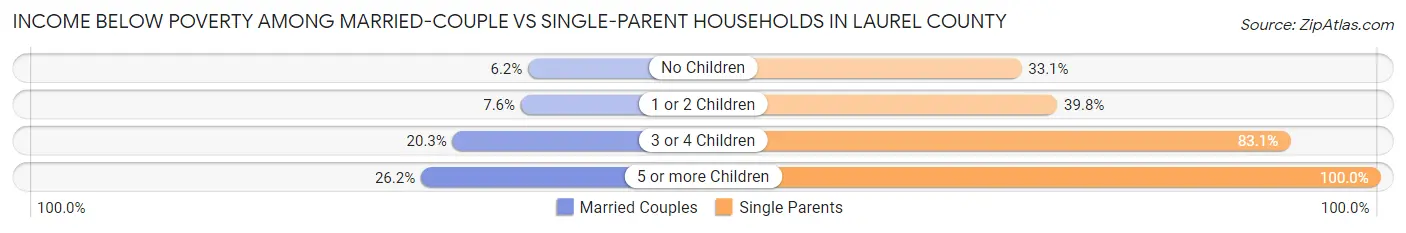
| Children | Married-Couple Families | Single-Parent Households |
| No Children | 468 (6.2%) | 472 (33.1%) |
| 1 or 2 Children | 316 (7.6%) | 922 (39.8%) |
| 3 or 4 Children | 202 (20.3%) | 325 (83.1%) |
| 5 or more Children | 28 (26.2%) | 17 (100.0%) |
| Total | 1,014 (7.9%) | 1,736 (41.8%) |
Employment Characteristics in Laurel County
Employment by Class of Employer in Laurel County
Among the 25,559 employed individuals in Laurel County, private company employees (17,992 | 70.4%), not-for-profit organizations (2,046 | 8.0%), and self-employed (not incorporated) (1,567 | 6.1%) make up the most common classes of employment.
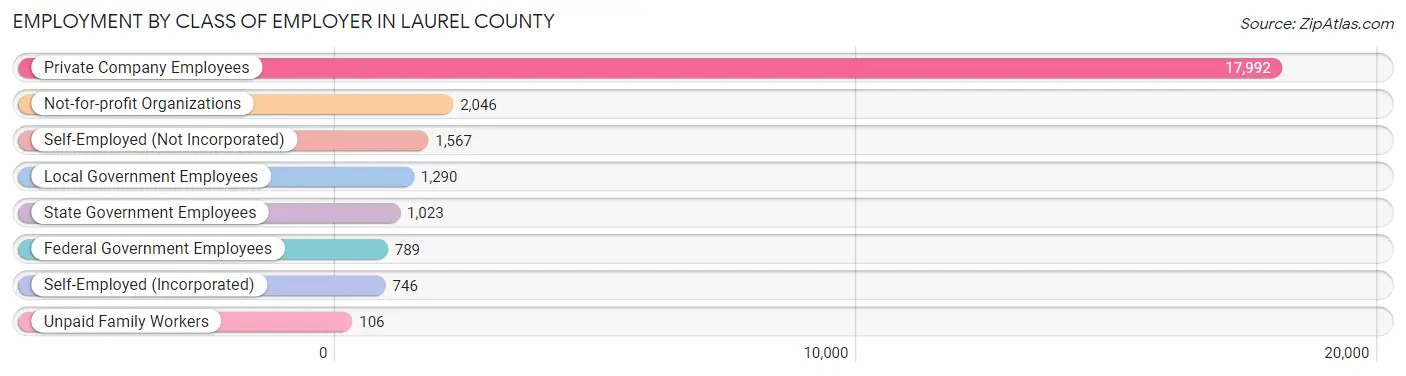
| Employer Class | # Employees | % Employees |
| Private Company Employees | 17,992 | 70.4% |
| Self-Employed (Incorporated) | 746 | 2.9% |
| Self-Employed (Not Incorporated) | 1,567 | 6.1% |
| Not-for-profit Organizations | 2,046 | 8.0% |
| Local Government Employees | 1,290 | 5.1% |
| State Government Employees | 1,023 | 4.0% |
| Federal Government Employees | 789 | 3.1% |
| Unpaid Family Workers | 106 | 0.4% |
| Total | 25,559 | 100.0% |
Employment Status by Age in Laurel County
According to the labor force statistics for Laurel County, out of the total population over 16 years of age (49,979), 53.9% or 26,939 individuals are in the labor force, with 3.6% or 970 of them unemployed. The age group with the highest labor force participation rate is 35 to 44 years, with 74.7% or 6,021 individuals in the labor force. Within the labor force, the 16 to 19 years age range has the highest percentage of unemployed individuals, with 16.6% or 245 of them being unemployed.
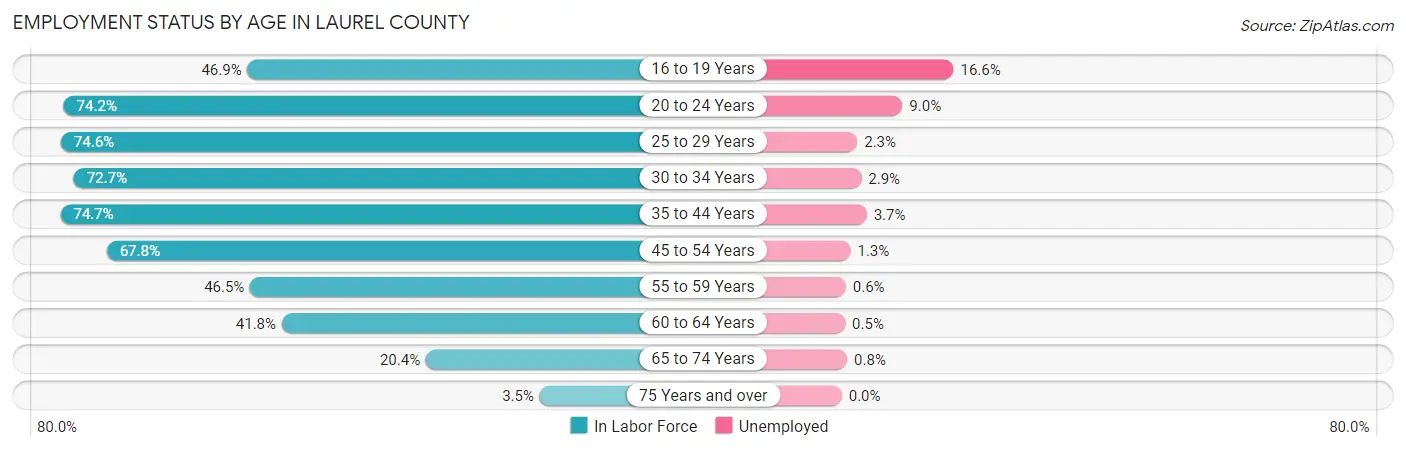
| Age Bracket | In Labor Force | Unemployed |
| 16 to 19 Years | 1,473 (46.9%) | 245 (16.6%) |
| 20 to 24 Years | 2,780 (74.2%) | 250 (9.0%) |
| 25 to 29 Years | 2,959 (74.6%) | 68 (2.3%) |
| 30 to 34 Years | 2,952 (72.7%) | 86 (2.9%) |
| 35 to 44 Years | 6,021 (74.7%) | 223 (3.7%) |
| 45 to 54 Years | 5,697 (67.8%) | 74 (1.3%) |
| 55 to 59 Years | 1,868 (46.5%) | 11 (0.6%) |
| 60 to 64 Years | 1,723 (41.8%) | 9 (0.5%) |
| 65 to 74 Years | 1,307 (20.4%) | 10 (0.8%) |
| 75 Years and over | 142 (3.5%) | 0 (0.0%) |
| Total | 26,939 (53.9%) | 970 (3.6%) |
Employment Status by Educational Attainment in Laurel County
According to labor force statistics for Laurel County, 65.1% of individuals (21,242) out of the total population between 25 and 64 years of age (32,630) are in the labor force, with 2.2% or 467 of them being unemployed. The group with the highest labor force participation rate are those with the educational attainment of bachelor's degree or higher, with 81.8% or 4,559 individuals in the labor force. Within the labor force, individuals with less than high school education have the highest percentage of unemployment, with 4.6% or 91 of them being unemployed.
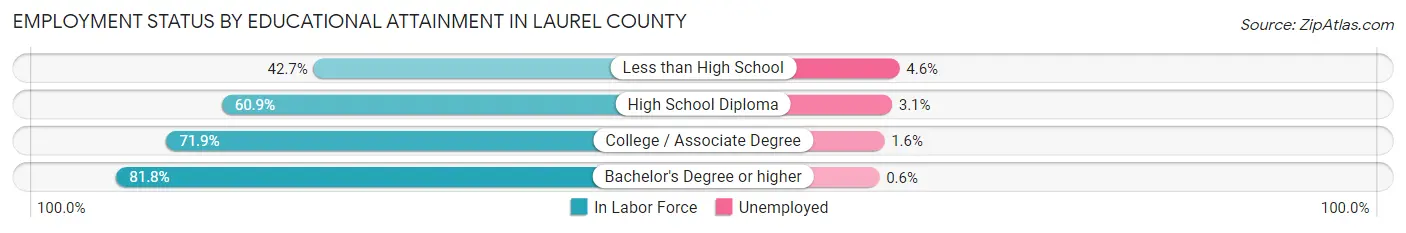
| Educational Attainment | In Labor Force | Unemployed |
| Less than High School | 1,978 (42.7%) | 213 (4.6%) |
| High School Diploma | 7,897 (60.9%) | 402 (3.1%) |
| College / Associate Degree | 6,800 (71.9%) | 151 (1.6%) |
| Bachelor's Degree or higher | 4,559 (81.8%) | 33 (0.6%) |
| Total | 21,242 (65.1%) | 718 (2.2%) |
Employment Occupations by Sex in Laurel County
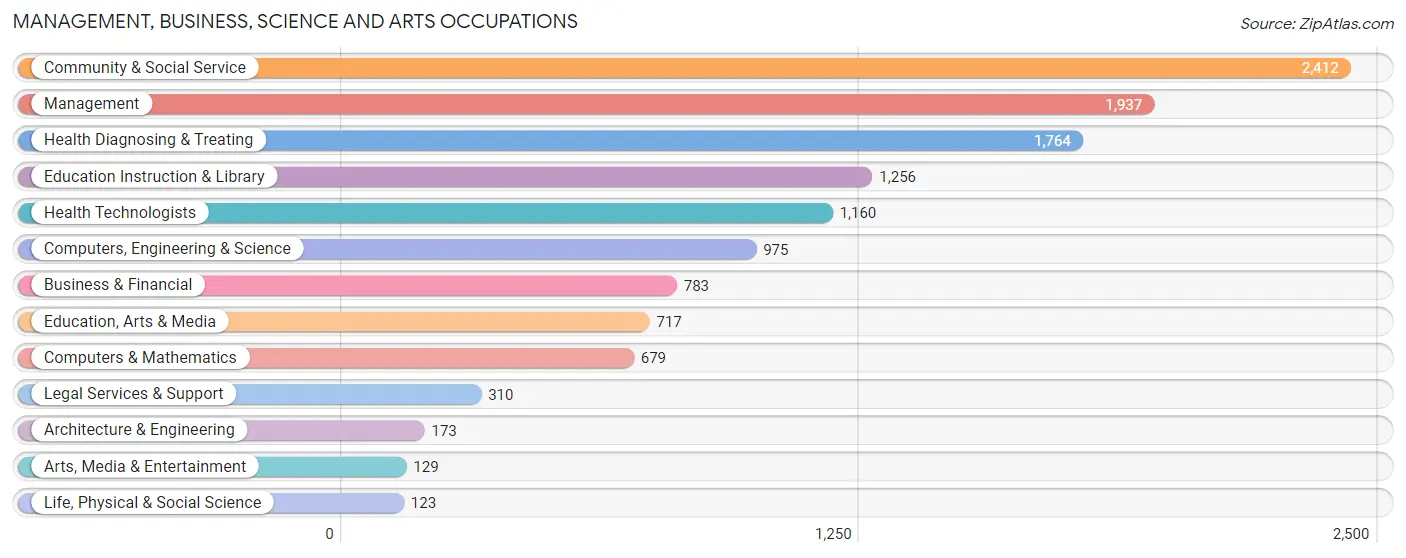
Management, Business, Science and Arts Occupations
The most common Management, Business, Science and Arts occupations in Laurel County are Community & Social Service (2,412 | 9.3%), Management (1,937 | 7.5%), Health Diagnosing & Treating (1,764 | 6.8%), Education Instruction & Library (1,256 | 4.8%), and Health Technologists (1,160 | 4.5%).
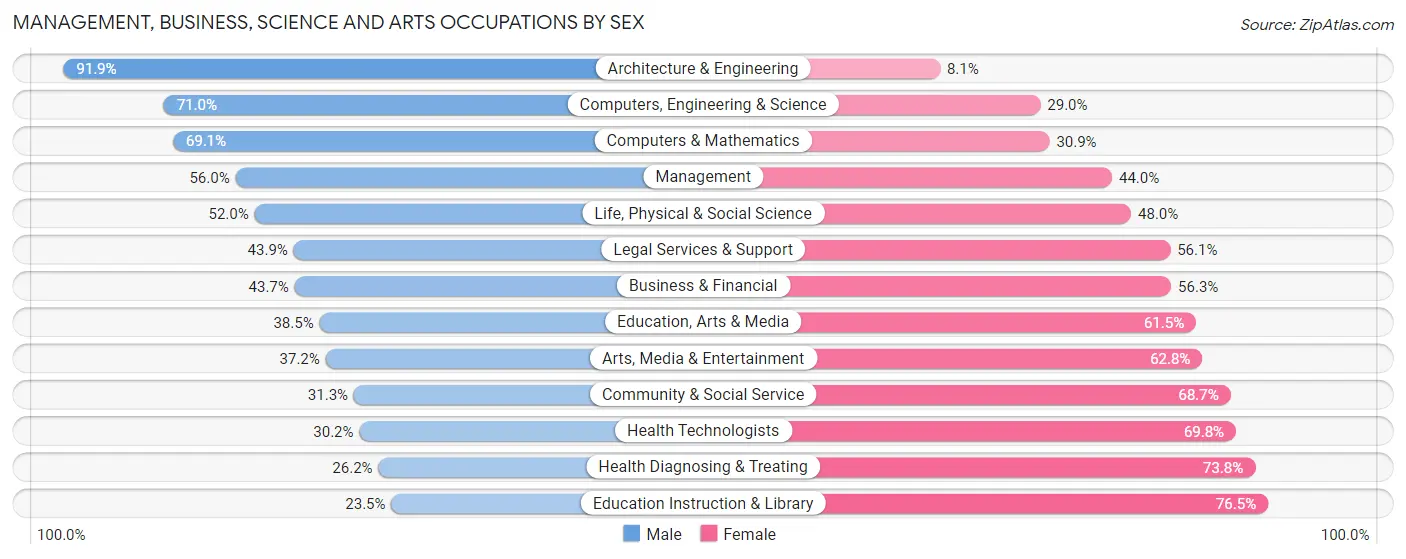
Management, Business, Science and Arts Occupations by Sex
Within the Management, Business, Science and Arts occupations in Laurel County, the most male-oriented occupations are Architecture & Engineering (91.9%), Computers, Engineering & Science (71.0%), and Computers & Mathematics (69.1%), while the most female-oriented occupations are Education Instruction & Library (76.5%), Health Diagnosing & Treating (73.8%), and Health Technologists (69.8%).
| Occupation | Male | Female |
| Management | 1,085 (56.0%) | 852 (44.0%) |
| Business & Financial | 342 (43.7%) | 441 (56.3%) |
| Computers, Engineering & Science | 692 (71.0%) | 283 (29.0%) |
| Computers & Mathematics | 469 (69.1%) | 210 (30.9%) |
| Architecture & Engineering | 159 (91.9%) | 14 (8.1%) |
| Life, Physical & Social Science | 64 (52.0%) | 59 (48.0%) |
| Community & Social Service | 755 (31.3%) | 1,657 (68.7%) |
| Education, Arts & Media | 276 (38.5%) | 441 (61.5%) |
| Legal Services & Support | 136 (43.9%) | 174 (56.1%) |
| Education Instruction & Library | 295 (23.5%) | 961 (76.5%) |
| Arts, Media & Entertainment | 48 (37.2%) | 81 (62.8%) |
| Health Diagnosing & Treating | 462 (26.2%) | 1,302 (73.8%) |
| Health Technologists | 350 (30.2%) | 810 (69.8%) |
| Total (Category) | 3,336 (42.4%) | 4,535 (57.6%) |
| Total (Overall) | 13,923 (53.7%) | 12,026 (46.3%) |
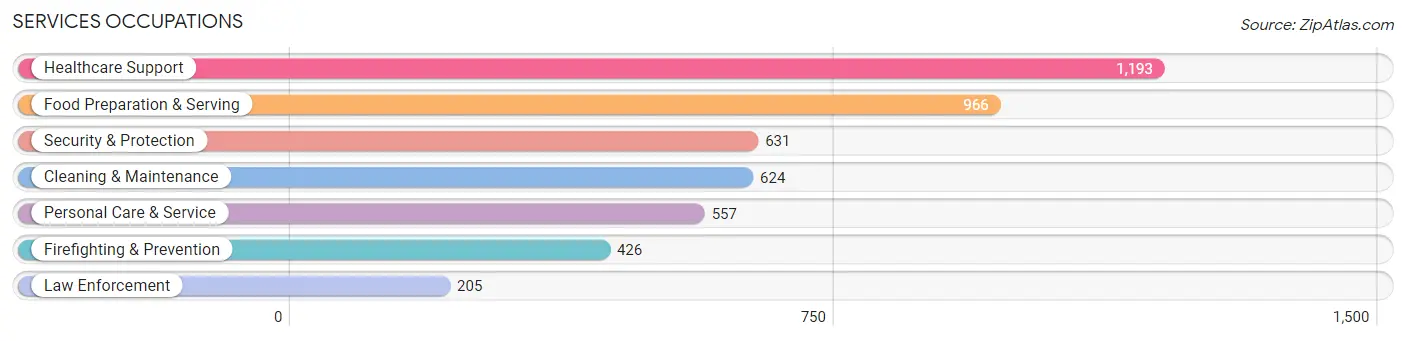
Services Occupations
The most common Services occupations in Laurel County are Healthcare Support (1,193 | 4.6%), Food Preparation & Serving (966 | 3.7%), Security & Protection (631 | 2.4%), Cleaning & Maintenance (624 | 2.4%), and Personal Care & Service (557 | 2.1%).
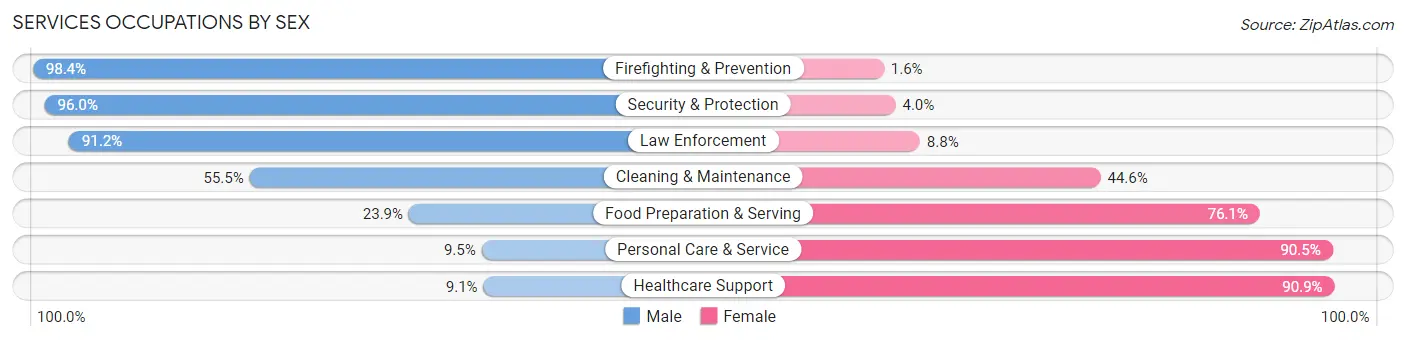
Services Occupations by Sex
Within the Services occupations in Laurel County, the most male-oriented occupations are Firefighting & Prevention (98.4%), Security & Protection (96.0%), and Law Enforcement (91.2%), while the most female-oriented occupations are Healthcare Support (90.9%), Personal Care & Service (90.5%), and Food Preparation & Serving (76.1%).
| Occupation | Male | Female |
| Healthcare Support | 109 (9.1%) | 1,084 (90.9%) |
| Security & Protection | 606 (96.0%) | 25 (4.0%) |
| Firefighting & Prevention | 419 (98.4%) | 7 (1.6%) |
| Law Enforcement | 187 (91.2%) | 18 (8.8%) |
| Food Preparation & Serving | 231 (23.9%) | 735 (76.1%) |
| Cleaning & Maintenance | 346 (55.4%) | 278 (44.6%) |
| Personal Care & Service | 53 (9.5%) | 504 (90.5%) |
| Total (Category) | 1,345 (33.9%) | 2,626 (66.1%) |
| Total (Overall) | 13,923 (53.7%) | 12,026 (46.3%) |
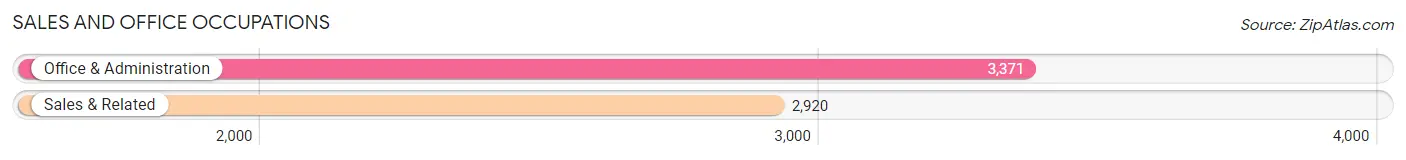
Sales and Office Occupations
The most common Sales and Office occupations in Laurel County are Office & Administration (3,371 | 13.0%), and Sales & Related (2,920 | 11.3%).
Sales and Office Occupations by Sex
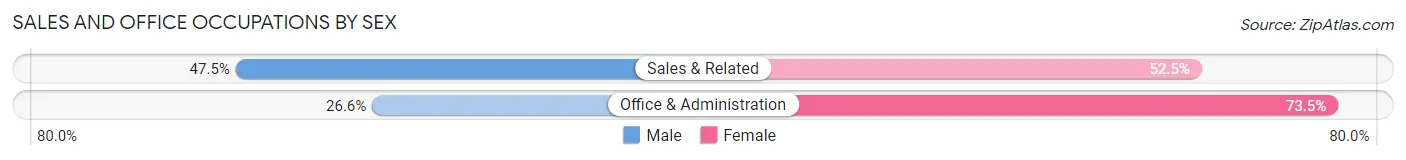
| Occupation | Male | Female |
| Sales & Related | 1,388 (47.5%) | 1,532 (52.5%) |
| Office & Administration | 895 (26.6%) | 2,476 (73.5%) |
| Total (Category) | 2,283 (36.3%) | 4,008 (63.7%) |
| Total (Overall) | 13,923 (53.7%) | 12,026 (46.3%) |
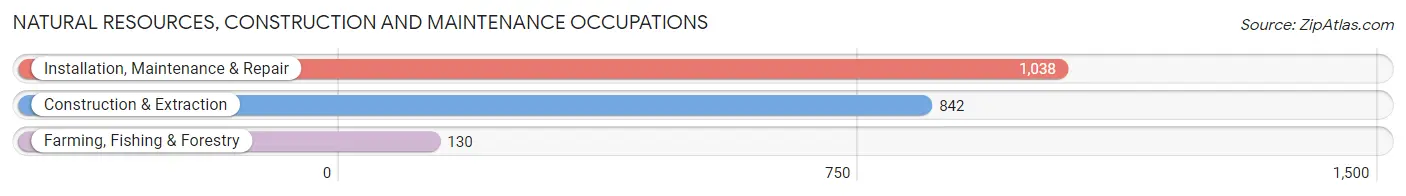
Natural Resources, Construction and Maintenance Occupations
The most common Natural Resources, Construction and Maintenance occupations in Laurel County are Installation, Maintenance & Repair (1,038 | 4.0%), Construction & Extraction (842 | 3.2%), and Farming, Fishing & Forestry (130 | 0.5%).
Natural Resources, Construction and Maintenance Occupations by Sex
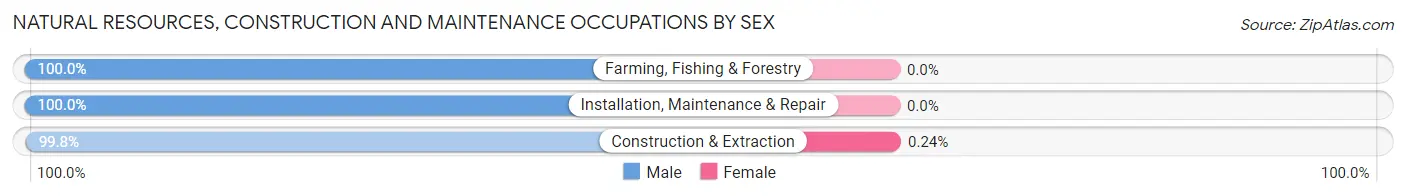
| Occupation | Male | Female |
| Farming, Fishing & Forestry | 130 (100.0%) | 0 (0.0%) |
| Construction & Extraction | 840 (99.8%) | 2 (0.2%) |
| Installation, Maintenance & Repair | 1,038 (100.0%) | 0 (0.0%) |
| Total (Category) | 2,008 (99.9%) | 2 (0.1%) |
| Total (Overall) | 13,923 (53.7%) | 12,026 (46.3%) |
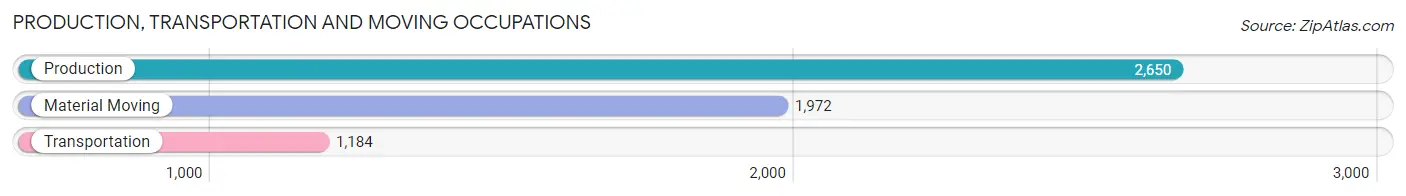
Production, Transportation and Moving Occupations
The most common Production, Transportation and Moving occupations in Laurel County are Production (2,650 | 10.2%), Material Moving (1,972 | 7.6%), and Transportation (1,184 | 4.6%).
Production, Transportation and Moving Occupations by Sex
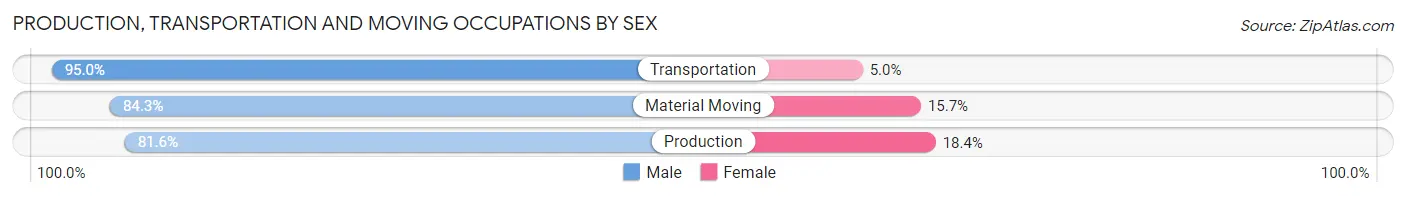
| Occupation | Male | Female |
| Production | 2,163 (81.6%) | 487 (18.4%) |
| Transportation | 1,125 (95.0%) | 59 (5.0%) |
| Material Moving | 1,663 (84.3%) | 309 (15.7%) |
| Total (Category) | 4,951 (85.3%) | 855 (14.7%) |
| Total (Overall) | 13,923 (53.7%) | 12,026 (46.3%) |
Employment Industries by Sex in Laurel County
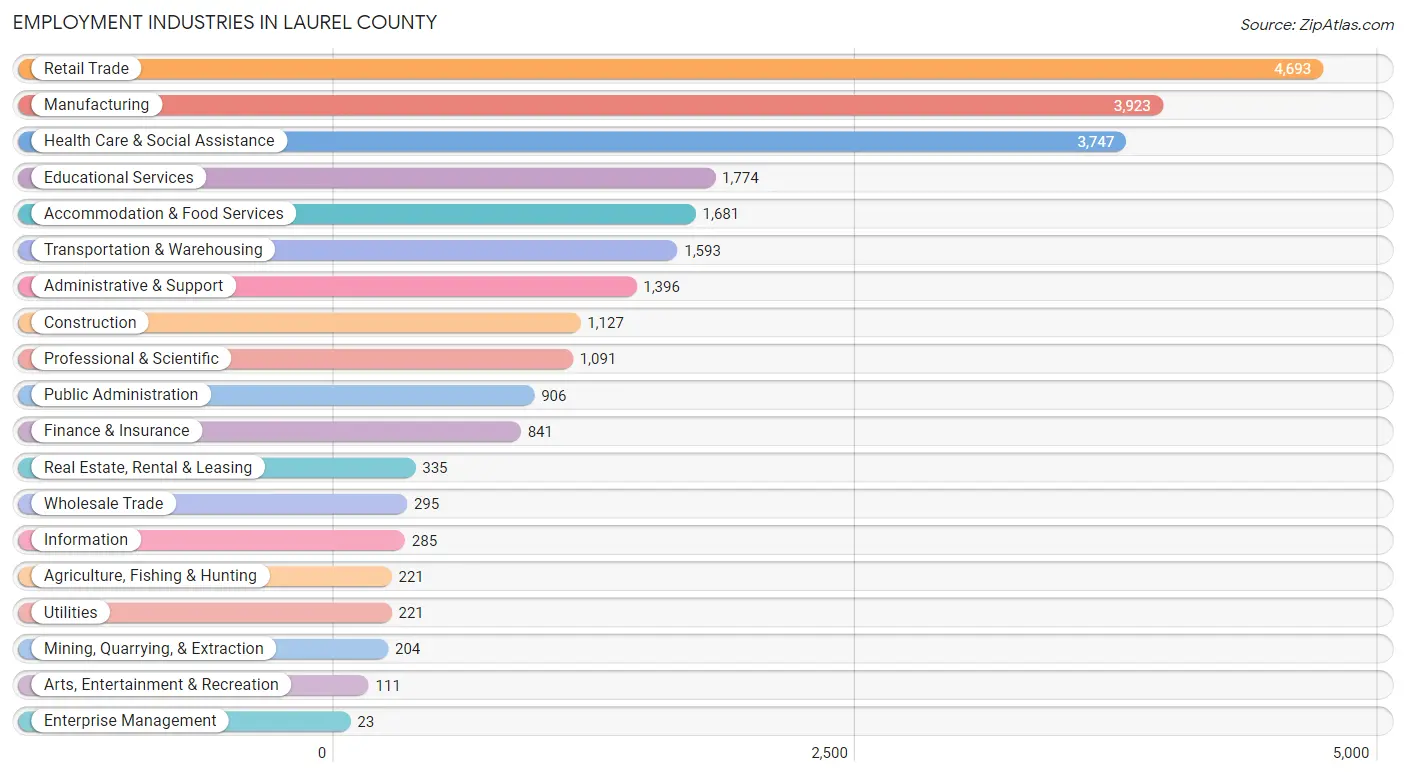
Employment Industries in Laurel County
The major employment industries in Laurel County include Retail Trade (4,693 | 18.1%), Manufacturing (3,923 | 15.1%), Health Care & Social Assistance (3,747 | 14.4%), Educational Services (1,774 | 6.8%), and Accommodation & Food Services (1,681 | 6.5%).
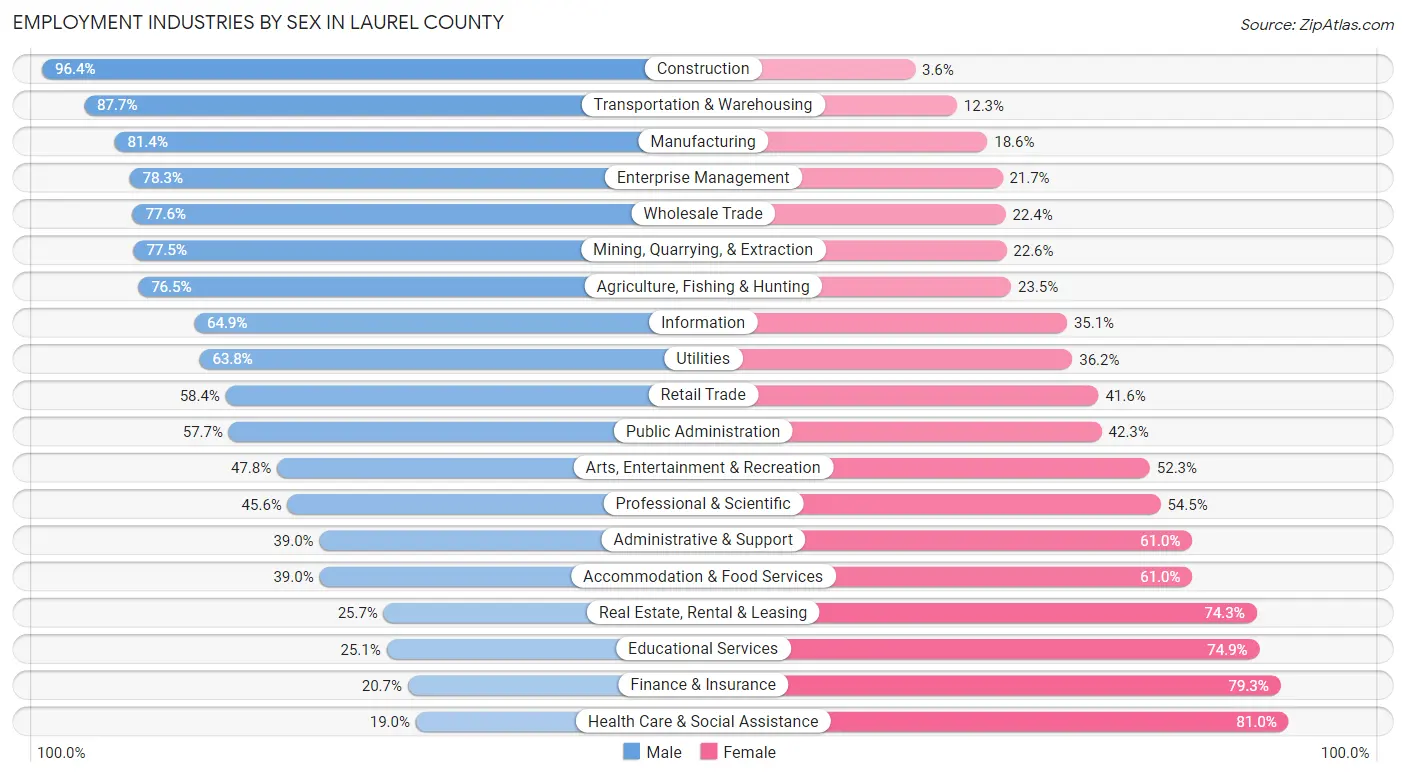
Employment Industries by Sex in Laurel County
The Laurel County industries that see more men than women are Construction (96.4%), Transportation & Warehousing (87.7%), and Manufacturing (81.4%), whereas the industries that tend to have a higher number of women are Health Care & Social Assistance (81.0%), Finance & Insurance (79.3%), and Educational Services (74.9%).
| Industry | Male | Female |
| Agriculture, Fishing & Hunting | 169 (76.5%) | 52 (23.5%) |
| Mining, Quarrying, & Extraction | 158 (77.4%) | 46 (22.6%) |
| Construction | 1,086 (96.4%) | 41 (3.6%) |
| Manufacturing | 3,193 (81.4%) | 730 (18.6%) |
| Wholesale Trade | 229 (77.6%) | 66 (22.4%) |
| Retail Trade | 2,740 (58.4%) | 1,953 (41.6%) |
| Transportation & Warehousing | 1,397 (87.7%) | 196 (12.3%) |
| Utilities | 141 (63.8%) | 80 (36.2%) |
| Information | 185 (64.9%) | 100 (35.1%) |
| Finance & Insurance | 174 (20.7%) | 667 (79.3%) |
| Real Estate, Rental & Leasing | 86 (25.7%) | 249 (74.3%) |
| Professional & Scientific | 497 (45.6%) | 594 (54.4%) |
| Enterprise Management | 18 (78.3%) | 5 (21.7%) |
| Administrative & Support | 544 (39.0%) | 852 (61.0%) |
| Educational Services | 445 (25.1%) | 1,329 (74.9%) |
| Health Care & Social Assistance | 713 (19.0%) | 3,034 (81.0%) |
| Arts, Entertainment & Recreation | 53 (47.7%) | 58 (52.2%) |
| Accommodation & Food Services | 655 (39.0%) | 1,026 (61.0%) |
| Public Administration | 523 (57.7%) | 383 (42.3%) |
| Total | 13,923 (53.7%) | 12,026 (46.3%) |
Education in Laurel County
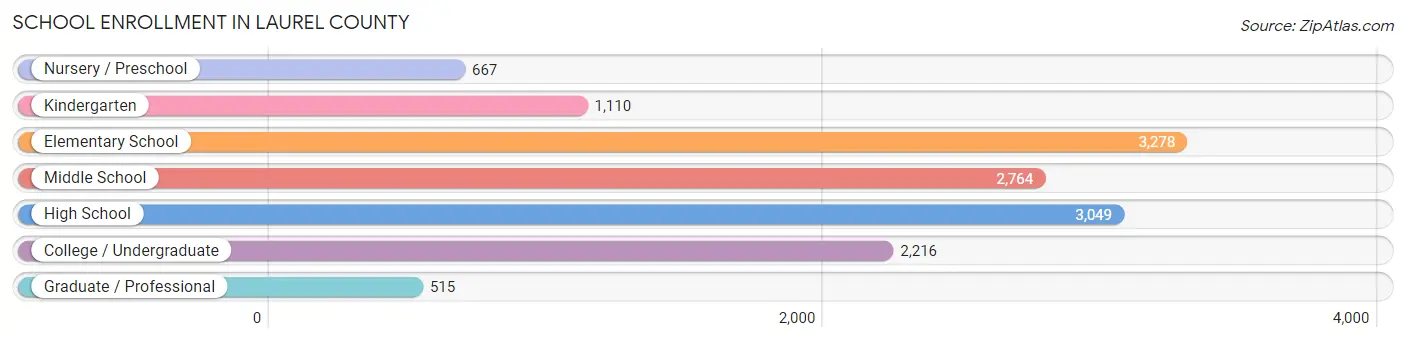
School Enrollment in Laurel County
The most common levels of schooling among the 13,599 students in Laurel County are elementary school (3,278 | 24.1%), high school (3,049 | 22.4%), and middle school (2,764 | 20.3%).
| School Level | # Students | % Students |
| Nursery / Preschool | 667 | 4.9% |
| Kindergarten | 1,110 | 8.2% |
| Elementary School | 3,278 | 24.1% |
| Middle School | 2,764 | 20.3% |
| High School | 3,049 | 22.4% |
| College / Undergraduate | 2,216 | 16.3% |
| Graduate / Professional | 515 | 3.8% |
| Total | 13,599 | 100.0% |
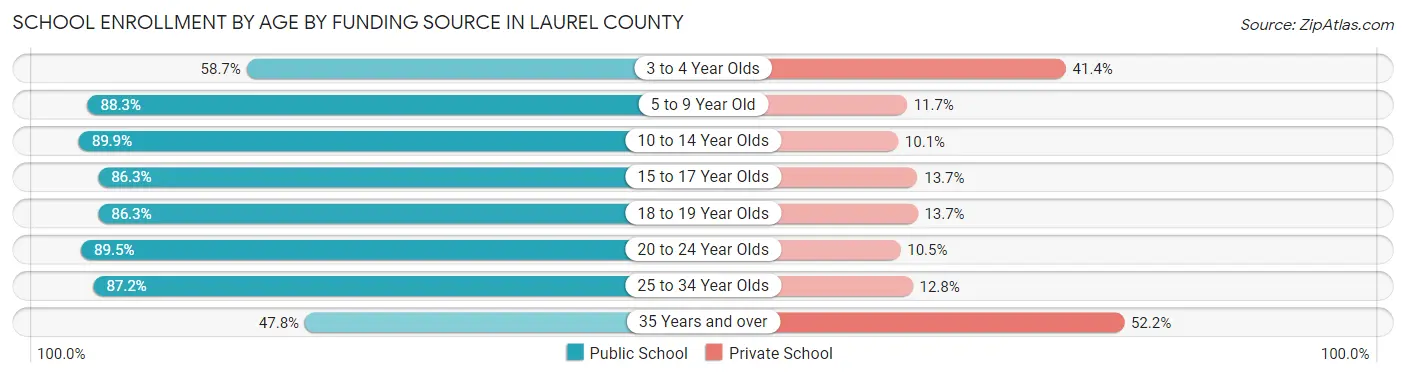
School Enrollment by Age by Funding Source in Laurel County
Out of a total of 13,599 students who are enrolled in schools in Laurel County, 2,081 (15.3%) attend a private institution, while the remaining 11,518 (84.7%) are enrolled in public schools. The age group of 35 years and over has the highest likelihood of being enrolled in private schools, with 413 (52.2% in the age bracket) enrolled. Conversely, the age group of 10 to 14 year olds has the lowest likelihood of being enrolled in a private school, with 3,222 (89.9% in the age bracket) attending a public institution.
| Age Bracket | Public School | Private School |
| 3 to 4 Year Olds | 329 (58.7%) | 232 (41.3%) |
| 5 to 9 Year Old | 3,480 (88.3%) | 463 (11.7%) |
| 10 to 14 Year Olds | 3,222 (89.9%) | 362 (10.1%) |
| 15 to 17 Year Olds | 2,012 (86.3%) | 320 (13.7%) |
| 18 to 19 Year Olds | 659 (86.3%) | 105 (13.7%) |
| 20 to 24 Year Olds | 679 (89.5%) | 80 (10.5%) |
| 25 to 34 Year Olds | 754 (87.2%) | 111 (12.8%) |
| 35 Years and over | 378 (47.8%) | 413 (52.2%) |
| Total | 11,518 (84.7%) | 2,081 (15.3%) |
Educational Attainment by Field of Study in Laurel County
Education (1,629 | 21.5%), business (1,196 | 15.8%), science & technology (968 | 12.8%), arts & humanities (863 | 11.4%), and psychology (559 | 7.4%) are the most common fields of study among 7,584 individuals in Laurel County who have obtained a bachelor's degree or higher.

| Field of Study | # Graduates | % Graduates |
| Computers & Mathematics | 83 | 1.1% |
| Bio, Nature & Agricultural | 486 | 6.4% |
| Physical & Health Sciences | 289 | 3.8% |
| Psychology | 559 | 7.4% |
| Social Sciences | 370 | 4.9% |
| Engineering | 160 | 2.1% |
| Multidisciplinary Studies | 0 | 0.0% |
| Science & Technology | 968 | 12.8% |
| Business | 1,196 | 15.8% |
| Education | 1,629 | 21.5% |
| Literature & Languages | 193 | 2.5% |
| Liberal Arts & History | 464 | 6.1% |
| Visual & Performing Arts | 118 | 1.6% |
| Communications | 206 | 2.7% |
| Arts & Humanities | 863 | 11.4% |
| Total | 7,584 | 100.0% |
Transportation & Commute in Laurel County
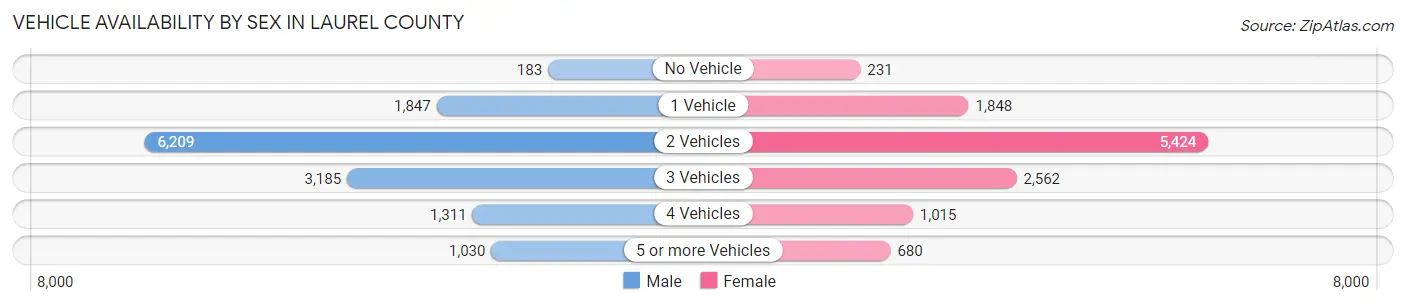
Vehicle Availability by Sex in Laurel County
The most prevalent vehicle ownership categories in Laurel County are males with 2 vehicles (6,209, accounting for 45.1%) and females with 2 vehicles (5,424, making up 52.8%).
| Vehicles Available | Male | Female |
| No Vehicle | 183 (1.3%) | 231 (2.0%) |
| 1 Vehicle | 1,847 (13.4%) | 1,848 (15.7%) |
| 2 Vehicles | 6,209 (45.1%) | 5,424 (46.1%) |
| 3 Vehicles | 3,185 (23.1%) | 2,562 (21.8%) |
| 4 Vehicles | 1,311 (9.5%) | 1,015 (8.6%) |
| 5 or more Vehicles | 1,030 (7.5%) | 680 (5.8%) |
| Total | 13,765 (100.0%) | 11,760 (100.0%) |
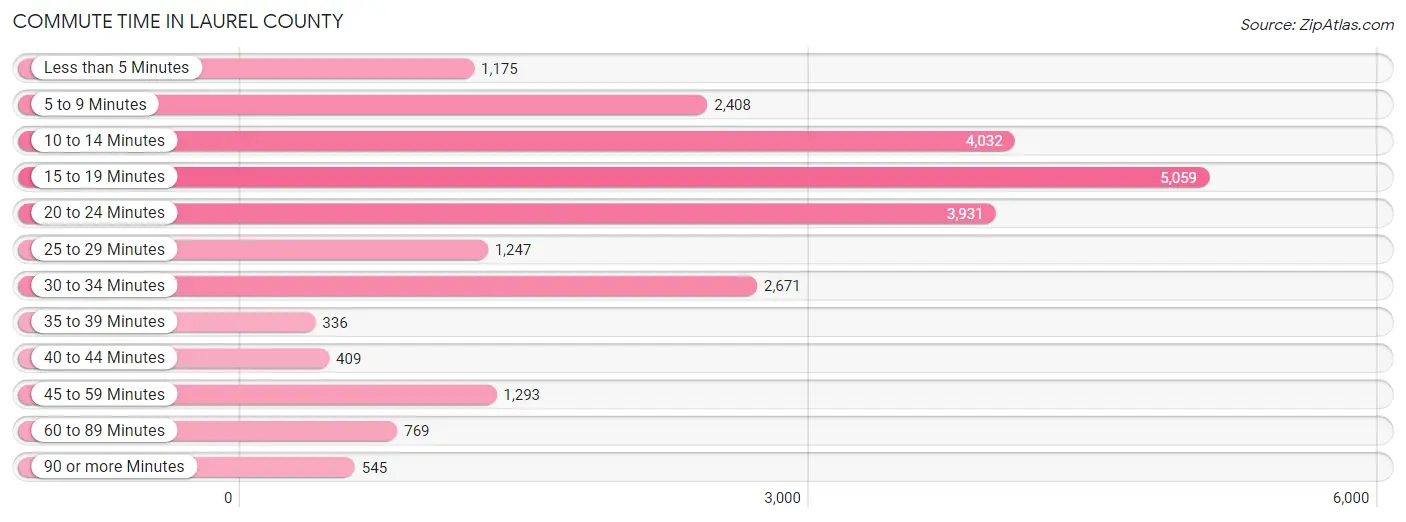
Commute Time in Laurel County
The most frequently occuring commute durations in Laurel County are 15 to 19 minutes (5,059 commuters, 21.2%), 10 to 14 minutes (4,032 commuters, 16.9%), and 20 to 24 minutes (3,931 commuters, 16.5%).
| Commute Time | # Commuters | % Commuters |
| Less than 5 Minutes | 1,175 | 4.9% |
| 5 to 9 Minutes | 2,408 | 10.1% |
| 10 to 14 Minutes | 4,032 | 16.9% |
| 15 to 19 Minutes | 5,059 | 21.2% |
| 20 to 24 Minutes | 3,931 | 16.5% |
| 25 to 29 Minutes | 1,247 | 5.2% |
| 30 to 34 Minutes | 2,671 | 11.2% |
| 35 to 39 Minutes | 336 | 1.4% |
| 40 to 44 Minutes | 409 | 1.7% |
| 45 to 59 Minutes | 1,293 | 5.4% |
| 60 to 89 Minutes | 769 | 3.2% |
| 90 or more Minutes | 545 | 2.3% |
Commute Time by Sex in Laurel County
The most common commute times in Laurel County are 15 to 19 minutes (2,702 commuters, 20.6%) for males and 15 to 19 minutes (2,357 commuters, 21.9%) for females.
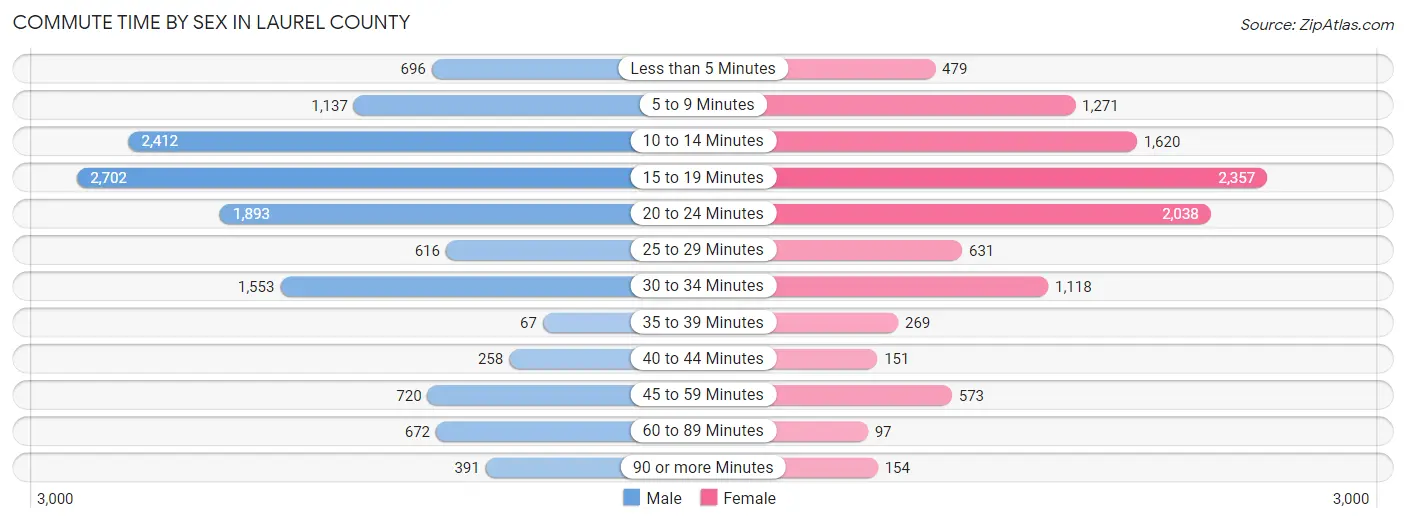
| Commute Time | Male | Female |
| Less than 5 Minutes | 696 (5.3%) | 479 (4.4%) |
| 5 to 9 Minutes | 1,137 (8.7%) | 1,271 (11.8%) |
| 10 to 14 Minutes | 2,412 (18.4%) | 1,620 (15.1%) |
| 15 to 19 Minutes | 2,702 (20.6%) | 2,357 (21.9%) |
| 20 to 24 Minutes | 1,893 (14.4%) | 2,038 (18.9%) |
| 25 to 29 Minutes | 616 (4.7%) | 631 (5.9%) |
| 30 to 34 Minutes | 1,553 (11.8%) | 1,118 (10.4%) |
| 35 to 39 Minutes | 67 (0.5%) | 269 (2.5%) |
| 40 to 44 Minutes | 258 (2.0%) | 151 (1.4%) |
| 45 to 59 Minutes | 720 (5.5%) | 573 (5.3%) |
| 60 to 89 Minutes | 672 (5.1%) | 97 (0.9%) |
| 90 or more Minutes | 391 (3.0%) | 154 (1.4%) |
Time of Departure to Work by Sex in Laurel County
The most frequent times of departure to work in Laurel County are 8:00 AM to 8:29 AM (1,504, 11.5%) for males and 7:00 AM to 7:29 AM (2,064, 19.2%) for females.
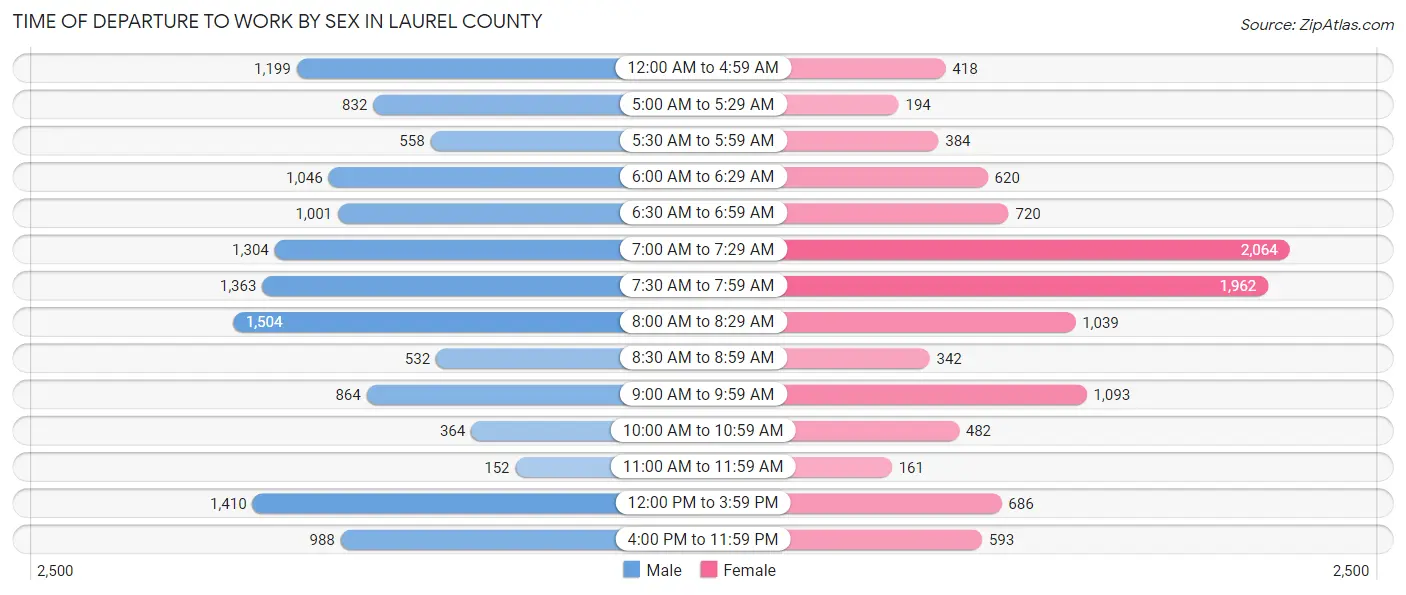
| Time of Departure | Male | Female |
| 12:00 AM to 4:59 AM | 1,199 (9.1%) | 418 (3.9%) |
| 5:00 AM to 5:29 AM | 832 (6.3%) | 194 (1.8%) |
| 5:30 AM to 5:59 AM | 558 (4.3%) | 384 (3.6%) |
| 6:00 AM to 6:29 AM | 1,046 (8.0%) | 620 (5.8%) |
| 6:30 AM to 6:59 AM | 1,001 (7.6%) | 720 (6.7%) |
| 7:00 AM to 7:29 AM | 1,304 (9.9%) | 2,064 (19.2%) |
| 7:30 AM to 7:59 AM | 1,363 (10.4%) | 1,962 (18.2%) |
| 8:00 AM to 8:29 AM | 1,504 (11.5%) | 1,039 (9.7%) |
| 8:30 AM to 8:59 AM | 532 (4.1%) | 342 (3.2%) |
| 9:00 AM to 9:59 AM | 864 (6.6%) | 1,093 (10.2%) |
| 10:00 AM to 10:59 AM | 364 (2.8%) | 482 (4.5%) |
| 11:00 AM to 11:59 AM | 152 (1.2%) | 161 (1.5%) |
| 12:00 PM to 3:59 PM | 1,410 (10.7%) | 686 (6.4%) |
| 4:00 PM to 11:59 PM | 988 (7.5%) | 593 (5.5%) |
| Total | 13,117 (100.0%) | 10,758 (100.0%) |
Housing Occupancy in Laurel County
Occupancy by Ownership in Laurel County
Of the total 23,424 dwellings in Laurel County, owner-occupied units account for 16,678 (71.2%), while renter-occupied units make up 6,746 (28.8%).
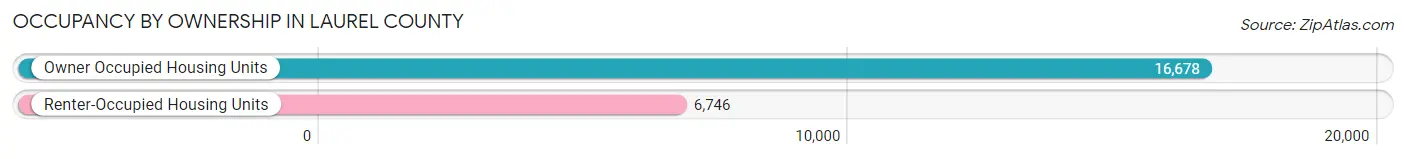
| Occupancy | # Housing Units | % Housing Units |
| Owner Occupied Housing Units | 16,678 | 71.2% |
| Renter-Occupied Housing Units | 6,746 | 28.8% |
| Total Occupied Housing Units | 23,424 | 100.0% |
Occupancy by Household Size in Laurel County
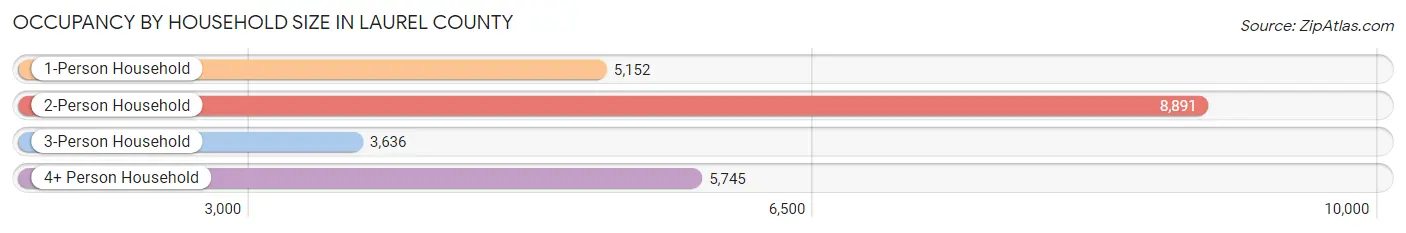
| Household Size | # Housing Units | % Housing Units |
| 1-Person Household | 5,152 | 22.0% |
| 2-Person Household | 8,891 | 38.0% |
| 3-Person Household | 3,636 | 15.5% |
| 4+ Person Household | 5,745 | 24.5% |
| Total Housing Units | 23,424 | 100.0% |
Occupancy by Ownership by Household Size in Laurel County
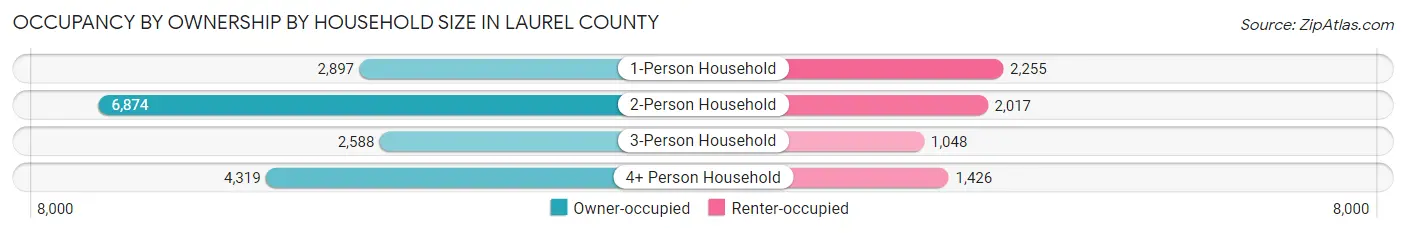
| Household Size | Owner-occupied | Renter-occupied |
| 1-Person Household | 2,897 (56.2%) | 2,255 (43.8%) |
| 2-Person Household | 6,874 (77.3%) | 2,017 (22.7%) |
| 3-Person Household | 2,588 (71.2%) | 1,048 (28.8%) |
| 4+ Person Household | 4,319 (75.2%) | 1,426 (24.8%) |
| Total Housing Units | 16,678 (71.2%) | 6,746 (28.8%) |
Occupancy by Educational Attainment in Laurel County
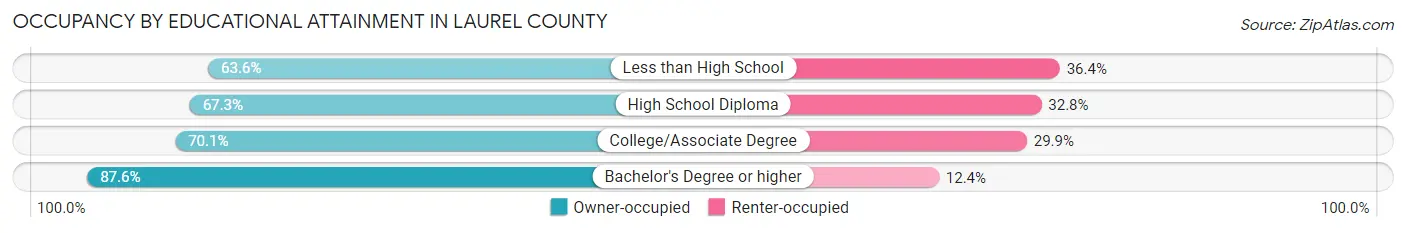
| Household Size | Owner-occupied | Renter-occupied |
| Less than High School | 2,098 (63.6%) | 1,200 (36.4%) |
| High School Diploma | 6,207 (67.2%) | 3,023 (32.8%) |
| College/Associate Degree | 4,697 (70.1%) | 2,001 (29.9%) |
| Bachelor's Degree or higher | 3,676 (87.6%) | 522 (12.4%) |
Occupancy by Age of Householder in Laurel County
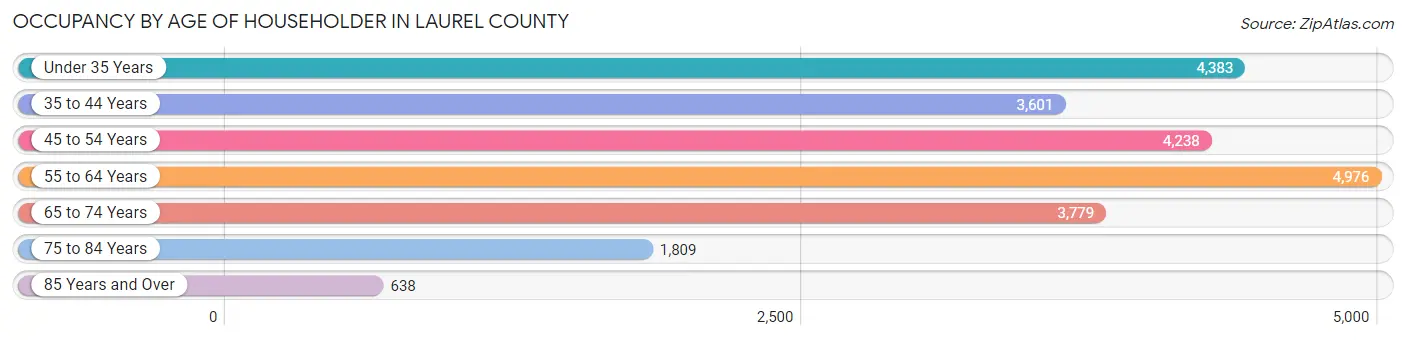
| Age Bracket | # Households | % Households |
| Under 35 Years | 4,383 | 18.7% |
| 35 to 44 Years | 3,601 | 15.4% |
| 45 to 54 Years | 4,238 | 18.1% |
| 55 to 64 Years | 4,976 | 21.2% |
| 65 to 74 Years | 3,779 | 16.1% |
| 75 to 84 Years | 1,809 | 7.7% |
| 85 Years and Over | 638 | 2.7% |
| Total | 23,424 | 100.0% |
Housing Finances in Laurel County
Median Income by Occupancy in Laurel County
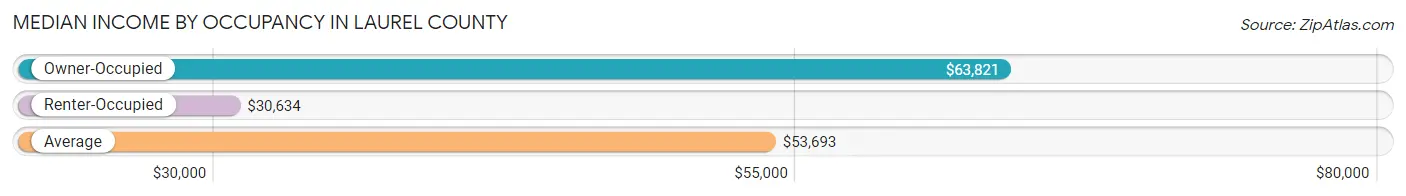
| Occupancy Type | # Households | Median Income |
| Owner-Occupied | 16,678 (71.2%) | $63,821 |
| Renter-Occupied | 6,746 (28.8%) | $30,634 |
| Average | 23,424 (100.0%) | $53,693 |
Occupancy by Householder Income Bracket in Laurel County
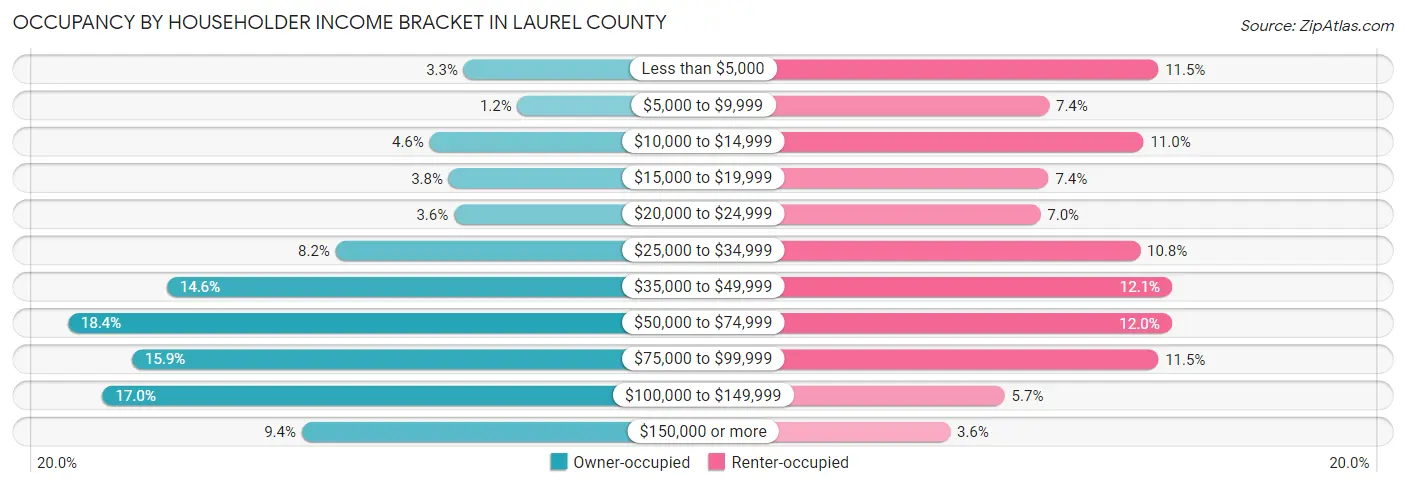
| Income Bracket | Owner-occupied | Renter-occupied |
| Less than $5,000 | 545 (3.3%) | 778 (11.5%) |
| $5,000 to $9,999 | 203 (1.2%) | 497 (7.4%) |
| $10,000 to $14,999 | 762 (4.6%) | 740 (11.0%) |
| $15,000 to $19,999 | 641 (3.8%) | 496 (7.3%) |
| $20,000 to $24,999 | 607 (3.6%) | 475 (7.0%) |
| $25,000 to $34,999 | 1,359 (8.2%) | 731 (10.8%) |
| $35,000 to $49,999 | 2,431 (14.6%) | 813 (12.0%) |
| $50,000 to $74,999 | 3,061 (18.3%) | 812 (12.0%) |
| $75,000 to $99,999 | 2,653 (15.9%) | 778 (11.5%) |
| $100,000 to $149,999 | 2,841 (17.0%) | 383 (5.7%) |
| $150,000 or more | 1,575 (9.4%) | 243 (3.6%) |
| Total | 16,678 (100.0%) | 6,746 (100.0%) |
Monthly Housing Cost Tiers in Laurel County
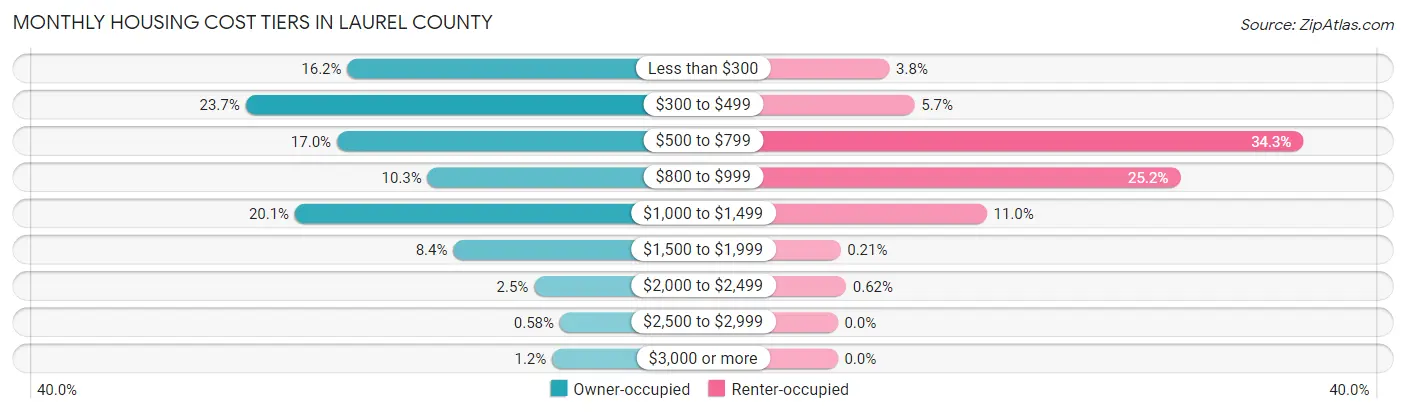
| Monthly Cost | Owner-occupied | Renter-occupied |
| Less than $300 | 2,707 (16.2%) | 257 (3.8%) |
| $300 to $499 | 3,958 (23.7%) | 382 (5.7%) |
| $500 to $799 | 2,835 (17.0%) | 2,314 (34.3%) |
| $800 to $999 | 1,722 (10.3%) | 1,703 (25.2%) |
| $1,000 to $1,499 | 3,350 (20.1%) | 741 (11.0%) |
| $1,500 to $1,999 | 1,406 (8.4%) | 14 (0.2%) |
| $2,000 to $2,499 | 412 (2.5%) | 42 (0.6%) |
| $2,500 to $2,999 | 96 (0.6%) | 0 (0.0%) |
| $3,000 or more | 192 (1.1%) | 0 (0.0%) |
| Total | 16,678 (100.0%) | 6,746 (100.0%) |
Physical Housing Characteristics in Laurel County
Housing Structures in Laurel County
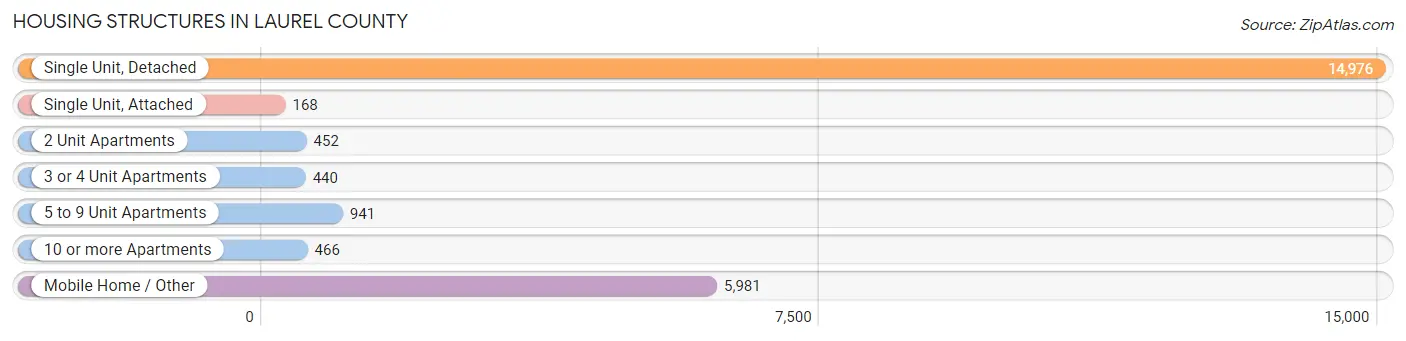
| Structure Type | # Housing Units | % Housing Units |
| Single Unit, Detached | 14,976 | 63.9% |
| Single Unit, Attached | 168 | 0.7% |
| 2 Unit Apartments | 452 | 1.9% |
| 3 or 4 Unit Apartments | 440 | 1.9% |
| 5 to 9 Unit Apartments | 941 | 4.0% |
| 10 or more Apartments | 466 | 2.0% |
| Mobile Home / Other | 5,981 | 25.5% |
| Total | 23,424 | 100.0% |
Housing Structures by Occupancy in Laurel County
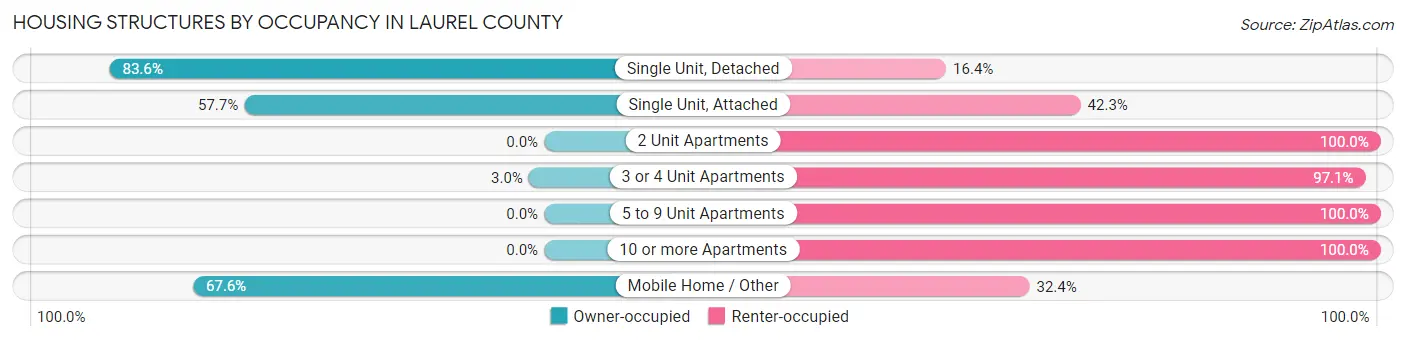
| Structure Type | Owner-occupied | Renter-occupied |
| Single Unit, Detached | 12,526 (83.6%) | 2,450 (16.4%) |
| Single Unit, Attached | 97 (57.7%) | 71 (42.3%) |
| 2 Unit Apartments | 0 (0.0%) | 452 (100.0%) |
| 3 or 4 Unit Apartments | 13 (2.9%) | 427 (97.1%) |
| 5 to 9 Unit Apartments | 0 (0.0%) | 941 (100.0%) |
| 10 or more Apartments | 0 (0.0%) | 466 (100.0%) |
| Mobile Home / Other | 4,042 (67.6%) | 1,939 (32.4%) |
| Total | 16,678 (71.2%) | 6,746 (28.8%) |
Housing Structures by Number of Rooms in Laurel County
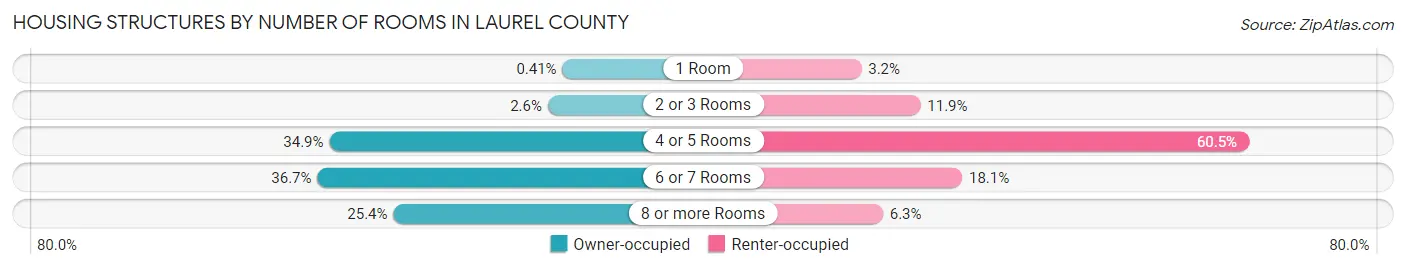
| Number of Rooms | Owner-occupied | Renter-occupied |
| 1 Room | 69 (0.4%) | 213 (3.2%) |
| 2 or 3 Rooms | 430 (2.6%) | 803 (11.9%) |
| 4 or 5 Rooms | 5,821 (34.9%) | 4,083 (60.5%) |
| 6 or 7 Rooms | 6,117 (36.7%) | 1,219 (18.1%) |
| 8 or more Rooms | 4,241 (25.4%) | 428 (6.3%) |
| Total | 16,678 (100.0%) | 6,746 (100.0%) |
Housing Structure by Heating Type in Laurel County
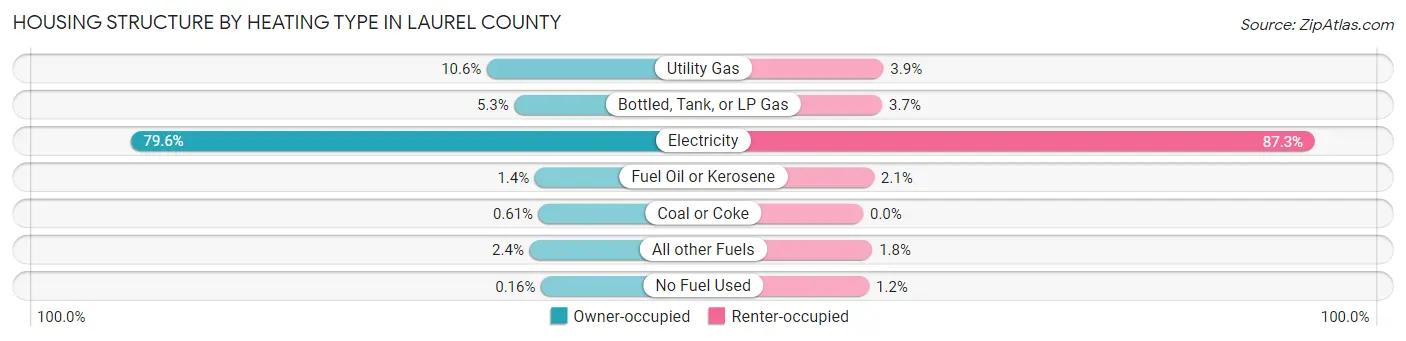
| Heating Type | Owner-occupied | Renter-occupied |
| Utility Gas | 1,770 (10.6%) | 266 (3.9%) |
| Bottled, Tank, or LP Gas | 888 (5.3%) | 249 (3.7%) |
| Electricity | 13,268 (79.5%) | 5,890 (87.3%) |
| Fuel Oil or Kerosene | 227 (1.4%) | 142 (2.1%) |
| Coal or Coke | 101 (0.6%) | 0 (0.0%) |
| All other Fuels | 398 (2.4%) | 120 (1.8%) |
| No Fuel Used | 26 (0.2%) | 79 (1.2%) |
| Total | 16,678 (100.0%) | 6,746 (100.0%) |
Household Vehicle Usage in Laurel County
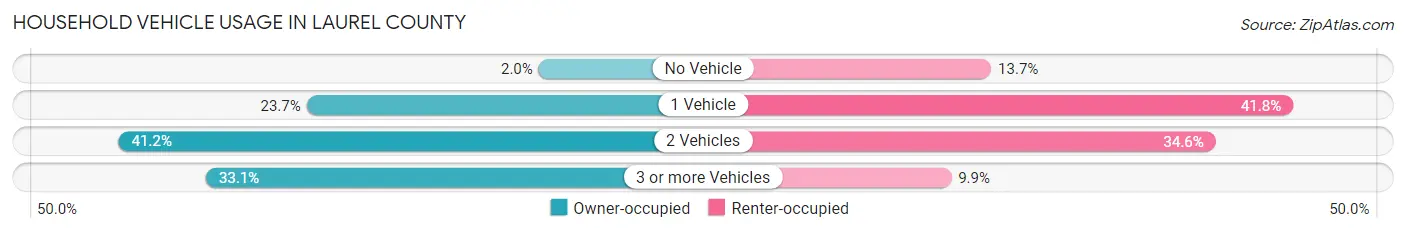
| Vehicles per Household | Owner-occupied | Renter-occupied |
| No Vehicle | 337 (2.0%) | 921 (13.7%) |
| 1 Vehicle | 3,949 (23.7%) | 2,822 (41.8%) |
| 2 Vehicles | 6,877 (41.2%) | 2,334 (34.6%) |
| 3 or more Vehicles | 5,515 (33.1%) | 669 (9.9%) |
| Total | 16,678 (100.0%) | 6,746 (100.0%) |
Real Estate & Mortgages in Laurel County
Real Estate and Mortgage Overview in Laurel County
| Characteristic | Without Mortgage | With Mortgage |
| Housing Units | 8,429 | 8,249 |
| Median Property Value | $119,100 | $155,300 |
| Median Household Income | $47,490 | $971 |
| Monthly Housing Costs | $352 | $192 |
| Real Estate Taxes | $604 | $594 |
Property Value by Mortgage Status in Laurel County
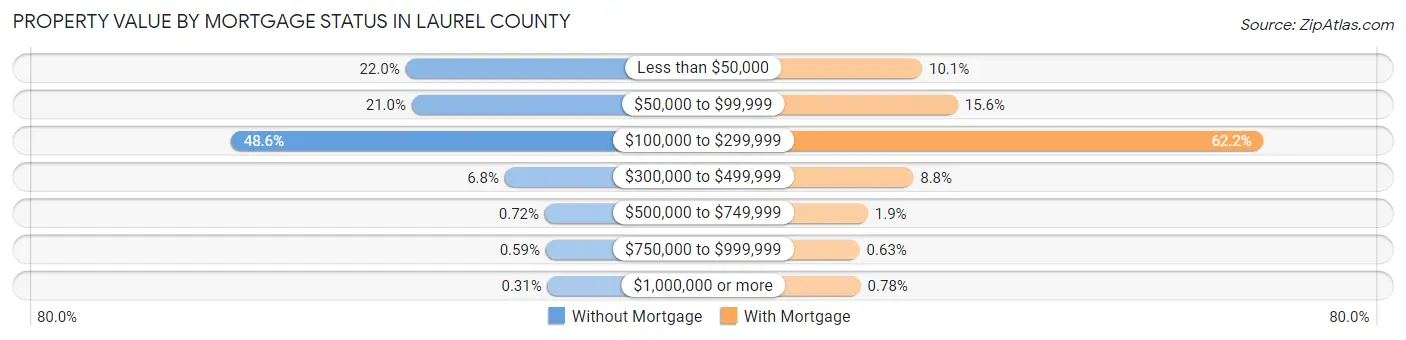
| Property Value | Without Mortgage | With Mortgage |
| Less than $50,000 | 1,851 (22.0%) | 836 (10.1%) |
| $50,000 to $99,999 | 1,770 (21.0%) | 1,286 (15.6%) |
| $100,000 to $299,999 | 4,095 (48.6%) | 5,130 (62.2%) |
| $300,000 to $499,999 | 576 (6.8%) | 726 (8.8%) |
| $500,000 to $749,999 | 61 (0.7%) | 155 (1.9%) |
| $750,000 to $999,999 | 50 (0.6%) | 52 (0.6%) |
| $1,000,000 or more | 26 (0.3%) | 64 (0.8%) |
| Total | 8,429 (100.0%) | 8,249 (100.0%) |
Household Income by Mortgage Status in Laurel County
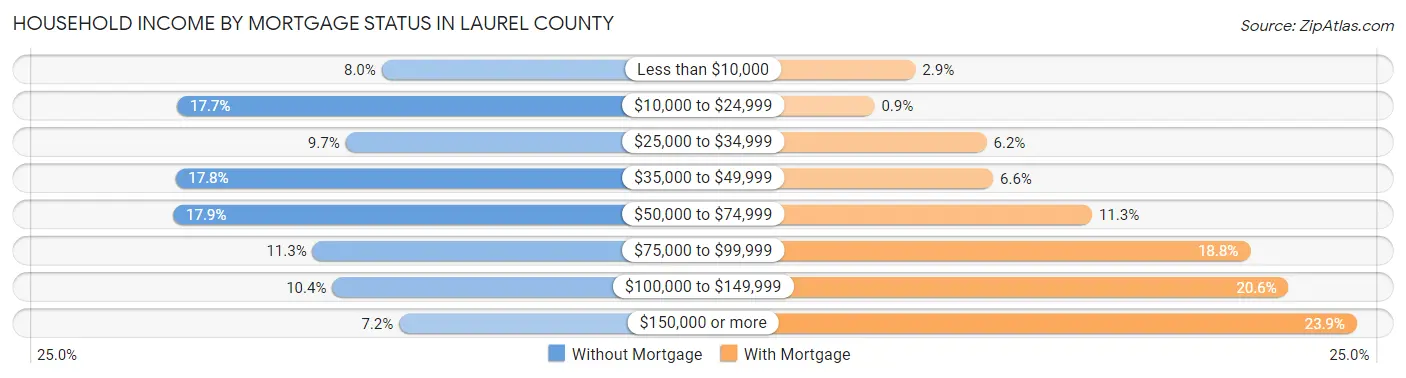
| Household Income | Without Mortgage | With Mortgage |
| Less than $10,000 | 674 (8.0%) | 235 (2.9%) |
| $10,000 to $24,999 | 1,495 (17.7%) | 74 (0.9%) |
| $25,000 to $34,999 | 819 (9.7%) | 515 (6.2%) |
| $35,000 to $49,999 | 1,502 (17.8%) | 540 (6.6%) |
| $50,000 to $74,999 | 1,511 (17.9%) | 929 (11.3%) |
| $75,000 to $99,999 | 952 (11.3%) | 1,550 (18.8%) |
| $100,000 to $149,999 | 872 (10.3%) | 1,701 (20.6%) |
| $150,000 or more | 604 (7.2%) | 1,969 (23.9%) |
| Total | 8,429 (100.0%) | 8,249 (100.0%) |
Property Value to Household Income Ratio in Laurel County
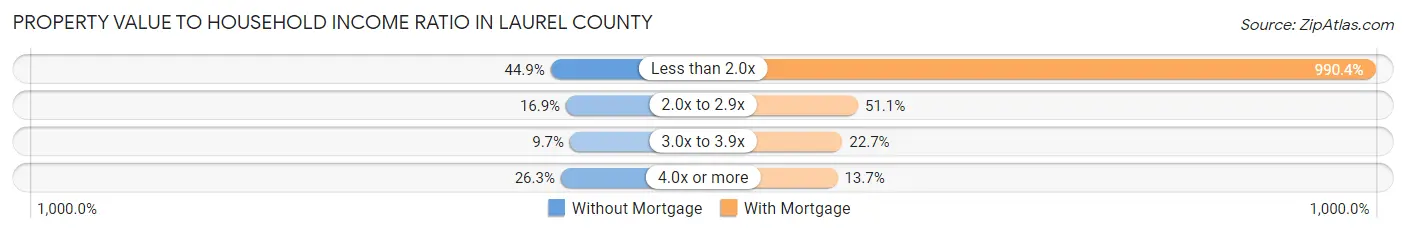
| Value-to-Income Ratio | Without Mortgage | With Mortgage |
| Less than 2.0x | 3,785 (44.9%) | 81,696 (990.4%) |
| 2.0x to 2.9x | 1,421 (16.9%) | 4,214 (51.1%) |
| 3.0x to 3.9x | 820 (9.7%) | 1,872 (22.7%) |
| 4.0x or more | 2,220 (26.3%) | 1,130 (13.7%) |
| Total | 8,429 (100.0%) | 8,249 (100.0%) |
Real Estate Taxes by Mortgage Status in Laurel County
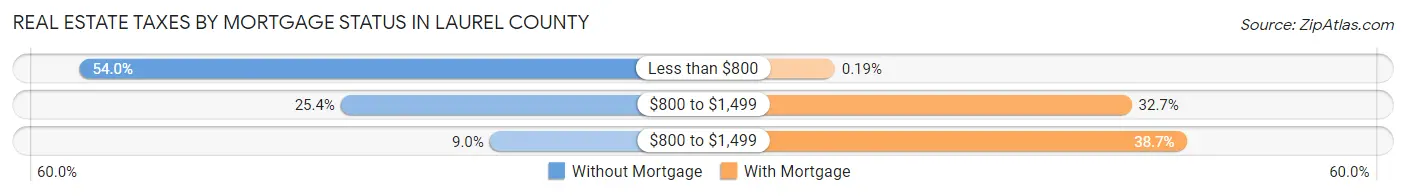
| Property Taxes | Without Mortgage | With Mortgage |
| Less than $800 | 4,548 (54.0%) | 16 (0.2%) |
| $800 to $1,499 | 2,138 (25.4%) | 2,699 (32.7%) |
| $800 to $1,499 | 762 (9.0%) | 3,194 (38.7%) |
| Total | 8,429 (100.0%) | 8,249 (100.0%) |
Health & Disability in Laurel County
Health Insurance Coverage by Age in Laurel County
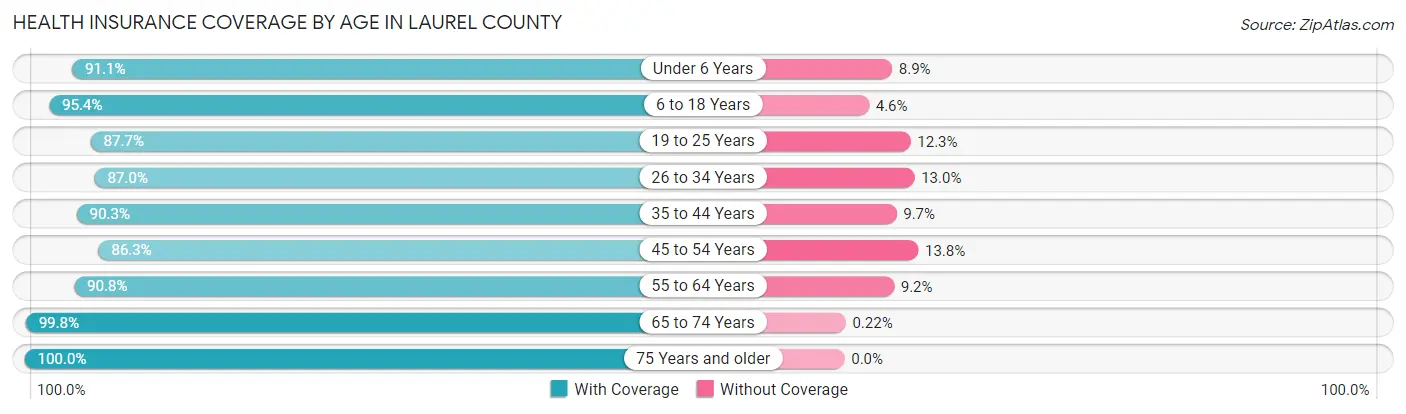
| Age Bracket | With Coverage | Without Coverage |
| Under 6 Years | 4,170 (91.1%) | 406 (8.9%) |
| 6 to 18 Years | 10,051 (95.4%) | 481 (4.6%) |
| 19 to 25 Years | 4,483 (87.7%) | 630 (12.3%) |
| 26 to 34 Years | 6,007 (87.0%) | 901 (13.0%) |
| 35 to 44 Years | 7,083 (90.3%) | 760 (9.7%) |
| 45 to 54 Years | 7,150 (86.3%) | 1,140 (13.8%) |
| 55 to 64 Years | 7,317 (90.8%) | 744 (9.2%) |
| 65 to 74 Years | 6,298 (99.8%) | 14 (0.2%) |
| 75 Years and older | 3,881 (100.0%) | 0 (0.0%) |
| Total | 56,440 (91.7%) | 5,076 (8.3%) |
Health Insurance Coverage by Citizenship Status in Laurel County
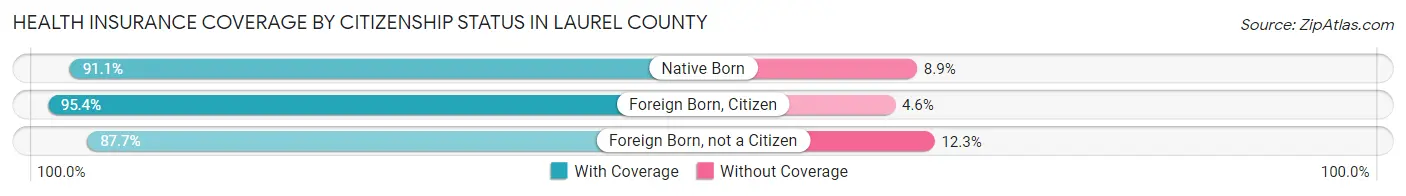
| Citizenship Status | With Coverage | Without Coverage |
| Native Born | 4,170 (91.1%) | 406 (8.9%) |
| Foreign Born, Citizen | 10,051 (95.4%) | 481 (4.6%) |
| Foreign Born, not a Citizen | 4,483 (87.7%) | 630 (12.3%) |
Health Insurance Coverage by Household Income in Laurel County
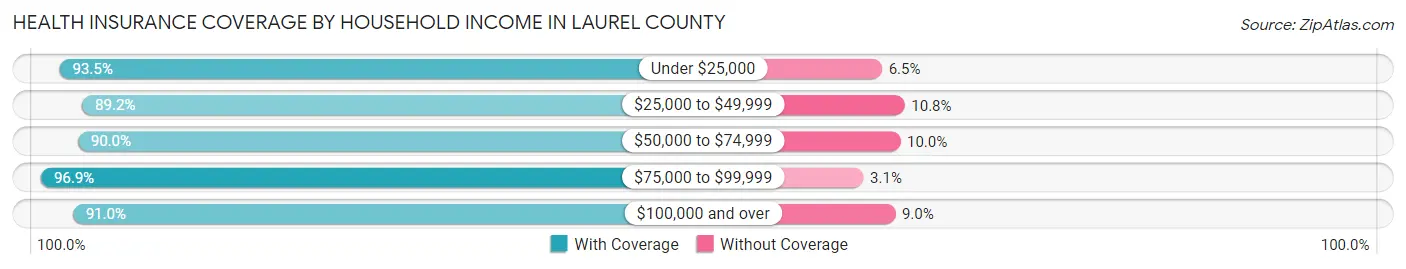
| Household Income | With Coverage | Without Coverage |
| Under $25,000 | 10,383 (93.5%) | 726 (6.5%) |
| $25,000 to $49,999 | 12,149 (89.2%) | 1,469 (10.8%) |
| $50,000 to $74,999 | 9,572 (90.0%) | 1,060 (10.0%) |
| $75,000 to $99,999 | 8,882 (96.9%) | 281 (3.1%) |
| $100,000 and over | 15,306 (91.0%) | 1,517 (9.0%) |
Public vs Private Health Insurance Coverage by Age in Laurel County
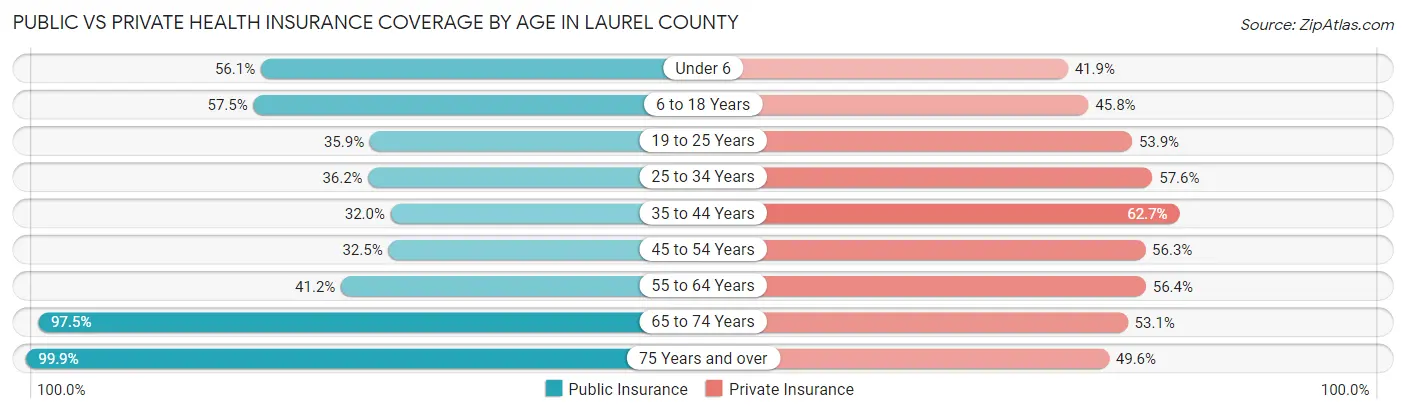
| Age Bracket | Public Insurance | Private Insurance |
| Under 6 | 2,568 (56.1%) | 1,919 (41.9%) |
| 6 to 18 Years | 6,056 (57.5%) | 4,820 (45.8%) |
| 19 to 25 Years | 1,835 (35.9%) | 2,754 (53.9%) |
| 25 to 34 Years | 2,499 (36.2%) | 3,982 (57.6%) |
| 35 to 44 Years | 2,512 (32.0%) | 4,915 (62.7%) |
| 45 to 54 Years | 2,691 (32.5%) | 4,668 (56.3%) |
| 55 to 64 Years | 3,324 (41.2%) | 4,549 (56.4%) |
| 65 to 74 Years | 6,155 (97.5%) | 3,349 (53.1%) |
| 75 Years and over | 3,875 (99.9%) | 1,924 (49.6%) |
| Total | 31,515 (51.2%) | 32,880 (53.4%) |
Disability Status by Sex by Age in Laurel County
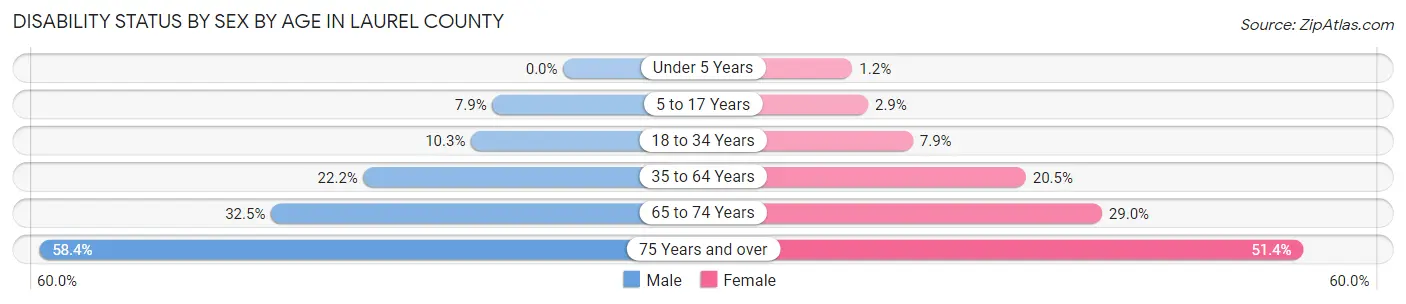
| Age Bracket | Male | Female |
| Under 5 Years | 0 (0.0%) | 21 (1.2%) |
| 5 to 17 Years | 429 (7.9%) | 148 (2.9%) |
| 18 to 34 Years | 658 (10.3%) | 513 (7.9%) |
| 35 to 64 Years | 2,645 (22.2%) | 2,521 (20.5%) |
| 65 to 74 Years | 993 (32.5%) | 944 (29.0%) |
| 75 Years and over | 945 (58.4%) | 1,163 (51.4%) |
Disability Class by Sex by Age in Laurel County
Disability Class: Hearing Difficulty
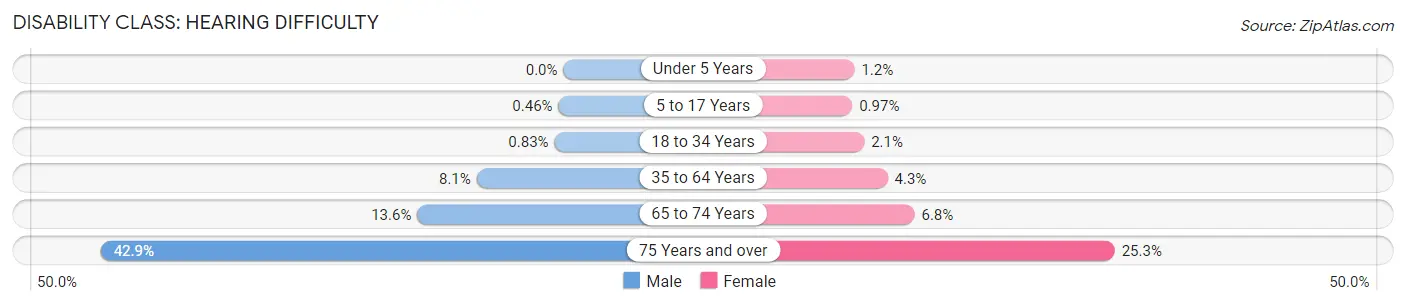
| Age Bracket | Male | Female |
| Under 5 Years | 0 (0.0%) | 21 (1.2%) |
| 5 to 17 Years | 25 (0.5%) | 49 (1.0%) |
| 18 to 34 Years | 53 (0.8%) | 135 (2.1%) |
| 35 to 64 Years | 957 (8.1%) | 523 (4.3%) |
| 65 to 74 Years | 414 (13.6%) | 220 (6.8%) |
| 75 Years and over | 695 (42.9%) | 573 (25.3%) |
Disability Class: Vision Difficulty
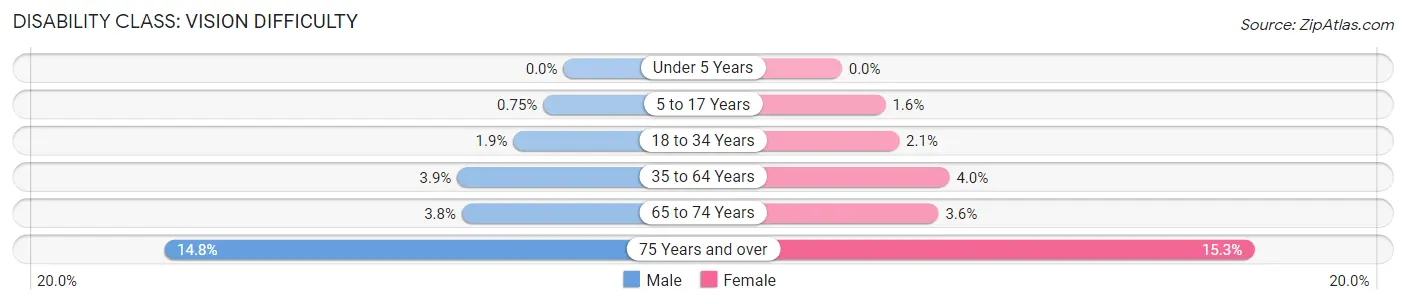
| Age Bracket | Male | Female |
| Under 5 Years | 0 (0.0%) | 0 (0.0%) |
| 5 to 17 Years | 41 (0.7%) | 82 (1.6%) |
| 18 to 34 Years | 119 (1.9%) | 138 (2.1%) |
| 35 to 64 Years | 468 (3.9%) | 492 (4.0%) |
| 65 to 74 Years | 115 (3.8%) | 117 (3.6%) |
| 75 Years and over | 240 (14.8%) | 346 (15.3%) |
Disability Class: Cognitive Difficulty
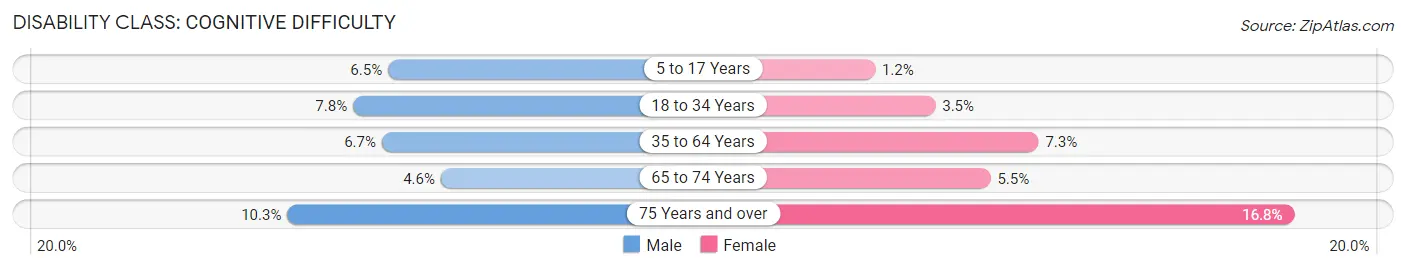
| Age Bracket | Male | Female |
| 5 to 17 Years | 354 (6.5%) | 62 (1.2%) |
| 18 to 34 Years | 501 (7.8%) | 225 (3.5%) |
| 35 to 64 Years | 802 (6.7%) | 898 (7.3%) |
| 65 to 74 Years | 139 (4.5%) | 180 (5.5%) |
| 75 Years and over | 166 (10.2%) | 380 (16.8%) |
Disability Class: Ambulatory Difficulty
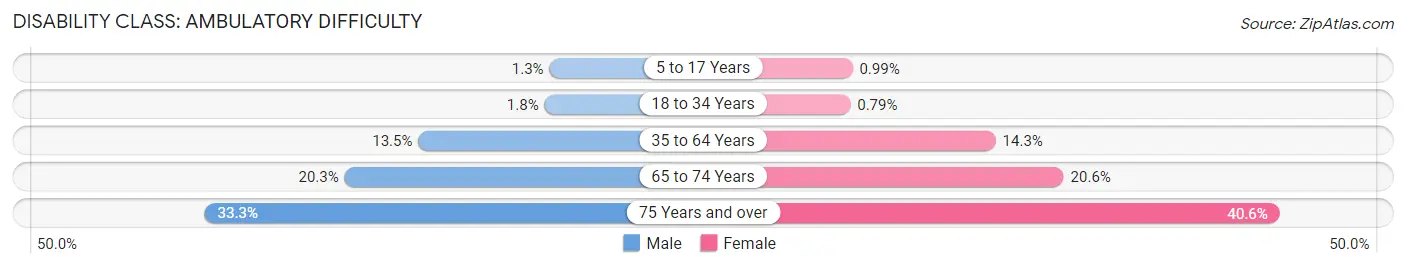
| Age Bracket | Male | Female |
| 5 to 17 Years | 70 (1.3%) | 50 (1.0%) |
| 18 to 34 Years | 112 (1.8%) | 51 (0.8%) |
| 35 to 64 Years | 1,601 (13.5%) | 1,756 (14.3%) |
| 65 to 74 Years | 620 (20.3%) | 671 (20.6%) |
| 75 Years and over | 539 (33.3%) | 919 (40.6%) |
Disability Class: Self-Care Difficulty
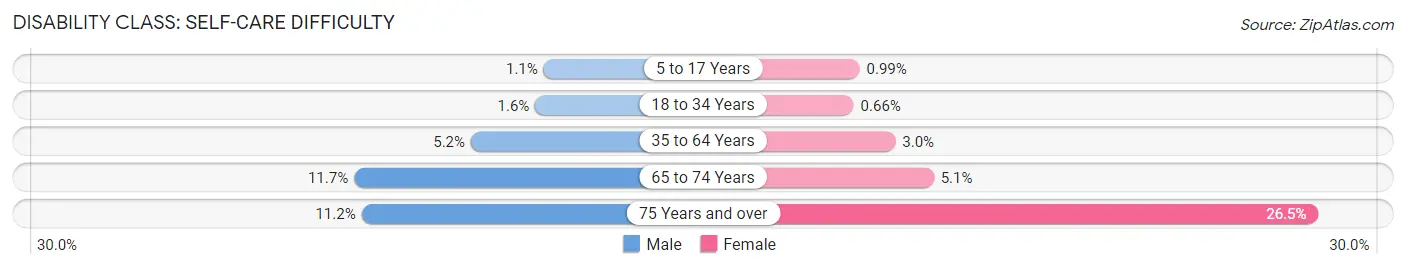
| Age Bracket | Male | Female |
| 5 to 17 Years | 60 (1.1%) | 50 (1.0%) |
| 18 to 34 Years | 101 (1.6%) | 43 (0.7%) |
| 35 to 64 Years | 613 (5.1%) | 367 (3.0%) |
| 65 to 74 Years | 356 (11.7%) | 167 (5.1%) |
| 75 Years and over | 182 (11.2%) | 600 (26.5%) |
Technology Access in Laurel County
Computing Device Access in Laurel County
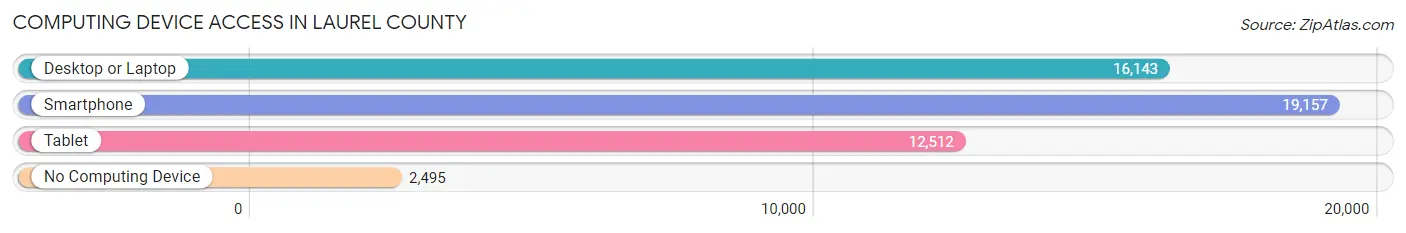
| Device Type | # Households | % Households |
| Desktop or Laptop | 16,143 | 68.9% |
| Smartphone | 19,157 | 81.8% |
| Tablet | 12,512 | 53.4% |
| No Computing Device | 2,495 | 10.6% |
| Total | 23,424 | 100.0% |
Internet Access in Laurel County
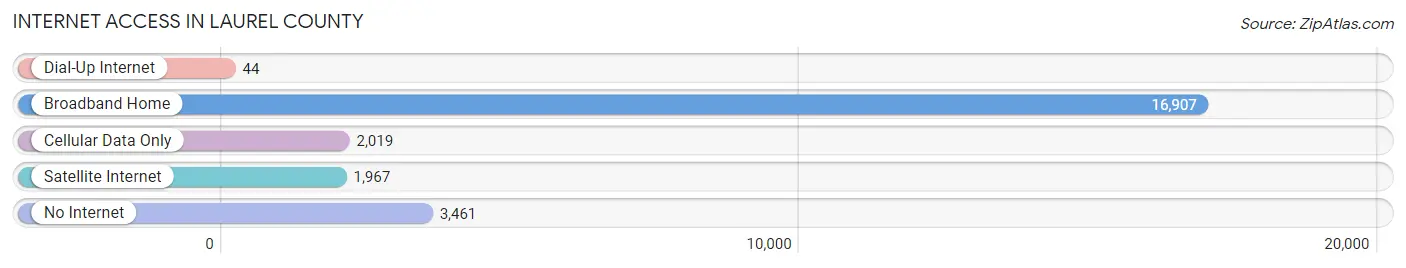
| Internet Type | # Households | % Households |
| Dial-Up Internet | 44 | 0.2% |
| Broadband Home | 16,907 | 72.2% |
| Cellular Data Only | 2,019 | 8.6% |
| Satellite Internet | 1,967 | 8.4% |
| No Internet | 3,461 | 14.8% |
| Total | 23,424 | 100.0% |
Laurel County Summary
Laurel County is a county located in the U.S. state of Kentucky. As of the 2010 census, the population was 58,849. The county seat is London. The county was formed in 1825 and named for the laurel bushes that grew in the area.
History
Laurel County was formed in 1825 from parts of Clay, Knox, and Rockcastle counties. It was named for the laurel bushes that grew in the area. The first settlers in the county were mostly of English and Scottish descent. The first county seat was established in London in 1826.
The county was a major producer of tobacco and hemp during the 19th century. The county also had a large number of distilleries, which produced whiskey and other spirits.
During the Civil War, Laurel County was a major supplier of food and supplies to the Confederate Army. The county was also the site of several skirmishes between Union and Confederate forces.
Geography
Laurel County is located in southeastern Kentucky, in the Appalachian Mountains. It is bordered by Clay County to the north, Knox County to the east, Rockcastle County to the south, and Jackson County to the west.
The county has a total area of 441 square miles, of which 439 square miles is land and 2 square miles (0.5%) is water. The county is drained by the Rockcastle River and its tributaries.
The highest point in the county is the summit of Pine Mountain, which has an elevation of 2,890 feet. The lowest point is the confluence of the Rockcastle River and the Cumberland River, which has an elevation of 860 feet.
Economy
The economy of Laurel County is largely based on agriculture and manufacturing. The county is a major producer of tobacco, corn, hay, and soybeans. It is also home to several manufacturing plants, including a paper mill, a furniture factory, and a plastics plant.
The county is also home to several tourist attractions, including the Levi Jackson Wilderness Road State Park, the Laurel River Lake, and the London Dragway.
Demographics
As of the 2010 census, there were 58,849 people, 22,845 households, and 16,717 families living in the county. The population density was 133 people per square mile. There were 25,845 housing units at an average density of 59 per square mile.
The racial makeup of the county was 97.2% White, 0.9% Black or African American, 0.3% Native American, 0.2% Asian, 0.1% Pacific Islander, 0.4% from other races, and 0.9% from two or more races. 1.5% of the population were Hispanic or Latino of any race.
There were 22,845 households, out of which 32.2% had children under the age of 18 living with them, 56.2% were married couples living together, 11.3% had a female householder with no husband present, and 28.2% were non-families. 24.2% of all households were made up of individuals, and 9.7% had someone living alone who was 65 years of age or older. The average household size was 2.54 and the average family size was 3.00.
In the county, the population was spread out, with 25.2% under the age of 18, 8.3% from 18 to 24, 28.7% from 25 to 44, 24.2% from 45 to 64, and 13.6% who were 65 years of age or older. The median age was 37 years. For every 100 females, there were 97.2 males. For every 100 females age 18 and over, there were 94.2 males.
The median income for a household in the county was $32,945, and the median income for a family was $39,845. Males had a median income of $30,945 versus $21,845 for females. The per capita income for the county was $16,845. About 11.2% of families and 14.2% of the population were below the poverty line, including 19.2% of those under age 18 and 13.2% of those age 65 or over.
Common Questions
What is the Total Population of Laurel County?
Total Population of Laurel County is 62,442.
What is the Total Male Population of Laurel County?
Total Male Population of Laurel County is 30,964.
What is the Total Female Population of Laurel County?
Total Female Population of Laurel County is 31,478.
What is the Ratio of Males per 100 Females in Laurel County?
There are 98.37 Males per 100 Females in Laurel County.
What is the Ratio of Females per 100 Males in Laurel County?
There are 101.66 Females per 100 Males in Laurel County.
What is the Median Population Age in Laurel County?
Median Population Age in Laurel County is 39.8 Years.
What is the Average Family Size in Laurel County
Average Family Size in Laurel County is 3.1 People.
What is the Average Household Size in Laurel County
Average Household Size in Laurel County is 2.6 People.
What is Per Capita Income in Laurel County?
Per Capita income in Laurel County is $26,829.
What is the Median Family Income in Laurel County?
Median Family Income in Laurel County is $62,278.
What is the Median Household income in Laurel County?
Median Household Income in Laurel County is $53,693.
What is Income or Wage Gap in Laurel County?
Income or Wage Gap in Laurel County is 31.9%.
Women in Laurel County earn 68.1 cents for every dollar earned by a man.
What is Family Income Deficit in Laurel County?
Family Income Deficit in Laurel County is $11,167.
Families that are below poverty line in Laurel County earn $11,167 less on average than the poverty threshold level.
What is Inequality or Gini Index in Laurel County?
Inequality or Gini Index in Laurel County is 0.45.
How Large is the Labor Force in Laurel County?
There are 26,939 People in the Labor Forcein in Laurel County.
What is the Percentage of People in the Labor Force in Laurel County?
53.9% of People are in the Labor Force in Laurel County.
What is the Unemployment Rate in Laurel County?
Unemployment Rate in Laurel County is 3.6%.