Kenton County, KY
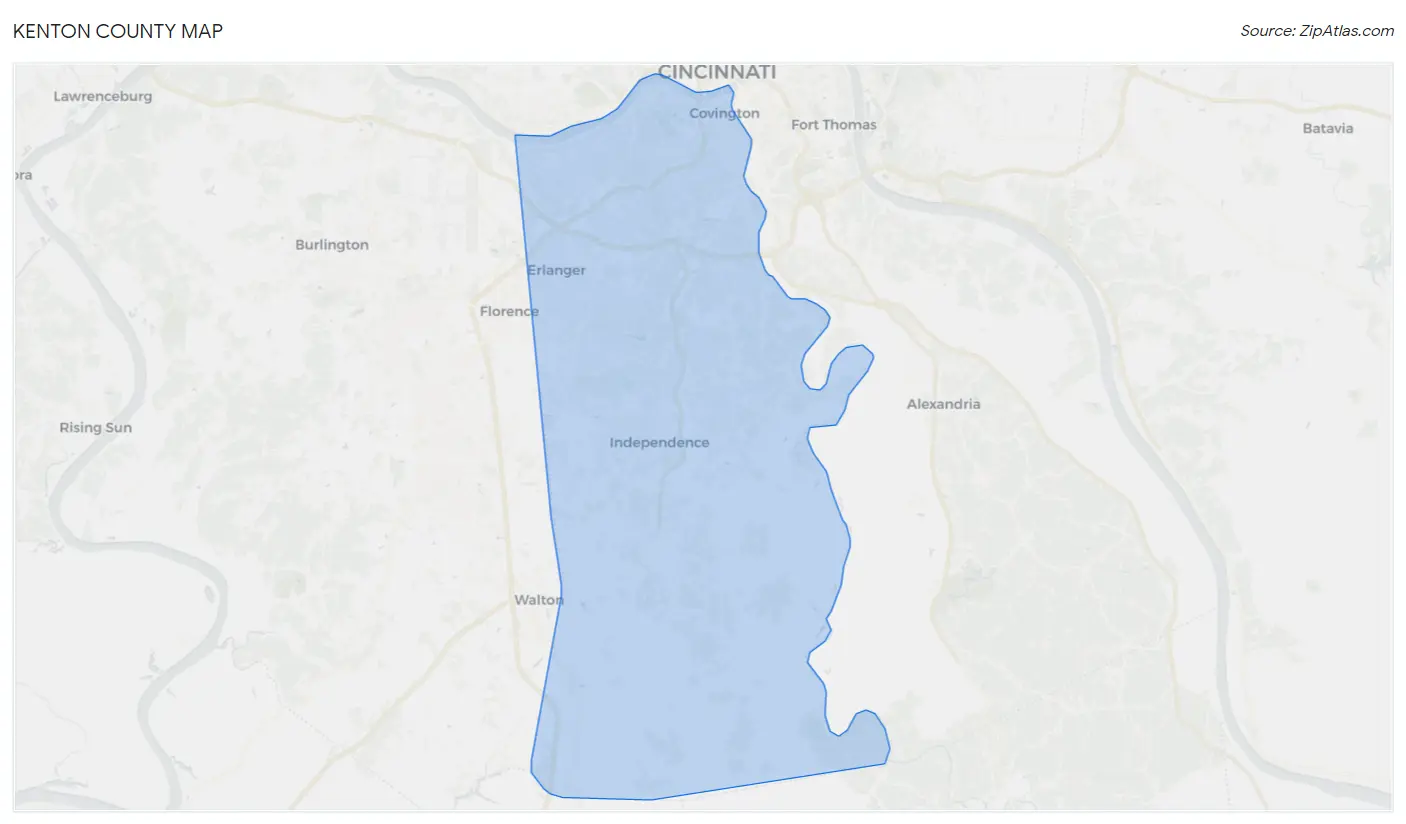
Kenton County Map
Kenton County Overview
169,066
TOTAL POPULATION
84,198
MALE POPULATION
84,868
FEMALE POPULATION
99.21
MALES / 100 FEMALES
100.80
FEMALES / 100 MALES
37.7
MEDIAN AGE
3.1
AVG FAMILY SIZE
2.5
AVG HOUSEHOLD SIZE
$40,780
PER CAPITA INCOME
$95,611
AVG FAMILY INCOME
$76,016
AVG HOUSEHOLD INCOME
25.1%
WAGE / INCOME GAP [ % ]
74.9¢/ $1
WAGE / INCOME GAP [ $ ]
$12,342
FAMILY INCOME DEFICIT
0.45
INEQUALITY / GINI INDEX
92,861
LABOR FORCE [ PEOPLE ]
69.3%
PERCENT IN LABOR FORCE
4.4%
UNEMPLOYMENT RATE
Kenton County Area Codes
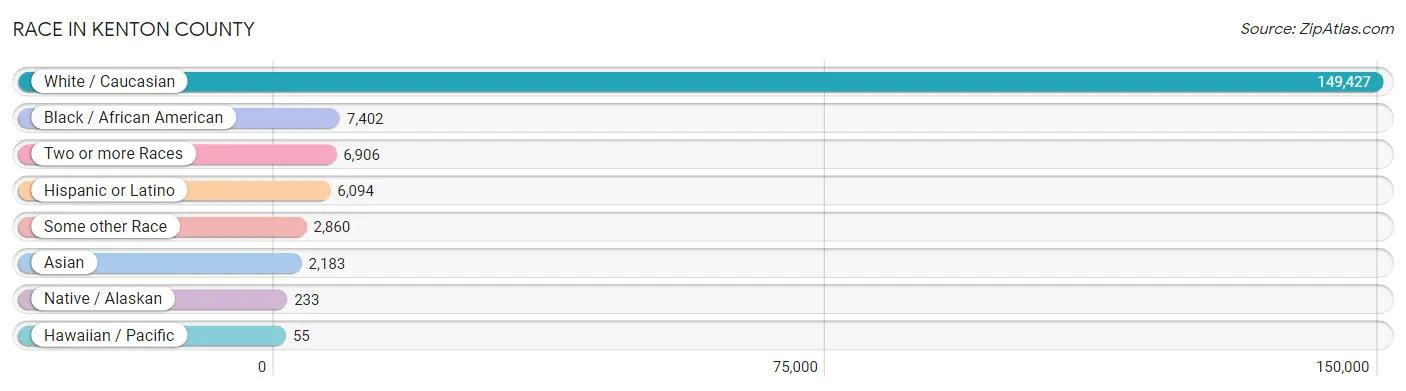
Race in Kenton County
The most populous races in Kenton County are White / Caucasian (149,427 | 88.4%), Black / African American (7,402 | 4.4%), and Two or more Races (6,906 | 4.1%).
| Race | # Population | % Population |
| Asian | 2,183 | 1.3% |
| Black / African American | 7,402 | 4.4% |
| Hawaiian / Pacific | 55 | 0.0% |
| Hispanic or Latino | 6,094 | 3.6% |
| Native / Alaskan | 233 | 0.1% |
| White / Caucasian | 149,427 | 88.4% |
| Two or more Races | 6,906 | 4.1% |
| Some other Race | 2,860 | 1.7% |
| Total | 169,066 | 100.0% |
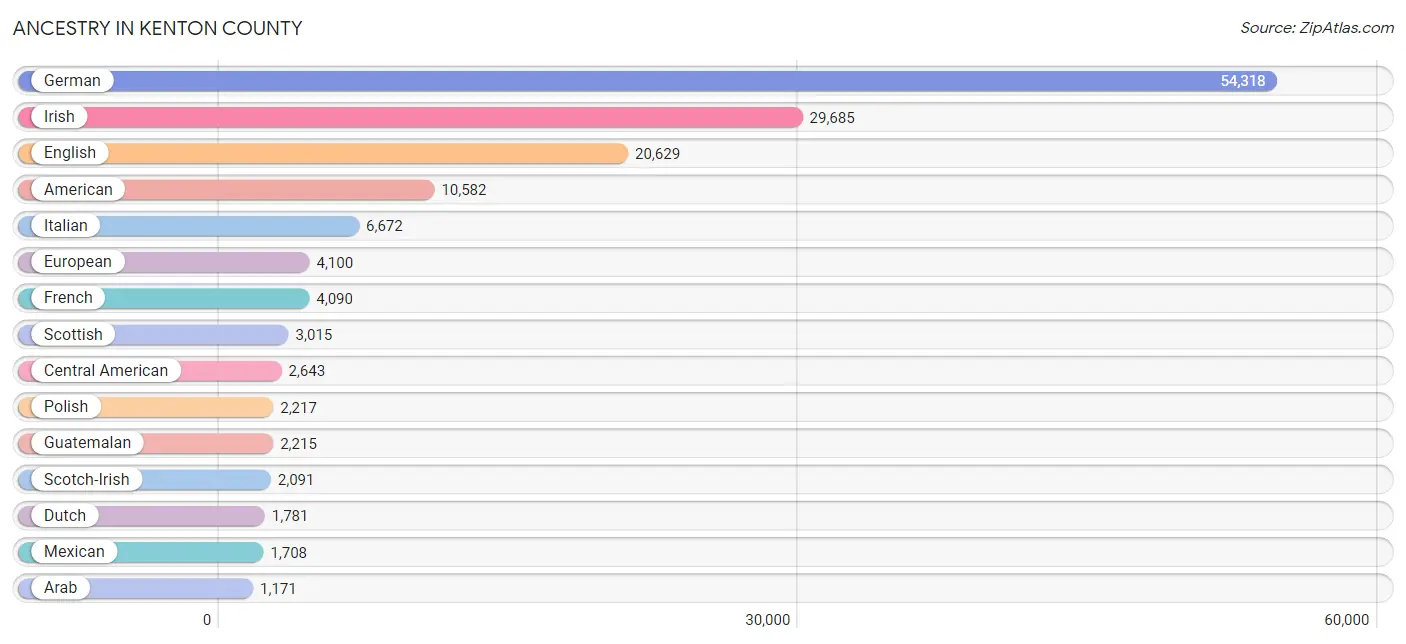
Ancestry in Kenton County
The most populous ancestries reported in Kenton County are German (54,318 | 32.1%), Irish (29,685 | 17.6%), English (20,629 | 12.2%), American (10,582 | 6.3%), and Italian (6,672 | 4.0%), together accounting for 72.1% of all Kenton County residents.
| Ancestry | # Population | % Population |
| African | 419 | 0.3% |
| Albanian | 12 | 0.0% |
| American | 10,582 | 6.3% |
| Apache | 20 | 0.0% |
| Arab | 1,171 | 0.7% |
| Armenian | 8 | 0.0% |
| Assyrian / Chaldean / Syriac | 23 | 0.0% |
| Austrian | 159 | 0.1% |
| Bangladeshi | 23 | 0.0% |
| Belgian | 37 | 0.0% |
| Bhutanese | 308 | 0.2% |
| Blackfeet | 10 | 0.0% |
| Brazilian | 17 | 0.0% |
| British | 1,032 | 0.6% |
| Bulgarian | 19 | 0.0% |
| Burmese | 451 | 0.3% |
| Cajun | 1 | 0.0% |
| Canadian | 64 | 0.0% |
| Celtic | 47 | 0.0% |
| Central American | 2,643 | 1.6% |
| Central American Indian | 65 | 0.0% |
| Cherokee | 488 | 0.3% |
| Chilean | 33 | 0.0% |
| Chippewa | 10 | 0.0% |
| Choctaw | 29 | 0.0% |
| Colombian | 111 | 0.1% |
| Cree | 1 | 0.0% |
| Croatian | 105 | 0.1% |
| Crow | 5 | 0.0% |
| Cuban | 254 | 0.2% |
| Czech | 171 | 0.1% |
| Czechoslovakian | 109 | 0.1% |
| Danish | 261 | 0.2% |
| Dominican | 65 | 0.0% |
| Dutch | 1,781 | 1.1% |
| Eastern European | 184 | 0.1% |
| Ecuadorian | 7 | 0.0% |
| Egyptian | 18 | 0.0% |
| English | 20,629 | 12.2% |
| European | 4,100 | 2.4% |
| Filipino | 31 | 0.0% |
| Finnish | 90 | 0.1% |
| French | 4,090 | 2.4% |
| French American Indian | 1 | 0.0% |
| French Canadian | 366 | 0.2% |
| German | 54,318 | 32.1% |
| German Russian | 13 | 0.0% |
| Greek | 505 | 0.3% |
| Guamanian / Chamorro | 18 | 0.0% |
| Guatemalan | 2,215 | 1.3% |
| Haitian | 20 | 0.0% |
| Honduran | 227 | 0.1% |
| Hungarian | 567 | 0.3% |
| Indian (Asian) | 502 | 0.3% |
| Indonesian | 154 | 0.1% |
| Inupiat | 26 | 0.0% |
| Iranian | 116 | 0.1% |
| Irish | 29,685 | 17.6% |
| Iroquois | 4 | 0.0% |
| Israeli | 15 | 0.0% |
| Italian | 6,672 | 4.0% |
| Jamaican | 34 | 0.0% |
| Kenyan | 8 | 0.0% |
| Korean | 435 | 0.3% |
| Latvian | 37 | 0.0% |
| Lebanese | 327 | 0.2% |
| Liberian | 45 | 0.0% |
| Lithuanian | 159 | 0.1% |
| Macedonian | 14 | 0.0% |
| Mexican | 1,708 | 1.0% |
| Mexican American Indian | 136 | 0.1% |
| Moroccan | 371 | 0.2% |
| Native Hawaiian | 40 | 0.0% |
| Navajo | 34 | 0.0% |
| Nigerian | 86 | 0.1% |
| Northern European | 55 | 0.0% |
| Norwegian | 636 | 0.4% |
| Pakistani | 96 | 0.1% |
| Palestinian | 127 | 0.1% |
| Panamanian | 129 | 0.1% |
| Pennsylvania German | 39 | 0.0% |
| Peruvian | 39 | 0.0% |
| Polish | 2,217 | 1.3% |
| Portuguese | 88 | 0.1% |
| Puerto Rican | 691 | 0.4% |
| Romanian | 19 | 0.0% |
| Russian | 351 | 0.2% |
| Salvadoran | 72 | 0.0% |
| Samoan | 196 | 0.1% |
| Scandinavian | 700 | 0.4% |
| Scotch-Irish | 2,091 | 1.2% |
| Scottish | 3,015 | 1.8% |
| Seminole | 1 | 0.0% |
| Serbian | 51 | 0.0% |
| Slavic | 74 | 0.0% |
| Slovak | 128 | 0.1% |
| Slovene | 18 | 0.0% |
| South African | 32 | 0.0% |
| South American | 268 | 0.2% |
| Spaniard | 277 | 0.2% |
| Spanish | 8 | 0.0% |
| Sri Lankan | 394 | 0.2% |
| Subsaharan African | 566 | 0.3% |
| Swedish | 561 | 0.3% |
| Swiss | 335 | 0.2% |
| Syrian | 15 | 0.0% |
| Thai | 412 | 0.2% |
| Tongan | 18 | 0.0% |
| Turkish | 22 | 0.0% |
| Ukrainian | 70 | 0.0% |
| Venezuelan | 78 | 0.1% |
| Welsh | 1,165 | 0.7% |
| West Indian | 11 | 0.0% |
| Yugoslavian | 22 | 0.0% | View All 114 Rows |
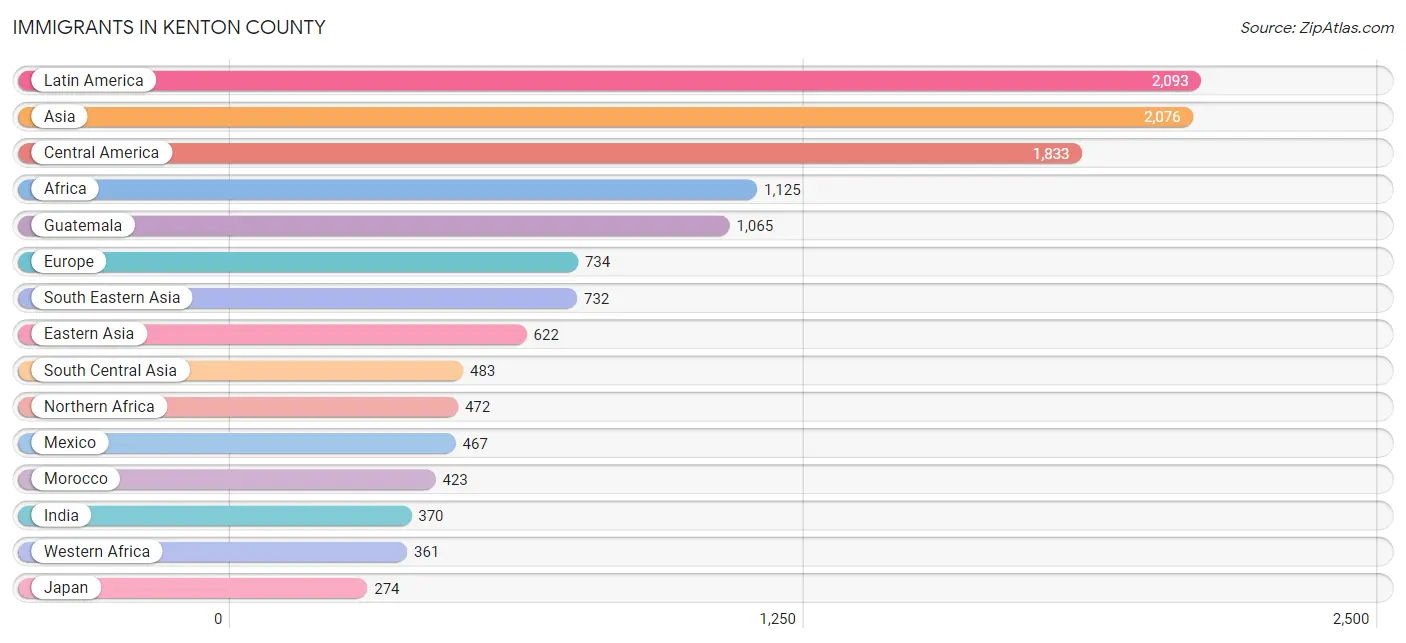
Immigrants in Kenton County
The most numerous immigrant groups reported in Kenton County came from Latin America (2,093 | 1.2%), Asia (2,076 | 1.2%), Central America (1,833 | 1.1%), Africa (1,125 | 0.7%), and Guatemala (1,065 | 0.6%), together accounting for 4.9% of all Kenton County residents.
| Immigration Origin | # Population | % Population |
| Africa | 1,125 | 0.7% |
| Asia | 2,076 | 1.2% |
| Australia | 6 | 0.0% |
| Austria | 1 | 0.0% |
| Belarus | 49 | 0.0% |
| Bosnia and Herzegovina | 22 | 0.0% |
| Brazil | 10 | 0.0% |
| Bulgaria | 25 | 0.0% |
| Cambodia | 4 | 0.0% |
| Canada | 127 | 0.1% |
| Caribbean | 54 | 0.0% |
| Central America | 1,833 | 1.1% |
| Chile | 40 | 0.0% |
| China | 196 | 0.1% |
| Colombia | 64 | 0.0% |
| Denmark | 28 | 0.0% |
| Eastern Africa | 270 | 0.2% |
| Eastern Asia | 622 | 0.4% |
| Eastern Europe | 236 | 0.1% |
| El Salvador | 17 | 0.0% |
| England | 44 | 0.0% |
| Europe | 734 | 0.4% |
| France | 68 | 0.0% |
| Germany | 163 | 0.1% |
| Ghana | 22 | 0.0% |
| Greece | 108 | 0.1% |
| Guatemala | 1,065 | 0.6% |
| Haiti | 20 | 0.0% |
| Honduras | 206 | 0.1% |
| Hong Kong | 16 | 0.0% |
| Hungary | 67 | 0.0% |
| India | 370 | 0.2% |
| Iran | 38 | 0.0% |
| Ireland | 17 | 0.0% |
| Israel | 15 | 0.0% |
| Jamaica | 34 | 0.0% |
| Japan | 274 | 0.2% |
| Kenya | 8 | 0.0% |
| Korea | 152 | 0.1% |
| Latin America | 2,093 | 1.2% |
| Latvia | 10 | 0.0% |
| Mexico | 467 | 0.3% |
| Morocco | 423 | 0.3% |
| Northern Africa | 472 | 0.3% |
| Northern Europe | 147 | 0.1% |
| Oceania | 6 | 0.0% |
| Pakistan | 75 | 0.0% |
| Panama | 78 | 0.1% |
| Peru | 34 | 0.0% |
| Philippines | 245 | 0.1% |
| Poland | 19 | 0.0% |
| Romania | 22 | 0.0% |
| Russia | 11 | 0.0% |
| Saudi Arabia | 24 | 0.0% |
| Scotland | 17 | 0.0% |
| Senegal | 271 | 0.2% |
| Serbia | 11 | 0.0% |
| South Africa | 15 | 0.0% |
| South America | 206 | 0.1% |
| South Central Asia | 483 | 0.3% |
| South Eastern Asia | 732 | 0.4% |
| Southern Europe | 119 | 0.1% |
| Spain | 11 | 0.0% |
| Sweden | 2 | 0.0% |
| Syria | 12 | 0.0% |
| Taiwan | 4 | 0.0% |
| Thailand | 66 | 0.0% |
| Turkey | 22 | 0.0% |
| Venezuela | 58 | 0.0% |
| Vietnam | 263 | 0.2% |
| Western Africa | 361 | 0.2% |
| Western Asia | 113 | 0.1% |
| Western Europe | 232 | 0.1% |
| Zimbabwe | 23 | 0.0% | View All 74 Rows |
Sex and Age in Kenton County
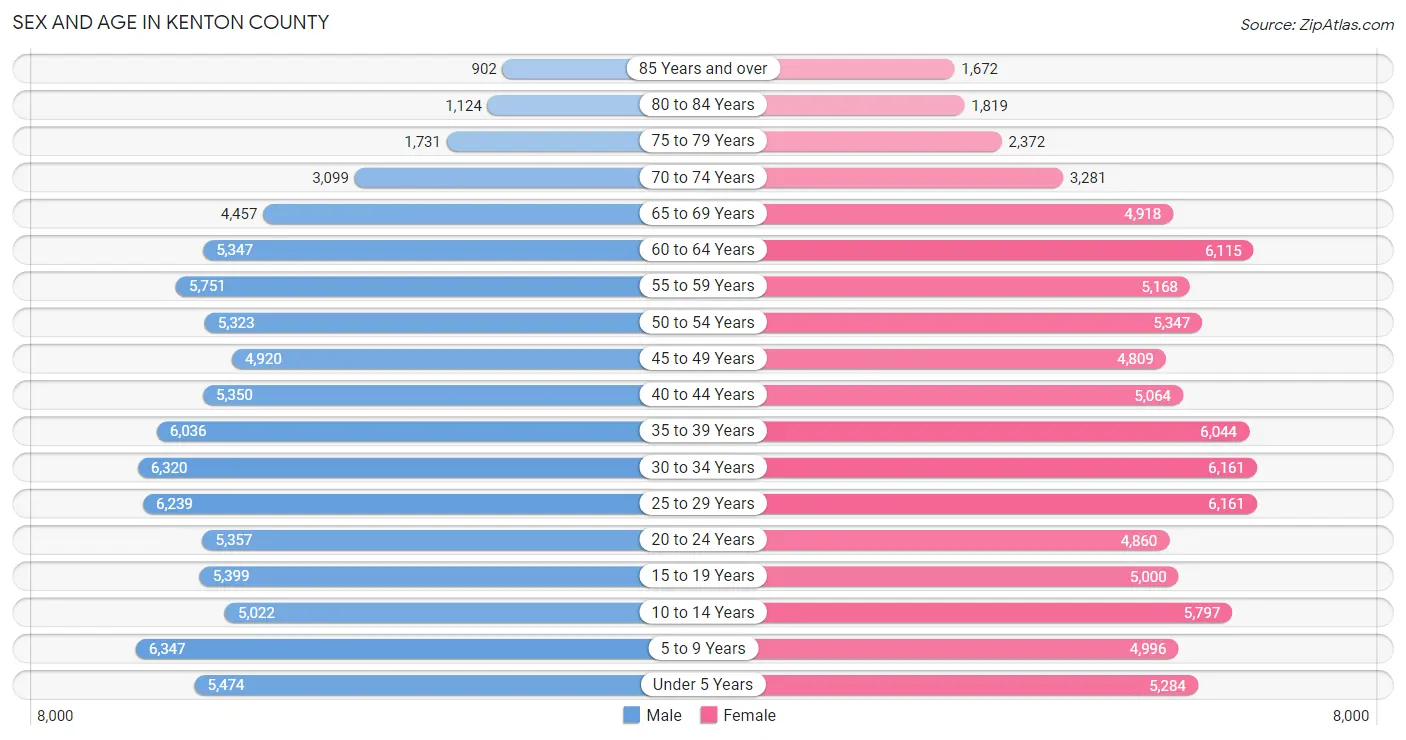
Sex and Age in Kenton County
The most populous age groups in Kenton County are 5 to 9 Years (6,347 | 7.5%) for men and 25 to 29 Years (6,161 | 7.3%) for women.
| Age Bracket | Male | Female |
| Under 5 Years | 5,474 (6.5%) | 5,284 (6.2%) |
| 5 to 9 Years | 6,347 (7.5%) | 4,996 (5.9%) |
| 10 to 14 Years | 5,022 (6.0%) | 5,797 (6.8%) |
| 15 to 19 Years | 5,399 (6.4%) | 5,000 (5.9%) |
| 20 to 24 Years | 5,357 (6.4%) | 4,860 (5.7%) |
| 25 to 29 Years | 6,239 (7.4%) | 6,161 (7.3%) |
| 30 to 34 Years | 6,320 (7.5%) | 6,161 (7.3%) |
| 35 to 39 Years | 6,036 (7.2%) | 6,044 (7.1%) |
| 40 to 44 Years | 5,350 (6.4%) | 5,064 (6.0%) |
| 45 to 49 Years | 4,920 (5.8%) | 4,809 (5.7%) |
| 50 to 54 Years | 5,323 (6.3%) | 5,347 (6.3%) |
| 55 to 59 Years | 5,751 (6.8%) | 5,168 (6.1%) |
| 60 to 64 Years | 5,347 (6.4%) | 6,115 (7.2%) |
| 65 to 69 Years | 4,457 (5.3%) | 4,918 (5.8%) |
| 70 to 74 Years | 3,099 (3.7%) | 3,281 (3.9%) |
| 75 to 79 Years | 1,731 (2.1%) | 2,372 (2.8%) |
| 80 to 84 Years | 1,124 (1.3%) | 1,819 (2.1%) |
| 85 Years and over | 902 (1.1%) | 1,672 (2.0%) |
| Total | 84,198 (100.0%) | 84,868 (100.0%) |
Families and Households in Kenton County
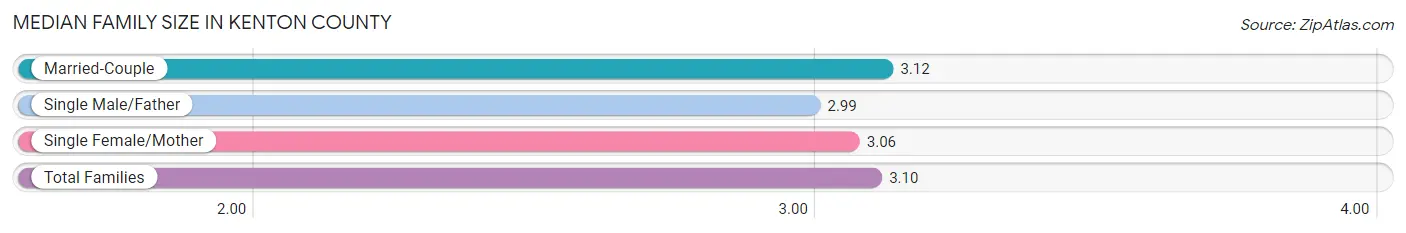
Median Family Size in Kenton County
The median family size in Kenton County is 3.10 persons per family, with married-couple families (31,030 | 73.7%) accounting for the largest median family size of 3.12 persons per family. On the other hand, single male/father families (3,493 | 8.3%) represent the smallest median family size with 2.99 persons per family.
| Family Type | # Families | Family Size |
| Married-Couple | 31,030 (73.7%) | 3.12 |
| Single Male/Father | 3,493 (8.3%) | 2.99 |
| Single Female/Mother | 7,604 (18.0%) | 3.06 |
| Total Families | 42,127 (100.0%) | 3.10 |
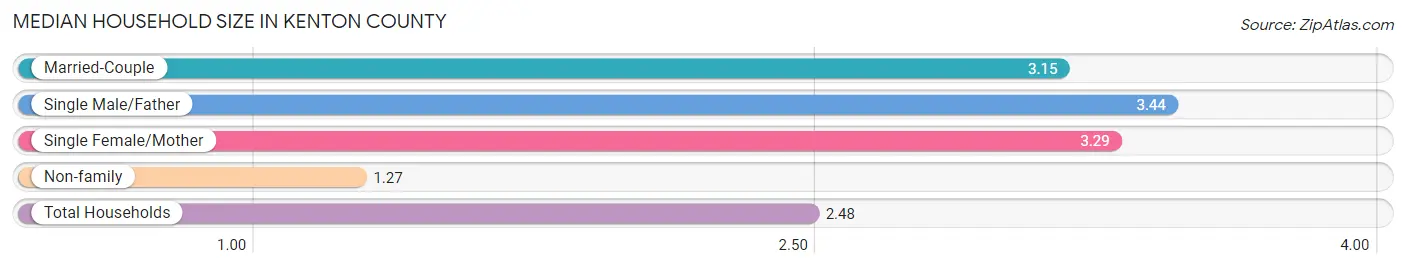
Median Household Size in Kenton County
The median household size in Kenton County is 2.48 persons per household, with single male/father households (3,493 | 5.2%) accounting for the largest median household size of 3.44 persons per household. non-family households (25,226 | 37.4%) represent the smallest median household size with 1.27 persons per household.
| Household Type | # Households | Household Size |
| Married-Couple | 31,030 (46.1%) | 3.15 |
| Single Male/Father | 3,493 (5.2%) | 3.44 |
| Single Female/Mother | 7,604 (11.3%) | 3.29 |
| Non-family | 25,226 (37.4%) | 1.27 |
| Total Households | 67,353 (100.0%) | 2.48 |
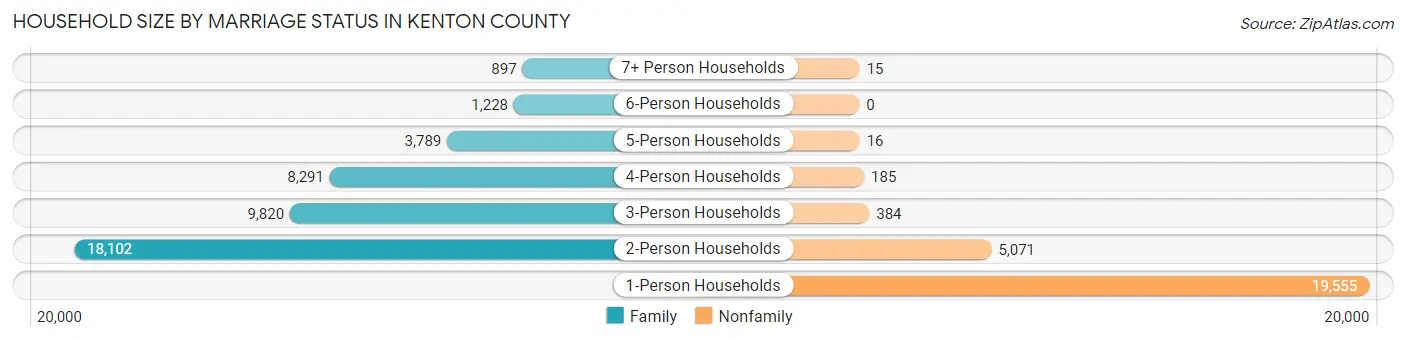
Household Size by Marriage Status in Kenton County
Out of a total of 67,353 households in Kenton County, 42,127 (62.5%) are family households, while 25,226 (37.4%) are nonfamily households. The most numerous type of family households are 2-person households, comprising 18,102, and the most common type of nonfamily households are 1-person households, comprising 19,555.
| Household Size | Family Households | Nonfamily Households |
| 1-Person Households | - | 19,555 (29.0%) |
| 2-Person Households | 18,102 (26.9%) | 5,071 (7.5%) |
| 3-Person Households | 9,820 (14.6%) | 384 (0.6%) |
| 4-Person Households | 8,291 (12.3%) | 185 (0.3%) |
| 5-Person Households | 3,789 (5.6%) | 16 (0.0%) |
| 6-Person Households | 1,228 (1.8%) | 0 (0.0%) |
| 7+ Person Households | 897 (1.3%) | 15 (0.0%) |
| Total | 42,127 (62.5%) | 25,226 (37.4%) |
Female Fertility in Kenton County
Fertility by Age in Kenton County
Average fertility rate in Kenton County is 59.0 births per 1,000 women. Women in the age bracket of 20 to 34 years have the highest fertility rate with 115.0 births per 1,000 women. Women in the age bracket of 20 to 34 years acount for 85.8% of all women with births.
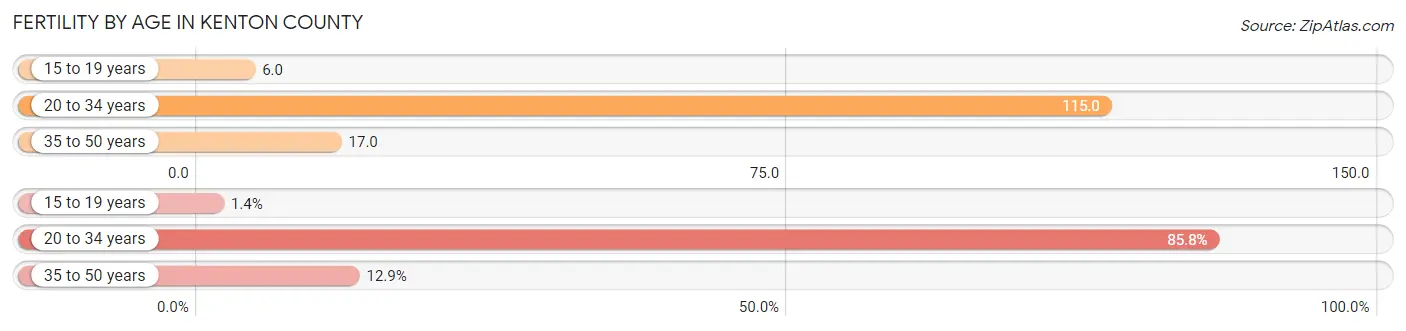
| Age Bracket | Women with Births | Births / 1,000 Women |
| 15 to 19 years | 31 (1.3%) | 6.0 |
| 20 to 34 years | 1,970 (85.8%) | 115.0 |
| 35 to 50 years | 295 (12.9%) | 17.0 |
| Total | 2,296 (100.0%) | 59.0 |
Fertility by Age by Marriage Status in Kenton County
80.7% of women with births (2,296) in Kenton County are married. The highest percentage of unmarried women with births falls into 15 to 19 years age bracket with 100.0% of them unmarried at the time of birth, while the lowest percentage of unmarried women with births belong to 20 to 34 years age bracket with 17.5% of them unmarried.
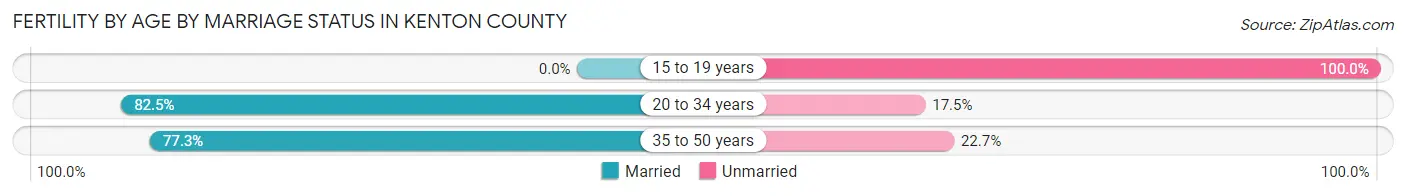
| Age Bracket | Married | Unmarried |
| 15 to 19 years | 0 (0.0%) | 31 (100.0%) |
| 20 to 34 years | 1,625 (82.5%) | 345 (17.5%) |
| 35 to 50 years | 228 (77.3%) | 67 (22.7%) |
| Total | 1,853 (80.7%) | 443 (19.3%) |
Fertility by Education in Kenton County
Average fertility rate in Kenton County is 59.0 births per 1,000 women. Women with the education attainment of bachelor's degree have the highest fertility rate of 80.0 births per 1,000 women, while women with the education attainment of high school diploma have the lowest fertility at 36.0 births per 1,000 women. Women with the education attainment of bachelor's degree represent 35.3% of all women with births.
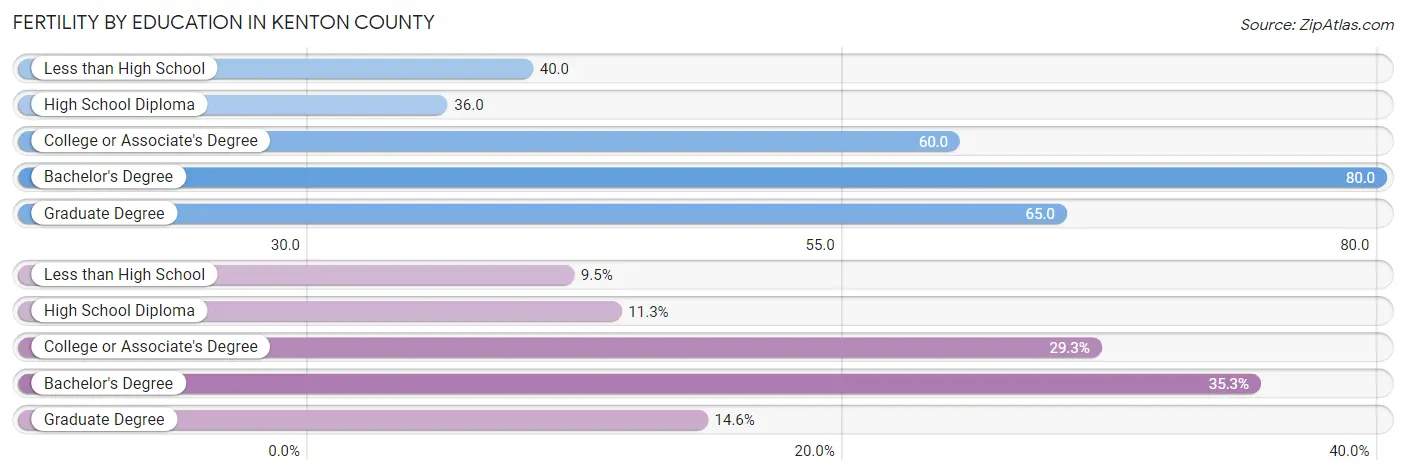
| Educational Attainment | Women with Births | Births / 1,000 Women |
| Less than High School | 219 (9.5%) | 40.0 |
| High School Diploma | 260 (11.3%) | 36.0 |
| College or Associate's Degree | 673 (29.3%) | 60.0 |
| Bachelor's Degree | 810 (35.3%) | 80.0 |
| Graduate Degree | 334 (14.5%) | 65.0 |
| Total | 2,296 (100.0%) | 59.0 |
Fertility by Education by Marriage Status in Kenton County
19.3% of women with births in Kenton County are unmarried. Women with the educational attainment of bachelor's degree are most likely to be married with 99.5% of them married at childbirth, while women with the educational attainment of high school diploma are least likely to be married with 78.5% of them unmarried at childbirth.
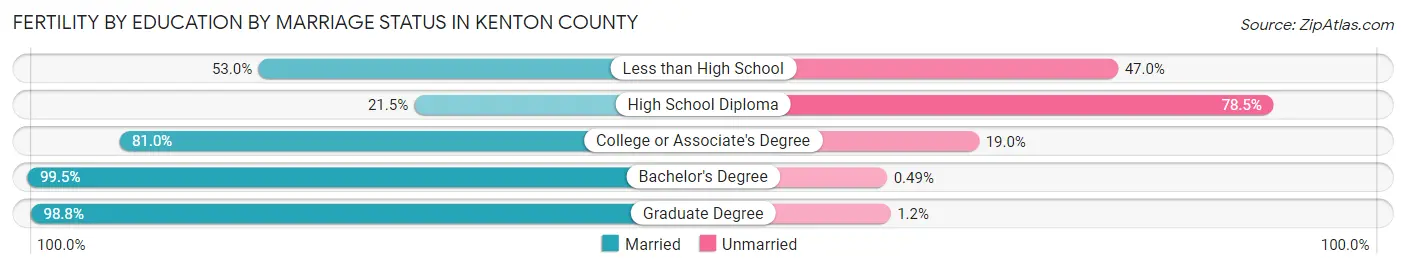
| Educational Attainment | Married | Unmarried |
| Less than High School | 116 (53.0%) | 103 (47.0%) |
| High School Diploma | 56 (21.5%) | 204 (78.5%) |
| College or Associate's Degree | 545 (81.0%) | 128 (19.0%) |
| Bachelor's Degree | 806 (99.5%) | 4 (0.5%) |
| Graduate Degree | 330 (98.8%) | 4 (1.2%) |
| Total | 1,853 (80.7%) | 443 (19.3%) |
Income in Kenton County
Income Overview in Kenton County
Per Capita Income in Kenton County is $40,780, while median incomes of families and households are $95,611 and $76,016 respectively.
| Characteristic | Number | Measure |
| Per Capita Income | 169,066 | $40,780 |
| Median Family Income | 42,127 | $95,611 |
| Mean Family Income | 42,127 | $120,232 |
| Median Household Income | 67,353 | $76,016 |
| Mean Household Income | 67,353 | $100,475 |
| Income Deficit | 42,127 | $12,342 |
| Wage / Income Gap (%) | 169,066 | 25.07% |
| Wage / Income Gap ($) | 169,066 | 74.93¢ per $1 |
| Gini / Inequality Index | 169,066 | 0.45 |
Earnings by Sex in Kenton County
Average Earnings in Kenton County are $43,906, $50,164 for men and $37,589 for women, a difference of 25.1%.
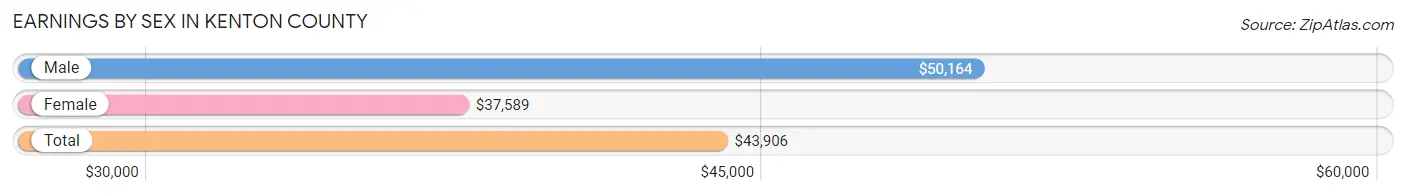
| Sex | Number | Average Earnings |
| Male | 50,553 (52.5%) | $50,164 |
| Female | 45,815 (47.5%) | $37,589 |
| Total | 96,368 (100.0%) | $43,906 |
Earnings by Sex by Income Bracket in Kenton County
The most common earnings brackets in Kenton County are $100,000+ for men (8,747 | 17.3%) and $100,000+ for women (3,834 | 8.4%).
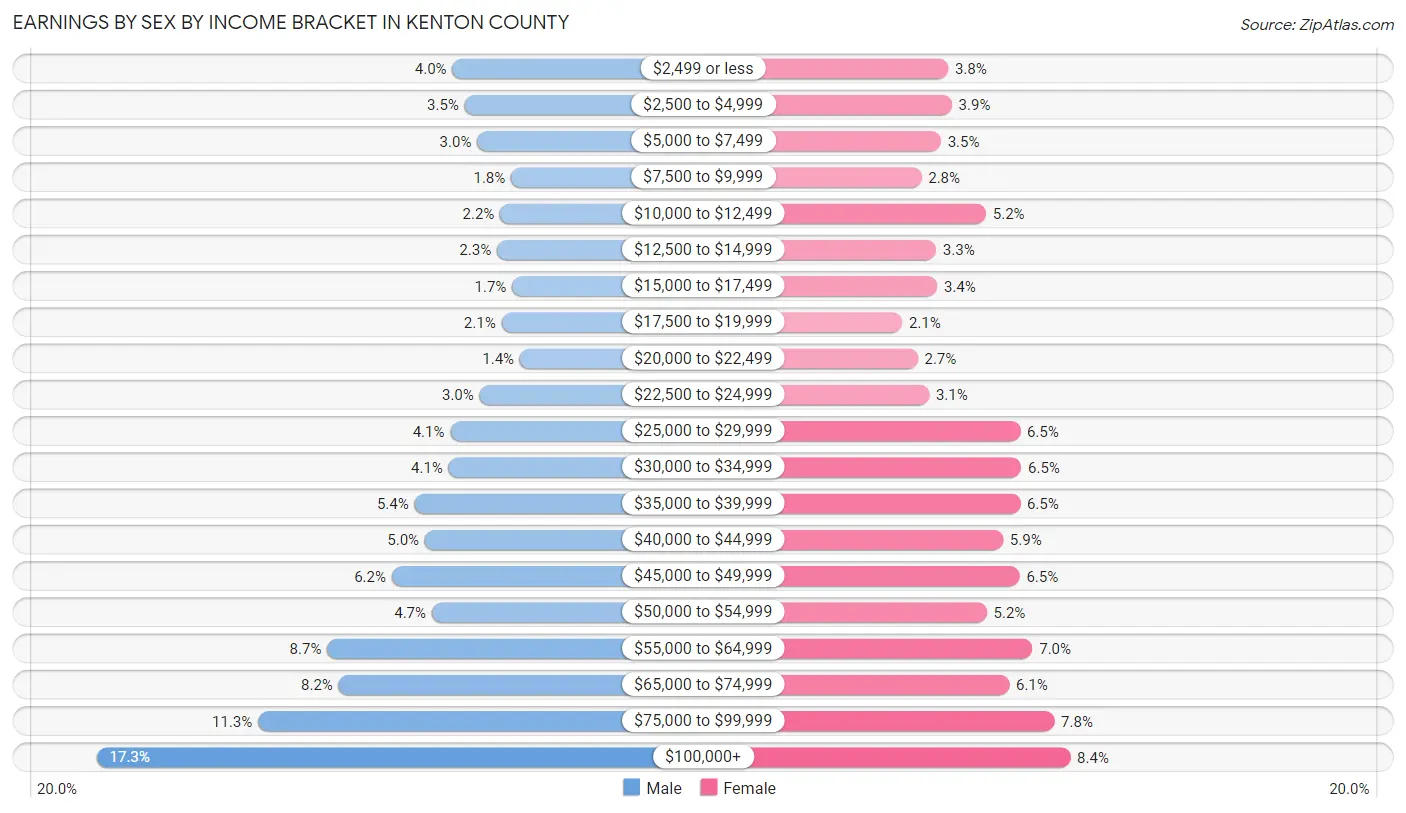
| Income | Male | Female |
| $2,499 or less | 2,007 (4.0%) | 1,738 (3.8%) |
| $2,500 to $4,999 | 1,772 (3.5%) | 1,802 (3.9%) |
| $5,000 to $7,499 | 1,537 (3.0%) | 1,613 (3.5%) |
| $7,500 to $9,999 | 896 (1.8%) | 1,278 (2.8%) |
| $10,000 to $12,499 | 1,103 (2.2%) | 2,388 (5.2%) |
| $12,500 to $14,999 | 1,165 (2.3%) | 1,532 (3.3%) |
| $15,000 to $17,499 | 876 (1.7%) | 1,547 (3.4%) |
| $17,500 to $19,999 | 1,077 (2.1%) | 948 (2.1%) |
| $20,000 to $22,499 | 728 (1.4%) | 1,212 (2.6%) |
| $22,500 to $24,999 | 1,491 (2.9%) | 1,409 (3.1%) |
| $25,000 to $29,999 | 2,049 (4.1%) | 2,974 (6.5%) |
| $30,000 to $34,999 | 2,080 (4.1%) | 2,991 (6.5%) |
| $35,000 to $39,999 | 2,723 (5.4%) | 2,973 (6.5%) |
| $40,000 to $44,999 | 2,527 (5.0%) | 2,679 (5.9%) |
| $45,000 to $49,999 | 3,154 (6.2%) | 2,966 (6.5%) |
| $50,000 to $54,999 | 2,395 (4.7%) | 2,399 (5.2%) |
| $55,000 to $64,999 | 4,377 (8.7%) | 3,184 (7.0%) |
| $65,000 to $74,999 | 4,163 (8.2%) | 2,787 (6.1%) |
| $75,000 to $99,999 | 5,686 (11.3%) | 3,561 (7.8%) |
| $100,000+ | 8,747 (17.3%) | 3,834 (8.4%) |
| Total | 50,553 (100.0%) | 45,815 (100.0%) |
Earnings by Sex by Educational Attainment in Kenton County
Average earnings in Kenton County are $56,846 for men and $42,115 for women, a difference of 25.9%. Men with an educational attainment of graduate degree enjoy the highest average annual earnings of $89,205, while those with less than high school education earn the least with $28,524. Women with an educational attainment of graduate degree earn the most with the average annual earnings of $62,294, while those with less than high school education have the smallest earnings of $22,145.
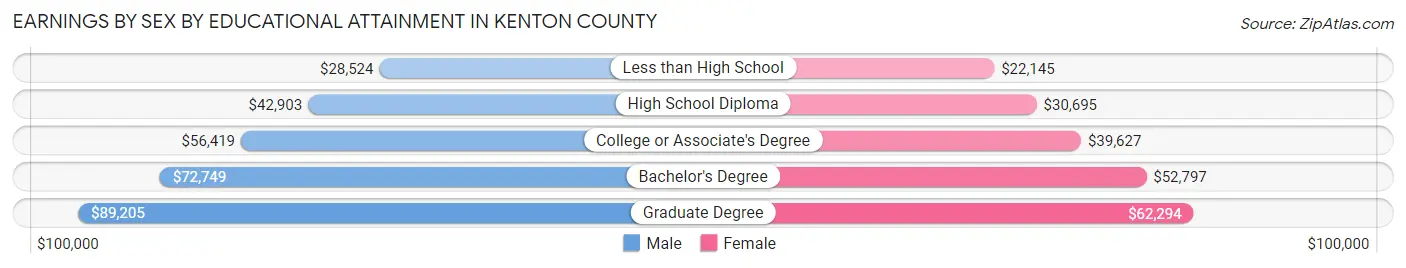
| Educational Attainment | Male Income | Female Income |
| Less than High School | $28,524 | $22,145 |
| High School Diploma | $42,903 | $30,695 |
| College or Associate's Degree | $56,419 | $39,627 |
| Bachelor's Degree | $72,749 | $52,797 |
| Graduate Degree | $89,205 | $62,294 |
| Total | $56,846 | $42,115 |
Family Income in Kenton County
Family Income Brackets in Kenton County
According to the Kenton County family income data, there are 9,816 families falling into the $100,000 to $149,999 income range, which is the most common income bracket and makes up 23.3% of all families. Conversely, the $10,000 to $14,999 income bracket is the least frequent group with only 716 families (1.7%) belonging to this category.
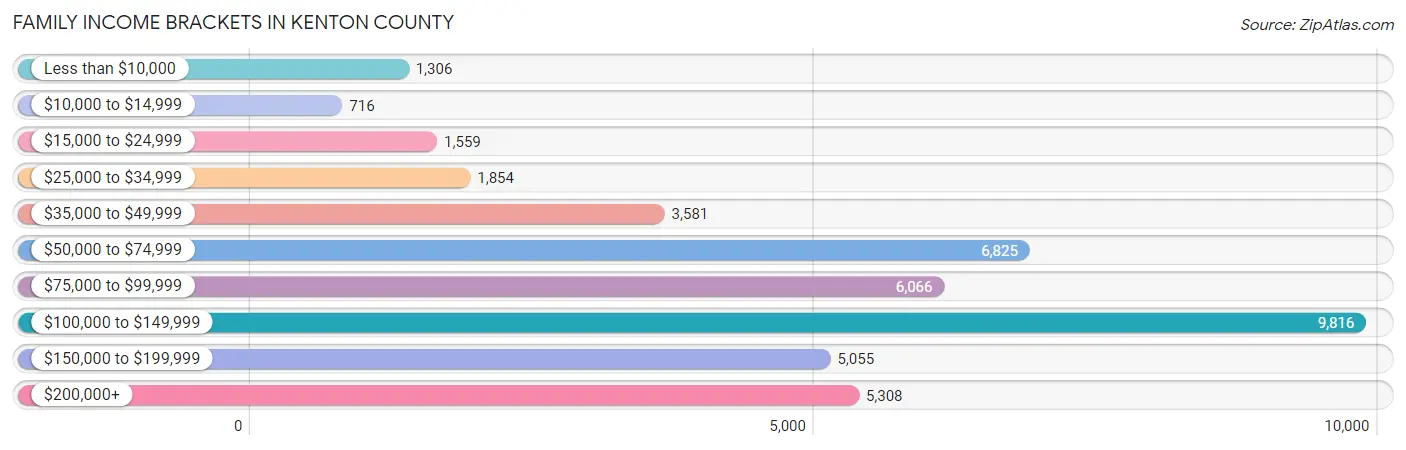
| Income Bracket | # Families | % Families |
| Less than $10,000 | 1,306 | 3.1% |
| $10,000 to $14,999 | 716 | 1.7% |
| $15,000 to $24,999 | 1,559 | 3.7% |
| $25,000 to $34,999 | 1,854 | 4.4% |
| $35,000 to $49,999 | 3,581 | 8.5% |
| $50,000 to $74,999 | 6,825 | 16.2% |
| $75,000 to $99,999 | 6,066 | 14.4% |
| $100,000 to $149,999 | 9,816 | 23.3% |
| $150,000 to $199,999 | 5,055 | 12.0% |
| $200,000+ | 5,308 | 12.6% |
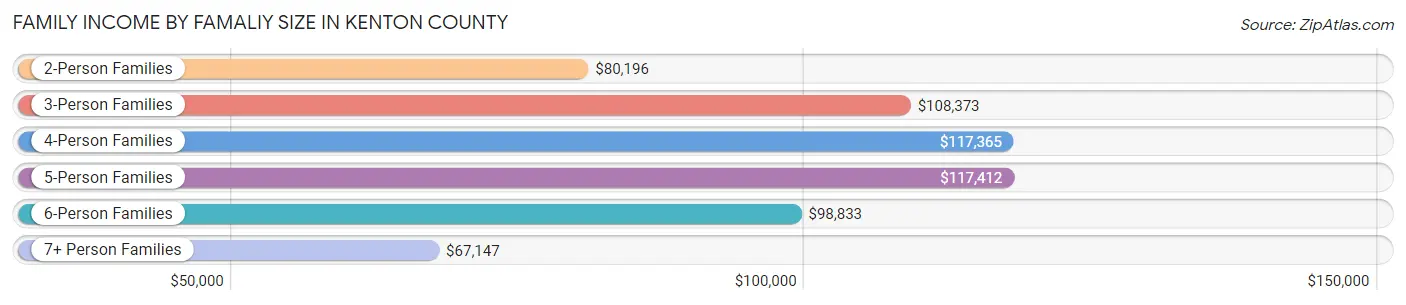
Family Income by Famaliy Size in Kenton County
5-person families (3,326 | 7.9%) account for the highest median family income in Kenton County with $117,412 per family, while 2-person families (19,853 | 47.1%) have the highest median income of $40,098 per family member.
| Income Bracket | # Families | Median Income |
| 2-Person Families | 19,853 (47.1%) | $80,196 |
| 3-Person Families | 9,014 (21.4%) | $108,373 |
| 4-Person Families | 7,999 (19.0%) | $117,365 |
| 5-Person Families | 3,326 (7.9%) | $117,412 |
| 6-Person Families | 1,184 (2.8%) | $98,833 |
| 7+ Person Families | 751 (1.8%) | $67,147 |
| Total | 42,127 (100.0%) | $95,611 |
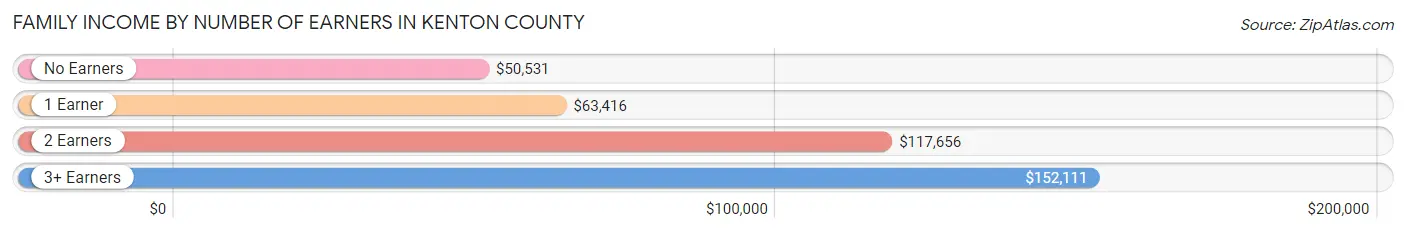
Family Income by Number of Earners in Kenton County
The median family income in Kenton County is $95,611, with families comprising 3+ earners (5,117) having the highest median family income of $152,111, while families with no earners (5,443) have the lowest median family income of $50,531, accounting for 12.1% and 12.9% of families, respectively.
| Number of Earners | # Families | Median Income |
| No Earners | 5,443 (12.9%) | $50,531 |
| 1 Earner | 11,909 (28.3%) | $63,416 |
| 2 Earners | 19,658 (46.7%) | $117,656 |
| 3+ Earners | 5,117 (12.1%) | $152,111 |
| Total | 42,127 (100.0%) | $95,611 |
Household Income in Kenton County
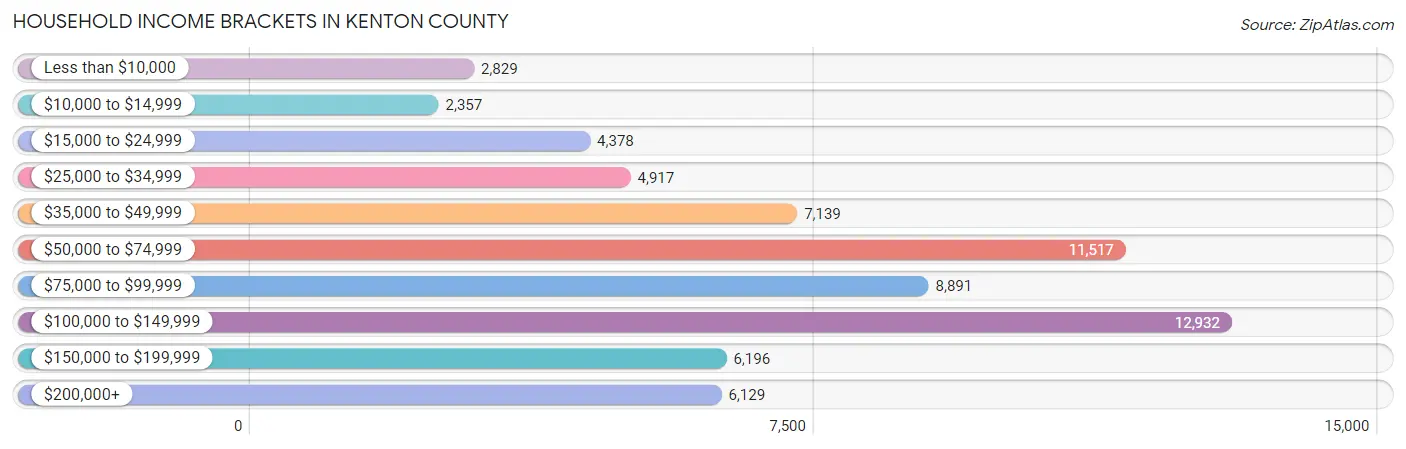
Household Income Brackets in Kenton County
With 12,932 households falling in the category, the $100,000 to $149,999 income range is the most frequent in Kenton County, accounting for 19.2% of all households. In contrast, only 2,357 households (3.5%) fall into the $10,000 to $14,999 income bracket, making it the least populous group.
| Income Bracket | # Households | % Households |
| Less than $10,000 | 2,829 | 4.2% |
| $10,000 to $14,999 | 2,357 | 3.5% |
| $15,000 to $24,999 | 4,378 | 6.5% |
| $25,000 to $34,999 | 4,917 | 7.3% |
| $35,000 to $49,999 | 7,139 | 10.6% |
| $50,000 to $74,999 | 11,517 | 17.1% |
| $75,000 to $99,999 | 8,891 | 13.2% |
| $100,000 to $149,999 | 12,932 | 19.2% |
| $150,000 to $199,999 | 6,196 | 9.2% |
| $200,000+ | 6,129 | 9.1% |
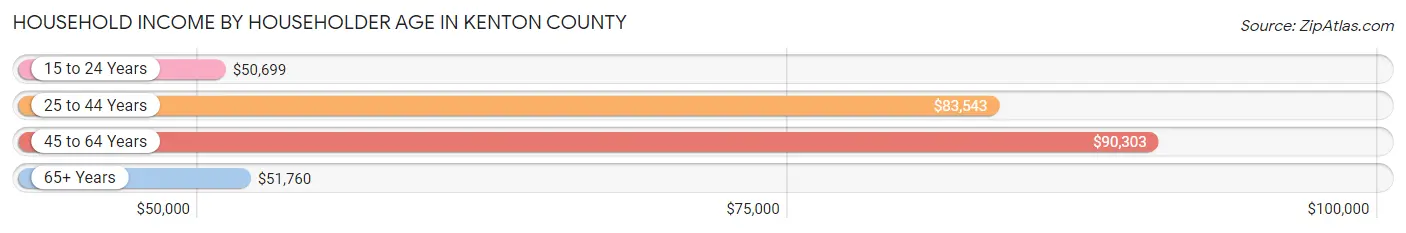
Household Income by Householder Age in Kenton County
The median household income in Kenton County is $76,016, with the highest median household income of $90,303 found in the 45 to 64 years age bracket for the primary householder. A total of 24,886 households (36.9%) fall into this category. Meanwhile, the 15 to 24 years age bracket for the primary householder has the lowest median household income of $50,699, with 2,375 households (3.5%) in this group.
| Income Bracket | # Households | Median Income |
| 15 to 24 Years | 2,375 (3.5%) | $50,699 |
| 25 to 44 Years | 24,380 (36.2%) | $83,543 |
| 45 to 64 Years | 24,886 (36.9%) | $90,303 |
| 65+ Years | 15,712 (23.3%) | $51,760 |
| Total | 67,353 (100.0%) | $76,016 |
Poverty in Kenton County
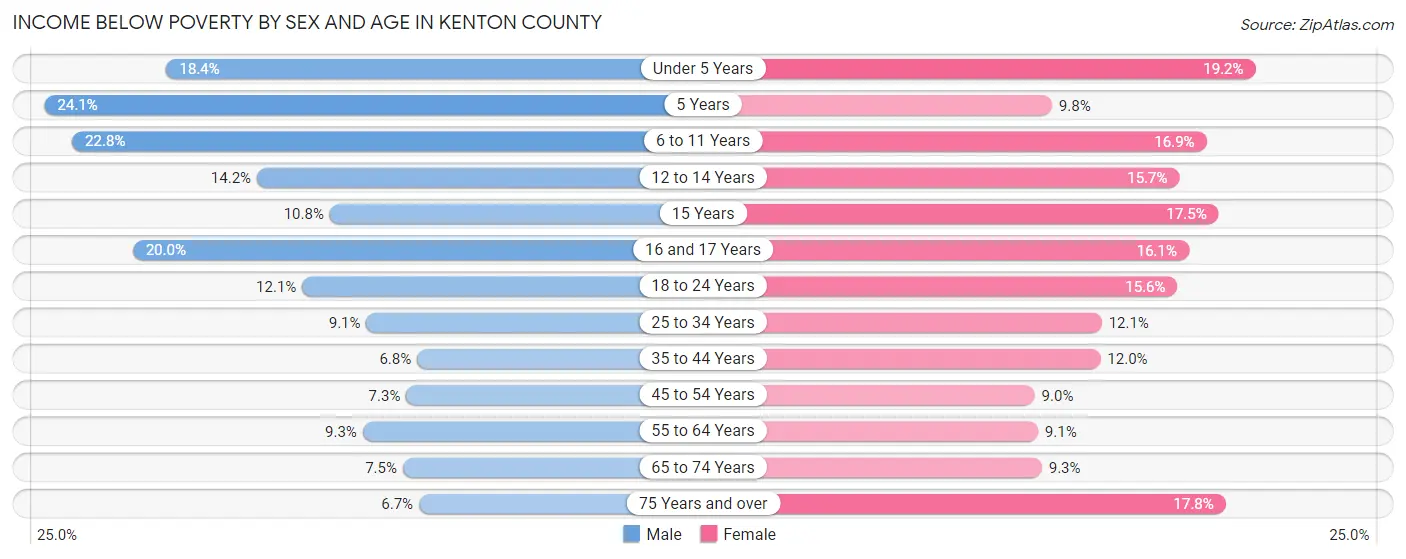
Income Below Poverty by Sex and Age in Kenton County
With 11.1% poverty level for males and 12.7% for females among the residents of Kenton County, 5 year old males and under 5 year old females are the most vulnerable to poverty, with 274 males (24.1%) and 998 females (19.2%) in their respective age groups living below the poverty level.
| Age Bracket | Male | Female |
| Under 5 Years | 992 (18.4%) | 998 (19.2%) |
| 5 Years | 274 (24.1%) | 110 (9.8%) |
| 6 to 11 Years | 1,665 (22.8%) | 1,029 (16.9%) |
| 12 to 14 Years | 397 (14.2%) | 537 (15.7%) |
| 15 Years | 132 (10.8%) | 161 (17.5%) |
| 16 and 17 Years | 449 (20.0%) | 368 (16.1%) |
| 18 to 24 Years | 849 (12.1%) | 1,011 (15.6%) |
| 25 to 34 Years | 1,136 (9.1%) | 1,484 (12.1%) |
| 35 to 44 Years | 767 (6.8%) | 1,330 (12.0%) |
| 45 to 54 Years | 742 (7.3%) | 908 (8.9%) |
| 55 to 64 Years | 1,033 (9.3%) | 1,021 (9.1%) |
| 65 to 74 Years | 559 (7.4%) | 750 (9.3%) |
| 75 Years and over | 246 (6.7%) | 974 (17.8%) |
| Total | 9,241 (11.1%) | 10,681 (12.7%) |
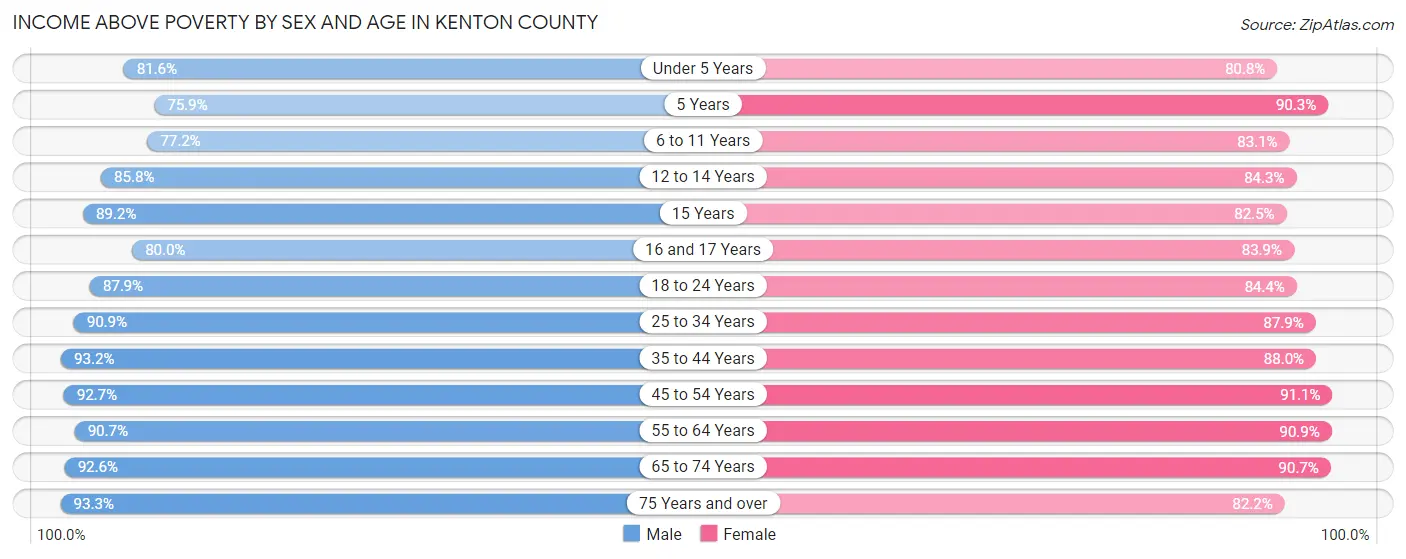
Income Above Poverty by Sex and Age in Kenton County
According to the poverty statistics in Kenton County, males aged 75 years and over and females aged 45 to 54 years are the age groups that are most secure financially, with 93.3% of males and 91.0% of females in these age groups living above the poverty line.
| Age Bracket | Male | Female |
| Under 5 Years | 4,394 (81.6%) | 4,202 (80.8%) |
| 5 Years | 864 (75.9%) | 1,018 (90.2%) |
| 6 to 11 Years | 5,638 (77.2%) | 5,053 (83.1%) |
| 12 to 14 Years | 2,395 (85.8%) | 2,892 (84.3%) |
| 15 Years | 1,086 (89.2%) | 760 (82.5%) |
| 16 and 17 Years | 1,798 (80.0%) | 1,918 (83.9%) |
| 18 to 24 Years | 6,154 (87.9%) | 5,481 (84.4%) |
| 25 to 34 Years | 11,298 (90.9%) | 10,819 (87.9%) |
| 35 to 44 Years | 10,531 (93.2%) | 9,756 (88.0%) |
| 45 to 54 Years | 9,438 (92.7%) | 9,242 (91.0%) |
| 55 to 64 Years | 10,059 (90.7%) | 10,195 (90.9%) |
| 65 to 74 Years | 6,941 (92.5%) | 7,334 (90.7%) |
| 75 Years and over | 3,426 (93.3%) | 4,494 (82.2%) |
| Total | 74,022 (88.9%) | 73,164 (87.3%) |
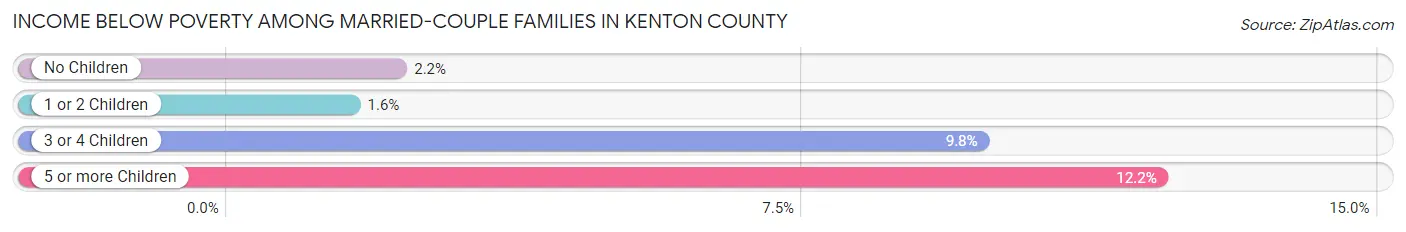
Income Below Poverty Among Married-Couple Families in Kenton County
The poverty statistics for married-couple families in Kenton County show that 2.8% or 874 of the total 31,030 families live below the poverty line. Families with 5 or more children have the highest poverty rate of 12.1%, comprising of 39 families. On the other hand, families with 1 or 2 children have the lowest poverty rate of 1.6%, which includes 156 families.
| Children | Above Poverty | Below Poverty |
| No Children | 17,726 (97.8%) | 400 (2.2%) |
| 1 or 2 Children | 9,583 (98.4%) | 156 (1.6%) |
| 3 or 4 Children | 2,565 (90.2%) | 279 (9.8%) |
| 5 or more Children | 282 (87.8%) | 39 (12.1%) |
| Total | 30,156 (97.2%) | 874 (2.8%) |
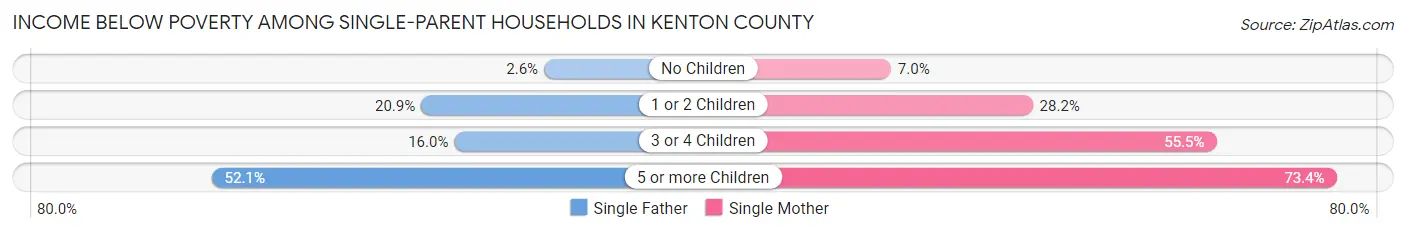
Income Below Poverty Among Single-Parent Households in Kenton County
According to the poverty data in Kenton County, 14.8% or 516 single-father households and 25.4% or 1,931 single-mother households are living below the poverty line. Among single-father households, those with 5 or more children have the highest poverty rate, with 49 households (52.1%) experiencing poverty. Likewise, among single-mother households, those with 5 or more children have the highest poverty rate, with 174 households (73.4%) falling below the poverty line.
| Children | Single Father | Single Mother |
| No Children | 32 (2.6%) | 198 (7.0%) |
| 1 or 2 Children | 373 (20.9%) | 997 (28.2%) |
| 3 or 4 Children | 62 (16.0%) | 562 (55.5%) |
| 5 or more Children | 49 (52.1%) | 174 (73.4%) |
| Total | 516 (14.8%) | 1,931 (25.4%) |
Income Below Poverty Among Married-Couple vs Single-Parent Households in Kenton County
The poverty data for Kenton County shows that 874 of the married-couple family households (2.8%) and 2,447 of the single-parent households (22.1%) are living below the poverty level. Within the married-couple family households, those with 5 or more children have the highest poverty rate, with 39 households (12.1%) falling below the poverty line. Among the single-parent households, those with 5 or more children have the highest poverty rate, with 223 household (67.4%) living below poverty.
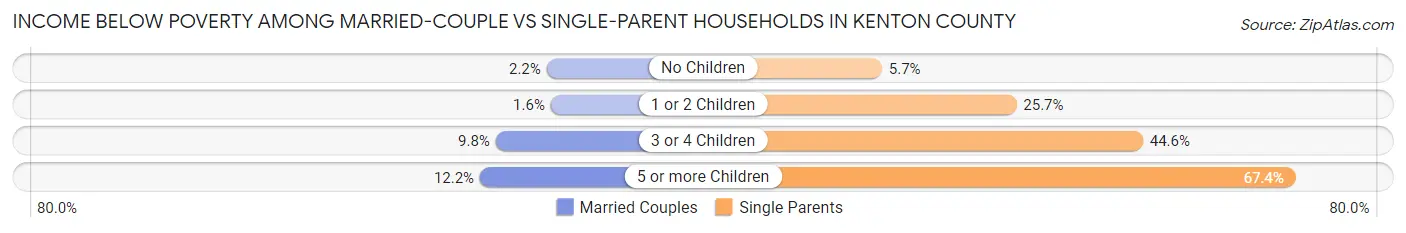
| Children | Married-Couple Families | Single-Parent Households |
| No Children | 400 (2.2%) | 230 (5.7%) |
| 1 or 2 Children | 156 (1.6%) | 1,370 (25.7%) |
| 3 or 4 Children | 279 (9.8%) | 624 (44.6%) |
| 5 or more Children | 39 (12.1%) | 223 (67.4%) |
| Total | 874 (2.8%) | 2,447 (22.1%) |
Employment Characteristics in Kenton County
Employment by Class of Employer in Kenton County
Among the 87,466 employed individuals in Kenton County, private company employees (63,816 | 73.0%), not-for-profit organizations (9,316 | 10.6%), and local government employees (4,834 | 5.5%) make up the most common classes of employment.
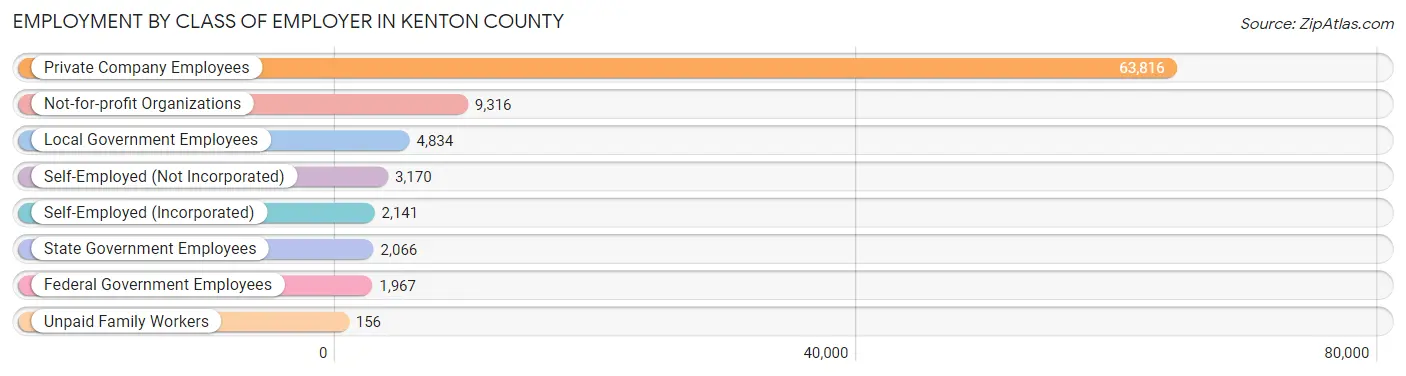
| Employer Class | # Employees | % Employees |
| Private Company Employees | 63,816 | 73.0% |
| Self-Employed (Incorporated) | 2,141 | 2.5% |
| Self-Employed (Not Incorporated) | 3,170 | 3.6% |
| Not-for-profit Organizations | 9,316 | 10.6% |
| Local Government Employees | 4,834 | 5.5% |
| State Government Employees | 2,066 | 2.4% |
| Federal Government Employees | 1,967 | 2.2% |
| Unpaid Family Workers | 156 | 0.2% |
| Total | 87,466 | 100.0% |
Employment Status by Age in Kenton County
According to the labor force statistics for Kenton County, out of the total population over 16 years of age (133,999), 69.3% or 92,861 individuals are in the labor force, with 4.4% or 4,086 of them unemployed. The age group with the highest labor force participation rate is 25 to 29 years, with 88.6% or 10,986 individuals in the labor force. Within the labor force, the 16 to 19 years age range has the highest percentage of unemployed individuals, with 12.3% or 531 of them being unemployed.
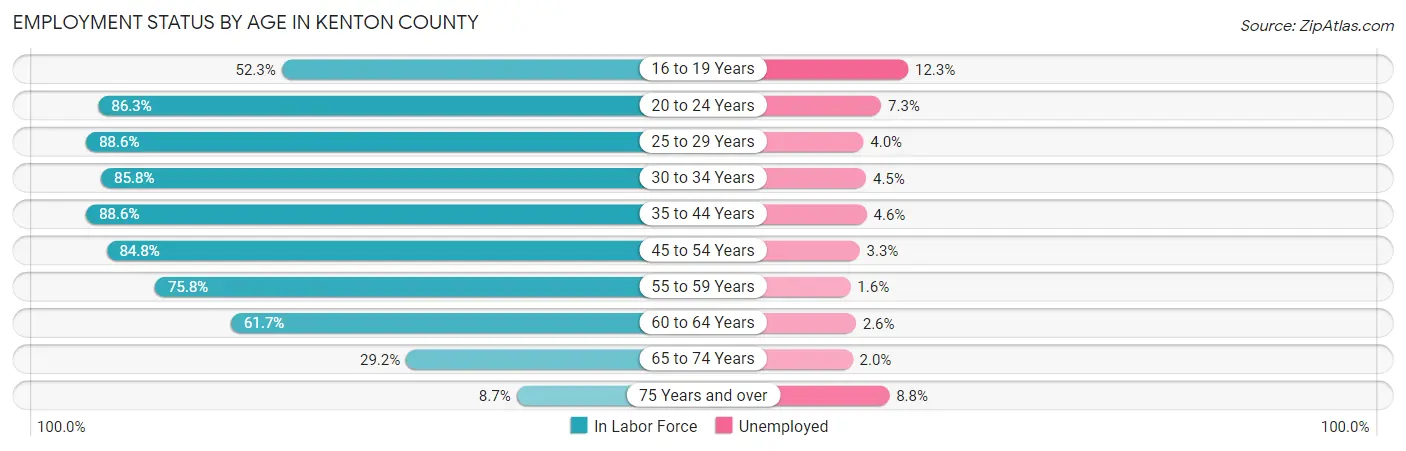
| Age Bracket | In Labor Force | Unemployed |
| 16 to 19 Years | 4,316 (52.3%) | 531 (12.3%) |
| 20 to 24 Years | 8,817 (86.3%) | 644 (7.3%) |
| 25 to 29 Years | 10,986 (88.6%) | 439 (4.0%) |
| 30 to 34 Years | 10,709 (85.8%) | 482 (4.5%) |
| 35 to 44 Years | 19,930 (88.6%) | 917 (4.6%) |
| 45 to 54 Years | 17,298 (84.8%) | 571 (3.3%) |
| 55 to 59 Years | 8,277 (75.8%) | 132 (1.6%) |
| 60 to 64 Years | 7,072 (61.7%) | 184 (2.6%) |
| 65 to 74 Years | 4,600 (29.2%) | 92 (2.0%) |
| 75 Years and over | 837 (8.7%) | 74 (8.8%) |
| Total | 92,861 (69.3%) | 4,086 (4.4%) |
Employment Status by Educational Attainment in Kenton County
According to labor force statistics for Kenton County, 82.4% of individuals (74,288) out of the total population between 25 and 64 years of age (90,155) are in the labor force, with 3.7% or 2,749 of them being unemployed. The group with the highest labor force participation rate are those with the educational attainment of bachelor's degree or higher, with 91.3% or 31,882 individuals in the labor force. Within the labor force, individuals with less than high school education have the highest percentage of unemployment, with 6.9% or 276 of them being unemployed.

| Educational Attainment | In Labor Force | Unemployed |
| Less than High School | 4,001 (58.7%) | 470 (6.9%) |
| High School Diploma | 16,706 (74.5%) | 1,144 (5.1%) |
| College / Associate Degree | 21,680 (83.4%) | 1,248 (4.8%) |
| Bachelor's Degree or higher | 31,882 (91.3%) | 629 (1.8%) |
| Total | 74,288 (82.4%) | 3,336 (3.7%) |
Employment Occupations by Sex in Kenton County
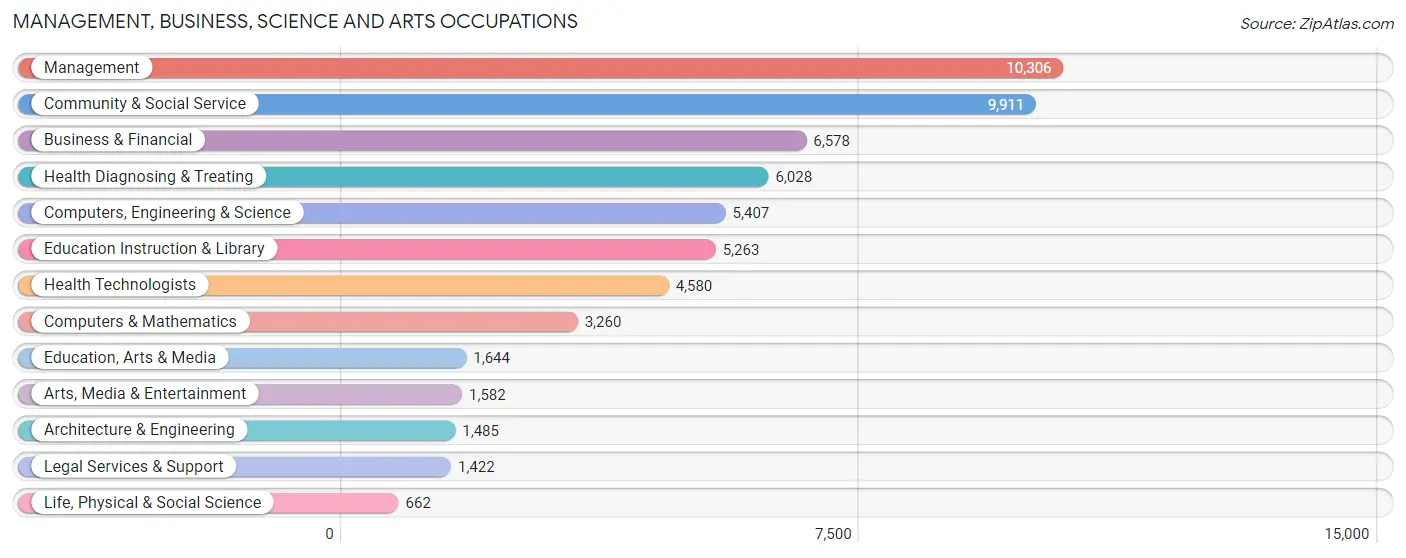
Management, Business, Science and Arts Occupations
The most common Management, Business, Science and Arts occupations in Kenton County are Management (10,306 | 11.6%), Community & Social Service (9,911 | 11.2%), Business & Financial (6,578 | 7.4%), Health Diagnosing & Treating (6,028 | 6.8%), and Computers, Engineering & Science (5,407 | 6.1%).
Management, Business, Science and Arts Occupations by Sex
Within the Management, Business, Science and Arts occupations in Kenton County, the most male-oriented occupations are Architecture & Engineering (87.7%), Computers & Mathematics (72.6%), and Computers, Engineering & Science (71.1%), while the most female-oriented occupations are Education Instruction & Library (75.0%), Health Technologists (74.5%), and Health Diagnosing & Treating (74.3%).
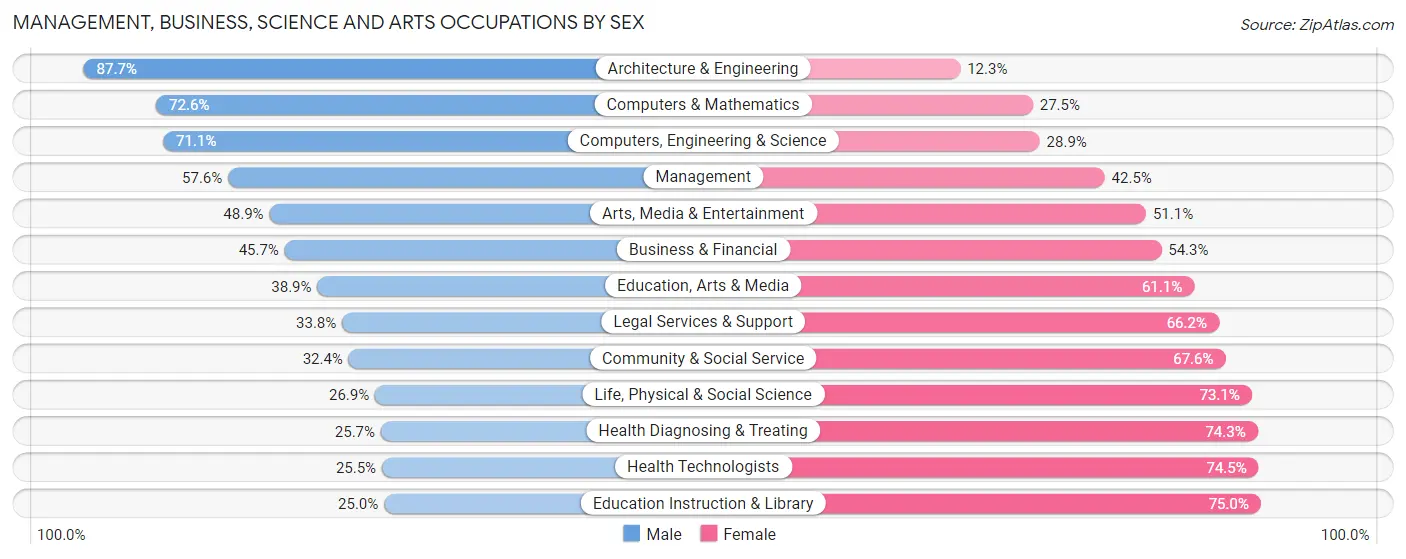
| Occupation | Male | Female |
| Management | 5,931 (57.6%) | 4,375 (42.4%) |
| Business & Financial | 3,009 (45.7%) | 3,569 (54.3%) |
| Computers, Engineering & Science | 3,845 (71.1%) | 1,562 (28.9%) |
| Computers & Mathematics | 2,365 (72.6%) | 895 (27.5%) |
| Architecture & Engineering | 1,302 (87.7%) | 183 (12.3%) |
| Life, Physical & Social Science | 178 (26.9%) | 484 (73.1%) |
| Community & Social Service | 3,210 (32.4%) | 6,701 (67.6%) |
| Education, Arts & Media | 640 (38.9%) | 1,004 (61.1%) |
| Legal Services & Support | 480 (33.8%) | 942 (66.2%) |
| Education Instruction & Library | 1,316 (25.0%) | 3,947 (75.0%) |
| Arts, Media & Entertainment | 774 (48.9%) | 808 (51.1%) |
| Health Diagnosing & Treating | 1,548 (25.7%) | 4,480 (74.3%) |
| Health Technologists | 1,166 (25.5%) | 3,414 (74.5%) |
| Total (Category) | 17,543 (45.9%) | 20,687 (54.1%) |
| Total (Overall) | 46,350 (52.2%) | 42,356 (47.7%) |
Services Occupations
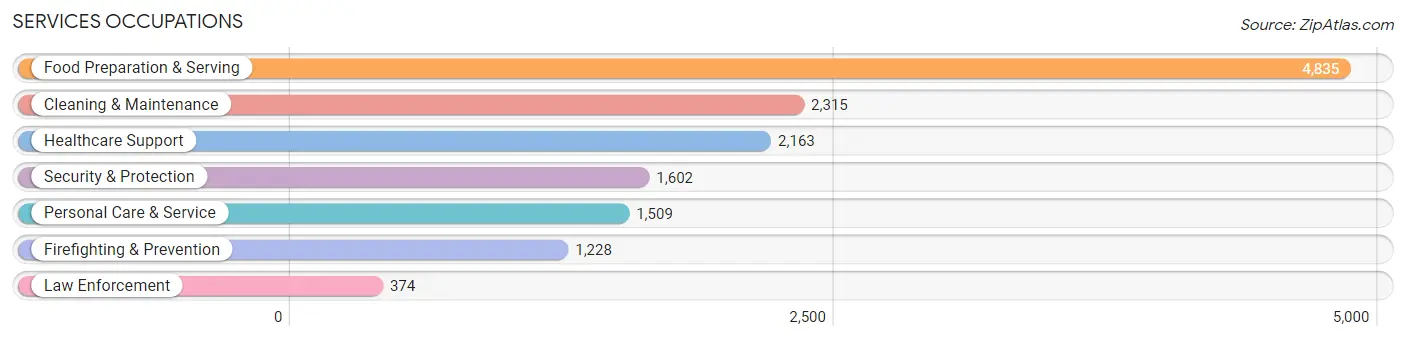
The most common Services occupations in Kenton County are Food Preparation & Serving (4,835 | 5.4%), Cleaning & Maintenance (2,315 | 2.6%), Healthcare Support (2,163 | 2.4%), Security & Protection (1,602 | 1.8%), and Personal Care & Service (1,509 | 1.7%).
Services Occupations by Sex
Within the Services occupations in Kenton County, the most male-oriented occupations are Law Enforcement (87.4%), Security & Protection (87.4%), and Firefighting & Prevention (87.4%), while the most female-oriented occupations are Healthcare Support (88.7%), Personal Care & Service (80.6%), and Food Preparation & Serving (60.7%).
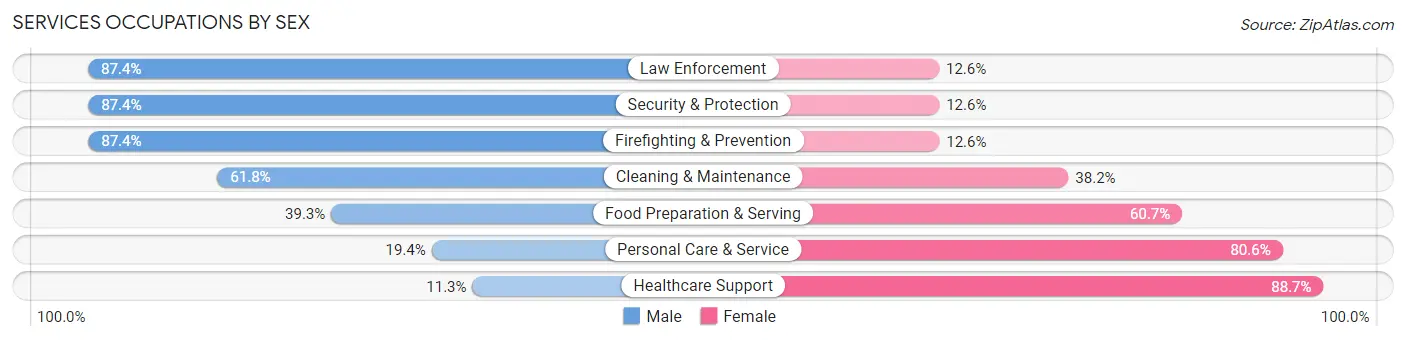
| Occupation | Male | Female |
| Healthcare Support | 245 (11.3%) | 1,918 (88.7%) |
| Security & Protection | 1,400 (87.4%) | 202 (12.6%) |
| Firefighting & Prevention | 1,073 (87.4%) | 155 (12.6%) |
| Law Enforcement | 327 (87.4%) | 47 (12.6%) |
| Food Preparation & Serving | 1,900 (39.3%) | 2,935 (60.7%) |
| Cleaning & Maintenance | 1,431 (61.8%) | 884 (38.2%) |
| Personal Care & Service | 293 (19.4%) | 1,216 (80.6%) |
| Total (Category) | 5,269 (42.4%) | 7,155 (57.6%) |
| Total (Overall) | 46,350 (52.2%) | 42,356 (47.7%) |
Sales and Office Occupations
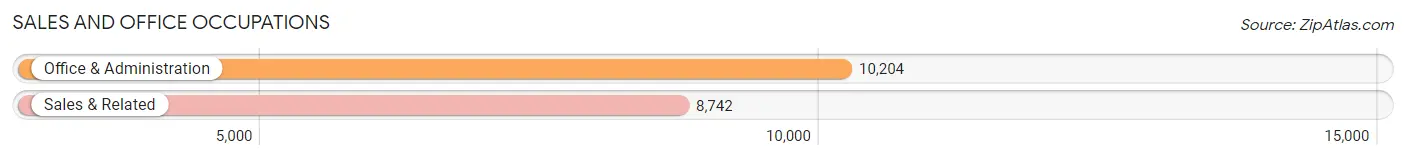
The most common Sales and Office occupations in Kenton County are Office & Administration (10,204 | 11.5%), and Sales & Related (8,742 | 9.9%).
Sales and Office Occupations by Sex
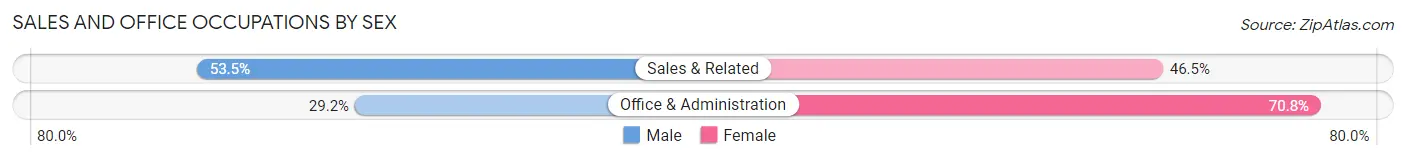
| Occupation | Male | Female |
| Sales & Related | 4,677 (53.5%) | 4,065 (46.5%) |
| Office & Administration | 2,978 (29.2%) | 7,226 (70.8%) |
| Total (Category) | 7,655 (40.4%) | 11,291 (59.6%) |
| Total (Overall) | 46,350 (52.2%) | 42,356 (47.7%) |
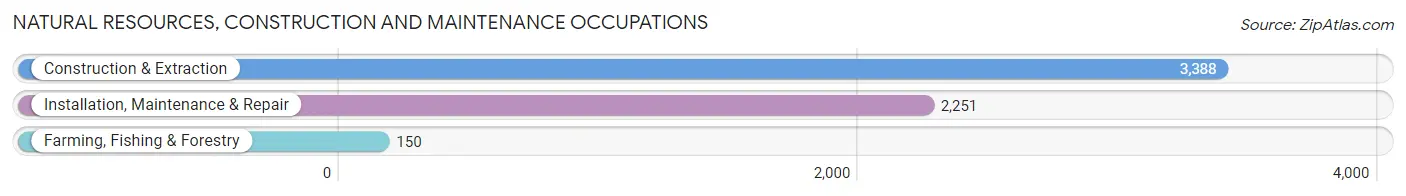
Natural Resources, Construction and Maintenance Occupations
The most common Natural Resources, Construction and Maintenance occupations in Kenton County are Construction & Extraction (3,388 | 3.8%), Installation, Maintenance & Repair (2,251 | 2.5%), and Farming, Fishing & Forestry (150 | 0.2%).
Natural Resources, Construction and Maintenance Occupations by Sex
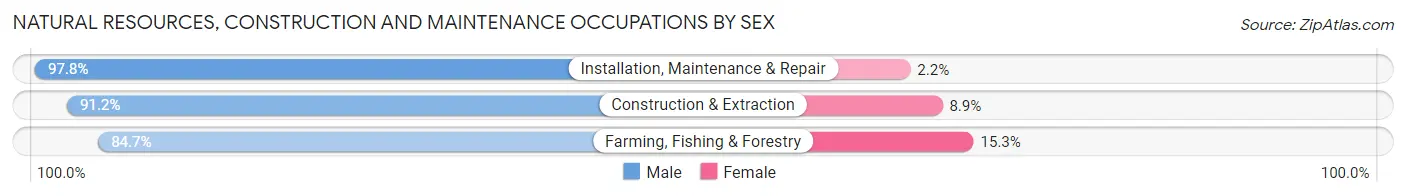
| Occupation | Male | Female |
| Farming, Fishing & Forestry | 127 (84.7%) | 23 (15.3%) |
| Construction & Extraction | 3,088 (91.1%) | 300 (8.8%) |
| Installation, Maintenance & Repair | 2,202 (97.8%) | 49 (2.2%) |
| Total (Category) | 5,417 (93.6%) | 372 (6.4%) |
| Total (Overall) | 46,350 (52.2%) | 42,356 (47.7%) |
Production, Transportation and Moving Occupations
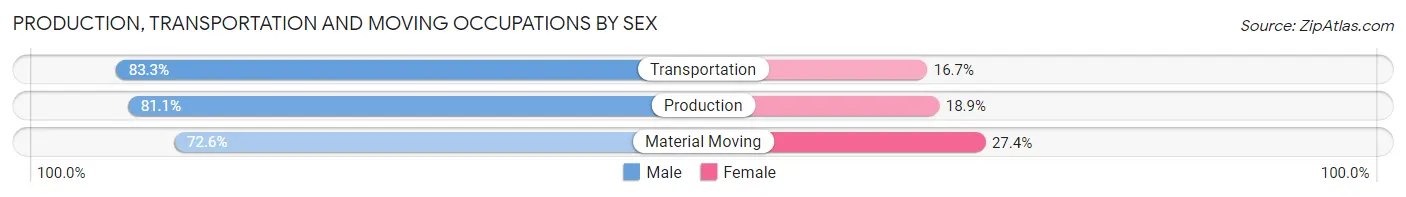
The most common Production, Transportation and Moving occupations in Kenton County are Production (5,649 | 6.4%), Material Moving (4,658 | 5.2%), and Transportation (3,010 | 3.4%).
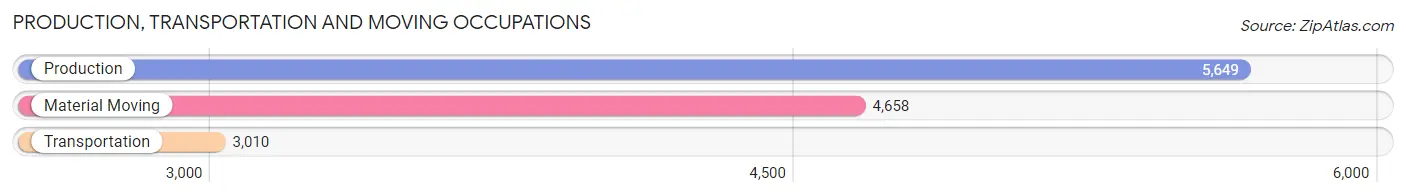
Production, Transportation and Moving Occupations by Sex
| Occupation | Male | Female |
| Production | 4,579 (81.1%) | 1,070 (18.9%) |
| Transportation | 2,506 (83.3%) | 504 (16.7%) |
| Material Moving | 3,381 (72.6%) | 1,277 (27.4%) |
| Total (Category) | 10,466 (78.6%) | 2,851 (21.4%) |
| Total (Overall) | 46,350 (52.2%) | 42,356 (47.7%) |
Employment Industries by Sex in Kenton County
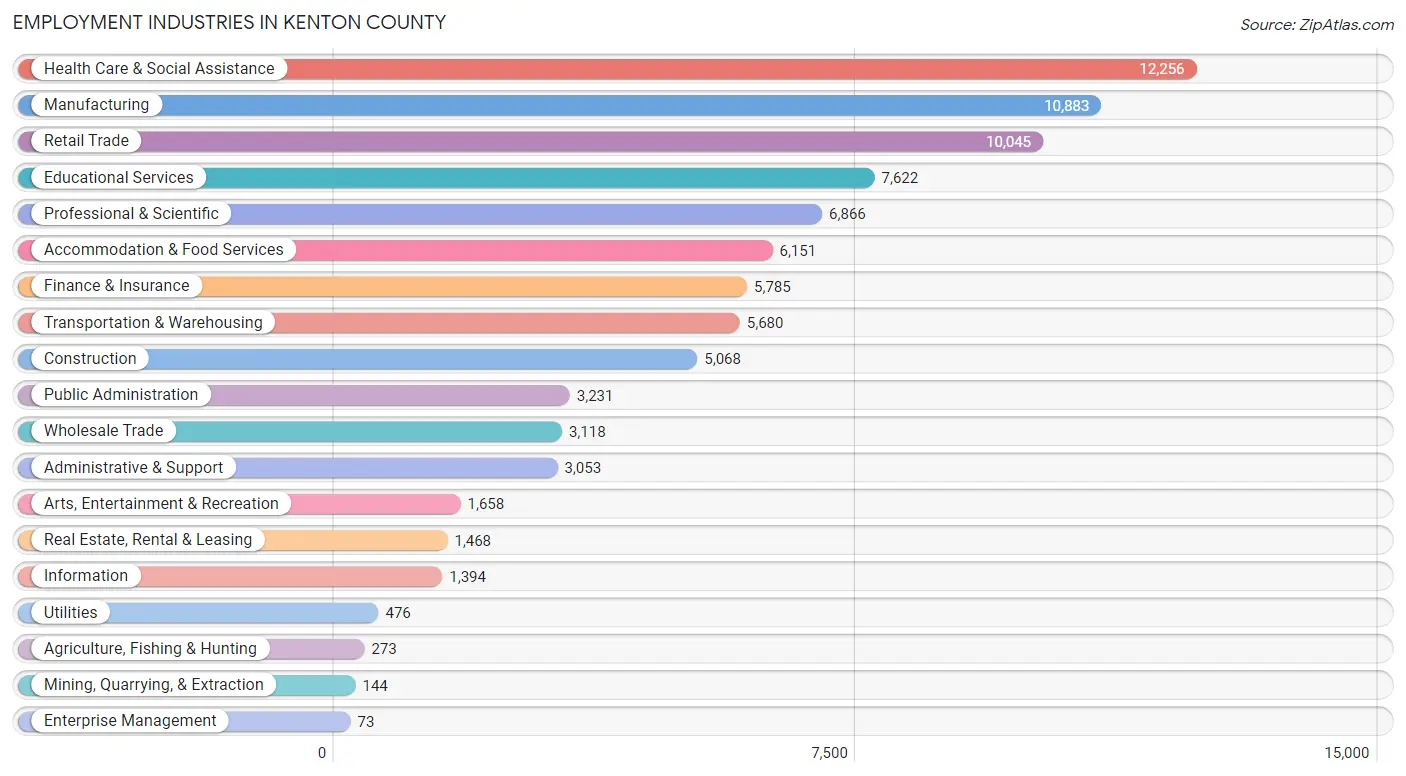
Employment Industries in Kenton County
The major employment industries in Kenton County include Health Care & Social Assistance (12,256 | 13.8%), Manufacturing (10,883 | 12.3%), Retail Trade (10,045 | 11.3%), Educational Services (7,622 | 8.6%), and Professional & Scientific (6,866 | 7.7%).
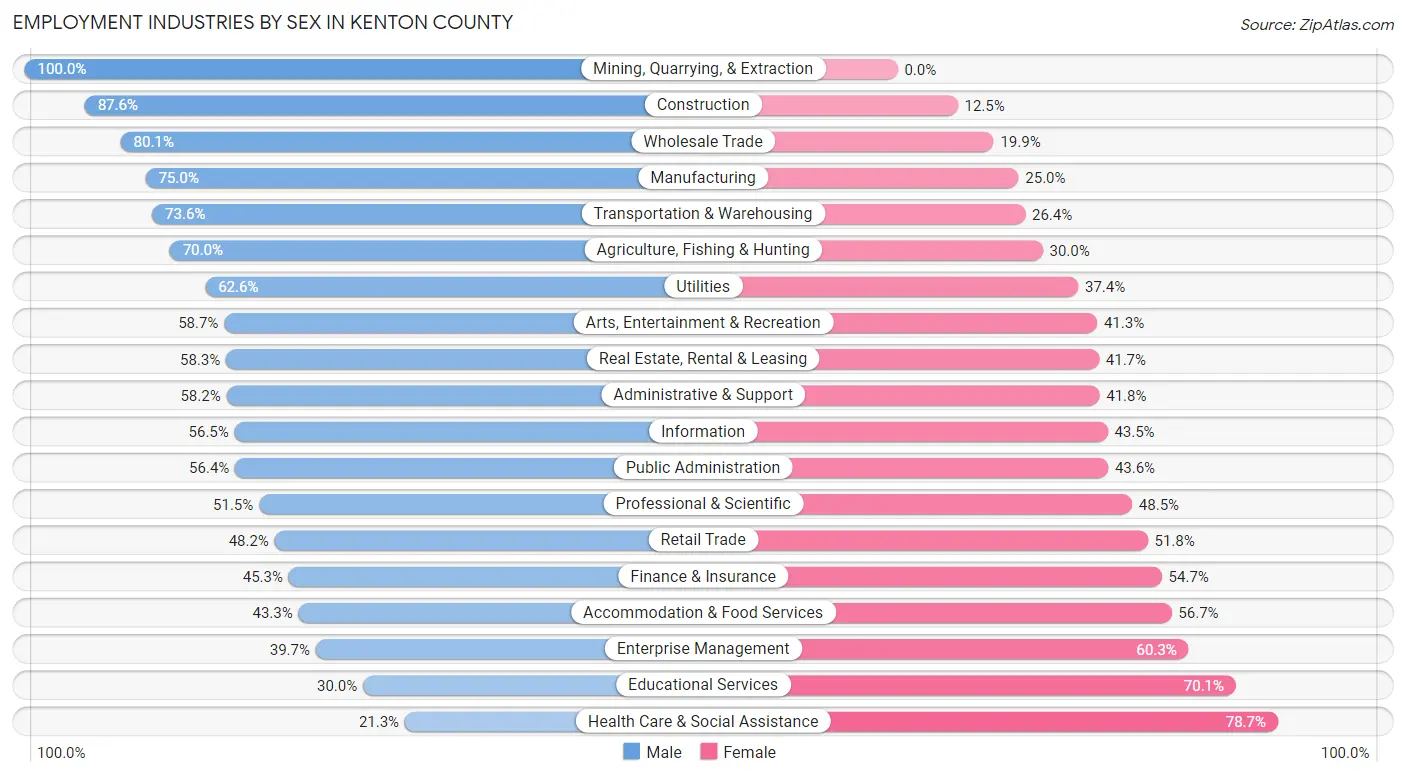
Employment Industries by Sex in Kenton County
The Kenton County industries that see more men than women are Mining, Quarrying, & Extraction (100.0%), Construction (87.5%), and Wholesale Trade (80.1%), whereas the industries that tend to have a higher number of women are Health Care & Social Assistance (78.7%), Educational Services (70.1%), and Enterprise Management (60.3%).
| Industry | Male | Female |
| Agriculture, Fishing & Hunting | 191 (70.0%) | 82 (30.0%) |
| Mining, Quarrying, & Extraction | 144 (100.0%) | 0 (0.0%) |
| Construction | 4,437 (87.5%) | 631 (12.4%) |
| Manufacturing | 8,159 (75.0%) | 2,724 (25.0%) |
| Wholesale Trade | 2,498 (80.1%) | 620 (19.9%) |
| Retail Trade | 4,845 (48.2%) | 5,200 (51.8%) |
| Transportation & Warehousing | 4,180 (73.6%) | 1,500 (26.4%) |
| Utilities | 298 (62.6%) | 178 (37.4%) |
| Information | 788 (56.5%) | 606 (43.5%) |
| Finance & Insurance | 2,621 (45.3%) | 3,164 (54.7%) |
| Real Estate, Rental & Leasing | 856 (58.3%) | 612 (41.7%) |
| Professional & Scientific | 3,533 (51.5%) | 3,333 (48.5%) |
| Enterprise Management | 29 (39.7%) | 44 (60.3%) |
| Administrative & Support | 1,777 (58.2%) | 1,276 (41.8%) |
| Educational Services | 2,283 (29.9%) | 5,339 (70.1%) |
| Health Care & Social Assistance | 2,607 (21.3%) | 9,649 (78.7%) |
| Arts, Entertainment & Recreation | 973 (58.7%) | 685 (41.3%) |
| Accommodation & Food Services | 2,663 (43.3%) | 3,488 (56.7%) |
| Public Administration | 1,823 (56.4%) | 1,408 (43.6%) |
| Total | 46,350 (52.2%) | 42,356 (47.7%) |
Education in Kenton County
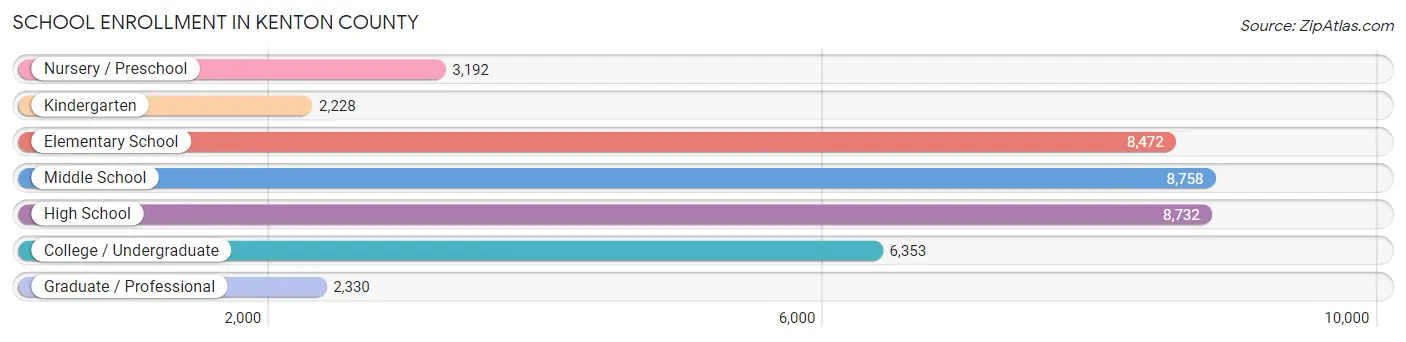
School Enrollment in Kenton County
The most common levels of schooling among the 40,065 students in Kenton County are middle school (8,758 | 21.9%), high school (8,732 | 21.8%), and elementary school (8,472 | 21.1%).
| School Level | # Students | % Students |
| Nursery / Preschool | 3,192 | 8.0% |
| Kindergarten | 2,228 | 5.6% |
| Elementary School | 8,472 | 21.1% |
| Middle School | 8,758 | 21.9% |
| High School | 8,732 | 21.8% |
| College / Undergraduate | 6,353 | 15.9% |
| Graduate / Professional | 2,330 | 5.8% |
| Total | 40,065 | 100.0% |
School Enrollment by Age by Funding Source in Kenton County
Out of a total of 40,065 students who are enrolled in schools in Kenton County, 9,856 (24.6%) attend a private institution, while the remaining 30,209 (75.4%) are enrolled in public schools. The age group of 3 to 4 year olds has the highest likelihood of being enrolled in private schools, with 1,227 (54.8% in the age bracket) enrolled. Conversely, the age group of 20 to 24 year olds has the lowest likelihood of being enrolled in a private school, with 2,802 (81.6% in the age bracket) attending a public institution.
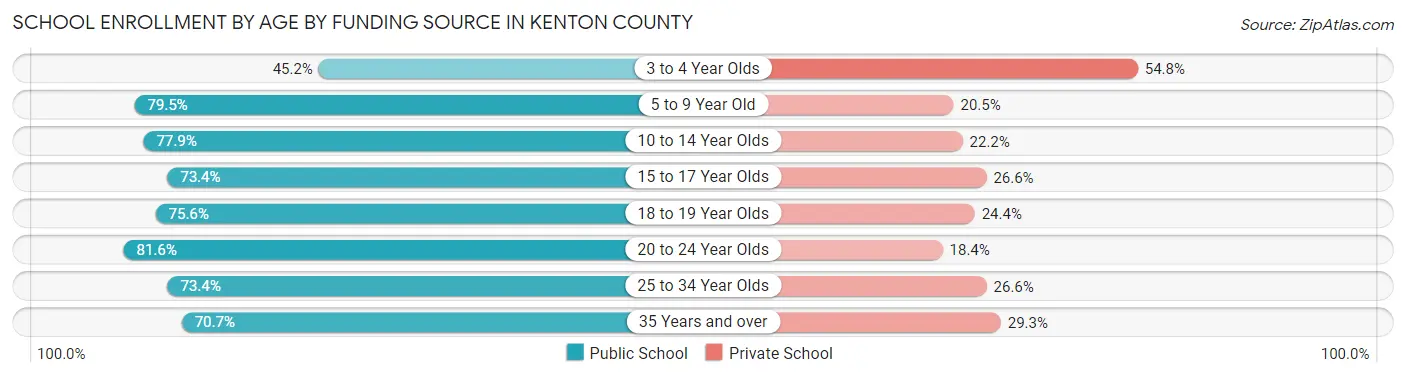
| Age Bracket | Public School | Private School |
| 3 to 4 Year Olds | 1,013 (45.2%) | 1,227 (54.8%) |
| 5 to 9 Year Old | 8,458 (79.5%) | 2,176 (20.5%) |
| 10 to 14 Year Olds | 8,215 (77.8%) | 2,337 (22.2%) |
| 15 to 17 Year Olds | 4,873 (73.4%) | 1,765 (26.6%) |
| 18 to 19 Year Olds | 1,827 (75.6%) | 590 (24.4%) |
| 20 to 24 Year Olds | 2,802 (81.6%) | 633 (18.4%) |
| 25 to 34 Year Olds | 1,836 (73.4%) | 666 (26.6%) |
| 35 Years and over | 1,165 (70.7%) | 482 (29.3%) |
| Total | 30,209 (75.4%) | 9,856 (24.6%) |
Educational Attainment by Field of Study in Kenton County
Business (10,985 | 24.1%), education (4,953 | 10.9%), science & technology (4,675 | 10.2%), arts & humanities (3,807 | 8.4%), and social sciences (2,840 | 6.2%) are the most common fields of study among 45,608 individuals in Kenton County who have obtained a bachelor's degree or higher.
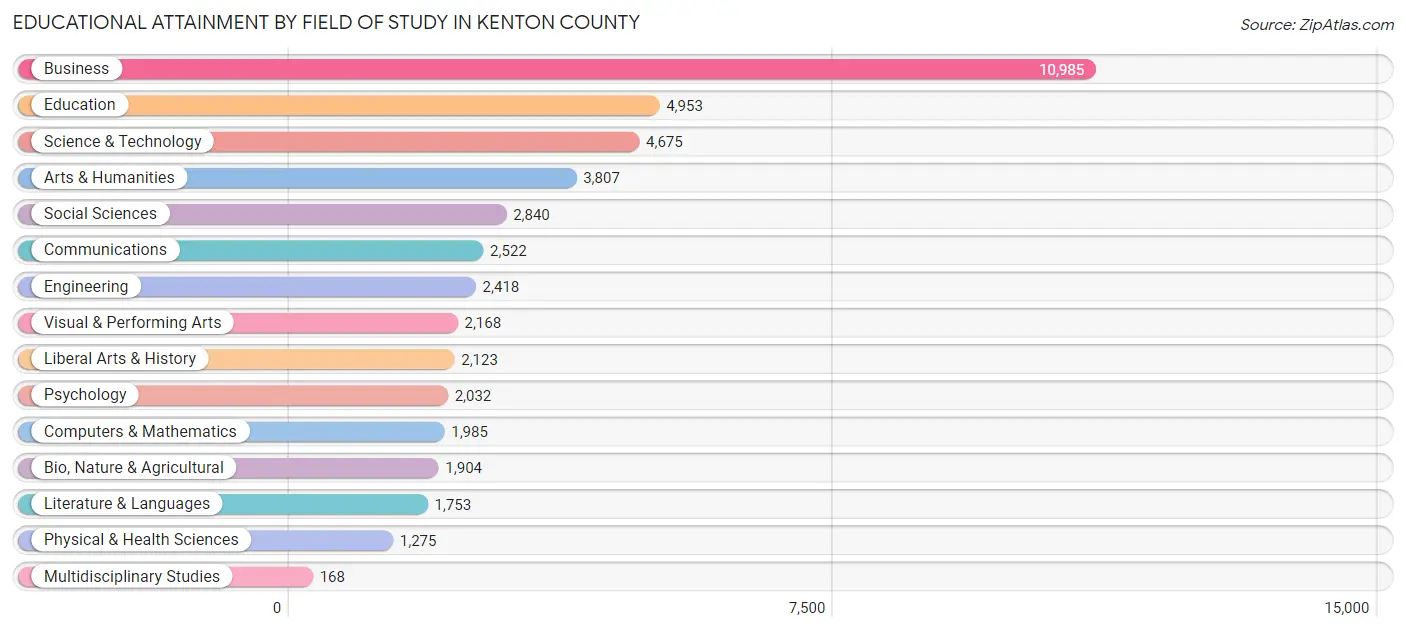
| Field of Study | # Graduates | % Graduates |
| Computers & Mathematics | 1,985 | 4.3% |
| Bio, Nature & Agricultural | 1,904 | 4.2% |
| Physical & Health Sciences | 1,275 | 2.8% |
| Psychology | 2,032 | 4.5% |
| Social Sciences | 2,840 | 6.2% |
| Engineering | 2,418 | 5.3% |
| Multidisciplinary Studies | 168 | 0.4% |
| Science & Technology | 4,675 | 10.2% |
| Business | 10,985 | 24.1% |
| Education | 4,953 | 10.9% |
| Literature & Languages | 1,753 | 3.8% |
| Liberal Arts & History | 2,123 | 4.6% |
| Visual & Performing Arts | 2,168 | 4.8% |
| Communications | 2,522 | 5.5% |
| Arts & Humanities | 3,807 | 8.4% |
| Total | 45,608 | 100.0% |
Transportation & Commute in Kenton County
Vehicle Availability by Sex in Kenton County
The most prevalent vehicle ownership categories in Kenton County are males with 2 vehicles (20,760, accounting for 45.4%) and females with 2 vehicles (18,655, making up 50.1%).
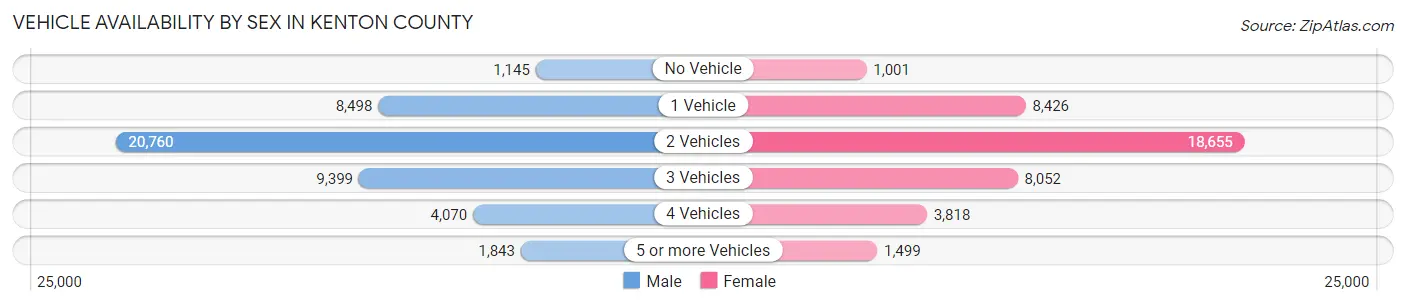
| Vehicles Available | Male | Female |
| No Vehicle | 1,145 (2.5%) | 1,001 (2.4%) |
| 1 Vehicle | 8,498 (18.6%) | 8,426 (20.3%) |
| 2 Vehicles | 20,760 (45.4%) | 18,655 (45.0%) |
| 3 Vehicles | 9,399 (20.6%) | 8,052 (19.4%) |
| 4 Vehicles | 4,070 (8.9%) | 3,818 (9.2%) |
| 5 or more Vehicles | 1,843 (4.0%) | 1,499 (3.6%) |
| Total | 45,715 (100.0%) | 41,451 (100.0%) |
Commute Time in Kenton County
The most frequently occuring commute durations in Kenton County are 15 to 19 minutes (16,047 commuters, 20.6%), 20 to 24 minutes (14,507 commuters, 18.6%), and 10 to 14 minutes (11,651 commuters, 15.0%).
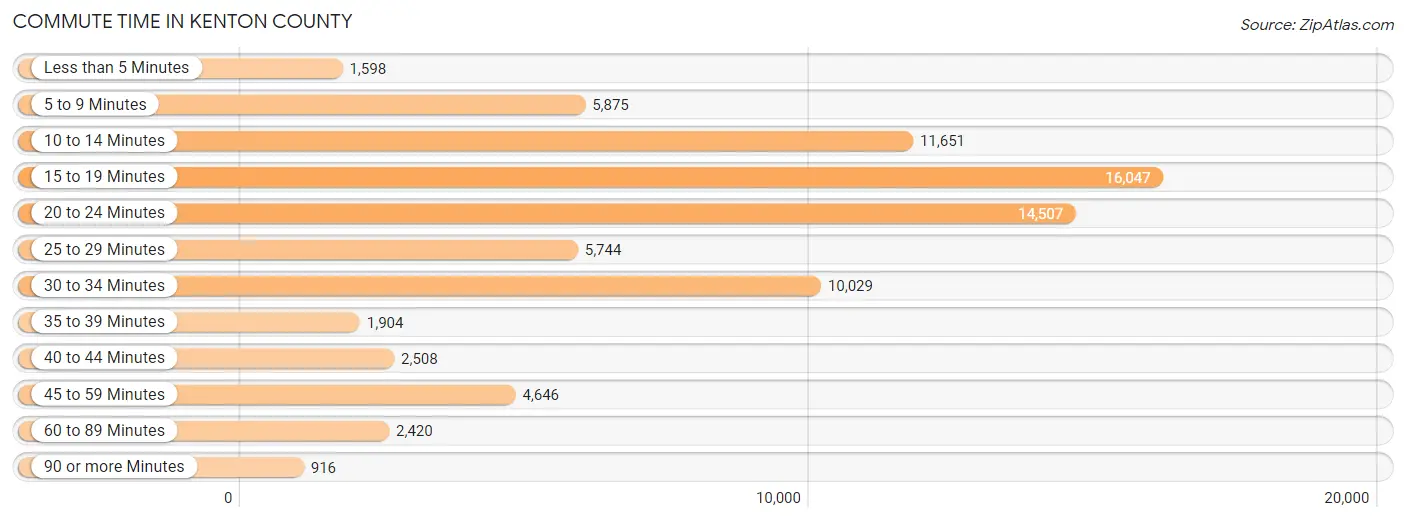
| Commute Time | # Commuters | % Commuters |
| Less than 5 Minutes | 1,598 | 2.1% |
| 5 to 9 Minutes | 5,875 | 7.5% |
| 10 to 14 Minutes | 11,651 | 15.0% |
| 15 to 19 Minutes | 16,047 | 20.6% |
| 20 to 24 Minutes | 14,507 | 18.6% |
| 25 to 29 Minutes | 5,744 | 7.4% |
| 30 to 34 Minutes | 10,029 | 12.9% |
| 35 to 39 Minutes | 1,904 | 2.5% |
| 40 to 44 Minutes | 2,508 | 3.2% |
| 45 to 59 Minutes | 4,646 | 6.0% |
| 60 to 89 Minutes | 2,420 | 3.1% |
| 90 or more Minutes | 916 | 1.2% |
Commute Time by Sex in Kenton County
The most common commute times in Kenton County are 15 to 19 minutes (8,424 commuters, 20.4%) for males and 15 to 19 minutes (7,623 commuters, 20.9%) for females.
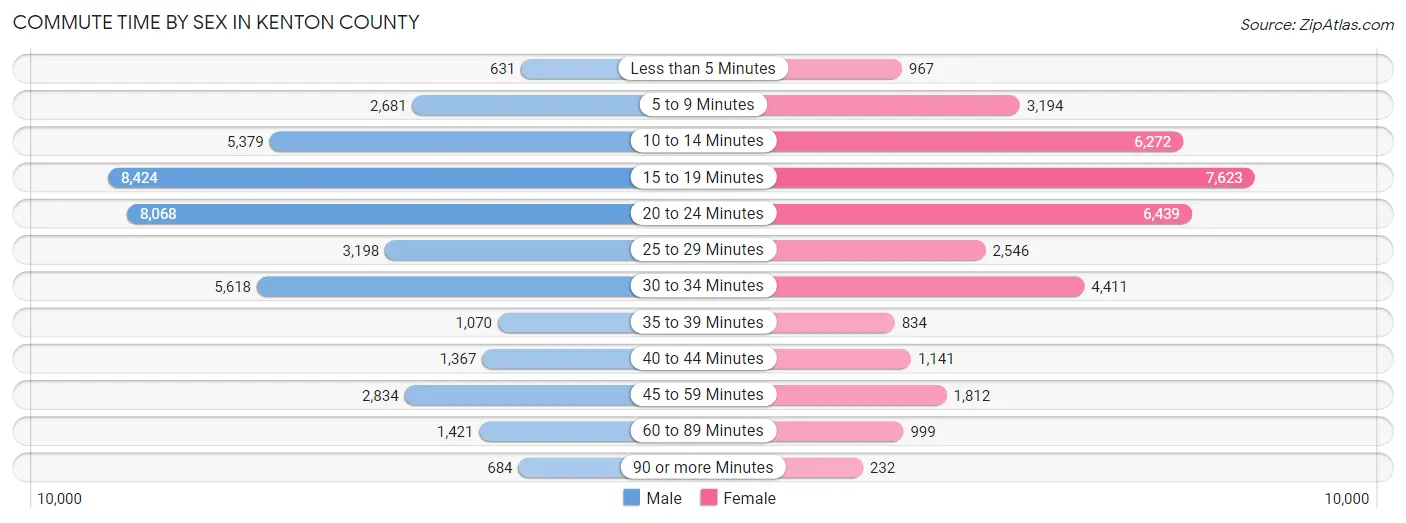
| Commute Time | Male | Female |
| Less than 5 Minutes | 631 (1.5%) | 967 (2.6%) |
| 5 to 9 Minutes | 2,681 (6.5%) | 3,194 (8.8%) |
| 10 to 14 Minutes | 5,379 (13.0%) | 6,272 (17.2%) |
| 15 to 19 Minutes | 8,424 (20.4%) | 7,623 (20.9%) |
| 20 to 24 Minutes | 8,068 (19.5%) | 6,439 (17.7%) |
| 25 to 29 Minutes | 3,198 (7.7%) | 2,546 (7.0%) |
| 30 to 34 Minutes | 5,618 (13.6%) | 4,411 (12.1%) |
| 35 to 39 Minutes | 1,070 (2.6%) | 834 (2.3%) |
| 40 to 44 Minutes | 1,367 (3.3%) | 1,141 (3.1%) |
| 45 to 59 Minutes | 2,834 (6.9%) | 1,812 (5.0%) |
| 60 to 89 Minutes | 1,421 (3.4%) | 999 (2.7%) |
| 90 or more Minutes | 684 (1.7%) | 232 (0.6%) |
Time of Departure to Work by Sex in Kenton County
The most frequent times of departure to work in Kenton County are 7:00 AM to 7:29 AM (5,140, 12.4%) for males and 7:00 AM to 7:29 AM (5,961, 16.3%) for females.
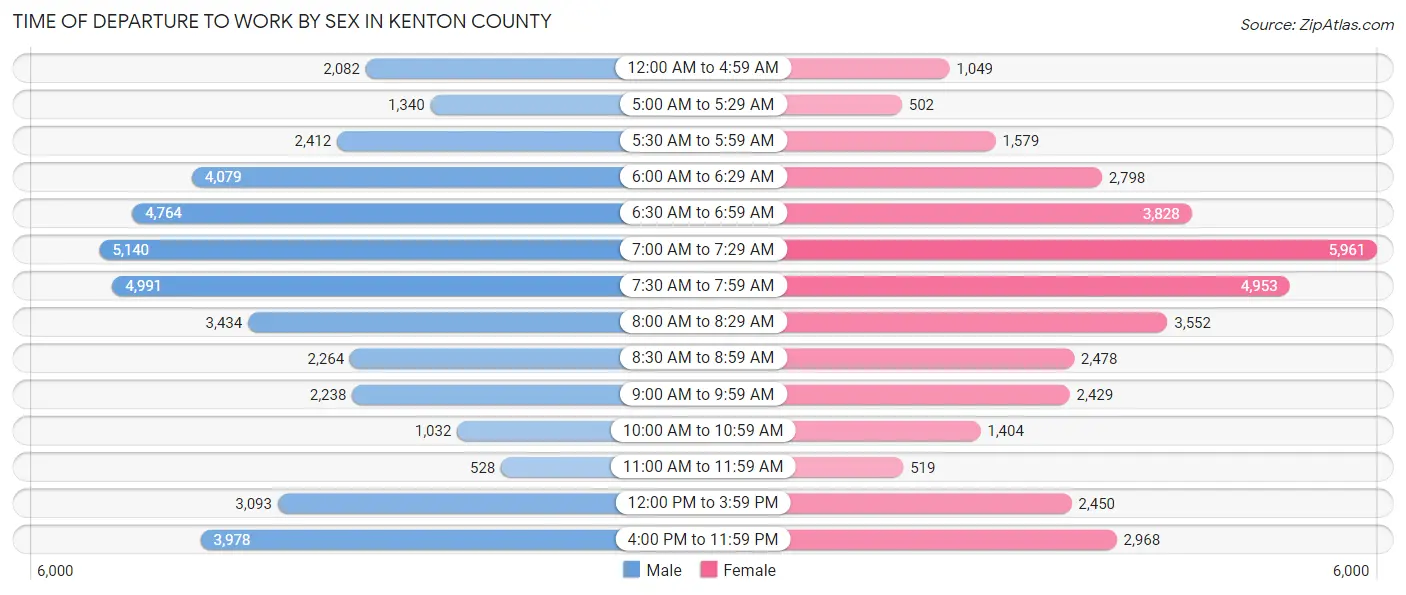
| Time of Departure | Male | Female |
| 12:00 AM to 4:59 AM | 2,082 (5.0%) | 1,049 (2.9%) |
| 5:00 AM to 5:29 AM | 1,340 (3.2%) | 502 (1.4%) |
| 5:30 AM to 5:59 AM | 2,412 (5.8%) | 1,579 (4.3%) |
| 6:00 AM to 6:29 AM | 4,079 (9.9%) | 2,798 (7.7%) |
| 6:30 AM to 6:59 AM | 4,764 (11.5%) | 3,828 (10.5%) |
| 7:00 AM to 7:29 AM | 5,140 (12.4%) | 5,961 (16.3%) |
| 7:30 AM to 7:59 AM | 4,991 (12.1%) | 4,953 (13.6%) |
| 8:00 AM to 8:29 AM | 3,434 (8.3%) | 3,552 (9.7%) |
| 8:30 AM to 8:59 AM | 2,264 (5.5%) | 2,478 (6.8%) |
| 9:00 AM to 9:59 AM | 2,238 (5.4%) | 2,429 (6.7%) |
| 10:00 AM to 10:59 AM | 1,032 (2.5%) | 1,404 (3.8%) |
| 11:00 AM to 11:59 AM | 528 (1.3%) | 519 (1.4%) |
| 12:00 PM to 3:59 PM | 3,093 (7.5%) | 2,450 (6.7%) |
| 4:00 PM to 11:59 PM | 3,978 (9.6%) | 2,968 (8.1%) |
| Total | 41,375 (100.0%) | 36,470 (100.0%) |
Housing Occupancy in Kenton County
Occupancy by Ownership in Kenton County
Of the total 67,353 dwellings in Kenton County, owner-occupied units account for 46,532 (69.1%), while renter-occupied units make up 20,821 (30.9%).
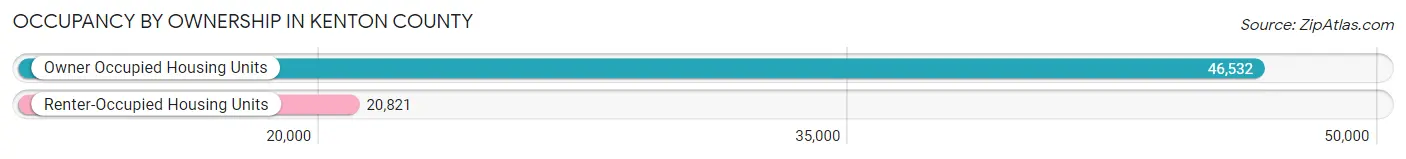
| Occupancy | # Housing Units | % Housing Units |
| Owner Occupied Housing Units | 46,532 | 69.1% |
| Renter-Occupied Housing Units | 20,821 | 30.9% |
| Total Occupied Housing Units | 67,353 | 100.0% |
Occupancy by Household Size in Kenton County
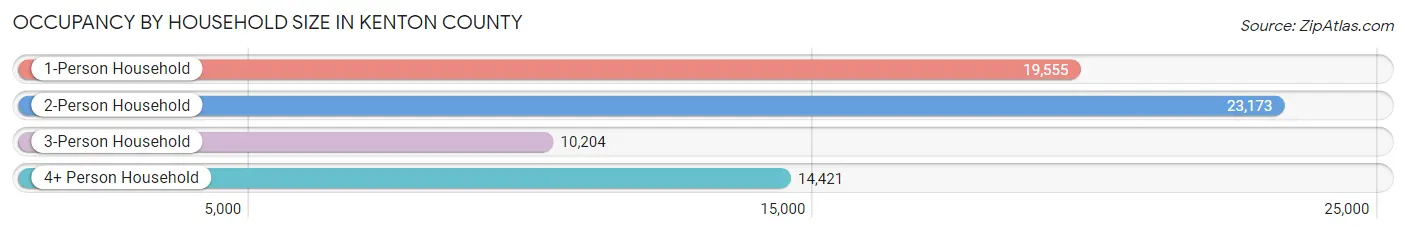
| Household Size | # Housing Units | % Housing Units |
| 1-Person Household | 19,555 | 29.0% |
| 2-Person Household | 23,173 | 34.4% |
| 3-Person Household | 10,204 | 15.1% |
| 4+ Person Household | 14,421 | 21.4% |
| Total Housing Units | 67,353 | 100.0% |
Occupancy by Ownership by Household Size in Kenton County
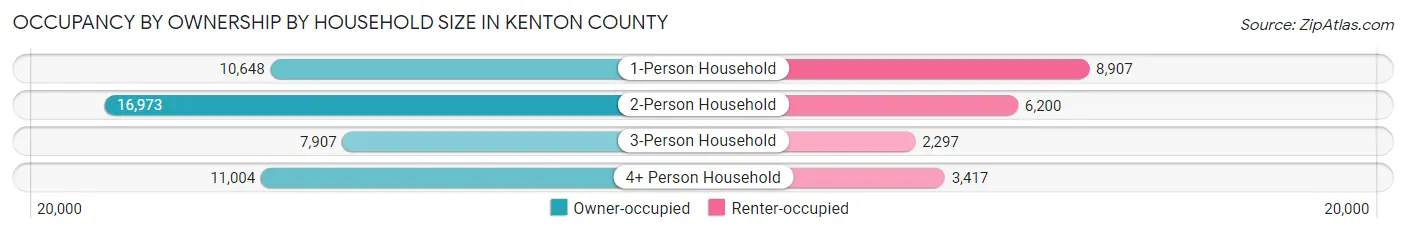
| Household Size | Owner-occupied | Renter-occupied |
| 1-Person Household | 10,648 (54.4%) | 8,907 (45.6%) |
| 2-Person Household | 16,973 (73.2%) | 6,200 (26.8%) |
| 3-Person Household | 7,907 (77.5%) | 2,297 (22.5%) |
| 4+ Person Household | 11,004 (76.3%) | 3,417 (23.7%) |
| Total Housing Units | 46,532 (69.1%) | 20,821 (30.9%) |
Occupancy by Educational Attainment in Kenton County
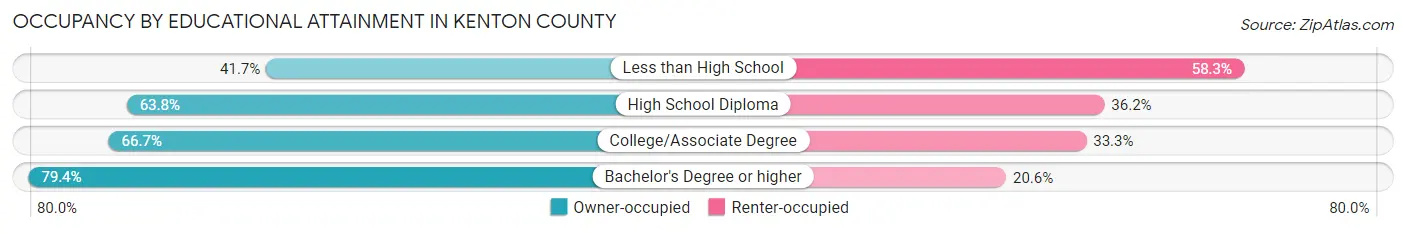
| Household Size | Owner-occupied | Renter-occupied |
| Less than High School | 2,050 (41.7%) | 2,867 (58.3%) |
| High School Diploma | 10,402 (63.8%) | 5,903 (36.2%) |
| College/Associate Degree | 13,344 (66.7%) | 6,671 (33.3%) |
| Bachelor's Degree or higher | 20,736 (79.4%) | 5,380 (20.6%) |
Occupancy by Age of Householder in Kenton County
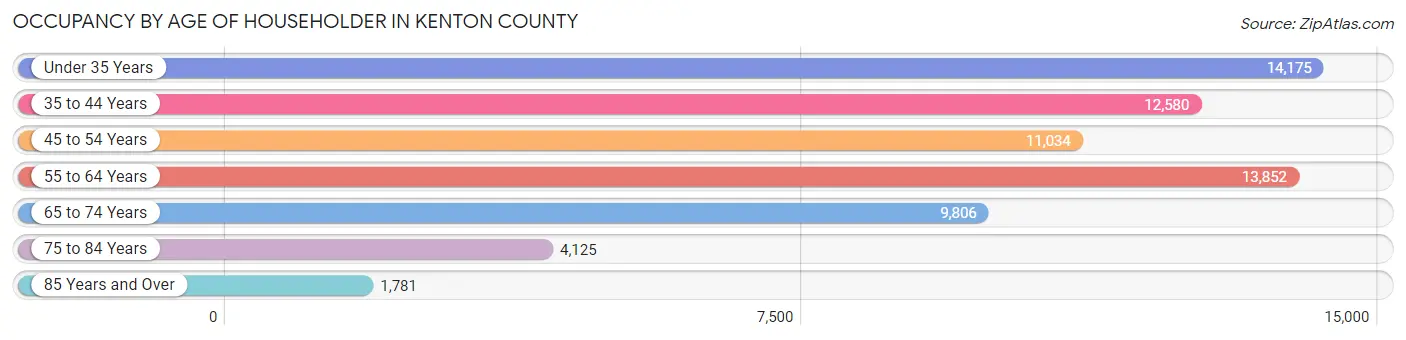
| Age Bracket | # Households | % Households |
| Under 35 Years | 14,175 | 21.0% |
| 35 to 44 Years | 12,580 | 18.7% |
| 45 to 54 Years | 11,034 | 16.4% |
| 55 to 64 Years | 13,852 | 20.6% |
| 65 to 74 Years | 9,806 | 14.6% |
| 75 to 84 Years | 4,125 | 6.1% |
| 85 Years and Over | 1,781 | 2.6% |
| Total | 67,353 | 100.0% |
Housing Finances in Kenton County
Median Income by Occupancy in Kenton County
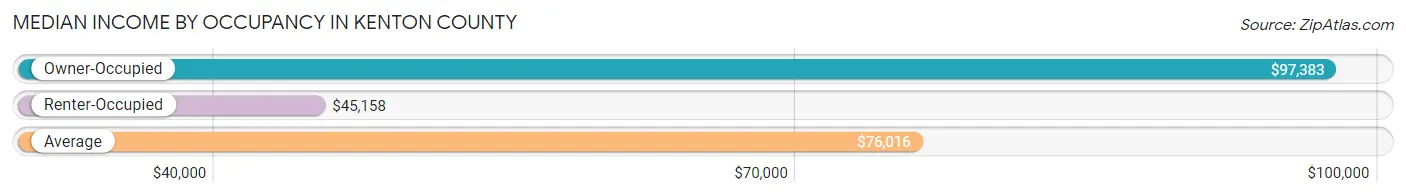
| Occupancy Type | # Households | Median Income |
| Owner-Occupied | 46,532 (69.1%) | $97,383 |
| Renter-Occupied | 20,821 (30.9%) | $45,158 |
| Average | 67,353 (100.0%) | $76,016 |
Occupancy by Householder Income Bracket in Kenton County
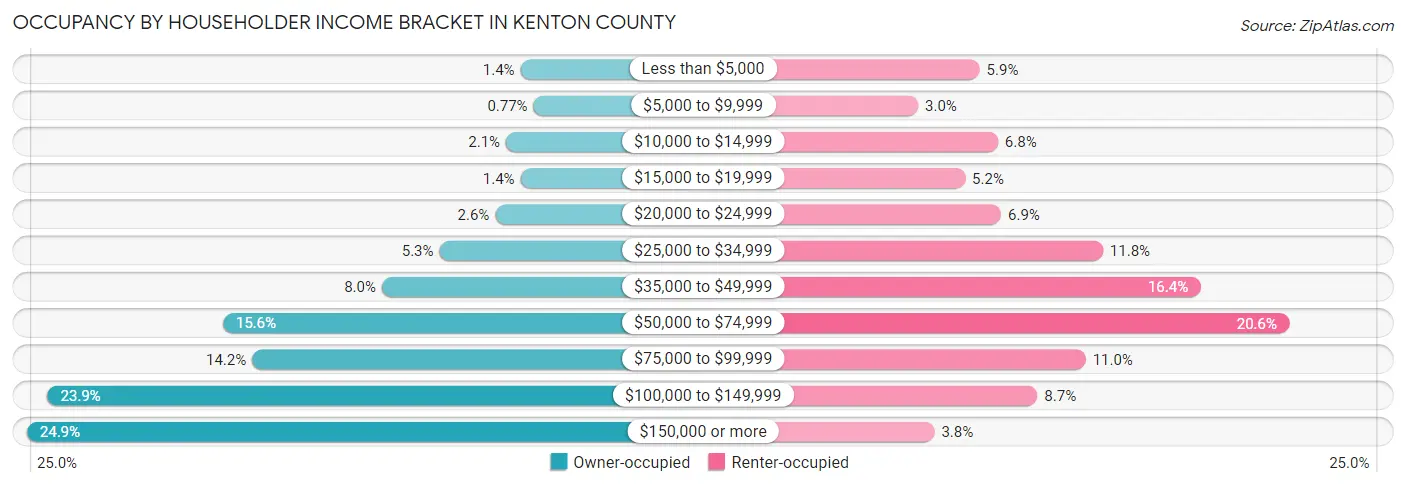
| Income Bracket | Owner-occupied | Renter-occupied |
| Less than $5,000 | 646 (1.4%) | 1,231 (5.9%) |
| $5,000 to $9,999 | 359 (0.8%) | 621 (3.0%) |
| $10,000 to $14,999 | 970 (2.1%) | 1,411 (6.8%) |
| $15,000 to $19,999 | 645 (1.4%) | 1,087 (5.2%) |
| $20,000 to $24,999 | 1,205 (2.6%) | 1,442 (6.9%) |
| $25,000 to $34,999 | 2,445 (5.2%) | 2,452 (11.8%) |
| $35,000 to $49,999 | 3,720 (8.0%) | 3,415 (16.4%) |
| $50,000 to $74,999 | 7,239 (15.6%) | 4,295 (20.6%) |
| $75,000 to $99,999 | 6,595 (14.2%) | 2,282 (11.0%) |
| $100,000 to $149,999 | 11,127 (23.9%) | 1,803 (8.7%) |
| $150,000 or more | 11,581 (24.9%) | 782 (3.8%) |
| Total | 46,532 (100.0%) | 20,821 (100.0%) |
Monthly Housing Cost Tiers in Kenton County
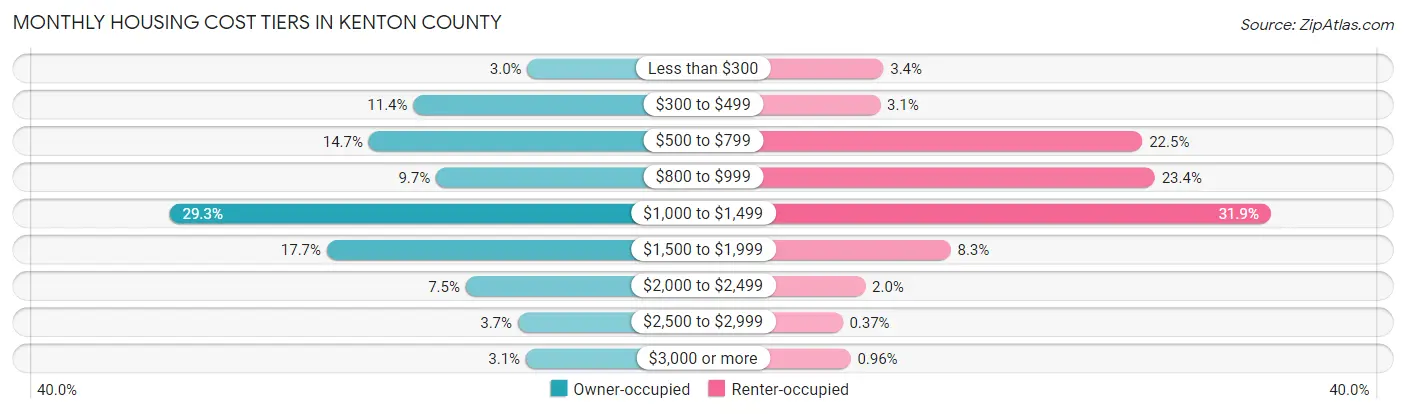
| Monthly Cost | Owner-occupied | Renter-occupied |
| Less than $300 | 1,381 (3.0%) | 703 (3.4%) |
| $300 to $499 | 5,290 (11.4%) | 653 (3.1%) |
| $500 to $799 | 6,816 (14.6%) | 4,675 (22.5%) |
| $800 to $999 | 4,513 (9.7%) | 4,865 (23.4%) |
| $1,000 to $1,499 | 13,641 (29.3%) | 6,643 (31.9%) |
| $1,500 to $1,999 | 8,257 (17.7%) | 1,735 (8.3%) |
| $2,000 to $2,499 | 3,494 (7.5%) | 425 (2.0%) |
| $2,500 to $2,999 | 1,707 (3.7%) | 77 (0.4%) |
| $3,000 or more | 1,433 (3.1%) | 199 (1.0%) |
| Total | 46,532 (100.0%) | 20,821 (100.0%) |
Physical Housing Characteristics in Kenton County
Housing Structures in Kenton County
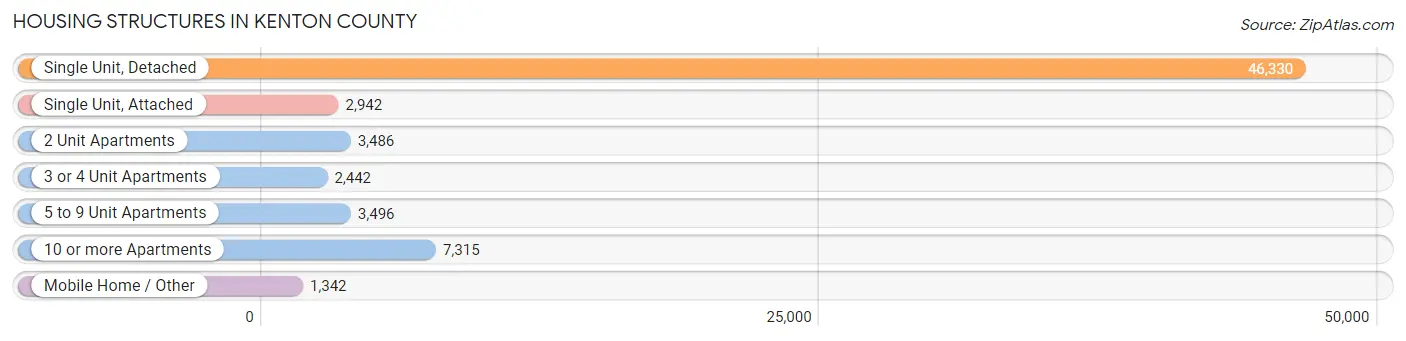
| Structure Type | # Housing Units | % Housing Units |
| Single Unit, Detached | 46,330 | 68.8% |
| Single Unit, Attached | 2,942 | 4.4% |
| 2 Unit Apartments | 3,486 | 5.2% |
| 3 or 4 Unit Apartments | 2,442 | 3.6% |
| 5 to 9 Unit Apartments | 3,496 | 5.2% |
| 10 or more Apartments | 7,315 | 10.9% |
| Mobile Home / Other | 1,342 | 2.0% |
| Total | 67,353 | 100.0% |
Housing Structures by Occupancy in Kenton County
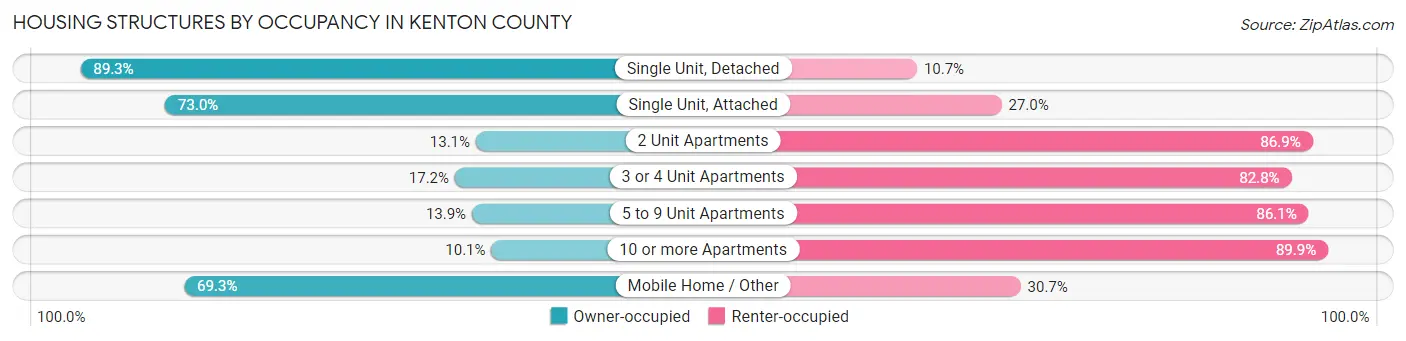
| Structure Type | Owner-occupied | Renter-occupied |
| Single Unit, Detached | 41,353 (89.3%) | 4,977 (10.7%) |
| Single Unit, Attached | 2,147 (73.0%) | 795 (27.0%) |
| 2 Unit Apartments | 457 (13.1%) | 3,029 (86.9%) |
| 3 or 4 Unit Apartments | 419 (17.2%) | 2,023 (82.8%) |
| 5 to 9 Unit Apartments | 485 (13.9%) | 3,011 (86.1%) |
| 10 or more Apartments | 741 (10.1%) | 6,574 (89.9%) |
| Mobile Home / Other | 930 (69.3%) | 412 (30.7%) |
| Total | 46,532 (69.1%) | 20,821 (30.9%) |
Housing Structures by Number of Rooms in Kenton County
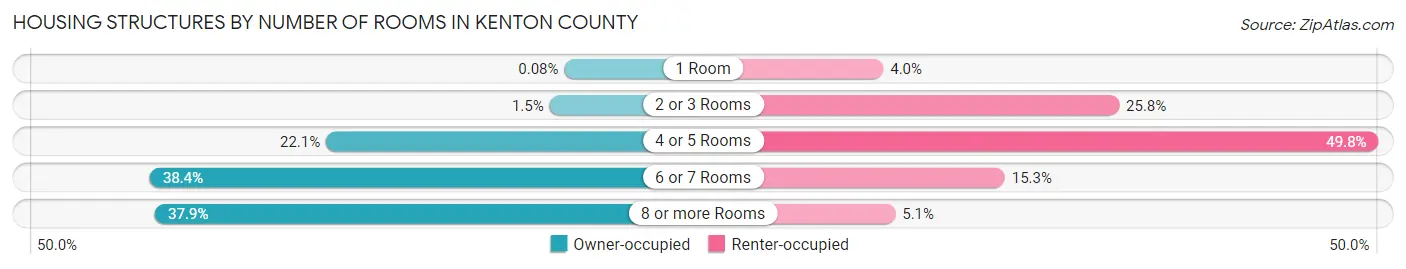
| Number of Rooms | Owner-occupied | Renter-occupied |
| 1 Room | 38 (0.1%) | 834 (4.0%) |
| 2 or 3 Rooms | 675 (1.5%) | 5,376 (25.8%) |
| 4 or 5 Rooms | 10,292 (22.1%) | 10,369 (49.8%) |
| 6 or 7 Rooms | 17,879 (38.4%) | 3,176 (15.2%) |
| 8 or more Rooms | 17,648 (37.9%) | 1,066 (5.1%) |
| Total | 46,532 (100.0%) | 20,821 (100.0%) |
Housing Structure by Heating Type in Kenton County
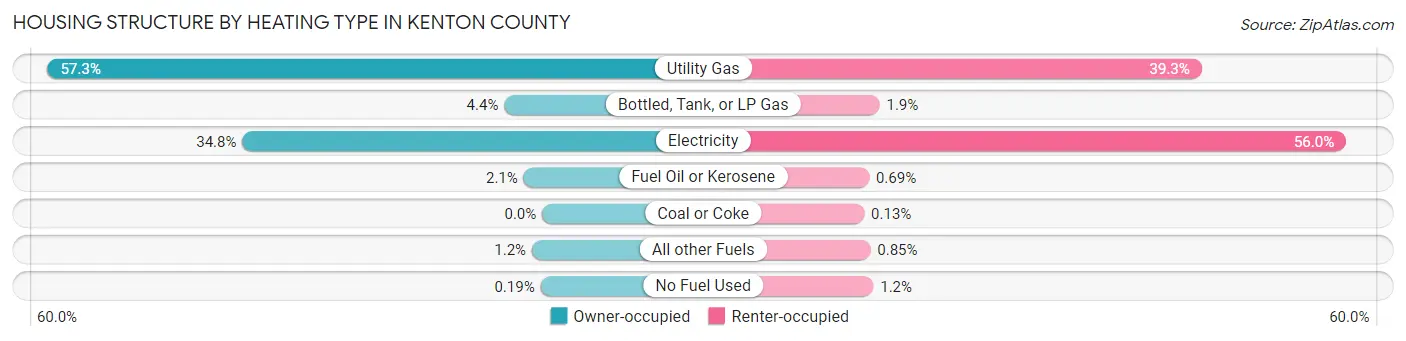
| Heating Type | Owner-occupied | Renter-occupied |
| Utility Gas | 26,683 (57.3%) | 8,173 (39.3%) |
| Bottled, Tank, or LP Gas | 2,045 (4.4%) | 397 (1.9%) |
| Electricity | 16,174 (34.8%) | 11,657 (56.0%) |
| Fuel Oil or Kerosene | 996 (2.1%) | 143 (0.7%) |
| Coal or Coke | 0 (0.0%) | 27 (0.1%) |
| All other Fuels | 547 (1.2%) | 177 (0.9%) |
| No Fuel Used | 87 (0.2%) | 247 (1.2%) |
| Total | 46,532 (100.0%) | 20,821 (100.0%) |
Household Vehicle Usage in Kenton County
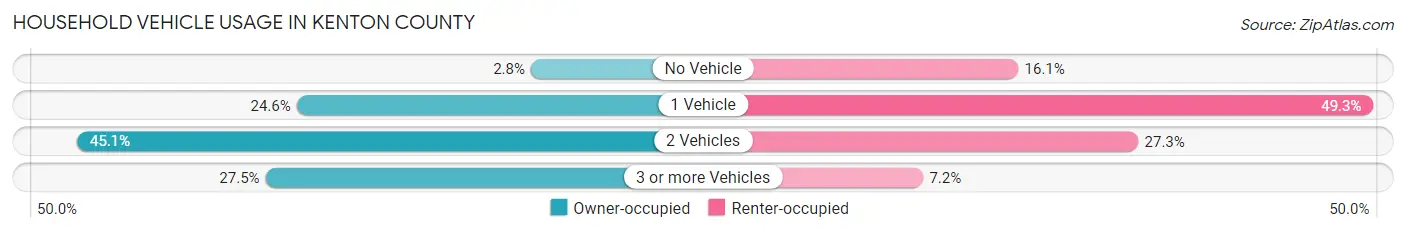
| Vehicles per Household | Owner-occupied | Renter-occupied |
| No Vehicle | 1,278 (2.8%) | 3,357 (16.1%) |
| 1 Vehicle | 11,452 (24.6%) | 10,268 (49.3%) |
| 2 Vehicles | 20,995 (45.1%) | 5,688 (27.3%) |
| 3 or more Vehicles | 12,807 (27.5%) | 1,508 (7.2%) |
| Total | 46,532 (100.0%) | 20,821 (100.0%) |
Real Estate & Mortgages in Kenton County
Real Estate and Mortgage Overview in Kenton County
| Characteristic | Without Mortgage | With Mortgage |
| Housing Units | 13,954 | 32,578 |
| Median Property Value | $188,500 | $214,400 |
| Median Household Income | $68,611 | $8,833 |
| Monthly Housing Costs | $521 | $1,406 |
| Real Estate Taxes | $1,937 | $682 |
Property Value by Mortgage Status in Kenton County
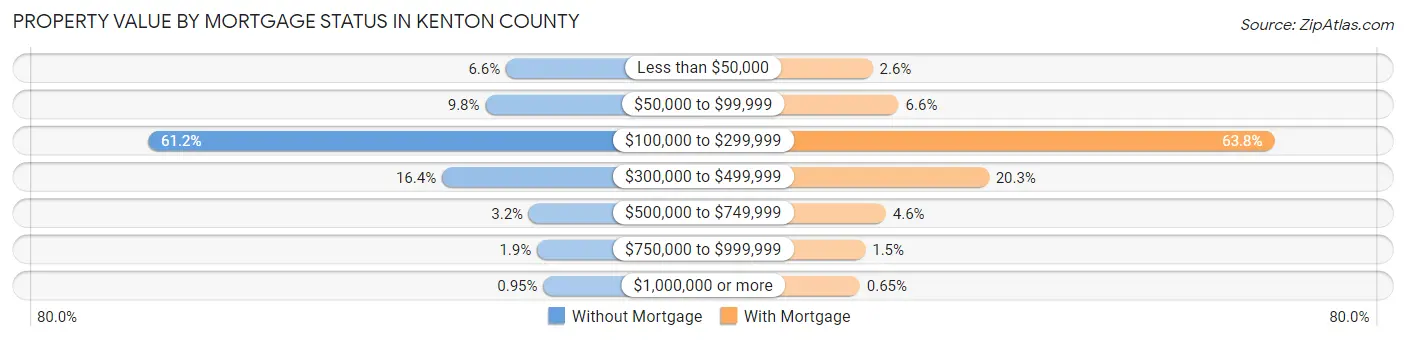
| Property Value | Without Mortgage | With Mortgage |
| Less than $50,000 | 926 (6.6%) | 846 (2.6%) |
| $50,000 to $99,999 | 1,366 (9.8%) | 2,141 (6.6%) |
| $100,000 to $299,999 | 8,535 (61.2%) | 20,784 (63.8%) |
| $300,000 to $499,999 | 2,289 (16.4%) | 6,609 (20.3%) |
| $500,000 to $749,999 | 439 (3.2%) | 1,504 (4.6%) |
| $750,000 to $999,999 | 266 (1.9%) | 481 (1.5%) |
| $1,000,000 or more | 133 (0.9%) | 213 (0.6%) |
| Total | 13,954 (100.0%) | 32,578 (100.0%) |
Household Income by Mortgage Status in Kenton County
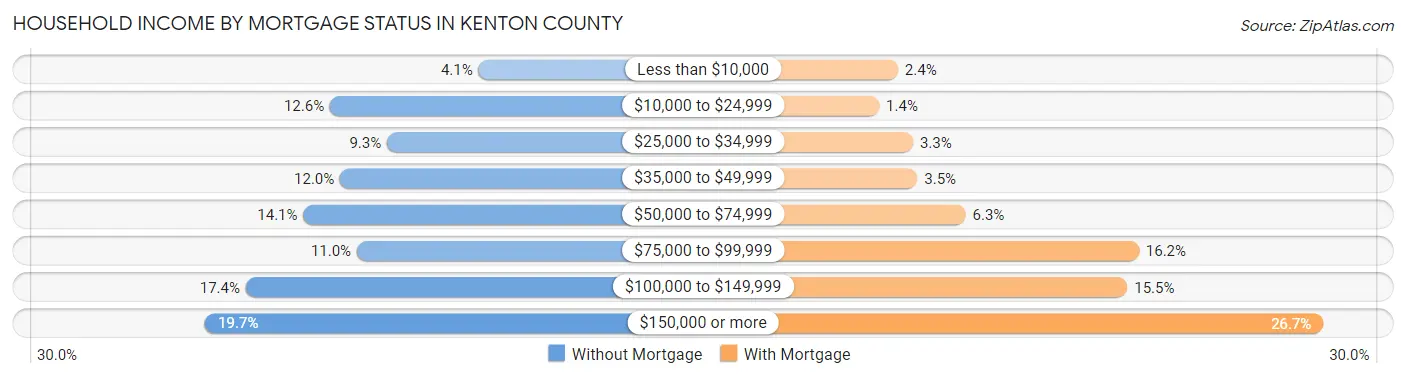
| Household Income | Without Mortgage | With Mortgage |
| Less than $10,000 | 566 (4.1%) | 787 (2.4%) |
| $10,000 to $24,999 | 1,751 (12.6%) | 439 (1.3%) |
| $25,000 to $34,999 | 1,296 (9.3%) | 1,069 (3.3%) |
| $35,000 to $49,999 | 1,670 (12.0%) | 1,149 (3.5%) |
| $50,000 to $74,999 | 1,963 (14.1%) | 2,050 (6.3%) |
| $75,000 to $99,999 | 1,537 (11.0%) | 5,276 (16.2%) |
| $100,000 to $149,999 | 2,423 (17.4%) | 5,058 (15.5%) |
| $150,000 or more | 2,748 (19.7%) | 8,704 (26.7%) |
| Total | 13,954 (100.0%) | 32,578 (100.0%) |
Property Value to Household Income Ratio in Kenton County
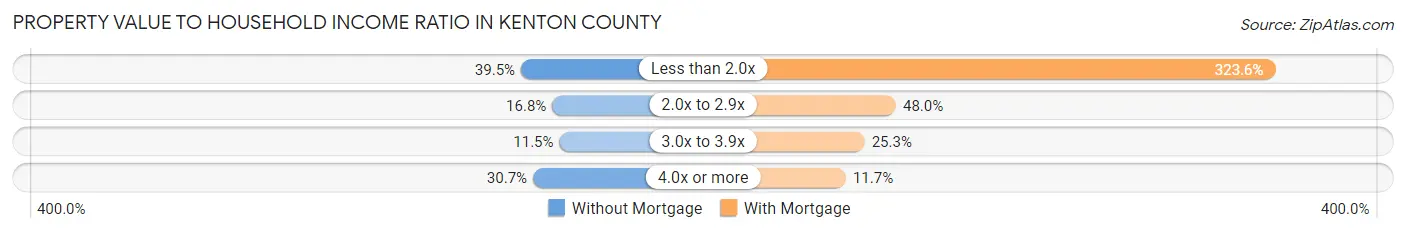
| Value-to-Income Ratio | Without Mortgage | With Mortgage |
| Less than 2.0x | 5,505 (39.5%) | 105,407 (323.6%) |
| 2.0x to 2.9x | 2,337 (16.8%) | 15,647 (48.0%) |
| 3.0x to 3.9x | 1,610 (11.5%) | 8,239 (25.3%) |
| 4.0x or more | 4,289 (30.7%) | 3,800 (11.7%) |
| Total | 13,954 (100.0%) | 32,578 (100.0%) |
Real Estate Taxes by Mortgage Status in Kenton County
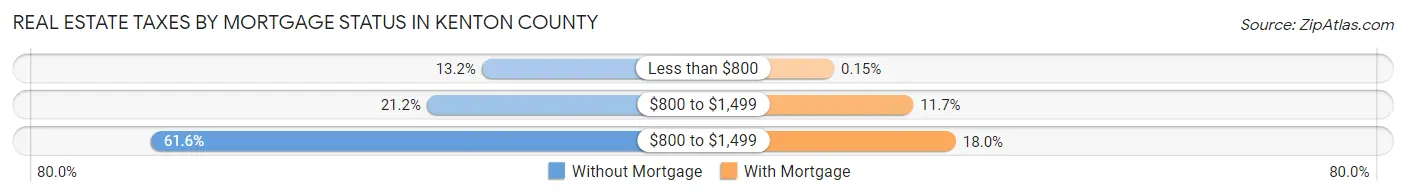
| Property Taxes | Without Mortgage | With Mortgage |
| Less than $800 | 1,843 (13.2%) | 49 (0.2%) |
| $800 to $1,499 | 2,964 (21.2%) | 3,826 (11.7%) |
| $800 to $1,499 | 8,589 (61.6%) | 5,848 (17.9%) |
| Total | 13,954 (100.0%) | 32,578 (100.0%) |
Health & Disability in Kenton County
Health Insurance Coverage by Age in Kenton County
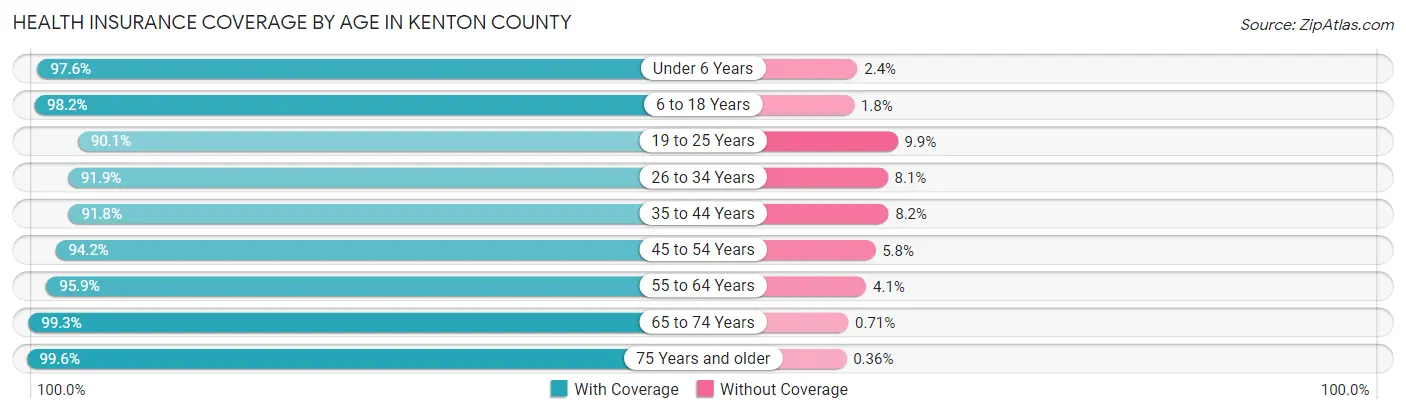
| Age Bracket | With Coverage | Without Coverage |
| Under 6 Years | 12,765 (97.6%) | 319 (2.4%) |
| 6 to 18 Years | 27,867 (98.2%) | 509 (1.8%) |
| 19 to 25 Years | 13,131 (90.1%) | 1,448 (9.9%) |
| 26 to 34 Years | 20,343 (91.9%) | 1,787 (8.1%) |
| 35 to 44 Years | 20,487 (91.8%) | 1,831 (8.2%) |
| 45 to 54 Years | 19,160 (94.2%) | 1,170 (5.8%) |
| 55 to 64 Years | 21,403 (95.9%) | 905 (4.1%) |
| 65 to 74 Years | 15,474 (99.3%) | 110 (0.7%) |
| 75 Years and older | 9,107 (99.6%) | 33 (0.4%) |
| Total | 159,737 (95.2%) | 8,112 (4.8%) |
Health Insurance Coverage by Citizenship Status in Kenton County
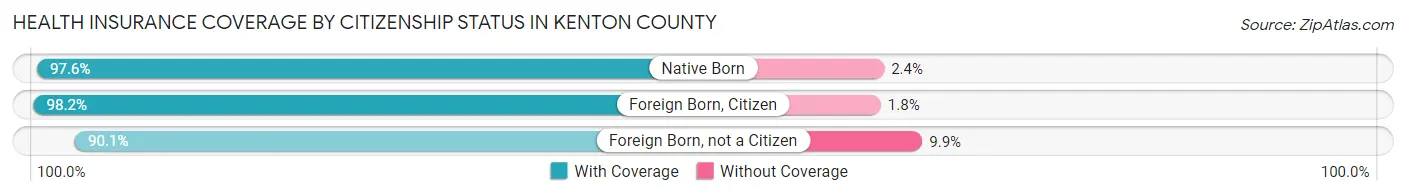
| Citizenship Status | With Coverage | Without Coverage |
| Native Born | 12,765 (97.6%) | 319 (2.4%) |
| Foreign Born, Citizen | 27,867 (98.2%) | 509 (1.8%) |
| Foreign Born, not a Citizen | 13,131 (90.1%) | 1,448 (9.9%) |
Health Insurance Coverage by Household Income in Kenton County
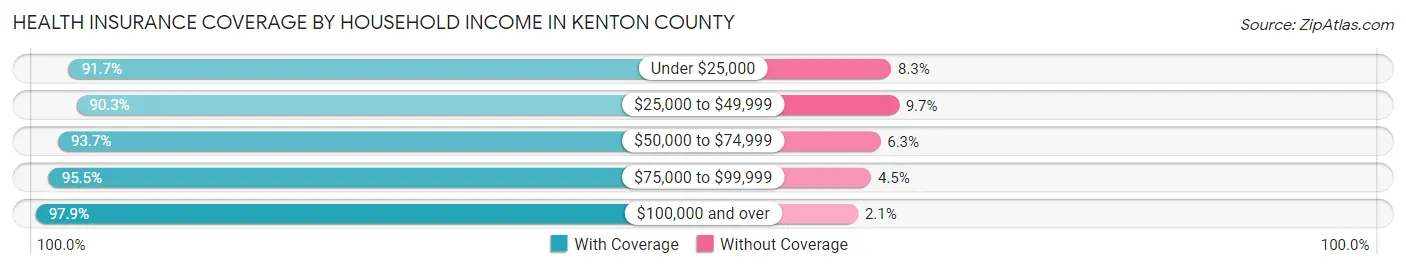
| Household Income | With Coverage | Without Coverage |
| Under $25,000 | 15,202 (91.7%) | 1,370 (8.3%) |
| $25,000 to $49,999 | 21,866 (90.3%) | 2,354 (9.7%) |
| $50,000 to $74,999 | 24,689 (93.7%) | 1,651 (6.3%) |
| $75,000 to $99,999 | 21,643 (95.5%) | 1,029 (4.5%) |
| $100,000 and over | 75,425 (97.9%) | 1,610 (2.1%) |
Public vs Private Health Insurance Coverage by Age in Kenton County
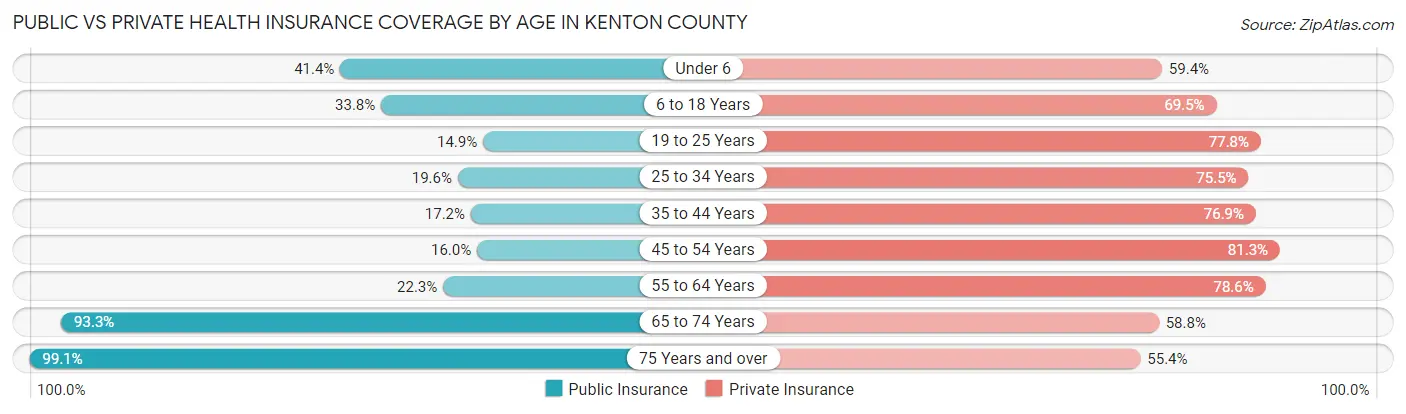
| Age Bracket | Public Insurance | Private Insurance |
| Under 6 | 5,420 (41.4%) | 7,775 (59.4%) |
| 6 to 18 Years | 9,599 (33.8%) | 19,731 (69.5%) |
| 19 to 25 Years | 2,172 (14.9%) | 11,340 (77.8%) |
| 25 to 34 Years | 4,336 (19.6%) | 16,701 (75.5%) |
| 35 to 44 Years | 3,833 (17.2%) | 17,151 (76.8%) |
| 45 to 54 Years | 3,256 (16.0%) | 16,531 (81.3%) |
| 55 to 64 Years | 4,980 (22.3%) | 17,544 (78.6%) |
| 65 to 74 Years | 14,532 (93.2%) | 9,168 (58.8%) |
| 75 Years and over | 9,059 (99.1%) | 5,065 (55.4%) |
| Total | 57,187 (34.1%) | 121,006 (72.1%) |
Disability Status by Sex by Age in Kenton County
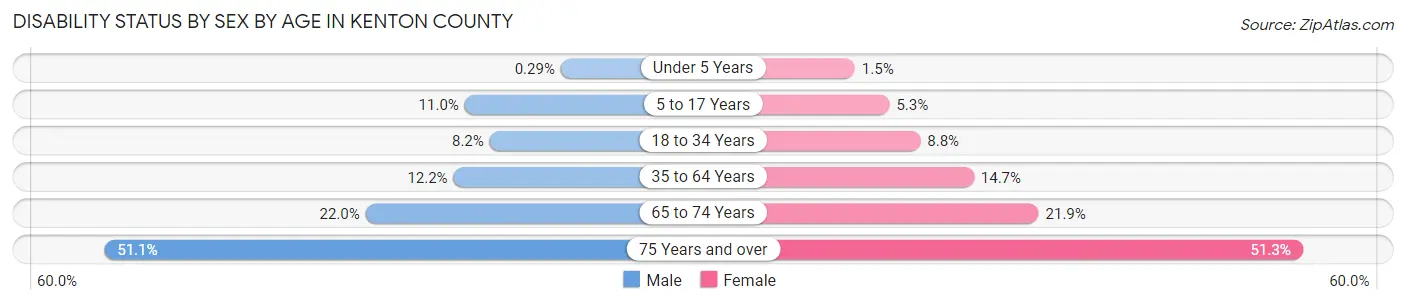
| Age Bracket | Male | Female |
| Under 5 Years | 16 (0.3%) | 77 (1.5%) |
| 5 to 17 Years | 1,630 (11.0%) | 744 (5.3%) |
| 18 to 34 Years | 1,613 (8.2%) | 1,658 (8.7%) |
| 35 to 64 Years | 3,979 (12.2%) | 4,773 (14.7%) |
| 65 to 74 Years | 1,652 (22.0%) | 1,772 (21.9%) |
| 75 Years and over | 1,877 (51.1%) | 2,806 (51.3%) |
Disability Class by Sex by Age in Kenton County
Disability Class: Hearing Difficulty
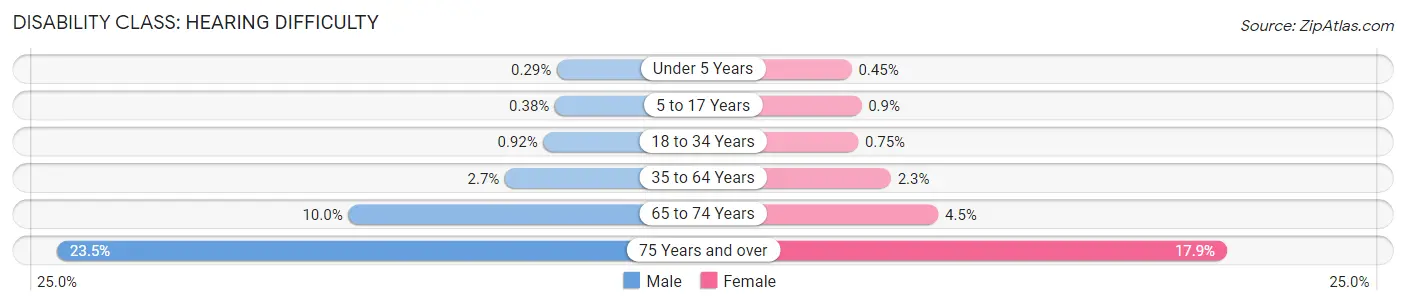
| Age Bracket | Male | Female |
| Under 5 Years | 16 (0.3%) | 24 (0.4%) |
| 5 to 17 Years | 57 (0.4%) | 126 (0.9%) |
| 18 to 34 Years | 181 (0.9%) | 143 (0.7%) |
| 35 to 64 Years | 877 (2.7%) | 736 (2.3%) |
| 65 to 74 Years | 748 (10.0%) | 361 (4.5%) |
| 75 Years and over | 863 (23.5%) | 977 (17.9%) |
Disability Class: Vision Difficulty
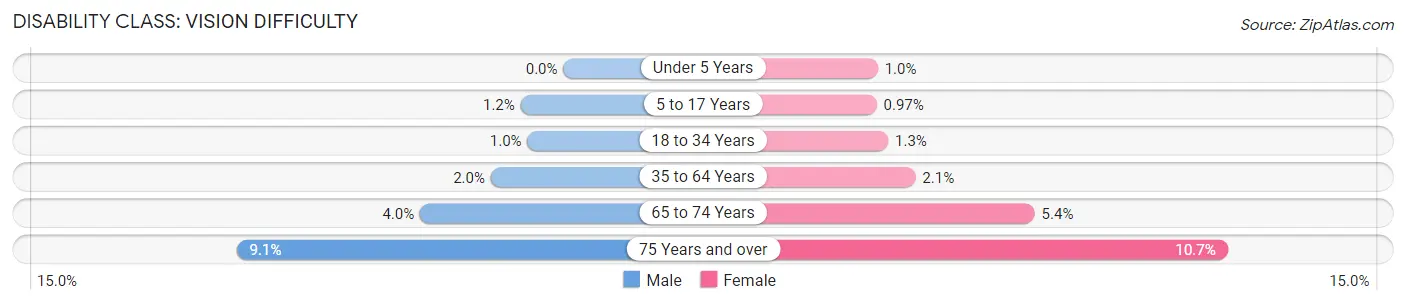
| Age Bracket | Male | Female |
| Under 5 Years | 0 (0.0%) | 53 (1.0%) |
| 5 to 17 Years | 176 (1.2%) | 136 (1.0%) |
| 18 to 34 Years | 196 (1.0%) | 244 (1.3%) |
| 35 to 64 Years | 656 (2.0%) | 666 (2.1%) |
| 65 to 74 Years | 299 (4.0%) | 434 (5.4%) |
| 75 Years and over | 334 (9.1%) | 587 (10.7%) |
Disability Class: Cognitive Difficulty
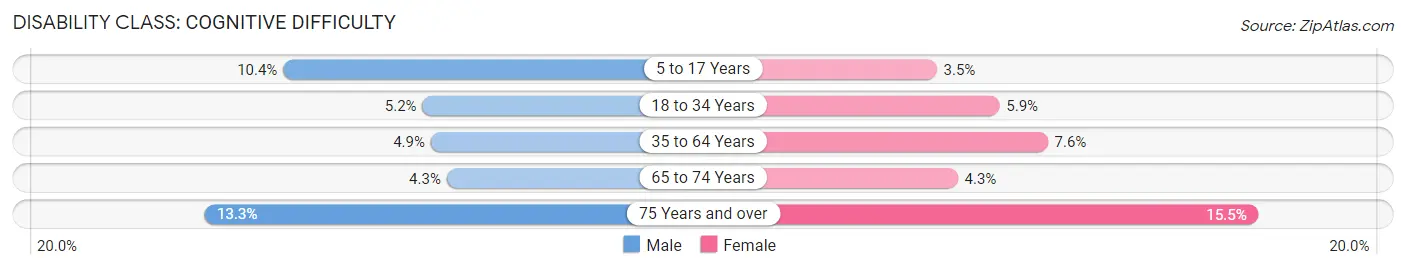
| Age Bracket | Male | Female |
| 5 to 17 Years | 1,542 (10.4%) | 493 (3.5%) |
| 18 to 34 Years | 1,027 (5.2%) | 1,108 (5.9%) |
| 35 to 64 Years | 1,598 (4.9%) | 2,478 (7.6%) |
| 65 to 74 Years | 325 (4.3%) | 348 (4.3%) |
| 75 Years and over | 490 (13.3%) | 846 (15.5%) |
Disability Class: Ambulatory Difficulty
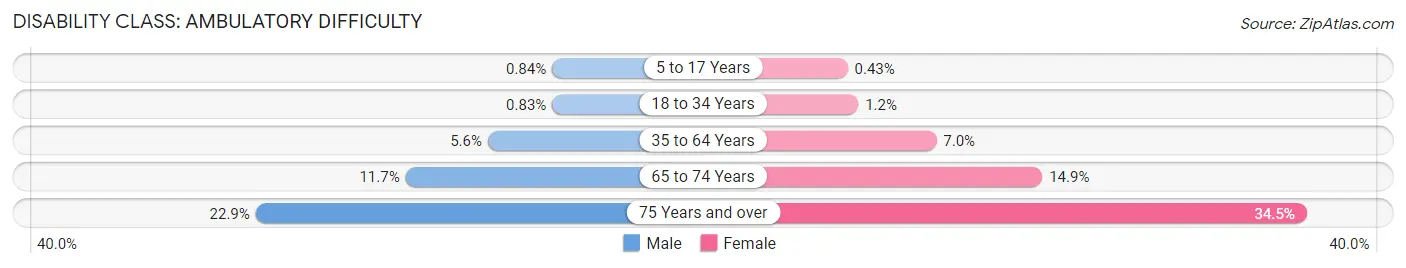
| Age Bracket | Male | Female |
| 5 to 17 Years | 125 (0.8%) | 60 (0.4%) |
| 18 to 34 Years | 163 (0.8%) | 231 (1.2%) |
| 35 to 64 Years | 1,825 (5.6%) | 2,279 (7.0%) |
| 65 to 74 Years | 879 (11.7%) | 1,203 (14.9%) |
| 75 Years and over | 839 (22.9%) | 1,887 (34.5%) |
Disability Class: Self-Care Difficulty
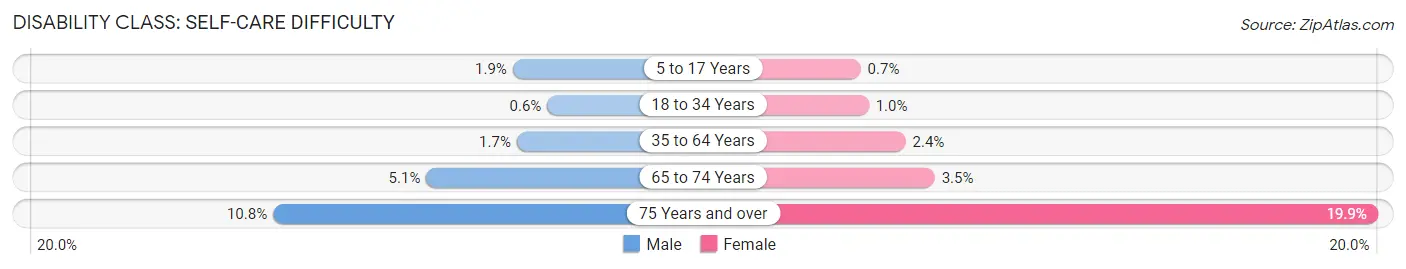
| Age Bracket | Male | Female |
| 5 to 17 Years | 279 (1.9%) | 98 (0.7%) |
| 18 to 34 Years | 117 (0.6%) | 190 (1.0%) |
| 35 to 64 Years | 562 (1.7%) | 769 (2.4%) |
| 65 to 74 Years | 382 (5.1%) | 279 (3.5%) |
| 75 Years and over | 396 (10.8%) | 1,090 (19.9%) |
Technology Access in Kenton County
Computing Device Access in Kenton County
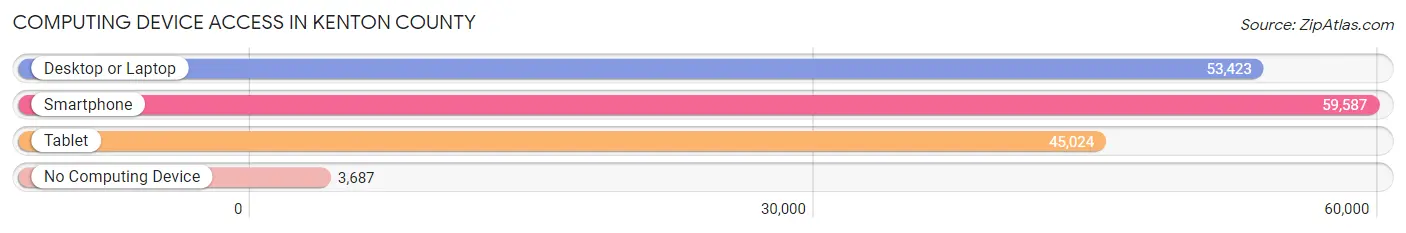
| Device Type | # Households | % Households |
| Desktop or Laptop | 53,423 | 79.3% |
| Smartphone | 59,587 | 88.5% |
| Tablet | 45,024 | 66.8% |
| No Computing Device | 3,687 | 5.5% |
| Total | 67,353 | 100.0% |
Internet Access in Kenton County
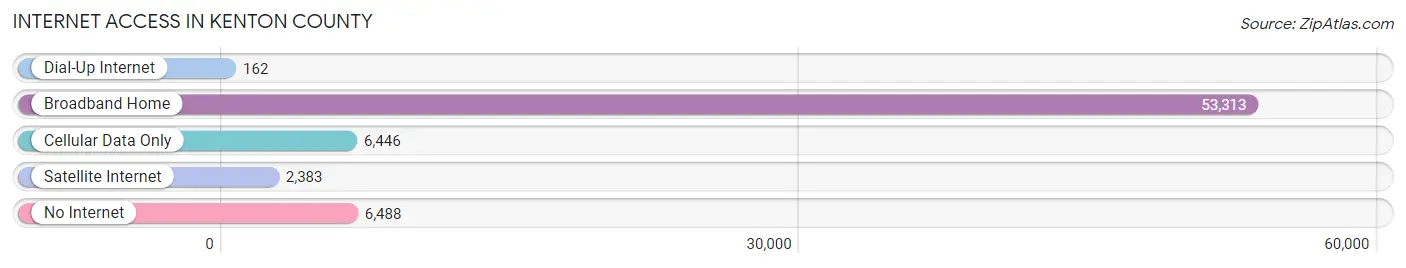
| Internet Type | # Households | % Households |
| Dial-Up Internet | 162 | 0.2% |
| Broadband Home | 53,313 | 79.1% |
| Cellular Data Only | 6,446 | 9.6% |
| Satellite Internet | 2,383 | 3.5% |
| No Internet | 6,488 | 9.6% |
| Total | 67,353 | 100.0% |
Kenton County Summary
Kenton County is located in the northern part of the Commonwealth of Kentucky, and is part of the Cincinnati-Northern Kentucky metropolitan area. It is bordered by Campbell County to the north, Boone County to the east, Grant County to the south, and Hamilton County, Ohio to the west. The county seat is Independence, and the largest city is Covington. As of the 2010 census, the population of Kenton County was 159,720, making it the third most populous county in Kentucky.
Geography
Kenton County is located in the northern part of the Commonwealth of Kentucky, and is part of the Cincinnati-Northern Kentucky metropolitan area. It is bordered by Campbell County to the north, Boone County to the east, Grant County to the south, and Hamilton County, Ohio to the west. The county has a total area of 186 square miles, of which 183 square miles is land and 3 square miles (1.6%) is water. The county is located in the Bluegrass region of Kentucky, and is characterized by rolling hills and valleys. The Licking River flows through the county, and is a major tributary of the Ohio River.
Demographics
As of the 2010 census, there were 159,720 people, 63,945 households, and 41,945 families residing in the county. The population density was 871.3 people per square mile. There were 68,945 housing units at an average density of 375.7 per square mile. The racial makeup of the county was 87.3% White, 8.7% Black or African American, 0.2% Native American, 1.3% Asian, 0.1% Pacific Islander, 0.9% from other races, and 1.5% from two or more races. 2.7% of the population were Hispanic or Latino of any race.
Economy
Kenton County is part of the Cincinnati-Northern Kentucky metropolitan area, and is home to a diverse economy. The county is home to several major employers, including Procter & Gamble, Toyota, and Amazon. The county is also home to several smaller businesses, including manufacturing, retail, and service industries. The county is also home to several educational institutions, including Northern Kentucky University, Thomas More College, and Gateway Community and Technical College.
The median household income in Kenton County was $54,945 in 2017, and the median family income was $64,945. The per capita income was $27,945. The unemployment rate in the county was 4.2% in 2017.
History
Kenton County was formed in 1840 from parts of Campbell and Boone Counties. It was named for Simon Kenton, a pioneer and Revolutionary War veteran who was an early settler in the area. The county seat is Independence, and the largest city is Covington.
The county has a rich history, and was home to several Native American tribes prior to European settlement. The area was also part of the Underground Railroad, and was a major stop on the route to freedom for many African Americans.
Kenton County has seen significant growth in recent years, and is now home to a diverse population. The county is home to several major employers, and is a major hub for education and culture in the region.
Common Questions
What is the Total Population of Kenton County?
Total Population of Kenton County is 169,066.
What is the Total Male Population of Kenton County?
Total Male Population of Kenton County is 84,198.
What is the Total Female Population of Kenton County?
Total Female Population of Kenton County is 84,868.
What is the Ratio of Males per 100 Females in Kenton County?
There are 99.21 Males per 100 Females in Kenton County.
What is the Ratio of Females per 100 Males in Kenton County?
There are 100.80 Females per 100 Males in Kenton County.
What is the Median Population Age in Kenton County?
Median Population Age in Kenton County is 37.7 Years.
What is the Average Family Size in Kenton County
Average Family Size in Kenton County is 3.1 People.
What is the Average Household Size in Kenton County
Average Household Size in Kenton County is 2.5 People.
What is Per Capita Income in Kenton County?
Per Capita income in Kenton County is $40,780.
What is the Median Family Income in Kenton County?
Median Family Income in Kenton County is $95,611.
What is the Median Household income in Kenton County?
Median Household Income in Kenton County is $76,016.
What is Income or Wage Gap in Kenton County?
Income or Wage Gap in Kenton County is 25.1%.
Women in Kenton County earn 74.9 cents for every dollar earned by a man.
What is Family Income Deficit in Kenton County?
Family Income Deficit in Kenton County is $12,342.
Families that are below poverty line in Kenton County earn $12,342 less on average than the poverty threshold level.
What is Inequality or Gini Index in Kenton County?
Inequality or Gini Index in Kenton County is 0.45.
How Large is the Labor Force in Kenton County?
There are 92,861 People in the Labor Forcein in Kenton County.
What is the Percentage of People in the Labor Force in Kenton County?
69.3% of People are in the Labor Force in Kenton County.
What is the Unemployment Rate in Kenton County?
Unemployment Rate in Kenton County is 4.4%.