Jefferson County, KY
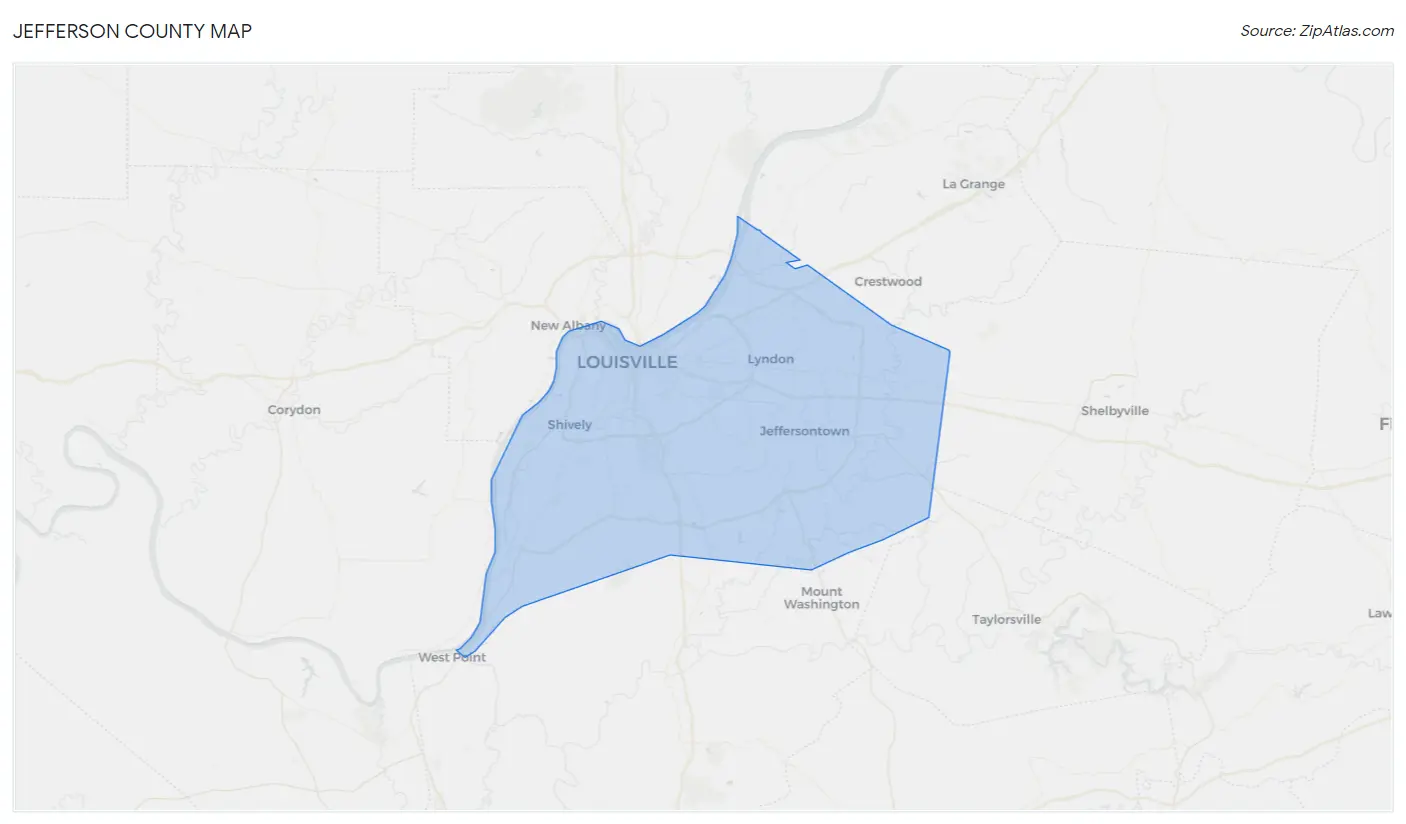
Jefferson County Map
Jefferson County Overview
779,232
TOTAL POPULATION
379,431
MALE POPULATION
399,801
FEMALE POPULATION
94.90
MALES / 100 FEMALES
105.37
FEMALES / 100 MALES
38.5
MEDIAN AGE
3.0
AVG FAMILY SIZE
2.3
AVG HOUSEHOLD SIZE
$39,994
PER CAPITA INCOME
$86,214
AVG FAMILY INCOME
$66,296
AVG HOUSEHOLD INCOME
23.0%
WAGE / INCOME GAP [ % ]
77.0¢/ $1
WAGE / INCOME GAP [ $ ]
$11,052
FAMILY INCOME DEFICIT
0.48
INEQUALITY / GINI INDEX
413,400
LABOR FORCE [ PEOPLE ]
65.9%
PERCENT IN LABOR FORCE
5.1%
UNEMPLOYMENT RATE
Jefferson County Area Codes
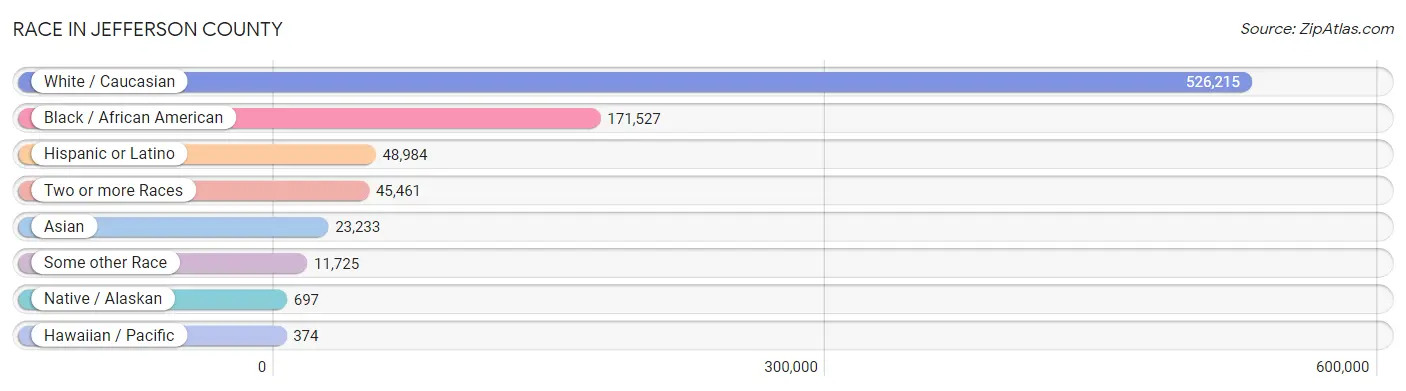
Race in Jefferson County
The most populous races in Jefferson County are White / Caucasian (526,215 | 67.5%), Black / African American (171,527 | 22.0%), and Hispanic or Latino (48,984 | 6.3%).
| Race | # Population | % Population |
| Asian | 23,233 | 3.0% |
| Black / African American | 171,527 | 22.0% |
| Hawaiian / Pacific | 374 | 0.1% |
| Hispanic or Latino | 48,984 | 6.3% |
| Native / Alaskan | 697 | 0.1% |
| White / Caucasian | 526,215 | 67.5% |
| Two or more Races | 45,461 | 5.8% |
| Some other Race | 11,725 | 1.5% |
| Total | 779,232 | 100.0% |
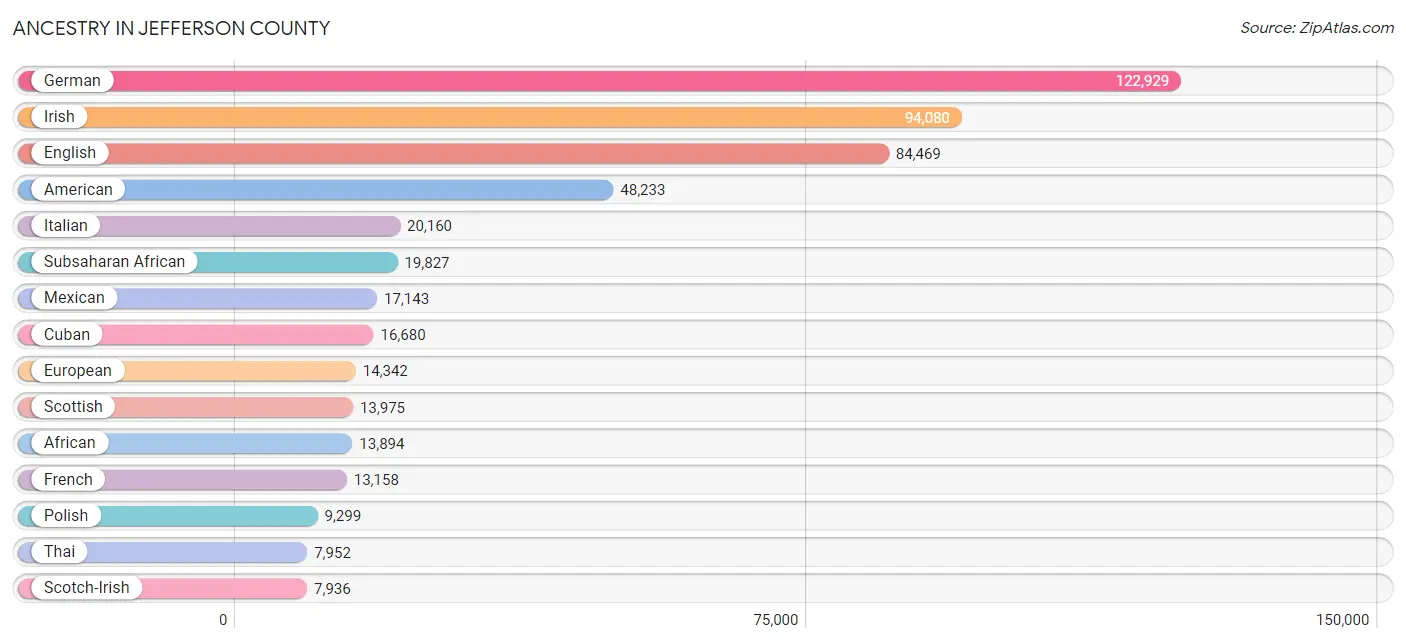
Ancestry in Jefferson County
The most populous ancestries reported in Jefferson County are German (122,929 | 15.8%), Irish (94,080 | 12.1%), English (84,469 | 10.8%), American (48,233 | 6.2%), and Italian (20,160 | 2.6%), together accounting for 47.5% of all Jefferson County residents.
| Ancestry | # Population | % Population |
| Afghan | 290 | 0.0% |
| African | 13,894 | 1.8% |
| Alaska Native | 23 | 0.0% |
| Albanian | 572 | 0.1% |
| Aleut | 5 | 0.0% |
| Alsatian | 71 | 0.0% |
| American | 48,233 | 6.2% |
| Apache | 7 | 0.0% |
| Arab | 6,320 | 0.8% |
| Argentinean | 366 | 0.1% |
| Armenian | 123 | 0.0% |
| Assyrian / Chaldean / Syriac | 23 | 0.0% |
| Australian | 106 | 0.0% |
| Austrian | 721 | 0.1% |
| Bahamian | 4 | 0.0% |
| Bangladeshi | 316 | 0.0% |
| Barbadian | 89 | 0.0% |
| Basque | 22 | 0.0% |
| Belgian | 393 | 0.1% |
| Belizean | 19 | 0.0% |
| Bermudan | 101 | 0.0% |
| Bhutanese | 1,396 | 0.2% |
| Blackfeet | 521 | 0.1% |
| Bolivian | 122 | 0.0% |
| Brazilian | 194 | 0.0% |
| British | 4,249 | 0.5% |
| British West Indian | 132 | 0.0% |
| Bulgarian | 78 | 0.0% |
| Burmese | 2,712 | 0.4% |
| Cajun | 29 | 0.0% |
| Cambodian | 47 | 0.0% |
| Canadian | 951 | 0.1% |
| Cape Verdean | 79 | 0.0% |
| Celtic | 119 | 0.0% |
| Central American | 5,986 | 0.8% |
| Central American Indian | 340 | 0.0% |
| Cherokee | 2,449 | 0.3% |
| Cheyenne | 16 | 0.0% |
| Chickasaw | 96 | 0.0% |
| Chilean | 283 | 0.0% |
| Chinese | 13 | 0.0% |
| Chippewa | 61 | 0.0% |
| Choctaw | 81 | 0.0% |
| Colombian | 738 | 0.1% |
| Comanche | 5 | 0.0% |
| Costa Rican | 67 | 0.0% |
| Cree | 23 | 0.0% |
| Creek | 15 | 0.0% |
| Croatian | 735 | 0.1% |
| Crow | 17 | 0.0% |
| Cuban | 16,680 | 2.1% |
| Czech | 1,278 | 0.2% |
| Czechoslovakian | 322 | 0.0% |
| Danish | 777 | 0.1% |
| Delaware | 6 | 0.0% |
| Dominican | 324 | 0.0% |
| Dutch | 6,725 | 0.9% |
| Dutch West Indian | 5 | 0.0% |
| Eastern European | 1,491 | 0.2% |
| Ecuadorian | 130 | 0.0% |
| Egyptian | 138 | 0.0% |
| English | 84,469 | 10.8% |
| Estonian | 12 | 0.0% |
| Ethiopian | 704 | 0.1% |
| European | 14,342 | 1.8% |
| Filipino | 154 | 0.0% |
| Finnish | 288 | 0.0% |
| French | 13,158 | 1.7% |
| French American Indian | 43 | 0.0% |
| French Canadian | 1,050 | 0.1% |
| German | 122,929 | 15.8% |
| Ghanaian | 85 | 0.0% |
| Greek | 679 | 0.1% |
| Guamanian / Chamorro | 69 | 0.0% |
| Guatemalan | 2,285 | 0.3% |
| Guyanese | 9 | 0.0% |
| Haitian | 933 | 0.1% |
| Hmong | 90 | 0.0% |
| Honduran | 2,380 | 0.3% |
| Hopi | 23 | 0.0% |
| Hungarian | 1,516 | 0.2% |
| Icelander | 99 | 0.0% |
| Indian (Asian) | 3,662 | 0.5% |
| Indonesian | 1,350 | 0.2% |
| Inupiat | 27 | 0.0% |
| Iranian | 671 | 0.1% |
| Iraqi | 949 | 0.1% |
| Irish | 94,080 | 12.1% |
| Iroquois | 7 | 0.0% |
| Israeli | 186 | 0.0% |
| Italian | 20,160 | 2.6% |
| Jamaican | 442 | 0.1% |
| Japanese | 431 | 0.1% |
| Jordanian | 653 | 0.1% |
| Kenyan | 257 | 0.0% |
| Korean | 4,523 | 0.6% |
| Laotian | 17 | 0.0% |
| Latvian | 305 | 0.0% |
| Lebanese | 1,245 | 0.2% |
| Liberian | 386 | 0.1% |
| Lithuanian | 1,235 | 0.2% |
| Lumbee | 4 | 0.0% |
| Luxembourger | 28 | 0.0% |
| Malaysian | 46 | 0.0% |
| Maltese | 18 | 0.0% |
| Menominee | 8 | 0.0% |
| Mexican | 17,143 | 2.2% |
| Mexican American Indian | 246 | 0.0% |
| Mongolian | 51 | 0.0% |
| Moroccan | 543 | 0.1% |
| Native Hawaiian | 338 | 0.0% |
| Navajo | 25 | 0.0% |
| New Zealander | 51 | 0.0% |
| Nicaraguan | 242 | 0.0% |
| Nigerian | 582 | 0.1% |
| Northern European | 949 | 0.1% |
| Norwegian | 2,913 | 0.4% |
| Osage | 37 | 0.0% |
| Ottawa | 2 | 0.0% |
| Pakistani | 489 | 0.1% |
| Palestinian | 253 | 0.0% |
| Panamanian | 558 | 0.1% |
| Paraguayan | 11 | 0.0% |
| Pennsylvania German | 38 | 0.0% |
| Peruvian | 957 | 0.1% |
| Polish | 9,299 | 1.2% |
| Portuguese | 1,142 | 0.2% |
| Potawatomi | 20 | 0.0% |
| Pueblo | 5 | 0.0% |
| Puerto Rican | 3,159 | 0.4% |
| Romanian | 328 | 0.0% |
| Russian | 3,227 | 0.4% |
| Salvadoran | 454 | 0.1% |
| Samoan | 96 | 0.0% |
| Scandinavian | 1,833 | 0.2% |
| Scotch-Irish | 7,936 | 1.0% |
| Scottish | 13,975 | 1.8% |
| Seminole | 7 | 0.0% |
| Senegalese | 141 | 0.0% |
| Serbian | 276 | 0.0% |
| Shoshone | 17 | 0.0% |
| Sioux | 99 | 0.0% |
| Slavic | 422 | 0.1% |
| Slovak | 768 | 0.1% |
| Slovene | 129 | 0.0% |
| Somali | 1,432 | 0.2% |
| South African | 121 | 0.0% |
| South American | 3,170 | 0.4% |
| South American Indian | 15 | 0.0% |
| Soviet Union | 16 | 0.0% |
| Spaniard | 601 | 0.1% |
| Spanish | 729 | 0.1% |
| Sri Lankan | 3,406 | 0.4% |
| Subsaharan African | 19,827 | 2.5% |
| Sudanese | 269 | 0.0% |
| Swedish | 4,228 | 0.5% |
| Swiss | 2,801 | 0.4% |
| Syrian | 169 | 0.0% |
| Taiwanese | 38 | 0.0% |
| Thai | 7,952 | 1.0% |
| Tohono O'Odham | 181 | 0.0% |
| Tongan | 4 | 0.0% |
| Trinidadian and Tobagonian | 194 | 0.0% |
| Turkish | 506 | 0.1% |
| U.S. Virgin Islander | 48 | 0.0% |
| Ugandan | 37 | 0.0% |
| Ukrainian | 750 | 0.1% |
| Uruguayan | 10 | 0.0% |
| Venezuelan | 526 | 0.1% |
| Vietnamese | 55 | 0.0% |
| Welsh | 4,826 | 0.6% |
| West Indian | 116 | 0.0% |
| Yugoslavian | 1,739 | 0.2% |
| Zimbabwean | 5 | 0.0% | View All 174 Rows |
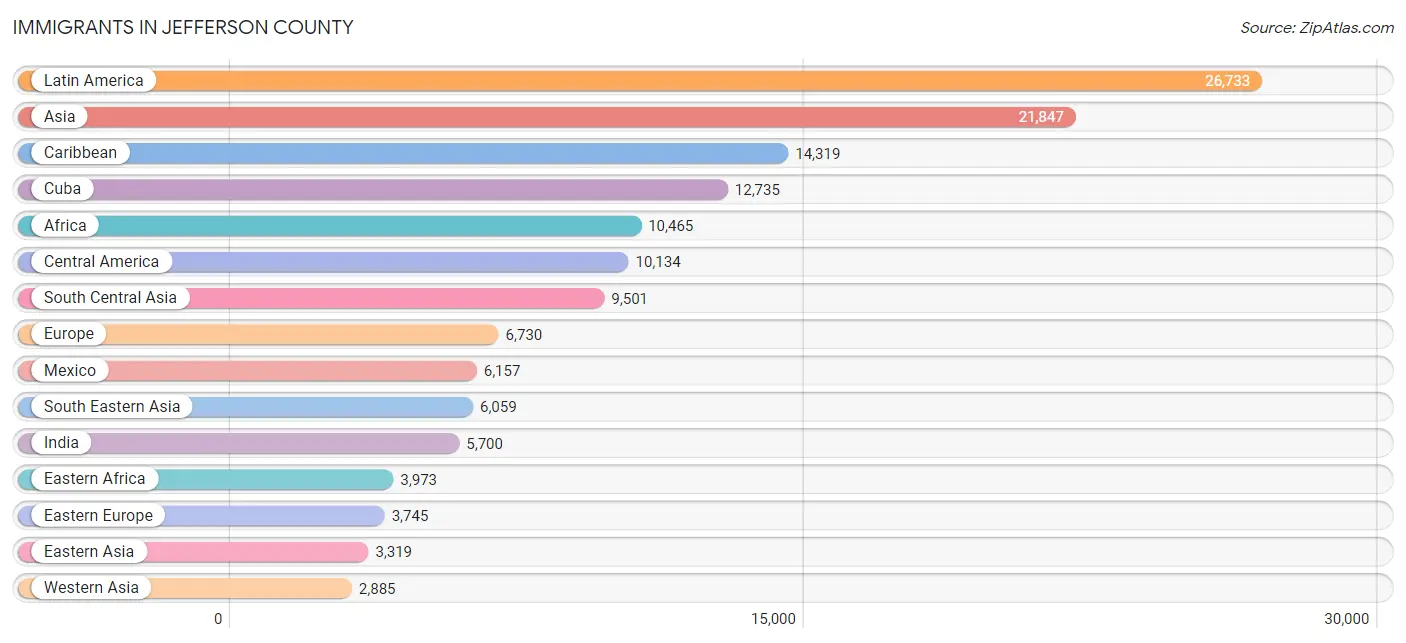
Immigrants in Jefferson County
The most numerous immigrant groups reported in Jefferson County came from Latin America (26,733 | 3.4%), Asia (21,847 | 2.8%), Caribbean (14,319 | 1.8%), Cuba (12,735 | 1.6%), and Africa (10,465 | 1.3%), together accounting for 11.0% of all Jefferson County residents.
| Immigration Origin | # Population | % Population |
| Afghanistan | 254 | 0.0% |
| Africa | 10,465 | 1.3% |
| Albania | 113 | 0.0% |
| Argentina | 163 | 0.0% |
| Armenia | 1 | 0.0% |
| Asia | 21,847 | 2.8% |
| Australia | 85 | 0.0% |
| Austria | 91 | 0.0% |
| Bangladesh | 89 | 0.0% |
| Barbados | 38 | 0.0% |
| Belarus | 256 | 0.0% |
| Belgium | 19 | 0.0% |
| Belize | 19 | 0.0% |
| Bolivia | 84 | 0.0% |
| Bosnia and Herzegovina | 1,348 | 0.2% |
| Brazil | 176 | 0.0% |
| Bulgaria | 42 | 0.0% |
| Cambodia | 146 | 0.0% |
| Cameroon | 25 | 0.0% |
| Canada | 1,209 | 0.2% |
| Caribbean | 14,319 | 1.8% |
| Central America | 10,134 | 1.3% |
| Chile | 149 | 0.0% |
| China | 1,812 | 0.2% |
| Colombia | 431 | 0.1% |
| Congo | 1,023 | 0.1% |
| Costa Rica | 65 | 0.0% |
| Croatia | 179 | 0.0% |
| Cuba | 12,735 | 1.6% |
| Czechoslovakia | 36 | 0.0% |
| Denmark | 18 | 0.0% |
| Dominican Republic | 87 | 0.0% |
| Eastern Africa | 3,973 | 0.5% |
| Eastern Asia | 3,319 | 0.4% |
| Eastern Europe | 3,745 | 0.5% |
| Ecuador | 25 | 0.0% |
| Egypt | 59 | 0.0% |
| El Salvador | 210 | 0.0% |
| England | 286 | 0.0% |
| Eritrea | 197 | 0.0% |
| Ethiopia | 946 | 0.1% |
| Europe | 6,730 | 0.9% |
| Fiji | 9 | 0.0% |
| France | 191 | 0.0% |
| Germany | 1,202 | 0.2% |
| Ghana | 203 | 0.0% |
| Greece | 10 | 0.0% |
| Guatemala | 1,622 | 0.2% |
| Guyana | 184 | 0.0% |
| Haiti | 695 | 0.1% |
| Honduras | 1,756 | 0.2% |
| Hong Kong | 182 | 0.0% |
| Hungary | 30 | 0.0% |
| India | 5,700 | 0.7% |
| Indonesia | 4 | 0.0% |
| Iran | 470 | 0.1% |
| Iraq | 1,532 | 0.2% |
| Ireland | 85 | 0.0% |
| Israel | 41 | 0.0% |
| Italy | 92 | 0.0% |
| Jamaica | 524 | 0.1% |
| Japan | 387 | 0.1% |
| Jordan | 670 | 0.1% |
| Kazakhstan | 33 | 0.0% |
| Kenya | 608 | 0.1% |
| Korea | 1,054 | 0.1% |
| Kuwait | 96 | 0.0% |
| Laos | 193 | 0.0% |
| Latin America | 26,733 | 3.4% |
| Latvia | 8 | 0.0% |
| Lebanon | 43 | 0.0% |
| Liberia | 511 | 0.1% |
| Lithuania | 46 | 0.0% |
| Malaysia | 148 | 0.0% |
| Mexico | 6,157 | 0.8% |
| Micronesia | 27 | 0.0% |
| Middle Africa | 2,294 | 0.3% |
| Moldova | 107 | 0.0% |
| Morocco | 370 | 0.1% |
| Nepal | 712 | 0.1% |
| Netherlands | 60 | 0.0% |
| Nicaragua | 183 | 0.0% |
| Nigeria | 346 | 0.0% |
| Northern Africa | 1,130 | 0.2% |
| Northern Europe | 995 | 0.1% |
| Norway | 14 | 0.0% |
| Oceania | 211 | 0.0% |
| Pakistan | 483 | 0.1% |
| Panama | 122 | 0.0% |
| Peru | 506 | 0.1% |
| Philippines | 2,047 | 0.3% |
| Poland | 125 | 0.0% |
| Portugal | 46 | 0.0% |
| Romania | 46 | 0.0% |
| Russia | 501 | 0.1% |
| Saudi Arabia | 67 | 0.0% |
| Scotland | 177 | 0.0% |
| Senegal | 128 | 0.0% |
| Serbia | 179 | 0.0% |
| Singapore | 28 | 0.0% |
| Somalia | 1,400 | 0.2% |
| South Africa | 304 | 0.0% |
| South America | 2,280 | 0.3% |
| South Central Asia | 9,501 | 1.2% |
| South Eastern Asia | 6,059 | 0.8% |
| Southern Europe | 425 | 0.1% |
| Spain | 277 | 0.0% |
| Sri Lanka | 168 | 0.0% |
| Sudan | 161 | 0.0% |
| Sweden | 26 | 0.0% |
| Syria | 142 | 0.0% |
| Taiwan | 149 | 0.0% |
| Thailand | 743 | 0.1% |
| Trinidad and Tobago | 120 | 0.0% |
| Turkey | 64 | 0.0% |
| Uganda | 74 | 0.0% |
| Ukraine | 239 | 0.0% |
| Uruguay | 10 | 0.0% |
| Uzbekistan | 497 | 0.1% |
| Venezuela | 527 | 0.1% |
| Vietnam | 2,116 | 0.3% |
| West Indies | 99 | 0.0% |
| Western Africa | 1,763 | 0.2% |
| Western Asia | 2,885 | 0.4% |
| Western Europe | 1,563 | 0.2% |
| Zaire | 1,002 | 0.1% |
| Zimbabwe | 5 | 0.0% | View All 127 Rows |
Sex and Age in Jefferson County
Sex and Age in Jefferson County
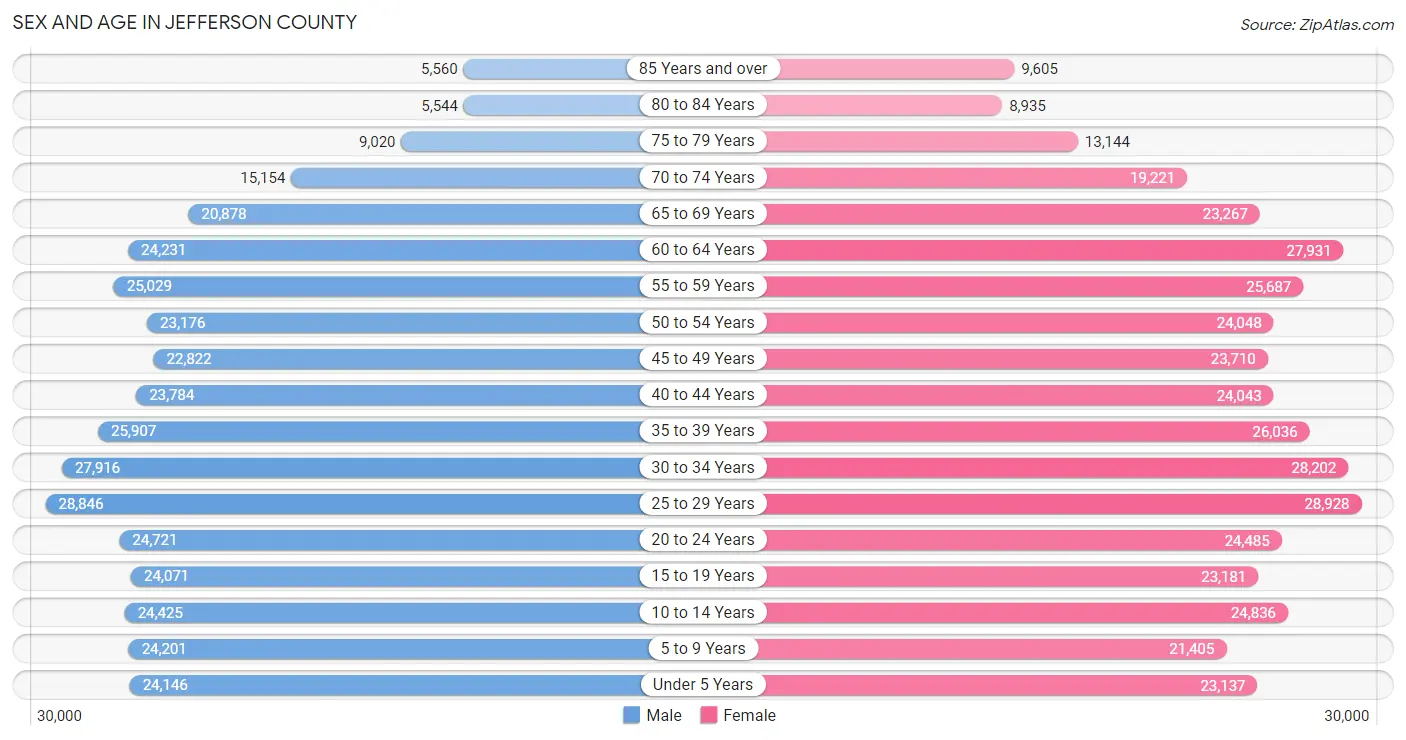
The most populous age groups in Jefferson County are 25 to 29 Years (28,846 | 7.6%) for men and 25 to 29 Years (28,928 | 7.2%) for women.
| Age Bracket | Male | Female |
| Under 5 Years | 24,146 (6.4%) | 23,137 (5.8%) |
| 5 to 9 Years | 24,201 (6.4%) | 21,405 (5.3%) |
| 10 to 14 Years | 24,425 (6.4%) | 24,836 (6.2%) |
| 15 to 19 Years | 24,071 (6.3%) | 23,181 (5.8%) |
| 20 to 24 Years | 24,721 (6.5%) | 24,485 (6.1%) |
| 25 to 29 Years | 28,846 (7.6%) | 28,928 (7.2%) |
| 30 to 34 Years | 27,916 (7.4%) | 28,202 (7.0%) |
| 35 to 39 Years | 25,907 (6.8%) | 26,036 (6.5%) |
| 40 to 44 Years | 23,784 (6.3%) | 24,043 (6.0%) |
| 45 to 49 Years | 22,822 (6.0%) | 23,710 (5.9%) |
| 50 to 54 Years | 23,176 (6.1%) | 24,048 (6.0%) |
| 55 to 59 Years | 25,029 (6.6%) | 25,687 (6.4%) |
| 60 to 64 Years | 24,231 (6.4%) | 27,931 (7.0%) |
| 65 to 69 Years | 20,878 (5.5%) | 23,267 (5.8%) |
| 70 to 74 Years | 15,154 (4.0%) | 19,221 (4.8%) |
| 75 to 79 Years | 9,020 (2.4%) | 13,144 (3.3%) |
| 80 to 84 Years | 5,544 (1.5%) | 8,935 (2.2%) |
| 85 Years and over | 5,560 (1.5%) | 9,605 (2.4%) |
| Total | 379,431 (100.0%) | 399,801 (100.0%) |
Families and Households in Jefferson County
Median Family Size in Jefferson County
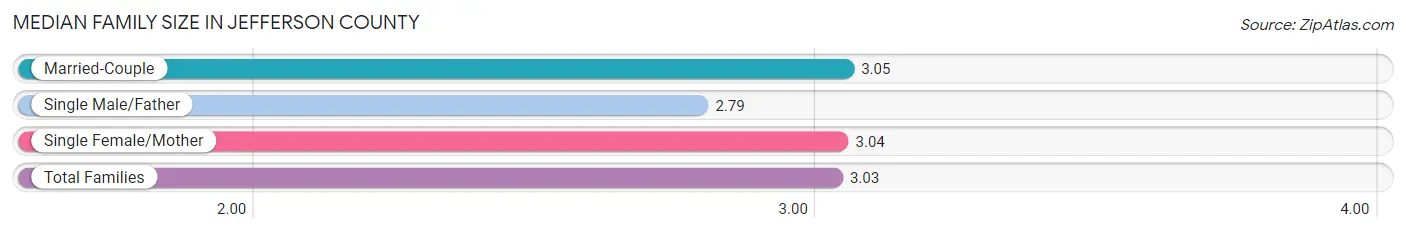
The median family size in Jefferson County is 3.03 persons per family, with married-couple families (129,446 | 67.5%) accounting for the largest median family size of 3.05 persons per family. On the other hand, single male/father families (16,217 | 8.5%) represent the smallest median family size with 2.79 persons per family.
| Family Type | # Families | Family Size |
| Married-Couple | 129,446 (67.5%) | 3.05 |
| Single Male/Father | 16,217 (8.5%) | 2.79 |
| Single Female/Mother | 45,994 (24.0%) | 3.04 |
| Total Families | 191,657 (100.0%) | 3.03 |
Median Household Size in Jefferson County
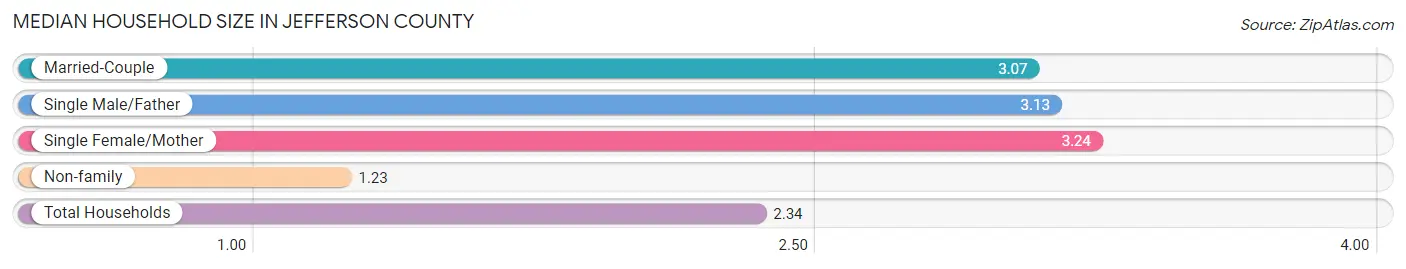
The median household size in Jefferson County is 2.34 persons per household, with single female/mother households (45,994 | 14.1%) accounting for the largest median household size of 3.24 persons per household. non-family households (135,554 | 41.4%) represent the smallest median household size with 1.23 persons per household.
| Household Type | # Households | Household Size |
| Married-Couple | 129,446 (39.6%) | 3.07 |
| Single Male/Father | 16,217 (5.0%) | 3.13 |
| Single Female/Mother | 45,994 (14.1%) | 3.24 |
| Non-family | 135,554 (41.4%) | 1.23 |
| Total Households | 327,211 (100.0%) | 2.34 |
Household Size by Marriage Status in Jefferson County
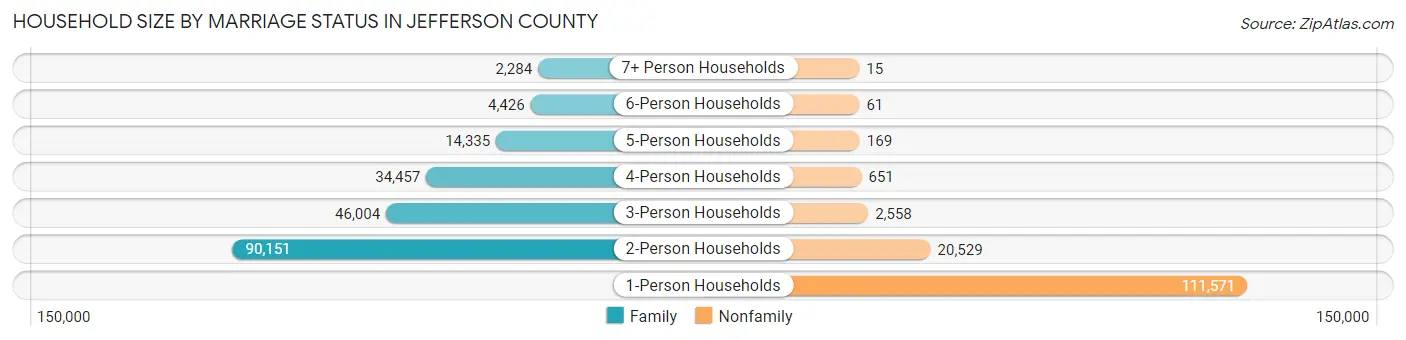
Out of a total of 327,211 households in Jefferson County, 191,657 (58.6%) are family households, while 135,554 (41.4%) are nonfamily households. The most numerous type of family households are 2-person households, comprising 90,151, and the most common type of nonfamily households are 1-person households, comprising 111,571.
| Household Size | Family Households | Nonfamily Households |
| 1-Person Households | - | 111,571 (34.1%) |
| 2-Person Households | 90,151 (27.6%) | 20,529 (6.3%) |
| 3-Person Households | 46,004 (14.1%) | 2,558 (0.8%) |
| 4-Person Households | 34,457 (10.5%) | 651 (0.2%) |
| 5-Person Households | 14,335 (4.4%) | 169 (0.1%) |
| 6-Person Households | 4,426 (1.3%) | 61 (0.0%) |
| 7+ Person Households | 2,284 (0.7%) | 15 (0.0%) |
| Total | 191,657 (58.6%) | 135,554 (41.4%) |
Female Fertility in Jefferson County
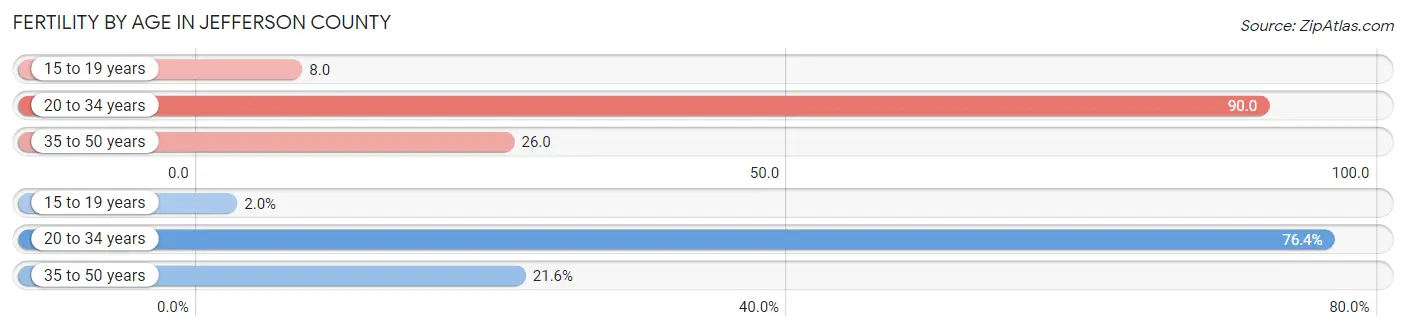
Fertility by Age in Jefferson County
Average fertility rate in Jefferson County is 52.0 births per 1,000 women. Women in the age bracket of 20 to 34 years have the highest fertility rate with 90.0 births per 1,000 women. Women in the age bracket of 20 to 34 years acount for 76.4% of all women with births.
| Age Bracket | Women with Births | Births / 1,000 Women |
| 15 to 19 years | 192 (2.0%) | 8.0 |
| 20 to 34 years | 7,376 (76.4%) | 90.0 |
| 35 to 50 years | 2,081 (21.6%) | 26.0 |
| Total | 9,649 (100.0%) | 52.0 |
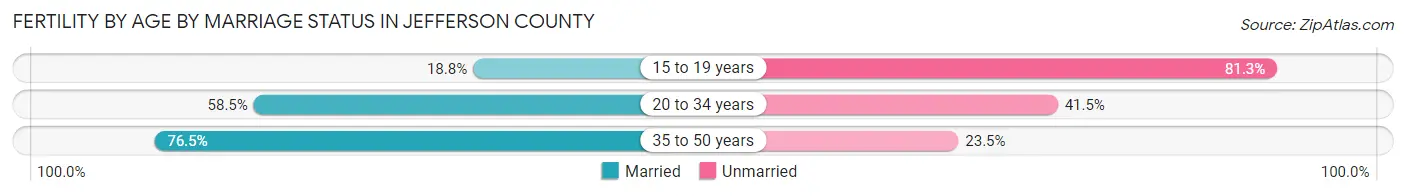
Fertility by Age by Marriage Status in Jefferson County
61.6% of women with births (9,649) in Jefferson County are married. The highest percentage of unmarried women with births falls into 15 to 19 years age bracket with 81.2% of them unmarried at the time of birth, while the lowest percentage of unmarried women with births belong to 35 to 50 years age bracket with 23.5% of them unmarried.
| Age Bracket | Married | Unmarried |
| 15 to 19 years | 36 (18.8%) | 156 (81.2%) |
| 20 to 34 years | 4,315 (58.5%) | 3,061 (41.5%) |
| 35 to 50 years | 1,592 (76.5%) | 489 (23.5%) |
| Total | 5,944 (61.6%) | 3,705 (38.4%) |
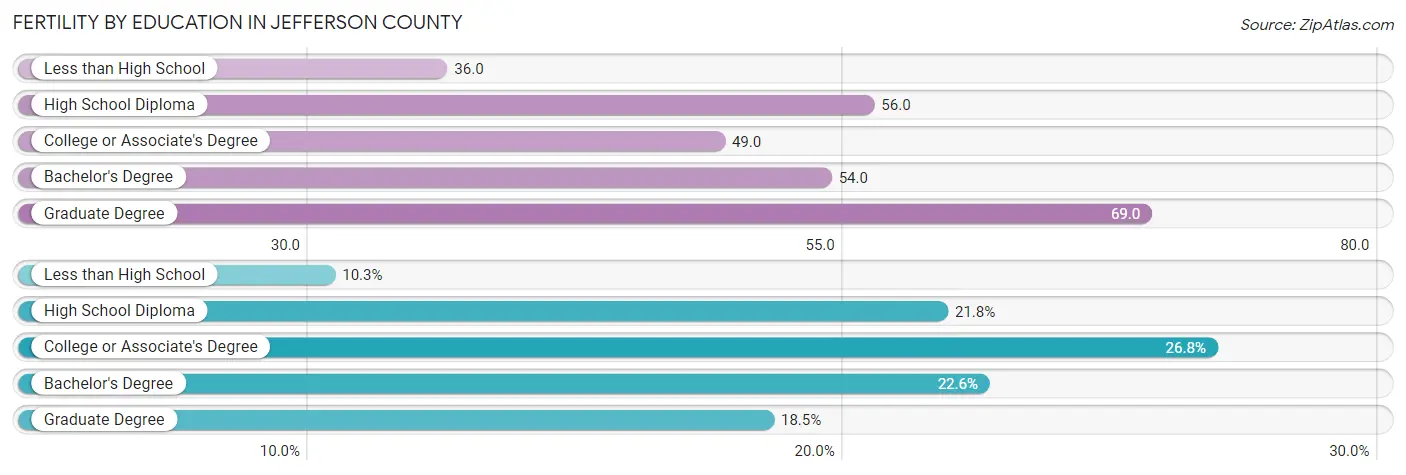
Fertility by Education in Jefferson County
Average fertility rate in Jefferson County is 52.0 births per 1,000 women. Women with the education attainment of graduate degree have the highest fertility rate of 69.0 births per 1,000 women, while women with the education attainment of less than high school have the lowest fertility at 36.0 births per 1,000 women. Women with the education attainment of college or associate's degree represent 26.8% of all women with births.
| Educational Attainment | Women with Births | Births / 1,000 Women |
| Less than High School | 994 (10.3%) | 36.0 |
| High School Diploma | 2,102 (21.8%) | 56.0 |
| College or Associate's Degree | 2,589 (26.8%) | 49.0 |
| Bachelor's Degree | 2,177 (22.6%) | 54.0 |
| Graduate Degree | 1,787 (18.5%) | 69.0 |
| Total | 9,649 (100.0%) | 52.0 |
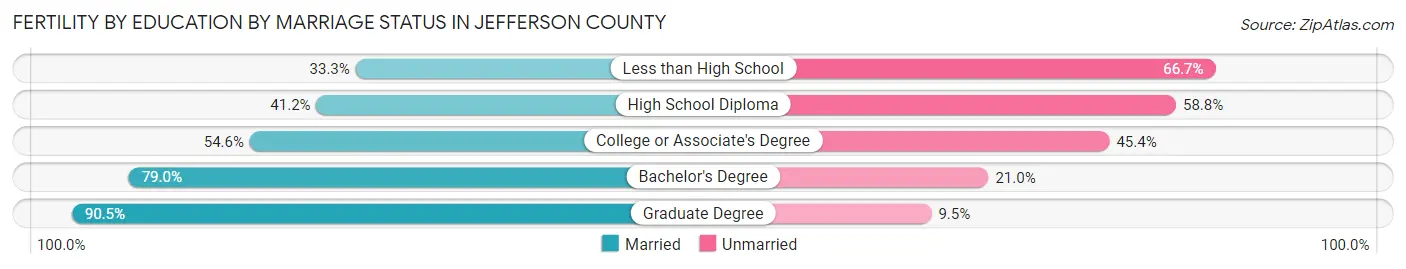
Fertility by Education by Marriage Status in Jefferson County
38.4% of women with births in Jefferson County are unmarried. Women with the educational attainment of graduate degree are most likely to be married with 90.5% of them married at childbirth, while women with the educational attainment of less than high school are least likely to be married with 66.7% of them unmarried at childbirth.
| Educational Attainment | Married | Unmarried |
| Less than High School | 331 (33.3%) | 663 (66.7%) |
| High School Diploma | 866 (41.2%) | 1,236 (58.8%) |
| College or Associate's Degree | 1,414 (54.6%) | 1,175 (45.4%) |
| Bachelor's Degree | 1,720 (79.0%) | 457 (21.0%) |
| Graduate Degree | 1,617 (90.5%) | 170 (9.5%) |
| Total | 5,944 (61.6%) | 3,705 (38.4%) |
Income in Jefferson County
Income Overview in Jefferson County
Per Capita Income in Jefferson County is $39,994, while median incomes of families and households are $86,214 and $66,296 respectively.
| Characteristic | Number | Measure |
| Per Capita Income | 779,232 | $39,994 |
| Median Family Income | 191,657 | $86,214 |
| Mean Family Income | 191,657 | $115,174 |
| Median Household Income | 327,211 | $66,296 |
| Mean Household Income | 327,211 | $93,367 |
| Income Deficit | 191,657 | $11,052 |
| Wage / Income Gap (%) | 779,232 | 22.97% |
| Wage / Income Gap ($) | 779,232 | 77.03¢ per $1 |
| Gini / Inequality Index | 779,232 | 0.48 |
Earnings by Sex in Jefferson County
Average Earnings in Jefferson County are $40,788, $46,272 for men and $35,642 for women, a difference of 23.0%.
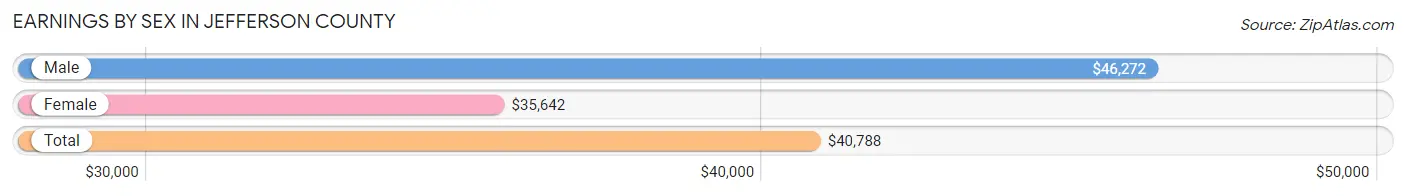
| Sex | Number | Average Earnings |
| Male | 219,879 (51.3%) | $46,272 |
| Female | 209,028 (48.7%) | $35,642 |
| Total | 428,907 (100.0%) | $40,788 |
Earnings by Sex by Income Bracket in Jefferson County
The most common earnings brackets in Jefferson County are $100,000+ for men (35,667 | 16.2%) and $75,000 to $99,999 for women (16,847 | 8.1%).
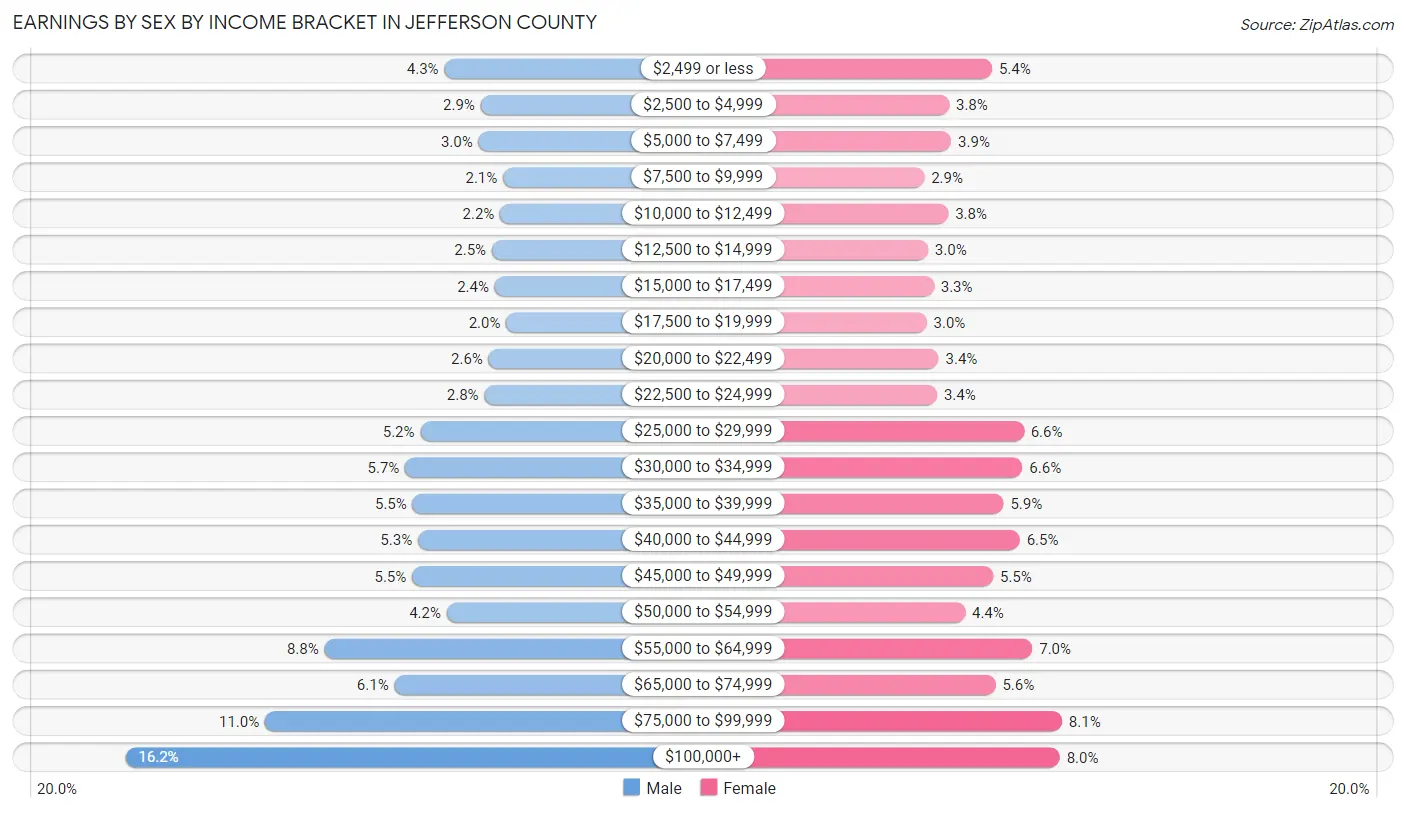
| Income | Male | Female |
| $2,499 or less | 9,386 (4.3%) | 11,380 (5.4%) |
| $2,500 to $4,999 | 6,390 (2.9%) | 7,996 (3.8%) |
| $5,000 to $7,499 | 6,580 (3.0%) | 8,178 (3.9%) |
| $7,500 to $9,999 | 4,556 (2.1%) | 6,068 (2.9%) |
| $10,000 to $12,499 | 4,783 (2.2%) | 7,939 (3.8%) |
| $12,500 to $14,999 | 5,468 (2.5%) | 6,347 (3.0%) |
| $15,000 to $17,499 | 5,234 (2.4%) | 6,809 (3.3%) |
| $17,500 to $19,999 | 4,287 (1.9%) | 6,248 (3.0%) |
| $20,000 to $22,499 | 5,735 (2.6%) | 7,182 (3.4%) |
| $22,500 to $24,999 | 6,080 (2.8%) | 7,058 (3.4%) |
| $25,000 to $29,999 | 11,360 (5.2%) | 13,851 (6.6%) |
| $30,000 to $34,999 | 12,612 (5.7%) | 13,754 (6.6%) |
| $35,000 to $39,999 | 12,013 (5.5%) | 12,260 (5.9%) |
| $40,000 to $44,999 | 11,559 (5.3%) | 13,544 (6.5%) |
| $45,000 to $49,999 | 12,052 (5.5%) | 11,450 (5.5%) |
| $50,000 to $54,999 | 9,184 (4.2%) | 9,259 (4.4%) |
| $55,000 to $64,999 | 19,263 (8.8%) | 14,528 (7.0%) |
| $65,000 to $74,999 | 13,510 (6.1%) | 11,646 (5.6%) |
| $75,000 to $99,999 | 24,160 (11.0%) | 16,847 (8.1%) |
| $100,000+ | 35,667 (16.2%) | 16,684 (8.0%) |
| Total | 219,879 (100.0%) | 209,028 (100.0%) |
Earnings by Sex by Educational Attainment in Jefferson County
Average earnings in Jefferson County are $52,695 for men and $40,559 for women, a difference of 23.0%. Men with an educational attainment of graduate degree enjoy the highest average annual earnings of $86,032, while those with less than high school education earn the least with $30,908. Women with an educational attainment of graduate degree earn the most with the average annual earnings of $67,773, while those with less than high school education have the smallest earnings of $21,633.
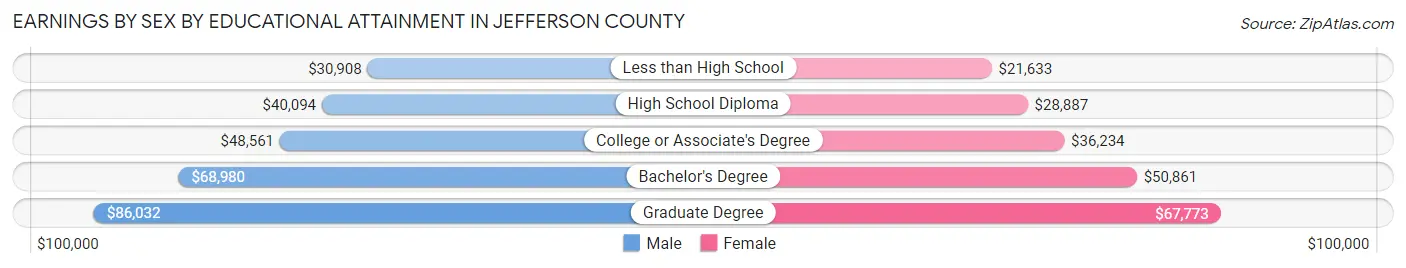
| Educational Attainment | Male Income | Female Income |
| Less than High School | $30,908 | $21,633 |
| High School Diploma | $40,094 | $28,887 |
| College or Associate's Degree | $48,561 | $36,234 |
| Bachelor's Degree | $68,980 | $50,861 |
| Graduate Degree | $86,032 | $67,773 |
| Total | $52,695 | $40,559 |
Family Income in Jefferson County
Family Income Brackets in Jefferson County
According to the Jefferson County family income data, there are 37,948 families falling into the $100,000 to $149,999 income range, which is the most common income bracket and makes up 19.8% of all families. Conversely, the $10,000 to $14,999 income bracket is the least frequent group with only 4,025 families (2.1%) belonging to this category.
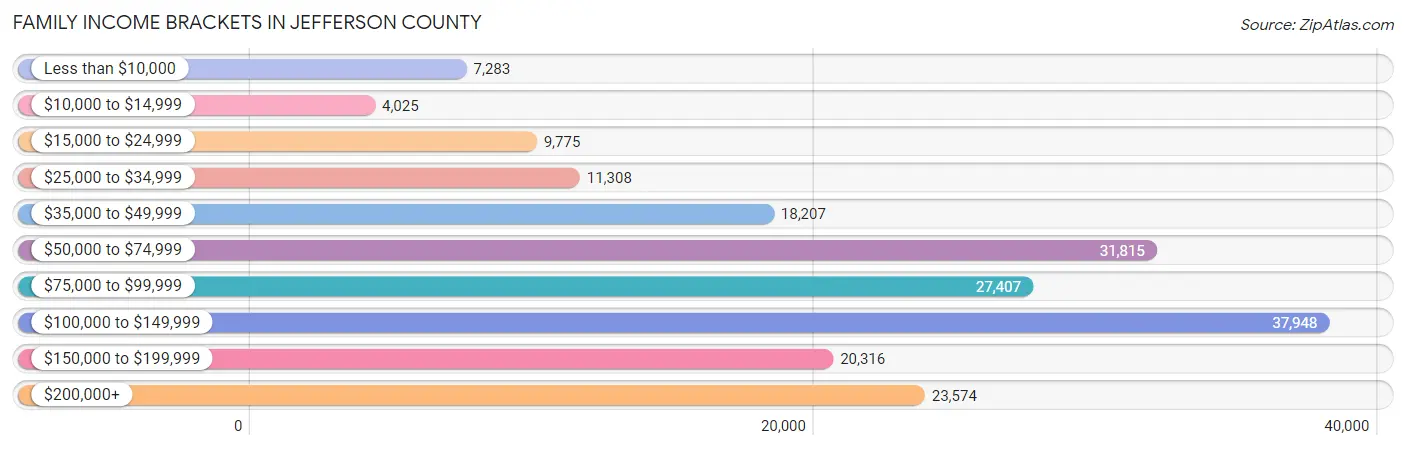
| Income Bracket | # Families | % Families |
| Less than $10,000 | 7,283 | 3.8% |
| $10,000 to $14,999 | 4,025 | 2.1% |
| $15,000 to $24,999 | 9,775 | 5.1% |
| $25,000 to $34,999 | 11,308 | 5.9% |
| $35,000 to $49,999 | 18,207 | 9.5% |
| $50,000 to $74,999 | 31,815 | 16.6% |
| $75,000 to $99,999 | 27,407 | 14.3% |
| $100,000 to $149,999 | 37,948 | 19.8% |
| $150,000 to $199,999 | 20,316 | 10.6% |
| $200,000+ | 23,574 | 12.3% |
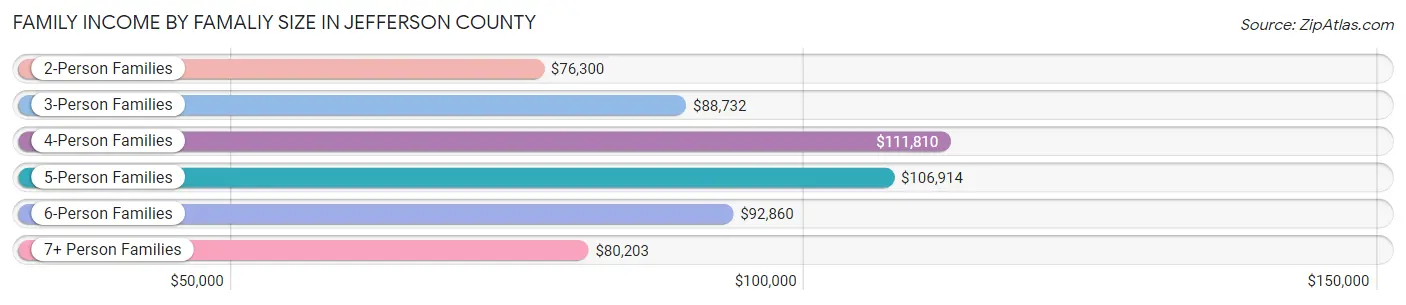
Family Income by Famaliy Size in Jefferson County
4-person families (31,588 | 16.5%) account for the highest median family income in Jefferson County with $111,810 per family, while 2-person families (97,304 | 50.8%) have the highest median income of $38,150 per family member.
| Income Bracket | # Families | Median Income |
| 2-Person Families | 97,304 (50.8%) | $76,300 |
| 3-Person Families | 44,043 (23.0%) | $88,732 |
| 4-Person Families | 31,588 (16.5%) | $111,810 |
| 5-Person Families | 13,119 (6.9%) | $106,914 |
| 6-Person Families | 3,681 (1.9%) | $92,860 |
| 7+ Person Families | 1,922 (1.0%) | $80,203 |
| Total | 191,657 (100.0%) | $86,214 |
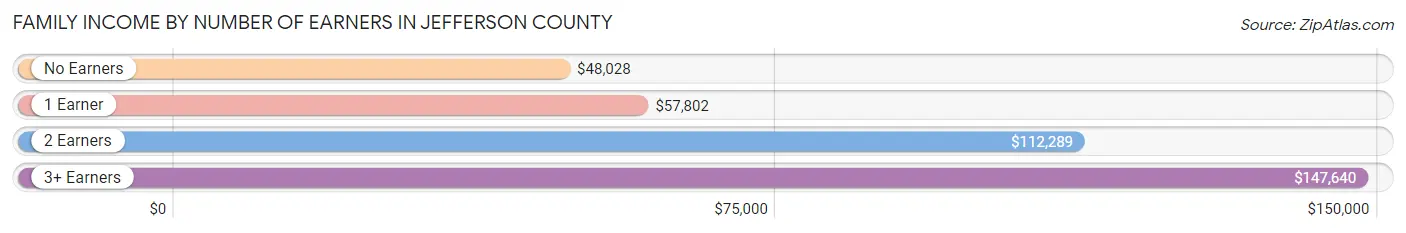
Family Income by Number of Earners in Jefferson County
The median family income in Jefferson County is $86,214, with families comprising 3+ earners (19,358) having the highest median family income of $147,640, while families with no earners (27,180) have the lowest median family income of $48,028, accounting for 10.1% and 14.2% of families, respectively.
| Number of Earners | # Families | Median Income |
| No Earners | 27,180 (14.2%) | $48,028 |
| 1 Earner | 62,738 (32.7%) | $57,802 |
| 2 Earners | 82,381 (43.0%) | $112,289 |
| 3+ Earners | 19,358 (10.1%) | $147,640 |
| Total | 191,657 (100.0%) | $86,214 |
Household Income in Jefferson County
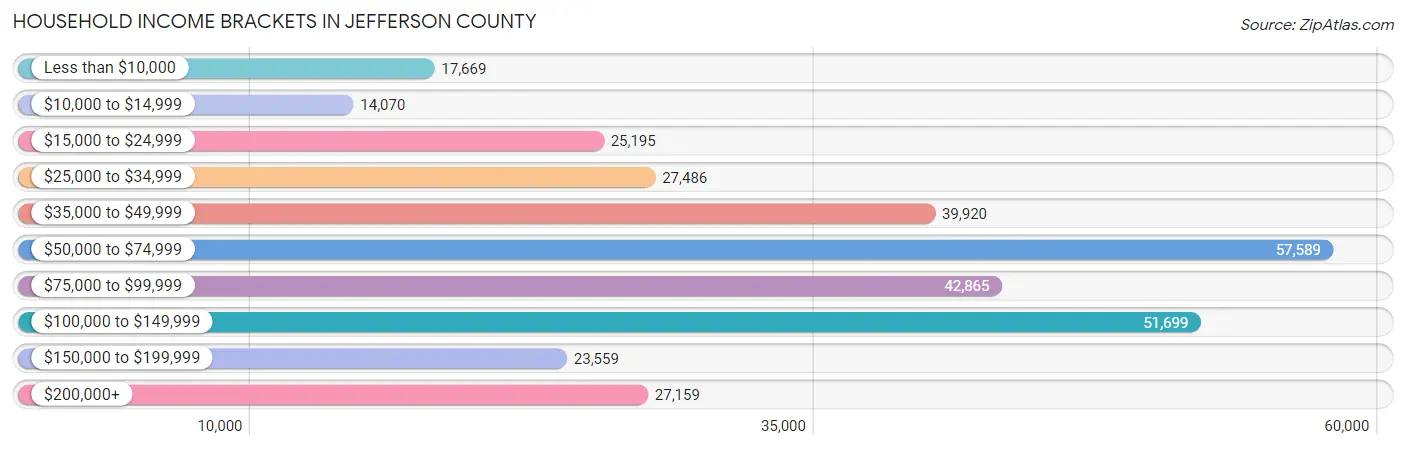
Household Income Brackets in Jefferson County
With 57,589 households falling in the category, the $50,000 to $74,999 income range is the most frequent in Jefferson County, accounting for 17.6% of all households. In contrast, only 14,070 households (4.3%) fall into the $10,000 to $14,999 income bracket, making it the least populous group.
| Income Bracket | # Households | % Households |
| Less than $10,000 | 17,669 | 5.4% |
| $10,000 to $14,999 | 14,070 | 4.3% |
| $15,000 to $24,999 | 25,195 | 7.7% |
| $25,000 to $34,999 | 27,486 | 8.4% |
| $35,000 to $49,999 | 39,920 | 12.2% |
| $50,000 to $74,999 | 57,589 | 17.6% |
| $75,000 to $99,999 | 42,865 | 13.1% |
| $100,000 to $149,999 | 51,699 | 15.8% |
| $150,000 to $199,999 | 23,559 | 7.2% |
| $200,000+ | 27,159 | 8.3% |
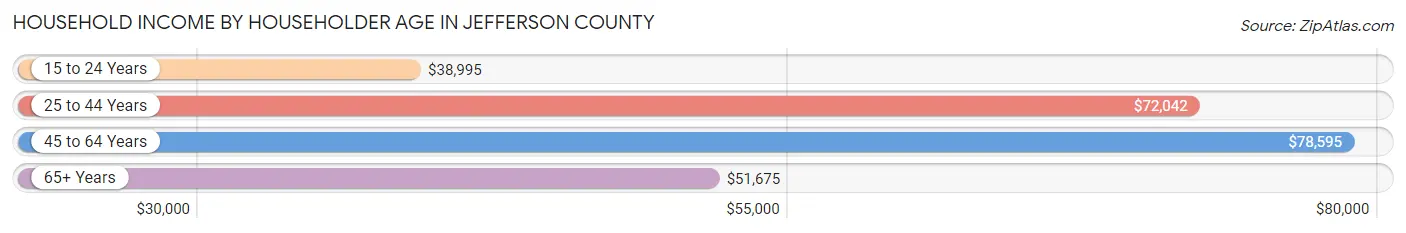
Household Income by Householder Age in Jefferson County
The median household income in Jefferson County is $66,296, with the highest median household income of $78,595 found in the 45 to 64 years age bracket for the primary householder. A total of 116,160 households (35.5%) fall into this category. Meanwhile, the 15 to 24 years age bracket for the primary householder has the lowest median household income of $38,995, with 13,500 households (4.1%) in this group.
| Income Bracket | # Households | Median Income |
| 15 to 24 Years | 13,500 (4.1%) | $38,995 |
| 25 to 44 Years | 111,019 (33.9%) | $72,042 |
| 45 to 64 Years | 116,160 (35.5%) | $78,595 |
| 65+ Years | 86,532 (26.5%) | $51,675 |
| Total | 327,211 (100.0%) | $66,296 |
Poverty in Jefferson County
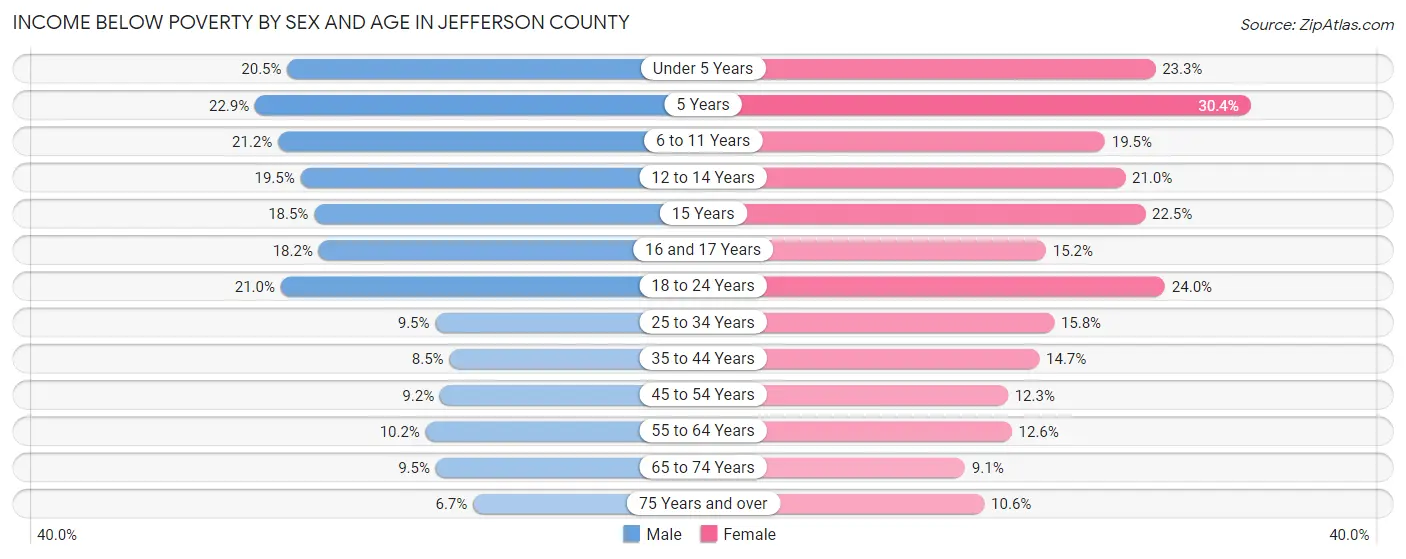
Income Below Poverty by Sex and Age in Jefferson County
With 12.7% poverty level for males and 15.4% for females among the residents of Jefferson County, 5 year old males and 5 year old females are the most vulnerable to poverty, with 1,084 males (22.9%) and 1,512 females (30.3%) in their respective age groups living below the poverty level.
| Age Bracket | Male | Female |
| Under 5 Years | 4,826 (20.5%) | 5,266 (23.3%) |
| 5 Years | 1,084 (22.9%) | 1,512 (30.3%) |
| 6 to 11 Years | 6,084 (21.2%) | 4,964 (19.5%) |
| 12 to 14 Years | 2,750 (19.5%) | 3,075 (21.0%) |
| 15 Years | 944 (18.5%) | 1,041 (22.5%) |
| 16 and 17 Years | 1,716 (18.2%) | 1,435 (15.1%) |
| 18 to 24 Years | 6,627 (21.0%) | 7,426 (24.0%) |
| 25 to 34 Years | 5,321 (9.5%) | 8,952 (15.8%) |
| 35 to 44 Years | 4,148 (8.5%) | 7,309 (14.6%) |
| 45 to 54 Years | 4,171 (9.2%) | 5,862 (12.3%) |
| 55 to 64 Years | 4,998 (10.2%) | 6,718 (12.6%) |
| 65 to 74 Years | 3,370 (9.5%) | 3,822 (9.1%) |
| 75 Years and over | 1,308 (6.7%) | 3,168 (10.6%) |
| Total | 47,347 (12.7%) | 60,550 (15.4%) |
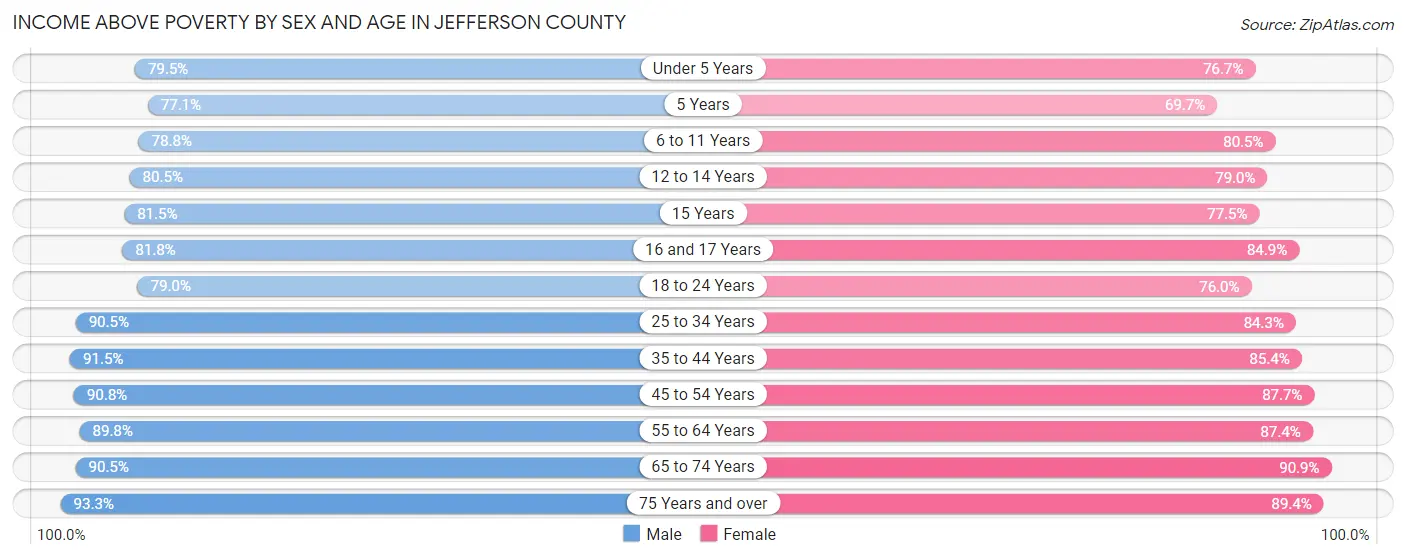
Income Above Poverty by Sex and Age in Jefferson County
According to the poverty statistics in Jefferson County, males aged 75 years and over and females aged 65 to 74 years are the age groups that are most secure financially, with 93.3% of males and 90.9% of females in these age groups living above the poverty line.
| Age Bracket | Male | Female |
| Under 5 Years | 18,727 (79.5%) | 17,360 (76.7%) |
| 5 Years | 3,651 (77.1%) | 3,470 (69.7%) |
| 6 to 11 Years | 22,646 (78.8%) | 20,450 (80.5%) |
| 12 to 14 Years | 11,343 (80.5%) | 11,549 (79.0%) |
| 15 Years | 4,158 (81.5%) | 3,581 (77.5%) |
| 16 and 17 Years | 7,732 (81.8%) | 8,040 (84.9%) |
| 18 to 24 Years | 24,954 (79.0%) | 23,535 (76.0%) |
| 25 to 34 Years | 50,715 (90.5%) | 47,871 (84.3%) |
| 35 to 44 Years | 44,876 (91.5%) | 42,572 (85.4%) |
| 45 to 54 Years | 41,344 (90.8%) | 41,705 (87.7%) |
| 55 to 64 Years | 43,893 (89.8%) | 46,561 (87.4%) |
| 65 to 74 Years | 32,216 (90.5%) | 37,972 (90.9%) |
| 75 Years and over | 18,206 (93.3%) | 26,794 (89.4%) |
| Total | 324,461 (87.3%) | 331,460 (84.6%) |
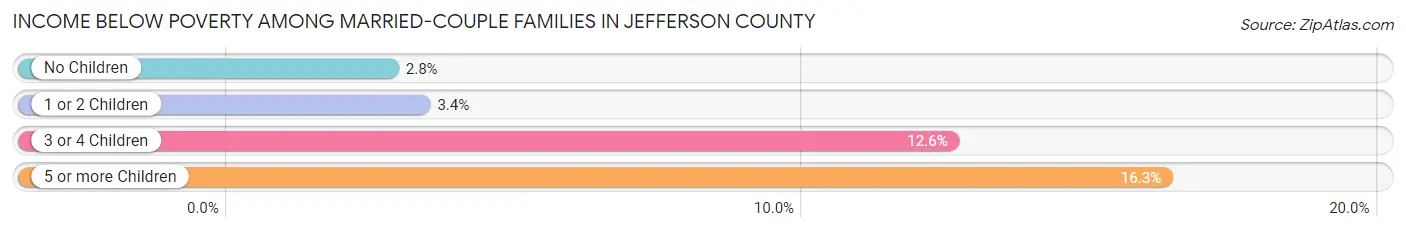
Income Below Poverty Among Married-Couple Families in Jefferson County
The poverty statistics for married-couple families in Jefferson County show that 3.7% or 4,853 of the total 129,446 families live below the poverty line. Families with 5 or more children have the highest poverty rate of 16.3%, comprising of 92 families. On the other hand, families with no children have the lowest poverty rate of 2.8%, which includes 2,219 families.
| Children | Above Poverty | Below Poverty |
| No Children | 77,020 (97.2%) | 2,219 (2.8%) |
| 1 or 2 Children | 38,762 (96.7%) | 1,344 (3.4%) |
| 3 or 4 Children | 8,338 (87.4%) | 1,198 (12.6%) |
| 5 or more Children | 473 (83.7%) | 92 (16.3%) |
| Total | 124,593 (96.3%) | 4,853 (3.7%) |
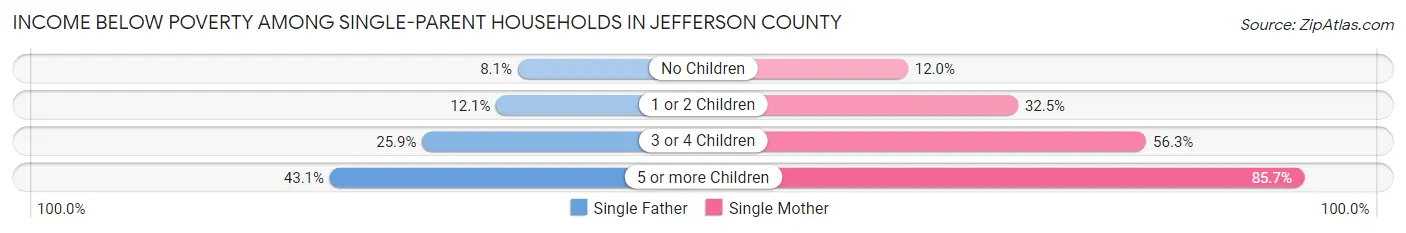
Income Below Poverty Among Single-Parent Households in Jefferson County
According to the poverty data in Jefferson County, 10.9% or 1,772 single-father households and 28.0% or 12,856 single-mother households are living below the poverty line. Among single-father households, those with 5 or more children have the highest poverty rate, with 44 households (43.1%) experiencing poverty. Likewise, among single-mother households, those with 5 or more children have the highest poverty rate, with 467 households (85.7%) falling below the poverty line.
| Children | Single Father | Single Mother |
| No Children | 665 (8.1%) | 2,067 (11.9%) |
| 1 or 2 Children | 874 (12.1%) | 7,523 (32.5%) |
| 3 or 4 Children | 189 (25.9%) | 2,799 (56.3%) |
| 5 or more Children | 44 (43.1%) | 467 (85.7%) |
| Total | 1,772 (10.9%) | 12,856 (28.0%) |
Income Below Poverty Among Married-Couple vs Single-Parent Households in Jefferson County
The poverty data for Jefferson County shows that 4,853 of the married-couple family households (3.7%) and 14,628 of the single-parent households (23.5%) are living below the poverty level. Within the married-couple family households, those with 5 or more children have the highest poverty rate, with 92 households (16.3%) falling below the poverty line. Among the single-parent households, those with 5 or more children have the highest poverty rate, with 511 household (79.0%) living below poverty.
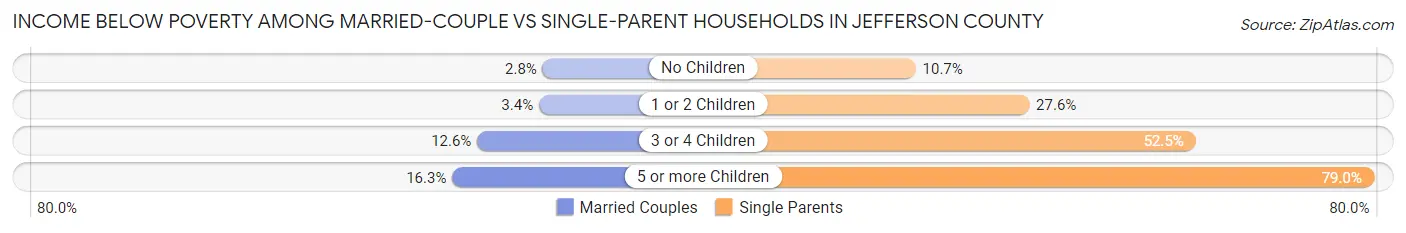
| Children | Married-Couple Families | Single-Parent Households |
| No Children | 2,219 (2.8%) | 2,732 (10.7%) |
| 1 or 2 Children | 1,344 (3.4%) | 8,397 (27.6%) |
| 3 or 4 Children | 1,198 (12.6%) | 2,988 (52.4%) |
| 5 or more Children | 92 (16.3%) | 511 (79.0%) |
| Total | 4,853 (3.7%) | 14,628 (23.5%) |
Employment Characteristics in Jefferson County
Employment by Class of Employer in Jefferson County
Among the 384,235 employed individuals in Jefferson County, private company employees (275,750 | 71.8%), not-for-profit organizations (35,608 | 9.3%), and local government employees (20,942 | 5.4%) make up the most common classes of employment.
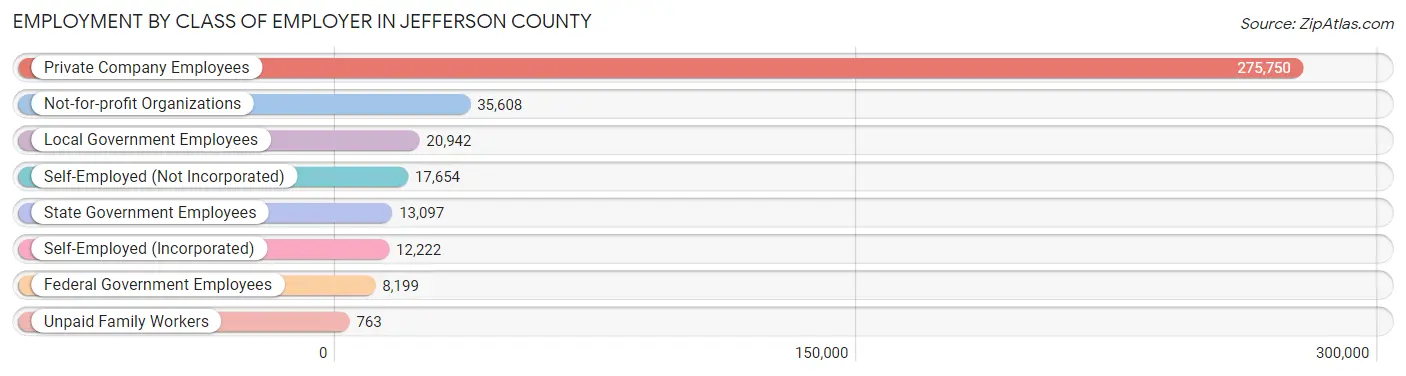
| Employer Class | # Employees | % Employees |
| Private Company Employees | 275,750 | 71.8% |
| Self-Employed (Incorporated) | 12,222 | 3.2% |
| Self-Employed (Not Incorporated) | 17,654 | 4.6% |
| Not-for-profit Organizations | 35,608 | 9.3% |
| Local Government Employees | 20,942 | 5.4% |
| State Government Employees | 13,097 | 3.4% |
| Federal Government Employees | 8,199 | 2.1% |
| Unpaid Family Workers | 763 | 0.2% |
| Total | 384,235 | 100.0% |
Employment Status by Age in Jefferson County
According to the labor force statistics for Jefferson County, out of the total population over 16 years of age (627,314), 65.9% or 413,400 individuals are in the labor force, with 5.1% or 21,083 of them unemployed. The age group with the highest labor force participation rate is 30 to 34 years, with 86.4% or 48,486 individuals in the labor force. Within the labor force, the 16 to 19 years age range has the highest percentage of unemployed individuals, with 11.3% or 2,037 of them being unemployed.
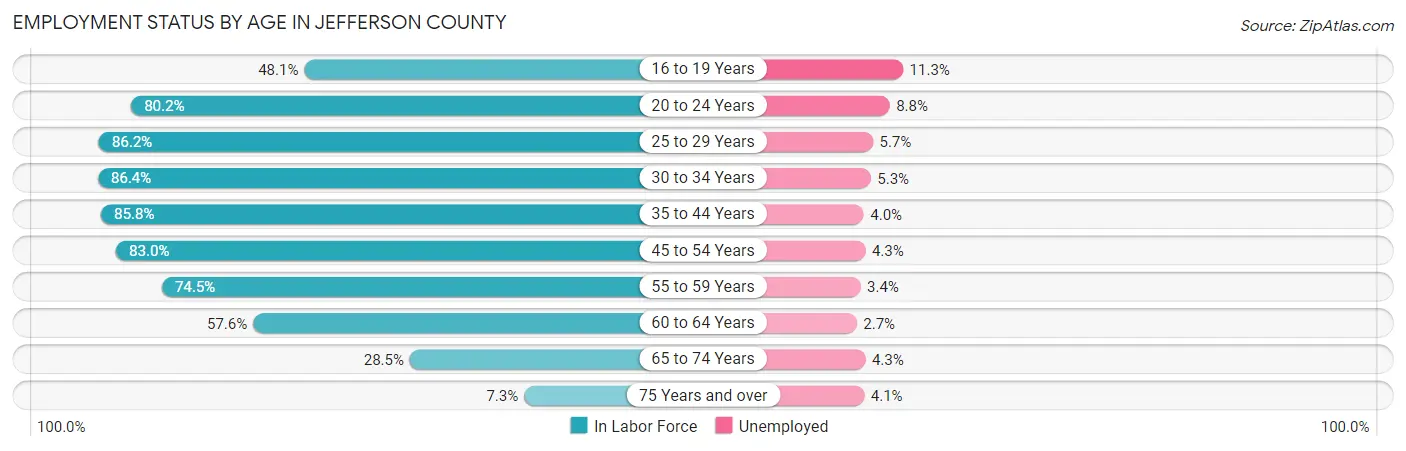
| Age Bracket | In Labor Force | Unemployed |
| 16 to 19 Years | 18,030 (48.1%) | 2,037 (11.3%) |
| 20 to 24 Years | 39,463 (80.2%) | 3,473 (8.8%) |
| 25 to 29 Years | 49,801 (86.2%) | 2,839 (5.7%) |
| 30 to 34 Years | 48,486 (86.4%) | 2,570 (5.3%) |
| 35 to 44 Years | 85,603 (85.8%) | 3,424 (4.0%) |
| 45 to 54 Years | 77,817 (83.0%) | 3,346 (4.3%) |
| 55 to 59 Years | 37,783 (74.5%) | 1,285 (3.4%) |
| 60 to 64 Years | 30,045 (57.6%) | 811 (2.7%) |
| 65 to 74 Years | 22,378 (28.5%) | 962 (4.3%) |
| 75 Years and over | 3,782 (7.3%) | 155 (4.1%) |
| Total | 413,400 (65.9%) | 21,083 (5.1%) |
Employment Status by Educational Attainment in Jefferson County
According to labor force statistics for Jefferson County, 80.3% of individuals (329,468) out of the total population between 25 and 64 years of age (410,296) are in the labor force, with 4.3% or 14,167 of them being unemployed. The group with the highest labor force participation rate are those with the educational attainment of bachelor's degree or higher, with 89.1% or 139,342 individuals in the labor force. Within the labor force, individuals with less than high school education have the highest percentage of unemployment, with 8.3% or 1,603 of them being unemployed.
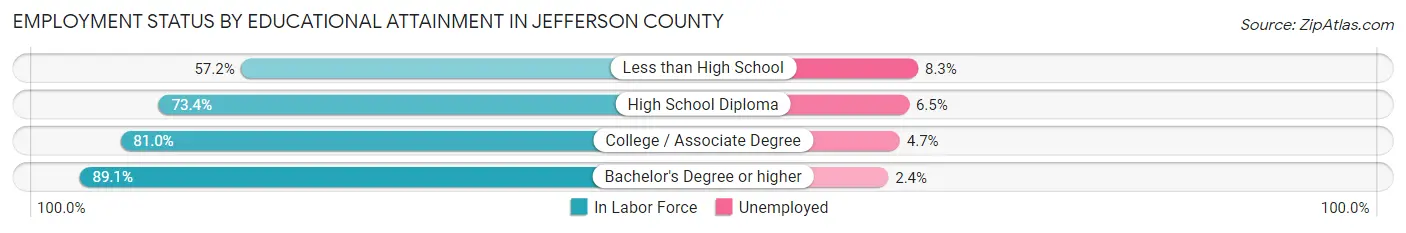
| Educational Attainment | In Labor Force | Unemployed |
| Less than High School | 19,311 (57.2%) | 2,802 (8.3%) |
| High School Diploma | 72,304 (73.4%) | 6,403 (6.5%) |
| College / Associate Degree | 98,528 (81.0%) | 5,717 (4.7%) |
| Bachelor's Degree or higher | 139,342 (89.1%) | 3,753 (2.4%) |
| Total | 329,468 (80.3%) | 17,643 (4.3%) |
Employment Occupations by Sex in Jefferson County
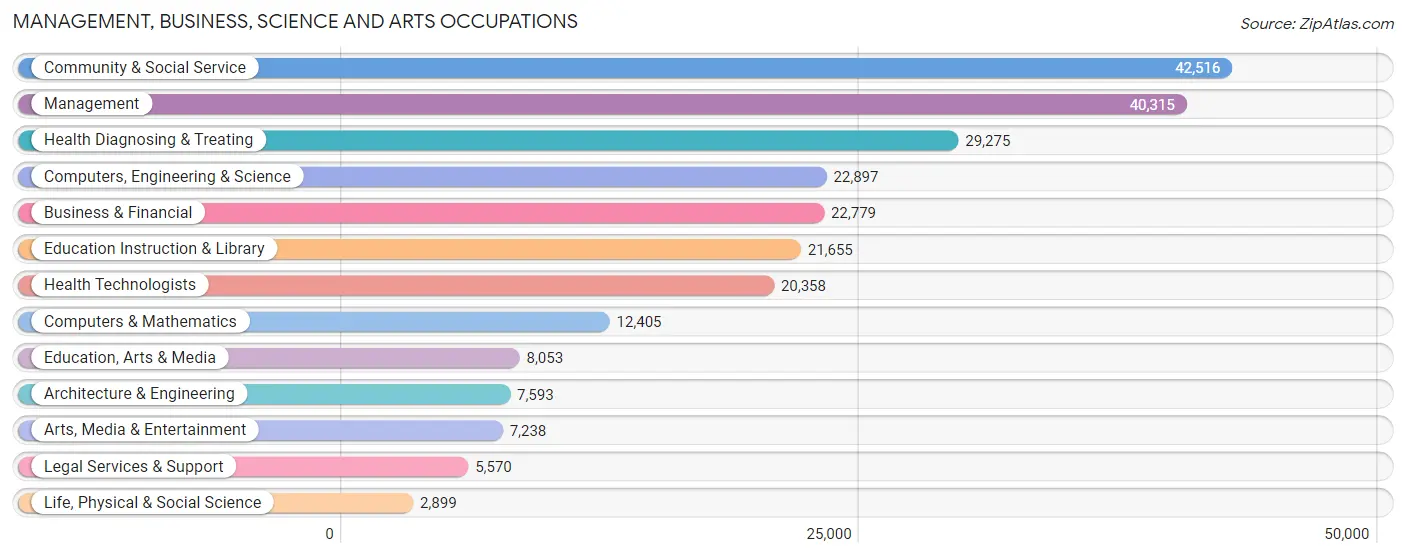
Management, Business, Science and Arts Occupations
The most common Management, Business, Science and Arts occupations in Jefferson County are Community & Social Service (42,516 | 10.9%), Management (40,315 | 10.3%), Health Diagnosing & Treating (29,275 | 7.5%), Computers, Engineering & Science (22,897 | 5.9%), and Business & Financial (22,779 | 5.8%).
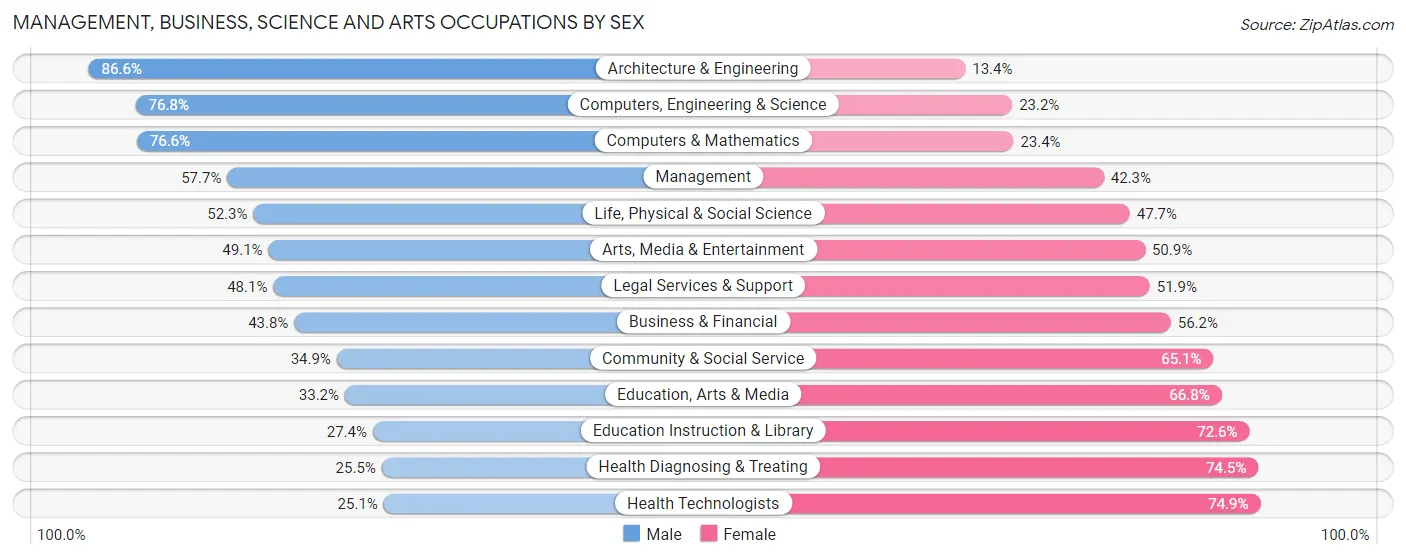
Management, Business, Science and Arts Occupations by Sex
Within the Management, Business, Science and Arts occupations in Jefferson County, the most male-oriented occupations are Architecture & Engineering (86.6%), Computers, Engineering & Science (76.8%), and Computers & Mathematics (76.6%), while the most female-oriented occupations are Health Technologists (74.9%), Health Diagnosing & Treating (74.5%), and Education Instruction & Library (72.6%).
| Occupation | Male | Female |
| Management | 23,272 (57.7%) | 17,043 (42.3%) |
| Business & Financial | 9,969 (43.8%) | 12,810 (56.2%) |
| Computers, Engineering & Science | 17,594 (76.8%) | 5,303 (23.2%) |
| Computers & Mathematics | 9,500 (76.6%) | 2,905 (23.4%) |
| Architecture & Engineering | 6,578 (86.6%) | 1,015 (13.4%) |
| Life, Physical & Social Science | 1,516 (52.3%) | 1,383 (47.7%) |
| Community & Social Service | 14,838 (34.9%) | 27,678 (65.1%) |
| Education, Arts & Media | 2,673 (33.2%) | 5,380 (66.8%) |
| Legal Services & Support | 2,681 (48.1%) | 2,889 (51.9%) |
| Education Instruction & Library | 5,927 (27.4%) | 15,728 (72.6%) |
| Arts, Media & Entertainment | 3,557 (49.1%) | 3,681 (50.9%) |
| Health Diagnosing & Treating | 7,472 (25.5%) | 21,803 (74.5%) |
| Health Technologists | 5,109 (25.1%) | 15,249 (74.9%) |
| Total (Category) | 73,145 (46.4%) | 84,637 (53.6%) |
| Total (Overall) | 201,418 (51.5%) | 189,944 (48.5%) |
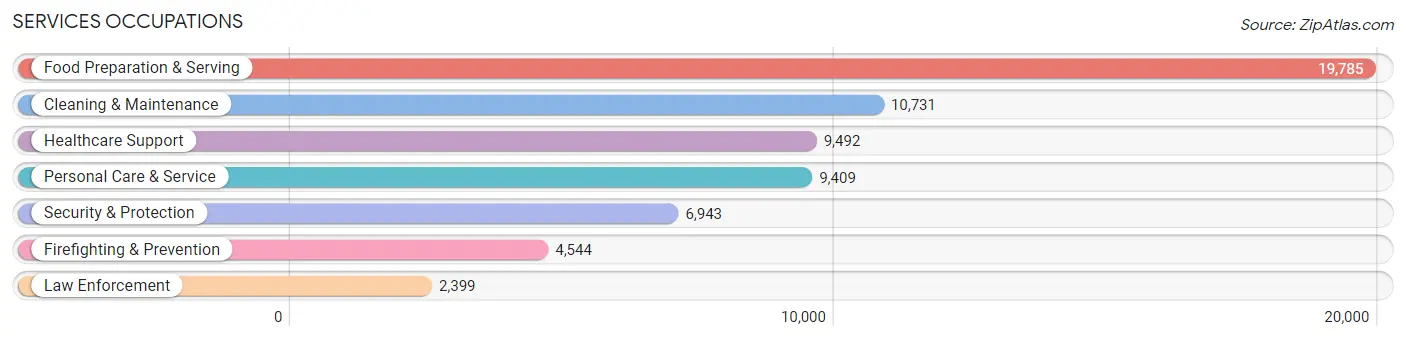
Services Occupations
The most common Services occupations in Jefferson County are Food Preparation & Serving (19,785 | 5.1%), Cleaning & Maintenance (10,731 | 2.7%), Healthcare Support (9,492 | 2.4%), Personal Care & Service (9,409 | 2.4%), and Security & Protection (6,943 | 1.8%).
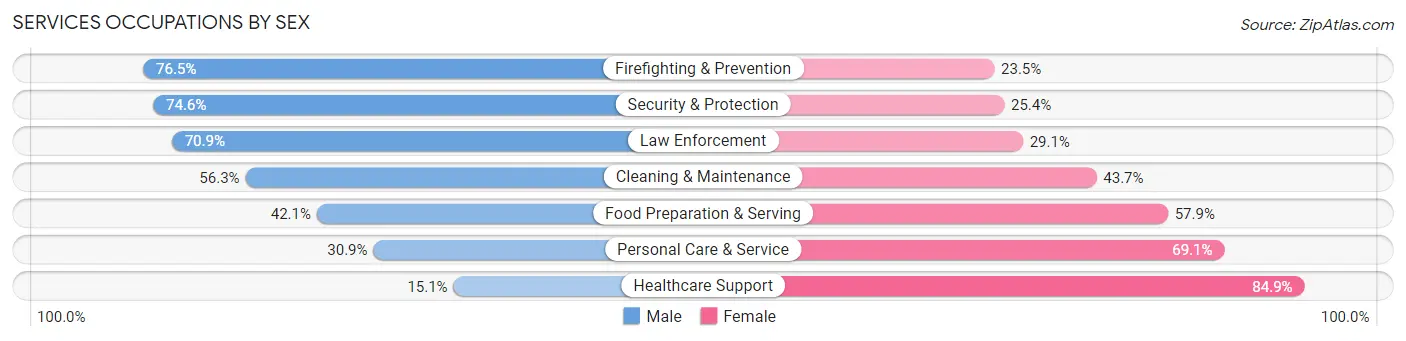
Services Occupations by Sex
Within the Services occupations in Jefferson County, the most male-oriented occupations are Firefighting & Prevention (76.5%), Security & Protection (74.6%), and Law Enforcement (70.9%), while the most female-oriented occupations are Healthcare Support (84.9%), Personal Care & Service (69.1%), and Food Preparation & Serving (57.9%).
| Occupation | Male | Female |
| Healthcare Support | 1,431 (15.1%) | 8,061 (84.9%) |
| Security & Protection | 5,177 (74.6%) | 1,766 (25.4%) |
| Firefighting & Prevention | 3,477 (76.5%) | 1,067 (23.5%) |
| Law Enforcement | 1,700 (70.9%) | 699 (29.1%) |
| Food Preparation & Serving | 8,337 (42.1%) | 11,448 (57.9%) |
| Cleaning & Maintenance | 6,039 (56.3%) | 4,692 (43.7%) |
| Personal Care & Service | 2,911 (30.9%) | 6,498 (69.1%) |
| Total (Category) | 23,895 (42.4%) | 32,465 (57.6%) |
| Total (Overall) | 201,418 (51.5%) | 189,944 (48.5%) |
Sales and Office Occupations
The most common Sales and Office occupations in Jefferson County are Office & Administration (44,403 | 11.4%), and Sales & Related (36,639 | 9.4%).

Sales and Office Occupations by Sex
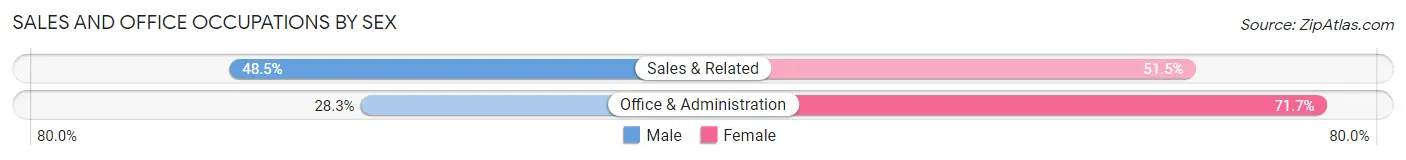
| Occupation | Male | Female |
| Sales & Related | 17,768 (48.5%) | 18,871 (51.5%) |
| Office & Administration | 12,580 (28.3%) | 31,823 (71.7%) |
| Total (Category) | 30,348 (37.4%) | 50,694 (62.5%) |
| Total (Overall) | 201,418 (51.5%) | 189,944 (48.5%) |
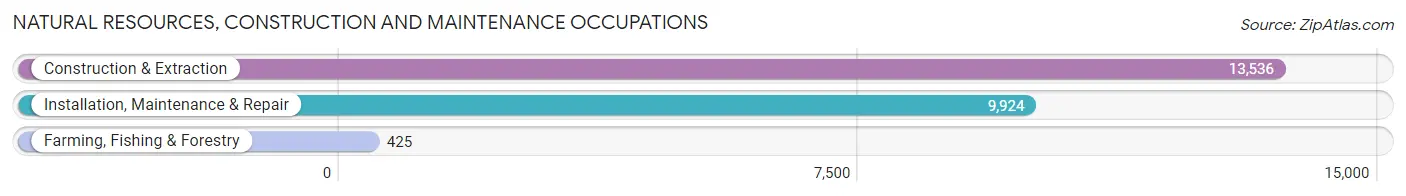
Natural Resources, Construction and Maintenance Occupations
The most common Natural Resources, Construction and Maintenance occupations in Jefferson County are Construction & Extraction (13,536 | 3.5%), Installation, Maintenance & Repair (9,924 | 2.5%), and Farming, Fishing & Forestry (425 | 0.1%).
Natural Resources, Construction and Maintenance Occupations by Sex
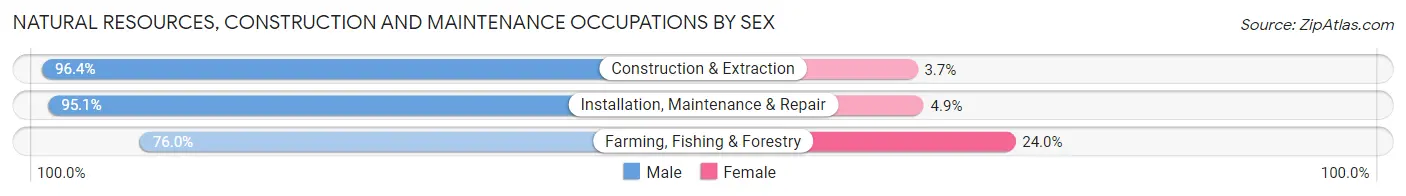
| Occupation | Male | Female |
| Farming, Fishing & Forestry | 323 (76.0%) | 102 (24.0%) |
| Construction & Extraction | 13,042 (96.4%) | 494 (3.6%) |
| Installation, Maintenance & Repair | 9,434 (95.1%) | 490 (4.9%) |
| Total (Category) | 22,799 (95.5%) | 1,086 (4.5%) |
| Total (Overall) | 201,418 (51.5%) | 189,944 (48.5%) |
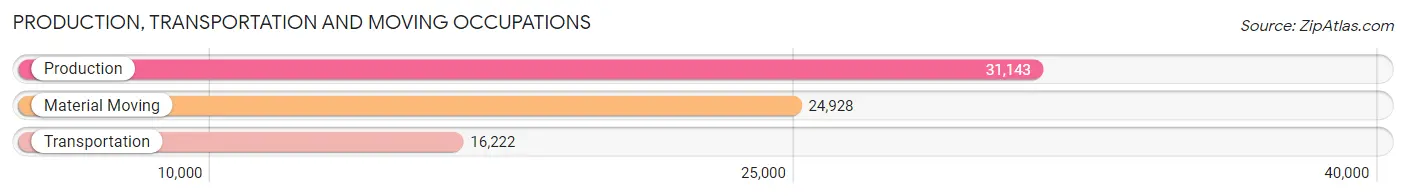
Production, Transportation and Moving Occupations
The most common Production, Transportation and Moving occupations in Jefferson County are Production (31,143 | 8.0%), Material Moving (24,928 | 6.4%), and Transportation (16,222 | 4.2%).
Production, Transportation and Moving Occupations by Sex
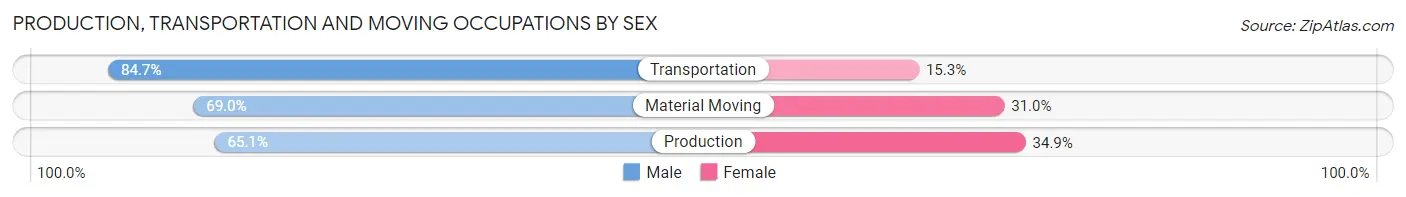
| Occupation | Male | Female |
| Production | 20,283 (65.1%) | 10,860 (34.9%) |
| Transportation | 13,738 (84.7%) | 2,484 (15.3%) |
| Material Moving | 17,210 (69.0%) | 7,718 (31.0%) |
| Total (Category) | 51,231 (70.9%) | 21,062 (29.1%) |
| Total (Overall) | 201,418 (51.5%) | 189,944 (48.5%) |
Employment Industries by Sex in Jefferson County
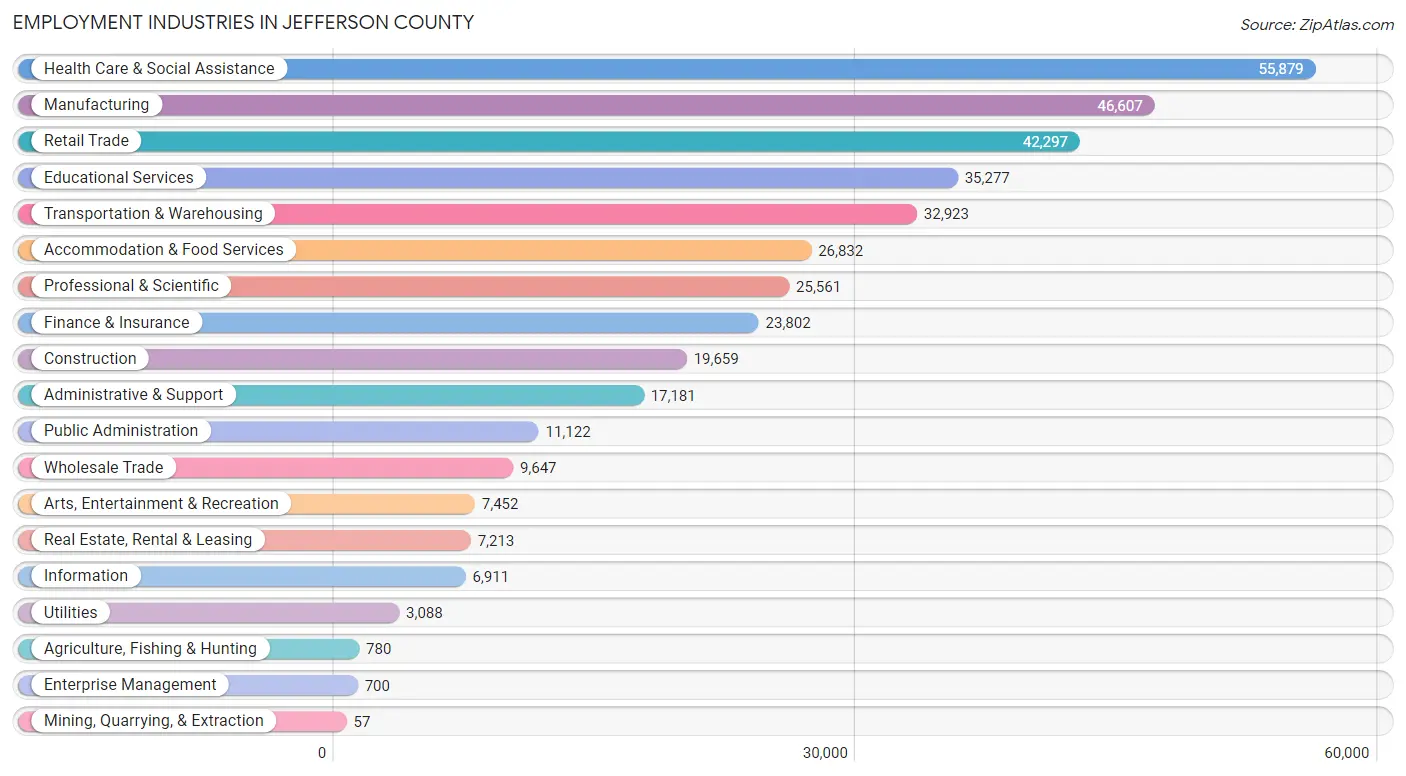
Employment Industries in Jefferson County
The major employment industries in Jefferson County include Health Care & Social Assistance (55,879 | 14.3%), Manufacturing (46,607 | 11.9%), Retail Trade (42,297 | 10.8%), Educational Services (35,277 | 9.0%), and Transportation & Warehousing (32,923 | 8.4%).
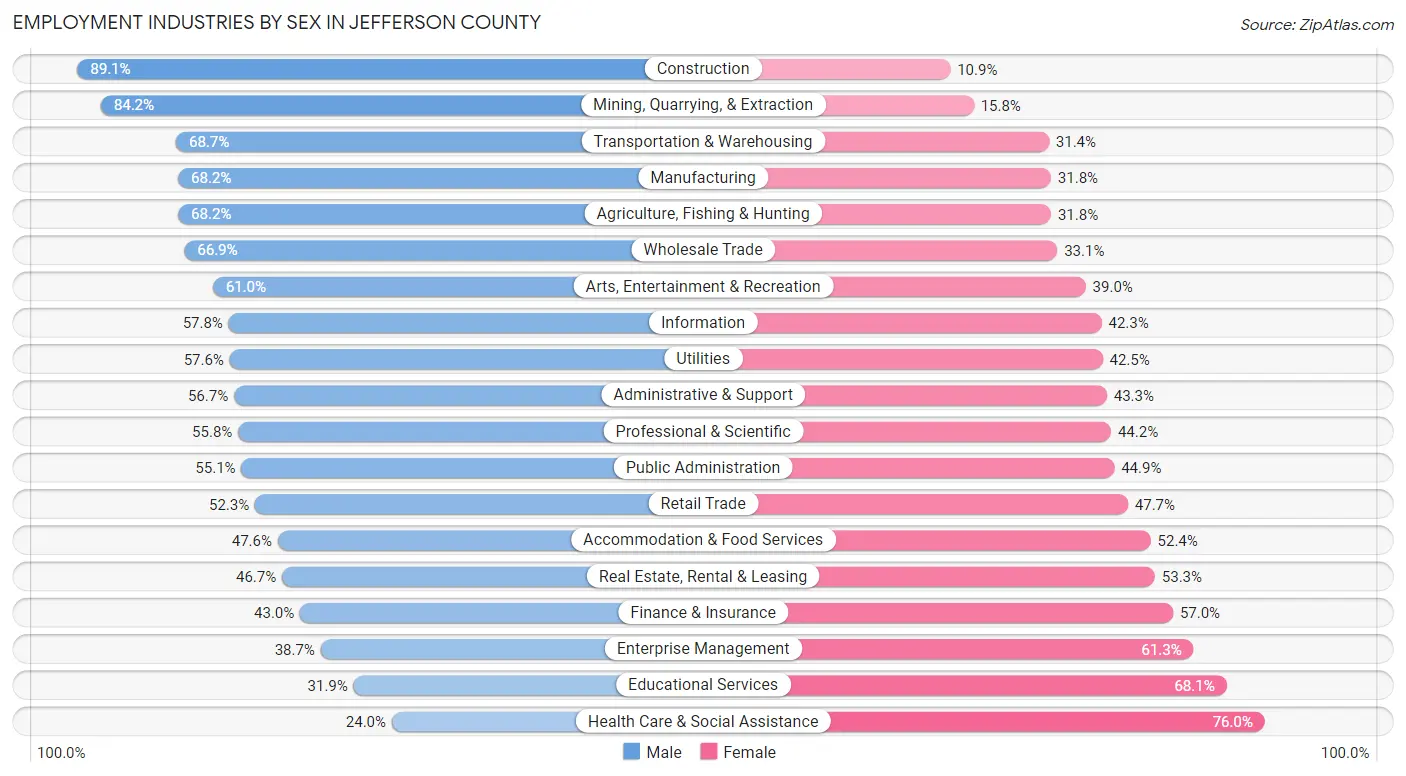
Employment Industries by Sex in Jefferson County
The Jefferson County industries that see more men than women are Construction (89.1%), Mining, Quarrying, & Extraction (84.2%), and Transportation & Warehousing (68.6%), whereas the industries that tend to have a higher number of women are Health Care & Social Assistance (76.0%), Educational Services (68.1%), and Enterprise Management (61.3%).
| Industry | Male | Female |
| Agriculture, Fishing & Hunting | 532 (68.2%) | 248 (31.8%) |
| Mining, Quarrying, & Extraction | 48 (84.2%) | 9 (15.8%) |
| Construction | 17,510 (89.1%) | 2,149 (10.9%) |
| Manufacturing | 31,802 (68.2%) | 14,805 (31.8%) |
| Wholesale Trade | 6,456 (66.9%) | 3,191 (33.1%) |
| Retail Trade | 22,123 (52.3%) | 20,174 (47.7%) |
| Transportation & Warehousing | 22,602 (68.6%) | 10,321 (31.4%) |
| Utilities | 1,777 (57.6%) | 1,311 (42.4%) |
| Information | 3,991 (57.8%) | 2,920 (42.2%) |
| Finance & Insurance | 10,227 (43.0%) | 13,575 (57.0%) |
| Real Estate, Rental & Leasing | 3,369 (46.7%) | 3,844 (53.3%) |
| Professional & Scientific | 14,263 (55.8%) | 11,298 (44.2%) |
| Enterprise Management | 271 (38.7%) | 429 (61.3%) |
| Administrative & Support | 9,735 (56.7%) | 7,446 (43.3%) |
| Educational Services | 11,253 (31.9%) | 24,024 (68.1%) |
| Health Care & Social Assistance | 13,398 (24.0%) | 42,481 (76.0%) |
| Arts, Entertainment & Recreation | 4,549 (61.0%) | 2,903 (39.0%) |
| Accommodation & Food Services | 12,770 (47.6%) | 14,062 (52.4%) |
| Public Administration | 6,130 (55.1%) | 4,992 (44.9%) |
| Total | 201,418 (51.5%) | 189,944 (48.5%) |
Education in Jefferson County
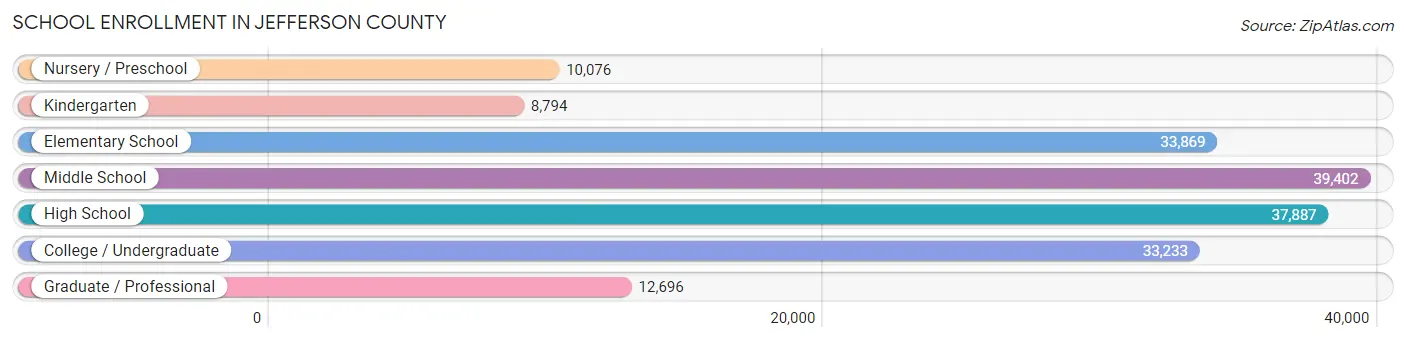
School Enrollment in Jefferson County
The most common levels of schooling among the 175,957 students in Jefferson County are middle school (39,402 | 22.4%), high school (37,887 | 21.5%), and elementary school (33,869 | 19.3%).
| School Level | # Students | % Students |
| Nursery / Preschool | 10,076 | 5.7% |
| Kindergarten | 8,794 | 5.0% |
| Elementary School | 33,869 | 19.3% |
| Middle School | 39,402 | 22.4% |
| High School | 37,887 | 21.5% |
| College / Undergraduate | 33,233 | 18.9% |
| Graduate / Professional | 12,696 | 7.2% |
| Total | 175,957 | 100.0% |
School Enrollment by Age by Funding Source in Jefferson County
Out of a total of 175,957 students who are enrolled in schools in Jefferson County, 44,517 (25.3%) attend a private institution, while the remaining 131,440 (74.7%) are enrolled in public schools. The age group of 3 to 4 year olds has the highest likelihood of being enrolled in private schools, with 4,036 (55.7% in the age bracket) enrolled. Conversely, the age group of 10 to 14 year olds has the lowest likelihood of being enrolled in a private school, with 38,058 (80.0% in the age bracket) attending a public institution.
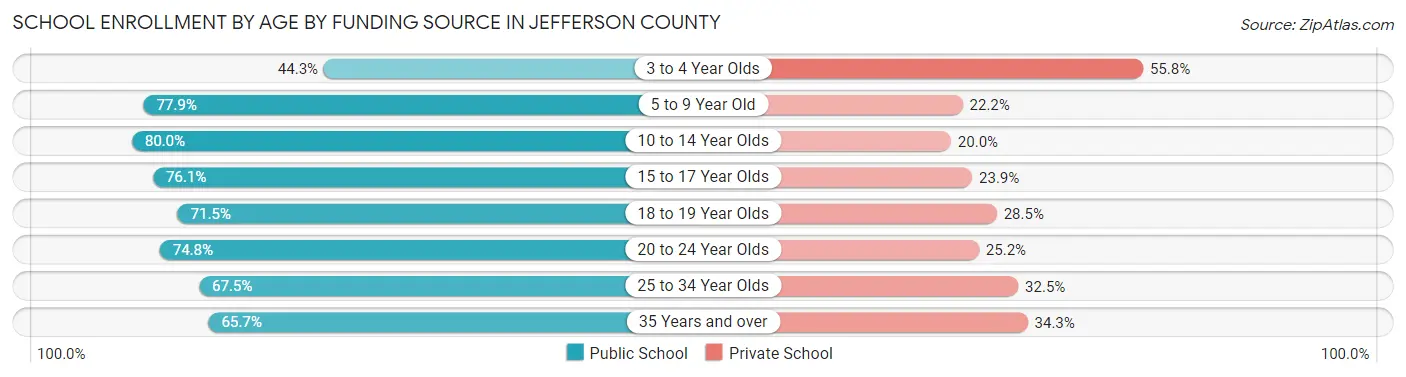
| Age Bracket | Public School | Private School |
| 3 to 4 Year Olds | 3,203 (44.3%) | 4,036 (55.7%) |
| 5 to 9 Year Old | 32,502 (77.8%) | 9,249 (22.2%) |
| 10 to 14 Year Olds | 38,058 (80.0%) | 9,497 (20.0%) |
| 15 to 17 Year Olds | 20,941 (76.1%) | 6,584 (23.9%) |
| 18 to 19 Year Olds | 8,286 (71.5%) | 3,305 (28.5%) |
| 20 to 24 Year Olds | 13,791 (74.8%) | 4,643 (25.2%) |
| 25 to 34 Year Olds | 8,552 (67.5%) | 4,118 (32.5%) |
| 35 Years and over | 6,043 (65.7%) | 3,149 (34.3%) |
| Total | 131,440 (74.7%) | 44,517 (25.3%) |
Educational Attainment by Field of Study in Jefferson County
Business (41,920 | 19.9%), science & technology (22,422 | 10.6%), education (20,349 | 9.6%), social sciences (15,514 | 7.3%), and arts & humanities (13,529 | 6.4%) are the most common fields of study among 211,159 individuals in Jefferson County who have obtained a bachelor's degree or higher.
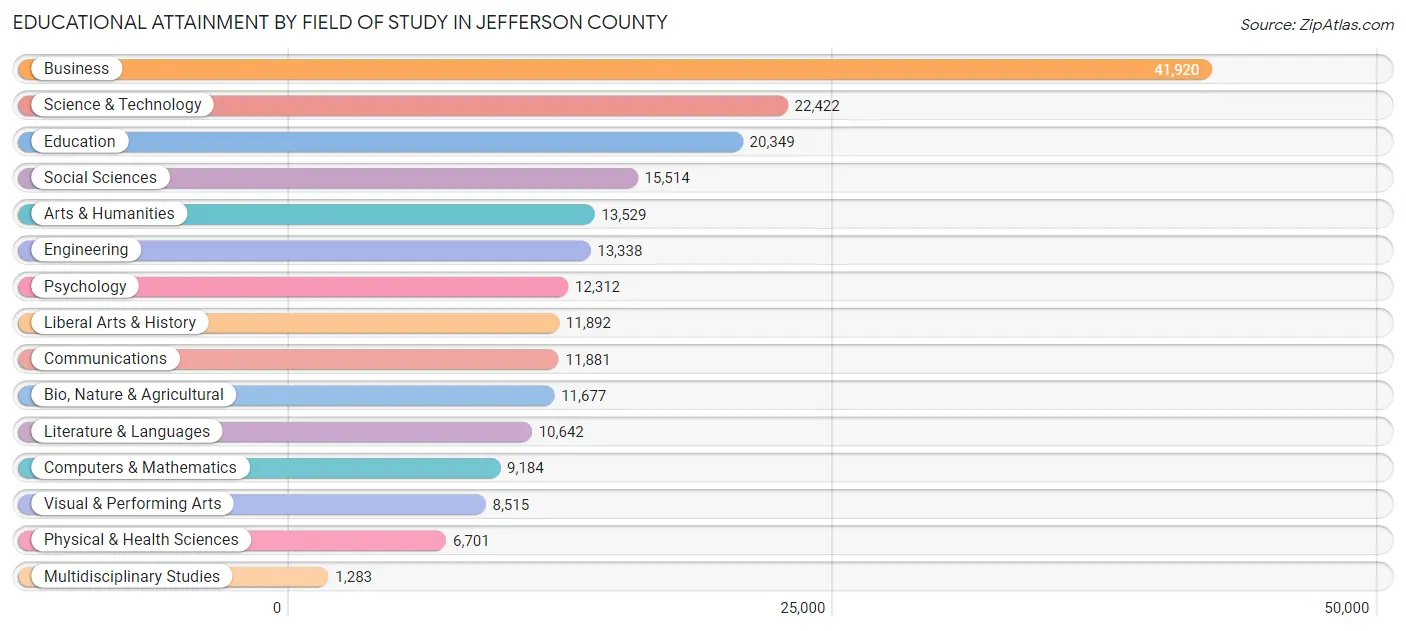
| Field of Study | # Graduates | % Graduates |
| Computers & Mathematics | 9,184 | 4.3% |
| Bio, Nature & Agricultural | 11,677 | 5.5% |
| Physical & Health Sciences | 6,701 | 3.2% |
| Psychology | 12,312 | 5.8% |
| Social Sciences | 15,514 | 7.3% |
| Engineering | 13,338 | 6.3% |
| Multidisciplinary Studies | 1,283 | 0.6% |
| Science & Technology | 22,422 | 10.6% |
| Business | 41,920 | 19.9% |
| Education | 20,349 | 9.6% |
| Literature & Languages | 10,642 | 5.0% |
| Liberal Arts & History | 11,892 | 5.6% |
| Visual & Performing Arts | 8,515 | 4.0% |
| Communications | 11,881 | 5.6% |
| Arts & Humanities | 13,529 | 6.4% |
| Total | 211,159 | 100.0% |
Transportation & Commute in Jefferson County
Vehicle Availability by Sex in Jefferson County
The most prevalent vehicle ownership categories in Jefferson County are males with 2 vehicles (90,330, accounting for 45.8%) and females with 2 vehicles (77,848, making up 49.2%).
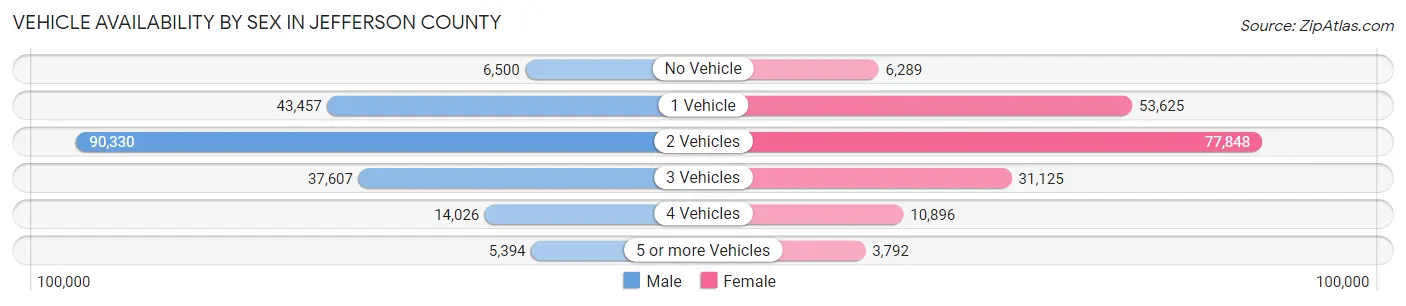
| Vehicles Available | Male | Female |
| No Vehicle | 6,500 (3.3%) | 6,289 (3.4%) |
| 1 Vehicle | 43,457 (22.0%) | 53,625 (29.2%) |
| 2 Vehicles | 90,330 (45.8%) | 77,848 (42.4%) |
| 3 Vehicles | 37,607 (19.1%) | 31,125 (17.0%) |
| 4 Vehicles | 14,026 (7.1%) | 10,896 (5.9%) |
| 5 or more Vehicles | 5,394 (2.7%) | 3,792 (2.1%) |
| Total | 197,314 (100.0%) | 183,575 (100.0%) |
Commute Time in Jefferson County
The most frequently occuring commute durations in Jefferson County are 20 to 24 minutes (76,811 commuters, 22.4%), 15 to 19 minutes (65,827 commuters, 19.2%), and 10 to 14 minutes (46,148 commuters, 13.5%).
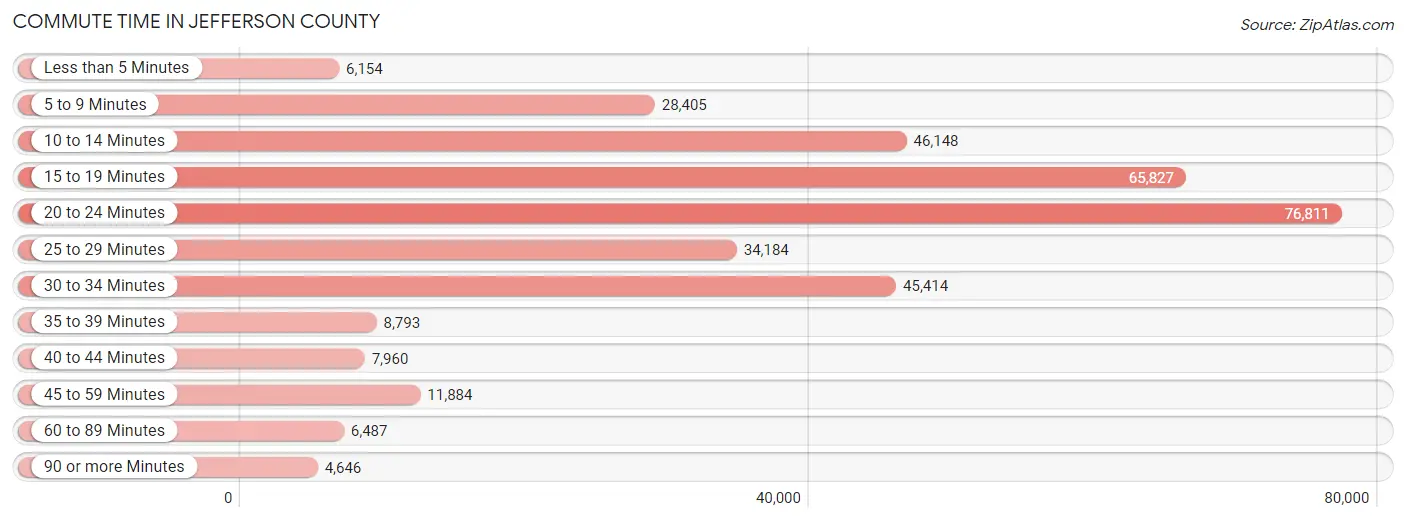
| Commute Time | # Commuters | % Commuters |
| Less than 5 Minutes | 6,154 | 1.8% |
| 5 to 9 Minutes | 28,405 | 8.3% |
| 10 to 14 Minutes | 46,148 | 13.5% |
| 15 to 19 Minutes | 65,827 | 19.2% |
| 20 to 24 Minutes | 76,811 | 22.4% |
| 25 to 29 Minutes | 34,184 | 10.0% |
| 30 to 34 Minutes | 45,414 | 13.3% |
| 35 to 39 Minutes | 8,793 | 2.6% |
| 40 to 44 Minutes | 7,960 | 2.3% |
| 45 to 59 Minutes | 11,884 | 3.5% |
| 60 to 89 Minutes | 6,487 | 1.9% |
| 90 or more Minutes | 4,646 | 1.4% |
Commute Time by Sex in Jefferson County
The most common commute times in Jefferson County are 20 to 24 minutes (41,415 commuters, 23.1%) for males and 20 to 24 minutes (35,396 commuters, 21.7%) for females.
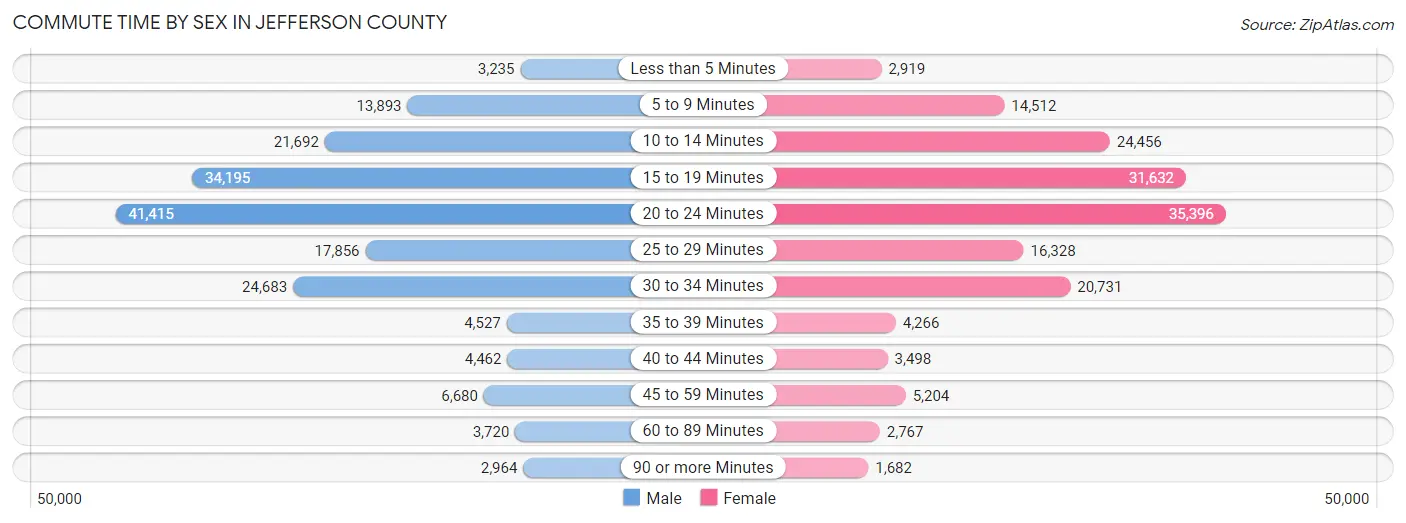
| Commute Time | Male | Female |
| Less than 5 Minutes | 3,235 (1.8%) | 2,919 (1.8%) |
| 5 to 9 Minutes | 13,893 (7.7%) | 14,512 (8.9%) |
| 10 to 14 Minutes | 21,692 (12.1%) | 24,456 (15.0%) |
| 15 to 19 Minutes | 34,195 (19.1%) | 31,632 (19.4%) |
| 20 to 24 Minutes | 41,415 (23.1%) | 35,396 (21.7%) |
| 25 to 29 Minutes | 17,856 (10.0%) | 16,328 (10.0%) |
| 30 to 34 Minutes | 24,683 (13.8%) | 20,731 (12.7%) |
| 35 to 39 Minutes | 4,527 (2.5%) | 4,266 (2.6%) |
| 40 to 44 Minutes | 4,462 (2.5%) | 3,498 (2.1%) |
| 45 to 59 Minutes | 6,680 (3.7%) | 5,204 (3.2%) |
| 60 to 89 Minutes | 3,720 (2.1%) | 2,767 (1.7%) |
| 90 or more Minutes | 2,964 (1.7%) | 1,682 (1.0%) |
Time of Departure to Work by Sex in Jefferson County
The most frequent times of departure to work in Jefferson County are 7:00 AM to 7:29 AM (28,284, 15.8%) for males and 7:00 AM to 7:29 AM (27,607, 16.9%) for females.
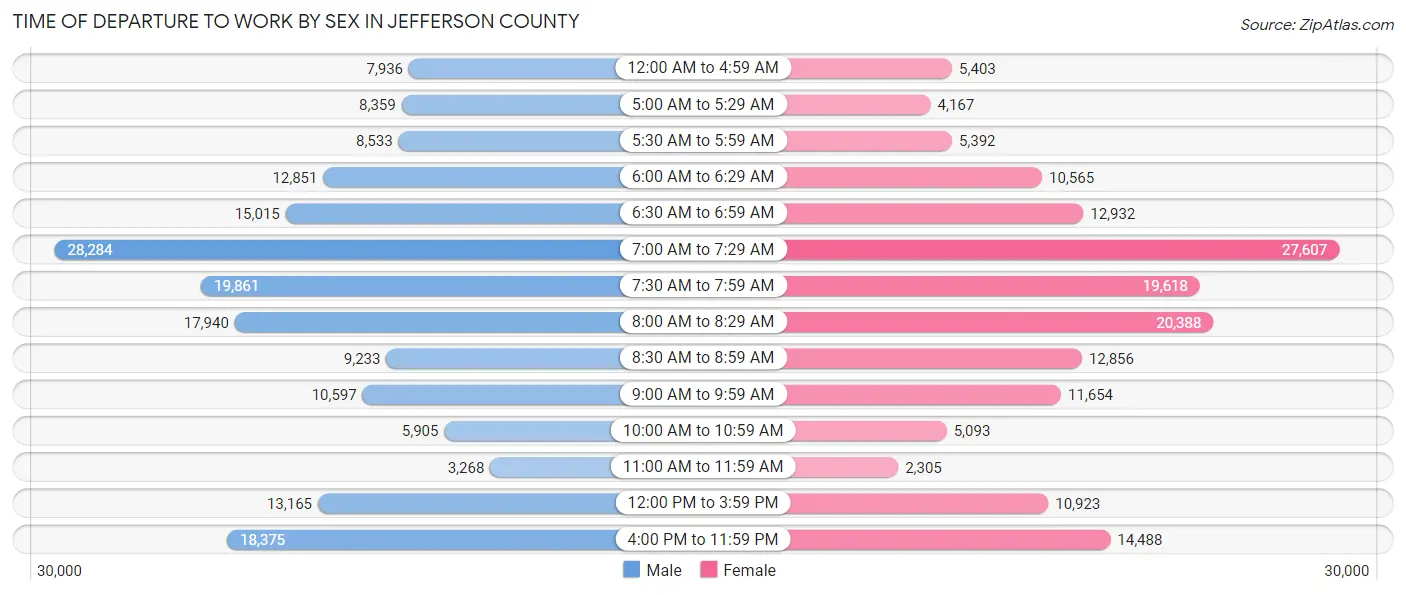
| Time of Departure | Male | Female |
| 12:00 AM to 4:59 AM | 7,936 (4.4%) | 5,403 (3.3%) |
| 5:00 AM to 5:29 AM | 8,359 (4.7%) | 4,167 (2.5%) |
| 5:30 AM to 5:59 AM | 8,533 (4.8%) | 5,392 (3.3%) |
| 6:00 AM to 6:29 AM | 12,851 (7.2%) | 10,565 (6.5%) |
| 6:30 AM to 6:59 AM | 15,015 (8.4%) | 12,932 (7.9%) |
| 7:00 AM to 7:29 AM | 28,284 (15.8%) | 27,607 (16.9%) |
| 7:30 AM to 7:59 AM | 19,861 (11.1%) | 19,618 (12.0%) |
| 8:00 AM to 8:29 AM | 17,940 (10.0%) | 20,388 (12.5%) |
| 8:30 AM to 8:59 AM | 9,233 (5.1%) | 12,856 (7.9%) |
| 9:00 AM to 9:59 AM | 10,597 (5.9%) | 11,654 (7.1%) |
| 10:00 AM to 10:59 AM | 5,905 (3.3%) | 5,093 (3.1%) |
| 11:00 AM to 11:59 AM | 3,268 (1.8%) | 2,305 (1.4%) |
| 12:00 PM to 3:59 PM | 13,165 (7.3%) | 10,923 (6.7%) |
| 4:00 PM to 11:59 PM | 18,375 (10.2%) | 14,488 (8.9%) |
| Total | 179,322 (100.0%) | 163,391 (100.0%) |
Housing Occupancy in Jefferson County
Occupancy by Ownership in Jefferson County
Of the total 327,211 dwellings in Jefferson County, owner-occupied units account for 202,118 (61.8%), while renter-occupied units make up 125,093 (38.2%).
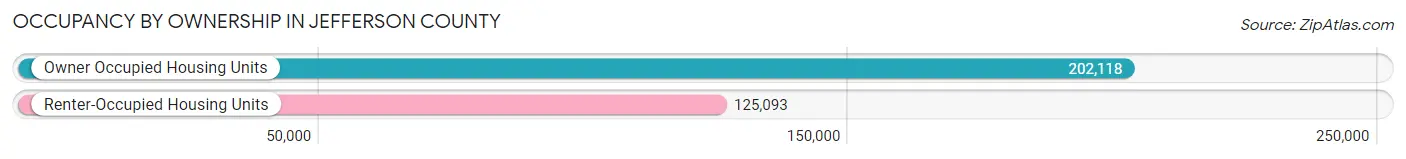
| Occupancy | # Housing Units | % Housing Units |
| Owner Occupied Housing Units | 202,118 | 61.8% |
| Renter-Occupied Housing Units | 125,093 | 38.2% |
| Total Occupied Housing Units | 327,211 | 100.0% |
Occupancy by Household Size in Jefferson County
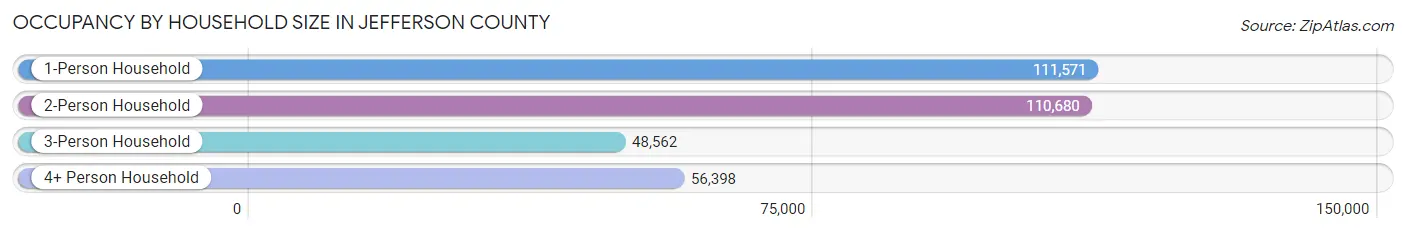
| Household Size | # Housing Units | % Housing Units |
| 1-Person Household | 111,571 | 34.1% |
| 2-Person Household | 110,680 | 33.8% |
| 3-Person Household | 48,562 | 14.8% |
| 4+ Person Household | 56,398 | 17.2% |
| Total Housing Units | 327,211 | 100.0% |
Occupancy by Ownership by Household Size in Jefferson County
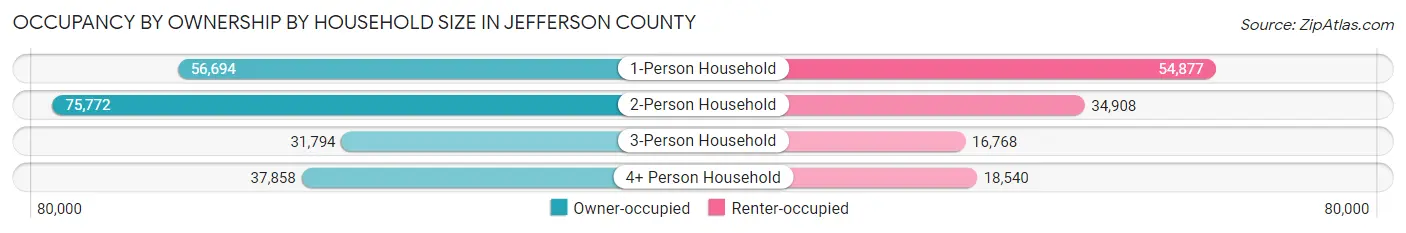
| Household Size | Owner-occupied | Renter-occupied |
| 1-Person Household | 56,694 (50.8%) | 54,877 (49.2%) |
| 2-Person Household | 75,772 (68.5%) | 34,908 (31.5%) |
| 3-Person Household | 31,794 (65.5%) | 16,768 (34.5%) |
| 4+ Person Household | 37,858 (67.1%) | 18,540 (32.9%) |
| Total Housing Units | 202,118 (61.8%) | 125,093 (38.2%) |
Occupancy by Educational Attainment in Jefferson County
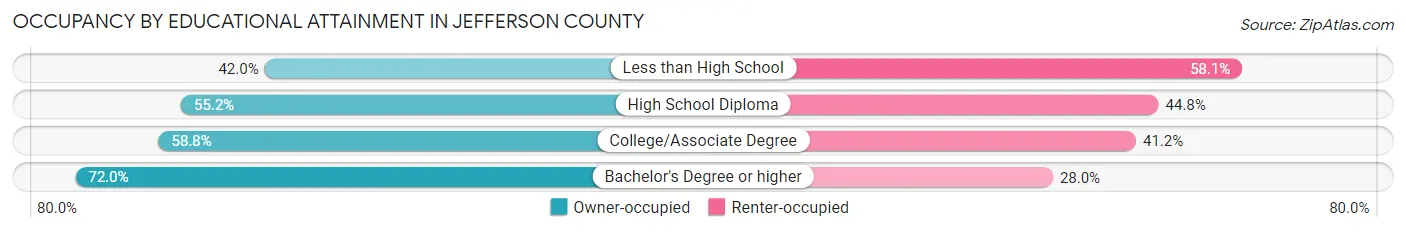
| Household Size | Owner-occupied | Renter-occupied |
| Less than High School | 10,086 (41.9%) | 13,955 (58.1%) |
| High School Diploma | 42,279 (55.2%) | 34,318 (44.8%) |
| College/Associate Degree | 59,273 (58.8%) | 41,558 (41.2%) |
| Bachelor's Degree or higher | 90,480 (72.0%) | 35,262 (28.0%) |
Occupancy by Age of Householder in Jefferson County
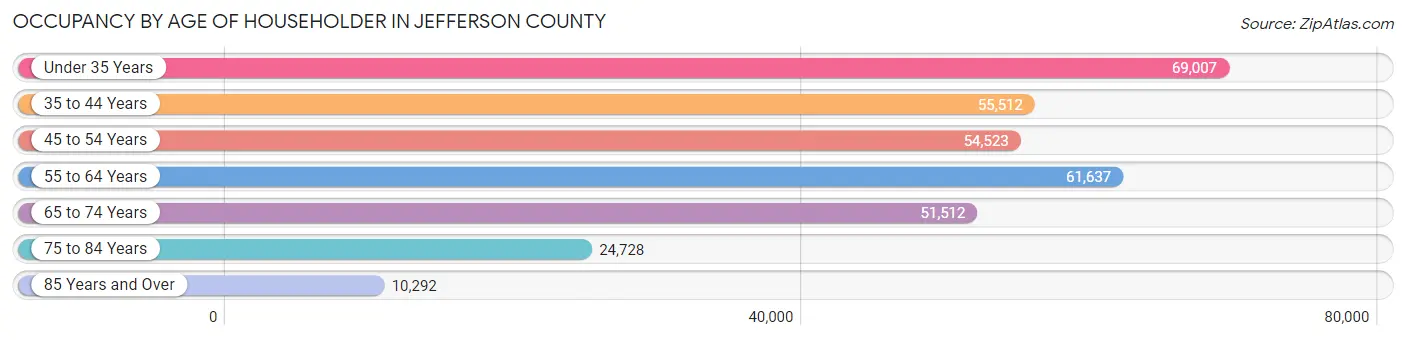
| Age Bracket | # Households | % Households |
| Under 35 Years | 69,007 | 21.1% |
| 35 to 44 Years | 55,512 | 17.0% |
| 45 to 54 Years | 54,523 | 16.7% |
| 55 to 64 Years | 61,637 | 18.8% |
| 65 to 74 Years | 51,512 | 15.7% |
| 75 to 84 Years | 24,728 | 7.6% |
| 85 Years and Over | 10,292 | 3.2% |
| Total | 327,211 | 100.0% |
Housing Finances in Jefferson County
Median Income by Occupancy in Jefferson County
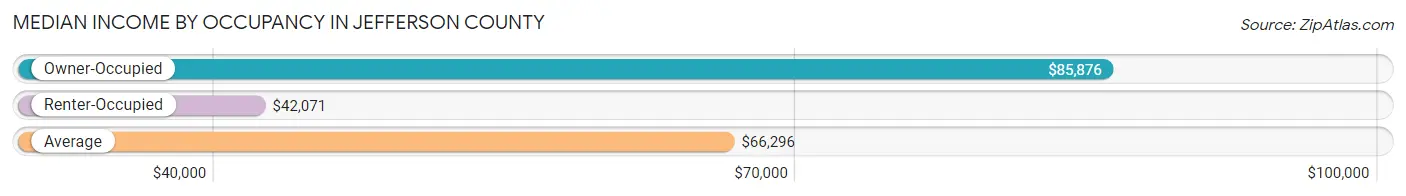
| Occupancy Type | # Households | Median Income |
| Owner-Occupied | 202,118 (61.8%) | $85,876 |
| Renter-Occupied | 125,093 (38.2%) | $42,071 |
| Average | 327,211 (100.0%) | $66,296 |
Occupancy by Householder Income Bracket in Jefferson County
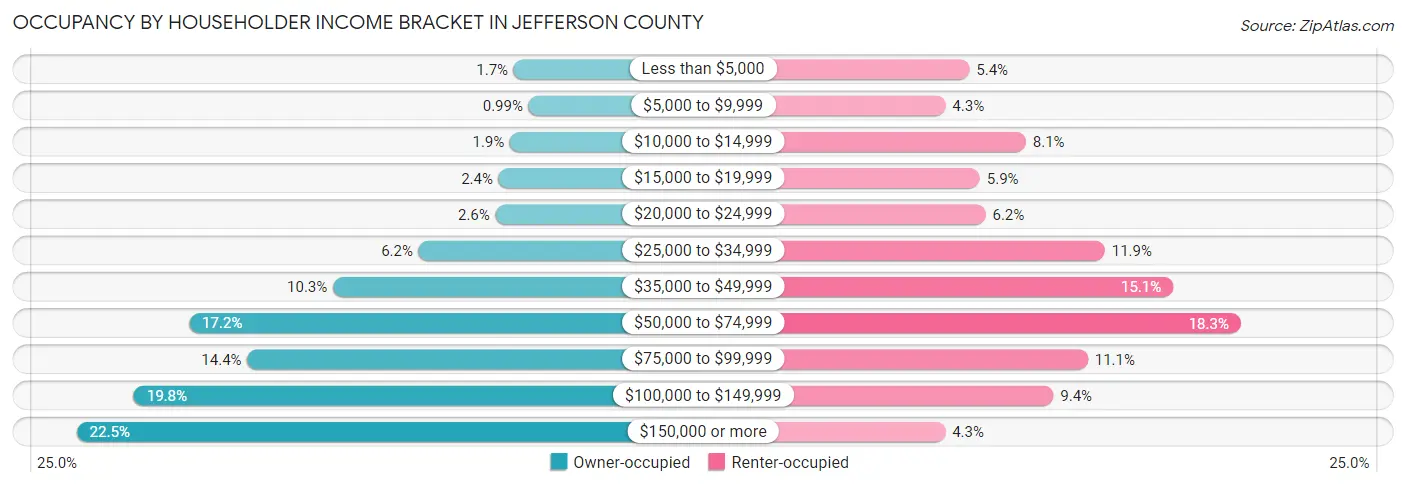
| Income Bracket | Owner-occupied | Renter-occupied |
| Less than $5,000 | 3,444 (1.7%) | 6,779 (5.4%) |
| $5,000 to $9,999 | 2,003 (1.0%) | 5,348 (4.3%) |
| $10,000 to $14,999 | 3,806 (1.9%) | 10,148 (8.1%) |
| $15,000 to $19,999 | 4,893 (2.4%) | 7,407 (5.9%) |
| $20,000 to $24,999 | 5,195 (2.6%) | 7,739 (6.2%) |
| $25,000 to $34,999 | 12,599 (6.2%) | 14,853 (11.9%) |
| $35,000 to $49,999 | 20,845 (10.3%) | 18,917 (15.1%) |
| $50,000 to $74,999 | 34,703 (17.2%) | 22,938 (18.3%) |
| $75,000 to $99,999 | 29,090 (14.4%) | 13,840 (11.1%) |
| $100,000 to $149,999 | 40,015 (19.8%) | 11,779 (9.4%) |
| $150,000 or more | 45,525 (22.5%) | 5,345 (4.3%) |
| Total | 202,118 (100.0%) | 125,093 (100.0%) |
Monthly Housing Cost Tiers in Jefferson County
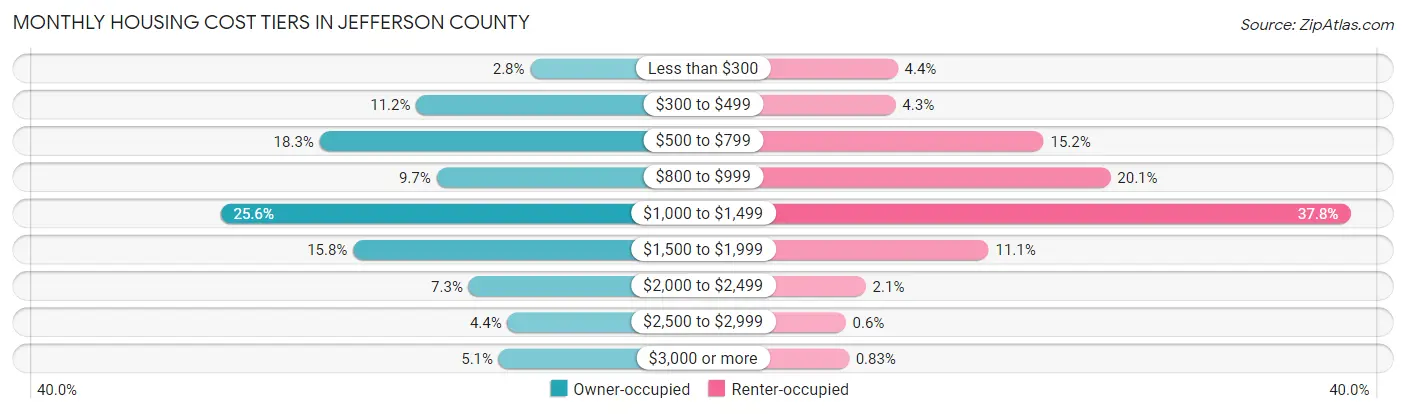
| Monthly Cost | Owner-occupied | Renter-occupied |
| Less than $300 | 5,568 (2.8%) | 5,543 (4.4%) |
| $300 to $499 | 22,541 (11.2%) | 5,338 (4.3%) |
| $500 to $799 | 36,927 (18.3%) | 18,992 (15.2%) |
| $800 to $999 | 19,532 (9.7%) | 25,145 (20.1%) |
| $1,000 to $1,499 | 51,676 (25.6%) | 47,240 (37.8%) |
| $1,500 to $1,999 | 31,926 (15.8%) | 13,926 (11.1%) |
| $2,000 to $2,499 | 14,732 (7.3%) | 2,600 (2.1%) |
| $2,500 to $2,999 | 8,959 (4.4%) | 748 (0.6%) |
| $3,000 or more | 10,257 (5.1%) | 1,034 (0.8%) |
| Total | 202,118 (100.0%) | 125,093 (100.0%) |
Physical Housing Characteristics in Jefferson County
Housing Structures in Jefferson County
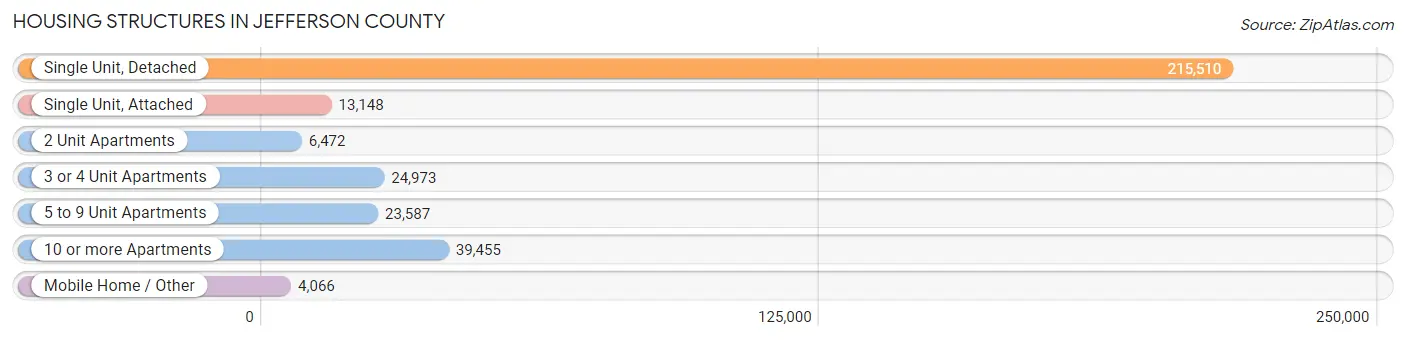
| Structure Type | # Housing Units | % Housing Units |
| Single Unit, Detached | 215,510 | 65.9% |
| Single Unit, Attached | 13,148 | 4.0% |
| 2 Unit Apartments | 6,472 | 2.0% |
| 3 or 4 Unit Apartments | 24,973 | 7.6% |
| 5 to 9 Unit Apartments | 23,587 | 7.2% |
| 10 or more Apartments | 39,455 | 12.1% |
| Mobile Home / Other | 4,066 | 1.2% |
| Total | 327,211 | 100.0% |
Housing Structures by Occupancy in Jefferson County
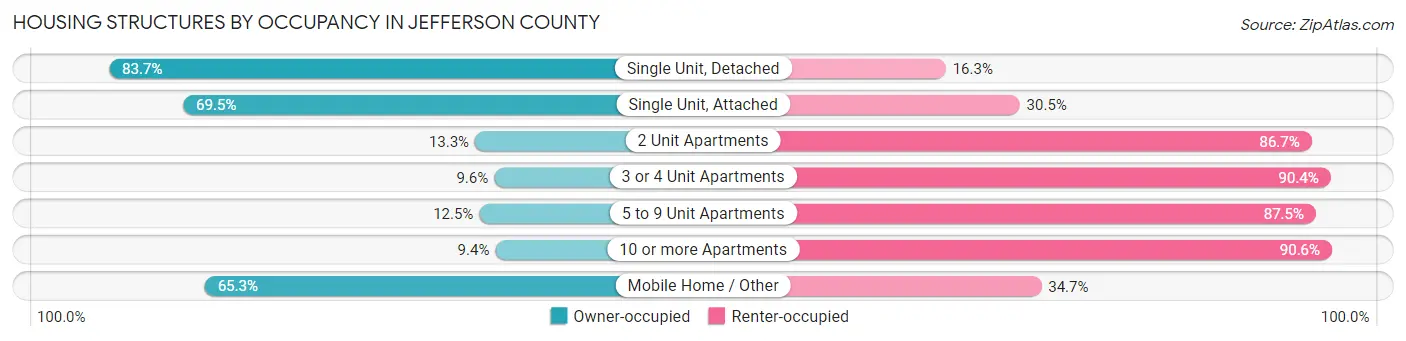
| Structure Type | Owner-occupied | Renter-occupied |
| Single Unit, Detached | 180,424 (83.7%) | 35,086 (16.3%) |
| Single Unit, Attached | 9,137 (69.5%) | 4,011 (30.5%) |
| 2 Unit Apartments | 860 (13.3%) | 5,612 (86.7%) |
| 3 or 4 Unit Apartments | 2,400 (9.6%) | 22,573 (90.4%) |
| 5 to 9 Unit Apartments | 2,941 (12.5%) | 20,646 (87.5%) |
| 10 or more Apartments | 3,700 (9.4%) | 35,755 (90.6%) |
| Mobile Home / Other | 2,656 (65.3%) | 1,410 (34.7%) |
| Total | 202,118 (61.8%) | 125,093 (38.2%) |
Housing Structures by Number of Rooms in Jefferson County
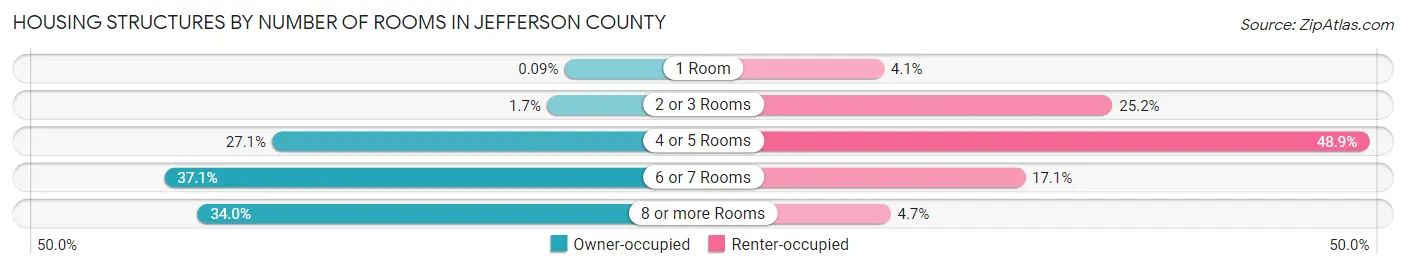
| Number of Rooms | Owner-occupied | Renter-occupied |
| 1 Room | 177 (0.1%) | 5,085 (4.1%) |
| 2 or 3 Rooms | 3,453 (1.7%) | 31,528 (25.2%) |
| 4 or 5 Rooms | 54,837 (27.1%) | 61,211 (48.9%) |
| 6 or 7 Rooms | 74,920 (37.1%) | 21,410 (17.1%) |
| 8 or more Rooms | 68,731 (34.0%) | 5,859 (4.7%) |
| Total | 202,118 (100.0%) | 125,093 (100.0%) |
Housing Structure by Heating Type in Jefferson County
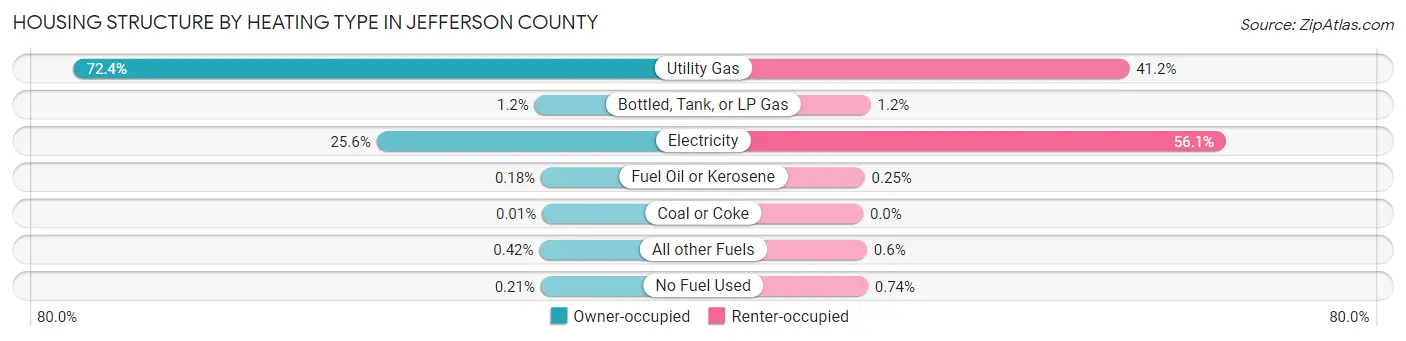
| Heating Type | Owner-occupied | Renter-occupied |
| Utility Gas | 146,369 (72.4%) | 51,473 (41.1%) |
| Bottled, Tank, or LP Gas | 2,349 (1.2%) | 1,461 (1.2%) |
| Electricity | 51,741 (25.6%) | 70,167 (56.1%) |
| Fuel Oil or Kerosene | 362 (0.2%) | 308 (0.3%) |
| Coal or Coke | 15 (0.0%) | 2 (0.0%) |
| All other Fuels | 856 (0.4%) | 754 (0.6%) |
| No Fuel Used | 426 (0.2%) | 928 (0.7%) |
| Total | 202,118 (100.0%) | 125,093 (100.0%) |
Household Vehicle Usage in Jefferson County
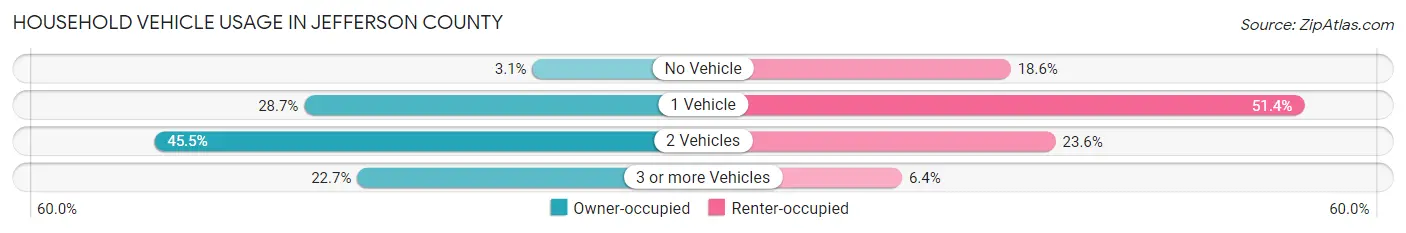
| Vehicles per Household | Owner-occupied | Renter-occupied |
| No Vehicle | 6,290 (3.1%) | 23,226 (18.6%) |
| 1 Vehicle | 57,962 (28.7%) | 64,344 (51.4%) |
| 2 Vehicles | 91,907 (45.5%) | 29,528 (23.6%) |
| 3 or more Vehicles | 45,959 (22.7%) | 7,995 (6.4%) |
| Total | 202,118 (100.0%) | 125,093 (100.0%) |
Real Estate & Mortgages in Jefferson County
Real Estate and Mortgage Overview in Jefferson County
| Characteristic | Without Mortgage | With Mortgage |
| Housing Units | 70,746 | 131,372 |
| Median Property Value | $210,400 | $227,800 |
| Median Household Income | $63,660 | $34,592 |
| Monthly Housing Costs | $564 | $9,966 |
| Real Estate Taxes | $1,744 | $2,982 |
Property Value by Mortgage Status in Jefferson County
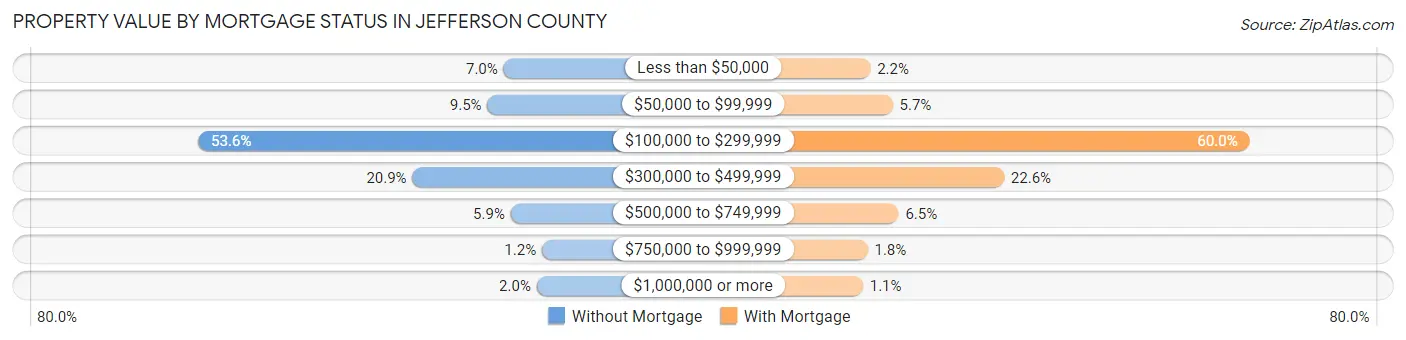
| Property Value | Without Mortgage | With Mortgage |
| Less than $50,000 | 4,957 (7.0%) | 2,936 (2.2%) |
| $50,000 to $99,999 | 6,703 (9.5%) | 7,429 (5.7%) |
| $100,000 to $299,999 | 37,900 (53.6%) | 78,857 (60.0%) |
| $300,000 to $499,999 | 14,789 (20.9%) | 29,706 (22.6%) |
| $500,000 to $749,999 | 4,189 (5.9%) | 8,591 (6.5%) |
| $750,000 to $999,999 | 821 (1.2%) | 2,410 (1.8%) |
| $1,000,000 or more | 1,387 (2.0%) | 1,443 (1.1%) |
| Total | 70,746 (100.0%) | 131,372 (100.0%) |
Household Income by Mortgage Status in Jefferson County
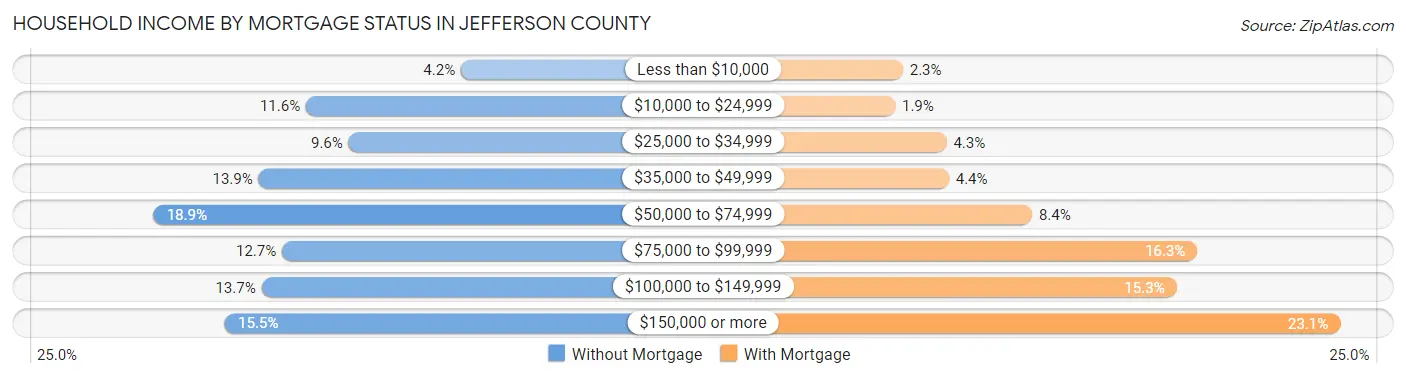
| Household Income | Without Mortgage | With Mortgage |
| Less than $10,000 | 2,983 (4.2%) | 2,954 (2.2%) |
| $10,000 to $24,999 | 8,207 (11.6%) | 2,464 (1.9%) |
| $25,000 to $34,999 | 6,768 (9.6%) | 5,687 (4.3%) |
| $35,000 to $49,999 | 9,806 (13.9%) | 5,831 (4.4%) |
| $50,000 to $74,999 | 13,333 (18.9%) | 11,039 (8.4%) |
| $75,000 to $99,999 | 9,012 (12.7%) | 21,370 (16.3%) |
| $100,000 to $149,999 | 9,704 (13.7%) | 20,078 (15.3%) |
| $150,000 or more | 10,933 (15.4%) | 30,311 (23.1%) |
| Total | 70,746 (100.0%) | 131,372 (100.0%) |
Property Value to Household Income Ratio in Jefferson County
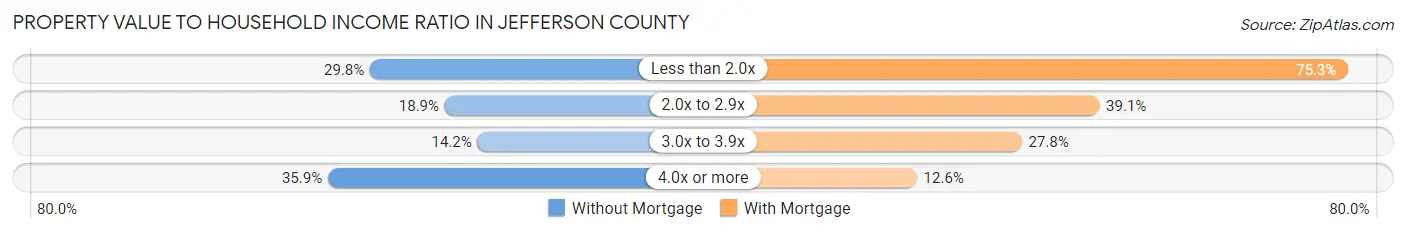
| Value-to-Income Ratio | Without Mortgage | With Mortgage |
| Less than 2.0x | 21,082 (29.8%) | 98,930 (75.3%) |
| 2.0x to 2.9x | 13,400 (18.9%) | 51,399 (39.1%) |
| 3.0x to 3.9x | 10,032 (14.2%) | 36,573 (27.8%) |
| 4.0x or more | 25,410 (35.9%) | 16,557 (12.6%) |
| Total | 70,746 (100.0%) | 131,372 (100.0%) |
Real Estate Taxes by Mortgage Status in Jefferson County
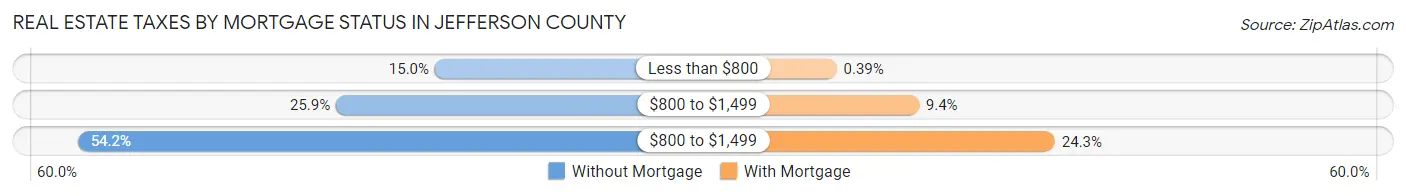
| Property Taxes | Without Mortgage | With Mortgage |
| Less than $800 | 10,639 (15.0%) | 518 (0.4%) |
| $800 to $1,499 | 18,304 (25.9%) | 12,353 (9.4%) |
| $800 to $1,499 | 38,333 (54.2%) | 31,930 (24.3%) |
| Total | 70,746 (100.0%) | 131,372 (100.0%) |
Health & Disability in Jefferson County
Health Insurance Coverage by Age in Jefferson County
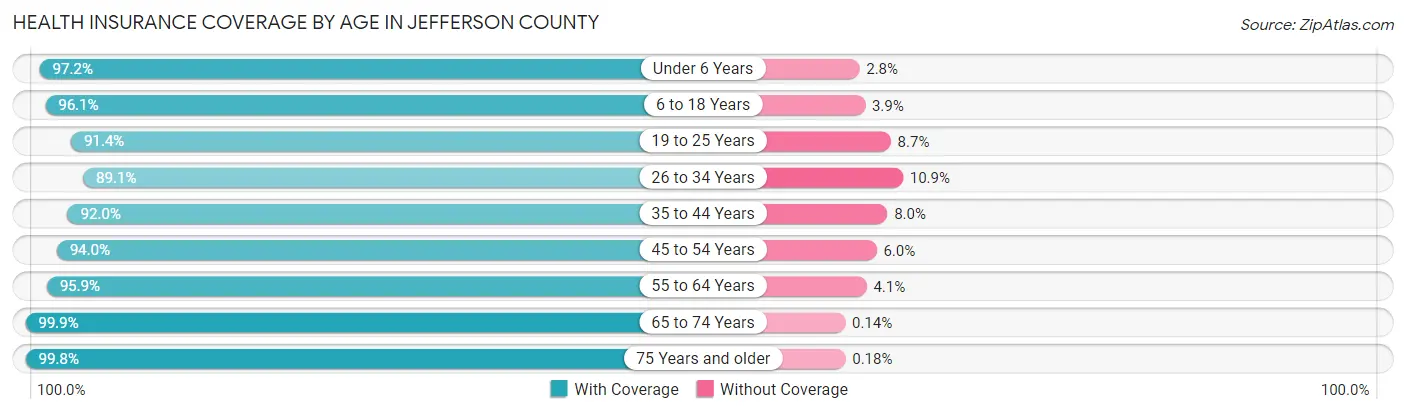
| Age Bracket | With Coverage | Without Coverage |
| Under 6 Years | 55,413 (97.2%) | 1,597 (2.8%) |
| 6 to 18 Years | 117,878 (96.1%) | 4,729 (3.9%) |
| 19 to 25 Years | 65,505 (91.3%) | 6,202 (8.6%) |
| 26 to 34 Years | 88,295 (89.1%) | 10,816 (10.9%) |
| 35 to 44 Years | 90,618 (92.0%) | 7,890 (8.0%) |
| 45 to 54 Years | 87,442 (94.0%) | 5,583 (6.0%) |
| 55 to 64 Years | 97,948 (95.9%) | 4,222 (4.1%) |
| 65 to 74 Years | 77,275 (99.9%) | 105 (0.1%) |
| 75 Years and older | 49,388 (99.8%) | 88 (0.2%) |
| Total | 729,762 (94.7%) | 41,232 (5.3%) |
Health Insurance Coverage by Citizenship Status in Jefferson County
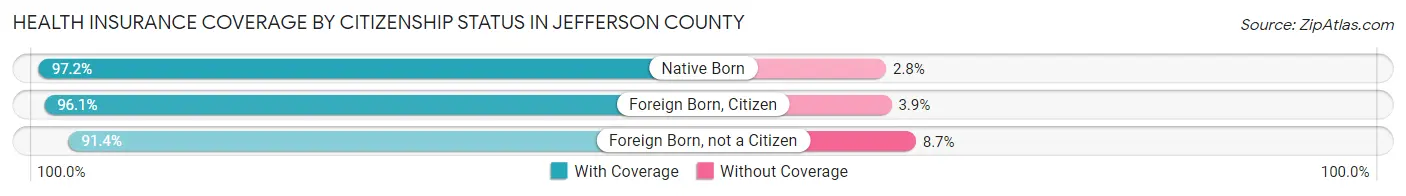
| Citizenship Status | With Coverage | Without Coverage |
| Native Born | 55,413 (97.2%) | 1,597 (2.8%) |
| Foreign Born, Citizen | 117,878 (96.1%) | 4,729 (3.9%) |
| Foreign Born, not a Citizen | 65,505 (91.3%) | 6,202 (8.6%) |
Health Insurance Coverage by Household Income in Jefferson County
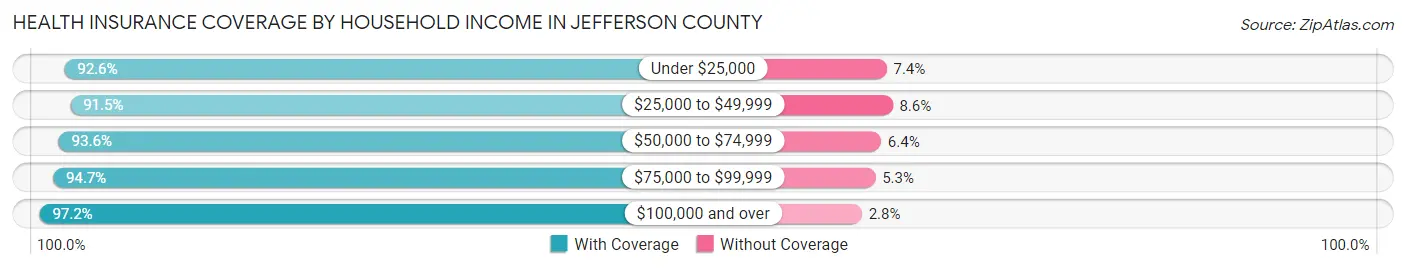
| Household Income | With Coverage | Without Coverage |
| Under $25,000 | 93,466 (92.6%) | 7,517 (7.4%) |
| $25,000 to $49,999 | 119,817 (91.4%) | 11,197 (8.6%) |
| $50,000 to $74,999 | 116,322 (93.6%) | 7,937 (6.4%) |
| $75,000 to $99,999 | 100,449 (94.7%) | 5,649 (5.3%) |
| $100,000 and over | 292,795 (97.2%) | 8,405 (2.8%) |
Public vs Private Health Insurance Coverage by Age in Jefferson County
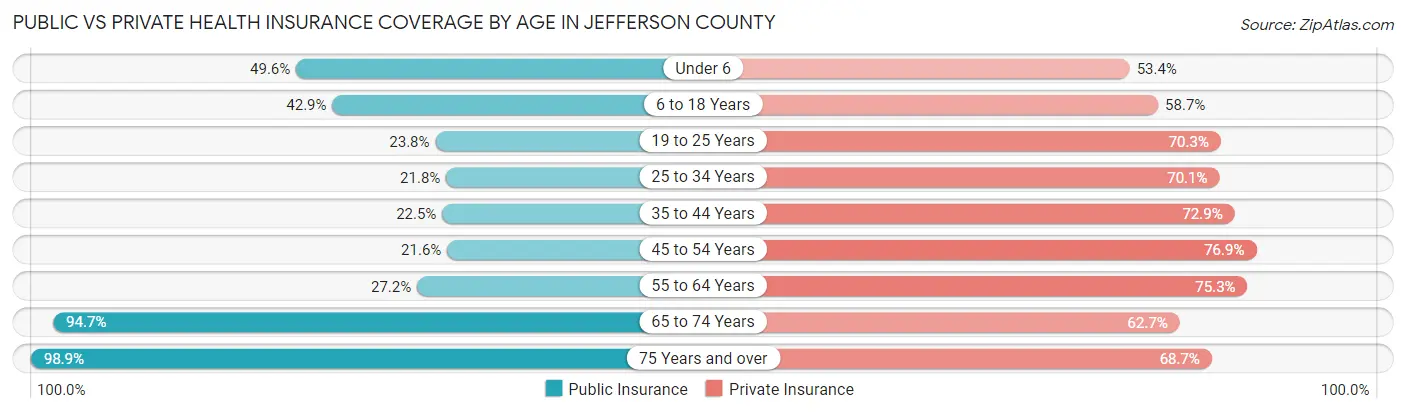
| Age Bracket | Public Insurance | Private Insurance |
| Under 6 | 28,277 (49.6%) | 30,466 (53.4%) |
| 6 to 18 Years | 52,559 (42.9%) | 71,998 (58.7%) |
| 19 to 25 Years | 17,039 (23.8%) | 50,429 (70.3%) |
| 25 to 34 Years | 21,560 (21.7%) | 69,435 (70.1%) |
| 35 to 44 Years | 22,156 (22.5%) | 71,791 (72.9%) |
| 45 to 54 Years | 20,062 (21.6%) | 71,558 (76.9%) |
| 55 to 64 Years | 27,738 (27.2%) | 76,917 (75.3%) |
| 65 to 74 Years | 73,270 (94.7%) | 48,527 (62.7%) |
| 75 Years and over | 48,905 (98.9%) | 33,964 (68.6%) |
| Total | 311,566 (40.4%) | 525,085 (68.1%) |
Disability Status by Sex by Age in Jefferson County
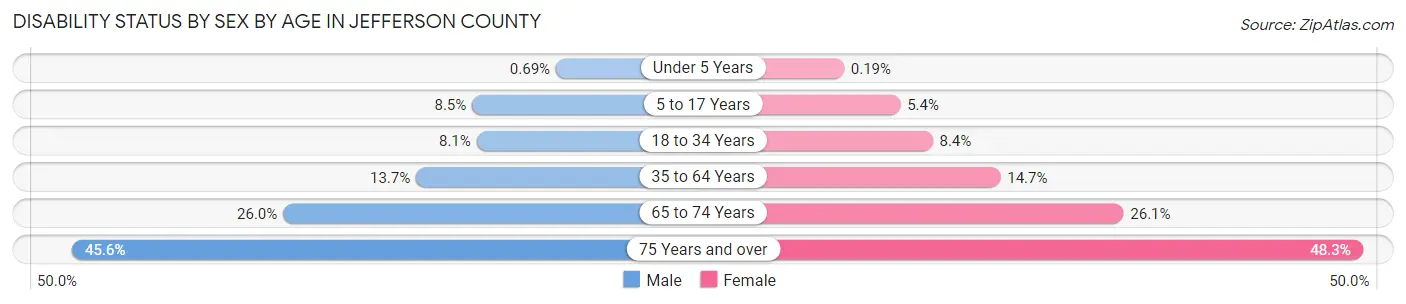
| Age Bracket | Male | Female |
| Under 5 Years | 166 (0.7%) | 44 (0.2%) |
| 5 to 17 Years | 5,344 (8.5%) | 3,269 (5.4%) |
| 18 to 34 Years | 7,206 (8.1%) | 7,591 (8.4%) |
| 35 to 64 Years | 19,548 (13.7%) | 22,175 (14.7%) |
| 65 to 74 Years | 9,255 (26.0%) | 10,919 (26.1%) |
| 75 Years and over | 8,898 (45.6%) | 14,479 (48.3%) |
Disability Class by Sex by Age in Jefferson County
Disability Class: Hearing Difficulty
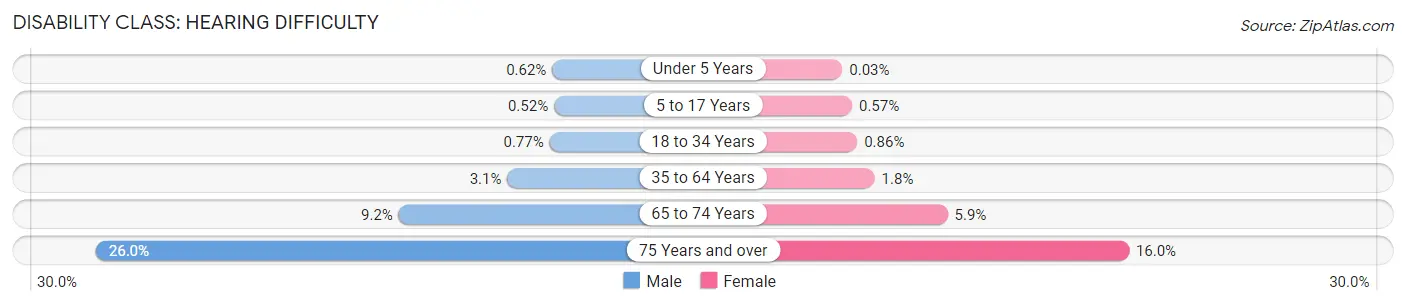
| Age Bracket | Male | Female |
| Under 5 Years | 149 (0.6%) | 6 (0.0%) |
| 5 to 17 Years | 331 (0.5%) | 341 (0.6%) |
| 18 to 34 Years | 692 (0.8%) | 780 (0.9%) |
| 35 to 64 Years | 4,459 (3.1%) | 2,765 (1.8%) |
| 65 to 74 Years | 3,262 (9.2%) | 2,463 (5.9%) |
| 75 Years and over | 5,079 (26.0%) | 4,791 (16.0%) |
Disability Class: Vision Difficulty
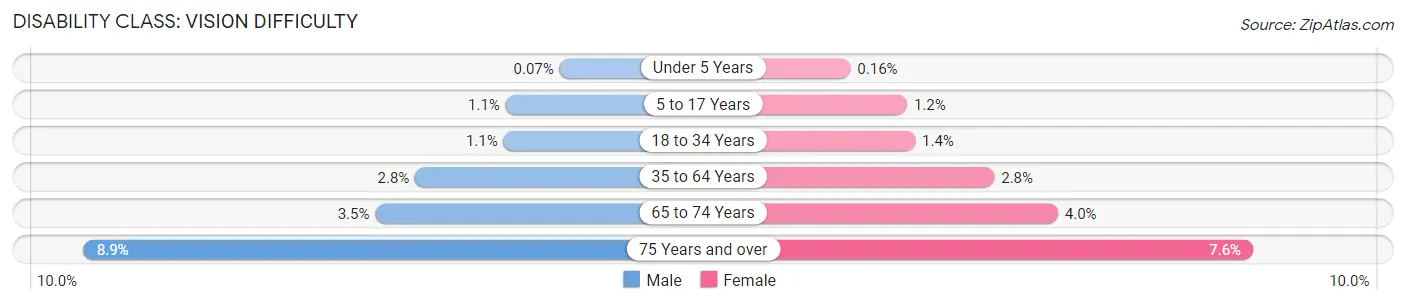
| Age Bracket | Male | Female |
| Under 5 Years | 17 (0.1%) | 38 (0.2%) |
| 5 to 17 Years | 677 (1.1%) | 730 (1.2%) |
| 18 to 34 Years | 996 (1.1%) | 1,231 (1.4%) |
| 35 to 64 Years | 3,939 (2.8%) | 4,265 (2.8%) |
| 65 to 74 Years | 1,242 (3.5%) | 1,675 (4.0%) |
| 75 Years and over | 1,737 (8.9%) | 2,287 (7.6%) |
Disability Class: Cognitive Difficulty
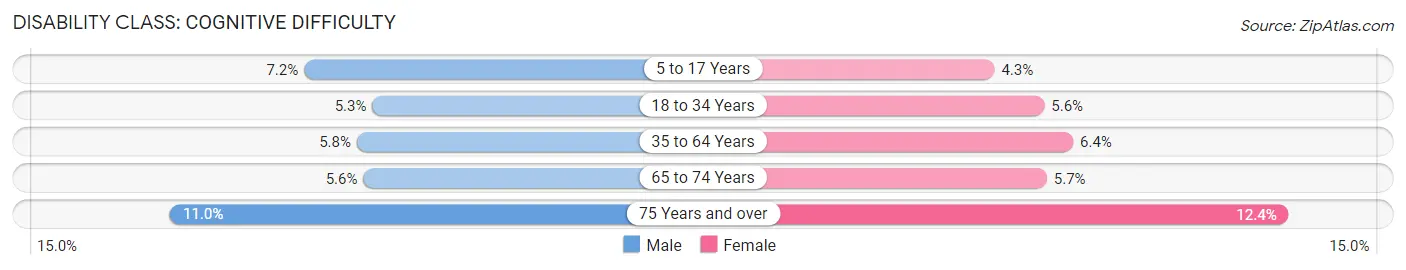
| Age Bracket | Male | Female |
| 5 to 17 Years | 4,558 (7.2%) | 2,562 (4.3%) |
| 18 to 34 Years | 4,768 (5.3%) | 5,089 (5.6%) |
| 35 to 64 Years | 8,216 (5.8%) | 9,710 (6.4%) |
| 65 to 74 Years | 1,982 (5.6%) | 2,387 (5.7%) |
| 75 Years and over | 2,137 (11.0%) | 3,728 (12.4%) |
Disability Class: Ambulatory Difficulty
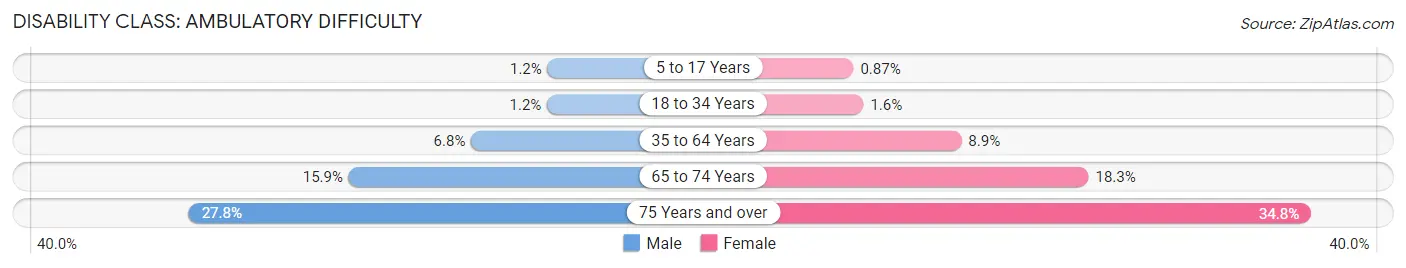
| Age Bracket | Male | Female |
| 5 to 17 Years | 740 (1.2%) | 524 (0.9%) |
| 18 to 34 Years | 1,074 (1.2%) | 1,451 (1.6%) |
| 35 to 64 Years | 9,785 (6.8%) | 13,388 (8.9%) |
| 65 to 74 Years | 5,668 (15.9%) | 7,658 (18.3%) |
| 75 Years and over | 5,426 (27.8%) | 10,438 (34.8%) |
Disability Class: Self-Care Difficulty
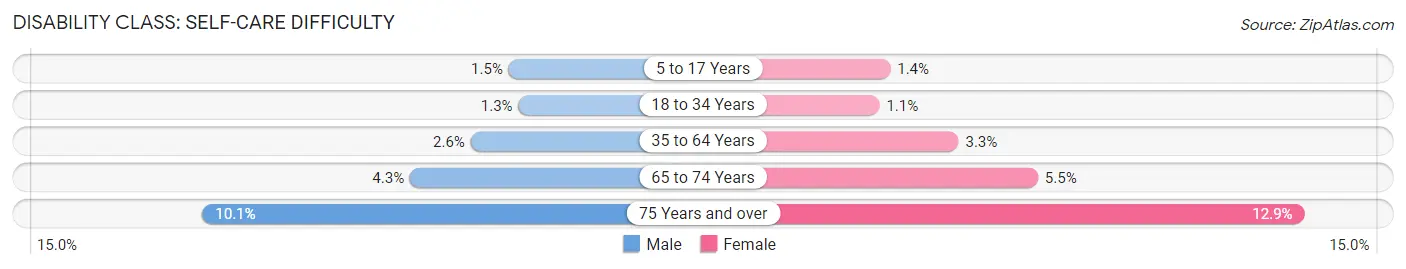
| Age Bracket | Male | Female |
| 5 to 17 Years | 961 (1.5%) | 814 (1.3%) |
| 18 to 34 Years | 1,117 (1.3%) | 948 (1.1%) |
| 35 to 64 Years | 3,682 (2.6%) | 4,897 (3.3%) |
| 65 to 74 Years | 1,521 (4.3%) | 2,282 (5.5%) |
| 75 Years and over | 1,961 (10.1%) | 3,860 (12.9%) |
Technology Access in Jefferson County
Computing Device Access in Jefferson County
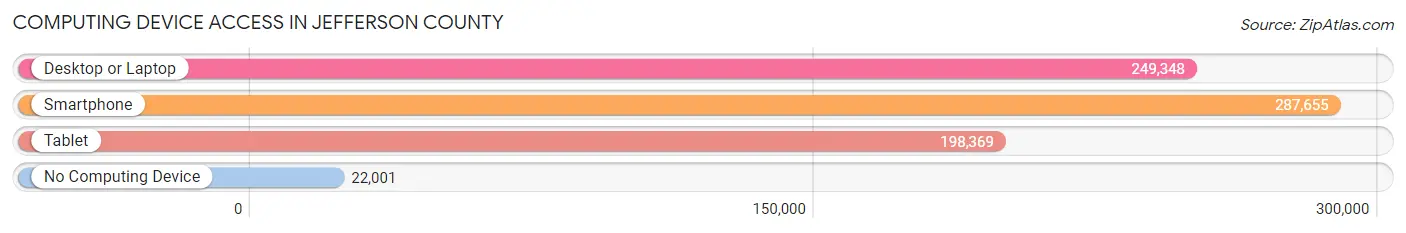
| Device Type | # Households | % Households |
| Desktop or Laptop | 249,348 | 76.2% |
| Smartphone | 287,655 | 87.9% |
| Tablet | 198,369 | 60.6% |
| No Computing Device | 22,001 | 6.7% |
| Total | 327,211 | 100.0% |
Internet Access in Jefferson County
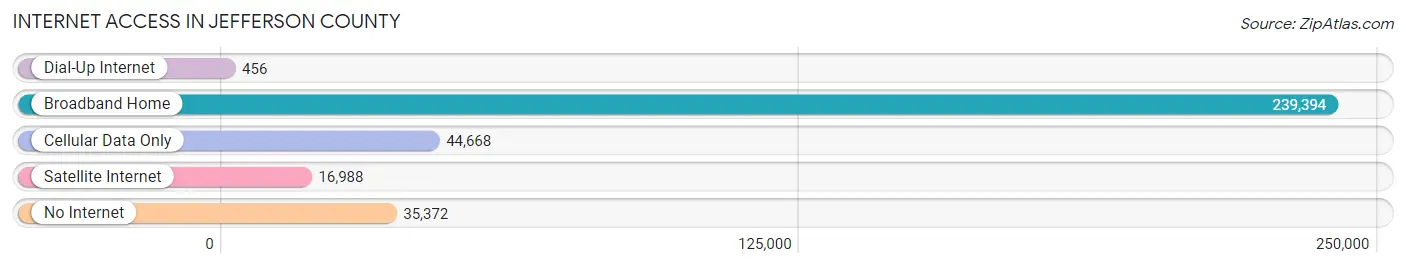
| Internet Type | # Households | % Households |
| Dial-Up Internet | 456 | 0.1% |
| Broadband Home | 239,394 | 73.2% |
| Cellular Data Only | 44,668 | 13.7% |
| Satellite Internet | 16,988 | 5.2% |
| No Internet | 35,372 | 10.8% |
| Total | 327,211 | 100.0% |
Jefferson County Summary
Jefferson County, Kentucky is located in the north-central part of the state and is the most populous county in the state. It is bordered by Oldham County to the north, Bullitt County to the south, Shelby County to the east, and Trimble County to the west. The county seat is Louisville, which is also the largest city in the state.
History
Jefferson County was established in 1780 and named after Thomas Jefferson, the third President of the United States. The county was originally part of Fincastle County, Virginia, and was later divided into three counties: Jefferson, Fayette, and Nelson. The county was further divided in 1807 when Shelby County was created.
The county was home to many Native American tribes, including the Shawnee, Cherokee, and Chickasaw. The first European settlers arrived in the area in the late 1700s and early 1800s. The county was home to many prominent figures in American history, including Daniel Boone, who lived in the area for a time.
Geography
Jefferson County covers an area of 498 square miles and is located in the Bluegrass region of Kentucky. The county is mostly flat, with some rolling hills in the northern and western parts. The county is drained by the Ohio River, which forms its northern border. The county is also home to several small lakes and ponds, including Floyds Fork Lake and Lake Forest.
The county is home to several state parks, including Jefferson Memorial Forest, Otter Creek Park, and Iroquois Park. The county is also home to several golf courses, including the Valhalla Golf Club and the Quail Chase Golf Club.
Economy
Jefferson County is home to a diverse economy, with a variety of industries. The county is home to several large companies, including Brown-Forman, Humana, and Yum! Brands. The county is also home to several universities, including the University of Louisville and Bellarmine University.
The county is home to several major employers, including UPS, Ford Motor Company, and GE Appliances. The county is also home to several hospitals, including Norton Healthcare and Baptist Health Louisville.
Demographics
As of the 2010 census, Jefferson County had a population of 741,096. The population was spread out, with 24.3% under the age of 18, 10.2% from 18 to 24, 32.2% from 25 to 44, 22.2% from 45 to 64, and 11.1% who were 65 years of age or older. The median age was 34.3 years.
The racial makeup of the county was 68.2% White, 28.2% African American, 0.3% Native American, 1.7% Asian, 0.1% Pacific Islander, 0.7% from other races, and 1.9% from two or more races. Hispanic or Latino of any race were 2.7% of the population.
The median income for a household in the county was $45,856, and the median income for a family was $54,817. Males had a median income of $41,845 versus $33,817 for females. The per capita income for the county was $25,945. About 11.2% of families and 14.3% of the population were below the poverty line, including 20.2% of those under age 18 and 9.2% of those age 65 or over.
Common Questions
What is the Total Population of Jefferson County?
Total Population of Jefferson County is 779,232.
What is the Total Male Population of Jefferson County?
Total Male Population of Jefferson County is 379,431.
What is the Total Female Population of Jefferson County?
Total Female Population of Jefferson County is 399,801.
What is the Ratio of Males per 100 Females in Jefferson County?
There are 94.90 Males per 100 Females in Jefferson County.
What is the Ratio of Females per 100 Males in Jefferson County?
There are 105.37 Females per 100 Males in Jefferson County.
What is the Median Population Age in Jefferson County?
Median Population Age in Jefferson County is 38.5 Years.
What is the Average Family Size in Jefferson County
Average Family Size in Jefferson County is 3.0 People.
What is the Average Household Size in Jefferson County
Average Household Size in Jefferson County is 2.3 People.
What is Per Capita Income in Jefferson County?
Per Capita income in Jefferson County is $39,994.
What is the Median Family Income in Jefferson County?
Median Family Income in Jefferson County is $86,214.
What is the Median Household income in Jefferson County?
Median Household Income in Jefferson County is $66,296.
What is Income or Wage Gap in Jefferson County?
Income or Wage Gap in Jefferson County is 23.0%.
Women in Jefferson County earn 77.0 cents for every dollar earned by a man.
What is Family Income Deficit in Jefferson County?
Family Income Deficit in Jefferson County is $11,052.
Families that are below poverty line in Jefferson County earn $11,052 less on average than the poverty threshold level.
What is Inequality or Gini Index in Jefferson County?
Inequality or Gini Index in Jefferson County is 0.48.
How Large is the Labor Force in Jefferson County?
There are 413,400 People in the Labor Forcein in Jefferson County.
What is the Percentage of People in the Labor Force in Jefferson County?
65.9% of People are in the Labor Force in Jefferson County.
What is the Unemployment Rate in Jefferson County?
Unemployment Rate in Jefferson County is 5.1%.