Hopkins County, KY
Hopkins County Map
Hopkins County Overview
45,223
TOTAL POPULATION
22,060
MALE POPULATION
23,163
FEMALE POPULATION
95.24
MALES / 100 FEMALES
105.00
FEMALES / 100 MALES
41.4
MEDIAN AGE
2.9
AVG FAMILY SIZE
2.4
AVG HOUSEHOLD SIZE
$27,878
PER CAPITA INCOME
$64,949
AVG FAMILY INCOME
$54,466
AVG HOUSEHOLD INCOME
30.0%
WAGE / INCOME GAP [ % ]
70.0¢/ $1
WAGE / INCOME GAP [ $ ]
$13,353
FAMILY INCOME DEFICIT
0.43
INEQUALITY / GINI INDEX
19,623
LABOR FORCE [ PEOPLE ]
54.2%
PERCENT IN LABOR FORCE
7.7%
UNEMPLOYMENT RATE
Hopkins County Area Codes
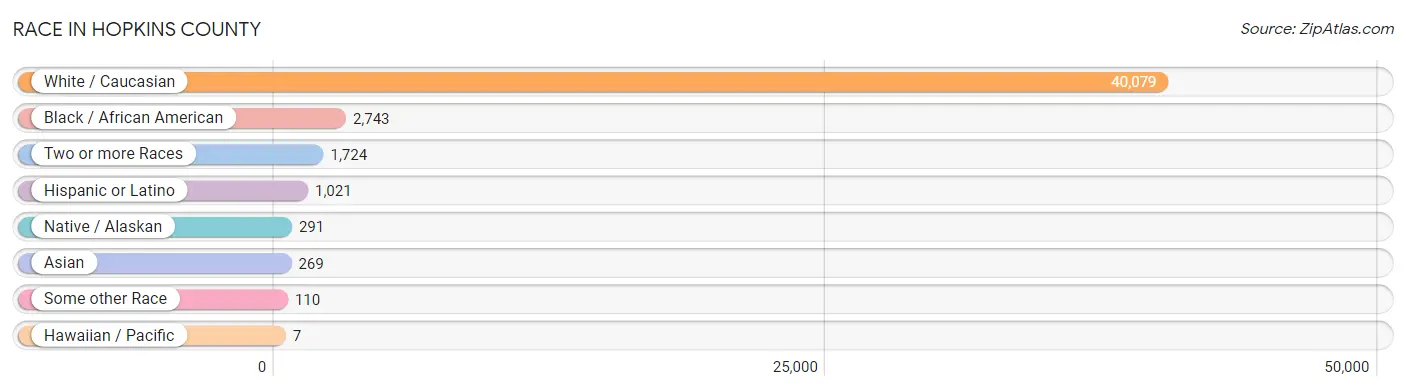
Race in Hopkins County
The most populous races in Hopkins County are White / Caucasian (40,079 | 88.6%), Black / African American (2,743 | 6.1%), and Two or more Races (1,724 | 3.8%).
| Race | # Population | % Population |
| Asian | 269 | 0.6% |
| Black / African American | 2,743 | 6.1% |
| Hawaiian / Pacific | 7 | 0.0% |
| Hispanic or Latino | 1,021 | 2.3% |
| Native / Alaskan | 291 | 0.6% |
| White / Caucasian | 40,079 | 88.6% |
| Two or more Races | 1,724 | 3.8% |
| Some other Race | 110 | 0.2% |
| Total | 45,223 | 100.0% |
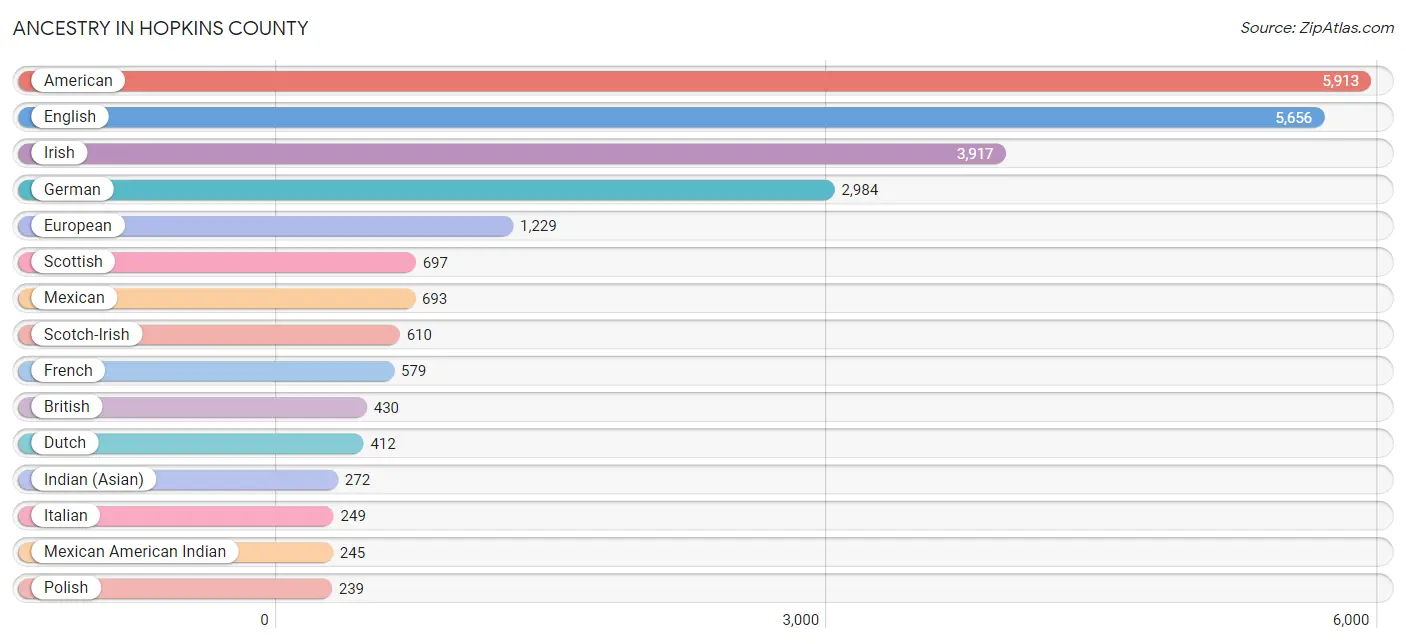
Ancestry in Hopkins County
The most populous ancestries reported in Hopkins County are American (5,913 | 13.1%), English (5,656 | 12.5%), Irish (3,917 | 8.7%), German (2,984 | 6.6%), and European (1,229 | 2.7%), together accounting for 43.6% of all Hopkins County residents.
| Ancestry | # Population | % Population |
| African | 16 | 0.0% |
| Albanian | 6 | 0.0% |
| American | 5,913 | 13.1% |
| Arab | 6 | 0.0% |
| Argentinean | 18 | 0.0% |
| Australian | 15 | 0.0% |
| Bhutanese | 30 | 0.1% |
| British | 430 | 0.9% |
| Burmese | 10 | 0.0% |
| Cajun | 4 | 0.0% |
| Canadian | 57 | 0.1% |
| Central American | 114 | 0.3% |
| Cherokee | 68 | 0.2% |
| Creek | 13 | 0.0% |
| Cuban | 4 | 0.0% |
| Czech | 3 | 0.0% |
| Danish | 12 | 0.0% |
| Dominican | 20 | 0.0% |
| Dutch | 412 | 0.9% |
| Dutch West Indian | 11 | 0.0% |
| Eastern European | 23 | 0.1% |
| English | 5,656 | 12.5% |
| European | 1,229 | 2.7% |
| Finnish | 38 | 0.1% |
| French | 579 | 1.3% |
| French Canadian | 19 | 0.0% |
| German | 2,984 | 6.6% |
| Guatemalan | 8 | 0.0% |
| Haitian | 7 | 0.0% |
| Honduran | 100 | 0.2% |
| Hungarian | 60 | 0.1% |
| Indian (Asian) | 272 | 0.6% |
| Irish | 3,917 | 8.7% |
| Italian | 249 | 0.5% |
| Jamaican | 14 | 0.0% |
| Japanese | 40 | 0.1% |
| Mexican | 693 | 1.5% |
| Mexican American Indian | 245 | 0.5% |
| Native Hawaiian | 66 | 0.2% |
| Navajo | 3 | 0.0% |
| Nigerian | 8 | 0.0% |
| Northern European | 22 | 0.1% |
| Norwegian | 75 | 0.2% |
| Panamanian | 6 | 0.0% |
| Pennsylvania German | 21 | 0.1% |
| Polish | 239 | 0.5% |
| Portuguese | 51 | 0.1% |
| Puerto Rican | 44 | 0.1% |
| Romanian | 9 | 0.0% |
| Russian | 16 | 0.0% |
| Scandinavian | 48 | 0.1% |
| Scotch-Irish | 610 | 1.3% |
| Scottish | 697 | 1.5% |
| Sioux | 32 | 0.1% |
| Slovak | 7 | 0.0% |
| Slovene | 3 | 0.0% |
| South American | 18 | 0.0% |
| Spaniard | 16 | 0.0% |
| Spanish | 51 | 0.1% |
| Sri Lankan | 23 | 0.1% |
| Subsaharan African | 24 | 0.1% |
| Swedish | 63 | 0.1% |
| Syrian | 6 | 0.0% |
| Ukrainian | 39 | 0.1% |
| Welsh | 122 | 0.3% |
| Yugoslavian | 92 | 0.2% | View All 66 Rows |
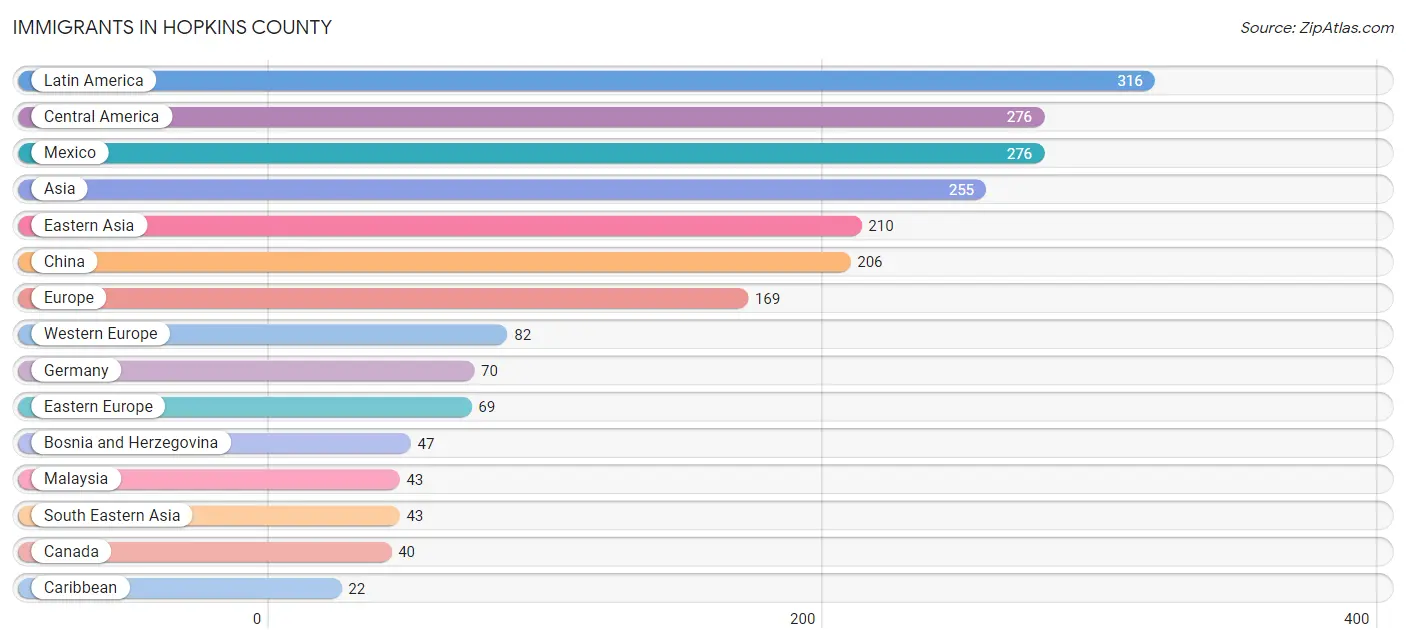
Immigrants in Hopkins County
The most numerous immigrant groups reported in Hopkins County came from Latin America (316 | 0.7%), Central America (276 | 0.6%), Mexico (276 | 0.6%), Asia (255 | 0.6%), and Eastern Asia (210 | 0.5%), together accounting for 2.9% of all Hopkins County residents.
| Immigration Origin | # Population | % Population |
| Africa | 5 | 0.0% |
| Asia | 255 | 0.6% |
| Barbados | 5 | 0.0% |
| Bosnia and Herzegovina | 47 | 0.1% |
| Canada | 40 | 0.1% |
| Caribbean | 22 | 0.1% |
| Central America | 276 | 0.6% |
| China | 206 | 0.5% |
| Cuba | 4 | 0.0% |
| Dominican Republic | 6 | 0.0% |
| Eastern Asia | 210 | 0.5% |
| Eastern Europe | 69 | 0.2% |
| England | 5 | 0.0% |
| Europe | 169 | 0.4% |
| France | 12 | 0.0% |
| Germany | 70 | 0.2% |
| Haiti | 7 | 0.0% |
| Hungary | 6 | 0.0% |
| Iraq | 2 | 0.0% |
| Italy | 6 | 0.0% |
| Korea | 4 | 0.0% |
| Latin America | 316 | 0.7% |
| Malaysia | 43 | 0.1% |
| Mexico | 276 | 0.6% |
| Nigeria | 5 | 0.0% |
| Northern Europe | 12 | 0.0% |
| Oceania | 3 | 0.0% |
| Peru | 18 | 0.0% |
| Russia | 16 | 0.0% |
| South America | 18 | 0.0% |
| South Eastern Asia | 43 | 0.1% |
| Southern Europe | 6 | 0.0% |
| Western Africa | 5 | 0.0% |
| Western Asia | 2 | 0.0% |
| Western Europe | 82 | 0.2% | View All 35 Rows |
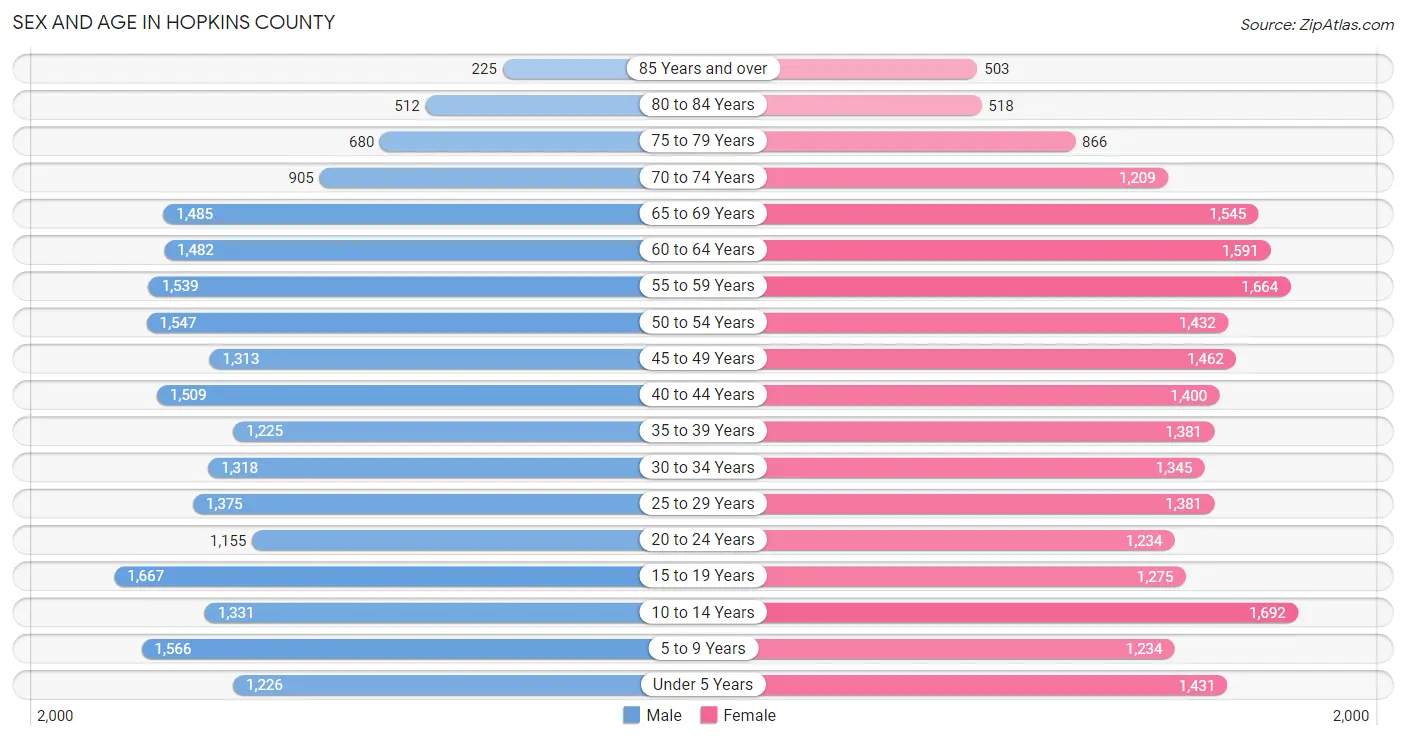
Sex and Age in Hopkins County
Sex and Age in Hopkins County
The most populous age groups in Hopkins County are 15 to 19 Years (1,667 | 7.6%) for men and 10 to 14 Years (1,692 | 7.3%) for women.
| Age Bracket | Male | Female |
| Under 5 Years | 1,226 (5.6%) | 1,431 (6.2%) |
| 5 to 9 Years | 1,566 (7.1%) | 1,234 (5.3%) |
| 10 to 14 Years | 1,331 (6.0%) | 1,692 (7.3%) |
| 15 to 19 Years | 1,667 (7.6%) | 1,275 (5.5%) |
| 20 to 24 Years | 1,155 (5.2%) | 1,234 (5.3%) |
| 25 to 29 Years | 1,375 (6.2%) | 1,381 (6.0%) |
| 30 to 34 Years | 1,318 (6.0%) | 1,345 (5.8%) |
| 35 to 39 Years | 1,225 (5.6%) | 1,381 (6.0%) |
| 40 to 44 Years | 1,509 (6.8%) | 1,400 (6.0%) |
| 45 to 49 Years | 1,313 (5.9%) | 1,462 (6.3%) |
| 50 to 54 Years | 1,547 (7.0%) | 1,432 (6.2%) |
| 55 to 59 Years | 1,539 (7.0%) | 1,664 (7.2%) |
| 60 to 64 Years | 1,482 (6.7%) | 1,591 (6.9%) |
| 65 to 69 Years | 1,485 (6.7%) | 1,545 (6.7%) |
| 70 to 74 Years | 905 (4.1%) | 1,209 (5.2%) |
| 75 to 79 Years | 680 (3.1%) | 866 (3.7%) |
| 80 to 84 Years | 512 (2.3%) | 518 (2.2%) |
| 85 Years and over | 225 (1.0%) | 503 (2.2%) |
| Total | 22,060 (100.0%) | 23,163 (100.0%) |
Families and Households in Hopkins County
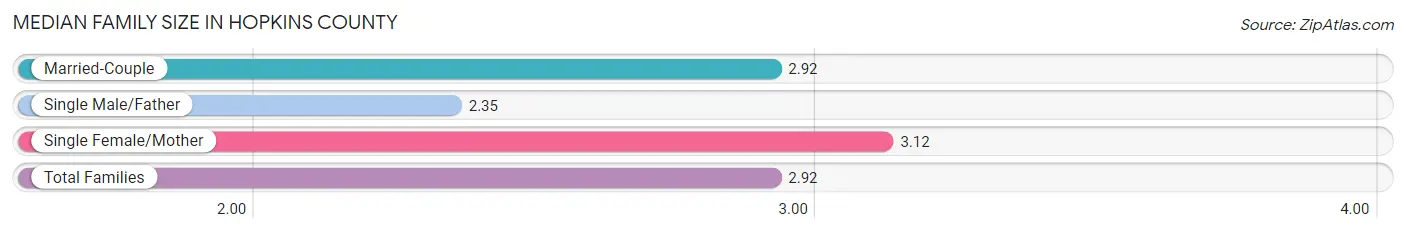
Median Family Size in Hopkins County
The median family size in Hopkins County is 2.92 persons per family, with single female/mother families (2,353 | 19.3%) accounting for the largest median family size of 3.12 persons per family. On the other hand, single male/father families (947 | 7.8%) represent the smallest median family size with 2.35 persons per family.
| Family Type | # Families | Family Size |
| Married-Couple | 8,902 (73.0%) | 2.92 |
| Single Male/Father | 947 (7.8%) | 2.35 |
| Single Female/Mother | 2,353 (19.3%) | 3.12 |
| Total Families | 12,202 (100.0%) | 2.92 |
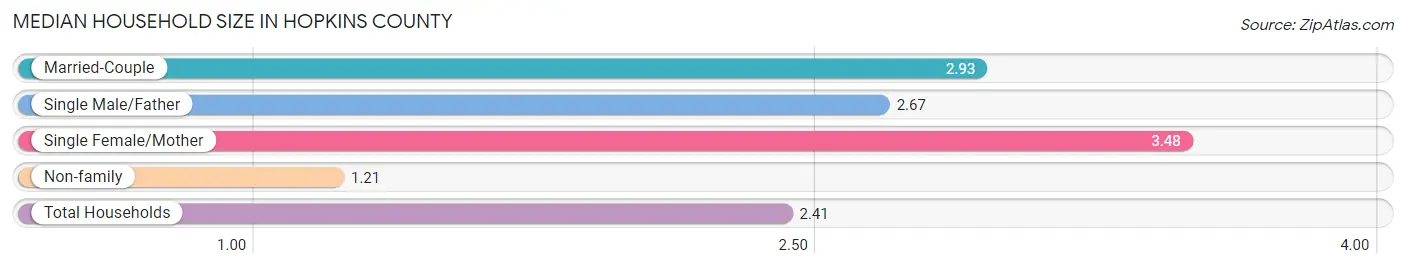
Median Household Size in Hopkins County
The median household size in Hopkins County is 2.41 persons per household, with single female/mother households (2,353 | 12.8%) accounting for the largest median household size of 3.48 persons per household. non-family households (6,143 | 33.5%) represent the smallest median household size with 1.21 persons per household.
| Household Type | # Households | Household Size |
| Married-Couple | 8,902 (48.5%) | 2.93 |
| Single Male/Father | 947 (5.2%) | 2.67 |
| Single Female/Mother | 2,353 (12.8%) | 3.48 |
| Non-family | 6,143 (33.5%) | 1.21 |
| Total Households | 18,345 (100.0%) | 2.41 |
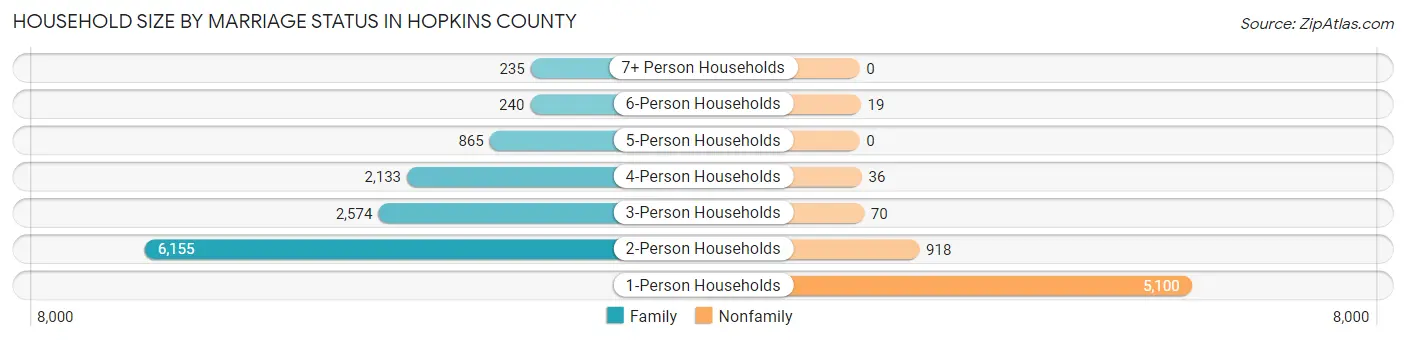
Household Size by Marriage Status in Hopkins County
Out of a total of 18,345 households in Hopkins County, 12,202 (66.5%) are family households, while 6,143 (33.5%) are nonfamily households. The most numerous type of family households are 2-person households, comprising 6,155, and the most common type of nonfamily households are 1-person households, comprising 5,100.
| Household Size | Family Households | Nonfamily Households |
| 1-Person Households | - | 5,100 (27.8%) |
| 2-Person Households | 6,155 (33.6%) | 918 (5.0%) |
| 3-Person Households | 2,574 (14.0%) | 70 (0.4%) |
| 4-Person Households | 2,133 (11.6%) | 36 (0.2%) |
| 5-Person Households | 865 (4.7%) | 0 (0.0%) |
| 6-Person Households | 240 (1.3%) | 19 (0.1%) |
| 7+ Person Households | 235 (1.3%) | 0 (0.0%) |
| Total | 12,202 (66.5%) | 6,143 (33.5%) |
Female Fertility in Hopkins County
Fertility by Age in Hopkins County
Average fertility rate in Hopkins County is 67.0 births per 1,000 women. Women in the age bracket of 20 to 34 years have the highest fertility rate with 139.0 births per 1,000 women. Women in the age bracket of 20 to 34 years acount for 83.7% of all women with births.
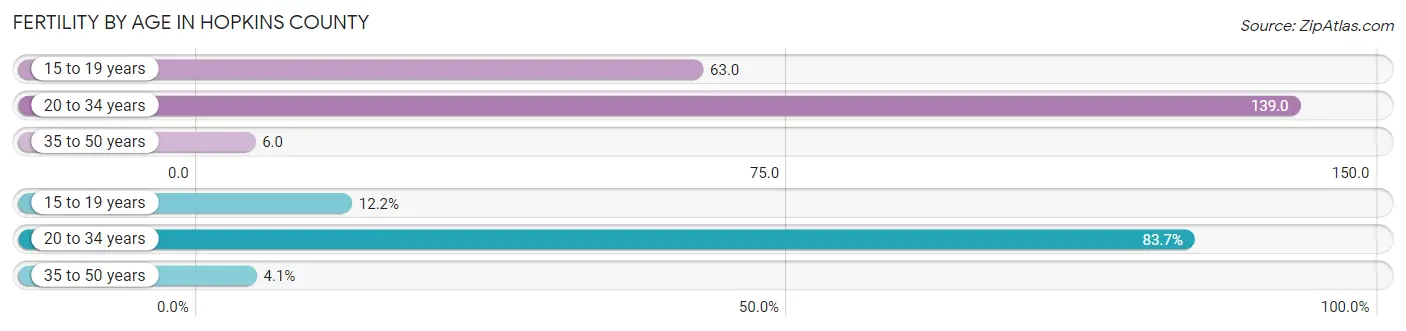
| Age Bracket | Women with Births | Births / 1,000 Women |
| 15 to 19 years | 80 (12.2%) | 63.0 |
| 20 to 34 years | 549 (83.7%) | 139.0 |
| 35 to 50 years | 27 (4.1%) | 6.0 |
| Total | 656 (100.0%) | 67.0 |
Fertility by Age by Marriage Status in Hopkins County
40.1% of women with births (656) in Hopkins County are married. The highest percentage of unmarried women with births falls into 15 to 19 years age bracket with 100.0% of them unmarried at the time of birth, while the lowest percentage of unmarried women with births belong to 20 to 34 years age bracket with 53.0% of them unmarried.
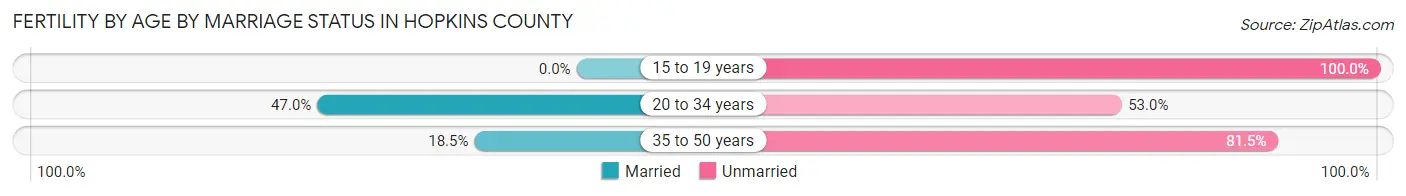
| Age Bracket | Married | Unmarried |
| 15 to 19 years | 0 (0.0%) | 80 (100.0%) |
| 20 to 34 years | 258 (47.0%) | 291 (53.0%) |
| 35 to 50 years | 5 (18.5%) | 22 (81.5%) |
| Total | 263 (40.1%) | 393 (59.9%) |
Fertility by Education in Hopkins County
Average fertility rate in Hopkins County is 67.0 births per 1,000 women. Women with the education attainment of less than high school have the highest fertility rate of 93.0 births per 1,000 women, while women with the education attainment of graduate degree have the lowest fertility at 23.0 births per 1,000 women. Women with the education attainment of college or associate's degree represent 40.4% of all women with births.
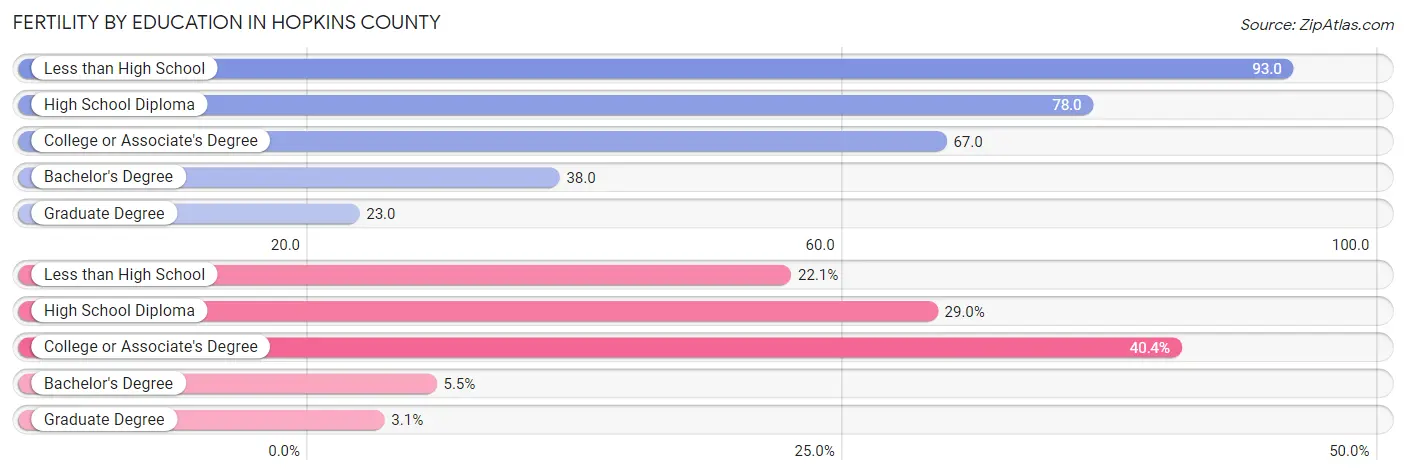
| Educational Attainment | Women with Births | Births / 1,000 Women |
| Less than High School | 145 (22.1%) | 93.0 |
| High School Diploma | 190 (29.0%) | 78.0 |
| College or Associate's Degree | 265 (40.4%) | 67.0 |
| Bachelor's Degree | 36 (5.5%) | 38.0 |
| Graduate Degree | 20 (3.0%) | 23.0 |
| Total | 656 (100.0%) | 67.0 |
Fertility by Education by Marriage Status in Hopkins County
59.9% of women with births in Hopkins County are unmarried. Women with the educational attainment of bachelor's degree are most likely to be married with 100.0% of them married at childbirth, while women with the educational attainment of less than high school are least likely to be married with 97.2% of them unmarried at childbirth.
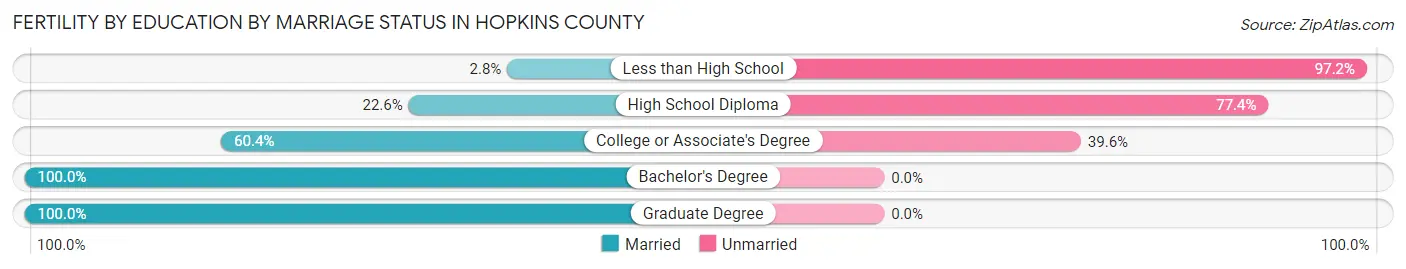
| Educational Attainment | Married | Unmarried |
| Less than High School | 4 (2.8%) | 141 (97.2%) |
| High School Diploma | 43 (22.6%) | 147 (77.4%) |
| College or Associate's Degree | 160 (60.4%) | 105 (39.6%) |
| Bachelor's Degree | 36 (100.0%) | 0 (0.0%) |
| Graduate Degree | 20 (100.0%) | 0 (0.0%) |
| Total | 263 (40.1%) | 393 (59.9%) |
Income in Hopkins County
Income Overview in Hopkins County
Per Capita Income in Hopkins County is $27,878, while median incomes of families and households are $64,949 and $54,466 respectively.
| Characteristic | Number | Measure |
| Per Capita Income | 45,223 | $27,878 |
| Median Family Income | 12,202 | $64,949 |
| Mean Family Income | 12,202 | $79,213 |
| Median Household Income | 18,345 | $54,466 |
| Mean Household Income | 18,345 | $67,816 |
| Income Deficit | 12,202 | $13,353 |
| Wage / Income Gap (%) | 45,223 | 30.04% |
| Wage / Income Gap ($) | 45,223 | 69.96¢ per $1 |
| Gini / Inequality Index | 45,223 | 0.43 |
Earnings by Sex in Hopkins County
Average Earnings in Hopkins County are $38,024, $45,279 for men and $31,679 for women, a difference of 30.0%.
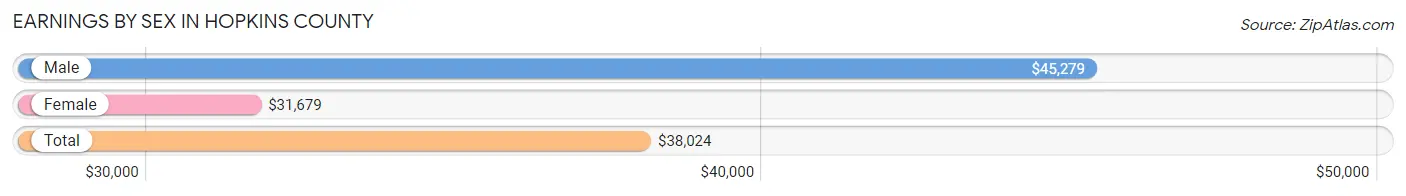
| Sex | Number | Average Earnings |
| Male | 10,567 (51.8%) | $45,279 |
| Female | 9,813 (48.1%) | $31,679 |
| Total | 20,380 (100.0%) | $38,024 |
Earnings by Sex by Income Bracket in Hopkins County
The most common earnings brackets in Hopkins County are $75,000 to $99,999 for men (1,409 | 13.3%) and $40,000 to $44,999 for women (902 | 9.2%).
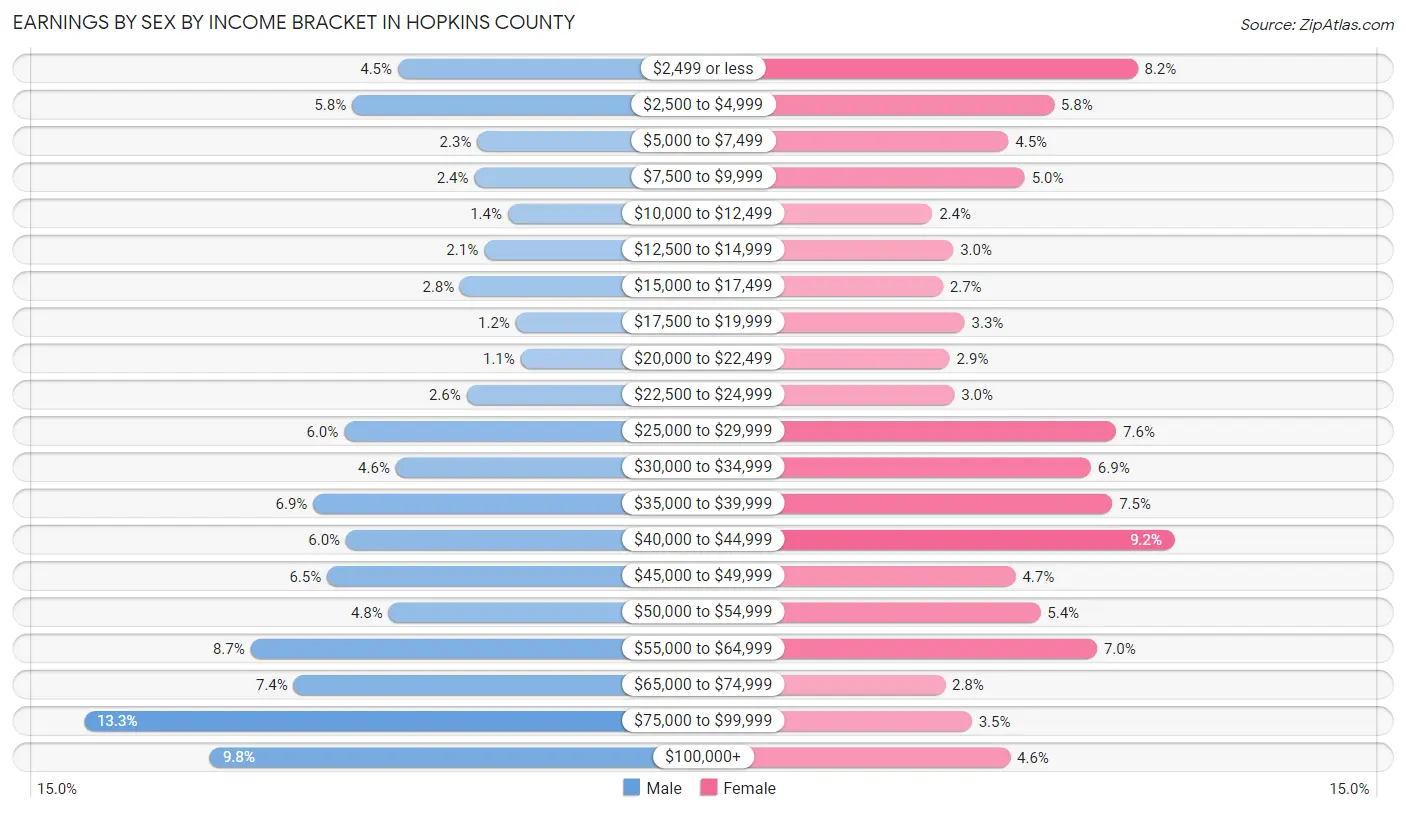
| Income | Male | Female |
| $2,499 or less | 477 (4.5%) | 802 (8.2%) |
| $2,500 to $4,999 | 613 (5.8%) | 571 (5.8%) |
| $5,000 to $7,499 | 241 (2.3%) | 446 (4.5%) |
| $7,500 to $9,999 | 249 (2.4%) | 491 (5.0%) |
| $10,000 to $12,499 | 150 (1.4%) | 236 (2.4%) |
| $12,500 to $14,999 | 221 (2.1%) | 293 (3.0%) |
| $15,000 to $17,499 | 292 (2.8%) | 265 (2.7%) |
| $17,500 to $19,999 | 127 (1.2%) | 325 (3.3%) |
| $20,000 to $22,499 | 112 (1.1%) | 284 (2.9%) |
| $22,500 to $24,999 | 273 (2.6%) | 296 (3.0%) |
| $25,000 to $29,999 | 636 (6.0%) | 743 (7.6%) |
| $30,000 to $34,999 | 483 (4.6%) | 673 (6.9%) |
| $35,000 to $39,999 | 728 (6.9%) | 732 (7.5%) |
| $40,000 to $44,999 | 631 (6.0%) | 902 (9.2%) |
| $45,000 to $49,999 | 687 (6.5%) | 465 (4.7%) |
| $50,000 to $54,999 | 504 (4.8%) | 534 (5.4%) |
| $55,000 to $64,999 | 914 (8.6%) | 690 (7.0%) |
| $65,000 to $74,999 | 786 (7.4%) | 271 (2.8%) |
| $75,000 to $99,999 | 1,409 (13.3%) | 344 (3.5%) |
| $100,000+ | 1,034 (9.8%) | 450 (4.6%) |
| Total | 10,567 (100.0%) | 9,813 (100.0%) |
Earnings by Sex by Educational Attainment in Hopkins County
Average earnings in Hopkins County are $50,238 for men and $35,441 for women, a difference of 29.4%. Men with an educational attainment of graduate degree enjoy the highest average annual earnings of $79,957, while those with less than high school education earn the least with $37,083. Women with an educational attainment of graduate degree earn the most with the average annual earnings of $49,034, while those with less than high school education have the smallest earnings of $9,959.
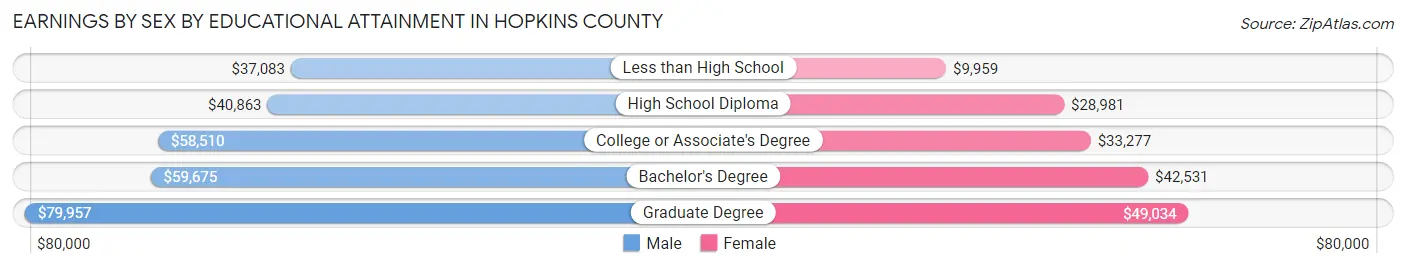
| Educational Attainment | Male Income | Female Income |
| Less than High School | $37,083 | $9,959 |
| High School Diploma | $40,863 | $28,981 |
| College or Associate's Degree | $58,510 | $33,277 |
| Bachelor's Degree | $59,675 | $42,531 |
| Graduate Degree | $79,957 | $49,034 |
| Total | $50,238 | $35,441 |
Family Income in Hopkins County
Family Income Brackets in Hopkins County
According to the Hopkins County family income data, there are 2,562 families falling into the $50,000 to $74,999 income range, which is the most common income bracket and makes up 21.0% of all families. Conversely, the $10,000 to $14,999 income bracket is the least frequent group with only 378 families (3.1%) belonging to this category.
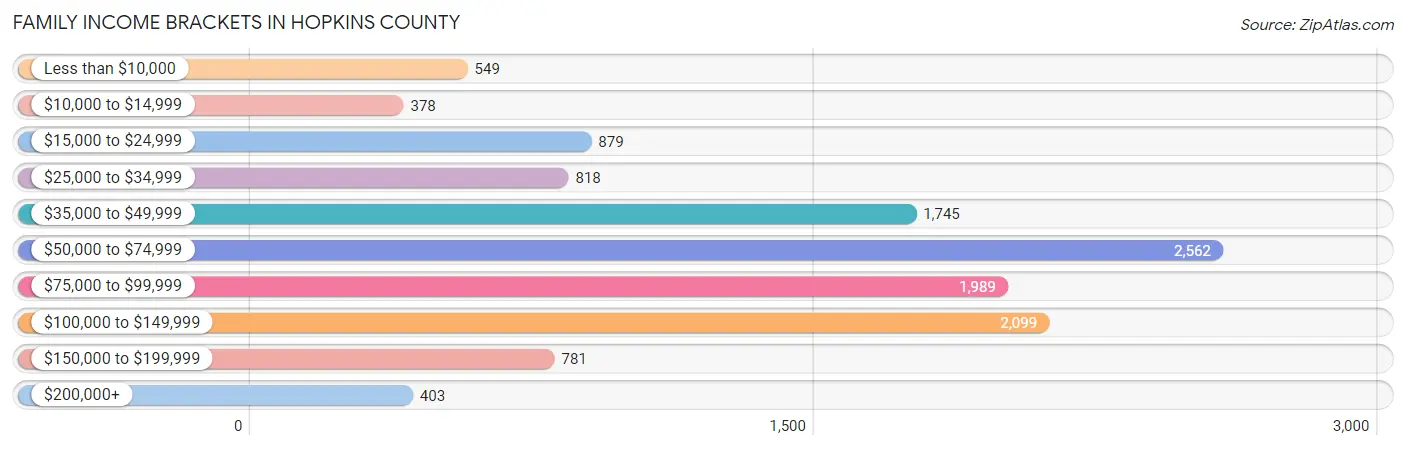
| Income Bracket | # Families | % Families |
| Less than $10,000 | 549 | 4.5% |
| $10,000 to $14,999 | 378 | 3.1% |
| $15,000 to $24,999 | 879 | 7.2% |
| $25,000 to $34,999 | 818 | 6.7% |
| $35,000 to $49,999 | 1,745 | 14.3% |
| $50,000 to $74,999 | 2,562 | 21.0% |
| $75,000 to $99,999 | 1,989 | 16.3% |
| $100,000 to $149,999 | 2,099 | 17.2% |
| $150,000 to $199,999 | 781 | 6.4% |
| $200,000+ | 403 | 3.3% |
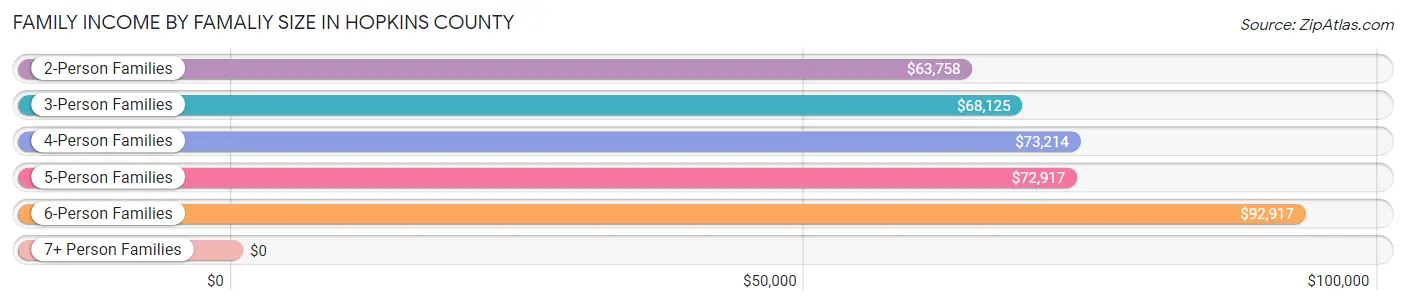
Family Income by Famaliy Size in Hopkins County
6-person families (189 | 1.5%) account for the highest median family income in Hopkins County with $92,917 per family, while 2-person families (6,436 | 52.7%) have the highest median income of $31,879 per family member.
| Income Bracket | # Families | Median Income |
| 2-Person Families | 6,436 (52.7%) | $63,758 |
| 3-Person Families | 2,571 (21.1%) | $68,125 |
| 4-Person Families | 2,030 (16.6%) | $73,214 |
| 5-Person Families | 786 (6.4%) | $72,917 |
| 6-Person Families | 189 (1.5%) | $92,917 |
| 7+ Person Families | 190 (1.6%) | $0 |
| Total | 12,202 (100.0%) | $64,949 |
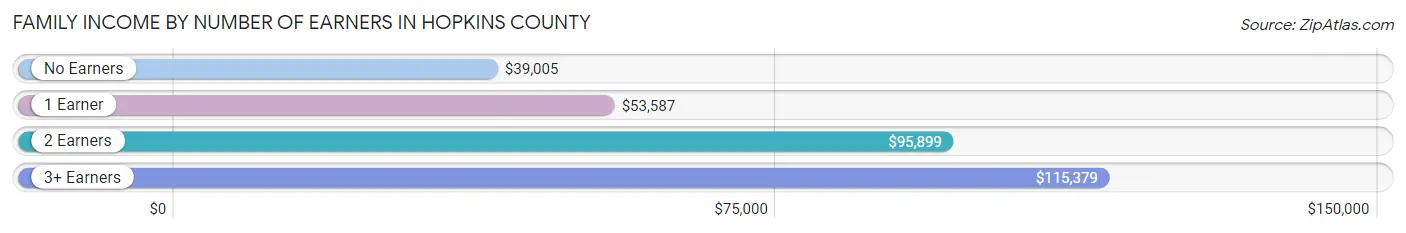
Family Income by Number of Earners in Hopkins County
The median family income in Hopkins County is $64,949, with families comprising 3+ earners (770) having the highest median family income of $115,379, while families with no earners (2,931) have the lowest median family income of $39,005, accounting for 6.3% and 24.0% of families, respectively.
| Number of Earners | # Families | Median Income |
| No Earners | 2,931 (24.0%) | $39,005 |
| 1 Earner | 4,095 (33.6%) | $53,587 |
| 2 Earners | 4,406 (36.1%) | $95,899 |
| 3+ Earners | 770 (6.3%) | $115,379 |
| Total | 12,202 (100.0%) | $64,949 |
Household Income in Hopkins County
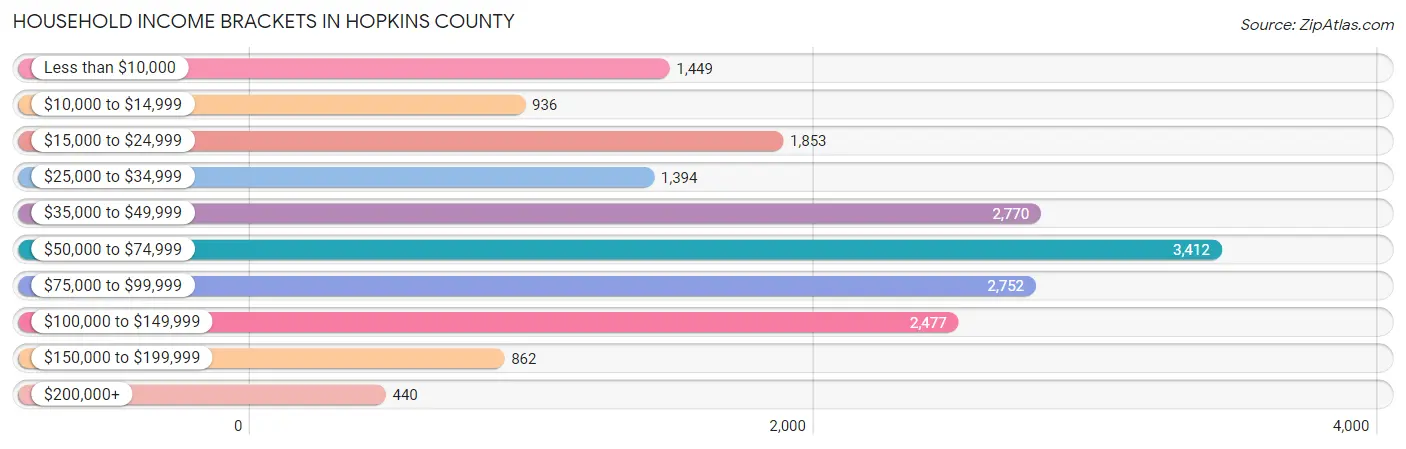
Household Income Brackets in Hopkins County
With 3,412 households falling in the category, the $50,000 to $74,999 income range is the most frequent in Hopkins County, accounting for 18.6% of all households. In contrast, only 440 households (2.4%) fall into the $200,000+ income bracket, making it the least populous group.
| Income Bracket | # Households | % Households |
| Less than $10,000 | 1,449 | 7.9% |
| $10,000 to $14,999 | 936 | 5.1% |
| $15,000 to $24,999 | 1,853 | 10.1% |
| $25,000 to $34,999 | 1,394 | 7.6% |
| $35,000 to $49,999 | 2,770 | 15.1% |
| $50,000 to $74,999 | 3,412 | 18.6% |
| $75,000 to $99,999 | 2,752 | 15.0% |
| $100,000 to $149,999 | 2,477 | 13.5% |
| $150,000 to $199,999 | 862 | 4.7% |
| $200,000+ | 440 | 2.4% |
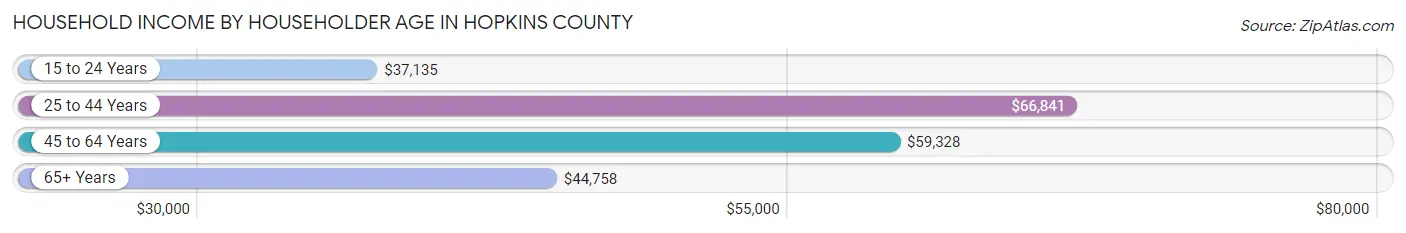
Household Income by Householder Age in Hopkins County
The median household income in Hopkins County is $54,466, with the highest median household income of $66,841 found in the 25 to 44 years age bracket for the primary householder. A total of 5,189 households (28.3%) fall into this category. Meanwhile, the 15 to 24 years age bracket for the primary householder has the lowest median household income of $37,135, with 740 households (4.0%) in this group.
| Income Bracket | # Households | Median Income |
| 15 to 24 Years | 740 (4.0%) | $37,135 |
| 25 to 44 Years | 5,189 (28.3%) | $66,841 |
| 45 to 64 Years | 6,853 (37.4%) | $59,328 |
| 65+ Years | 5,563 (30.3%) | $44,758 |
| Total | 18,345 (100.0%) | $54,466 |
Poverty in Hopkins County
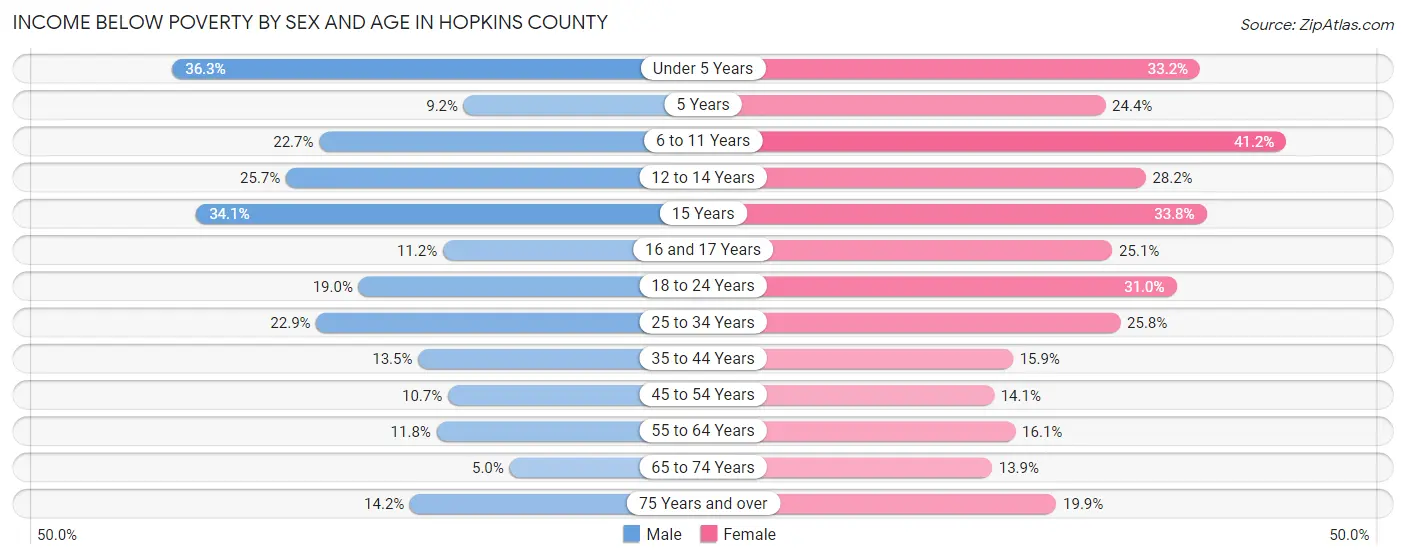
Income Below Poverty by Sex and Age in Hopkins County
With 16.2% poverty level for males and 22.0% for females among the residents of Hopkins County, under 5 year old males and 6 to 11 year old females are the most vulnerable to poverty, with 438 males (36.3%) and 701 females (41.2%) in their respective age groups living below the poverty level.
| Age Bracket | Male | Female |
| Under 5 Years | 438 (36.3%) | 442 (33.2%) |
| 5 Years | 31 (9.2%) | 22 (24.4%) |
| 6 to 11 Years | 364 (22.7%) | 701 (41.2%) |
| 12 to 14 Years | 212 (25.7%) | 290 (28.2%) |
| 15 Years | 93 (34.1%) | 90 (33.8%) |
| 16 and 17 Years | 83 (11.2%) | 140 (25.1%) |
| 18 to 24 Years | 335 (19.0%) | 523 (31.0%) |
| 25 to 34 Years | 585 (22.9%) | 701 (25.8%) |
| 35 to 44 Years | 352 (13.5%) | 441 (15.9%) |
| 45 to 54 Years | 294 (10.7%) | 404 (14.1%) |
| 55 to 64 Years | 349 (11.8%) | 512 (16.1%) |
| 65 to 74 Years | 115 (5.0%) | 377 (13.9%) |
| 75 Years and over | 196 (14.2%) | 334 (19.9%) |
| Total | 3,447 (16.2%) | 4,977 (22.0%) |
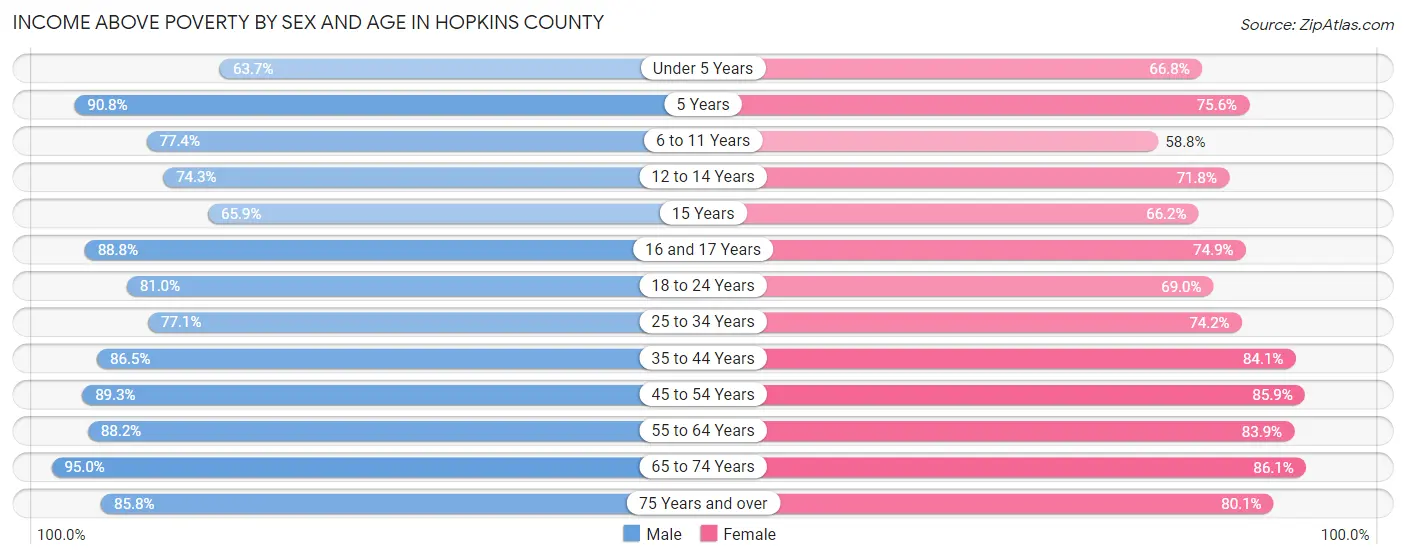
Income Above Poverty by Sex and Age in Hopkins County
According to the poverty statistics in Hopkins County, males aged 65 to 74 years and females aged 65 to 74 years are the age groups that are most secure financially, with 95.0% of males and 86.1% of females in these age groups living above the poverty line.
| Age Bracket | Male | Female |
| Under 5 Years | 769 (63.7%) | 888 (66.8%) |
| 5 Years | 305 (90.8%) | 68 (75.6%) |
| 6 to 11 Years | 1,243 (77.3%) | 999 (58.8%) |
| 12 to 14 Years | 612 (74.3%) | 739 (71.8%) |
| 15 Years | 180 (65.9%) | 176 (66.2%) |
| 16 and 17 Years | 660 (88.8%) | 418 (74.9%) |
| 18 to 24 Years | 1,429 (81.0%) | 1,162 (69.0%) |
| 25 to 34 Years | 1,967 (77.1%) | 2,013 (74.2%) |
| 35 to 44 Years | 2,264 (86.5%) | 2,340 (84.1%) |
| 45 to 54 Years | 2,453 (89.3%) | 2,462 (85.9%) |
| 55 to 64 Years | 2,618 (88.2%) | 2,671 (83.9%) |
| 65 to 74 Years | 2,188 (95.0%) | 2,332 (86.1%) |
| 75 Years and over | 1,182 (85.8%) | 1,345 (80.1%) |
| Total | 17,870 (83.8%) | 17,613 (78.0%) |
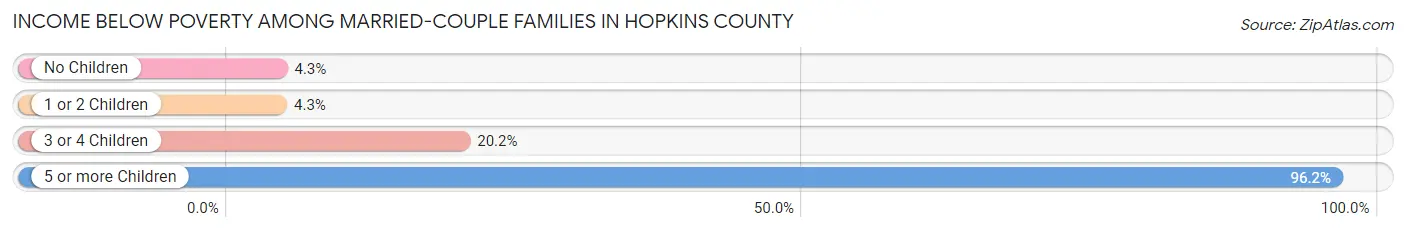
Income Below Poverty Among Married-Couple Families in Hopkins County
The poverty statistics for married-couple families in Hopkins County show that 5.8% or 518 of the total 8,902 families live below the poverty line. Families with 5 or more children have the highest poverty rate of 96.2%, comprising of 50 families. On the other hand, families with 1 or 2 children have the lowest poverty rate of 4.3%, which includes 112 families.
| Children | Above Poverty | Below Poverty |
| No Children | 5,435 (95.7%) | 245 (4.3%) |
| 1 or 2 Children | 2,509 (95.7%) | 112 (4.3%) |
| 3 or 4 Children | 438 (79.8%) | 111 (20.2%) |
| 5 or more Children | 2 (3.8%) | 50 (96.2%) |
| Total | 8,384 (94.2%) | 518 (5.8%) |
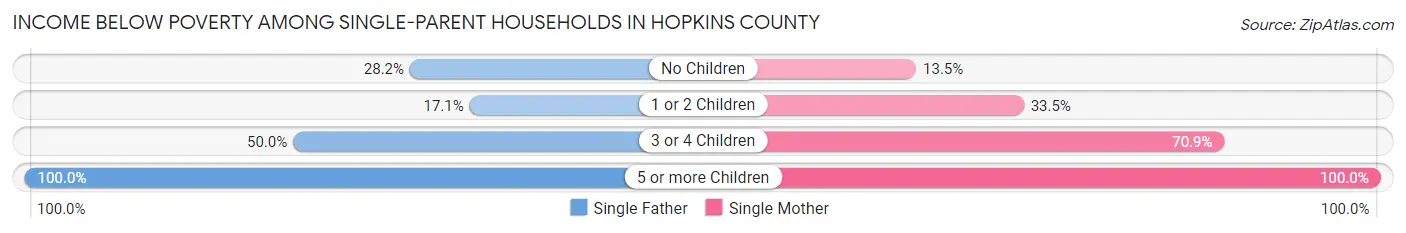
Income Below Poverty Among Single-Parent Households in Hopkins County
According to the poverty data in Hopkins County, 23.1% or 219 single-father households and 38.6% or 907 single-mother households are living below the poverty line. Among single-father households, those with 5 or more children have the highest poverty rate, with 15 households (100.0%) experiencing poverty. Likewise, among single-mother households, those with 5 or more children have the highest poverty rate, with 73 households (100.0%) falling below the poverty line.
| Children | Single Father | Single Mother |
| No Children | 96 (28.2%) | 82 (13.5%) |
| 1 or 2 Children | 98 (17.1%) | 389 (33.5%) |
| 3 or 4 Children | 10 (50.0%) | 363 (70.9%) |
| 5 or more Children | 15 (100.0%) | 73 (100.0%) |
| Total | 219 (23.1%) | 907 (38.6%) |
Income Below Poverty Among Married-Couple vs Single-Parent Households in Hopkins County
The poverty data for Hopkins County shows that 518 of the married-couple family households (5.8%) and 1,126 of the single-parent households (34.1%) are living below the poverty level. Within the married-couple family households, those with 5 or more children have the highest poverty rate, with 50 households (96.2%) falling below the poverty line. Among the single-parent households, those with 5 or more children have the highest poverty rate, with 88 household (100.0%) living below poverty.
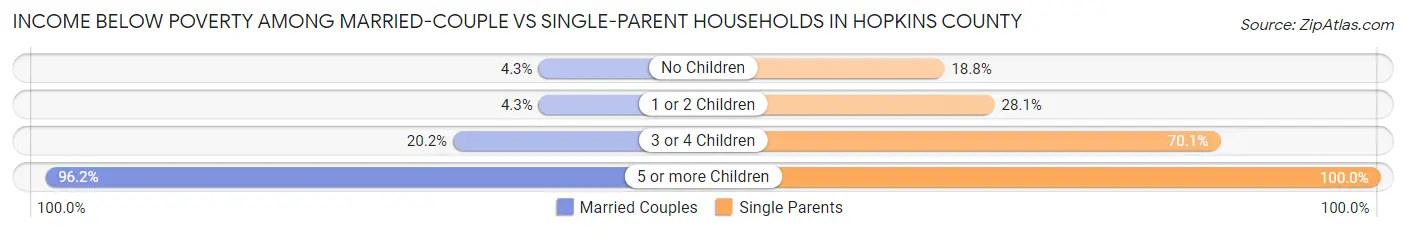
| Children | Married-Couple Families | Single-Parent Households |
| No Children | 245 (4.3%) | 178 (18.8%) |
| 1 or 2 Children | 112 (4.3%) | 487 (28.1%) |
| 3 or 4 Children | 111 (20.2%) | 373 (70.1%) |
| 5 or more Children | 50 (96.2%) | 88 (100.0%) |
| Total | 518 (5.8%) | 1,126 (34.1%) |
Employment Characteristics in Hopkins County
Employment by Class of Employer in Hopkins County
Among the 17,727 employed individuals in Hopkins County, private company employees (11,600 | 65.4%), not-for-profit organizations (1,889 | 10.7%), and local government employees (1,523 | 8.6%) make up the most common classes of employment.
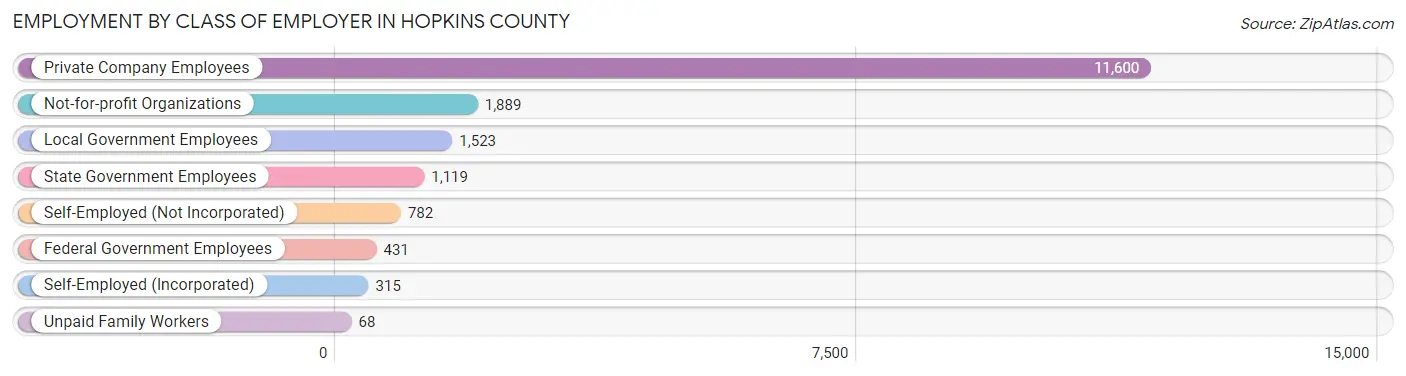
| Employer Class | # Employees | % Employees |
| Private Company Employees | 11,600 | 65.4% |
| Self-Employed (Incorporated) | 315 | 1.8% |
| Self-Employed (Not Incorporated) | 782 | 4.4% |
| Not-for-profit Organizations | 1,889 | 10.7% |
| Local Government Employees | 1,523 | 8.6% |
| State Government Employees | 1,119 | 6.3% |
| Federal Government Employees | 431 | 2.4% |
| Unpaid Family Workers | 68 | 0.4% |
| Total | 17,727 | 100.0% |
Employment Status by Age in Hopkins County
According to the labor force statistics for Hopkins County, out of the total population over 16 years of age (36,204), 54.2% or 19,623 individuals are in the labor force, with 7.7% or 1,511 of them unemployed. The age group with the highest labor force participation rate is 35 to 44 years, with 77.0% or 4,247 individuals in the labor force. Within the labor force, the 16 to 19 years age range has the highest percentage of unemployed individuals, with 21.1% or 212 of them being unemployed.
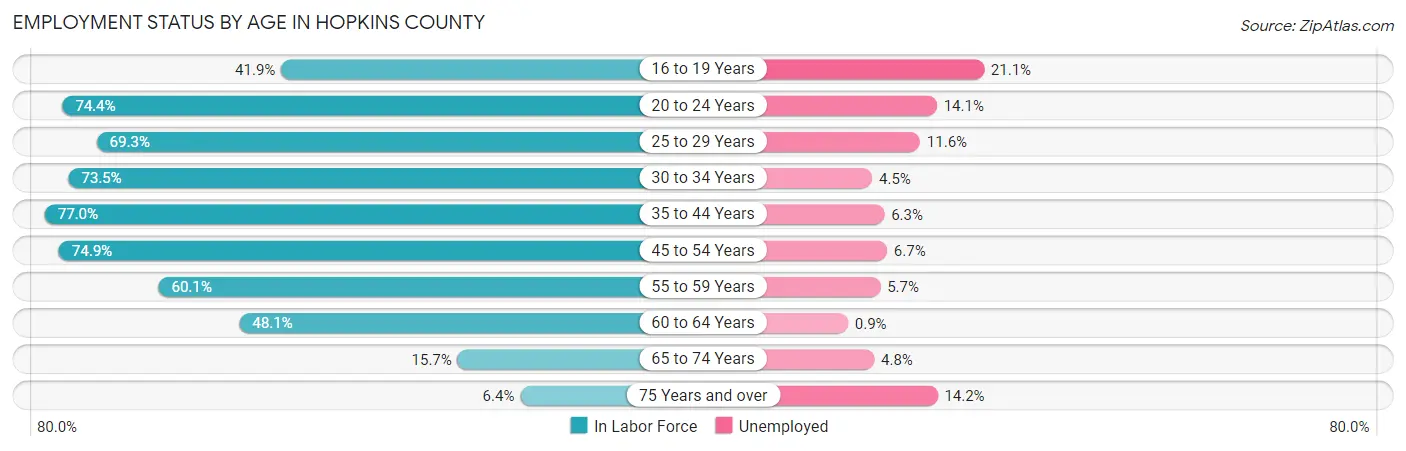
| Age Bracket | In Labor Force | Unemployed |
| 16 to 19 Years | 1,007 (41.9%) | 212 (21.1%) |
| 20 to 24 Years | 1,777 (74.4%) | 251 (14.1%) |
| 25 to 29 Years | 1,910 (69.3%) | 222 (11.6%) |
| 30 to 34 Years | 1,957 (73.5%) | 88 (4.5%) |
| 35 to 44 Years | 4,247 (77.0%) | 268 (6.3%) |
| 45 to 54 Years | 4,310 (74.9%) | 289 (6.7%) |
| 55 to 59 Years | 1,925 (60.1%) | 110 (5.7%) |
| 60 to 64 Years | 1,478 (48.1%) | 13 (0.9%) |
| 65 to 74 Years | 808 (15.7%) | 39 (4.8%) |
| 75 Years and over | 211 (6.4%) | 30 (14.2%) |
| Total | 19,623 (54.2%) | 1,511 (7.7%) |
Employment Status by Educational Attainment in Hopkins County
According to labor force statistics for Hopkins County, 68.9% of individuals (15,822) out of the total population between 25 and 64 years of age (22,964) are in the labor force, with 6.2% or 981 of them being unemployed. The group with the highest labor force participation rate are those with the educational attainment of bachelor's degree or higher, with 85.4% or 3,216 individuals in the labor force. Within the labor force, individuals with less than high school education have the highest percentage of unemployment, with 16.5% or 130 of them being unemployed.
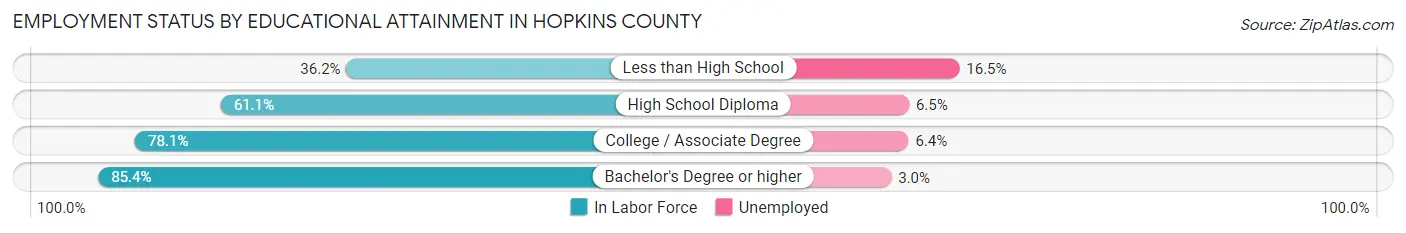
| Educational Attainment | In Labor Force | Unemployed |
| Less than High School | 787 (36.2%) | 359 (16.5%) |
| High School Diploma | 5,296 (61.1%) | 563 (6.5%) |
| College / Associate Degree | 6,527 (78.1%) | 535 (6.4%) |
| Bachelor's Degree or higher | 3,216 (85.4%) | 113 (3.0%) |
| Total | 15,822 (68.9%) | 1,424 (6.2%) |
Employment Occupations by Sex in Hopkins County
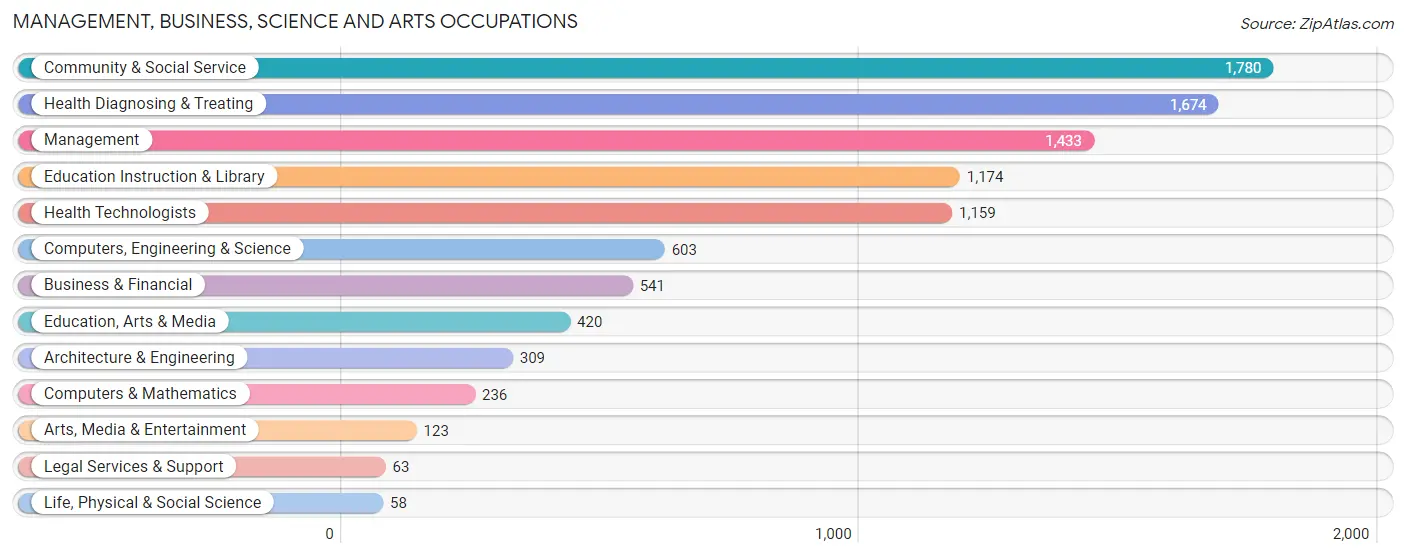
Management, Business, Science and Arts Occupations
The most common Management, Business, Science and Arts occupations in Hopkins County are Community & Social Service (1,780 | 9.8%), Health Diagnosing & Treating (1,674 | 9.3%), Management (1,433 | 7.9%), Education Instruction & Library (1,174 | 6.5%), and Health Technologists (1,159 | 6.4%).
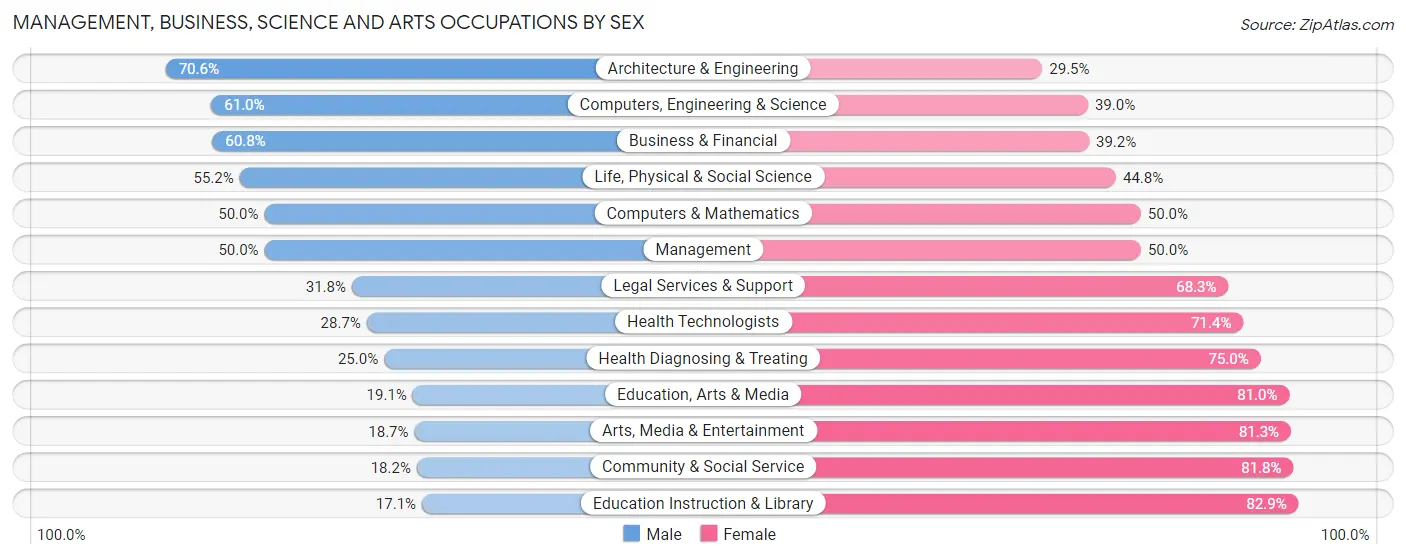
Management, Business, Science and Arts Occupations by Sex
Within the Management, Business, Science and Arts occupations in Hopkins County, the most male-oriented occupations are Architecture & Engineering (70.6%), Computers, Engineering & Science (61.0%), and Business & Financial (60.8%), while the most female-oriented occupations are Education Instruction & Library (82.9%), Community & Social Service (81.8%), and Arts, Media & Entertainment (81.3%).
| Occupation | Male | Female |
| Management | 716 (50.0%) | 717 (50.0%) |
| Business & Financial | 329 (60.8%) | 212 (39.2%) |
| Computers, Engineering & Science | 368 (61.0%) | 235 (39.0%) |
| Computers & Mathematics | 118 (50.0%) | 118 (50.0%) |
| Architecture & Engineering | 218 (70.6%) | 91 (29.4%) |
| Life, Physical & Social Science | 32 (55.2%) | 26 (44.8%) |
| Community & Social Service | 324 (18.2%) | 1,456 (81.8%) |
| Education, Arts & Media | 80 (19.1%) | 340 (80.9%) |
| Legal Services & Support | 20 (31.8%) | 43 (68.2%) |
| Education Instruction & Library | 201 (17.1%) | 973 (82.9%) |
| Arts, Media & Entertainment | 23 (18.7%) | 100 (81.3%) |
| Health Diagnosing & Treating | 419 (25.0%) | 1,255 (75.0%) |
| Health Technologists | 332 (28.6%) | 827 (71.4%) |
| Total (Category) | 2,156 (35.7%) | 3,875 (64.2%) |
| Total (Overall) | 9,516 (52.6%) | 8,571 (47.4%) |
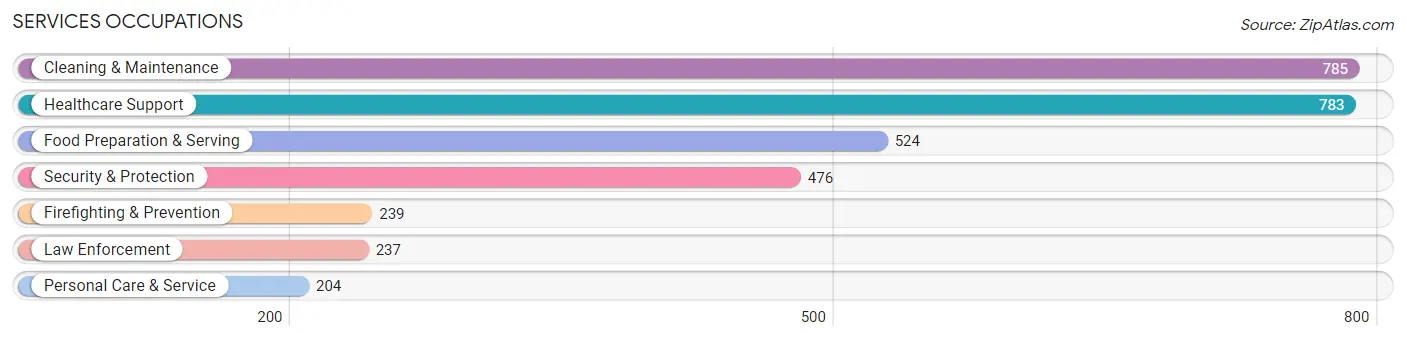
Services Occupations
The most common Services occupations in Hopkins County are Cleaning & Maintenance (785 | 4.3%), Healthcare Support (783 | 4.3%), Food Preparation & Serving (524 | 2.9%), Security & Protection (476 | 2.6%), and Firefighting & Prevention (239 | 1.3%).
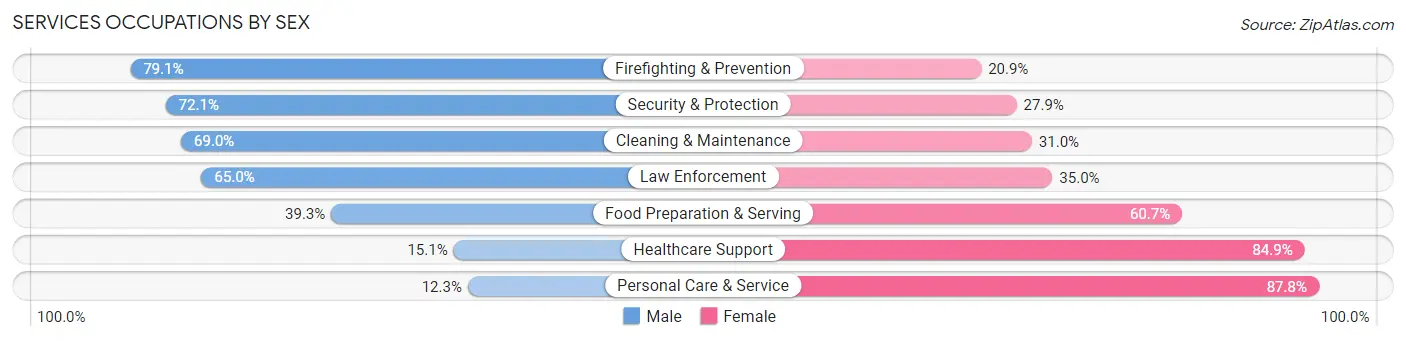
Services Occupations by Sex
Within the Services occupations in Hopkins County, the most male-oriented occupations are Firefighting & Prevention (79.1%), Security & Protection (72.1%), and Cleaning & Maintenance (69.0%), while the most female-oriented occupations are Personal Care & Service (87.7%), Healthcare Support (84.9%), and Food Preparation & Serving (60.7%).
| Occupation | Male | Female |
| Healthcare Support | 118 (15.1%) | 665 (84.9%) |
| Security & Protection | 343 (72.1%) | 133 (27.9%) |
| Firefighting & Prevention | 189 (79.1%) | 50 (20.9%) |
| Law Enforcement | 154 (65.0%) | 83 (35.0%) |
| Food Preparation & Serving | 206 (39.3%) | 318 (60.7%) |
| Cleaning & Maintenance | 542 (69.0%) | 243 (31.0%) |
| Personal Care & Service | 25 (12.2%) | 179 (87.7%) |
| Total (Category) | 1,234 (44.5%) | 1,538 (55.5%) |
| Total (Overall) | 9,516 (52.6%) | 8,571 (47.4%) |
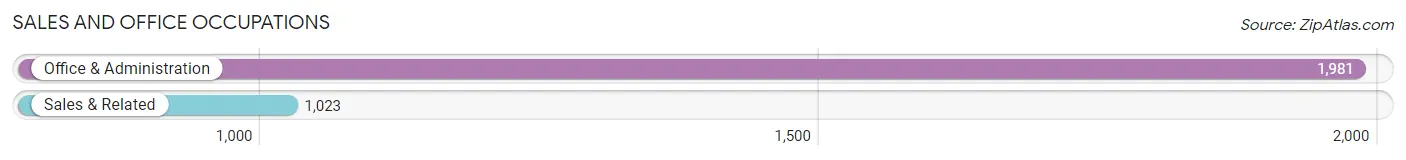
Sales and Office Occupations
The most common Sales and Office occupations in Hopkins County are Office & Administration (1,981 | 11.0%), and Sales & Related (1,023 | 5.7%).
Sales and Office Occupations by Sex
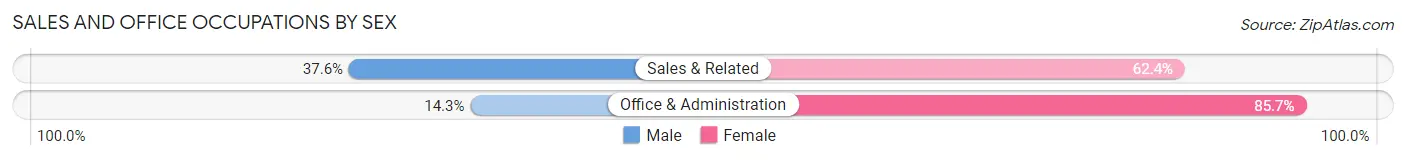
| Occupation | Male | Female |
| Sales & Related | 385 (37.6%) | 638 (62.4%) |
| Office & Administration | 283 (14.3%) | 1,698 (85.7%) |
| Total (Category) | 668 (22.2%) | 2,336 (77.8%) |
| Total (Overall) | 9,516 (52.6%) | 8,571 (47.4%) |
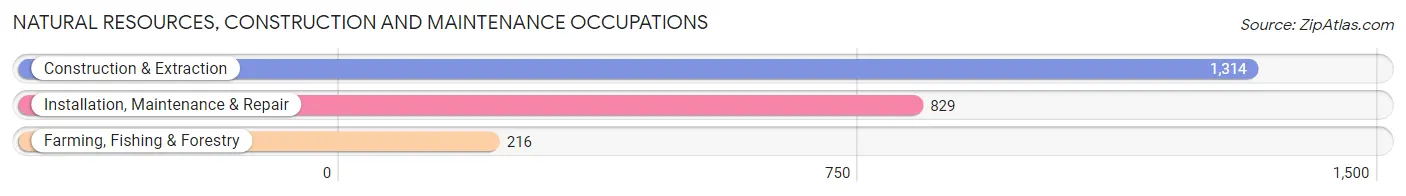
Natural Resources, Construction and Maintenance Occupations
The most common Natural Resources, Construction and Maintenance occupations in Hopkins County are Construction & Extraction (1,314 | 7.3%), Installation, Maintenance & Repair (829 | 4.6%), and Farming, Fishing & Forestry (216 | 1.2%).
Natural Resources, Construction and Maintenance Occupations by Sex
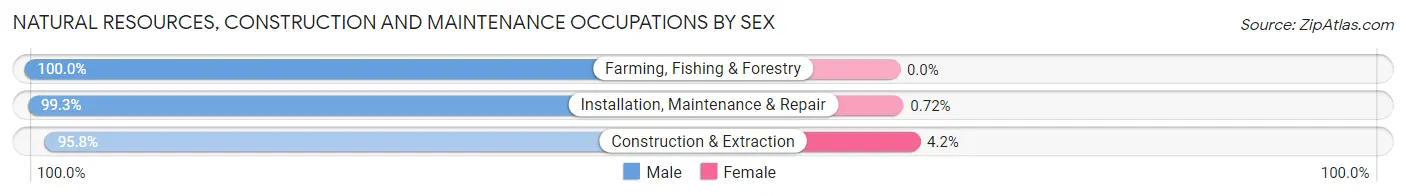
| Occupation | Male | Female |
| Farming, Fishing & Forestry | 216 (100.0%) | 0 (0.0%) |
| Construction & Extraction | 1,259 (95.8%) | 55 (4.2%) |
| Installation, Maintenance & Repair | 823 (99.3%) | 6 (0.7%) |
| Total (Category) | 2,298 (97.4%) | 61 (2.6%) |
| Total (Overall) | 9,516 (52.6%) | 8,571 (47.4%) |
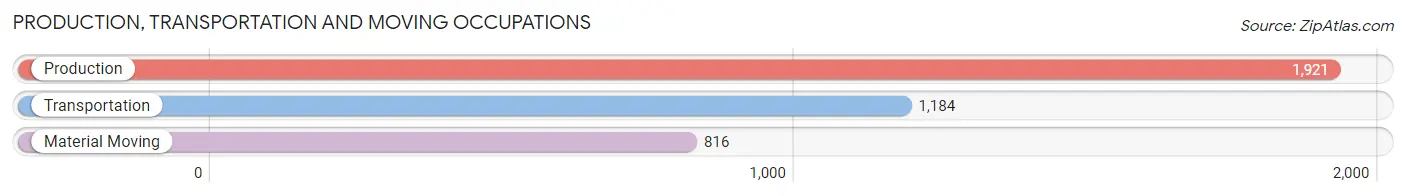
Production, Transportation and Moving Occupations
The most common Production, Transportation and Moving occupations in Hopkins County are Production (1,921 | 10.6%), Transportation (1,184 | 6.6%), and Material Moving (816 | 4.5%).
Production, Transportation and Moving Occupations by Sex
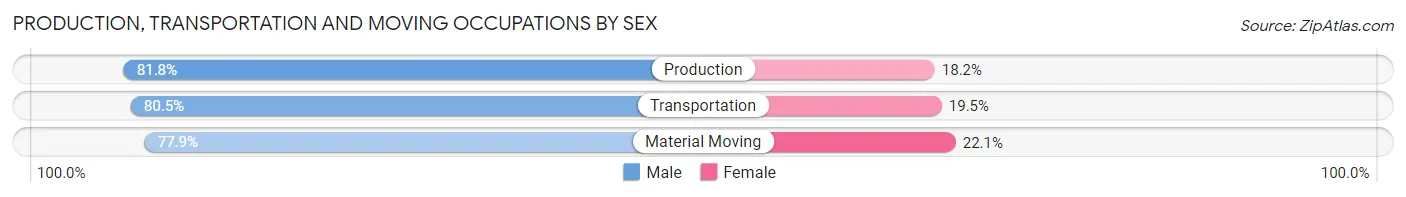
| Occupation | Male | Female |
| Production | 1,571 (81.8%) | 350 (18.2%) |
| Transportation | 953 (80.5%) | 231 (19.5%) |
| Material Moving | 636 (77.9%) | 180 (22.1%) |
| Total (Category) | 3,160 (80.6%) | 761 (19.4%) |
| Total (Overall) | 9,516 (52.6%) | 8,571 (47.4%) |
Employment Industries by Sex in Hopkins County
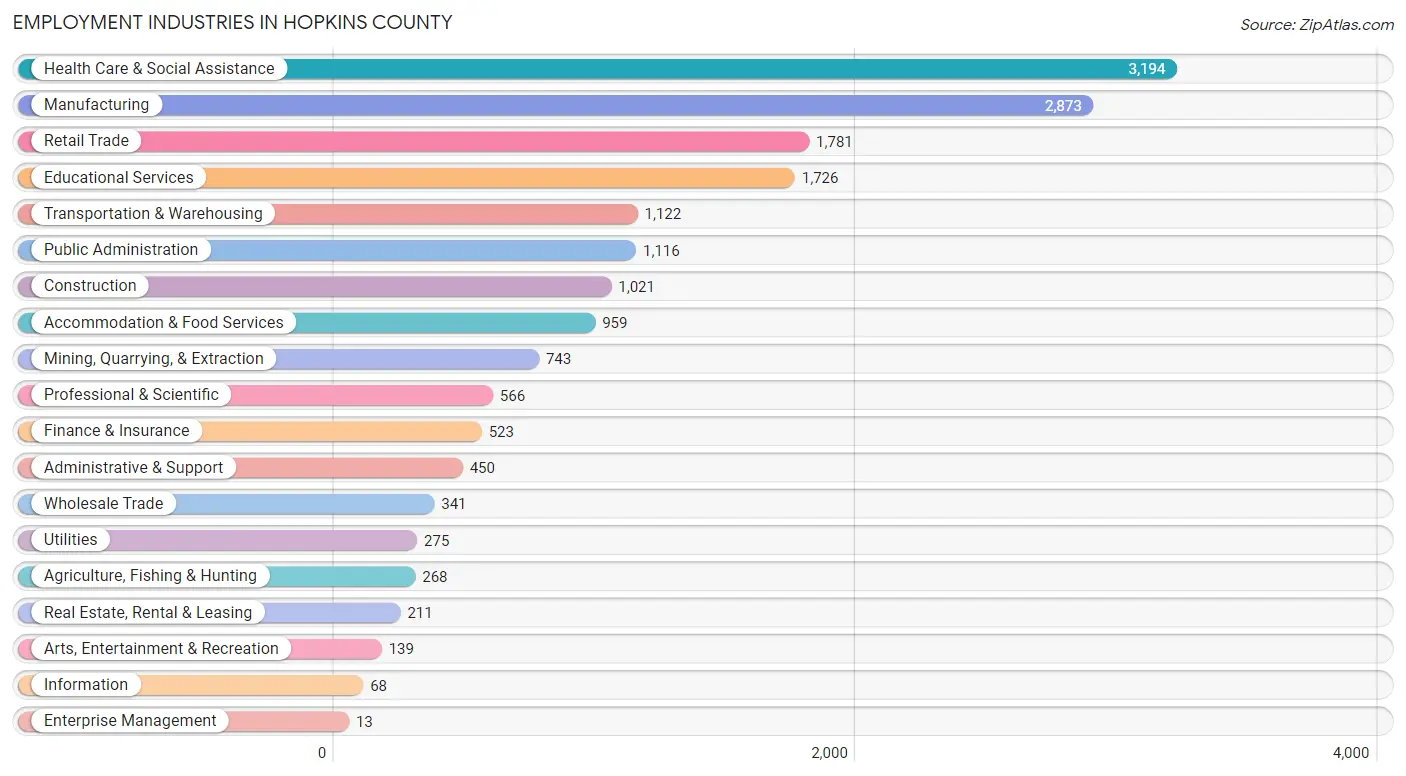
Employment Industries in Hopkins County
The major employment industries in Hopkins County include Health Care & Social Assistance (3,194 | 17.7%), Manufacturing (2,873 | 15.9%), Retail Trade (1,781 | 9.9%), Educational Services (1,726 | 9.5%), and Transportation & Warehousing (1,122 | 6.2%).
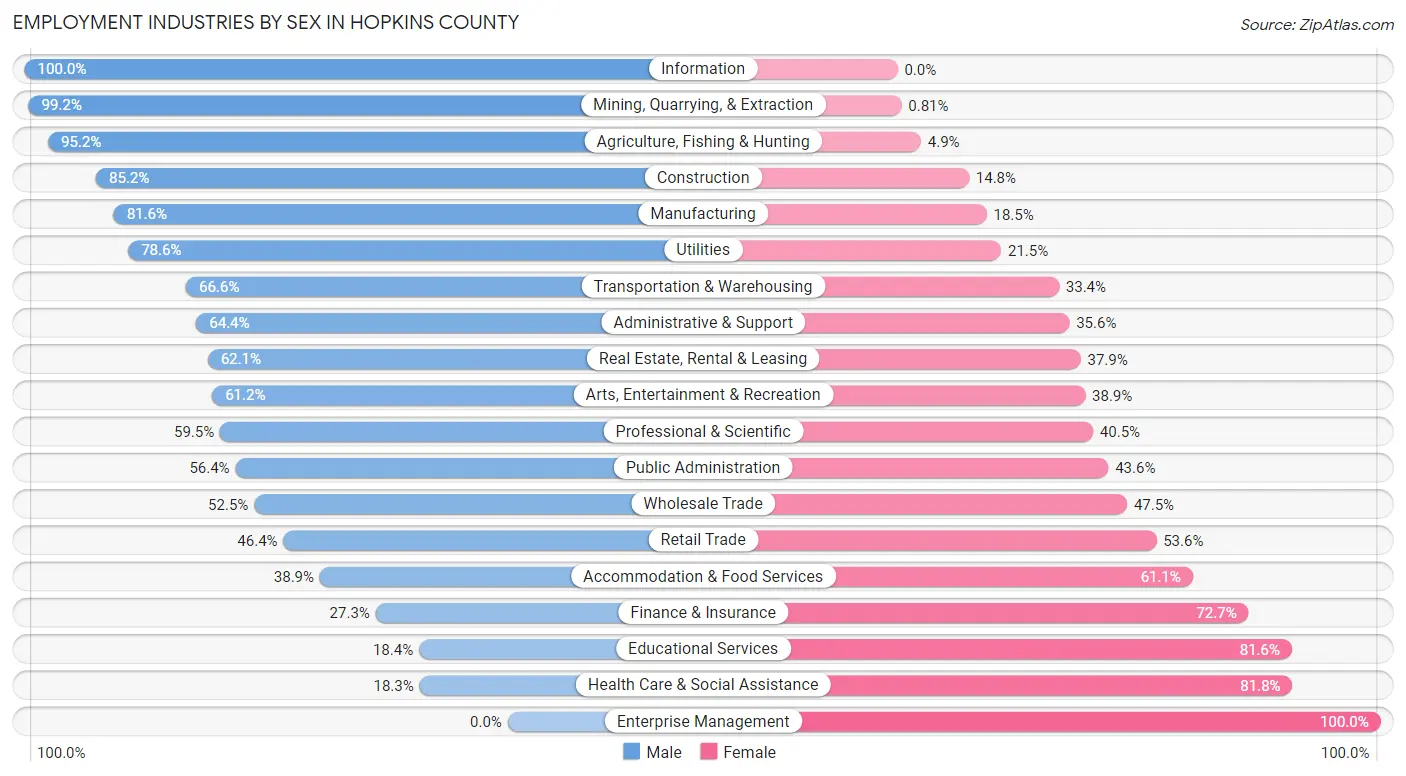
Employment Industries by Sex in Hopkins County
The Hopkins County industries that see more men than women are Information (100.0%), Mining, Quarrying, & Extraction (99.2%), and Agriculture, Fishing & Hunting (95.2%), whereas the industries that tend to have a higher number of women are Enterprise Management (100.0%), Health Care & Social Assistance (81.8%), and Educational Services (81.6%).
| Industry | Male | Female |
| Agriculture, Fishing & Hunting | 255 (95.2%) | 13 (4.9%) |
| Mining, Quarrying, & Extraction | 737 (99.2%) | 6 (0.8%) |
| Construction | 870 (85.2%) | 151 (14.8%) |
| Manufacturing | 2,343 (81.6%) | 530 (18.4%) |
| Wholesale Trade | 179 (52.5%) | 162 (47.5%) |
| Retail Trade | 827 (46.4%) | 954 (53.6%) |
| Transportation & Warehousing | 747 (66.6%) | 375 (33.4%) |
| Utilities | 216 (78.5%) | 59 (21.4%) |
| Information | 68 (100.0%) | 0 (0.0%) |
| Finance & Insurance | 143 (27.3%) | 380 (72.7%) |
| Real Estate, Rental & Leasing | 131 (62.1%) | 80 (37.9%) |
| Professional & Scientific | 337 (59.5%) | 229 (40.5%) |
| Enterprise Management | 0 (0.0%) | 13 (100.0%) |
| Administrative & Support | 290 (64.4%) | 160 (35.6%) |
| Educational Services | 317 (18.4%) | 1,409 (81.6%) |
| Health Care & Social Assistance | 583 (18.2%) | 2,611 (81.8%) |
| Arts, Entertainment & Recreation | 85 (61.2%) | 54 (38.9%) |
| Accommodation & Food Services | 373 (38.9%) | 586 (61.1%) |
| Public Administration | 629 (56.4%) | 487 (43.6%) |
| Total | 9,516 (52.6%) | 8,571 (47.4%) |
Education in Hopkins County
School Enrollment in Hopkins County
The most common levels of schooling among the 9,613 students in Hopkins County are high school (2,409 | 25.1%), middle school (2,329 | 24.2%), and elementary school (2,225 | 23.2%).

| School Level | # Students | % Students |
| Nursery / Preschool | 448 | 4.7% |
| Kindergarten | 475 | 4.9% |
| Elementary School | 2,225 | 23.2% |
| Middle School | 2,329 | 24.2% |
| High School | 2,409 | 25.1% |
| College / Undergraduate | 1,268 | 13.2% |
| Graduate / Professional | 459 | 4.8% |
| Total | 9,613 | 100.0% |
School Enrollment by Age by Funding Source in Hopkins County
Out of a total of 9,613 students who are enrolled in schools in Hopkins County, 1,105 (11.5%) attend a private institution, while the remaining 8,508 (88.5%) are enrolled in public schools. The age group of 3 to 4 year olds has the highest likelihood of being enrolled in private schools, with 116 (35.7% in the age bracket) enrolled. Conversely, the age group of 15 to 17 year olds has the lowest likelihood of being enrolled in a private school, with 1,645 (92.8% in the age bracket) attending a public institution.
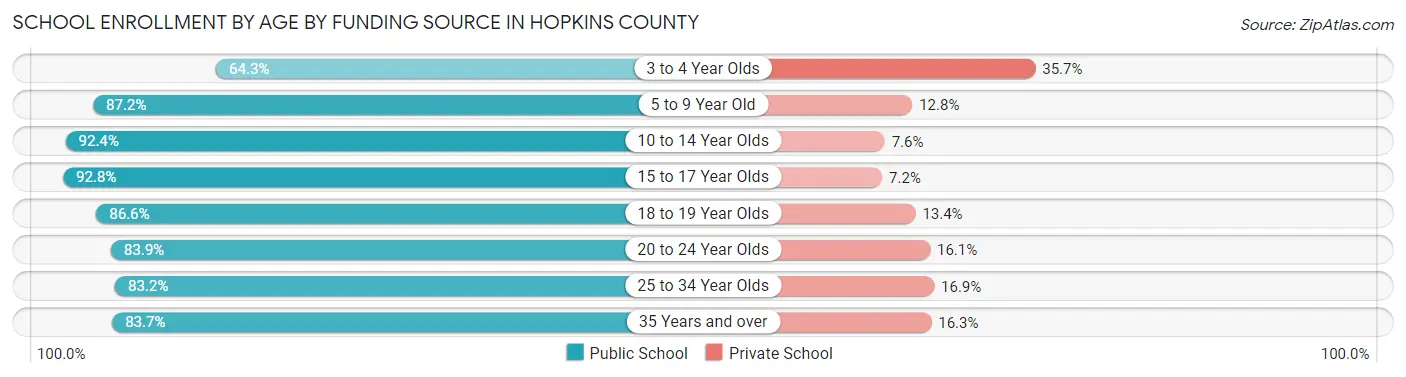
| Age Bracket | Public School | Private School |
| 3 to 4 Year Olds | 209 (64.3%) | 116 (35.7%) |
| 5 to 9 Year Old | 2,261 (87.2%) | 331 (12.8%) |
| 10 to 14 Year Olds | 2,694 (92.4%) | 223 (7.6%) |
| 15 to 17 Year Olds | 1,645 (92.8%) | 127 (7.2%) |
| 18 to 19 Year Olds | 499 (86.6%) | 77 (13.4%) |
| 20 to 24 Year Olds | 308 (83.9%) | 59 (16.1%) |
| 25 to 34 Year Olds | 370 (83.2%) | 75 (16.9%) |
| 35 Years and over | 518 (83.7%) | 101 (16.3%) |
| Total | 8,508 (88.5%) | 1,105 (11.5%) |
Educational Attainment by Field of Study in Hopkins County
Education (1,236 | 24.0%), science & technology (740 | 14.4%), business (677 | 13.1%), bio, nature & agricultural (348 | 6.8%), and liberal arts & history (332 | 6.4%) are the most common fields of study among 5,153 individuals in Hopkins County who have obtained a bachelor's degree or higher.
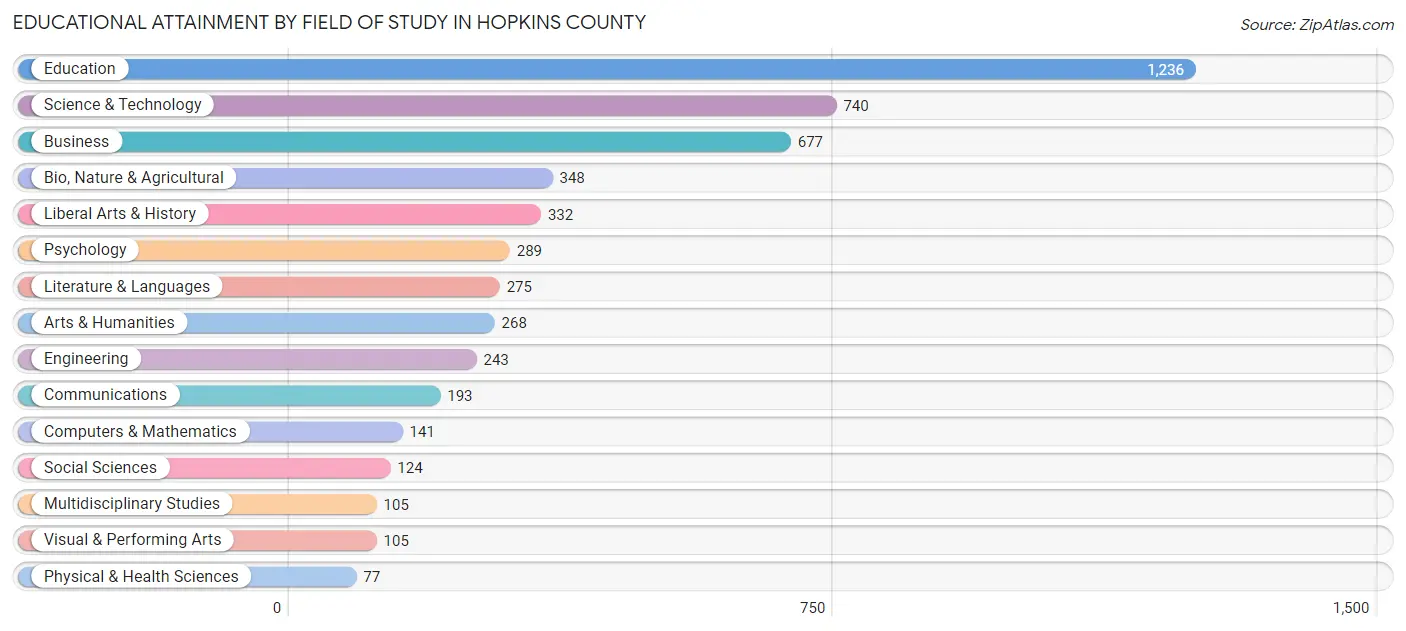
| Field of Study | # Graduates | % Graduates |
| Computers & Mathematics | 141 | 2.7% |
| Bio, Nature & Agricultural | 348 | 6.8% |
| Physical & Health Sciences | 77 | 1.5% |
| Psychology | 289 | 5.6% |
| Social Sciences | 124 | 2.4% |
| Engineering | 243 | 4.7% |
| Multidisciplinary Studies | 105 | 2.0% |
| Science & Technology | 740 | 14.4% |
| Business | 677 | 13.1% |
| Education | 1,236 | 24.0% |
| Literature & Languages | 275 | 5.3% |
| Liberal Arts & History | 332 | 6.4% |
| Visual & Performing Arts | 105 | 2.0% |
| Communications | 193 | 3.7% |
| Arts & Humanities | 268 | 5.2% |
| Total | 5,153 | 100.0% |
Transportation & Commute in Hopkins County
Vehicle Availability by Sex in Hopkins County
The most prevalent vehicle ownership categories in Hopkins County are males with 2 vehicles (3,936, accounting for 41.9%) and females with 2 vehicles (3,722, making up 47.2%).
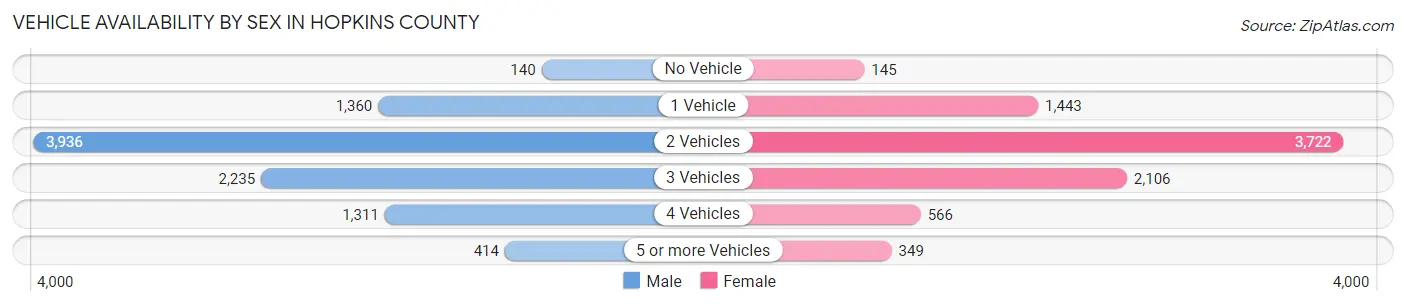
| Vehicles Available | Male | Female |
| No Vehicle | 140 (1.5%) | 145 (1.7%) |
| 1 Vehicle | 1,360 (14.5%) | 1,443 (17.3%) |
| 2 Vehicles | 3,936 (41.9%) | 3,722 (44.7%) |
| 3 Vehicles | 2,235 (23.8%) | 2,106 (25.3%) |
| 4 Vehicles | 1,311 (14.0%) | 566 (6.8%) |
| 5 or more Vehicles | 414 (4.4%) | 349 (4.2%) |
| Total | 9,396 (100.0%) | 8,331 (100.0%) |
Commute Time in Hopkins County
The most frequently occuring commute durations in Hopkins County are 10 to 14 minutes (3,906 commuters, 22.8%), 15 to 19 minutes (2,772 commuters, 16.2%), and 5 to 9 minutes (2,503 commuters, 14.6%).
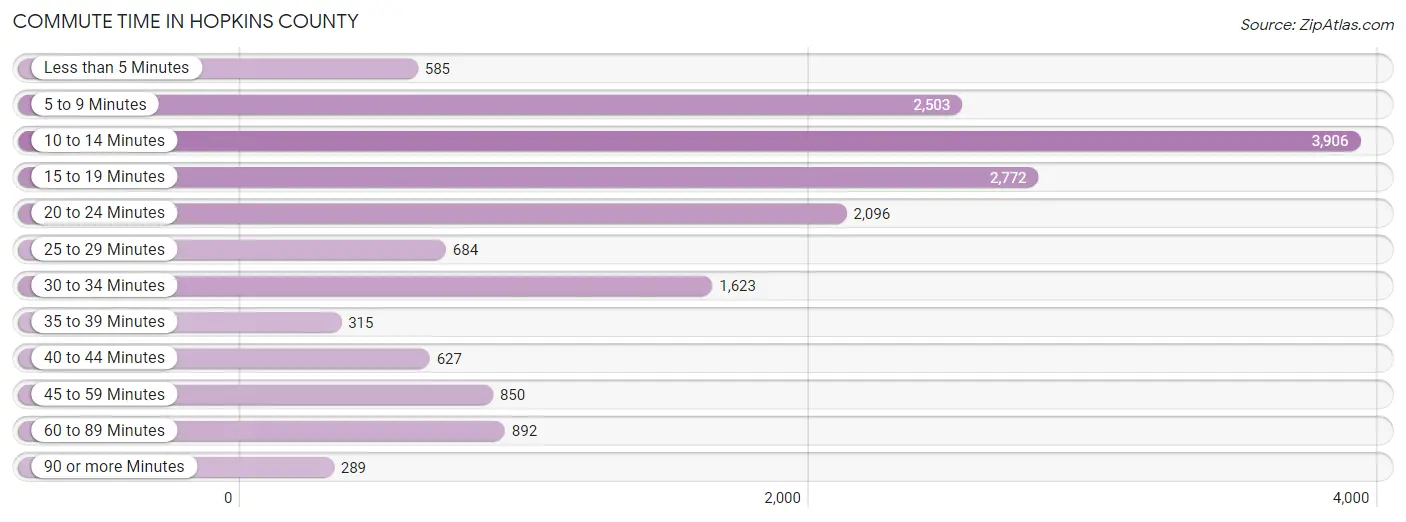
| Commute Time | # Commuters | % Commuters |
| Less than 5 Minutes | 585 | 3.4% |
| 5 to 9 Minutes | 2,503 | 14.6% |
| 10 to 14 Minutes | 3,906 | 22.8% |
| 15 to 19 Minutes | 2,772 | 16.2% |
| 20 to 24 Minutes | 2,096 | 12.2% |
| 25 to 29 Minutes | 684 | 4.0% |
| 30 to 34 Minutes | 1,623 | 9.5% |
| 35 to 39 Minutes | 315 | 1.8% |
| 40 to 44 Minutes | 627 | 3.7% |
| 45 to 59 Minutes | 850 | 5.0% |
| 60 to 89 Minutes | 892 | 5.2% |
| 90 or more Minutes | 289 | 1.7% |
Commute Time by Sex in Hopkins County
The most common commute times in Hopkins County are 10 to 14 minutes (1,944 commuters, 21.4%) for males and 10 to 14 minutes (1,962 commuters, 24.4%) for females.
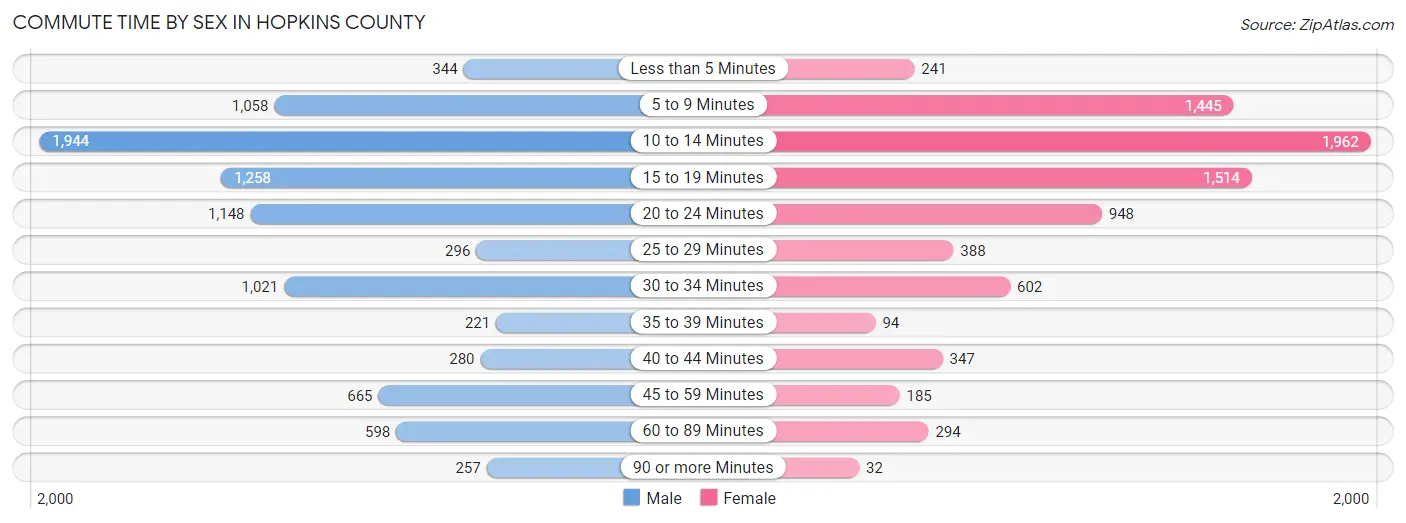
| Commute Time | Male | Female |
| Less than 5 Minutes | 344 (3.8%) | 241 (3.0%) |
| 5 to 9 Minutes | 1,058 (11.6%) | 1,445 (17.9%) |
| 10 to 14 Minutes | 1,944 (21.4%) | 1,962 (24.4%) |
| 15 to 19 Minutes | 1,258 (13.8%) | 1,514 (18.8%) |
| 20 to 24 Minutes | 1,148 (12.6%) | 948 (11.8%) |
| 25 to 29 Minutes | 296 (3.3%) | 388 (4.8%) |
| 30 to 34 Minutes | 1,021 (11.2%) | 602 (7.5%) |
| 35 to 39 Minutes | 221 (2.4%) | 94 (1.2%) |
| 40 to 44 Minutes | 280 (3.1%) | 347 (4.3%) |
| 45 to 59 Minutes | 665 (7.3%) | 185 (2.3%) |
| 60 to 89 Minutes | 598 (6.6%) | 294 (3.6%) |
| 90 or more Minutes | 257 (2.8%) | 32 (0.4%) |
Time of Departure to Work by Sex in Hopkins County
The most frequent times of departure to work in Hopkins County are 12:00 AM to 4:59 AM (1,333, 14.7%) for males and 7:30 AM to 7:59 AM (1,305, 16.2%) for females.
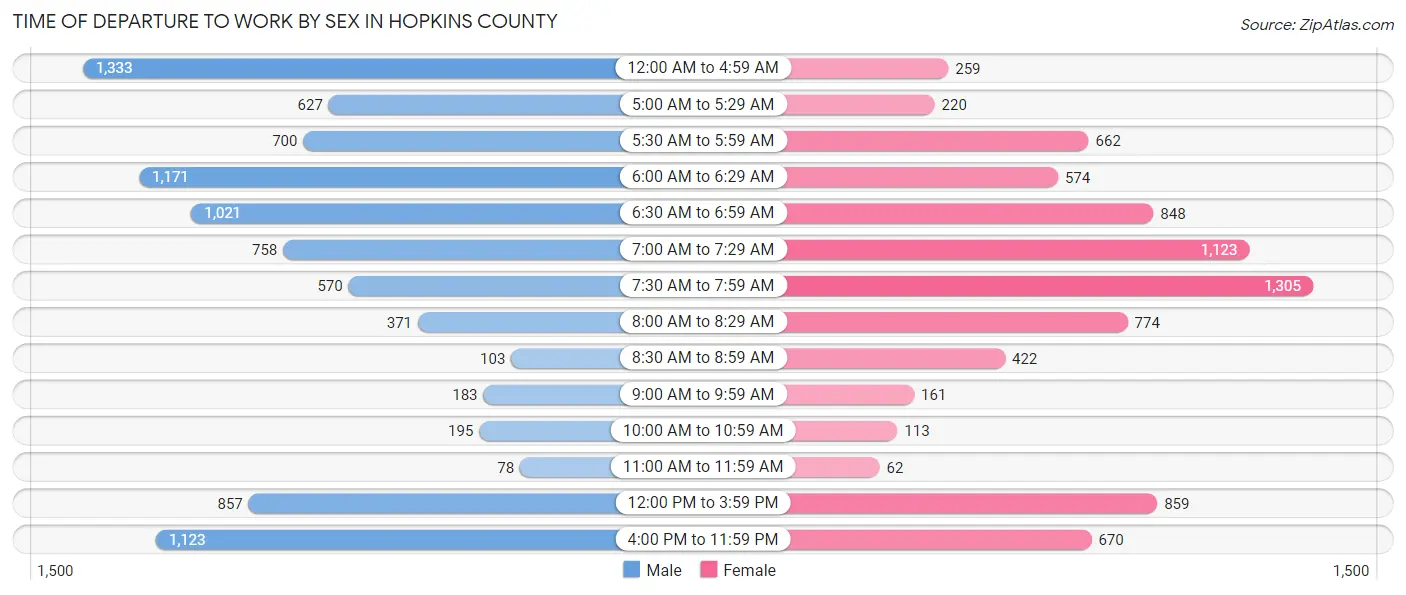
| Time of Departure | Male | Female |
| 12:00 AM to 4:59 AM | 1,333 (14.7%) | 259 (3.2%) |
| 5:00 AM to 5:29 AM | 627 (6.9%) | 220 (2.7%) |
| 5:30 AM to 5:59 AM | 700 (7.7%) | 662 (8.2%) |
| 6:00 AM to 6:29 AM | 1,171 (12.9%) | 574 (7.1%) |
| 6:30 AM to 6:59 AM | 1,021 (11.2%) | 848 (10.5%) |
| 7:00 AM to 7:29 AM | 758 (8.3%) | 1,123 (14.0%) |
| 7:30 AM to 7:59 AM | 570 (6.3%) | 1,305 (16.2%) |
| 8:00 AM to 8:29 AM | 371 (4.1%) | 774 (9.6%) |
| 8:30 AM to 8:59 AM | 103 (1.1%) | 422 (5.2%) |
| 9:00 AM to 9:59 AM | 183 (2.0%) | 161 (2.0%) |
| 10:00 AM to 10:59 AM | 195 (2.1%) | 113 (1.4%) |
| 11:00 AM to 11:59 AM | 78 (0.9%) | 62 (0.8%) |
| 12:00 PM to 3:59 PM | 857 (9.4%) | 859 (10.7%) |
| 4:00 PM to 11:59 PM | 1,123 (12.3%) | 670 (8.3%) |
| Total | 9,090 (100.0%) | 8,052 (100.0%) |
Housing Occupancy in Hopkins County
Occupancy by Ownership in Hopkins County
Of the total 18,345 dwellings in Hopkins County, owner-occupied units account for 12,829 (69.9%), while renter-occupied units make up 5,516 (30.1%).
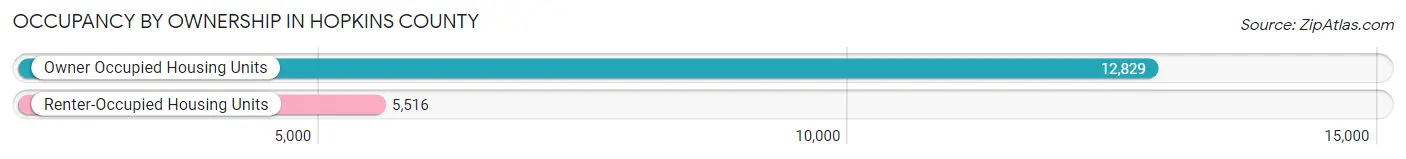
| Occupancy | # Housing Units | % Housing Units |
| Owner Occupied Housing Units | 12,829 | 69.9% |
| Renter-Occupied Housing Units | 5,516 | 30.1% |
| Total Occupied Housing Units | 18,345 | 100.0% |
Occupancy by Household Size in Hopkins County
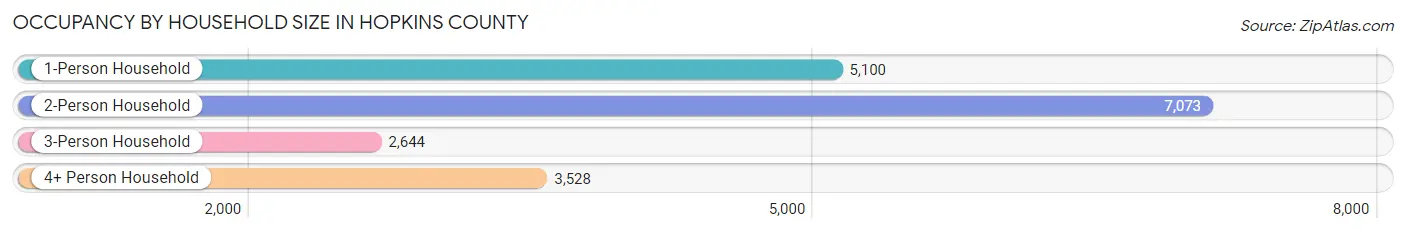
| Household Size | # Housing Units | % Housing Units |
| 1-Person Household | 5,100 | 27.8% |
| 2-Person Household | 7,073 | 38.6% |
| 3-Person Household | 2,644 | 14.4% |
| 4+ Person Household | 3,528 | 19.2% |
| Total Housing Units | 18,345 | 100.0% |
Occupancy by Ownership by Household Size in Hopkins County
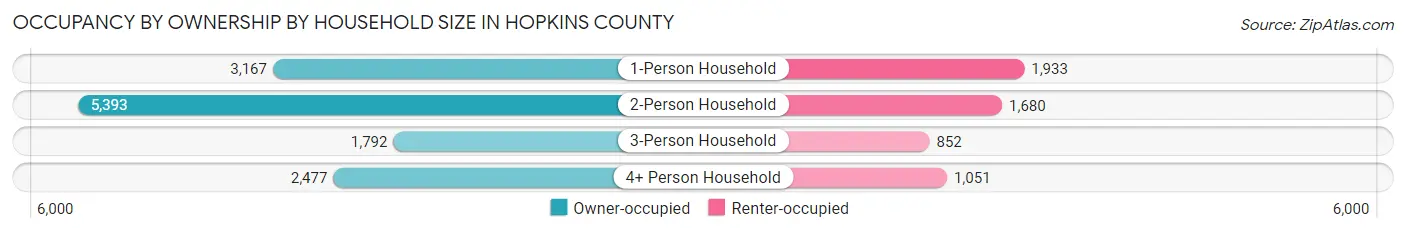
| Household Size | Owner-occupied | Renter-occupied |
| 1-Person Household | 3,167 (62.1%) | 1,933 (37.9%) |
| 2-Person Household | 5,393 (76.2%) | 1,680 (23.7%) |
| 3-Person Household | 1,792 (67.8%) | 852 (32.2%) |
| 4+ Person Household | 2,477 (70.2%) | 1,051 (29.8%) |
| Total Housing Units | 12,829 (69.9%) | 5,516 (30.1%) |
Occupancy by Educational Attainment in Hopkins County
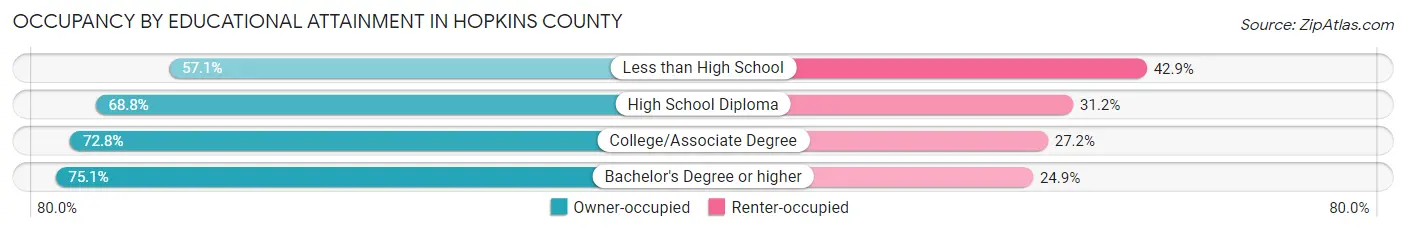
| Household Size | Owner-occupied | Renter-occupied |
| Less than High School | 1,119 (57.1%) | 841 (42.9%) |
| High School Diploma | 4,844 (68.8%) | 2,201 (31.2%) |
| College/Associate Degree | 4,670 (72.8%) | 1,747 (27.2%) |
| Bachelor's Degree or higher | 2,196 (75.1%) | 727 (24.9%) |
Occupancy by Age of Householder in Hopkins County
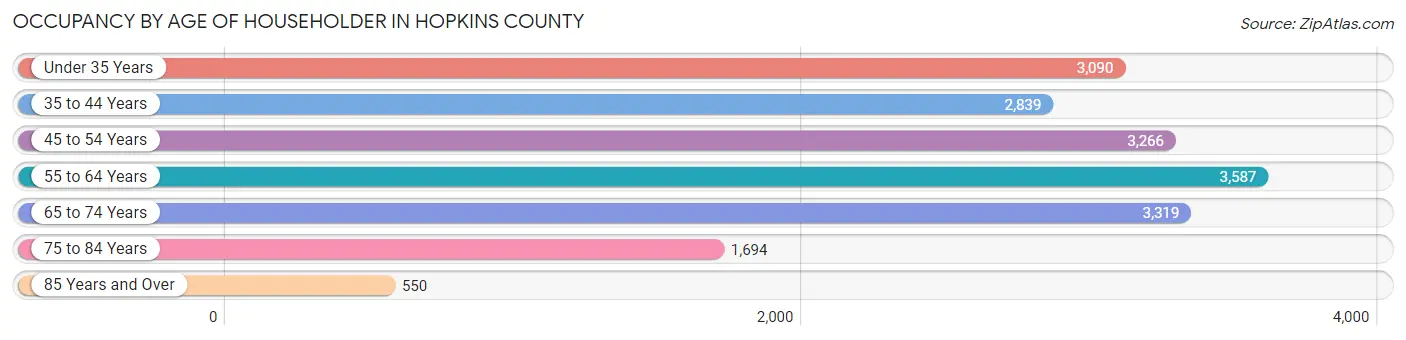
| Age Bracket | # Households | % Households |
| Under 35 Years | 3,090 | 16.8% |
| 35 to 44 Years | 2,839 | 15.5% |
| 45 to 54 Years | 3,266 | 17.8% |
| 55 to 64 Years | 3,587 | 19.6% |
| 65 to 74 Years | 3,319 | 18.1% |
| 75 to 84 Years | 1,694 | 9.2% |
| 85 Years and Over | 550 | 3.0% |
| Total | 18,345 | 100.0% |
Housing Finances in Hopkins County
Median Income by Occupancy in Hopkins County
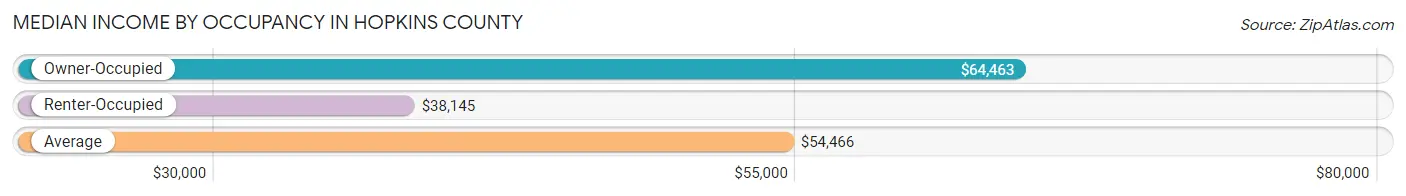
| Occupancy Type | # Households | Median Income |
| Owner-Occupied | 12,829 (69.9%) | $64,463 |
| Renter-Occupied | 5,516 (30.1%) | $38,145 |
| Average | 18,345 (100.0%) | $54,466 |
Occupancy by Householder Income Bracket in Hopkins County
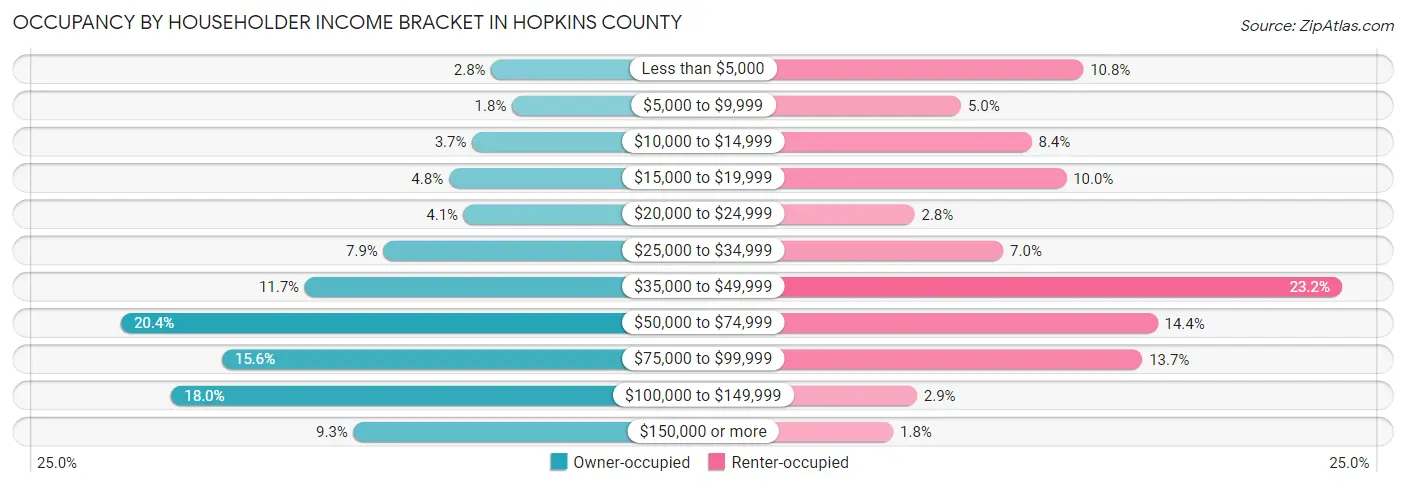
| Income Bracket | Owner-occupied | Renter-occupied |
| Less than $5,000 | 355 (2.8%) | 598 (10.8%) |
| $5,000 to $9,999 | 228 (1.8%) | 277 (5.0%) |
| $10,000 to $14,999 | 472 (3.7%) | 462 (8.4%) |
| $15,000 to $19,999 | 615 (4.8%) | 553 (10.0%) |
| $20,000 to $24,999 | 523 (4.1%) | 155 (2.8%) |
| $25,000 to $34,999 | 1,013 (7.9%) | 388 (7.0%) |
| $35,000 to $49,999 | 1,494 (11.7%) | 1,277 (23.2%) |
| $50,000 to $74,999 | 2,619 (20.4%) | 793 (14.4%) |
| $75,000 to $99,999 | 2,002 (15.6%) | 753 (13.7%) |
| $100,000 to $149,999 | 2,311 (18.0%) | 161 (2.9%) |
| $150,000 or more | 1,197 (9.3%) | 99 (1.8%) |
| Total | 12,829 (100.0%) | 5,516 (100.0%) |
Monthly Housing Cost Tiers in Hopkins County
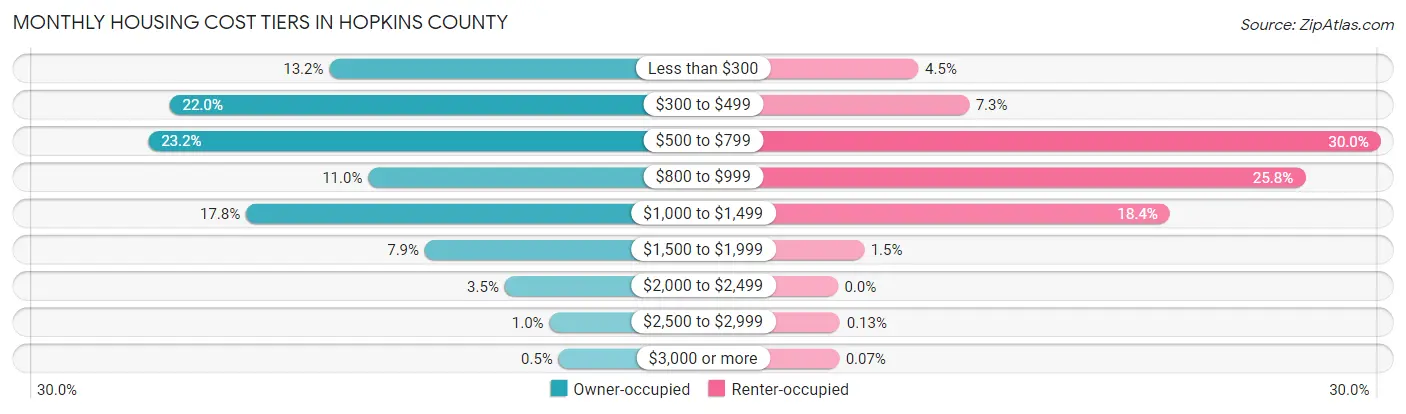
| Monthly Cost | Owner-occupied | Renter-occupied |
| Less than $300 | 1,690 (13.2%) | 246 (4.5%) |
| $300 to $499 | 2,821 (22.0%) | 400 (7.2%) |
| $500 to $799 | 2,972 (23.2%) | 1,655 (30.0%) |
| $800 to $999 | 1,414 (11.0%) | 1,425 (25.8%) |
| $1,000 to $1,499 | 2,280 (17.8%) | 1,012 (18.3%) |
| $1,500 to $1,999 | 1,012 (7.9%) | 80 (1.5%) |
| $2,000 to $2,499 | 446 (3.5%) | 0 (0.0%) |
| $2,500 to $2,999 | 130 (1.0%) | 7 (0.1%) |
| $3,000 or more | 64 (0.5%) | 4 (0.1%) |
| Total | 12,829 (100.0%) | 5,516 (100.0%) |
Physical Housing Characteristics in Hopkins County
Housing Structures in Hopkins County
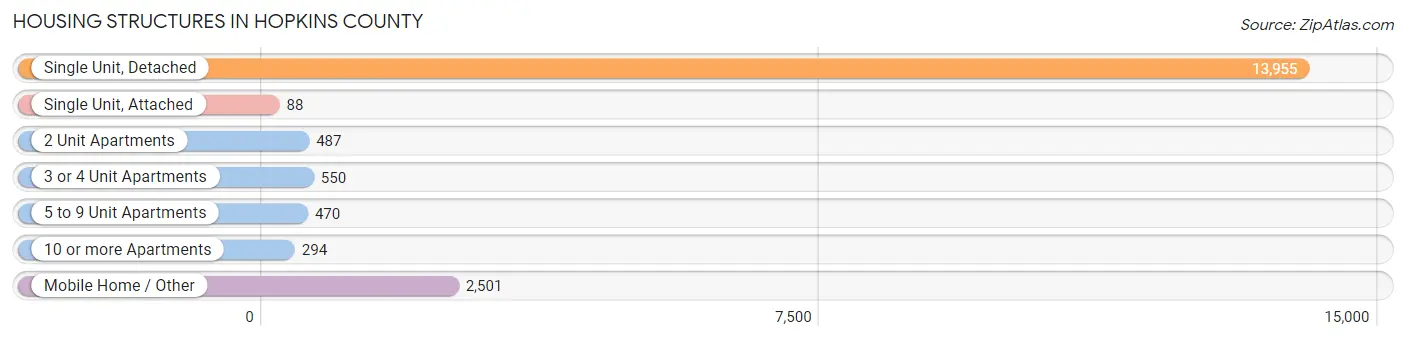
| Structure Type | # Housing Units | % Housing Units |
| Single Unit, Detached | 13,955 | 76.1% |
| Single Unit, Attached | 88 | 0.5% |
| 2 Unit Apartments | 487 | 2.6% |
| 3 or 4 Unit Apartments | 550 | 3.0% |
| 5 to 9 Unit Apartments | 470 | 2.6% |
| 10 or more Apartments | 294 | 1.6% |
| Mobile Home / Other | 2,501 | 13.6% |
| Total | 18,345 | 100.0% |
Housing Structures by Occupancy in Hopkins County
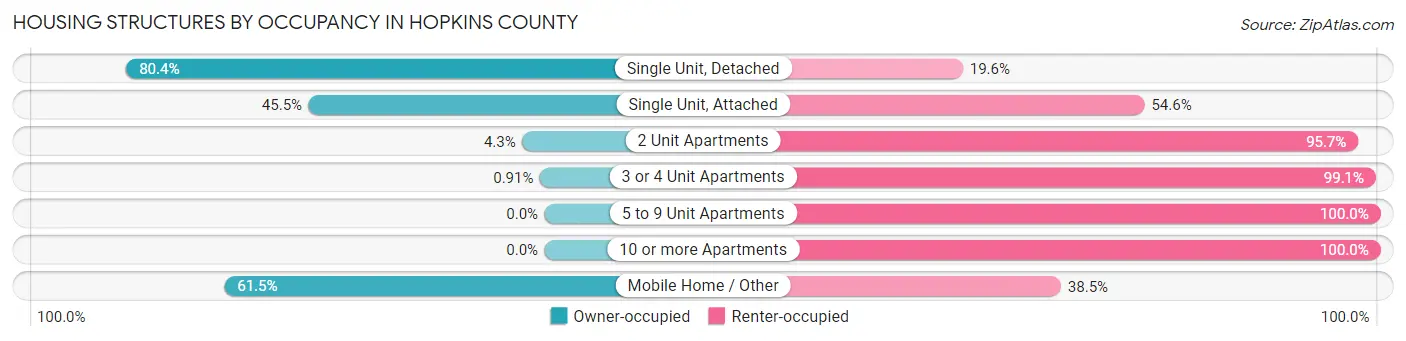
| Structure Type | Owner-occupied | Renter-occupied |
| Single Unit, Detached | 11,224 (80.4%) | 2,731 (19.6%) |
| Single Unit, Attached | 40 (45.5%) | 48 (54.5%) |
| 2 Unit Apartments | 21 (4.3%) | 466 (95.7%) |
| 3 or 4 Unit Apartments | 5 (0.9%) | 545 (99.1%) |
| 5 to 9 Unit Apartments | 0 (0.0%) | 470 (100.0%) |
| 10 or more Apartments | 0 (0.0%) | 294 (100.0%) |
| Mobile Home / Other | 1,539 (61.5%) | 962 (38.5%) |
| Total | 12,829 (69.9%) | 5,516 (30.1%) |
Housing Structures by Number of Rooms in Hopkins County
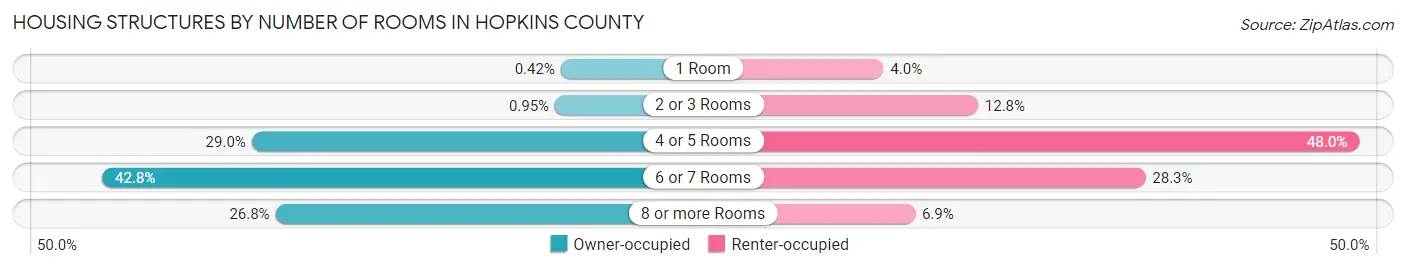
| Number of Rooms | Owner-occupied | Renter-occupied |
| 1 Room | 54 (0.4%) | 222 (4.0%) |
| 2 or 3 Rooms | 122 (0.9%) | 704 (12.8%) |
| 4 or 5 Rooms | 3,720 (29.0%) | 2,649 (48.0%) |
| 6 or 7 Rooms | 5,495 (42.8%) | 1,558 (28.2%) |
| 8 or more Rooms | 3,438 (26.8%) | 383 (6.9%) |
| Total | 12,829 (100.0%) | 5,516 (100.0%) |
Housing Structure by Heating Type in Hopkins County
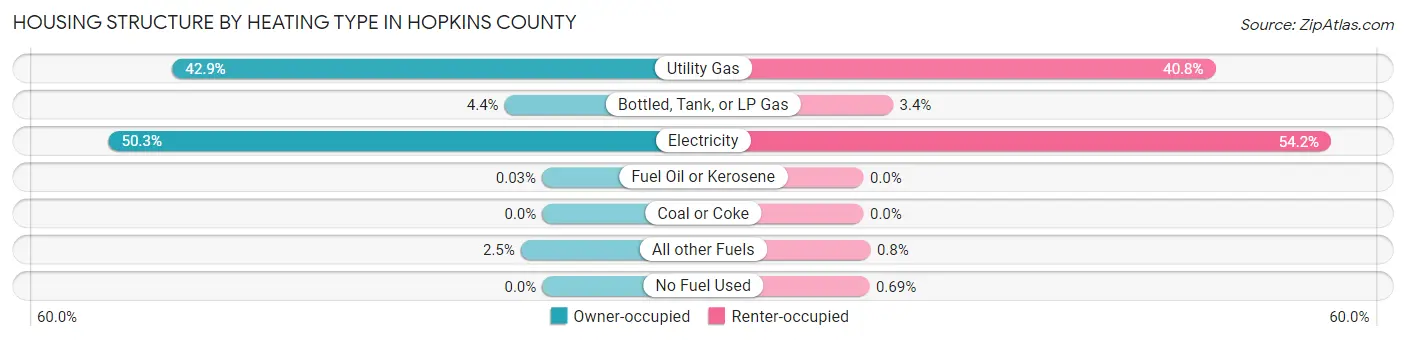
| Heating Type | Owner-occupied | Renter-occupied |
| Utility Gas | 5,498 (42.9%) | 2,253 (40.8%) |
| Bottled, Tank, or LP Gas | 560 (4.4%) | 189 (3.4%) |
| Electricity | 6,448 (50.3%) | 2,992 (54.2%) |
| Fuel Oil or Kerosene | 4 (0.0%) | 0 (0.0%) |
| Coal or Coke | 0 (0.0%) | 0 (0.0%) |
| All other Fuels | 319 (2.5%) | 44 (0.8%) |
| No Fuel Used | 0 (0.0%) | 38 (0.7%) |
| Total | 12,829 (100.0%) | 5,516 (100.0%) |
Household Vehicle Usage in Hopkins County
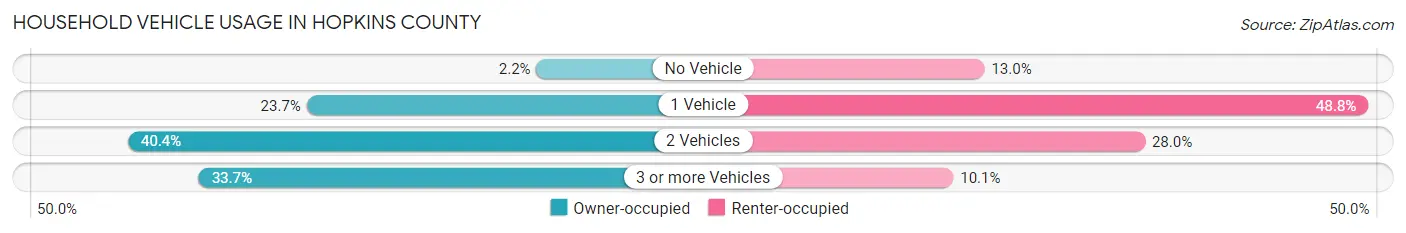
| Vehicles per Household | Owner-occupied | Renter-occupied |
| No Vehicle | 285 (2.2%) | 719 (13.0%) |
| 1 Vehicle | 3,037 (23.7%) | 2,694 (48.8%) |
| 2 Vehicles | 5,178 (40.4%) | 1,545 (28.0%) |
| 3 or more Vehicles | 4,329 (33.7%) | 558 (10.1%) |
| Total | 12,829 (100.0%) | 5,516 (100.0%) |
Real Estate & Mortgages in Hopkins County
Real Estate and Mortgage Overview in Hopkins County
| Characteristic | Without Mortgage | With Mortgage |
| Housing Units | 6,163 | 6,666 |
| Median Property Value | $103,300 | $147,900 |
| Median Household Income | $49,055 | $812 |
| Monthly Housing Costs | $403 | $64 |
| Real Estate Taxes | $782 | $348 |
Property Value by Mortgage Status in Hopkins County
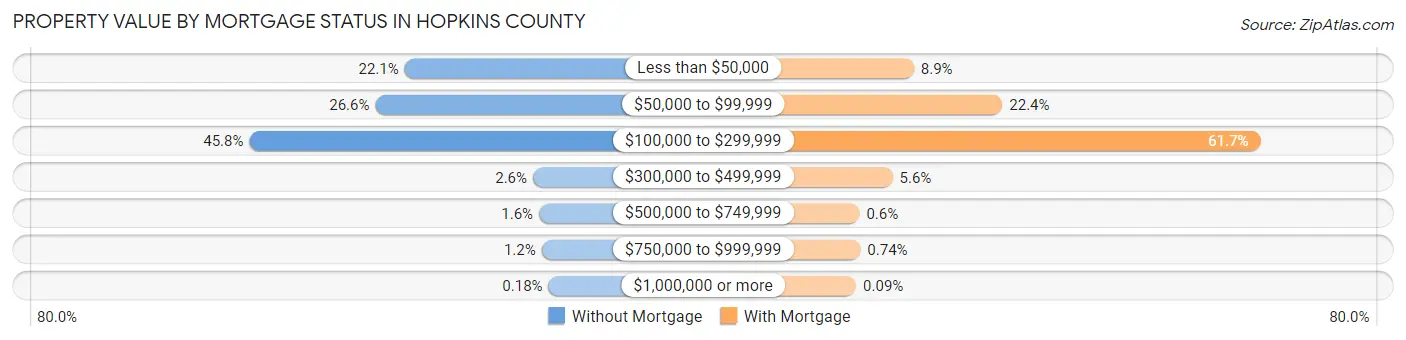
| Property Value | Without Mortgage | With Mortgage |
| Less than $50,000 | 1,362 (22.1%) | 592 (8.9%) |
| $50,000 to $99,999 | 1,637 (26.6%) | 1,491 (22.4%) |
| $100,000 to $299,999 | 2,820 (45.8%) | 4,112 (61.7%) |
| $300,000 to $499,999 | 157 (2.5%) | 376 (5.6%) |
| $500,000 to $749,999 | 100 (1.6%) | 40 (0.6%) |
| $750,000 to $999,999 | 76 (1.2%) | 49 (0.7%) |
| $1,000,000 or more | 11 (0.2%) | 6 (0.1%) |
| Total | 6,163 (100.0%) | 6,666 (100.0%) |
Household Income by Mortgage Status in Hopkins County
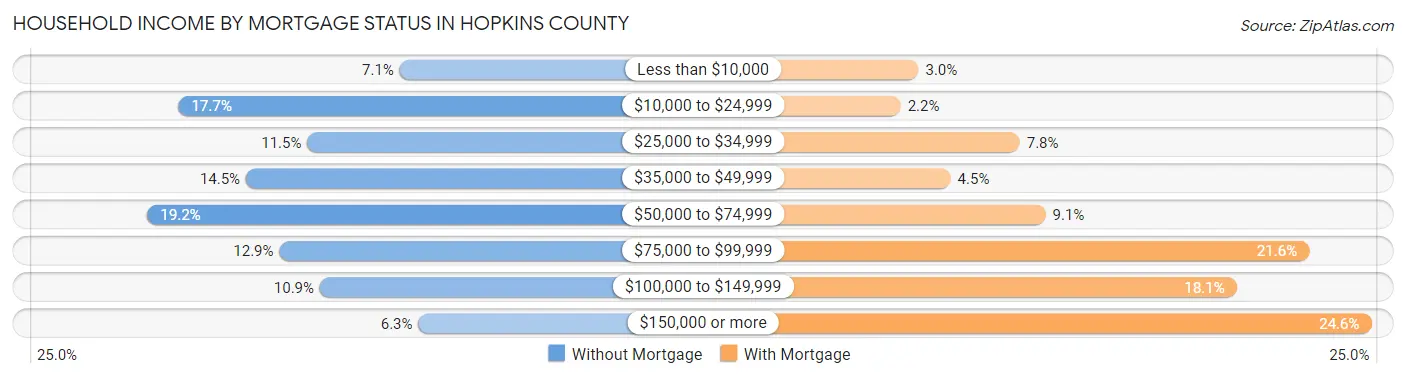
| Household Income | Without Mortgage | With Mortgage |
| Less than $10,000 | 440 (7.1%) | 200 (3.0%) |
| $10,000 to $24,999 | 1,089 (17.7%) | 143 (2.1%) |
| $25,000 to $34,999 | 711 (11.5%) | 521 (7.8%) |
| $35,000 to $49,999 | 891 (14.5%) | 302 (4.5%) |
| $50,000 to $74,999 | 1,180 (19.2%) | 603 (9.0%) |
| $75,000 to $99,999 | 793 (12.9%) | 1,439 (21.6%) |
| $100,000 to $149,999 | 674 (10.9%) | 1,209 (18.1%) |
| $150,000 or more | 385 (6.2%) | 1,637 (24.6%) |
| Total | 6,163 (100.0%) | 6,666 (100.0%) |
Property Value to Household Income Ratio in Hopkins County
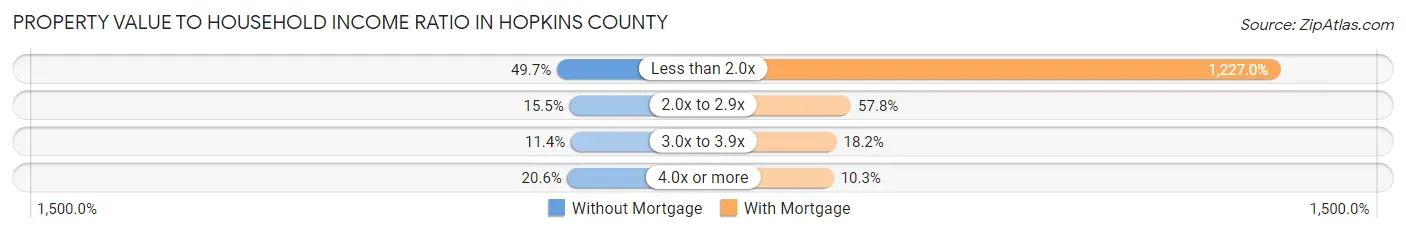
| Value-to-Income Ratio | Without Mortgage | With Mortgage |
| Less than 2.0x | 3,064 (49.7%) | 81,791 (1,227.0%) |
| 2.0x to 2.9x | 954 (15.5%) | 3,855 (57.8%) |
| 3.0x to 3.9x | 701 (11.4%) | 1,211 (18.2%) |
| 4.0x or more | 1,270 (20.6%) | 686 (10.3%) |
| Total | 6,163 (100.0%) | 6,666 (100.0%) |
Real Estate Taxes by Mortgage Status in Hopkins County
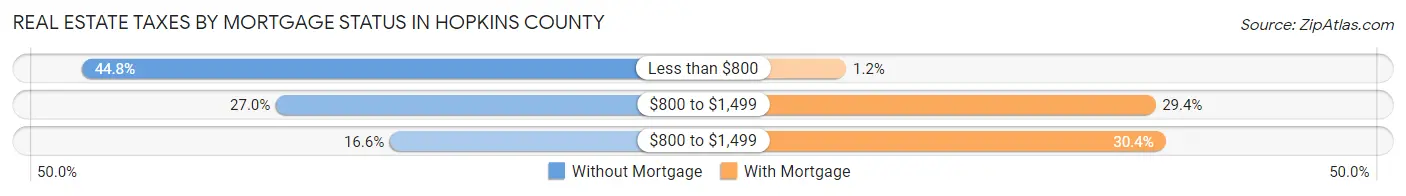
| Property Taxes | Without Mortgage | With Mortgage |
| Less than $800 | 2,760 (44.8%) | 79 (1.2%) |
| $800 to $1,499 | 1,666 (27.0%) | 1,961 (29.4%) |
| $800 to $1,499 | 1,025 (16.6%) | 2,024 (30.4%) |
| Total | 6,163 (100.0%) | 6,666 (100.0%) |
Health & Disability in Hopkins County
Health Insurance Coverage by Age in Hopkins County
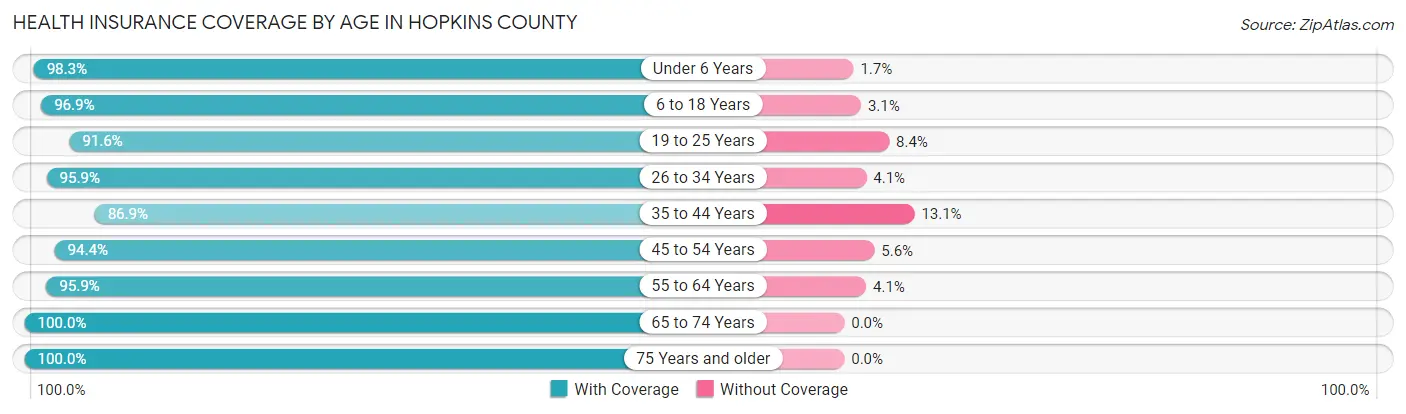
| Age Bracket | With Coverage | Without Coverage |
| Under 6 Years | 3,050 (98.3%) | 53 (1.7%) |
| 6 to 18 Years | 7,383 (96.9%) | 237 (3.1%) |
| 19 to 25 Years | 3,396 (91.6%) | 310 (8.4%) |
| 26 to 34 Years | 4,406 (95.9%) | 189 (4.1%) |
| 35 to 44 Years | 4,691 (86.9%) | 706 (13.1%) |
| 45 to 54 Years | 5,286 (94.4%) | 314 (5.6%) |
| 55 to 64 Years | 5,900 (95.9%) | 250 (4.1%) |
| 65 to 74 Years | 5,012 (100.0%) | 0 (0.0%) |
| 75 Years and older | 3,057 (100.0%) | 0 (0.0%) |
| Total | 42,181 (95.4%) | 2,059 (4.6%) |
Health Insurance Coverage by Citizenship Status in Hopkins County
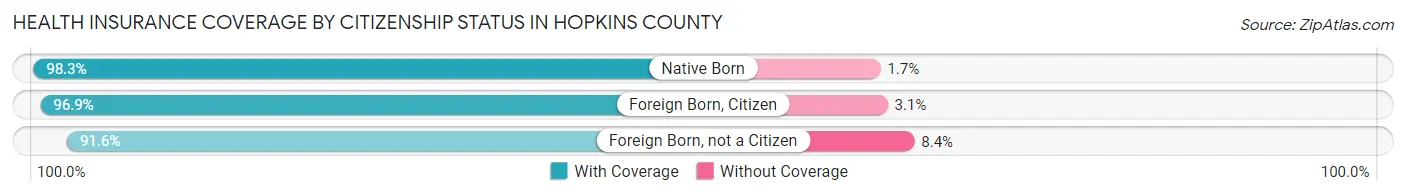
| Citizenship Status | With Coverage | Without Coverage |
| Native Born | 3,050 (98.3%) | 53 (1.7%) |
| Foreign Born, Citizen | 7,383 (96.9%) | 237 (3.1%) |
| Foreign Born, not a Citizen | 3,396 (91.6%) | 310 (8.4%) |
Health Insurance Coverage by Household Income in Hopkins County
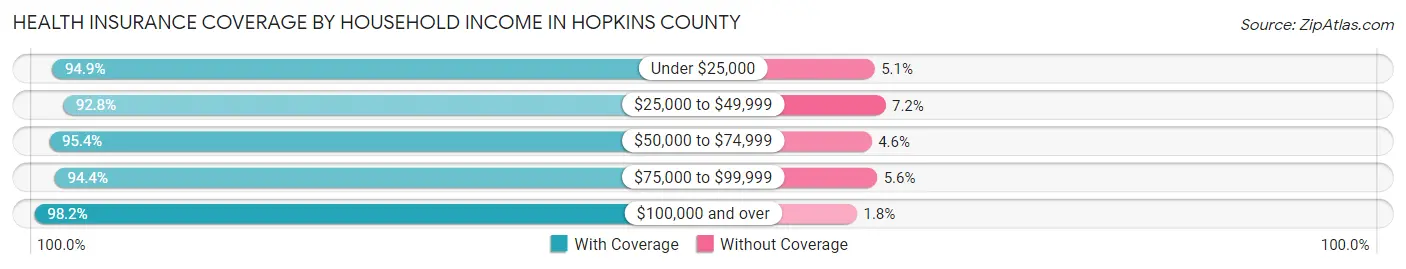
| Household Income | With Coverage | Without Coverage |
| Under $25,000 | 7,767 (94.9%) | 421 (5.1%) |
| $25,000 to $49,999 | 8,412 (92.8%) | 649 (7.2%) |
| $50,000 to $74,999 | 8,019 (95.4%) | 384 (4.6%) |
| $75,000 to $99,999 | 6,510 (94.4%) | 387 (5.6%) |
| $100,000 and over | 11,464 (98.2%) | 213 (1.8%) |
Public vs Private Health Insurance Coverage by Age in Hopkins County
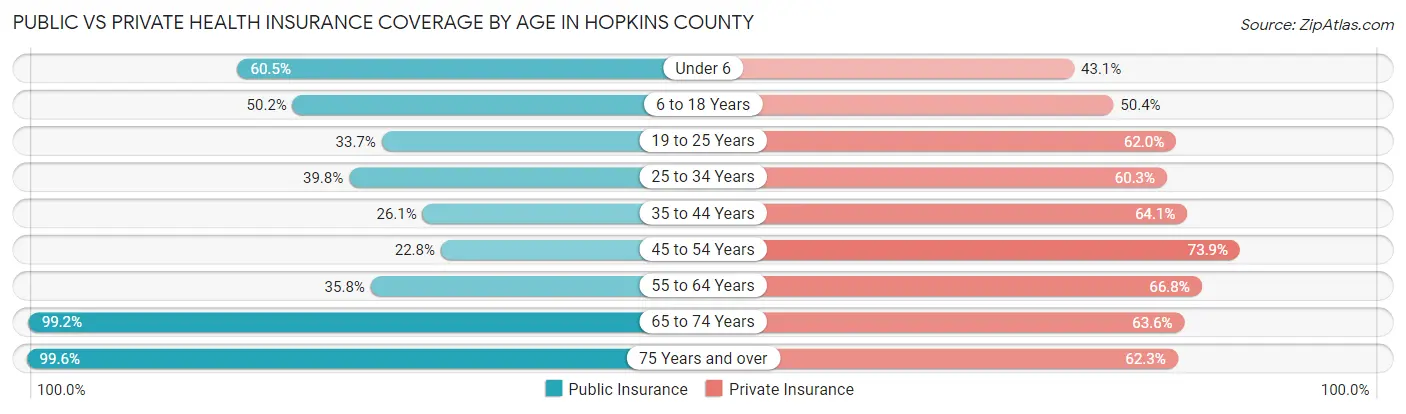
| Age Bracket | Public Insurance | Private Insurance |
| Under 6 | 1,876 (60.5%) | 1,338 (43.1%) |
| 6 to 18 Years | 3,828 (50.2%) | 3,841 (50.4%) |
| 19 to 25 Years | 1,250 (33.7%) | 2,299 (62.0%) |
| 25 to 34 Years | 1,828 (39.8%) | 2,772 (60.3%) |
| 35 to 44 Years | 1,411 (26.1%) | 3,460 (64.1%) |
| 45 to 54 Years | 1,274 (22.8%) | 4,137 (73.9%) |
| 55 to 64 Years | 2,200 (35.8%) | 4,106 (66.8%) |
| 65 to 74 Years | 4,973 (99.2%) | 3,187 (63.6%) |
| 75 Years and over | 3,045 (99.6%) | 1,905 (62.3%) |
| Total | 21,685 (49.0%) | 27,045 (61.1%) |
Disability Status by Sex by Age in Hopkins County
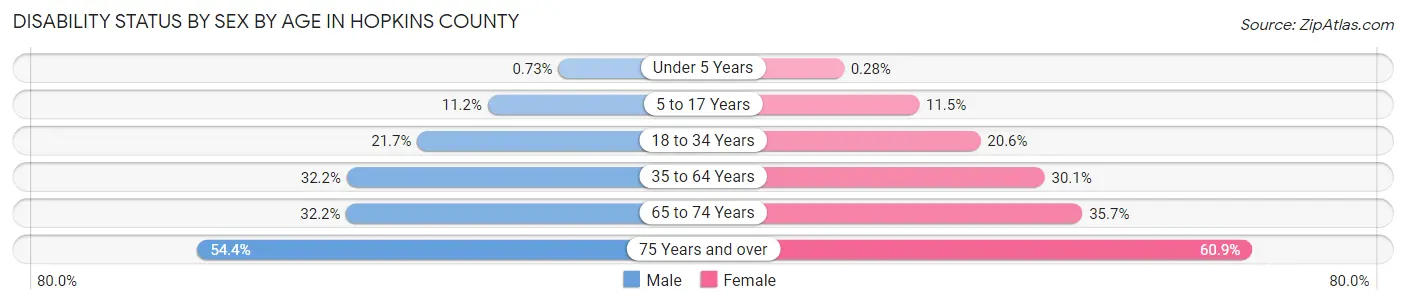
| Age Bracket | Male | Female |
| Under 5 Years | 9 (0.7%) | 4 (0.3%) |
| 5 to 17 Years | 439 (11.2%) | 430 (11.5%) |
| 18 to 34 Years | 936 (21.7%) | 903 (20.6%) |
| 35 to 64 Years | 2,675 (32.2%) | 2,659 (30.1%) |
| 65 to 74 Years | 742 (32.2%) | 967 (35.7%) |
| 75 Years and over | 749 (54.3%) | 1,023 (60.9%) |
Disability Class by Sex by Age in Hopkins County
Disability Class: Hearing Difficulty
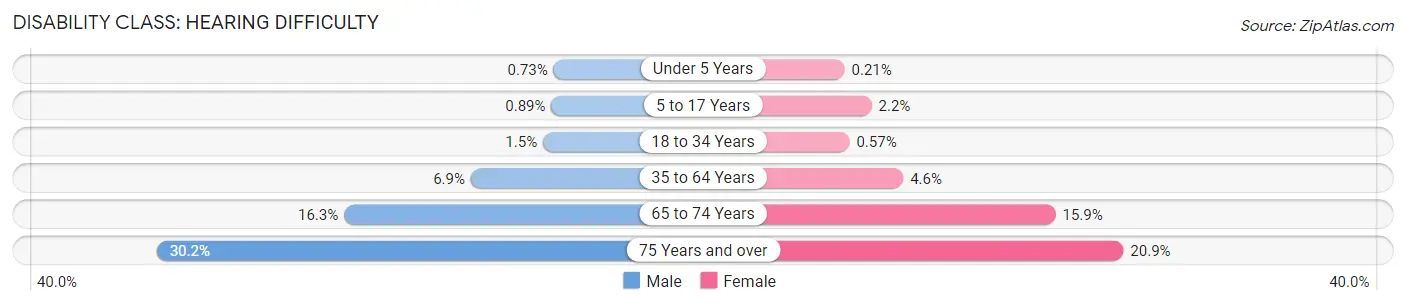
| Age Bracket | Male | Female |
| Under 5 Years | 9 (0.7%) | 3 (0.2%) |
| 5 to 17 Years | 35 (0.9%) | 83 (2.2%) |
| 18 to 34 Years | 65 (1.5%) | 25 (0.6%) |
| 35 to 64 Years | 571 (6.9%) | 403 (4.6%) |
| 65 to 74 Years | 375 (16.3%) | 430 (15.9%) |
| 75 Years and over | 416 (30.2%) | 351 (20.9%) |
Disability Class: Vision Difficulty
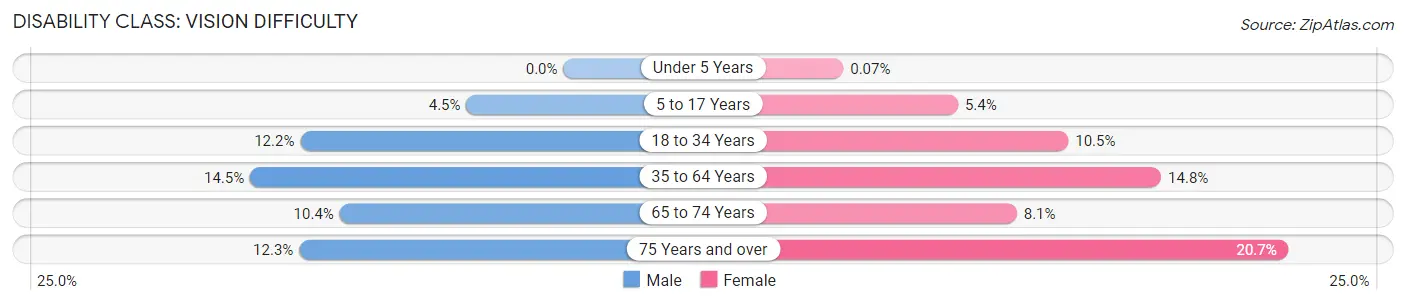
| Age Bracket | Male | Female |
| Under 5 Years | 0 (0.0%) | 1 (0.1%) |
| 5 to 17 Years | 176 (4.5%) | 202 (5.4%) |
| 18 to 34 Years | 527 (12.2%) | 461 (10.5%) |
| 35 to 64 Years | 1,209 (14.5%) | 1,309 (14.8%) |
| 65 to 74 Years | 239 (10.4%) | 220 (8.1%) |
| 75 Years and over | 169 (12.3%) | 348 (20.7%) |
Disability Class: Cognitive Difficulty
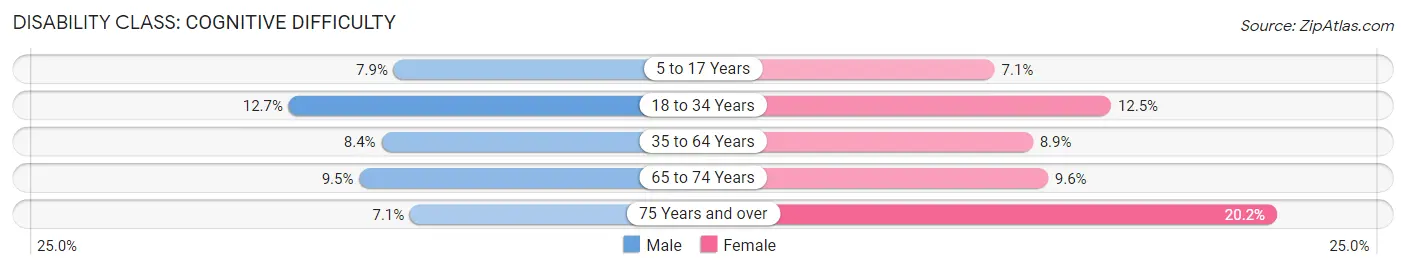
| Age Bracket | Male | Female |
| 5 to 17 Years | 308 (7.9%) | 266 (7.1%) |
| 18 to 34 Years | 550 (12.7%) | 548 (12.5%) |
| 35 to 64 Years | 702 (8.4%) | 782 (8.9%) |
| 65 to 74 Years | 218 (9.5%) | 259 (9.6%) |
| 75 Years and over | 98 (7.1%) | 339 (20.2%) |
Disability Class: Ambulatory Difficulty
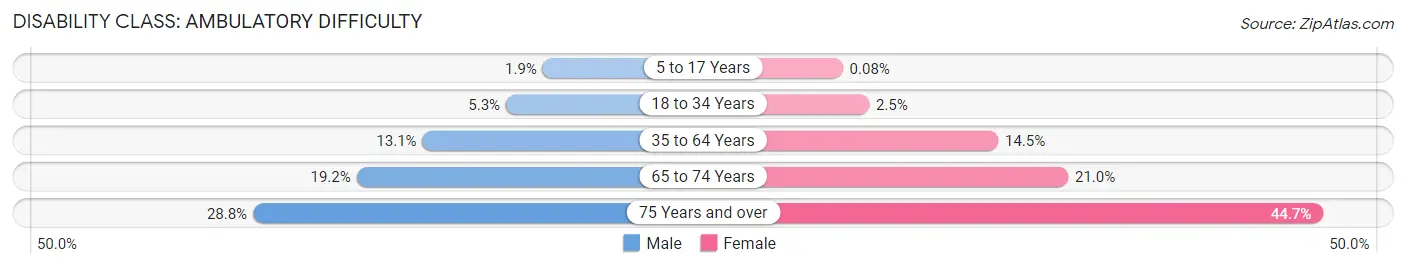
| Age Bracket | Male | Female |
| 5 to 17 Years | 75 (1.9%) | 3 (0.1%) |
| 18 to 34 Years | 230 (5.3%) | 111 (2.5%) |
| 35 to 64 Years | 1,088 (13.1%) | 1,280 (14.5%) |
| 65 to 74 Years | 442 (19.2%) | 569 (21.0%) |
| 75 Years and over | 397 (28.8%) | 750 (44.7%) |
Disability Class: Self-Care Difficulty
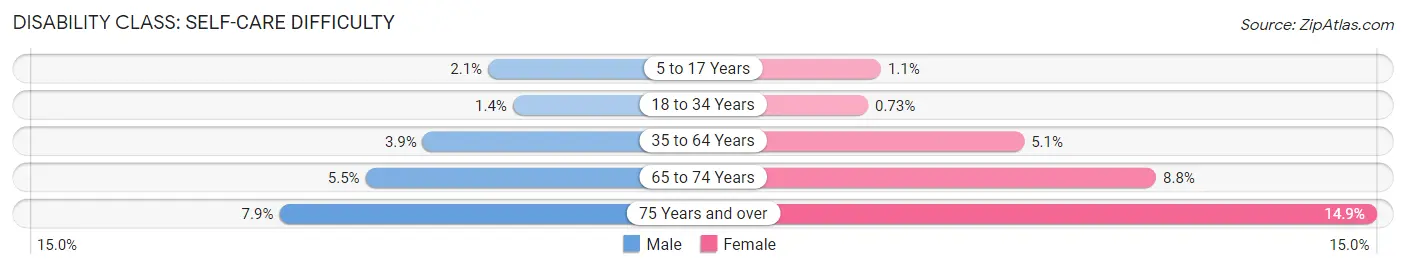
| Age Bracket | Male | Female |
| 5 to 17 Years | 82 (2.1%) | 41 (1.1%) |
| 18 to 34 Years | 61 (1.4%) | 32 (0.7%) |
| 35 to 64 Years | 326 (3.9%) | 449 (5.1%) |
| 65 to 74 Years | 127 (5.5%) | 237 (8.7%) |
| 75 Years and over | 109 (7.9%) | 250 (14.9%) |
Technology Access in Hopkins County
Computing Device Access in Hopkins County
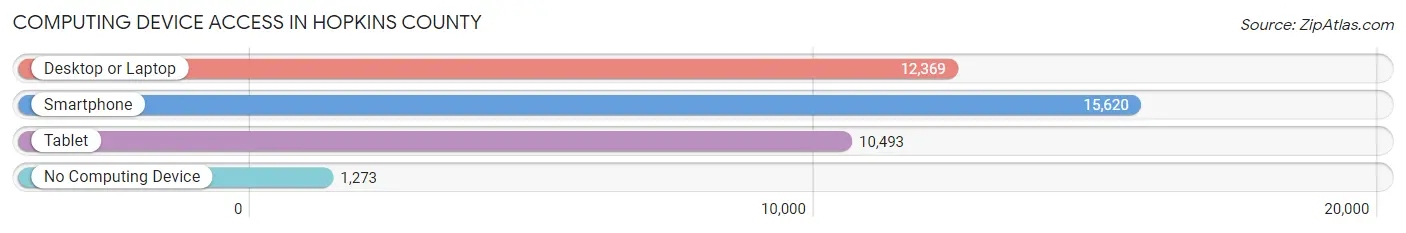
| Device Type | # Households | % Households |
| Desktop or Laptop | 12,369 | 67.4% |
| Smartphone | 15,620 | 85.2% |
| Tablet | 10,493 | 57.2% |
| No Computing Device | 1,273 | 6.9% |
| Total | 18,345 | 100.0% |
Internet Access in Hopkins County
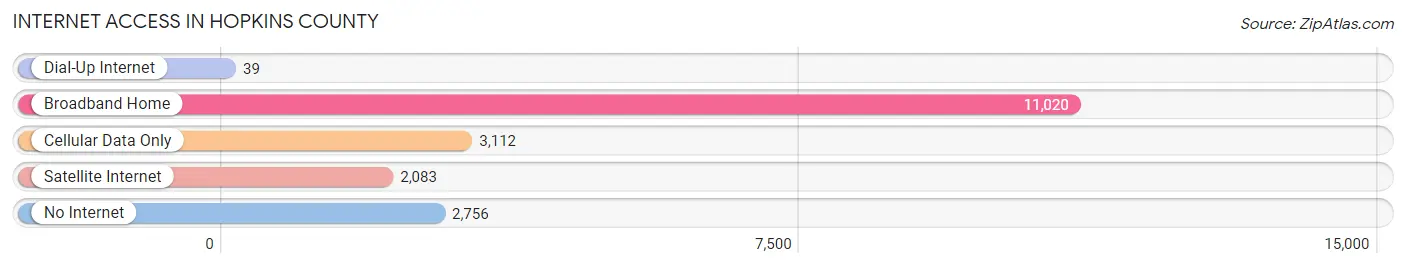
| Internet Type | # Households | % Households |
| Dial-Up Internet | 39 | 0.2% |
| Broadband Home | 11,020 | 60.1% |
| Cellular Data Only | 3,112 | 17.0% |
| Satellite Internet | 2,083 | 11.4% |
| No Internet | 2,756 | 15.0% |
| Total | 18,345 | 100.0% |
Hopkins County Summary
Hopkins County, Kentucky is located in the western part of the state, and is bordered by Webster, Muhlenberg, McLean, and Christian counties. It is part of the Jackson Purchase region of Kentucky, and is the home of the city of Madisonville, the county seat. The county was established in 1806 and named for General Samuel Hopkins, a Revolutionary War hero.
Geography
Hopkins County is located in the western part of Kentucky, and is bordered by Webster, Muhlenberg, McLean, and Christian counties. It is part of the Jackson Purchase region of Kentucky, and is the home of the city of Madisonville, the county seat. The county is mostly rural, with a total area of 441 square miles. The terrain is mostly flat, with some rolling hills in the northern part of the county. The county is drained by the Green River, which flows through the county from north to south.
The climate of Hopkins County is humid subtropical, with hot, humid summers and mild winters. The average annual temperature is around 60 degrees Fahrenheit, and the average annual precipitation is around 45 inches.
Demographics
As of the 2010 census, the population of Hopkins County was 46,920, making it the 33rd most populous county in Kentucky. The population density was 106 people per square mile. The racial makeup of the county was 92.3% White, 4.7% African American, 0.3% Native American, 0.7% Asian, 0.1% Pacific Islander, 0.7% from other races, and 1.2% from two or more races. Hispanic or Latino of any race were 1.9% of the population.
The median income for a household in the county was $37,945, and the median income for a family was $45,945. The per capita income for the county was $19,945. About 11.3% of families and 14.7% of the population were below the poverty line, including 19.2% of those under age 18 and 11.2% of those age 65 or over.
Economy
The economy of Hopkins County is largely based on agriculture, with corn, soybeans, and wheat being the main crops. The county is also home to several manufacturing companies, including a large automotive parts plant and a furniture factory. The county is also home to several coal mines, which provide jobs for many of the county's residents.
The county is also home to several tourist attractions, including the Hopkins County Museum, the Hopkins County Fairgrounds, and the Kentucky Opry. The county is also home to several wineries, and is a popular destination for outdoor recreation, including fishing, hunting, and camping.
Conclusion
Hopkins County, Kentucky is a rural county located in the western part of the state. It is part of the Jackson Purchase region of Kentucky, and is the home of the city of Madisonville, the county seat. The county has a population of 46,920, and the economy is largely based on agriculture and manufacturing. The county is also home to several tourist attractions, and is a popular destination for outdoor recreation.
Common Questions
What is the Total Population of Hopkins County?
Total Population of Hopkins County is 45,223.
What is the Total Male Population of Hopkins County?
Total Male Population of Hopkins County is 22,060.
What is the Total Female Population of Hopkins County?
Total Female Population of Hopkins County is 23,163.
What is the Ratio of Males per 100 Females in Hopkins County?
There are 95.24 Males per 100 Females in Hopkins County.
What is the Ratio of Females per 100 Males in Hopkins County?
There are 105.00 Females per 100 Males in Hopkins County.
What is the Median Population Age in Hopkins County?
Median Population Age in Hopkins County is 41.4 Years.
What is the Average Family Size in Hopkins County
Average Family Size in Hopkins County is 2.9 People.
What is the Average Household Size in Hopkins County
Average Household Size in Hopkins County is 2.4 People.
What is Per Capita Income in Hopkins County?
Per Capita income in Hopkins County is $27,878.
What is the Median Family Income in Hopkins County?
Median Family Income in Hopkins County is $64,949.
What is the Median Household income in Hopkins County?
Median Household Income in Hopkins County is $54,466.
What is Income or Wage Gap in Hopkins County?
Income or Wage Gap in Hopkins County is 30.0%.
Women in Hopkins County earn 70.0 cents for every dollar earned by a man.
What is Family Income Deficit in Hopkins County?
Family Income Deficit in Hopkins County is $13,353.
Families that are below poverty line in Hopkins County earn $13,353 less on average than the poverty threshold level.
What is Inequality or Gini Index in Hopkins County?
Inequality or Gini Index in Hopkins County is 0.43.
How Large is the Labor Force in Hopkins County?
There are 19,623 People in the Labor Forcein in Hopkins County.
What is the Percentage of People in the Labor Force in Hopkins County?
54.2% of People are in the Labor Force in Hopkins County.
What is the Unemployment Rate in Hopkins County?
Unemployment Rate in Hopkins County is 7.7%.