Hardin County, KY
Hardin County Map
Hardin County Overview
111,005
TOTAL POPULATION
55,411
MALE POPULATION
55,594
FEMALE POPULATION
99.67
MALES / 100 FEMALES
100.33
FEMALES / 100 MALES
37.2
MEDIAN AGE
3.1
AVG FAMILY SIZE
2.5
AVG HOUSEHOLD SIZE
$35,226
PER CAPITA INCOME
$79,590
AVG FAMILY INCOME
$64,136
AVG HOUSEHOLD INCOME
26.6%
WAGE / INCOME GAP [ % ]
73.4¢/ $1
WAGE / INCOME GAP [ $ ]
$9,425
FAMILY INCOME DEFICIT
0.46
INEQUALITY / GINI INDEX
54,483
LABOR FORCE [ PEOPLE ]
62.7%
PERCENT IN LABOR FORCE
6.8%
UNEMPLOYMENT RATE
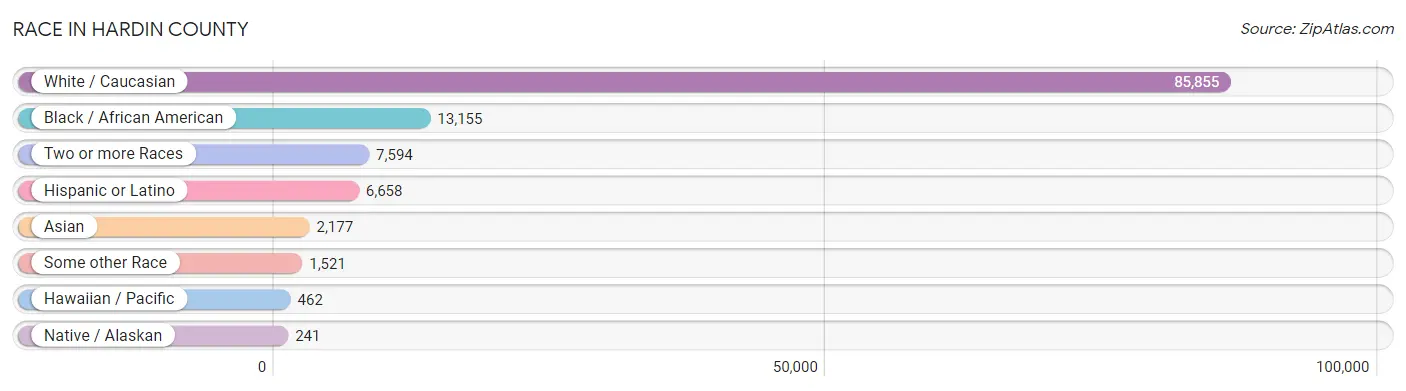
Race in Hardin County
The most populous races in Hardin County are White / Caucasian (85,855 | 77.3%), Black / African American (13,155 | 11.8%), and Two or more Races (7,594 | 6.8%).
| Race | # Population | % Population |
| Asian | 2,177 | 2.0% |
| Black / African American | 13,155 | 11.8% |
| Hawaiian / Pacific | 462 | 0.4% |
| Hispanic or Latino | 6,658 | 6.0% |
| Native / Alaskan | 241 | 0.2% |
| White / Caucasian | 85,855 | 77.3% |
| Two or more Races | 7,594 | 6.8% |
| Some other Race | 1,521 | 1.4% |
| Total | 111,005 | 100.0% |
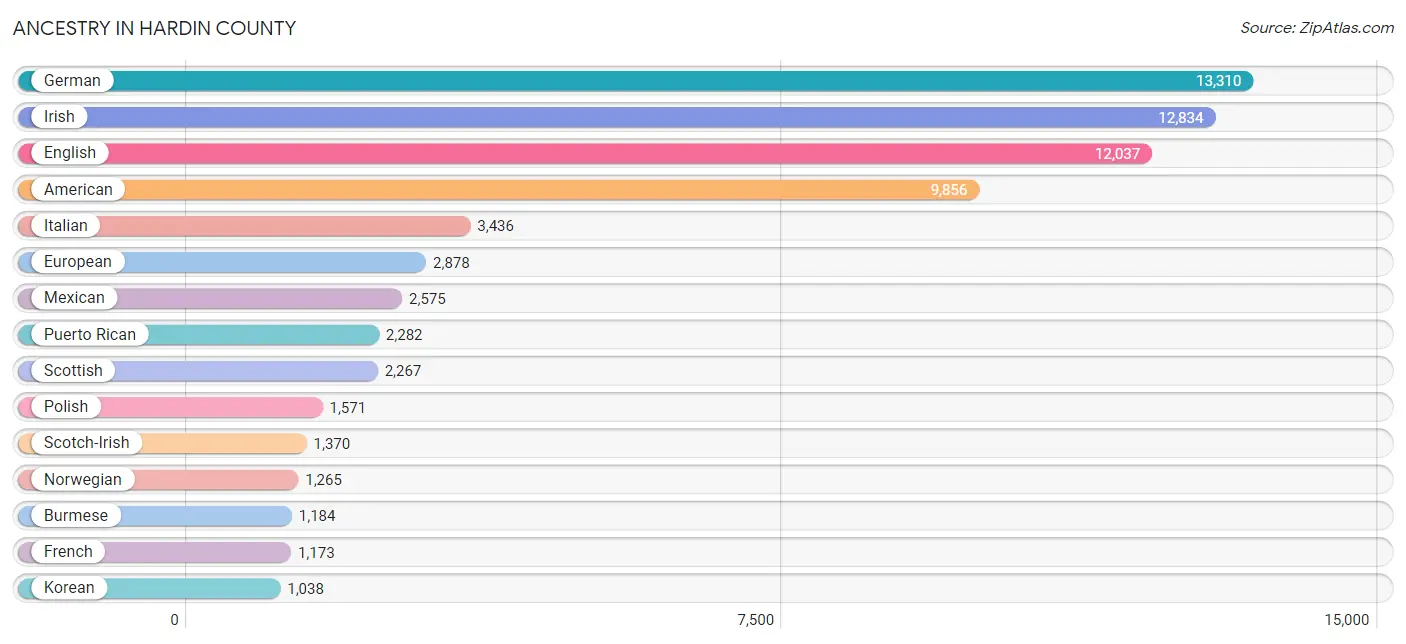
Ancestry in Hardin County
The most populous ancestries reported in Hardin County are German (13,310 | 12.0%), Irish (12,834 | 11.6%), English (12,037 | 10.8%), American (9,856 | 8.9%), and Italian (3,436 | 3.1%), together accounting for 46.4% of all Hardin County residents.
| Ancestry | # Population | % Population |
| African | 825 | 0.7% |
| American | 9,856 | 8.9% |
| Arab | 181 | 0.2% |
| Armenian | 59 | 0.1% |
| Australian | 9 | 0.0% |
| Austrian | 44 | 0.0% |
| Belgian | 173 | 0.2% |
| Bhutanese | 486 | 0.4% |
| Blackfeet | 79 | 0.1% |
| Brazilian | 37 | 0.0% |
| British | 527 | 0.5% |
| British West Indian | 32 | 0.0% |
| Burmese | 1,184 | 1.1% |
| Cajun | 33 | 0.0% |
| Canadian | 122 | 0.1% |
| Central American | 718 | 0.6% |
| Central American Indian | 32 | 0.0% |
| Cherokee | 327 | 0.3% |
| Cheyenne | 1 | 0.0% |
| Chickasaw | 14 | 0.0% |
| Chippewa | 42 | 0.0% |
| Choctaw | 30 | 0.0% |
| Colombian | 64 | 0.1% |
| Creek | 17 | 0.0% |
| Croatian | 88 | 0.1% |
| Cuban | 263 | 0.2% |
| Czech | 80 | 0.1% |
| Czechoslovakian | 32 | 0.0% |
| Danish | 96 | 0.1% |
| Dominican | 178 | 0.2% |
| Dutch | 959 | 0.9% |
| Dutch West Indian | 64 | 0.1% |
| Eastern European | 113 | 0.1% |
| Egyptian | 32 | 0.0% |
| English | 12,037 | 10.8% |
| European | 2,878 | 2.6% |
| Fijian | 23 | 0.0% |
| Filipino | 84 | 0.1% |
| Finnish | 50 | 0.1% |
| French | 1,173 | 1.1% |
| French Canadian | 498 | 0.4% |
| German | 13,310 | 12.0% |
| Greek | 159 | 0.1% |
| Guamanian / Chamorro | 118 | 0.1% |
| Guatemalan | 88 | 0.1% |
| Haitian | 18 | 0.0% |
| Honduran | 115 | 0.1% |
| Hungarian | 103 | 0.1% |
| Indian (Asian) | 296 | 0.3% |
| Irish | 12,834 | 11.6% |
| Iroquois | 27 | 0.0% |
| Italian | 3,436 | 3.1% |
| Jamaican | 84 | 0.1% |
| Japanese | 49 | 0.0% |
| Jordanian | 2 | 0.0% |
| Korean | 1,038 | 0.9% |
| Latvian | 16 | 0.0% |
| Lebanese | 58 | 0.1% |
| Lithuanian | 76 | 0.1% |
| Malaysian | 27 | 0.0% |
| Mexican | 2,575 | 2.3% |
| Mexican American Indian | 69 | 0.1% |
| Moroccan | 52 | 0.1% |
| Native Hawaiian | 234 | 0.2% |
| Navajo | 9 | 0.0% |
| Nicaraguan | 29 | 0.0% |
| Nigerian | 148 | 0.1% |
| Northern European | 73 | 0.1% |
| Norwegian | 1,265 | 1.1% |
| Pakistani | 68 | 0.1% |
| Panamanian | 394 | 0.4% |
| Pennsylvania German | 8 | 0.0% |
| Peruvian | 33 | 0.0% |
| Polish | 1,571 | 1.4% |
| Portuguese | 161 | 0.2% |
| Pueblo | 31 | 0.0% |
| Puerto Rican | 2,282 | 2.1% |
| Romanian | 262 | 0.2% |
| Russian | 320 | 0.3% |
| Salvadoran | 92 | 0.1% |
| Samoan | 13 | 0.0% |
| Scandinavian | 492 | 0.4% |
| Scotch-Irish | 1,370 | 1.2% |
| Scottish | 2,267 | 2.0% |
| Serbian | 38 | 0.0% |
| Sioux | 29 | 0.0% |
| Slavic | 18 | 0.0% |
| Slovak | 66 | 0.1% |
| Somali | 23 | 0.0% |
| South American | 114 | 0.1% |
| South American Indian | 1 | 0.0% |
| Spaniard | 275 | 0.3% |
| Spanish | 146 | 0.1% |
| Spanish American | 35 | 0.0% |
| Sri Lankan | 145 | 0.1% |
| Subsaharan African | 996 | 0.9% |
| Swedish | 301 | 0.3% |
| Swiss | 366 | 0.3% |
| Syrian | 16 | 0.0% |
| Thai | 476 | 0.4% |
| Tohono O'Odham | 12 | 0.0% |
| Turkish | 39 | 0.0% |
| Ukrainian | 133 | 0.1% |
| Venezuelan | 17 | 0.0% |
| Welsh | 731 | 0.7% |
| West Indian | 417 | 0.4% |
| Yugoslavian | 20 | 0.0% | View All 107 Rows |
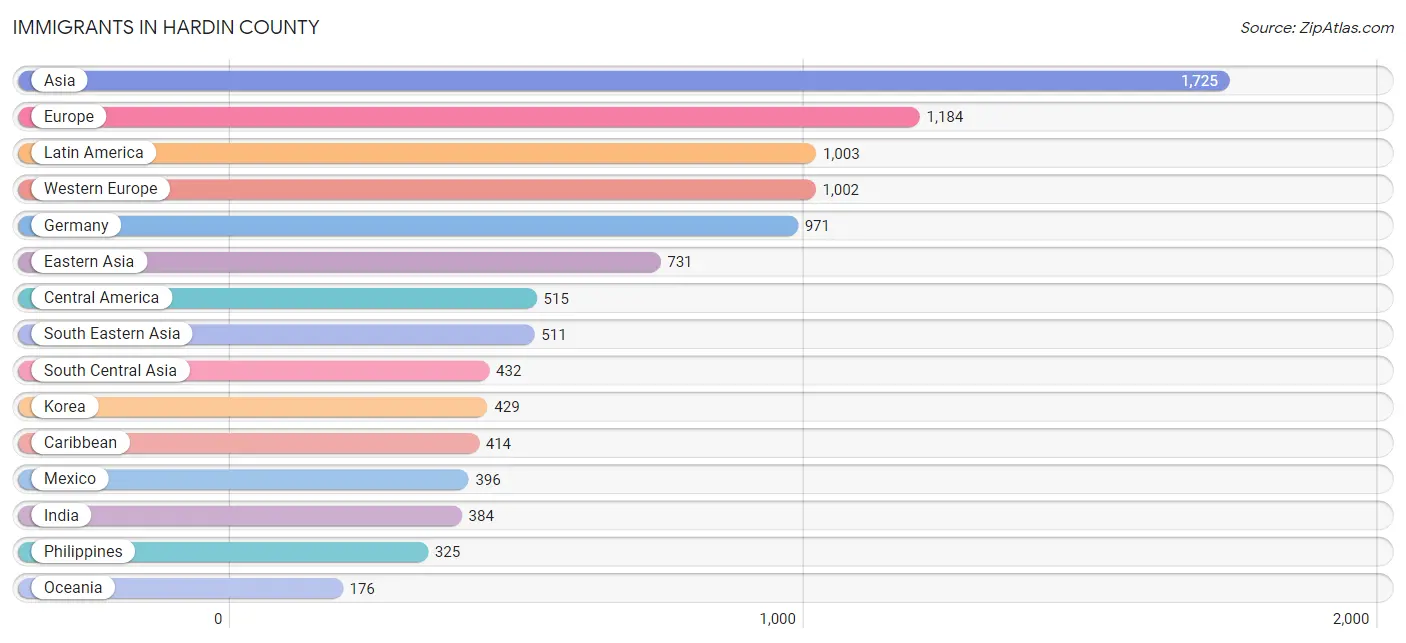
Immigrants in Hardin County
The most numerous immigrant groups reported in Hardin County came from Asia (1,725 | 1.5%), Europe (1,184 | 1.1%), Latin America (1,003 | 0.9%), Western Europe (1,002 | 0.9%), and Germany (971 | 0.9%), together accounting for 5.3% of all Hardin County residents.
| Immigration Origin | # Population | % Population |
| Africa | 108 | 0.1% |
| Asia | 1,725 | 1.5% |
| Australia | 30 | 0.0% |
| Austria | 3 | 0.0% |
| Bangladesh | 7 | 0.0% |
| Belgium | 8 | 0.0% |
| Canada | 90 | 0.1% |
| Caribbean | 414 | 0.4% |
| Central America | 515 | 0.5% |
| China | 138 | 0.1% |
| Colombia | 34 | 0.0% |
| Cuba | 144 | 0.1% |
| Dominican Republic | 101 | 0.1% |
| Eastern Africa | 23 | 0.0% |
| Eastern Asia | 731 | 0.7% |
| Eastern Europe | 112 | 0.1% |
| England | 28 | 0.0% |
| Europe | 1,184 | 1.1% |
| France | 14 | 0.0% |
| Germany | 971 | 0.9% |
| Greece | 7 | 0.0% |
| Grenada | 21 | 0.0% |
| Guatemala | 34 | 0.0% |
| Hong Kong | 22 | 0.0% |
| India | 384 | 0.4% |
| Indonesia | 16 | 0.0% |
| Israel | 49 | 0.0% |
| Jamaica | 86 | 0.1% |
| Japan | 164 | 0.2% |
| Jordan | 2 | 0.0% |
| Korea | 429 | 0.4% |
| Laos | 27 | 0.0% |
| Latin America | 1,003 | 0.9% |
| Liberia | 42 | 0.0% |
| Mexico | 396 | 0.4% |
| Micronesia | 112 | 0.1% |
| Nigeria | 40 | 0.0% |
| Northern Europe | 63 | 0.1% |
| Oceania | 176 | 0.2% |
| Pakistan | 41 | 0.0% |
| Panama | 85 | 0.1% |
| Peru | 16 | 0.0% |
| Philippines | 325 | 0.3% |
| Poland | 14 | 0.0% |
| Russia | 44 | 0.0% |
| Scotland | 4 | 0.0% |
| Somalia | 23 | 0.0% |
| South America | 74 | 0.1% |
| South Central Asia | 432 | 0.4% |
| South Eastern Asia | 511 | 0.5% |
| Southern Europe | 7 | 0.0% |
| St. Vincent and the Grenadines | 14 | 0.0% |
| Switzerland | 6 | 0.0% |
| Thailand | 19 | 0.0% |
| Trinidad and Tobago | 41 | 0.0% |
| Ukraine | 48 | 0.0% |
| Venezuela | 24 | 0.0% |
| Vietnam | 118 | 0.1% |
| Western Africa | 85 | 0.1% |
| Western Asia | 51 | 0.1% |
| Western Europe | 1,002 | 0.9% | View All 61 Rows |
Sex and Age in Hardin County
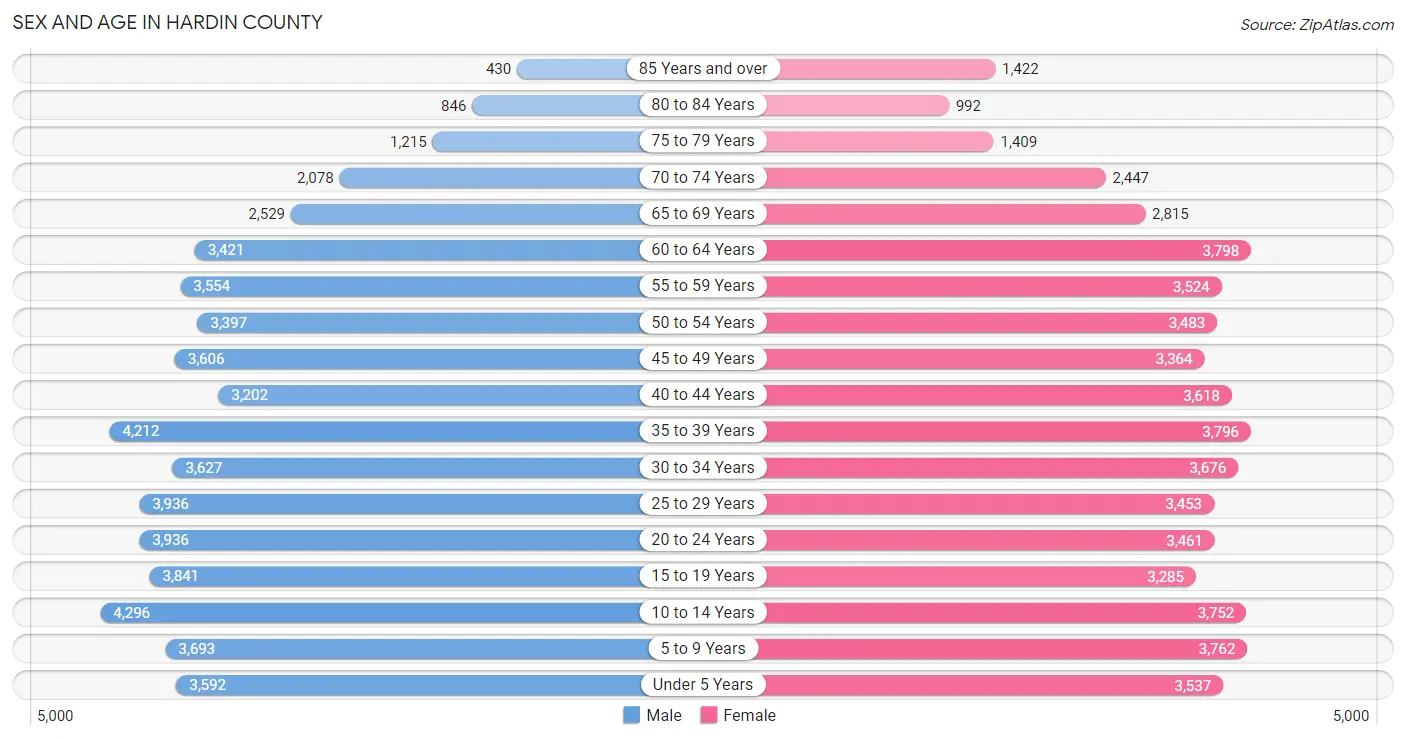
Sex and Age in Hardin County
The most populous age groups in Hardin County are 10 to 14 Years (4,296 | 7.7%) for men and 60 to 64 Years (3,798 | 6.8%) for women.
| Age Bracket | Male | Female |
| Under 5 Years | 3,592 (6.5%) | 3,537 (6.4%) |
| 5 to 9 Years | 3,693 (6.7%) | 3,762 (6.8%) |
| 10 to 14 Years | 4,296 (7.7%) | 3,752 (6.8%) |
| 15 to 19 Years | 3,841 (6.9%) | 3,285 (5.9%) |
| 20 to 24 Years | 3,936 (7.1%) | 3,461 (6.2%) |
| 25 to 29 Years | 3,936 (7.1%) | 3,453 (6.2%) |
| 30 to 34 Years | 3,627 (6.6%) | 3,676 (6.6%) |
| 35 to 39 Years | 4,212 (7.6%) | 3,796 (6.8%) |
| 40 to 44 Years | 3,202 (5.8%) | 3,618 (6.5%) |
| 45 to 49 Years | 3,606 (6.5%) | 3,364 (6.0%) |
| 50 to 54 Years | 3,397 (6.1%) | 3,483 (6.3%) |
| 55 to 59 Years | 3,554 (6.4%) | 3,524 (6.3%) |
| 60 to 64 Years | 3,421 (6.2%) | 3,798 (6.8%) |
| 65 to 69 Years | 2,529 (4.6%) | 2,815 (5.1%) |
| 70 to 74 Years | 2,078 (3.7%) | 2,447 (4.4%) |
| 75 to 79 Years | 1,215 (2.2%) | 1,409 (2.5%) |
| 80 to 84 Years | 846 (1.5%) | 992 (1.8%) |
| 85 Years and over | 430 (0.8%) | 1,422 (2.6%) |
| Total | 55,411 (100.0%) | 55,594 (100.0%) |
Families and Households in Hardin County
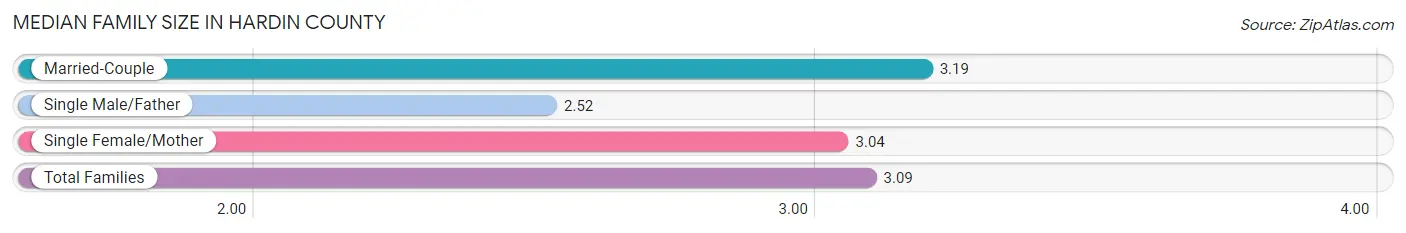
Median Family Size in Hardin County
The median family size in Hardin County is 3.09 persons per family, with married-couple families (20,296 | 71.8%) accounting for the largest median family size of 3.19 persons per family. On the other hand, single male/father families (2,857 | 10.1%) represent the smallest median family size with 2.52 persons per family.
| Family Type | # Families | Family Size |
| Married-Couple | 20,296 (71.8%) | 3.19 |
| Single Male/Father | 2,857 (10.1%) | 2.52 |
| Single Female/Mother | 5,123 (18.1%) | 3.04 |
| Total Families | 28,276 (100.0%) | 3.09 |
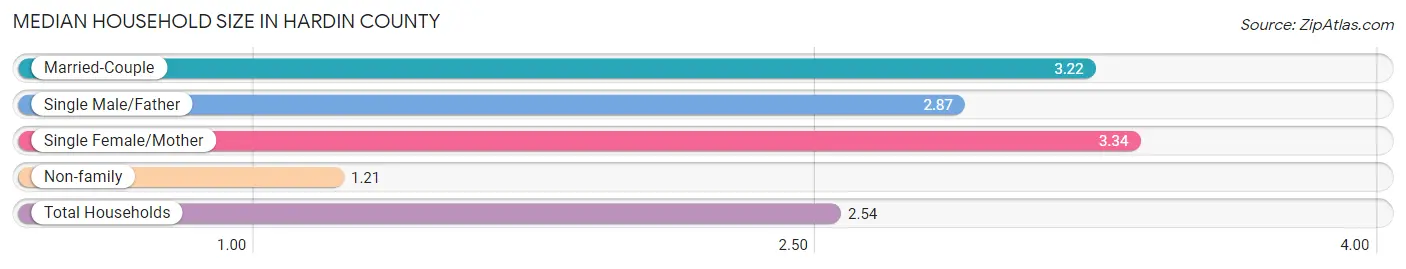
Median Household Size in Hardin County
The median household size in Hardin County is 2.54 persons per household, with single female/mother households (5,123 | 12.0%) accounting for the largest median household size of 3.34 persons per household. non-family households (14,362 | 33.7%) represent the smallest median household size with 1.21 persons per household.
| Household Type | # Households | Household Size |
| Married-Couple | 20,296 (47.6%) | 3.22 |
| Single Male/Father | 2,857 (6.7%) | 2.87 |
| Single Female/Mother | 5,123 (12.0%) | 3.34 |
| Non-family | 14,362 (33.7%) | 1.21 |
| Total Households | 42,638 (100.0%) | 2.54 |
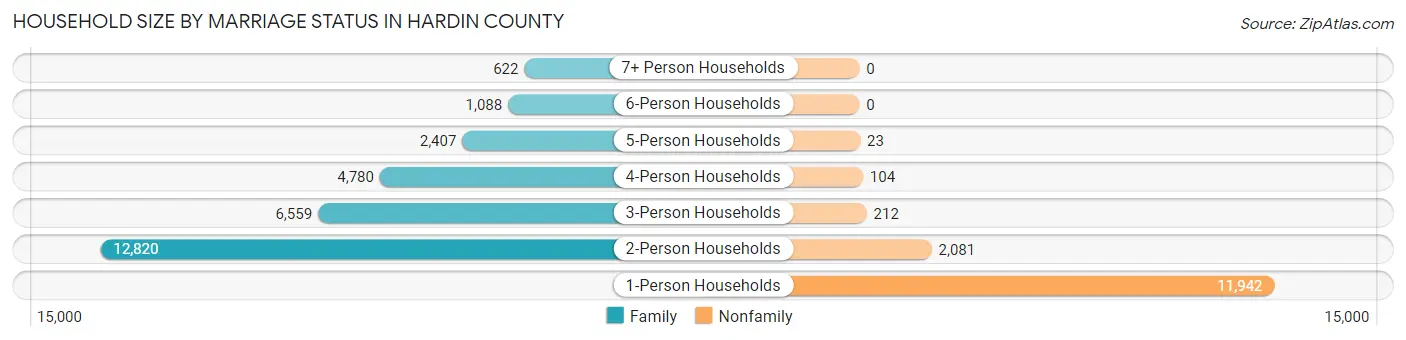
Household Size by Marriage Status in Hardin County
Out of a total of 42,638 households in Hardin County, 28,276 (66.3%) are family households, while 14,362 (33.7%) are nonfamily households. The most numerous type of family households are 2-person households, comprising 12,820, and the most common type of nonfamily households are 1-person households, comprising 11,942.
| Household Size | Family Households | Nonfamily Households |
| 1-Person Households | - | 11,942 (28.0%) |
| 2-Person Households | 12,820 (30.1%) | 2,081 (4.9%) |
| 3-Person Households | 6,559 (15.4%) | 212 (0.5%) |
| 4-Person Households | 4,780 (11.2%) | 104 (0.2%) |
| 5-Person Households | 2,407 (5.7%) | 23 (0.1%) |
| 6-Person Households | 1,088 (2.5%) | 0 (0.0%) |
| 7+ Person Households | 622 (1.5%) | 0 (0.0%) |
| Total | 28,276 (66.3%) | 14,362 (33.7%) |
Female Fertility in Hardin County
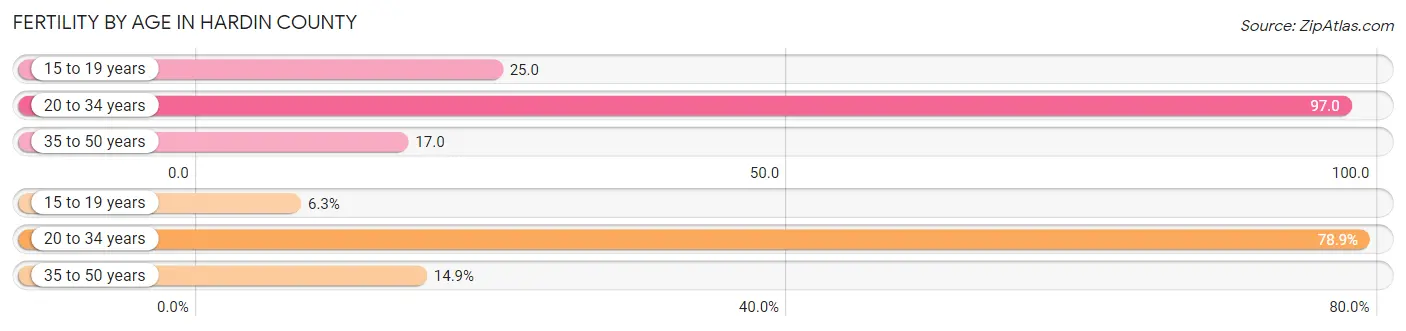
Fertility by Age in Hardin County
Average fertility rate in Hardin County is 51.0 births per 1,000 women. Women in the age bracket of 20 to 34 years have the highest fertility rate with 97.0 births per 1,000 women. Women in the age bracket of 20 to 34 years acount for 78.8% of all women with births.
| Age Bracket | Women with Births | Births / 1,000 Women |
| 15 to 19 years | 82 (6.3%) | 25.0 |
| 20 to 34 years | 1,025 (78.8%) | 97.0 |
| 35 to 50 years | 193 (14.8%) | 17.0 |
| Total | 1,300 (100.0%) | 51.0 |
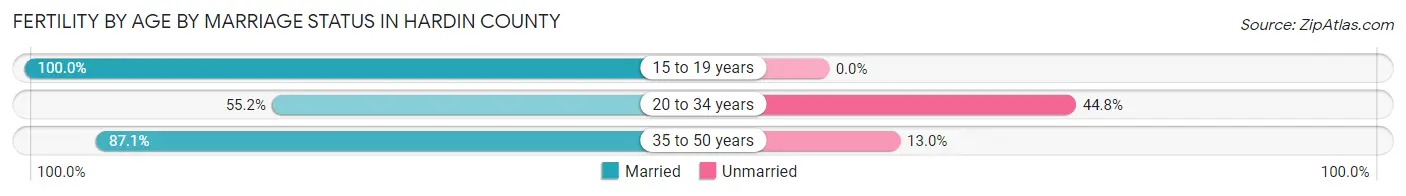
Fertility by Age by Marriage Status in Hardin County
62.8% of women with births (1,300) in Hardin County are married. The highest percentage of unmarried women with births falls into 20 to 34 years age bracket with 44.8% of them unmarried at the time of birth, while the lowest percentage of unmarried women with births belong to 15 to 19 years age bracket with 0.0% of them unmarried.
| Age Bracket | Married | Unmarried |
| 15 to 19 years | 82 (100.0%) | 0 (0.0%) |
| 20 to 34 years | 566 (55.2%) | 459 (44.8%) |
| 35 to 50 years | 168 (87.1%) | 25 (13.0%) |
| Total | 816 (62.8%) | 484 (37.2%) |
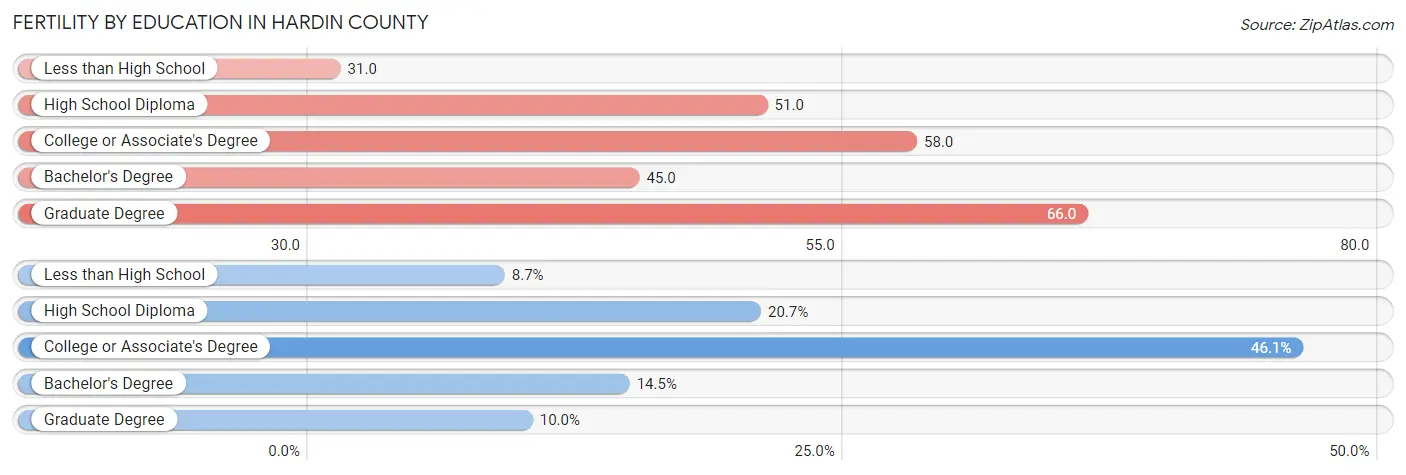
Fertility by Education in Hardin County
Average fertility rate in Hardin County is 51.0 births per 1,000 women. Women with the education attainment of graduate degree have the highest fertility rate of 66.0 births per 1,000 women, while women with the education attainment of less than high school have the lowest fertility at 31.0 births per 1,000 women. Women with the education attainment of college or associate's degree represent 46.1% of all women with births.
| Educational Attainment | Women with Births | Births / 1,000 Women |
| Less than High School | 113 (8.7%) | 31.0 |
| High School Diploma | 269 (20.7%) | 51.0 |
| College or Associate's Degree | 599 (46.1%) | 58.0 |
| Bachelor's Degree | 189 (14.5%) | 45.0 |
| Graduate Degree | 130 (10.0%) | 66.0 |
| Total | 1,300 (100.0%) | 51.0 |
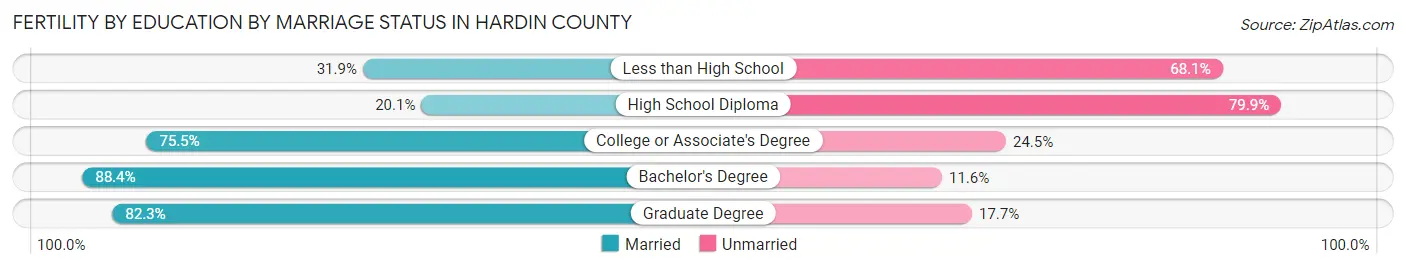
Fertility by Education by Marriage Status in Hardin County
37.2% of women with births in Hardin County are unmarried. Women with the educational attainment of bachelor's degree are most likely to be married with 88.4% of them married at childbirth, while women with the educational attainment of high school diploma are least likely to be married with 79.9% of them unmarried at childbirth.
| Educational Attainment | Married | Unmarried |
| Less than High School | 36 (31.9%) | 77 (68.1%) |
| High School Diploma | 54 (20.1%) | 215 (79.9%) |
| College or Associate's Degree | 452 (75.5%) | 147 (24.5%) |
| Bachelor's Degree | 167 (88.4%) | 22 (11.6%) |
| Graduate Degree | 107 (82.3%) | 23 (17.7%) |
| Total | 816 (62.8%) | 484 (37.2%) |
Income in Hardin County
Income Overview in Hardin County
Per Capita Income in Hardin County is $35,226, while median incomes of families and households are $79,590 and $64,136 respectively.
| Characteristic | Number | Measure |
| Per Capita Income | 111,005 | $35,226 |
| Median Family Income | 28,276 | $79,590 |
| Mean Family Income | 28,276 | $106,835 |
| Median Household Income | 42,638 | $64,136 |
| Mean Household Income | 42,638 | $89,362 |
| Income Deficit | 28,276 | $9,425 |
| Wage / Income Gap (%) | 111,005 | 26.57% |
| Wage / Income Gap ($) | 111,005 | 73.43¢ per $1 |
| Gini / Inequality Index | 111,005 | 0.46 |
Earnings by Sex in Hardin County
Average Earnings in Hardin County are $39,432, $45,992 for men and $33,771 for women, a difference of 26.6%.
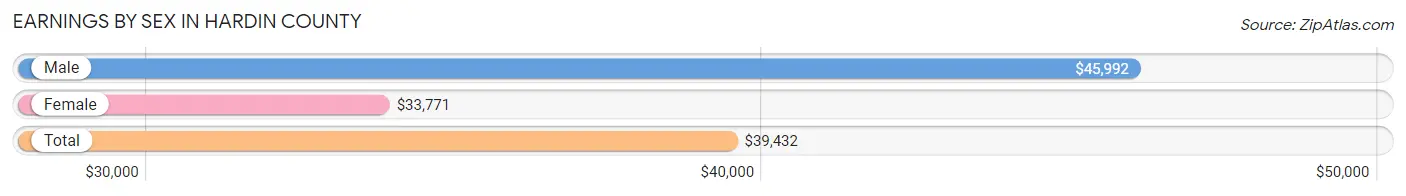
| Sex | Number | Average Earnings |
| Male | 29,862 (53.0%) | $45,992 |
| Female | 26,475 (47.0%) | $33,771 |
| Total | 56,337 (100.0%) | $39,432 |
Earnings by Sex by Income Bracket in Hardin County
The most common earnings brackets in Hardin County are $100,000+ for men (3,926 | 13.2%) and $55,000 to $64,999 for women (2,150 | 8.1%).
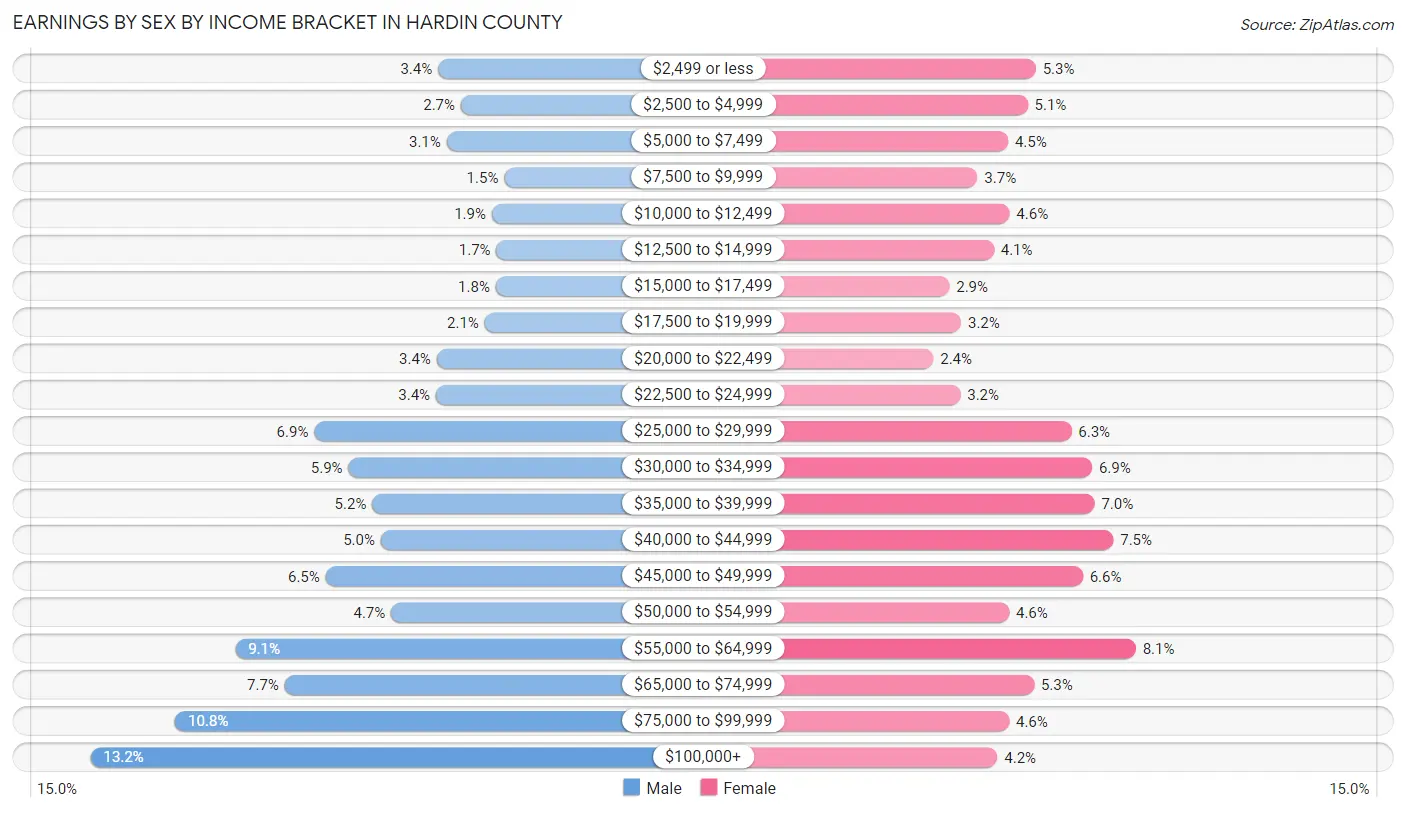
| Income | Male | Female |
| $2,499 or less | 1,010 (3.4%) | 1,406 (5.3%) |
| $2,500 to $4,999 | 817 (2.7%) | 1,345 (5.1%) |
| $5,000 to $7,499 | 939 (3.1%) | 1,199 (4.5%) |
| $7,500 to $9,999 | 454 (1.5%) | 971 (3.7%) |
| $10,000 to $12,499 | 558 (1.9%) | 1,211 (4.6%) |
| $12,500 to $14,999 | 521 (1.7%) | 1,093 (4.1%) |
| $15,000 to $17,499 | 527 (1.8%) | 763 (2.9%) |
| $17,500 to $19,999 | 619 (2.1%) | 850 (3.2%) |
| $20,000 to $22,499 | 1,020 (3.4%) | 643 (2.4%) |
| $22,500 to $24,999 | 1,028 (3.4%) | 845 (3.2%) |
| $25,000 to $29,999 | 2,049 (6.9%) | 1,670 (6.3%) |
| $30,000 to $34,999 | 1,762 (5.9%) | 1,824 (6.9%) |
| $35,000 to $39,999 | 1,563 (5.2%) | 1,842 (7.0%) |
| $40,000 to $44,999 | 1,489 (5.0%) | 1,982 (7.5%) |
| $45,000 to $49,999 | 1,952 (6.5%) | 1,754 (6.6%) |
| $50,000 to $54,999 | 1,404 (4.7%) | 1,208 (4.6%) |
| $55,000 to $64,999 | 2,711 (9.1%) | 2,150 (8.1%) |
| $65,000 to $74,999 | 2,297 (7.7%) | 1,392 (5.3%) |
| $75,000 to $99,999 | 3,216 (10.8%) | 1,206 (4.6%) |
| $100,000+ | 3,926 (13.2%) | 1,121 (4.2%) |
| Total | 29,862 (100.0%) | 26,475 (100.0%) |
Earnings by Sex by Educational Attainment in Hardin County
Average earnings in Hardin County are $51,685 for men and $37,977 for women, a difference of 26.5%. Men with an educational attainment of graduate degree enjoy the highest average annual earnings of $95,881, while those with less than high school education earn the least with $28,926. Women with an educational attainment of graduate degree earn the most with the average annual earnings of $55,074, while those with less than high school education have the smallest earnings of $23,333.
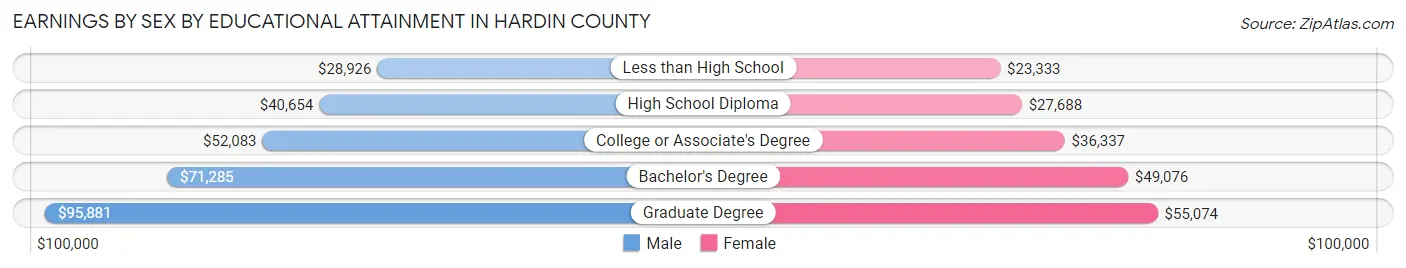
| Educational Attainment | Male Income | Female Income |
| Less than High School | $28,926 | $23,333 |
| High School Diploma | $40,654 | $27,688 |
| College or Associate's Degree | $52,083 | $36,337 |
| Bachelor's Degree | $71,285 | $49,076 |
| Graduate Degree | $95,881 | $55,074 |
| Total | $51,685 | $37,977 |
Family Income in Hardin County
Family Income Brackets in Hardin County
According to the Hardin County family income data, there are 6,108 families falling into the $100,000 to $149,999 income range, which is the most common income bracket and makes up 21.6% of all families. Conversely, the $10,000 to $14,999 income bracket is the least frequent group with only 481 families (1.7%) belonging to this category.
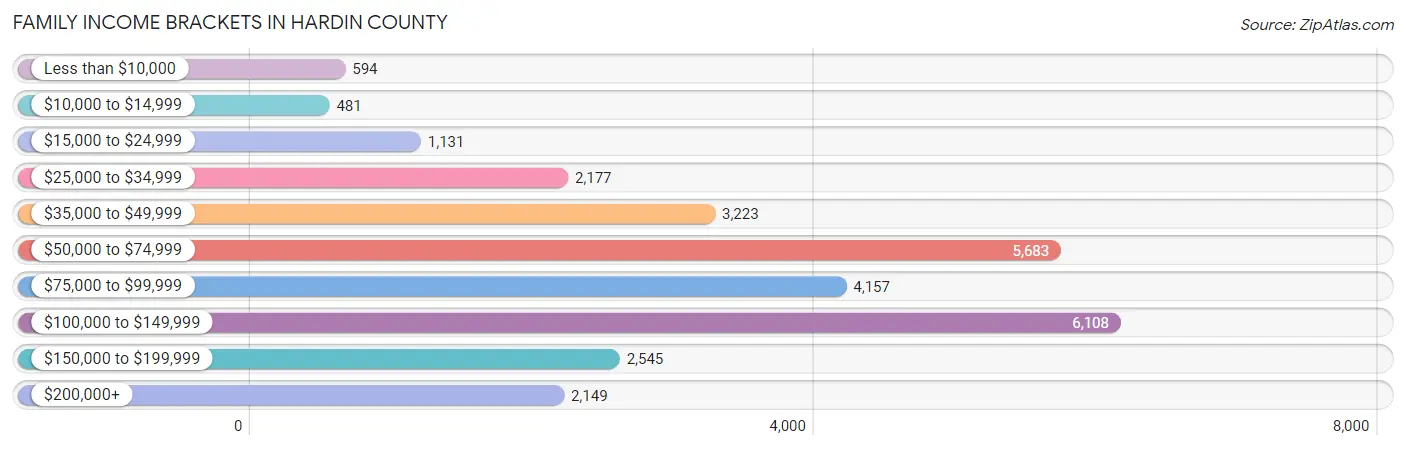
| Income Bracket | # Families | % Families |
| Less than $10,000 | 594 | 2.1% |
| $10,000 to $14,999 | 481 | 1.7% |
| $15,000 to $24,999 | 1,131 | 4.0% |
| $25,000 to $34,999 | 2,177 | 7.7% |
| $35,000 to $49,999 | 3,223 | 11.4% |
| $50,000 to $74,999 | 5,683 | 20.1% |
| $75,000 to $99,999 | 4,157 | 14.7% |
| $100,000 to $149,999 | 6,108 | 21.6% |
| $150,000 to $199,999 | 2,545 | 9.0% |
| $200,000+ | 2,149 | 7.6% |
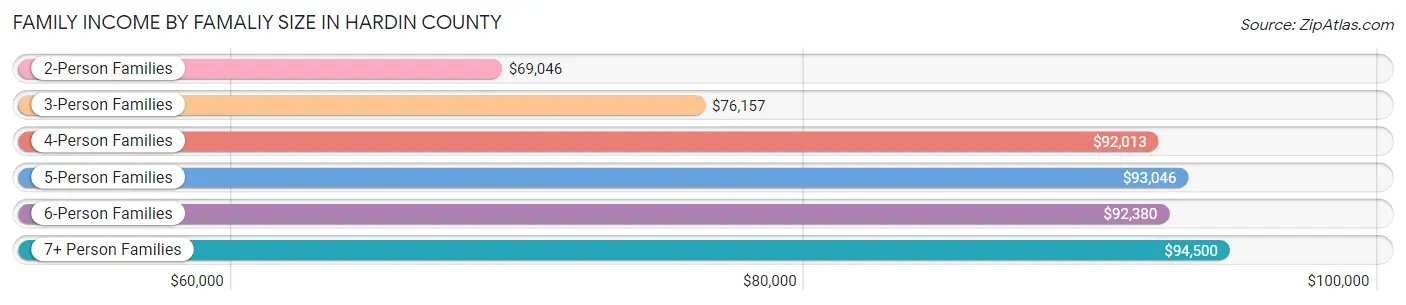
Family Income by Famaliy Size in Hardin County
7+ person families (504 | 1.8%) account for the highest median family income in Hardin County with $94,500 per family, while 2-person families (13,994 | 49.5%) have the highest median income of $34,523 per family member.
| Income Bracket | # Families | Median Income |
| 2-Person Families | 13,994 (49.5%) | $69,046 |
| 3-Person Families | 6,122 (21.6%) | $76,157 |
| 4-Person Families | 4,425 (15.7%) | $92,013 |
| 5-Person Families | 2,326 (8.2%) | $93,046 |
| 6-Person Families | 905 (3.2%) | $92,380 |
| 7+ Person Families | 504 (1.8%) | $94,500 |
| Total | 28,276 (100.0%) | $79,590 |
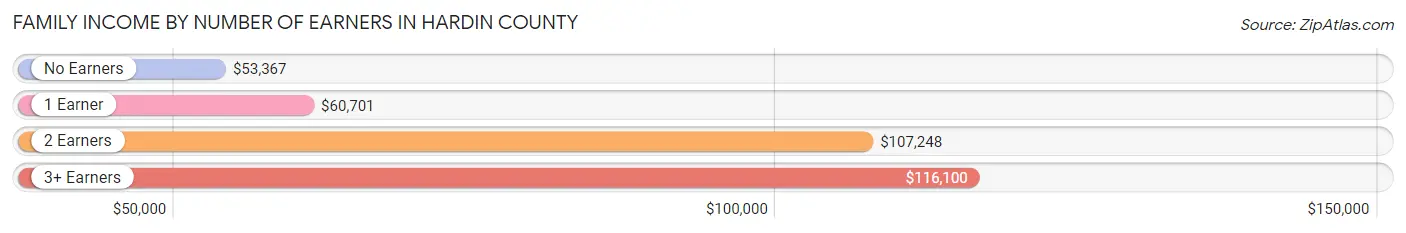
Family Income by Number of Earners in Hardin County
The median family income in Hardin County is $79,590, with families comprising 3+ earners (2,880) having the highest median family income of $116,100, while families with no earners (4,297) have the lowest median family income of $53,367, accounting for 10.2% and 15.2% of families, respectively.
| Number of Earners | # Families | Median Income |
| No Earners | 4,297 (15.2%) | $53,367 |
| 1 Earner | 10,158 (35.9%) | $60,701 |
| 2 Earners | 10,941 (38.7%) | $107,248 |
| 3+ Earners | 2,880 (10.2%) | $116,100 |
| Total | 28,276 (100.0%) | $79,590 |
Household Income in Hardin County
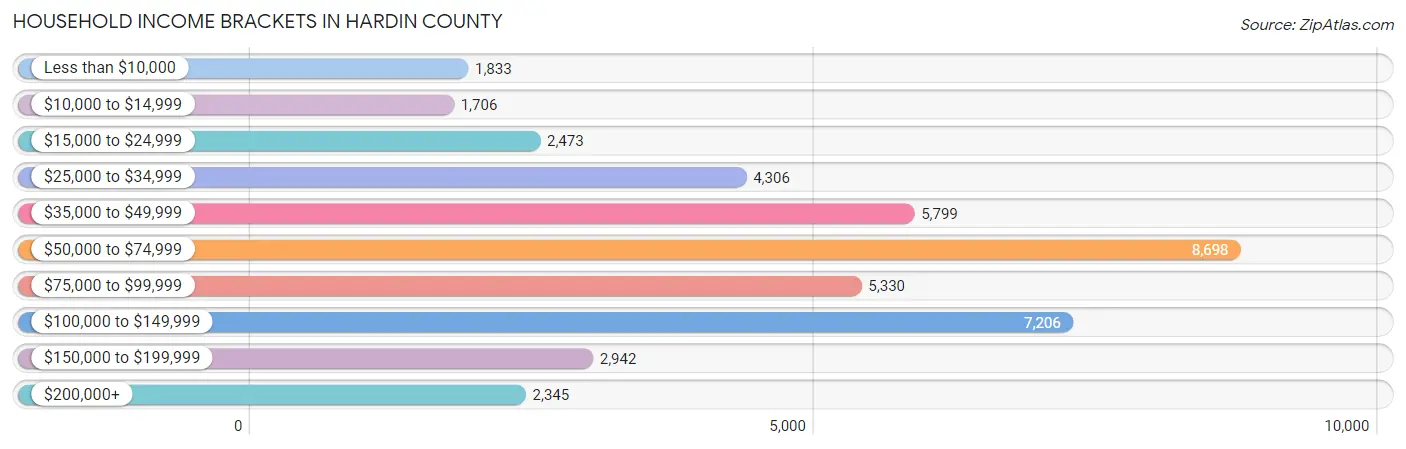
Household Income Brackets in Hardin County
With 8,698 households falling in the category, the $50,000 to $74,999 income range is the most frequent in Hardin County, accounting for 20.4% of all households. In contrast, only 1,706 households (4.0%) fall into the $10,000 to $14,999 income bracket, making it the least populous group.
| Income Bracket | # Households | % Households |
| Less than $10,000 | 1,833 | 4.3% |
| $10,000 to $14,999 | 1,706 | 4.0% |
| $15,000 to $24,999 | 2,473 | 5.8% |
| $25,000 to $34,999 | 4,306 | 10.1% |
| $35,000 to $49,999 | 5,799 | 13.6% |
| $50,000 to $74,999 | 8,698 | 20.4% |
| $75,000 to $99,999 | 5,330 | 12.5% |
| $100,000 to $149,999 | 7,206 | 16.9% |
| $150,000 to $199,999 | 2,942 | 6.9% |
| $200,000+ | 2,345 | 5.5% |
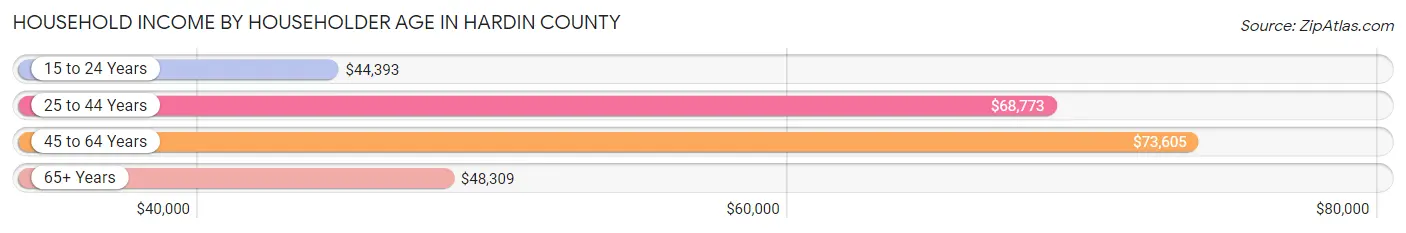
Household Income by Householder Age in Hardin County
The median household income in Hardin County is $64,136, with the highest median household income of $73,605 found in the 45 to 64 years age bracket for the primary householder. A total of 16,300 households (38.2%) fall into this category. Meanwhile, the 15 to 24 years age bracket for the primary householder has the lowest median household income of $44,393, with 1,584 households (3.7%) in this group.
| Income Bracket | # Households | Median Income |
| 15 to 24 Years | 1,584 (3.7%) | $44,393 |
| 25 to 44 Years | 14,285 (33.5%) | $68,773 |
| 45 to 64 Years | 16,300 (38.2%) | $73,605 |
| 65+ Years | 10,469 (24.5%) | $48,309 |
| Total | 42,638 (100.0%) | $64,136 |
Poverty in Hardin County
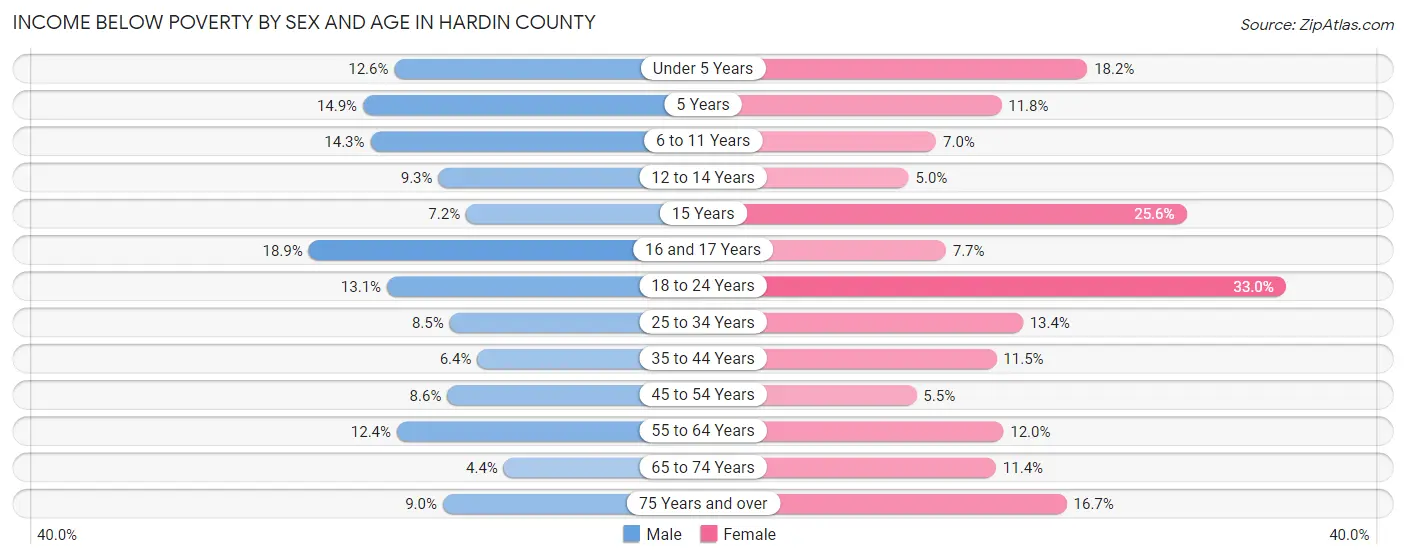
Income Below Poverty by Sex and Age in Hardin County
With 10.0% poverty level for males and 13.0% for females among the residents of Hardin County, 16 and 17 year old males and 18 to 24 year old females are the most vulnerable to poverty, with 309 males (18.9%) and 1,444 females (33.0%) in their respective age groups living below the poverty level.
| Age Bracket | Male | Female |
| Under 5 Years | 425 (12.6%) | 622 (18.2%) |
| 5 Years | 75 (14.9%) | 69 (11.8%) |
| 6 to 11 Years | 660 (14.3%) | 339 (7.0%) |
| 12 to 14 Years | 254 (9.3%) | 96 (5.0%) |
| 15 Years | 48 (7.2%) | 208 (25.6%) |
| 16 and 17 Years | 309 (18.9%) | 116 (7.7%) |
| 18 to 24 Years | 571 (13.1%) | 1,444 (33.0%) |
| 25 to 34 Years | 594 (8.5%) | 941 (13.4%) |
| 35 to 44 Years | 460 (6.4%) | 850 (11.5%) |
| 45 to 54 Years | 595 (8.6%) | 374 (5.5%) |
| 55 to 64 Years | 854 (12.4%) | 872 (12.0%) |
| 65 to 74 Years | 203 (4.4%) | 599 (11.4%) |
| 75 Years and over | 219 (8.9%) | 604 (16.7%) |
| Total | 5,267 (10.0%) | 7,134 (13.0%) |
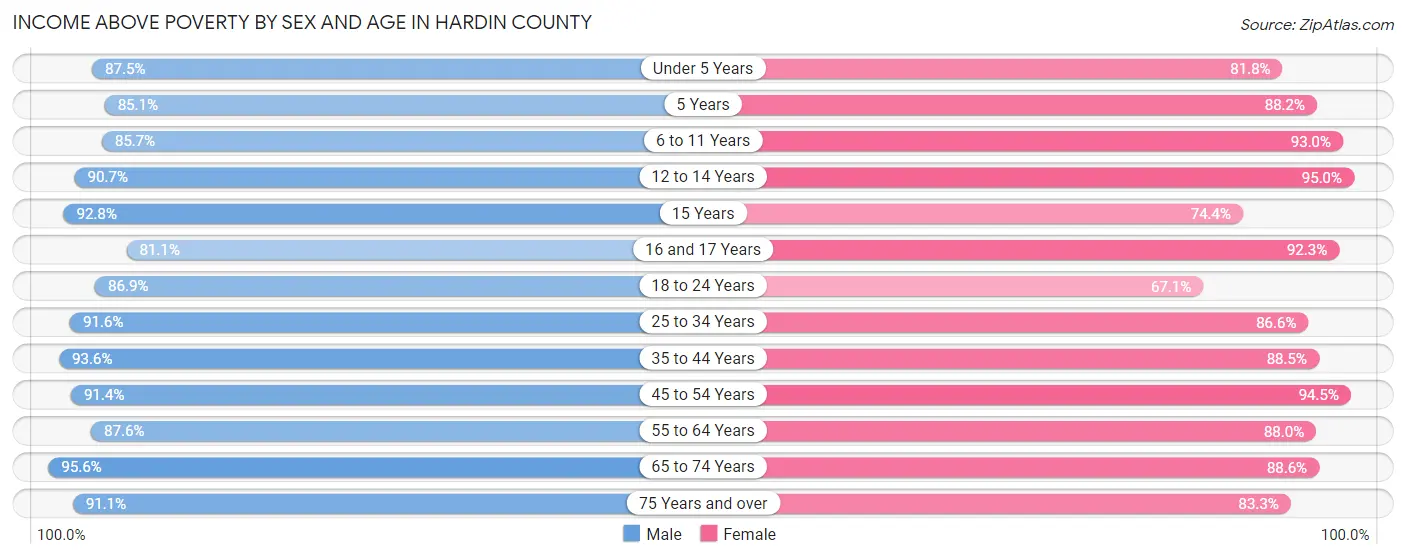
Income Above Poverty by Sex and Age in Hardin County
According to the poverty statistics in Hardin County, males aged 65 to 74 years and females aged 12 to 14 years are the age groups that are most secure financially, with 95.6% of males and 95.0% of females in these age groups living above the poverty line.
| Age Bracket | Male | Female |
| Under 5 Years | 2,962 (87.5%) | 2,792 (81.8%) |
| 5 Years | 429 (85.1%) | 514 (88.2%) |
| 6 to 11 Years | 3,947 (85.7%) | 4,503 (93.0%) |
| 12 to 14 Years | 2,483 (90.7%) | 1,838 (95.0%) |
| 15 Years | 616 (92.8%) | 605 (74.4%) |
| 16 and 17 Years | 1,324 (81.1%) | 1,387 (92.3%) |
| 18 to 24 Years | 3,789 (86.9%) | 2,939 (67.0%) |
| 25 to 34 Years | 6,433 (91.5%) | 6,064 (86.6%) |
| 35 to 44 Years | 6,736 (93.6%) | 6,551 (88.5%) |
| 45 to 54 Years | 6,306 (91.4%) | 6,380 (94.5%) |
| 55 to 64 Years | 6,053 (87.6%) | 6,401 (88.0%) |
| 65 to 74 Years | 4,383 (95.6%) | 4,637 (88.6%) |
| 75 Years and over | 2,227 (91.0%) | 3,015 (83.3%) |
| Total | 47,688 (90.0%) | 47,626 (87.0%) |
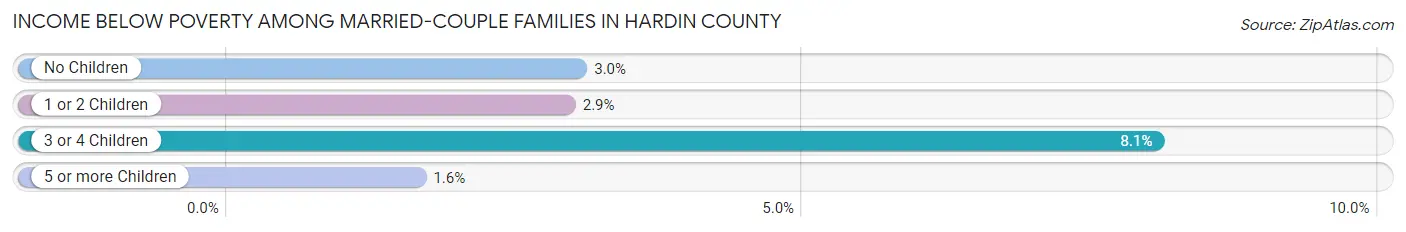
Income Below Poverty Among Married-Couple Families in Hardin County
The poverty statistics for married-couple families in Hardin County show that 3.4% or 697 of the total 20,296 families live below the poverty line. Families with 3 or 4 children have the highest poverty rate of 8.1%, comprising of 143 families. On the other hand, families with 5 or more children have the lowest poverty rate of 1.6%, which includes 4 families.
| Children | Above Poverty | Below Poverty |
| No Children | 11,596 (97.0%) | 364 (3.0%) |
| 1 or 2 Children | 6,131 (97.1%) | 186 (2.9%) |
| 3 or 4 Children | 1,632 (91.9%) | 143 (8.1%) |
| 5 or more Children | 240 (98.4%) | 4 (1.6%) |
| Total | 19,599 (96.6%) | 697 (3.4%) |
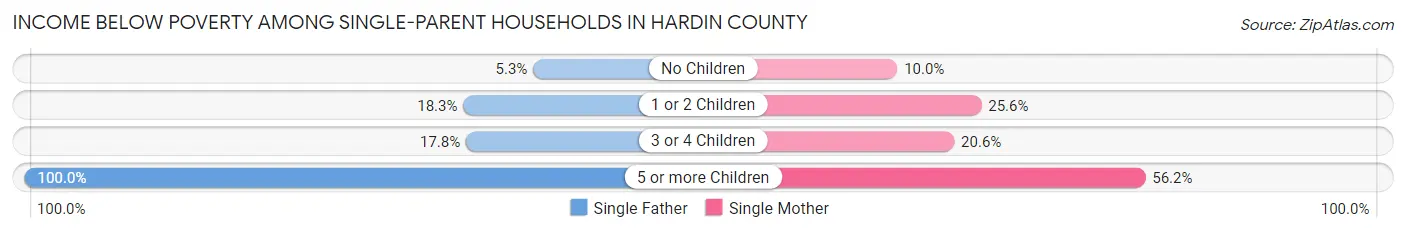
Income Below Poverty Among Single-Parent Households in Hardin County
According to the poverty data in Hardin County, 13.3% or 380 single-father households and 20.7% or 1,061 single-mother households are living below the poverty line. Among single-father households, those with 5 or more children have the highest poverty rate, with 8 households (100.0%) experiencing poverty. Likewise, among single-mother households, those with 5 or more children have the highest poverty rate, with 50 households (56.2%) falling below the poverty line.
| Children | Single Father | Single Mother |
| No Children | 60 (5.3%) | 159 (10.0%) |
| 1 or 2 Children | 288 (18.3%) | 731 (25.6%) |
| 3 or 4 Children | 24 (17.8%) | 121 (20.6%) |
| 5 or more Children | 8 (100.0%) | 50 (56.2%) |
| Total | 380 (13.3%) | 1,061 (20.7%) |
Income Below Poverty Among Married-Couple vs Single-Parent Households in Hardin County
The poverty data for Hardin County shows that 697 of the married-couple family households (3.4%) and 1,441 of the single-parent households (18.1%) are living below the poverty level. Within the married-couple family households, those with 3 or 4 children have the highest poverty rate, with 143 households (8.1%) falling below the poverty line. Among the single-parent households, those with 5 or more children have the highest poverty rate, with 58 household (59.8%) living below poverty.
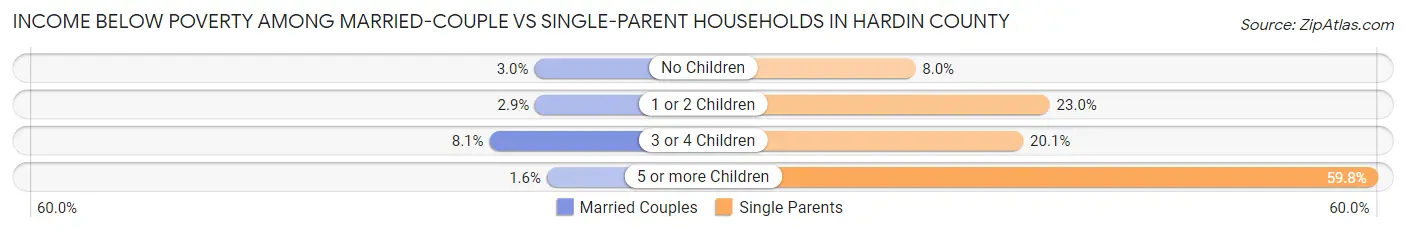
| Children | Married-Couple Families | Single-Parent Households |
| No Children | 364 (3.0%) | 219 (8.0%) |
| 1 or 2 Children | 186 (2.9%) | 1,019 (23.0%) |
| 3 or 4 Children | 143 (8.1%) | 145 (20.1%) |
| 5 or more Children | 4 (1.6%) | 58 (59.8%) |
| Total | 697 (3.4%) | 1,441 (18.1%) |
Employment Characteristics in Hardin County
Employment by Class of Employer in Hardin County
Among the 49,975 employed individuals in Hardin County, private company employees (31,854 | 63.7%), federal government employees (7,677 | 15.4%), and not-for-profit organizations (2,728 | 5.5%) make up the most common classes of employment.
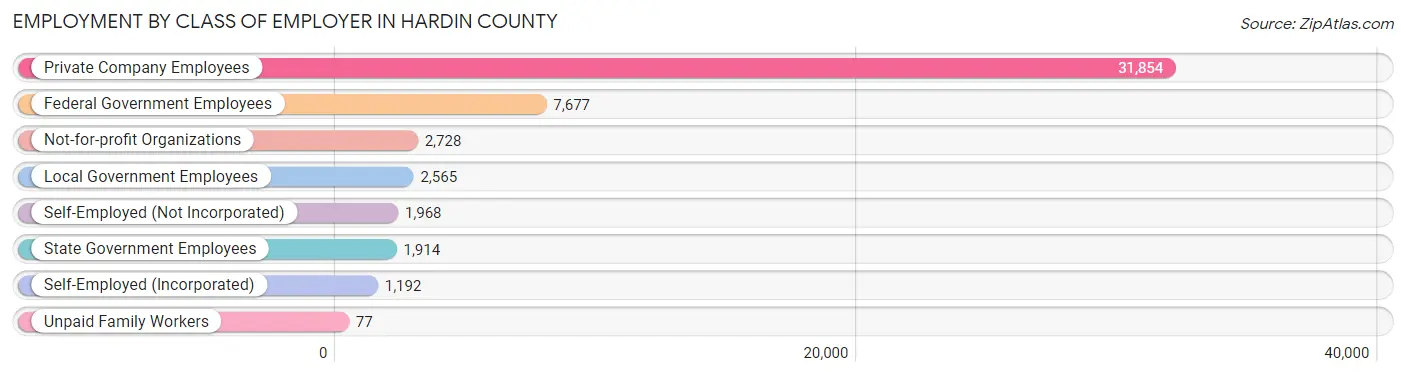
| Employer Class | # Employees | % Employees |
| Private Company Employees | 31,854 | 63.7% |
| Self-Employed (Incorporated) | 1,192 | 2.4% |
| Self-Employed (Not Incorporated) | 1,968 | 3.9% |
| Not-for-profit Organizations | 2,728 | 5.5% |
| Local Government Employees | 2,565 | 5.1% |
| State Government Employees | 1,914 | 3.8% |
| Federal Government Employees | 7,677 | 15.4% |
| Unpaid Family Workers | 77 | 0.2% |
| Total | 49,975 | 100.0% |
Employment Status by Age in Hardin County
According to the labor force statistics for Hardin County, out of the total population over 16 years of age (86,895), 62.7% or 54,483 individuals are in the labor force, with 6.8% or 3,705 of them unemployed. The age group with the highest labor force participation rate is 30 to 34 years, with 84.1% or 6,142 individuals in the labor force. Within the labor force, the 16 to 19 years age range has the highest percentage of unemployed individuals, with 22.8% or 603 of them being unemployed.
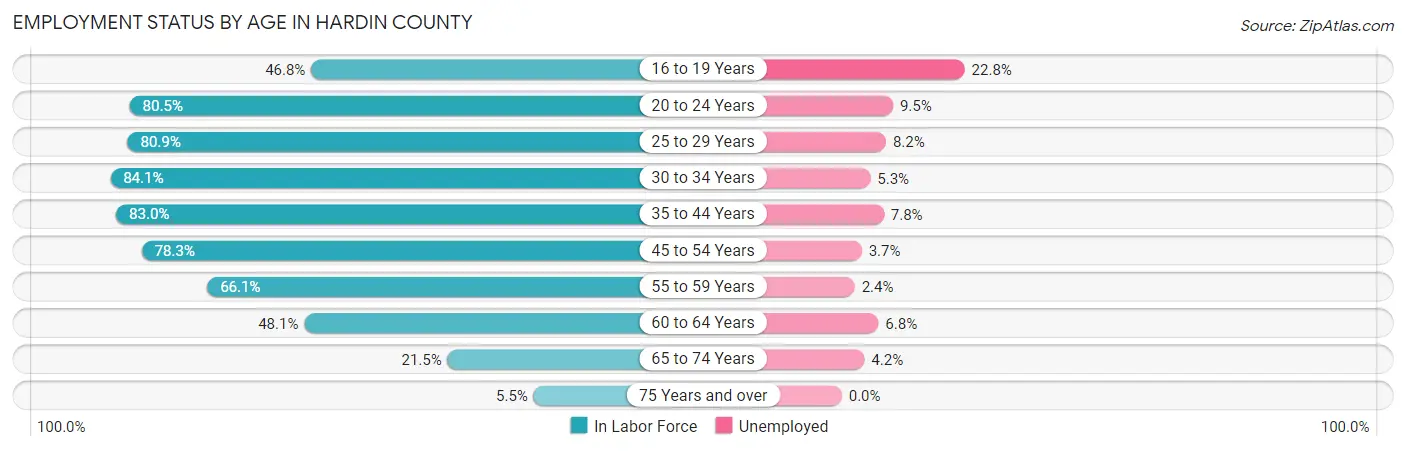
| Age Bracket | In Labor Force | Unemployed |
| 16 to 19 Years | 2,643 (46.8%) | 603 (22.8%) |
| 20 to 24 Years | 5,955 (80.5%) | 566 (9.5%) |
| 25 to 29 Years | 5,978 (80.9%) | 490 (8.2%) |
| 30 to 34 Years | 6,142 (84.1%) | 326 (5.3%) |
| 35 to 44 Years | 12,307 (83.0%) | 960 (7.8%) |
| 45 to 54 Years | 10,845 (78.3%) | 401 (3.7%) |
| 55 to 59 Years | 4,679 (66.1%) | 112 (2.4%) |
| 60 to 64 Years | 3,472 (48.1%) | 236 (6.8%) |
| 65 to 74 Years | 2,122 (21.5%) | 89 (4.2%) |
| 75 Years and over | 347 (5.5%) | 0 (0.0%) |
| Total | 54,483 (62.7%) | 3,705 (6.8%) |
Employment Status by Educational Attainment in Hardin County
According to labor force statistics for Hardin County, 75.3% of individuals (43,423) out of the total population between 25 and 64 years of age (57,667) are in the labor force, with 5.8% or 2,519 of them being unemployed. The group with the highest labor force participation rate are those with the educational attainment of bachelor's degree or higher, with 85.3% or 12,210 individuals in the labor force. Within the labor force, individuals with less than high school education have the highest percentage of unemployment, with 20.5% or 463 of them being unemployed.
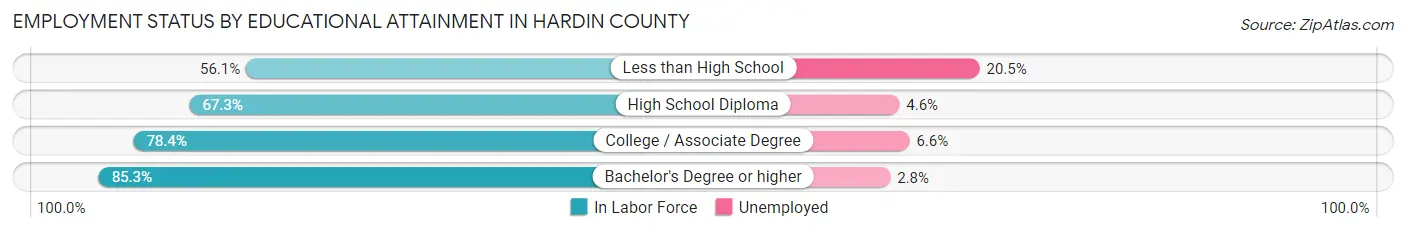
| Educational Attainment | In Labor Force | Unemployed |
| Less than High School | 2,257 (56.1%) | 825 (20.5%) |
| High School Diploma | 11,288 (67.3%) | 772 (4.6%) |
| College / Associate Degree | 17,685 (78.4%) | 1,489 (6.6%) |
| Bachelor's Degree or higher | 12,210 (85.3%) | 401 (2.8%) |
| Total | 43,423 (75.3%) | 3,345 (5.8%) |
Employment Occupations by Sex in Hardin County
Management, Business, Science and Arts Occupations
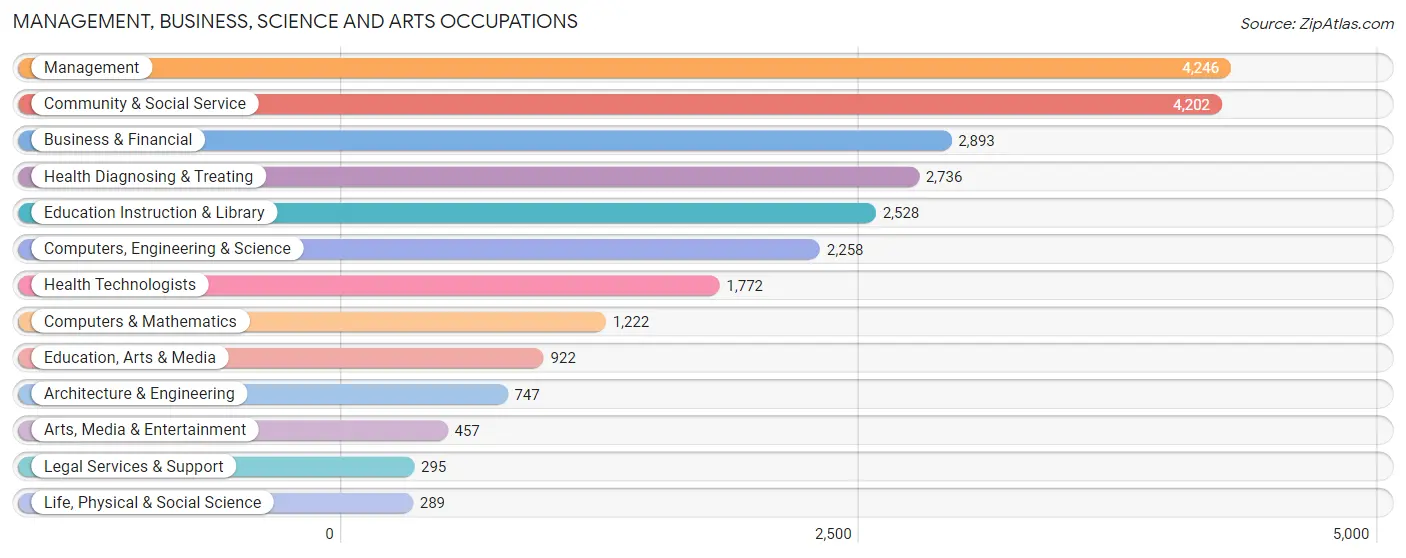
The most common Management, Business, Science and Arts occupations in Hardin County are Management (4,246 | 9.0%), Community & Social Service (4,202 | 8.9%), Business & Financial (2,893 | 6.1%), Health Diagnosing & Treating (2,736 | 5.8%), and Education Instruction & Library (2,528 | 5.3%).
Management, Business, Science and Arts Occupations by Sex
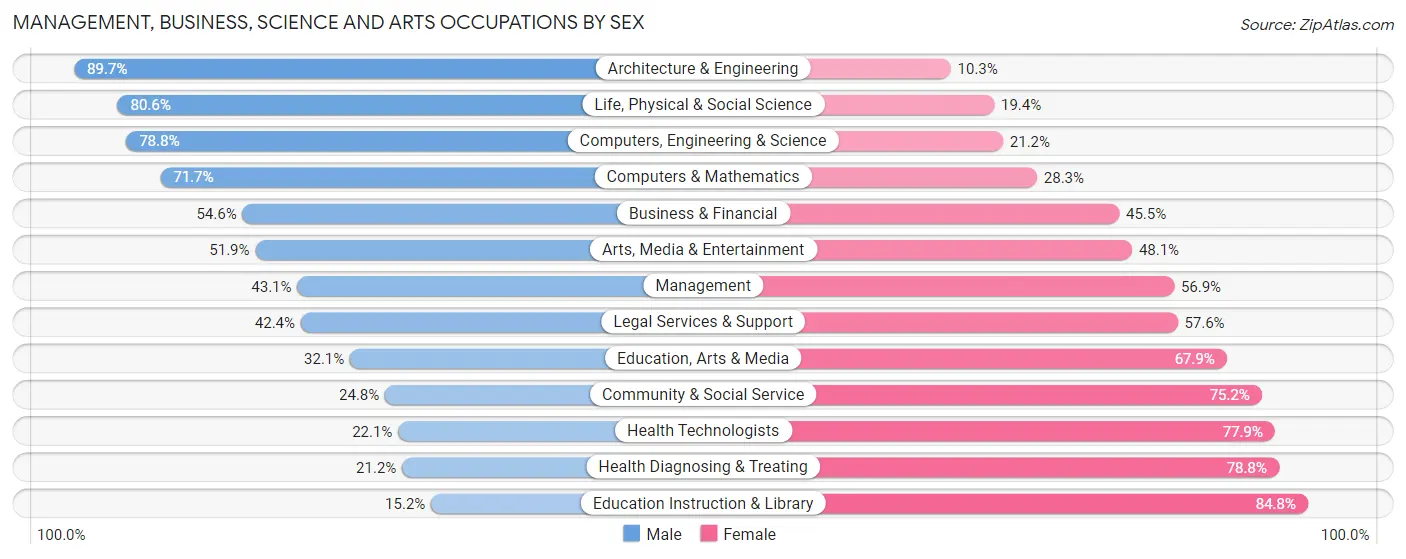
Within the Management, Business, Science and Arts occupations in Hardin County, the most male-oriented occupations are Architecture & Engineering (89.7%), Life, Physical & Social Science (80.6%), and Computers, Engineering & Science (78.8%), while the most female-oriented occupations are Education Instruction & Library (84.8%), Health Diagnosing & Treating (78.8%), and Health Technologists (77.9%).
| Occupation | Male | Female |
| Management | 1,830 (43.1%) | 2,416 (56.9%) |
| Business & Financial | 1,578 (54.5%) | 1,315 (45.5%) |
| Computers, Engineering & Science | 1,779 (78.8%) | 479 (21.2%) |
| Computers & Mathematics | 876 (71.7%) | 346 (28.3%) |
| Architecture & Engineering | 670 (89.7%) | 77 (10.3%) |
| Life, Physical & Social Science | 233 (80.6%) | 56 (19.4%) |
| Community & Social Service | 1,042 (24.8%) | 3,160 (75.2%) |
| Education, Arts & Media | 296 (32.1%) | 626 (67.9%) |
| Legal Services & Support | 125 (42.4%) | 170 (57.6%) |
| Education Instruction & Library | 384 (15.2%) | 2,144 (84.8%) |
| Arts, Media & Entertainment | 237 (51.9%) | 220 (48.1%) |
| Health Diagnosing & Treating | 581 (21.2%) | 2,155 (78.8%) |
| Health Technologists | 391 (22.1%) | 1,381 (77.9%) |
| Total (Category) | 6,810 (41.7%) | 9,525 (58.3%) |
| Total (Overall) | 24,623 (52.0%) | 22,725 (48.0%) |
Services Occupations
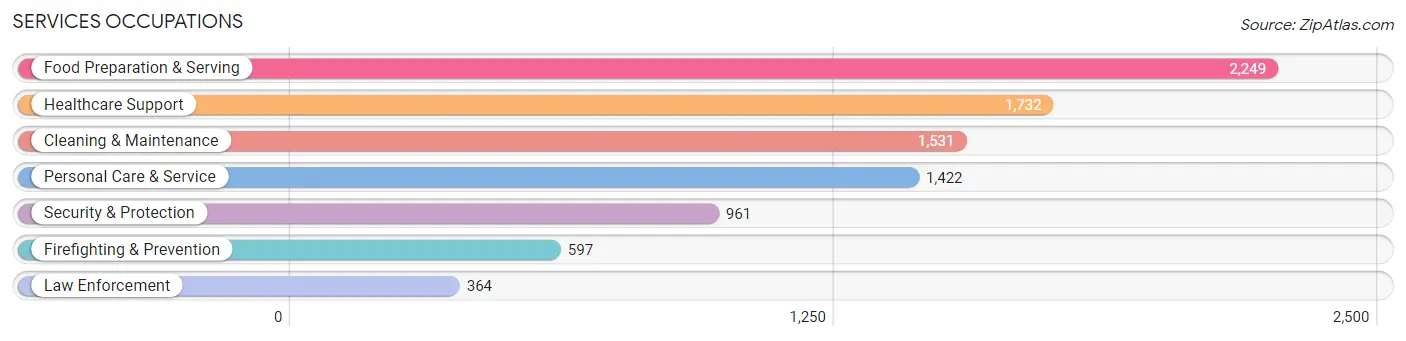
The most common Services occupations in Hardin County are Food Preparation & Serving (2,249 | 4.8%), Healthcare Support (1,732 | 3.7%), Cleaning & Maintenance (1,531 | 3.2%), Personal Care & Service (1,422 | 3.0%), and Security & Protection (961 | 2.0%).
Services Occupations by Sex
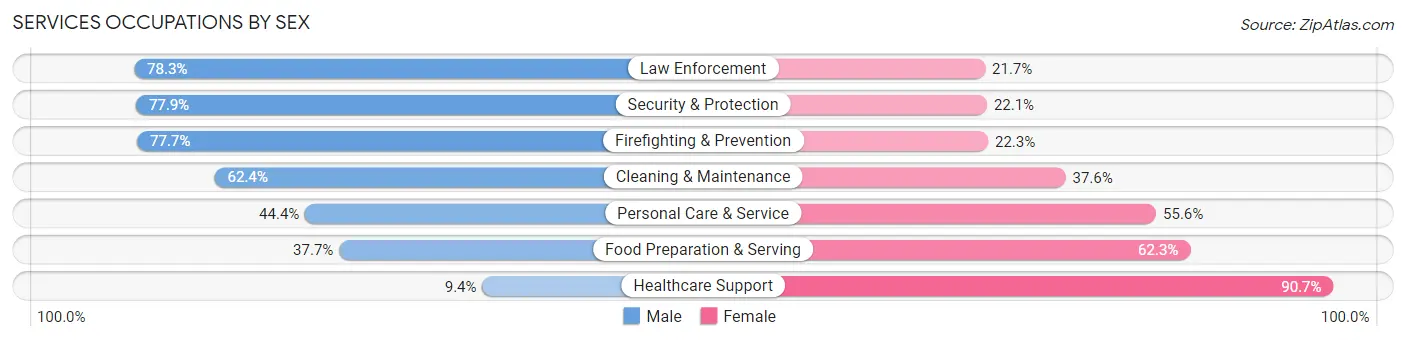
Within the Services occupations in Hardin County, the most male-oriented occupations are Law Enforcement (78.3%), Security & Protection (77.9%), and Firefighting & Prevention (77.7%), while the most female-oriented occupations are Healthcare Support (90.6%), Food Preparation & Serving (62.3%), and Personal Care & Service (55.6%).
| Occupation | Male | Female |
| Healthcare Support | 162 (9.3%) | 1,570 (90.6%) |
| Security & Protection | 749 (77.9%) | 212 (22.1%) |
| Firefighting & Prevention | 464 (77.7%) | 133 (22.3%) |
| Law Enforcement | 285 (78.3%) | 79 (21.7%) |
| Food Preparation & Serving | 848 (37.7%) | 1,401 (62.3%) |
| Cleaning & Maintenance | 955 (62.4%) | 576 (37.6%) |
| Personal Care & Service | 632 (44.4%) | 790 (55.6%) |
| Total (Category) | 3,346 (42.4%) | 4,549 (57.6%) |
| Total (Overall) | 24,623 (52.0%) | 22,725 (48.0%) |
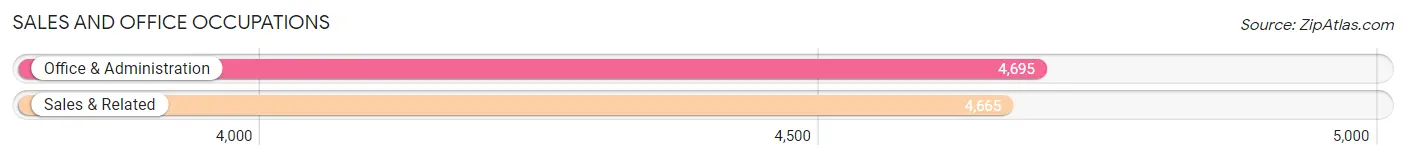
Sales and Office Occupations
The most common Sales and Office occupations in Hardin County are Office & Administration (4,695 | 9.9%), and Sales & Related (4,665 | 9.9%).
Sales and Office Occupations by Sex
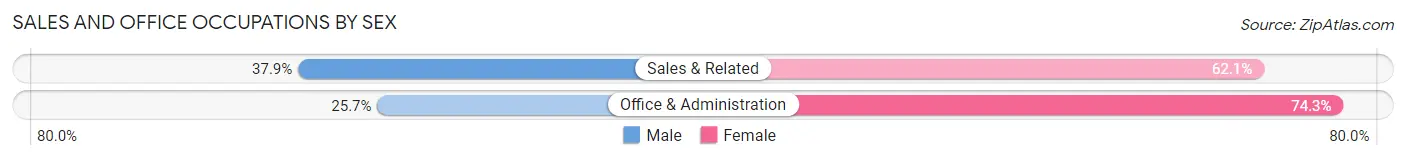
| Occupation | Male | Female |
| Sales & Related | 1,769 (37.9%) | 2,896 (62.1%) |
| Office & Administration | 1,208 (25.7%) | 3,487 (74.3%) |
| Total (Category) | 2,977 (31.8%) | 6,383 (68.2%) |
| Total (Overall) | 24,623 (52.0%) | 22,725 (48.0%) |
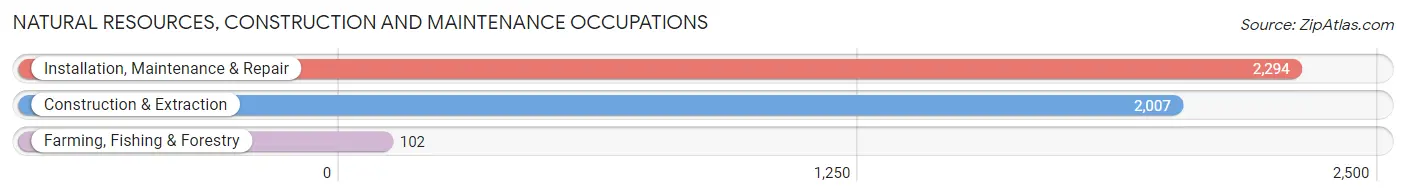
Natural Resources, Construction and Maintenance Occupations
The most common Natural Resources, Construction and Maintenance occupations in Hardin County are Installation, Maintenance & Repair (2,294 | 4.8%), Construction & Extraction (2,007 | 4.2%), and Farming, Fishing & Forestry (102 | 0.2%).
Natural Resources, Construction and Maintenance Occupations by Sex
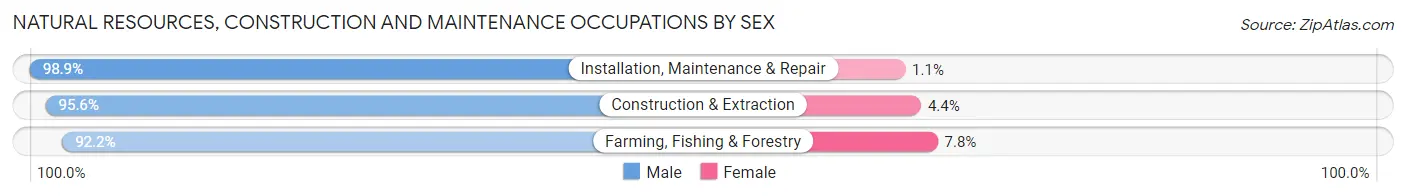
| Occupation | Male | Female |
| Farming, Fishing & Forestry | 94 (92.2%) | 8 (7.8%) |
| Construction & Extraction | 1,919 (95.6%) | 88 (4.4%) |
| Installation, Maintenance & Repair | 2,269 (98.9%) | 25 (1.1%) |
| Total (Category) | 4,282 (97.3%) | 121 (2.8%) |
| Total (Overall) | 24,623 (52.0%) | 22,725 (48.0%) |
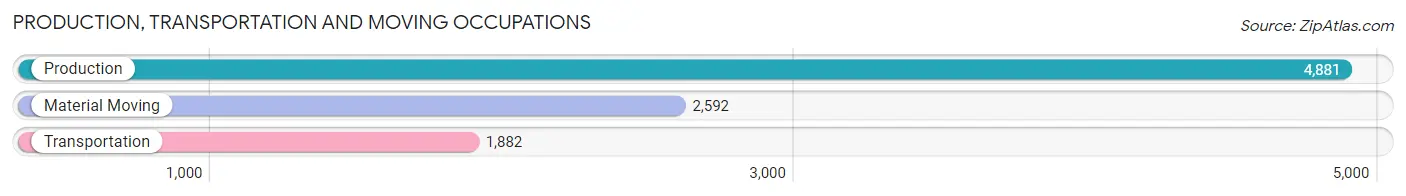
Production, Transportation and Moving Occupations
The most common Production, Transportation and Moving occupations in Hardin County are Production (4,881 | 10.3%), Material Moving (2,592 | 5.5%), and Transportation (1,882 | 4.0%).
Production, Transportation and Moving Occupations by Sex
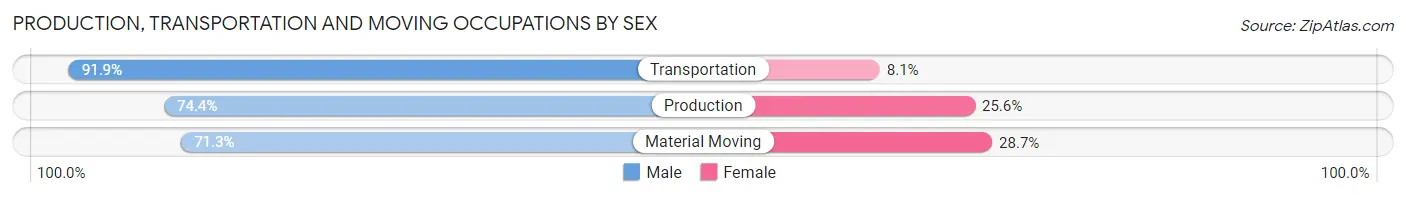
| Occupation | Male | Female |
| Production | 3,632 (74.4%) | 1,249 (25.6%) |
| Transportation | 1,729 (91.9%) | 153 (8.1%) |
| Material Moving | 1,847 (71.3%) | 745 (28.7%) |
| Total (Category) | 7,208 (77.0%) | 2,147 (23.0%) |
| Total (Overall) | 24,623 (52.0%) | 22,725 (48.0%) |
Employment Industries by Sex in Hardin County
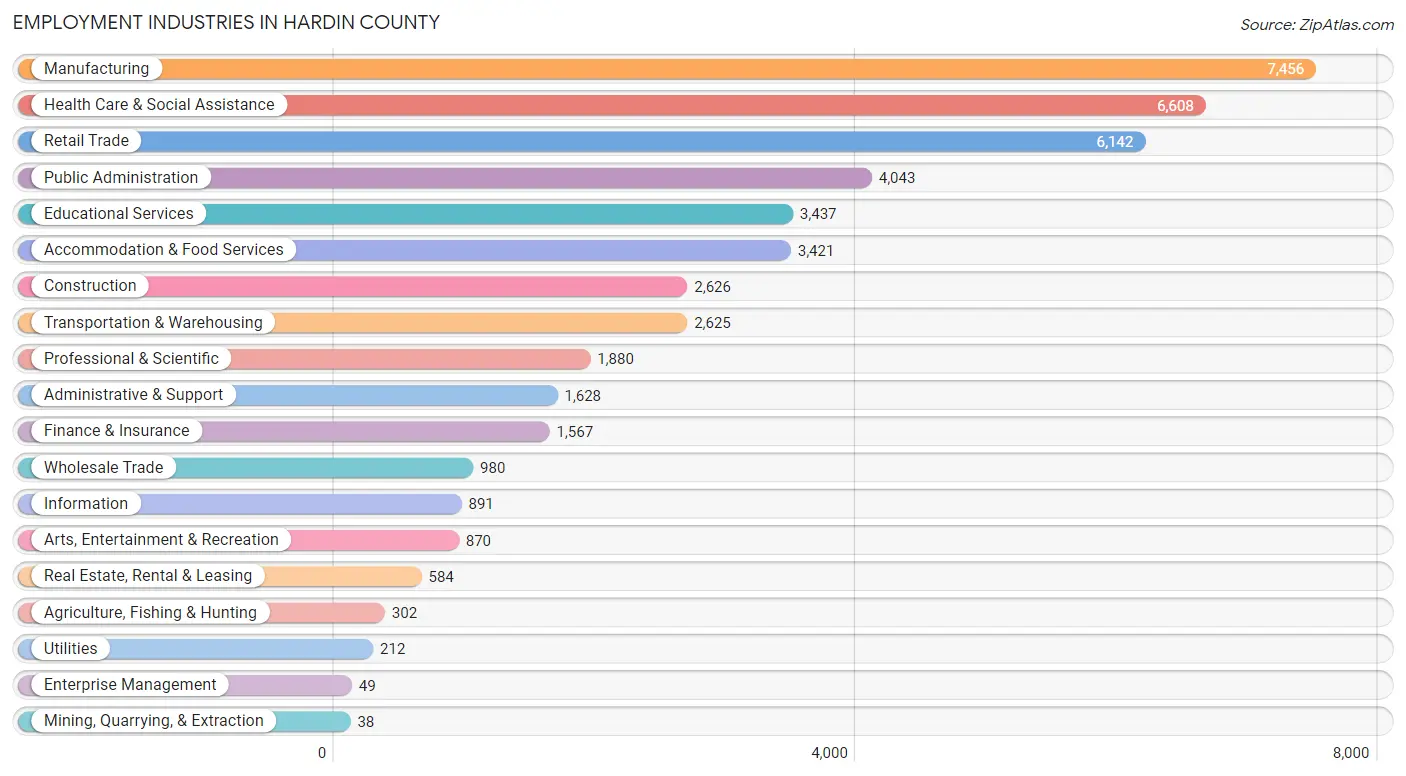
Employment Industries in Hardin County
The major employment industries in Hardin County include Manufacturing (7,456 | 15.8%), Health Care & Social Assistance (6,608 | 14.0%), Retail Trade (6,142 | 13.0%), Public Administration (4,043 | 8.5%), and Educational Services (3,437 | 7.3%).
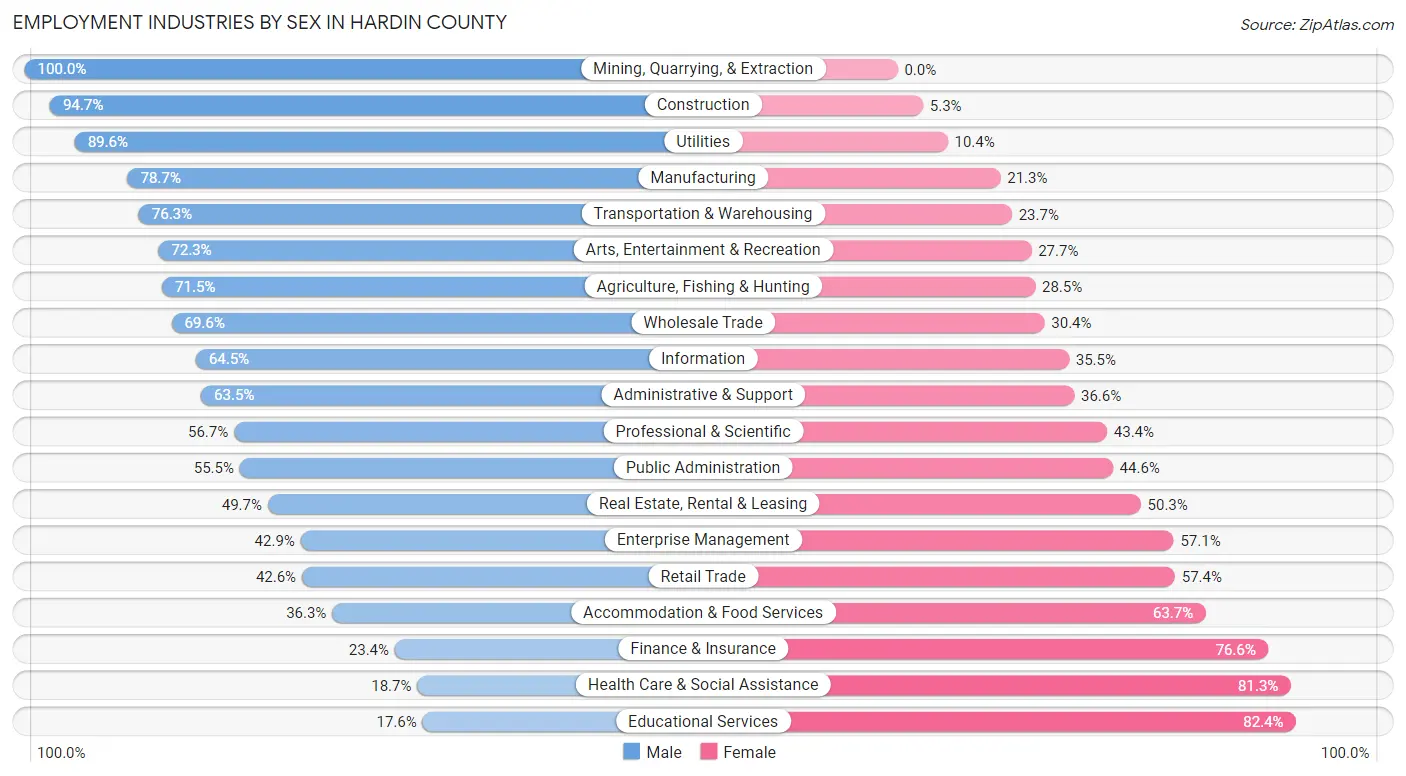
Employment Industries by Sex in Hardin County
The Hardin County industries that see more men than women are Mining, Quarrying, & Extraction (100.0%), Construction (94.7%), and Utilities (89.6%), whereas the industries that tend to have a higher number of women are Educational Services (82.4%), Health Care & Social Assistance (81.3%), and Finance & Insurance (76.6%).
| Industry | Male | Female |
| Agriculture, Fishing & Hunting | 216 (71.5%) | 86 (28.5%) |
| Mining, Quarrying, & Extraction | 38 (100.0%) | 0 (0.0%) |
| Construction | 2,488 (94.7%) | 138 (5.3%) |
| Manufacturing | 5,868 (78.7%) | 1,588 (21.3%) |
| Wholesale Trade | 682 (69.6%) | 298 (30.4%) |
| Retail Trade | 2,616 (42.6%) | 3,526 (57.4%) |
| Transportation & Warehousing | 2,004 (76.3%) | 621 (23.7%) |
| Utilities | 190 (89.6%) | 22 (10.4%) |
| Information | 575 (64.5%) | 316 (35.5%) |
| Finance & Insurance | 366 (23.4%) | 1,201 (76.6%) |
| Real Estate, Rental & Leasing | 290 (49.7%) | 294 (50.3%) |
| Professional & Scientific | 1,065 (56.7%) | 815 (43.3%) |
| Enterprise Management | 21 (42.9%) | 28 (57.1%) |
| Administrative & Support | 1,033 (63.4%) | 595 (36.5%) |
| Educational Services | 606 (17.6%) | 2,831 (82.4%) |
| Health Care & Social Assistance | 1,237 (18.7%) | 5,371 (81.3%) |
| Arts, Entertainment & Recreation | 629 (72.3%) | 241 (27.7%) |
| Accommodation & Food Services | 1,243 (36.3%) | 2,178 (63.7%) |
| Public Administration | 2,242 (55.4%) | 1,801 (44.6%) |
| Total | 24,623 (52.0%) | 22,725 (48.0%) |
Education in Hardin County
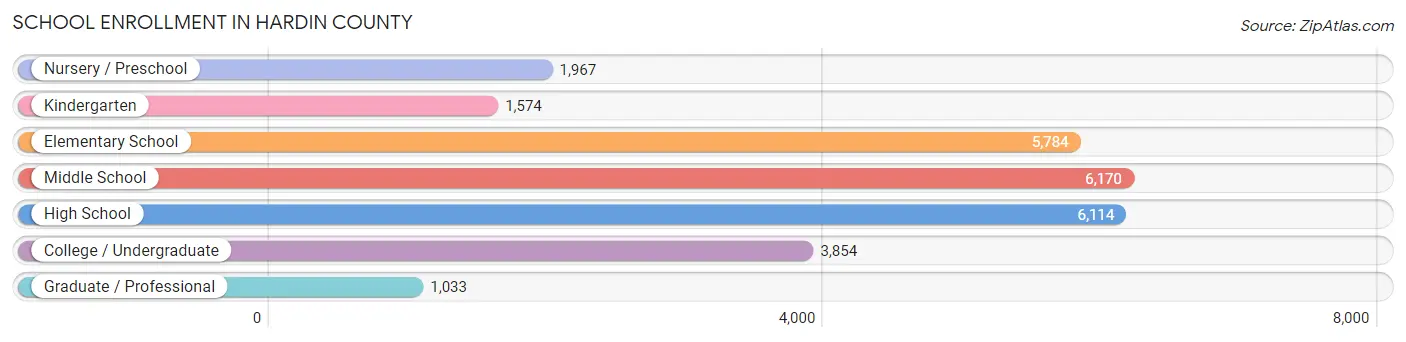
School Enrollment in Hardin County
The most common levels of schooling among the 26,496 students in Hardin County are middle school (6,170 | 23.3%), high school (6,114 | 23.1%), and elementary school (5,784 | 21.8%).
| School Level | # Students | % Students |
| Nursery / Preschool | 1,967 | 7.4% |
| Kindergarten | 1,574 | 5.9% |
| Elementary School | 5,784 | 21.8% |
| Middle School | 6,170 | 23.3% |
| High School | 6,114 | 23.1% |
| College / Undergraduate | 3,854 | 14.5% |
| Graduate / Professional | 1,033 | 3.9% |
| Total | 26,496 | 100.0% |
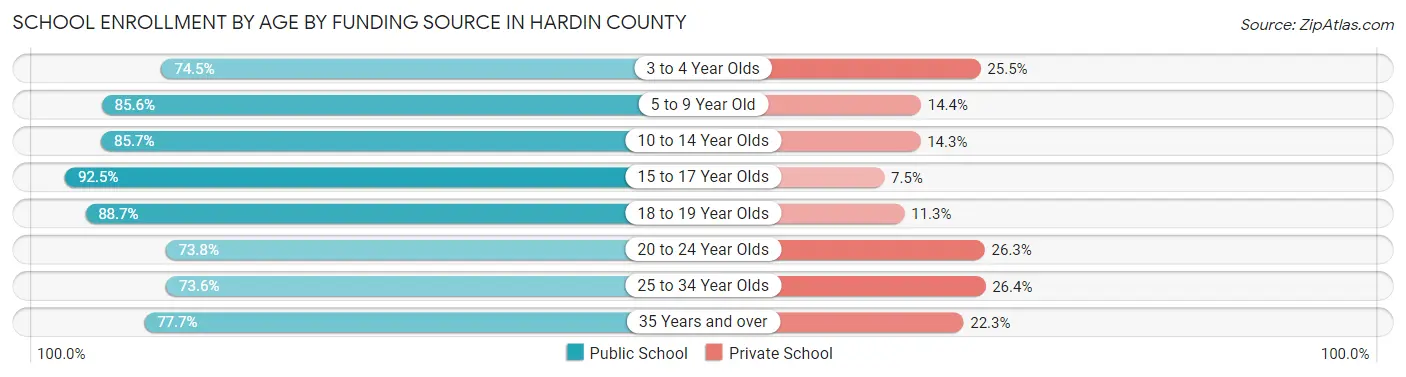
School Enrollment by Age by Funding Source in Hardin County
Out of a total of 26,496 students who are enrolled in schools in Hardin County, 4,080 (15.4%) attend a private institution, while the remaining 22,416 (84.6%) are enrolled in public schools. The age group of 25 to 34 year olds has the highest likelihood of being enrolled in private schools, with 341 (26.4% in the age bracket) enrolled. Conversely, the age group of 15 to 17 year olds has the lowest likelihood of being enrolled in a private school, with 4,090 (92.5% in the age bracket) attending a public institution.
| Age Bracket | Public School | Private School |
| 3 to 4 Year Olds | 1,197 (74.5%) | 409 (25.5%) |
| 5 to 9 Year Old | 5,978 (85.6%) | 1,002 (14.4%) |
| 10 to 14 Year Olds | 6,728 (85.7%) | 1,119 (14.3%) |
| 15 to 17 Year Olds | 4,090 (92.5%) | 333 (7.5%) |
| 18 to 19 Year Olds | 1,163 (88.7%) | 148 (11.3%) |
| 20 to 24 Year Olds | 1,051 (73.8%) | 374 (26.3%) |
| 25 to 34 Year Olds | 952 (73.6%) | 341 (26.4%) |
| 35 Years and over | 1,252 (77.7%) | 359 (22.3%) |
| Total | 22,416 (84.6%) | 4,080 (15.4%) |
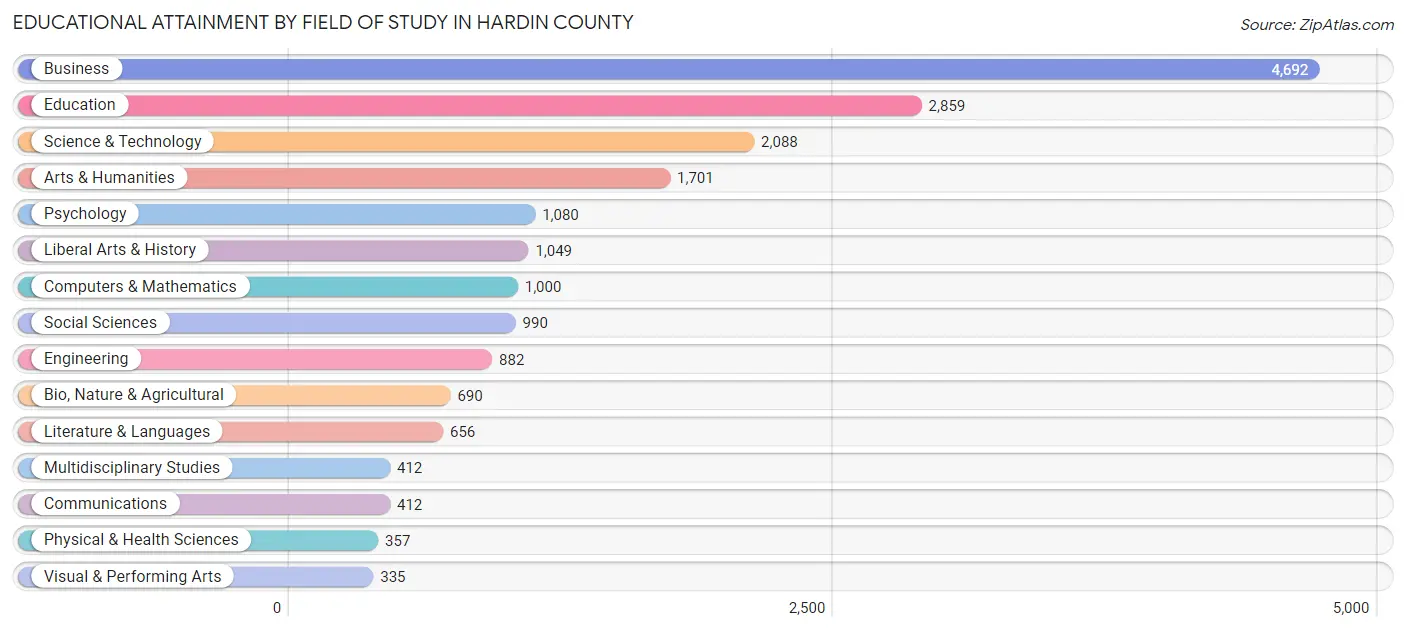
Educational Attainment by Field of Study in Hardin County
Business (4,692 | 24.4%), education (2,859 | 14.9%), science & technology (2,088 | 10.9%), arts & humanities (1,701 | 8.9%), and psychology (1,080 | 5.6%) are the most common fields of study among 19,203 individuals in Hardin County who have obtained a bachelor's degree or higher.
| Field of Study | # Graduates | % Graduates |
| Computers & Mathematics | 1,000 | 5.2% |
| Bio, Nature & Agricultural | 690 | 3.6% |
| Physical & Health Sciences | 357 | 1.9% |
| Psychology | 1,080 | 5.6% |
| Social Sciences | 990 | 5.2% |
| Engineering | 882 | 4.6% |
| Multidisciplinary Studies | 412 | 2.1% |
| Science & Technology | 2,088 | 10.9% |
| Business | 4,692 | 24.4% |
| Education | 2,859 | 14.9% |
| Literature & Languages | 656 | 3.4% |
| Liberal Arts & History | 1,049 | 5.5% |
| Visual & Performing Arts | 335 | 1.7% |
| Communications | 412 | 2.1% |
| Arts & Humanities | 1,701 | 8.9% |
| Total | 19,203 | 100.0% |
Transportation & Commute in Hardin County
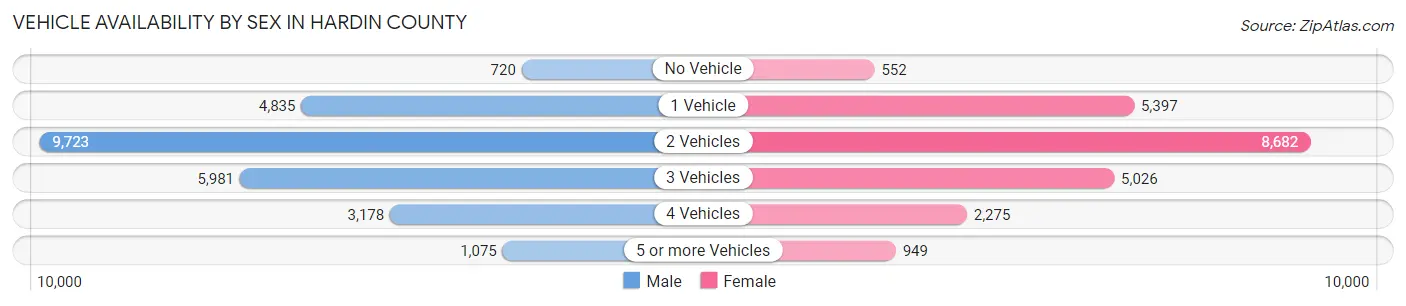
Vehicle Availability by Sex in Hardin County
The most prevalent vehicle ownership categories in Hardin County are males with 2 vehicles (9,723, accounting for 38.1%) and females with 2 vehicles (8,682, making up 42.5%).
| Vehicles Available | Male | Female |
| No Vehicle | 720 (2.8%) | 552 (2.4%) |
| 1 Vehicle | 4,835 (19.0%) | 5,397 (23.6%) |
| 2 Vehicles | 9,723 (38.1%) | 8,682 (37.9%) |
| 3 Vehicles | 5,981 (23.4%) | 5,026 (22.0%) |
| 4 Vehicles | 3,178 (12.5%) | 2,275 (9.9%) |
| 5 or more Vehicles | 1,075 (4.2%) | 949 (4.2%) |
| Total | 25,512 (100.0%) | 22,881 (100.0%) |
Commute Time in Hardin County
The most frequently occuring commute durations in Hardin County are 10 to 14 minutes (8,860 commuters, 19.0%), 15 to 19 minutes (7,899 commuters, 16.9%), and 5 to 9 minutes (6,597 commuters, 14.1%).
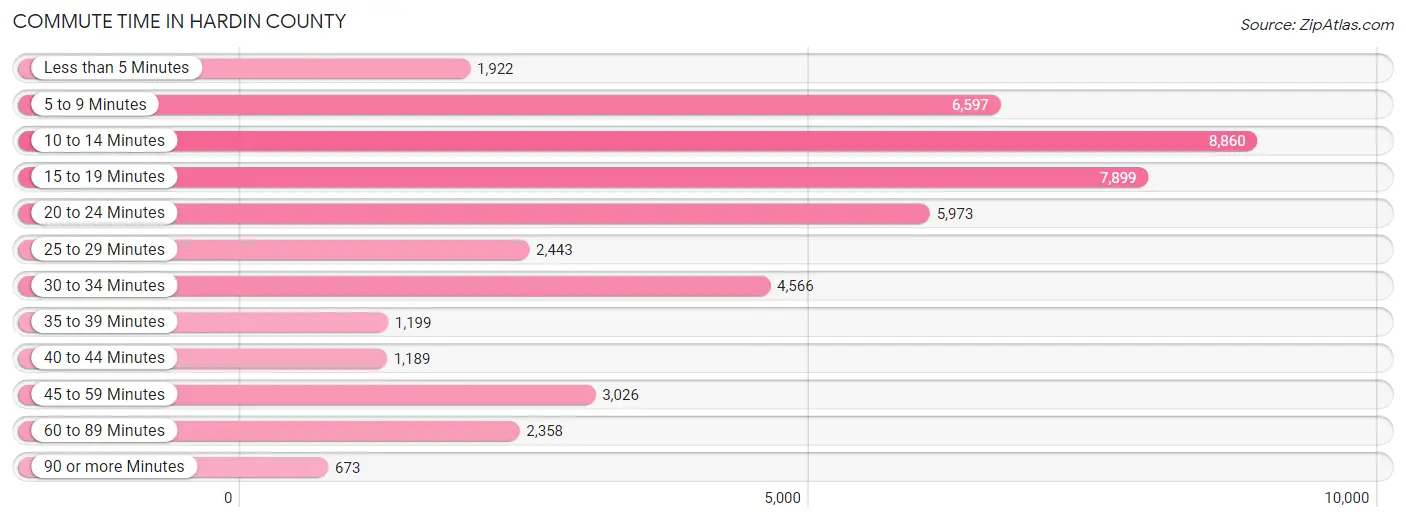
| Commute Time | # Commuters | % Commuters |
| Less than 5 Minutes | 1,922 | 4.1% |
| 5 to 9 Minutes | 6,597 | 14.1% |
| 10 to 14 Minutes | 8,860 | 19.0% |
| 15 to 19 Minutes | 7,899 | 16.9% |
| 20 to 24 Minutes | 5,973 | 12.8% |
| 25 to 29 Minutes | 2,443 | 5.2% |
| 30 to 34 Minutes | 4,566 | 9.8% |
| 35 to 39 Minutes | 1,199 | 2.6% |
| 40 to 44 Minutes | 1,189 | 2.5% |
| 45 to 59 Minutes | 3,026 | 6.5% |
| 60 to 89 Minutes | 2,358 | 5.1% |
| 90 or more Minutes | 673 | 1.4% |
Commute Time by Sex in Hardin County
The most common commute times in Hardin County are 10 to 14 minutes (4,246 commuters, 16.7%) for males and 10 to 14 minutes (4,614 commuters, 21.7%) for females.
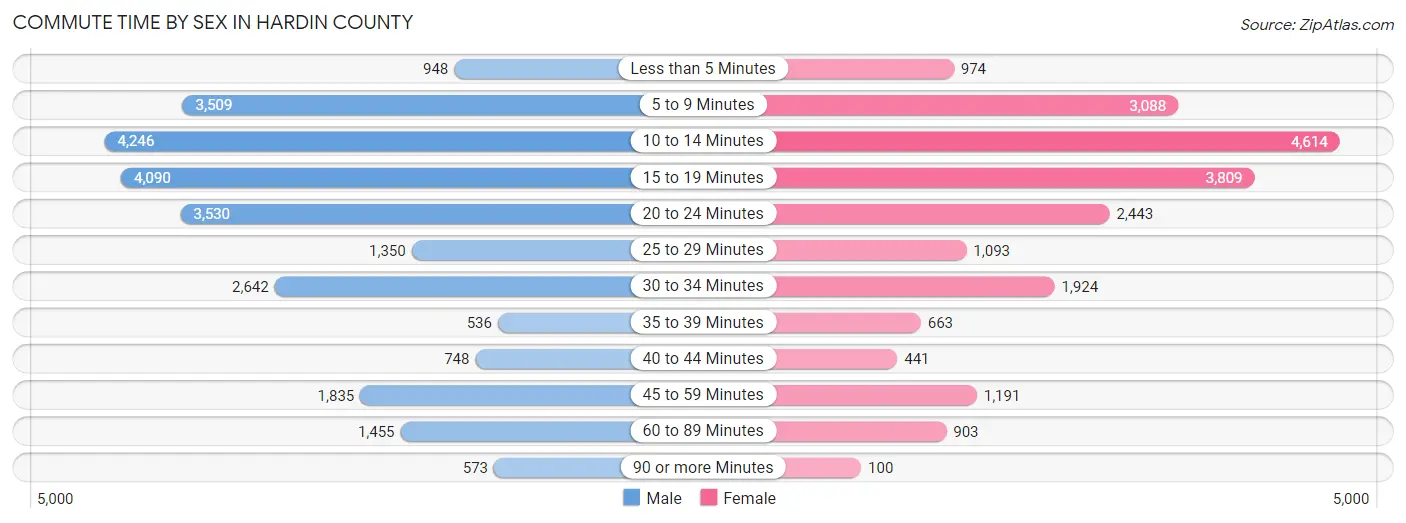
| Commute Time | Male | Female |
| Less than 5 Minutes | 948 (3.7%) | 974 (4.6%) |
| 5 to 9 Minutes | 3,509 (13.8%) | 3,088 (14.5%) |
| 10 to 14 Minutes | 4,246 (16.7%) | 4,614 (21.7%) |
| 15 to 19 Minutes | 4,090 (16.1%) | 3,809 (17.9%) |
| 20 to 24 Minutes | 3,530 (13.9%) | 2,443 (11.5%) |
| 25 to 29 Minutes | 1,350 (5.3%) | 1,093 (5.1%) |
| 30 to 34 Minutes | 2,642 (10.4%) | 1,924 (9.1%) |
| 35 to 39 Minutes | 536 (2.1%) | 663 (3.1%) |
| 40 to 44 Minutes | 748 (2.9%) | 441 (2.1%) |
| 45 to 59 Minutes | 1,835 (7.2%) | 1,191 (5.6%) |
| 60 to 89 Minutes | 1,455 (5.7%) | 903 (4.3%) |
| 90 or more Minutes | 573 (2.2%) | 100 (0.5%) |
Time of Departure to Work by Sex in Hardin County
The most frequent times of departure to work in Hardin County are 7:00 AM to 7:29 AM (3,126, 12.3%) for males and 7:00 AM to 7:29 AM (3,495, 16.5%) for females.
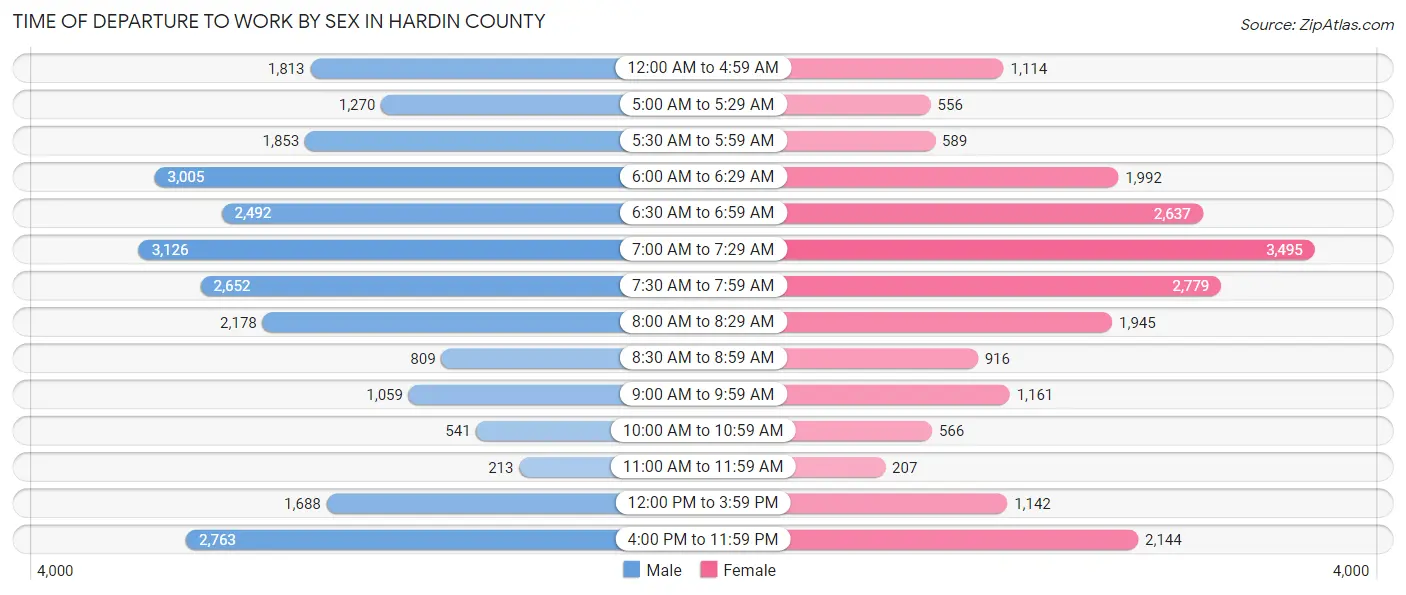
| Time of Departure | Male | Female |
| 12:00 AM to 4:59 AM | 1,813 (7.1%) | 1,114 (5.2%) |
| 5:00 AM to 5:29 AM | 1,270 (5.0%) | 556 (2.6%) |
| 5:30 AM to 5:59 AM | 1,853 (7.3%) | 589 (2.8%) |
| 6:00 AM to 6:29 AM | 3,005 (11.8%) | 1,992 (9.4%) |
| 6:30 AM to 6:59 AM | 2,492 (9.8%) | 2,637 (12.4%) |
| 7:00 AM to 7:29 AM | 3,126 (12.3%) | 3,495 (16.5%) |
| 7:30 AM to 7:59 AM | 2,652 (10.4%) | 2,779 (13.1%) |
| 8:00 AM to 8:29 AM | 2,178 (8.6%) | 1,945 (9.2%) |
| 8:30 AM to 8:59 AM | 809 (3.2%) | 916 (4.3%) |
| 9:00 AM to 9:59 AM | 1,059 (4.2%) | 1,161 (5.5%) |
| 10:00 AM to 10:59 AM | 541 (2.1%) | 566 (2.7%) |
| 11:00 AM to 11:59 AM | 213 (0.8%) | 207 (1.0%) |
| 12:00 PM to 3:59 PM | 1,688 (6.6%) | 1,142 (5.4%) |
| 4:00 PM to 11:59 PM | 2,763 (10.8%) | 2,144 (10.1%) |
| Total | 25,462 (100.0%) | 21,243 (100.0%) |
Housing Occupancy in Hardin County
Occupancy by Ownership in Hardin County
Of the total 42,638 dwellings in Hardin County, owner-occupied units account for 26,458 (62.1%), while renter-occupied units make up 16,180 (38.0%).
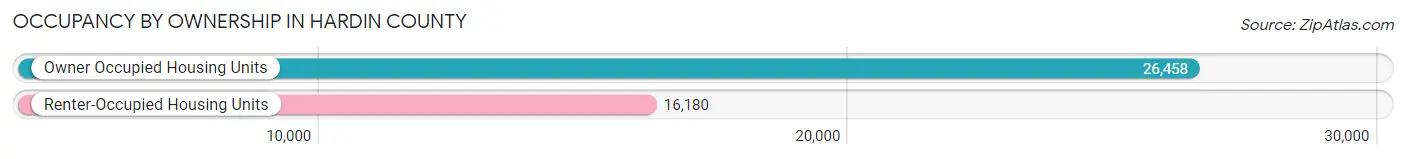
| Occupancy | # Housing Units | % Housing Units |
| Owner Occupied Housing Units | 26,458 | 62.1% |
| Renter-Occupied Housing Units | 16,180 | 38.0% |
| Total Occupied Housing Units | 42,638 | 100.0% |
Occupancy by Household Size in Hardin County
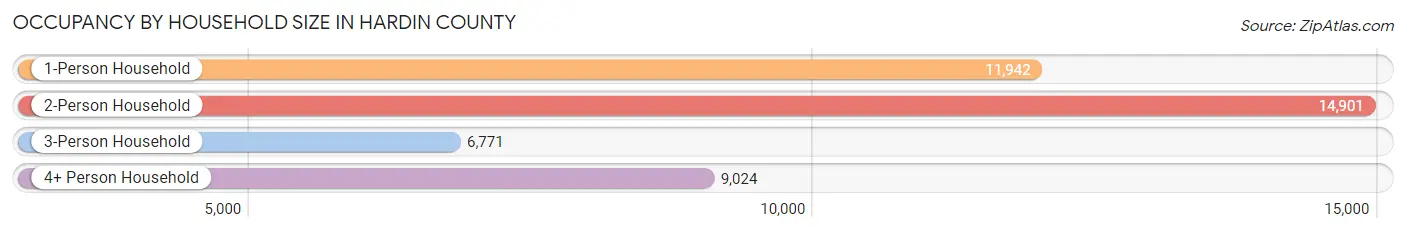
| Household Size | # Housing Units | % Housing Units |
| 1-Person Household | 11,942 | 28.0% |
| 2-Person Household | 14,901 | 34.9% |
| 3-Person Household | 6,771 | 15.9% |
| 4+ Person Household | 9,024 | 21.2% |
| Total Housing Units | 42,638 | 100.0% |
Occupancy by Ownership by Household Size in Hardin County
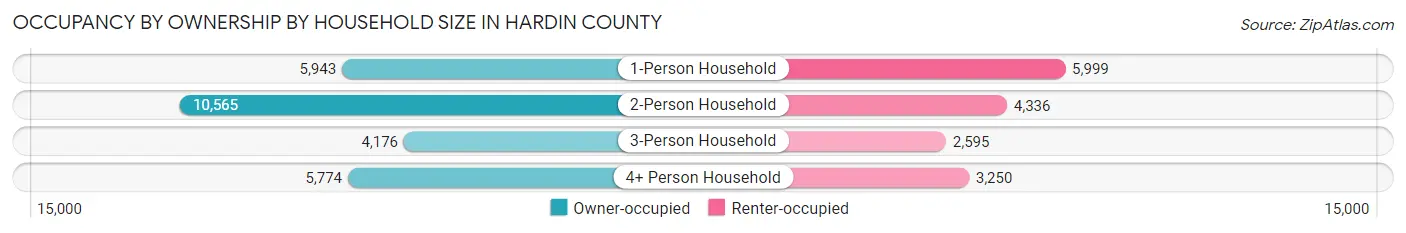
| Household Size | Owner-occupied | Renter-occupied |
| 1-Person Household | 5,943 (49.8%) | 5,999 (50.2%) |
| 2-Person Household | 10,565 (70.9%) | 4,336 (29.1%) |
| 3-Person Household | 4,176 (61.7%) | 2,595 (38.3%) |
| 4+ Person Household | 5,774 (64.0%) | 3,250 (36.0%) |
| Total Housing Units | 26,458 (62.1%) | 16,180 (38.0%) |
Occupancy by Educational Attainment in Hardin County
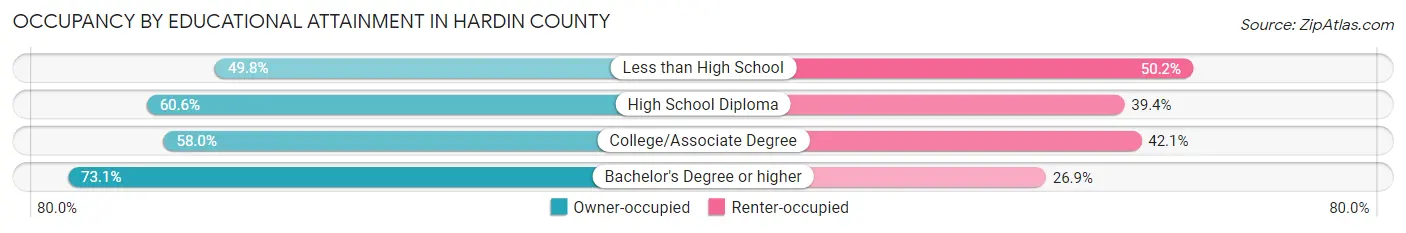
| Household Size | Owner-occupied | Renter-occupied |
| Less than High School | 1,495 (49.8%) | 1,508 (50.2%) |
| High School Diploma | 7,430 (60.6%) | 4,825 (39.4%) |
| College/Associate Degree | 9,493 (58.0%) | 6,888 (42.0%) |
| Bachelor's Degree or higher | 8,040 (73.1%) | 2,959 (26.9%) |
Occupancy by Age of Householder in Hardin County
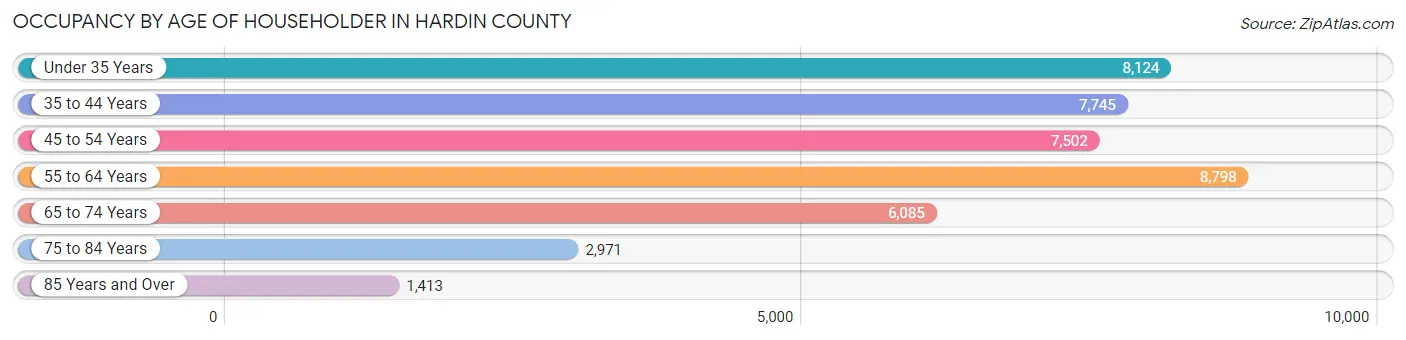
| Age Bracket | # Households | % Households |
| Under 35 Years | 8,124 | 19.1% |
| 35 to 44 Years | 7,745 | 18.2% |
| 45 to 54 Years | 7,502 | 17.6% |
| 55 to 64 Years | 8,798 | 20.6% |
| 65 to 74 Years | 6,085 | 14.3% |
| 75 to 84 Years | 2,971 | 7.0% |
| 85 Years and Over | 1,413 | 3.3% |
| Total | 42,638 | 100.0% |
Housing Finances in Hardin County
Median Income by Occupancy in Hardin County
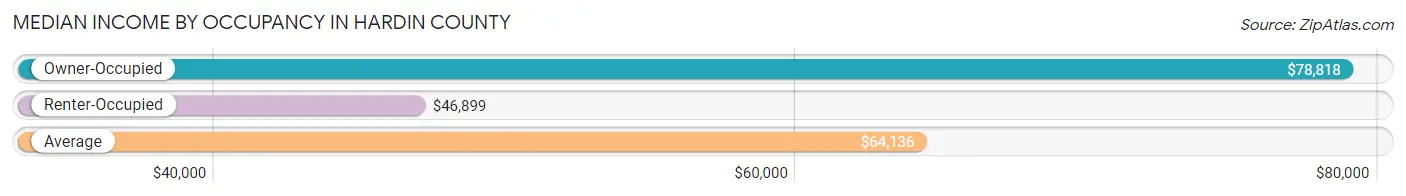
| Occupancy Type | # Households | Median Income |
| Owner-Occupied | 26,458 (62.1%) | $78,818 |
| Renter-Occupied | 16,180 (38.0%) | $46,899 |
| Average | 42,638 (100.0%) | $64,136 |
Occupancy by Householder Income Bracket in Hardin County
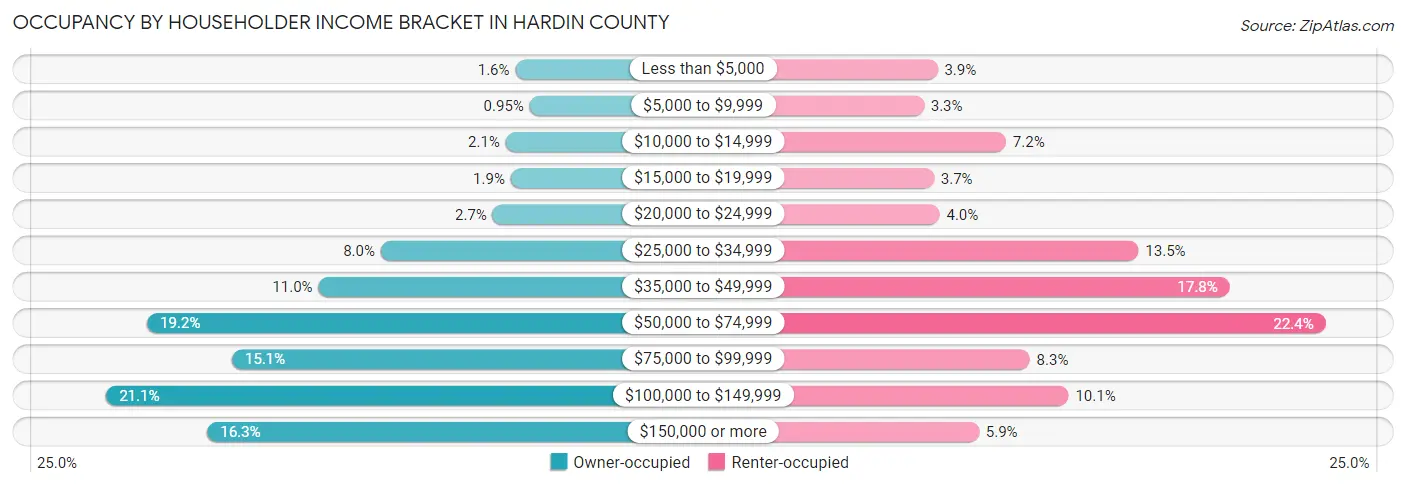
| Income Bracket | Owner-occupied | Renter-occupied |
| Less than $5,000 | 431 (1.6%) | 631 (3.9%) |
| $5,000 to $9,999 | 252 (0.9%) | 526 (3.3%) |
| $10,000 to $14,999 | 554 (2.1%) | 1,158 (7.2%) |
| $15,000 to $19,999 | 489 (1.8%) | 604 (3.7%) |
| $20,000 to $24,999 | 718 (2.7%) | 648 (4.0%) |
| $25,000 to $34,999 | 2,127 (8.0%) | 2,179 (13.5%) |
| $35,000 to $49,999 | 2,914 (11.0%) | 2,881 (17.8%) |
| $50,000 to $74,999 | 5,071 (19.2%) | 3,621 (22.4%) |
| $75,000 to $99,999 | 4,004 (15.1%) | 1,342 (8.3%) |
| $100,000 to $149,999 | 5,585 (21.1%) | 1,640 (10.1%) |
| $150,000 or more | 4,313 (16.3%) | 950 (5.9%) |
| Total | 26,458 (100.0%) | 16,180 (100.0%) |
Monthly Housing Cost Tiers in Hardin County
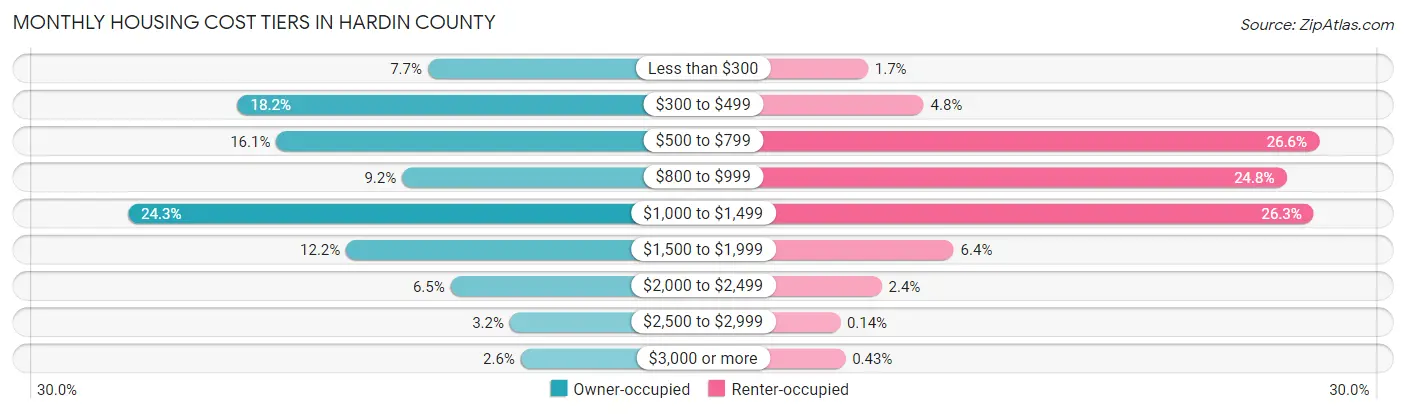
| Monthly Cost | Owner-occupied | Renter-occupied |
| Less than $300 | 2,044 (7.7%) | 272 (1.7%) |
| $300 to $499 | 4,824 (18.2%) | 770 (4.8%) |
| $500 to $799 | 4,259 (16.1%) | 4,303 (26.6%) |
| $800 to $999 | 2,421 (9.1%) | 4,011 (24.8%) |
| $1,000 to $1,499 | 6,424 (24.3%) | 4,255 (26.3%) |
| $1,500 to $1,999 | 3,239 (12.2%) | 1,039 (6.4%) |
| $2,000 to $2,499 | 1,713 (6.5%) | 394 (2.4%) |
| $2,500 to $2,999 | 846 (3.2%) | 22 (0.1%) |
| $3,000 or more | 688 (2.6%) | 70 (0.4%) |
| Total | 26,458 (100.0%) | 16,180 (100.0%) |
Physical Housing Characteristics in Hardin County
Housing Structures in Hardin County
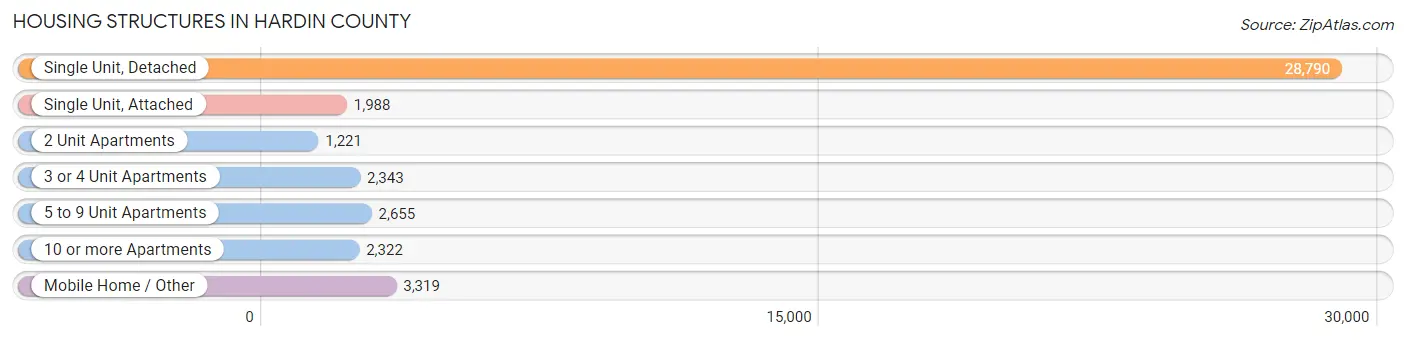
| Structure Type | # Housing Units | % Housing Units |
| Single Unit, Detached | 28,790 | 67.5% |
| Single Unit, Attached | 1,988 | 4.7% |
| 2 Unit Apartments | 1,221 | 2.9% |
| 3 or 4 Unit Apartments | 2,343 | 5.5% |
| 5 to 9 Unit Apartments | 2,655 | 6.2% |
| 10 or more Apartments | 2,322 | 5.4% |
| Mobile Home / Other | 3,319 | 7.8% |
| Total | 42,638 | 100.0% |
Housing Structures by Occupancy in Hardin County
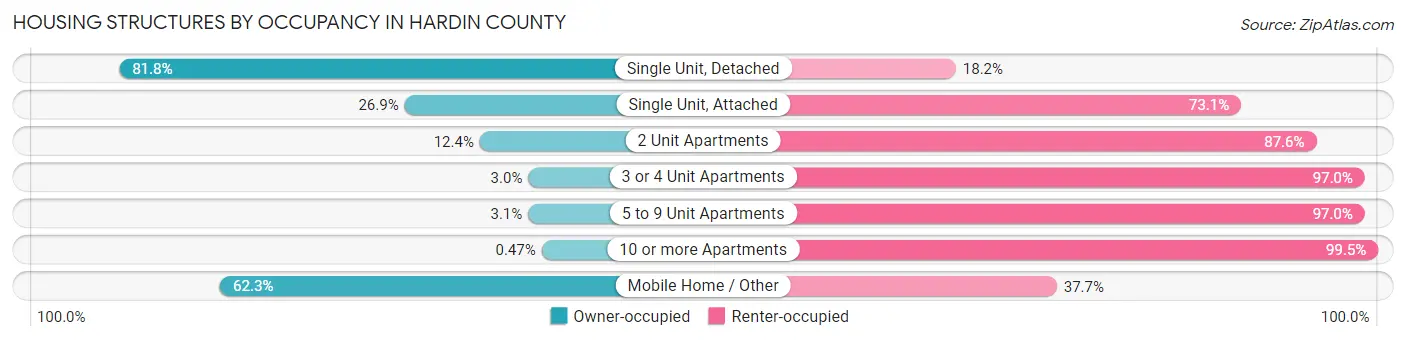
| Structure Type | Owner-occupied | Renter-occupied |
| Single Unit, Detached | 23,541 (81.8%) | 5,249 (18.2%) |
| Single Unit, Attached | 534 (26.9%) | 1,454 (73.1%) |
| 2 Unit Apartments | 151 (12.4%) | 1,070 (87.6%) |
| 3 or 4 Unit Apartments | 71 (3.0%) | 2,272 (97.0%) |
| 5 to 9 Unit Apartments | 81 (3.0%) | 2,574 (97.0%) |
| 10 or more Apartments | 11 (0.5%) | 2,311 (99.5%) |
| Mobile Home / Other | 2,069 (62.3%) | 1,250 (37.7%) |
| Total | 26,458 (62.1%) | 16,180 (38.0%) |
Housing Structures by Number of Rooms in Hardin County
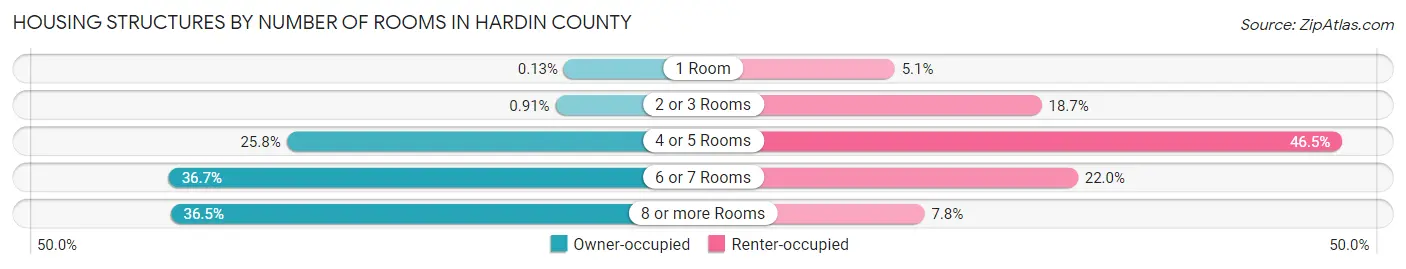
| Number of Rooms | Owner-occupied | Renter-occupied |
| 1 Room | 35 (0.1%) | 820 (5.1%) |
| 2 or 3 Rooms | 242 (0.9%) | 3,018 (18.6%) |
| 4 or 5 Rooms | 6,821 (25.8%) | 7,516 (46.5%) |
| 6 or 7 Rooms | 9,702 (36.7%) | 3,560 (22.0%) |
| 8 or more Rooms | 9,658 (36.5%) | 1,266 (7.8%) |
| Total | 26,458 (100.0%) | 16,180 (100.0%) |
Housing Structure by Heating Type in Hardin County
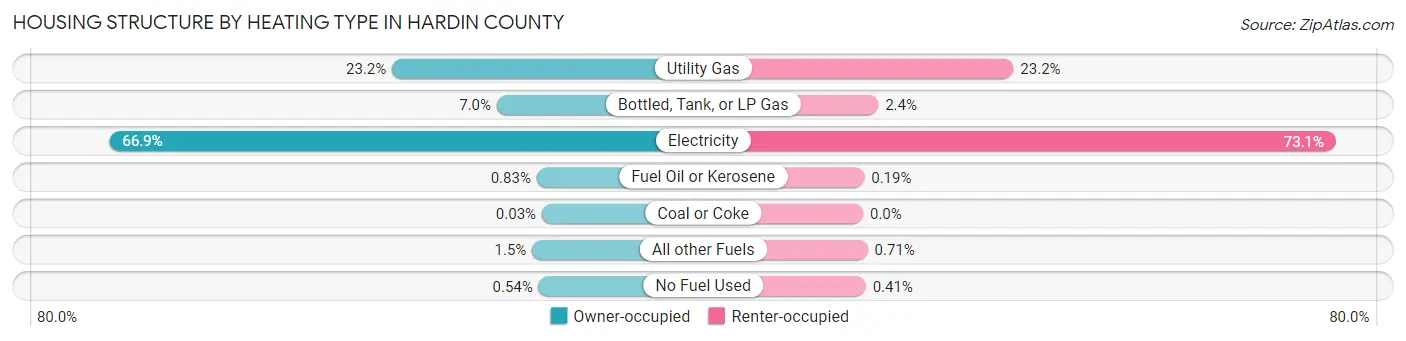
| Heating Type | Owner-occupied | Renter-occupied |
| Utility Gas | 6,136 (23.2%) | 3,760 (23.2%) |
| Bottled, Tank, or LP Gas | 1,849 (7.0%) | 381 (2.4%) |
| Electricity | 17,697 (66.9%) | 11,826 (73.1%) |
| Fuel Oil or Kerosene | 220 (0.8%) | 31 (0.2%) |
| Coal or Coke | 7 (0.0%) | 0 (0.0%) |
| All other Fuels | 405 (1.5%) | 115 (0.7%) |
| No Fuel Used | 144 (0.5%) | 67 (0.4%) |
| Total | 26,458 (100.0%) | 16,180 (100.0%) |
Household Vehicle Usage in Hardin County
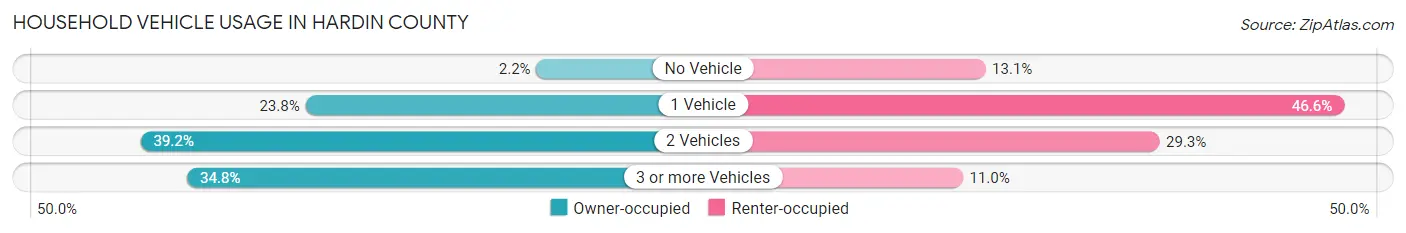
| Vehicles per Household | Owner-occupied | Renter-occupied |
| No Vehicle | 588 (2.2%) | 2,118 (13.1%) |
| 1 Vehicle | 6,291 (23.8%) | 7,539 (46.6%) |
| 2 Vehicles | 10,365 (39.2%) | 4,746 (29.3%) |
| 3 or more Vehicles | 9,214 (34.8%) | 1,777 (11.0%) |
| Total | 26,458 (100.0%) | 16,180 (100.0%) |
Real Estate & Mortgages in Hardin County
Real Estate and Mortgage Overview in Hardin County
| Characteristic | Without Mortgage | With Mortgage |
| Housing Units | 10,046 | 16,412 |
| Median Property Value | $164,400 | $198,600 |
| Median Household Income | $60,921 | $3,281 |
| Monthly Housing Costs | $410 | $688 |
| Real Estate Taxes | $1,152 | $600 |
Property Value by Mortgage Status in Hardin County
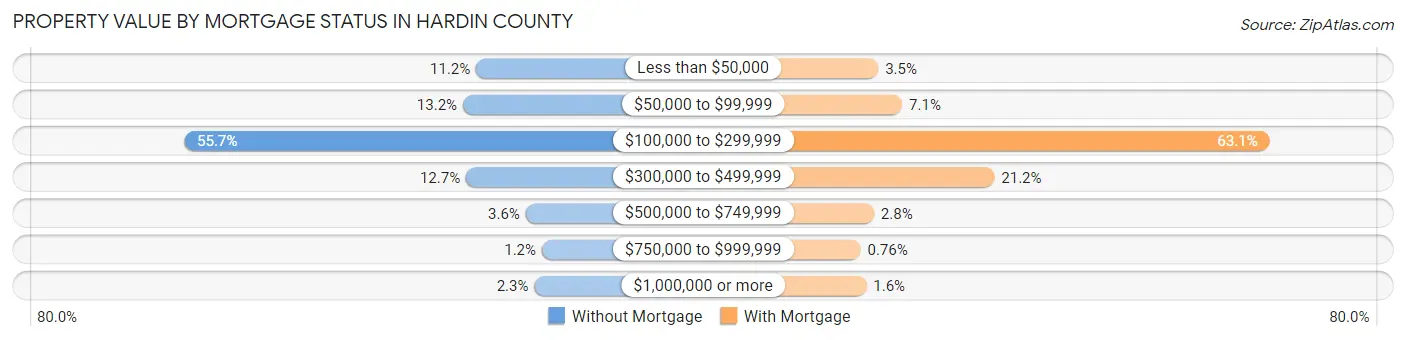
| Property Value | Without Mortgage | With Mortgage |
| Less than $50,000 | 1,125 (11.2%) | 568 (3.5%) |
| $50,000 to $99,999 | 1,327 (13.2%) | 1,166 (7.1%) |
| $100,000 to $299,999 | 5,595 (55.7%) | 10,354 (63.1%) |
| $300,000 to $499,999 | 1,280 (12.7%) | 3,471 (21.1%) |
| $500,000 to $749,999 | 366 (3.6%) | 460 (2.8%) |
| $750,000 to $999,999 | 119 (1.2%) | 124 (0.8%) |
| $1,000,000 or more | 234 (2.3%) | 269 (1.6%) |
| Total | 10,046 (100.0%) | 16,412 (100.0%) |
Household Income by Mortgage Status in Hardin County
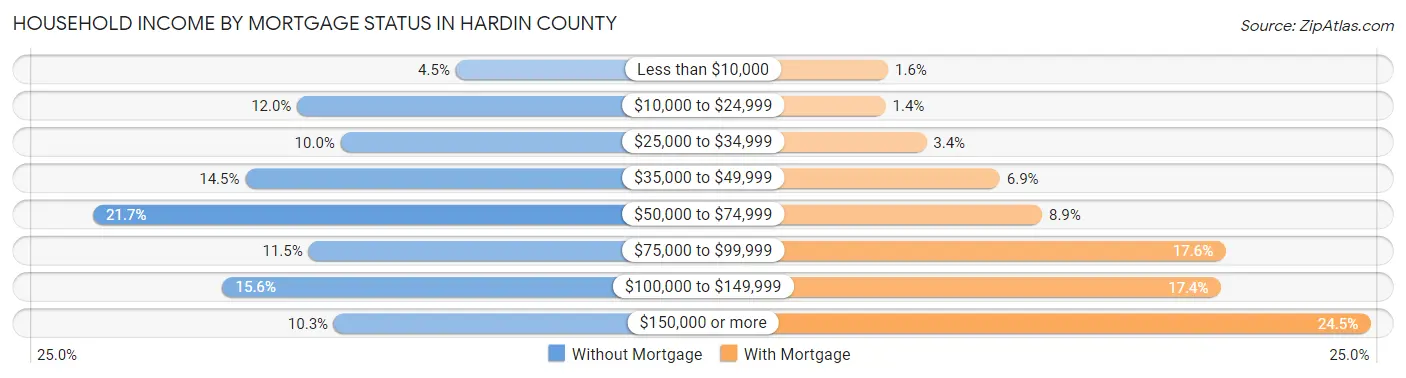
| Household Income | Without Mortgage | With Mortgage |
| Less than $10,000 | 449 (4.5%) | 254 (1.5%) |
| $10,000 to $24,999 | 1,208 (12.0%) | 234 (1.4%) |
| $25,000 to $34,999 | 1,000 (10.0%) | 553 (3.4%) |
| $35,000 to $49,999 | 1,456 (14.5%) | 1,127 (6.9%) |
| $50,000 to $74,999 | 2,184 (21.7%) | 1,458 (8.9%) |
| $75,000 to $99,999 | 1,153 (11.5%) | 2,887 (17.6%) |
| $100,000 to $149,999 | 1,564 (15.6%) | 2,851 (17.4%) |
| $150,000 or more | 1,032 (10.3%) | 4,021 (24.5%) |
| Total | 10,046 (100.0%) | 16,412 (100.0%) |
Property Value to Household Income Ratio in Hardin County
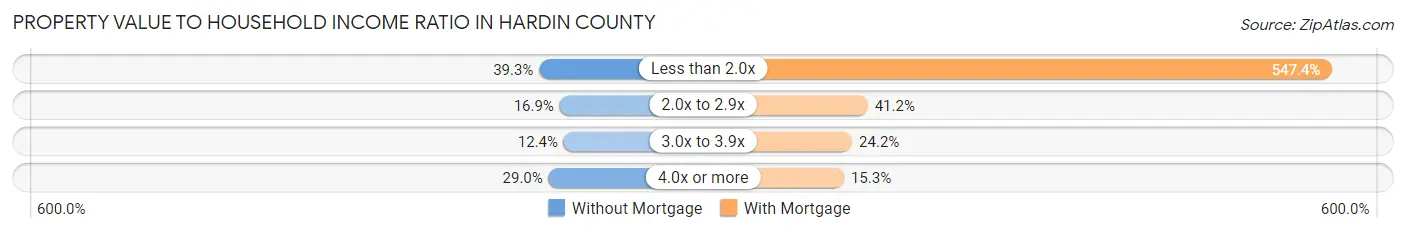
| Value-to-Income Ratio | Without Mortgage | With Mortgage |
| Less than 2.0x | 3,943 (39.3%) | 89,831 (547.3%) |
| 2.0x to 2.9x | 1,698 (16.9%) | 6,765 (41.2%) |
| 3.0x to 3.9x | 1,244 (12.4%) | 3,977 (24.2%) |
| 4.0x or more | 2,910 (29.0%) | 2,514 (15.3%) |
| Total | 10,046 (100.0%) | 16,412 (100.0%) |
Real Estate Taxes by Mortgage Status in Hardin County
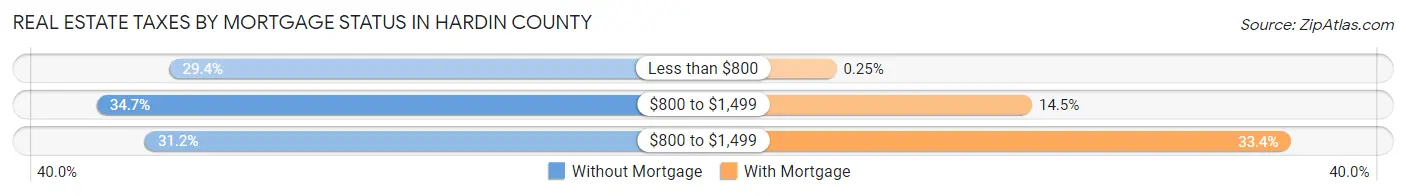
| Property Taxes | Without Mortgage | With Mortgage |
| Less than $800 | 2,954 (29.4%) | 41 (0.3%) |
| $800 to $1,499 | 3,488 (34.7%) | 2,386 (14.5%) |
| $800 to $1,499 | 3,134 (31.2%) | 5,484 (33.4%) |
| Total | 10,046 (100.0%) | 16,412 (100.0%) |
Health & Disability in Hardin County
Health Insurance Coverage by Age in Hardin County
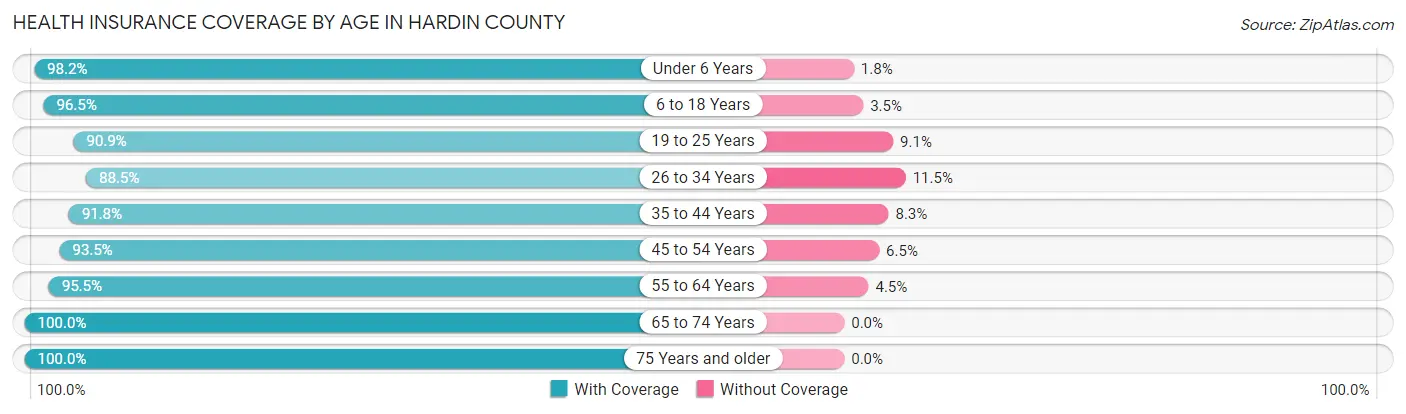
| Age Bracket | With Coverage | Without Coverage |
| Under 6 Years | 8,108 (98.2%) | 148 (1.8%) |
| 6 to 18 Years | 19,664 (96.5%) | 720 (3.5%) |
| 19 to 25 Years | 7,909 (90.9%) | 793 (9.1%) |
| 26 to 34 Years | 10,522 (88.5%) | 1,362 (11.5%) |
| 35 to 44 Years | 12,448 (91.7%) | 1,119 (8.3%) |
| 45 to 54 Years | 12,416 (93.5%) | 863 (6.5%) |
| 55 to 64 Years | 13,533 (95.5%) | 640 (4.5%) |
| 65 to 74 Years | 9,822 (100.0%) | 0 (0.0%) |
| 75 Years and older | 6,065 (100.0%) | 0 (0.0%) |
| Total | 100,487 (94.7%) | 5,645 (5.3%) |
Health Insurance Coverage by Citizenship Status in Hardin County
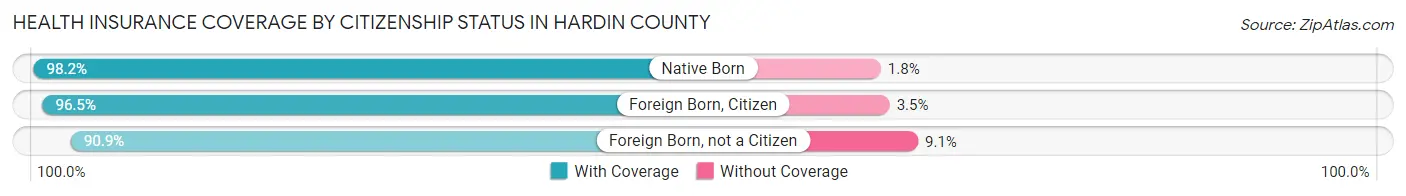
| Citizenship Status | With Coverage | Without Coverage |
| Native Born | 8,108 (98.2%) | 148 (1.8%) |
| Foreign Born, Citizen | 19,664 (96.5%) | 720 (3.5%) |
| Foreign Born, not a Citizen | 7,909 (90.9%) | 793 (9.1%) |
Health Insurance Coverage by Household Income in Hardin County
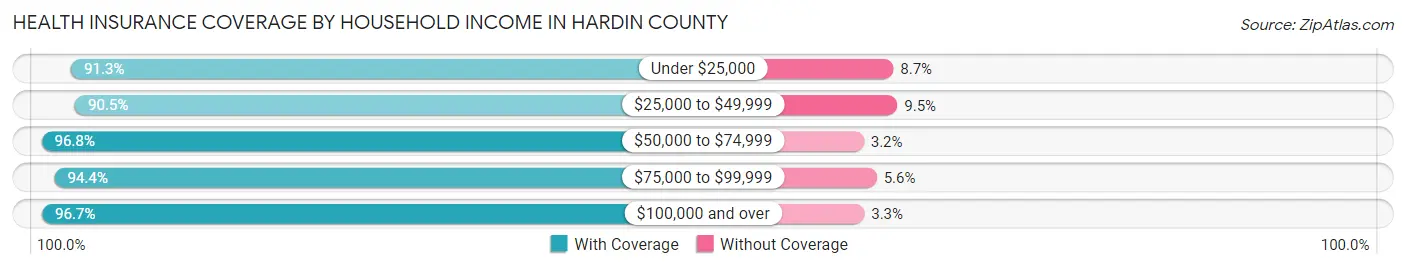
| Household Income | With Coverage | Without Coverage |
| Under $25,000 | 8,630 (91.3%) | 824 (8.7%) |
| $25,000 to $49,999 | 19,187 (90.5%) | 2,007 (9.5%) |
| $50,000 to $74,999 | 20,097 (96.8%) | 661 (3.2%) |
| $75,000 to $99,999 | 14,597 (94.4%) | 867 (5.6%) |
| $100,000 and over | 37,816 (96.7%) | 1,283 (3.3%) |
Public vs Private Health Insurance Coverage by Age in Hardin County
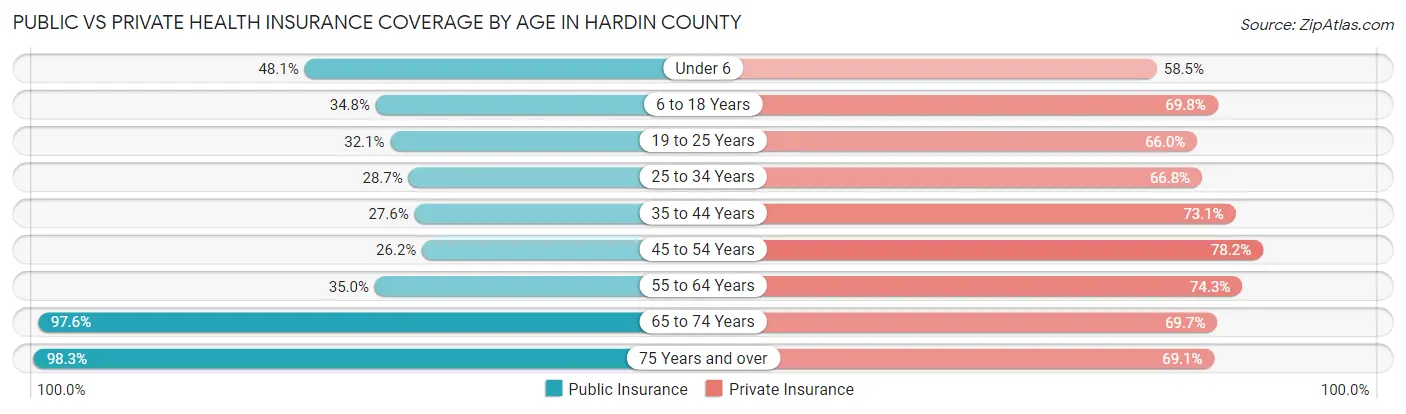
| Age Bracket | Public Insurance | Private Insurance |
| Under 6 | 3,967 (48.0%) | 4,827 (58.5%) |
| 6 to 18 Years | 7,098 (34.8%) | 14,220 (69.8%) |
| 19 to 25 Years | 2,795 (32.1%) | 5,740 (66.0%) |
| 25 to 34 Years | 3,416 (28.7%) | 7,943 (66.8%) |
| 35 to 44 Years | 3,748 (27.6%) | 9,914 (73.1%) |
| 45 to 54 Years | 3,481 (26.2%) | 10,384 (78.2%) |
| 55 to 64 Years | 4,961 (35.0%) | 10,532 (74.3%) |
| 65 to 74 Years | 9,581 (97.6%) | 6,844 (69.7%) |
| 75 Years and over | 5,962 (98.3%) | 4,193 (69.1%) |
| Total | 45,009 (42.4%) | 74,597 (70.3%) |
Disability Status by Sex by Age in Hardin County
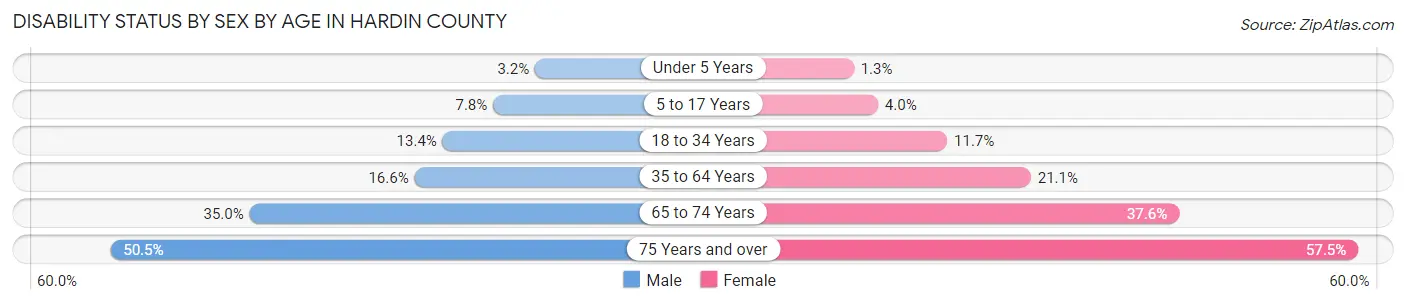
| Age Bracket | Male | Female |
| Under 5 Years | 113 (3.2%) | 47 (1.3%) |
| 5 to 17 Years | 803 (7.8%) | 395 (4.0%) |
| 18 to 34 Years | 1,445 (13.4%) | 1,319 (11.7%) |
| 35 to 64 Years | 3,333 (16.6%) | 4,404 (21.0%) |
| 65 to 74 Years | 1,603 (34.9%) | 1,966 (37.6%) |
| 75 Years and over | 1,234 (50.4%) | 2,081 (57.5%) |
Disability Class by Sex by Age in Hardin County
Disability Class: Hearing Difficulty
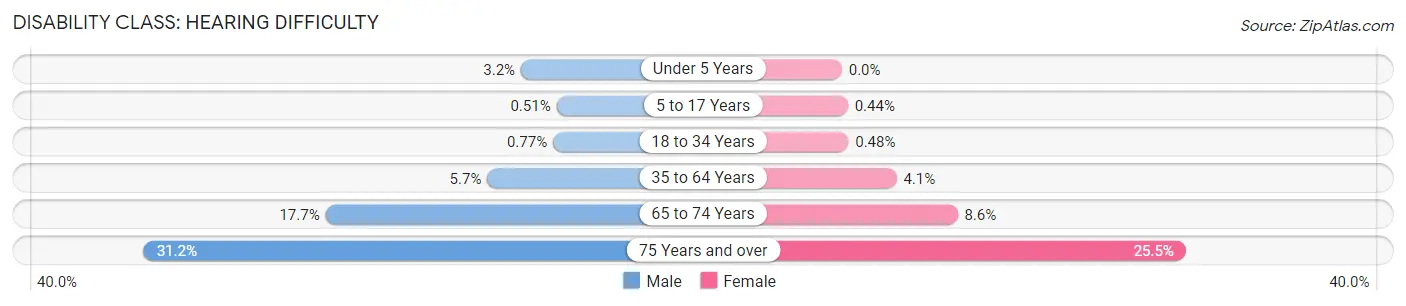
| Age Bracket | Male | Female |
| Under 5 Years | 113 (3.2%) | 0 (0.0%) |
| 5 to 17 Years | 52 (0.5%) | 43 (0.4%) |
| 18 to 34 Years | 83 (0.8%) | 54 (0.5%) |
| 35 to 64 Years | 1,135 (5.7%) | 849 (4.1%) |
| 65 to 74 Years | 810 (17.7%) | 450 (8.6%) |
| 75 Years and over | 762 (31.1%) | 924 (25.5%) |
Disability Class: Vision Difficulty
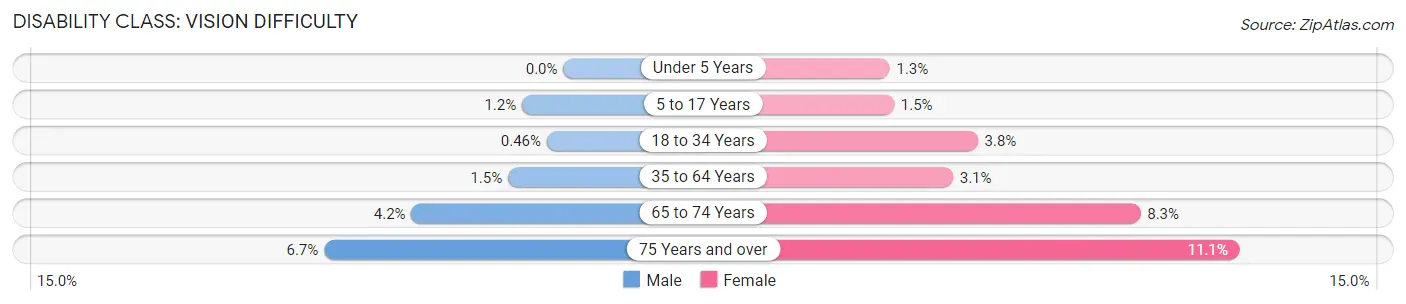
| Age Bracket | Male | Female |
| Under 5 Years | 0 (0.0%) | 47 (1.3%) |
| 5 to 17 Years | 118 (1.1%) | 142 (1.5%) |
| 18 to 34 Years | 50 (0.5%) | 425 (3.8%) |
| 35 to 64 Years | 309 (1.5%) | 646 (3.1%) |
| 65 to 74 Years | 194 (4.2%) | 435 (8.3%) |
| 75 Years and over | 163 (6.7%) | 401 (11.1%) |
Disability Class: Cognitive Difficulty
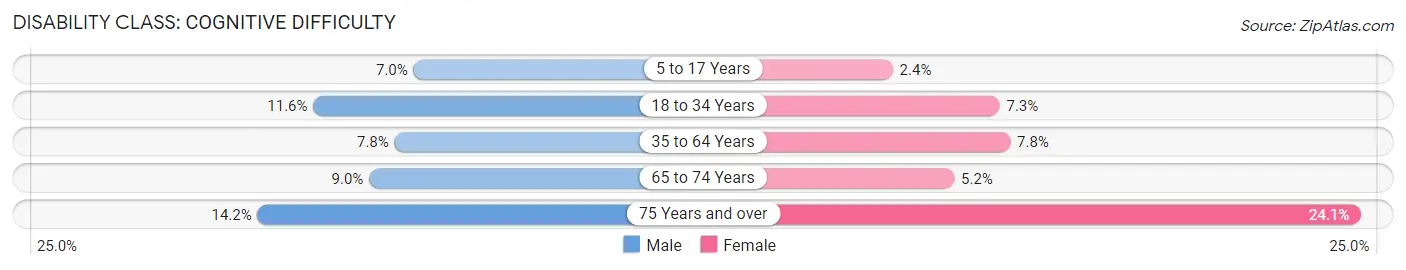
| Age Bracket | Male | Female |
| 5 to 17 Years | 714 (7.0%) | 232 (2.4%) |
| 18 to 34 Years | 1,247 (11.6%) | 823 (7.3%) |
| 35 to 64 Years | 1,574 (7.8%) | 1,634 (7.8%) |
| 65 to 74 Years | 413 (9.0%) | 273 (5.2%) |
| 75 Years and over | 347 (14.2%) | 872 (24.1%) |
Disability Class: Ambulatory Difficulty
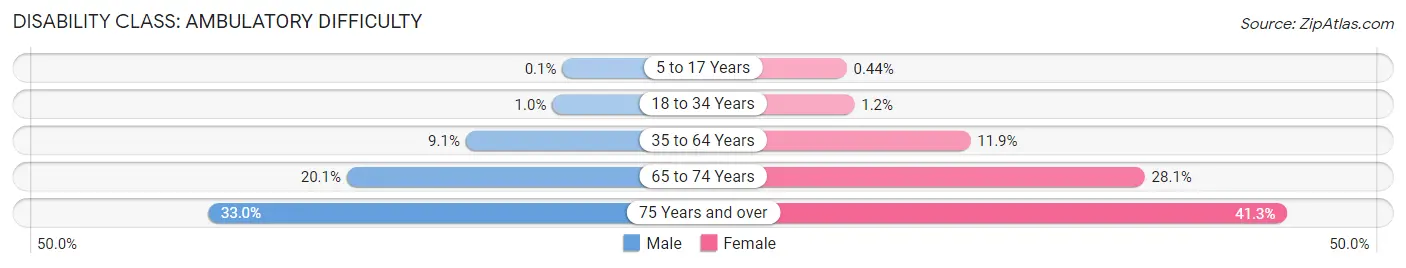
| Age Bracket | Male | Female |
| 5 to 17 Years | 10 (0.1%) | 43 (0.4%) |
| 18 to 34 Years | 111 (1.0%) | 130 (1.2%) |
| 35 to 64 Years | 1,820 (9.1%) | 2,497 (11.9%) |
| 65 to 74 Years | 922 (20.1%) | 1,472 (28.1%) |
| 75 Years and over | 807 (33.0%) | 1,496 (41.3%) |
Disability Class: Self-Care Difficulty
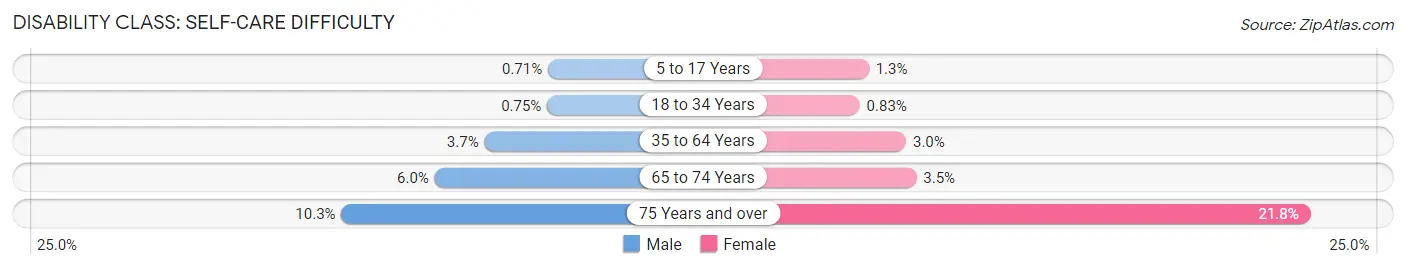
| Age Bracket | Male | Female |
| 5 to 17 Years | 73 (0.7%) | 123 (1.3%) |
| 18 to 34 Years | 81 (0.7%) | 93 (0.8%) |
| 35 to 64 Years | 736 (3.7%) | 623 (3.0%) |
| 65 to 74 Years | 274 (6.0%) | 181 (3.5%) |
| 75 Years and over | 252 (10.3%) | 787 (21.7%) |
Technology Access in Hardin County
Computing Device Access in Hardin County
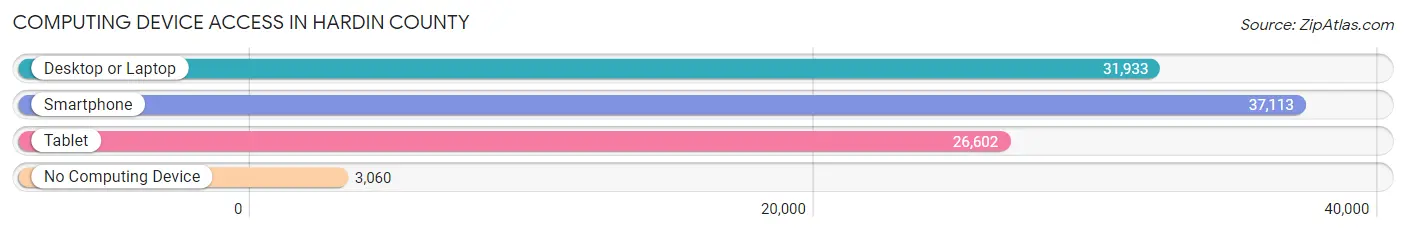
| Device Type | # Households | % Households |
| Desktop or Laptop | 31,933 | 74.9% |
| Smartphone | 37,113 | 87.0% |
| Tablet | 26,602 | 62.4% |
| No Computing Device | 3,060 | 7.2% |
| Total | 42,638 | 100.0% |
Internet Access in Hardin County
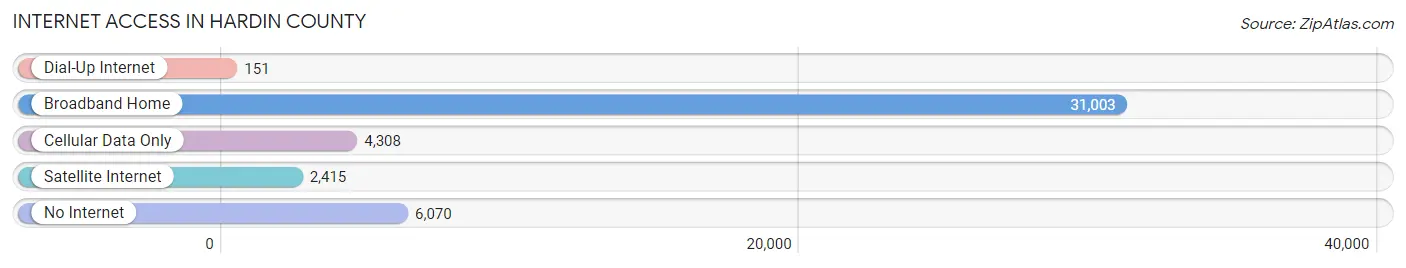
| Internet Type | # Households | % Households |
| Dial-Up Internet | 151 | 0.4% |
| Broadband Home | 31,003 | 72.7% |
| Cellular Data Only | 4,308 | 10.1% |
| Satellite Internet | 2,415 | 5.7% |
| No Internet | 6,070 | 14.2% |
| Total | 42,638 | 100.0% |
Hardin County Summary
Hardin County is located in the central part of Kentucky, in the heart of the Bluegrass Region. It is bordered by LaRue County to the north, Grayson County to the east, Meade County to the south, and Nelson County to the west. The county seat is Elizabethtown, which is also the largest city in the county. Hardin County was established in 1792 and named after Colonel John Hardin, a Revolutionary War hero.
Geography
Hardin County is located in the central part of Kentucky, in the heart of the Bluegrass Region. It is bordered by LaRue County to the north, Grayson County to the east, Meade County to the south, and Nelson County to the west. The county has a total area of 517 square miles, of which 514 square miles is land and 3 square miles is water. The terrain is mostly rolling hills, with some flat areas in the northern part of the county. The highest point in the county is located in the northern part of the county, at an elevation of 890 feet.
The county is drained by the Nolin River, which flows through the western part of the county, and the Salt River, which flows through the eastern part of the county. The county is also home to several small lakes, including Lake Nolin, Lake Elizabethtown, and Lake Hardin.
Economy
The economy of Hardin County is largely based on agriculture and manufacturing. The county is home to several large farms, which produce corn, soybeans, wheat, and other crops. The county is also home to several large manufacturing companies, including General Electric, which produces appliances, and Toyota, which produces automobiles.
The county is also home to several large retail stores, including Walmart, Target, and Lowe's. The county is also home to several large restaurants, including McDonald's, Burger King, and KFC.
Demographics
As of the 2010 census, Hardin County had a population of 105,543. The racial makeup of the county was 90.3% White, 6.2% African American, 0.4% Native American, 0.7% Asian, 0.1% Pacific Islander, 1.2% from other races, and 1.1% from two or more races. Hispanic or Latino of any race were 3.2% of the population.
The median income for a household in the county was $41,945, and the median income for a family was $50,945. The per capita income for the county was $20,945. About 11.2% of families and 14.3% of the population were below the poverty line, including 19.2% of those under age 18 and 9.2% of those age 65 or over.
Conclusion
Hardin County is a rural county located in the central part of Kentucky. It is bordered by LaRue County to the north, Grayson County to the east, Meade County to the south, and Nelson County to the west. The county has a total area of 517 square miles, of which 514 square miles is land and 3 square miles is water. The economy of Hardin County is largely based on agriculture and manufacturing, and the county is home to several large farms and manufacturing companies. As of the 2010 census, Hardin County had a population of 105,543, with a median income for a household of $41,945 and a median income for a family of $50,945.
Common Questions
What is the Total Population of Hardin County?
Total Population of Hardin County is 111,005.
What is the Total Male Population of Hardin County?
Total Male Population of Hardin County is 55,411.
What is the Total Female Population of Hardin County?
Total Female Population of Hardin County is 55,594.
What is the Ratio of Males per 100 Females in Hardin County?
There are 99.67 Males per 100 Females in Hardin County.
What is the Ratio of Females per 100 Males in Hardin County?
There are 100.33 Females per 100 Males in Hardin County.
What is the Median Population Age in Hardin County?
Median Population Age in Hardin County is 37.2 Years.
What is the Average Family Size in Hardin County
Average Family Size in Hardin County is 3.1 People.
What is the Average Household Size in Hardin County
Average Household Size in Hardin County is 2.5 People.
What is Per Capita Income in Hardin County?
Per Capita income in Hardin County is $35,226.
What is the Median Family Income in Hardin County?
Median Family Income in Hardin County is $79,590.
What is the Median Household income in Hardin County?
Median Household Income in Hardin County is $64,136.
What is Income or Wage Gap in Hardin County?
Income or Wage Gap in Hardin County is 26.6%.
Women in Hardin County earn 73.4 cents for every dollar earned by a man.
What is Family Income Deficit in Hardin County?
Family Income Deficit in Hardin County is $9,425.
Families that are below poverty line in Hardin County earn $9,425 less on average than the poverty threshold level.
What is Inequality or Gini Index in Hardin County?
Inequality or Gini Index in Hardin County is 0.46.
How Large is the Labor Force in Hardin County?
There are 54,483 People in the Labor Forcein in Hardin County.
What is the Percentage of People in the Labor Force in Hardin County?
62.7% of People are in the Labor Force in Hardin County.
What is the Unemployment Rate in Hardin County?
Unemployment Rate in Hardin County is 6.8%.