Greenup County, KY
Greenup County Map
Greenup County Overview
35,853
TOTAL POPULATION
17,610
MALE POPULATION
18,243
FEMALE POPULATION
96.53
MALES / 100 FEMALES
103.59
FEMALES / 100 MALES
43.8
MEDIAN AGE
3.0
AVG FAMILY SIZE
2.5
AVG HOUSEHOLD SIZE
$32,070
PER CAPITA INCOME
$72,842
AVG FAMILY INCOME
$58,562
AVG HOUSEHOLD INCOME
36.5%
WAGE / INCOME GAP [ % ]
63.5¢/ $1
WAGE / INCOME GAP [ $ ]
$9,809
FAMILY INCOME DEFICIT
0.48
INEQUALITY / GINI INDEX
14,667
LABOR FORCE [ PEOPLE ]
50.1%
PERCENT IN LABOR FORCE
6.2%
UNEMPLOYMENT RATE
Greenup County Area Codes
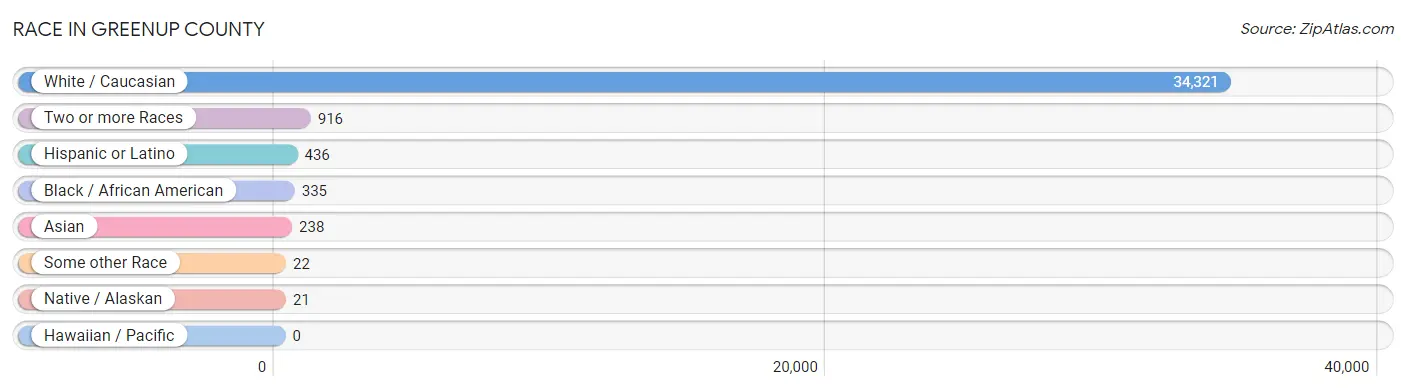
Race in Greenup County
The most populous races in Greenup County are White / Caucasian (34,321 | 95.7%), Two or more Races (916 | 2.5%), and Hispanic or Latino (436 | 1.2%).
| Race | # Population | % Population |
| Asian | 238 | 0.7% |
| Black / African American | 335 | 0.9% |
| Hawaiian / Pacific | 0 | 0.0% |
| Hispanic or Latino | 436 | 1.2% |
| Native / Alaskan | 21 | 0.1% |
| White / Caucasian | 34,321 | 95.7% |
| Two or more Races | 916 | 2.5% |
| Some other Race | 22 | 0.1% |
| Total | 35,853 | 100.0% |
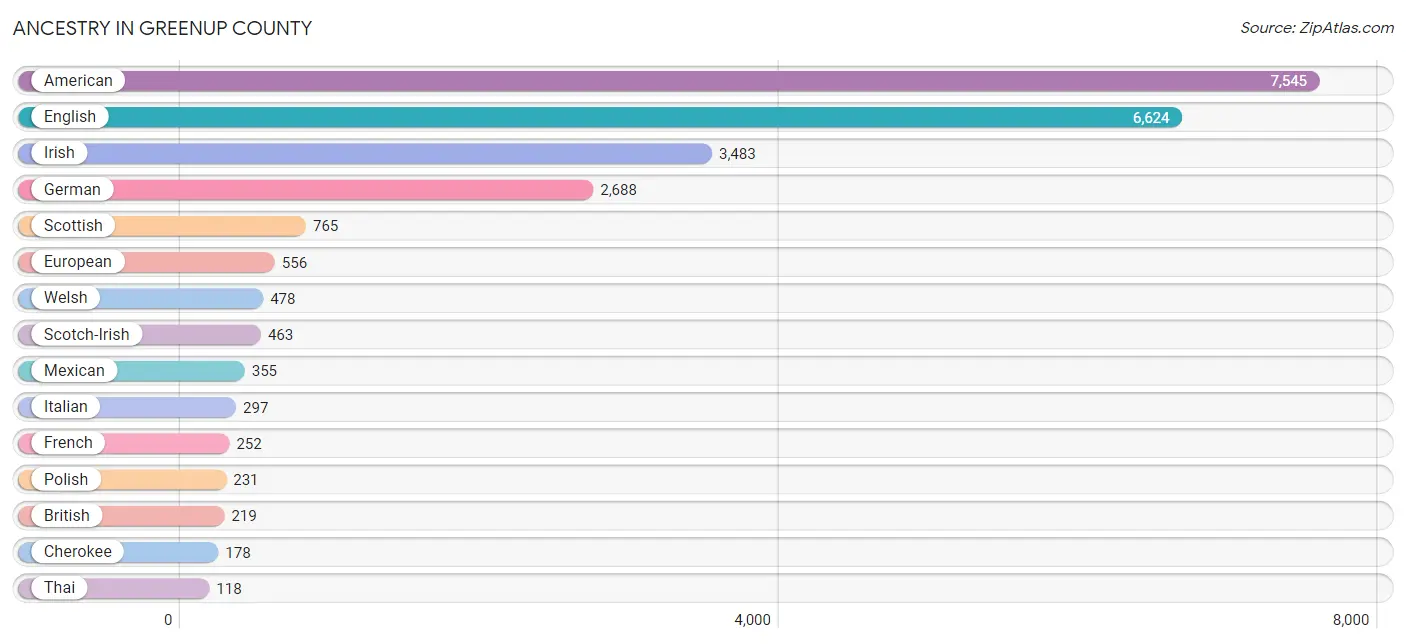
Ancestry in Greenup County
The most populous ancestries reported in Greenup County are American (7,545 | 21.0%), English (6,624 | 18.5%), Irish (3,483 | 9.7%), German (2,688 | 7.5%), and Scottish (765 | 2.1%), together accounting for 58.9% of all Greenup County residents.
| Ancestry | # Population | % Population |
| American | 7,545 | 21.0% |
| Arab | 10 | 0.0% |
| Bhutanese | 46 | 0.1% |
| British | 219 | 0.6% |
| Bulgarian | 12 | 0.0% |
| Burmese | 7 | 0.0% |
| Canadian | 4 | 0.0% |
| Celtic | 92 | 0.3% |
| Central American | 9 | 0.0% |
| Cherokee | 178 | 0.5% |
| Croatian | 1 | 0.0% |
| Cuban | 2 | 0.0% |
| Czechoslovakian | 3 | 0.0% |
| Danish | 13 | 0.0% |
| Dutch | 113 | 0.3% |
| Eastern European | 69 | 0.2% |
| Ecuadorian | 11 | 0.0% |
| Egyptian | 2 | 0.0% |
| English | 6,624 | 18.5% |
| European | 556 | 1.5% |
| Finnish | 15 | 0.0% |
| French | 252 | 0.7% |
| French Canadian | 1 | 0.0% |
| German | 2,688 | 7.5% |
| Greek | 37 | 0.1% |
| Hungarian | 35 | 0.1% |
| Icelander | 2 | 0.0% |
| Indian (Asian) | 20 | 0.1% |
| Irish | 3,483 | 9.7% |
| Italian | 297 | 0.8% |
| Korean | 15 | 0.0% |
| Lebanese | 6 | 0.0% |
| Lumbee | 11 | 0.0% |
| Macedonian | 4 | 0.0% |
| Mexican | 355 | 1.0% |
| Northern European | 38 | 0.1% |
| Norwegian | 21 | 0.1% |
| Pakistani | 10 | 0.0% |
| Polish | 231 | 0.6% |
| Puerto Rican | 20 | 0.1% |
| Russian | 38 | 0.1% |
| Salvadoran | 9 | 0.0% |
| Scandinavian | 26 | 0.1% |
| Scotch-Irish | 463 | 1.3% |
| Scottish | 765 | 2.1% |
| Seminole | 8 | 0.0% |
| South African | 6 | 0.0% |
| South American | 11 | 0.0% |
| Spaniard | 3 | 0.0% |
| Subsaharan African | 6 | 0.0% |
| Swedish | 66 | 0.2% |
| Swiss | 21 | 0.1% |
| Thai | 118 | 0.3% |
| Ukrainian | 48 | 0.1% |
| Welsh | 478 | 1.3% |
| West Indian | 30 | 0.1% | View All 56 Rows |
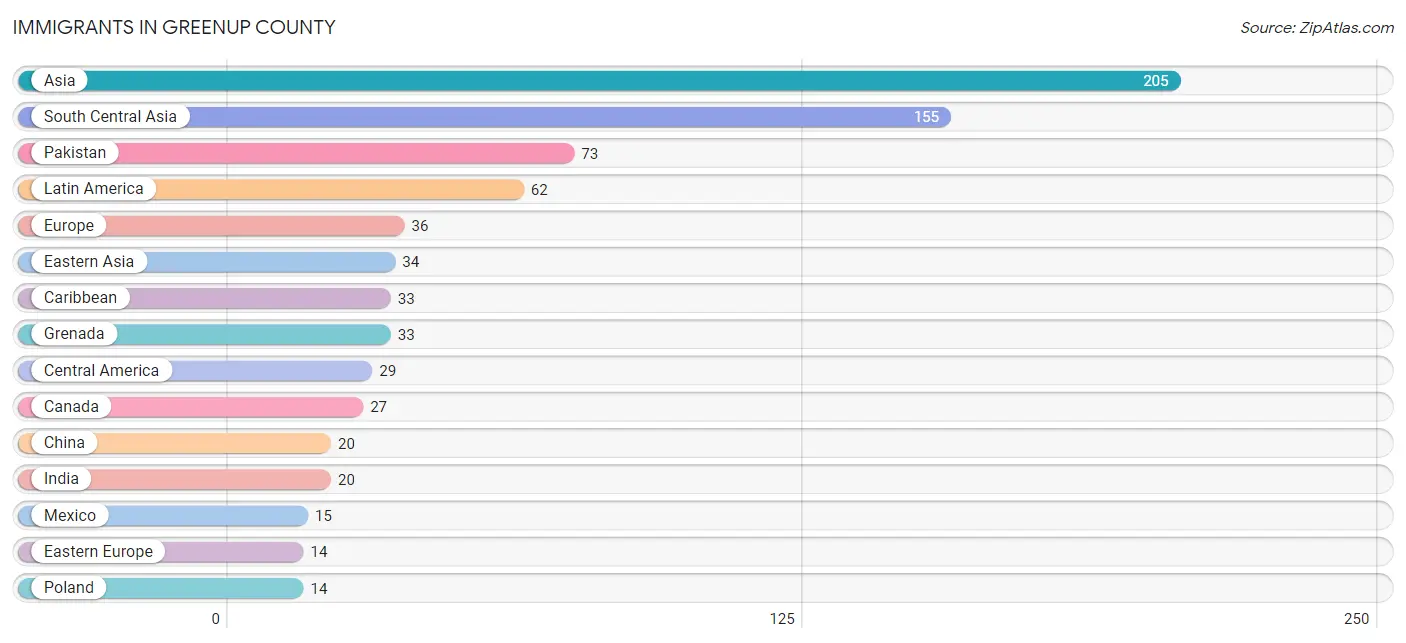
Immigrants in Greenup County
The most numerous immigrant groups reported in Greenup County came from Asia (205 | 0.6%), South Central Asia (155 | 0.4%), Pakistan (73 | 0.2%), Latin America (62 | 0.2%), and Europe (36 | 0.1%), together accounting for 1.5% of all Greenup County residents.
| Immigration Origin | # Population | % Population |
| Africa | 6 | 0.0% |
| Asia | 205 | 0.6% |
| Canada | 27 | 0.1% |
| Caribbean | 33 | 0.1% |
| Central America | 29 | 0.1% |
| China | 20 | 0.1% |
| Eastern Asia | 34 | 0.1% |
| Eastern Europe | 14 | 0.0% |
| El Salvador | 9 | 0.0% |
| England | 10 | 0.0% |
| Europe | 36 | 0.1% |
| Germany | 7 | 0.0% |
| Grenada | 33 | 0.1% |
| India | 20 | 0.1% |
| Japan | 11 | 0.0% |
| Korea | 3 | 0.0% |
| Latin America | 62 | 0.2% |
| Lebanon | 6 | 0.0% |
| Mexico | 15 | 0.0% |
| Northern Europe | 12 | 0.0% |
| Pakistan | 73 | 0.2% |
| Panama | 5 | 0.0% |
| Poland | 14 | 0.0% |
| South Africa | 6 | 0.0% |
| South Central Asia | 155 | 0.4% |
| South Eastern Asia | 10 | 0.0% |
| Southern Europe | 3 | 0.0% |
| Spain | 3 | 0.0% |
| Thailand | 10 | 0.0% |
| Western Asia | 6 | 0.0% |
| Western Europe | 7 | 0.0% | View All 31 Rows |
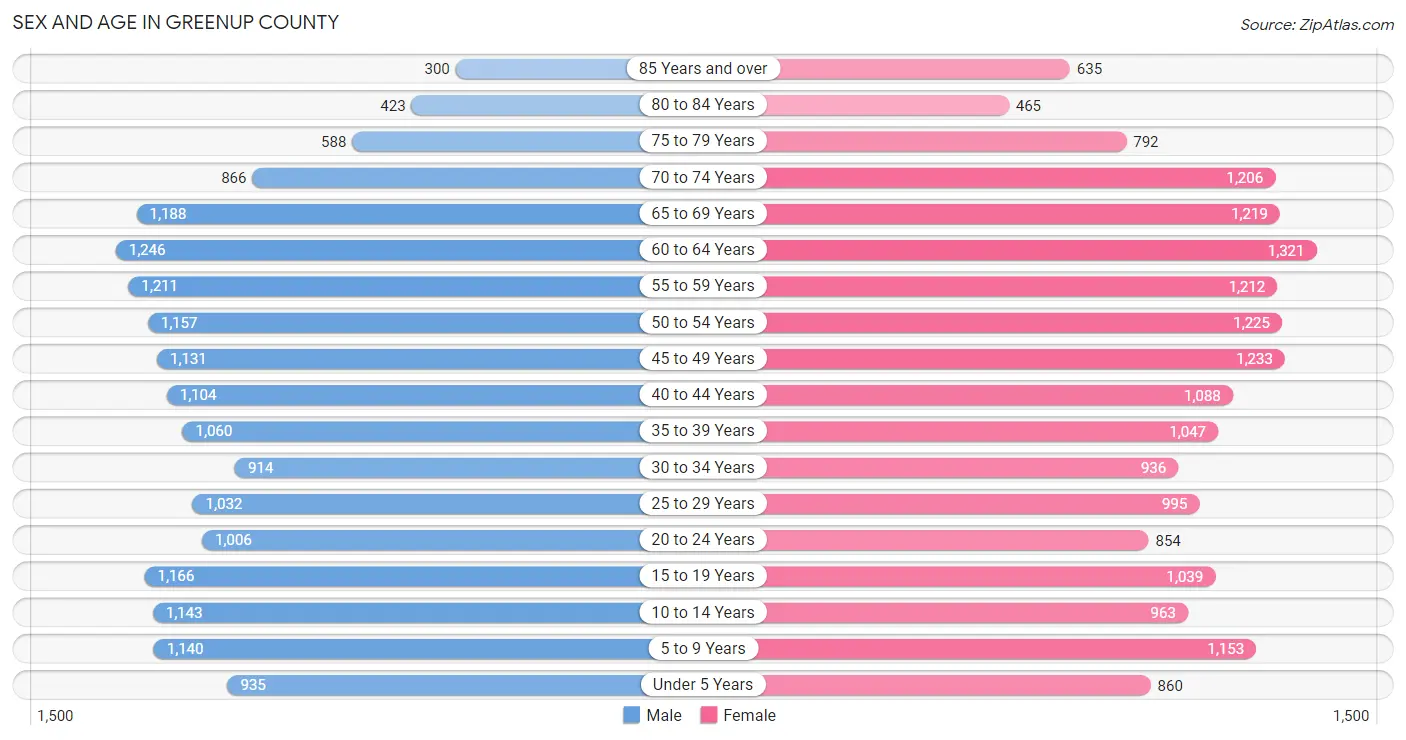
Sex and Age in Greenup County
Sex and Age in Greenup County
The most populous age groups in Greenup County are 60 to 64 Years (1,246 | 7.1%) for men and 60 to 64 Years (1,321 | 7.2%) for women.
| Age Bracket | Male | Female |
| Under 5 Years | 935 (5.3%) | 860 (4.7%) |
| 5 to 9 Years | 1,140 (6.5%) | 1,153 (6.3%) |
| 10 to 14 Years | 1,143 (6.5%) | 963 (5.3%) |
| 15 to 19 Years | 1,166 (6.6%) | 1,039 (5.7%) |
| 20 to 24 Years | 1,006 (5.7%) | 854 (4.7%) |
| 25 to 29 Years | 1,032 (5.9%) | 995 (5.4%) |
| 30 to 34 Years | 914 (5.2%) | 936 (5.1%) |
| 35 to 39 Years | 1,060 (6.0%) | 1,047 (5.7%) |
| 40 to 44 Years | 1,104 (6.3%) | 1,088 (6.0%) |
| 45 to 49 Years | 1,131 (6.4%) | 1,233 (6.8%) |
| 50 to 54 Years | 1,157 (6.6%) | 1,225 (6.7%) |
| 55 to 59 Years | 1,211 (6.9%) | 1,212 (6.6%) |
| 60 to 64 Years | 1,246 (7.1%) | 1,321 (7.2%) |
| 65 to 69 Years | 1,188 (6.8%) | 1,219 (6.7%) |
| 70 to 74 Years | 866 (4.9%) | 1,206 (6.6%) |
| 75 to 79 Years | 588 (3.3%) | 792 (4.3%) |
| 80 to 84 Years | 423 (2.4%) | 465 (2.5%) |
| 85 Years and over | 300 (1.7%) | 635 (3.5%) |
| Total | 17,610 (100.0%) | 18,243 (100.0%) |
Families and Households in Greenup County
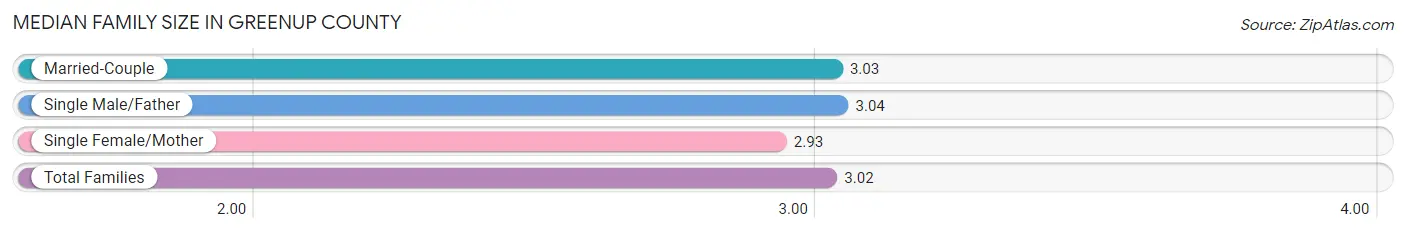
Median Family Size in Greenup County
The median family size in Greenup County is 3.02 persons per family, with single male/father families (755 | 7.9%) accounting for the largest median family size of 3.04 persons per family. On the other hand, single female/mother families (1,436 | 14.9%) represent the smallest median family size with 2.93 persons per family.
| Family Type | # Families | Family Size |
| Married-Couple | 7,432 (77.2%) | 3.03 |
| Single Male/Father | 755 (7.9%) | 3.04 |
| Single Female/Mother | 1,436 (14.9%) | 2.93 |
| Total Families | 9,623 (100.0%) | 3.02 |
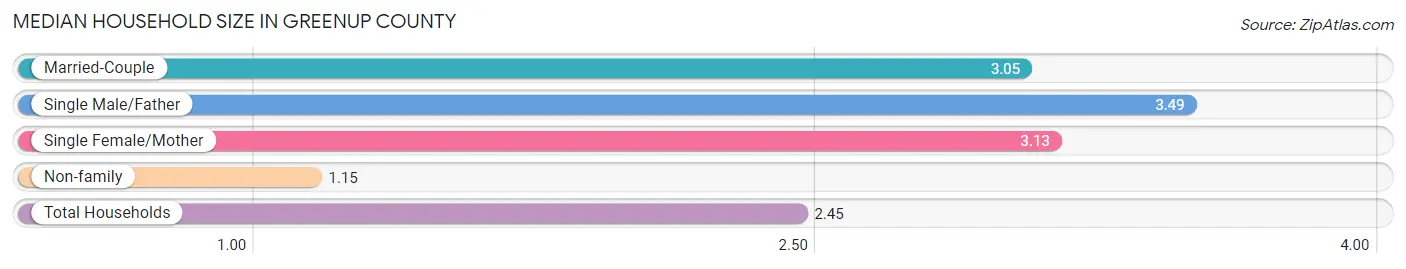
Median Household Size in Greenup County
The median household size in Greenup County is 2.45 persons per household, with single male/father households (755 | 5.2%) accounting for the largest median household size of 3.49 persons per household. non-family households (4,855 | 33.5%) represent the smallest median household size with 1.15 persons per household.
| Household Type | # Households | Household Size |
| Married-Couple | 7,432 (51.3%) | 3.05 |
| Single Male/Father | 755 (5.2%) | 3.49 |
| Single Female/Mother | 1,436 (9.9%) | 3.13 |
| Non-family | 4,855 (33.5%) | 1.15 |
| Total Households | 14,478 (100.0%) | 2.45 |
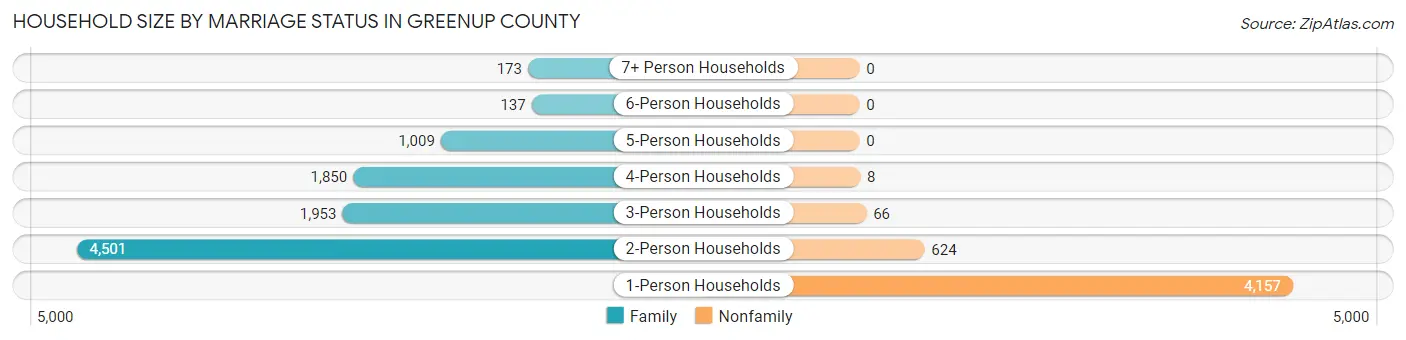
Household Size by Marriage Status in Greenup County
Out of a total of 14,478 households in Greenup County, 9,623 (66.5%) are family households, while 4,855 (33.5%) are nonfamily households. The most numerous type of family households are 2-person households, comprising 4,501, and the most common type of nonfamily households are 1-person households, comprising 4,157.
| Household Size | Family Households | Nonfamily Households |
| 1-Person Households | - | 4,157 (28.7%) |
| 2-Person Households | 4,501 (31.1%) | 624 (4.3%) |
| 3-Person Households | 1,953 (13.5%) | 66 (0.5%) |
| 4-Person Households | 1,850 (12.8%) | 8 (0.1%) |
| 5-Person Households | 1,009 (7.0%) | 0 (0.0%) |
| 6-Person Households | 137 (0.9%) | 0 (0.0%) |
| 7+ Person Households | 173 (1.2%) | 0 (0.0%) |
| Total | 9,623 (66.5%) | 4,855 (33.5%) |
Female Fertility in Greenup County
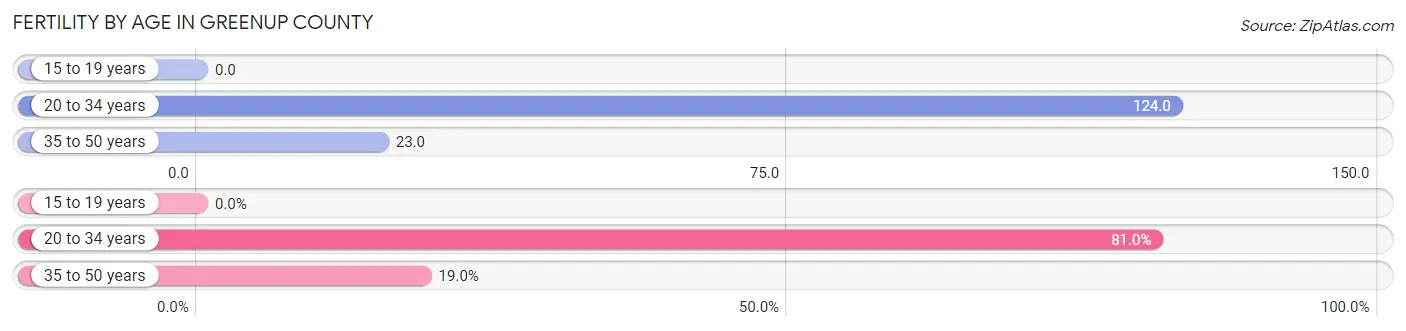
Fertility by Age in Greenup County
Average fertility rate in Greenup County is 59.0 births per 1,000 women. Women in the age bracket of 20 to 34 years have the highest fertility rate with 124.0 births per 1,000 women. Women in the age bracket of 20 to 34 years acount for 81.0% of all women with births.
| Age Bracket | Women with Births | Births / 1,000 Women |
| 15 to 19 years | 0 (0.0%) | 0.0 |
| 20 to 34 years | 346 (81.0%) | 124.0 |
| 35 to 50 years | 81 (19.0%) | 23.0 |
| Total | 427 (100.0%) | 59.0 |
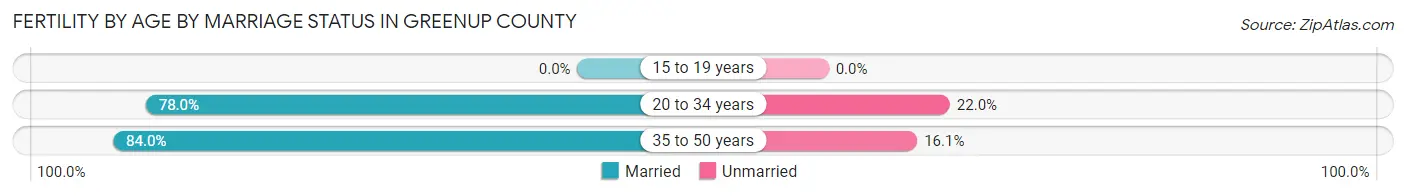
Fertility by Age by Marriage Status in Greenup County
79.2% of women with births (427) in Greenup County are married. The highest percentage of unmarried women with births falls into 20 to 34 years age bracket with 22.0% of them unmarried at the time of birth, while the lowest percentage of unmarried women with births belong to 35 to 50 years age bracket with 16.0% of them unmarried.
| Age Bracket | Married | Unmarried |
| 15 to 19 years | 0 (0.0%) | 0 (0.0%) |
| 20 to 34 years | 270 (78.0%) | 76 (22.0%) |
| 35 to 50 years | 68 (84.0%) | 13 (16.1%) |
| Total | 338 (79.2%) | 89 (20.8%) |
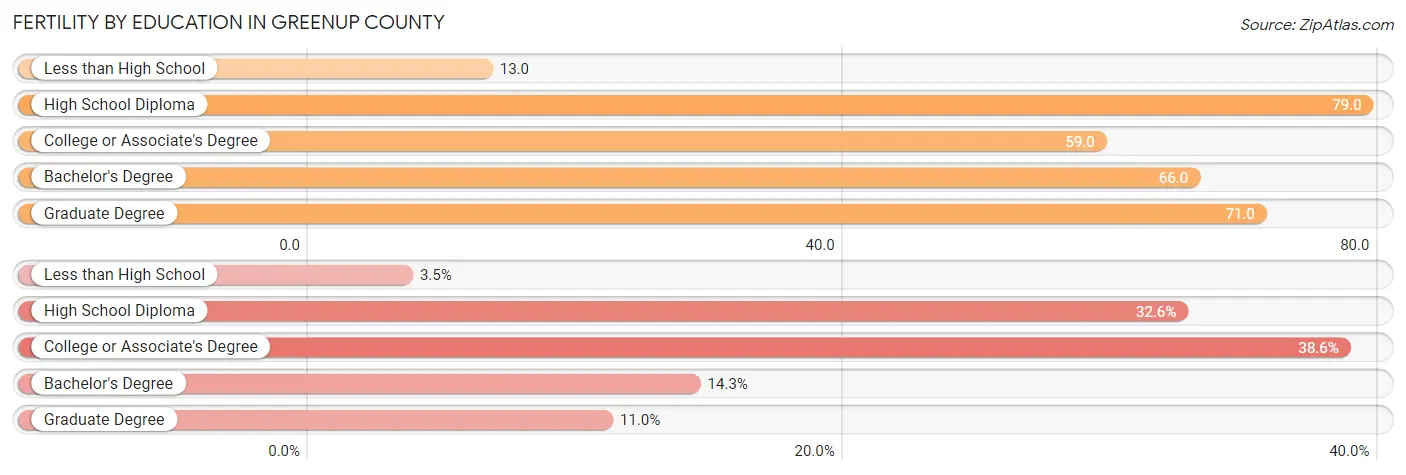
Fertility by Education in Greenup County
Average fertility rate in Greenup County is 59.0 births per 1,000 women. Women with the education attainment of high school diploma have the highest fertility rate of 79.0 births per 1,000 women, while women with the education attainment of less than high school have the lowest fertility at 13.0 births per 1,000 women. Women with the education attainment of college or associate's degree represent 38.6% of all women with births.
| Educational Attainment | Women with Births | Births / 1,000 Women |
| Less than High School | 15 (3.5%) | 13.0 |
| High School Diploma | 139 (32.6%) | 79.0 |
| College or Associate's Degree | 165 (38.6%) | 59.0 |
| Bachelor's Degree | 61 (14.3%) | 66.0 |
| Graduate Degree | 47 (11.0%) | 71.0 |
| Total | 427 (100.0%) | 59.0 |
Fertility by Education by Marriage Status in Greenup County
20.8% of women with births in Greenup County are unmarried. Women with the educational attainment of less than high school are most likely to be married with 100.0% of them married at childbirth, while women with the educational attainment of graduate degree are least likely to be married with 27.7% of them unmarried at childbirth.

| Educational Attainment | Married | Unmarried |
| Less than High School | 15 (100.0%) | 0 (0.0%) |
| High School Diploma | 102 (73.4%) | 37 (26.6%) |
| College or Associate's Degree | 126 (76.4%) | 39 (23.6%) |
| Bachelor's Degree | 61 (100.0%) | 0 (0.0%) |
| Graduate Degree | 34 (72.3%) | 13 (27.7%) |
| Total | 338 (79.2%) | 89 (20.8%) |
Income in Greenup County
Income Overview in Greenup County
Per Capita Income in Greenup County is $32,070, while median incomes of families and households are $72,842 and $58,562 respectively.
| Characteristic | Number | Measure |
| Per Capita Income | 35,853 | $32,070 |
| Median Family Income | 9,623 | $72,842 |
| Mean Family Income | 9,623 | $95,581 |
| Median Household Income | 14,478 | $58,562 |
| Mean Household Income | 14,478 | $79,161 |
| Income Deficit | 9,623 | $9,809 |
| Wage / Income Gap (%) | 35,853 | 36.49% |
| Wage / Income Gap ($) | 35,853 | 63.51¢ per $1 |
| Gini / Inequality Index | 35,853 | 0.48 |
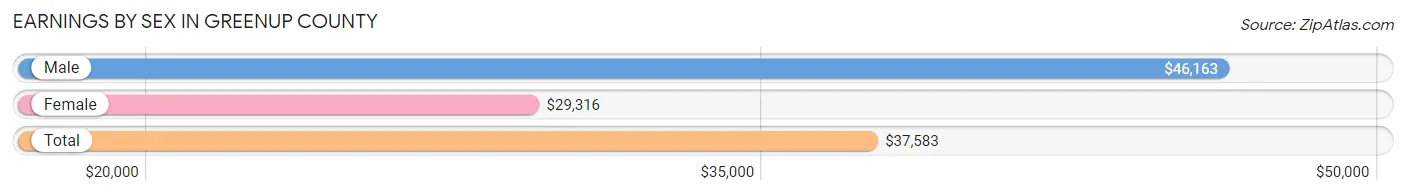
Earnings by Sex in Greenup County
Average Earnings in Greenup County are $37,583, $46,163 for men and $29,316 for women, a difference of 36.5%.
| Sex | Number | Average Earnings |
| Male | 8,427 (53.9%) | $46,163 |
| Female | 7,198 (46.1%) | $29,316 |
| Total | 15,625 (100.0%) | $37,583 |
Earnings by Sex by Income Bracket in Greenup County
The most common earnings brackets in Greenup County are $100,000+ for men (1,192 | 14.1%) and $2,499 or less for women (873 | 12.1%).
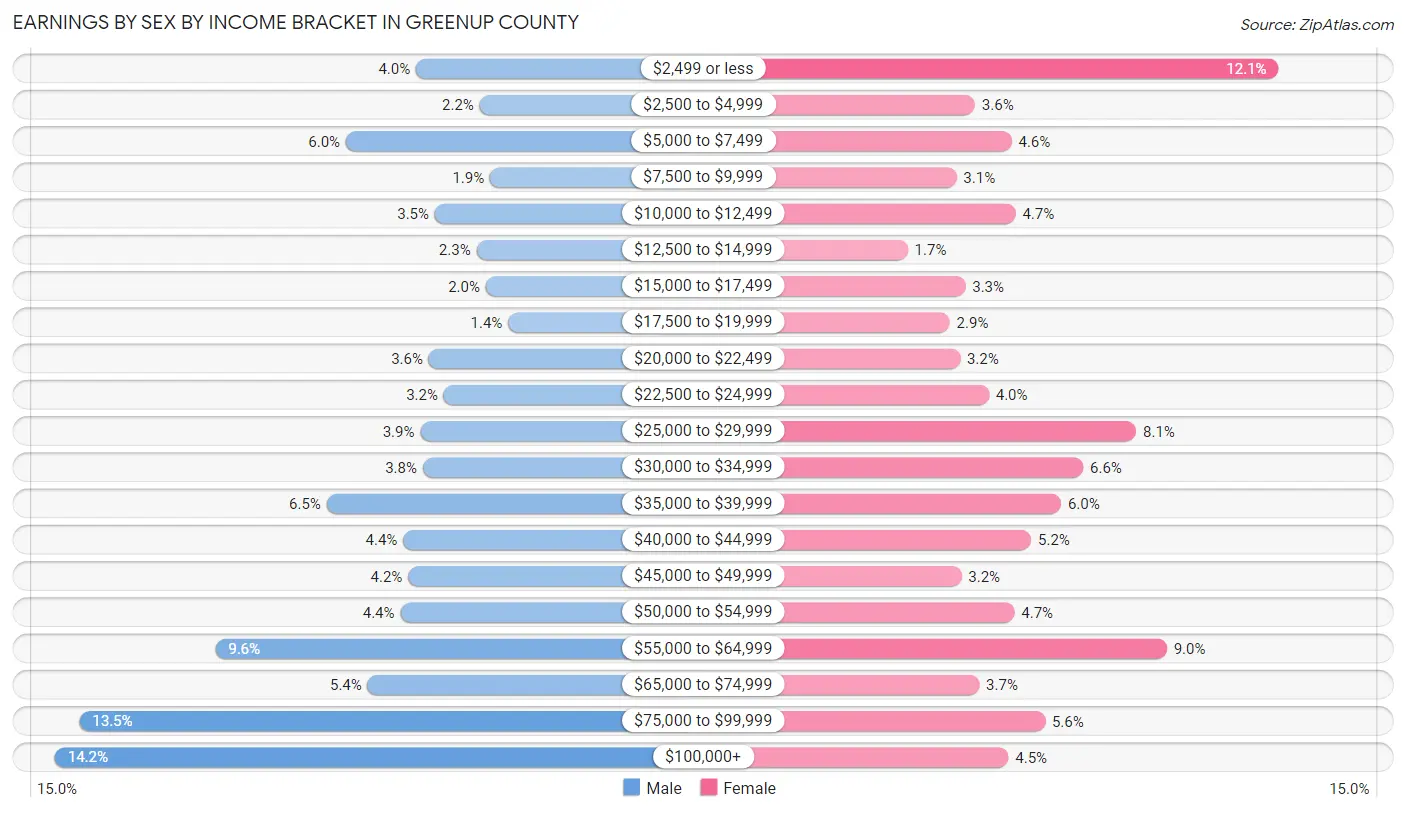
| Income | Male | Female |
| $2,499 or less | 337 (4.0%) | 873 (12.1%) |
| $2,500 to $4,999 | 186 (2.2%) | 259 (3.6%) |
| $5,000 to $7,499 | 503 (6.0%) | 333 (4.6%) |
| $7,500 to $9,999 | 162 (1.9%) | 222 (3.1%) |
| $10,000 to $12,499 | 292 (3.5%) | 341 (4.7%) |
| $12,500 to $14,999 | 194 (2.3%) | 123 (1.7%) |
| $15,000 to $17,499 | 172 (2.0%) | 240 (3.3%) |
| $17,500 to $19,999 | 119 (1.4%) | 208 (2.9%) |
| $20,000 to $22,499 | 307 (3.6%) | 229 (3.2%) |
| $22,500 to $24,999 | 271 (3.2%) | 287 (4.0%) |
| $25,000 to $29,999 | 327 (3.9%) | 585 (8.1%) |
| $30,000 to $34,999 | 321 (3.8%) | 478 (6.6%) |
| $35,000 to $39,999 | 549 (6.5%) | 433 (6.0%) |
| $40,000 to $44,999 | 367 (4.4%) | 373 (5.2%) |
| $45,000 to $49,999 | 356 (4.2%) | 232 (3.2%) |
| $50,000 to $54,999 | 374 (4.4%) | 339 (4.7%) |
| $55,000 to $64,999 | 812 (9.6%) | 647 (9.0%) |
| $65,000 to $74,999 | 452 (5.4%) | 268 (3.7%) |
| $75,000 to $99,999 | 1,134 (13.5%) | 401 (5.6%) |
| $100,000+ | 1,192 (14.1%) | 327 (4.5%) |
| Total | 8,427 (100.0%) | 7,198 (100.0%) |
Earnings by Sex by Educational Attainment in Greenup County
Average earnings in Greenup County are $53,192 for men and $33,335 for women, a difference of 37.3%. Men with an educational attainment of bachelor's degree enjoy the highest average annual earnings of $81,048, while those with less than high school education earn the least with $27,750. Women with an educational attainment of graduate degree earn the most with the average annual earnings of $55,481, while those with less than high school education have the smallest earnings of $16,875.
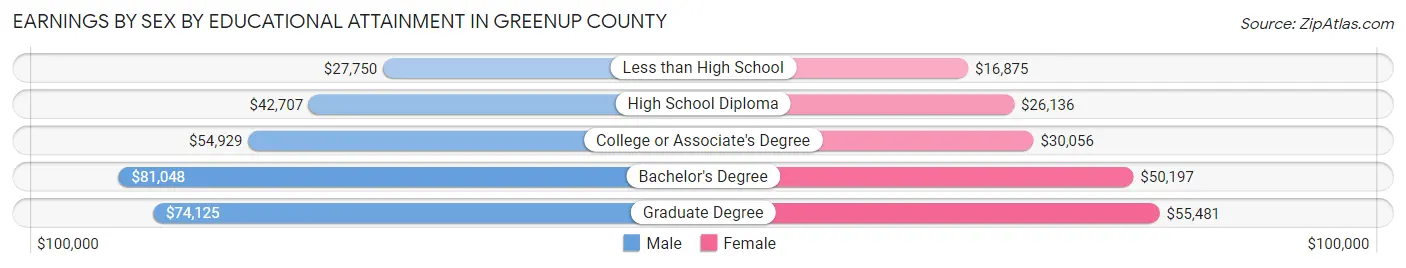
| Educational Attainment | Male Income | Female Income |
| Less than High School | $27,750 | $16,875 |
| High School Diploma | $42,707 | $26,136 |
| College or Associate's Degree | $54,929 | $30,056 |
| Bachelor's Degree | $81,048 | $50,197 |
| Graduate Degree | $74,125 | $55,481 |
| Total | $53,192 | $33,335 |
Family Income in Greenup County
Family Income Brackets in Greenup County
According to the Greenup County family income data, there are 2,242 families falling into the $50,000 to $74,999 income range, which is the most common income bracket and makes up 23.3% of all families. Conversely, the $10,000 to $14,999 income bracket is the least frequent group with only 260 families (2.7%) belonging to this category.
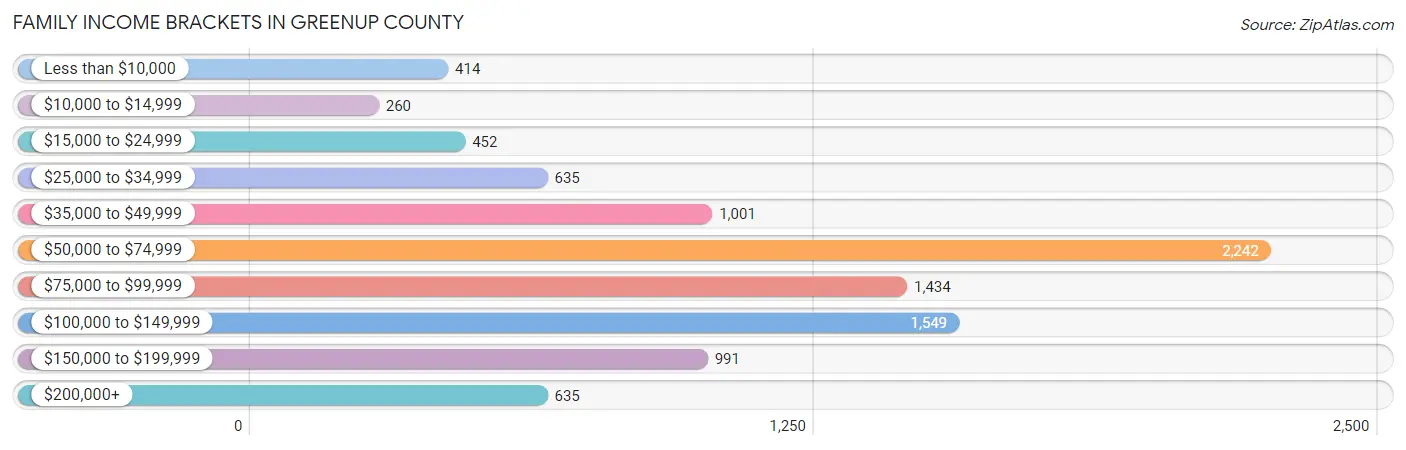
| Income Bracket | # Families | % Families |
| Less than $10,000 | 414 | 4.3% |
| $10,000 to $14,999 | 260 | 2.7% |
| $15,000 to $24,999 | 452 | 4.7% |
| $25,000 to $34,999 | 635 | 6.6% |
| $35,000 to $49,999 | 1,001 | 10.4% |
| $50,000 to $74,999 | 2,242 | 23.3% |
| $75,000 to $99,999 | 1,434 | 14.9% |
| $100,000 to $149,999 | 1,549 | 16.1% |
| $150,000 to $199,999 | 991 | 10.3% |
| $200,000+ | 635 | 6.6% |
Family Income by Famaliy Size in Greenup County
5-person families (858 | 8.9%) account for the highest median family income in Greenup County with $94,630 per family, while 2-person families (4,608 | 47.9%) have the highest median income of $31,424 per family member.
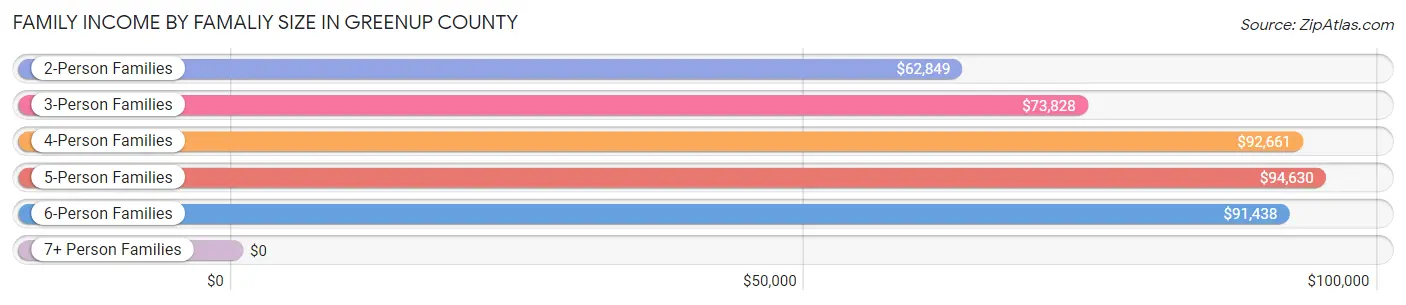
| Income Bracket | # Families | Median Income |
| 2-Person Families | 4,608 (47.9%) | $62,849 |
| 3-Person Families | 2,090 (21.7%) | $73,828 |
| 4-Person Families | 1,818 (18.9%) | $92,661 |
| 5-Person Families | 858 (8.9%) | $94,630 |
| 6-Person Families | 130 (1.3%) | $91,438 |
| 7+ Person Families | 119 (1.2%) | $0 |
| Total | 9,623 (100.0%) | $72,842 |
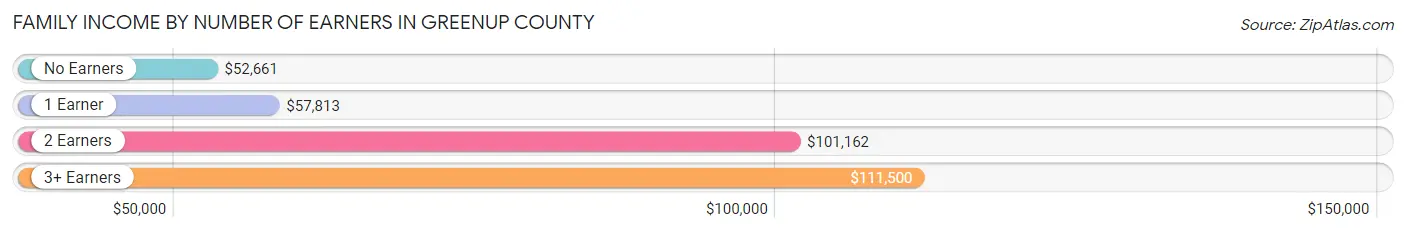
Family Income by Number of Earners in Greenup County
The median family income in Greenup County is $72,842, with families comprising 3+ earners (844) having the highest median family income of $111,500, while families with no earners (2,489) have the lowest median family income of $52,661, accounting for 8.8% and 25.9% of families, respectively.
| Number of Earners | # Families | Median Income |
| No Earners | 2,489 (25.9%) | $52,661 |
| 1 Earner | 2,790 (29.0%) | $57,813 |
| 2 Earners | 3,500 (36.4%) | $101,162 |
| 3+ Earners | 844 (8.8%) | $111,500 |
| Total | 9,623 (100.0%) | $72,842 |
Household Income in Greenup County
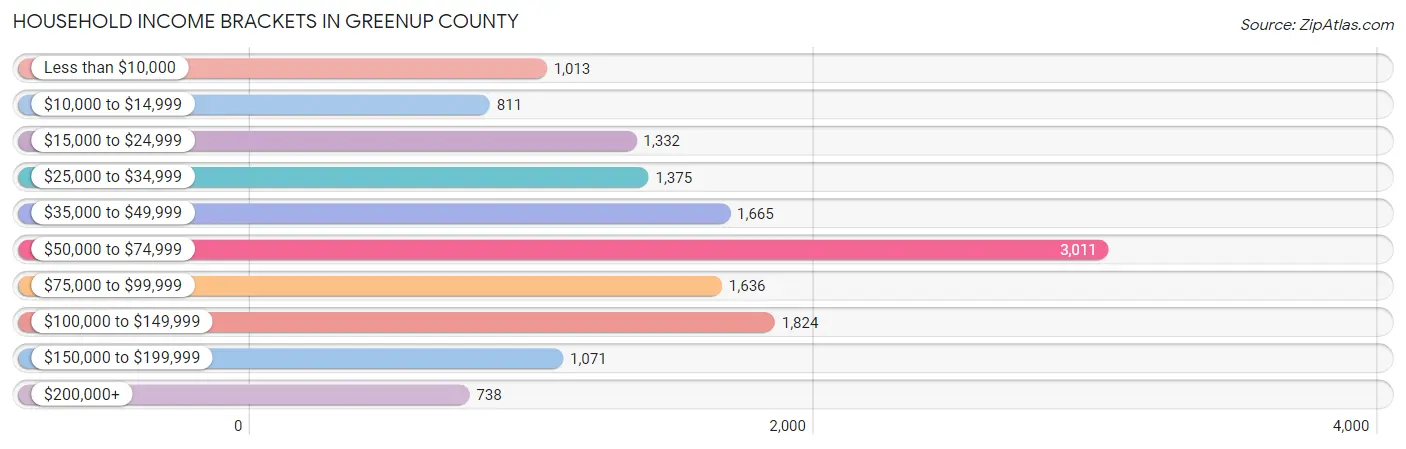
Household Income Brackets in Greenup County
With 3,011 households falling in the category, the $50,000 to $74,999 income range is the most frequent in Greenup County, accounting for 20.8% of all households. In contrast, only 738 households (5.1%) fall into the $200,000+ income bracket, making it the least populous group.
| Income Bracket | # Households | % Households |
| Less than $10,000 | 1,013 | 7.0% |
| $10,000 to $14,999 | 811 | 5.6% |
| $15,000 to $24,999 | 1,332 | 9.2% |
| $25,000 to $34,999 | 1,375 | 9.5% |
| $35,000 to $49,999 | 1,665 | 11.5% |
| $50,000 to $74,999 | 3,011 | 20.8% |
| $75,000 to $99,999 | 1,636 | 11.3% |
| $100,000 to $149,999 | 1,824 | 12.6% |
| $150,000 to $199,999 | 1,071 | 7.4% |
| $200,000+ | 738 | 5.1% |
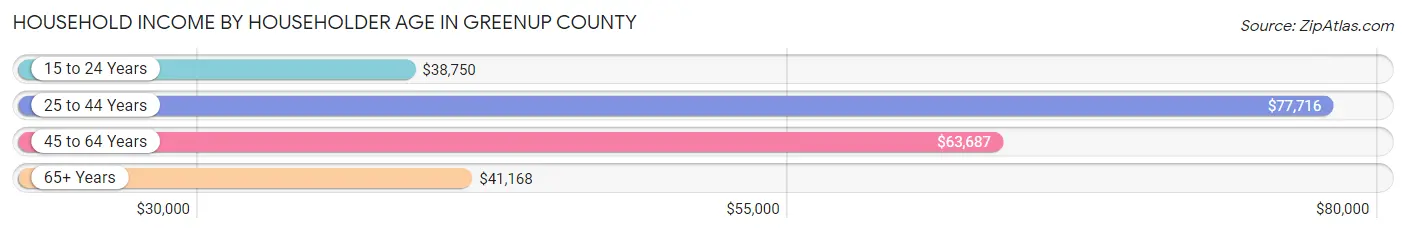
Household Income by Householder Age in Greenup County
The median household income in Greenup County is $58,562, with the highest median household income of $77,716 found in the 25 to 44 years age bracket for the primary householder. A total of 3,625 households (25.0%) fall into this category. Meanwhile, the 15 to 24 years age bracket for the primary householder has the lowest median household income of $38,750, with 366 households (2.5%) in this group.
| Income Bracket | # Households | Median Income |
| 15 to 24 Years | 366 (2.5%) | $38,750 |
| 25 to 44 Years | 3,625 (25.0%) | $77,716 |
| 45 to 64 Years | 5,375 (37.1%) | $63,687 |
| 65+ Years | 5,112 (35.3%) | $41,168 |
| Total | 14,478 (100.0%) | $58,562 |
Poverty in Greenup County
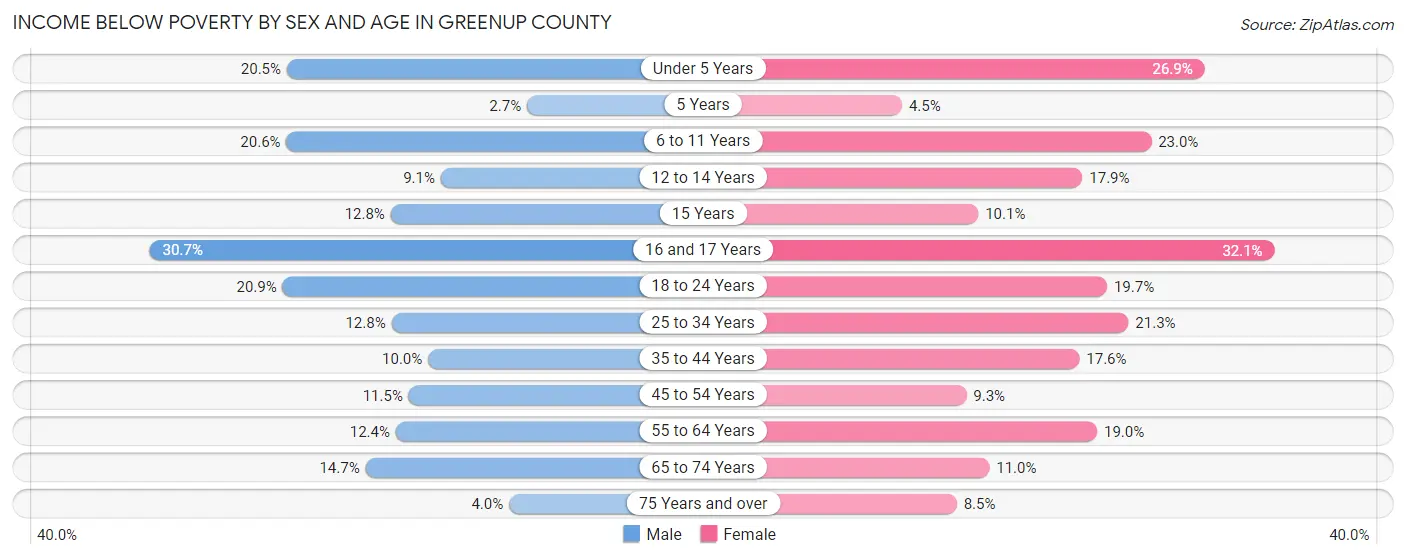
Income Below Poverty by Sex and Age in Greenup County
With 13.8% poverty level for males and 16.3% for females among the residents of Greenup County, 16 and 17 year old males and 16 and 17 year old females are the most vulnerable to poverty, with 188 males (30.7%) and 159 females (32.1%) in their respective age groups living below the poverty level.
| Age Bracket | Male | Female |
| Under 5 Years | 192 (20.5%) | 229 (26.9%) |
| 5 Years | 6 (2.7%) | 13 (4.5%) |
| 6 to 11 Years | 251 (20.6%) | 277 (23.0%) |
| 12 to 14 Years | 71 (9.1%) | 107 (17.9%) |
| 15 Years | 20 (12.8%) | 23 (10.1%) |
| 16 and 17 Years | 188 (30.7%) | 159 (32.1%) |
| 18 to 24 Years | 289 (20.8%) | 230 (19.7%) |
| 25 to 34 Years | 245 (12.8%) | 407 (21.3%) |
| 35 to 44 Years | 214 (10.0%) | 375 (17.6%) |
| 45 to 54 Years | 261 (11.5%) | 225 (9.2%) |
| 55 to 64 Years | 304 (12.4%) | 478 (19.0%) |
| 65 to 74 Years | 299 (14.7%) | 261 (11.0%) |
| 75 Years and over | 51 (4.0%) | 148 (8.5%) |
| Total | 2,391 (13.8%) | 2,932 (16.3%) |
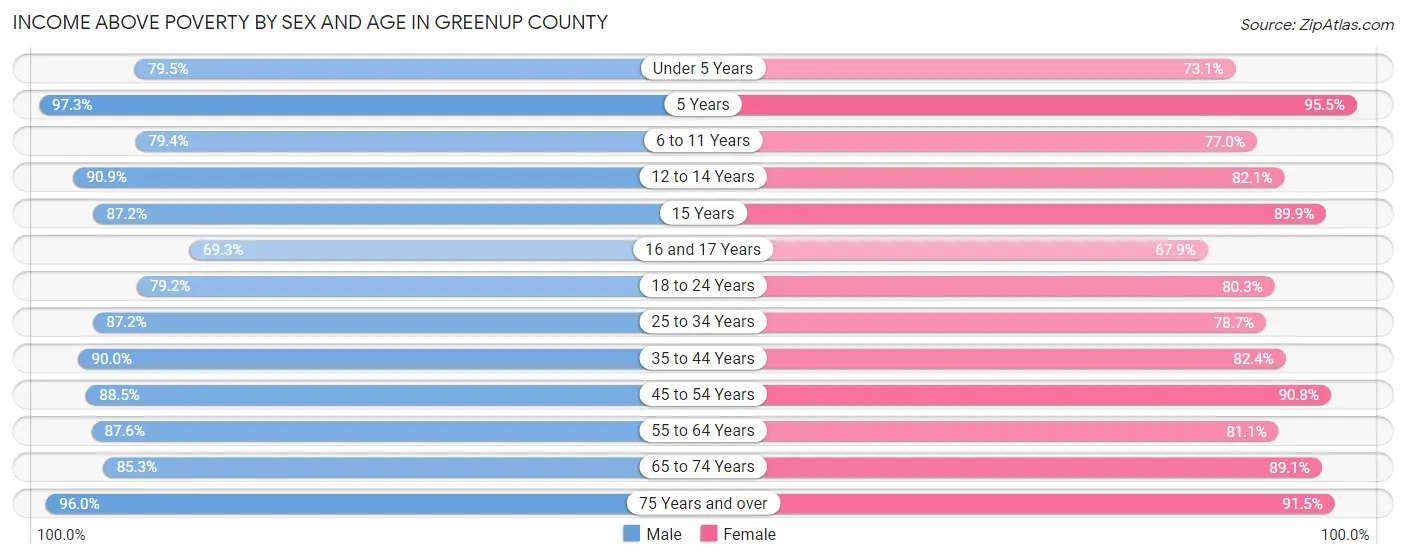
Income Above Poverty by Sex and Age in Greenup County
According to the poverty statistics in Greenup County, males aged 5 years and females aged 5 years are the age groups that are most secure financially, with 97.3% of males and 95.5% of females in these age groups living above the poverty line.
| Age Bracket | Male | Female |
| Under 5 Years | 743 (79.5%) | 621 (73.1%) |
| 5 Years | 216 (97.3%) | 278 (95.5%) |
| 6 to 11 Years | 970 (79.4%) | 929 (77.0%) |
| 12 to 14 Years | 709 (90.9%) | 492 (82.1%) |
| 15 Years | 136 (87.2%) | 204 (89.9%) |
| 16 and 17 Years | 424 (69.3%) | 336 (67.9%) |
| 18 to 24 Years | 1,097 (79.1%) | 938 (80.3%) |
| 25 to 34 Years | 1,675 (87.2%) | 1,506 (78.7%) |
| 35 to 44 Years | 1,917 (90.0%) | 1,751 (82.4%) |
| 45 to 54 Years | 2,012 (88.5%) | 2,207 (90.7%) |
| 55 to 64 Years | 2,139 (87.6%) | 2,045 (81.0%) |
| 65 to 74 Years | 1,736 (85.3%) | 2,122 (89.0%) |
| 75 Years and over | 1,215 (96.0%) | 1,587 (91.5%) |
| Total | 14,989 (86.2%) | 15,016 (83.7%) |
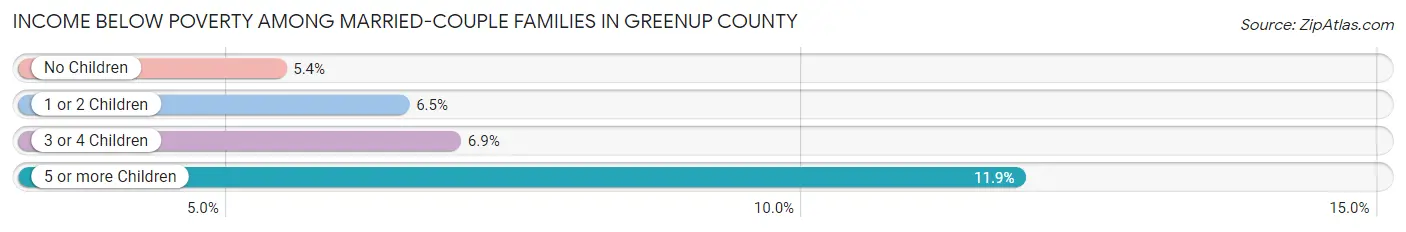
Income Below Poverty Among Married-Couple Families in Greenup County
The poverty statistics for married-couple families in Greenup County show that 5.9% or 441 of the total 7,432 families live below the poverty line. Families with 5 or more children have the highest poverty rate of 11.9%, comprising of 7 families. On the other hand, families with no children have the lowest poverty rate of 5.4%, which includes 240 families.
| Children | Above Poverty | Below Poverty |
| No Children | 4,189 (94.6%) | 240 (5.4%) |
| 1 or 2 Children | 2,147 (93.5%) | 149 (6.5%) |
| 3 or 4 Children | 603 (93.1%) | 45 (6.9%) |
| 5 or more Children | 52 (88.1%) | 7 (11.9%) |
| Total | 6,991 (94.1%) | 441 (5.9%) |
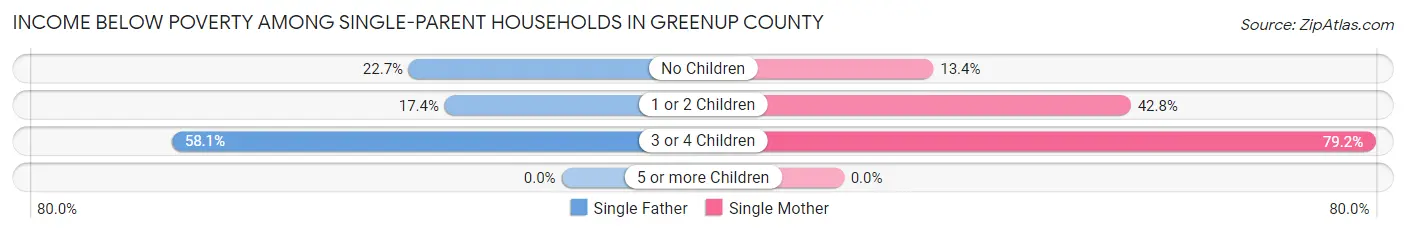
Income Below Poverty Among Single-Parent Households in Greenup County
According to the poverty data in Greenup County, 26.1% or 197 single-father households and 30.8% or 442 single-mother households are living below the poverty line. Among single-father households, those with 3 or 4 children have the highest poverty rate, with 72 households (58.1%) experiencing poverty. Likewise, among single-mother households, those with 3 or 4 children have the highest poverty rate, with 76 households (79.2%) falling below the poverty line.
| Children | Single Father | Single Mother |
| No Children | 65 (22.7%) | 94 (13.4%) |
| 1 or 2 Children | 60 (17.4%) | 272 (42.8%) |
| 3 or 4 Children | 72 (58.1%) | 76 (79.2%) |
| 5 or more Children | 0 (0.0%) | 0 (0.0%) |
| Total | 197 (26.1%) | 442 (30.8%) |
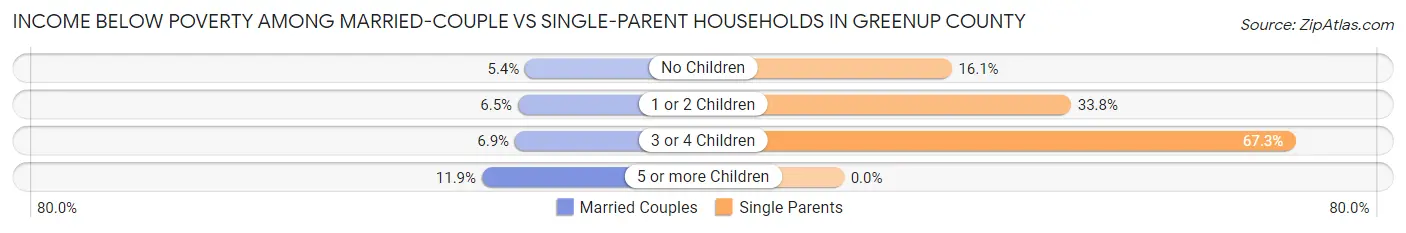
Income Below Poverty Among Married-Couple vs Single-Parent Households in Greenup County
The poverty data for Greenup County shows that 441 of the married-couple family households (5.9%) and 639 of the single-parent households (29.2%) are living below the poverty level. Within the married-couple family households, those with 5 or more children have the highest poverty rate, with 7 households (11.9%) falling below the poverty line. Among the single-parent households, those with 3 or 4 children have the highest poverty rate, with 148 household (67.3%) living below poverty.
| Children | Married-Couple Families | Single-Parent Households |
| No Children | 240 (5.4%) | 159 (16.1%) |
| 1 or 2 Children | 149 (6.5%) | 332 (33.8%) |
| 3 or 4 Children | 45 (6.9%) | 148 (67.3%) |
| 5 or more Children | 7 (11.9%) | 0 (0.0%) |
| Total | 441 (5.9%) | 639 (29.2%) |
Employment Characteristics in Greenup County
Employment by Class of Employer in Greenup County
Among the 13,549 employed individuals in Greenup County, private company employees (9,021 | 66.6%), not-for-profit organizations (1,491 | 11.0%), and local government employees (862 | 6.4%) make up the most common classes of employment.
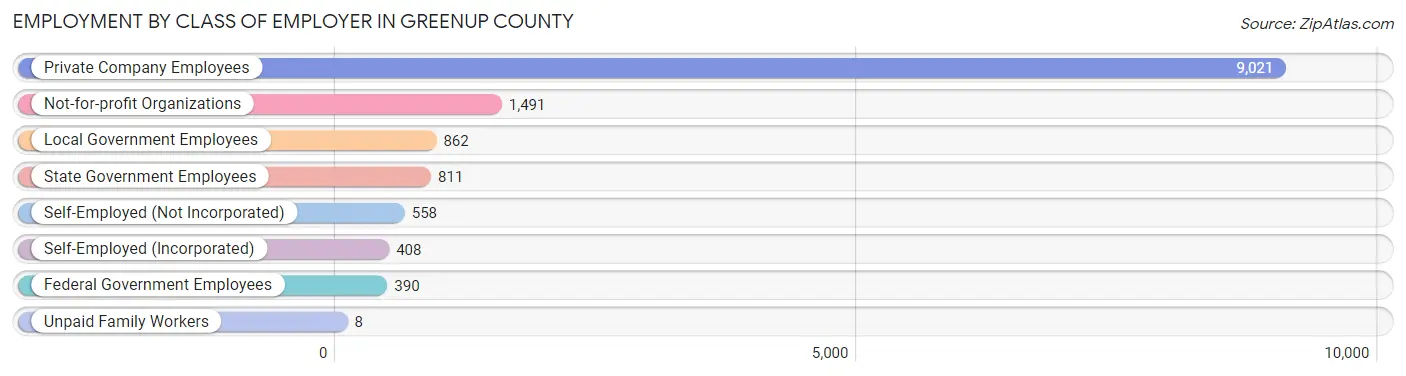
| Employer Class | # Employees | % Employees |
| Private Company Employees | 9,021 | 66.6% |
| Self-Employed (Incorporated) | 408 | 3.0% |
| Self-Employed (Not Incorporated) | 558 | 4.1% |
| Not-for-profit Organizations | 1,491 | 11.0% |
| Local Government Employees | 862 | 6.4% |
| State Government Employees | 811 | 6.0% |
| Federal Government Employees | 390 | 2.9% |
| Unpaid Family Workers | 8 | 0.1% |
| Total | 13,549 | 100.0% |
Employment Status by Age in Greenup County
According to the labor force statistics for Greenup County, out of the total population over 16 years of age (29,276), 50.1% or 14,667 individuals are in the labor force, with 6.2% or 909 of them unemployed. The age group with the highest labor force participation rate is 35 to 44 years, with 83.9% or 3,607 individuals in the labor force. Within the labor force, the 75 years and over age range has the highest percentage of unemployed individuals, with 15.8% or 19 of them being unemployed.
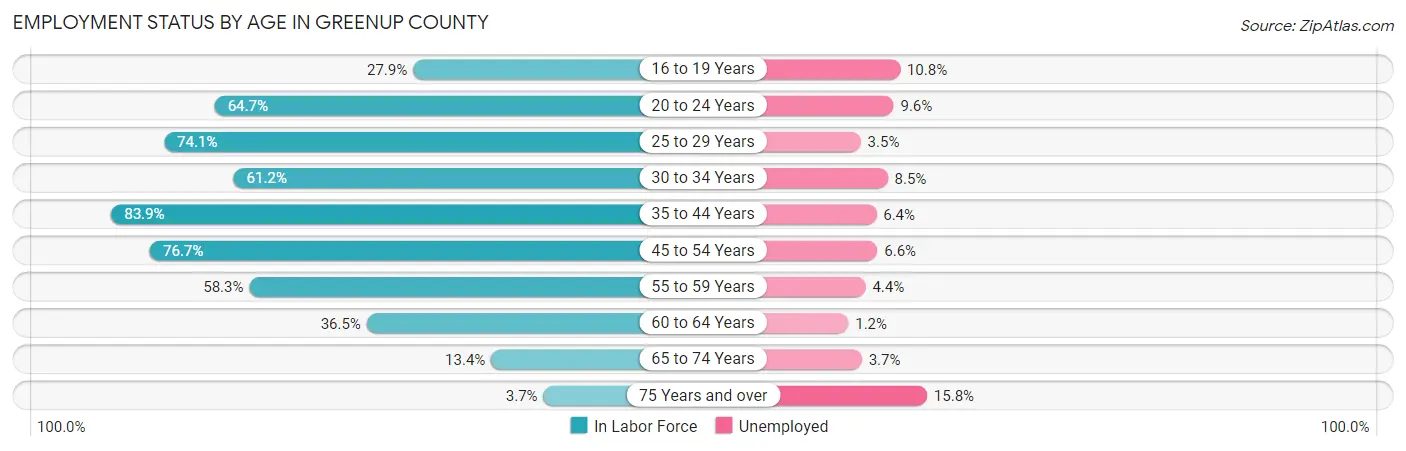
| Age Bracket | In Labor Force | Unemployed |
| 16 to 19 Years | 508 (27.9%) | 55 (10.8%) |
| 20 to 24 Years | 1,203 (64.7%) | 115 (9.6%) |
| 25 to 29 Years | 1,502 (74.1%) | 53 (3.5%) |
| 30 to 34 Years | 1,132 (61.2%) | 96 (8.5%) |
| 35 to 44 Years | 3,607 (83.9%) | 231 (6.4%) |
| 45 to 54 Years | 3,640 (76.7%) | 240 (6.6%) |
| 55 to 59 Years | 1,413 (58.3%) | 62 (4.4%) |
| 60 to 64 Years | 937 (36.5%) | 11 (1.2%) |
| 65 to 74 Years | 600 (13.4%) | 22 (3.7%) |
| 75 Years and over | 119 (3.7%) | 19 (15.8%) |
| Total | 14,667 (50.1%) | 909 (6.2%) |
Employment Status by Educational Attainment in Greenup County
According to labor force statistics for Greenup County, 68.3% of individuals (12,234) out of the total population between 25 and 64 years of age (17,912) are in the labor force, with 5.7% or 697 of them being unemployed. The group with the highest labor force participation rate are those with the educational attainment of bachelor's degree or higher, with 83.4% or 2,893 individuals in the labor force. Within the labor force, individuals with high school diploma education have the highest percentage of unemployment, with 9.2% or 341 of them being unemployed.
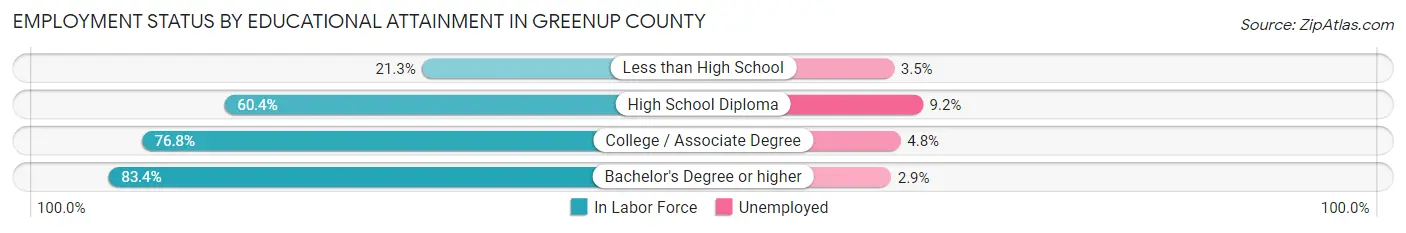
| Educational Attainment | In Labor Force | Unemployed |
| Less than High School | 288 (21.3%) | 47 (3.5%) |
| High School Diploma | 3,704 (60.4%) | 564 (9.2%) |
| College / Associate Degree | 5,345 (76.8%) | 334 (4.8%) |
| Bachelor's Degree or higher | 2,893 (83.4%) | 101 (2.9%) |
| Total | 12,234 (68.3%) | 1,021 (5.7%) |
Employment Occupations by Sex in Greenup County
Management, Business, Science and Arts Occupations
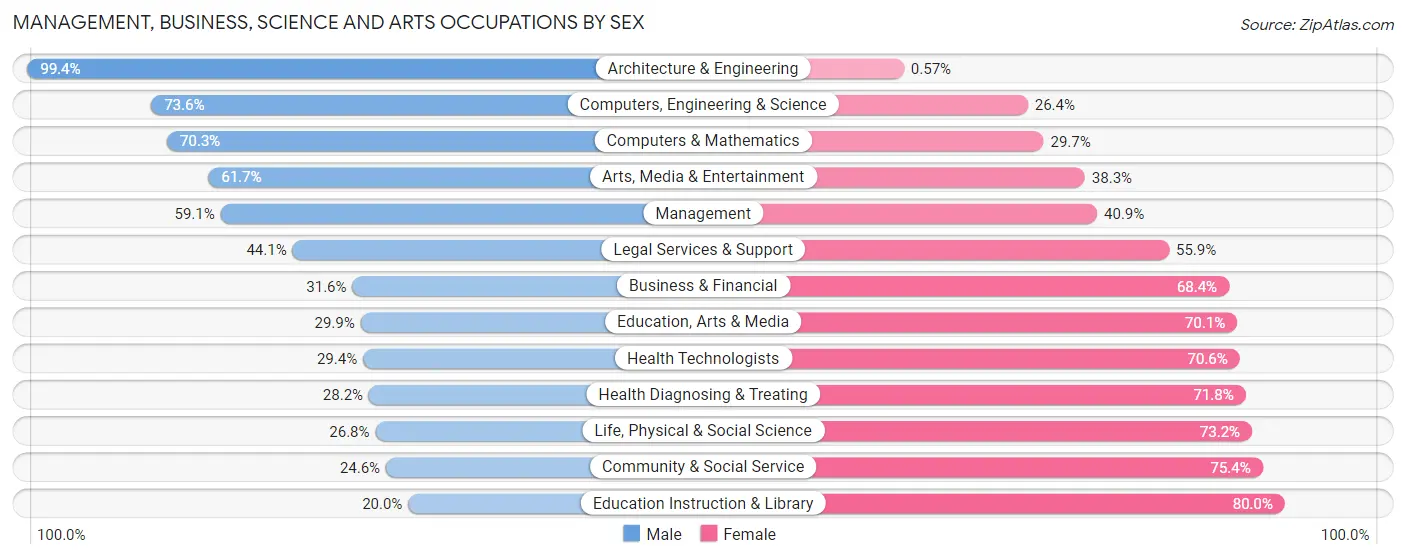
The most common Management, Business, Science and Arts occupations in Greenup County are Health Diagnosing & Treating (1,860 | 13.5%), Community & Social Service (1,637 | 11.9%), Education Instruction & Library (1,211 | 8.8%), Health Technologists (1,163 | 8.5%), and Management (1,062 | 7.7%).
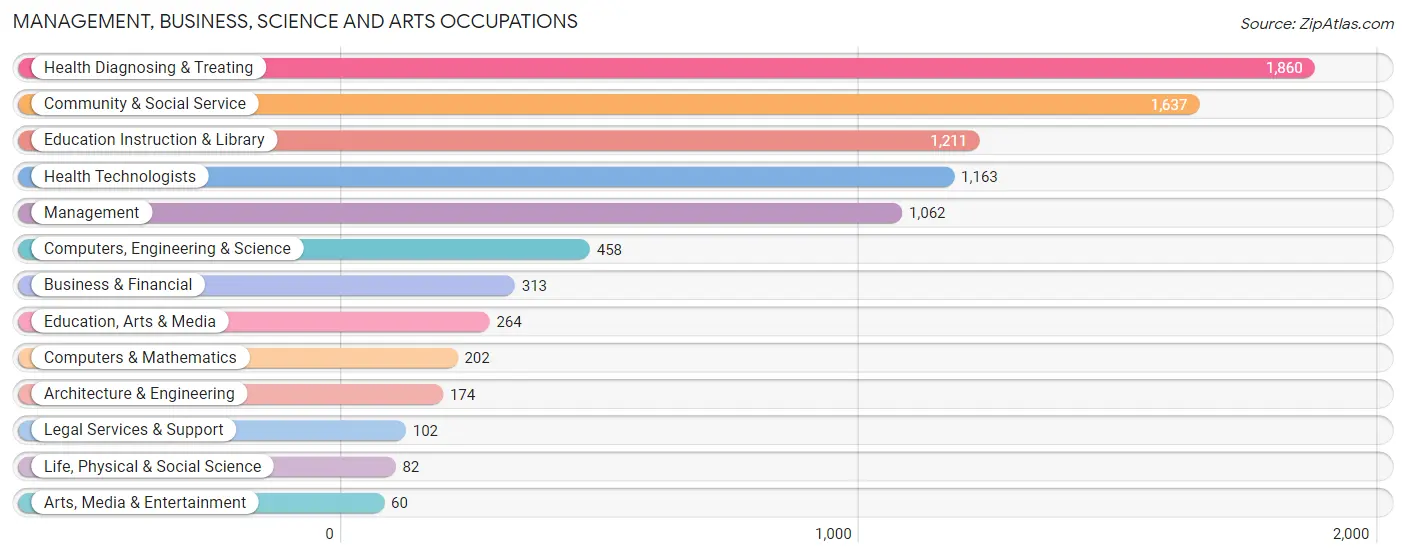
Management, Business, Science and Arts Occupations by Sex
Within the Management, Business, Science and Arts occupations in Greenup County, the most male-oriented occupations are Architecture & Engineering (99.4%), Computers, Engineering & Science (73.6%), and Computers & Mathematics (70.3%), while the most female-oriented occupations are Education Instruction & Library (80.0%), Community & Social Service (75.4%), and Life, Physical & Social Science (73.2%).
| Occupation | Male | Female |
| Management | 628 (59.1%) | 434 (40.9%) |
| Business & Financial | 99 (31.6%) | 214 (68.4%) |
| Computers, Engineering & Science | 337 (73.6%) | 121 (26.4%) |
| Computers & Mathematics | 142 (70.3%) | 60 (29.7%) |
| Architecture & Engineering | 173 (99.4%) | 1 (0.6%) |
| Life, Physical & Social Science | 22 (26.8%) | 60 (73.2%) |
| Community & Social Service | 403 (24.6%) | 1,234 (75.4%) |
| Education, Arts & Media | 79 (29.9%) | 185 (70.1%) |
| Legal Services & Support | 45 (44.1%) | 57 (55.9%) |
| Education Instruction & Library | 242 (20.0%) | 969 (80.0%) |
| Arts, Media & Entertainment | 37 (61.7%) | 23 (38.3%) |
| Health Diagnosing & Treating | 524 (28.2%) | 1,336 (71.8%) |
| Health Technologists | 342 (29.4%) | 821 (70.6%) |
| Total (Category) | 1,991 (37.3%) | 3,339 (62.6%) |
| Total (Overall) | 7,542 (54.9%) | 6,199 (45.1%) |
Services Occupations
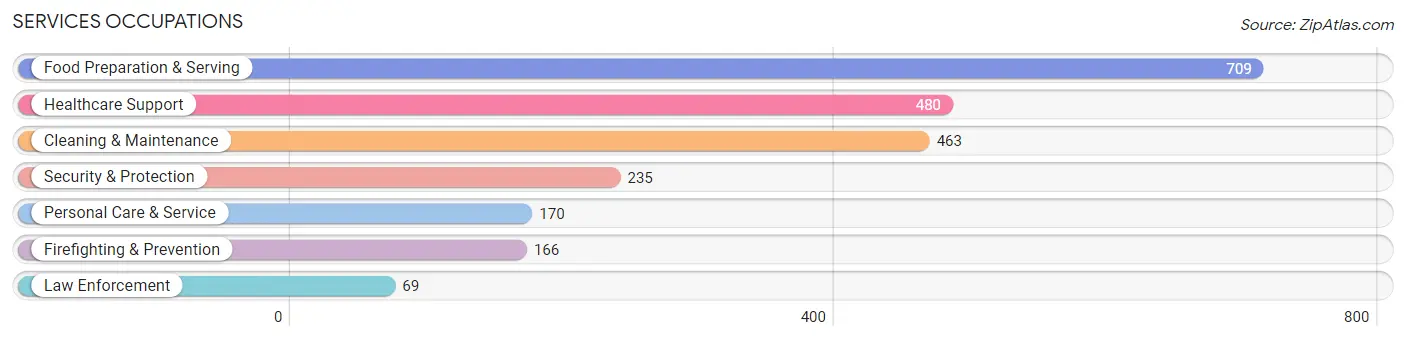
The most common Services occupations in Greenup County are Food Preparation & Serving (709 | 5.2%), Healthcare Support (480 | 3.5%), Cleaning & Maintenance (463 | 3.4%), Security & Protection (235 | 1.7%), and Personal Care & Service (170 | 1.2%).
Services Occupations by Sex
Within the Services occupations in Greenup County, the most male-oriented occupations are Law Enforcement (100.0%), Security & Protection (94.9%), and Firefighting & Prevention (92.8%), while the most female-oriented occupations are Personal Care & Service (74.1%), Healthcare Support (70.4%), and Food Preparation & Serving (59.4%).
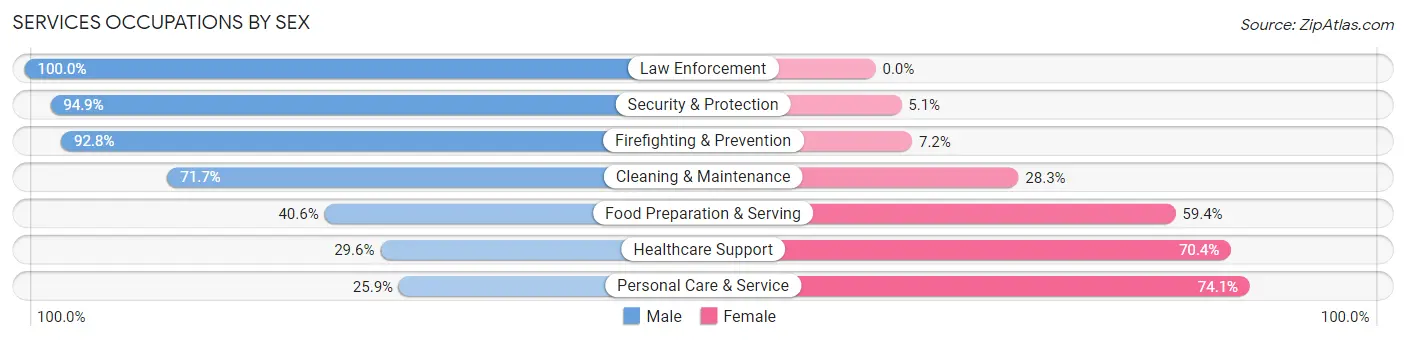
| Occupation | Male | Female |
| Healthcare Support | 142 (29.6%) | 338 (70.4%) |
| Security & Protection | 223 (94.9%) | 12 (5.1%) |
| Firefighting & Prevention | 154 (92.8%) | 12 (7.2%) |
| Law Enforcement | 69 (100.0%) | 0 (0.0%) |
| Food Preparation & Serving | 288 (40.6%) | 421 (59.4%) |
| Cleaning & Maintenance | 332 (71.7%) | 131 (28.3%) |
| Personal Care & Service | 44 (25.9%) | 126 (74.1%) |
| Total (Category) | 1,029 (50.0%) | 1,028 (50.0%) |
| Total (Overall) | 7,542 (54.9%) | 6,199 (45.1%) |
Sales and Office Occupations
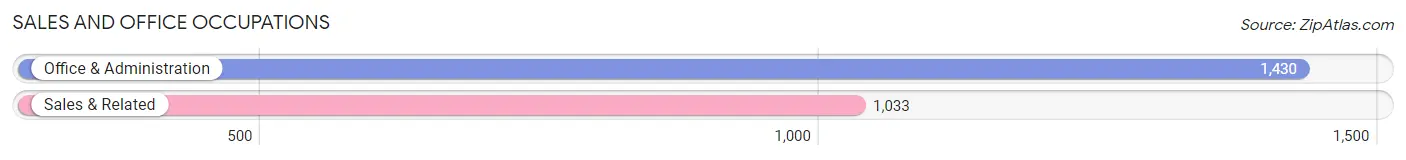
The most common Sales and Office occupations in Greenup County are Office & Administration (1,430 | 10.4%), and Sales & Related (1,033 | 7.5%).
Sales and Office Occupations by Sex
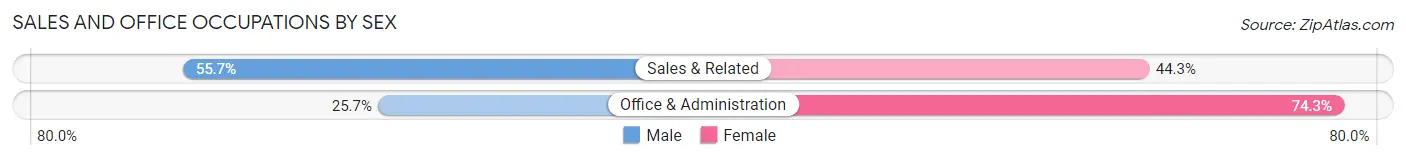
| Occupation | Male | Female |
| Sales & Related | 575 (55.7%) | 458 (44.3%) |
| Office & Administration | 367 (25.7%) | 1,063 (74.3%) |
| Total (Category) | 942 (38.3%) | 1,521 (61.8%) |
| Total (Overall) | 7,542 (54.9%) | 6,199 (45.1%) |
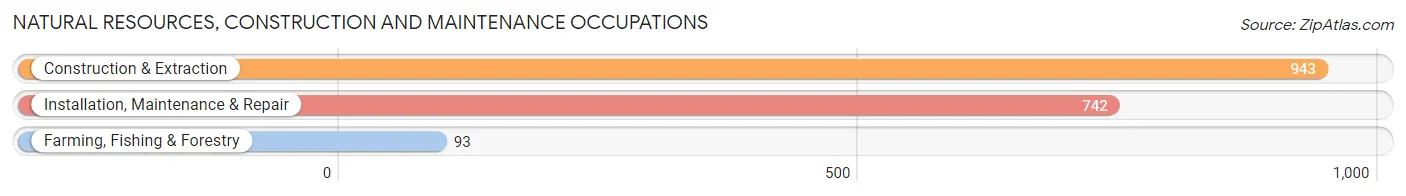
Natural Resources, Construction and Maintenance Occupations
The most common Natural Resources, Construction and Maintenance occupations in Greenup County are Construction & Extraction (943 | 6.9%), Installation, Maintenance & Repair (742 | 5.4%), and Farming, Fishing & Forestry (93 | 0.7%).
Natural Resources, Construction and Maintenance Occupations by Sex
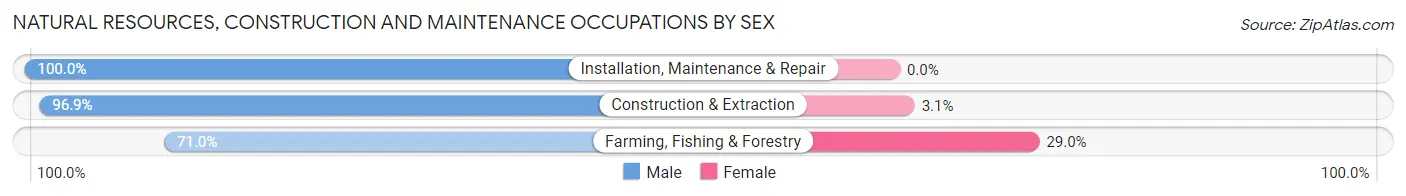
| Occupation | Male | Female |
| Farming, Fishing & Forestry | 66 (71.0%) | 27 (29.0%) |
| Construction & Extraction | 914 (96.9%) | 29 (3.1%) |
| Installation, Maintenance & Repair | 742 (100.0%) | 0 (0.0%) |
| Total (Category) | 1,722 (96.9%) | 56 (3.2%) |
| Total (Overall) | 7,542 (54.9%) | 6,199 (45.1%) |
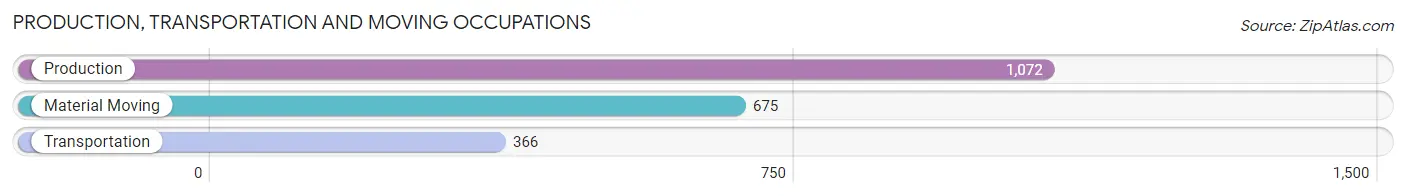
Production, Transportation and Moving Occupations
The most common Production, Transportation and Moving occupations in Greenup County are Production (1,072 | 7.8%), Material Moving (675 | 4.9%), and Transportation (366 | 2.7%).
Production, Transportation and Moving Occupations by Sex
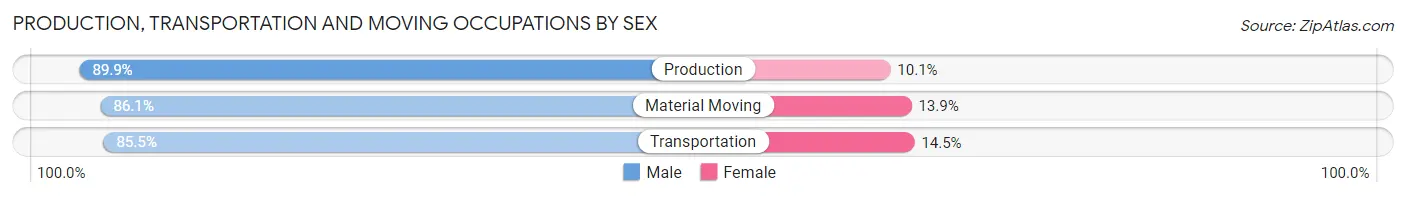
| Occupation | Male | Female |
| Production | 964 (89.9%) | 108 (10.1%) |
| Transportation | 313 (85.5%) | 53 (14.5%) |
| Material Moving | 581 (86.1%) | 94 (13.9%) |
| Total (Category) | 1,858 (87.9%) | 255 (12.1%) |
| Total (Overall) | 7,542 (54.9%) | 6,199 (45.1%) |
Employment Industries by Sex in Greenup County
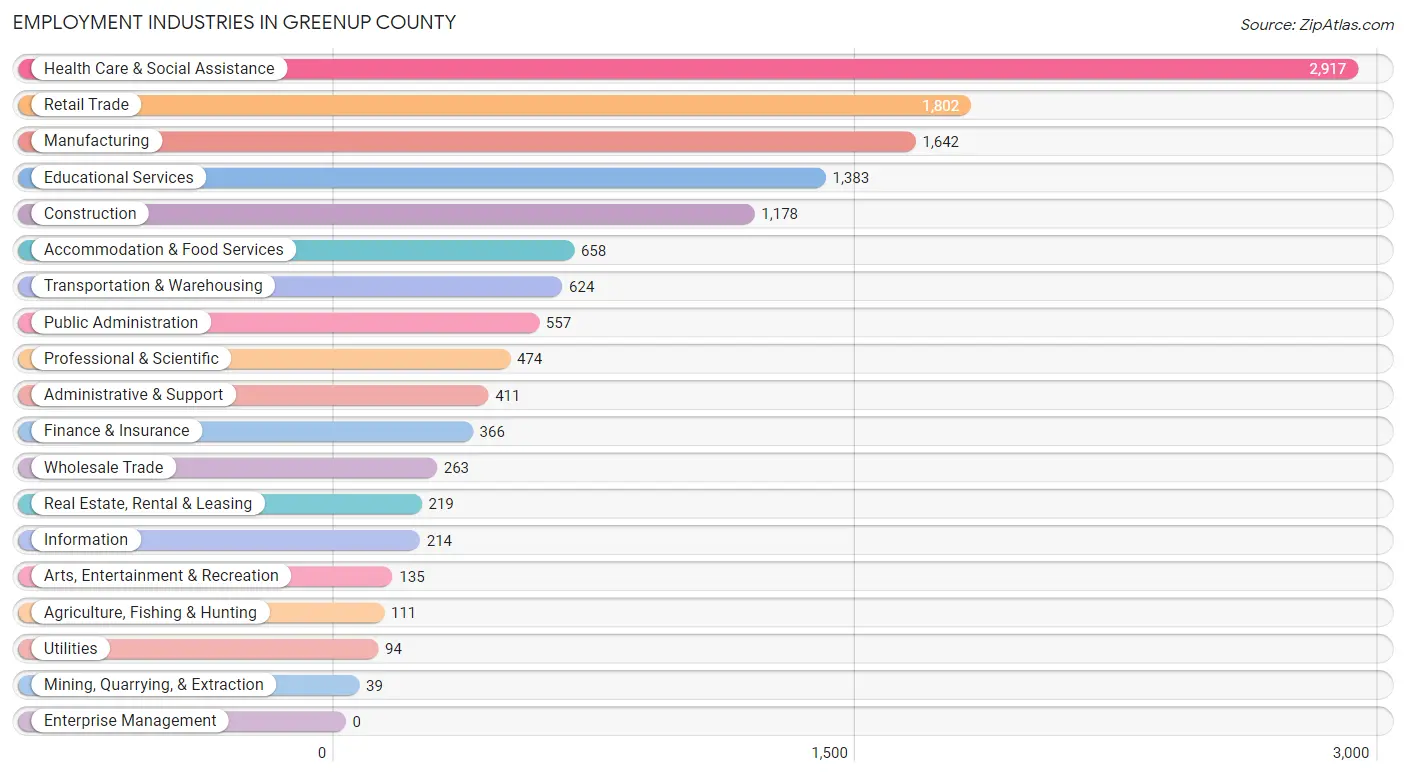
Employment Industries in Greenup County
The major employment industries in Greenup County include Health Care & Social Assistance (2,917 | 21.2%), Retail Trade (1,802 | 13.1%), Manufacturing (1,642 | 11.9%), Educational Services (1,383 | 10.1%), and Construction (1,178 | 8.6%).
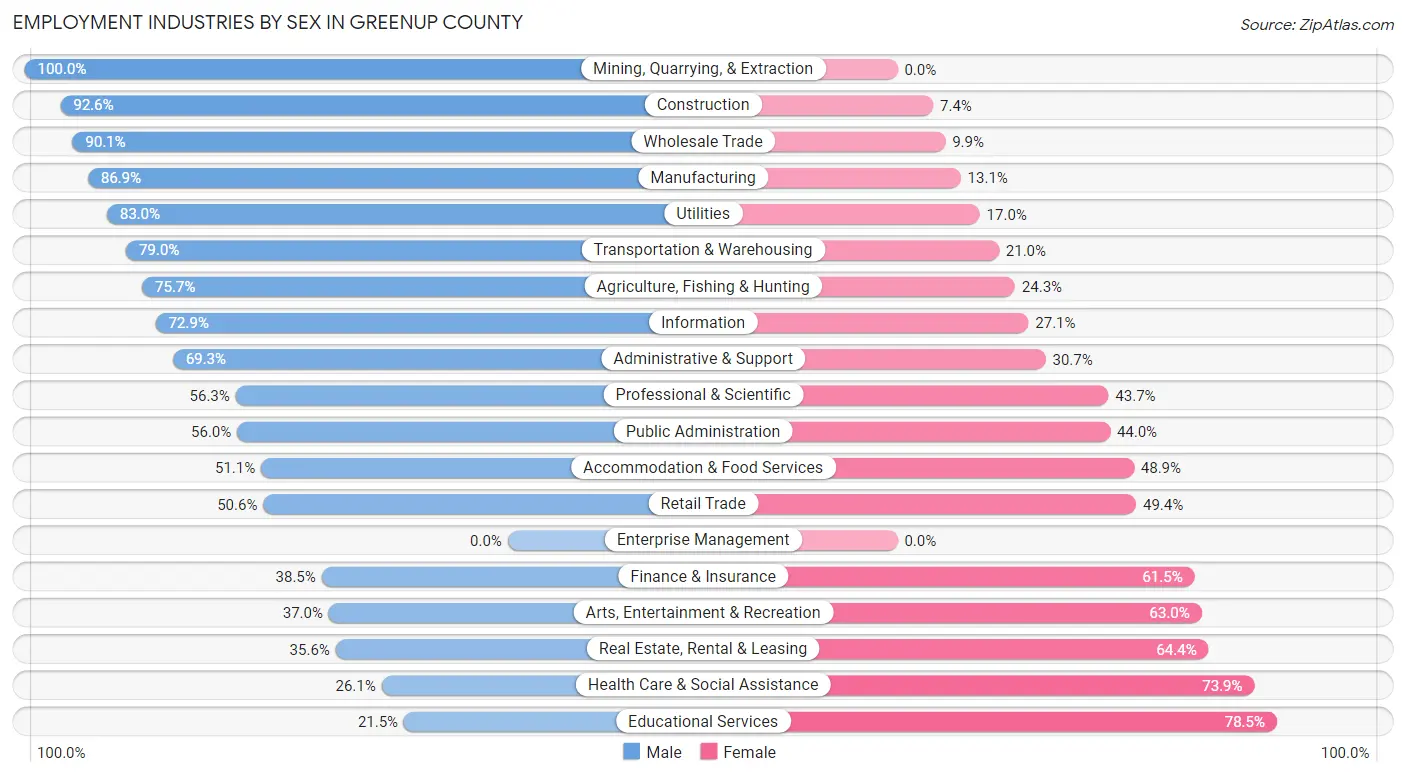
Employment Industries by Sex in Greenup County
The Greenup County industries that see more men than women are Mining, Quarrying, & Extraction (100.0%), Construction (92.6%), and Wholesale Trade (90.1%), whereas the industries that tend to have a higher number of women are Educational Services (78.5%), Health Care & Social Assistance (73.9%), and Real Estate, Rental & Leasing (64.4%).
| Industry | Male | Female |
| Agriculture, Fishing & Hunting | 84 (75.7%) | 27 (24.3%) |
| Mining, Quarrying, & Extraction | 39 (100.0%) | 0 (0.0%) |
| Construction | 1,091 (92.6%) | 87 (7.4%) |
| Manufacturing | 1,427 (86.9%) | 215 (13.1%) |
| Wholesale Trade | 237 (90.1%) | 26 (9.9%) |
| Retail Trade | 912 (50.6%) | 890 (49.4%) |
| Transportation & Warehousing | 493 (79.0%) | 131 (21.0%) |
| Utilities | 78 (83.0%) | 16 (17.0%) |
| Information | 156 (72.9%) | 58 (27.1%) |
| Finance & Insurance | 141 (38.5%) | 225 (61.5%) |
| Real Estate, Rental & Leasing | 78 (35.6%) | 141 (64.4%) |
| Professional & Scientific | 267 (56.3%) | 207 (43.7%) |
| Enterprise Management | 0 (0.0%) | 0 (0.0%) |
| Administrative & Support | 285 (69.3%) | 126 (30.7%) |
| Educational Services | 297 (21.5%) | 1,086 (78.5%) |
| Health Care & Social Assistance | 762 (26.1%) | 2,155 (73.9%) |
| Arts, Entertainment & Recreation | 50 (37.0%) | 85 (63.0%) |
| Accommodation & Food Services | 336 (51.1%) | 322 (48.9%) |
| Public Administration | 312 (56.0%) | 245 (44.0%) |
| Total | 7,542 (54.9%) | 6,199 (45.1%) |
Education in Greenup County
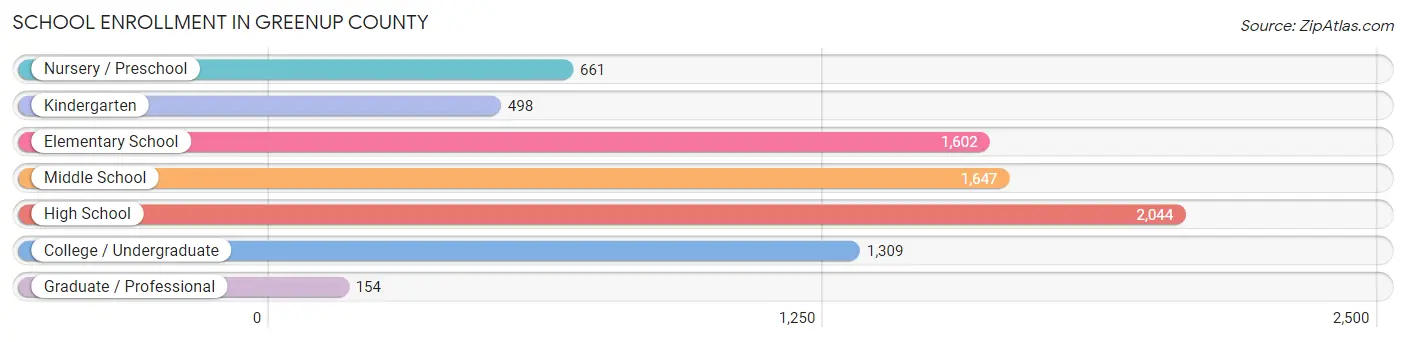
School Enrollment in Greenup County
The most common levels of schooling among the 7,915 students in Greenup County are high school (2,044 | 25.8%), middle school (1,647 | 20.8%), and elementary school (1,602 | 20.2%).
| School Level | # Students | % Students |
| Nursery / Preschool | 661 | 8.4% |
| Kindergarten | 498 | 6.3% |
| Elementary School | 1,602 | 20.2% |
| Middle School | 1,647 | 20.8% |
| High School | 2,044 | 25.8% |
| College / Undergraduate | 1,309 | 16.5% |
| Graduate / Professional | 154 | 1.9% |
| Total | 7,915 | 100.0% |
School Enrollment by Age by Funding Source in Greenup County
Out of a total of 7,915 students who are enrolled in schools in Greenup County, 602 (7.6%) attend a private institution, while the remaining 7,313 (92.4%) are enrolled in public schools. The age group of 25 to 34 year olds has the highest likelihood of being enrolled in private schools, with 78 (20.0% in the age bracket) enrolled. Conversely, the age group of 3 to 4 year olds has the lowest likelihood of being enrolled in a private school, with 460 (99.1% in the age bracket) attending a public institution.
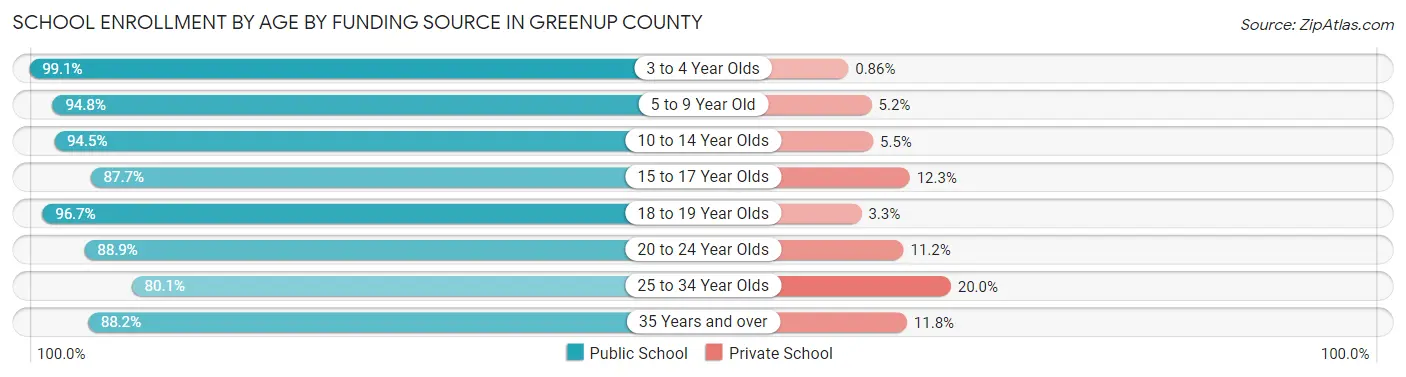
| Age Bracket | Public School | Private School |
| 3 to 4 Year Olds | 460 (99.1%) | 4 (0.9%) |
| 5 to 9 Year Old | 2,040 (94.8%) | 112 (5.2%) |
| 10 to 14 Year Olds | 1,899 (94.5%) | 110 (5.5%) |
| 15 to 17 Year Olds | 1,234 (87.7%) | 173 (12.3%) |
| 18 to 19 Year Olds | 525 (96.7%) | 18 (3.3%) |
| 20 to 24 Year Olds | 534 (88.8%) | 67 (11.2%) |
| 25 to 34 Year Olds | 313 (80.0%) | 78 (20.0%) |
| 35 Years and over | 307 (88.2%) | 41 (11.8%) |
| Total | 7,313 (92.4%) | 602 (7.6%) |
Educational Attainment by Field of Study in Greenup County
Education (1,318 | 26.8%), science & technology (829 | 16.8%), business (647 | 13.1%), bio, nature & agricultural (414 | 8.4%), and arts & humanities (285 | 5.8%) are the most common fields of study among 4,928 individuals in Greenup County who have obtained a bachelor's degree or higher.
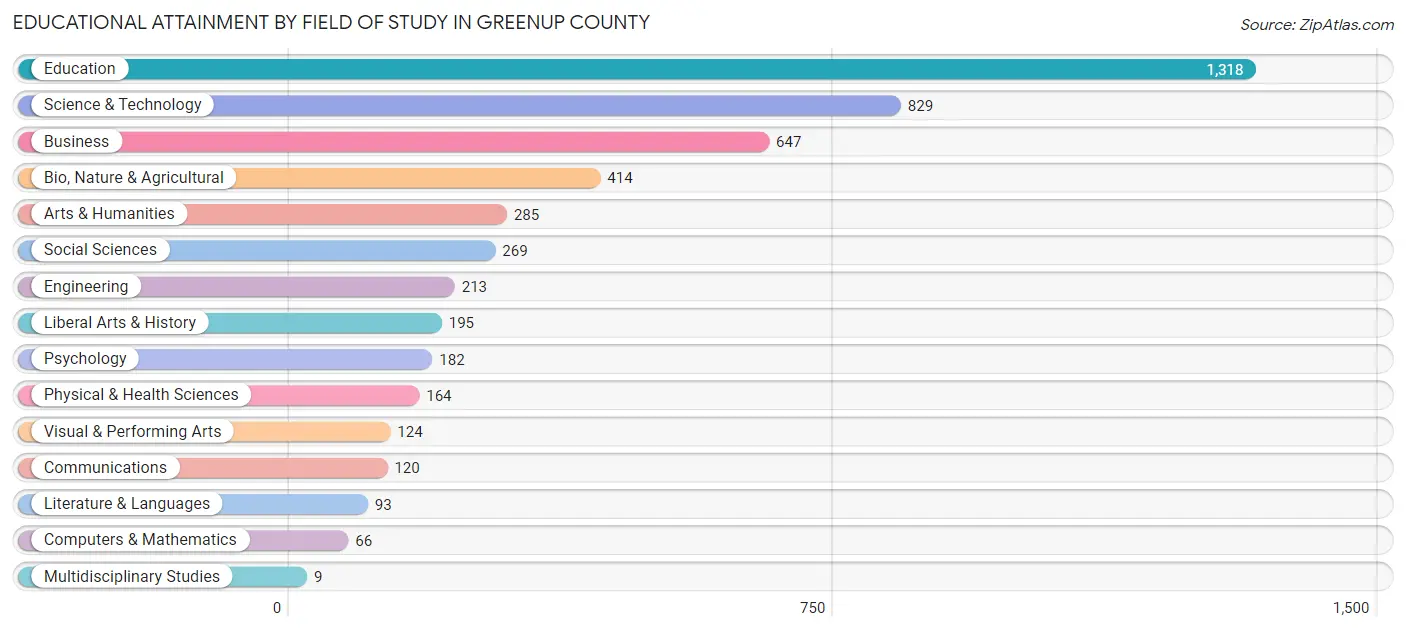
| Field of Study | # Graduates | % Graduates |
| Computers & Mathematics | 66 | 1.3% |
| Bio, Nature & Agricultural | 414 | 8.4% |
| Physical & Health Sciences | 164 | 3.3% |
| Psychology | 182 | 3.7% |
| Social Sciences | 269 | 5.5% |
| Engineering | 213 | 4.3% |
| Multidisciplinary Studies | 9 | 0.2% |
| Science & Technology | 829 | 16.8% |
| Business | 647 | 13.1% |
| Education | 1,318 | 26.8% |
| Literature & Languages | 93 | 1.9% |
| Liberal Arts & History | 195 | 4.0% |
| Visual & Performing Arts | 124 | 2.5% |
| Communications | 120 | 2.4% |
| Arts & Humanities | 285 | 5.8% |
| Total | 4,928 | 100.0% |
Transportation & Commute in Greenup County
Vehicle Availability by Sex in Greenup County
The most prevalent vehicle ownership categories in Greenup County are males with 2 vehicles (3,021, accounting for 40.5%) and females with 2 vehicles (2,283, making up 49.7%).
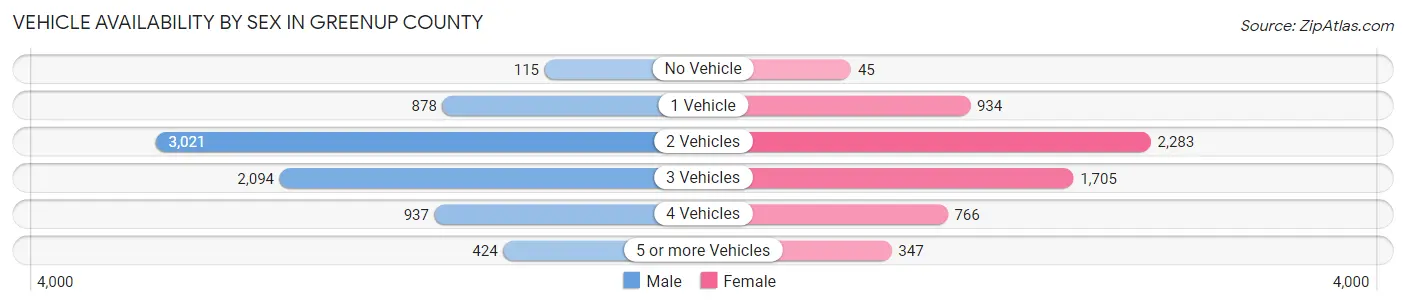
| Vehicles Available | Male | Female |
| No Vehicle | 115 (1.5%) | 45 (0.7%) |
| 1 Vehicle | 878 (11.8%) | 934 (15.4%) |
| 2 Vehicles | 3,021 (40.5%) | 2,283 (37.6%) |
| 3 Vehicles | 2,094 (28.0%) | 1,705 (28.0%) |
| 4 Vehicles | 937 (12.6%) | 766 (12.6%) |
| 5 or more Vehicles | 424 (5.7%) | 347 (5.7%) |
| Total | 7,469 (100.0%) | 6,080 (100.0%) |
Commute Time in Greenup County
The most frequently occuring commute durations in Greenup County are 15 to 19 minutes (2,307 commuters, 17.7%), 20 to 24 minutes (1,755 commuters, 13.5%), and 10 to 14 minutes (1,565 commuters, 12.0%).
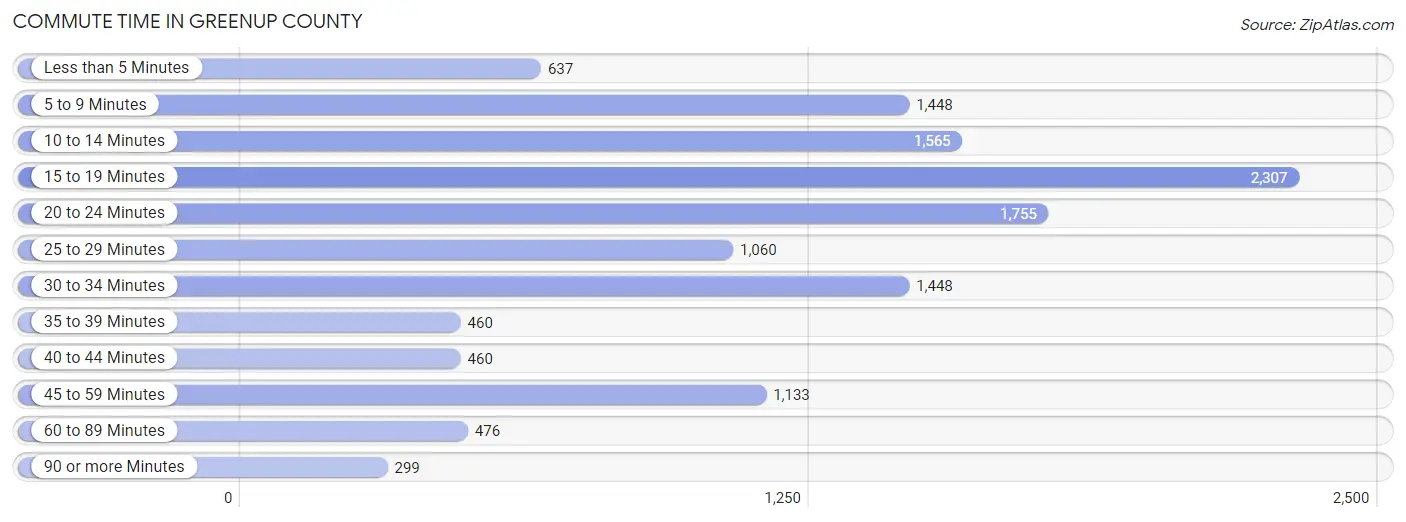
| Commute Time | # Commuters | % Commuters |
| Less than 5 Minutes | 637 | 4.9% |
| 5 to 9 Minutes | 1,448 | 11.1% |
| 10 to 14 Minutes | 1,565 | 12.0% |
| 15 to 19 Minutes | 2,307 | 17.7% |
| 20 to 24 Minutes | 1,755 | 13.5% |
| 25 to 29 Minutes | 1,060 | 8.1% |
| 30 to 34 Minutes | 1,448 | 11.1% |
| 35 to 39 Minutes | 460 | 3.5% |
| 40 to 44 Minutes | 460 | 3.5% |
| 45 to 59 Minutes | 1,133 | 8.7% |
| 60 to 89 Minutes | 476 | 3.6% |
| 90 or more Minutes | 299 | 2.3% |
Commute Time by Sex in Greenup County
The most common commute times in Greenup County are 15 to 19 minutes (1,101 commuters, 15.1%) for males and 15 to 19 minutes (1,206 commuters, 20.9%) for females.
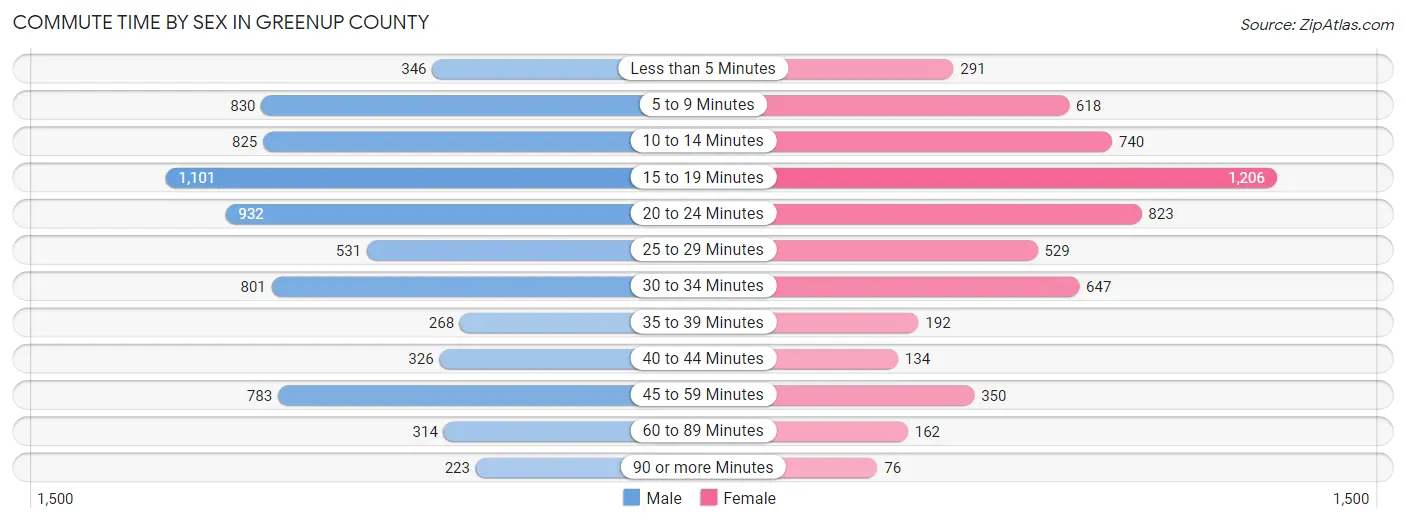
| Commute Time | Male | Female |
| Less than 5 Minutes | 346 (4.8%) | 291 (5.1%) |
| 5 to 9 Minutes | 830 (11.4%) | 618 (10.7%) |
| 10 to 14 Minutes | 825 (11.3%) | 740 (12.8%) |
| 15 to 19 Minutes | 1,101 (15.1%) | 1,206 (20.9%) |
| 20 to 24 Minutes | 932 (12.8%) | 823 (14.3%) |
| 25 to 29 Minutes | 531 (7.3%) | 529 (9.2%) |
| 30 to 34 Minutes | 801 (11.0%) | 647 (11.2%) |
| 35 to 39 Minutes | 268 (3.7%) | 192 (3.3%) |
| 40 to 44 Minutes | 326 (4.5%) | 134 (2.3%) |
| 45 to 59 Minutes | 783 (10.8%) | 350 (6.1%) |
| 60 to 89 Minutes | 314 (4.3%) | 162 (2.8%) |
| 90 or more Minutes | 223 (3.1%) | 76 (1.3%) |
Time of Departure to Work by Sex in Greenup County
The most frequent times of departure to work in Greenup County are 7:00 AM to 7:29 AM (898, 12.3%) for males and 7:00 AM to 7:29 AM (1,079, 18.7%) for females.
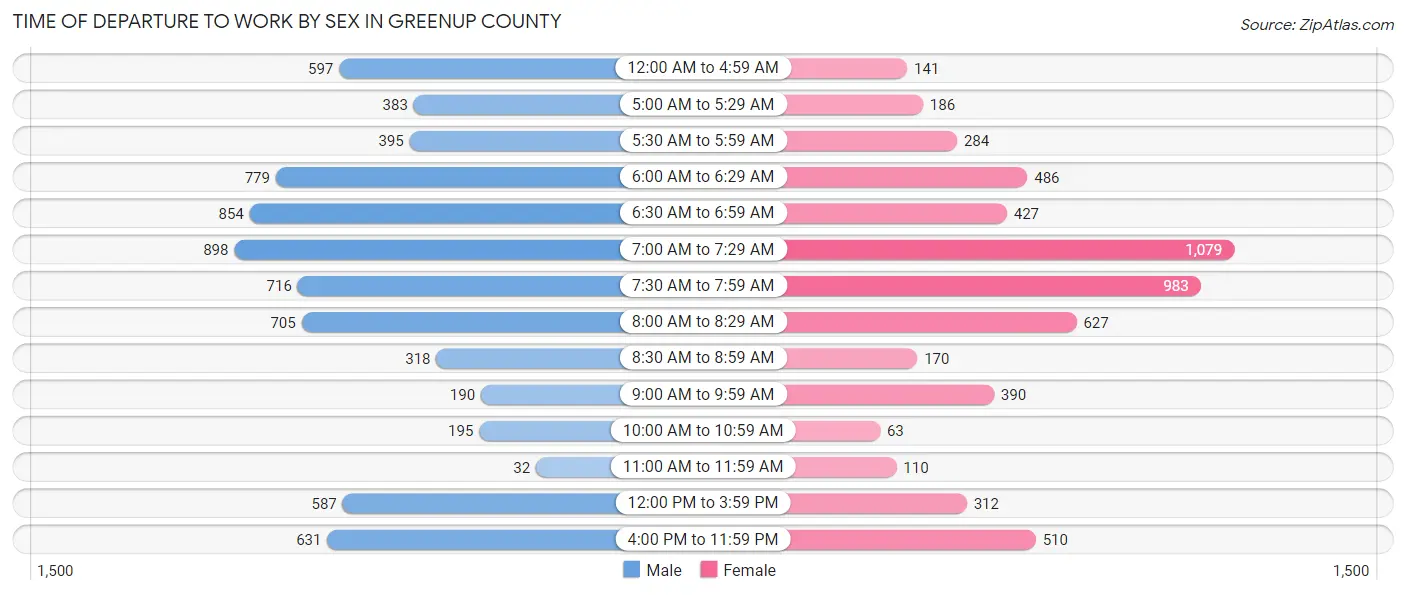
| Time of Departure | Male | Female |
| 12:00 AM to 4:59 AM | 597 (8.2%) | 141 (2.4%) |
| 5:00 AM to 5:29 AM | 383 (5.3%) | 186 (3.2%) |
| 5:30 AM to 5:59 AM | 395 (5.4%) | 284 (4.9%) |
| 6:00 AM to 6:29 AM | 779 (10.7%) | 486 (8.4%) |
| 6:30 AM to 6:59 AM | 854 (11.7%) | 427 (7.4%) |
| 7:00 AM to 7:29 AM | 898 (12.3%) | 1,079 (18.7%) |
| 7:30 AM to 7:59 AM | 716 (9.8%) | 983 (17.0%) |
| 8:00 AM to 8:29 AM | 705 (9.7%) | 627 (10.9%) |
| 8:30 AM to 8:59 AM | 318 (4.4%) | 170 (2.9%) |
| 9:00 AM to 9:59 AM | 190 (2.6%) | 390 (6.8%) |
| 10:00 AM to 10:59 AM | 195 (2.7%) | 63 (1.1%) |
| 11:00 AM to 11:59 AM | 32 (0.4%) | 110 (1.9%) |
| 12:00 PM to 3:59 PM | 587 (8.1%) | 312 (5.4%) |
| 4:00 PM to 11:59 PM | 631 (8.7%) | 510 (8.8%) |
| Total | 7,280 (100.0%) | 5,768 (100.0%) |
Housing Occupancy in Greenup County
Occupancy by Ownership in Greenup County
Of the total 14,478 dwellings in Greenup County, owner-occupied units account for 11,421 (78.9%), while renter-occupied units make up 3,057 (21.1%).
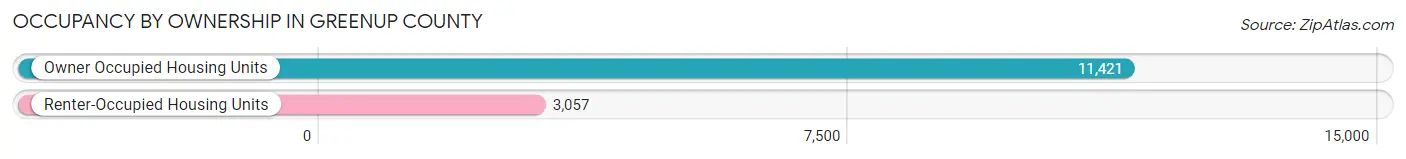
| Occupancy | # Housing Units | % Housing Units |
| Owner Occupied Housing Units | 11,421 | 78.9% |
| Renter-Occupied Housing Units | 3,057 | 21.1% |
| Total Occupied Housing Units | 14,478 | 100.0% |
Occupancy by Household Size in Greenup County
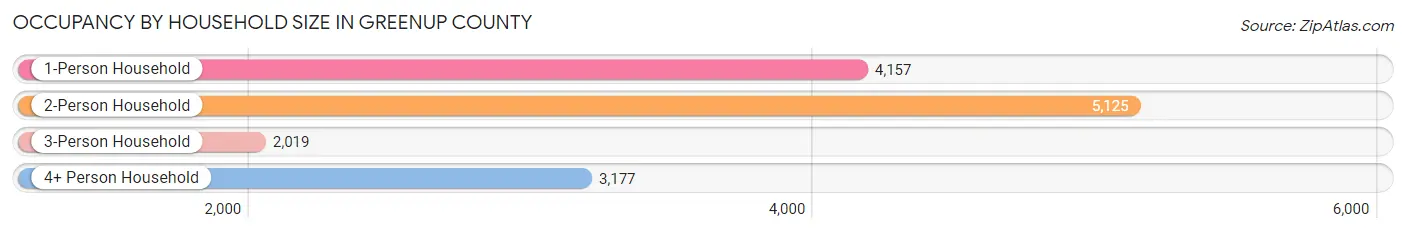
| Household Size | # Housing Units | % Housing Units |
| 1-Person Household | 4,157 | 28.7% |
| 2-Person Household | 5,125 | 35.4% |
| 3-Person Household | 2,019 | 14.0% |
| 4+ Person Household | 3,177 | 21.9% |
| Total Housing Units | 14,478 | 100.0% |
Occupancy by Ownership by Household Size in Greenup County
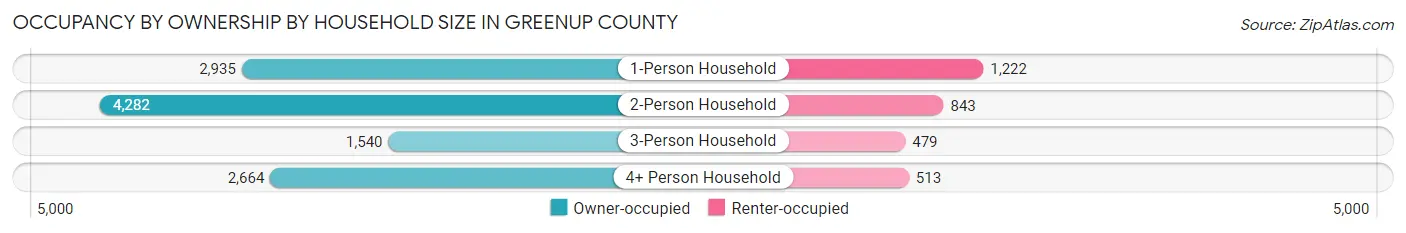
| Household Size | Owner-occupied | Renter-occupied |
| 1-Person Household | 2,935 (70.6%) | 1,222 (29.4%) |
| 2-Person Household | 4,282 (83.6%) | 843 (16.5%) |
| 3-Person Household | 1,540 (76.3%) | 479 (23.7%) |
| 4+ Person Household | 2,664 (83.9%) | 513 (16.2%) |
| Total Housing Units | 11,421 (78.9%) | 3,057 (21.1%) |
Occupancy by Educational Attainment in Greenup County
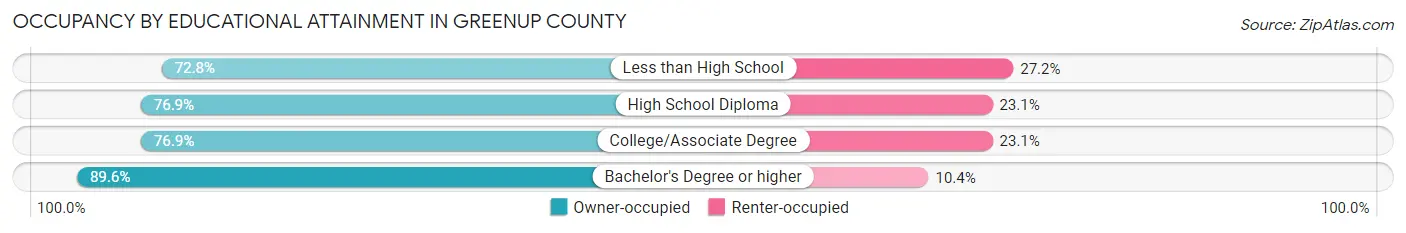
| Household Size | Owner-occupied | Renter-occupied |
| Less than High School | 964 (72.8%) | 360 (27.2%) |
| High School Diploma | 3,786 (76.9%) | 1,135 (23.1%) |
| College/Associate Degree | 4,282 (76.9%) | 1,285 (23.1%) |
| Bachelor's Degree or higher | 2,389 (89.6%) | 277 (10.4%) |
Occupancy by Age of Householder in Greenup County
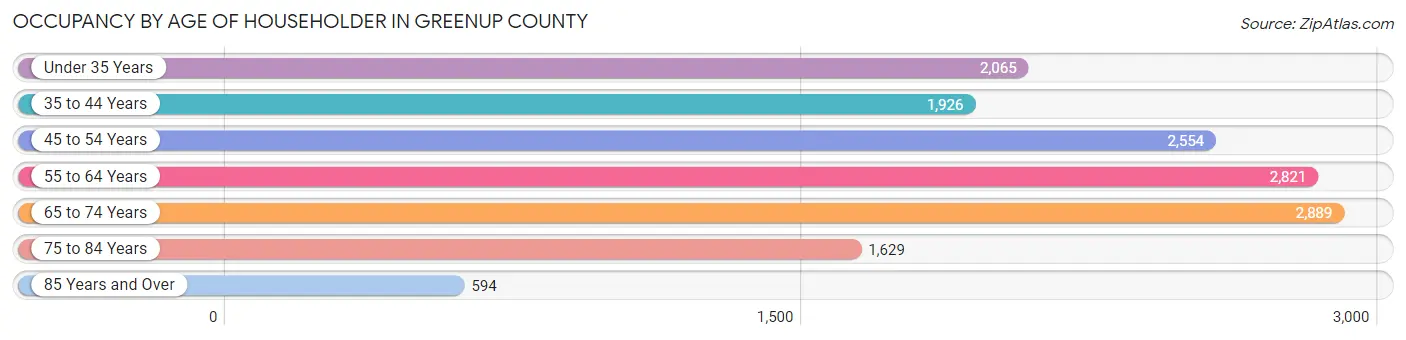
| Age Bracket | # Households | % Households |
| Under 35 Years | 2,065 | 14.3% |
| 35 to 44 Years | 1,926 | 13.3% |
| 45 to 54 Years | 2,554 | 17.6% |
| 55 to 64 Years | 2,821 | 19.5% |
| 65 to 74 Years | 2,889 | 20.0% |
| 75 to 84 Years | 1,629 | 11.3% |
| 85 Years and Over | 594 | 4.1% |
| Total | 14,478 | 100.0% |
Housing Finances in Greenup County
Median Income by Occupancy in Greenup County
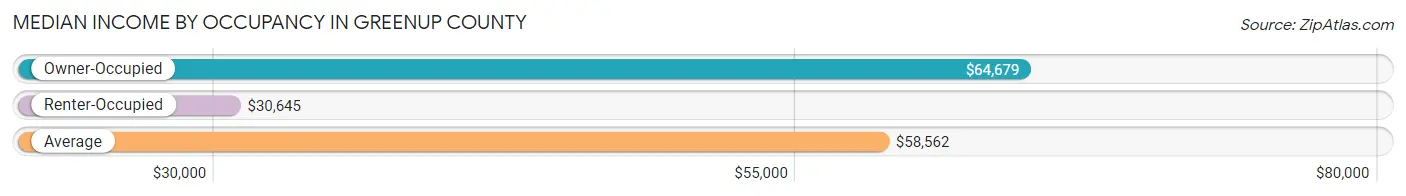
| Occupancy Type | # Households | Median Income |
| Owner-Occupied | 11,421 (78.9%) | $64,679 |
| Renter-Occupied | 3,057 (21.1%) | $30,645 |
| Average | 14,478 (100.0%) | $58,562 |
Occupancy by Householder Income Bracket in Greenup County
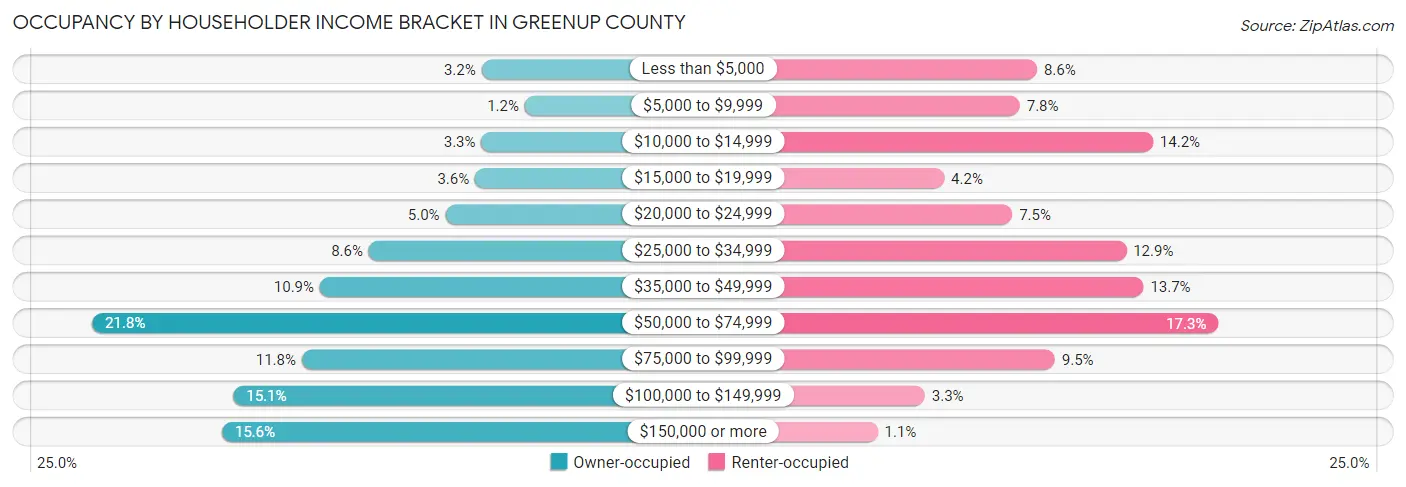
| Income Bracket | Owner-occupied | Renter-occupied |
| Less than $5,000 | 370 (3.2%) | 264 (8.6%) |
| $5,000 to $9,999 | 135 (1.2%) | 239 (7.8%) |
| $10,000 to $14,999 | 371 (3.3%) | 433 (14.2%) |
| $15,000 to $19,999 | 406 (3.5%) | 129 (4.2%) |
| $20,000 to $24,999 | 566 (5.0%) | 228 (7.5%) |
| $25,000 to $34,999 | 983 (8.6%) | 394 (12.9%) |
| $35,000 to $49,999 | 1,250 (10.9%) | 419 (13.7%) |
| $50,000 to $74,999 | 2,489 (21.8%) | 528 (17.3%) |
| $75,000 to $99,999 | 1,348 (11.8%) | 290 (9.5%) |
| $100,000 to $149,999 | 1,720 (15.1%) | 101 (3.3%) |
| $150,000 or more | 1,783 (15.6%) | 32 (1.1%) |
| Total | 11,421 (100.0%) | 3,057 (100.0%) |
Monthly Housing Cost Tiers in Greenup County
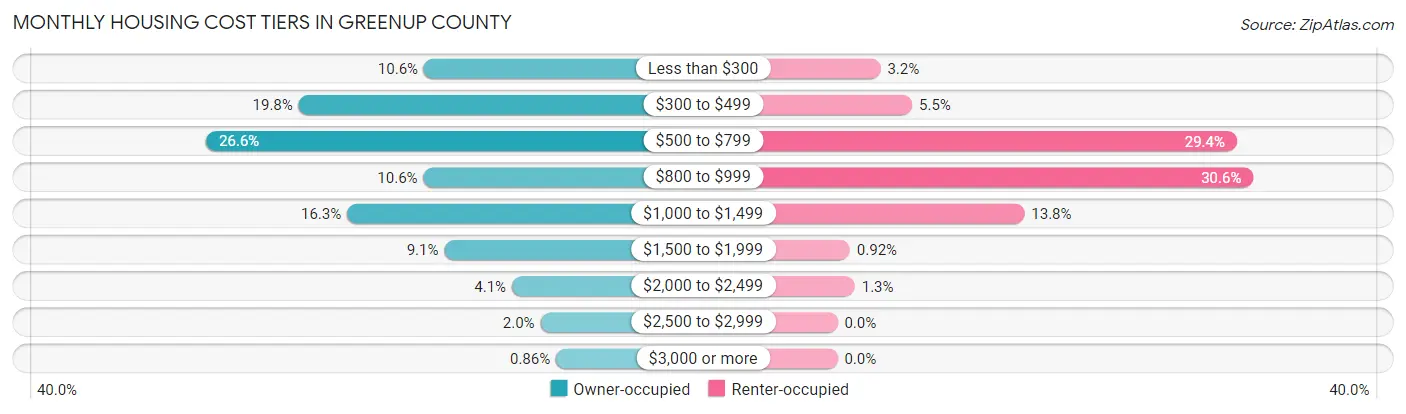
| Monthly Cost | Owner-occupied | Renter-occupied |
| Less than $300 | 1,210 (10.6%) | 97 (3.2%) |
| $300 to $499 | 2,264 (19.8%) | 168 (5.5%) |
| $500 to $799 | 3,043 (26.6%) | 899 (29.4%) |
| $800 to $999 | 1,214 (10.6%) | 936 (30.6%) |
| $1,000 to $1,499 | 1,856 (16.3%) | 421 (13.8%) |
| $1,500 to $1,999 | 1,038 (9.1%) | 28 (0.9%) |
| $2,000 to $2,499 | 469 (4.1%) | 39 (1.3%) |
| $2,500 to $2,999 | 229 (2.0%) | 0 (0.0%) |
| $3,000 or more | 98 (0.9%) | 0 (0.0%) |
| Total | 11,421 (100.0%) | 3,057 (100.0%) |
Physical Housing Characteristics in Greenup County
Housing Structures in Greenup County
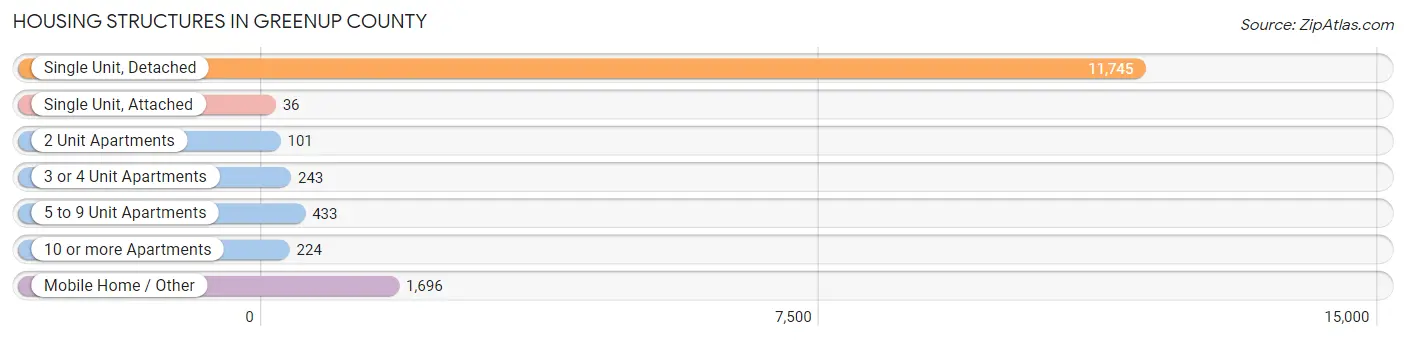
| Structure Type | # Housing Units | % Housing Units |
| Single Unit, Detached | 11,745 | 81.1% |
| Single Unit, Attached | 36 | 0.3% |
| 2 Unit Apartments | 101 | 0.7% |
| 3 or 4 Unit Apartments | 243 | 1.7% |
| 5 to 9 Unit Apartments | 433 | 3.0% |
| 10 or more Apartments | 224 | 1.5% |
| Mobile Home / Other | 1,696 | 11.7% |
| Total | 14,478 | 100.0% |
Housing Structures by Occupancy in Greenup County
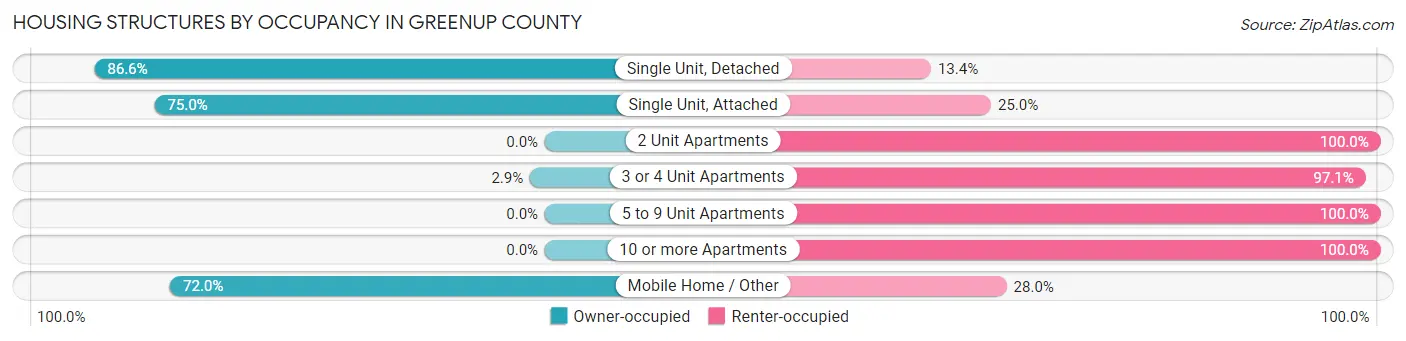
| Structure Type | Owner-occupied | Renter-occupied |
| Single Unit, Detached | 10,166 (86.6%) | 1,579 (13.4%) |
| Single Unit, Attached | 27 (75.0%) | 9 (25.0%) |
| 2 Unit Apartments | 0 (0.0%) | 101 (100.0%) |
| 3 or 4 Unit Apartments | 7 (2.9%) | 236 (97.1%) |
| 5 to 9 Unit Apartments | 0 (0.0%) | 433 (100.0%) |
| 10 or more Apartments | 0 (0.0%) | 224 (100.0%) |
| Mobile Home / Other | 1,221 (72.0%) | 475 (28.0%) |
| Total | 11,421 (78.9%) | 3,057 (21.1%) |
Housing Structures by Number of Rooms in Greenup County
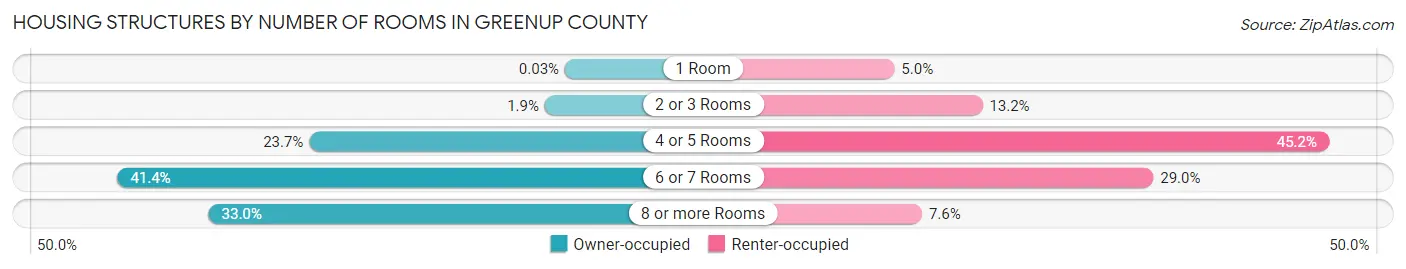
| Number of Rooms | Owner-occupied | Renter-occupied |
| 1 Room | 3 (0.0%) | 154 (5.0%) |
| 2 or 3 Rooms | 216 (1.9%) | 403 (13.2%) |
| 4 or 5 Rooms | 2,705 (23.7%) | 1,382 (45.2%) |
| 6 or 7 Rooms | 4,730 (41.4%) | 886 (29.0%) |
| 8 or more Rooms | 3,767 (33.0%) | 232 (7.6%) |
| Total | 11,421 (100.0%) | 3,057 (100.0%) |
Housing Structure by Heating Type in Greenup County
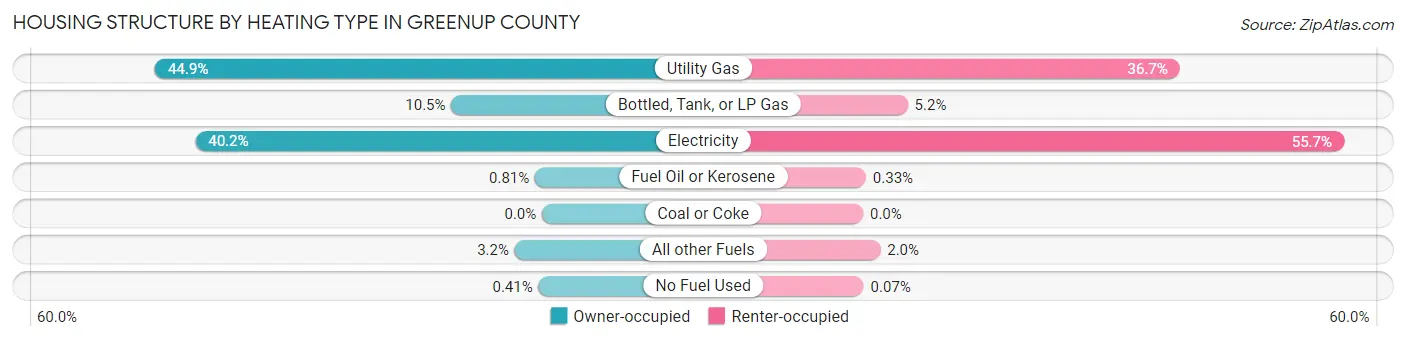
| Heating Type | Owner-occupied | Renter-occupied |
| Utility Gas | 5,126 (44.9%) | 1,122 (36.7%) |
| Bottled, Tank, or LP Gas | 1,201 (10.5%) | 158 (5.2%) |
| Electricity | 4,592 (40.2%) | 1,704 (55.7%) |
| Fuel Oil or Kerosene | 93 (0.8%) | 10 (0.3%) |
| Coal or Coke | 0 (0.0%) | 0 (0.0%) |
| All other Fuels | 362 (3.2%) | 61 (2.0%) |
| No Fuel Used | 47 (0.4%) | 2 (0.1%) |
| Total | 11,421 (100.0%) | 3,057 (100.0%) |
Household Vehicle Usage in Greenup County
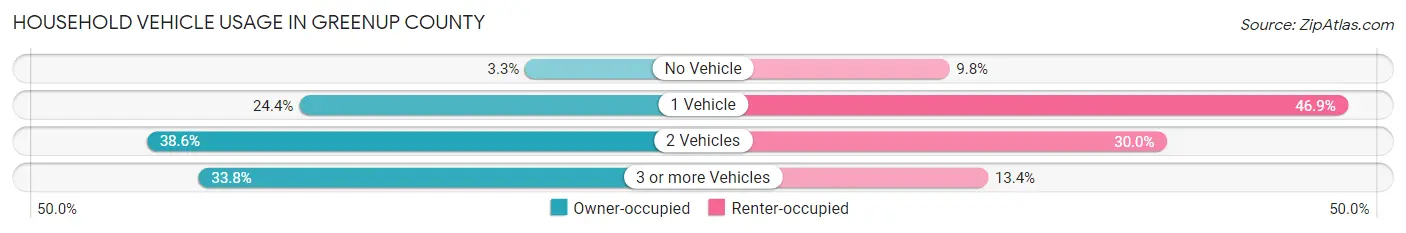
| Vehicles per Household | Owner-occupied | Renter-occupied |
| No Vehicle | 373 (3.3%) | 298 (9.8%) |
| 1 Vehicle | 2,783 (24.4%) | 1,434 (46.9%) |
| 2 Vehicles | 4,408 (38.6%) | 917 (30.0%) |
| 3 or more Vehicles | 3,857 (33.8%) | 408 (13.4%) |
| Total | 11,421 (100.0%) | 3,057 (100.0%) |
Real Estate & Mortgages in Greenup County
Real Estate and Mortgage Overview in Greenup County
| Characteristic | Without Mortgage | With Mortgage |
| Housing Units | 6,071 | 5,350 |
| Median Property Value | $99,100 | $149,300 |
| Median Household Income | $54,856 | $1,141 |
| Monthly Housing Costs | $469 | $87 |
| Real Estate Taxes | $896 | $175 |
Property Value by Mortgage Status in Greenup County
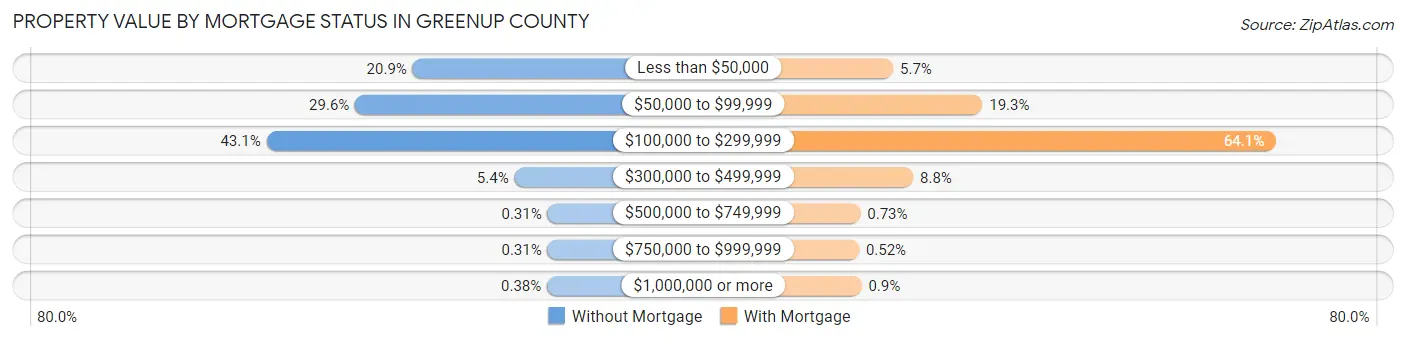
| Property Value | Without Mortgage | With Mortgage |
| Less than $50,000 | 1,267 (20.9%) | 306 (5.7%) |
| $50,000 to $99,999 | 1,799 (29.6%) | 1,033 (19.3%) |
| $100,000 to $299,999 | 2,619 (43.1%) | 3,427 (64.1%) |
| $300,000 to $499,999 | 325 (5.3%) | 469 (8.8%) |
| $500,000 to $749,999 | 19 (0.3%) | 39 (0.7%) |
| $750,000 to $999,999 | 19 (0.3%) | 28 (0.5%) |
| $1,000,000 or more | 23 (0.4%) | 48 (0.9%) |
| Total | 6,071 (100.0%) | 5,350 (100.0%) |
Household Income by Mortgage Status in Greenup County
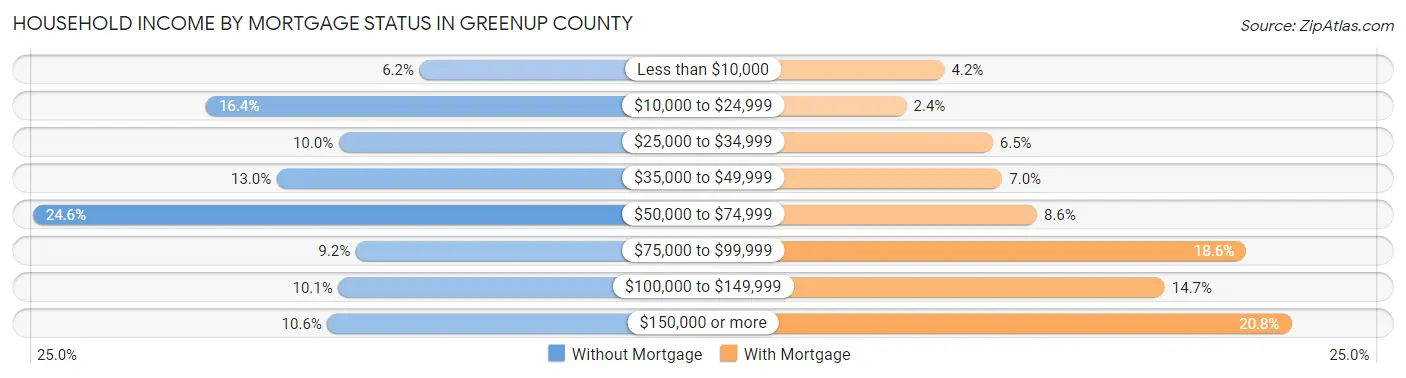
| Household Income | Without Mortgage | With Mortgage |
| Less than $10,000 | 375 (6.2%) | 227 (4.2%) |
| $10,000 to $24,999 | 993 (16.4%) | 130 (2.4%) |
| $25,000 to $34,999 | 609 (10.0%) | 350 (6.5%) |
| $35,000 to $49,999 | 788 (13.0%) | 374 (7.0%) |
| $50,000 to $74,999 | 1,494 (24.6%) | 462 (8.6%) |
| $75,000 to $99,999 | 560 (9.2%) | 995 (18.6%) |
| $100,000 to $149,999 | 610 (10.1%) | 788 (14.7%) |
| $150,000 or more | 642 (10.6%) | 1,110 (20.7%) |
| Total | 6,071 (100.0%) | 5,350 (100.0%) |
Property Value to Household Income Ratio in Greenup County
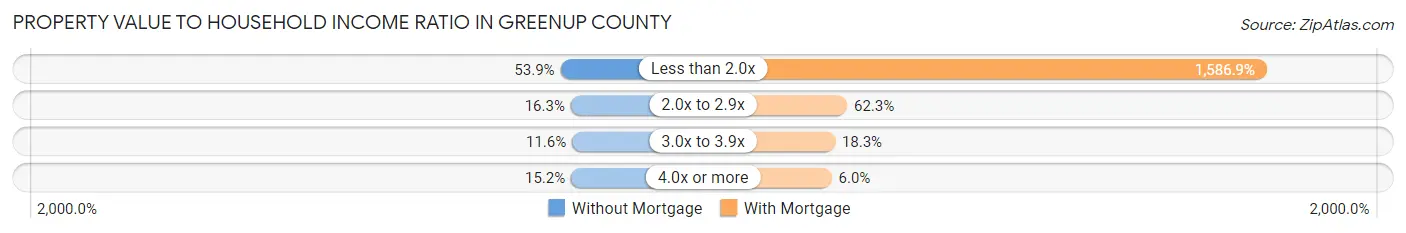
| Value-to-Income Ratio | Without Mortgage | With Mortgage |
| Less than 2.0x | 3,273 (53.9%) | 84,897 (1,586.9%) |
| 2.0x to 2.9x | 992 (16.3%) | 3,333 (62.3%) |
| 3.0x to 3.9x | 706 (11.6%) | 978 (18.3%) |
| 4.0x or more | 920 (15.1%) | 319 (6.0%) |
| Total | 6,071 (100.0%) | 5,350 (100.0%) |
Real Estate Taxes by Mortgage Status in Greenup County
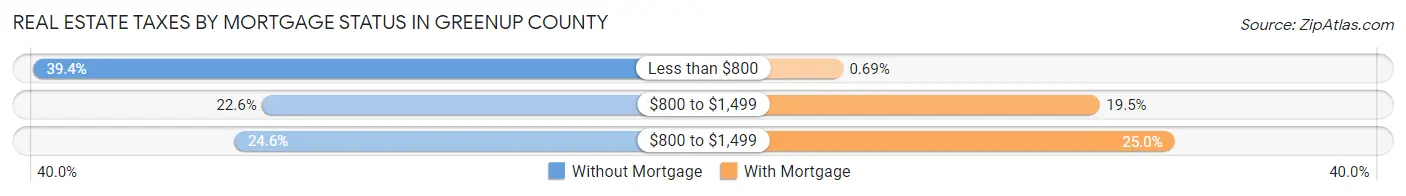
| Property Taxes | Without Mortgage | With Mortgage |
| Less than $800 | 2,389 (39.4%) | 37 (0.7%) |
| $800 to $1,499 | 1,373 (22.6%) | 1,041 (19.5%) |
| $800 to $1,499 | 1,495 (24.6%) | 1,335 (24.9%) |
| Total | 6,071 (100.0%) | 5,350 (100.0%) |
Health & Disability in Greenup County
Health Insurance Coverage by Age in Greenup County
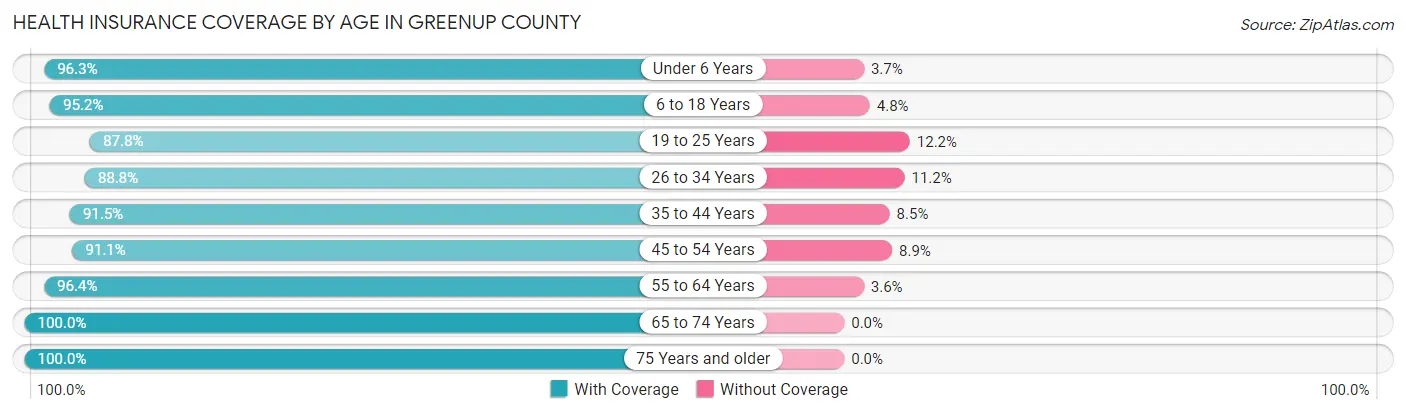
| Age Bracket | With Coverage | Without Coverage |
| Under 6 Years | 2,230 (96.3%) | 85 (3.7%) |
| 6 to 18 Years | 5,561 (95.2%) | 278 (4.8%) |
| 19 to 25 Years | 2,182 (87.8%) | 304 (12.2%) |
| 26 to 34 Years | 3,031 (88.8%) | 384 (11.2%) |
| 35 to 44 Years | 3,897 (91.5%) | 360 (8.5%) |
| 45 to 54 Years | 4,283 (91.1%) | 419 (8.9%) |
| 55 to 64 Years | 4,785 (96.4%) | 181 (3.6%) |
| 65 to 74 Years | 4,418 (100.0%) | 0 (0.0%) |
| 75 Years and older | 3,001 (100.0%) | 0 (0.0%) |
| Total | 33,388 (94.3%) | 2,011 (5.7%) |
Health Insurance Coverage by Citizenship Status in Greenup County
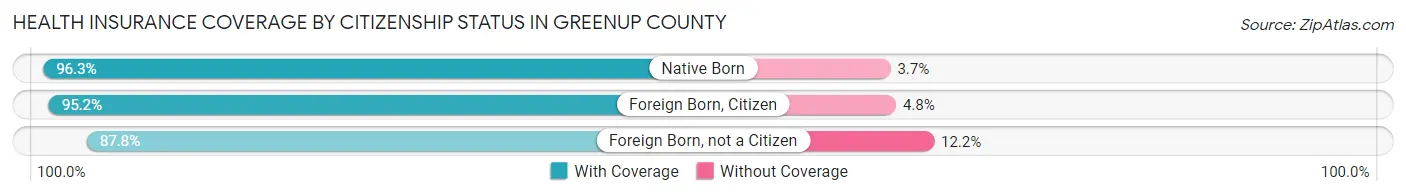
| Citizenship Status | With Coverage | Without Coverage |
| Native Born | 2,230 (96.3%) | 85 (3.7%) |
| Foreign Born, Citizen | 5,561 (95.2%) | 278 (4.8%) |
| Foreign Born, not a Citizen | 2,182 (87.8%) | 304 (12.2%) |
Health Insurance Coverage by Household Income in Greenup County
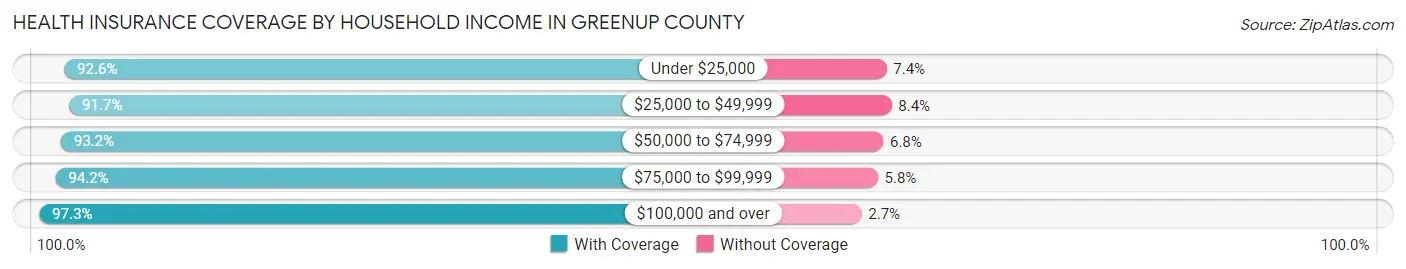
| Household Income | With Coverage | Without Coverage |
| Under $25,000 | 4,671 (92.6%) | 374 (7.4%) |
| $25,000 to $49,999 | 6,002 (91.6%) | 547 (8.4%) |
| $50,000 to $74,999 | 6,668 (93.2%) | 486 (6.8%) |
| $75,000 to $99,999 | 4,641 (94.2%) | 284 (5.8%) |
| $100,000 and over | 11,394 (97.3%) | 320 (2.7%) |
Public vs Private Health Insurance Coverage by Age in Greenup County
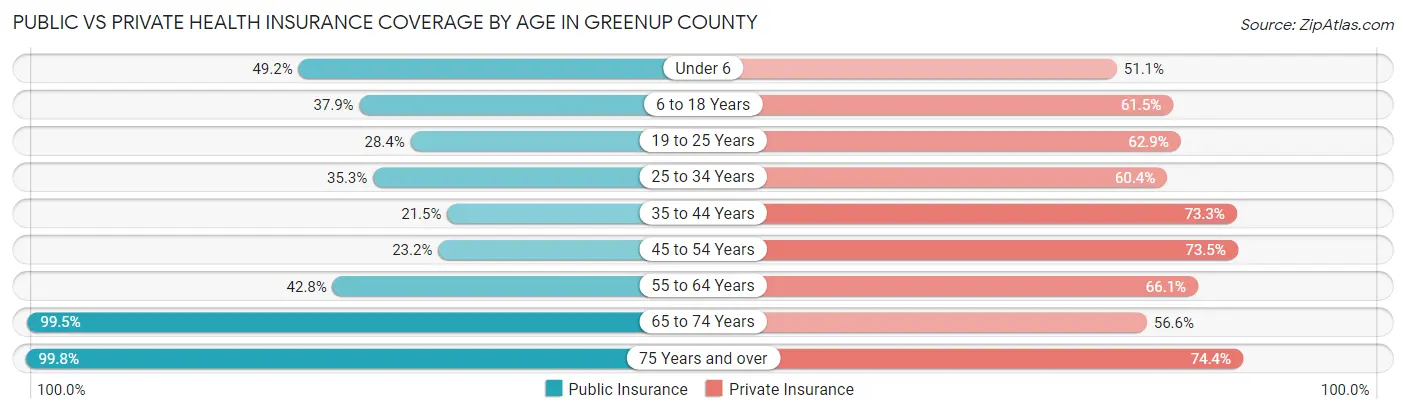
| Age Bracket | Public Insurance | Private Insurance |
| Under 6 | 1,138 (49.2%) | 1,182 (51.1%) |
| 6 to 18 Years | 2,210 (37.9%) | 3,590 (61.5%) |
| 19 to 25 Years | 705 (28.4%) | 1,563 (62.9%) |
| 25 to 34 Years | 1,206 (35.3%) | 2,062 (60.4%) |
| 35 to 44 Years | 917 (21.5%) | 3,120 (73.3%) |
| 45 to 54 Years | 1,092 (23.2%) | 3,454 (73.5%) |
| 55 to 64 Years | 2,127 (42.8%) | 3,282 (66.1%) |
| 65 to 74 Years | 4,395 (99.5%) | 2,501 (56.6%) |
| 75 Years and over | 2,996 (99.8%) | 2,234 (74.4%) |
| Total | 16,786 (47.4%) | 22,988 (64.9%) |
Disability Status by Sex by Age in Greenup County
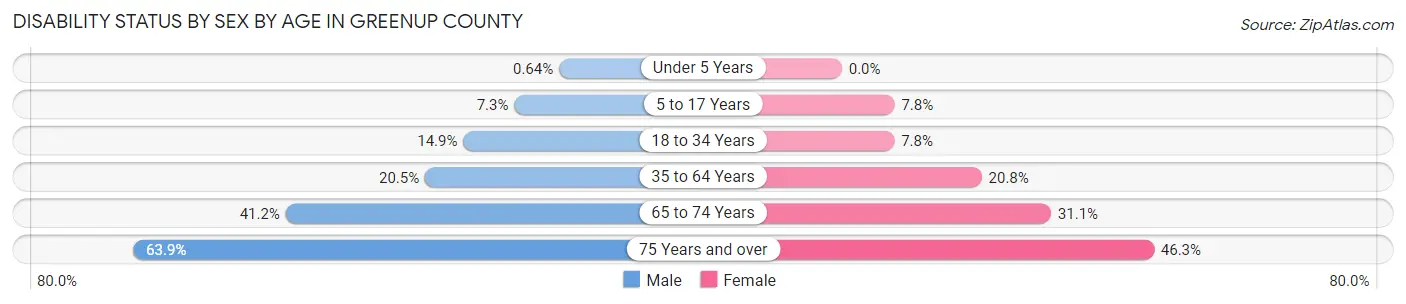
| Age Bracket | Male | Female |
| Under 5 Years | 6 (0.6%) | 0 (0.0%) |
| 5 to 17 Years | 222 (7.3%) | 222 (7.8%) |
| 18 to 34 Years | 489 (14.9%) | 240 (7.8%) |
| 35 to 64 Years | 1,406 (20.5%) | 1,470 (20.8%) |
| 65 to 74 Years | 839 (41.2%) | 740 (31.0%) |
| 75 Years and over | 809 (63.9%) | 804 (46.3%) |
Disability Class by Sex by Age in Greenup County
Disability Class: Hearing Difficulty
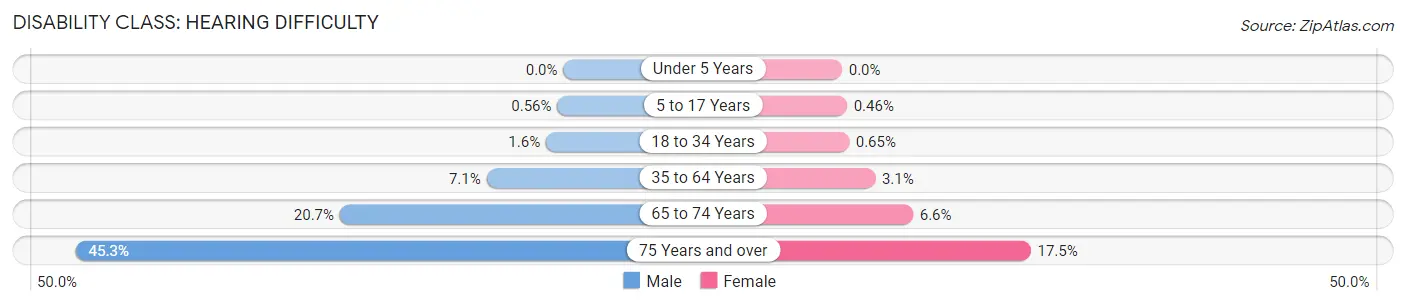
| Age Bracket | Male | Female |
| Under 5 Years | 0 (0.0%) | 0 (0.0%) |
| 5 to 17 Years | 17 (0.6%) | 13 (0.5%) |
| 18 to 34 Years | 53 (1.6%) | 20 (0.6%) |
| 35 to 64 Years | 488 (7.1%) | 218 (3.1%) |
| 65 to 74 Years | 422 (20.7%) | 157 (6.6%) |
| 75 Years and over | 573 (45.3%) | 304 (17.5%) |
Disability Class: Vision Difficulty
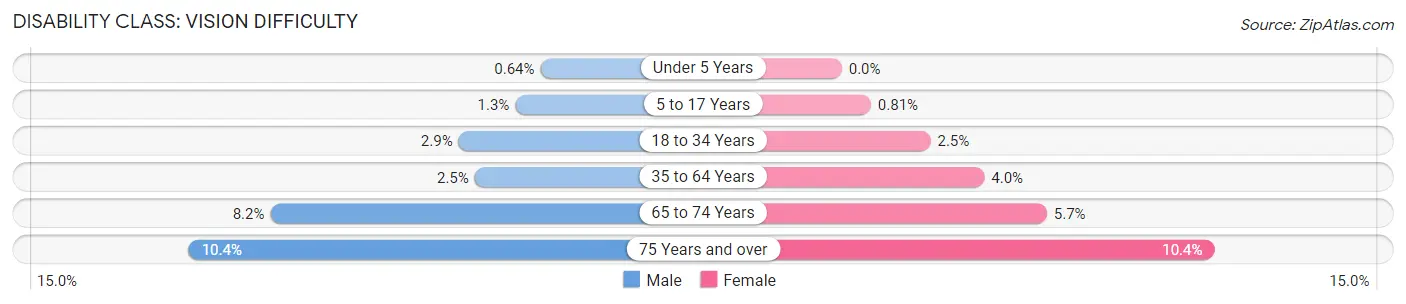
| Age Bracket | Male | Female |
| Under 5 Years | 6 (0.6%) | 0 (0.0%) |
| 5 to 17 Years | 41 (1.3%) | 23 (0.8%) |
| 18 to 34 Years | 96 (2.9%) | 76 (2.5%) |
| 35 to 64 Years | 169 (2.5%) | 281 (4.0%) |
| 65 to 74 Years | 166 (8.2%) | 136 (5.7%) |
| 75 Years and over | 132 (10.4%) | 180 (10.4%) |
Disability Class: Cognitive Difficulty
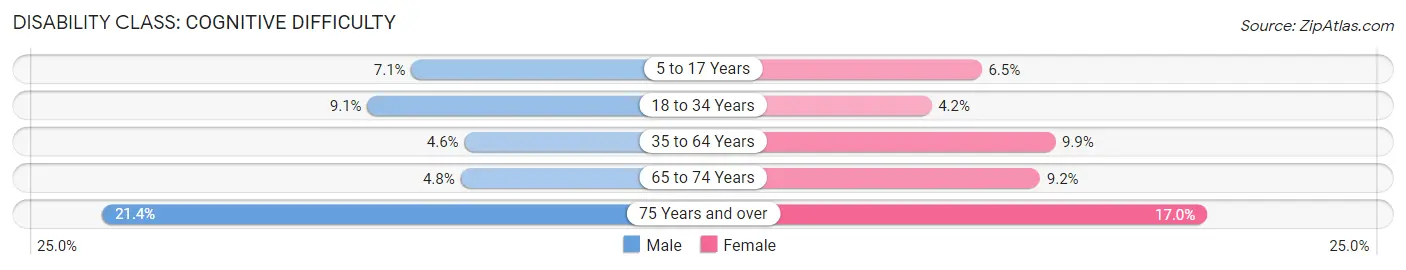
| Age Bracket | Male | Female |
| 5 to 17 Years | 215 (7.0%) | 184 (6.5%) |
| 18 to 34 Years | 299 (9.1%) | 128 (4.2%) |
| 35 to 64 Years | 314 (4.6%) | 700 (9.9%) |
| 65 to 74 Years | 97 (4.8%) | 219 (9.2%) |
| 75 Years and over | 271 (21.4%) | 294 (17.0%) |
Disability Class: Ambulatory Difficulty
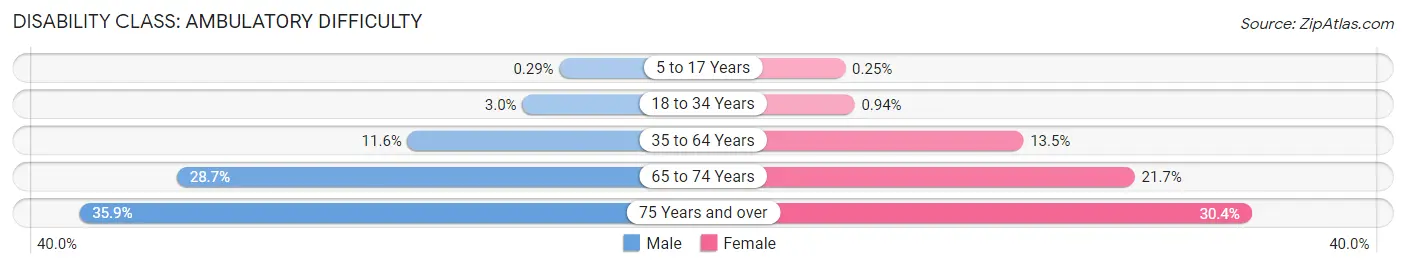
| Age Bracket | Male | Female |
| 5 to 17 Years | 9 (0.3%) | 7 (0.3%) |
| 18 to 34 Years | 100 (3.0%) | 29 (0.9%) |
| 35 to 64 Years | 791 (11.6%) | 954 (13.5%) |
| 65 to 74 Years | 584 (28.7%) | 518 (21.7%) |
| 75 Years and over | 455 (35.9%) | 528 (30.4%) |
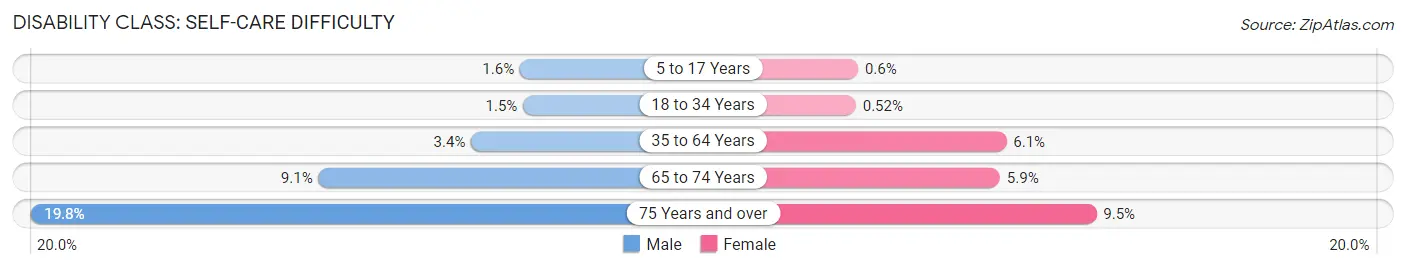
Disability Class: Self-Care Difficulty
| Age Bracket | Male | Female |
| 5 to 17 Years | 49 (1.6%) | 17 (0.6%) |
| 18 to 34 Years | 49 (1.5%) | 16 (0.5%) |
| 35 to 64 Years | 234 (3.4%) | 433 (6.1%) |
| 65 to 74 Years | 185 (9.1%) | 140 (5.9%) |
| 75 Years and over | 250 (19.8%) | 164 (9.5%) |
Technology Access in Greenup County
Computing Device Access in Greenup County
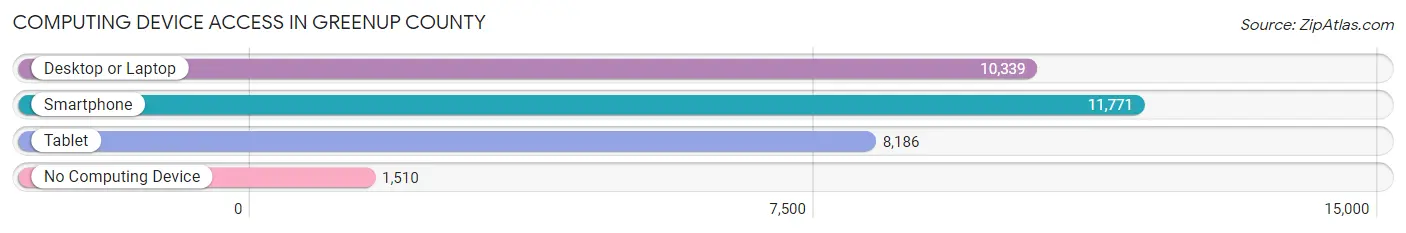
| Device Type | # Households | % Households |
| Desktop or Laptop | 10,339 | 71.4% |
| Smartphone | 11,771 | 81.3% |
| Tablet | 8,186 | 56.5% |
| No Computing Device | 1,510 | 10.4% |
| Total | 14,478 | 100.0% |
Internet Access in Greenup County
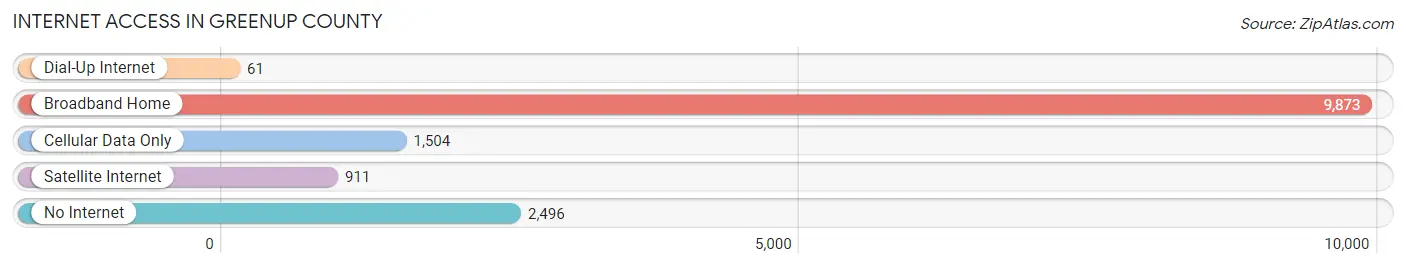
| Internet Type | # Households | % Households |
| Dial-Up Internet | 61 | 0.4% |
| Broadband Home | 9,873 | 68.2% |
| Cellular Data Only | 1,504 | 10.4% |
| Satellite Internet | 911 | 6.3% |
| No Internet | 2,496 | 17.2% |
| Total | 14,478 | 100.0% |
Greenup County Summary
Geography
Greenup County is located in the northeastern corner of Kentucky, along the Ohio River. It is bordered by Scioto County, Ohio to the north, Lawrence County, Ohio to the east, Carter County to the south, and Lewis County to the west. The county has a total area of 437 square miles, of which 431 square miles is land and 6 square miles is water. The county is mostly hilly, with the highest point being the summit of Little Blaine Hill at 1,068 feet above sea level. The county is drained by the Little Sandy River, which flows through the county from north to south.
History
Greenup County was formed in 1803 from parts of Mason and Carter Counties. It was named for Christopher Greenup, who was the Governor of Kentucky from 1804 to 1808. The county was originally divided into three townships: Greenup, Washington, and Portsmouth. The county seat was established in Greenup in 1804.
The county was an important center of the Underground Railroad during the Civil War. It was also the site of the Battle of Greenup, which was fought in 1862.
Economy
Greenup County has a diverse economy, with the largest employers being the Greenup County Board of Education, the Greenup County Health Department, and the Greenup County Sheriff's Office. Other major employers include the Greenup County Hospital, the Greenup County Public Library, and the Greenup County Courthouse.
The county is also home to several manufacturing companies, including the Greenup County Glass Company, the Greenup County Steel Company, and the Greenup County Textile Company. Agriculture is also an important part of the county's economy, with the main crops being corn, soybeans, and wheat.
Demographics
As of the 2010 census, Greenup County had a population of 36,910. The racial makeup of the county was 94.2% White, 3.3% Black or African American, 0.3% Native American, 0.3% Asian, 0.2% Pacific Islander, 0.7% from other races, and 1.2% from two or more races. Hispanic or Latino of any race were 1.7% of the population.
The median income for a household in the county was $37,945, and the median income for a family was $45,945. The per capita income for the county was $19,845. About 14.2% of families and 17.7% of the population were below the poverty line, including 25.2% of those under age 18 and 11.2% of those age 65 or over.
Common Questions
What is the Total Population of Greenup County?
Total Population of Greenup County is 35,853.
What is the Total Male Population of Greenup County?
Total Male Population of Greenup County is 17,610.
What is the Total Female Population of Greenup County?
Total Female Population of Greenup County is 18,243.
What is the Ratio of Males per 100 Females in Greenup County?
There are 96.53 Males per 100 Females in Greenup County.
What is the Ratio of Females per 100 Males in Greenup County?
There are 103.59 Females per 100 Males in Greenup County.
What is the Median Population Age in Greenup County?
Median Population Age in Greenup County is 43.8 Years.
What is the Average Family Size in Greenup County
Average Family Size in Greenup County is 3.0 People.
What is the Average Household Size in Greenup County
Average Household Size in Greenup County is 2.5 People.
What is Per Capita Income in Greenup County?
Per Capita income in Greenup County is $32,070.
What is the Median Family Income in Greenup County?
Median Family Income in Greenup County is $72,842.
What is the Median Household income in Greenup County?
Median Household Income in Greenup County is $58,562.
What is Income or Wage Gap in Greenup County?
Income or Wage Gap in Greenup County is 36.5%.
Women in Greenup County earn 63.5 cents for every dollar earned by a man.
What is Family Income Deficit in Greenup County?
Family Income Deficit in Greenup County is $9,809.
Families that are below poverty line in Greenup County earn $9,809 less on average than the poverty threshold level.
What is Inequality or Gini Index in Greenup County?
Inequality or Gini Index in Greenup County is 0.48.
How Large is the Labor Force in Greenup County?
There are 14,667 People in the Labor Forcein in Greenup County.
What is the Percentage of People in the Labor Force in Greenup County?
50.1% of People are in the Labor Force in Greenup County.
What is the Unemployment Rate in Greenup County?
Unemployment Rate in Greenup County is 6.2%.