Graves County, KY
Graves County Map
Graves County Overview
36,701
TOTAL POPULATION
18,097
MALE POPULATION
18,604
FEMALE POPULATION
97.27
MALES / 100 FEMALES
102.80
FEMALES / 100 MALES
39.9
MEDIAN AGE
3.1
AVG FAMILY SIZE
2.5
AVG HOUSEHOLD SIZE
$28,978
PER CAPITA INCOME
$66,538
AVG FAMILY INCOME
$52,526
AVG HOUSEHOLD INCOME
34.6%
WAGE / INCOME GAP [ % ]
65.4¢/ $1
WAGE / INCOME GAP [ $ ]
$12,276
FAMILY INCOME DEFICIT
0.48
INEQUALITY / GINI INDEX
15,945
LABOR FORCE [ PEOPLE ]
55.2%
PERCENT IN LABOR FORCE
3.7%
UNEMPLOYMENT RATE
Graves County Area Codes
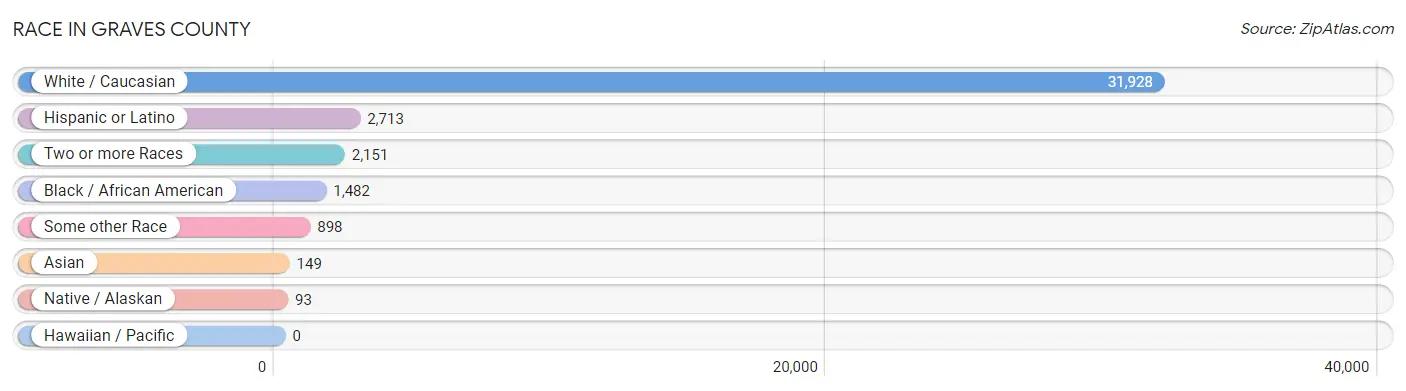
Race in Graves County
The most populous races in Graves County are White / Caucasian (31,928 | 87.0%), Hispanic or Latino (2,713 | 7.4%), and Two or more Races (2,151 | 5.9%).
| Race | # Population | % Population |
| Asian | 149 | 0.4% |
| Black / African American | 1,482 | 4.0% |
| Hawaiian / Pacific | 0 | 0.0% |
| Hispanic or Latino | 2,713 | 7.4% |
| Native / Alaskan | 93 | 0.3% |
| White / Caucasian | 31,928 | 87.0% |
| Two or more Races | 2,151 | 5.9% |
| Some other Race | 898 | 2.5% |
| Total | 36,701 | 100.0% |
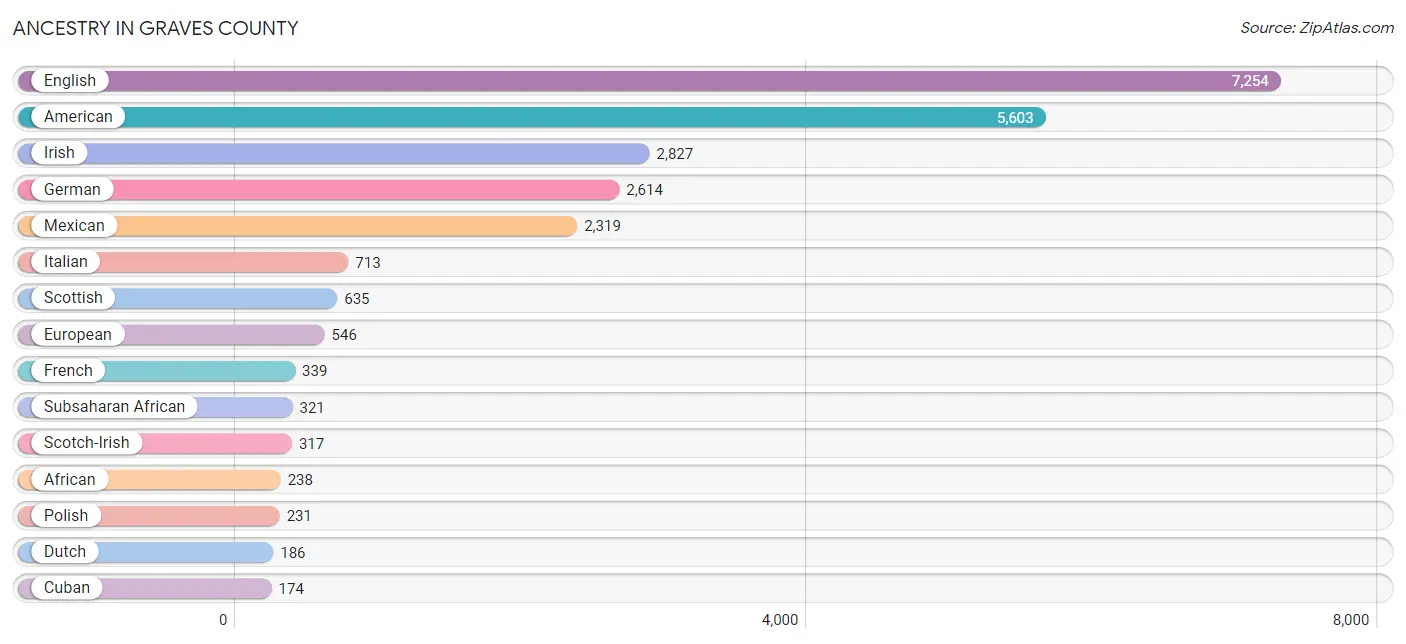
Ancestry in Graves County
The most populous ancestries reported in Graves County are English (7,254 | 19.8%), American (5,603 | 15.3%), Irish (2,827 | 7.7%), German (2,614 | 7.1%), and Mexican (2,319 | 6.3%), together accounting for 56.2% of all Graves County residents.
| Ancestry | # Population | % Population |
| African | 238 | 0.6% |
| American | 5,603 | 15.3% |
| Apache | 29 | 0.1% |
| Arab | 121 | 0.3% |
| Austrian | 33 | 0.1% |
| Bhutanese | 13 | 0.0% |
| Blackfeet | 24 | 0.1% |
| British | 108 | 0.3% |
| British West Indian | 46 | 0.1% |
| Canadian | 10 | 0.0% |
| Celtic | 13 | 0.0% |
| Central American | 19 | 0.1% |
| Cherokee | 91 | 0.3% |
| Cuban | 174 | 0.5% |
| Czech | 42 | 0.1% |
| Czechoslovakian | 9 | 0.0% |
| Dutch | 186 | 0.5% |
| Egyptian | 22 | 0.1% |
| English | 7,254 | 19.8% |
| European | 546 | 1.5% |
| Finnish | 40 | 0.1% |
| French | 339 | 0.9% |
| French Canadian | 17 | 0.1% |
| German | 2,614 | 7.1% |
| Honduran | 19 | 0.1% |
| Hungarian | 23 | 0.1% |
| Indian (Asian) | 44 | 0.1% |
| Irish | 2,827 | 7.7% |
| Italian | 713 | 1.9% |
| Korean | 106 | 0.3% |
| Lebanese | 91 | 0.3% |
| Lithuanian | 3 | 0.0% |
| Lumbee | 43 | 0.1% |
| Mexican | 2,319 | 6.3% |
| Mexican American Indian | 90 | 0.3% |
| Nigerian | 46 | 0.1% |
| Norwegian | 93 | 0.3% |
| Pakistani | 4 | 0.0% |
| Peruvian | 69 | 0.2% |
| Polish | 231 | 0.6% |
| Portuguese | 36 | 0.1% |
| Puerto Rican | 41 | 0.1% |
| Romanian | 9 | 0.0% |
| Russian | 98 | 0.3% |
| Scandinavian | 24 | 0.1% |
| Scotch-Irish | 317 | 0.9% |
| Scottish | 635 | 1.7% |
| Seminole | 12 | 0.0% |
| South African | 37 | 0.1% |
| South American | 69 | 0.2% |
| Spanish | 62 | 0.2% |
| Subsaharan African | 321 | 0.9% |
| Swedish | 46 | 0.1% |
| Syrian | 8 | 0.0% |
| Thai | 86 | 0.2% |
| Turkish | 15 | 0.0% |
| Welsh | 165 | 0.4% | View All 57 Rows |
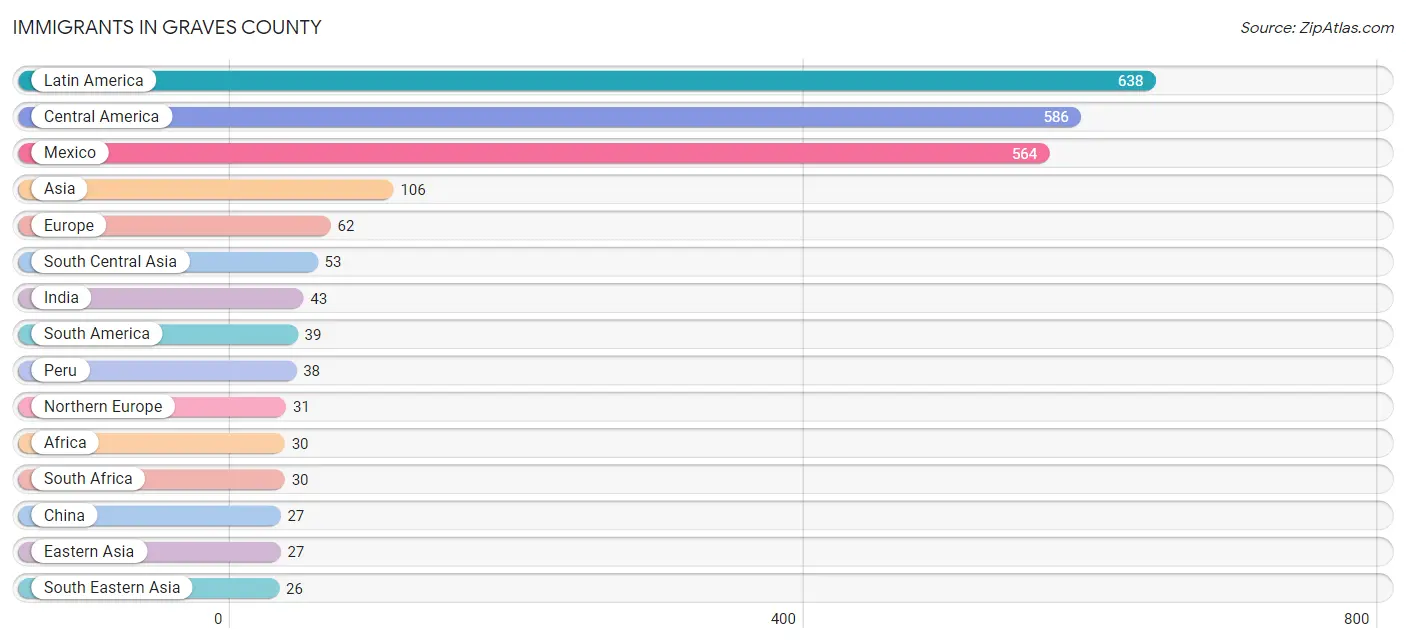
Immigrants in Graves County
The most numerous immigrant groups reported in Graves County came from Latin America (638 | 1.7%), Central America (586 | 1.6%), Mexico (564 | 1.5%), Asia (106 | 0.3%), and Europe (62 | 0.2%), together accounting for 5.3% of all Graves County residents.
| Immigration Origin | # Population | % Population |
| Africa | 30 | 0.1% |
| Asia | 106 | 0.3% |
| Canada | 18 | 0.1% |
| Caribbean | 13 | 0.0% |
| Central America | 586 | 1.6% |
| Chile | 1 | 0.0% |
| China | 27 | 0.1% |
| Cuba | 13 | 0.0% |
| Eastern Asia | 27 | 0.1% |
| Eastern Europe | 9 | 0.0% |
| England | 9 | 0.0% |
| Europe | 62 | 0.2% |
| Germany | 22 | 0.1% |
| Honduras | 22 | 0.1% |
| India | 43 | 0.1% |
| Kazakhstan | 10 | 0.0% |
| Latin America | 638 | 1.7% |
| Mexico | 564 | 1.5% |
| Northern Europe | 31 | 0.1% |
| Peru | 38 | 0.1% |
| Philippines | 24 | 0.1% |
| Russia | 9 | 0.0% |
| South Africa | 30 | 0.1% |
| South America | 39 | 0.1% |
| South Central Asia | 53 | 0.1% |
| South Eastern Asia | 26 | 0.1% |
| Thailand | 2 | 0.0% |
| Western Europe | 22 | 0.1% | View All 28 Rows |
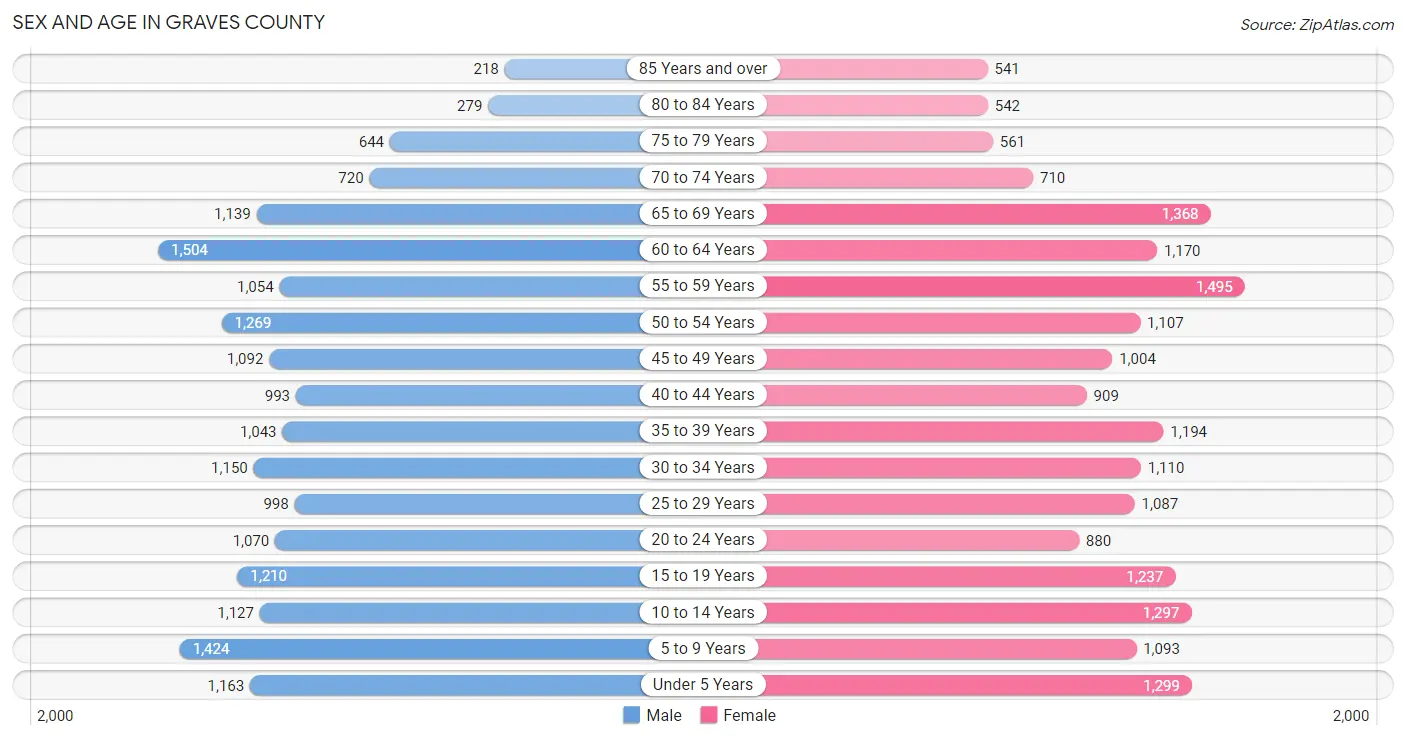
Sex and Age in Graves County
Sex and Age in Graves County
The most populous age groups in Graves County are 60 to 64 Years (1,504 | 8.3%) for men and 55 to 59 Years (1,495 | 8.0%) for women.
| Age Bracket | Male | Female |
| Under 5 Years | 1,163 (6.4%) | 1,299 (7.0%) |
| 5 to 9 Years | 1,424 (7.9%) | 1,093 (5.9%) |
| 10 to 14 Years | 1,127 (6.2%) | 1,297 (7.0%) |
| 15 to 19 Years | 1,210 (6.7%) | 1,237 (6.7%) |
| 20 to 24 Years | 1,070 (5.9%) | 880 (4.7%) |
| 25 to 29 Years | 998 (5.5%) | 1,087 (5.8%) |
| 30 to 34 Years | 1,150 (6.4%) | 1,110 (6.0%) |
| 35 to 39 Years | 1,043 (5.8%) | 1,194 (6.4%) |
| 40 to 44 Years | 993 (5.5%) | 909 (4.9%) |
| 45 to 49 Years | 1,092 (6.0%) | 1,004 (5.4%) |
| 50 to 54 Years | 1,269 (7.0%) | 1,107 (5.9%) |
| 55 to 59 Years | 1,054 (5.8%) | 1,495 (8.0%) |
| 60 to 64 Years | 1,504 (8.3%) | 1,170 (6.3%) |
| 65 to 69 Years | 1,139 (6.3%) | 1,368 (7.3%) |
| 70 to 74 Years | 720 (4.0%) | 710 (3.8%) |
| 75 to 79 Years | 644 (3.6%) | 561 (3.0%) |
| 80 to 84 Years | 279 (1.5%) | 542 (2.9%) |
| 85 Years and over | 218 (1.2%) | 541 (2.9%) |
| Total | 18,097 (100.0%) | 18,604 (100.0%) |
Families and Households in Graves County
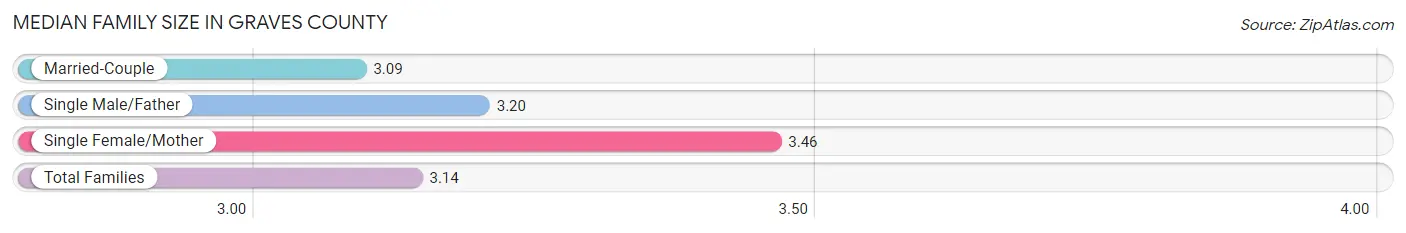
Median Family Size in Graves County
The median family size in Graves County is 3.14 persons per family, with single female/mother families (1,203 | 12.8%) accounting for the largest median family size of 3.46 persons per family. On the other hand, married-couple families (7,624 | 80.9%) represent the smallest median family size with 3.09 persons per family.
| Family Type | # Families | Family Size |
| Married-Couple | 7,624 (80.9%) | 3.09 |
| Single Male/Father | 597 (6.3%) | 3.20 |
| Single Female/Mother | 1,203 (12.8%) | 3.46 |
| Total Families | 9,424 (100.0%) | 3.14 |
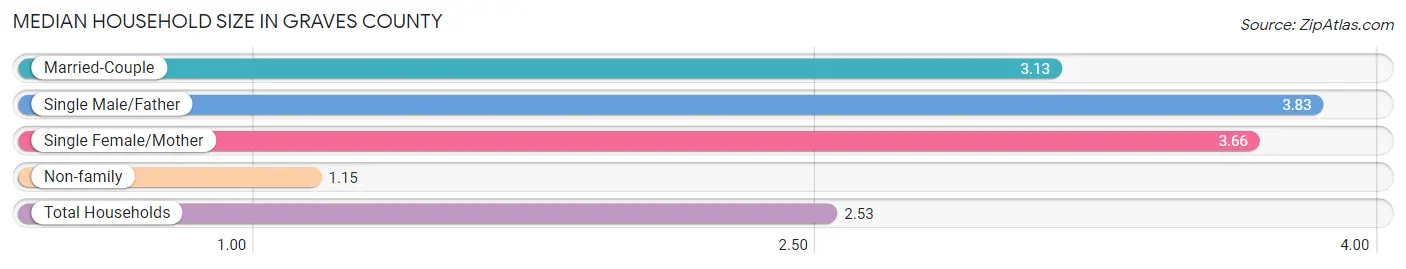
Median Household Size in Graves County
The median household size in Graves County is 2.53 persons per household, with single male/father households (597 | 4.2%) accounting for the largest median household size of 3.83 persons per household. non-family households (4,880 | 34.1%) represent the smallest median household size with 1.15 persons per household.
| Household Type | # Households | Household Size |
| Married-Couple | 7,624 (53.3%) | 3.13 |
| Single Male/Father | 597 (4.2%) | 3.83 |
| Single Female/Mother | 1,203 (8.4%) | 3.66 |
| Non-family | 4,880 (34.1%) | 1.15 |
| Total Households | 14,304 (100.0%) | 2.53 |
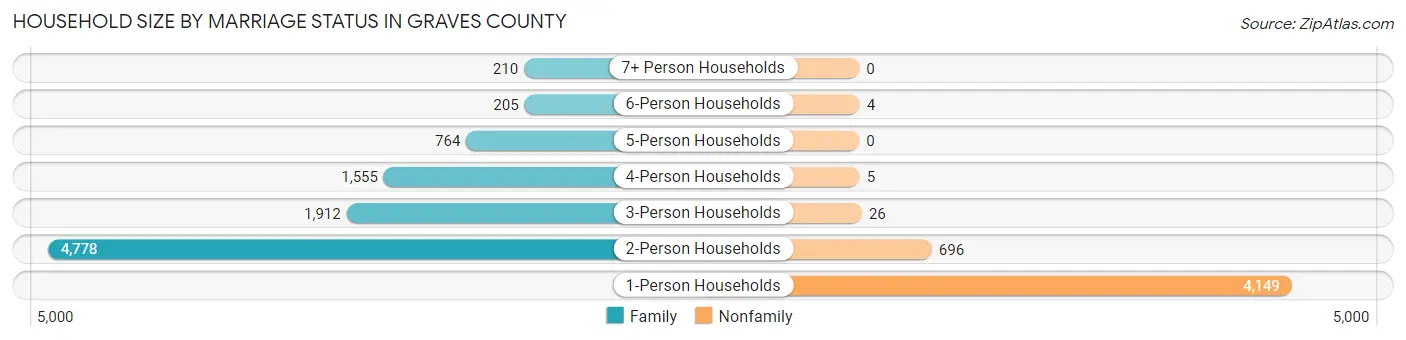
Household Size by Marriage Status in Graves County
Out of a total of 14,304 households in Graves County, 9,424 (65.9%) are family households, while 4,880 (34.1%) are nonfamily households. The most numerous type of family households are 2-person households, comprising 4,778, and the most common type of nonfamily households are 1-person households, comprising 4,149.
| Household Size | Family Households | Nonfamily Households |
| 1-Person Households | - | 4,149 (29.0%) |
| 2-Person Households | 4,778 (33.4%) | 696 (4.9%) |
| 3-Person Households | 1,912 (13.4%) | 26 (0.2%) |
| 4-Person Households | 1,555 (10.9%) | 5 (0.0%) |
| 5-Person Households | 764 (5.3%) | 0 (0.0%) |
| 6-Person Households | 205 (1.4%) | 4 (0.0%) |
| 7+ Person Households | 210 (1.5%) | 0 (0.0%) |
| Total | 9,424 (65.9%) | 4,880 (34.1%) |
Female Fertility in Graves County
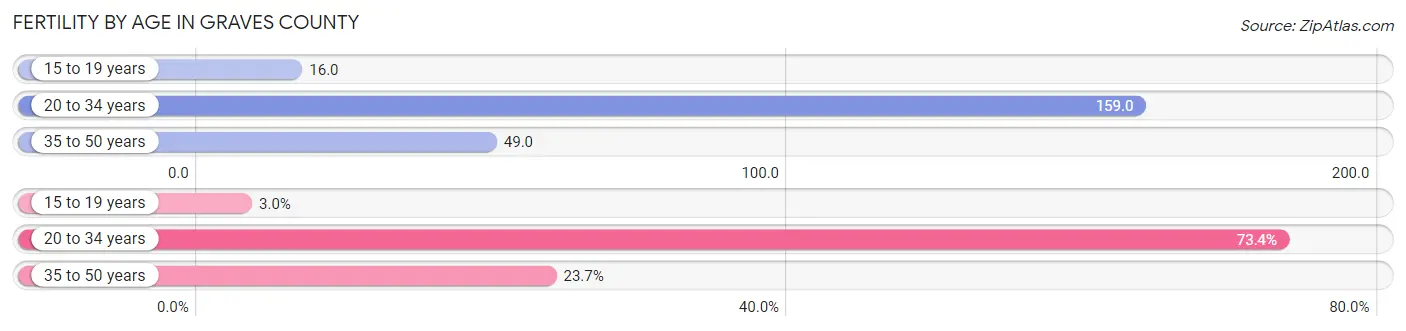
Fertility by Age in Graves County
Average fertility rate in Graves County is 89.0 births per 1,000 women. Women in the age bracket of 20 to 34 years have the highest fertility rate with 159.0 births per 1,000 women. Women in the age bracket of 20 to 34 years acount for 73.4% of all women with births.
| Age Bracket | Women with Births | Births / 1,000 Women |
| 15 to 19 years | 20 (3.0%) | 16.0 |
| 20 to 34 years | 490 (73.4%) | 159.0 |
| 35 to 50 years | 158 (23.6%) | 49.0 |
| Total | 668 (100.0%) | 89.0 |
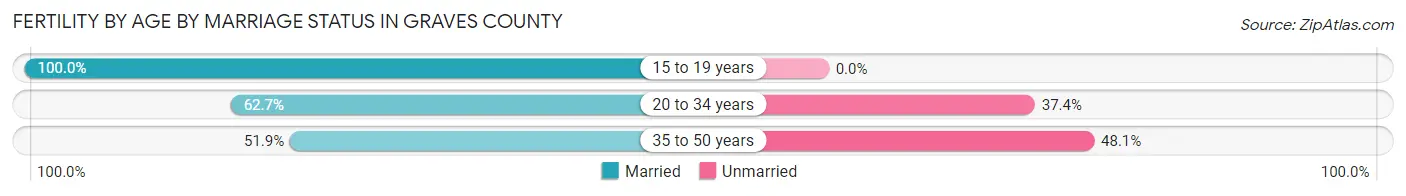
Fertility by Age by Marriage Status in Graves County
61.2% of women with births (668) in Graves County are married. The highest percentage of unmarried women with births falls into 35 to 50 years age bracket with 48.1% of them unmarried at the time of birth, while the lowest percentage of unmarried women with births belong to 15 to 19 years age bracket with 0.0% of them unmarried.
| Age Bracket | Married | Unmarried |
| 15 to 19 years | 20 (100.0%) | 0 (0.0%) |
| 20 to 34 years | 307 (62.6%) | 183 (37.3%) |
| 35 to 50 years | 82 (51.9%) | 76 (48.1%) |
| Total | 409 (61.2%) | 259 (38.8%) |
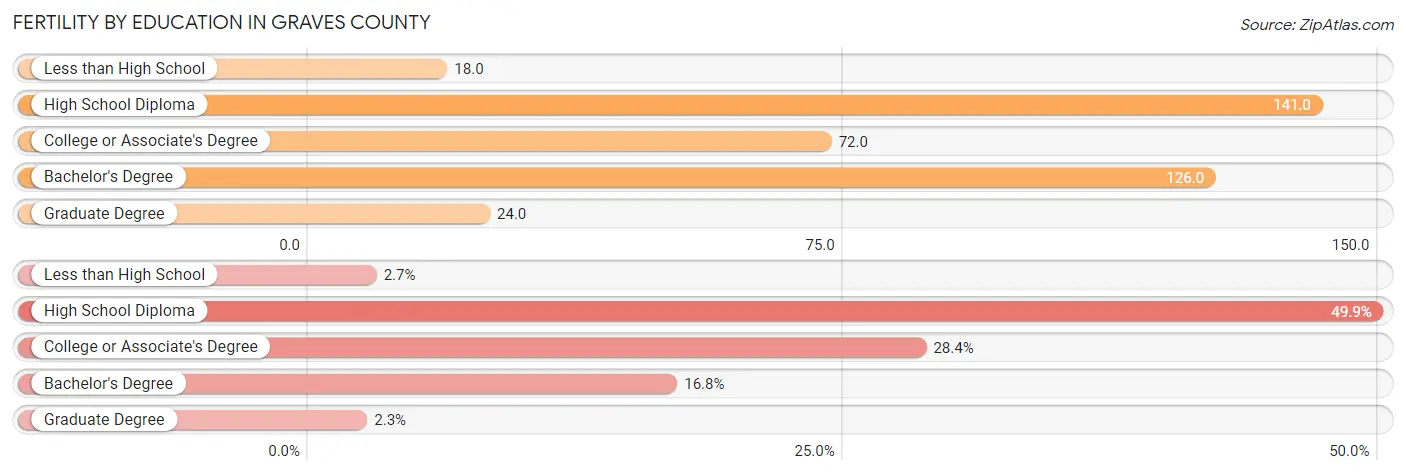
Fertility by Education in Graves County
Average fertility rate in Graves County is 89.0 births per 1,000 women. Women with the education attainment of high school diploma have the highest fertility rate of 141.0 births per 1,000 women, while women with the education attainment of less than high school have the lowest fertility at 18.0 births per 1,000 women. Women with the education attainment of high school diploma represent 49.8% of all women with births.
| Educational Attainment | Women with Births | Births / 1,000 Women |
| Less than High School | 18 (2.7%) | 18.0 |
| High School Diploma | 333 (49.8%) | 141.0 |
| College or Associate's Degree | 190 (28.4%) | 72.0 |
| Bachelor's Degree | 112 (16.8%) | 126.0 |
| Graduate Degree | 15 (2.2%) | 24.0 |
| Total | 668 (100.0%) | 89.0 |
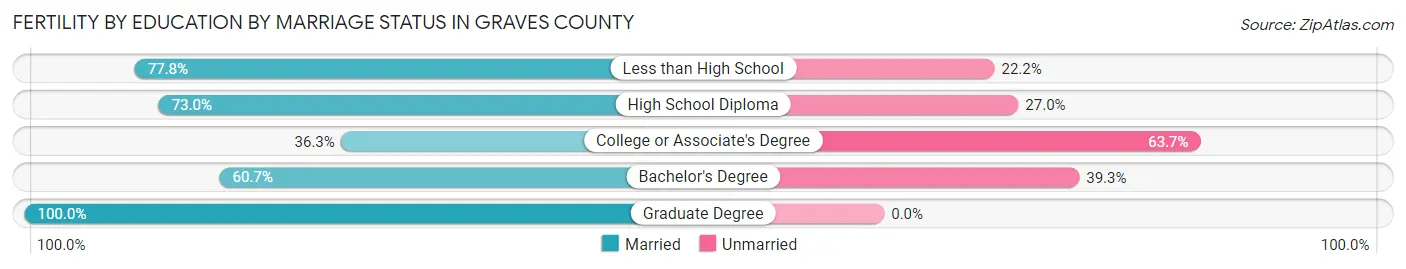
Fertility by Education by Marriage Status in Graves County
38.8% of women with births in Graves County are unmarried. Women with the educational attainment of graduate degree are most likely to be married with 100.0% of them married at childbirth, while women with the educational attainment of college or associate's degree are least likely to be married with 63.7% of them unmarried at childbirth.
| Educational Attainment | Married | Unmarried |
| Less than High School | 14 (77.8%) | 4 (22.2%) |
| High School Diploma | 243 (73.0%) | 90 (27.0%) |
| College or Associate's Degree | 69 (36.3%) | 121 (63.7%) |
| Bachelor's Degree | 68 (60.7%) | 44 (39.3%) |
| Graduate Degree | 15 (100.0%) | 0 (0.0%) |
| Total | 409 (61.2%) | 259 (38.8%) |
Income in Graves County
Income Overview in Graves County
Per Capita Income in Graves County is $28,978, while median incomes of families and households are $66,538 and $52,526 respectively.
| Characteristic | Number | Measure |
| Per Capita Income | 36,701 | $28,978 |
| Median Family Income | 9,424 | $66,538 |
| Mean Family Income | 9,424 | $86,644 |
| Median Household Income | 14,304 | $52,526 |
| Mean Household Income | 14,304 | $71,040 |
| Income Deficit | 9,424 | $12,276 |
| Wage / Income Gap (%) | 36,701 | 34.62% |
| Wage / Income Gap ($) | 36,701 | 65.38¢ per $1 |
| Gini / Inequality Index | 36,701 | 0.48 |
Earnings by Sex in Graves County
Average Earnings in Graves County are $34,408, $43,682 for men and $28,559 for women, a difference of 34.6%.
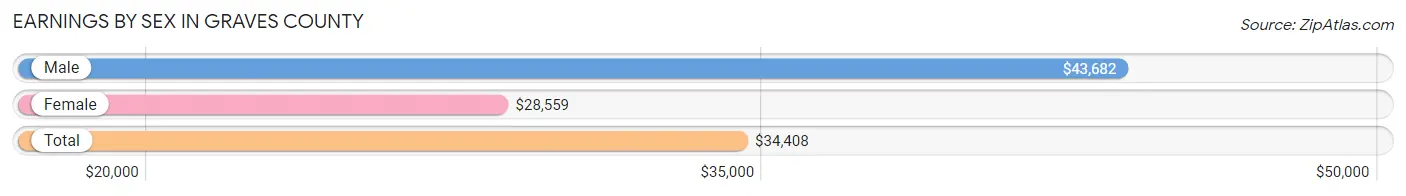
| Sex | Number | Average Earnings |
| Male | 9,145 (54.4%) | $43,682 |
| Female | 7,650 (45.6%) | $28,559 |
| Total | 16,795 (100.0%) | $34,408 |
Earnings by Sex by Income Bracket in Graves County
The most common earnings brackets in Graves County are $100,000+ for men (979 | 10.7%) and $30,000 to $34,999 for women (673 | 8.8%).
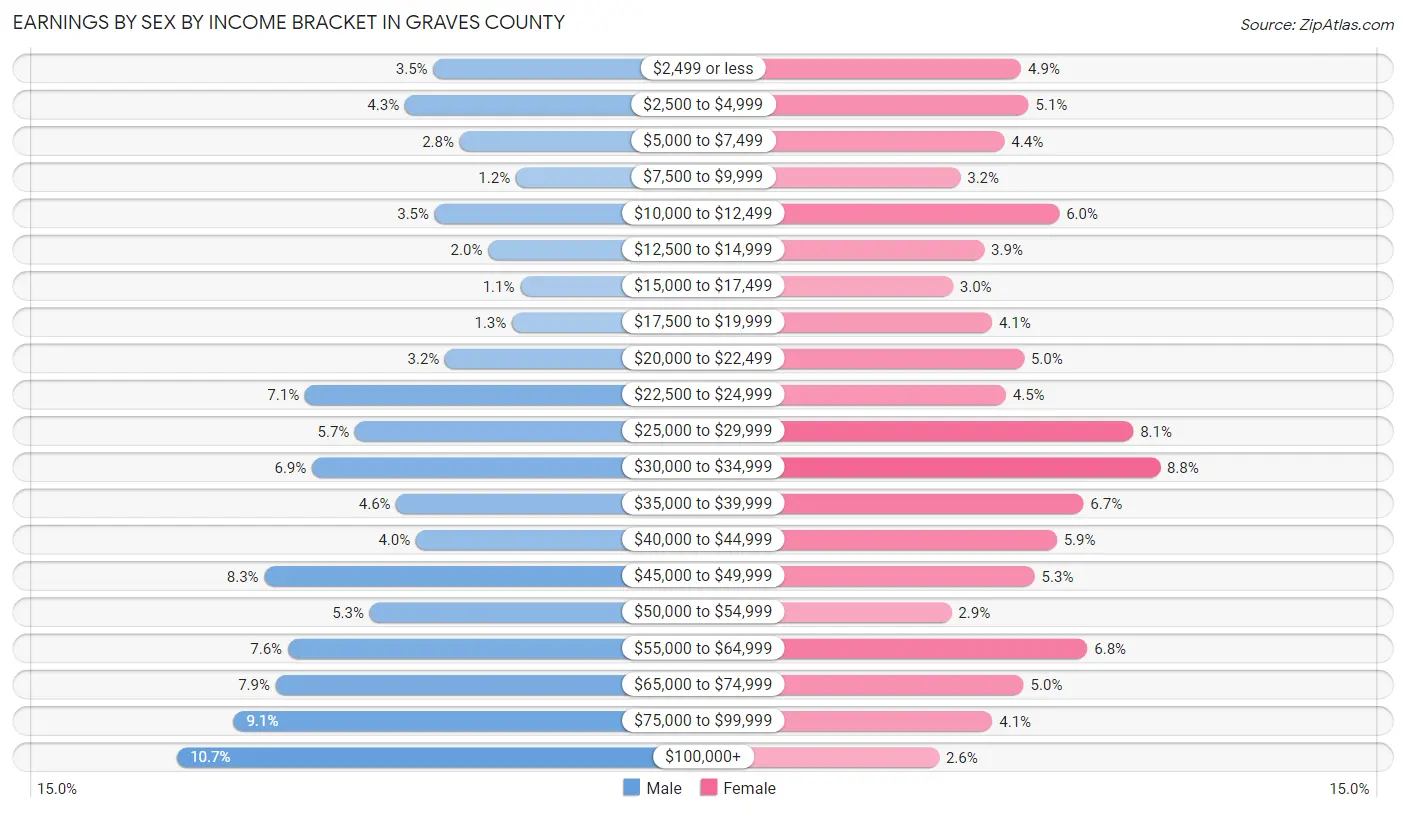
| Income | Male | Female |
| $2,499 or less | 321 (3.5%) | 375 (4.9%) |
| $2,500 to $4,999 | 394 (4.3%) | 391 (5.1%) |
| $5,000 to $7,499 | 253 (2.8%) | 339 (4.4%) |
| $7,500 to $9,999 | 109 (1.2%) | 244 (3.2%) |
| $10,000 to $12,499 | 317 (3.5%) | 457 (6.0%) |
| $12,500 to $14,999 | 180 (2.0%) | 295 (3.9%) |
| $15,000 to $17,499 | 98 (1.1%) | 228 (3.0%) |
| $17,500 to $19,999 | 119 (1.3%) | 312 (4.1%) |
| $20,000 to $22,499 | 291 (3.2%) | 381 (5.0%) |
| $22,500 to $24,999 | 651 (7.1%) | 342 (4.5%) |
| $25,000 to $29,999 | 522 (5.7%) | 616 (8.1%) |
| $30,000 to $34,999 | 633 (6.9%) | 673 (8.8%) |
| $35,000 to $39,999 | 416 (4.5%) | 509 (6.7%) |
| $40,000 to $44,999 | 366 (4.0%) | 451 (5.9%) |
| $45,000 to $49,999 | 755 (8.3%) | 404 (5.3%) |
| $50,000 to $54,999 | 485 (5.3%) | 225 (2.9%) |
| $55,000 to $64,999 | 695 (7.6%) | 517 (6.8%) |
| $65,000 to $74,999 | 726 (7.9%) | 380 (5.0%) |
| $75,000 to $99,999 | 835 (9.1%) | 313 (4.1%) |
| $100,000+ | 979 (10.7%) | 198 (2.6%) |
| Total | 9,145 (100.0%) | 7,650 (100.0%) |
Earnings by Sex by Educational Attainment in Graves County
Average earnings in Graves County are $48,202 for men and $32,302 for women, a difference of 33.0%. Men with an educational attainment of graduate degree enjoy the highest average annual earnings of $69,700, while those with less than high school education earn the least with $30,000. Women with an educational attainment of graduate degree earn the most with the average annual earnings of $59,133, while those with less than high school education have the smallest earnings of $18,269.
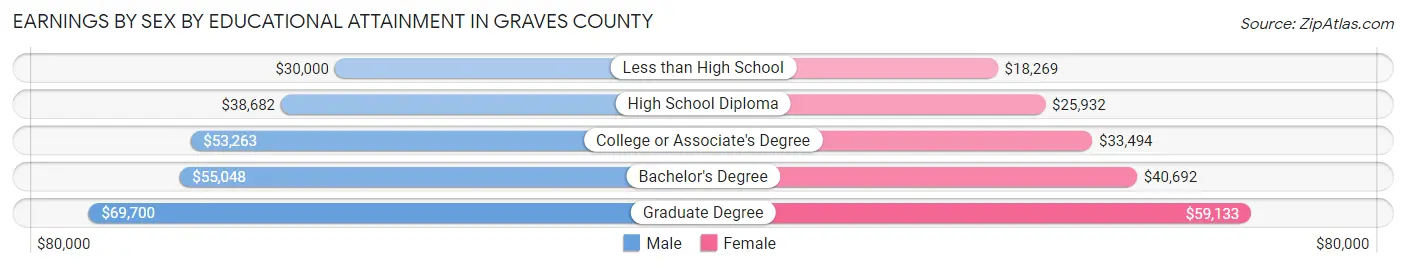
| Educational Attainment | Male Income | Female Income |
| Less than High School | $30,000 | $18,269 |
| High School Diploma | $38,682 | $25,932 |
| College or Associate's Degree | $53,263 | $33,494 |
| Bachelor's Degree | $55,048 | $40,692 |
| Graduate Degree | $69,700 | $59,133 |
| Total | $48,202 | $32,302 |
Family Income in Graves County
Family Income Brackets in Graves County
According to the Graves County family income data, there are 1,800 families falling into the $50,000 to $74,999 income range, which is the most common income bracket and makes up 19.1% of all families. Conversely, the $10,000 to $14,999 income bracket is the least frequent group with only 236 families (2.5%) belonging to this category.
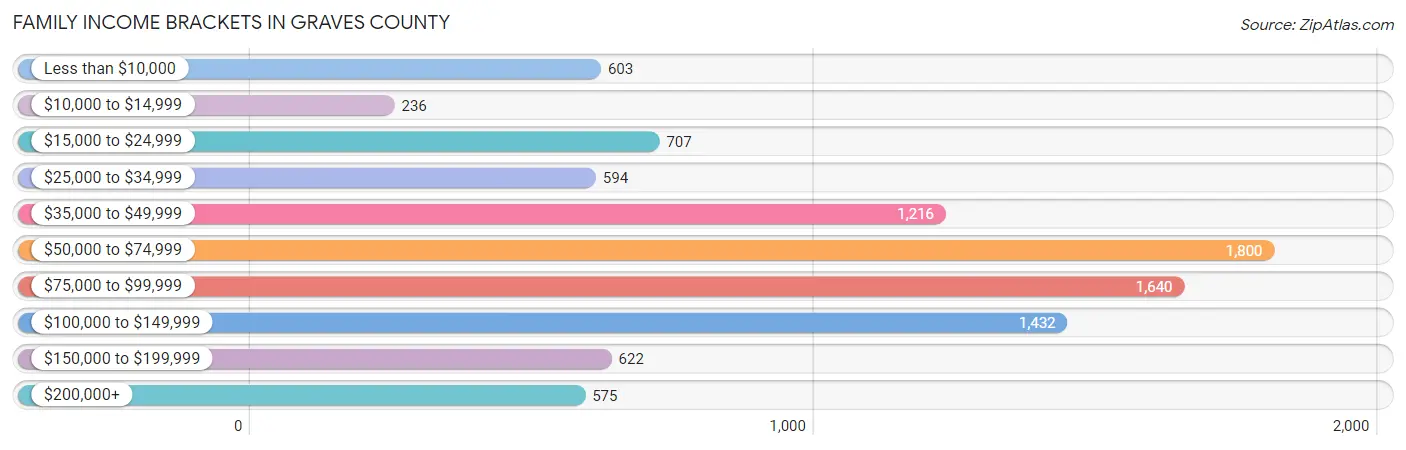
| Income Bracket | # Families | % Families |
| Less than $10,000 | 603 | 6.4% |
| $10,000 to $14,999 | 236 | 2.5% |
| $15,000 to $24,999 | 707 | 7.5% |
| $25,000 to $34,999 | 594 | 6.3% |
| $35,000 to $49,999 | 1,216 | 12.9% |
| $50,000 to $74,999 | 1,800 | 19.1% |
| $75,000 to $99,999 | 1,640 | 17.4% |
| $100,000 to $149,999 | 1,432 | 15.2% |
| $150,000 to $199,999 | 622 | 6.6% |
| $200,000+ | 575 | 6.1% |
Family Income by Famaliy Size in Graves County
4-person families (1,531 | 16.3%) account for the highest median family income in Graves County with $91,556 per family, while 2-person families (4,856 | 51.5%) have the highest median income of $28,654 per family member.
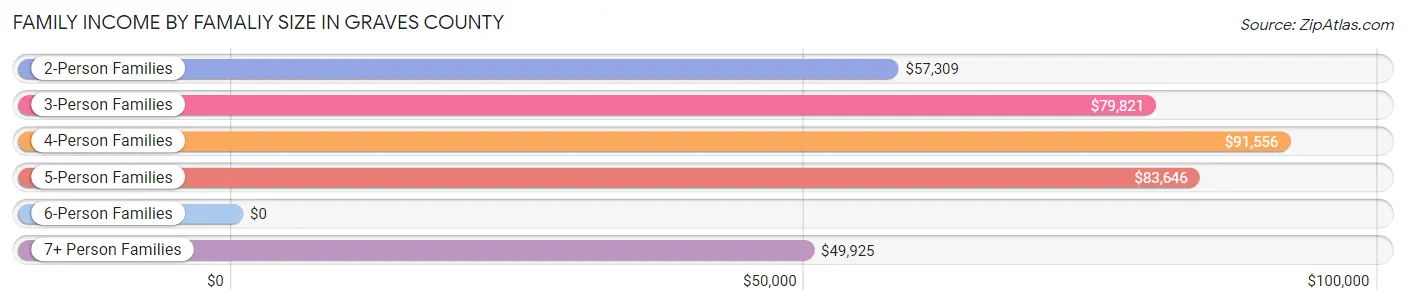
| Income Bracket | # Families | Median Income |
| 2-Person Families | 4,856 (51.5%) | $57,309 |
| 3-Person Families | 2,005 (21.3%) | $79,821 |
| 4-Person Families | 1,531 (16.3%) | $91,556 |
| 5-Person Families | 755 (8.0%) | $83,646 |
| 6-Person Families | 108 (1.1%) | $0 |
| 7+ Person Families | 169 (1.8%) | $49,925 |
| Total | 9,424 (100.0%) | $66,538 |
Family Income by Number of Earners in Graves County
The median family income in Graves County is $66,538, with families comprising 3+ earners (769) having the highest median family income of $143,838, while families with no earners (2,045) have the lowest median family income of $31,841, accounting for 8.2% and 21.7% of families, respectively.
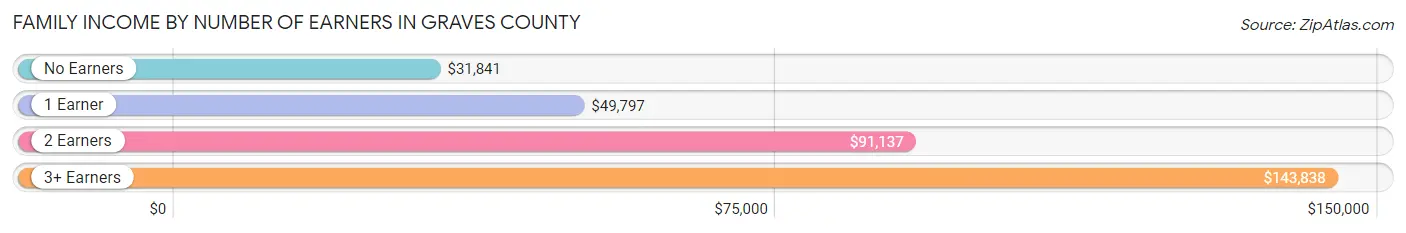
| Number of Earners | # Families | Median Income |
| No Earners | 2,045 (21.7%) | $31,841 |
| 1 Earner | 2,809 (29.8%) | $49,797 |
| 2 Earners | 3,801 (40.3%) | $91,137 |
| 3+ Earners | 769 (8.2%) | $143,838 |
| Total | 9,424 (100.0%) | $66,538 |
Household Income in Graves County
Household Income Brackets in Graves County
With 2,575 households falling in the category, the $50,000 to $74,999 income range is the most frequent in Graves County, accounting for 18.0% of all households. In contrast, only 615 households (4.3%) fall into the $200,000+ income bracket, making it the least populous group.
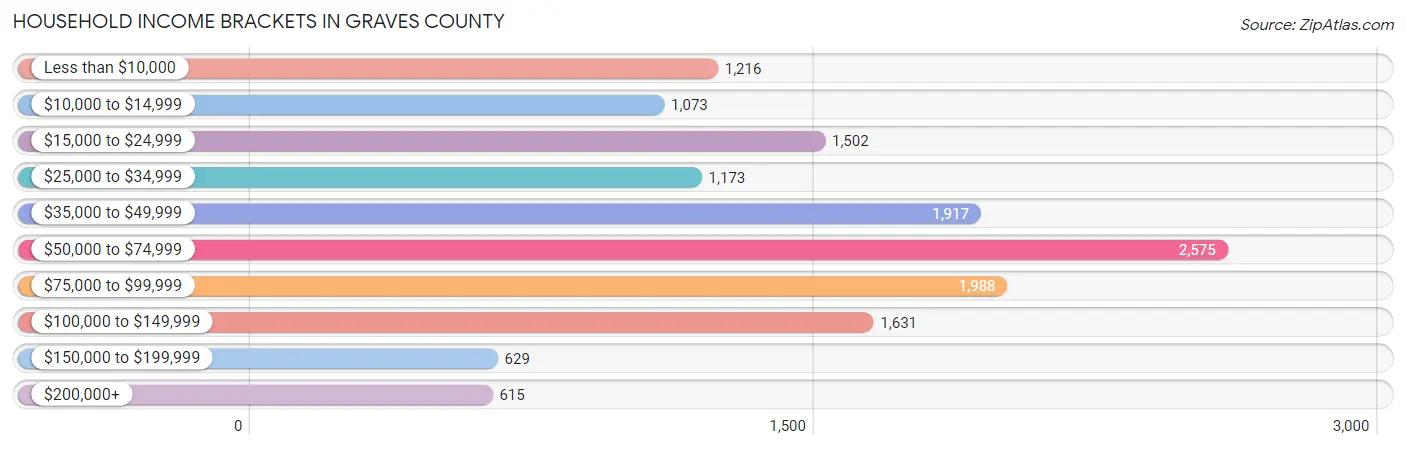
| Income Bracket | # Households | % Households |
| Less than $10,000 | 1,216 | 8.5% |
| $10,000 to $14,999 | 1,073 | 7.5% |
| $15,000 to $24,999 | 1,502 | 10.5% |
| $25,000 to $34,999 | 1,173 | 8.2% |
| $35,000 to $49,999 | 1,917 | 13.4% |
| $50,000 to $74,999 | 2,575 | 18.0% |
| $75,000 to $99,999 | 1,988 | 13.9% |
| $100,000 to $149,999 | 1,631 | 11.4% |
| $150,000 to $199,999 | 629 | 4.4% |
| $200,000+ | 615 | 4.3% |
Household Income by Householder Age in Graves County
The median household income in Graves County is $52,526, with the highest median household income of $70,032 found in the 25 to 44 years age bracket for the primary householder. A total of 4,060 households (28.4%) fall into this category. Meanwhile, the 65+ years age bracket for the primary householder has the lowest median household income of $37,117, with 4,176 households (29.2%) in this group.
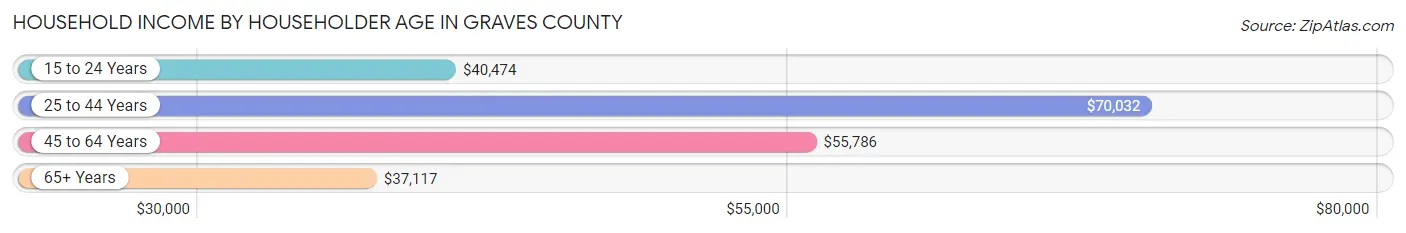
| Income Bracket | # Households | Median Income |
| 15 to 24 Years | 647 (4.5%) | $40,474 |
| 25 to 44 Years | 4,060 (28.4%) | $70,032 |
| 45 to 64 Years | 5,421 (37.9%) | $55,786 |
| 65+ Years | 4,176 (29.2%) | $37,117 |
| Total | 14,304 (100.0%) | $52,526 |
Poverty in Graves County
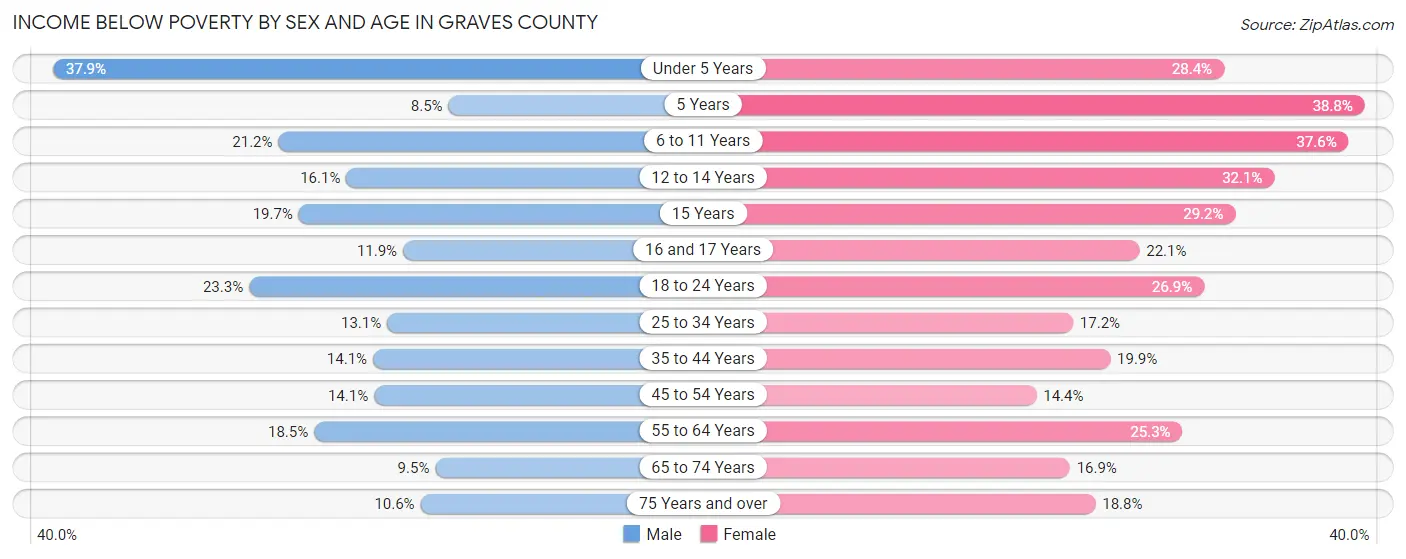
Income Below Poverty by Sex and Age in Graves County
With 16.8% poverty level for males and 22.7% for females among the residents of Graves County, under 5 year old males and 5 year old females are the most vulnerable to poverty, with 437 males (37.9%) and 92 females (38.8%) in their respective age groups living below the poverty level.
| Age Bracket | Male | Female |
| Under 5 Years | 437 (37.9%) | 360 (28.4%) |
| 5 Years | 29 (8.5%) | 92 (38.8%) |
| 6 to 11 Years | 289 (21.2%) | 509 (37.6%) |
| 12 to 14 Years | 113 (16.1%) | 252 (32.1%) |
| 15 Years | 45 (19.7%) | 52 (29.2%) |
| 16 and 17 Years | 56 (11.9%) | 110 (22.1%) |
| 18 to 24 Years | 356 (23.3%) | 381 (26.9%) |
| 25 to 34 Years | 278 (13.1%) | 377 (17.2%) |
| 35 to 44 Years | 283 (14.1%) | 419 (19.9%) |
| 45 to 54 Years | 328 (14.1%) | 303 (14.4%) |
| 55 to 64 Years | 471 (18.5%) | 672 (25.3%) |
| 65 to 74 Years | 173 (9.5%) | 351 (16.9%) |
| 75 Years and over | 118 (10.6%) | 287 (18.8%) |
| Total | 2,976 (16.8%) | 4,165 (22.7%) |
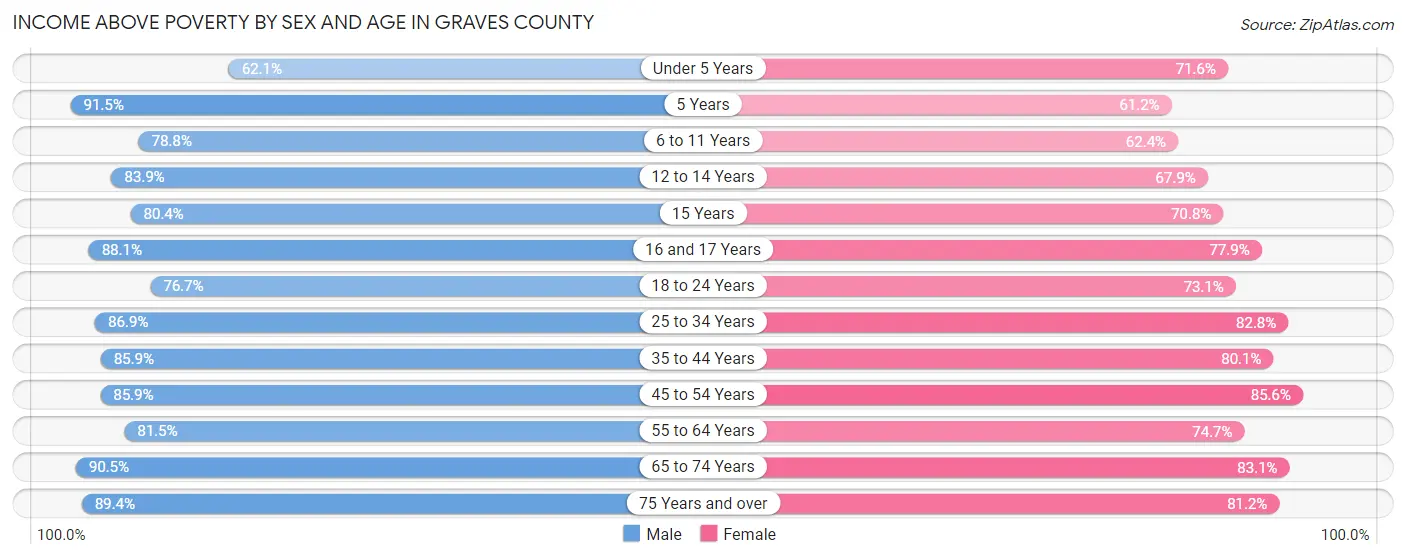
Income Above Poverty by Sex and Age in Graves County
According to the poverty statistics in Graves County, males aged 5 years and females aged 45 to 54 years are the age groups that are most secure financially, with 91.5% of males and 85.6% of females in these age groups living above the poverty line.
| Age Bracket | Male | Female |
| Under 5 Years | 716 (62.1%) | 909 (71.6%) |
| 5 Years | 311 (91.5%) | 145 (61.2%) |
| 6 to 11 Years | 1,077 (78.8%) | 844 (62.4%) |
| 12 to 14 Years | 588 (83.9%) | 533 (67.9%) |
| 15 Years | 184 (80.3%) | 126 (70.8%) |
| 16 and 17 Years | 414 (88.1%) | 388 (77.9%) |
| 18 to 24 Years | 1,169 (76.7%) | 1,036 (73.1%) |
| 25 to 34 Years | 1,845 (86.9%) | 1,820 (82.8%) |
| 35 to 44 Years | 1,719 (85.9%) | 1,684 (80.1%) |
| 45 to 54 Years | 2,005 (85.9%) | 1,795 (85.6%) |
| 55 to 64 Years | 2,074 (81.5%) | 1,985 (74.7%) |
| 65 to 74 Years | 1,646 (90.5%) | 1,723 (83.1%) |
| 75 Years and over | 994 (89.4%) | 1,238 (81.2%) |
| Total | 14,742 (83.2%) | 14,226 (77.3%) |
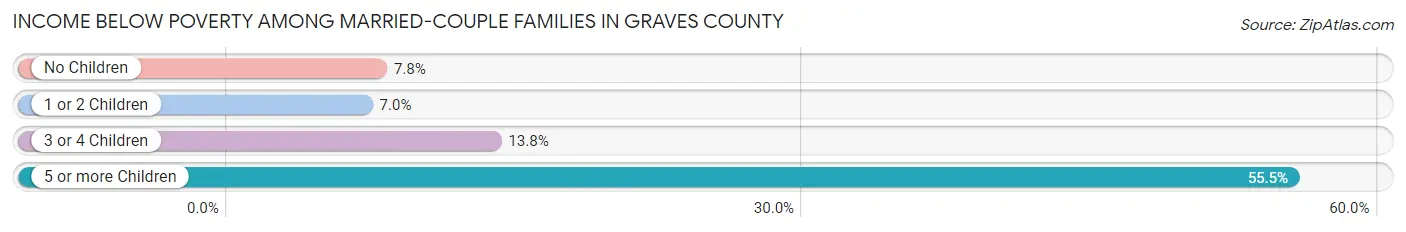
Income Below Poverty Among Married-Couple Families in Graves County
The poverty statistics for married-couple families in Graves County show that 8.6% or 658 of the total 7,624 families live below the poverty line. Families with 5 or more children have the highest poverty rate of 55.4%, comprising of 56 families. On the other hand, families with 1 or 2 children have the lowest poverty rate of 7.0%, which includes 165 families.
| Children | Above Poverty | Below Poverty |
| No Children | 4,243 (92.2%) | 358 (7.8%) |
| 1 or 2 Children | 2,183 (93.0%) | 165 (7.0%) |
| 3 or 4 Children | 495 (86.2%) | 79 (13.8%) |
| 5 or more Children | 45 (44.6%) | 56 (55.4%) |
| Total | 6,966 (91.4%) | 658 (8.6%) |
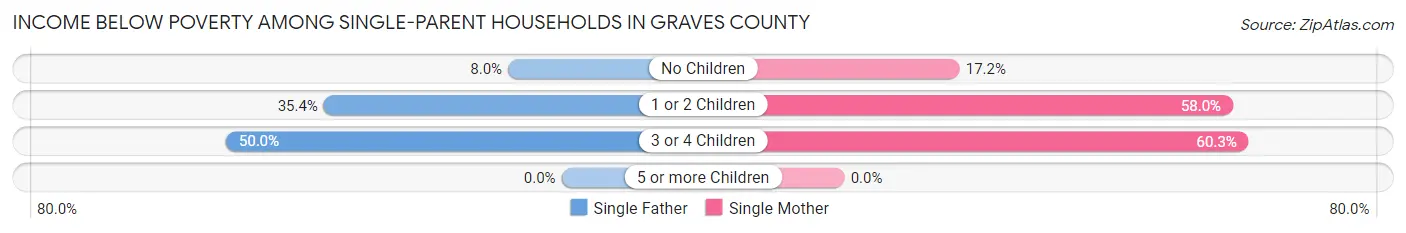
Income Below Poverty Among Single-Parent Households in Graves County
According to the poverty data in Graves County, 17.6% or 105 single-father households and 45.5% or 547 single-mother households are living below the poverty line. Among single-father households, those with 3 or 4 children have the highest poverty rate, with 13 households (50.0%) experiencing poverty. Likewise, among single-mother households, those with 3 or 4 children have the highest poverty rate, with 105 households (60.3%) falling below the poverty line.
| Children | Single Father | Single Mother |
| No Children | 30 (8.0%) | 65 (17.2%) |
| 1 or 2 Children | 62 (35.4%) | 377 (58.0%) |
| 3 or 4 Children | 13 (50.0%) | 105 (60.3%) |
| 5 or more Children | 0 (0.0%) | 0 (0.0%) |
| Total | 105 (17.6%) | 547 (45.5%) |
Income Below Poverty Among Married-Couple vs Single-Parent Households in Graves County
The poverty data for Graves County shows that 658 of the married-couple family households (8.6%) and 652 of the single-parent households (36.2%) are living below the poverty level. Within the married-couple family households, those with 5 or more children have the highest poverty rate, with 56 households (55.4%) falling below the poverty line. Among the single-parent households, those with 3 or 4 children have the highest poverty rate, with 118 household (59.0%) living below poverty.
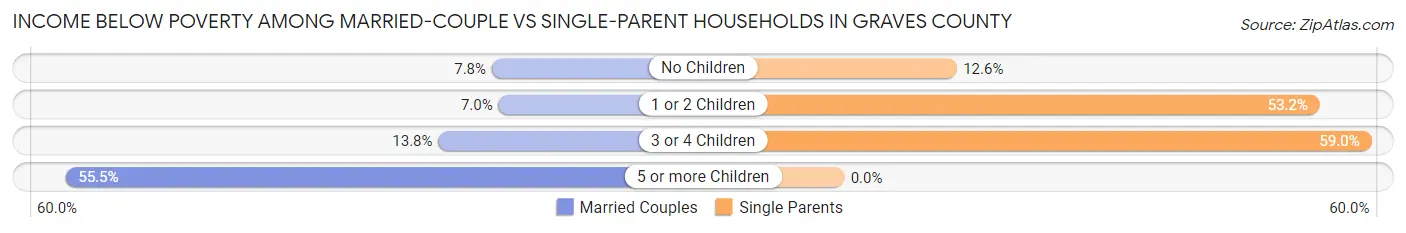
| Children | Married-Couple Families | Single-Parent Households |
| No Children | 358 (7.8%) | 95 (12.6%) |
| 1 or 2 Children | 165 (7.0%) | 439 (53.2%) |
| 3 or 4 Children | 79 (13.8%) | 118 (59.0%) |
| 5 or more Children | 56 (55.4%) | 0 (0.0%) |
| Total | 658 (8.6%) | 652 (36.2%) |
Employment Characteristics in Graves County
Employment by Class of Employer in Graves County
Among the 15,060 employed individuals in Graves County, private company employees (10,496 | 69.7%), not-for-profit organizations (1,044 | 6.9%), and local government employees (842 | 5.6%) make up the most common classes of employment.
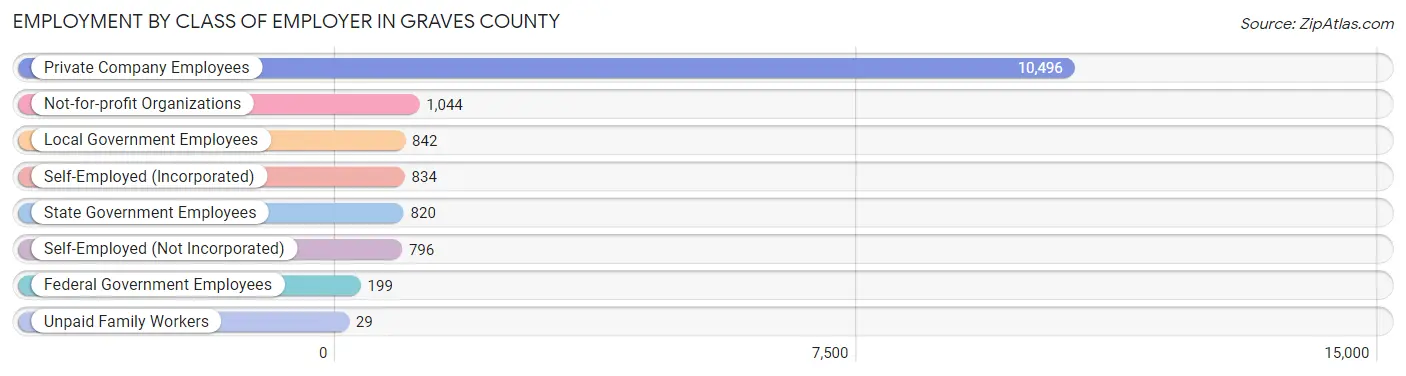
| Employer Class | # Employees | % Employees |
| Private Company Employees | 10,496 | 69.7% |
| Self-Employed (Incorporated) | 834 | 5.5% |
| Self-Employed (Not Incorporated) | 796 | 5.3% |
| Not-for-profit Organizations | 1,044 | 6.9% |
| Local Government Employees | 842 | 5.6% |
| State Government Employees | 820 | 5.4% |
| Federal Government Employees | 199 | 1.3% |
| Unpaid Family Workers | 29 | 0.2% |
| Total | 15,060 | 100.0% |
Employment Status by Age in Graves County
According to the labor force statistics for Graves County, out of the total population over 16 years of age (28,886), 55.2% or 15,945 individuals are in the labor force, with 3.7% or 590 of them unemployed. The age group with the highest labor force participation rate is 30 to 34 years, with 83.0% or 1,876 individuals in the labor force. Within the labor force, the 75 years and over age range has the highest percentage of unemployed individuals, with 11.0% or 18 of them being unemployed.
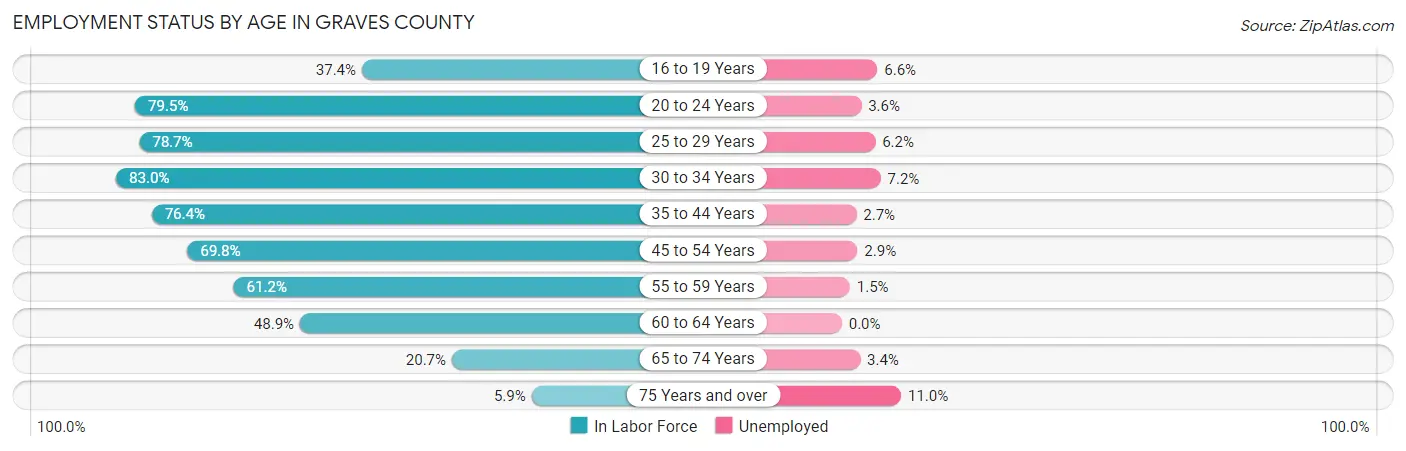
| Age Bracket | In Labor Force | Unemployed |
| 16 to 19 Years | 761 (37.4%) | 50 (6.6%) |
| 20 to 24 Years | 1,550 (79.5%) | 56 (3.6%) |
| 25 to 29 Years | 1,641 (78.7%) | 102 (6.2%) |
| 30 to 34 Years | 1,876 (83.0%) | 135 (7.2%) |
| 35 to 44 Years | 3,162 (76.4%) | 85 (2.7%) |
| 45 to 54 Years | 3,121 (69.8%) | 91 (2.9%) |
| 55 to 59 Years | 1,560 (61.2%) | 23 (1.5%) |
| 60 to 64 Years | 1,308 (48.9%) | 0 (0.0%) |
| 65 to 74 Years | 815 (20.7%) | 28 (3.4%) |
| 75 Years and over | 164 (5.9%) | 18 (11.0%) |
| Total | 15,945 (55.2%) | 590 (3.7%) |
Employment Status by Educational Attainment in Graves County
According to labor force statistics for Graves County, 69.7% of individuals (12,671) out of the total population between 25 and 64 years of age (18,179) are in the labor force, with 3.4% or 431 of them being unemployed. The group with the highest labor force participation rate are those with the educational attainment of bachelor's degree or higher, with 85.0% or 3,067 individuals in the labor force. Within the labor force, individuals with less than high school education have the highest percentage of unemployment, with 17.3% or 116 of them being unemployed.
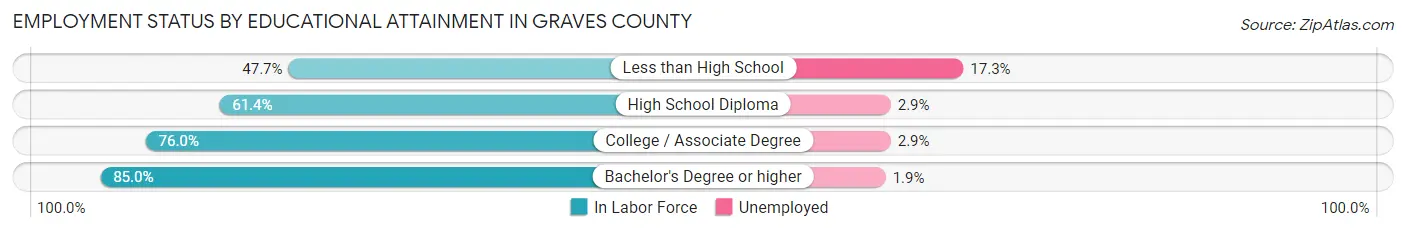
| Educational Attainment | In Labor Force | Unemployed |
| Less than High School | 669 (47.7%) | 243 (17.3%) |
| High School Diploma | 4,505 (61.4%) | 213 (2.9%) |
| College / Associate Degree | 4,432 (76.0%) | 169 (2.9%) |
| Bachelor's Degree or higher | 3,067 (85.0%) | 69 (1.9%) |
| Total | 12,671 (69.7%) | 618 (3.4%) |
Employment Occupations by Sex in Graves County
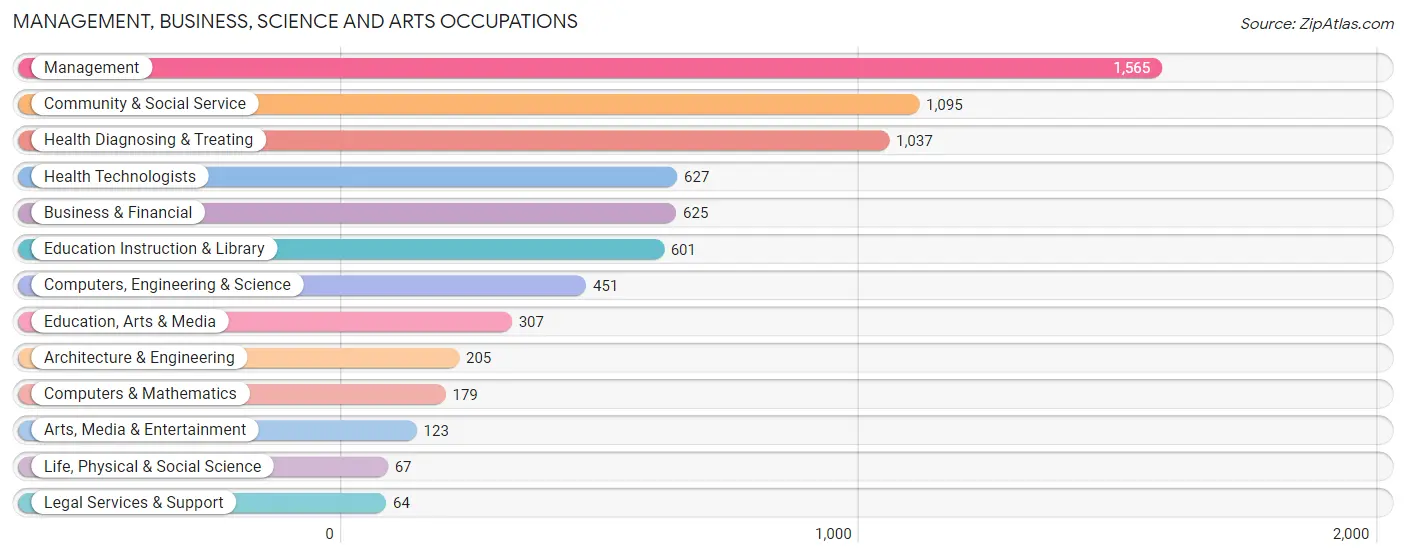
Management, Business, Science and Arts Occupations
The most common Management, Business, Science and Arts occupations in Graves County are Management (1,565 | 10.2%), Community & Social Service (1,095 | 7.1%), Health Diagnosing & Treating (1,037 | 6.8%), Health Technologists (627 | 4.1%), and Business & Financial (625 | 4.1%).
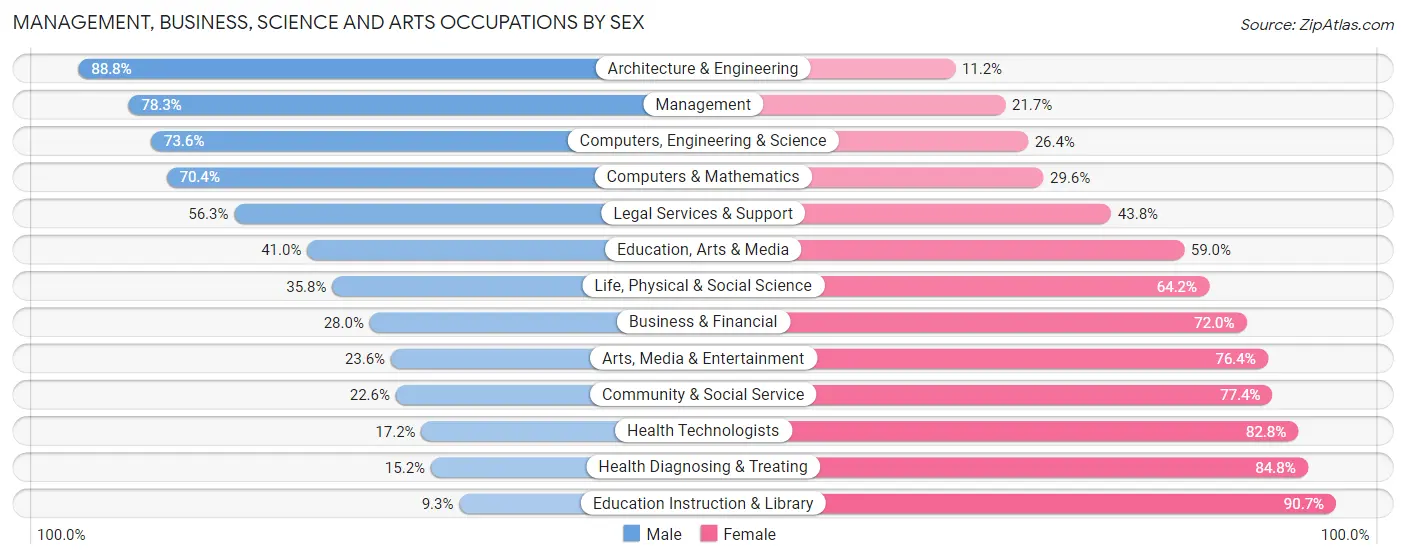
Management, Business, Science and Arts Occupations by Sex
Within the Management, Business, Science and Arts occupations in Graves County, the most male-oriented occupations are Architecture & Engineering (88.8%), Management (78.3%), and Computers, Engineering & Science (73.6%), while the most female-oriented occupations are Education Instruction & Library (90.7%), Health Diagnosing & Treating (84.8%), and Health Technologists (82.8%).
| Occupation | Male | Female |
| Management | 1,226 (78.3%) | 339 (21.7%) |
| Business & Financial | 175 (28.0%) | 450 (72.0%) |
| Computers, Engineering & Science | 332 (73.6%) | 119 (26.4%) |
| Computers & Mathematics | 126 (70.4%) | 53 (29.6%) |
| Architecture & Engineering | 182 (88.8%) | 23 (11.2%) |
| Life, Physical & Social Science | 24 (35.8%) | 43 (64.2%) |
| Community & Social Service | 247 (22.6%) | 848 (77.4%) |
| Education, Arts & Media | 126 (41.0%) | 181 (59.0%) |
| Legal Services & Support | 36 (56.2%) | 28 (43.8%) |
| Education Instruction & Library | 56 (9.3%) | 545 (90.7%) |
| Arts, Media & Entertainment | 29 (23.6%) | 94 (76.4%) |
| Health Diagnosing & Treating | 158 (15.2%) | 879 (84.8%) |
| Health Technologists | 108 (17.2%) | 519 (82.8%) |
| Total (Category) | 2,138 (44.8%) | 2,635 (55.2%) |
| Total (Overall) | 8,338 (54.2%) | 7,033 (45.8%) |
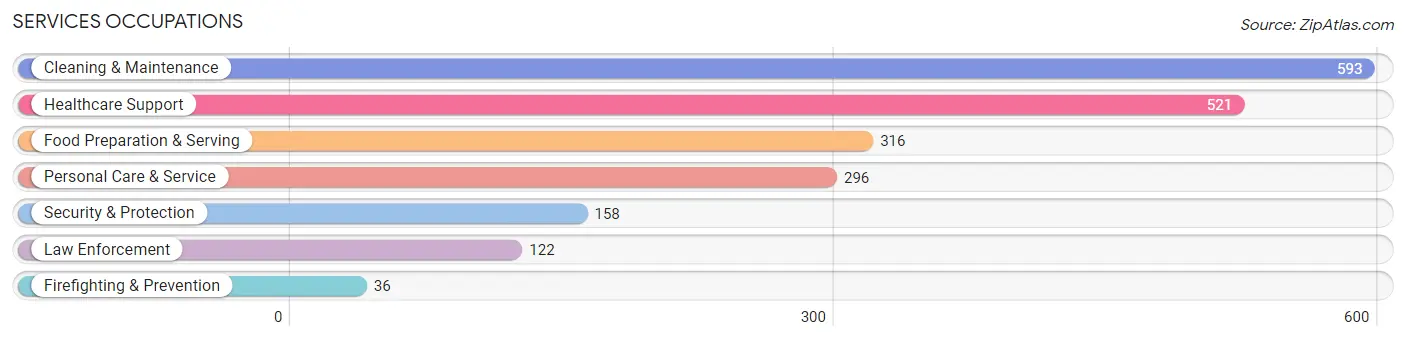
Services Occupations
The most common Services occupations in Graves County are Cleaning & Maintenance (593 | 3.9%), Healthcare Support (521 | 3.4%), Food Preparation & Serving (316 | 2.1%), Personal Care & Service (296 | 1.9%), and Security & Protection (158 | 1.0%).
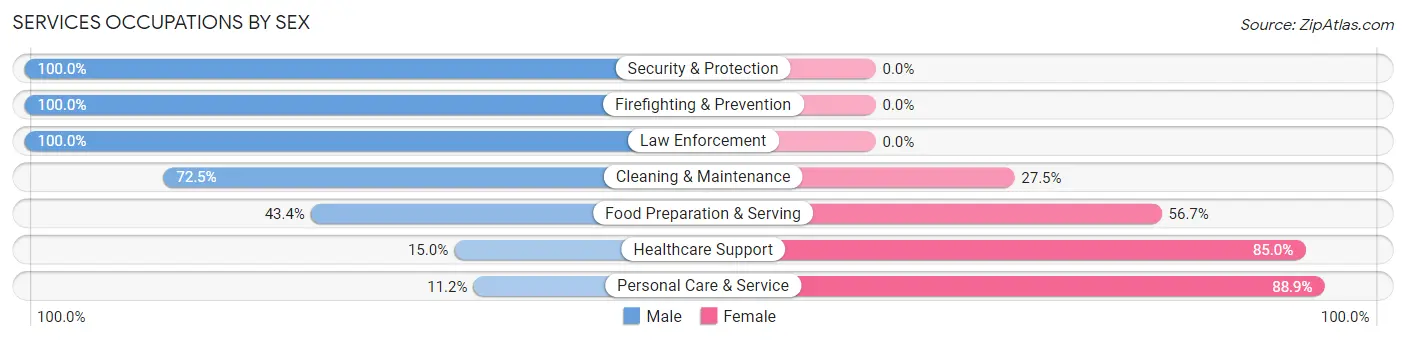
Services Occupations by Sex
Within the Services occupations in Graves County, the most male-oriented occupations are Security & Protection (100.0%), Firefighting & Prevention (100.0%), and Law Enforcement (100.0%), while the most female-oriented occupations are Personal Care & Service (88.8%), Healthcare Support (85.0%), and Food Preparation & Serving (56.7%).
| Occupation | Male | Female |
| Healthcare Support | 78 (15.0%) | 443 (85.0%) |
| Security & Protection | 158 (100.0%) | 0 (0.0%) |
| Firefighting & Prevention | 36 (100.0%) | 0 (0.0%) |
| Law Enforcement | 122 (100.0%) | 0 (0.0%) |
| Food Preparation & Serving | 137 (43.3%) | 179 (56.7%) |
| Cleaning & Maintenance | 430 (72.5%) | 163 (27.5%) |
| Personal Care & Service | 33 (11.2%) | 263 (88.8%) |
| Total (Category) | 836 (44.4%) | 1,048 (55.6%) |
| Total (Overall) | 8,338 (54.2%) | 7,033 (45.8%) |
Sales and Office Occupations
The most common Sales and Office occupations in Graves County are Office & Administration (1,731 | 11.3%), and Sales & Related (1,314 | 8.6%).
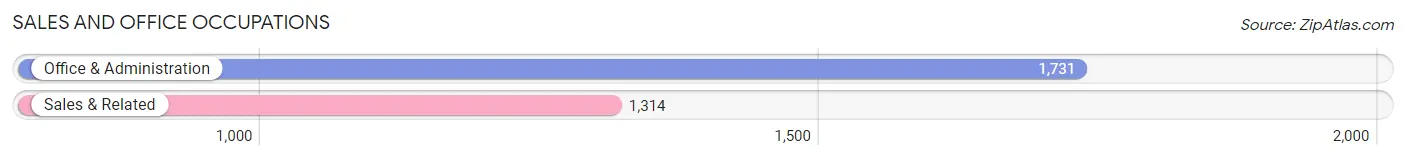
Sales and Office Occupations by Sex

| Occupation | Male | Female |
| Sales & Related | 644 (49.0%) | 670 (51.0%) |
| Office & Administration | 208 (12.0%) | 1,523 (88.0%) |
| Total (Category) | 852 (28.0%) | 2,193 (72.0%) |
| Total (Overall) | 8,338 (54.2%) | 7,033 (45.8%) |
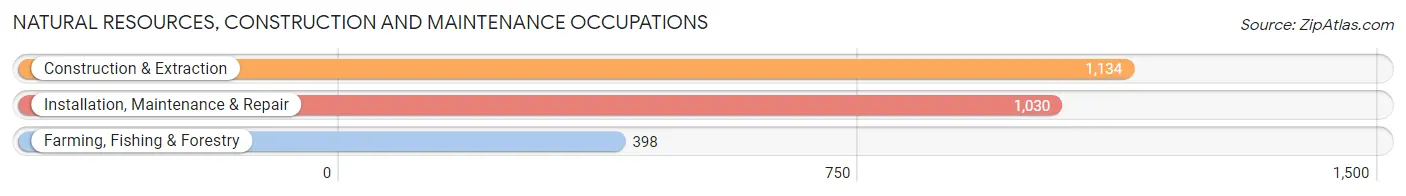
Natural Resources, Construction and Maintenance Occupations
The most common Natural Resources, Construction and Maintenance occupations in Graves County are Construction & Extraction (1,134 | 7.4%), Installation, Maintenance & Repair (1,030 | 6.7%), and Farming, Fishing & Forestry (398 | 2.6%).
Natural Resources, Construction and Maintenance Occupations by Sex
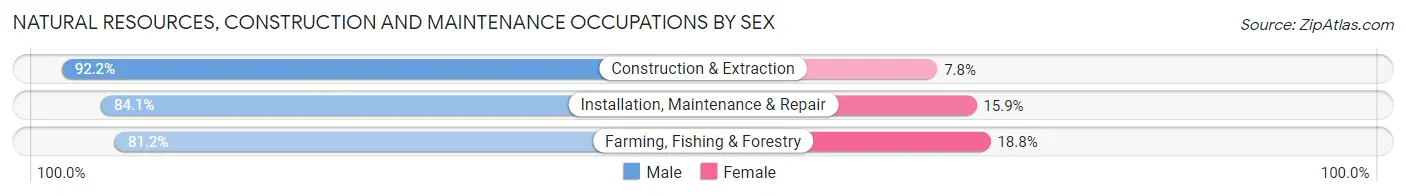
| Occupation | Male | Female |
| Farming, Fishing & Forestry | 323 (81.2%) | 75 (18.8%) |
| Construction & Extraction | 1,046 (92.2%) | 88 (7.8%) |
| Installation, Maintenance & Repair | 866 (84.1%) | 164 (15.9%) |
| Total (Category) | 2,235 (87.2%) | 327 (12.8%) |
| Total (Overall) | 8,338 (54.2%) | 7,033 (45.8%) |
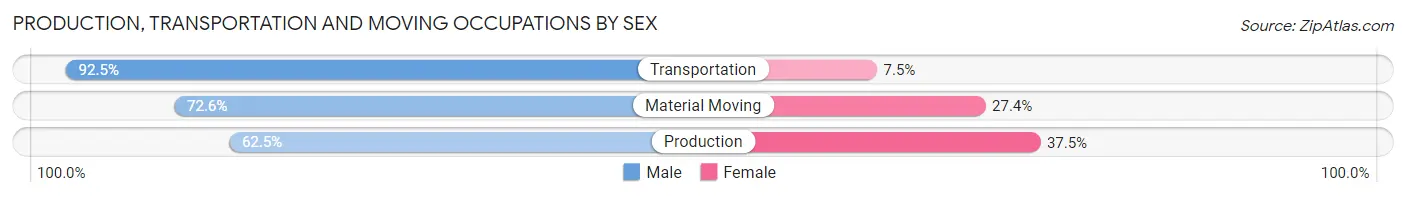
Production, Transportation and Moving Occupations
The most common Production, Transportation and Moving occupations in Graves County are Production (1,560 | 10.2%), Transportation (902 | 5.9%), and Material Moving (645 | 4.2%).
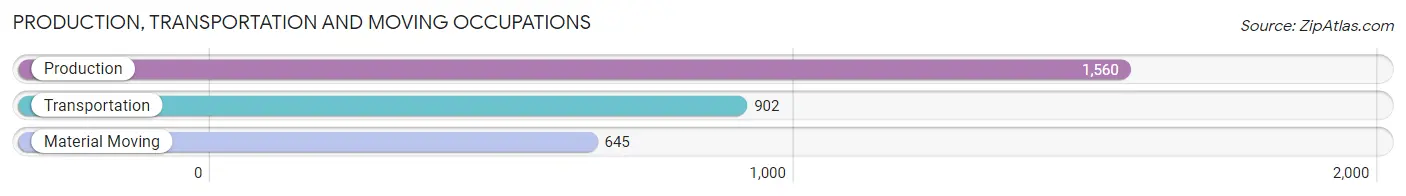
Production, Transportation and Moving Occupations by Sex
| Occupation | Male | Female |
| Production | 975 (62.5%) | 585 (37.5%) |
| Transportation | 834 (92.5%) | 68 (7.5%) |
| Material Moving | 468 (72.6%) | 177 (27.4%) |
| Total (Category) | 2,277 (73.3%) | 830 (26.7%) |
| Total (Overall) | 8,338 (54.2%) | 7,033 (45.8%) |
Employment Industries by Sex in Graves County
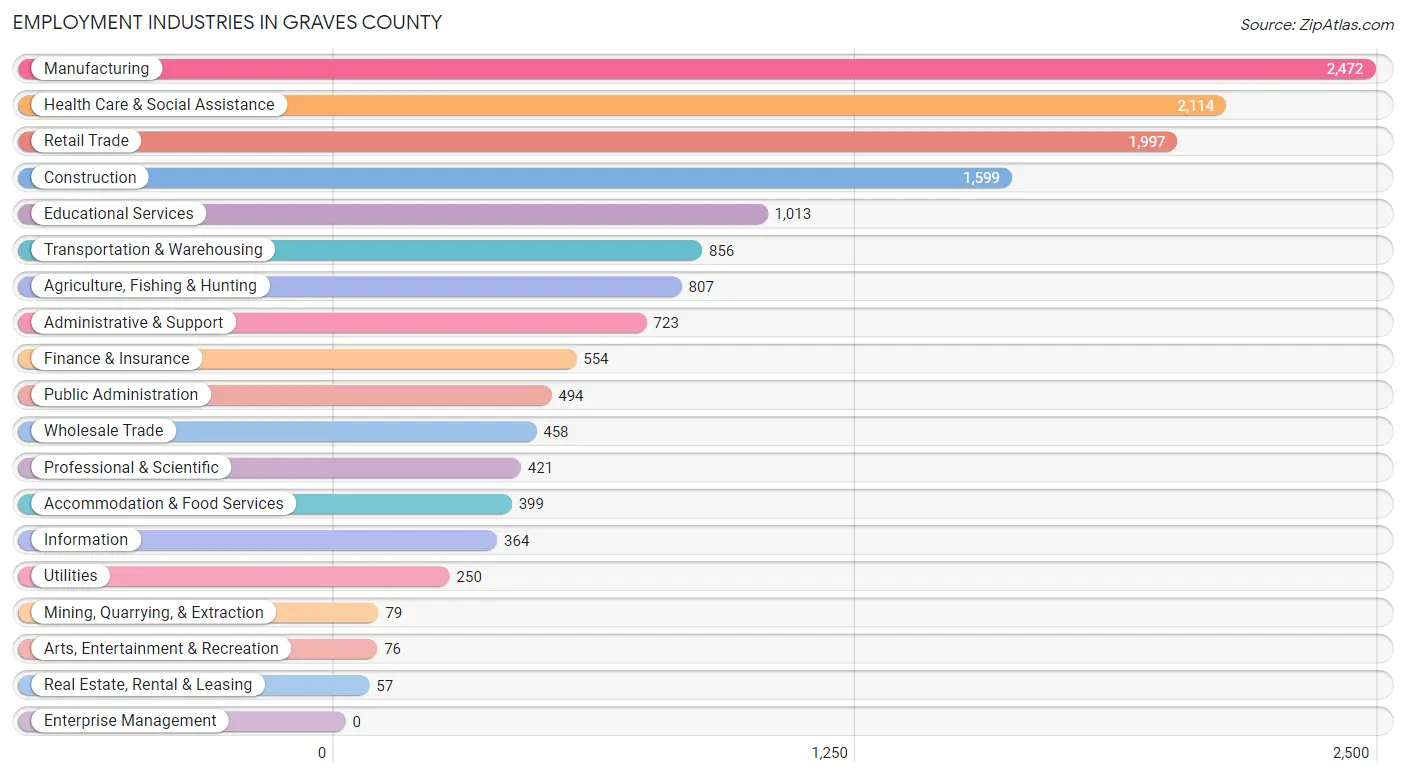
Employment Industries in Graves County
The major employment industries in Graves County include Manufacturing (2,472 | 16.1%), Health Care & Social Assistance (2,114 | 13.8%), Retail Trade (1,997 | 13.0%), Construction (1,599 | 10.4%), and Educational Services (1,013 | 6.6%).
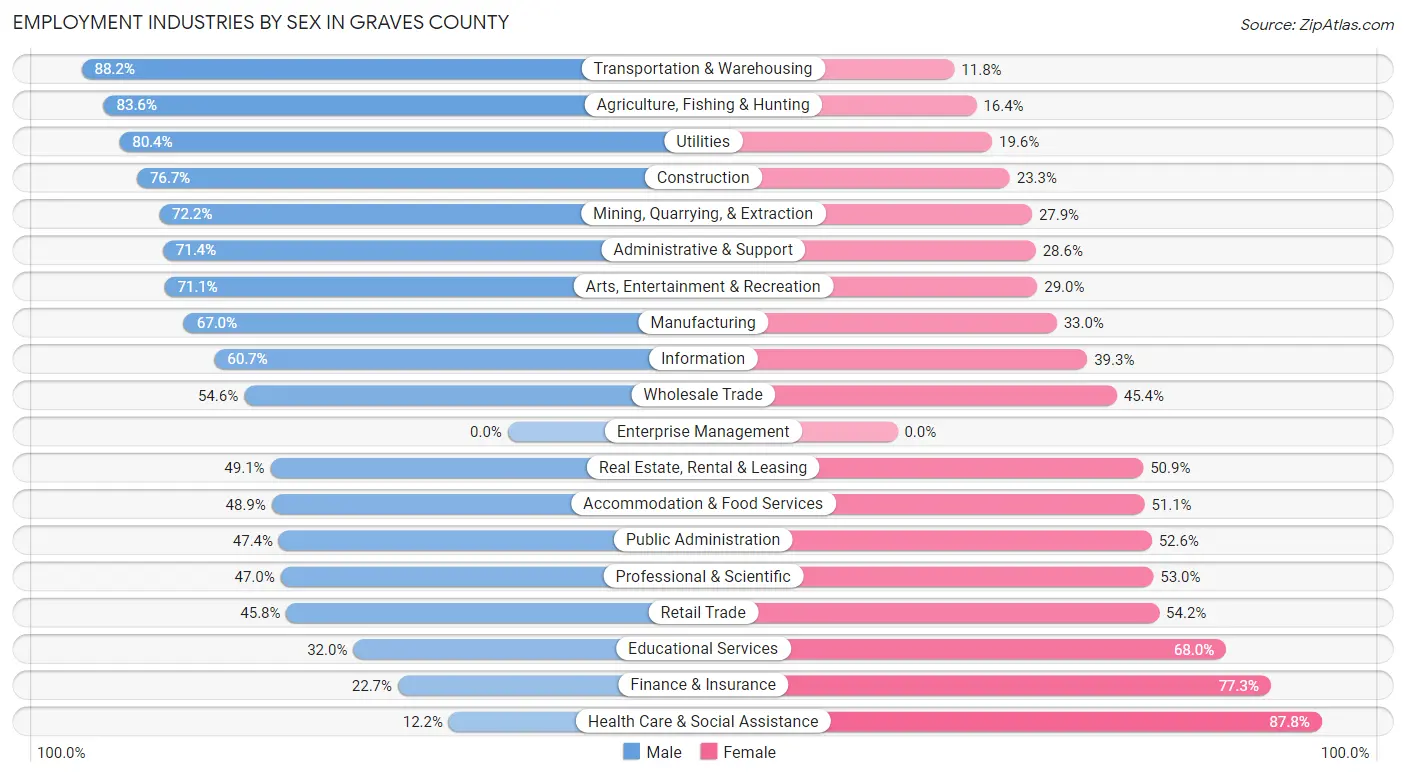
Employment Industries by Sex in Graves County
The Graves County industries that see more men than women are Transportation & Warehousing (88.2%), Agriculture, Fishing & Hunting (83.6%), and Utilities (80.4%), whereas the industries that tend to have a higher number of women are Health Care & Social Assistance (87.8%), Finance & Insurance (77.3%), and Educational Services (68.0%).
| Industry | Male | Female |
| Agriculture, Fishing & Hunting | 675 (83.6%) | 132 (16.4%) |
| Mining, Quarrying, & Extraction | 57 (72.2%) | 22 (27.9%) |
| Construction | 1,227 (76.7%) | 372 (23.3%) |
| Manufacturing | 1,657 (67.0%) | 815 (33.0%) |
| Wholesale Trade | 250 (54.6%) | 208 (45.4%) |
| Retail Trade | 915 (45.8%) | 1,082 (54.2%) |
| Transportation & Warehousing | 755 (88.2%) | 101 (11.8%) |
| Utilities | 201 (80.4%) | 49 (19.6%) |
| Information | 221 (60.7%) | 143 (39.3%) |
| Finance & Insurance | 126 (22.7%) | 428 (77.3%) |
| Real Estate, Rental & Leasing | 28 (49.1%) | 29 (50.9%) |
| Professional & Scientific | 198 (47.0%) | 223 (53.0%) |
| Enterprise Management | 0 (0.0%) | 0 (0.0%) |
| Administrative & Support | 516 (71.4%) | 207 (28.6%) |
| Educational Services | 324 (32.0%) | 689 (68.0%) |
| Health Care & Social Assistance | 258 (12.2%) | 1,856 (87.8%) |
| Arts, Entertainment & Recreation | 54 (71.1%) | 22 (28.9%) |
| Accommodation & Food Services | 195 (48.9%) | 204 (51.1%) |
| Public Administration | 234 (47.4%) | 260 (52.6%) |
| Total | 8,338 (54.2%) | 7,033 (45.8%) |
Education in Graves County
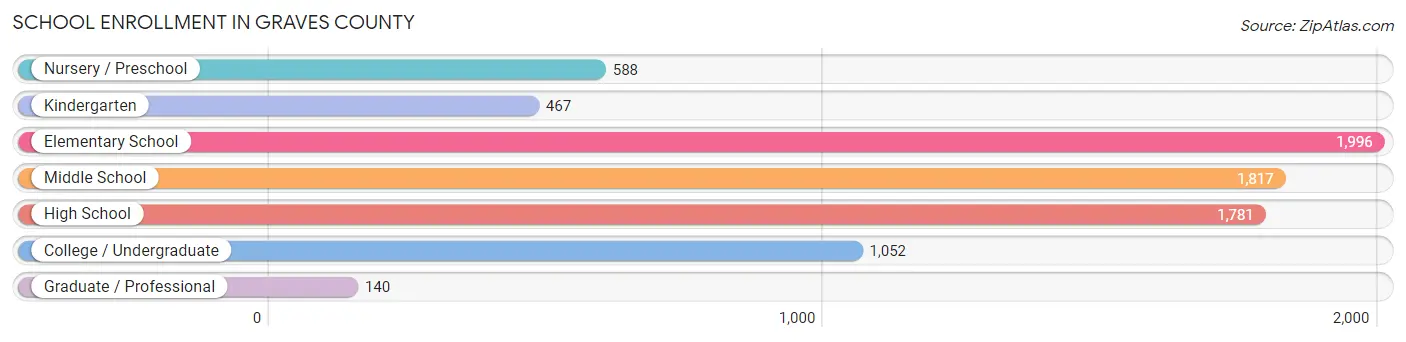
School Enrollment in Graves County
The most common levels of schooling among the 7,841 students in Graves County are elementary school (1,996 | 25.5%), middle school (1,817 | 23.2%), and high school (1,781 | 22.7%).
| School Level | # Students | % Students |
| Nursery / Preschool | 588 | 7.5% |
| Kindergarten | 467 | 6.0% |
| Elementary School | 1,996 | 25.5% |
| Middle School | 1,817 | 23.2% |
| High School | 1,781 | 22.7% |
| College / Undergraduate | 1,052 | 13.4% |
| Graduate / Professional | 140 | 1.8% |
| Total | 7,841 | 100.0% |
School Enrollment by Age by Funding Source in Graves County
Out of a total of 7,841 students who are enrolled in schools in Graves County, 518 (6.6%) attend a private institution, while the remaining 7,323 (93.4%) are enrolled in public schools. The age group of 3 to 4 year olds has the highest likelihood of being enrolled in private schools, with 105 (25.7% in the age bracket) enrolled. Conversely, the age group of 5 to 9 year old has the lowest likelihood of being enrolled in a private school, with 2,283 (98.2% in the age bracket) attending a public institution.
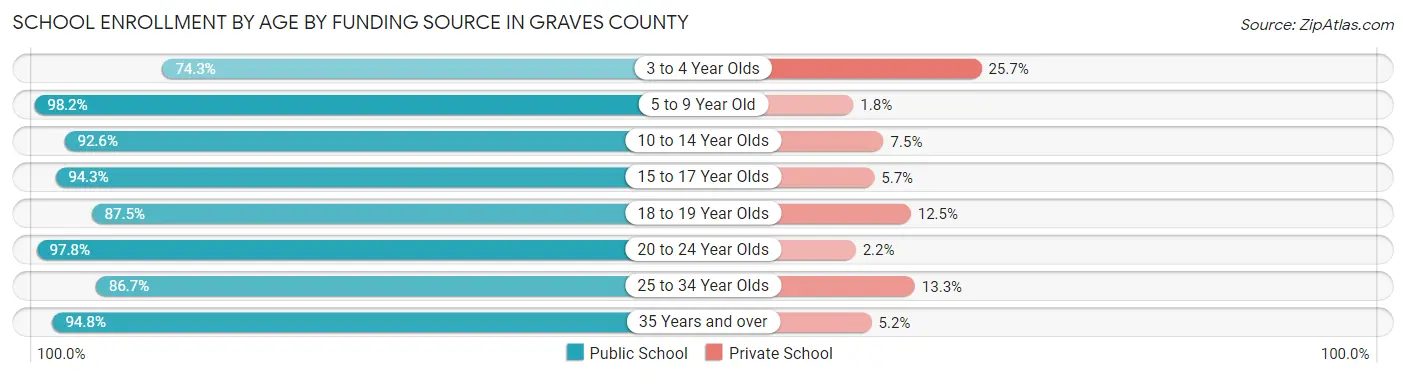
| Age Bracket | Public School | Private School |
| 3 to 4 Year Olds | 304 (74.3%) | 105 (25.7%) |
| 5 to 9 Year Old | 2,283 (98.2%) | 42 (1.8%) |
| 10 to 14 Year Olds | 2,074 (92.5%) | 167 (7.4%) |
| 15 to 17 Year Olds | 1,303 (94.3%) | 79 (5.7%) |
| 18 to 19 Year Olds | 504 (87.5%) | 72 (12.5%) |
| 20 to 24 Year Olds | 437 (97.8%) | 10 (2.2%) |
| 25 to 34 Year Olds | 183 (86.7%) | 28 (13.3%) |
| 35 Years and over | 237 (94.8%) | 13 (5.2%) |
| Total | 7,323 (93.4%) | 518 (6.6%) |
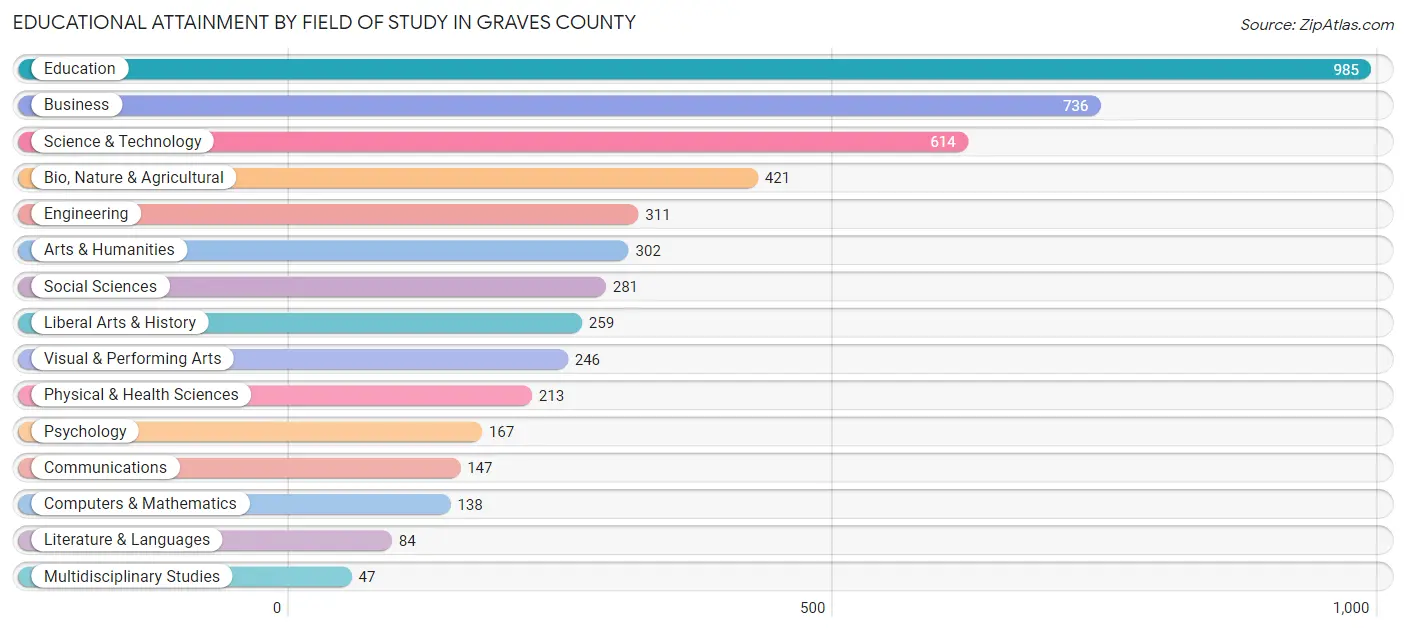
Educational Attainment by Field of Study in Graves County
Education (985 | 19.9%), business (736 | 14.9%), science & technology (614 | 12.4%), bio, nature & agricultural (421 | 8.5%), and engineering (311 | 6.3%) are the most common fields of study among 4,951 individuals in Graves County who have obtained a bachelor's degree or higher.
| Field of Study | # Graduates | % Graduates |
| Computers & Mathematics | 138 | 2.8% |
| Bio, Nature & Agricultural | 421 | 8.5% |
| Physical & Health Sciences | 213 | 4.3% |
| Psychology | 167 | 3.4% |
| Social Sciences | 281 | 5.7% |
| Engineering | 311 | 6.3% |
| Multidisciplinary Studies | 47 | 0.9% |
| Science & Technology | 614 | 12.4% |
| Business | 736 | 14.9% |
| Education | 985 | 19.9% |
| Literature & Languages | 84 | 1.7% |
| Liberal Arts & History | 259 | 5.2% |
| Visual & Performing Arts | 246 | 5.0% |
| Communications | 147 | 3.0% |
| Arts & Humanities | 302 | 6.1% |
| Total | 4,951 | 100.0% |
Transportation & Commute in Graves County
Vehicle Availability by Sex in Graves County
The most prevalent vehicle ownership categories in Graves County are males with 2 vehicles (3,423, accounting for 42.4%) and females with 2 vehicles (3,032, making up 49.5%).
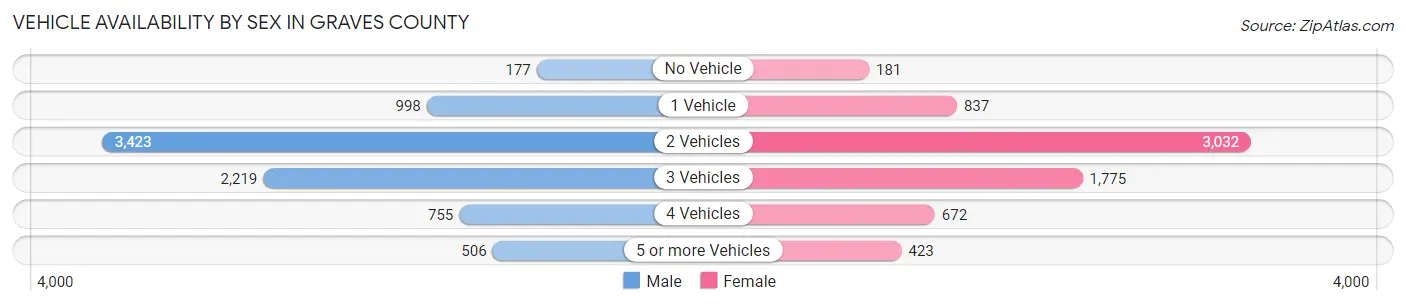
| Vehicles Available | Male | Female |
| No Vehicle | 177 (2.2%) | 181 (2.6%) |
| 1 Vehicle | 998 (12.3%) | 837 (12.1%) |
| 2 Vehicles | 3,423 (42.4%) | 3,032 (43.8%) |
| 3 Vehicles | 2,219 (27.5%) | 1,775 (25.7%) |
| 4 Vehicles | 755 (9.3%) | 672 (9.7%) |
| 5 or more Vehicles | 506 (6.3%) | 423 (6.1%) |
| Total | 8,078 (100.0%) | 6,920 (100.0%) |
Commute Time in Graves County
The most frequently occuring commute durations in Graves County are 10 to 14 minutes (2,337 commuters, 16.6%), 15 to 19 minutes (2,199 commuters, 15.7%), and 5 to 9 minutes (2,159 commuters, 15.4%).
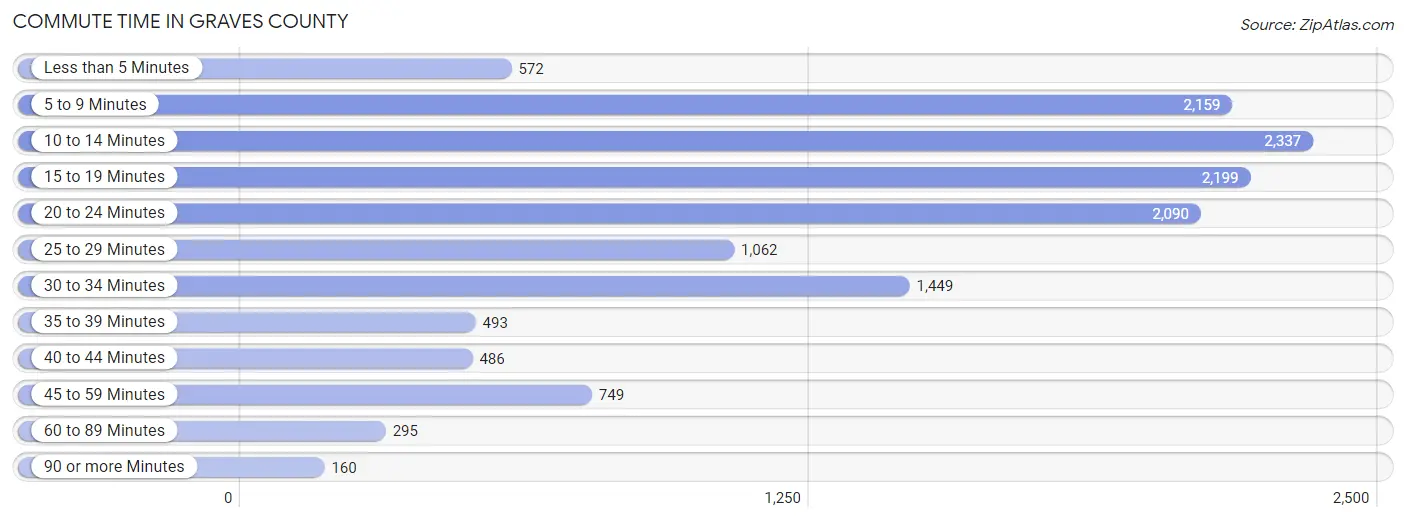
| Commute Time | # Commuters | % Commuters |
| Less than 5 Minutes | 572 | 4.1% |
| 5 to 9 Minutes | 2,159 | 15.4% |
| 10 to 14 Minutes | 2,337 | 16.6% |
| 15 to 19 Minutes | 2,199 | 15.7% |
| 20 to 24 Minutes | 2,090 | 14.9% |
| 25 to 29 Minutes | 1,062 | 7.6% |
| 30 to 34 Minutes | 1,449 | 10.3% |
| 35 to 39 Minutes | 493 | 3.5% |
| 40 to 44 Minutes | 486 | 3.5% |
| 45 to 59 Minutes | 749 | 5.3% |
| 60 to 89 Minutes | 295 | 2.1% |
| 90 or more Minutes | 160 | 1.1% |
Commute Time by Sex in Graves County
The most common commute times in Graves County are 5 to 9 minutes (1,334 commuters, 17.3%) for males and 15 to 19 minutes (1,189 commuters, 18.7%) for females.
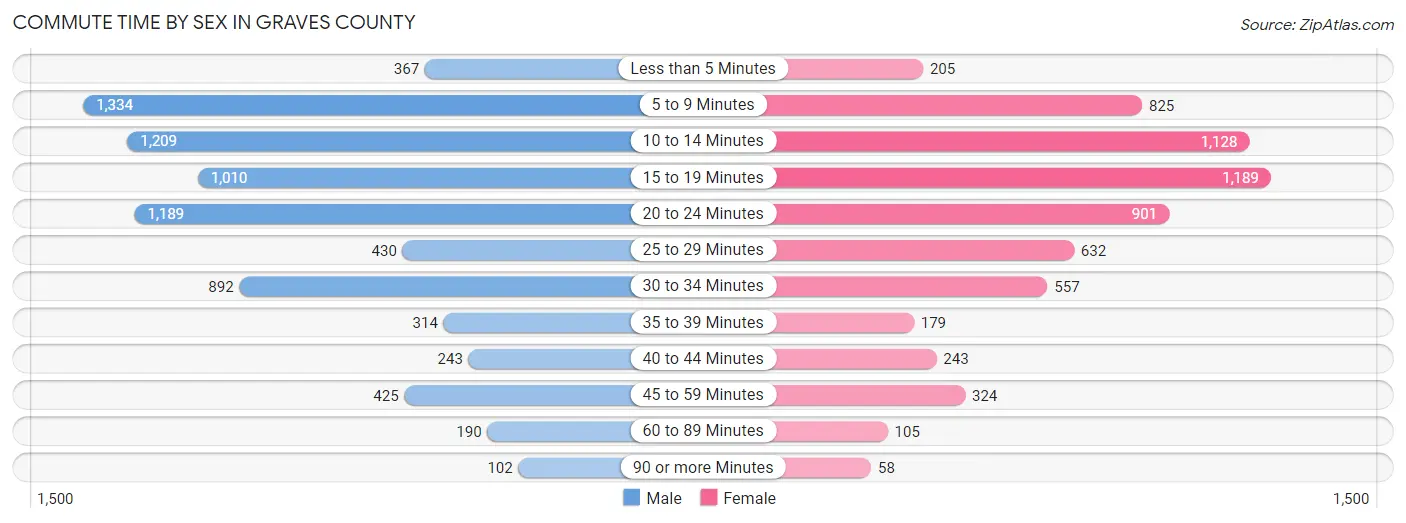
| Commute Time | Male | Female |
| Less than 5 Minutes | 367 (4.8%) | 205 (3.2%) |
| 5 to 9 Minutes | 1,334 (17.3%) | 825 (13.0%) |
| 10 to 14 Minutes | 1,209 (15.7%) | 1,128 (17.8%) |
| 15 to 19 Minutes | 1,010 (13.1%) | 1,189 (18.7%) |
| 20 to 24 Minutes | 1,189 (15.4%) | 901 (14.2%) |
| 25 to 29 Minutes | 430 (5.6%) | 632 (10.0%) |
| 30 to 34 Minutes | 892 (11.6%) | 557 (8.8%) |
| 35 to 39 Minutes | 314 (4.1%) | 179 (2.8%) |
| 40 to 44 Minutes | 243 (3.2%) | 243 (3.8%) |
| 45 to 59 Minutes | 425 (5.5%) | 324 (5.1%) |
| 60 to 89 Minutes | 190 (2.5%) | 105 (1.7%) |
| 90 or more Minutes | 102 (1.3%) | 58 (0.9%) |
Time of Departure to Work by Sex in Graves County
The most frequent times of departure to work in Graves County are 7:00 AM to 7:29 AM (2,176, 28.2%) for males and 7:00 AM to 7:29 AM (1,105, 17.4%) for females.
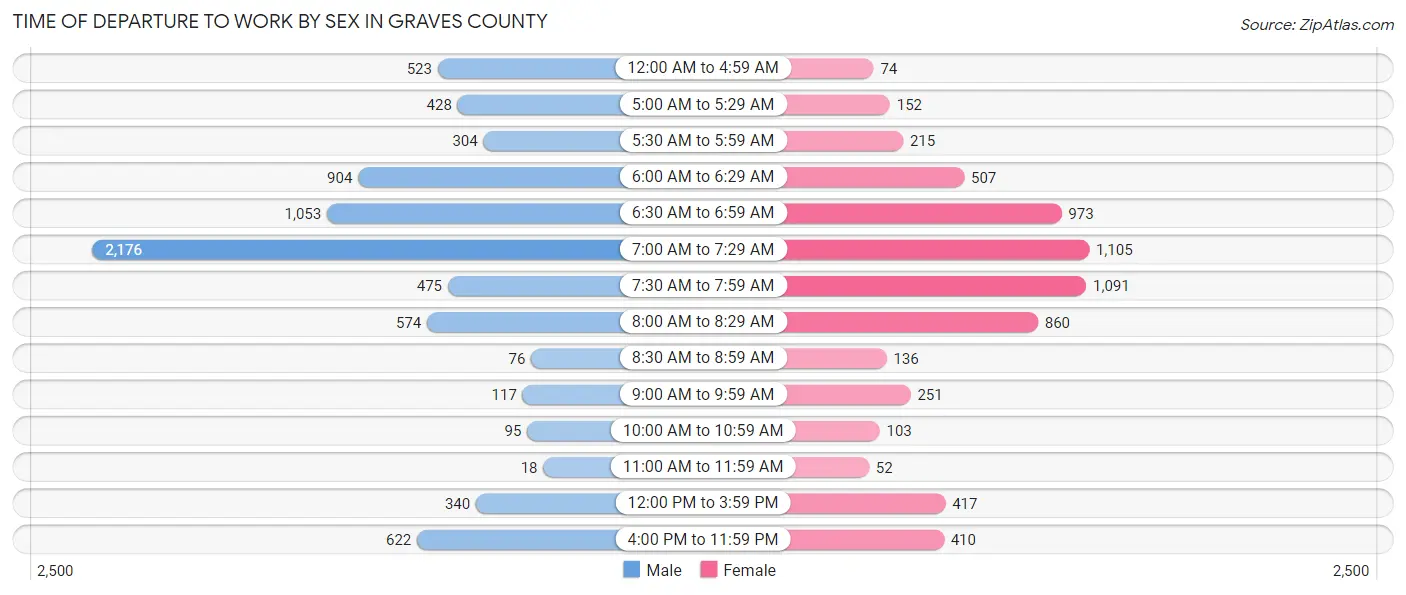
| Time of Departure | Male | Female |
| 12:00 AM to 4:59 AM | 523 (6.8%) | 74 (1.2%) |
| 5:00 AM to 5:29 AM | 428 (5.6%) | 152 (2.4%) |
| 5:30 AM to 5:59 AM | 304 (4.0%) | 215 (3.4%) |
| 6:00 AM to 6:29 AM | 904 (11.7%) | 507 (8.0%) |
| 6:30 AM to 6:59 AM | 1,053 (13.7%) | 973 (15.3%) |
| 7:00 AM to 7:29 AM | 2,176 (28.2%) | 1,105 (17.4%) |
| 7:30 AM to 7:59 AM | 475 (6.2%) | 1,091 (17.2%) |
| 8:00 AM to 8:29 AM | 574 (7.4%) | 860 (13.6%) |
| 8:30 AM to 8:59 AM | 76 (1.0%) | 136 (2.1%) |
| 9:00 AM to 9:59 AM | 117 (1.5%) | 251 (4.0%) |
| 10:00 AM to 10:59 AM | 95 (1.2%) | 103 (1.6%) |
| 11:00 AM to 11:59 AM | 18 (0.2%) | 52 (0.8%) |
| 12:00 PM to 3:59 PM | 340 (4.4%) | 417 (6.6%) |
| 4:00 PM to 11:59 PM | 622 (8.1%) | 410 (6.5%) |
| Total | 7,705 (100.0%) | 6,346 (100.0%) |
Housing Occupancy in Graves County
Occupancy by Ownership in Graves County
Of the total 14,304 dwellings in Graves County, owner-occupied units account for 10,699 (74.8%), while renter-occupied units make up 3,605 (25.2%).
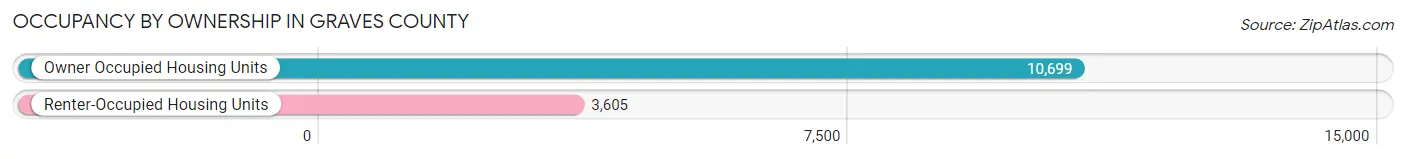
| Occupancy | # Housing Units | % Housing Units |
| Owner Occupied Housing Units | 10,699 | 74.8% |
| Renter-Occupied Housing Units | 3,605 | 25.2% |
| Total Occupied Housing Units | 14,304 | 100.0% |
Occupancy by Household Size in Graves County
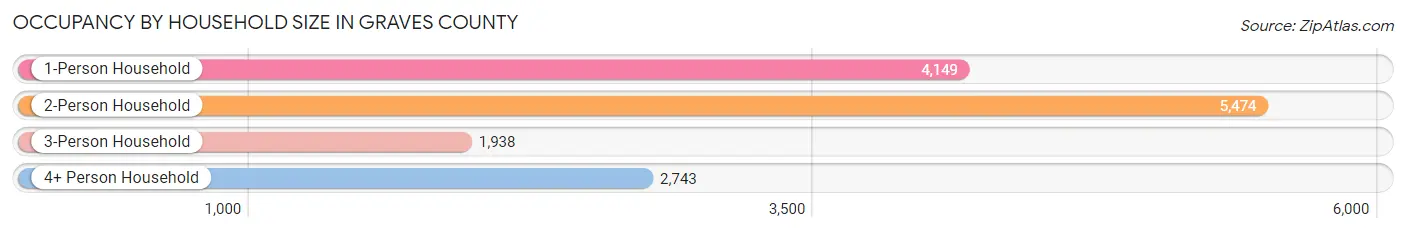
| Household Size | # Housing Units | % Housing Units |
| 1-Person Household | 4,149 | 29.0% |
| 2-Person Household | 5,474 | 38.3% |
| 3-Person Household | 1,938 | 13.6% |
| 4+ Person Household | 2,743 | 19.2% |
| Total Housing Units | 14,304 | 100.0% |
Occupancy by Ownership by Household Size in Graves County
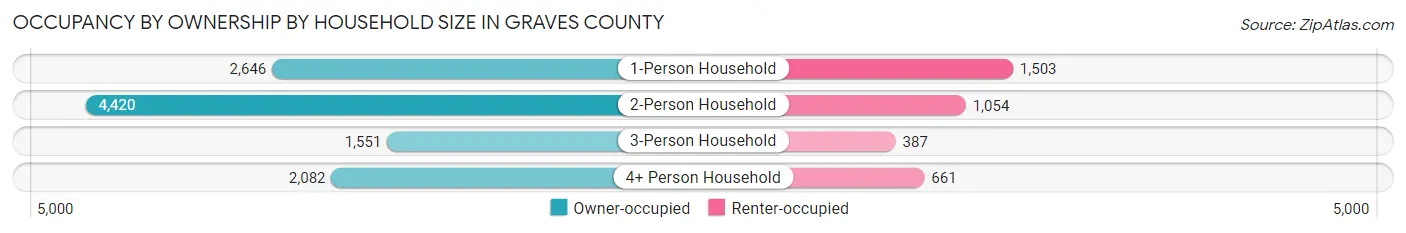
| Household Size | Owner-occupied | Renter-occupied |
| 1-Person Household | 2,646 (63.8%) | 1,503 (36.2%) |
| 2-Person Household | 4,420 (80.7%) | 1,054 (19.3%) |
| 3-Person Household | 1,551 (80.0%) | 387 (20.0%) |
| 4+ Person Household | 2,082 (75.9%) | 661 (24.1%) |
| Total Housing Units | 10,699 (74.8%) | 3,605 (25.2%) |
Occupancy by Educational Attainment in Graves County
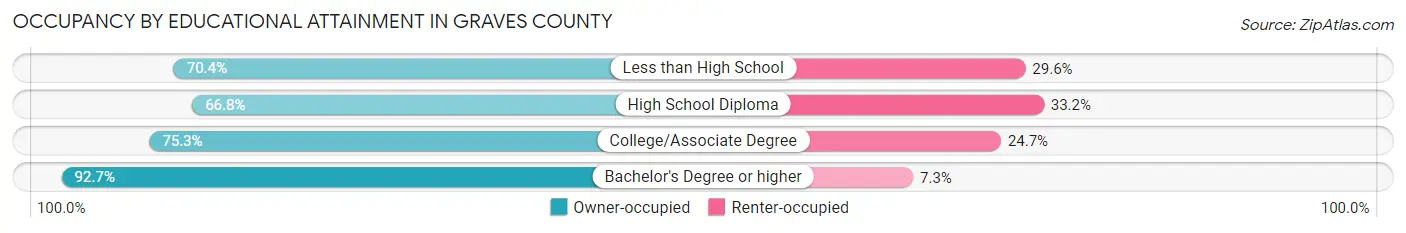
| Household Size | Owner-occupied | Renter-occupied |
| Less than High School | 978 (70.4%) | 411 (29.6%) |
| High School Diploma | 3,874 (66.8%) | 1,929 (33.2%) |
| College/Associate Degree | 3,215 (75.3%) | 1,057 (24.7%) |
| Bachelor's Degree or higher | 2,632 (92.7%) | 208 (7.3%) |
Occupancy by Age of Householder in Graves County
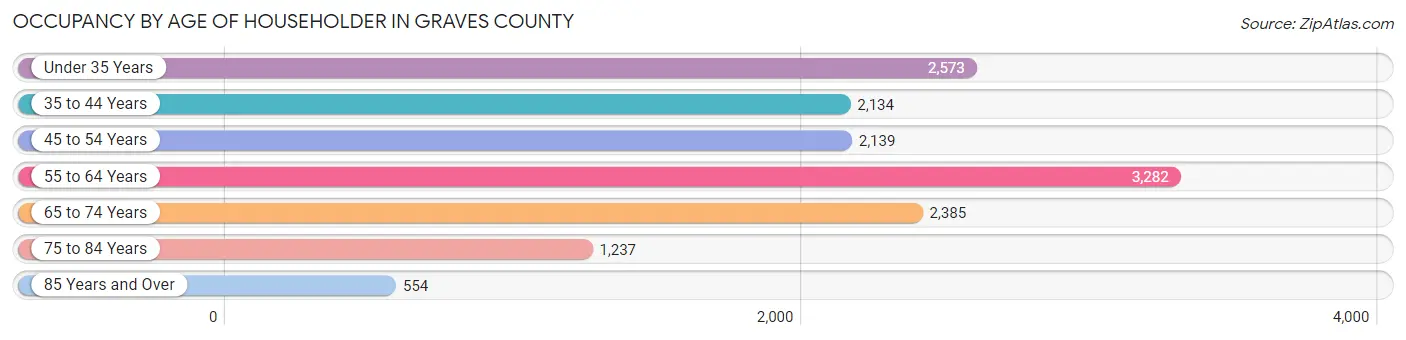
| Age Bracket | # Households | % Households |
| Under 35 Years | 2,573 | 18.0% |
| 35 to 44 Years | 2,134 | 14.9% |
| 45 to 54 Years | 2,139 | 14.9% |
| 55 to 64 Years | 3,282 | 22.9% |
| 65 to 74 Years | 2,385 | 16.7% |
| 75 to 84 Years | 1,237 | 8.6% |
| 85 Years and Over | 554 | 3.9% |
| Total | 14,304 | 100.0% |
Housing Finances in Graves County
Median Income by Occupancy in Graves County
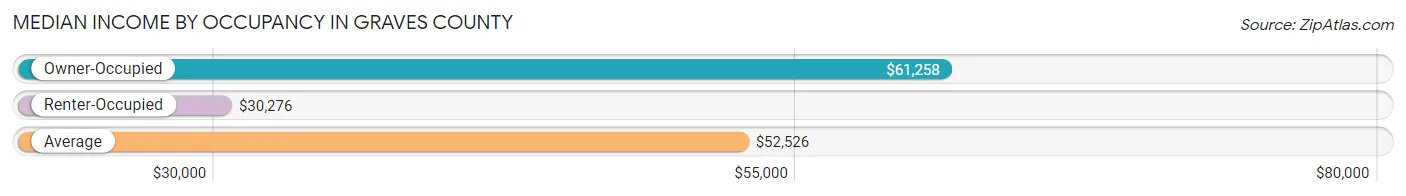
| Occupancy Type | # Households | Median Income |
| Owner-Occupied | 10,699 (74.8%) | $61,258 |
| Renter-Occupied | 3,605 (25.2%) | $30,276 |
| Average | 14,304 (100.0%) | $52,526 |
Occupancy by Householder Income Bracket in Graves County
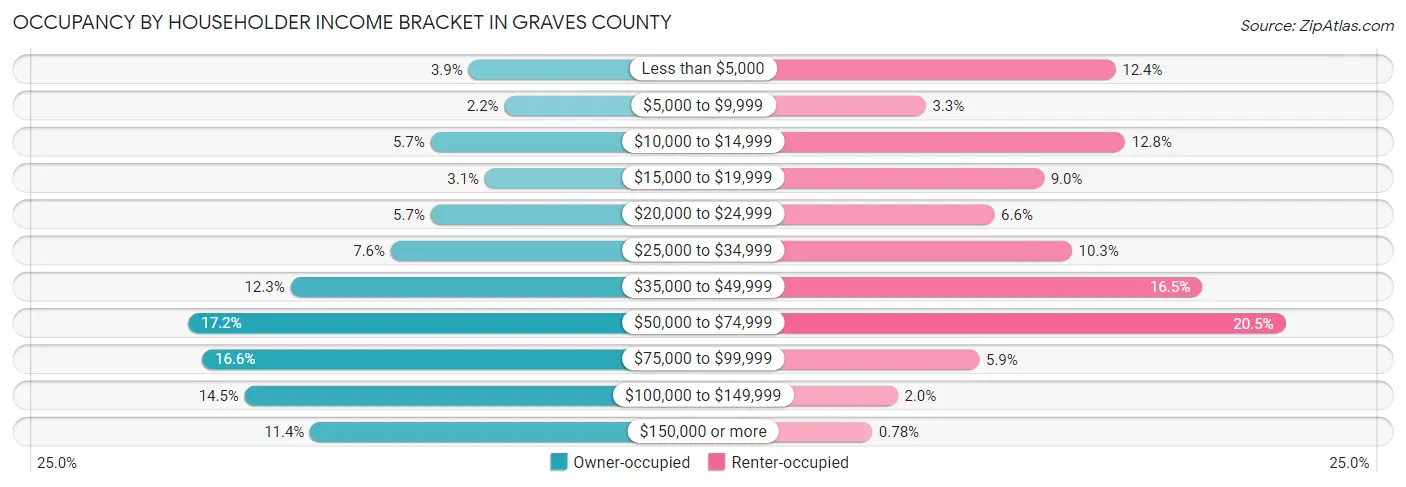
| Income Bracket | Owner-occupied | Renter-occupied |
| Less than $5,000 | 413 (3.9%) | 446 (12.4%) |
| $5,000 to $9,999 | 230 (2.1%) | 120 (3.3%) |
| $10,000 to $14,999 | 607 (5.7%) | 462 (12.8%) |
| $15,000 to $19,999 | 329 (3.1%) | 323 (9.0%) |
| $20,000 to $24,999 | 606 (5.7%) | 238 (6.6%) |
| $25,000 to $34,999 | 809 (7.6%) | 371 (10.3%) |
| $35,000 to $49,999 | 1,320 (12.3%) | 595 (16.5%) |
| $50,000 to $74,999 | 1,840 (17.2%) | 738 (20.5%) |
| $75,000 to $99,999 | 1,771 (16.6%) | 212 (5.9%) |
| $100,000 to $149,999 | 1,554 (14.5%) | 72 (2.0%) |
| $150,000 or more | 1,220 (11.4%) | 28 (0.8%) |
| Total | 10,699 (100.0%) | 3,605 (100.0%) |
Monthly Housing Cost Tiers in Graves County
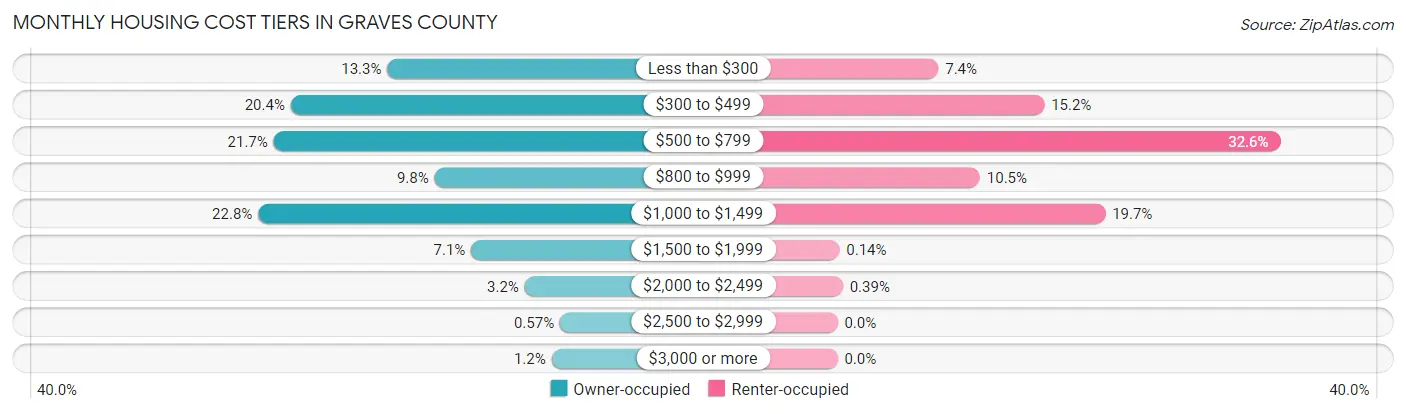
| Monthly Cost | Owner-occupied | Renter-occupied |
| Less than $300 | 1,422 (13.3%) | 268 (7.4%) |
| $300 to $499 | 2,183 (20.4%) | 549 (15.2%) |
| $500 to $799 | 2,317 (21.7%) | 1,176 (32.6%) |
| $800 to $999 | 1,050 (9.8%) | 378 (10.5%) |
| $1,000 to $1,499 | 2,439 (22.8%) | 711 (19.7%) |
| $1,500 to $1,999 | 761 (7.1%) | 5 (0.1%) |
| $2,000 to $2,499 | 339 (3.2%) | 14 (0.4%) |
| $2,500 to $2,999 | 61 (0.6%) | 0 (0.0%) |
| $3,000 or more | 127 (1.2%) | 0 (0.0%) |
| Total | 10,699 (100.0%) | 3,605 (100.0%) |
Physical Housing Characteristics in Graves County
Housing Structures in Graves County
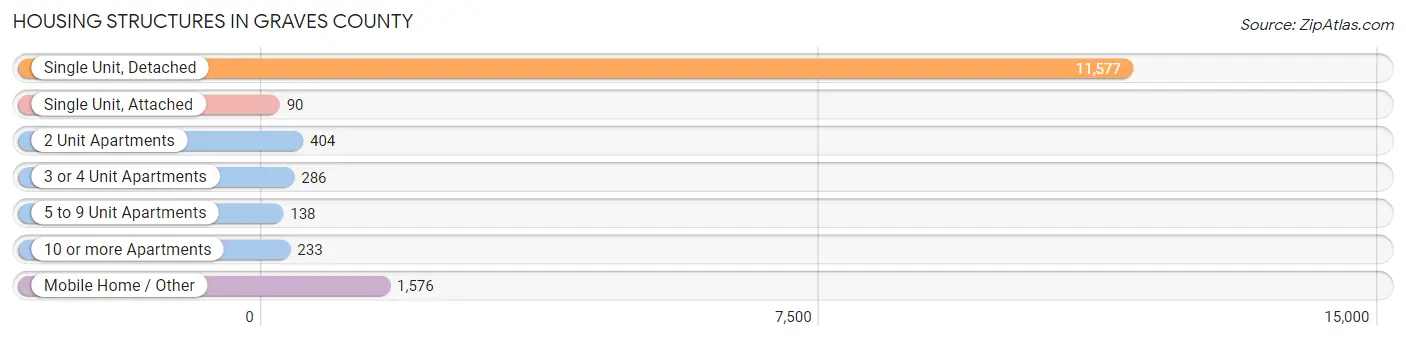
| Structure Type | # Housing Units | % Housing Units |
| Single Unit, Detached | 11,577 | 80.9% |
| Single Unit, Attached | 90 | 0.6% |
| 2 Unit Apartments | 404 | 2.8% |
| 3 or 4 Unit Apartments | 286 | 2.0% |
| 5 to 9 Unit Apartments | 138 | 1.0% |
| 10 or more Apartments | 233 | 1.6% |
| Mobile Home / Other | 1,576 | 11.0% |
| Total | 14,304 | 100.0% |
Housing Structures by Occupancy in Graves County
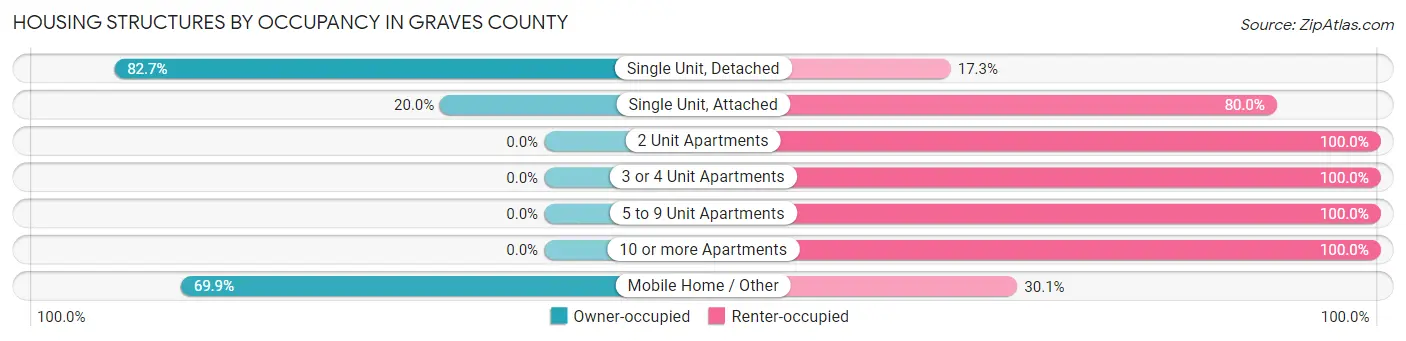
| Structure Type | Owner-occupied | Renter-occupied |
| Single Unit, Detached | 9,579 (82.7%) | 1,998 (17.3%) |
| Single Unit, Attached | 18 (20.0%) | 72 (80.0%) |
| 2 Unit Apartments | 0 (0.0%) | 404 (100.0%) |
| 3 or 4 Unit Apartments | 0 (0.0%) | 286 (100.0%) |
| 5 to 9 Unit Apartments | 0 (0.0%) | 138 (100.0%) |
| 10 or more Apartments | 0 (0.0%) | 233 (100.0%) |
| Mobile Home / Other | 1,102 (69.9%) | 474 (30.1%) |
| Total | 10,699 (74.8%) | 3,605 (25.2%) |
Housing Structures by Number of Rooms in Graves County
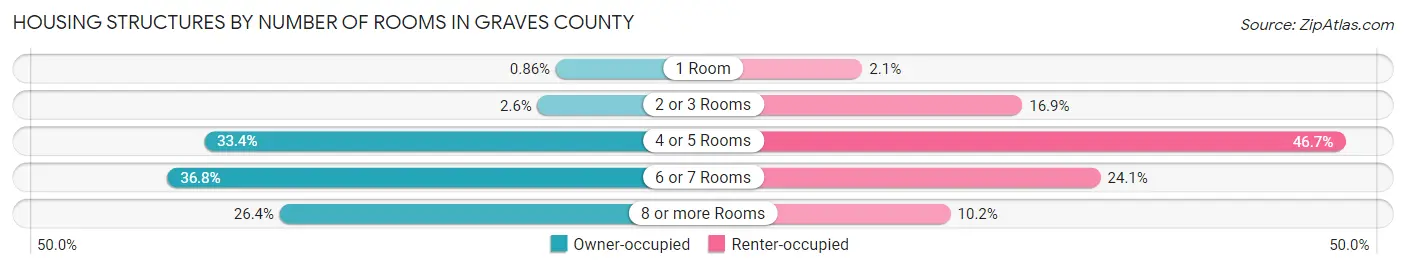
| Number of Rooms | Owner-occupied | Renter-occupied |
| 1 Room | 92 (0.9%) | 75 (2.1%) |
| 2 or 3 Rooms | 273 (2.5%) | 608 (16.9%) |
| 4 or 5 Rooms | 3,573 (33.4%) | 1,684 (46.7%) |
| 6 or 7 Rooms | 3,937 (36.8%) | 869 (24.1%) |
| 8 or more Rooms | 2,824 (26.4%) | 369 (10.2%) |
| Total | 10,699 (100.0%) | 3,605 (100.0%) |
Housing Structure by Heating Type in Graves County
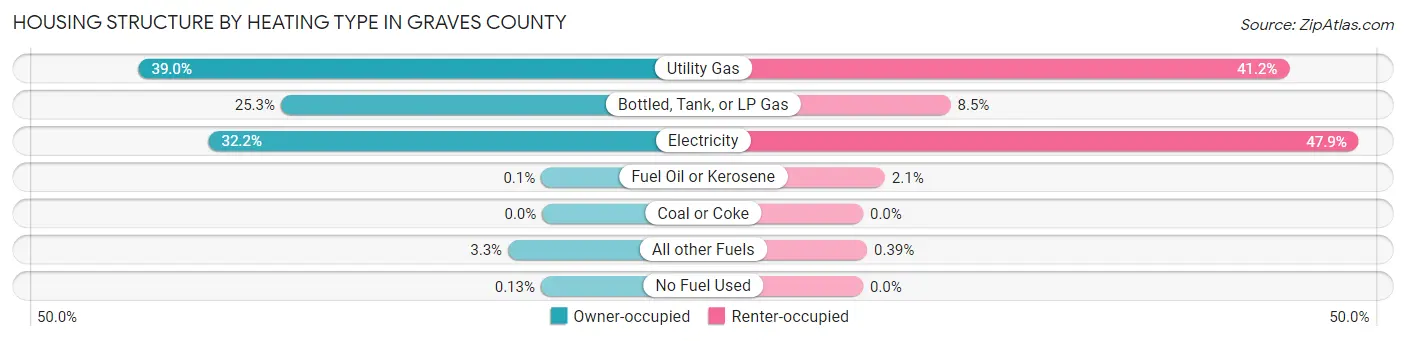
| Heating Type | Owner-occupied | Renter-occupied |
| Utility Gas | 4,172 (39.0%) | 1,484 (41.2%) |
| Bottled, Tank, or LP Gas | 2,702 (25.3%) | 305 (8.5%) |
| Electricity | 3,447 (32.2%) | 1,726 (47.9%) |
| Fuel Oil or Kerosene | 11 (0.1%) | 76 (2.1%) |
| Coal or Coke | 0 (0.0%) | 0 (0.0%) |
| All other Fuels | 353 (3.3%) | 14 (0.4%) |
| No Fuel Used | 14 (0.1%) | 0 (0.0%) |
| Total | 10,699 (100.0%) | 3,605 (100.0%) |
Household Vehicle Usage in Graves County
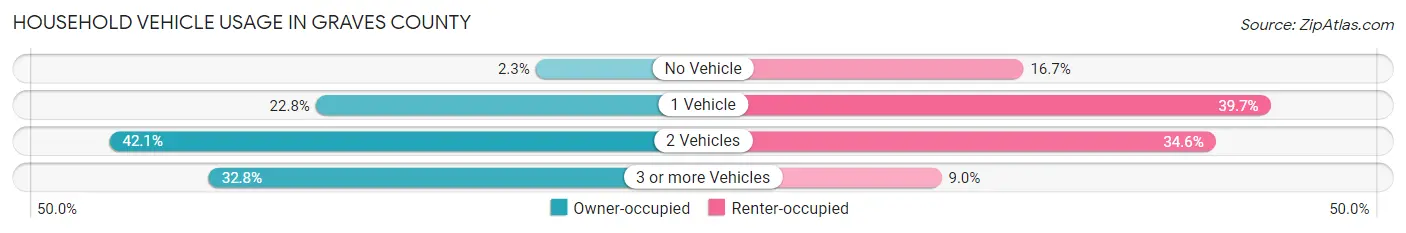
| Vehicles per Household | Owner-occupied | Renter-occupied |
| No Vehicle | 246 (2.3%) | 601 (16.7%) |
| 1 Vehicle | 2,443 (22.8%) | 1,432 (39.7%) |
| 2 Vehicles | 4,501 (42.1%) | 1,247 (34.6%) |
| 3 or more Vehicles | 3,509 (32.8%) | 325 (9.0%) |
| Total | 10,699 (100.0%) | 3,605 (100.0%) |
Real Estate & Mortgages in Graves County
Real Estate and Mortgage Overview in Graves County
| Characteristic | Without Mortgage | With Mortgage |
| Housing Units | 5,261 | 5,438 |
| Median Property Value | $112,900 | $152,000 |
| Median Household Income | $45,394 | $830 |
| Monthly Housing Costs | $404 | $122 |
| Real Estate Taxes | $657 | $112 |
Property Value by Mortgage Status in Graves County
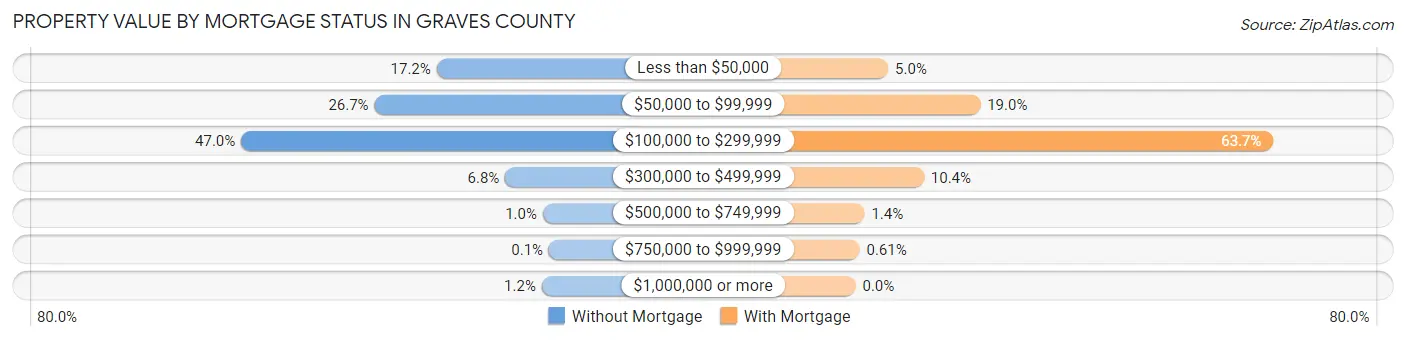
| Property Value | Without Mortgage | With Mortgage |
| Less than $50,000 | 906 (17.2%) | 270 (5.0%) |
| $50,000 to $99,999 | 1,404 (26.7%) | 1,033 (19.0%) |
| $100,000 to $299,999 | 2,473 (47.0%) | 3,462 (63.7%) |
| $300,000 to $499,999 | 356 (6.8%) | 566 (10.4%) |
| $500,000 to $749,999 | 54 (1.0%) | 74 (1.4%) |
| $750,000 to $999,999 | 5 (0.1%) | 33 (0.6%) |
| $1,000,000 or more | 63 (1.2%) | 0 (0.0%) |
| Total | 5,261 (100.0%) | 5,438 (100.0%) |
Household Income by Mortgage Status in Graves County
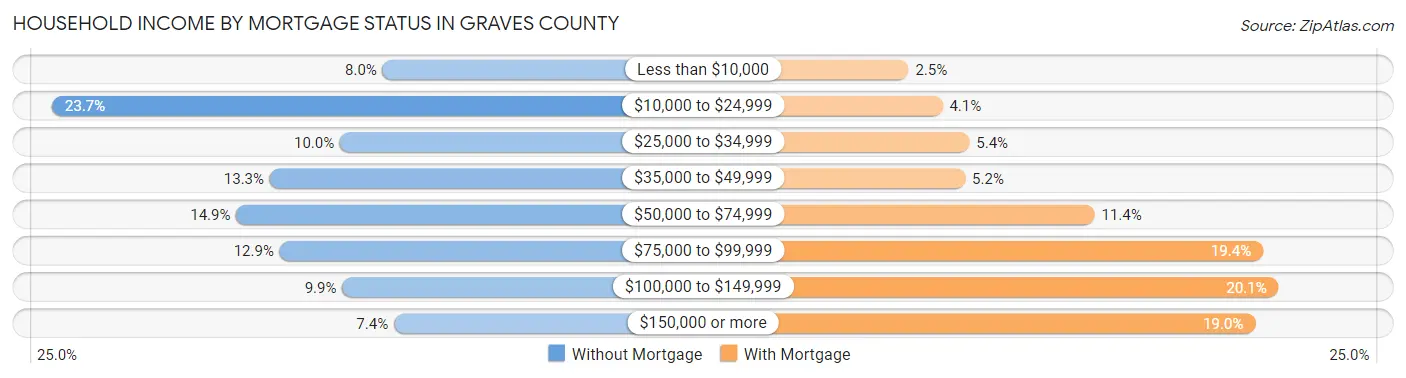
| Household Income | Without Mortgage | With Mortgage |
| Less than $10,000 | 418 (8.0%) | 137 (2.5%) |
| $10,000 to $24,999 | 1,247 (23.7%) | 225 (4.1%) |
| $25,000 to $34,999 | 525 (10.0%) | 295 (5.4%) |
| $35,000 to $49,999 | 701 (13.3%) | 284 (5.2%) |
| $50,000 to $74,999 | 785 (14.9%) | 619 (11.4%) |
| $75,000 to $99,999 | 676 (12.9%) | 1,055 (19.4%) |
| $100,000 to $149,999 | 519 (9.9%) | 1,095 (20.1%) |
| $150,000 or more | 390 (7.4%) | 1,035 (19.0%) |
| Total | 5,261 (100.0%) | 5,438 (100.0%) |
Property Value to Household Income Ratio in Graves County
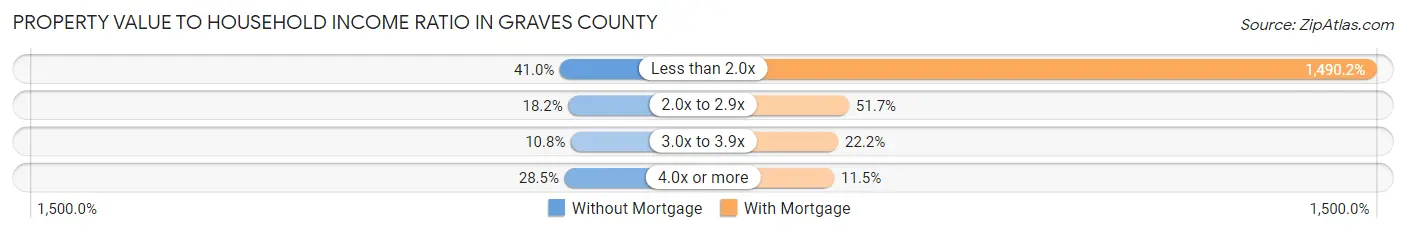
| Value-to-Income Ratio | Without Mortgage | With Mortgage |
| Less than 2.0x | 2,158 (41.0%) | 81,038 (1,490.2%) |
| 2.0x to 2.9x | 958 (18.2%) | 2,812 (51.7%) |
| 3.0x to 3.9x | 570 (10.8%) | 1,208 (22.2%) |
| 4.0x or more | 1,500 (28.5%) | 625 (11.5%) |
| Total | 5,261 (100.0%) | 5,438 (100.0%) |
Real Estate Taxes by Mortgage Status in Graves County
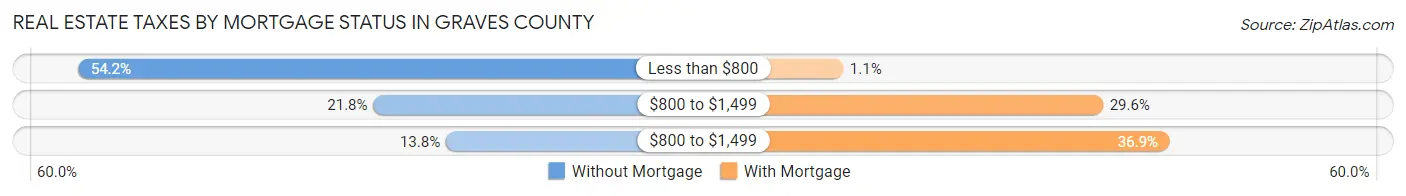
| Property Taxes | Without Mortgage | With Mortgage |
| Less than $800 | 2,850 (54.2%) | 59 (1.1%) |
| $800 to $1,499 | 1,146 (21.8%) | 1,607 (29.5%) |
| $800 to $1,499 | 727 (13.8%) | 2,007 (36.9%) |
| Total | 5,261 (100.0%) | 5,438 (100.0%) |
Health & Disability in Graves County
Health Insurance Coverage by Age in Graves County
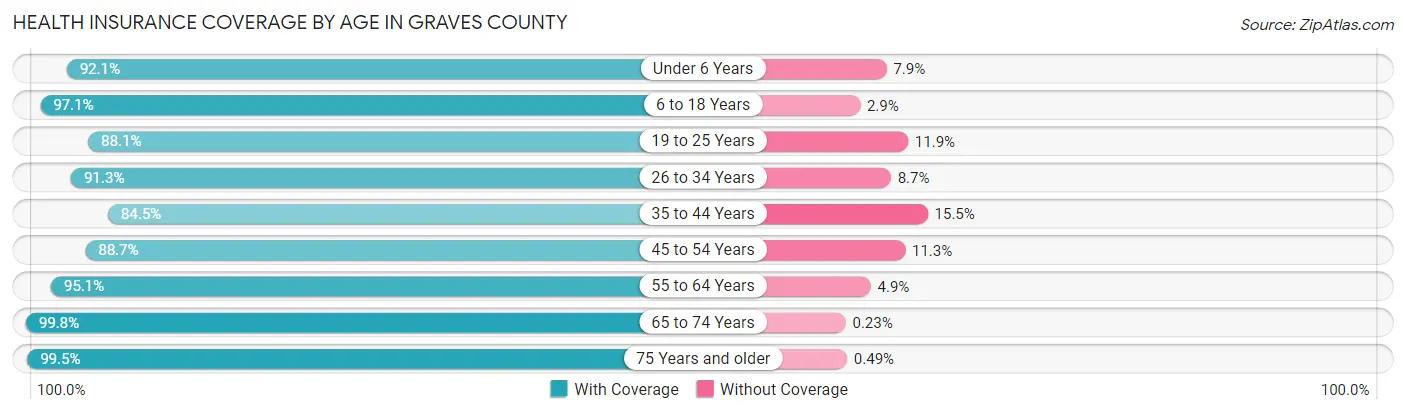
| Age Bracket | With Coverage | Without Coverage |
| Under 6 Years | 2,800 (92.1%) | 239 (7.9%) |
| 6 to 18 Years | 6,081 (97.1%) | 183 (2.9%) |
| 19 to 25 Years | 2,526 (88.1%) | 340 (11.9%) |
| 26 to 34 Years | 3,575 (91.3%) | 339 (8.7%) |
| 35 to 44 Years | 3,467 (84.5%) | 638 (15.5%) |
| 45 to 54 Years | 3,929 (88.7%) | 502 (11.3%) |
| 55 to 64 Years | 4,947 (95.1%) | 255 (4.9%) |
| 65 to 74 Years | 3,884 (99.8%) | 9 (0.2%) |
| 75 Years and older | 2,624 (99.5%) | 13 (0.5%) |
| Total | 33,833 (93.1%) | 2,518 (6.9%) |
Health Insurance Coverage by Citizenship Status in Graves County
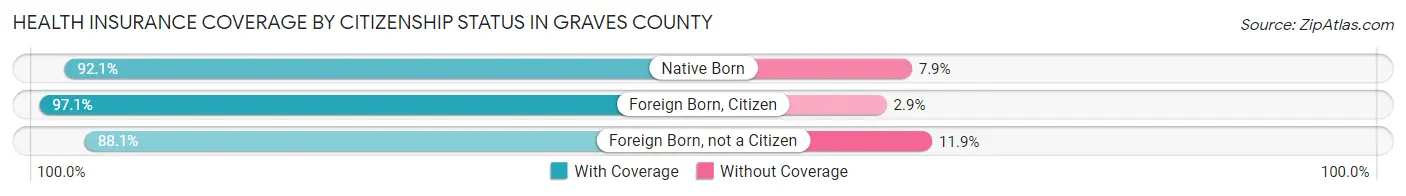
| Citizenship Status | With Coverage | Without Coverage |
| Native Born | 2,800 (92.1%) | 239 (7.9%) |
| Foreign Born, Citizen | 6,081 (97.1%) | 183 (2.9%) |
| Foreign Born, not a Citizen | 2,526 (88.1%) | 340 (11.9%) |
Health Insurance Coverage by Household Income in Graves County
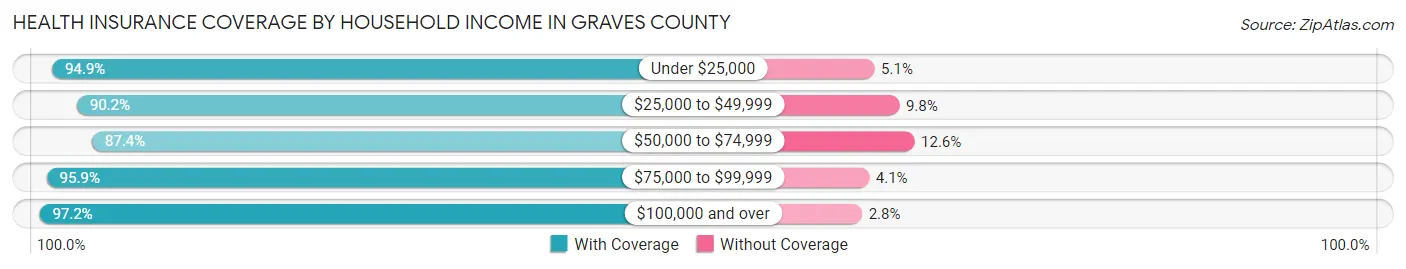
| Household Income | With Coverage | Without Coverage |
| Under $25,000 | 5,775 (94.9%) | 312 (5.1%) |
| $25,000 to $49,999 | 6,926 (90.2%) | 751 (9.8%) |
| $50,000 to $74,999 | 6,211 (87.4%) | 896 (12.6%) |
| $75,000 to $99,999 | 5,321 (95.9%) | 229 (4.1%) |
| $100,000 and over | 9,439 (97.2%) | 271 (2.8%) |
Public vs Private Health Insurance Coverage by Age in Graves County
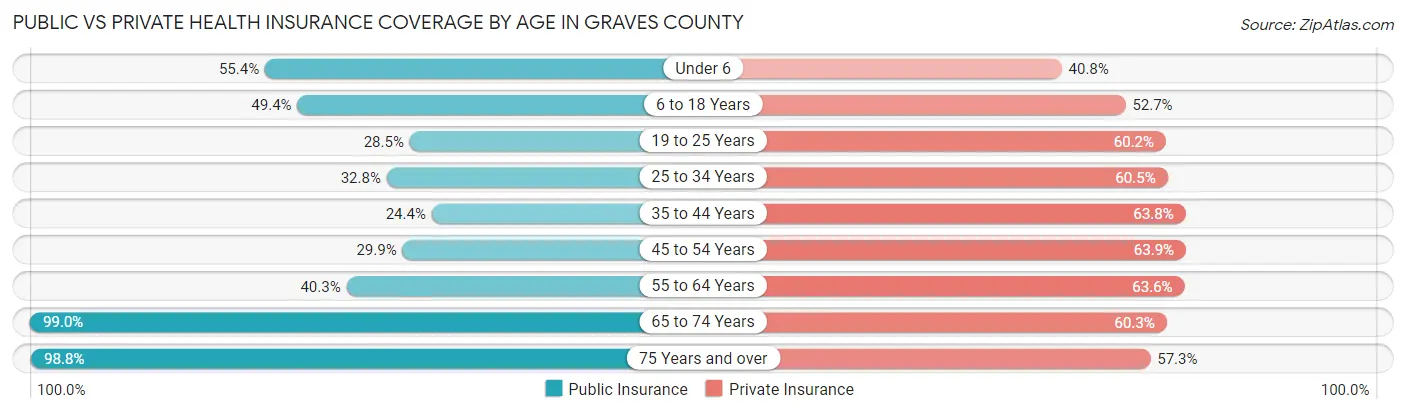
| Age Bracket | Public Insurance | Private Insurance |
| Under 6 | 1,683 (55.4%) | 1,240 (40.8%) |
| 6 to 18 Years | 3,092 (49.4%) | 3,298 (52.6%) |
| 19 to 25 Years | 817 (28.5%) | 1,724 (60.2%) |
| 25 to 34 Years | 1,283 (32.8%) | 2,366 (60.5%) |
| 35 to 44 Years | 1,003 (24.4%) | 2,619 (63.8%) |
| 45 to 54 Years | 1,323 (29.9%) | 2,830 (63.9%) |
| 55 to 64 Years | 2,094 (40.3%) | 3,308 (63.6%) |
| 65 to 74 Years | 3,854 (99.0%) | 2,347 (60.3%) |
| 75 Years and over | 2,605 (98.8%) | 1,510 (57.3%) |
| Total | 17,754 (48.8%) | 21,242 (58.4%) |
Disability Status by Sex by Age in Graves County
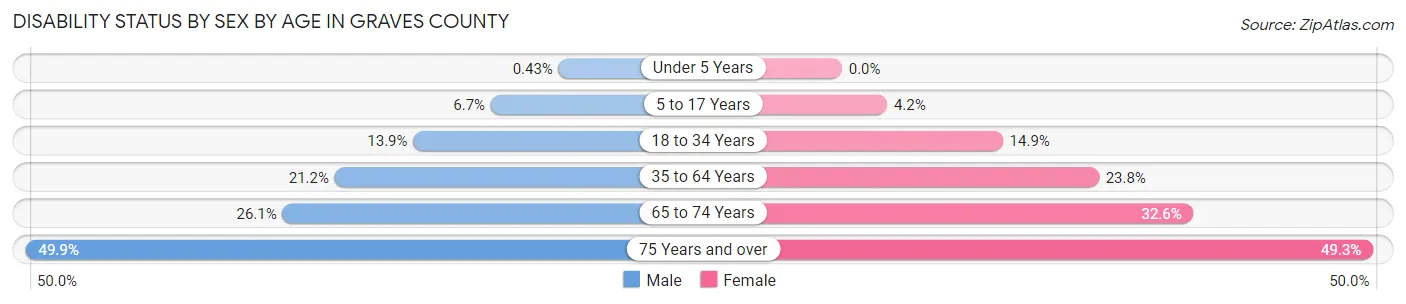
| Age Bracket | Male | Female |
| Under 5 Years | 5 (0.4%) | 0 (0.0%) |
| 5 to 17 Years | 218 (6.7%) | 128 (4.2%) |
| 18 to 34 Years | 513 (13.9%) | 543 (14.9%) |
| 35 to 64 Years | 1,459 (21.2%) | 1,635 (23.8%) |
| 65 to 74 Years | 474 (26.1%) | 677 (32.6%) |
| 75 Years and over | 555 (49.9%) | 752 (49.3%) |
Disability Class by Sex by Age in Graves County
Disability Class: Hearing Difficulty
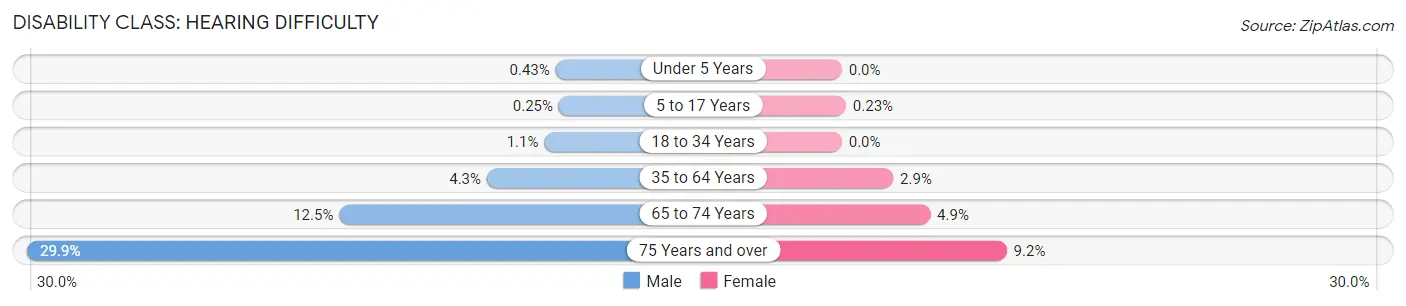
| Age Bracket | Male | Female |
| Under 5 Years | 5 (0.4%) | 0 (0.0%) |
| 5 to 17 Years | 8 (0.3%) | 7 (0.2%) |
| 18 to 34 Years | 39 (1.1%) | 0 (0.0%) |
| 35 to 64 Years | 293 (4.3%) | 196 (2.9%) |
| 65 to 74 Years | 227 (12.5%) | 102 (4.9%) |
| 75 Years and over | 332 (29.9%) | 140 (9.2%) |
Disability Class: Vision Difficulty
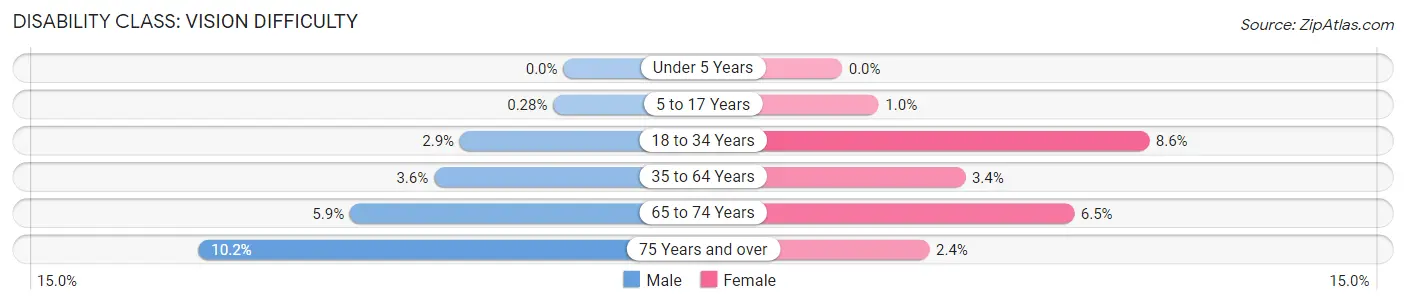
| Age Bracket | Male | Female |
| Under 5 Years | 0 (0.0%) | 0 (0.0%) |
| 5 to 17 Years | 9 (0.3%) | 31 (1.0%) |
| 18 to 34 Years | 106 (2.9%) | 311 (8.6%) |
| 35 to 64 Years | 248 (3.6%) | 235 (3.4%) |
| 65 to 74 Years | 108 (5.9%) | 134 (6.5%) |
| 75 Years and over | 113 (10.2%) | 37 (2.4%) |
Disability Class: Cognitive Difficulty
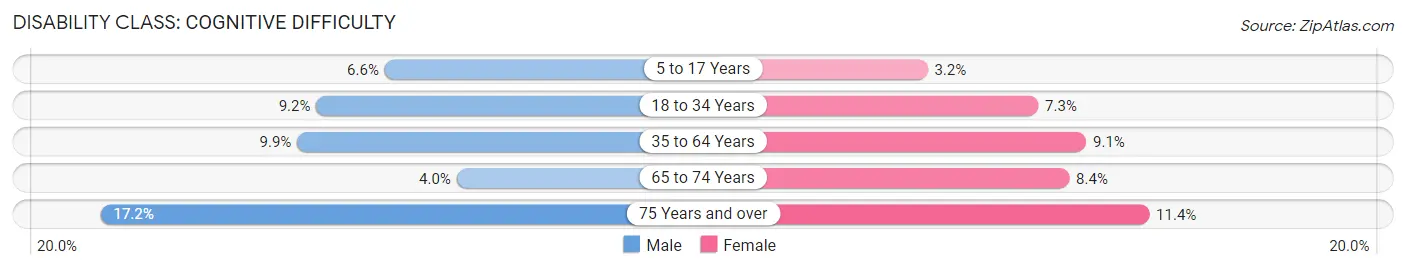
| Age Bracket | Male | Female |
| 5 to 17 Years | 215 (6.6%) | 97 (3.2%) |
| 18 to 34 Years | 338 (9.2%) | 265 (7.3%) |
| 35 to 64 Years | 680 (9.9%) | 622 (9.1%) |
| 65 to 74 Years | 72 (4.0%) | 175 (8.4%) |
| 75 Years and over | 191 (17.2%) | 174 (11.4%) |
Disability Class: Ambulatory Difficulty
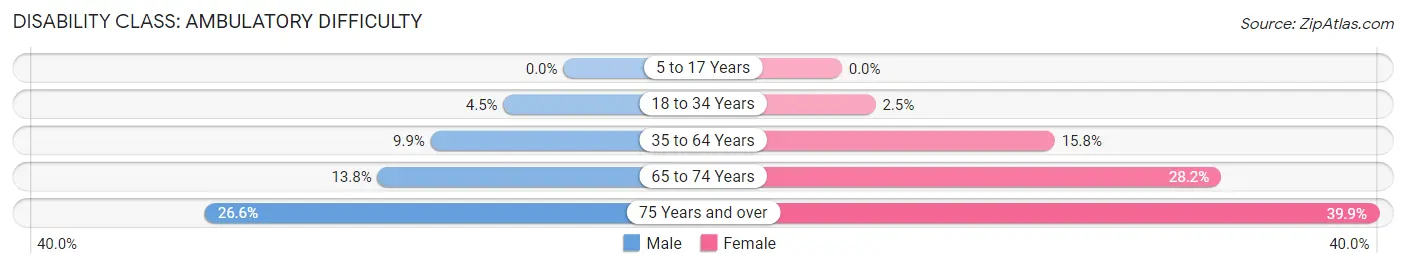
| Age Bracket | Male | Female |
| 5 to 17 Years | 0 (0.0%) | 0 (0.0%) |
| 18 to 34 Years | 164 (4.4%) | 91 (2.5%) |
| 35 to 64 Years | 678 (9.9%) | 1,084 (15.8%) |
| 65 to 74 Years | 251 (13.8%) | 584 (28.2%) |
| 75 Years and over | 296 (26.6%) | 608 (39.9%) |
Disability Class: Self-Care Difficulty
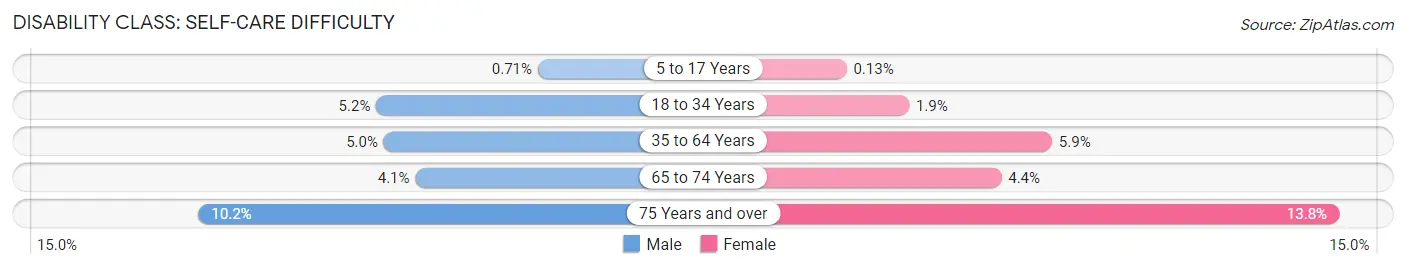
| Age Bracket | Male | Female |
| 5 to 17 Years | 23 (0.7%) | 4 (0.1%) |
| 18 to 34 Years | 192 (5.2%) | 68 (1.9%) |
| 35 to 64 Years | 344 (5.0%) | 401 (5.9%) |
| 65 to 74 Years | 75 (4.1%) | 92 (4.4%) |
| 75 Years and over | 113 (10.2%) | 211 (13.8%) |
Technology Access in Graves County
Computing Device Access in Graves County
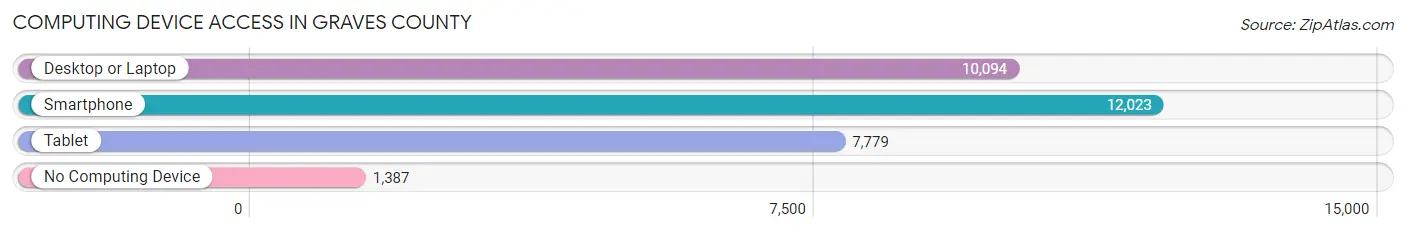
| Device Type | # Households | % Households |
| Desktop or Laptop | 10,094 | 70.6% |
| Smartphone | 12,023 | 84.1% |
| Tablet | 7,779 | 54.4% |
| No Computing Device | 1,387 | 9.7% |
| Total | 14,304 | 100.0% |
Internet Access in Graves County
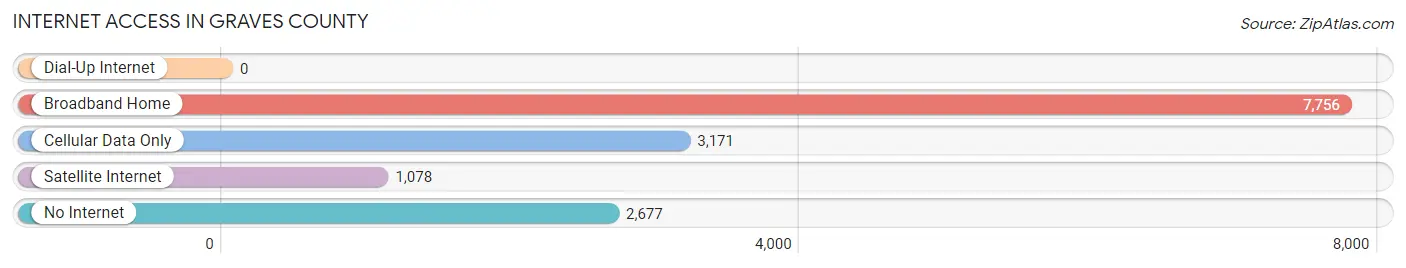
| Internet Type | # Households | % Households |
| Dial-Up Internet | 0 | 0.0% |
| Broadband Home | 7,756 | 54.2% |
| Cellular Data Only | 3,171 | 22.2% |
| Satellite Internet | 1,078 | 7.5% |
| No Internet | 2,677 | 18.7% |
| Total | 14,304 | 100.0% |
Graves County Summary
Graves County is located in the western part of Kentucky, in the Jackson Purchase region. It is bordered by the counties of McCracken, Marshall, Calloway, and Hickman. The county seat is Mayfield, and the county was formed in 1823 from parts of Hickman and Hickman counties. The county is named after Major Benjamin Franklin Graves, a veteran of the War of 1812.
Geography
Graves County covers an area of 517 square miles, with a population of 37,121 as of the 2010 census. The county is mostly flat, with some rolling hills in the northern and western parts. The county is drained by the Tennessee and Ohio Rivers, and the major streams are the Little Bayou, Big Bayou, and the Mayfield Creek. The county is mostly rural, with the majority of the population living in the towns of Mayfield, Water Valley, and Farmington.
The climate of Graves County is humid subtropical, with hot, humid summers and mild winters. The average annual temperature is around 60 degrees Fahrenheit, and the average annual precipitation is around 45 inches.
Economy
The economy of Graves County is largely based on agriculture, with corn, soybeans, and wheat being the main crops. Livestock production is also important, with cattle, hogs, and poultry being the main animals raised. Manufacturing is also an important part of the economy, with the major employers being the Mayfield-Graves County Industrial Park, the Mayfield-Graves County Airport, and the Mayfield-Graves County Medical Center.
Demographics
As of the 2010 census, the population of Graves County was 37,121, with a population density of 72 people per square mile. The racial makeup of the county was 95.3% White, 2.3% African American, 0.4% Native American, 0.3% Asian, 0.2% Pacific Islander, 0.7% from other races, and 0.9% from two or more races. Hispanic or Latino of any race were 1.7% of the population.
The median income for a household in the county was $37,945, and the median income for a family was $45,945. The per capita income for the county was $19,845. About 11.3% of the population was below the poverty line.
Education
Graves County is served by the Graves County School District, which operates seven elementary schools, two middle schools, and two high schools. The county also has several private schools, including Mayfield Christian Academy and Mayfield Christian School. The county is also home to two post-secondary institutions, West Kentucky Community and Technical College and Murray State University.
Common Questions
What is the Total Population of Graves County?
Total Population of Graves County is 36,701.
What is the Total Male Population of Graves County?
Total Male Population of Graves County is 18,097.
What is the Total Female Population of Graves County?
Total Female Population of Graves County is 18,604.
What is the Ratio of Males per 100 Females in Graves County?
There are 97.27 Males per 100 Females in Graves County.
What is the Ratio of Females per 100 Males in Graves County?
There are 102.80 Females per 100 Males in Graves County.
What is the Median Population Age in Graves County?
Median Population Age in Graves County is 39.9 Years.
What is the Average Family Size in Graves County
Average Family Size in Graves County is 3.1 People.
What is the Average Household Size in Graves County
Average Household Size in Graves County is 2.5 People.
What is Per Capita Income in Graves County?
Per Capita income in Graves County is $28,978.
What is the Median Family Income in Graves County?
Median Family Income in Graves County is $66,538.
What is the Median Household income in Graves County?
Median Household Income in Graves County is $52,526.
What is Income or Wage Gap in Graves County?
Income or Wage Gap in Graves County is 34.6%.
Women in Graves County earn 65.4 cents for every dollar earned by a man.
What is Family Income Deficit in Graves County?
Family Income Deficit in Graves County is $12,276.
Families that are below poverty line in Graves County earn $12,276 less on average than the poverty threshold level.
What is Inequality or Gini Index in Graves County?
Inequality or Gini Index in Graves County is 0.48.
How Large is the Labor Force in Graves County?
There are 15,945 People in the Labor Forcein in Graves County.
What is the Percentage of People in the Labor Force in Graves County?
55.2% of People are in the Labor Force in Graves County.
What is the Unemployment Rate in Graves County?
Unemployment Rate in Graves County is 3.7%.