Fleming County, KY
Fleming County Overview
15,111
TOTAL POPULATION
7,576
MALE POPULATION
7,535
FEMALE POPULATION
100.54
MALES / 100 FEMALES
99.46
FEMALES / 100 MALES
40.8
MEDIAN AGE
3.1
AVG FAMILY SIZE
2.6
AVG HOUSEHOLD SIZE
$26,230
PER CAPITA INCOME
$59,724
AVG FAMILY INCOME
$46,885
AVG HOUSEHOLD INCOME
36.3%
WAGE / INCOME GAP [ % ]
63.7¢/ $1
WAGE / INCOME GAP [ $ ]
$10,457
FAMILY INCOME DEFICIT
0.47
INEQUALITY / GINI INDEX
6,609
LABOR FORCE [ PEOPLE ]
55.5%
PERCENT IN LABOR FORCE
8.4%
UNEMPLOYMENT RATE
Fleming County Area Codes
Race in Fleming County
The most populous races in Fleming County are White / Caucasian (14,385 | 95.2%), Two or more Races (427 | 2.8%), and Hispanic or Latino (257 | 1.7%).

| Race | # Population | % Population |
| Asian | 79 | 0.5% |
| Black / African American | 132 | 0.9% |
| Hawaiian / Pacific | 0 | 0.0% |
| Hispanic or Latino | 257 | 1.7% |
| Native / Alaskan | 23 | 0.2% |
| White / Caucasian | 14,385 | 95.2% |
| Two or more Races | 427 | 2.8% |
| Some other Race | 65 | 0.4% |
| Total | 15,111 | 100.0% |
Ancestry in Fleming County
The most populous ancestries reported in Fleming County are American (4,552 | 30.1%), English (1,892 | 12.5%), Irish (1,803 | 11.9%), German (1,471 | 9.7%), and Scotch-Irish (489 | 3.2%), together accounting for 67.5% of all Fleming County residents.

| Ancestry | # Population | % Population |
| African | 2 | 0.0% |
| American | 4,552 | 30.1% |
| Armenian | 10 | 0.1% |
| Austrian | 53 | 0.4% |
| Bhutanese | 22 | 0.2% |
| British | 159 | 1.1% |
| Burmese | 7 | 0.1% |
| Canadian | 8 | 0.1% |
| Cherokee | 50 | 0.3% |
| Czechoslovakian | 9 | 0.1% |
| Dutch | 111 | 0.7% |
| English | 1,892 | 12.5% |
| European | 175 | 1.2% |
| Finnish | 10 | 0.1% |
| French | 42 | 0.3% |
| German | 1,471 | 9.7% |
| Greek | 39 | 0.3% |
| Indian (Asian) | 61 | 0.4% |
| Irish | 1,803 | 11.9% |
| Italian | 123 | 0.8% |
| Mexican | 254 | 1.7% |
| Northern European | 14 | 0.1% |
| Pennsylvania German | 232 | 1.5% |
| Polish | 14 | 0.1% |
| Puerto Rican | 3 | 0.0% |
| Scotch-Irish | 489 | 3.2% |
| Scottish | 373 | 2.5% |
| Subsaharan African | 2 | 0.0% |
| Swedish | 8 | 0.1% |
| Turkish | 13 | 0.1% |
| Ukrainian | 10 | 0.1% |
| Welsh | 108 | 0.7% | View All 32 Rows |
Immigrants in Fleming County
The most numerous immigrant groups reported in Fleming County came from Asia (79 | 0.5%), Eastern Asia (79 | 0.5%), China (61 | 0.4%), Central America (48 | 0.3%), and Latin America (48 | 0.3%), together accounting for 2.1% of all Fleming County residents.

| Immigration Origin | # Population | % Population |
| Asia | 79 | 0.5% |
| Belgium | 10 | 0.1% |
| Canada | 8 | 0.1% |
| Central America | 48 | 0.3% |
| China | 61 | 0.4% |
| Eastern Asia | 79 | 0.5% |
| Europe | 31 | 0.2% |
| Germany | 14 | 0.1% |
| Japan | 11 | 0.1% |
| Korea | 7 | 0.1% |
| Latin America | 48 | 0.3% |
| Mexico | 48 | 0.3% |
| Northern Europe | 7 | 0.1% |
| Western Europe | 24 | 0.2% | View All 14 Rows |
Sex and Age in Fleming County
Sex and Age in Fleming County
The most populous age groups in Fleming County are 10 to 14 Years (558 | 7.4%) for men and Under 5 Years (536 | 7.1%) for women.
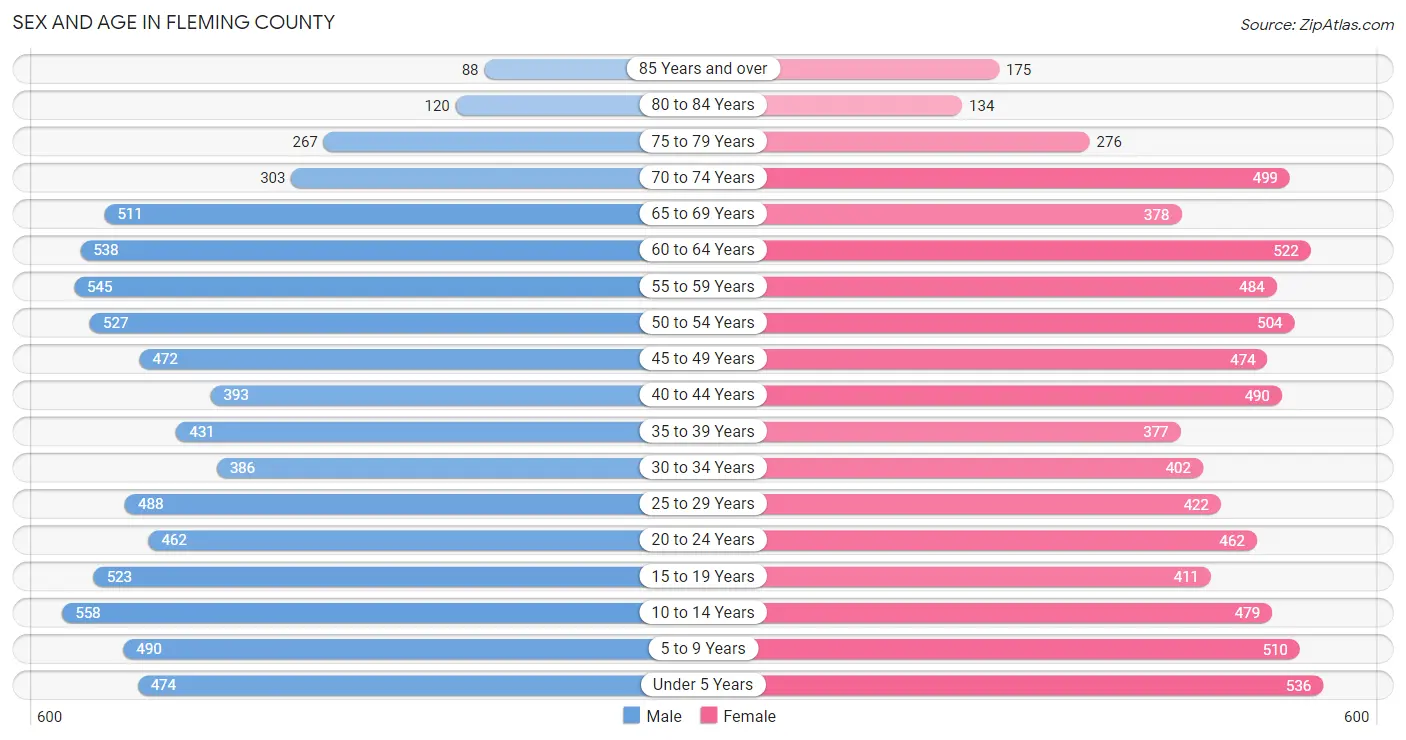
| Age Bracket | Male | Female |
| Under 5 Years | 474 (6.3%) | 536 (7.1%) |
| 5 to 9 Years | 490 (6.5%) | 510 (6.8%) |
| 10 to 14 Years | 558 (7.4%) | 479 (6.4%) |
| 15 to 19 Years | 523 (6.9%) | 411 (5.4%) |
| 20 to 24 Years | 462 (6.1%) | 462 (6.1%) |
| 25 to 29 Years | 488 (6.4%) | 422 (5.6%) |
| 30 to 34 Years | 386 (5.1%) | 402 (5.3%) |
| 35 to 39 Years | 431 (5.7%) | 377 (5.0%) |
| 40 to 44 Years | 393 (5.2%) | 490 (6.5%) |
| 45 to 49 Years | 472 (6.2%) | 474 (6.3%) |
| 50 to 54 Years | 527 (7.0%) | 504 (6.7%) |
| 55 to 59 Years | 545 (7.2%) | 484 (6.4%) |
| 60 to 64 Years | 538 (7.1%) | 522 (6.9%) |
| 65 to 69 Years | 511 (6.7%) | 378 (5.0%) |
| 70 to 74 Years | 303 (4.0%) | 499 (6.6%) |
| 75 to 79 Years | 267 (3.5%) | 276 (3.7%) |
| 80 to 84 Years | 120 (1.6%) | 134 (1.8%) |
| 85 Years and over | 88 (1.2%) | 175 (2.3%) |
| Total | 7,576 (100.0%) | 7,535 (100.0%) |
Families and Households in Fleming County
Median Family Size in Fleming County
The median family size in Fleming County is 3.09 persons per family, with single male/father families (342 | 8.6%) accounting for the largest median family size of 3.83 persons per family. On the other hand, single female/mother families (608 | 15.2%) represent the smallest median family size with 2.94 persons per family.
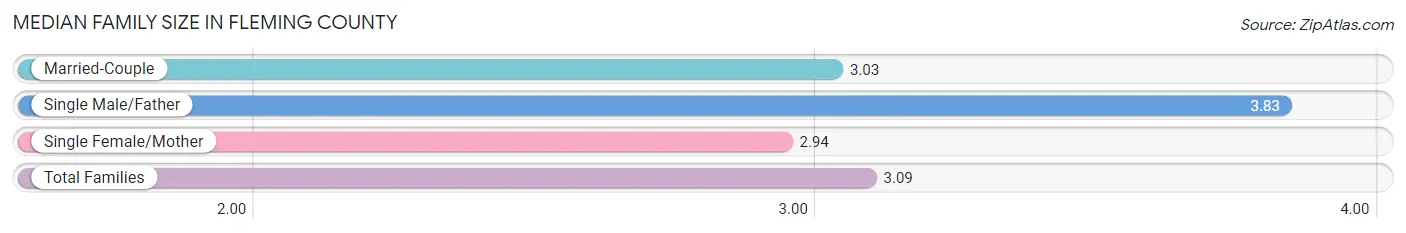
| Family Type | # Families | Family Size |
| Married-Couple | 3,047 (76.2%) | 3.03 |
| Single Male/Father | 342 (8.6%) | 3.83 |
| Single Female/Mother | 608 (15.2%) | 2.94 |
| Total Families | 3,997 (100.0%) | 3.09 |
Median Household Size in Fleming County
The median household size in Fleming County is 2.62 persons per household, with single male/father households (342 | 5.9%) accounting for the largest median household size of 4.27 persons per household. non-family households (1,750 | 30.4%) represent the smallest median household size with 1.26 persons per household.

| Household Type | # Households | Household Size |
| Married-Couple | 3,047 (53.0%) | 3.09 |
| Single Male/Father | 342 (5.9%) | 4.27 |
| Single Female/Mother | 608 (10.6%) | 3.26 |
| Non-family | 1,750 (30.4%) | 1.26 |
| Total Households | 5,747 (100.0%) | 2.62 |
Household Size by Marriage Status in Fleming County
Out of a total of 5,747 households in Fleming County, 3,997 (69.6%) are family households, while 1,750 (30.4%) are nonfamily households. The most numerous type of family households are 2-person households, comprising 2,032, and the most common type of nonfamily households are 1-person households, comprising 1,410.
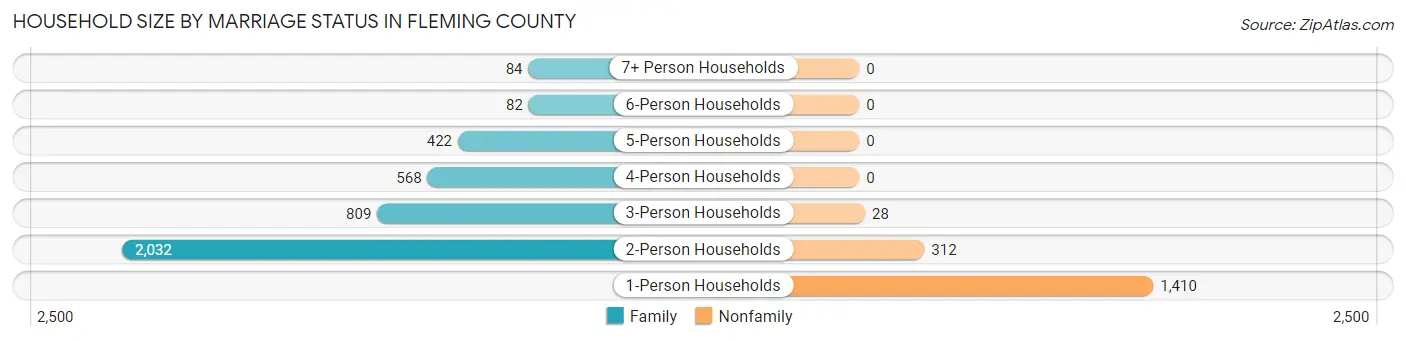
| Household Size | Family Households | Nonfamily Households |
| 1-Person Households | - | 1,410 (24.5%) |
| 2-Person Households | 2,032 (35.4%) | 312 (5.4%) |
| 3-Person Households | 809 (14.1%) | 28 (0.5%) |
| 4-Person Households | 568 (9.9%) | 0 (0.0%) |
| 5-Person Households | 422 (7.3%) | 0 (0.0%) |
| 6-Person Households | 82 (1.4%) | 0 (0.0%) |
| 7+ Person Households | 84 (1.5%) | 0 (0.0%) |
| Total | 3,997 (69.6%) | 1,750 (30.4%) |
Female Fertility in Fleming County
Fertility by Age in Fleming County
Average fertility rate in Fleming County is 32.0 births per 1,000 women. Women in the age bracket of 20 to 34 years have the highest fertility rate with 58.0 births per 1,000 women. Women in the age bracket of 20 to 34 years acount for 73.3% of all women with births.
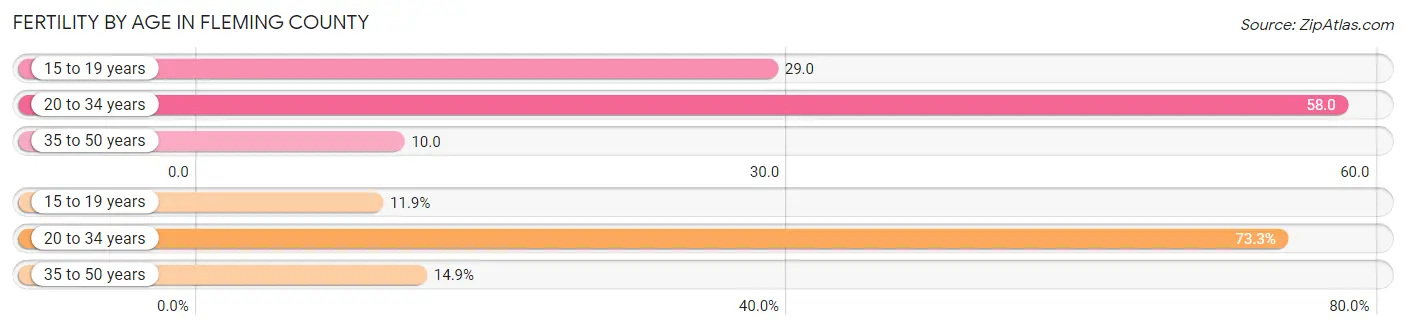
| Age Bracket | Women with Births | Births / 1,000 Women |
| 15 to 19 years | 12 (11.9%) | 29.0 |
| 20 to 34 years | 74 (73.3%) | 58.0 |
| 35 to 50 years | 15 (14.8%) | 10.0 |
| Total | 101 (100.0%) | 32.0 |
Fertility by Age by Marriage Status in Fleming County
43.6% of women with births (101) in Fleming County are married. The highest percentage of unmarried women with births falls into 15 to 19 years age bracket with 100.0% of them unmarried at the time of birth, while the lowest percentage of unmarried women with births belong to 35 to 50 years age bracket with 46.7% of them unmarried.
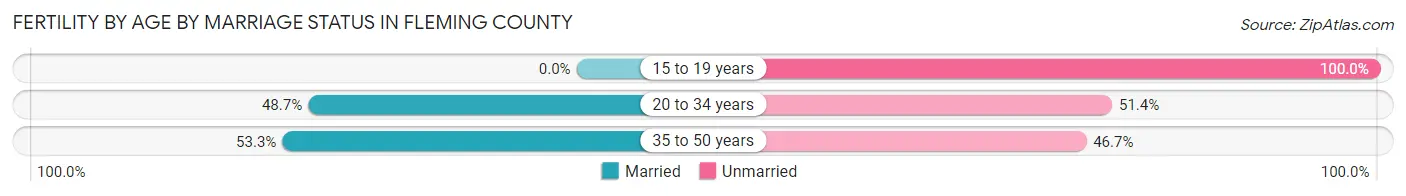
| Age Bracket | Married | Unmarried |
| 15 to 19 years | 0 (0.0%) | 12 (100.0%) |
| 20 to 34 years | 36 (48.6%) | 38 (51.3%) |
| 35 to 50 years | 8 (53.3%) | 7 (46.7%) |
| Total | 44 (43.6%) | 57 (56.4%) |
Fertility by Education in Fleming County
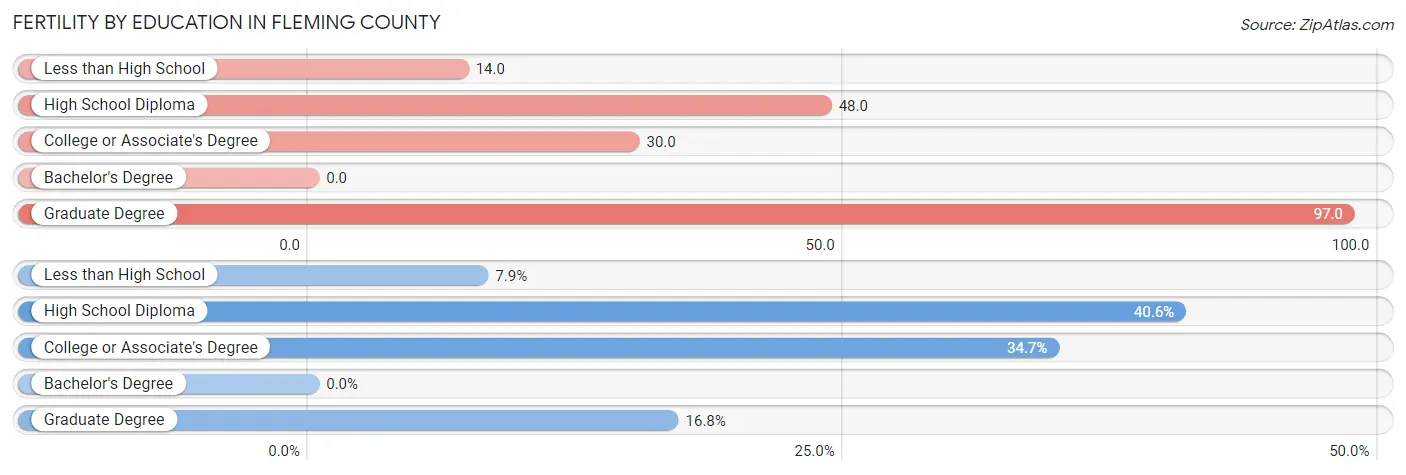
| Educational Attainment | Women with Births | Births / 1,000 Women |
| Less than High School | 8 (7.9%) | 14.0 |
| High School Diploma | 41 (40.6%) | 48.0 |
| College or Associate's Degree | 35 (34.6%) | 30.0 |
| Bachelor's Degree | 0 (0.0%) | 0.0 |
| Graduate Degree | 17 (16.8%) | 97.0 |
| Total | 101 (100.0%) | 32.0 |
Fertility by Education by Marriage Status in Fleming County
56.4% of women with births in Fleming County are unmarried. Women with the educational attainment of less than high school are most likely to be married with 100.0% of them married at childbirth, while women with the educational attainment of high school diploma are least likely to be married with 100.0% of them unmarried at childbirth.

| Educational Attainment | Married | Unmarried |
| Less than High School | 8 (100.0%) | 0 (0.0%) |
| High School Diploma | 0 (0.0%) | 41 (100.0%) |
| College or Associate's Degree | 19 (54.3%) | 16 (45.7%) |
| Bachelor's Degree | 0 (0.0%) | 0 (0.0%) |
| Graduate Degree | 17 (100.0%) | 0 (0.0%) |
| Total | 44 (43.6%) | 57 (56.4%) |
Income in Fleming County
Income Overview in Fleming County
Per Capita Income in Fleming County is $26,230, while median incomes of families and households are $59,724 and $46,885 respectively.
| Characteristic | Number | Measure |
| Per Capita Income | 15,111 | $26,230 |
| Median Family Income | 3,997 | $59,724 |
| Mean Family Income | 3,997 | $76,152 |
| Median Household Income | 5,747 | $46,885 |
| Mean Household Income | 5,747 | $65,181 |
| Income Deficit | 3,997 | $10,457 |
| Wage / Income Gap (%) | 15,111 | 36.30% |
| Wage / Income Gap ($) | 15,111 | 63.70¢ per $1 |
| Gini / Inequality Index | 15,111 | 0.47 |
Earnings by Sex in Fleming County
Average Earnings in Fleming County are $33,612, $41,223 for men and $26,260 for women, a difference of 36.3%.
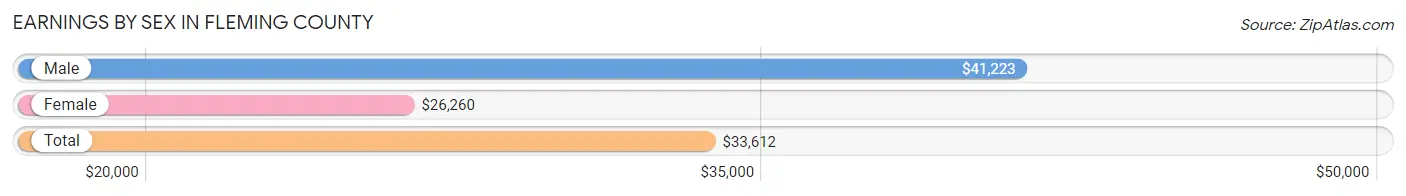
| Sex | Number | Average Earnings |
| Male | 3,682 (54.4%) | $41,223 |
| Female | 3,091 (45.6%) | $26,260 |
| Total | 6,773 (100.0%) | $33,612 |
Earnings by Sex by Income Bracket in Fleming County
The most common earnings brackets in Fleming County are $55,000 to $64,999 for men (521 | 14.1%) and $25,000 to $29,999 for women (331 | 10.7%).
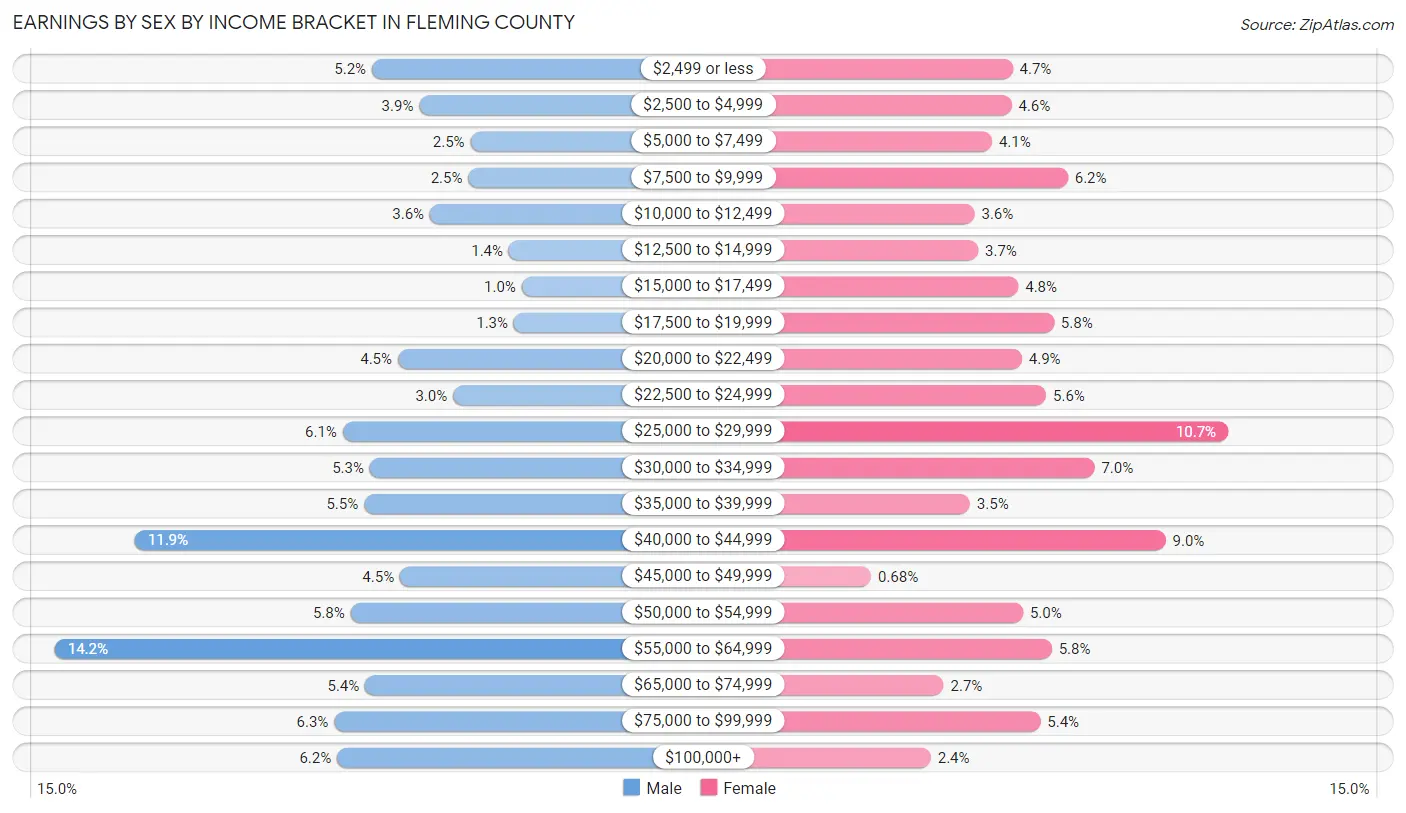
| Income | Male | Female |
| $2,499 or less | 193 (5.2%) | 144 (4.7%) |
| $2,500 to $4,999 | 144 (3.9%) | 143 (4.6%) |
| $5,000 to $7,499 | 91 (2.5%) | 126 (4.1%) |
| $7,500 to $9,999 | 93 (2.5%) | 192 (6.2%) |
| $10,000 to $12,499 | 133 (3.6%) | 111 (3.6%) |
| $12,500 to $14,999 | 51 (1.4%) | 114 (3.7%) |
| $15,000 to $17,499 | 38 (1.0%) | 149 (4.8%) |
| $17,500 to $19,999 | 46 (1.3%) | 180 (5.8%) |
| $20,000 to $22,499 | 166 (4.5%) | 152 (4.9%) |
| $22,500 to $24,999 | 109 (3.0%) | 173 (5.6%) |
| $25,000 to $29,999 | 223 (6.1%) | 331 (10.7%) |
| $30,000 to $34,999 | 195 (5.3%) | 215 (7.0%) |
| $35,000 to $39,999 | 201 (5.5%) | 107 (3.5%) |
| $40,000 to $44,999 | 438 (11.9%) | 277 (9.0%) |
| $45,000 to $49,999 | 164 (4.4%) | 21 (0.7%) |
| $50,000 to $54,999 | 215 (5.8%) | 153 (5.0%) |
| $55,000 to $64,999 | 521 (14.1%) | 178 (5.8%) |
| $65,000 to $74,999 | 200 (5.4%) | 84 (2.7%) |
| $75,000 to $99,999 | 232 (6.3%) | 168 (5.4%) |
| $100,000+ | 229 (6.2%) | 73 (2.4%) |
| Total | 3,682 (100.0%) | 3,091 (100.0%) |
Earnings by Sex by Educational Attainment in Fleming County
Average earnings in Fleming County are $43,171 for men and $29,272 for women, a difference of 32.2%. Men with an educational attainment of graduate degree enjoy the highest average annual earnings of $88,056, while those with less than high school education earn the least with $21,908. Women with an educational attainment of graduate degree earn the most with the average annual earnings of $51,817, while those with high school diploma education have the smallest earnings of $25,402.

| Educational Attainment | Male Income | Female Income |
| Less than High School | $21,908 | $40,450 |
| High School Diploma | $42,033 | $25,402 |
| College or Associate's Degree | $54,966 | $29,173 |
| Bachelor's Degree | $49,891 | $37,692 |
| Graduate Degree | $88,056 | $51,817 |
| Total | $43,171 | $29,272 |
Family Income in Fleming County
Family Income Brackets in Fleming County
According to the Fleming County family income data, there are 739 families falling into the $75,000 to $99,999 income range, which is the most common income bracket and makes up 18.5% of all families. Conversely, the $10,000 to $14,999 income bracket is the least frequent group with only 80 families (2.0%) belonging to this category.
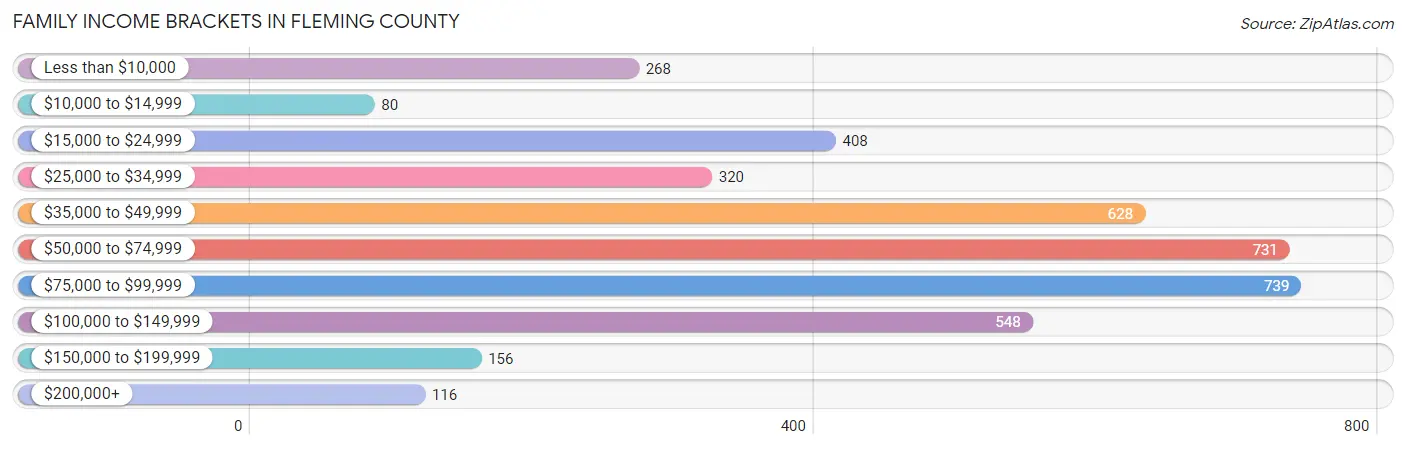
| Income Bracket | # Families | % Families |
| Less than $10,000 | 268 | 6.7% |
| $10,000 to $14,999 | 80 | 2.0% |
| $15,000 to $24,999 | 408 | 10.2% |
| $25,000 to $34,999 | 320 | 8.0% |
| $35,000 to $49,999 | 628 | 15.7% |
| $50,000 to $74,999 | 731 | 18.3% |
| $75,000 to $99,999 | 739 | 18.5% |
| $100,000 to $149,999 | 548 | 13.7% |
| $150,000 to $199,999 | 156 | 3.9% |
| $200,000+ | 116 | 2.9% |
Family Income by Famaliy Size in Fleming County
3-person families (634 | 15.9%) account for the highest median family income in Fleming County with $76,071 per family, while 3-person families (634 | 15.9%) have the highest median income of $25,357 per family member.
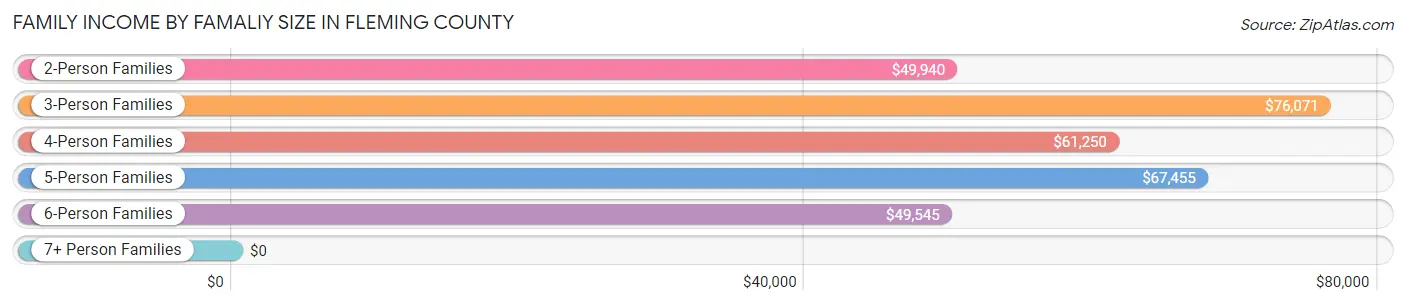
| Income Bracket | # Families | Median Income |
| 2-Person Families | 2,238 (56.0%) | $49,940 |
| 3-Person Families | 634 (15.9%) | $76,071 |
| 4-Person Families | 678 (17.0%) | $61,250 |
| 5-Person Families | 303 (7.6%) | $67,455 |
| 6-Person Families | 82 (2.1%) | $49,545 |
| 7+ Person Families | 62 (1.5%) | $0 |
| Total | 3,997 (100.0%) | $59,724 |
Family Income by Number of Earners in Fleming County
The median family income in Fleming County is $59,724, with families comprising 3+ earners (274) having the highest median family income of $102,708, while families with no earners (938) have the lowest median family income of $32,342, accounting for 6.9% and 23.5% of families, respectively.
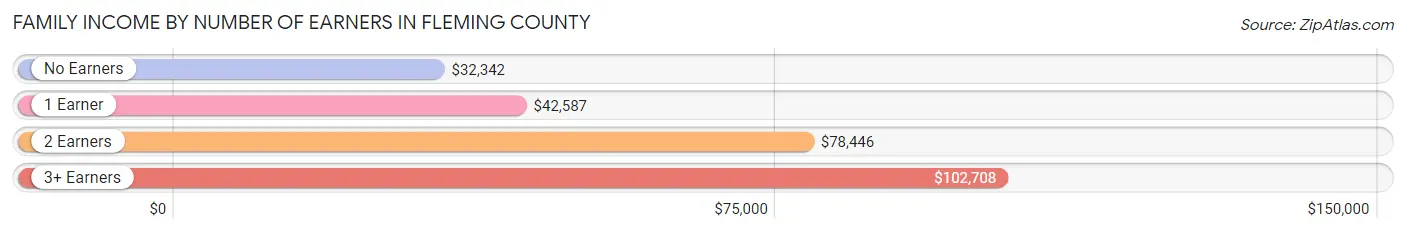
| Number of Earners | # Families | Median Income |
| No Earners | 938 (23.5%) | $32,342 |
| 1 Earner | 1,267 (31.7%) | $42,587 |
| 2 Earners | 1,518 (38.0%) | $78,446 |
| 3+ Earners | 274 (6.9%) | $102,708 |
| Total | 3,997 (100.0%) | $59,724 |
Household Income in Fleming County
Household Income Brackets in Fleming County
With 977 households falling in the category, the $50,000 to $74,999 income range is the most frequent in Fleming County, accounting for 17.0% of all households. In contrast, only 149 households (2.6%) fall into the $150,000 to $199,999 income bracket, making it the least populous group.
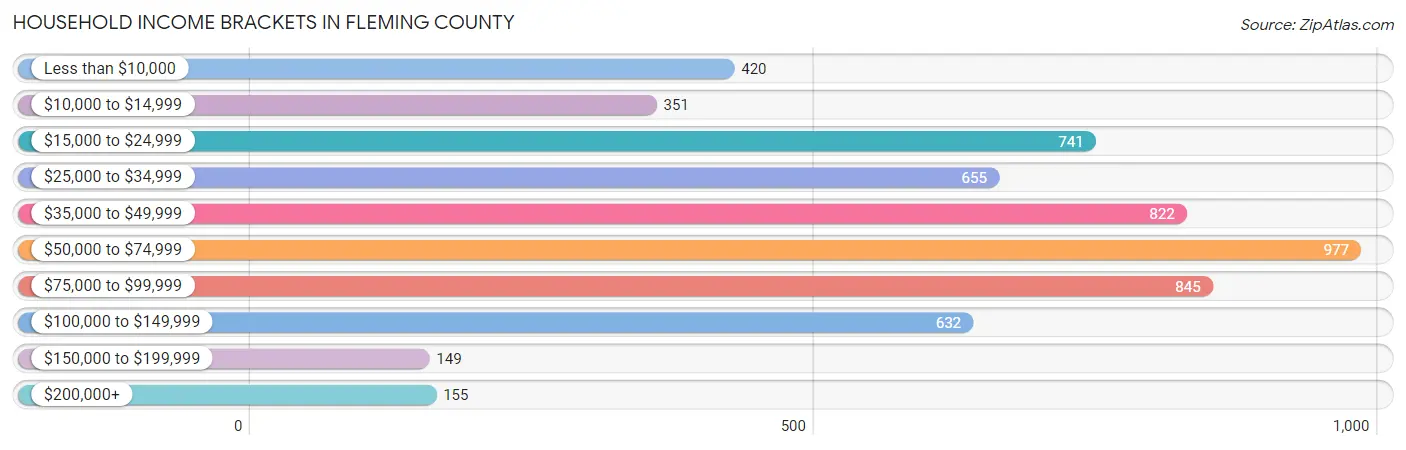
| Income Bracket | # Households | % Households |
| Less than $10,000 | 420 | 7.3% |
| $10,000 to $14,999 | 351 | 6.1% |
| $15,000 to $24,999 | 741 | 12.9% |
| $25,000 to $34,999 | 655 | 11.4% |
| $35,000 to $49,999 | 822 | 14.3% |
| $50,000 to $74,999 | 977 | 17.0% |
| $75,000 to $99,999 | 845 | 14.7% |
| $100,000 to $149,999 | 632 | 11.0% |
| $150,000 to $199,999 | 149 | 2.6% |
| $200,000+ | 155 | 2.7% |
Household Income by Householder Age in Fleming County
The median household income in Fleming County is $46,885, with the highest median household income of $65,486 found in the 25 to 44 years age bracket for the primary householder. A total of 1,651 households (28.7%) fall into this category. Meanwhile, the 15 to 24 years age bracket for the primary householder has the lowest median household income of $19,913, with 161 households (2.8%) in this group.

| Income Bracket | # Households | Median Income |
| 15 to 24 Years | 161 (2.8%) | $19,913 |
| 25 to 44 Years | 1,651 (28.7%) | $65,486 |
| 45 to 64 Years | 2,104 (36.6%) | $41,118 |
| 65+ Years | 1,831 (31.9%) | $41,784 |
| Total | 5,747 (100.0%) | $46,885 |
Poverty in Fleming County
Income Below Poverty by Sex and Age in Fleming County
With 21.3% poverty level for males and 20.7% for females among the residents of Fleming County, under 5 year old males and 15 year old females are the most vulnerable to poverty, with 269 males (56.8%) and 22 females (46.8%) in their respective age groups living below the poverty level.
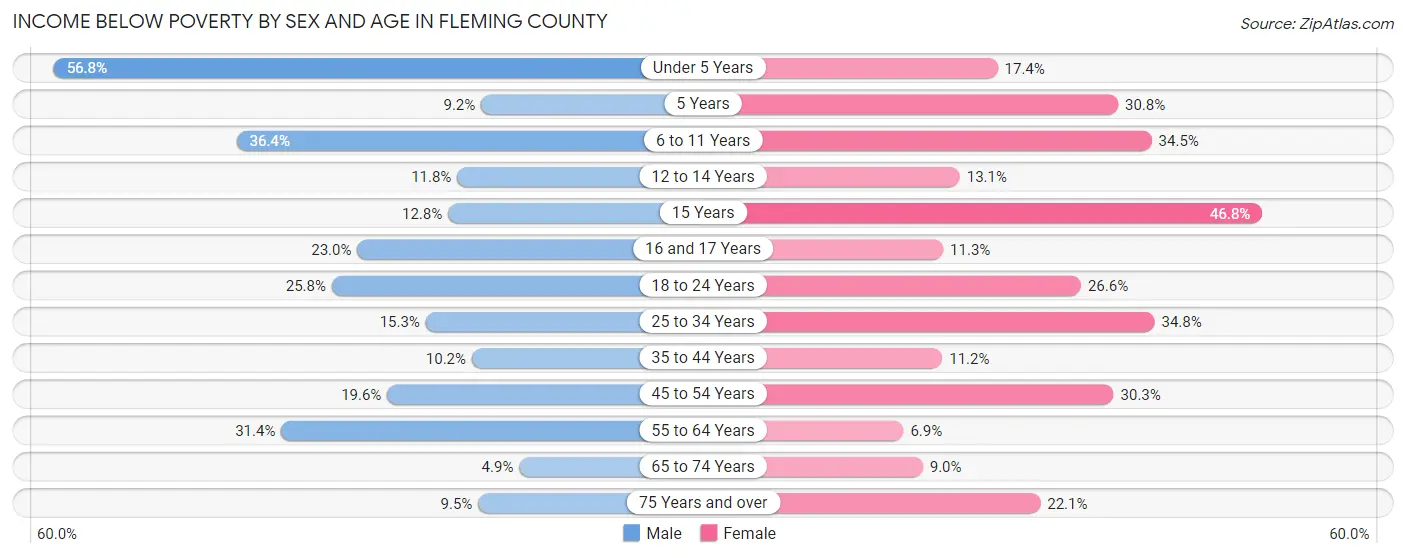
| Age Bracket | Male | Female |
| Under 5 Years | 269 (56.8%) | 93 (17.3%) |
| 5 Years | 12 (9.2%) | 24 (30.8%) |
| 6 to 11 Years | 226 (36.4%) | 254 (34.5%) |
| 12 to 14 Years | 35 (11.8%) | 23 (13.1%) |
| 15 Years | 14 (12.8%) | 22 (46.8%) |
| 16 and 17 Years | 56 (23.0%) | 28 (11.3%) |
| 18 to 24 Years | 163 (25.8%) | 154 (26.6%) |
| 25 to 34 Years | 134 (15.3%) | 287 (34.8%) |
| 35 to 44 Years | 84 (10.2%) | 97 (11.2%) |
| 45 to 54 Years | 196 (19.6%) | 296 (30.3%) |
| 55 to 64 Years | 340 (31.4%) | 69 (6.9%) |
| 65 to 74 Years | 40 (4.9%) | 78 (9.0%) |
| 75 Years and over | 45 (9.5%) | 128 (22.1%) |
| Total | 1,614 (21.3%) | 1,553 (20.7%) |
Income Above Poverty by Sex and Age in Fleming County
According to the poverty statistics in Fleming County, males aged 65 to 74 years and females aged 55 to 64 years are the age groups that are most secure financially, with 95.1% of males and 93.1% of females in these age groups living above the poverty line.
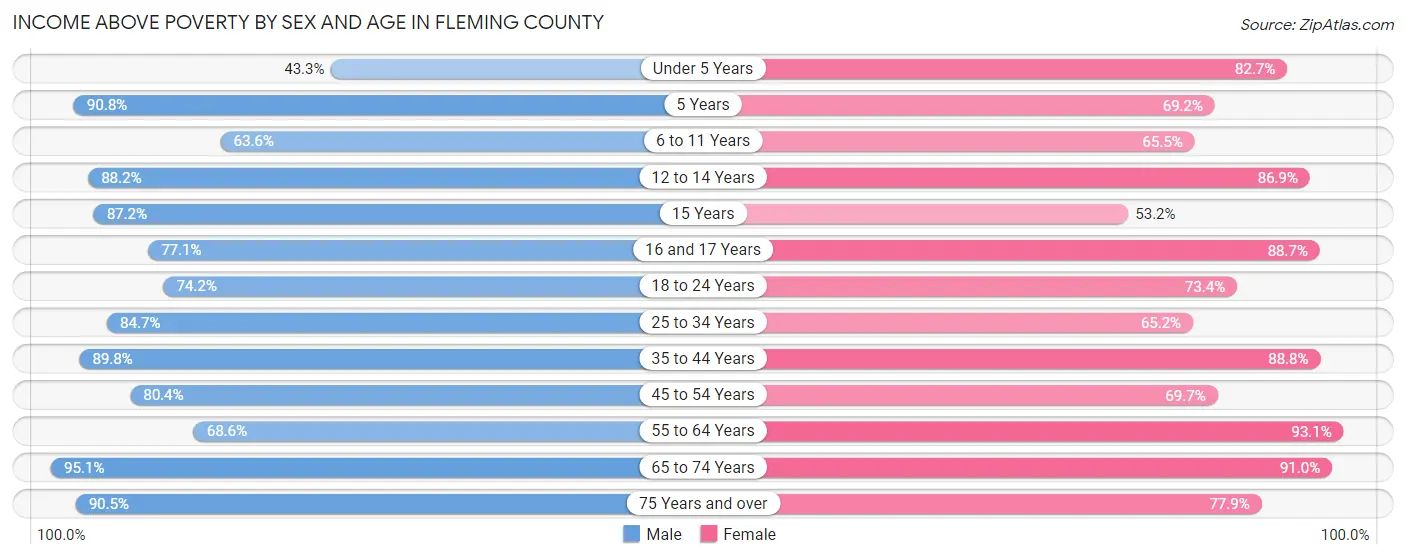
| Age Bracket | Male | Female |
| Under 5 Years | 205 (43.2%) | 443 (82.7%) |
| 5 Years | 119 (90.8%) | 54 (69.2%) |
| 6 to 11 Years | 395 (63.6%) | 482 (65.5%) |
| 12 to 14 Years | 261 (88.2%) | 152 (86.9%) |
| 15 Years | 95 (87.2%) | 25 (53.2%) |
| 16 and 17 Years | 188 (77.0%) | 220 (88.7%) |
| 18 to 24 Years | 469 (74.2%) | 424 (73.4%) |
| 25 to 34 Years | 740 (84.7%) | 537 (65.2%) |
| 35 to 44 Years | 740 (89.8%) | 770 (88.8%) |
| 45 to 54 Years | 803 (80.4%) | 682 (69.7%) |
| 55 to 64 Years | 742 (68.6%) | 936 (93.1%) |
| 65 to 74 Years | 774 (95.1%) | 787 (91.0%) |
| 75 Years and over | 429 (90.5%) | 451 (77.9%) |
| Total | 5,960 (78.7%) | 5,963 (79.3%) |
Income Below Poverty Among Married-Couple Families in Fleming County
The poverty statistics for married-couple families in Fleming County show that 7.7% or 234 of the total 3,047 families live below the poverty line. Families with 5 or more children have the highest poverty rate of 25.0%, comprising of 8 families. On the other hand, families with 3 or 4 children have the lowest poverty rate of 2.1%, which includes 6 families.
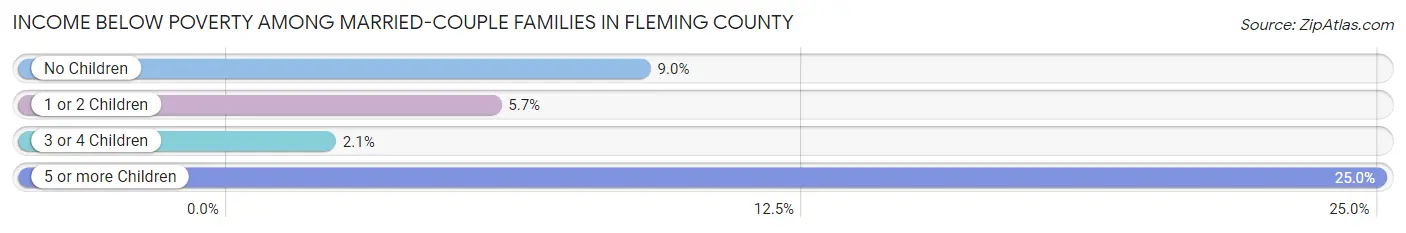
| Children | Above Poverty | Below Poverty |
| No Children | 1,773 (91.0%) | 175 (9.0%) |
| 1 or 2 Children | 740 (94.3%) | 45 (5.7%) |
| 3 or 4 Children | 276 (97.9%) | 6 (2.1%) |
| 5 or more Children | 24 (75.0%) | 8 (25.0%) |
| Total | 2,813 (92.3%) | 234 (7.7%) |
Income Below Poverty Among Single-Parent Households in Fleming County
According to the poverty data in Fleming County, 43.9% or 150 single-father households and 43.9% or 267 single-mother households are living below the poverty line. Among single-father households, those with 3 or 4 children have the highest poverty rate, with 86 households (67.2%) experiencing poverty. Likewise, among single-mother households, those with 3 or 4 children have the highest poverty rate, with 27 households (100.0%) falling below the poverty line.
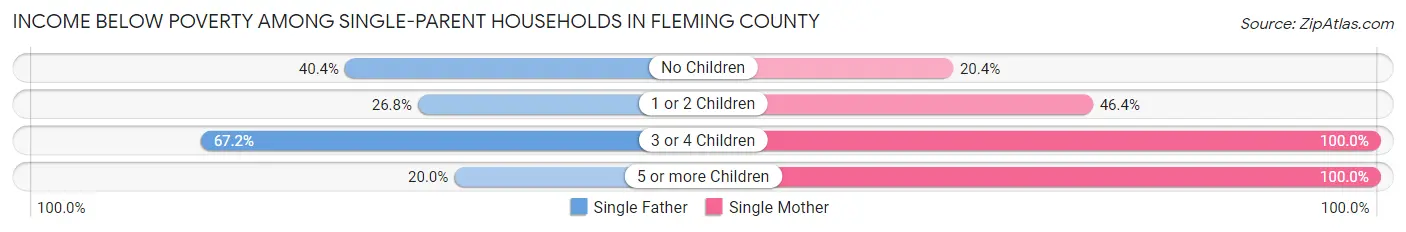
| Children | Single Father | Single Mother |
| No Children | 23 (40.4%) | 34 (20.4%) |
| 1 or 2 Children | 38 (26.8%) | 180 (46.4%) |
| 3 or 4 Children | 86 (67.2%) | 27 (100.0%) |
| 5 or more Children | 3 (20.0%) | 26 (100.0%) |
| Total | 150 (43.9%) | 267 (43.9%) |
Income Below Poverty Among Married-Couple vs Single-Parent Households in Fleming County
The poverty data for Fleming County shows that 234 of the married-couple family households (7.7%) and 417 of the single-parent households (43.9%) are living below the poverty level. Within the married-couple family households, those with 5 or more children have the highest poverty rate, with 8 households (25.0%) falling below the poverty line. Among the single-parent households, those with 3 or 4 children have the highest poverty rate, with 113 household (72.9%) living below poverty.
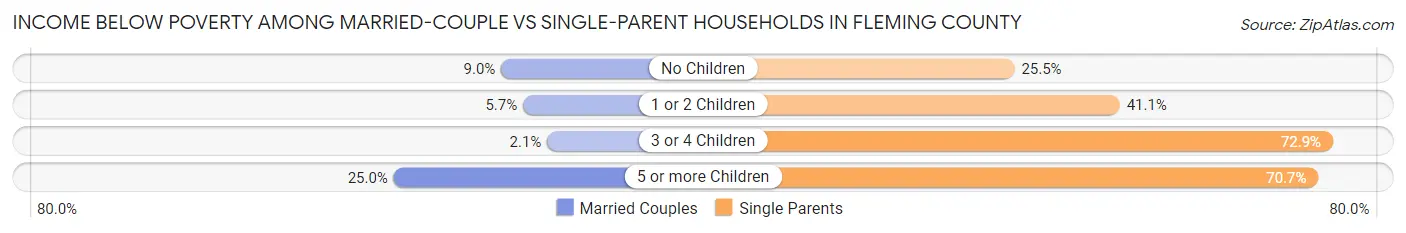
| Children | Married-Couple Families | Single-Parent Households |
| No Children | 175 (9.0%) | 57 (25.5%) |
| 1 or 2 Children | 45 (5.7%) | 218 (41.1%) |
| 3 or 4 Children | 6 (2.1%) | 113 (72.9%) |
| 5 or more Children | 8 (25.0%) | 29 (70.7%) |
| Total | 234 (7.7%) | 417 (43.9%) |
Employment Characteristics in Fleming County
Employment by Class of Employer in Fleming County
Among the 5,874 employed individuals in Fleming County, private company employees (3,859 | 65.7%), self-employed (not incorporated) (644 | 11.0%), and not-for-profit organizations (465 | 7.9%) make up the most common classes of employment.
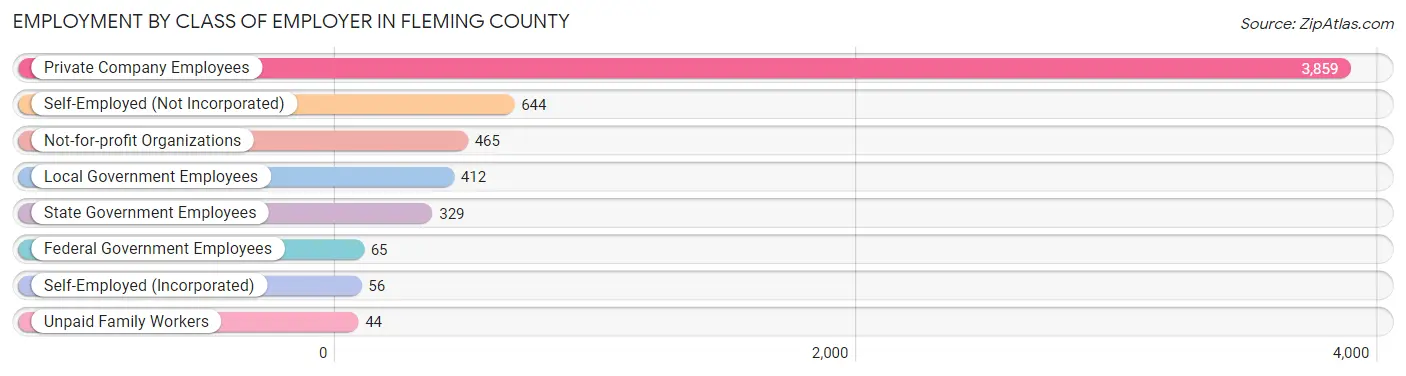
| Employer Class | # Employees | % Employees |
| Private Company Employees | 3,859 | 65.7% |
| Self-Employed (Incorporated) | 56 | 0.9% |
| Self-Employed (Not Incorporated) | 644 | 11.0% |
| Not-for-profit Organizations | 465 | 7.9% |
| Local Government Employees | 412 | 7.0% |
| State Government Employees | 329 | 5.6% |
| Federal Government Employees | 65 | 1.1% |
| Unpaid Family Workers | 44 | 0.7% |
| Total | 5,874 | 100.0% |
Employment Status by Age in Fleming County
According to the labor force statistics for Fleming County, out of the total population over 16 years of age (11,908), 55.5% or 6,609 individuals are in the labor force, with 8.4% or 555 of them unemployed. The age group with the highest labor force participation rate is 35 to 44 years, with 89.7% or 1,517 individuals in the labor force. Within the labor force, the 75 years and over age range has the highest percentage of unemployed individuals, with 30.4% or 28 of them being unemployed.

| Age Bracket | In Labor Force | Unemployed |
| 16 to 19 Years | 252 (32.4%) | 75 (29.8%) |
| 20 to 24 Years | 706 (76.4%) | 161 (22.8%) |
| 25 to 29 Years | 733 (80.5%) | 23 (3.1%) |
| 30 to 34 Years | 577 (73.2%) | 52 (9.0%) |
| 35 to 44 Years | 1,517 (89.7%) | 58 (3.8%) |
| 45 to 54 Years | 1,334 (67.5%) | 37 (2.8%) |
| 55 to 59 Years | 526 (51.1%) | 73 (13.9%) |
| 60 to 64 Years | 374 (35.3%) | 28 (7.5%) |
| 65 to 74 Years | 495 (29.3%) | 22 (4.4%) |
| 75 Years and over | 92 (8.7%) | 28 (30.4%) |
| Total | 6,609 (55.5%) | 555 (8.4%) |
Employment Status by Educational Attainment in Fleming County
According to labor force statistics for Fleming County, 67.9% of individuals (5,062) out of the total population between 25 and 64 years of age (7,455) are in the labor force, with 5.4% or 273 of them being unemployed. The group with the highest labor force participation rate are those with the educational attainment of bachelor's degree or higher, with 82.9% or 1,039 individuals in the labor force. Within the labor force, individuals with less than high school education have the highest percentage of unemployment, with 8.4% or 47 of them being unemployed.

| Educational Attainment | In Labor Force | Unemployed |
| Less than High School | 557 (45.8%) | 102 (8.4%) |
| High School Diploma | 1,972 (65.7%) | 132 (4.4%) |
| College / Associate Degree | 1,494 (75.3%) | 137 (6.9%) |
| Bachelor's Degree or higher | 1,039 (82.9%) | 41 (3.3%) |
| Total | 5,062 (67.9%) | 403 (5.4%) |
Employment Occupations by Sex in Fleming County
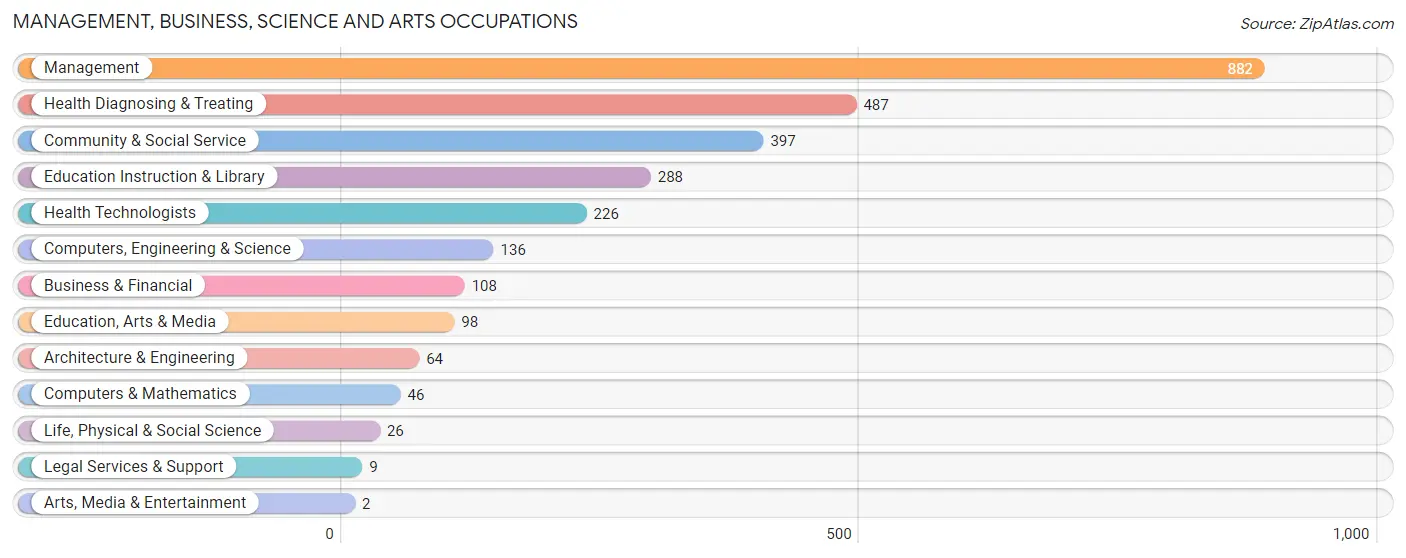
Management, Business, Science and Arts Occupations
The most common Management, Business, Science and Arts occupations in Fleming County are Management (882 | 14.6%), Health Diagnosing & Treating (487 | 8.1%), Community & Social Service (397 | 6.6%), Education Instruction & Library (288 | 4.8%), and Health Technologists (226 | 3.7%).
Management, Business, Science and Arts Occupations by Sex
Within the Management, Business, Science and Arts occupations in Fleming County, the most male-oriented occupations are Legal Services & Support (100.0%), Arts, Media & Entertainment (100.0%), and Computers & Mathematics (87.0%), while the most female-oriented occupations are Health Technologists (100.0%), Education Instruction & Library (91.0%), and Health Diagnosing & Treating (90.5%).
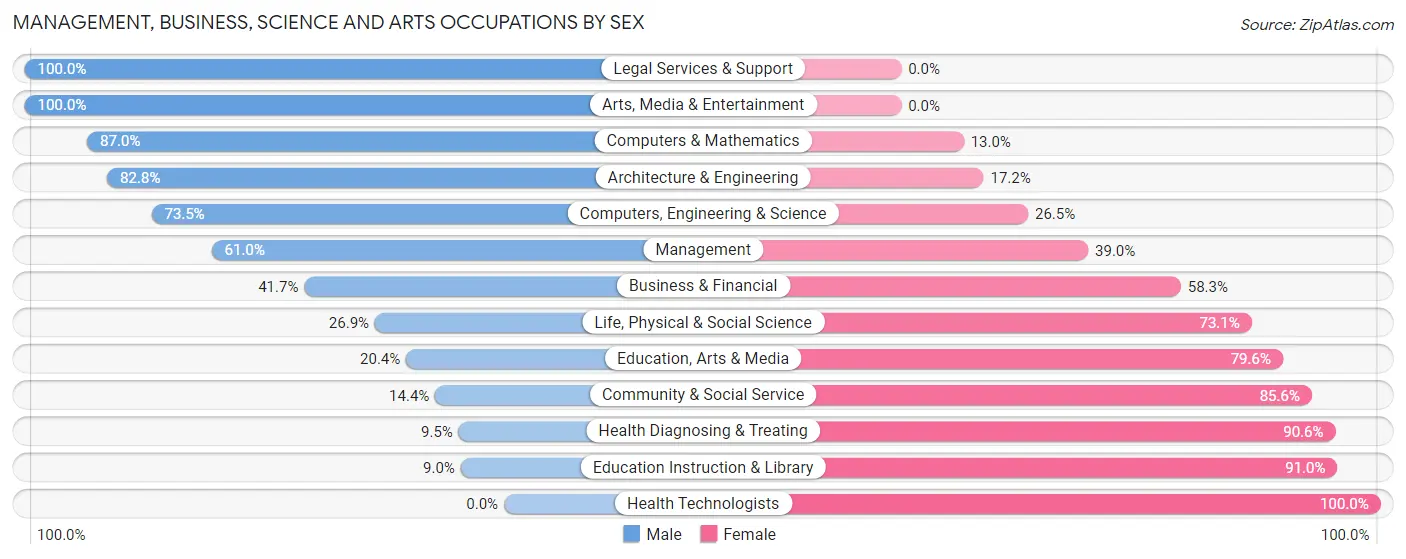
| Occupation | Male | Female |
| Management | 538 (61.0%) | 344 (39.0%) |
| Business & Financial | 45 (41.7%) | 63 (58.3%) |
| Computers, Engineering & Science | 100 (73.5%) | 36 (26.5%) |
| Computers & Mathematics | 40 (87.0%) | 6 (13.0%) |
| Architecture & Engineering | 53 (82.8%) | 11 (17.2%) |
| Life, Physical & Social Science | 7 (26.9%) | 19 (73.1%) |
| Community & Social Service | 57 (14.4%) | 340 (85.6%) |
| Education, Arts & Media | 20 (20.4%) | 78 (79.6%) |
| Legal Services & Support | 9 (100.0%) | 0 (0.0%) |
| Education Instruction & Library | 26 (9.0%) | 262 (91.0%) |
| Arts, Media & Entertainment | 2 (100.0%) | 0 (0.0%) |
| Health Diagnosing & Treating | 46 (9.5%) | 441 (90.5%) |
| Health Technologists | 0 (0.0%) | 226 (100.0%) |
| Total (Category) | 786 (39.1%) | 1,224 (60.9%) |
| Total (Overall) | 3,306 (54.6%) | 2,743 (45.4%) |
Services Occupations
The most common Services occupations in Fleming County are Food Preparation & Serving (287 | 4.7%), Healthcare Support (198 | 3.3%), Security & Protection (148 | 2.5%), Cleaning & Maintenance (115 | 1.9%), and Personal Care & Service (84 | 1.4%).

Services Occupations by Sex
Within the Services occupations in Fleming County, the most male-oriented occupations are Firefighting & Prevention (80.0%), Security & Protection (79.7%), and Law Enforcement (79.5%), while the most female-oriented occupations are Personal Care & Service (100.0%), Healthcare Support (95.5%), and Food Preparation & Serving (67.6%).

| Occupation | Male | Female |
| Healthcare Support | 9 (4.5%) | 189 (95.5%) |
| Security & Protection | 118 (79.7%) | 30 (20.3%) |
| Firefighting & Prevention | 56 (80.0%) | 14 (20.0%) |
| Law Enforcement | 62 (79.5%) | 16 (20.5%) |
| Food Preparation & Serving | 93 (32.4%) | 194 (67.6%) |
| Cleaning & Maintenance | 52 (45.2%) | 63 (54.8%) |
| Personal Care & Service | 0 (0.0%) | 84 (100.0%) |
| Total (Category) | 272 (32.7%) | 560 (67.3%) |
| Total (Overall) | 3,306 (54.6%) | 2,743 (45.4%) |
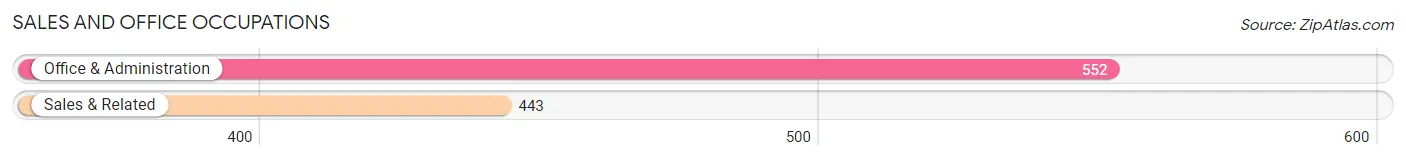
Sales and Office Occupations
The most common Sales and Office occupations in Fleming County are Office & Administration (552 | 9.1%), and Sales & Related (443 | 7.3%).
Sales and Office Occupations by Sex

| Occupation | Male | Female |
| Sales & Related | 242 (54.6%) | 201 (45.4%) |
| Office & Administration | 185 (33.5%) | 367 (66.5%) |
| Total (Category) | 427 (42.9%) | 568 (57.1%) |
| Total (Overall) | 3,306 (54.6%) | 2,743 (45.4%) |
Natural Resources, Construction and Maintenance Occupations
The most common Natural Resources, Construction and Maintenance occupations in Fleming County are Construction & Extraction (485 | 8.0%), Installation, Maintenance & Repair (207 | 3.4%), and Farming, Fishing & Forestry (71 | 1.2%).

Natural Resources, Construction and Maintenance Occupations by Sex

| Occupation | Male | Female |
| Farming, Fishing & Forestry | 71 (100.0%) | 0 (0.0%) |
| Construction & Extraction | 467 (96.3%) | 18 (3.7%) |
| Installation, Maintenance & Repair | 196 (94.7%) | 11 (5.3%) |
| Total (Category) | 734 (96.2%) | 29 (3.8%) |
| Total (Overall) | 3,306 (54.6%) | 2,743 (45.4%) |
Production, Transportation and Moving Occupations
The most common Production, Transportation and Moving occupations in Fleming County are Production (976 | 16.1%), Transportation (263 | 4.3%), and Material Moving (210 | 3.5%).

Production, Transportation and Moving Occupations by Sex

| Occupation | Male | Female |
| Production | 704 (72.1%) | 272 (27.9%) |
| Transportation | 233 (88.6%) | 30 (11.4%) |
| Material Moving | 150 (71.4%) | 60 (28.6%) |
| Total (Category) | 1,087 (75.0%) | 362 (25.0%) |
| Total (Overall) | 3,306 (54.6%) | 2,743 (45.4%) |
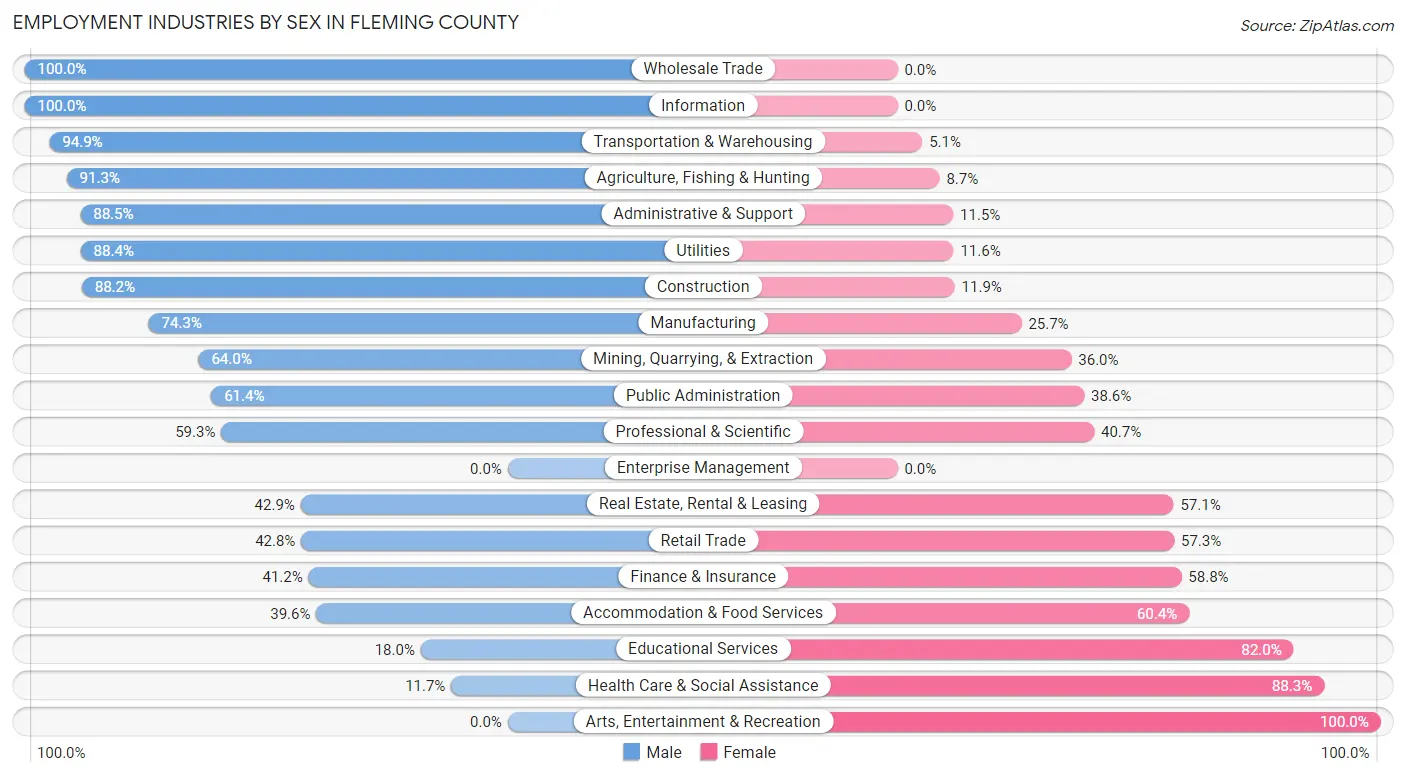
Employment Industries by Sex in Fleming County
Employment Industries in Fleming County
The major employment industries in Fleming County include Manufacturing (1,196 | 19.8%), Health Care & Social Assistance (966 | 16.0%), Retail Trade (779 | 12.9%), Construction (675 | 11.2%), and Educational Services (483 | 8.0%).

Employment Industries by Sex in Fleming County
The Fleming County industries that see more men than women are Wholesale Trade (100.0%), Information (100.0%), and Transportation & Warehousing (94.9%), whereas the industries that tend to have a higher number of women are Arts, Entertainment & Recreation (100.0%), Health Care & Social Assistance (88.3%), and Educational Services (82.0%).
| Industry | Male | Female |
| Agriculture, Fishing & Hunting | 262 (91.3%) | 25 (8.7%) |
| Mining, Quarrying, & Extraction | 16 (64.0%) | 9 (36.0%) |
| Construction | 595 (88.1%) | 80 (11.8%) |
| Manufacturing | 889 (74.3%) | 307 (25.7%) |
| Wholesale Trade | 34 (100.0%) | 0 (0.0%) |
| Retail Trade | 333 (42.7%) | 446 (57.3%) |
| Transportation & Warehousing | 203 (94.9%) | 11 (5.1%) |
| Utilities | 137 (88.4%) | 18 (11.6%) |
| Information | 5 (100.0%) | 0 (0.0%) |
| Finance & Insurance | 61 (41.2%) | 87 (58.8%) |
| Real Estate, Rental & Leasing | 6 (42.9%) | 8 (57.1%) |
| Professional & Scientific | 51 (59.3%) | 35 (40.7%) |
| Enterprise Management | 0 (0.0%) | 0 (0.0%) |
| Administrative & Support | 161 (88.5%) | 21 (11.5%) |
| Educational Services | 87 (18.0%) | 396 (82.0%) |
| Health Care & Social Assistance | 113 (11.7%) | 853 (88.3%) |
| Arts, Entertainment & Recreation | 0 (0.0%) | 14 (100.0%) |
| Accommodation & Food Services | 105 (39.6%) | 160 (60.4%) |
| Public Administration | 135 (61.4%) | 85 (38.6%) |
| Total | 3,306 (54.6%) | 2,743 (45.4%) |
Education in Fleming County
School Enrollment in Fleming County
The most common levels of schooling among the 3,239 students in Fleming County are elementary school (889 | 27.5%), middle school (726 | 22.4%), and high school (704 | 21.7%).

| School Level | # Students | % Students |
| Nursery / Preschool | 182 | 5.6% |
| Kindergarten | 238 | 7.3% |
| Elementary School | 889 | 27.5% |
| Middle School | 726 | 22.4% |
| High School | 704 | 21.7% |
| College / Undergraduate | 422 | 13.0% |
| Graduate / Professional | 78 | 2.4% |
| Total | 3,239 | 100.0% |
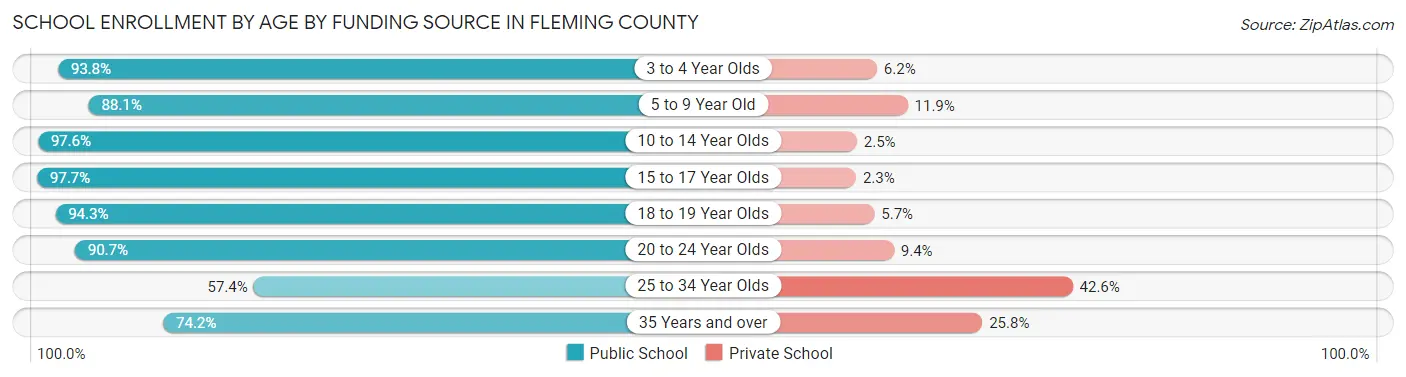
School Enrollment by Age by Funding Source in Fleming County
Out of a total of 3,239 students who are enrolled in schools in Fleming County, 259 (8.0%) attend a private institution, while the remaining 2,980 (92.0%) are enrolled in public schools. The age group of 25 to 34 year olds has the highest likelihood of being enrolled in private schools, with 55 (42.6% in the age bracket) enrolled. Conversely, the age group of 15 to 17 year olds has the lowest likelihood of being enrolled in a private school, with 597 (97.7% in the age bracket) attending a public institution.
| Age Bracket | Public School | Private School |
| 3 to 4 Year Olds | 106 (93.8%) | 7 (6.2%) |
| 5 to 9 Year Old | 836 (88.1%) | 113 (11.9%) |
| 10 to 14 Year Olds | 996 (97.6%) | 25 (2.5%) |
| 15 to 17 Year Olds | 597 (97.7%) | 14 (2.3%) |
| 18 to 19 Year Olds | 132 (94.3%) | 8 (5.7%) |
| 20 to 24 Year Olds | 194 (90.6%) | 20 (9.3%) |
| 25 to 34 Year Olds | 74 (57.4%) | 55 (42.6%) |
| 35 Years and over | 46 (74.2%) | 16 (25.8%) |
| Total | 2,980 (92.0%) | 259 (8.0%) |
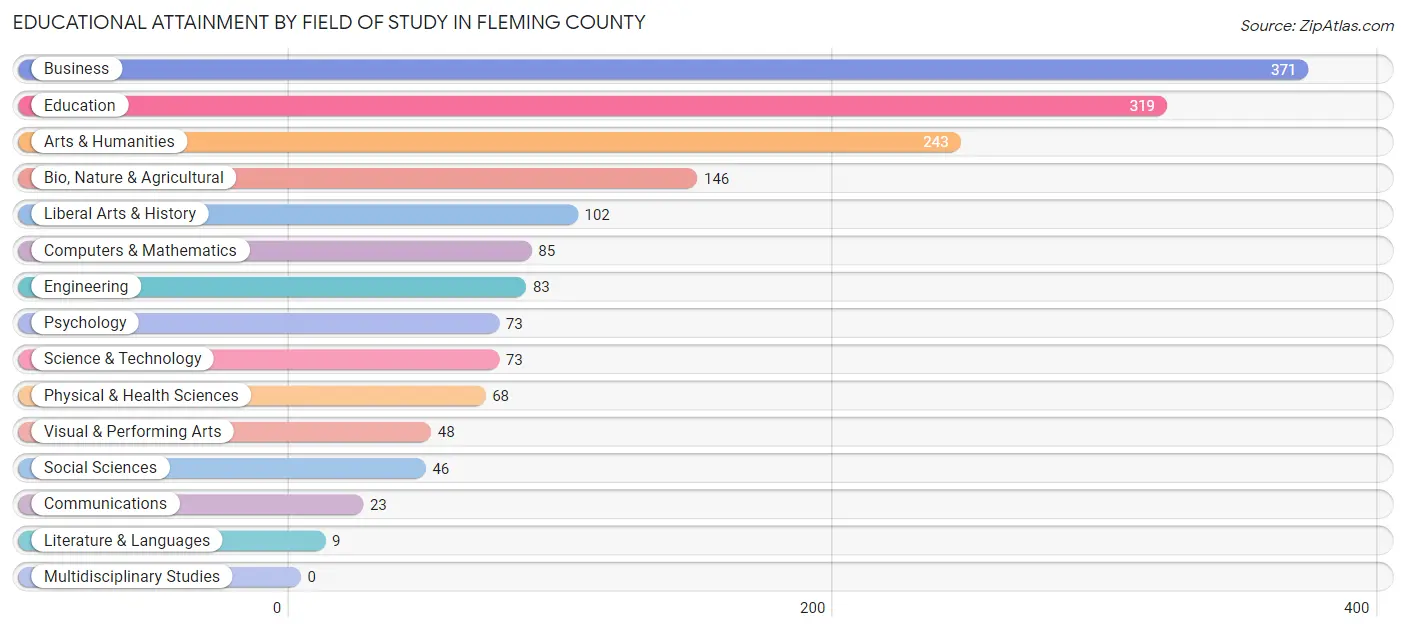
Educational Attainment by Field of Study in Fleming County
Business (371 | 22.0%), education (319 | 18.9%), arts & humanities (243 | 14.4%), bio, nature & agricultural (146 | 8.6%), and liberal arts & history (102 | 6.0%) are the most common fields of study among 1,689 individuals in Fleming County who have obtained a bachelor's degree or higher.
| Field of Study | # Graduates | % Graduates |
| Computers & Mathematics | 85 | 5.0% |
| Bio, Nature & Agricultural | 146 | 8.6% |
| Physical & Health Sciences | 68 | 4.0% |
| Psychology | 73 | 4.3% |
| Social Sciences | 46 | 2.7% |
| Engineering | 83 | 4.9% |
| Multidisciplinary Studies | 0 | 0.0% |
| Science & Technology | 73 | 4.3% |
| Business | 371 | 22.0% |
| Education | 319 | 18.9% |
| Literature & Languages | 9 | 0.5% |
| Liberal Arts & History | 102 | 6.0% |
| Visual & Performing Arts | 48 | 2.8% |
| Communications | 23 | 1.4% |
| Arts & Humanities | 243 | 14.4% |
| Total | 1,689 | 100.0% |
Transportation & Commute in Fleming County
Vehicle Availability by Sex in Fleming County
The most prevalent vehicle ownership categories in Fleming County are males with 2 vehicles (1,310, accounting for 40.9%) and females with 2 vehicles (983, making up 49.2%).

| Vehicles Available | Male | Female |
| No Vehicle | 148 (4.6%) | 45 (1.7%) |
| 1 Vehicle | 416 (13.0%) | 410 (15.4%) |
| 2 Vehicles | 1,310 (40.9%) | 983 (36.9%) |
| 3 Vehicles | 814 (25.4%) | 808 (30.3%) |
| 4 Vehicles | 374 (11.7%) | 286 (10.7%) |
| 5 or more Vehicles | 138 (4.3%) | 133 (5.0%) |
| Total | 3,200 (100.0%) | 2,665 (100.0%) |
Commute Time in Fleming County
The most frequently occuring commute durations in Fleming County are 15 to 19 minutes (860 commuters, 15.8%), 30 to 34 minutes (653 commuters, 12.0%), and 5 to 9 minutes (614 commuters, 11.3%).

| Commute Time | # Commuters | % Commuters |
| Less than 5 Minutes | 322 | 5.9% |
| 5 to 9 Minutes | 614 | 11.3% |
| 10 to 14 Minutes | 516 | 9.5% |
| 15 to 19 Minutes | 860 | 15.8% |
| 20 to 24 Minutes | 472 | 8.7% |
| 25 to 29 Minutes | 229 | 4.2% |
| 30 to 34 Minutes | 653 | 12.0% |
| 35 to 39 Minutes | 85 | 1.6% |
| 40 to 44 Minutes | 249 | 4.6% |
| 45 to 59 Minutes | 453 | 8.3% |
| 60 to 89 Minutes | 409 | 7.5% |
| 90 or more Minutes | 589 | 10.8% |
Commute Time by Sex in Fleming County
The most common commute times in Fleming County are 90 or more minutes (466 commuters, 15.7%) for males and 15 to 19 minutes (476 commuters, 19.2%) for females.
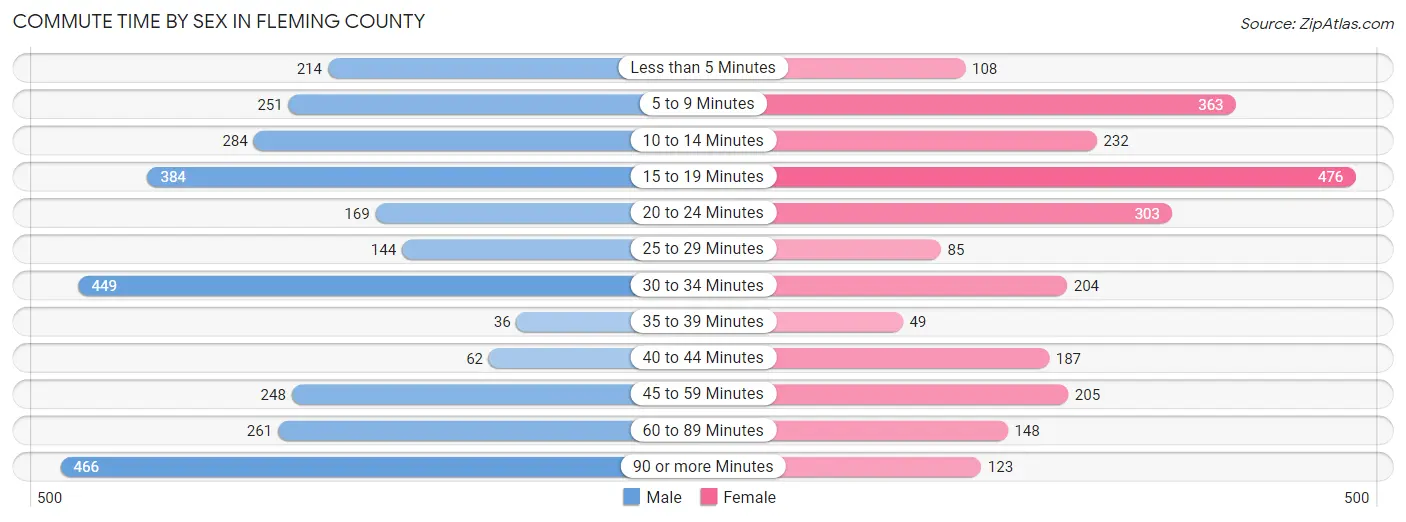
| Commute Time | Male | Female |
| Less than 5 Minutes | 214 (7.2%) | 108 (4.3%) |
| 5 to 9 Minutes | 251 (8.5%) | 363 (14.6%) |
| 10 to 14 Minutes | 284 (9.6%) | 232 (9.3%) |
| 15 to 19 Minutes | 384 (12.9%) | 476 (19.2%) |
| 20 to 24 Minutes | 169 (5.7%) | 303 (12.2%) |
| 25 to 29 Minutes | 144 (4.9%) | 85 (3.4%) |
| 30 to 34 Minutes | 449 (15.1%) | 204 (8.2%) |
| 35 to 39 Minutes | 36 (1.2%) | 49 (2.0%) |
| 40 to 44 Minutes | 62 (2.1%) | 187 (7.5%) |
| 45 to 59 Minutes | 248 (8.4%) | 205 (8.3%) |
| 60 to 89 Minutes | 261 (8.8%) | 148 (6.0%) |
| 90 or more Minutes | 466 (15.7%) | 123 (5.0%) |
Time of Departure to Work by Sex in Fleming County
The most frequent times of departure to work in Fleming County are 7:00 AM to 7:29 AM (542, 18.3%) for males and 7:00 AM to 7:29 AM (638, 25.7%) for females.
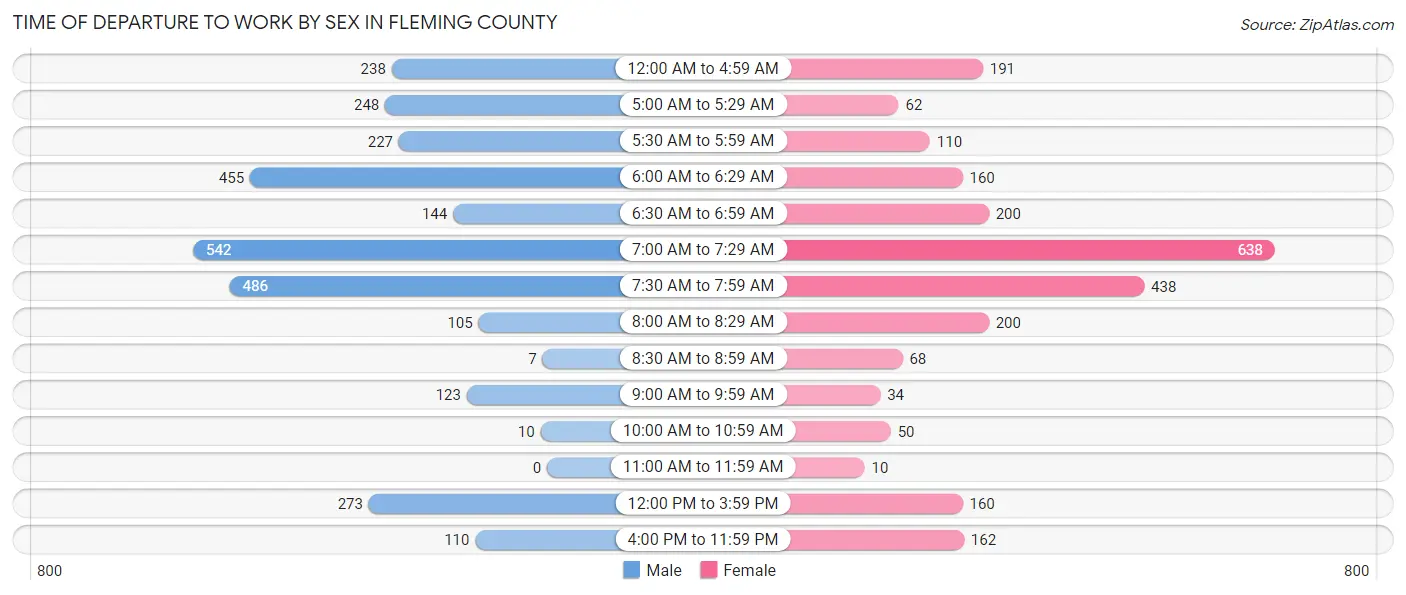
| Time of Departure | Male | Female |
| 12:00 AM to 4:59 AM | 238 (8.0%) | 191 (7.7%) |
| 5:00 AM to 5:29 AM | 248 (8.4%) | 62 (2.5%) |
| 5:30 AM to 5:59 AM | 227 (7.6%) | 110 (4.4%) |
| 6:00 AM to 6:29 AM | 455 (15.3%) | 160 (6.4%) |
| 6:30 AM to 6:59 AM | 144 (4.9%) | 200 (8.1%) |
| 7:00 AM to 7:29 AM | 542 (18.3%) | 638 (25.7%) |
| 7:30 AM to 7:59 AM | 486 (16.4%) | 438 (17.6%) |
| 8:00 AM to 8:29 AM | 105 (3.5%) | 200 (8.1%) |
| 8:30 AM to 8:59 AM | 7 (0.2%) | 68 (2.7%) |
| 9:00 AM to 9:59 AM | 123 (4.1%) | 34 (1.4%) |
| 10:00 AM to 10:59 AM | 10 (0.3%) | 50 (2.0%) |
| 11:00 AM to 11:59 AM | 0 (0.0%) | 10 (0.4%) |
| 12:00 PM to 3:59 PM | 273 (9.2%) | 160 (6.4%) |
| 4:00 PM to 11:59 PM | 110 (3.7%) | 162 (6.5%) |
| Total | 2,968 (100.0%) | 2,483 (100.0%) |
Housing Occupancy in Fleming County
Occupancy by Ownership in Fleming County
Of the total 5,747 dwellings in Fleming County, owner-occupied units account for 4,279 (74.5%), while renter-occupied units make up 1,468 (25.5%).

| Occupancy | # Housing Units | % Housing Units |
| Owner Occupied Housing Units | 4,279 | 74.5% |
| Renter-Occupied Housing Units | 1,468 | 25.5% |
| Total Occupied Housing Units | 5,747 | 100.0% |
Occupancy by Household Size in Fleming County

| Household Size | # Housing Units | % Housing Units |
| 1-Person Household | 1,410 | 24.5% |
| 2-Person Household | 2,344 | 40.8% |
| 3-Person Household | 837 | 14.6% |
| 4+ Person Household | 1,156 | 20.1% |
| Total Housing Units | 5,747 | 100.0% |
Occupancy by Ownership by Household Size in Fleming County
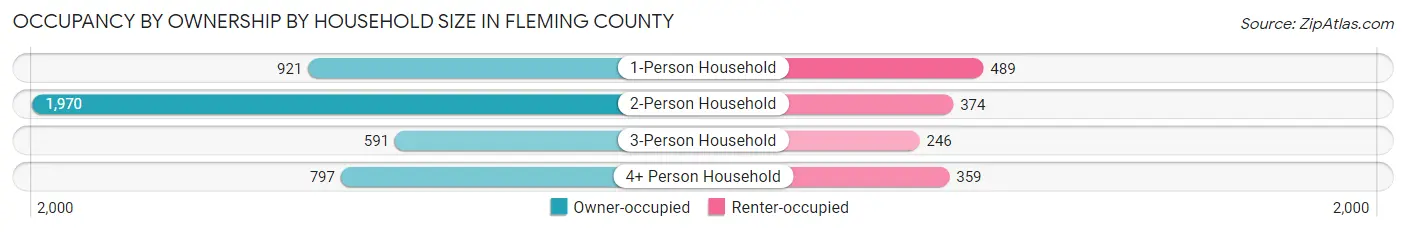
| Household Size | Owner-occupied | Renter-occupied |
| 1-Person Household | 921 (65.3%) | 489 (34.7%) |
| 2-Person Household | 1,970 (84.0%) | 374 (16.0%) |
| 3-Person Household | 591 (70.6%) | 246 (29.4%) |
| 4+ Person Household | 797 (68.9%) | 359 (31.1%) |
| Total Housing Units | 4,279 (74.5%) | 1,468 (25.5%) |
Occupancy by Educational Attainment in Fleming County

| Household Size | Owner-occupied | Renter-occupied |
| Less than High School | 623 (58.5%) | 442 (41.5%) |
| High School Diploma | 1,809 (80.6%) | 436 (19.4%) |
| College/Associate Degree | 1,086 (71.7%) | 429 (28.3%) |
| Bachelor's Degree or higher | 761 (82.5%) | 161 (17.5%) |
Occupancy by Age of Householder in Fleming County

| Age Bracket | # Households | % Households |
| Under 35 Years | 1,031 | 17.9% |
| 35 to 44 Years | 781 | 13.6% |
| 45 to 54 Years | 1,032 | 18.0% |
| 55 to 64 Years | 1,072 | 18.6% |
| 65 to 74 Years | 1,045 | 18.2% |
| 75 to 84 Years | 551 | 9.6% |
| 85 Years and Over | 235 | 4.1% |
| Total | 5,747 | 100.0% |
Housing Finances in Fleming County
Median Income by Occupancy in Fleming County

| Occupancy Type | # Households | Median Income |
| Owner-Occupied | 4,279 (74.5%) | $56,385 |
| Renter-Occupied | 1,468 (25.5%) | $28,950 |
| Average | 5,747 (100.0%) | $46,885 |
Occupancy by Householder Income Bracket in Fleming County
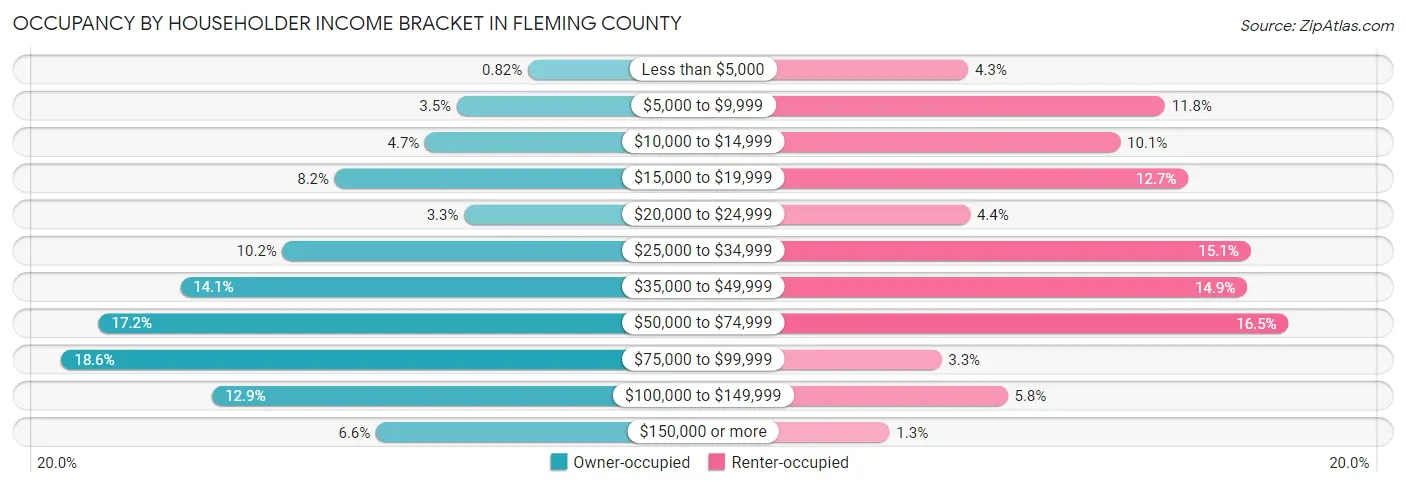
| Income Bracket | Owner-occupied | Renter-occupied |
| Less than $5,000 | 35 (0.8%) | 63 (4.3%) |
| $5,000 to $9,999 | 151 (3.5%) | 173 (11.8%) |
| $10,000 to $14,999 | 203 (4.7%) | 148 (10.1%) |
| $15,000 to $19,999 | 350 (8.2%) | 186 (12.7%) |
| $20,000 to $24,999 | 139 (3.3%) | 64 (4.4%) |
| $25,000 to $34,999 | 435 (10.2%) | 221 (15.0%) |
| $35,000 to $49,999 | 602 (14.1%) | 219 (14.9%) |
| $50,000 to $74,999 | 735 (17.2%) | 242 (16.5%) |
| $75,000 to $99,999 | 796 (18.6%) | 48 (3.3%) |
| $100,000 to $149,999 | 550 (12.9%) | 85 (5.8%) |
| $150,000 or more | 283 (6.6%) | 19 (1.3%) |
| Total | 4,279 (100.0%) | 1,468 (100.0%) |
Monthly Housing Cost Tiers in Fleming County
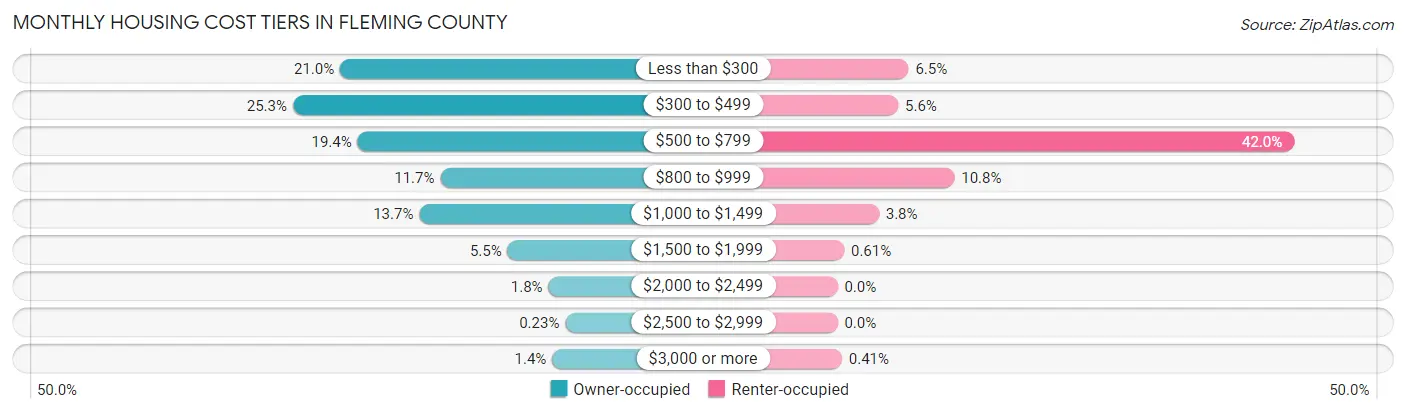
| Monthly Cost | Owner-occupied | Renter-occupied |
| Less than $300 | 897 (21.0%) | 96 (6.5%) |
| $300 to $499 | 1,083 (25.3%) | 82 (5.6%) |
| $500 to $799 | 828 (19.4%) | 617 (42.0%) |
| $800 to $999 | 502 (11.7%) | 158 (10.8%) |
| $1,000 to $1,499 | 585 (13.7%) | 56 (3.8%) |
| $1,500 to $1,999 | 237 (5.5%) | 9 (0.6%) |
| $2,000 to $2,499 | 76 (1.8%) | 0 (0.0%) |
| $2,500 to $2,999 | 10 (0.2%) | 0 (0.0%) |
| $3,000 or more | 61 (1.4%) | 6 (0.4%) |
| Total | 4,279 (100.0%) | 1,468 (100.0%) |
Physical Housing Characteristics in Fleming County
Housing Structures in Fleming County
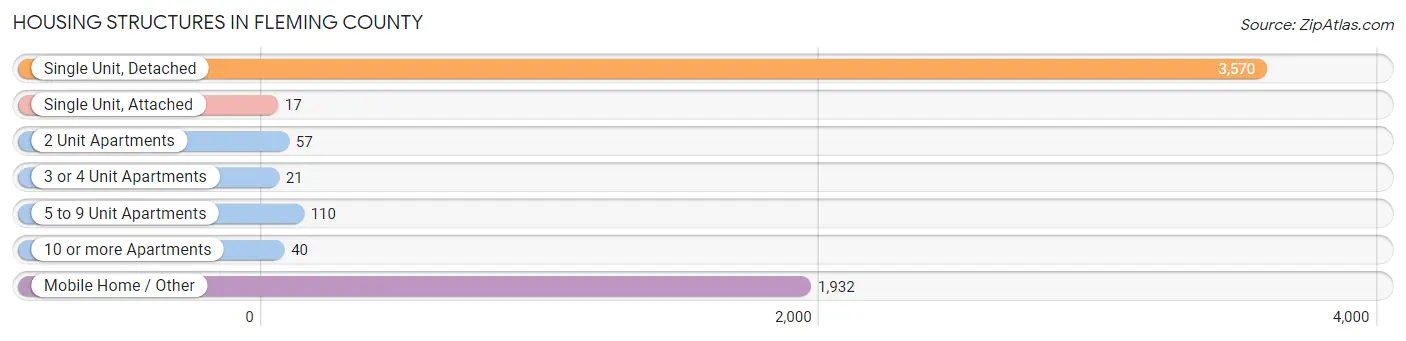
| Structure Type | # Housing Units | % Housing Units |
| Single Unit, Detached | 3,570 | 62.1% |
| Single Unit, Attached | 17 | 0.3% |
| 2 Unit Apartments | 57 | 1.0% |
| 3 or 4 Unit Apartments | 21 | 0.4% |
| 5 to 9 Unit Apartments | 110 | 1.9% |
| 10 or more Apartments | 40 | 0.7% |
| Mobile Home / Other | 1,932 | 33.6% |
| Total | 5,747 | 100.0% |
Housing Structures by Occupancy in Fleming County
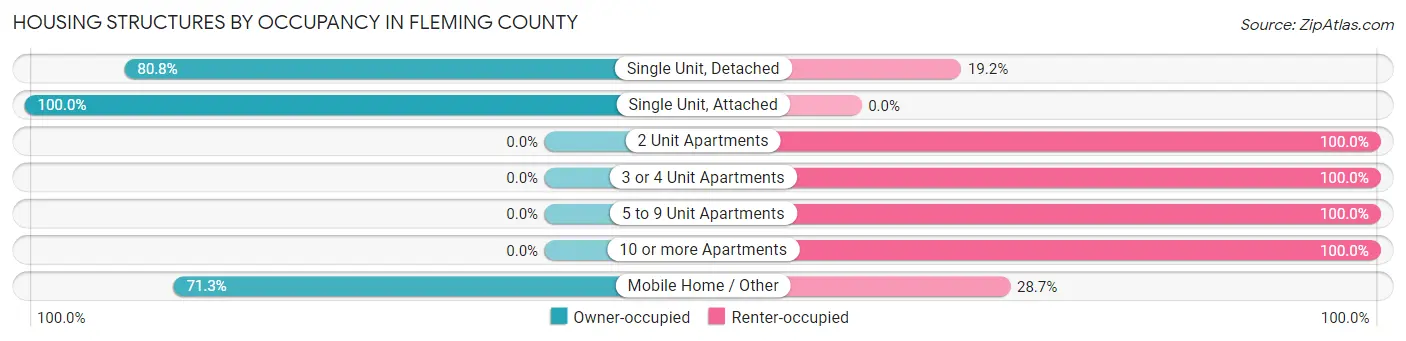
| Structure Type | Owner-occupied | Renter-occupied |
| Single Unit, Detached | 2,884 (80.8%) | 686 (19.2%) |
| Single Unit, Attached | 17 (100.0%) | 0 (0.0%) |
| 2 Unit Apartments | 0 (0.0%) | 57 (100.0%) |
| 3 or 4 Unit Apartments | 0 (0.0%) | 21 (100.0%) |
| 5 to 9 Unit Apartments | 0 (0.0%) | 110 (100.0%) |
| 10 or more Apartments | 0 (0.0%) | 40 (100.0%) |
| Mobile Home / Other | 1,378 (71.3%) | 554 (28.7%) |
| Total | 4,279 (74.5%) | 1,468 (25.5%) |
Housing Structures by Number of Rooms in Fleming County
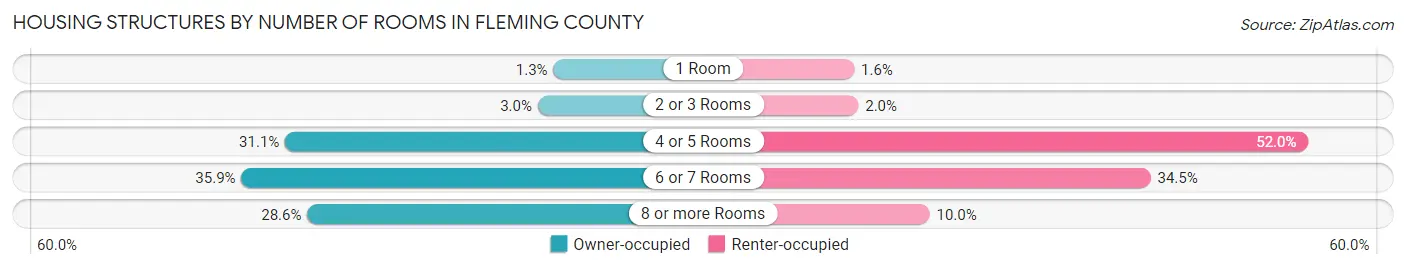
| Number of Rooms | Owner-occupied | Renter-occupied |
| 1 Room | 56 (1.3%) | 23 (1.6%) |
| 2 or 3 Rooms | 130 (3.0%) | 30 (2.0%) |
| 4 or 5 Rooms | 1,330 (31.1%) | 763 (52.0%) |
| 6 or 7 Rooms | 1,538 (35.9%) | 506 (34.5%) |
| 8 or more Rooms | 1,225 (28.6%) | 146 (10.0%) |
| Total | 4,279 (100.0%) | 1,468 (100.0%) |
Housing Structure by Heating Type in Fleming County
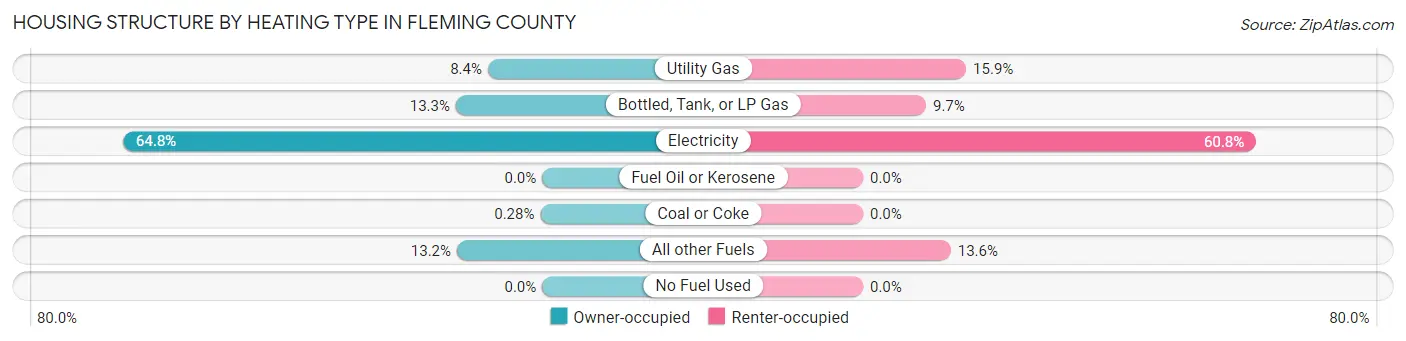
| Heating Type | Owner-occupied | Renter-occupied |
| Utility Gas | 359 (8.4%) | 234 (15.9%) |
| Bottled, Tank, or LP Gas | 571 (13.3%) | 143 (9.7%) |
| Electricity | 2,773 (64.8%) | 892 (60.8%) |
| Fuel Oil or Kerosene | 0 (0.0%) | 0 (0.0%) |
| Coal or Coke | 12 (0.3%) | 0 (0.0%) |
| All other Fuels | 564 (13.2%) | 199 (13.6%) |
| No Fuel Used | 0 (0.0%) | 0 (0.0%) |
| Total | 4,279 (100.0%) | 1,468 (100.0%) |
Household Vehicle Usage in Fleming County
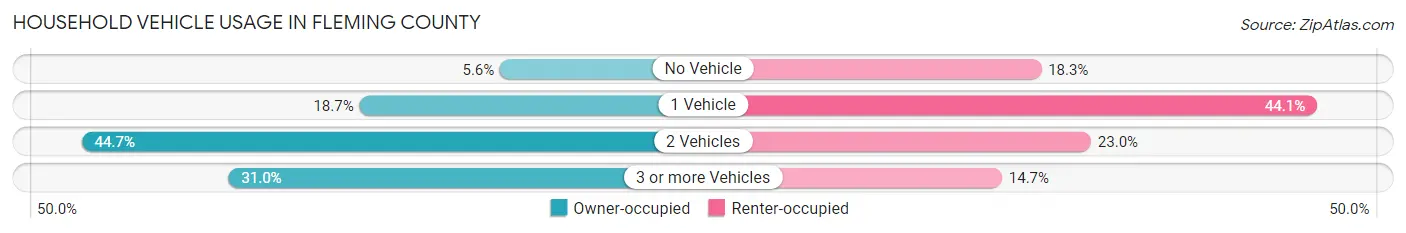
| Vehicles per Household | Owner-occupied | Renter-occupied |
| No Vehicle | 240 (5.6%) | 269 (18.3%) |
| 1 Vehicle | 802 (18.7%) | 647 (44.1%) |
| 2 Vehicles | 1,912 (44.7%) | 337 (23.0%) |
| 3 or more Vehicles | 1,325 (31.0%) | 215 (14.6%) |
| Total | 4,279 (100.0%) | 1,468 (100.0%) |
Real Estate & Mortgages in Fleming County
Real Estate and Mortgage Overview in Fleming County
| Characteristic | Without Mortgage | With Mortgage |
| Housing Units | 2,380 | 1,899 |
| Median Property Value | $98,400 | $121,500 |
| Median Household Income | $45,714 | $140 |
| Monthly Housing Costs | $344 | $61 |
| Real Estate Taxes | $512 | $93 |
Property Value by Mortgage Status in Fleming County
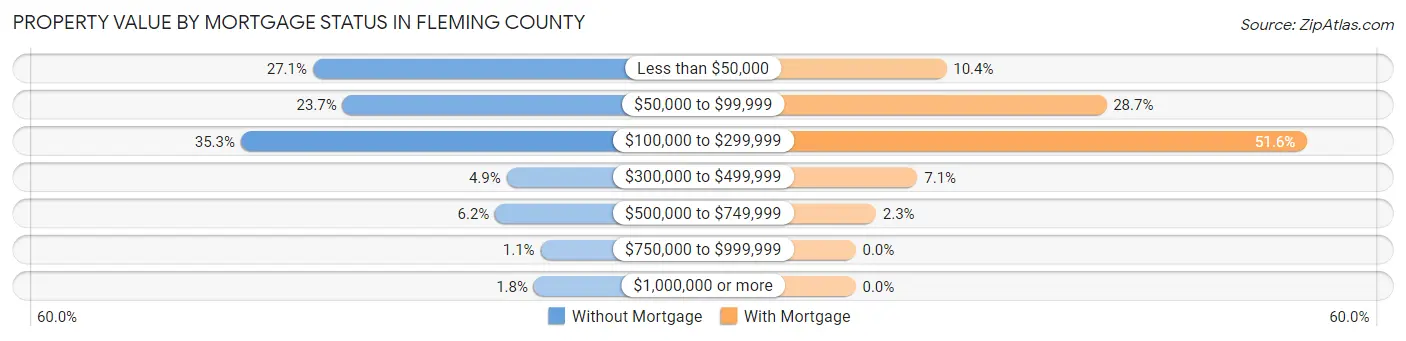
| Property Value | Without Mortgage | With Mortgage |
| Less than $50,000 | 644 (27.1%) | 197 (10.4%) |
| $50,000 to $99,999 | 563 (23.7%) | 544 (28.6%) |
| $100,000 to $299,999 | 840 (35.3%) | 980 (51.6%) |
| $300,000 to $499,999 | 117 (4.9%) | 134 (7.1%) |
| $500,000 to $749,999 | 148 (6.2%) | 44 (2.3%) |
| $750,000 to $999,999 | 25 (1.1%) | 0 (0.0%) |
| $1,000,000 or more | 43 (1.8%) | 0 (0.0%) |
| Total | 2,380 (100.0%) | 1,899 (100.0%) |
Household Income by Mortgage Status in Fleming County

| Household Income | Without Mortgage | With Mortgage |
| Less than $10,000 | 100 (4.2%) | 18 (0.9%) |
| $10,000 to $24,999 | 534 (22.4%) | 86 (4.5%) |
| $25,000 to $34,999 | 291 (12.2%) | 158 (8.3%) |
| $35,000 to $49,999 | 343 (14.4%) | 144 (7.6%) |
| $50,000 to $74,999 | 365 (15.3%) | 259 (13.6%) |
| $75,000 to $99,999 | 352 (14.8%) | 370 (19.5%) |
| $100,000 to $149,999 | 252 (10.6%) | 444 (23.4%) |
| $150,000 or more | 143 (6.0%) | 298 (15.7%) |
| Total | 2,380 (100.0%) | 1,899 (100.0%) |
Property Value to Household Income Ratio in Fleming County

| Value-to-Income Ratio | Without Mortgage | With Mortgage |
| Less than 2.0x | 1,216 (51.1%) | 68,277 (3,595.4%) |
| 2.0x to 2.9x | 339 (14.2%) | 984 (51.8%) |
| 3.0x to 3.9x | 192 (8.1%) | 401 (21.1%) |
| 4.0x or more | 607 (25.5%) | 167 (8.8%) |
| Total | 2,380 (100.0%) | 1,899 (100.0%) |
Real Estate Taxes by Mortgage Status in Fleming County

| Property Taxes | Without Mortgage | With Mortgage |
| Less than $800 | 1,363 (57.3%) | 9 (0.5%) |
| $800 to $1,499 | 510 (21.4%) | 711 (37.4%) |
| $800 to $1,499 | 257 (10.8%) | 736 (38.8%) |
| Total | 2,380 (100.0%) | 1,899 (100.0%) |
Health & Disability in Fleming County
Health Insurance Coverage by Age in Fleming County
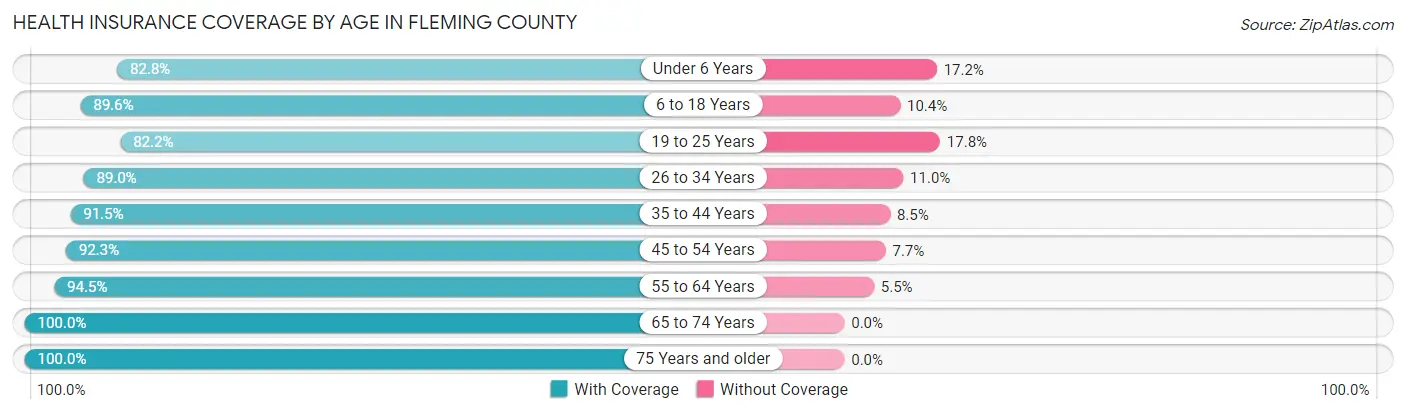
| Age Bracket | With Coverage | Without Coverage |
| Under 6 Years | 1,009 (82.8%) | 210 (17.2%) |
| 6 to 18 Years | 2,319 (89.6%) | 269 (10.4%) |
| 19 to 25 Years | 1,152 (82.2%) | 250 (17.8%) |
| 26 to 34 Years | 1,241 (89.0%) | 153 (11.0%) |
| 35 to 44 Years | 1,547 (91.5%) | 144 (8.5%) |
| 45 to 54 Years | 1,825 (92.3%) | 152 (7.7%) |
| 55 to 64 Years | 1,972 (94.5%) | 115 (5.5%) |
| 65 to 74 Years | 1,679 (100.0%) | 0 (0.0%) |
| 75 Years and older | 1,053 (100.0%) | 0 (0.0%) |
| Total | 13,797 (91.4%) | 1,293 (8.6%) |
Health Insurance Coverage by Citizenship Status in Fleming County
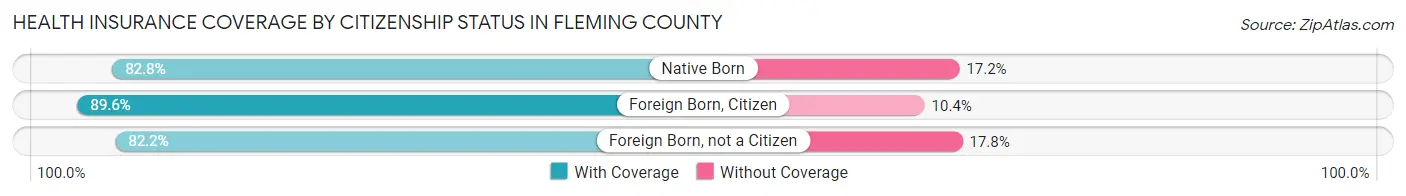
| Citizenship Status | With Coverage | Without Coverage |
| Native Born | 1,009 (82.8%) | 210 (17.2%) |
| Foreign Born, Citizen | 2,319 (89.6%) | 269 (10.4%) |
| Foreign Born, not a Citizen | 1,152 (82.2%) | 250 (17.8%) |
Health Insurance Coverage by Household Income in Fleming County

| Household Income | With Coverage | Without Coverage |
| Under $25,000 | 2,812 (95.0%) | 149 (5.0%) |
| $25,000 to $49,999 | 3,446 (89.6%) | 401 (10.4%) |
| $50,000 to $74,999 | 2,564 (97.5%) | 65 (2.5%) |
| $75,000 to $99,999 | 2,157 (91.5%) | 199 (8.5%) |
| $100,000 and over | 2,783 (85.4%) | 477 (14.6%) |
Public vs Private Health Insurance Coverage by Age in Fleming County
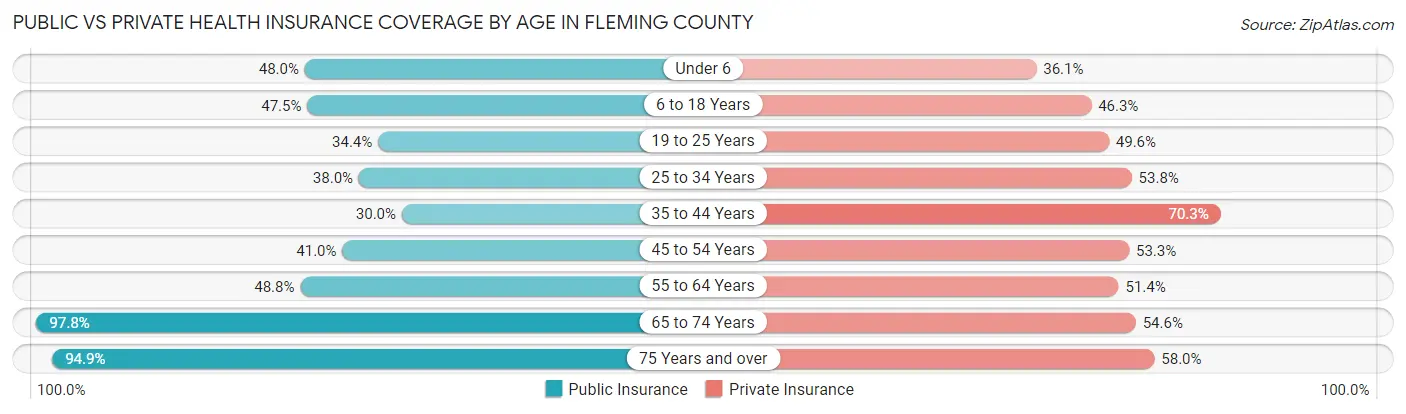
| Age Bracket | Public Insurance | Private Insurance |
| Under 6 | 585 (48.0%) | 440 (36.1%) |
| 6 to 18 Years | 1,230 (47.5%) | 1,198 (46.3%) |
| 19 to 25 Years | 482 (34.4%) | 695 (49.6%) |
| 25 to 34 Years | 529 (38.0%) | 750 (53.8%) |
| 35 to 44 Years | 507 (30.0%) | 1,189 (70.3%) |
| 45 to 54 Years | 811 (41.0%) | 1,054 (53.3%) |
| 55 to 64 Years | 1,019 (48.8%) | 1,072 (51.4%) |
| 65 to 74 Years | 1,642 (97.8%) | 916 (54.6%) |
| 75 Years and over | 999 (94.9%) | 611 (58.0%) |
| Total | 7,804 (51.7%) | 7,925 (52.5%) |
Disability Status by Sex by Age in Fleming County

| Age Bracket | Male | Female |
| Under 5 Years | 0 (0.0%) | 0 (0.0%) |
| 5 to 17 Years | 166 (11.8%) | 22 (1.7%) |
| 18 to 34 Years | 266 (17.7%) | 182 (13.0%) |
| 35 to 64 Years | 606 (20.9%) | 767 (26.9%) |
| 65 to 74 Years | 352 (43.2%) | 209 (24.2%) |
| 75 Years and over | 207 (43.7%) | 342 (59.1%) |
Disability Class by Sex by Age in Fleming County
Disability Class: Hearing Difficulty

| Age Bracket | Male | Female |
| Under 5 Years | 0 (0.0%) | 0 (0.0%) |
| 5 to 17 Years | 7 (0.5%) | 0 (0.0%) |
| 18 to 34 Years | 99 (6.6%) | 11 (0.8%) |
| 35 to 64 Years | 144 (5.0%) | 158 (5.5%) |
| 65 to 74 Years | 183 (22.5%) | 34 (3.9%) |
| 75 Years and over | 114 (24.0%) | 69 (11.9%) |
Disability Class: Vision Difficulty

| Age Bracket | Male | Female |
| Under 5 Years | 0 (0.0%) | 0 (0.0%) |
| 5 to 17 Years | 11 (0.8%) | 0 (0.0%) |
| 18 to 34 Years | 50 (3.3%) | 50 (3.6%) |
| 35 to 64 Years | 135 (4.6%) | 146 (5.1%) |
| 65 to 74 Years | 28 (3.4%) | 20 (2.3%) |
| 75 Years and over | 45 (9.5%) | 14 (2.4%) |
Disability Class: Cognitive Difficulty
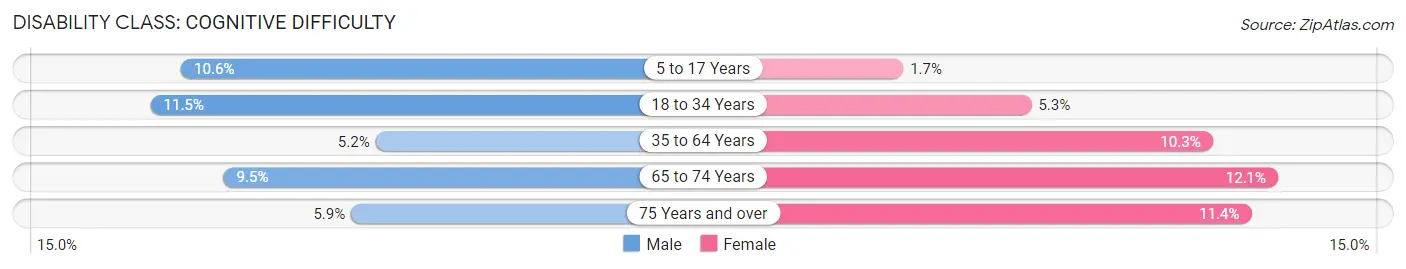
| Age Bracket | Male | Female |
| 5 to 17 Years | 149 (10.6%) | 22 (1.7%) |
| 18 to 34 Years | 173 (11.5%) | 74 (5.3%) |
| 35 to 64 Years | 152 (5.2%) | 294 (10.3%) |
| 65 to 74 Years | 77 (9.5%) | 105 (12.1%) |
| 75 Years and over | 28 (5.9%) | 66 (11.4%) |
Disability Class: Ambulatory Difficulty
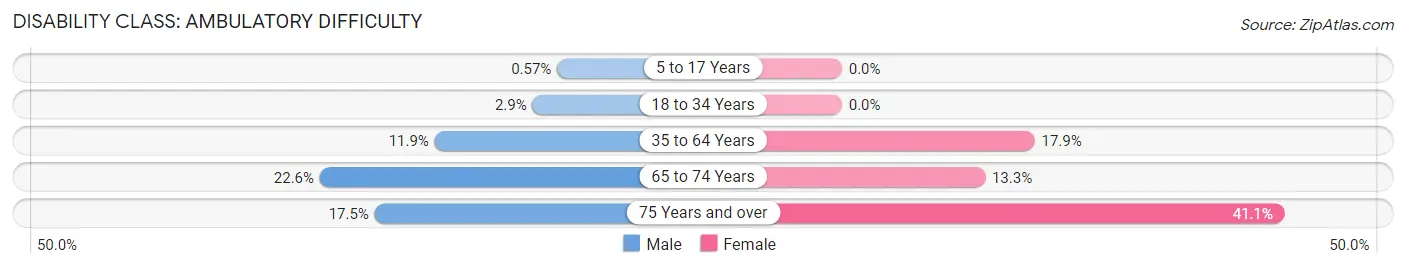
| Age Bracket | Male | Female |
| 5 to 17 Years | 8 (0.6%) | 0 (0.0%) |
| 18 to 34 Years | 43 (2.9%) | 0 (0.0%) |
| 35 to 64 Years | 347 (11.9%) | 510 (17.9%) |
| 65 to 74 Years | 184 (22.6%) | 115 (13.3%) |
| 75 Years and over | 83 (17.5%) | 238 (41.1%) |
Disability Class: Self-Care Difficulty

| Age Bracket | Male | Female |
| 5 to 17 Years | 8 (0.6%) | 0 (0.0%) |
| 18 to 34 Years | 10 (0.7%) | 0 (0.0%) |
| 35 to 64 Years | 38 (1.3%) | 36 (1.3%) |
| 65 to 74 Years | 35 (4.3%) | 29 (3.4%) |
| 75 Years and over | 39 (8.2%) | 48 (8.3%) |
Technology Access in Fleming County
Computing Device Access in Fleming County

| Device Type | # Households | % Households |
| Desktop or Laptop | 3,620 | 63.0% |
| Smartphone | 4,440 | 77.3% |
| Tablet | 2,900 | 50.5% |
| No Computing Device | 924 | 16.1% |
| Total | 5,747 | 100.0% |
Internet Access in Fleming County

| Internet Type | # Households | % Households |
| Dial-Up Internet | 7 | 0.1% |
| Broadband Home | 3,179 | 55.3% |
| Cellular Data Only | 796 | 13.9% |
| Satellite Internet | 470 | 8.2% |
| No Internet | 1,348 | 23.5% |
| Total | 5,747 | 100.0% |
Fleming County Summary
Fleming County is a county located in the U.S. state of Kentucky. As of the 2010 census, the population was 14,348. The county seat is Flemingsburg. The county was formed in 1798 and is named for Colonel John Fleming, an early settler and soldier.
Geography
Fleming County is located in the Eastern Coal Field region of Kentucky. It is bordered by Mason County to the north, Lewis County to the east, Rowan County to the south, and Robertson County to the west. The county has a total area of 286 square miles, of which 285 square miles is land and 1 square mile (0.4%) is water.
The county is located in the foothills of the Appalachian Mountains and is mostly hilly. The highest point in the county is located in the northwest corner, near the Mason County line, and has an elevation of 1,068 feet. The county is drained by the Licking River, which flows through the county from north to south.
Demographics
As of the 2010 census, there were 14,348 people, 5,717 households, and 4,072 families residing in the county. The population density was 50.3 people per square mile. There were 6,541 housing units at an average density of 22.9 per square mile. The racial makeup of the county was 97.7% White, 0.9% Black or African American, 0.2% Native American, 0.2% Asian, 0.2% from other races, and 0.8% from two or more races. 0.7% of the population were Hispanic or Latino of any race.
There were 5,717 households, out of which 30.2% had children under the age of 18 living with them, 56.2% were married couples living together, 10.3% had a female householder with no husband present, and 29.2% were non-families. 25.3% of all households were made up of individuals, and 11.2% had someone living alone who was 65 years of age or older. The average household size was 2.48 and the average family size was 2.94.
The age distribution was 23.7% under the age of 18, 8.2% from 18 to 24, 28.2% from 25 to 44, 25.3% from 45 to 64, and 14.6% who were 65 years of age or older. The median age was 38.2 years. For every 100 females, there were 95.2 males. For every 100 females age 18 and over, there were 92.3 males.
The median income for a household in the county was $37,845, and the median income for a family was $45,945. Males had a median income of $37,845 versus $25,945 for females. The per capita income for the county was $18,945. About 11.2% of families and 14.2% of the population were below the poverty line, including 19.2% of those under age 18 and 13.2% of those age 65 or over.
Economy
The economy of Fleming County is largely based on agriculture and manufacturing. The county is home to several large farms, as well as several small family farms. The county is also home to several manufacturing plants, including a paper mill, a furniture factory, and a plastics factory.
The county also has a large tourism industry, with several popular attractions, including the Fleming County Museum, the Fleming County Historical Society, and the Fleming County Fair.
Conclusion
Fleming County is a rural county located in the Eastern Coal Field region of Kentucky. It is bordered by Mason County to the north, Lewis County to the east, Rowan County to the south, and Robertson County to the west. The county has a total area of 286 square miles, of which 285 square miles is land and 1 square mile (0.4%) is water. As of the 2010 census, the population was 14,348. The economy of Fleming County is largely based on agriculture and manufacturing, and the county also has a large tourism industry.
Common Questions
What is the Total Population of Fleming County?
Total Population of Fleming County is 15,111.
What is the Total Male Population of Fleming County?
Total Male Population of Fleming County is 7,576.
What is the Total Female Population of Fleming County?
Total Female Population of Fleming County is 7,535.
What is the Ratio of Males per 100 Females in Fleming County?
There are 100.54 Males per 100 Females in Fleming County.
What is the Ratio of Females per 100 Males in Fleming County?
There are 99.46 Females per 100 Males in Fleming County.
What is the Median Population Age in Fleming County?
Median Population Age in Fleming County is 40.8 Years.
What is the Average Family Size in Fleming County
Average Family Size in Fleming County is 3.1 People.
What is the Average Household Size in Fleming County
Average Household Size in Fleming County is 2.6 People.
What is Per Capita Income in Fleming County?
Per Capita income in Fleming County is $26,230.
What is the Median Family Income in Fleming County?
Median Family Income in Fleming County is $59,724.
What is the Median Household income in Fleming County?
Median Household Income in Fleming County is $46,885.
What is Income or Wage Gap in Fleming County?
Income or Wage Gap in Fleming County is 36.3%.
Women in Fleming County earn 63.7 cents for every dollar earned by a man.
What is Family Income Deficit in Fleming County?
Family Income Deficit in Fleming County is $10,457.
Families that are below poverty line in Fleming County earn $10,457 less on average than the poverty threshold level.
What is Inequality or Gini Index in Fleming County?
Inequality or Gini Index in Fleming County is 0.47.
How Large is the Labor Force in Fleming County?
There are 6,609 People in the Labor Forcein in Fleming County.
What is the Percentage of People in the Labor Force in Fleming County?
55.5% of People are in the Labor Force in Fleming County.
What is the Unemployment Rate in Fleming County?
Unemployment Rate in Fleming County is 8.4%.