Fayette County, KY
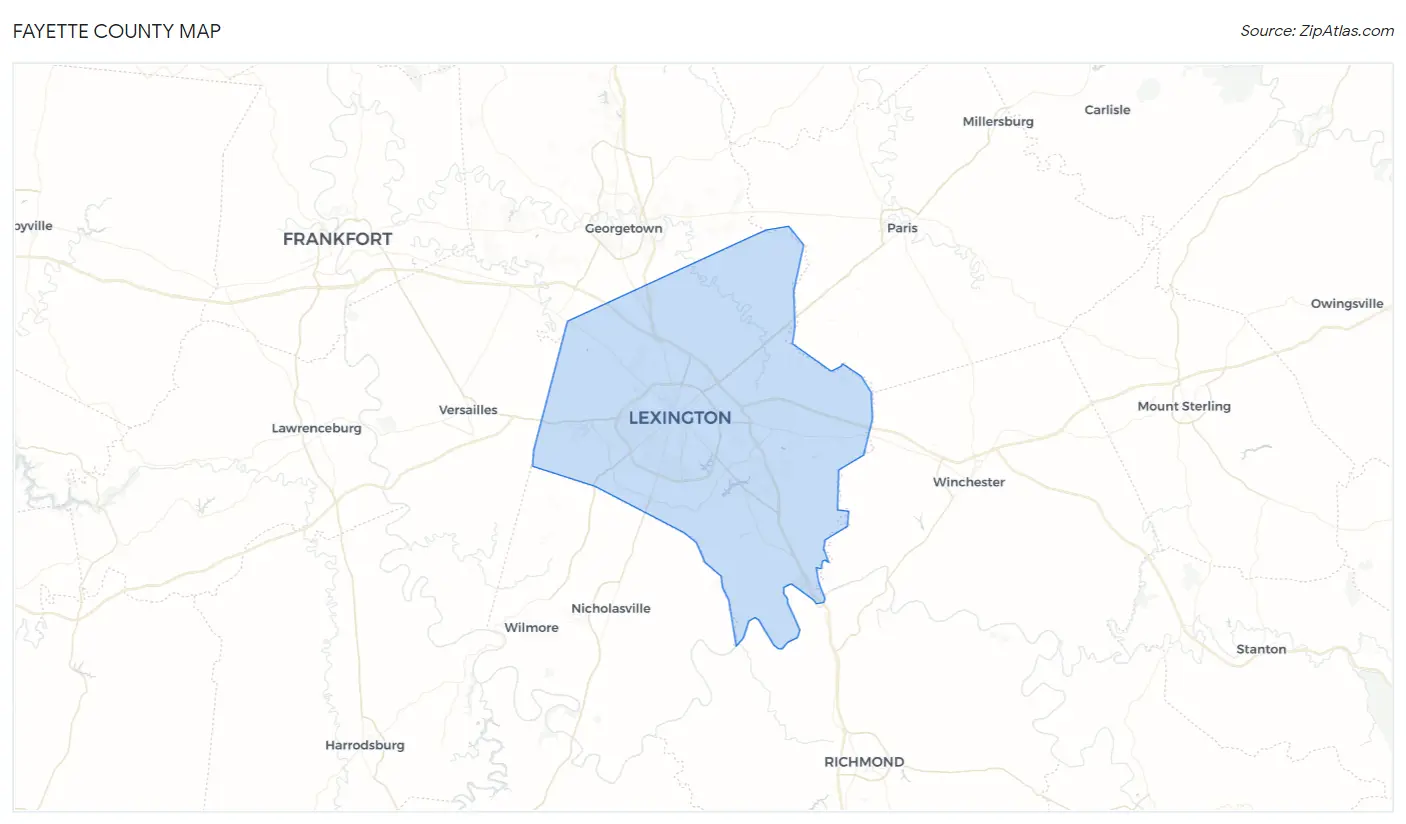
Fayette County Map
Fayette County Overview
321,276
TOTAL POPULATION
158,371
MALE POPULATION
162,905
FEMALE POPULATION
97.22
MALES / 100 FEMALES
102.86
FEMALES / 100 MALES
35.2
MEDIAN AGE
2.9
AVG FAMILY SIZE
2.3
AVG HOUSEHOLD SIZE
$40,953
PER CAPITA INCOME
$91,263
AVG FAMILY INCOME
$66,087
AVG HOUSEHOLD INCOME
23.9%
WAGE / INCOME GAP [ % ]
76.1¢/ $1
WAGE / INCOME GAP [ $ ]
$11,247
FAMILY INCOME DEFICIT
0.49
INEQUALITY / GINI INDEX
178,242
LABOR FORCE [ PEOPLE ]
67.9%
PERCENT IN LABOR FORCE
5.0%
UNEMPLOYMENT RATE
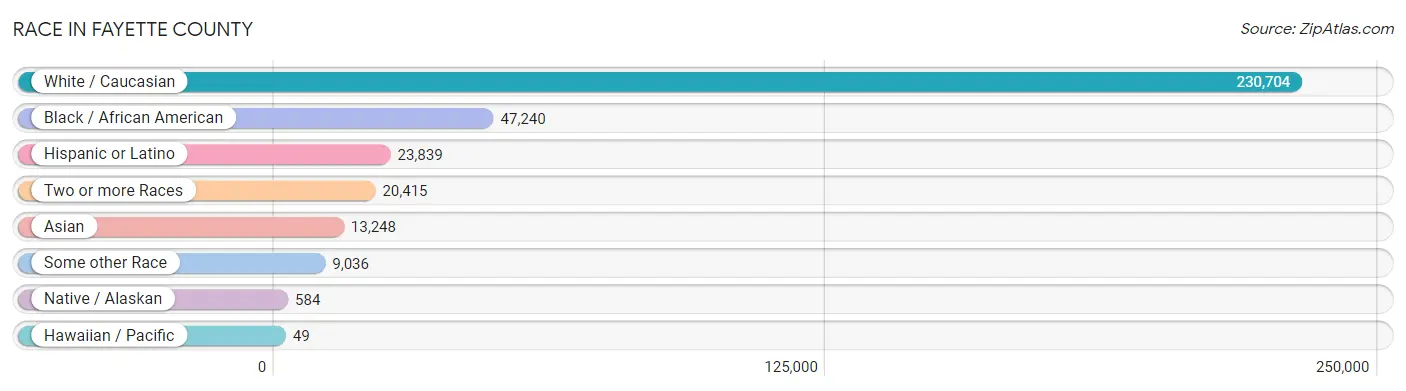
Race in Fayette County
The most populous races in Fayette County are White / Caucasian (230,704 | 71.8%), Black / African American (47,240 | 14.7%), and Hispanic or Latino (23,839 | 7.4%).
| Race | # Population | % Population |
| Asian | 13,248 | 4.1% |
| Black / African American | 47,240 | 14.7% |
| Hawaiian / Pacific | 49 | 0.0% |
| Hispanic or Latino | 23,839 | 7.4% |
| Native / Alaskan | 584 | 0.2% |
| White / Caucasian | 230,704 | 71.8% |
| Two or more Races | 20,415 | 6.4% |
| Some other Race | 9,036 | 2.8% |
| Total | 321,276 | 100.0% |
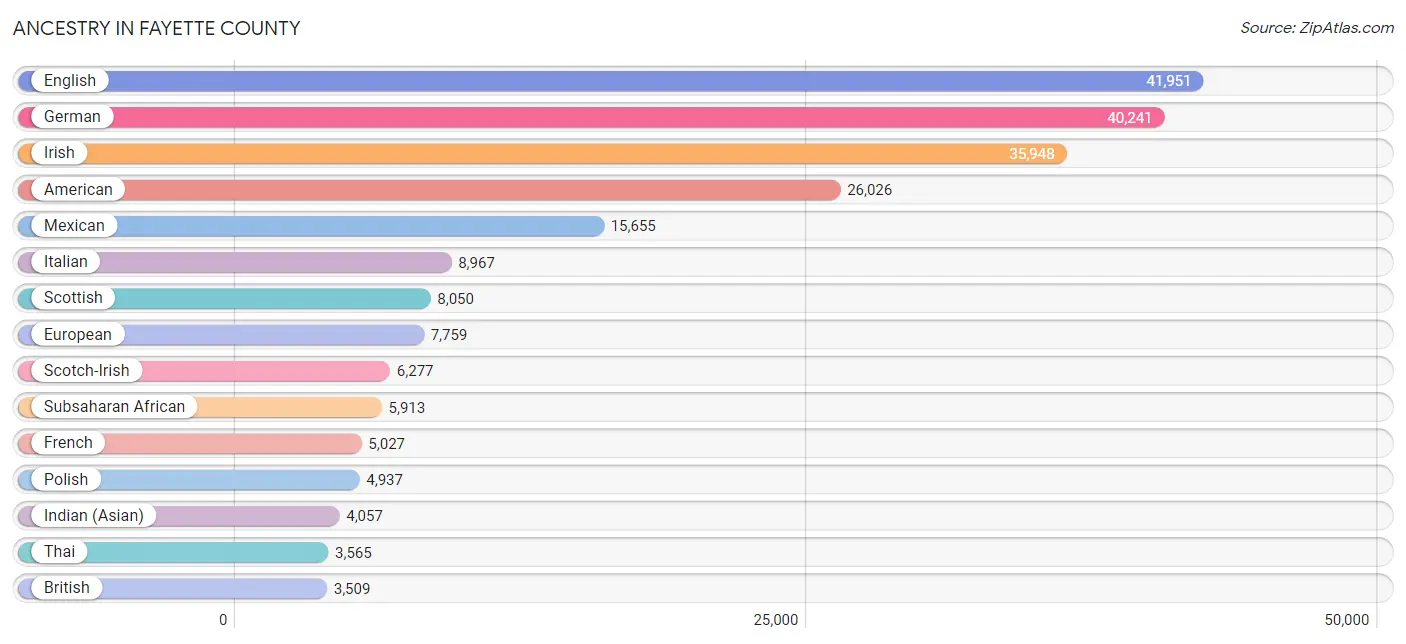
Ancestry in Fayette County
The most populous ancestries reported in Fayette County are English (41,951 | 13.1%), German (40,241 | 12.5%), Irish (35,948 | 11.2%), American (26,026 | 8.1%), and Mexican (15,655 | 4.9%), together accounting for 49.8% of all Fayette County residents.
| Ancestry | # Population | % Population |
| Afghan | 80 | 0.0% |
| African | 1,874 | 0.6% |
| Albanian | 206 | 0.1% |
| Alsatian | 1 | 0.0% |
| American | 26,026 | 8.1% |
| Apache | 29 | 0.0% |
| Arab | 3,100 | 1.0% |
| Argentinean | 138 | 0.0% |
| Armenian | 155 | 0.1% |
| Australian | 72 | 0.0% |
| Austrian | 512 | 0.2% |
| Bahamian | 52 | 0.0% |
| Basque | 16 | 0.0% |
| Belgian | 456 | 0.1% |
| Belizean | 38 | 0.0% |
| Bhutanese | 1,481 | 0.5% |
| Blackfeet | 55 | 0.0% |
| Brazilian | 68 | 0.0% |
| British | 3,509 | 1.1% |
| Bulgarian | 236 | 0.1% |
| Burmese | 1,215 | 0.4% |
| Cajun | 135 | 0.0% |
| Cambodian | 43 | 0.0% |
| Canadian | 454 | 0.1% |
| Cape Verdean | 70 | 0.0% |
| Carpatho Rusyn | 23 | 0.0% |
| Central American | 2,954 | 0.9% |
| Central American Indian | 169 | 0.1% |
| Cherokee | 771 | 0.2% |
| Cheyenne | 5 | 0.0% |
| Chickasaw | 33 | 0.0% |
| Chilean | 81 | 0.0% |
| Choctaw | 22 | 0.0% |
| Colombian | 315 | 0.1% |
| Costa Rican | 79 | 0.0% |
| Croatian | 189 | 0.1% |
| Cuban | 629 | 0.2% |
| Czech | 413 | 0.1% |
| Czechoslovakian | 298 | 0.1% |
| Danish | 589 | 0.2% |
| Dominican | 119 | 0.0% |
| Dutch | 2,640 | 0.8% |
| Eastern European | 689 | 0.2% |
| Ecuadorian | 25 | 0.0% |
| Egyptian | 303 | 0.1% |
| English | 41,951 | 13.1% |
| Ethiopian | 81 | 0.0% |
| European | 7,759 | 2.4% |
| Filipino | 220 | 0.1% |
| Finnish | 127 | 0.0% |
| French | 5,027 | 1.6% |
| French American Indian | 4 | 0.0% |
| French Canadian | 857 | 0.3% |
| German | 40,241 | 12.5% |
| German Russian | 64 | 0.0% |
| Ghanaian | 245 | 0.1% |
| Greek | 858 | 0.3% |
| Guamanian / Chamorro | 4 | 0.0% |
| Guatemalan | 751 | 0.2% |
| Guyanese | 22 | 0.0% |
| Haitian | 210 | 0.1% |
| Honduran | 1,536 | 0.5% |
| Houma | 4 | 0.0% |
| Hungarian | 839 | 0.3% |
| Icelander | 29 | 0.0% |
| Indian (Asian) | 4,057 | 1.3% |
| Indonesian | 4 | 0.0% |
| Inupiat | 5 | 0.0% |
| Iranian | 675 | 0.2% |
| Iraqi | 221 | 0.1% |
| Irish | 35,948 | 11.2% |
| Iroquois | 83 | 0.0% |
| Israeli | 44 | 0.0% |
| Italian | 8,967 | 2.8% |
| Jamaican | 466 | 0.2% |
| Japanese | 413 | 0.1% |
| Jordanian | 146 | 0.1% |
| Kenyan | 66 | 0.0% |
| Korean | 1,197 | 0.4% |
| Laotian | 174 | 0.1% |
| Latvian | 30 | 0.0% |
| Lebanese | 528 | 0.2% |
| Lithuanian | 382 | 0.1% |
| Luxembourger | 19 | 0.0% |
| Macedonian | 78 | 0.0% |
| Malaysian | 35 | 0.0% |
| Mexican | 15,655 | 4.9% |
| Mexican American Indian | 399 | 0.1% |
| Mongolian | 18 | 0.0% |
| Moroccan | 51 | 0.0% |
| Native Hawaiian | 39 | 0.0% |
| Navajo | 71 | 0.0% |
| New Zealander | 48 | 0.0% |
| Nicaraguan | 34 | 0.0% |
| Nigerian | 1,107 | 0.3% |
| Northern European | 608 | 0.2% |
| Norwegian | 1,535 | 0.5% |
| Okinawan | 16 | 0.0% |
| Osage | 33 | 0.0% |
| Pakistani | 340 | 0.1% |
| Palestinian | 221 | 0.1% |
| Panamanian | 272 | 0.1% |
| Paraguayan | 11 | 0.0% |
| Pennsylvania German | 22 | 0.0% |
| Peruvian | 471 | 0.2% |
| Polish | 4,937 | 1.5% |
| Portuguese | 551 | 0.2% |
| Potawatomi | 11 | 0.0% |
| Puerto Rican | 1,685 | 0.5% |
| Romanian | 162 | 0.1% |
| Russian | 1,309 | 0.4% |
| Salvadoran | 278 | 0.1% |
| Samoan | 49 | 0.0% |
| Scandinavian | 1,010 | 0.3% |
| Scotch-Irish | 6,277 | 1.9% |
| Scottish | 8,050 | 2.5% |
| Seminole | 23 | 0.0% |
| Senegalese | 90 | 0.0% |
| Serbian | 25 | 0.0% |
| Shoshone | 7 | 0.0% |
| Sierra Leonean | 21 | 0.0% |
| Sioux | 18 | 0.0% |
| Slavic | 31 | 0.0% |
| Slovak | 312 | 0.1% |
| Slovene | 148 | 0.1% |
| South African | 106 | 0.0% |
| South American | 1,475 | 0.5% |
| South American Indian | 20 | 0.0% |
| Spaniard | 439 | 0.1% |
| Spanish | 267 | 0.1% |
| Sri Lankan | 626 | 0.2% |
| Subsaharan African | 5,913 | 1.8% |
| Sudanese | 107 | 0.0% |
| Swedish | 1,814 | 0.6% |
| Swiss | 791 | 0.3% |
| Syrian | 169 | 0.1% |
| Thai | 3,565 | 1.1% |
| Tohono O'Odham | 29 | 0.0% |
| Trinidadian and Tobagonian | 99 | 0.0% |
| Turkish | 266 | 0.1% |
| Ukrainian | 766 | 0.2% |
| Venezuelan | 434 | 0.1% |
| Vietnamese | 100 | 0.0% |
| Welsh | 3,039 | 0.9% |
| West Indian | 26 | 0.0% |
| Yugoslavian | 69 | 0.0% | View All 146 Rows |
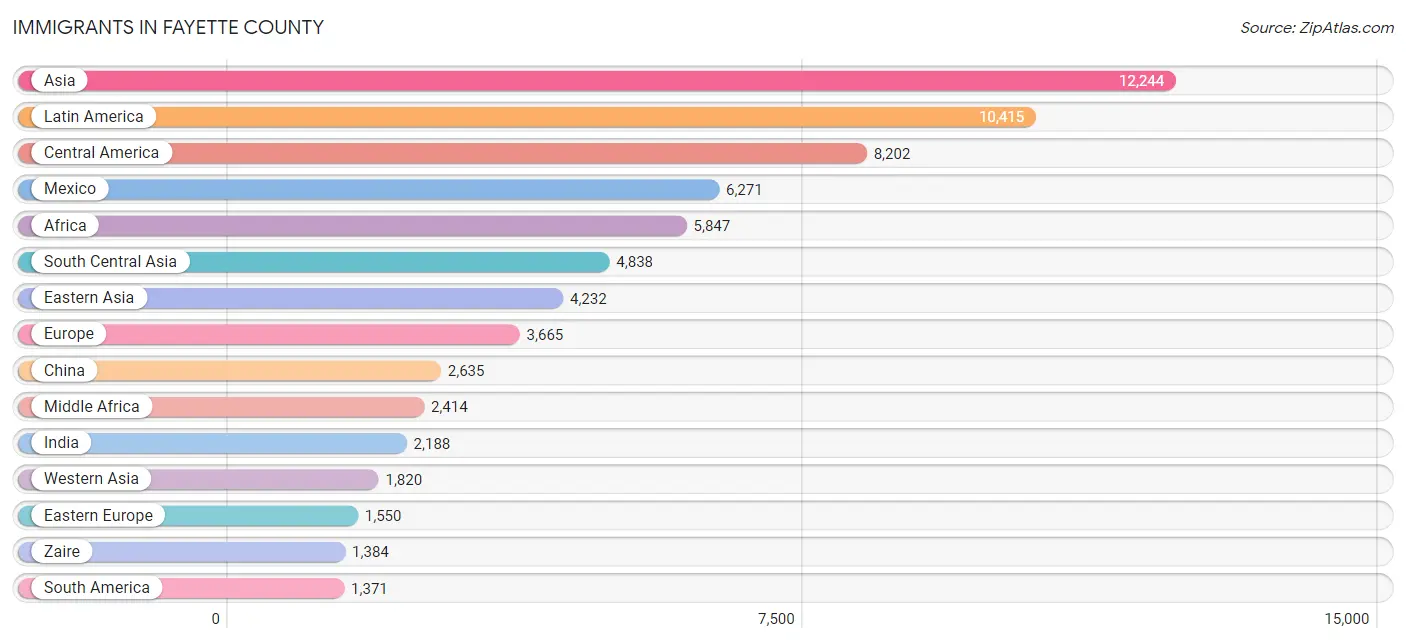
Immigrants in Fayette County
The most numerous immigrant groups reported in Fayette County came from Asia (12,244 | 3.8%), Latin America (10,415 | 3.2%), Central America (8,202 | 2.5%), Mexico (6,271 | 1.9%), and Africa (5,847 | 1.8%), together accounting for 13.4% of all Fayette County residents.
| Immigration Origin | # Population | % Population |
| Afghanistan | 69 | 0.0% |
| Africa | 5,847 | 1.8% |
| Albania | 101 | 0.0% |
| Argentina | 148 | 0.1% |
| Asia | 12,244 | 3.8% |
| Australia | 25 | 0.0% |
| Austria | 31 | 0.0% |
| Bahamas | 63 | 0.0% |
| Bangladesh | 112 | 0.0% |
| Belarus | 68 | 0.0% |
| Belgium | 5 | 0.0% |
| Bosnia and Herzegovina | 47 | 0.0% |
| Brazil | 146 | 0.1% |
| Bulgaria | 255 | 0.1% |
| Cambodia | 249 | 0.1% |
| Cameroon | 24 | 0.0% |
| Canada | 555 | 0.2% |
| Caribbean | 842 | 0.3% |
| Central America | 8,202 | 2.5% |
| Chile | 77 | 0.0% |
| China | 2,635 | 0.8% |
| Colombia | 276 | 0.1% |
| Congo | 792 | 0.3% |
| Costa Rica | 72 | 0.0% |
| Croatia | 34 | 0.0% |
| Cuba | 186 | 0.1% |
| Czechoslovakia | 11 | 0.0% |
| Dominican Republic | 51 | 0.0% |
| Eastern Africa | 1,353 | 0.4% |
| Eastern Asia | 4,232 | 1.3% |
| Eastern Europe | 1,550 | 0.5% |
| Ecuador | 30 | 0.0% |
| Egypt | 151 | 0.1% |
| El Salvador | 129 | 0.0% |
| England | 422 | 0.1% |
| Ethiopia | 81 | 0.0% |
| Europe | 3,665 | 1.1% |
| Fiji | 1 | 0.0% |
| France | 201 | 0.1% |
| Germany | 449 | 0.1% |
| Ghana | 325 | 0.1% |
| Greece | 27 | 0.0% |
| Guatemala | 485 | 0.2% |
| Guyana | 15 | 0.0% |
| Haiti | 201 | 0.1% |
| Honduras | 1,056 | 0.3% |
| Hong Kong | 65 | 0.0% |
| Hungary | 55 | 0.0% |
| India | 2,188 | 0.7% |
| Indonesia | 64 | 0.0% |
| Iran | 498 | 0.2% |
| Iraq | 762 | 0.2% |
| Ireland | 258 | 0.1% |
| Israel | 131 | 0.0% |
| Italy | 164 | 0.1% |
| Jamaica | 221 | 0.1% |
| Japan | 842 | 0.3% |
| Jordan | 199 | 0.1% |
| Kazakhstan | 24 | 0.0% |
| Kenya | 292 | 0.1% |
| Korea | 712 | 0.2% |
| Kuwait | 77 | 0.0% |
| Latin America | 10,415 | 3.2% |
| Latvia | 10 | 0.0% |
| Lebanon | 63 | 0.0% |
| Liberia | 61 | 0.0% |
| Malaysia | 18 | 0.0% |
| Mexico | 6,271 | 1.9% |
| Middle Africa | 2,414 | 0.7% |
| Moldova | 18 | 0.0% |
| Morocco | 26 | 0.0% |
| Nepal | 1,310 | 0.4% |
| Netherlands | 37 | 0.0% |
| Nigeria | 726 | 0.2% |
| North Macedonia | 16 | 0.0% |
| Northern Africa | 220 | 0.1% |
| Northern Europe | 1,144 | 0.4% |
| Norway | 52 | 0.0% |
| Oceania | 106 | 0.0% |
| Pakistan | 208 | 0.1% |
| Panama | 180 | 0.1% |
| Peru | 306 | 0.1% |
| Philippines | 351 | 0.1% |
| Poland | 124 | 0.0% |
| Romania | 12 | 0.0% |
| Russia | 183 | 0.1% |
| Saudi Arabia | 47 | 0.0% |
| Scotland | 37 | 0.0% |
| Senegal | 84 | 0.0% |
| Sierra Leone | 9 | 0.0% |
| Singapore | 19 | 0.0% |
| South Africa | 152 | 0.1% |
| South America | 1,371 | 0.4% |
| South Central Asia | 4,838 | 1.5% |
| South Eastern Asia | 1,171 | 0.4% |
| Southern Europe | 222 | 0.1% |
| Spain | 31 | 0.0% |
| Sri Lanka | 65 | 0.0% |
| St. Vincent and the Grenadines | 9 | 0.0% |
| Sweden | 140 | 0.0% |
| Switzerland | 26 | 0.0% |
| Syria | 296 | 0.1% |
| Taiwan | 105 | 0.0% |
| Thailand | 88 | 0.0% |
| Trinidad and Tobago | 104 | 0.0% |
| Turkey | 125 | 0.0% |
| Uganda | 27 | 0.0% |
| Ukraine | 393 | 0.1% |
| Uzbekistan | 19 | 0.0% |
| Venezuela | 373 | 0.1% |
| Vietnam | 354 | 0.1% |
| Western Africa | 1,312 | 0.4% |
| Western Asia | 1,820 | 0.6% |
| Western Europe | 749 | 0.2% |
| Zaire | 1,384 | 0.4% |
| Zimbabwe | 11 | 0.0% | View All 116 Rows |
Sex and Age in Fayette County
Sex and Age in Fayette County
The most populous age groups in Fayette County are 20 to 24 Years (16,692 | 10.5%) for men and 20 to 24 Years (17,091 | 10.5%) for women.
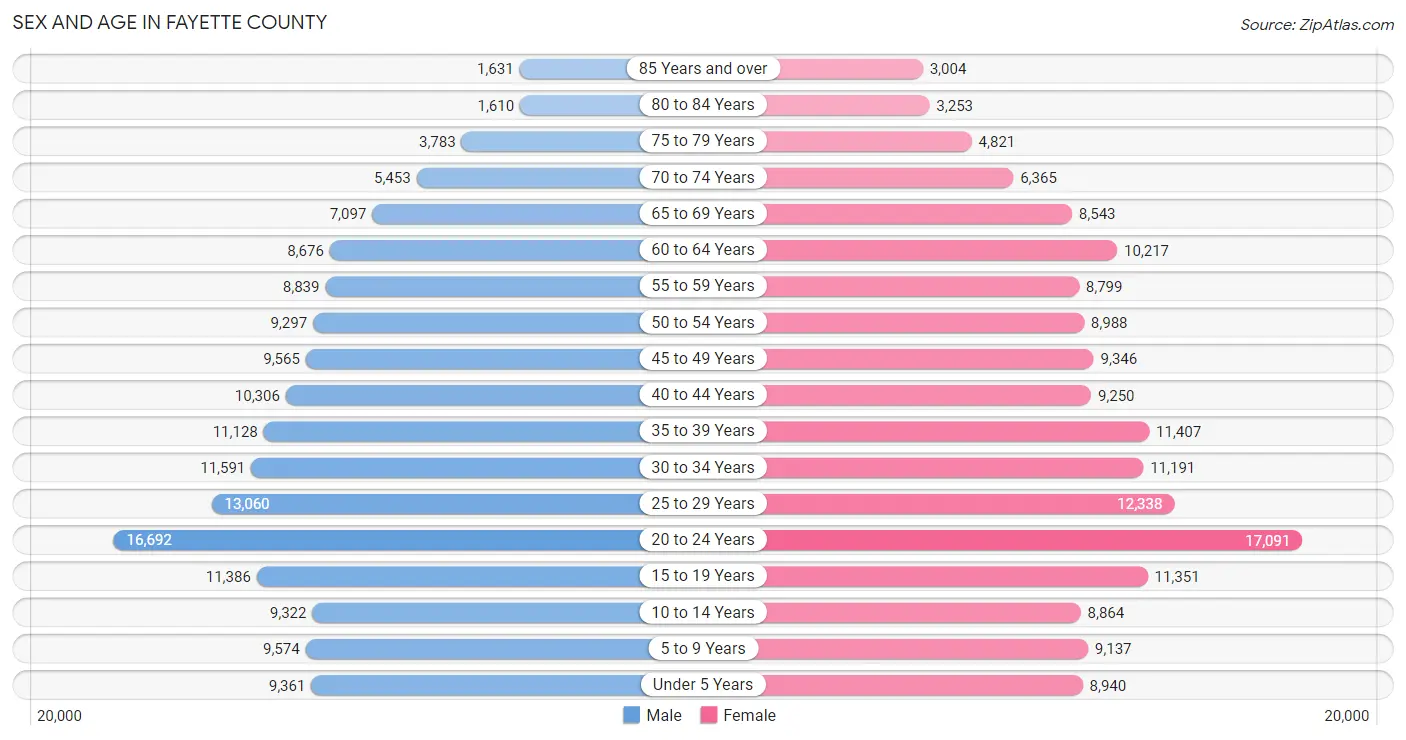
| Age Bracket | Male | Female |
| Under 5 Years | 9,361 (5.9%) | 8,940 (5.5%) |
| 5 to 9 Years | 9,574 (6.0%) | 9,137 (5.6%) |
| 10 to 14 Years | 9,322 (5.9%) | 8,864 (5.4%) |
| 15 to 19 Years | 11,386 (7.2%) | 11,351 (7.0%) |
| 20 to 24 Years | 16,692 (10.5%) | 17,091 (10.5%) |
| 25 to 29 Years | 13,060 (8.3%) | 12,338 (7.6%) |
| 30 to 34 Years | 11,591 (7.3%) | 11,191 (6.9%) |
| 35 to 39 Years | 11,128 (7.0%) | 11,407 (7.0%) |
| 40 to 44 Years | 10,306 (6.5%) | 9,250 (5.7%) |
| 45 to 49 Years | 9,565 (6.0%) | 9,346 (5.7%) |
| 50 to 54 Years | 9,297 (5.9%) | 8,988 (5.5%) |
| 55 to 59 Years | 8,839 (5.6%) | 8,799 (5.4%) |
| 60 to 64 Years | 8,676 (5.5%) | 10,217 (6.3%) |
| 65 to 69 Years | 7,097 (4.5%) | 8,543 (5.2%) |
| 70 to 74 Years | 5,453 (3.4%) | 6,365 (3.9%) |
| 75 to 79 Years | 3,783 (2.4%) | 4,821 (3.0%) |
| 80 to 84 Years | 1,610 (1.0%) | 3,253 (2.0%) |
| 85 Years and over | 1,631 (1.0%) | 3,004 (1.8%) |
| Total | 158,371 (100.0%) | 162,905 (100.0%) |
Families and Households in Fayette County
Median Family Size in Fayette County
The median family size in Fayette County is 2.94 persons per family, with married-couple families (54,674 | 72.0%) accounting for the largest median family size of 3.02 persons per family. On the other hand, single male/father families (6,218 | 8.2%) represent the smallest median family size with 2.44 persons per family.
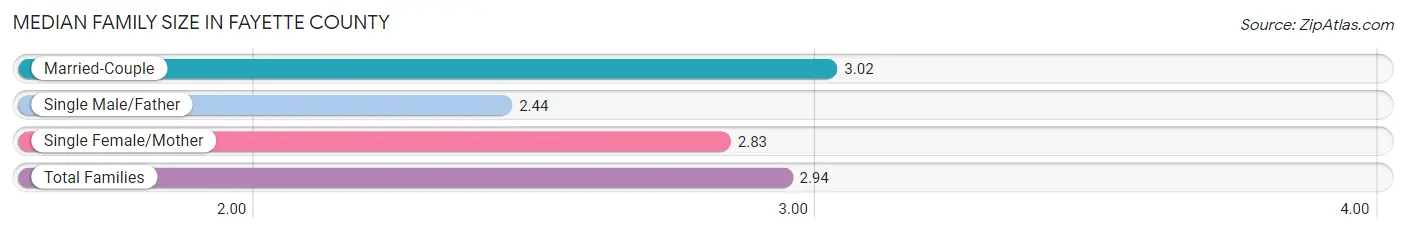
| Family Type | # Families | Family Size |
| Married-Couple | 54,674 (72.0%) | 3.02 |
| Single Male/Father | 6,218 (8.2%) | 2.44 |
| Single Female/Mother | 15,058 (19.8%) | 2.83 |
| Total Families | 75,950 (100.0%) | 2.94 |
Median Household Size in Fayette County
The median household size in Fayette County is 2.27 persons per household, with single female/mother households (15,058 | 11.1%) accounting for the largest median household size of 3.08 persons per household. non-family households (60,154 | 44.2%) represent the smallest median household size with 1.30 persons per household.
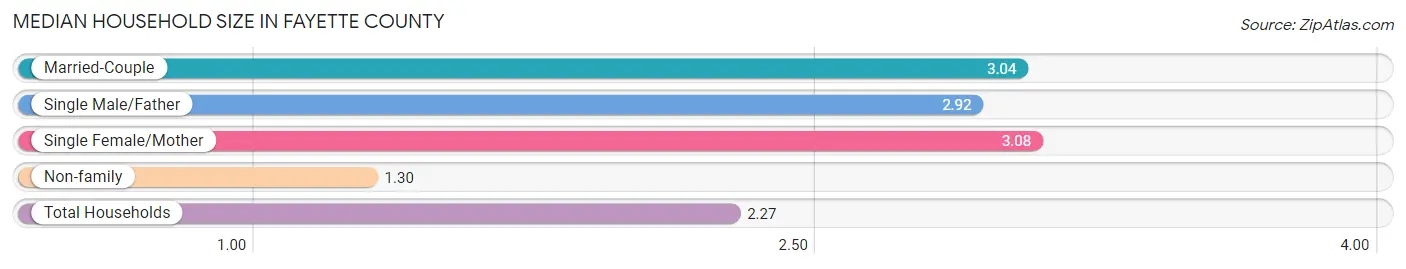
| Household Type | # Households | Household Size |
| Married-Couple | 54,674 (40.2%) | 3.04 |
| Single Male/Father | 6,218 (4.6%) | 2.92 |
| Single Female/Mother | 15,058 (11.1%) | 3.08 |
| Non-family | 60,154 (44.2%) | 1.30 |
| Total Households | 136,104 (100.0%) | 2.27 |
Household Size by Marriage Status in Fayette County
Out of a total of 136,104 households in Fayette County, 75,950 (55.8%) are family households, while 60,154 (44.2%) are nonfamily households. The most numerous type of family households are 2-person households, comprising 34,900, and the most common type of nonfamily households are 1-person households, comprising 45,946.
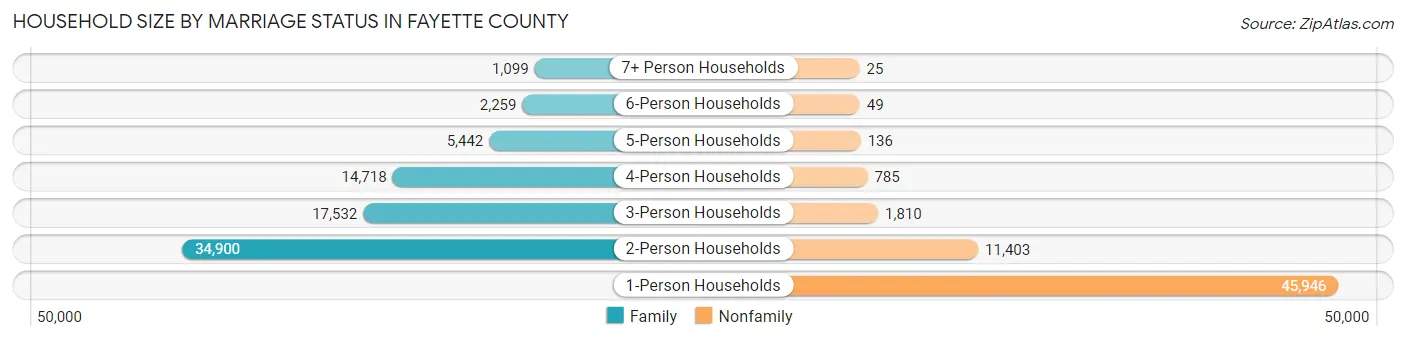
| Household Size | Family Households | Nonfamily Households |
| 1-Person Households | - | 45,946 (33.8%) |
| 2-Person Households | 34,900 (25.6%) | 11,403 (8.4%) |
| 3-Person Households | 17,532 (12.9%) | 1,810 (1.3%) |
| 4-Person Households | 14,718 (10.8%) | 785 (0.6%) |
| 5-Person Households | 5,442 (4.0%) | 136 (0.1%) |
| 6-Person Households | 2,259 (1.7%) | 49 (0.0%) |
| 7+ Person Households | 1,099 (0.8%) | 25 (0.0%) |
| Total | 75,950 (55.8%) | 60,154 (44.2%) |
Female Fertility in Fayette County
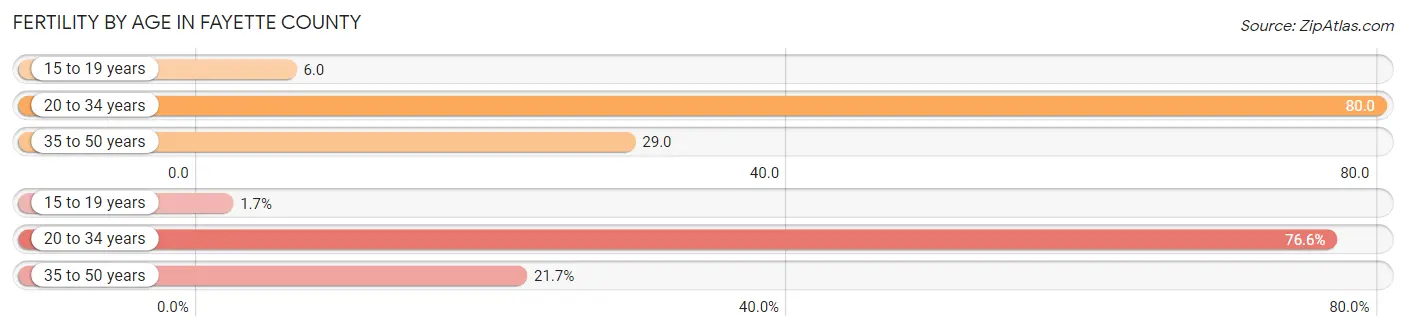
Fertility by Age in Fayette County
Average fertility rate in Fayette County is 51.0 births per 1,000 women. Women in the age bracket of 20 to 34 years have the highest fertility rate with 80.0 births per 1,000 women. Women in the age bracket of 20 to 34 years acount for 76.6% of all women with births.
| Age Bracket | Women with Births | Births / 1,000 Women |
| 15 to 19 years | 73 (1.7%) | 6.0 |
| 20 to 34 years | 3,267 (76.6%) | 80.0 |
| 35 to 50 years | 923 (21.6%) | 29.0 |
| Total | 4,263 (100.0%) | 51.0 |
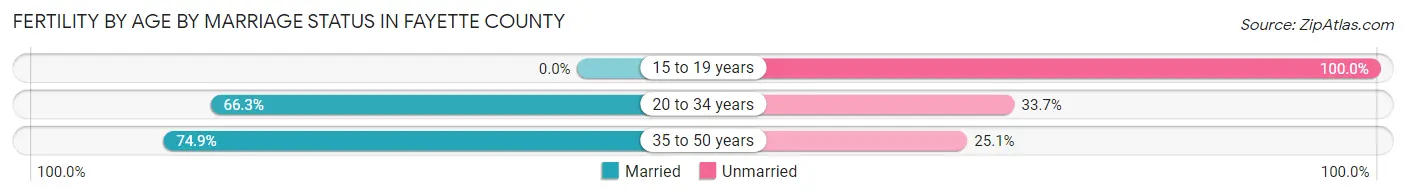
Fertility by Age by Marriage Status in Fayette County
67.0% of women with births (4,263) in Fayette County are married. The highest percentage of unmarried women with births falls into 15 to 19 years age bracket with 100.0% of them unmarried at the time of birth, while the lowest percentage of unmarried women with births belong to 35 to 50 years age bracket with 25.1% of them unmarried.
| Age Bracket | Married | Unmarried |
| 15 to 19 years | 0 (0.0%) | 73 (100.0%) |
| 20 to 34 years | 2,166 (66.3%) | 1,101 (33.7%) |
| 35 to 50 years | 691 (74.9%) | 232 (25.1%) |
| Total | 2,856 (67.0%) | 1,407 (33.0%) |
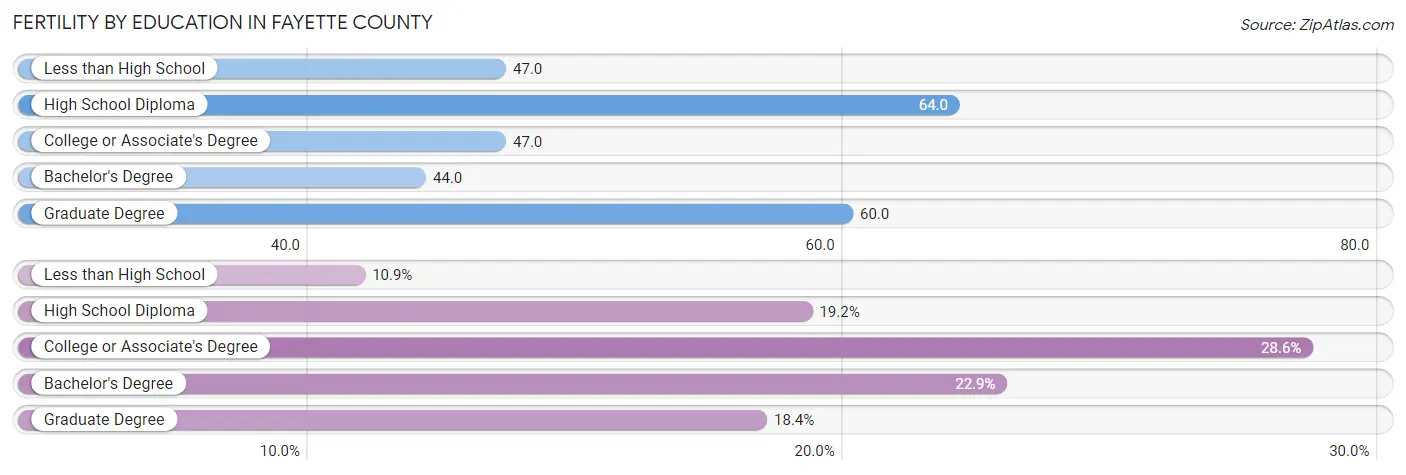
Fertility by Education in Fayette County
Average fertility rate in Fayette County is 51.0 births per 1,000 women. Women with the education attainment of high school diploma have the highest fertility rate of 64.0 births per 1,000 women, while women with the education attainment of bachelor's degree have the lowest fertility at 44.0 births per 1,000 women. Women with the education attainment of college or associate's degree represent 28.6% of all women with births.
| Educational Attainment | Women with Births | Births / 1,000 Women |
| Less than High School | 463 (10.9%) | 47.0 |
| High School Diploma | 820 (19.2%) | 64.0 |
| College or Associate's Degree | 1,220 (28.6%) | 47.0 |
| Bachelor's Degree | 976 (22.9%) | 44.0 |
| Graduate Degree | 784 (18.4%) | 60.0 |
| Total | 4,263 (100.0%) | 51.0 |
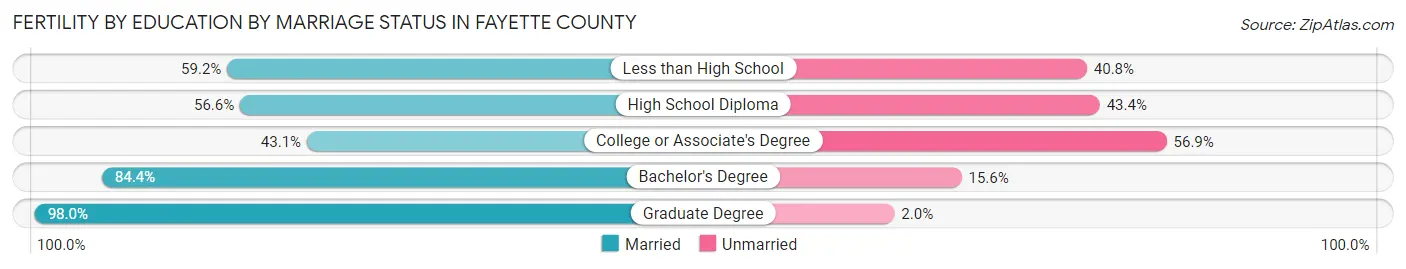
Fertility by Education by Marriage Status in Fayette County
33.0% of women with births in Fayette County are unmarried. Women with the educational attainment of graduate degree are most likely to be married with 98.0% of them married at childbirth, while women with the educational attainment of college or associate's degree are least likely to be married with 56.9% of them unmarried at childbirth.
| Educational Attainment | Married | Unmarried |
| Less than High School | 274 (59.2%) | 189 (40.8%) |
| High School Diploma | 464 (56.6%) | 356 (43.4%) |
| College or Associate's Degree | 526 (43.1%) | 694 (56.9%) |
| Bachelor's Degree | 824 (84.4%) | 152 (15.6%) |
| Graduate Degree | 768 (98.0%) | 16 (2.0%) |
| Total | 2,856 (67.0%) | 1,407 (33.0%) |
Income in Fayette County
Income Overview in Fayette County
Per Capita Income in Fayette County is $40,953, while median incomes of families and households are $91,263 and $66,087 respectively.
| Characteristic | Number | Measure |
| Per Capita Income | 321,276 | $40,953 |
| Median Family Income | 75,950 | $91,263 |
| Mean Family Income | 75,950 | $121,907 |
| Median Household Income | 136,104 | $66,087 |
| Mean Household Income | 136,104 | $96,124 |
| Income Deficit | 75,950 | $11,247 |
| Wage / Income Gap (%) | 321,276 | 23.94% |
| Wage / Income Gap ($) | 321,276 | 76.06¢ per $1 |
| Gini / Inequality Index | 321,276 | 0.49 |
Earnings by Sex in Fayette County
Average Earnings in Fayette County are $37,099, $42,791 for men and $32,546 for women, a difference of 23.9%.
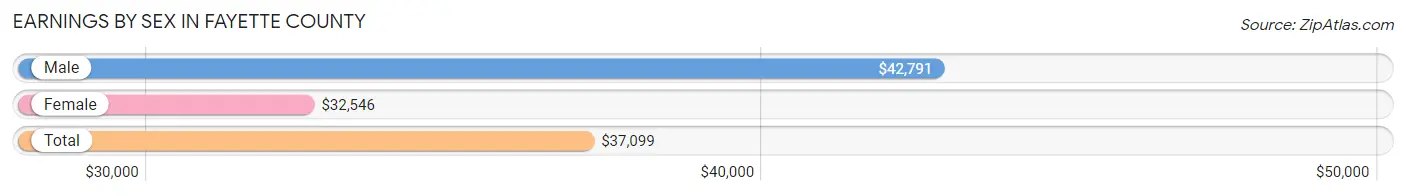
| Sex | Number | Average Earnings |
| Male | 98,497 (51.7%) | $42,791 |
| Female | 91,980 (48.3%) | $32,546 |
| Total | 190,477 (100.0%) | $37,099 |
Earnings by Sex by Income Bracket in Fayette County
The most common earnings brackets in Fayette County are $100,000+ for men (15,754 | 16.0%) and $100,000+ for women (7,388 | 8.0%).
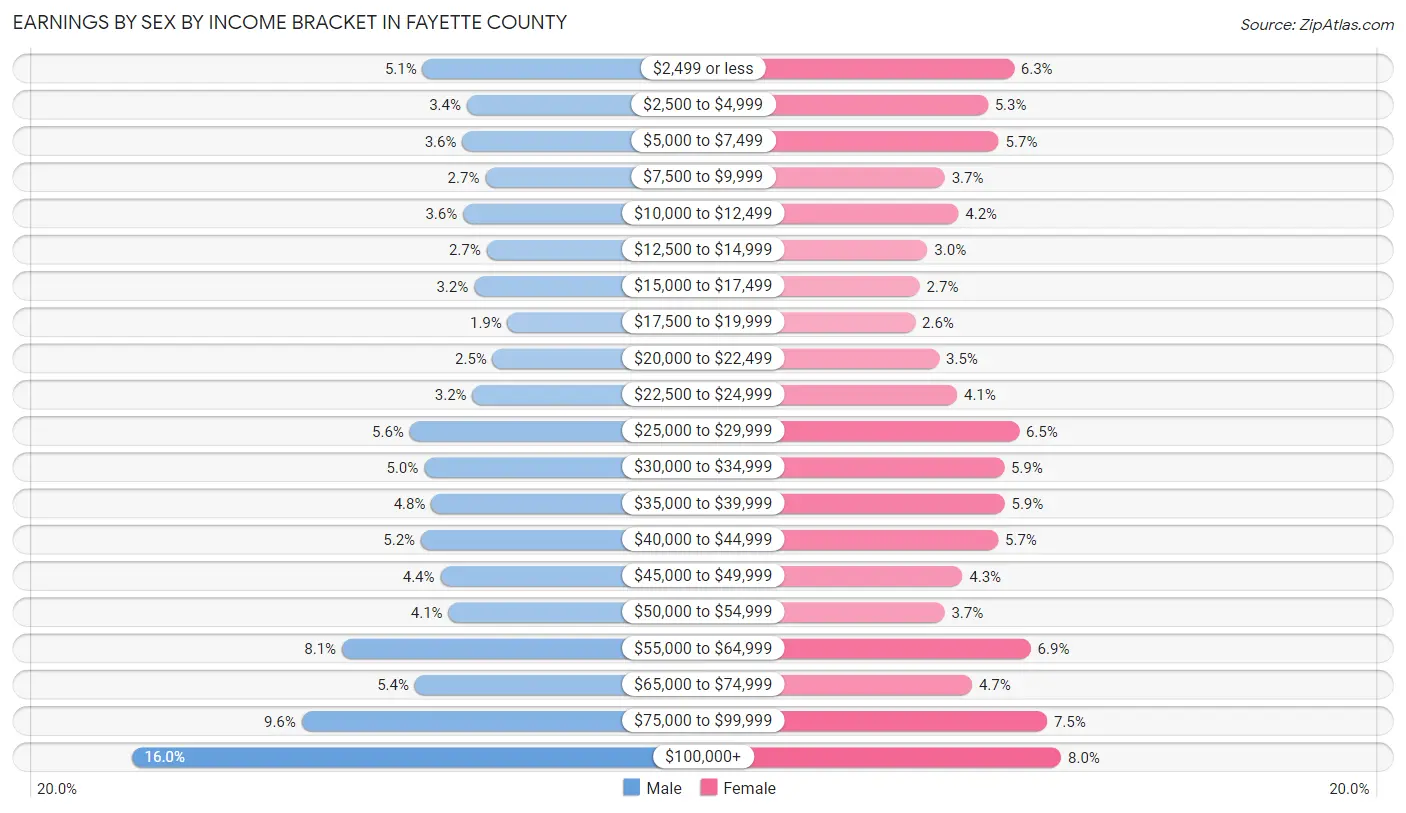
| Income | Male | Female |
| $2,499 or less | 5,012 (5.1%) | 5,761 (6.3%) |
| $2,500 to $4,999 | 3,382 (3.4%) | 4,860 (5.3%) |
| $5,000 to $7,499 | 3,543 (3.6%) | 5,230 (5.7%) |
| $7,500 to $9,999 | 2,700 (2.7%) | 3,380 (3.7%) |
| $10,000 to $12,499 | 3,513 (3.6%) | 3,842 (4.2%) |
| $12,500 to $14,999 | 2,645 (2.7%) | 2,778 (3.0%) |
| $15,000 to $17,499 | 3,112 (3.2%) | 2,511 (2.7%) |
| $17,500 to $19,999 | 1,872 (1.9%) | 2,351 (2.6%) |
| $20,000 to $22,499 | 2,420 (2.5%) | 3,184 (3.5%) |
| $22,500 to $24,999 | 3,175 (3.2%) | 3,797 (4.1%) |
| $25,000 to $29,999 | 5,486 (5.6%) | 5,937 (6.5%) |
| $30,000 to $34,999 | 4,951 (5.0%) | 5,414 (5.9%) |
| $35,000 to $39,999 | 4,689 (4.8%) | 5,439 (5.9%) |
| $40,000 to $44,999 | 5,075 (5.1%) | 5,218 (5.7%) |
| $45,000 to $49,999 | 4,350 (4.4%) | 3,979 (4.3%) |
| $50,000 to $54,999 | 4,058 (4.1%) | 3,363 (3.7%) |
| $55,000 to $64,999 | 7,985 (8.1%) | 6,338 (6.9%) |
| $65,000 to $74,999 | 5,303 (5.4%) | 4,316 (4.7%) |
| $75,000 to $99,999 | 9,472 (9.6%) | 6,894 (7.5%) |
| $100,000+ | 15,754 (16.0%) | 7,388 (8.0%) |
| Total | 98,497 (100.0%) | 91,980 (100.0%) |
Earnings by Sex by Educational Attainment in Fayette County
Average earnings in Fayette County are $52,258 for men and $40,792 for women, a difference of 21.9%. Men with an educational attainment of graduate degree enjoy the highest average annual earnings of $83,304, while those with less than high school education earn the least with $27,589. Women with an educational attainment of graduate degree earn the most with the average annual earnings of $63,826, while those with less than high school education have the smallest earnings of $22,796.
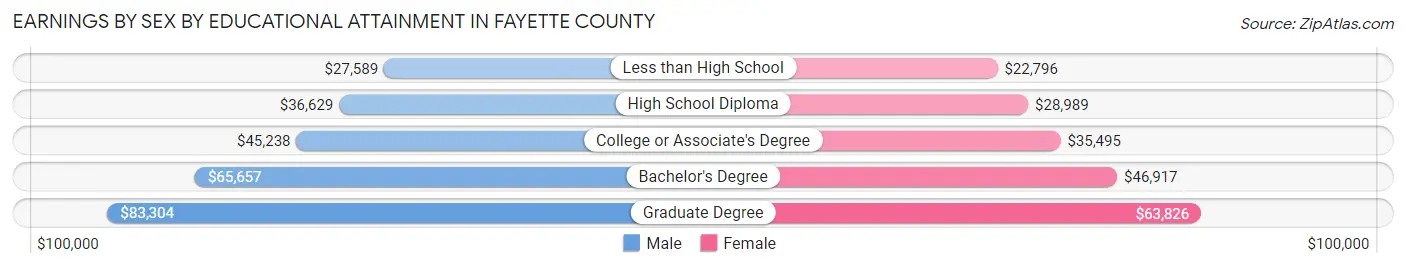
| Educational Attainment | Male Income | Female Income |
| Less than High School | $27,589 | $22,796 |
| High School Diploma | $36,629 | $28,989 |
| College or Associate's Degree | $45,238 | $35,495 |
| Bachelor's Degree | $65,657 | $46,917 |
| Graduate Degree | $83,304 | $63,826 |
| Total | $52,258 | $40,792 |
Family Income in Fayette County
Family Income Brackets in Fayette County
According to the Fayette County family income data, there are 15,190 families falling into the $100,000 to $149,999 income range, which is the most common income bracket and makes up 20.0% of all families. Conversely, the $10,000 to $14,999 income bracket is the least frequent group with only 1,215 families (1.6%) belonging to this category.
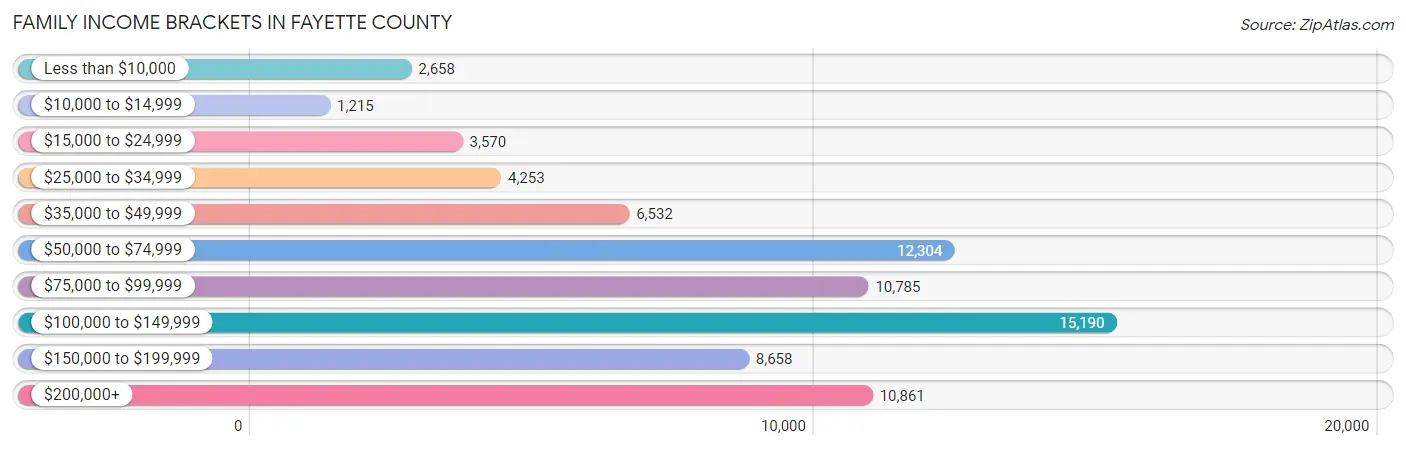
| Income Bracket | # Families | % Families |
| Less than $10,000 | 2,658 | 3.5% |
| $10,000 to $14,999 | 1,215 | 1.6% |
| $15,000 to $24,999 | 3,570 | 4.7% |
| $25,000 to $34,999 | 4,253 | 5.6% |
| $35,000 to $49,999 | 6,532 | 8.6% |
| $50,000 to $74,999 | 12,304 | 16.2% |
| $75,000 to $99,999 | 10,785 | 14.2% |
| $100,000 to $149,999 | 15,190 | 20.0% |
| $150,000 to $199,999 | 8,658 | 11.4% |
| $200,000+ | 10,861 | 14.3% |
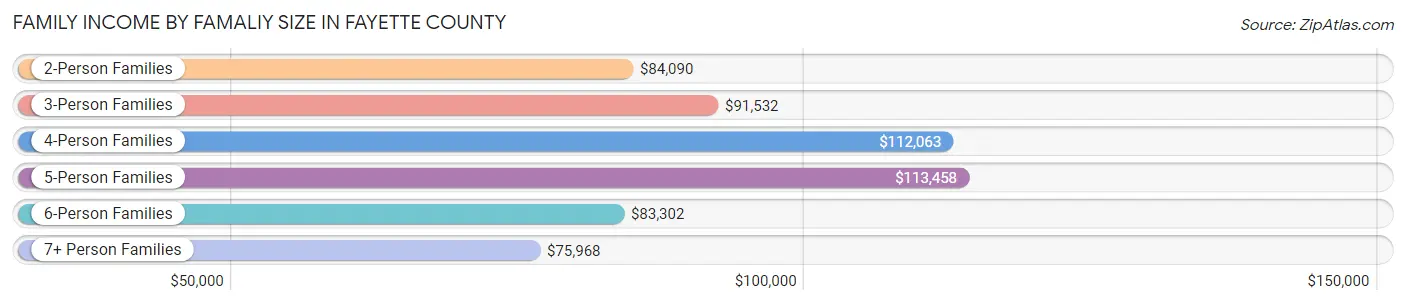
Family Income by Famaliy Size in Fayette County
5-person families (4,759 | 6.3%) account for the highest median family income in Fayette County with $113,458 per family, while 2-person families (38,299 | 50.4%) have the highest median income of $42,045 per family member.
| Income Bracket | # Families | Median Income |
| 2-Person Families | 38,299 (50.4%) | $84,090 |
| 3-Person Families | 16,177 (21.3%) | $91,532 |
| 4-Person Families | 13,934 (18.3%) | $112,063 |
| 5-Person Families | 4,759 (6.3%) | $113,458 |
| 6-Person Families | 1,883 (2.5%) | $83,302 |
| 7+ Person Families | 898 (1.2%) | $75,968 |
| Total | 75,950 (100.0%) | $91,263 |
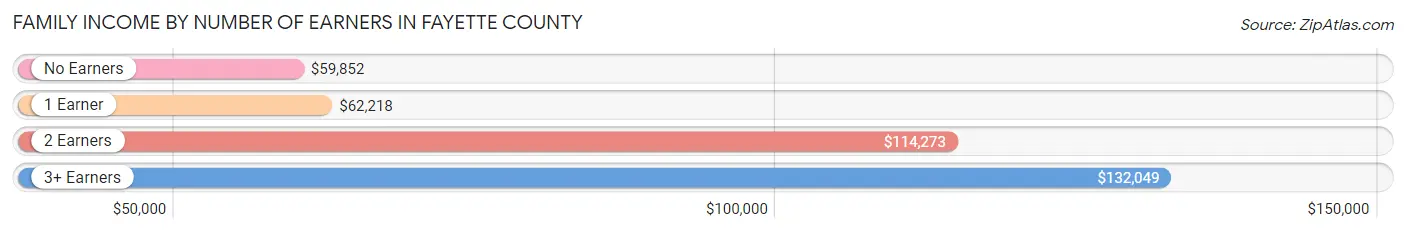
Family Income by Number of Earners in Fayette County
The median family income in Fayette County is $91,263, with families comprising 3+ earners (7,138) having the highest median family income of $132,049, while families with no earners (8,688) have the lowest median family income of $59,852, accounting for 9.4% and 11.4% of families, respectively.
| Number of Earners | # Families | Median Income |
| No Earners | 8,688 (11.4%) | $59,852 |
| 1 Earner | 23,800 (31.3%) | $62,218 |
| 2 Earners | 36,324 (47.8%) | $114,273 |
| 3+ Earners | 7,138 (9.4%) | $132,049 |
| Total | 75,950 (100.0%) | $91,263 |
Household Income in Fayette County
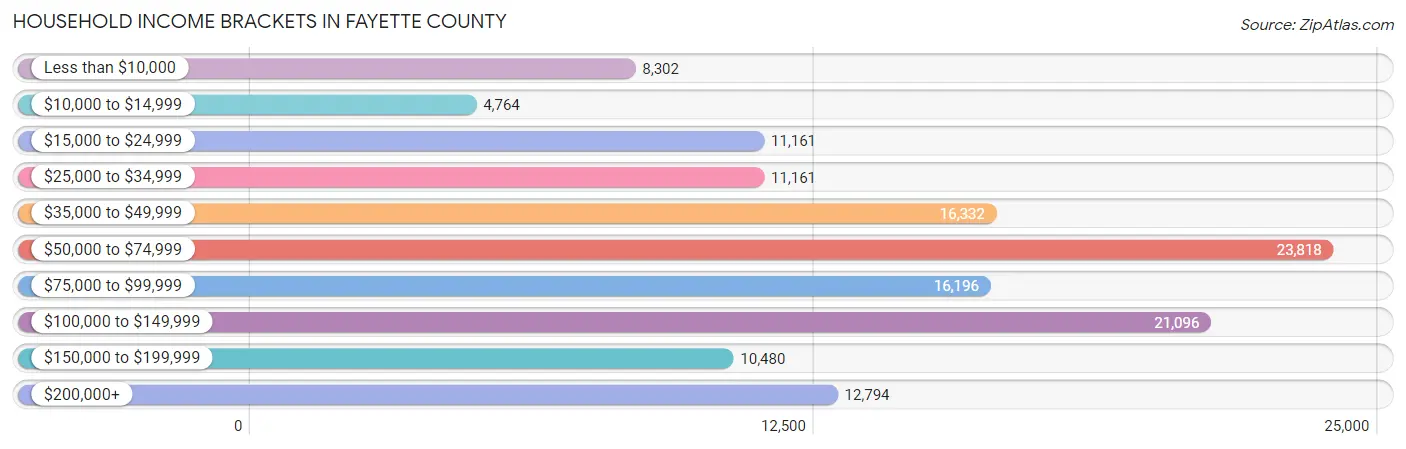
Household Income Brackets in Fayette County
With 23,818 households falling in the category, the $50,000 to $74,999 income range is the most frequent in Fayette County, accounting for 17.5% of all households. In contrast, only 4,764 households (3.5%) fall into the $10,000 to $14,999 income bracket, making it the least populous group.
| Income Bracket | # Households | % Households |
| Less than $10,000 | 8,302 | 6.1% |
| $10,000 to $14,999 | 4,764 | 3.5% |
| $15,000 to $24,999 | 11,161 | 8.2% |
| $25,000 to $34,999 | 11,161 | 8.2% |
| $35,000 to $49,999 | 16,332 | 12.0% |
| $50,000 to $74,999 | 23,818 | 17.5% |
| $75,000 to $99,999 | 16,196 | 11.9% |
| $100,000 to $149,999 | 21,096 | 15.5% |
| $150,000 to $199,999 | 10,480 | 7.7% |
| $200,000+ | 12,794 | 9.4% |
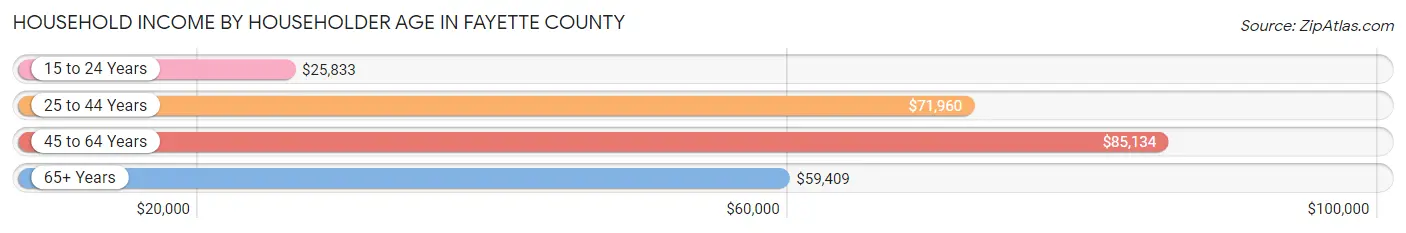
Household Income by Householder Age in Fayette County
The median household income in Fayette County is $66,087, with the highest median household income of $85,134 found in the 45 to 64 years age bracket for the primary householder. A total of 43,699 households (32.1%) fall into this category. Meanwhile, the 15 to 24 years age bracket for the primary householder has the lowest median household income of $25,833, with 13,642 households (10.0%) in this group.
| Income Bracket | # Households | Median Income |
| 15 to 24 Years | 13,642 (10.0%) | $25,833 |
| 25 to 44 Years | 48,626 (35.7%) | $71,960 |
| 45 to 64 Years | 43,699 (32.1%) | $85,134 |
| 65+ Years | 30,137 (22.1%) | $59,409 |
| Total | 136,104 (100.0%) | $66,087 |
Poverty in Fayette County
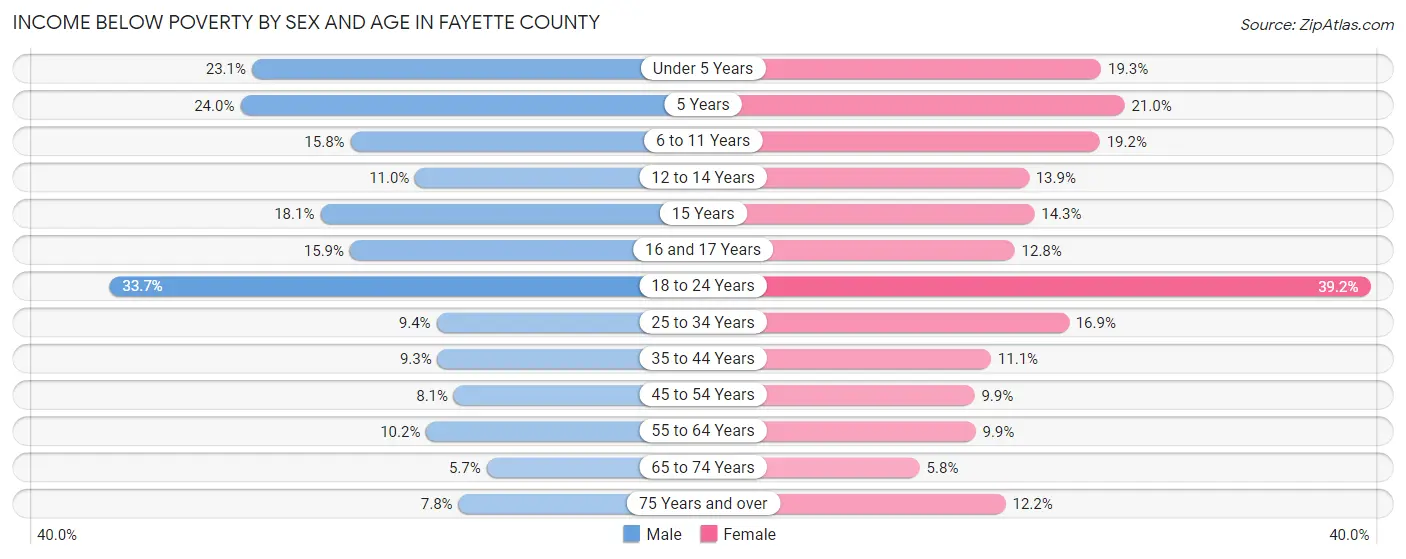
Income Below Poverty by Sex and Age in Fayette County
With 13.9% poverty level for males and 16.0% for females among the residents of Fayette County, 18 to 24 year old males and 18 to 24 year old females are the most vulnerable to poverty, with 6,525 males (33.7%) and 7,565 females (39.2%) in their respective age groups living below the poverty level.
| Age Bracket | Male | Female |
| Under 5 Years | 2,109 (23.1%) | 1,674 (19.3%) |
| 5 Years | 416 (24.0%) | 365 (21.0%) |
| 6 to 11 Years | 1,845 (15.8%) | 2,098 (19.2%) |
| 12 to 14 Years | 573 (11.0%) | 704 (13.9%) |
| 15 Years | 339 (18.0%) | 241 (14.3%) |
| 16 and 17 Years | 600 (15.9%) | 462 (12.8%) |
| 18 to 24 Years | 6,525 (33.7%) | 7,565 (39.2%) |
| 25 to 34 Years | 2,249 (9.4%) | 3,942 (16.9%) |
| 35 to 44 Years | 1,937 (9.3%) | 2,268 (11.1%) |
| 45 to 54 Years | 1,490 (8.1%) | 1,797 (9.9%) |
| 55 to 64 Years | 1,748 (10.2%) | 1,877 (9.9%) |
| 65 to 74 Years | 703 (5.7%) | 851 (5.8%) |
| 75 Years and over | 532 (7.8%) | 1,269 (12.2%) |
| Total | 21,066 (13.9%) | 25,113 (16.0%) |
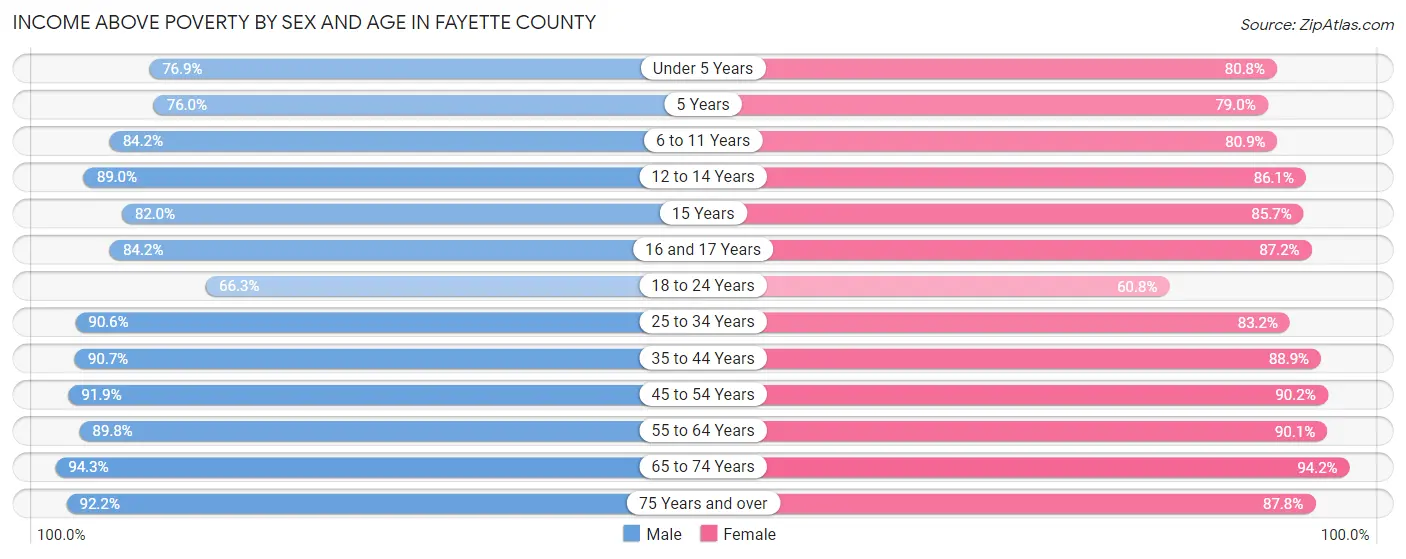
Income Above Poverty by Sex and Age in Fayette County
According to the poverty statistics in Fayette County, males aged 65 to 74 years and females aged 65 to 74 years are the age groups that are most secure financially, with 94.3% of males and 94.2% of females in these age groups living above the poverty line.
| Age Bracket | Male | Female |
| Under 5 Years | 7,009 (76.9%) | 7,023 (80.7%) |
| 5 Years | 1,318 (76.0%) | 1,374 (79.0%) |
| 6 to 11 Years | 9,822 (84.2%) | 8,857 (80.8%) |
| 12 to 14 Years | 4,635 (89.0%) | 4,368 (86.1%) |
| 15 Years | 1,539 (82.0%) | 1,446 (85.7%) |
| 16 and 17 Years | 3,186 (84.2%) | 3,139 (87.2%) |
| 18 to 24 Years | 12,837 (66.3%) | 11,717 (60.8%) |
| 25 to 34 Years | 21,636 (90.6%) | 19,456 (83.2%) |
| 35 to 44 Years | 18,794 (90.7%) | 18,228 (88.9%) |
| 45 to 54 Years | 16,841 (91.9%) | 16,447 (90.1%) |
| 55 to 64 Years | 15,424 (89.8%) | 17,031 (90.1%) |
| 65 to 74 Years | 11,621 (94.3%) | 13,860 (94.2%) |
| 75 Years and over | 6,301 (92.2%) | 9,166 (87.8%) |
| Total | 130,963 (86.1%) | 132,112 (84.0%) |
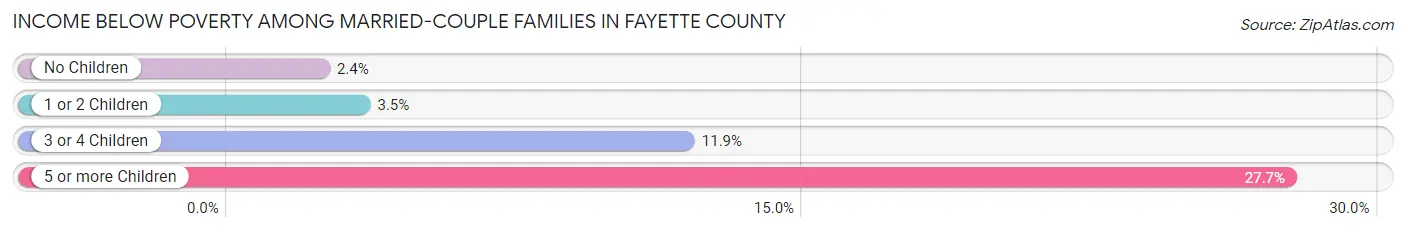
Income Below Poverty Among Married-Couple Families in Fayette County
The poverty statistics for married-couple families in Fayette County show that 3.6% or 1,989 of the total 54,674 families live below the poverty line. Families with 5 or more children have the highest poverty rate of 27.7%, comprising of 128 families. On the other hand, families with no children have the lowest poverty rate of 2.4%, which includes 757 families.
| Children | Above Poverty | Below Poverty |
| No Children | 30,721 (97.6%) | 757 (2.4%) |
| 1 or 2 Children | 18,337 (96.5%) | 658 (3.5%) |
| 3 or 4 Children | 3,292 (88.1%) | 446 (11.9%) |
| 5 or more Children | 335 (72.4%) | 128 (27.7%) |
| Total | 52,685 (96.4%) | 1,989 (3.6%) |
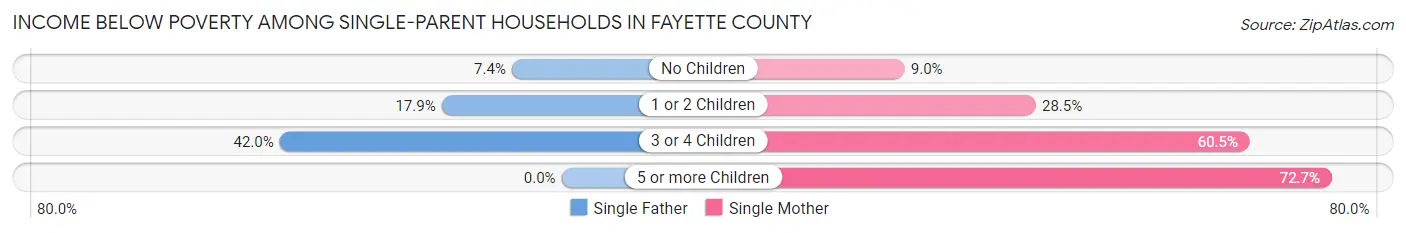
Income Below Poverty Among Single-Parent Households in Fayette County
According to the poverty data in Fayette County, 15.0% or 931 single-father households and 24.7% or 3,718 single-mother households are living below the poverty line. Among single-father households, those with 3 or 4 children have the highest poverty rate, with 155 households (42.0%) experiencing poverty. Likewise, among single-mother households, those with 5 or more children have the highest poverty rate, with 152 households (72.7%) falling below the poverty line.
| Children | Single Father | Single Mother |
| No Children | 191 (7.4%) | 548 (9.0%) |
| 1 or 2 Children | 585 (17.9%) | 2,022 (28.5%) |
| 3 or 4 Children | 155 (42.0%) | 996 (60.5%) |
| 5 or more Children | 0 (0.0%) | 152 (72.7%) |
| Total | 931 (15.0%) | 3,718 (24.7%) |
Income Below Poverty Among Married-Couple vs Single-Parent Households in Fayette County
The poverty data for Fayette County shows that 1,989 of the married-couple family households (3.6%) and 4,649 of the single-parent households (21.8%) are living below the poverty level. Within the married-couple family households, those with 5 or more children have the highest poverty rate, with 128 households (27.7%) falling below the poverty line. Among the single-parent households, those with 5 or more children have the highest poverty rate, with 152 household (72.7%) living below poverty.
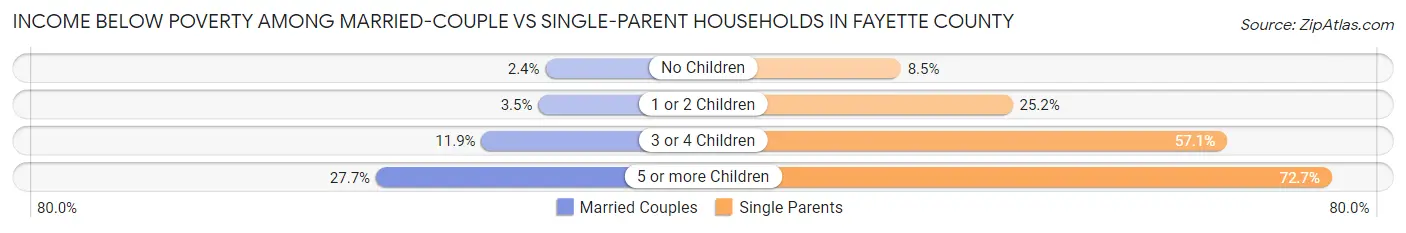
| Children | Married-Couple Families | Single-Parent Households |
| No Children | 757 (2.4%) | 739 (8.5%) |
| 1 or 2 Children | 658 (3.5%) | 2,607 (25.2%) |
| 3 or 4 Children | 446 (11.9%) | 1,151 (57.1%) |
| 5 or more Children | 128 (27.7%) | 152 (72.7%) |
| Total | 1,989 (3.6%) | 4,649 (21.8%) |
Employment Characteristics in Fayette County
Employment by Class of Employer in Fayette County
Among the 165,422 employed individuals in Fayette County, private company employees (105,592 | 63.8%), not-for-profit organizations (16,606 | 10.0%), and state government employees (15,958 | 9.7%) make up the most common classes of employment.
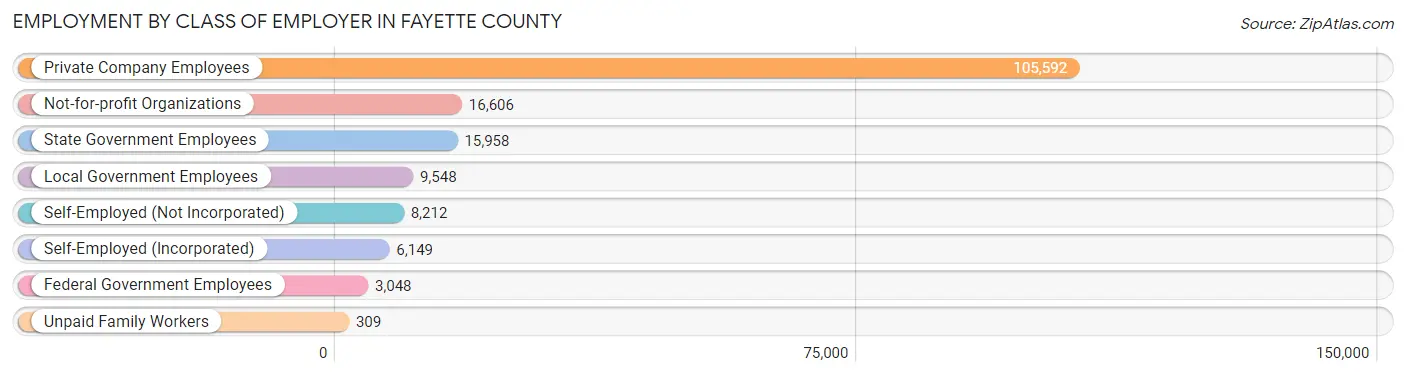
| Employer Class | # Employees | % Employees |
| Private Company Employees | 105,592 | 63.8% |
| Self-Employed (Incorporated) | 6,149 | 3.7% |
| Self-Employed (Not Incorporated) | 8,212 | 5.0% |
| Not-for-profit Organizations | 16,606 | 10.0% |
| Local Government Employees | 9,548 | 5.8% |
| State Government Employees | 15,958 | 9.7% |
| Federal Government Employees | 3,048 | 1.8% |
| Unpaid Family Workers | 309 | 0.2% |
| Total | 165,422 | 100.0% |
Employment Status by Age in Fayette County
According to the labor force statistics for Fayette County, out of the total population over 16 years of age (262,506), 67.9% or 178,242 individuals are in the labor force, with 5.0% or 8,912 of them unemployed. The age group with the highest labor force participation rate is 25 to 29 years, with 88.6% or 22,503 individuals in the labor force. Within the labor force, the 16 to 19 years age range has the highest percentage of unemployed individuals, with 18.2% or 1,486 of them being unemployed.
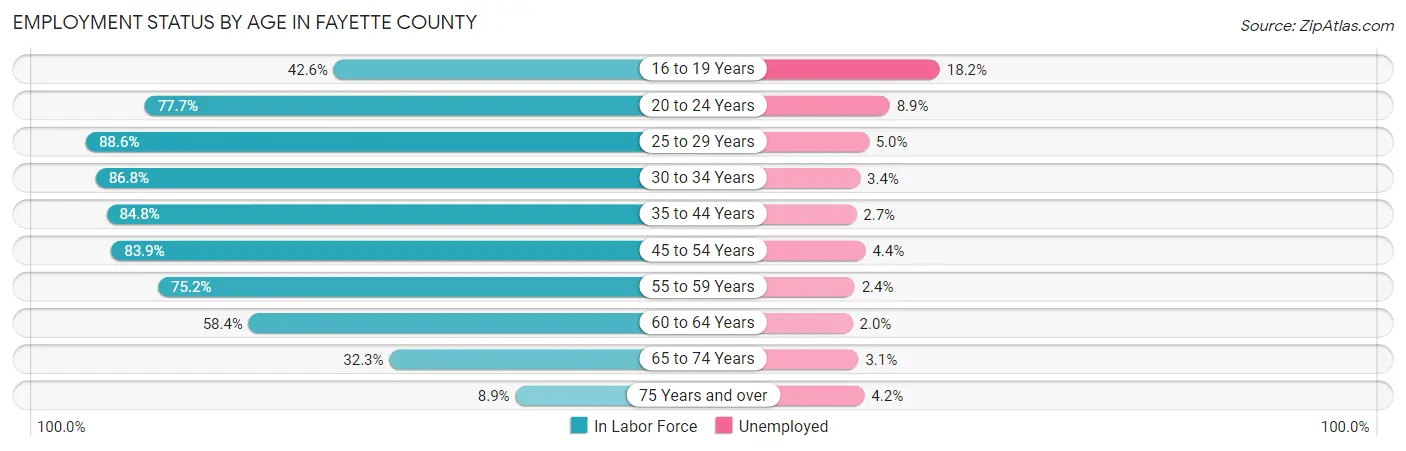
| Age Bracket | In Labor Force | Unemployed |
| 16 to 19 Years | 8,164 (42.6%) | 1,486 (18.2%) |
| 20 to 24 Years | 26,249 (77.7%) | 2,336 (8.9%) |
| 25 to 29 Years | 22,503 (88.6%) | 1,125 (5.0%) |
| 30 to 34 Years | 19,775 (86.8%) | 672 (3.4%) |
| 35 to 44 Years | 35,693 (84.8%) | 964 (2.7%) |
| 45 to 54 Years | 31,207 (83.9%) | 1,373 (4.4%) |
| 55 to 59 Years | 13,264 (75.2%) | 318 (2.4%) |
| 60 to 64 Years | 11,034 (58.4%) | 221 (2.0%) |
| 65 to 74 Years | 8,869 (32.3%) | 275 (3.1%) |
| 75 Years and over | 1,611 (8.9%) | 68 (4.2%) |
| Total | 178,242 (67.9%) | 8,912 (5.0%) |
Employment Status by Educational Attainment in Fayette County
According to labor force statistics for Fayette County, 81.4% of individuals (133,494) out of the total population between 25 and 64 years of age (163,998) are in the labor force, with 3.5% or 4,672 of them being unemployed. The group with the highest labor force participation rate are those with the educational attainment of bachelor's degree or higher, with 87.7% or 68,610 individuals in the labor force. Within the labor force, individuals with less than high school education have the highest percentage of unemployment, with 10.4% or 814 of them being unemployed.
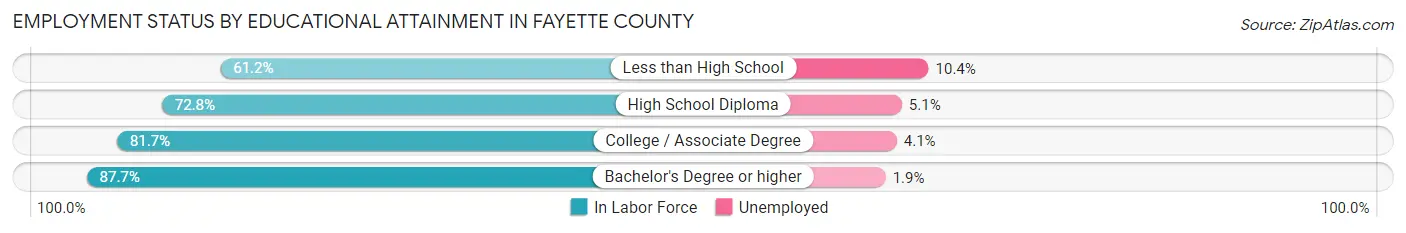
| Educational Attainment | In Labor Force | Unemployed |
| Less than High School | 7,827 (61.2%) | 1,330 (10.4%) |
| High School Diploma | 21,189 (72.8%) | 1,484 (5.1%) |
| College / Associate Degree | 35,842 (81.7%) | 1,799 (4.1%) |
| Bachelor's Degree or higher | 68,610 (87.7%) | 1,486 (1.9%) |
| Total | 133,494 (81.4%) | 5,740 (3.5%) |
Employment Occupations by Sex in Fayette County
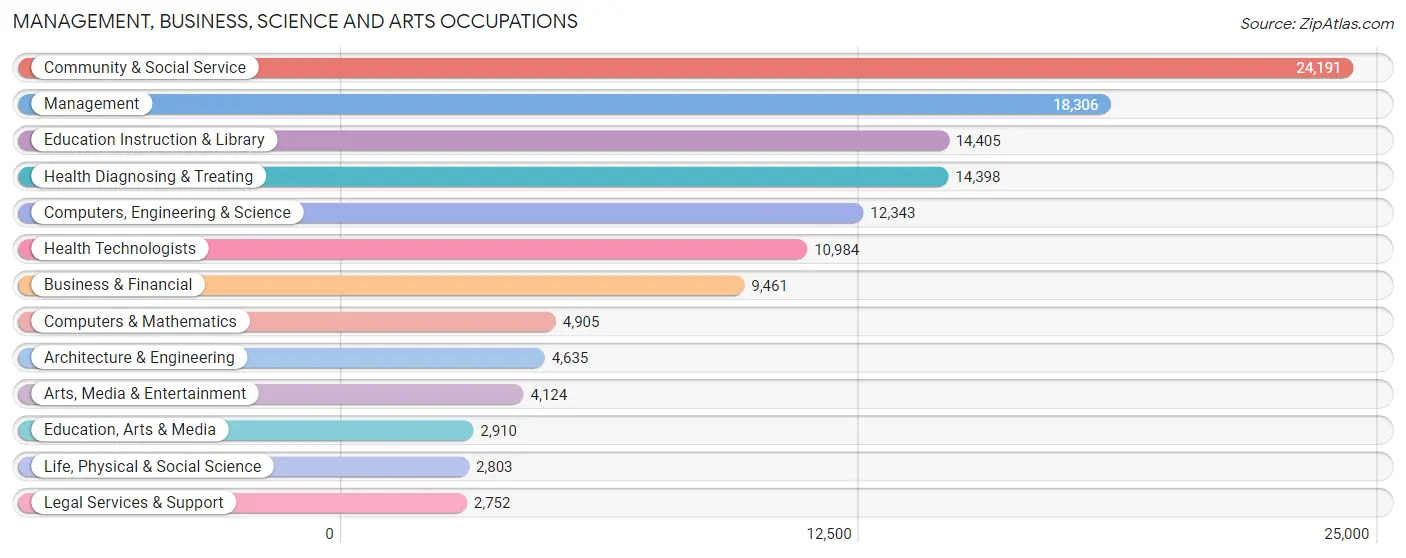
Management, Business, Science and Arts Occupations
The most common Management, Business, Science and Arts occupations in Fayette County are Community & Social Service (24,191 | 14.3%), Management (18,306 | 10.8%), Education Instruction & Library (14,405 | 8.5%), Health Diagnosing & Treating (14,398 | 8.5%), and Computers, Engineering & Science (12,343 | 7.3%).
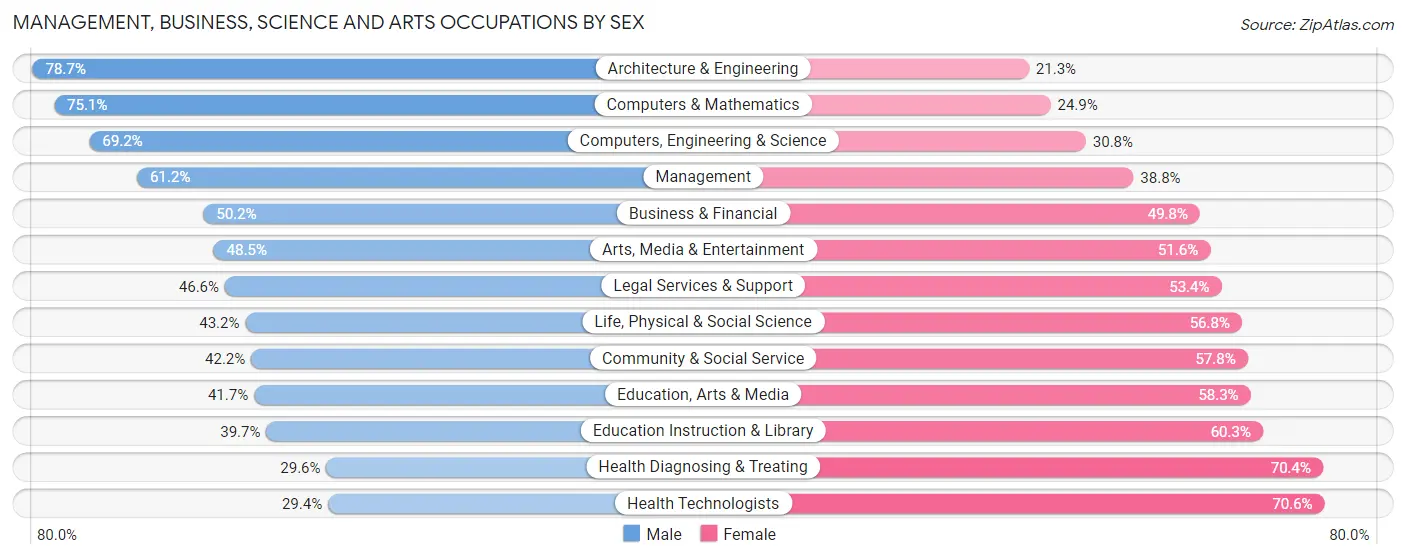
Management, Business, Science and Arts Occupations by Sex
Within the Management, Business, Science and Arts occupations in Fayette County, the most male-oriented occupations are Architecture & Engineering (78.7%), Computers & Mathematics (75.1%), and Computers, Engineering & Science (69.2%), while the most female-oriented occupations are Health Technologists (70.6%), Health Diagnosing & Treating (70.4%), and Education Instruction & Library (60.3%).
| Occupation | Male | Female |
| Management | 11,210 (61.2%) | 7,096 (38.8%) |
| Business & Financial | 4,747 (50.2%) | 4,714 (49.8%) |
| Computers, Engineering & Science | 8,539 (69.2%) | 3,804 (30.8%) |
| Computers & Mathematics | 3,682 (75.1%) | 1,223 (24.9%) |
| Architecture & Engineering | 3,647 (78.7%) | 988 (21.3%) |
| Life, Physical & Social Science | 1,210 (43.2%) | 1,593 (56.8%) |
| Community & Social Service | 10,208 (42.2%) | 13,983 (57.8%) |
| Education, Arts & Media | 1,214 (41.7%) | 1,696 (58.3%) |
| Legal Services & Support | 1,282 (46.6%) | 1,470 (53.4%) |
| Education Instruction & Library | 5,714 (39.7%) | 8,691 (60.3%) |
| Arts, Media & Entertainment | 1,998 (48.4%) | 2,126 (51.5%) |
| Health Diagnosing & Treating | 4,267 (29.6%) | 10,131 (70.4%) |
| Health Technologists | 3,226 (29.4%) | 7,758 (70.6%) |
| Total (Category) | 38,971 (49.5%) | 39,728 (50.5%) |
| Total (Overall) | 87,366 (51.6%) | 82,085 (48.4%) |
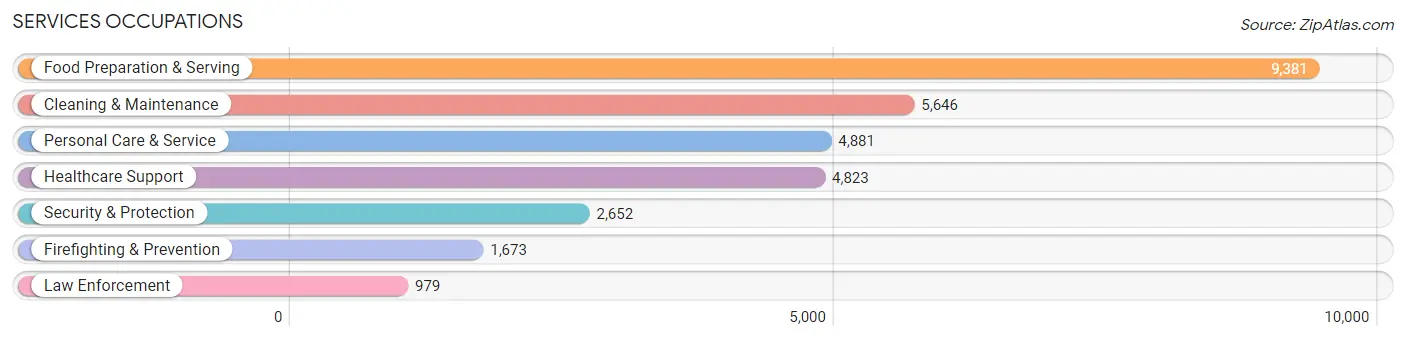
Services Occupations
The most common Services occupations in Fayette County are Food Preparation & Serving (9,381 | 5.5%), Cleaning & Maintenance (5,646 | 3.3%), Personal Care & Service (4,881 | 2.9%), Healthcare Support (4,823 | 2.9%), and Security & Protection (2,652 | 1.6%).
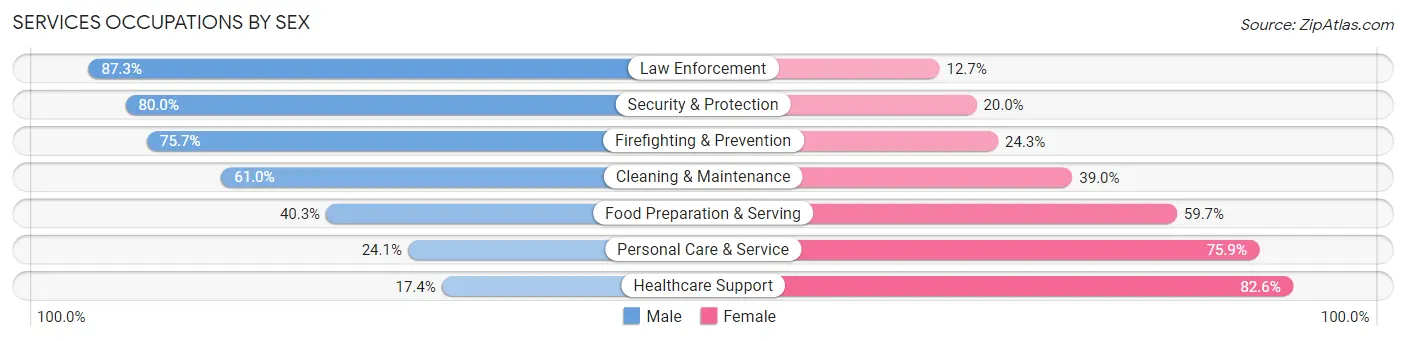
Services Occupations by Sex
Within the Services occupations in Fayette County, the most male-oriented occupations are Law Enforcement (87.3%), Security & Protection (80.0%), and Firefighting & Prevention (75.7%), while the most female-oriented occupations are Healthcare Support (82.6%), Personal Care & Service (75.9%), and Food Preparation & Serving (59.7%).
| Occupation | Male | Female |
| Healthcare Support | 841 (17.4%) | 3,982 (82.6%) |
| Security & Protection | 2,122 (80.0%) | 530 (20.0%) |
| Firefighting & Prevention | 1,267 (75.7%) | 406 (24.3%) |
| Law Enforcement | 855 (87.3%) | 124 (12.7%) |
| Food Preparation & Serving | 3,783 (40.3%) | 5,598 (59.7%) |
| Cleaning & Maintenance | 3,446 (61.0%) | 2,200 (39.0%) |
| Personal Care & Service | 1,178 (24.1%) | 3,703 (75.9%) |
| Total (Category) | 11,370 (41.5%) | 16,013 (58.5%) |
| Total (Overall) | 87,366 (51.6%) | 82,085 (48.4%) |
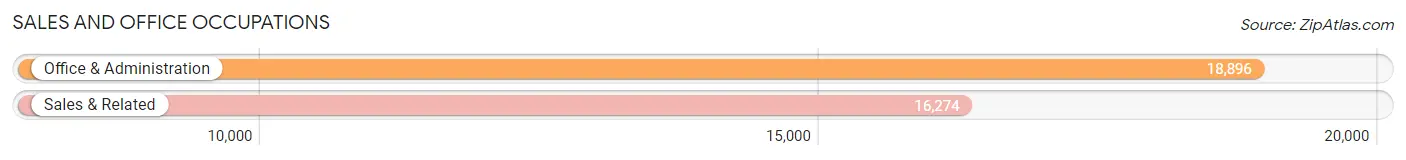
Sales and Office Occupations
The most common Sales and Office occupations in Fayette County are Office & Administration (18,896 | 11.2%), and Sales & Related (16,274 | 9.6%).
Sales and Office Occupations by Sex
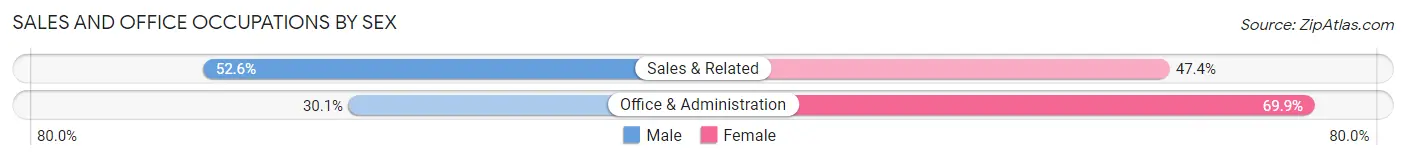
| Occupation | Male | Female |
| Sales & Related | 8,557 (52.6%) | 7,717 (47.4%) |
| Office & Administration | 5,687 (30.1%) | 13,209 (69.9%) |
| Total (Category) | 14,244 (40.5%) | 20,926 (59.5%) |
| Total (Overall) | 87,366 (51.6%) | 82,085 (48.4%) |
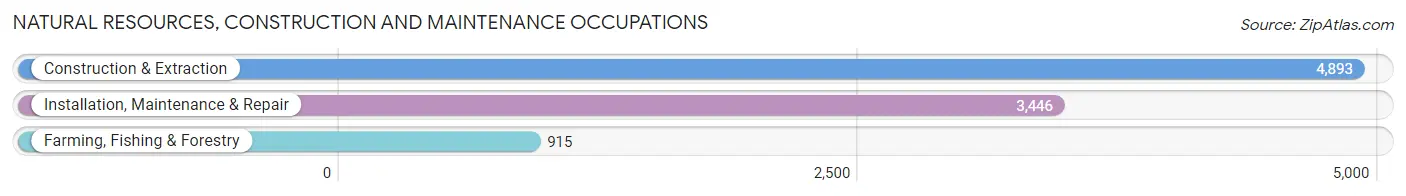
Natural Resources, Construction and Maintenance Occupations
The most common Natural Resources, Construction and Maintenance occupations in Fayette County are Construction & Extraction (4,893 | 2.9%), Installation, Maintenance & Repair (3,446 | 2.0%), and Farming, Fishing & Forestry (915 | 0.5%).
Natural Resources, Construction and Maintenance Occupations by Sex
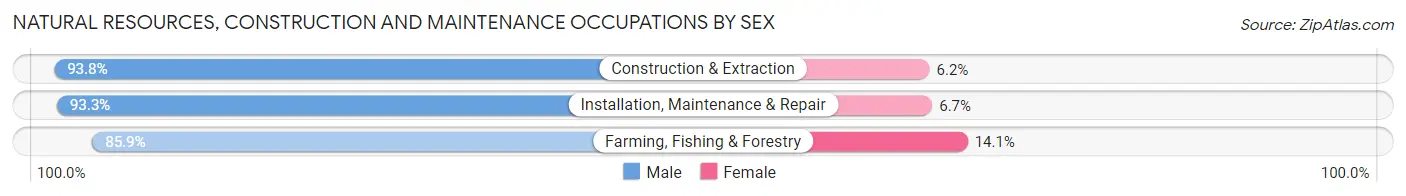
| Occupation | Male | Female |
| Farming, Fishing & Forestry | 786 (85.9%) | 129 (14.1%) |
| Construction & Extraction | 4,591 (93.8%) | 302 (6.2%) |
| Installation, Maintenance & Repair | 3,214 (93.3%) | 232 (6.7%) |
| Total (Category) | 8,591 (92.8%) | 663 (7.2%) |
| Total (Overall) | 87,366 (51.6%) | 82,085 (48.4%) |
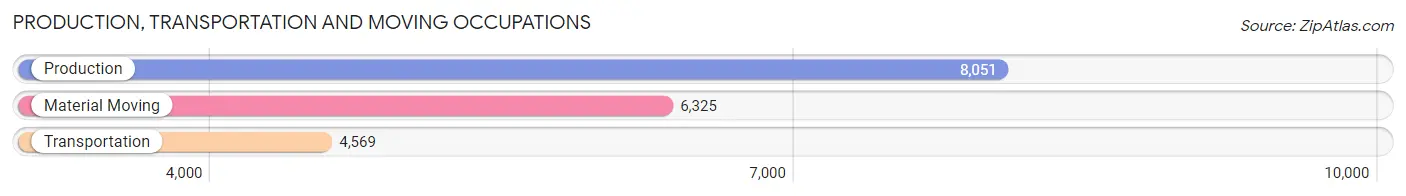
Production, Transportation and Moving Occupations
The most common Production, Transportation and Moving occupations in Fayette County are Production (8,051 | 4.8%), Material Moving (6,325 | 3.7%), and Transportation (4,569 | 2.7%).
Production, Transportation and Moving Occupations by Sex
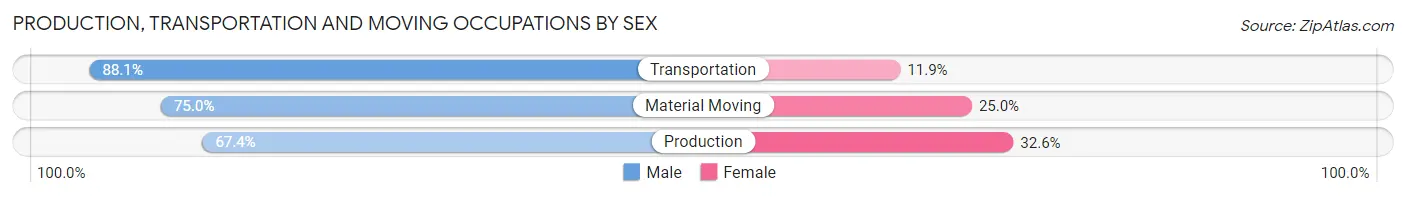
| Occupation | Male | Female |
| Production | 5,423 (67.4%) | 2,628 (32.6%) |
| Transportation | 4,025 (88.1%) | 544 (11.9%) |
| Material Moving | 4,742 (75.0%) | 1,583 (25.0%) |
| Total (Category) | 14,190 (74.9%) | 4,755 (25.1%) |
| Total (Overall) | 87,366 (51.6%) | 82,085 (48.4%) |
Employment Industries by Sex in Fayette County
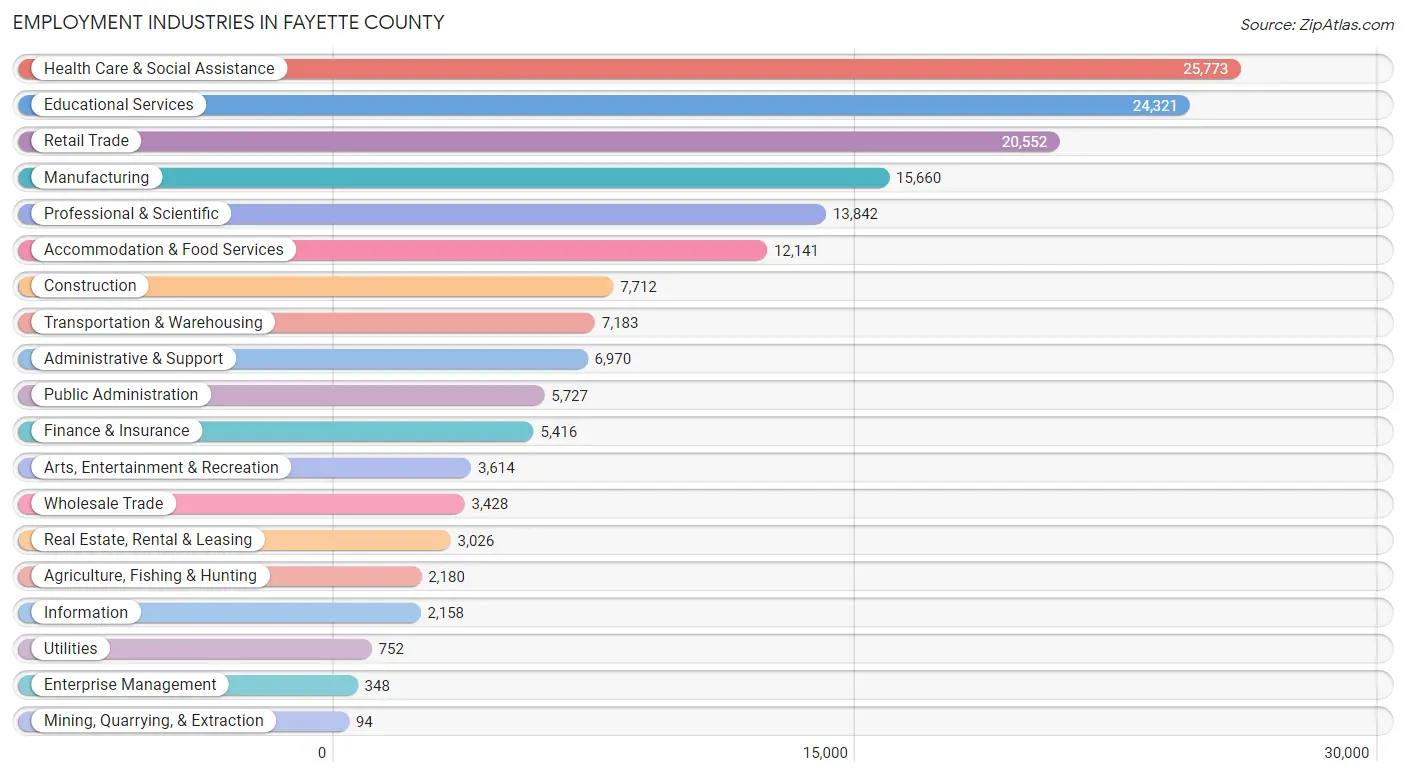
Employment Industries in Fayette County
The major employment industries in Fayette County include Health Care & Social Assistance (25,773 | 15.2%), Educational Services (24,321 | 14.3%), Retail Trade (20,552 | 12.1%), Manufacturing (15,660 | 9.2%), and Professional & Scientific (13,842 | 8.2%).
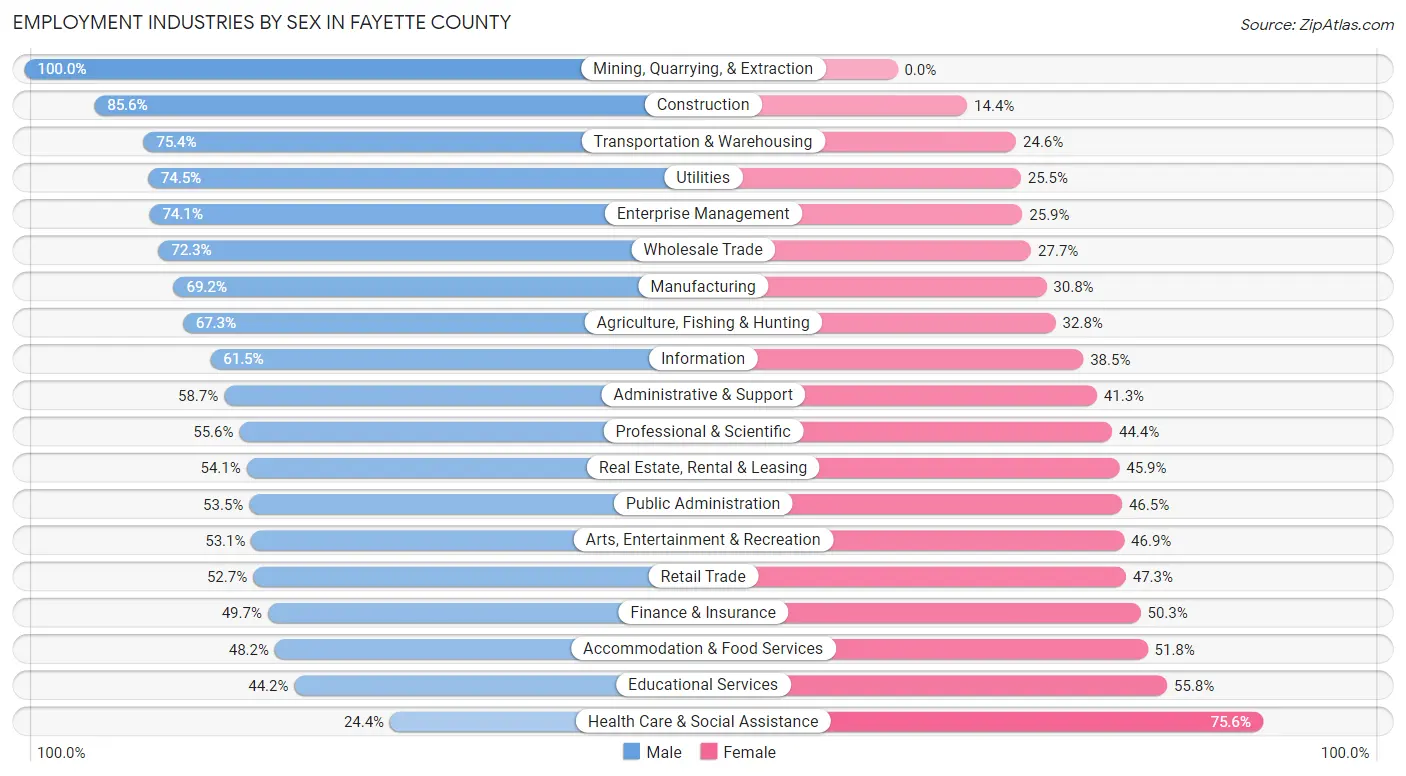
Employment Industries by Sex in Fayette County
The Fayette County industries that see more men than women are Mining, Quarrying, & Extraction (100.0%), Construction (85.6%), and Transportation & Warehousing (75.4%), whereas the industries that tend to have a higher number of women are Health Care & Social Assistance (75.6%), Educational Services (55.8%), and Accommodation & Food Services (51.8%).
| Industry | Male | Female |
| Agriculture, Fishing & Hunting | 1,466 (67.2%) | 714 (32.8%) |
| Mining, Quarrying, & Extraction | 94 (100.0%) | 0 (0.0%) |
| Construction | 6,599 (85.6%) | 1,113 (14.4%) |
| Manufacturing | 10,830 (69.2%) | 4,830 (30.8%) |
| Wholesale Trade | 2,479 (72.3%) | 949 (27.7%) |
| Retail Trade | 10,838 (52.7%) | 9,714 (47.3%) |
| Transportation & Warehousing | 5,418 (75.4%) | 1,765 (24.6%) |
| Utilities | 560 (74.5%) | 192 (25.5%) |
| Information | 1,328 (61.5%) | 830 (38.5%) |
| Finance & Insurance | 2,690 (49.7%) | 2,726 (50.3%) |
| Real Estate, Rental & Leasing | 1,636 (54.1%) | 1,390 (45.9%) |
| Professional & Scientific | 7,692 (55.6%) | 6,150 (44.4%) |
| Enterprise Management | 258 (74.1%) | 90 (25.9%) |
| Administrative & Support | 4,092 (58.7%) | 2,878 (41.3%) |
| Educational Services | 10,744 (44.2%) | 13,577 (55.8%) |
| Health Care & Social Assistance | 6,283 (24.4%) | 19,490 (75.6%) |
| Arts, Entertainment & Recreation | 1,918 (53.1%) | 1,696 (46.9%) |
| Accommodation & Food Services | 5,853 (48.2%) | 6,288 (51.8%) |
| Public Administration | 3,065 (53.5%) | 2,662 (46.5%) |
| Total | 87,366 (51.6%) | 82,085 (48.4%) |
Education in Fayette County
School Enrollment in Fayette County
The most common levels of schooling among the 88,025 students in Fayette County are college / undergraduate (27,377 | 31.1%), elementary school (14,360 | 16.3%), and middle school (14,310 | 16.3%).
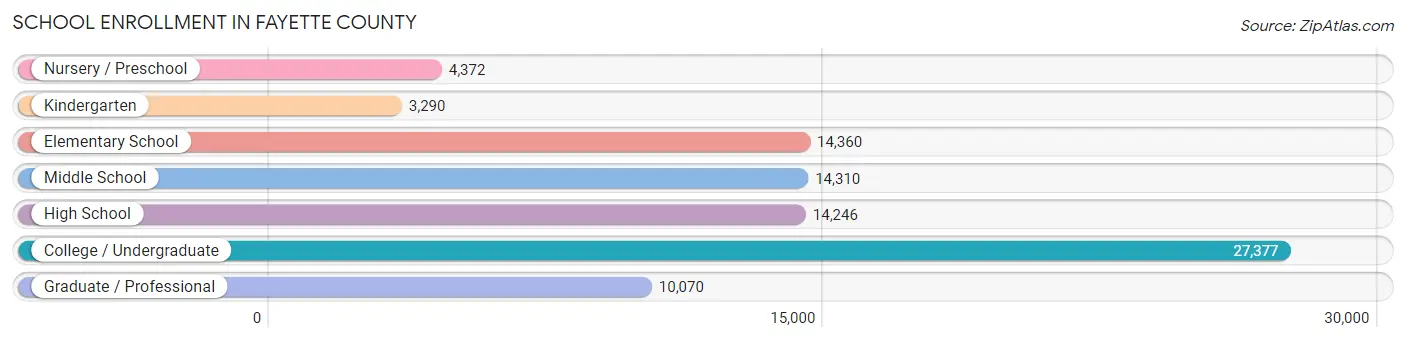
| School Level | # Students | % Students |
| Nursery / Preschool | 4,372 | 5.0% |
| Kindergarten | 3,290 | 3.7% |
| Elementary School | 14,360 | 16.3% |
| Middle School | 14,310 | 16.3% |
| High School | 14,246 | 16.2% |
| College / Undergraduate | 27,377 | 31.1% |
| Graduate / Professional | 10,070 | 11.4% |
| Total | 88,025 | 100.0% |
School Enrollment by Age by Funding Source in Fayette County
Out of a total of 88,025 students who are enrolled in schools in Fayette County, 13,556 (15.4%) attend a private institution, while the remaining 74,469 (84.6%) are enrolled in public schools. The age group of 3 to 4 year olds has the highest likelihood of being enrolled in private schools, with 2,142 (66.6% in the age bracket) enrolled. Conversely, the age group of 18 to 19 year olds has the lowest likelihood of being enrolled in a private school, with 8,787 (93.0% in the age bracket) attending a public institution.
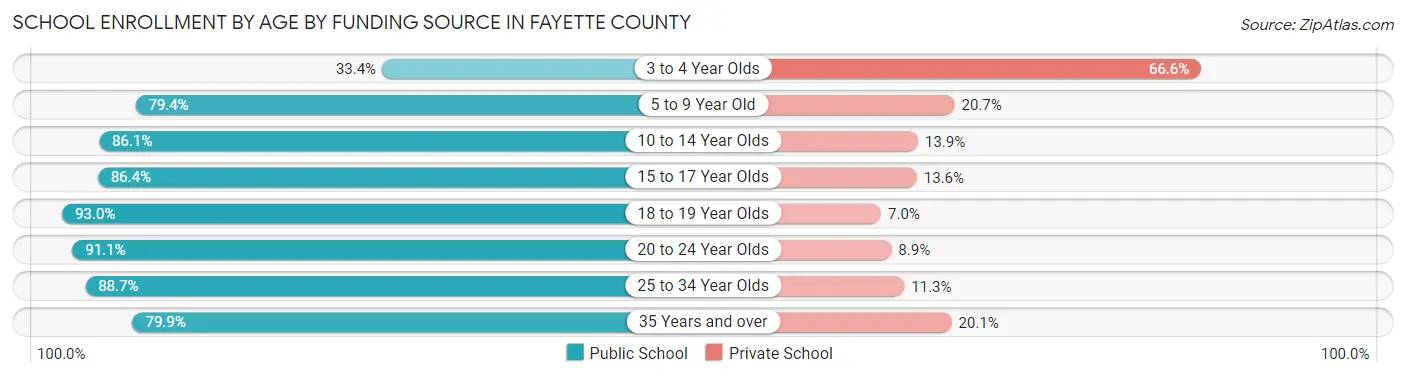
| Age Bracket | Public School | Private School |
| 3 to 4 Year Olds | 1,076 (33.4%) | 2,142 (66.6%) |
| 5 to 9 Year Old | 13,642 (79.3%) | 3,551 (20.6%) |
| 10 to 14 Year Olds | 15,333 (86.1%) | 2,467 (13.9%) |
| 15 to 17 Year Olds | 9,421 (86.4%) | 1,487 (13.6%) |
| 18 to 19 Year Olds | 8,787 (93.0%) | 658 (7.0%) |
| 20 to 24 Year Olds | 16,791 (91.1%) | 1,639 (8.9%) |
| 25 to 34 Year Olds | 6,251 (88.7%) | 796 (11.3%) |
| 35 Years and over | 3,183 (79.9%) | 801 (20.1%) |
| Total | 74,469 (84.6%) | 13,556 (15.4%) |
Educational Attainment by Field of Study in Fayette County
Business (19,141 | 17.9%), science & technology (11,749 | 11.0%), education (11,231 | 10.5%), bio, nature & agricultural (9,225 | 8.6%), and engineering (8,292 | 7.8%) are the most common fields of study among 106,910 individuals in Fayette County who have obtained a bachelor's degree or higher.
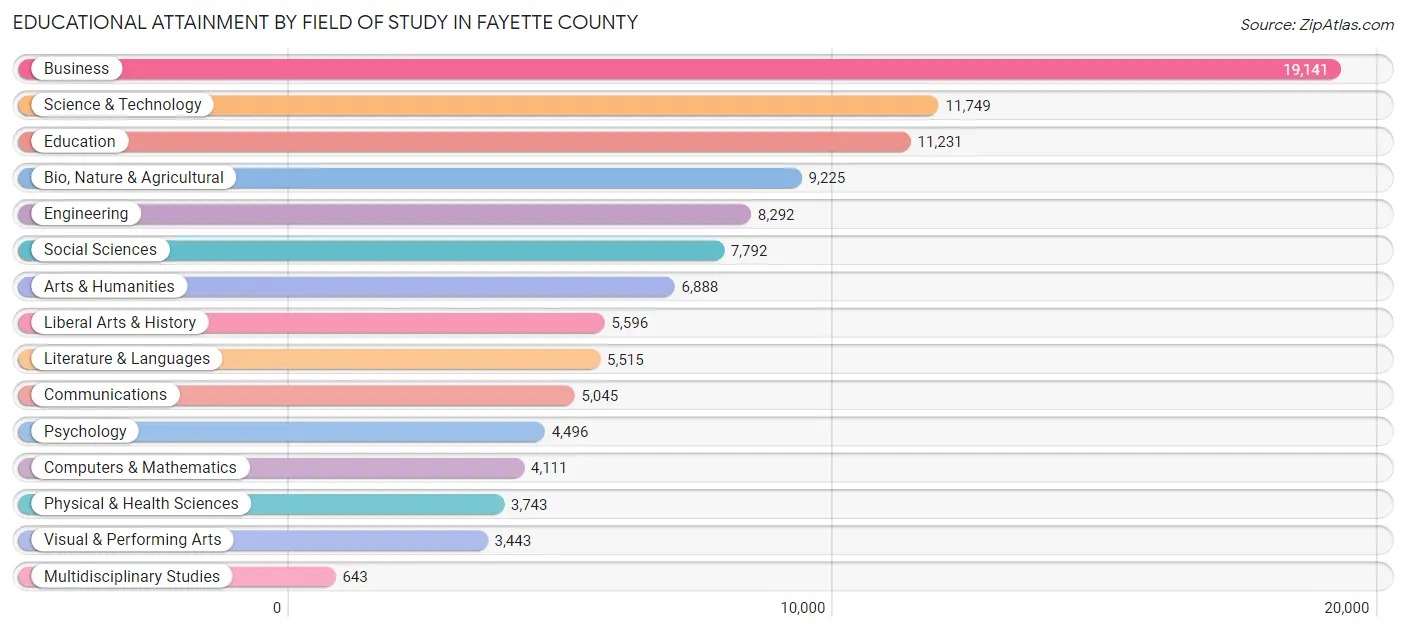
| Field of Study | # Graduates | % Graduates |
| Computers & Mathematics | 4,111 | 3.8% |
| Bio, Nature & Agricultural | 9,225 | 8.6% |
| Physical & Health Sciences | 3,743 | 3.5% |
| Psychology | 4,496 | 4.2% |
| Social Sciences | 7,792 | 7.3% |
| Engineering | 8,292 | 7.8% |
| Multidisciplinary Studies | 643 | 0.6% |
| Science & Technology | 11,749 | 11.0% |
| Business | 19,141 | 17.9% |
| Education | 11,231 | 10.5% |
| Literature & Languages | 5,515 | 5.2% |
| Liberal Arts & History | 5,596 | 5.2% |
| Visual & Performing Arts | 3,443 | 3.2% |
| Communications | 5,045 | 4.7% |
| Arts & Humanities | 6,888 | 6.4% |
| Total | 106,910 | 100.0% |
Transportation & Commute in Fayette County
Vehicle Availability by Sex in Fayette County
The most prevalent vehicle ownership categories in Fayette County are males with 2 vehicles (40,400, accounting for 47.5%) and females with 2 vehicles (36,462, making up 51.5%).
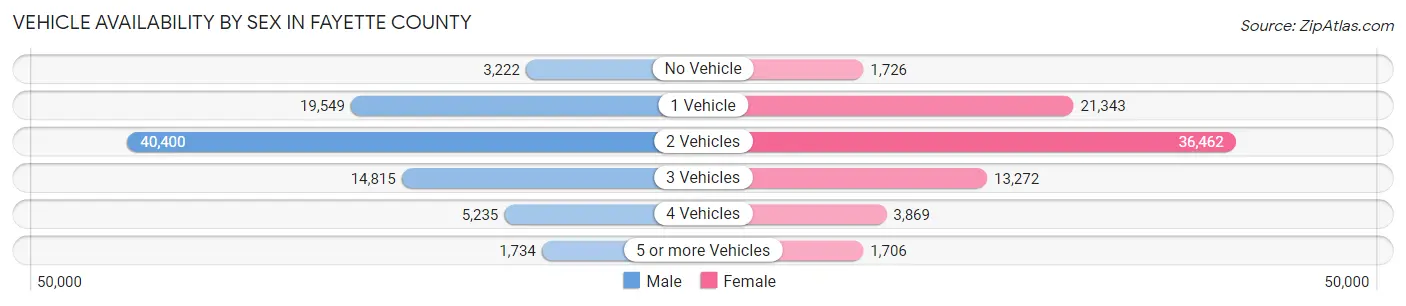
| Vehicles Available | Male | Female |
| No Vehicle | 3,222 (3.8%) | 1,726 (2.2%) |
| 1 Vehicle | 19,549 (23.0%) | 21,343 (27.2%) |
| 2 Vehicles | 40,400 (47.5%) | 36,462 (46.5%) |
| 3 Vehicles | 14,815 (17.4%) | 13,272 (16.9%) |
| 4 Vehicles | 5,235 (6.2%) | 3,869 (4.9%) |
| 5 or more Vehicles | 1,734 (2.0%) | 1,706 (2.2%) |
| Total | 84,955 (100.0%) | 78,378 (100.0%) |
Commute Time in Fayette County
The most frequently occuring commute durations in Fayette County are 15 to 19 minutes (33,830 commuters, 22.6%), 20 to 24 minutes (30,146 commuters, 20.2%), and 10 to 14 minutes (25,562 commuters, 17.1%).
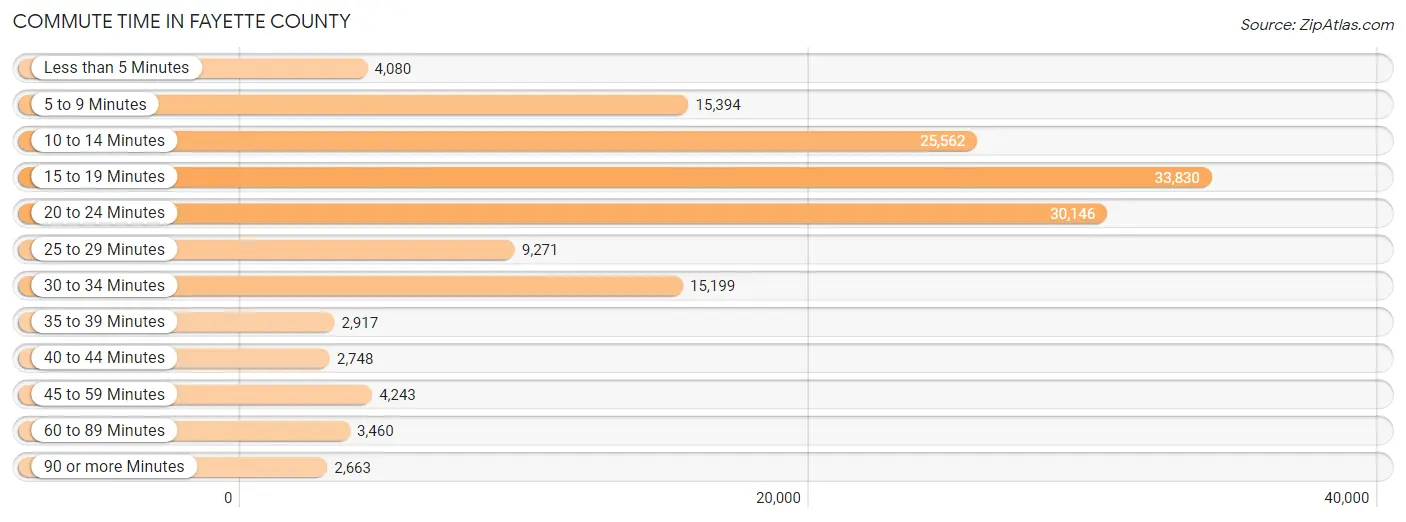
| Commute Time | # Commuters | % Commuters |
| Less than 5 Minutes | 4,080 | 2.7% |
| 5 to 9 Minutes | 15,394 | 10.3% |
| 10 to 14 Minutes | 25,562 | 17.1% |
| 15 to 19 Minutes | 33,830 | 22.6% |
| 20 to 24 Minutes | 30,146 | 20.2% |
| 25 to 29 Minutes | 9,271 | 6.2% |
| 30 to 34 Minutes | 15,199 | 10.2% |
| 35 to 39 Minutes | 2,917 | 1.9% |
| 40 to 44 Minutes | 2,748 | 1.8% |
| 45 to 59 Minutes | 4,243 | 2.8% |
| 60 to 89 Minutes | 3,460 | 2.3% |
| 90 or more Minutes | 2,663 | 1.8% |
Commute Time by Sex in Fayette County
The most common commute times in Fayette County are 15 to 19 minutes (17,253 commuters, 22.2%) for males and 15 to 19 minutes (16,577 commuters, 23.1%) for females.
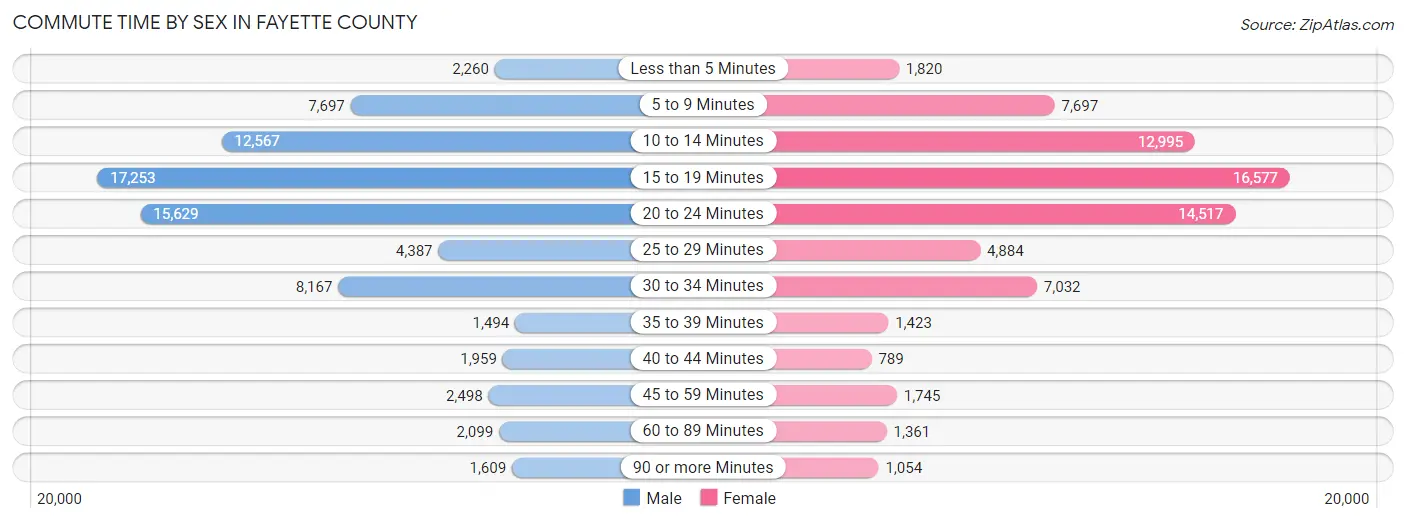
| Commute Time | Male | Female |
| Less than 5 Minutes | 2,260 (2.9%) | 1,820 (2.5%) |
| 5 to 9 Minutes | 7,697 (9.9%) | 7,697 (10.7%) |
| 10 to 14 Minutes | 12,567 (16.2%) | 12,995 (18.1%) |
| 15 to 19 Minutes | 17,253 (22.2%) | 16,577 (23.1%) |
| 20 to 24 Minutes | 15,629 (20.1%) | 14,517 (20.2%) |
| 25 to 29 Minutes | 4,387 (5.7%) | 4,884 (6.8%) |
| 30 to 34 Minutes | 8,167 (10.5%) | 7,032 (9.8%) |
| 35 to 39 Minutes | 1,494 (1.9%) | 1,423 (2.0%) |
| 40 to 44 Minutes | 1,959 (2.5%) | 789 (1.1%) |
| 45 to 59 Minutes | 2,498 (3.2%) | 1,745 (2.4%) |
| 60 to 89 Minutes | 2,099 (2.7%) | 1,361 (1.9%) |
| 90 or more Minutes | 1,609 (2.1%) | 1,054 (1.5%) |
Time of Departure to Work by Sex in Fayette County
The most frequent times of departure to work in Fayette County are 7:30 AM to 7:59 AM (11,132, 14.3%) for males and 7:30 AM to 7:59 AM (10,856, 15.1%) for females.
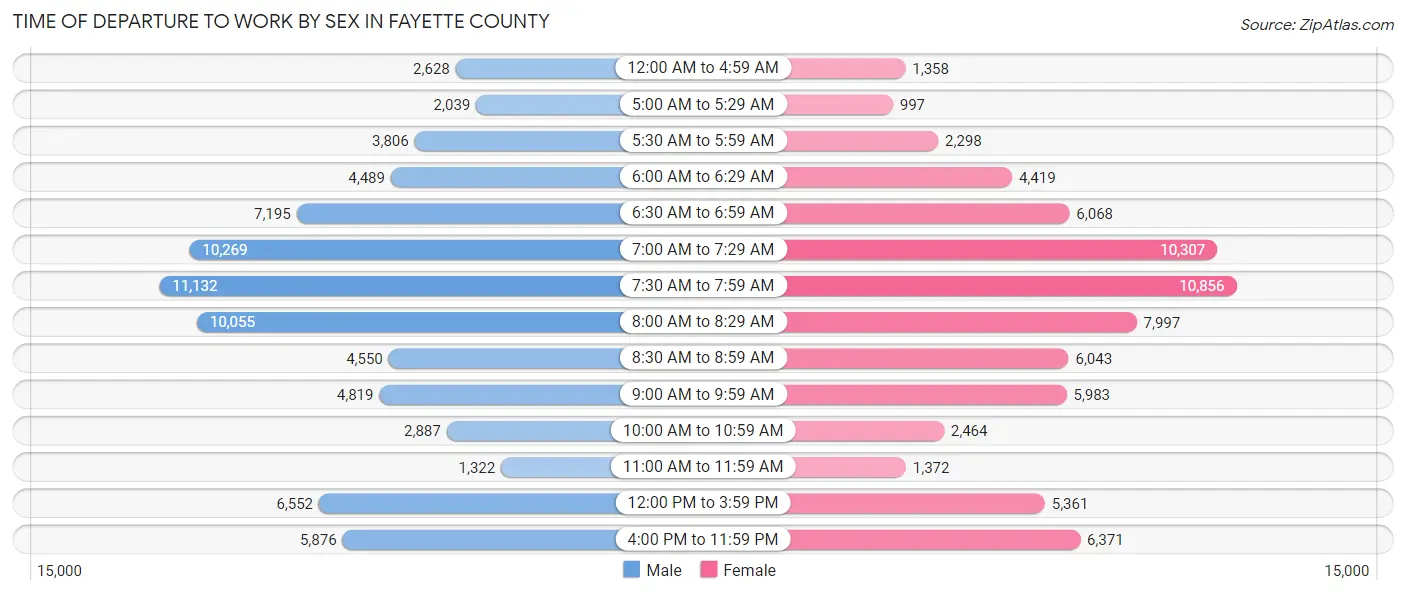
| Time of Departure | Male | Female |
| 12:00 AM to 4:59 AM | 2,628 (3.4%) | 1,358 (1.9%) |
| 5:00 AM to 5:29 AM | 2,039 (2.6%) | 997 (1.4%) |
| 5:30 AM to 5:59 AM | 3,806 (4.9%) | 2,298 (3.2%) |
| 6:00 AM to 6:29 AM | 4,489 (5.8%) | 4,419 (6.1%) |
| 6:30 AM to 6:59 AM | 7,195 (9.3%) | 6,068 (8.4%) |
| 7:00 AM to 7:29 AM | 10,269 (13.2%) | 10,307 (14.3%) |
| 7:30 AM to 7:59 AM | 11,132 (14.3%) | 10,856 (15.1%) |
| 8:00 AM to 8:29 AM | 10,055 (13.0%) | 7,997 (11.1%) |
| 8:30 AM to 8:59 AM | 4,550 (5.9%) | 6,043 (8.4%) |
| 9:00 AM to 9:59 AM | 4,819 (6.2%) | 5,983 (8.3%) |
| 10:00 AM to 10:59 AM | 2,887 (3.7%) | 2,464 (3.4%) |
| 11:00 AM to 11:59 AM | 1,322 (1.7%) | 1,372 (1.9%) |
| 12:00 PM to 3:59 PM | 6,552 (8.4%) | 5,361 (7.5%) |
| 4:00 PM to 11:59 PM | 5,876 (7.6%) | 6,371 (8.9%) |
| Total | 77,619 (100.0%) | 71,894 (100.0%) |
Housing Occupancy in Fayette County
Occupancy by Ownership in Fayette County
Of the total 136,104 dwellings in Fayette County, owner-occupied units account for 73,941 (54.3%), while renter-occupied units make up 62,163 (45.7%).
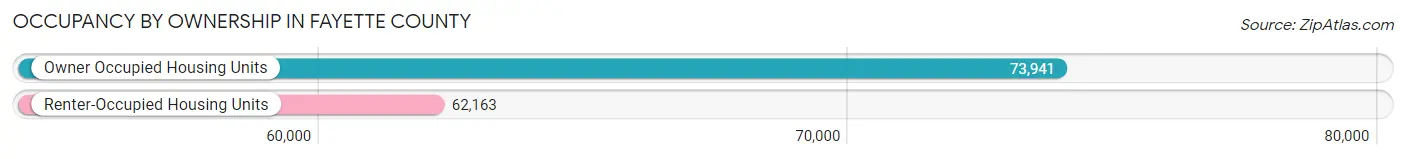
| Occupancy | # Housing Units | % Housing Units |
| Owner Occupied Housing Units | 73,941 | 54.3% |
| Renter-Occupied Housing Units | 62,163 | 45.7% |
| Total Occupied Housing Units | 136,104 | 100.0% |
Occupancy by Household Size in Fayette County
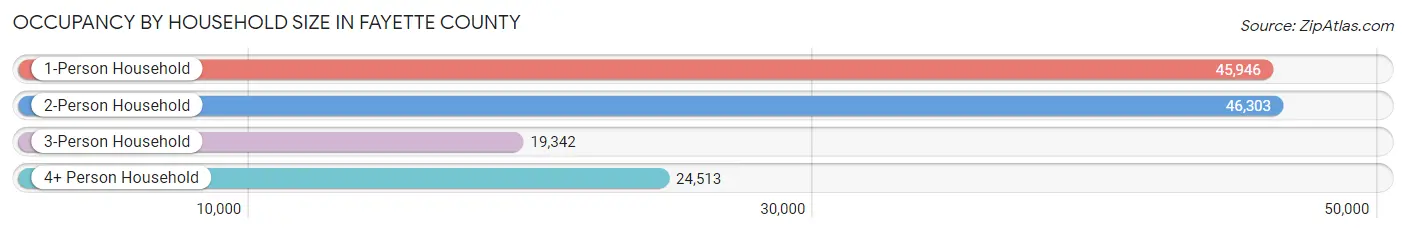
| Household Size | # Housing Units | % Housing Units |
| 1-Person Household | 45,946 | 33.8% |
| 2-Person Household | 46,303 | 34.0% |
| 3-Person Household | 19,342 | 14.2% |
| 4+ Person Household | 24,513 | 18.0% |
| Total Housing Units | 136,104 | 100.0% |
Occupancy by Ownership by Household Size in Fayette County
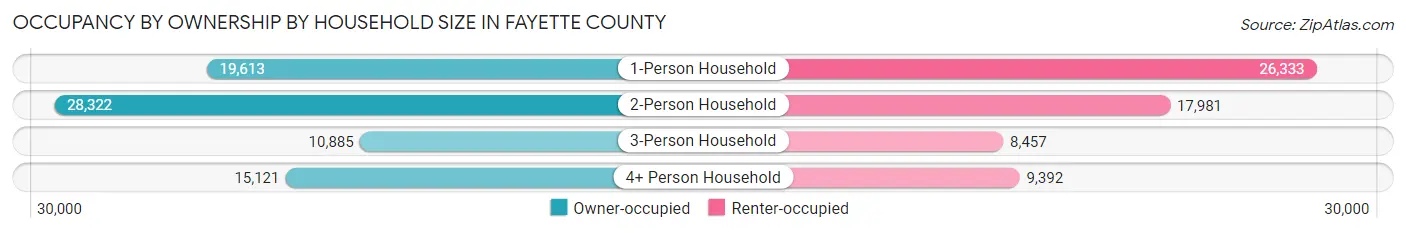
| Household Size | Owner-occupied | Renter-occupied |
| 1-Person Household | 19,613 (42.7%) | 26,333 (57.3%) |
| 2-Person Household | 28,322 (61.2%) | 17,981 (38.8%) |
| 3-Person Household | 10,885 (56.3%) | 8,457 (43.7%) |
| 4+ Person Household | 15,121 (61.7%) | 9,392 (38.3%) |
| Total Housing Units | 73,941 (54.3%) | 62,163 (45.7%) |
Occupancy by Educational Attainment in Fayette County
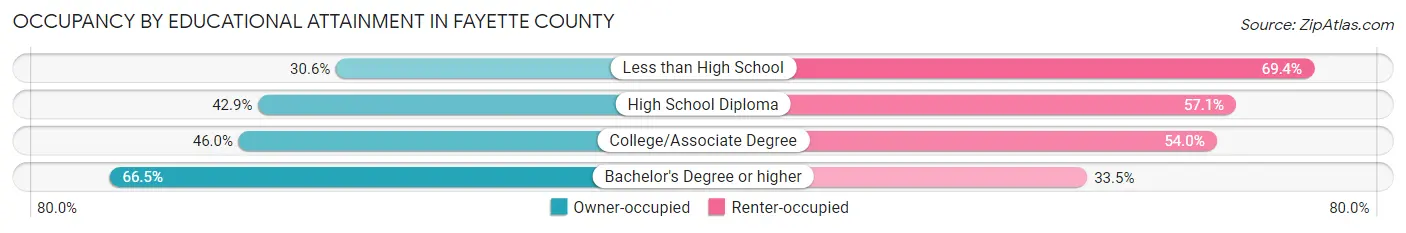
| Household Size | Owner-occupied | Renter-occupied |
| Less than High School | 2,578 (30.6%) | 5,852 (69.4%) |
| High School Diploma | 9,563 (42.9%) | 12,707 (57.1%) |
| College/Associate Degree | 18,675 (46.0%) | 21,898 (54.0%) |
| Bachelor's Degree or higher | 43,125 (66.5%) | 21,706 (33.5%) |
Occupancy by Age of Householder in Fayette County
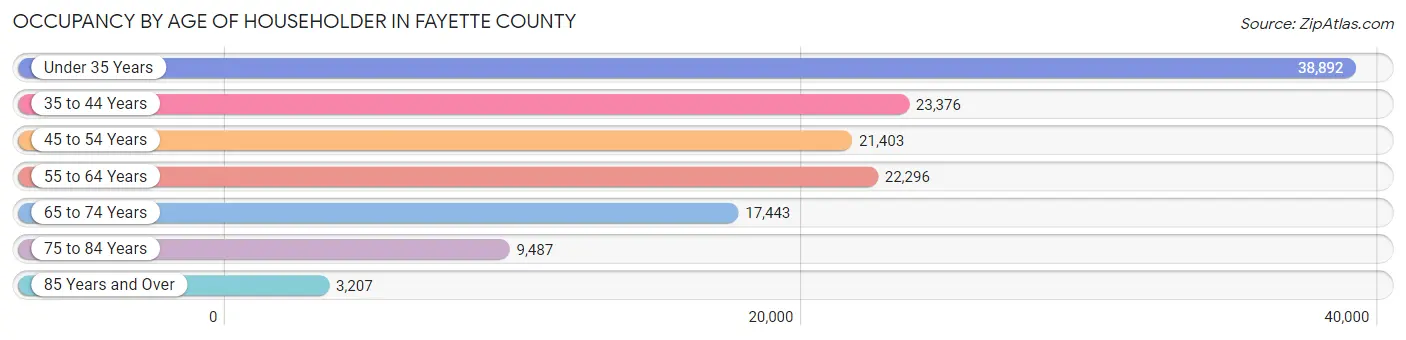
| Age Bracket | # Households | % Households |
| Under 35 Years | 38,892 | 28.6% |
| 35 to 44 Years | 23,376 | 17.2% |
| 45 to 54 Years | 21,403 | 15.7% |
| 55 to 64 Years | 22,296 | 16.4% |
| 65 to 74 Years | 17,443 | 12.8% |
| 75 to 84 Years | 9,487 | 7.0% |
| 85 Years and Over | 3,207 | 2.4% |
| Total | 136,104 | 100.0% |
Housing Finances in Fayette County
Median Income by Occupancy in Fayette County
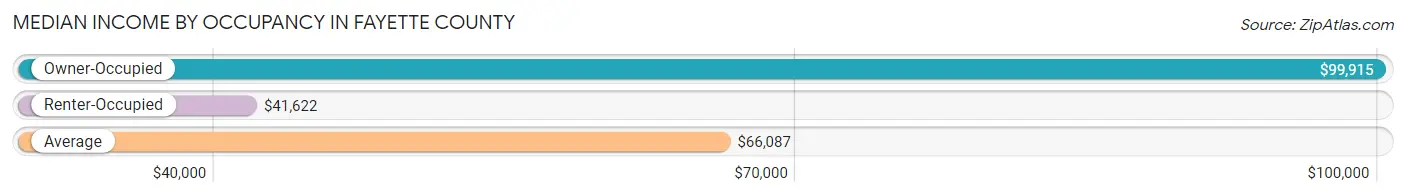
| Occupancy Type | # Households | Median Income |
| Owner-Occupied | 73,941 (54.3%) | $99,915 |
| Renter-Occupied | 62,163 (45.7%) | $41,622 |
| Average | 136,104 (100.0%) | $66,087 |
Occupancy by Householder Income Bracket in Fayette County
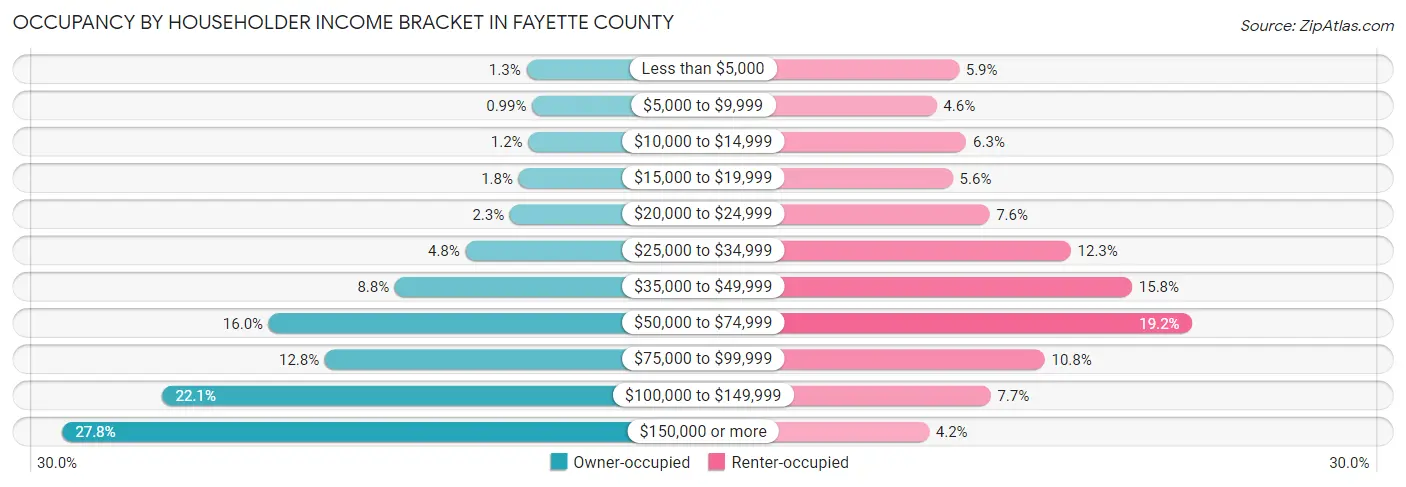
| Income Bracket | Owner-occupied | Renter-occupied |
| Less than $5,000 | 977 (1.3%) | 3,666 (5.9%) |
| $5,000 to $9,999 | 731 (1.0%) | 2,871 (4.6%) |
| $10,000 to $14,999 | 896 (1.2%) | 3,927 (6.3%) |
| $15,000 to $19,999 | 1,299 (1.8%) | 3,453 (5.6%) |
| $20,000 to $24,999 | 1,673 (2.3%) | 4,751 (7.6%) |
| $25,000 to $34,999 | 3,549 (4.8%) | 7,637 (12.3%) |
| $35,000 to $49,999 | 6,526 (8.8%) | 9,813 (15.8%) |
| $50,000 to $74,999 | 11,860 (16.0%) | 11,928 (19.2%) |
| $75,000 to $99,999 | 9,486 (12.8%) | 6,716 (10.8%) |
| $100,000 to $149,999 | 16,359 (22.1%) | 4,794 (7.7%) |
| $150,000 or more | 20,585 (27.8%) | 2,607 (4.2%) |
| Total | 73,941 (100.0%) | 62,163 (100.0%) |
Monthly Housing Cost Tiers in Fayette County
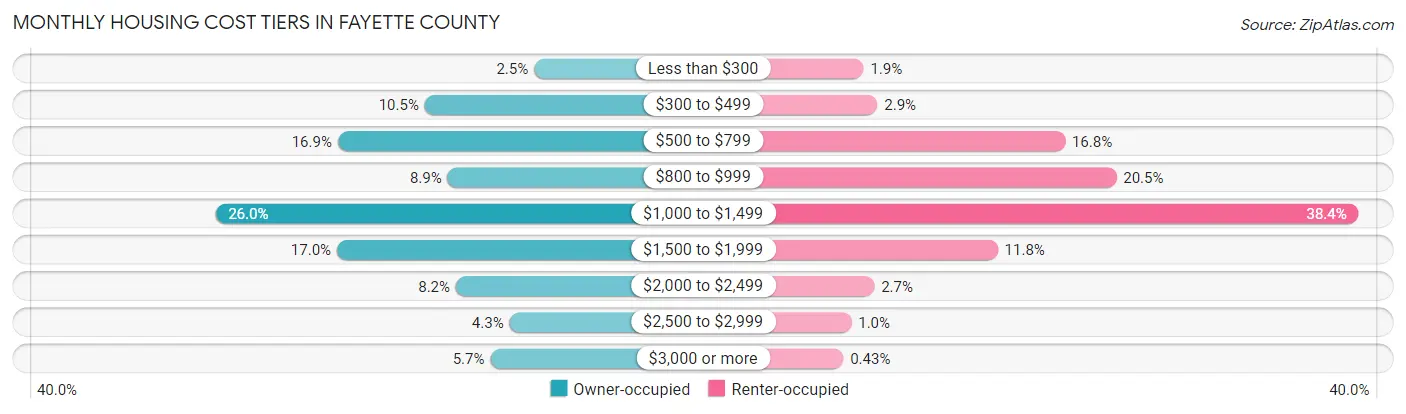
| Monthly Cost | Owner-occupied | Renter-occupied |
| Less than $300 | 1,836 (2.5%) | 1,193 (1.9%) |
| $300 to $499 | 7,783 (10.5%) | 1,826 (2.9%) |
| $500 to $799 | 12,527 (16.9%) | 10,420 (16.8%) |
| $800 to $999 | 6,547 (8.8%) | 12,771 (20.5%) |
| $1,000 to $1,499 | 19,197 (26.0%) | 23,861 (38.4%) |
| $1,500 to $1,999 | 12,573 (17.0%) | 7,338 (11.8%) |
| $2,000 to $2,499 | 6,090 (8.2%) | 1,684 (2.7%) |
| $2,500 to $2,999 | 3,172 (4.3%) | 631 (1.0%) |
| $3,000 or more | 4,216 (5.7%) | 269 (0.4%) |
| Total | 73,941 (100.0%) | 62,163 (100.0%) |
Physical Housing Characteristics in Fayette County
Housing Structures in Fayette County
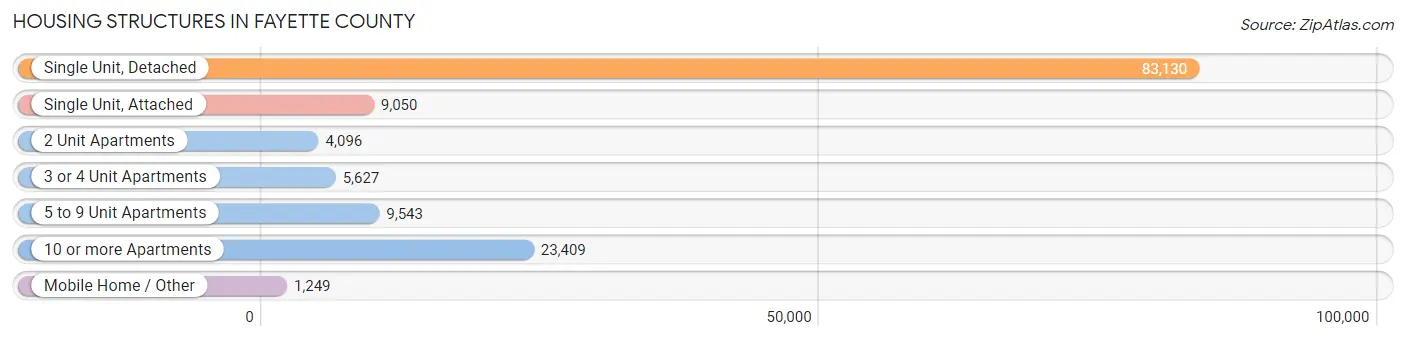
| Structure Type | # Housing Units | % Housing Units |
| Single Unit, Detached | 83,130 | 61.1% |
| Single Unit, Attached | 9,050 | 6.7% |
| 2 Unit Apartments | 4,096 | 3.0% |
| 3 or 4 Unit Apartments | 5,627 | 4.1% |
| 5 to 9 Unit Apartments | 9,543 | 7.0% |
| 10 or more Apartments | 23,409 | 17.2% |
| Mobile Home / Other | 1,249 | 0.9% |
| Total | 136,104 | 100.0% |
Housing Structures by Occupancy in Fayette County
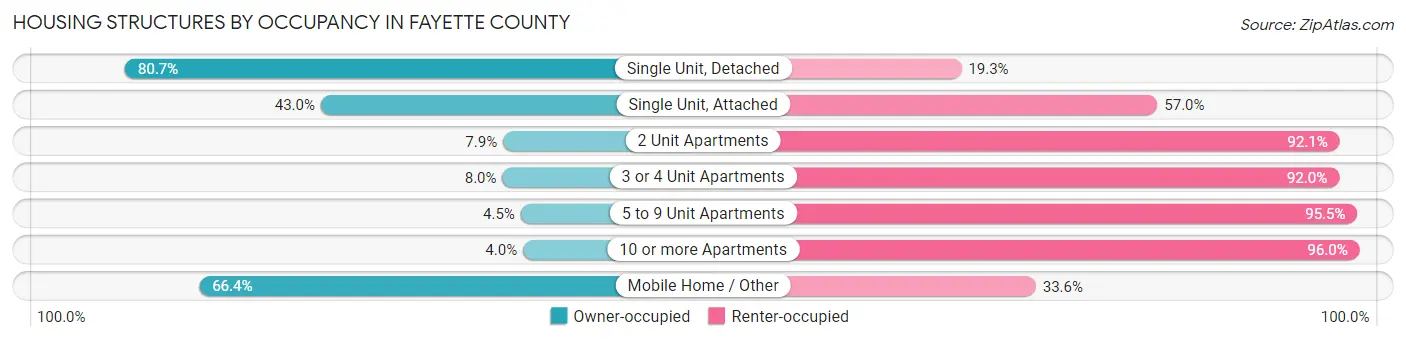
| Structure Type | Owner-occupied | Renter-occupied |
| Single Unit, Detached | 67,075 (80.7%) | 16,055 (19.3%) |
| Single Unit, Attached | 3,889 (43.0%) | 5,161 (57.0%) |
| 2 Unit Apartments | 323 (7.9%) | 3,773 (92.1%) |
| 3 or 4 Unit Apartments | 451 (8.0%) | 5,176 (92.0%) |
| 5 to 9 Unit Apartments | 428 (4.5%) | 9,115 (95.5%) |
| 10 or more Apartments | 946 (4.0%) | 22,463 (96.0%) |
| Mobile Home / Other | 829 (66.4%) | 420 (33.6%) |
| Total | 73,941 (54.3%) | 62,163 (45.7%) |
Housing Structures by Number of Rooms in Fayette County
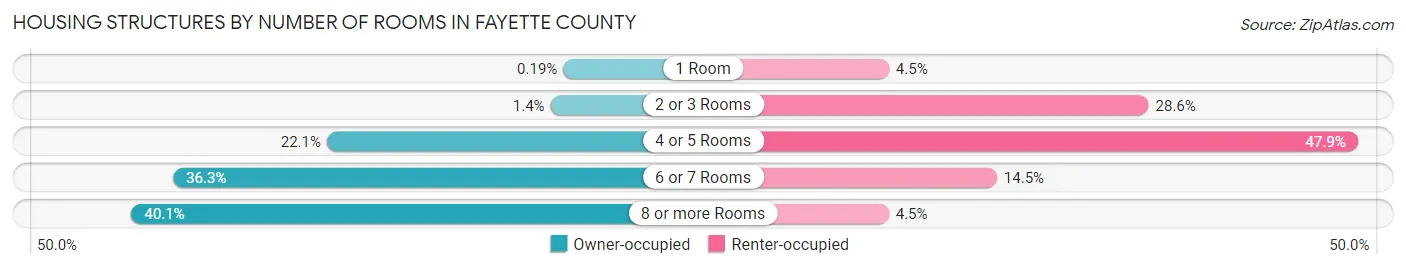
| Number of Rooms | Owner-occupied | Renter-occupied |
| 1 Room | 141 (0.2%) | 2,819 (4.5%) |
| 2 or 3 Rooms | 1,015 (1.4%) | 17,748 (28.5%) |
| 4 or 5 Rooms | 16,304 (22.1%) | 29,761 (47.9%) |
| 6 or 7 Rooms | 26,817 (36.3%) | 9,027 (14.5%) |
| 8 or more Rooms | 29,664 (40.1%) | 2,808 (4.5%) |
| Total | 73,941 (100.0%) | 62,163 (100.0%) |
Housing Structure by Heating Type in Fayette County
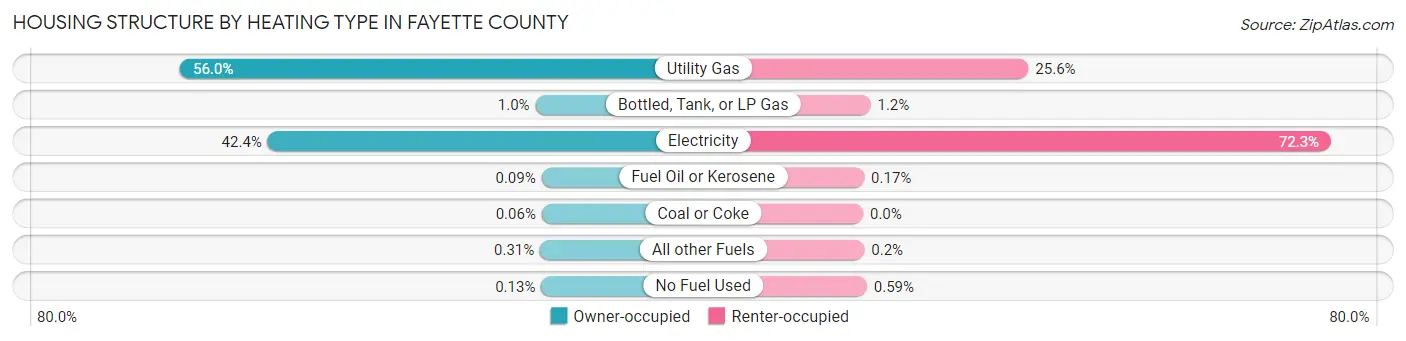
| Heating Type | Owner-occupied | Renter-occupied |
| Utility Gas | 41,378 (56.0%) | 15,890 (25.6%) |
| Bottled, Tank, or LP Gas | 758 (1.0%) | 721 (1.2%) |
| Electricity | 31,374 (42.4%) | 44,963 (72.3%) |
| Fuel Oil or Kerosene | 67 (0.1%) | 103 (0.2%) |
| Coal or Coke | 41 (0.1%) | 0 (0.0%) |
| All other Fuels | 229 (0.3%) | 122 (0.2%) |
| No Fuel Used | 94 (0.1%) | 364 (0.6%) |
| Total | 73,941 (100.0%) | 62,163 (100.0%) |
Household Vehicle Usage in Fayette County

| Vehicles per Household | Owner-occupied | Renter-occupied |
| No Vehicle | 1,469 (2.0%) | 8,385 (13.5%) |
| 1 Vehicle | 20,483 (27.7%) | 29,771 (47.9%) |
| 2 Vehicles | 35,733 (48.3%) | 18,544 (29.8%) |
| 3 or more Vehicles | 16,256 (22.0%) | 5,463 (8.8%) |
| Total | 73,941 (100.0%) | 62,163 (100.0%) |
Real Estate & Mortgages in Fayette County
Real Estate and Mortgage Overview in Fayette County
| Characteristic | Without Mortgage | With Mortgage |
| Housing Units | 23,581 | 50,360 |
| Median Property Value | $247,100 | $248,300 |
| Median Household Income | $77,162 | $15,218 |
| Monthly Housing Costs | $558 | $4,175 |
| Real Estate Taxes | $2,244 | $857 |
Property Value by Mortgage Status in Fayette County
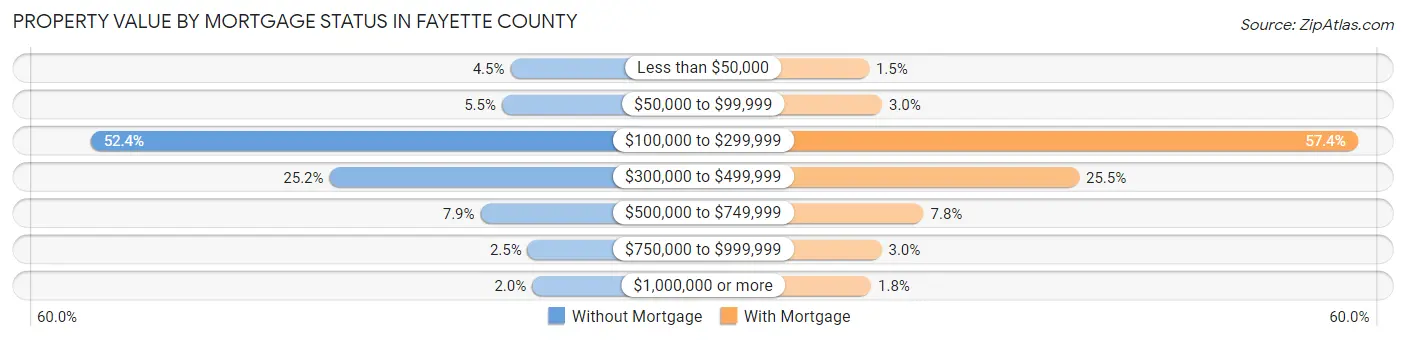
| Property Value | Without Mortgage | With Mortgage |
| Less than $50,000 | 1,058 (4.5%) | 769 (1.5%) |
| $50,000 to $99,999 | 1,287 (5.5%) | 1,528 (3.0%) |
| $100,000 to $299,999 | 12,367 (52.4%) | 28,892 (57.4%) |
| $300,000 to $499,999 | 5,936 (25.2%) | 12,862 (25.5%) |
| $500,000 to $749,999 | 1,866 (7.9%) | 3,916 (7.8%) |
| $750,000 to $999,999 | 594 (2.5%) | 1,497 (3.0%) |
| $1,000,000 or more | 473 (2.0%) | 896 (1.8%) |
| Total | 23,581 (100.0%) | 50,360 (100.0%) |
Household Income by Mortgage Status in Fayette County
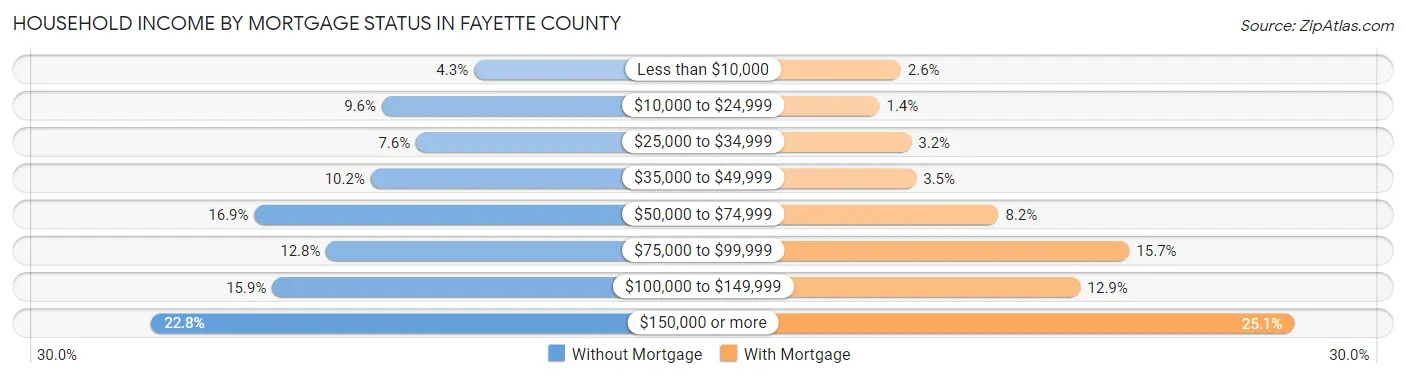
| Household Income | Without Mortgage | With Mortgage |
| Less than $10,000 | 1,019 (4.3%) | 1,305 (2.6%) |
| $10,000 to $24,999 | 2,262 (9.6%) | 689 (1.4%) |
| $25,000 to $34,999 | 1,799 (7.6%) | 1,606 (3.2%) |
| $35,000 to $49,999 | 2,410 (10.2%) | 1,750 (3.5%) |
| $50,000 to $74,999 | 3,978 (16.9%) | 4,116 (8.2%) |
| $75,000 to $99,999 | 3,009 (12.8%) | 7,882 (15.7%) |
| $100,000 to $149,999 | 3,737 (15.9%) | 6,477 (12.9%) |
| $150,000 or more | 5,367 (22.8%) | 12,622 (25.1%) |
| Total | 23,581 (100.0%) | 50,360 (100.0%) |
Property Value to Household Income Ratio in Fayette County
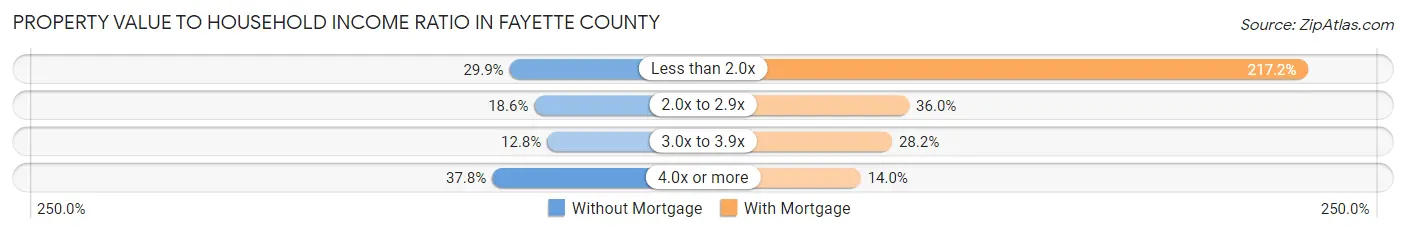
| Value-to-Income Ratio | Without Mortgage | With Mortgage |
| Less than 2.0x | 7,043 (29.9%) | 109,382 (217.2%) |
| 2.0x to 2.9x | 4,389 (18.6%) | 18,120 (36.0%) |
| 3.0x to 3.9x | 3,008 (12.8%) | 14,189 (28.2%) |
| 4.0x or more | 8,910 (37.8%) | 7,042 (14.0%) |
| Total | 23,581 (100.0%) | 50,360 (100.0%) |
Real Estate Taxes by Mortgage Status in Fayette County
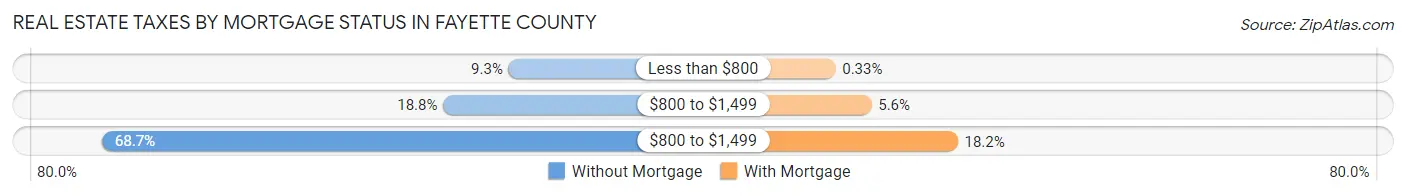
| Property Taxes | Without Mortgage | With Mortgage |
| Less than $800 | 2,183 (9.3%) | 166 (0.3%) |
| $800 to $1,499 | 4,437 (18.8%) | 2,813 (5.6%) |
| $800 to $1,499 | 16,200 (68.7%) | 9,160 (18.2%) |
| Total | 23,581 (100.0%) | 50,360 (100.0%) |
Health & Disability in Fayette County
Health Insurance Coverage by Age in Fayette County
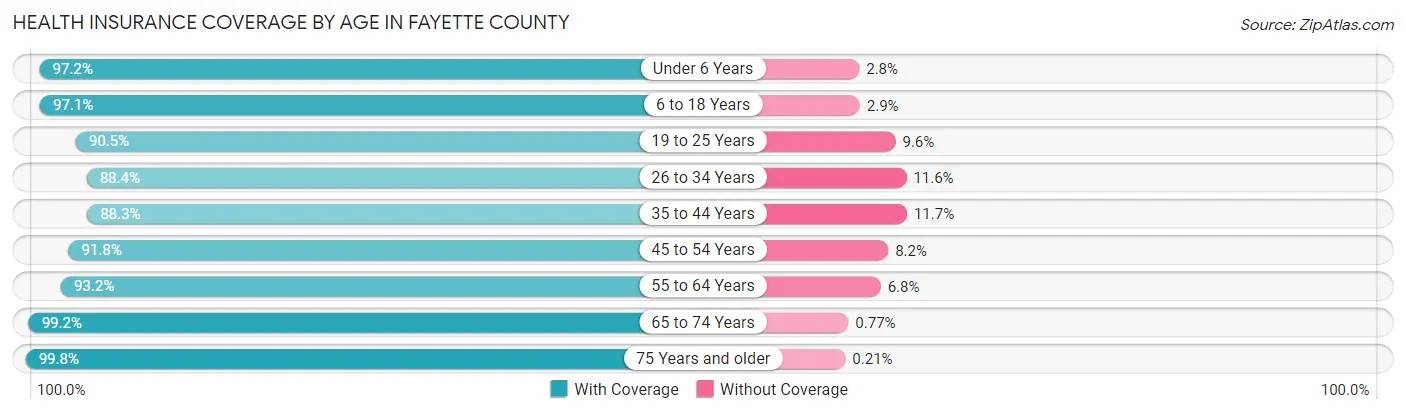
| Age Bracket | With Coverage | Without Coverage |
| Under 6 Years | 21,173 (97.2%) | 610 (2.8%) |
| 6 to 18 Years | 48,501 (97.1%) | 1,447 (2.9%) |
| 19 to 25 Years | 39,958 (90.4%) | 4,217 (9.6%) |
| 26 to 34 Years | 37,925 (88.4%) | 4,972 (11.6%) |
| 35 to 44 Years | 36,399 (88.3%) | 4,819 (11.7%) |
| 45 to 54 Years | 33,594 (91.8%) | 2,996 (8.2%) |
| 55 to 64 Years | 33,647 (93.2%) | 2,450 (6.8%) |
| 65 to 74 Years | 26,828 (99.2%) | 207 (0.8%) |
| 75 Years and older | 17,231 (99.8%) | 37 (0.2%) |
| Total | 295,256 (93.1%) | 21,755 (6.9%) |
Health Insurance Coverage by Citizenship Status in Fayette County
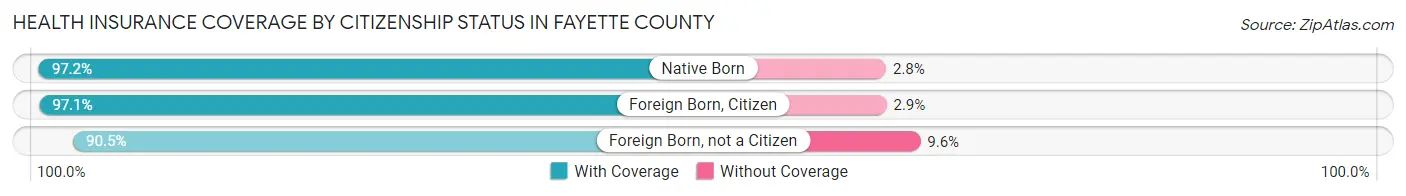
| Citizenship Status | With Coverage | Without Coverage |
| Native Born | 21,173 (97.2%) | 610 (2.8%) |
| Foreign Born, Citizen | 48,501 (97.1%) | 1,447 (2.9%) |
| Foreign Born, not a Citizen | 39,958 (90.4%) | 4,217 (9.6%) |
Health Insurance Coverage by Household Income in Fayette County
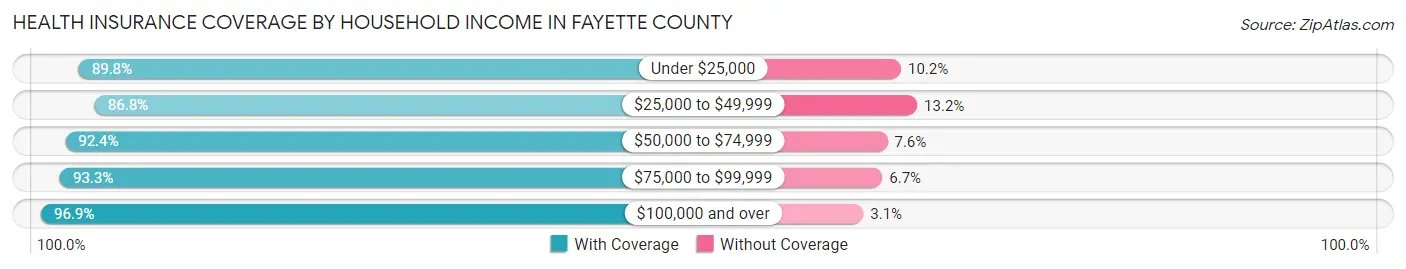
| Household Income | With Coverage | Without Coverage |
| Under $25,000 | 35,726 (89.8%) | 4,045 (10.2%) |
| $25,000 to $49,999 | 45,470 (86.8%) | 6,905 (13.2%) |
| $50,000 to $74,999 | 48,003 (92.4%) | 3,964 (7.6%) |
| $75,000 to $99,999 | 37,808 (93.3%) | 2,696 (6.7%) |
| $100,000 and over | 120,744 (96.9%) | 3,869 (3.1%) |
Public vs Private Health Insurance Coverage by Age in Fayette County
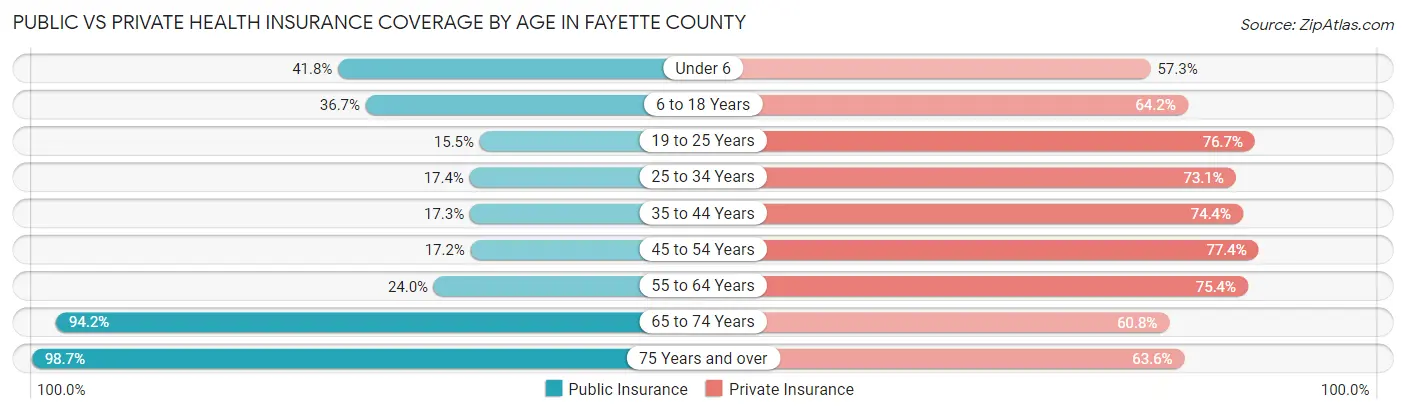
| Age Bracket | Public Insurance | Private Insurance |
| Under 6 | 9,104 (41.8%) | 12,481 (57.3%) |
| 6 to 18 Years | 18,312 (36.7%) | 32,055 (64.2%) |
| 19 to 25 Years | 6,848 (15.5%) | 33,863 (76.7%) |
| 25 to 34 Years | 7,456 (17.4%) | 31,354 (73.1%) |
| 35 to 44 Years | 7,140 (17.3%) | 30,683 (74.4%) |
| 45 to 54 Years | 6,293 (17.2%) | 28,304 (77.3%) |
| 55 to 64 Years | 8,672 (24.0%) | 27,204 (75.4%) |
| 65 to 74 Years | 25,462 (94.2%) | 16,427 (60.8%) |
| 75 Years and over | 17,039 (98.7%) | 10,980 (63.6%) |
| Total | 106,326 (33.5%) | 223,351 (70.5%) |
Disability Status by Sex by Age in Fayette County
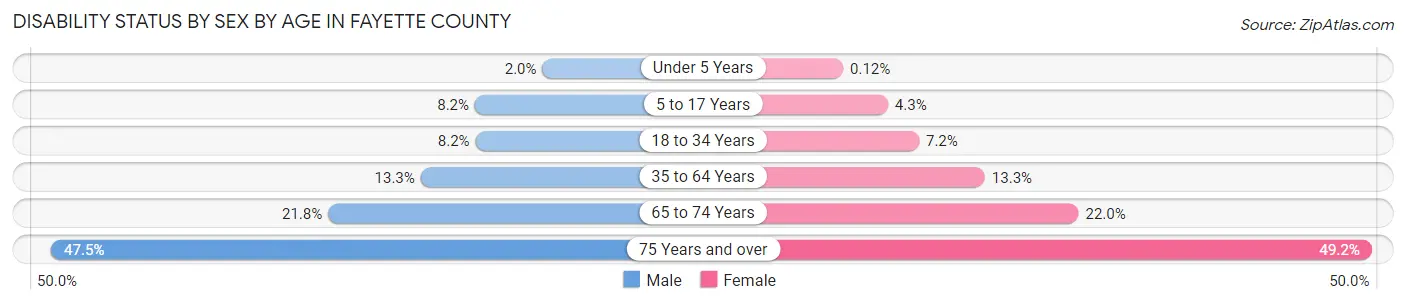
| Age Bracket | Male | Female |
| Under 5 Years | 183 (1.9%) | 11 (0.1%) |
| 5 to 17 Years | 2,015 (8.2%) | 1,002 (4.3%) |
| 18 to 34 Years | 3,763 (8.2%) | 3,332 (7.2%) |
| 35 to 64 Years | 7,450 (13.3%) | 7,662 (13.3%) |
| 65 to 74 Years | 2,692 (21.8%) | 3,232 (22.0%) |
| 75 Years and over | 3,248 (47.5%) | 5,131 (49.2%) |
Disability Class by Sex by Age in Fayette County
Disability Class: Hearing Difficulty
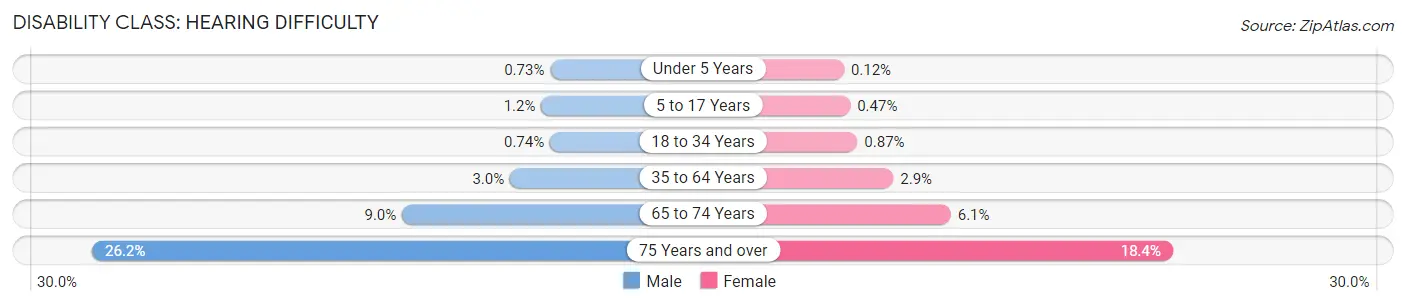
| Age Bracket | Male | Female |
| Under 5 Years | 68 (0.7%) | 11 (0.1%) |
| 5 to 17 Years | 302 (1.2%) | 111 (0.5%) |
| 18 to 34 Years | 342 (0.7%) | 406 (0.9%) |
| 35 to 64 Years | 1,671 (3.0%) | 1,655 (2.9%) |
| 65 to 74 Years | 1,107 (9.0%) | 893 (6.1%) |
| 75 Years and over | 1,793 (26.2%) | 1,923 (18.4%) |
Disability Class: Vision Difficulty
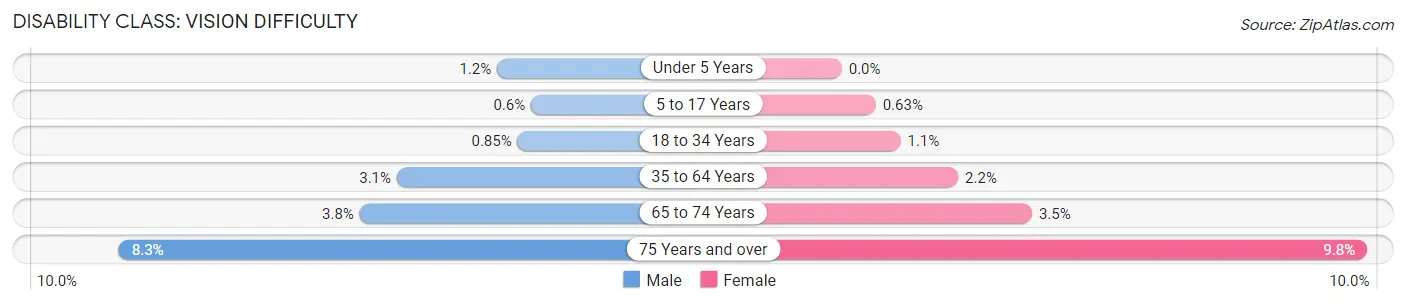
| Age Bracket | Male | Female |
| Under 5 Years | 115 (1.2%) | 0 (0.0%) |
| 5 to 17 Years | 148 (0.6%) | 147 (0.6%) |
| 18 to 34 Years | 391 (0.9%) | 505 (1.1%) |
| 35 to 64 Years | 1,740 (3.1%) | 1,248 (2.2%) |
| 65 to 74 Years | 466 (3.8%) | 519 (3.5%) |
| 75 Years and over | 564 (8.3%) | 1,017 (9.8%) |
Disability Class: Cognitive Difficulty
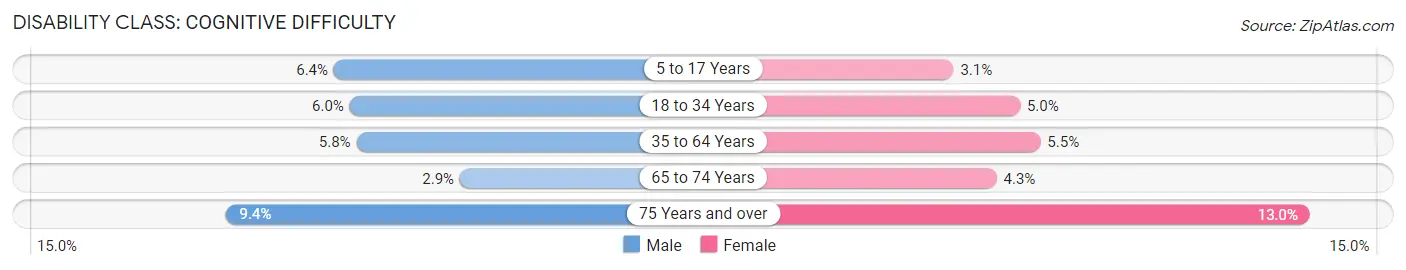
| Age Bracket | Male | Female |
| 5 to 17 Years | 1,569 (6.4%) | 728 (3.1%) |
| 18 to 34 Years | 2,742 (5.9%) | 2,303 (5.0%) |
| 35 to 64 Years | 3,239 (5.8%) | 3,192 (5.5%) |
| 65 to 74 Years | 355 (2.9%) | 634 (4.3%) |
| 75 Years and over | 641 (9.4%) | 1,360 (13.0%) |
Disability Class: Ambulatory Difficulty
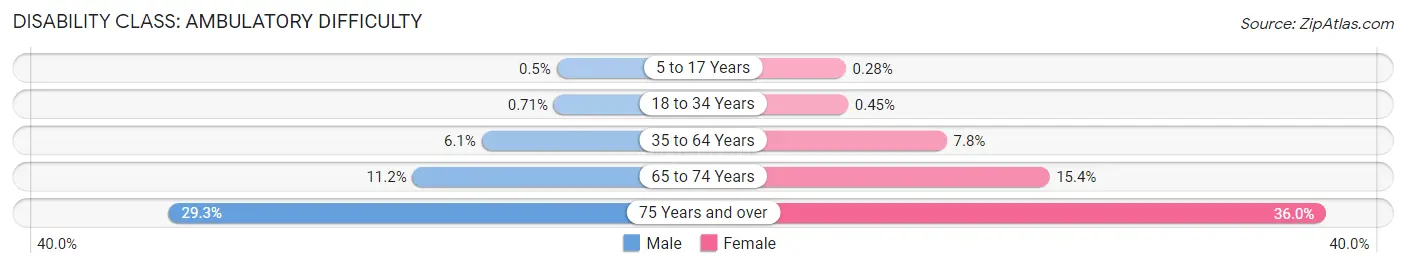
| Age Bracket | Male | Female |
| 5 to 17 Years | 122 (0.5%) | 65 (0.3%) |
| 18 to 34 Years | 327 (0.7%) | 210 (0.4%) |
| 35 to 64 Years | 3,411 (6.1%) | 4,486 (7.8%) |
| 65 to 74 Years | 1,380 (11.2%) | 2,266 (15.4%) |
| 75 Years and over | 2,002 (29.3%) | 3,752 (36.0%) |
Disability Class: Self-Care Difficulty
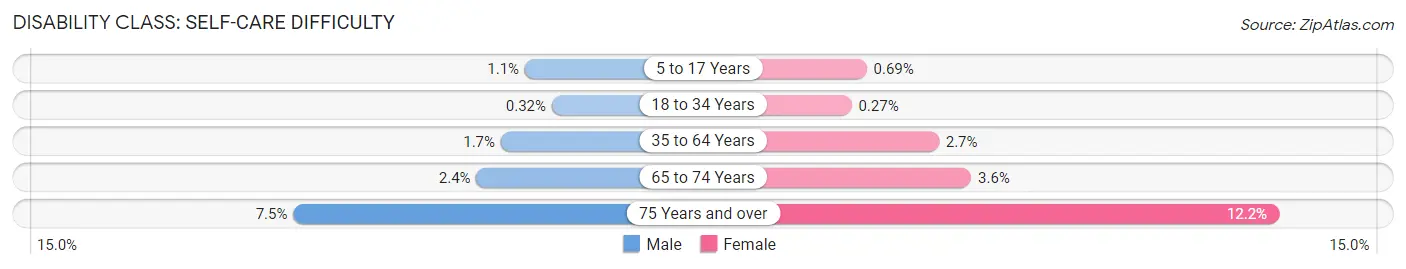
| Age Bracket | Male | Female |
| 5 to 17 Years | 262 (1.1%) | 162 (0.7%) |
| 18 to 34 Years | 149 (0.3%) | 127 (0.3%) |
| 35 to 64 Years | 981 (1.7%) | 1,559 (2.7%) |
| 65 to 74 Years | 298 (2.4%) | 529 (3.6%) |
| 75 Years and over | 514 (7.5%) | 1,270 (12.2%) |
Technology Access in Fayette County
Computing Device Access in Fayette County
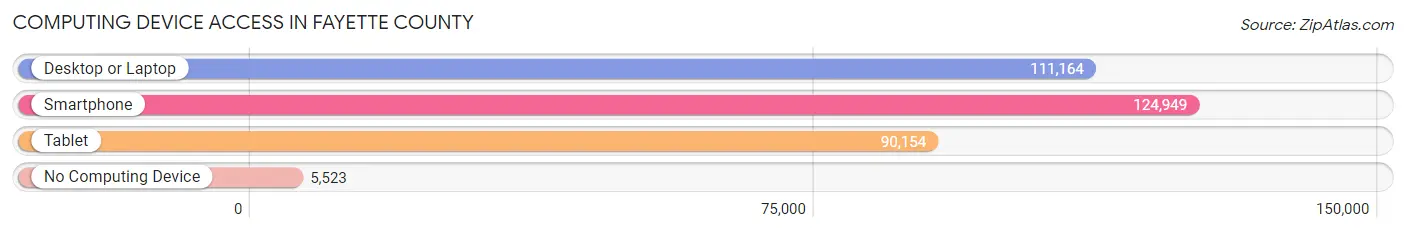
| Device Type | # Households | % Households |
| Desktop or Laptop | 111,164 | 81.7% |
| Smartphone | 124,949 | 91.8% |
| Tablet | 90,154 | 66.2% |
| No Computing Device | 5,523 | 4.1% |
| Total | 136,104 | 100.0% |
Internet Access in Fayette County
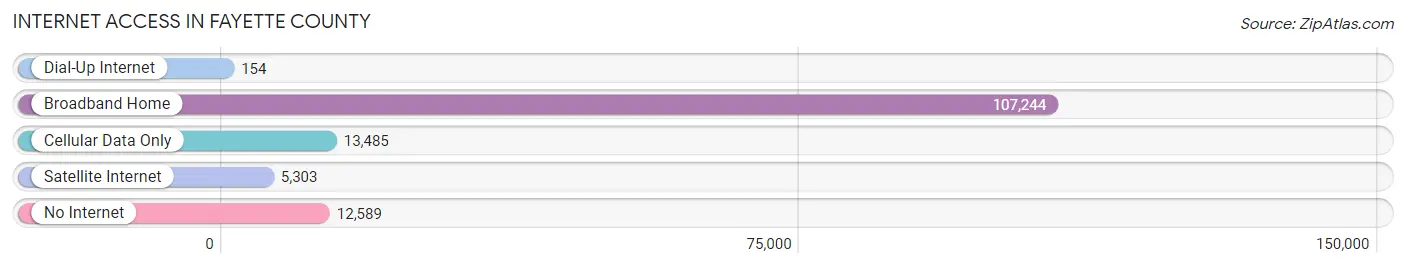
| Internet Type | # Households | % Households |
| Dial-Up Internet | 154 | 0.1% |
| Broadband Home | 107,244 | 78.8% |
| Cellular Data Only | 13,485 | 9.9% |
| Satellite Internet | 5,303 | 3.9% |
| No Internet | 12,589 | 9.2% |
| Total | 136,104 | 100.0% |
Fayette County Summary
Fayette County, Kentucky is located in the heart of the Bluegrass Region of the state. It is bordered by Scott, Woodford, Jessamine, Clark, Madison, and Bourbon counties. The county seat is Lexington, the second-largest city in the state. Fayette County is home to the University of Kentucky, Transylvania University, and Bluegrass Community and Technical College.
Geography
Fayette County is located in the Inner Bluegrass region of Kentucky. It is bordered by Scott, Woodford, Jessamine, Clark, Madison, and Bourbon counties. The county has a total area of 286 square miles, of which 284 square miles is land and 2 square miles is water. The county is divided into two distinct regions: the Inner Bluegrass and the Outer Bluegrass. The Inner Bluegrass is characterized by rolling hills and fertile soil, while the Outer Bluegrass is characterized by flat plains and sandy soil.
The county is home to several rivers, including the Kentucky River, Elkhorn Creek, and Stoner Creek. The Kentucky River forms the northern border of the county, while Elkhorn Creek and Stoner Creek flow through the county. The county is also home to several lakes, including Lake Reba, Lake Herrington, and Lake Ellerslie.
Climate
Fayette County has a humid subtropical climate, with hot, humid summers and mild winters. The average annual temperature is 57°F, with an average high of 79°F in July and an average low of 35°F in January. The average annual precipitation is 44.5 inches, with an average of 4.5 inches of snowfall per year.
Demographics
As of the 2010 census, Fayette County had a population of 295,803. The racial makeup of the county was 79.2% White, 15.3% African American, 0.3% Native American, 2.2% Asian, 0.1% Pacific Islander, 1.3% from other races, and 1.6% from two or more races. Hispanic or Latino of any race were 3.3% of the population.
The median income for a household in the county was $45,868, and the median income for a family was $54,817. The per capita income for the county was $25,945. About 11.2% of families and 15.2% of the population were below the poverty line, including 20.2% of those under age 18 and 9.2% of those age 65 or over.
Economy
Fayette County is home to a diverse economy, with a mix of manufacturing, services, and agriculture. The county is home to several major employers, including the University of Kentucky, Lexmark International, and Toyota Motor Manufacturing. The county is also home to several smaller businesses, including restaurants, retail stores, and professional services.
Agriculture is an important part of the county's economy, with corn, soybeans, and hay being the primary crops. Livestock production is also important, with cattle, horses, and poultry being the primary animals raised.
Fayette County is also home to several tourist attractions, including the Kentucky Horse Park, the Kentucky Bourbon Trail, and the Red Mile Racetrack. These attractions bring in millions of visitors each year, providing a boost to the local economy.
Conclusion
Fayette County, Kentucky is a vibrant and diverse county located in the heart of the Bluegrass Region. It is home to a diverse economy, with a mix of manufacturing, services, and agriculture. The county is also home to several tourist attractions, which bring in millions of visitors each year. The county has a population of 295,803, with a median income of $45,868. Fayette County is a great place to live, work, and visit.
Common Questions
What is the Total Population of Fayette County?
Total Population of Fayette County is 321,276.
What is the Total Male Population of Fayette County?
Total Male Population of Fayette County is 158,371.
What is the Total Female Population of Fayette County?
Total Female Population of Fayette County is 162,905.
What is the Ratio of Males per 100 Females in Fayette County?
There are 97.22 Males per 100 Females in Fayette County.
What is the Ratio of Females per 100 Males in Fayette County?
There are 102.86 Females per 100 Males in Fayette County.
What is the Median Population Age in Fayette County?
Median Population Age in Fayette County is 35.2 Years.
What is the Average Family Size in Fayette County
Average Family Size in Fayette County is 2.9 People.
What is the Average Household Size in Fayette County
Average Household Size in Fayette County is 2.3 People.
What is Per Capita Income in Fayette County?
Per Capita income in Fayette County is $40,953.
What is the Median Family Income in Fayette County?
Median Family Income in Fayette County is $91,263.
What is the Median Household income in Fayette County?
Median Household Income in Fayette County is $66,087.
What is Income or Wage Gap in Fayette County?
Income or Wage Gap in Fayette County is 23.9%.
Women in Fayette County earn 76.1 cents for every dollar earned by a man.
What is Family Income Deficit in Fayette County?
Family Income Deficit in Fayette County is $11,247.
Families that are below poverty line in Fayette County earn $11,247 less on average than the poverty threshold level.
What is Inequality or Gini Index in Fayette County?
Inequality or Gini Index in Fayette County is 0.49.
How Large is the Labor Force in Fayette County?
There are 178,242 People in the Labor Forcein in Fayette County.
What is the Percentage of People in the Labor Force in Fayette County?
67.9% of People are in the Labor Force in Fayette County.
What is the Unemployment Rate in Fayette County?
Unemployment Rate in Fayette County is 5.0%.