Daviess County, KY
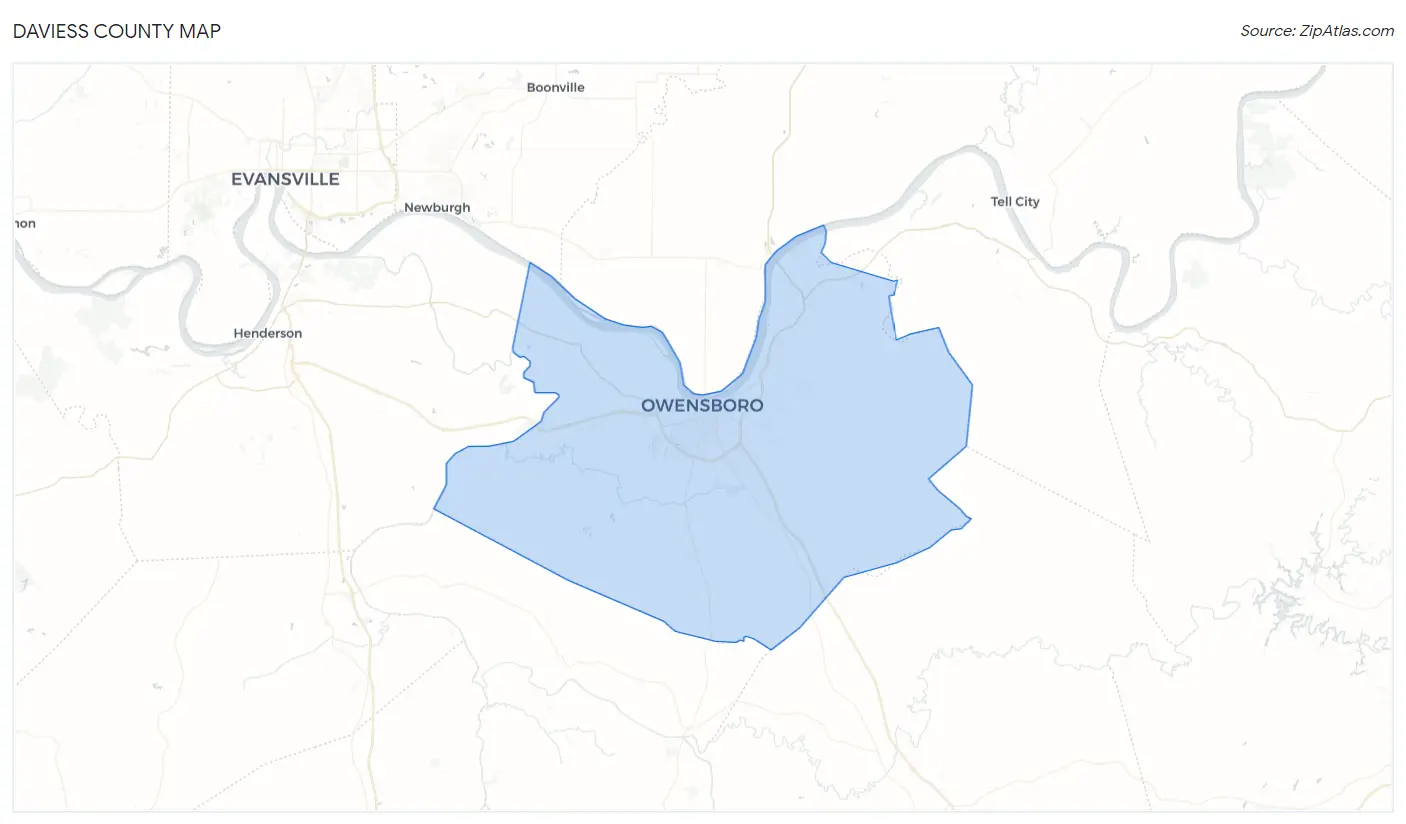
Daviess County Map
Daviess County Overview
102,916
TOTAL POPULATION
50,574
MALE POPULATION
52,342
FEMALE POPULATION
96.62
MALES / 100 FEMALES
103.50
FEMALES / 100 MALES
38.7
MEDIAN AGE
3.0
AVG FAMILY SIZE
2.5
AVG HOUSEHOLD SIZE
$33,599
PER CAPITA INCOME
$79,966
AVG FAMILY INCOME
$64,021
AVG HOUSEHOLD INCOME
34.0%
WAGE / INCOME GAP [ % ]
66.0¢/ $1
WAGE / INCOME GAP [ $ ]
$12,037
FAMILY INCOME DEFICIT
0.46
INEQUALITY / GINI INDEX
49,513
LABOR FORCE [ PEOPLE ]
61.6%
PERCENT IN LABOR FORCE
4.1%
UNEMPLOYMENT RATE
Daviess County Area Codes
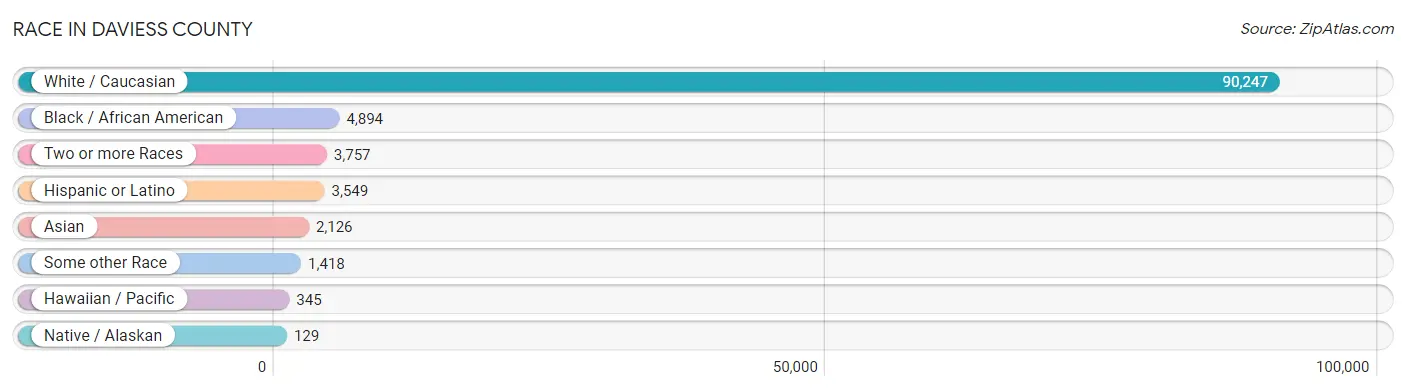
Race in Daviess County
The most populous races in Daviess County are White / Caucasian (90,247 | 87.7%), Black / African American (4,894 | 4.8%), and Two or more Races (3,757 | 3.6%).
| Race | # Population | % Population |
| Asian | 2,126 | 2.1% |
| Black / African American | 4,894 | 4.8% |
| Hawaiian / Pacific | 345 | 0.3% |
| Hispanic or Latino | 3,549 | 3.5% |
| Native / Alaskan | 129 | 0.1% |
| White / Caucasian | 90,247 | 87.7% |
| Two or more Races | 3,757 | 3.6% |
| Some other Race | 1,418 | 1.4% |
| Total | 102,916 | 100.0% |
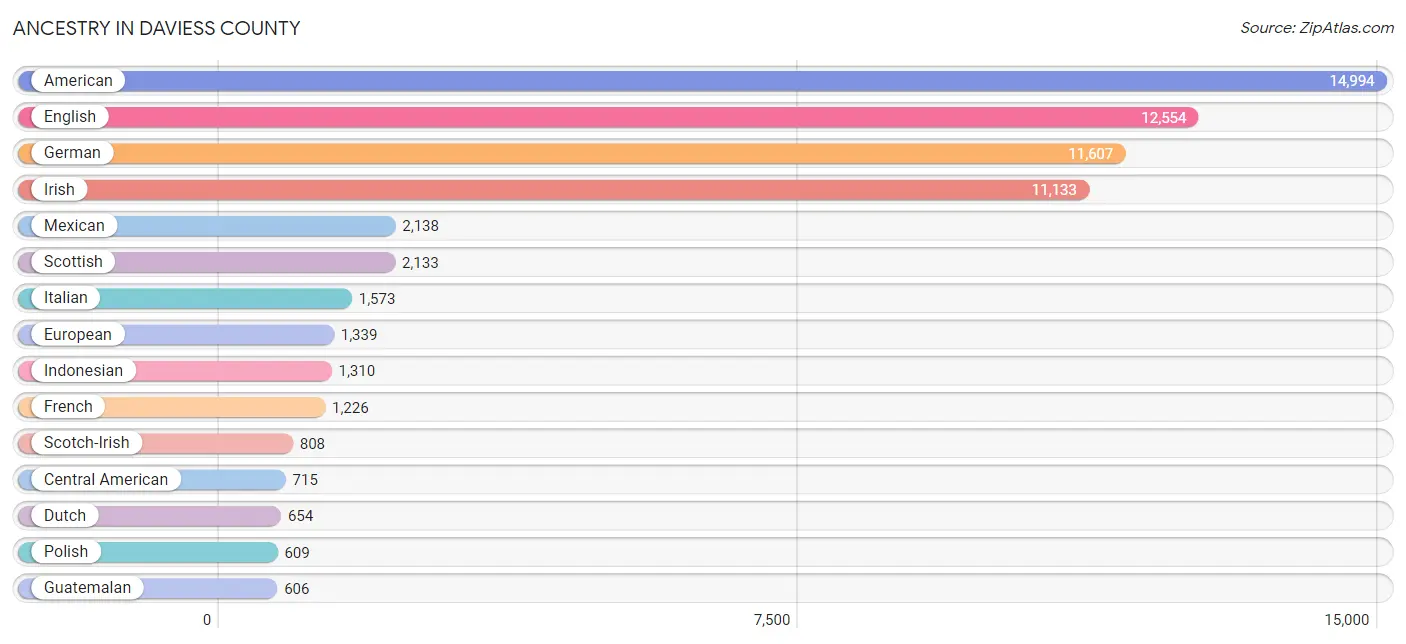
Ancestry in Daviess County
The most populous ancestries reported in Daviess County are American (14,994 | 14.6%), English (12,554 | 12.2%), German (11,607 | 11.3%), Irish (11,133 | 10.8%), and Mexican (2,138 | 2.1%), together accounting for 51.0% of all Daviess County residents.
| Ancestry | # Population | % Population |
| African | 77 | 0.1% |
| American | 14,994 | 14.6% |
| Apache | 10 | 0.0% |
| Arab | 47 | 0.1% |
| Argentinean | 57 | 0.1% |
| Armenian | 19 | 0.0% |
| Austrian | 33 | 0.0% |
| Belgian | 28 | 0.0% |
| Bhutanese | 50 | 0.1% |
| Blackfeet | 20 | 0.0% |
| Bolivian | 12 | 0.0% |
| British | 482 | 0.5% |
| British West Indian | 54 | 0.1% |
| Burmese | 132 | 0.1% |
| Cajun | 28 | 0.0% |
| Canadian | 98 | 0.1% |
| Central American | 715 | 0.7% |
| Central American Indian | 58 | 0.1% |
| Cherokee | 176 | 0.2% |
| Chippewa | 2 | 0.0% |
| Choctaw | 33 | 0.0% |
| Colombian | 26 | 0.0% |
| Creek | 30 | 0.0% |
| Croatian | 69 | 0.1% |
| Cuban | 73 | 0.1% |
| Czech | 27 | 0.0% |
| Czechoslovakian | 122 | 0.1% |
| Danish | 55 | 0.1% |
| Dutch | 654 | 0.6% |
| Eastern European | 132 | 0.1% |
| Ecuadorian | 9 | 0.0% |
| English | 12,554 | 12.2% |
| Ethiopian | 124 | 0.1% |
| European | 1,339 | 1.3% |
| Filipino | 11 | 0.0% |
| Finnish | 34 | 0.0% |
| French | 1,226 | 1.2% |
| French Canadian | 155 | 0.2% |
| German | 11,607 | 11.3% |
| Greek | 126 | 0.1% |
| Guamanian / Chamorro | 280 | 0.3% |
| Guatemalan | 606 | 0.6% |
| Haitian | 11 | 0.0% |
| Honduran | 91 | 0.1% |
| Hopi | 11 | 0.0% |
| Hungarian | 77 | 0.1% |
| Icelander | 16 | 0.0% |
| Indian (Asian) | 84 | 0.1% |
| Indonesian | 1,310 | 1.3% |
| Irish | 11,133 | 10.8% |
| Israeli | 24 | 0.0% |
| Italian | 1,573 | 1.5% |
| Korean | 161 | 0.2% |
| Laotian | 28 | 0.0% |
| Lebanese | 10 | 0.0% |
| Mexican | 2,138 | 2.1% |
| Mexican American Indian | 23 | 0.0% |
| Native Hawaiian | 41 | 0.0% |
| Nigerian | 10 | 0.0% |
| Northern European | 77 | 0.1% |
| Norwegian | 193 | 0.2% |
| Pakistani | 16 | 0.0% |
| Pennsylvania German | 10 | 0.0% |
| Polish | 609 | 0.6% |
| Portuguese | 63 | 0.1% |
| Puerto Rican | 306 | 0.3% |
| Romanian | 34 | 0.0% |
| Russian | 188 | 0.2% |
| Salvadoran | 18 | 0.0% |
| Scandinavian | 154 | 0.2% |
| Scotch-Irish | 808 | 0.8% |
| Scottish | 2,133 | 2.1% |
| Serbian | 7 | 0.0% |
| Sioux | 2 | 0.0% |
| Slovak | 12 | 0.0% |
| Slovene | 17 | 0.0% |
| South American | 131 | 0.1% |
| Spanish | 23 | 0.0% |
| Sri Lankan | 74 | 0.1% |
| Subsaharan African | 211 | 0.2% |
| Swedish | 176 | 0.2% |
| Swiss | 53 | 0.1% |
| Thai | 512 | 0.5% |
| Ukrainian | 134 | 0.1% |
| Venezuelan | 27 | 0.0% |
| Welsh | 243 | 0.2% |
| West Indian | 13 | 0.0% | View All 87 Rows |
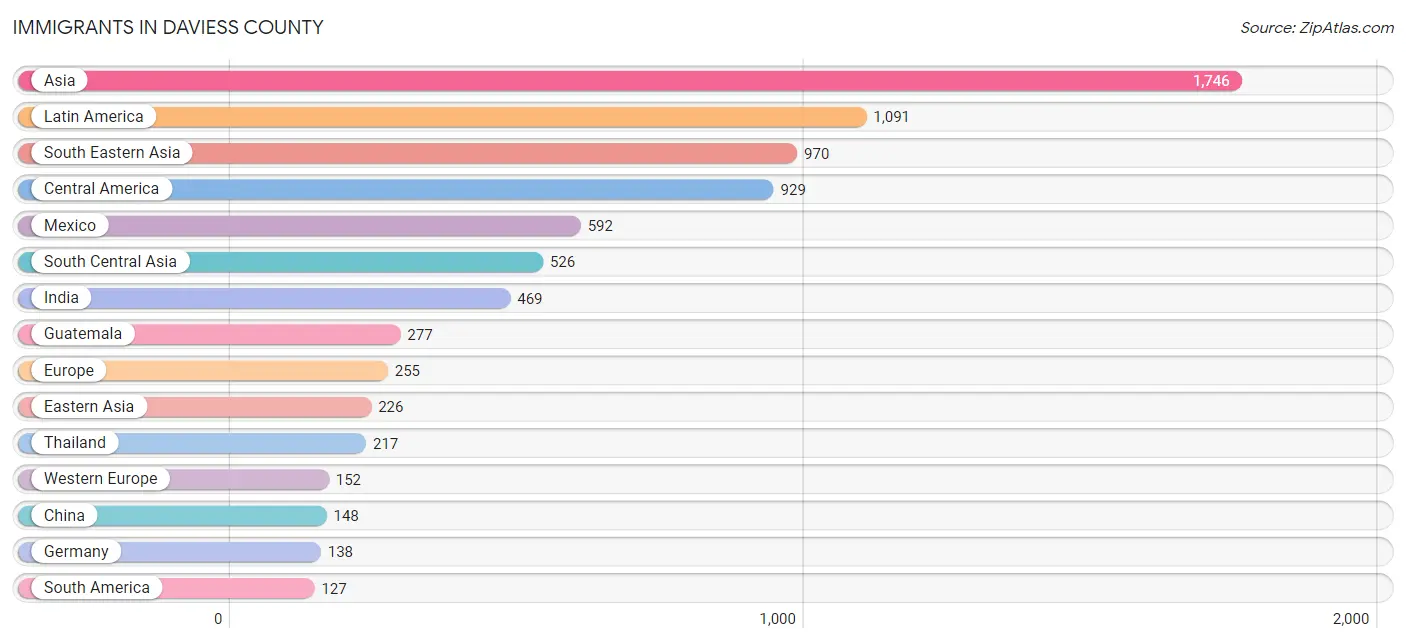
Immigrants in Daviess County
The most numerous immigrant groups reported in Daviess County came from Asia (1,746 | 1.7%), Latin America (1,091 | 1.1%), South Eastern Asia (970 | 0.9%), Central America (929 | 0.9%), and Mexico (592 | 0.6%), together accounting for 5.2% of all Daviess County residents.
| Immigration Origin | # Population | % Population |
| Africa | 105 | 0.1% |
| Argentina | 30 | 0.0% |
| Asia | 1,746 | 1.7% |
| Bangladesh | 57 | 0.1% |
| Bolivia | 12 | 0.0% |
| Canada | 106 | 0.1% |
| Caribbean | 35 | 0.0% |
| Central America | 929 | 0.9% |
| China | 148 | 0.1% |
| Colombia | 3 | 0.0% |
| Congo | 19 | 0.0% |
| Cuba | 35 | 0.0% |
| Eastern Africa | 86 | 0.1% |
| Eastern Asia | 226 | 0.2% |
| Eastern Europe | 12 | 0.0% |
| Ecuador | 9 | 0.0% |
| El Salvador | 22 | 0.0% |
| England | 39 | 0.0% |
| Ethiopia | 64 | 0.1% |
| Europe | 255 | 0.3% |
| France | 14 | 0.0% |
| Germany | 138 | 0.1% |
| Greece | 11 | 0.0% |
| Guatemala | 277 | 0.3% |
| Guyana | 62 | 0.1% |
| Honduras | 38 | 0.0% |
| India | 469 | 0.5% |
| Indonesia | 14 | 0.0% |
| Ireland | 23 | 0.0% |
| Israel | 24 | 0.0% |
| Korea | 78 | 0.1% |
| Latin America | 1,091 | 1.1% |
| Malaysia | 52 | 0.1% |
| Mexico | 592 | 0.6% |
| Middle Africa | 19 | 0.0% |
| Northern Europe | 80 | 0.1% |
| Oceania | 2 | 0.0% |
| Philippines | 67 | 0.1% |
| Romania | 11 | 0.0% |
| South America | 127 | 0.1% |
| South Central Asia | 526 | 0.5% |
| South Eastern Asia | 970 | 0.9% |
| Southern Europe | 11 | 0.0% |
| Taiwan | 11 | 0.0% |
| Thailand | 217 | 0.2% |
| Uganda | 22 | 0.0% |
| Ukraine | 1 | 0.0% |
| Vietnam | 13 | 0.0% |
| Western Asia | 24 | 0.0% |
| Western Europe | 152 | 0.2% | View All 50 Rows |
Sex and Age in Daviess County
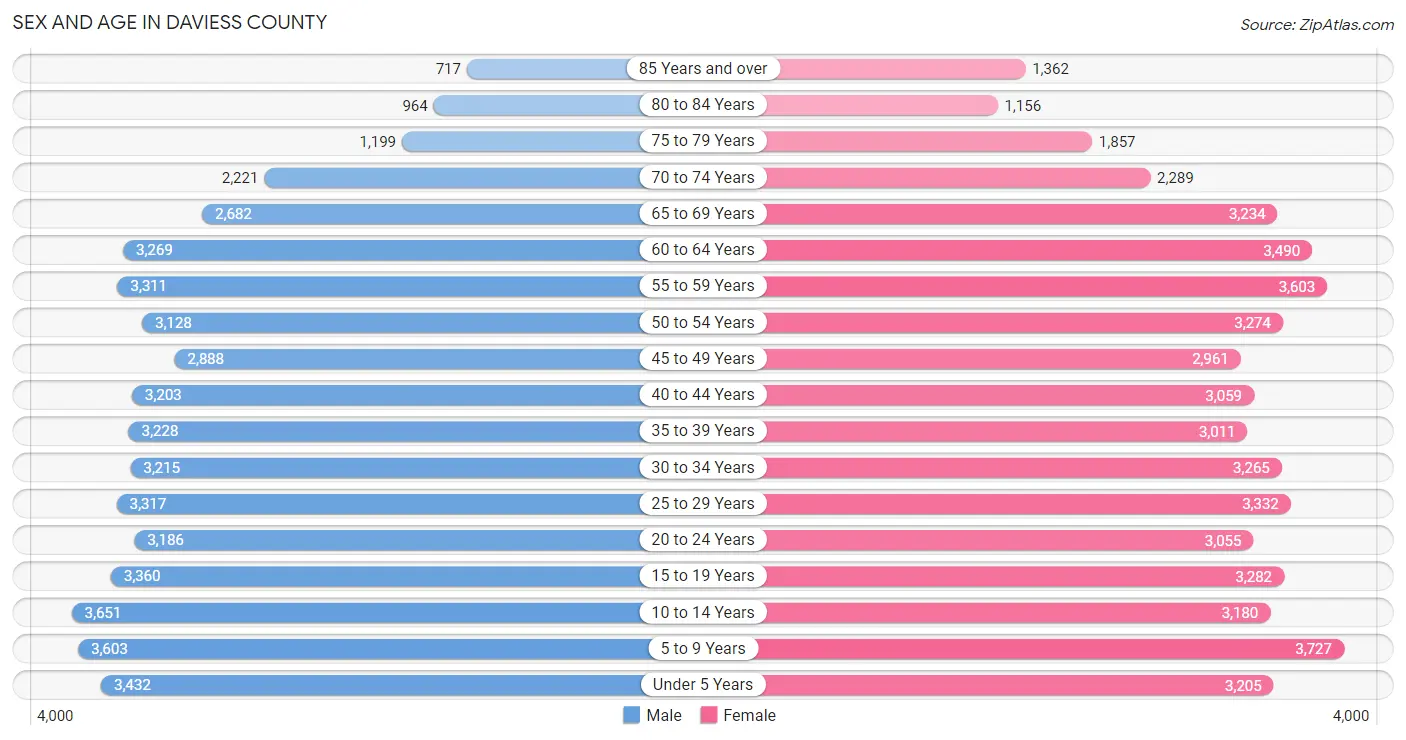
Sex and Age in Daviess County
The most populous age groups in Daviess County are 10 to 14 Years (3,651 | 7.2%) for men and 5 to 9 Years (3,727 | 7.1%) for women.
| Age Bracket | Male | Female |
| Under 5 Years | 3,432 (6.8%) | 3,205 (6.1%) |
| 5 to 9 Years | 3,603 (7.1%) | 3,727 (7.1%) |
| 10 to 14 Years | 3,651 (7.2%) | 3,180 (6.1%) |
| 15 to 19 Years | 3,360 (6.6%) | 3,282 (6.3%) |
| 20 to 24 Years | 3,186 (6.3%) | 3,055 (5.8%) |
| 25 to 29 Years | 3,317 (6.6%) | 3,332 (6.4%) |
| 30 to 34 Years | 3,215 (6.4%) | 3,265 (6.2%) |
| 35 to 39 Years | 3,228 (6.4%) | 3,011 (5.8%) |
| 40 to 44 Years | 3,203 (6.3%) | 3,059 (5.8%) |
| 45 to 49 Years | 2,888 (5.7%) | 2,961 (5.7%) |
| 50 to 54 Years | 3,128 (6.2%) | 3,274 (6.3%) |
| 55 to 59 Years | 3,311 (6.6%) | 3,603 (6.9%) |
| 60 to 64 Years | 3,269 (6.5%) | 3,490 (6.7%) |
| 65 to 69 Years | 2,682 (5.3%) | 3,234 (6.2%) |
| 70 to 74 Years | 2,221 (4.4%) | 2,289 (4.4%) |
| 75 to 79 Years | 1,199 (2.4%) | 1,857 (3.5%) |
| 80 to 84 Years | 964 (1.9%) | 1,156 (2.2%) |
| 85 Years and over | 717 (1.4%) | 1,362 (2.6%) |
| Total | 50,574 (100.0%) | 52,342 (100.0%) |
Families and Households in Daviess County
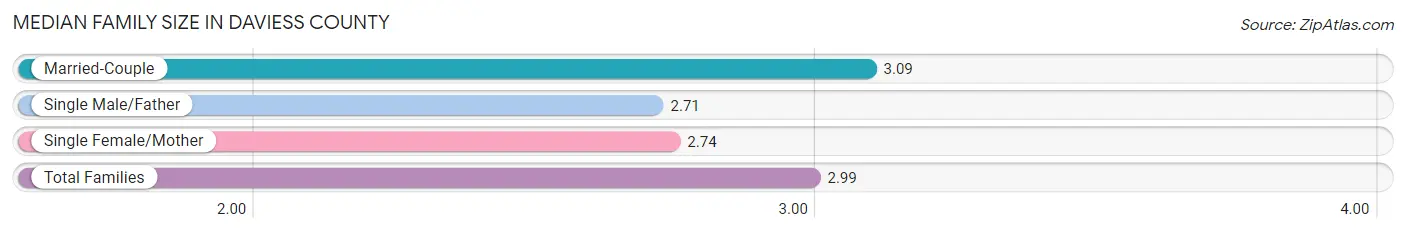
Median Family Size in Daviess County
The median family size in Daviess County is 2.99 persons per family, with married-couple families (19,500 | 72.7%) accounting for the largest median family size of 3.09 persons per family. On the other hand, single male/father families (2,299 | 8.6%) represent the smallest median family size with 2.71 persons per family.
| Family Type | # Families | Family Size |
| Married-Couple | 19,500 (72.7%) | 3.09 |
| Single Male/Father | 2,299 (8.6%) | 2.71 |
| Single Female/Mother | 5,012 (18.7%) | 2.74 |
| Total Families | 26,811 (100.0%) | 2.99 |
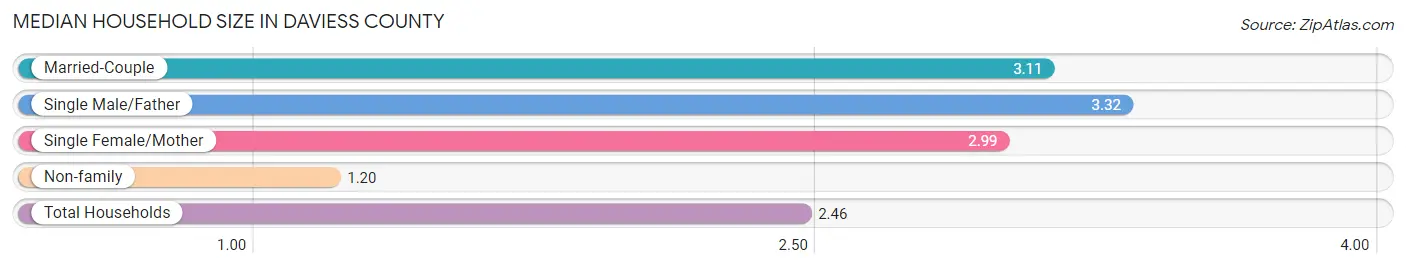
Median Household Size in Daviess County
The median household size in Daviess County is 2.46 persons per household, with single male/father households (2,299 | 5.7%) accounting for the largest median household size of 3.32 persons per household. non-family households (13,911 | 34.2%) represent the smallest median household size with 1.20 persons per household.
| Household Type | # Households | Household Size |
| Married-Couple | 19,500 (47.9%) | 3.11 |
| Single Male/Father | 2,299 (5.7%) | 3.32 |
| Single Female/Mother | 5,012 (12.3%) | 2.99 |
| Non-family | 13,911 (34.2%) | 1.20 |
| Total Households | 40,722 (100.0%) | 2.46 |
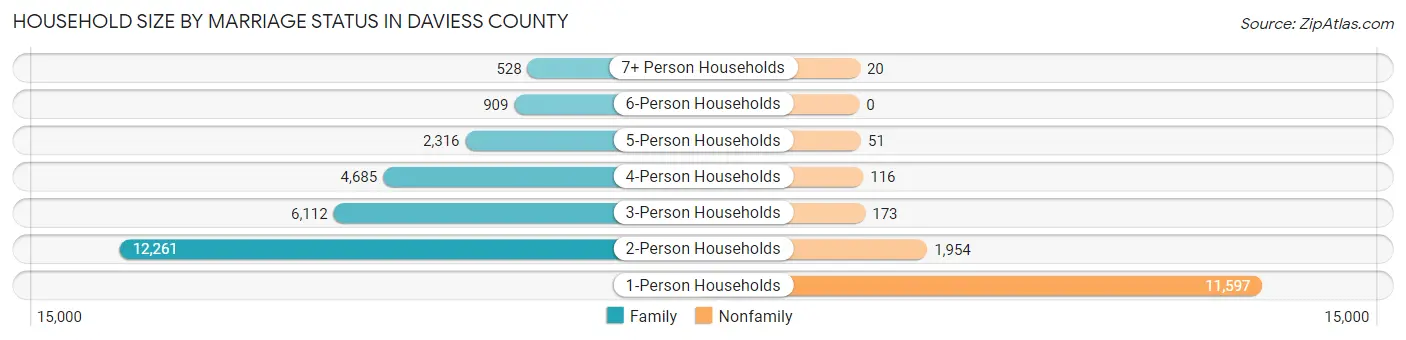
Household Size by Marriage Status in Daviess County
Out of a total of 40,722 households in Daviess County, 26,811 (65.8%) are family households, while 13,911 (34.2%) are nonfamily households. The most numerous type of family households are 2-person households, comprising 12,261, and the most common type of nonfamily households are 1-person households, comprising 11,597.
| Household Size | Family Households | Nonfamily Households |
| 1-Person Households | - | 11,597 (28.5%) |
| 2-Person Households | 12,261 (30.1%) | 1,954 (4.8%) |
| 3-Person Households | 6,112 (15.0%) | 173 (0.4%) |
| 4-Person Households | 4,685 (11.5%) | 116 (0.3%) |
| 5-Person Households | 2,316 (5.7%) | 51 (0.1%) |
| 6-Person Households | 909 (2.2%) | 0 (0.0%) |
| 7+ Person Households | 528 (1.3%) | 20 (0.1%) |
| Total | 26,811 (65.8%) | 13,911 (34.2%) |
Female Fertility in Daviess County
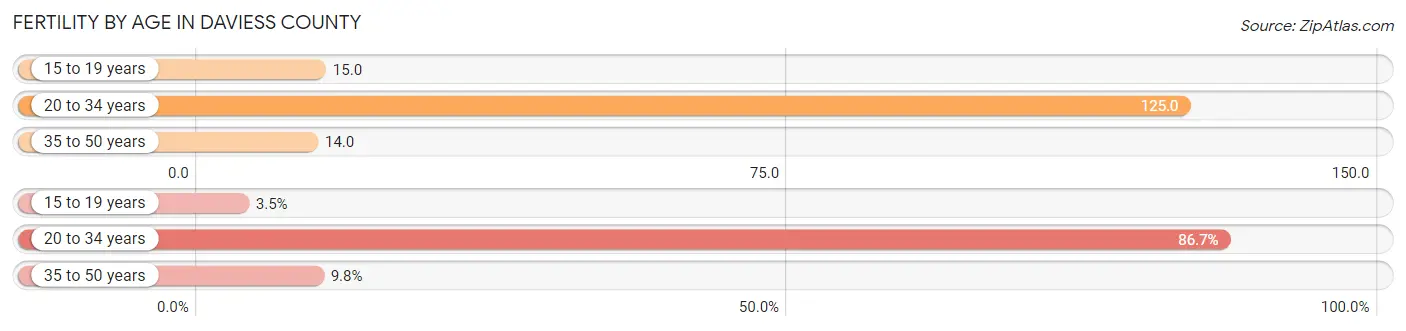
Fertility by Age in Daviess County
Average fertility rate in Daviess County is 61.0 births per 1,000 women. Women in the age bracket of 20 to 34 years have the highest fertility rate with 125.0 births per 1,000 women. Women in the age bracket of 20 to 34 years acount for 86.7% of all women with births.
| Age Bracket | Women with Births | Births / 1,000 Women |
| 15 to 19 years | 48 (3.5%) | 15.0 |
| 20 to 34 years | 1,203 (86.7%) | 125.0 |
| 35 to 50 years | 136 (9.8%) | 14.0 |
| Total | 1,387 (100.0%) | 61.0 |
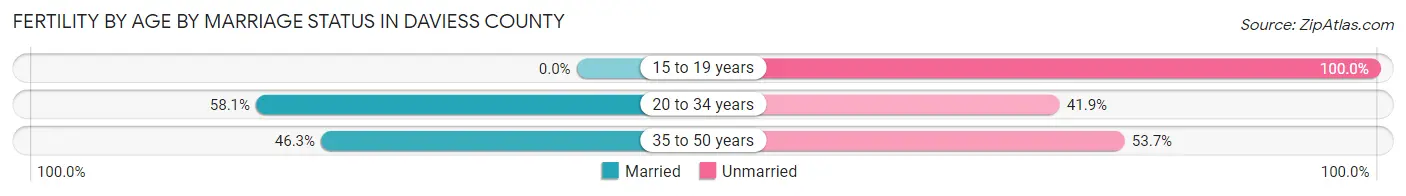
Fertility by Age by Marriage Status in Daviess County
54.9% of women with births (1,387) in Daviess County are married. The highest percentage of unmarried women with births falls into 15 to 19 years age bracket with 100.0% of them unmarried at the time of birth, while the lowest percentage of unmarried women with births belong to 20 to 34 years age bracket with 41.9% of them unmarried.
| Age Bracket | Married | Unmarried |
| 15 to 19 years | 0 (0.0%) | 48 (100.0%) |
| 20 to 34 years | 699 (58.1%) | 504 (41.9%) |
| 35 to 50 years | 63 (46.3%) | 73 (53.7%) |
| Total | 761 (54.9%) | 626 (45.1%) |
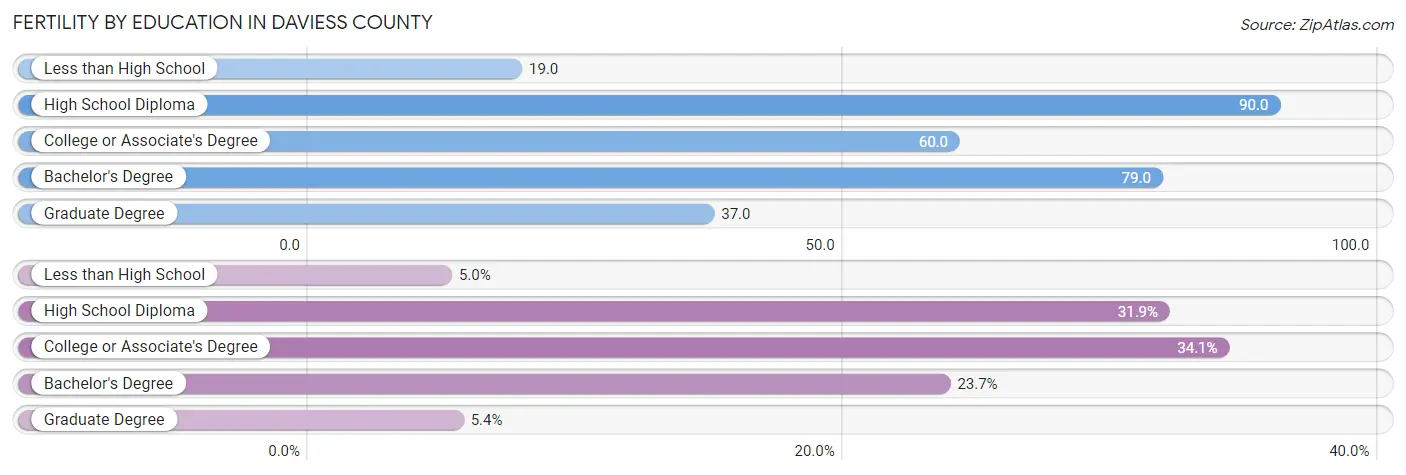
Fertility by Education in Daviess County
Average fertility rate in Daviess County is 61.0 births per 1,000 women. Women with the education attainment of high school diploma have the highest fertility rate of 90.0 births per 1,000 women, while women with the education attainment of less than high school have the lowest fertility at 19.0 births per 1,000 women. Women with the education attainment of college or associate's degree represent 34.1% of all women with births.
| Educational Attainment | Women with Births | Births / 1,000 Women |
| Less than High School | 69 (5.0%) | 19.0 |
| High School Diploma | 442 (31.9%) | 90.0 |
| College or Associate's Degree | 473 (34.1%) | 60.0 |
| Bachelor's Degree | 328 (23.6%) | 79.0 |
| Graduate Degree | 75 (5.4%) | 37.0 |
| Total | 1,387 (100.0%) | 61.0 |
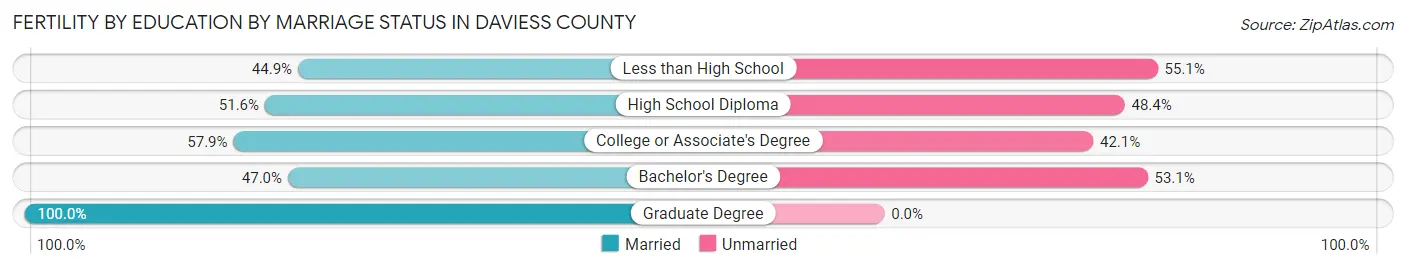
Fertility by Education by Marriage Status in Daviess County
45.1% of women with births in Daviess County are unmarried. Women with the educational attainment of graduate degree are most likely to be married with 100.0% of them married at childbirth, while women with the educational attainment of less than high school are least likely to be married with 55.1% of them unmarried at childbirth.
| Educational Attainment | Married | Unmarried |
| Less than High School | 31 (44.9%) | 38 (55.1%) |
| High School Diploma | 228 (51.6%) | 214 (48.4%) |
| College or Associate's Degree | 274 (57.9%) | 199 (42.1%) |
| Bachelor's Degree | 154 (46.9%) | 174 (53.0%) |
| Graduate Degree | 75 (100.0%) | 0 (0.0%) |
| Total | 761 (54.9%) | 626 (45.1%) |
Income in Daviess County
Income Overview in Daviess County
Per Capita Income in Daviess County is $33,599, while median incomes of families and households are $79,966 and $64,021 respectively.
| Characteristic | Number | Measure |
| Per Capita Income | 102,916 | $33,599 |
| Median Family Income | 26,811 | $79,966 |
| Mean Family Income | 26,811 | $97,615 |
| Median Household Income | 40,722 | $64,021 |
| Mean Household Income | 40,722 | $83,578 |
| Income Deficit | 26,811 | $12,037 |
| Wage / Income Gap (%) | 102,916 | 34.00% |
| Wage / Income Gap ($) | 102,916 | 66.00¢ per $1 |
| Gini / Inequality Index | 102,916 | 0.46 |
Earnings by Sex in Daviess County
Average Earnings in Daviess County are $38,345, $47,527 for men and $31,366 for women, a difference of 34.0%.
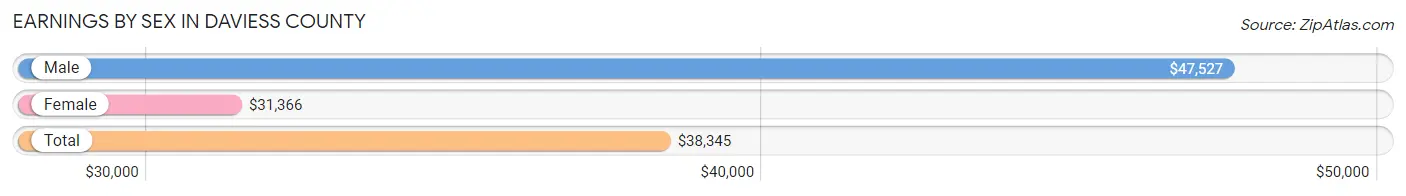
| Sex | Number | Average Earnings |
| Male | 26,963 (52.2%) | $47,527 |
| Female | 24,656 (47.8%) | $31,366 |
| Total | 51,619 (100.0%) | $38,345 |
Earnings by Sex by Income Bracket in Daviess County
The most common earnings brackets in Daviess County are $100,000+ for men (3,805 | 14.1%) and $25,000 to $29,999 for women (1,957 | 7.9%).
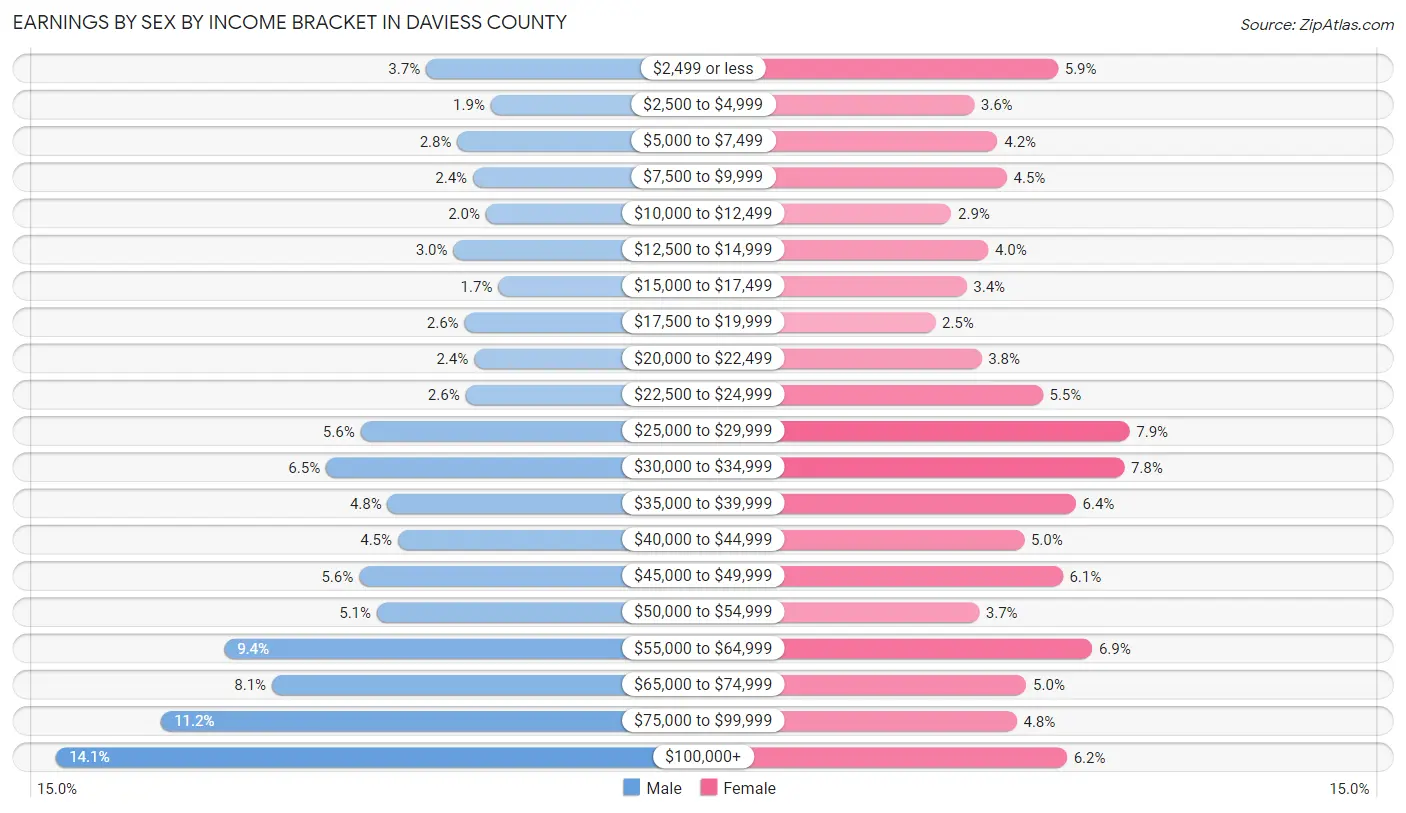
| Income | Male | Female |
| $2,499 or less | 1,003 (3.7%) | 1,462 (5.9%) |
| $2,500 to $4,999 | 513 (1.9%) | 880 (3.6%) |
| $5,000 to $7,499 | 765 (2.8%) | 1,044 (4.2%) |
| $7,500 to $9,999 | 646 (2.4%) | 1,106 (4.5%) |
| $10,000 to $12,499 | 550 (2.0%) | 722 (2.9%) |
| $12,500 to $14,999 | 796 (2.9%) | 978 (4.0%) |
| $15,000 to $17,499 | 456 (1.7%) | 828 (3.4%) |
| $17,500 to $19,999 | 713 (2.6%) | 611 (2.5%) |
| $20,000 to $22,499 | 640 (2.4%) | 932 (3.8%) |
| $22,500 to $24,999 | 704 (2.6%) | 1,355 (5.5%) |
| $25,000 to $29,999 | 1,499 (5.6%) | 1,957 (7.9%) |
| $30,000 to $34,999 | 1,761 (6.5%) | 1,921 (7.8%) |
| $35,000 to $39,999 | 1,295 (4.8%) | 1,586 (6.4%) |
| $40,000 to $44,999 | 1,217 (4.5%) | 1,227 (5.0%) |
| $45,000 to $49,999 | 1,511 (5.6%) | 1,494 (6.1%) |
| $50,000 to $54,999 | 1,376 (5.1%) | 915 (3.7%) |
| $55,000 to $64,999 | 2,533 (9.4%) | 1,698 (6.9%) |
| $65,000 to $74,999 | 2,170 (8.1%) | 1,242 (5.0%) |
| $75,000 to $99,999 | 3,010 (11.2%) | 1,175 (4.8%) |
| $100,000+ | 3,805 (14.1%) | 1,523 (6.2%) |
| Total | 26,963 (100.0%) | 24,656 (100.0%) |
Earnings by Sex by Educational Attainment in Daviess County
Average earnings in Daviess County are $54,130 for men and $35,909 for women, a difference of 33.7%. Men with an educational attainment of graduate degree enjoy the highest average annual earnings of $78,472, while those with less than high school education earn the least with $29,186. Women with an educational attainment of graduate degree earn the most with the average annual earnings of $58,750, while those with less than high school education have the smallest earnings of $23,442.
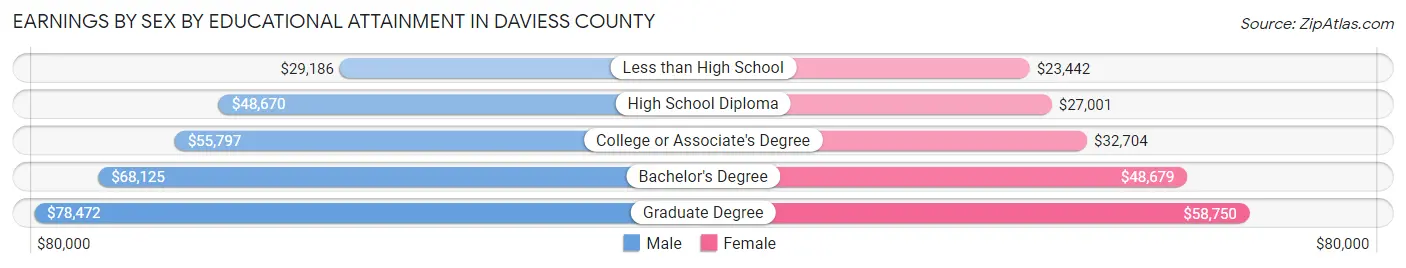
| Educational Attainment | Male Income | Female Income |
| Less than High School | $29,186 | $23,442 |
| High School Diploma | $48,670 | $27,001 |
| College or Associate's Degree | $55,797 | $32,704 |
| Bachelor's Degree | $68,125 | $48,679 |
| Graduate Degree | $78,472 | $58,750 |
| Total | $54,130 | $35,909 |
Family Income in Daviess County
Family Income Brackets in Daviess County
According to the Daviess County family income data, there are 5,711 families falling into the $100,000 to $149,999 income range, which is the most common income bracket and makes up 21.3% of all families. Conversely, the $10,000 to $14,999 income bracket is the least frequent group with only 643 families (2.4%) belonging to this category.
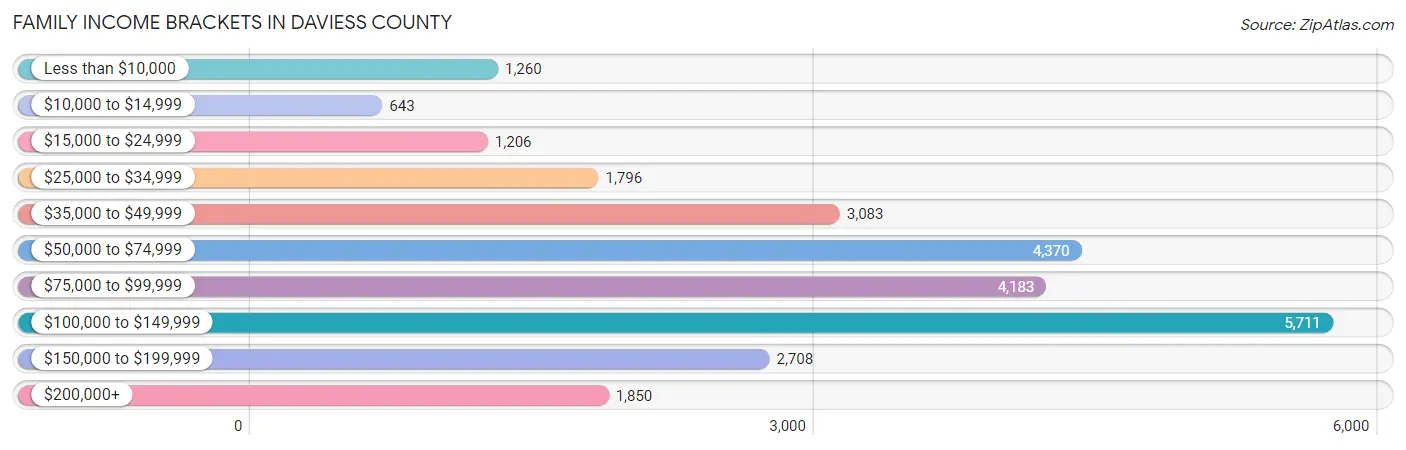
| Income Bracket | # Families | % Families |
| Less than $10,000 | 1,260 | 4.7% |
| $10,000 to $14,999 | 643 | 2.4% |
| $15,000 to $24,999 | 1,206 | 4.5% |
| $25,000 to $34,999 | 1,796 | 6.7% |
| $35,000 to $49,999 | 3,083 | 11.5% |
| $50,000 to $74,999 | 4,370 | 16.3% |
| $75,000 to $99,999 | 4,183 | 15.6% |
| $100,000 to $149,999 | 5,711 | 21.3% |
| $150,000 to $199,999 | 2,708 | 10.1% |
| $200,000+ | 1,850 | 6.9% |
Family Income by Famaliy Size in Daviess County
4-person families (3,751 | 14.0%) account for the highest median family income in Daviess County with $104,940 per family, while 2-person families (13,216 | 49.3%) have the highest median income of $35,540 per family member.
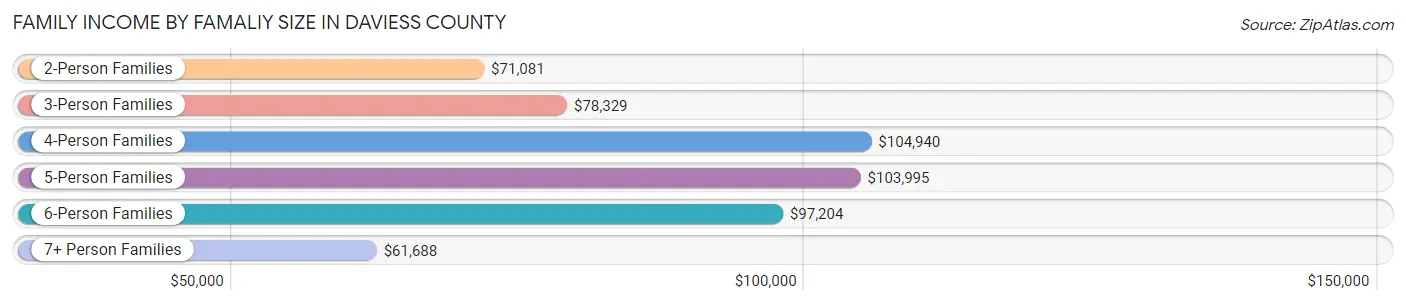
| Income Bracket | # Families | Median Income |
| 2-Person Families | 13,216 (49.3%) | $71,081 |
| 3-Person Families | 6,412 (23.9%) | $78,329 |
| 4-Person Families | 3,751 (14.0%) | $104,940 |
| 5-Person Families | 2,234 (8.3%) | $103,995 |
| 6-Person Families | 767 (2.9%) | $97,204 |
| 7+ Person Families | 431 (1.6%) | $61,688 |
| Total | 26,811 (100.0%) | $79,966 |
Family Income by Number of Earners in Daviess County
The median family income in Daviess County is $79,966, with families comprising 3+ earners (2,976) having the highest median family income of $137,810, while families with no earners (4,811) have the lowest median family income of $45,060, accounting for 11.1% and 17.9% of families, respectively.
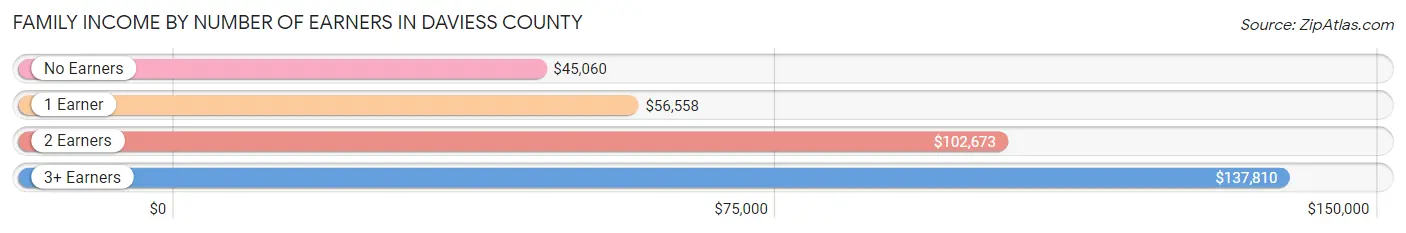
| Number of Earners | # Families | Median Income |
| No Earners | 4,811 (17.9%) | $45,060 |
| 1 Earner | 8,420 (31.4%) | $56,558 |
| 2 Earners | 10,604 (39.6%) | $102,673 |
| 3+ Earners | 2,976 (11.1%) | $137,810 |
| Total | 26,811 (100.0%) | $79,966 |
Household Income in Daviess County
Household Income Brackets in Daviess County
With 6,882 households falling in the category, the $50,000 to $74,999 income range is the most frequent in Daviess County, accounting for 16.9% of all households. In contrast, only 1,995 households (4.9%) fall into the $10,000 to $14,999 income bracket, making it the least populous group.
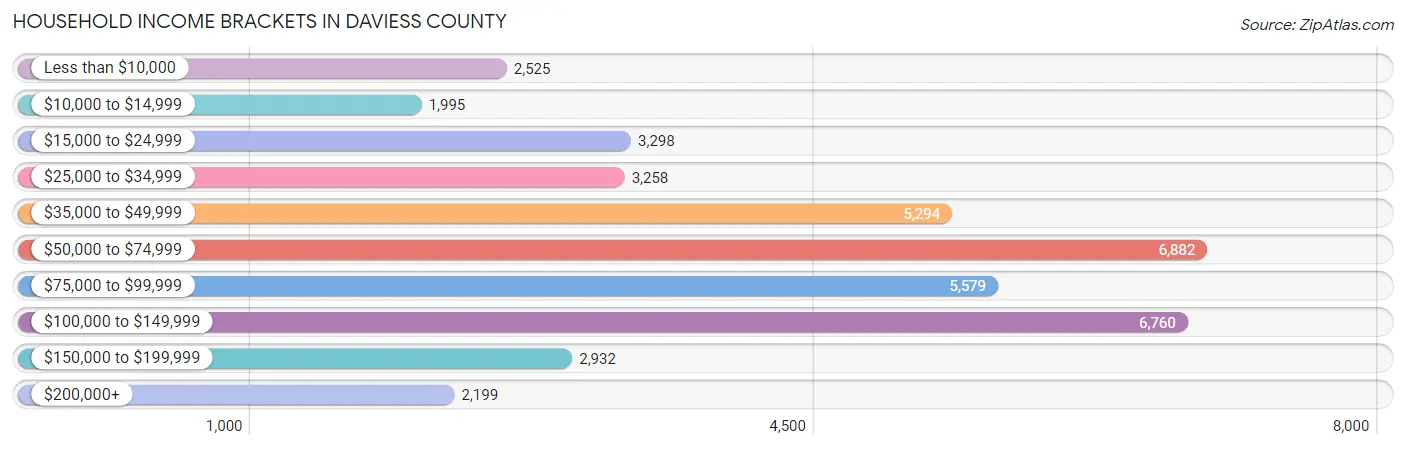
| Income Bracket | # Households | % Households |
| Less than $10,000 | 2,525 | 6.2% |
| $10,000 to $14,999 | 1,995 | 4.9% |
| $15,000 to $24,999 | 3,298 | 8.1% |
| $25,000 to $34,999 | 3,258 | 8.0% |
| $35,000 to $49,999 | 5,294 | 13.0% |
| $50,000 to $74,999 | 6,882 | 16.9% |
| $75,000 to $99,999 | 5,579 | 13.7% |
| $100,000 to $149,999 | 6,760 | 16.6% |
| $150,000 to $199,999 | 2,932 | 7.2% |
| $200,000+ | 2,199 | 5.4% |
Household Income by Householder Age in Daviess County
The median household income in Daviess County is $64,021, with the highest median household income of $77,191 found in the 45 to 64 years age bracket for the primary householder. A total of 14,881 households (36.5%) fall into this category. Meanwhile, the 15 to 24 years age bracket for the primary householder has the lowest median household income of $43,554, with 1,717 households (4.2%) in this group.
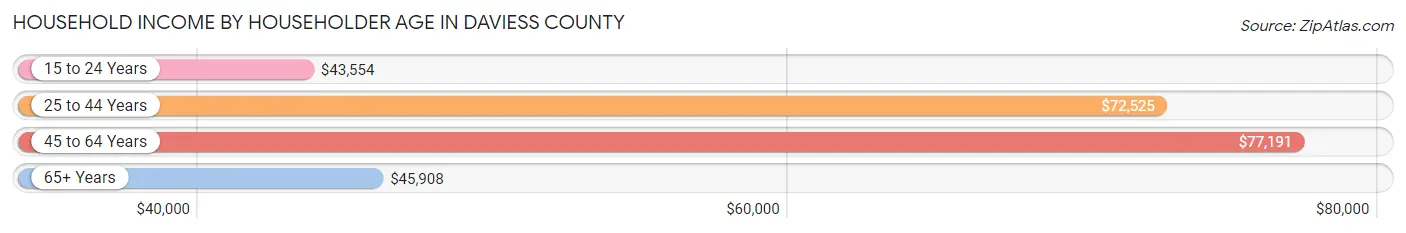
| Income Bracket | # Households | Median Income |
| 15 to 24 Years | 1,717 (4.2%) | $43,554 |
| 25 to 44 Years | 12,511 (30.7%) | $72,525 |
| 45 to 64 Years | 14,881 (36.5%) | $77,191 |
| 65+ Years | 11,613 (28.5%) | $45,908 |
| Total | 40,722 (100.0%) | $64,021 |
Poverty in Daviess County
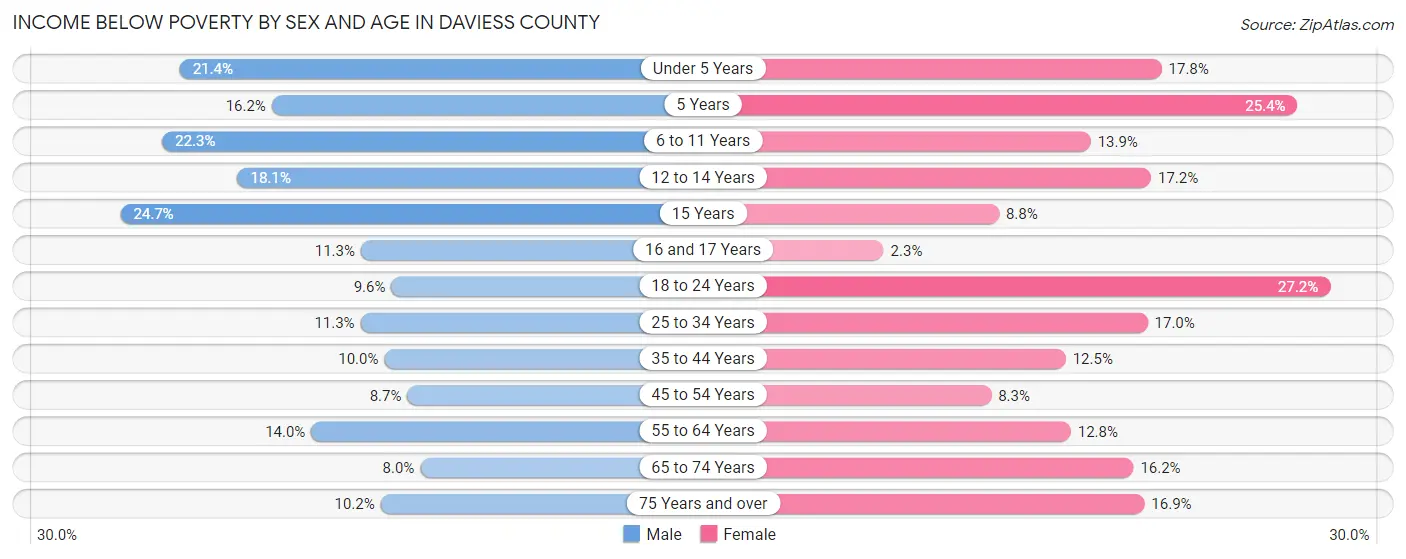
Income Below Poverty by Sex and Age in Daviess County
With 12.9% poverty level for males and 15.0% for females among the residents of Daviess County, 15 year old males and 18 to 24 year old females are the most vulnerable to poverty, with 179 males (24.7%) and 1,095 females (27.2%) in their respective age groups living below the poverty level.
| Age Bracket | Male | Female |
| Under 5 Years | 720 (21.4%) | 563 (17.8%) |
| 5 Years | 127 (16.2%) | 206 (25.4%) |
| 6 to 11 Years | 970 (22.3%) | 549 (13.9%) |
| 12 to 14 Years | 347 (18.1%) | 323 (17.2%) |
| 15 Years | 179 (24.7%) | 88 (8.7%) |
| 16 and 17 Years | 156 (11.3%) | 25 (2.3%) |
| 18 to 24 Years | 380 (9.6%) | 1,095 (27.2%) |
| 25 to 34 Years | 717 (11.3%) | 1,106 (17.0%) |
| 35 to 44 Years | 622 (10.0%) | 746 (12.5%) |
| 45 to 54 Years | 511 (8.7%) | 510 (8.3%) |
| 55 to 64 Years | 911 (14.0%) | 897 (12.8%) |
| 65 to 74 Years | 378 (8.0%) | 882 (16.2%) |
| 75 Years and over | 283 (10.2%) | 699 (16.9%) |
| Total | 6,301 (12.9%) | 7,689 (15.0%) |
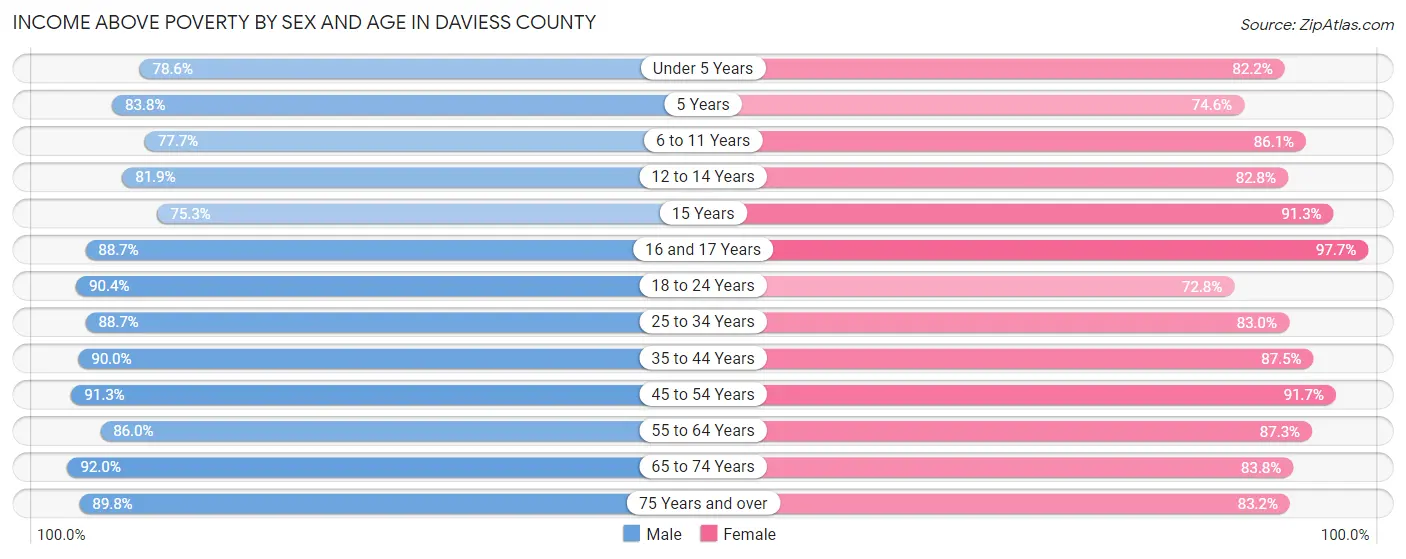
Income Above Poverty by Sex and Age in Daviess County
According to the poverty statistics in Daviess County, males aged 65 to 74 years and females aged 16 and 17 years are the age groups that are most secure financially, with 92.0% of males and 97.7% of females in these age groups living above the poverty line.
| Age Bracket | Male | Female |
| Under 5 Years | 2,650 (78.6%) | 2,598 (82.2%) |
| 5 Years | 655 (83.8%) | 606 (74.6%) |
| 6 to 11 Years | 3,372 (77.7%) | 3,411 (86.1%) |
| 12 to 14 Years | 1,566 (81.9%) | 1,553 (82.8%) |
| 15 Years | 547 (75.3%) | 918 (91.2%) |
| 16 and 17 Years | 1,227 (88.7%) | 1,046 (97.7%) |
| 18 to 24 Years | 3,587 (90.4%) | 2,932 (72.8%) |
| 25 to 34 Years | 5,629 (88.7%) | 5,389 (83.0%) |
| 35 to 44 Years | 5,619 (90.0%) | 5,236 (87.5%) |
| 45 to 54 Years | 5,367 (91.3%) | 5,620 (91.7%) |
| 55 to 64 Years | 5,578 (86.0%) | 6,136 (87.3%) |
| 65 to 74 Years | 4,363 (92.0%) | 4,549 (83.8%) |
| 75 Years and over | 2,496 (89.8%) | 3,449 (83.2%) |
| Total | 42,656 (87.1%) | 43,443 (85.0%) |
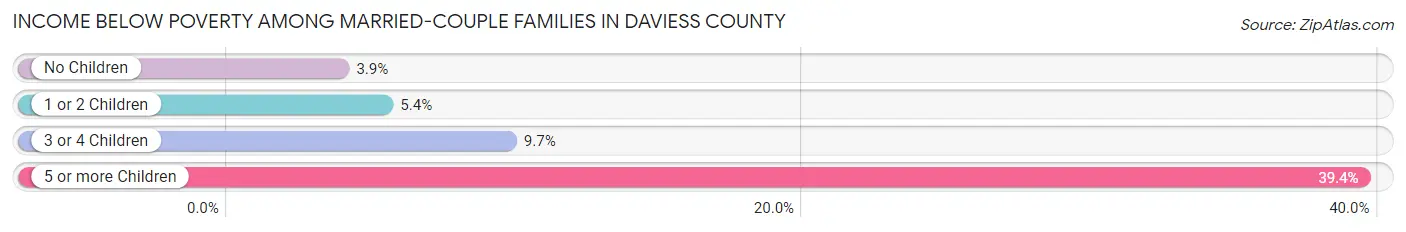
Income Below Poverty Among Married-Couple Families in Daviess County
The poverty statistics for married-couple families in Daviess County show that 5.3% or 1,037 of the total 19,500 families live below the poverty line. Families with 5 or more children have the highest poverty rate of 39.4%, comprising of 97 families. On the other hand, families with no children have the lowest poverty rate of 3.9%, which includes 452 families.
| Children | Above Poverty | Below Poverty |
| No Children | 11,195 (96.1%) | 452 (3.9%) |
| 1 or 2 Children | 5,510 (94.6%) | 315 (5.4%) |
| 3 or 4 Children | 1,609 (90.3%) | 173 (9.7%) |
| 5 or more Children | 149 (60.6%) | 97 (39.4%) |
| Total | 18,463 (94.7%) | 1,037 (5.3%) |
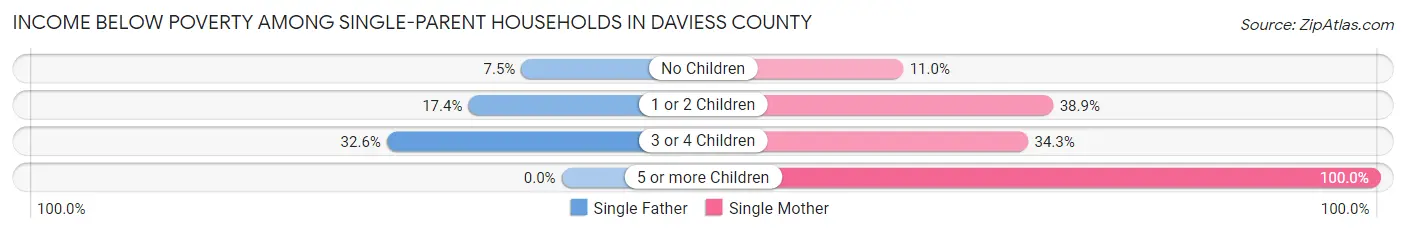
Income Below Poverty Among Single-Parent Households in Daviess County
According to the poverty data in Daviess County, 14.5% or 334 single-father households and 30.9% or 1,550 single-mother households are living below the poverty line. Among single-father households, those with 3 or 4 children have the highest poverty rate, with 42 households (32.6%) experiencing poverty. Likewise, among single-mother households, those with 5 or more children have the highest poverty rate, with 58 households (100.0%) falling below the poverty line.
| Children | Single Father | Single Mother |
| No Children | 61 (7.5%) | 164 (11.0%) |
| 1 or 2 Children | 231 (17.4%) | 1,179 (38.9%) |
| 3 or 4 Children | 42 (32.6%) | 149 (34.3%) |
| 5 or more Children | 0 (0.0%) | 58 (100.0%) |
| Total | 334 (14.5%) | 1,550 (30.9%) |
Income Below Poverty Among Married-Couple vs Single-Parent Households in Daviess County
The poverty data for Daviess County shows that 1,037 of the married-couple family households (5.3%) and 1,884 of the single-parent households (25.8%) are living below the poverty level. Within the married-couple family households, those with 5 or more children have the highest poverty rate, with 97 households (39.4%) falling below the poverty line. Among the single-parent households, those with 5 or more children have the highest poverty rate, with 58 household (67.4%) living below poverty.
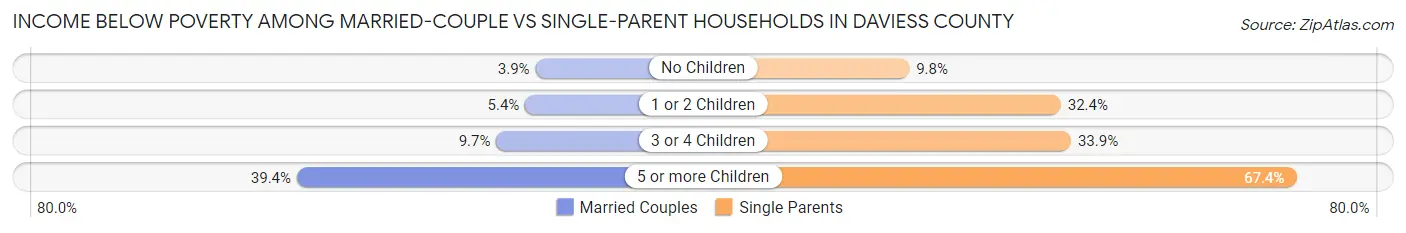
| Children | Married-Couple Families | Single-Parent Households |
| No Children | 452 (3.9%) | 225 (9.8%) |
| 1 or 2 Children | 315 (5.4%) | 1,410 (32.4%) |
| 3 or 4 Children | 173 (9.7%) | 191 (33.9%) |
| 5 or more Children | 97 (39.4%) | 58 (67.4%) |
| Total | 1,037 (5.3%) | 1,884 (25.8%) |
Employment Characteristics in Daviess County
Employment by Class of Employer in Daviess County
Among the 46,641 employed individuals in Daviess County, private company employees (32,596 | 69.9%), not-for-profit organizations (4,791 | 10.3%), and local government employees (3,042 | 6.5%) make up the most common classes of employment.
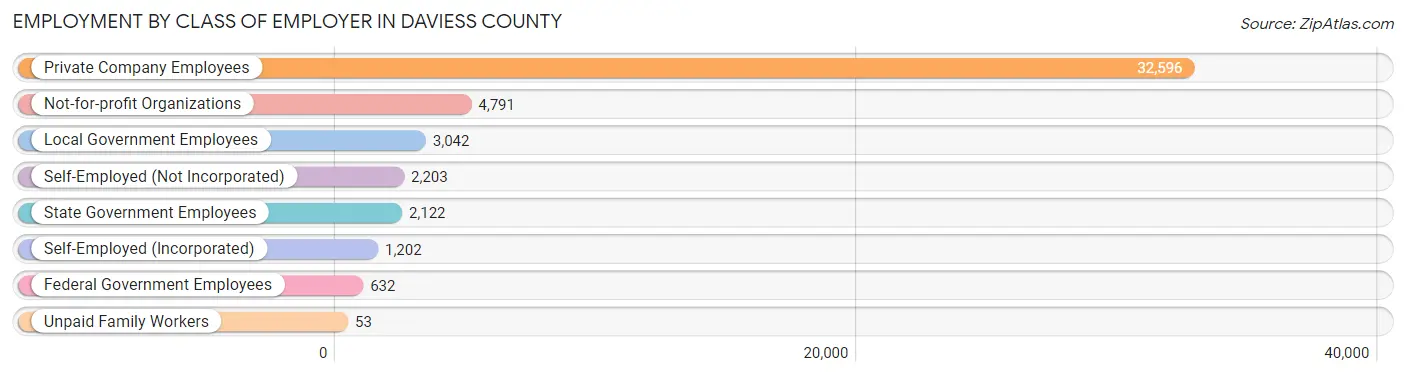
| Employer Class | # Employees | % Employees |
| Private Company Employees | 32,596 | 69.9% |
| Self-Employed (Incorporated) | 1,202 | 2.6% |
| Self-Employed (Not Incorporated) | 2,203 | 4.7% |
| Not-for-profit Organizations | 4,791 | 10.3% |
| Local Government Employees | 3,042 | 6.5% |
| State Government Employees | 2,122 | 4.5% |
| Federal Government Employees | 632 | 1.4% |
| Unpaid Family Workers | 53 | 0.1% |
| Total | 46,641 | 100.0% |
Employment Status by Age in Daviess County
According to the labor force statistics for Daviess County, out of the total population over 16 years of age (80,378), 61.6% or 49,513 individuals are in the labor force, with 4.1% or 2,030 of them unemployed. The age group with the highest labor force participation rate is 25 to 29 years, with 85.9% or 5,711 individuals in the labor force. Within the labor force, the 16 to 19 years age range has the highest percentage of unemployed individuals, with 21.0% or 534 of them being unemployed.
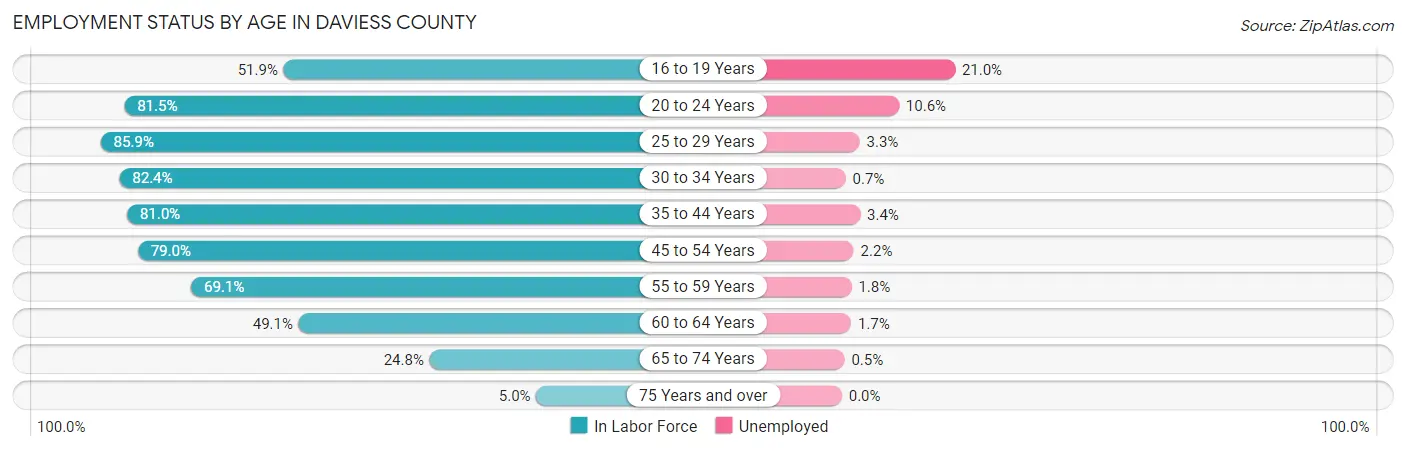
| Age Bracket | In Labor Force | Unemployed |
| 16 to 19 Years | 2,544 (51.9%) | 534 (21.0%) |
| 20 to 24 Years | 5,086 (81.5%) | 539 (10.6%) |
| 25 to 29 Years | 5,711 (85.9%) | 188 (3.3%) |
| 30 to 34 Years | 5,340 (82.4%) | 37 (0.7%) |
| 35 to 44 Years | 10,126 (81.0%) | 344 (3.4%) |
| 45 to 54 Years | 9,678 (79.0%) | 213 (2.2%) |
| 55 to 59 Years | 4,778 (69.1%) | 86 (1.8%) |
| 60 to 64 Years | 3,319 (49.1%) | 56 (1.7%) |
| 65 to 74 Years | 2,586 (24.8%) | 13 (0.5%) |
| 75 Years and over | 363 (5.0%) | 0 (0.0%) |
| Total | 49,513 (61.6%) | 2,030 (4.1%) |
Employment Status by Educational Attainment in Daviess County
According to labor force statistics for Daviess County, 75.6% of individuals (38,975) out of the total population between 25 and 64 years of age (51,554) are in the labor force, with 2.4% or 935 of them being unemployed. The group with the highest labor force participation rate are those with the educational attainment of bachelor's degree or higher, with 86.0% or 11,830 individuals in the labor force. Within the labor force, individuals with less than high school education have the highest percentage of unemployment, with 7.5% or 154 of them being unemployed.
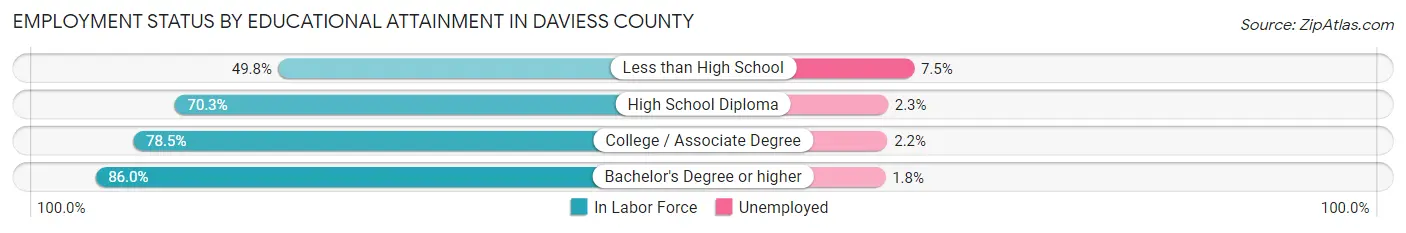
| Educational Attainment | In Labor Force | Unemployed |
| Less than High School | 2,048 (49.8%) | 308 (7.5%) |
| High School Diploma | 11,674 (70.3%) | 382 (2.3%) |
| College / Associate Degree | 13,407 (78.5%) | 376 (2.2%) |
| Bachelor's Degree or higher | 11,830 (86.0%) | 248 (1.8%) |
| Total | 38,975 (75.6%) | 1,237 (2.4%) |
Employment Occupations by Sex in Daviess County
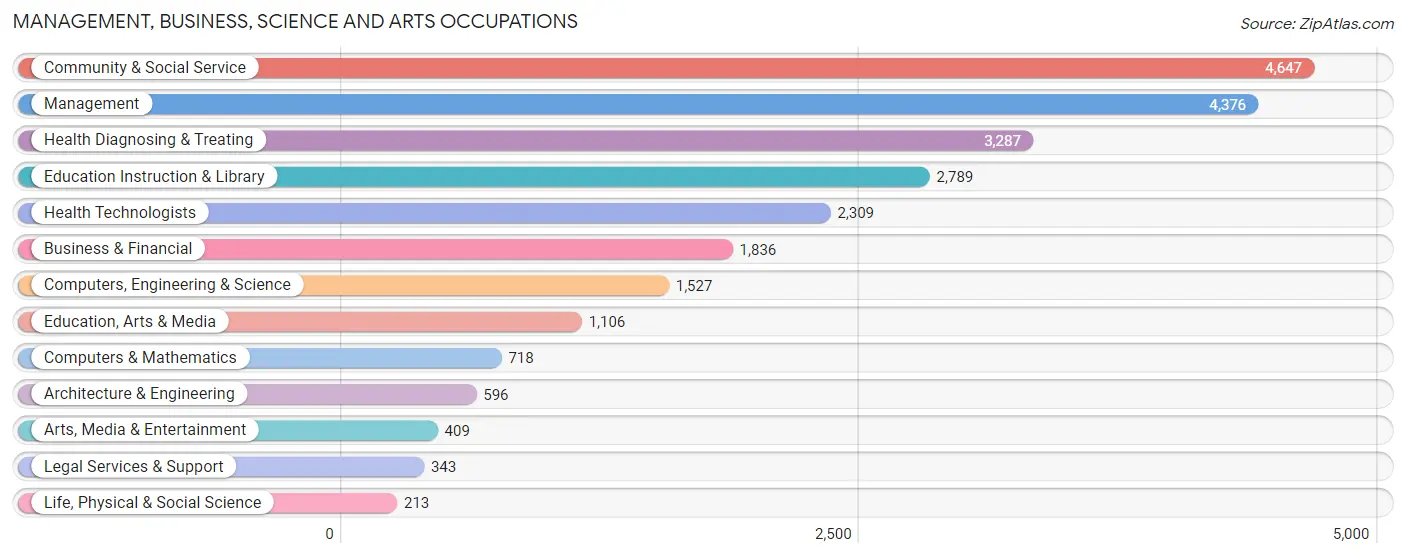
Management, Business, Science and Arts Occupations
The most common Management, Business, Science and Arts occupations in Daviess County are Community & Social Service (4,647 | 9.8%), Management (4,376 | 9.2%), Health Diagnosing & Treating (3,287 | 6.9%), Education Instruction & Library (2,789 | 5.9%), and Health Technologists (2,309 | 4.9%).
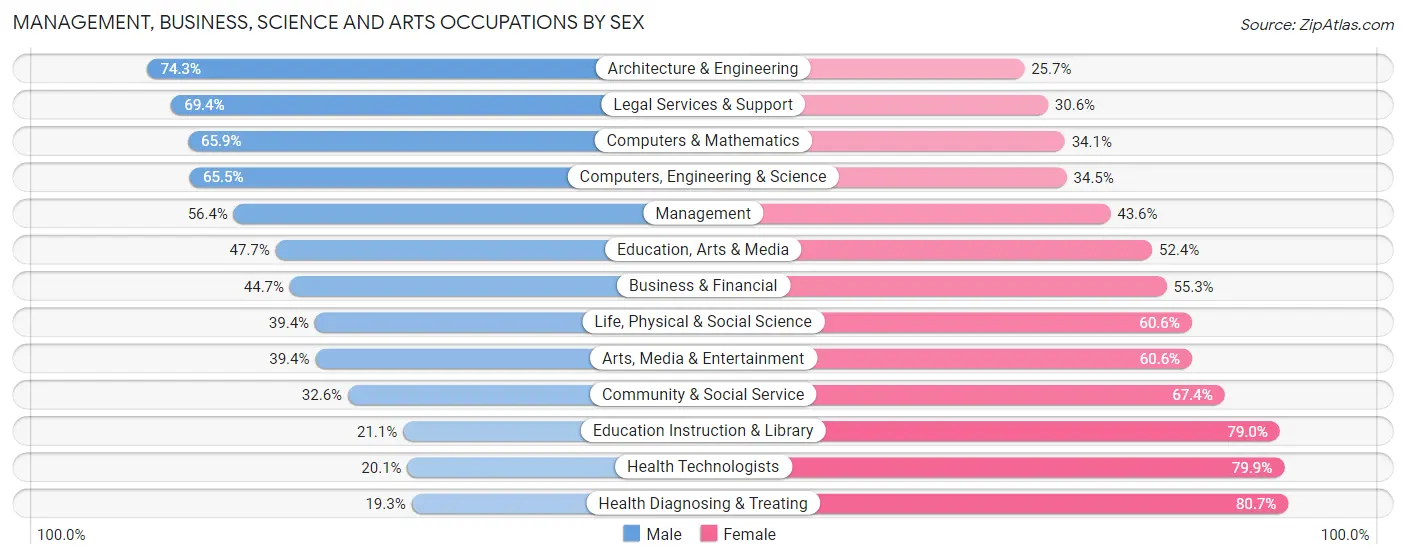
Management, Business, Science and Arts Occupations by Sex
Within the Management, Business, Science and Arts occupations in Daviess County, the most male-oriented occupations are Architecture & Engineering (74.3%), Legal Services & Support (69.4%), and Computers & Mathematics (65.9%), while the most female-oriented occupations are Health Diagnosing & Treating (80.7%), Health Technologists (79.9%), and Education Instruction & Library (78.9%).
| Occupation | Male | Female |
| Management | 2,467 (56.4%) | 1,909 (43.6%) |
| Business & Financial | 820 (44.7%) | 1,016 (55.3%) |
| Computers, Engineering & Science | 1,000 (65.5%) | 527 (34.5%) |
| Computers & Mathematics | 473 (65.9%) | 245 (34.1%) |
| Architecture & Engineering | 443 (74.3%) | 153 (25.7%) |
| Life, Physical & Social Science | 84 (39.4%) | 129 (60.6%) |
| Community & Social Service | 1,513 (32.6%) | 3,134 (67.4%) |
| Education, Arts & Media | 527 (47.6%) | 579 (52.3%) |
| Legal Services & Support | 238 (69.4%) | 105 (30.6%) |
| Education Instruction & Library | 587 (21.0%) | 2,202 (78.9%) |
| Arts, Media & Entertainment | 161 (39.4%) | 248 (60.6%) |
| Health Diagnosing & Treating | 634 (19.3%) | 2,653 (80.7%) |
| Health Technologists | 465 (20.1%) | 1,844 (79.9%) |
| Total (Category) | 6,434 (41.0%) | 9,239 (59.0%) |
| Total (Overall) | 24,912 (52.5%) | 22,558 (47.5%) |
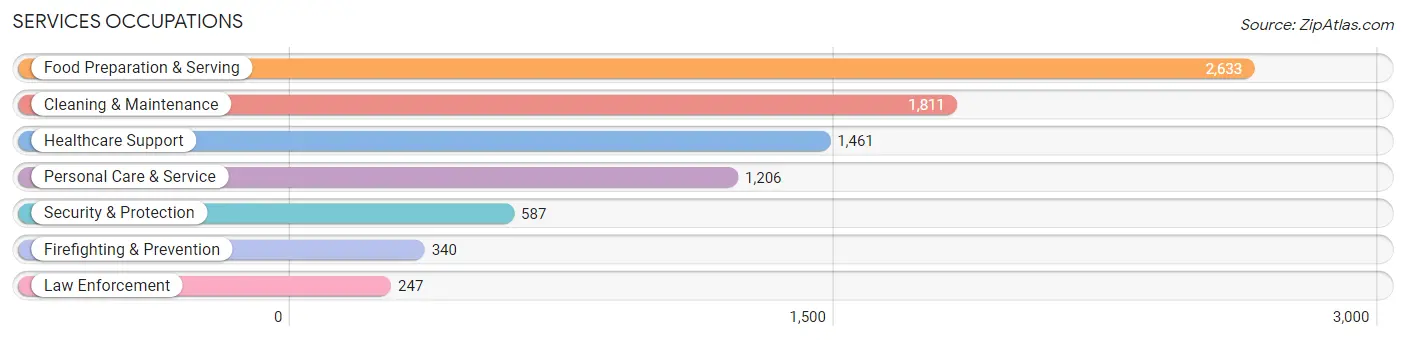
Services Occupations
The most common Services occupations in Daviess County are Food Preparation & Serving (2,633 | 5.6%), Cleaning & Maintenance (1,811 | 3.8%), Healthcare Support (1,461 | 3.1%), Personal Care & Service (1,206 | 2.5%), and Security & Protection (587 | 1.2%).
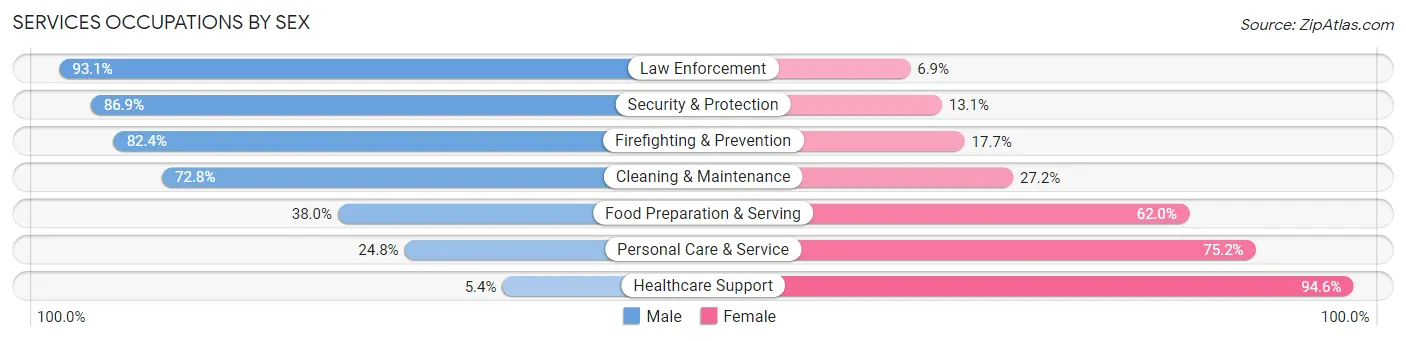
Services Occupations by Sex
Within the Services occupations in Daviess County, the most male-oriented occupations are Law Enforcement (93.1%), Security & Protection (86.9%), and Firefighting & Prevention (82.4%), while the most female-oriented occupations are Healthcare Support (94.6%), Personal Care & Service (75.2%), and Food Preparation & Serving (62.0%).
| Occupation | Male | Female |
| Healthcare Support | 79 (5.4%) | 1,382 (94.6%) |
| Security & Protection | 510 (86.9%) | 77 (13.1%) |
| Firefighting & Prevention | 280 (82.4%) | 60 (17.6%) |
| Law Enforcement | 230 (93.1%) | 17 (6.9%) |
| Food Preparation & Serving | 1,000 (38.0%) | 1,633 (62.0%) |
| Cleaning & Maintenance | 1,318 (72.8%) | 493 (27.2%) |
| Personal Care & Service | 299 (24.8%) | 907 (75.2%) |
| Total (Category) | 3,206 (41.6%) | 4,492 (58.4%) |
| Total (Overall) | 24,912 (52.5%) | 22,558 (47.5%) |
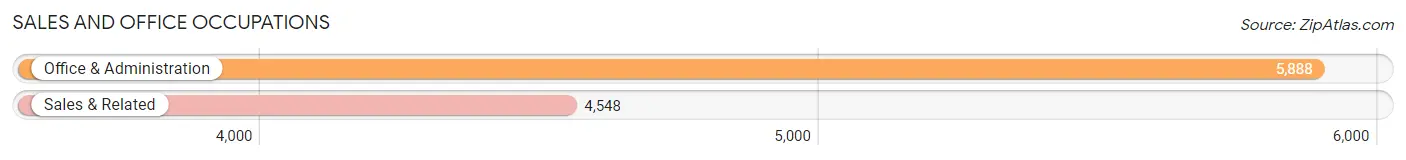
Sales and Office Occupations
The most common Sales and Office occupations in Daviess County are Office & Administration (5,888 | 12.4%), and Sales & Related (4,548 | 9.6%).
Sales and Office Occupations by Sex
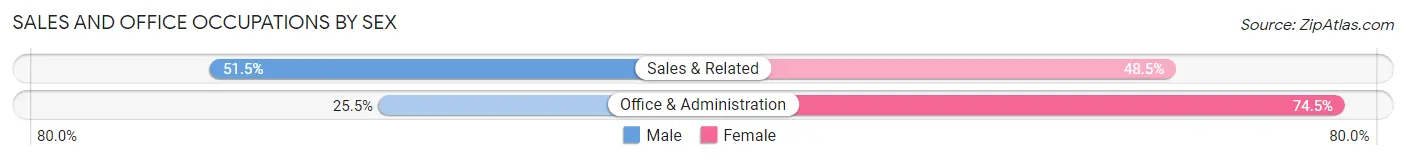
| Occupation | Male | Female |
| Sales & Related | 2,341 (51.5%) | 2,207 (48.5%) |
| Office & Administration | 1,501 (25.5%) | 4,387 (74.5%) |
| Total (Category) | 3,842 (36.8%) | 6,594 (63.2%) |
| Total (Overall) | 24,912 (52.5%) | 22,558 (47.5%) |
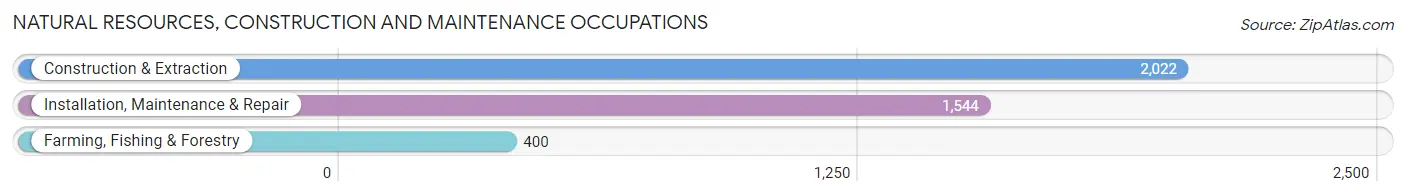
Natural Resources, Construction and Maintenance Occupations
The most common Natural Resources, Construction and Maintenance occupations in Daviess County are Construction & Extraction (2,022 | 4.3%), Installation, Maintenance & Repair (1,544 | 3.3%), and Farming, Fishing & Forestry (400 | 0.8%).
Natural Resources, Construction and Maintenance Occupations by Sex
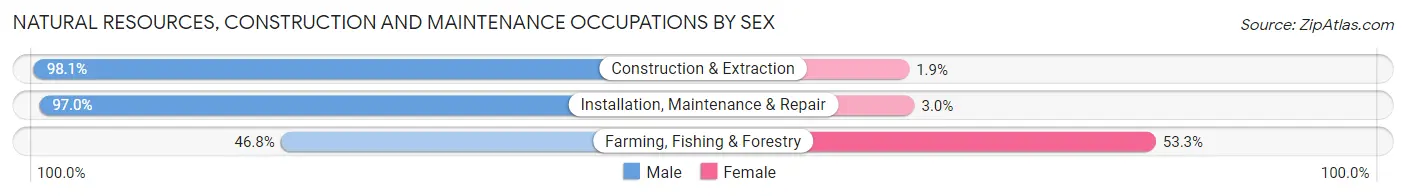
| Occupation | Male | Female |
| Farming, Fishing & Forestry | 187 (46.8%) | 213 (53.2%) |
| Construction & Extraction | 1,983 (98.1%) | 39 (1.9%) |
| Installation, Maintenance & Repair | 1,497 (97.0%) | 47 (3.0%) |
| Total (Category) | 3,667 (92.5%) | 299 (7.5%) |
| Total (Overall) | 24,912 (52.5%) | 22,558 (47.5%) |
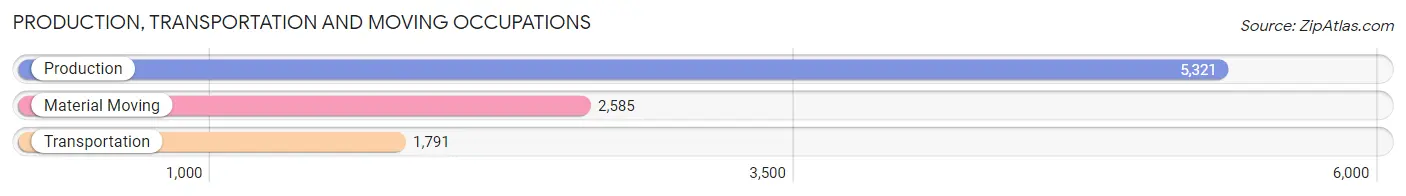
Production, Transportation and Moving Occupations
The most common Production, Transportation and Moving occupations in Daviess County are Production (5,321 | 11.2%), Material Moving (2,585 | 5.4%), and Transportation (1,791 | 3.8%).
Production, Transportation and Moving Occupations by Sex
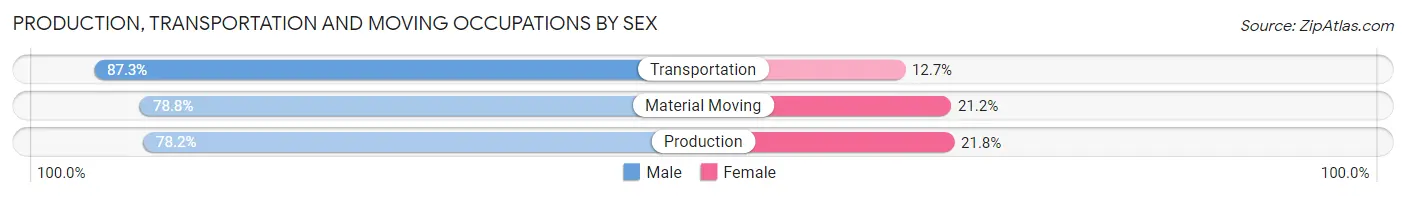
| Occupation | Male | Female |
| Production | 4,163 (78.2%) | 1,158 (21.8%) |
| Transportation | 1,563 (87.3%) | 228 (12.7%) |
| Material Moving | 2,037 (78.8%) | 548 (21.2%) |
| Total (Category) | 7,763 (80.1%) | 1,934 (19.9%) |
| Total (Overall) | 24,912 (52.5%) | 22,558 (47.5%) |
Employment Industries by Sex in Daviess County
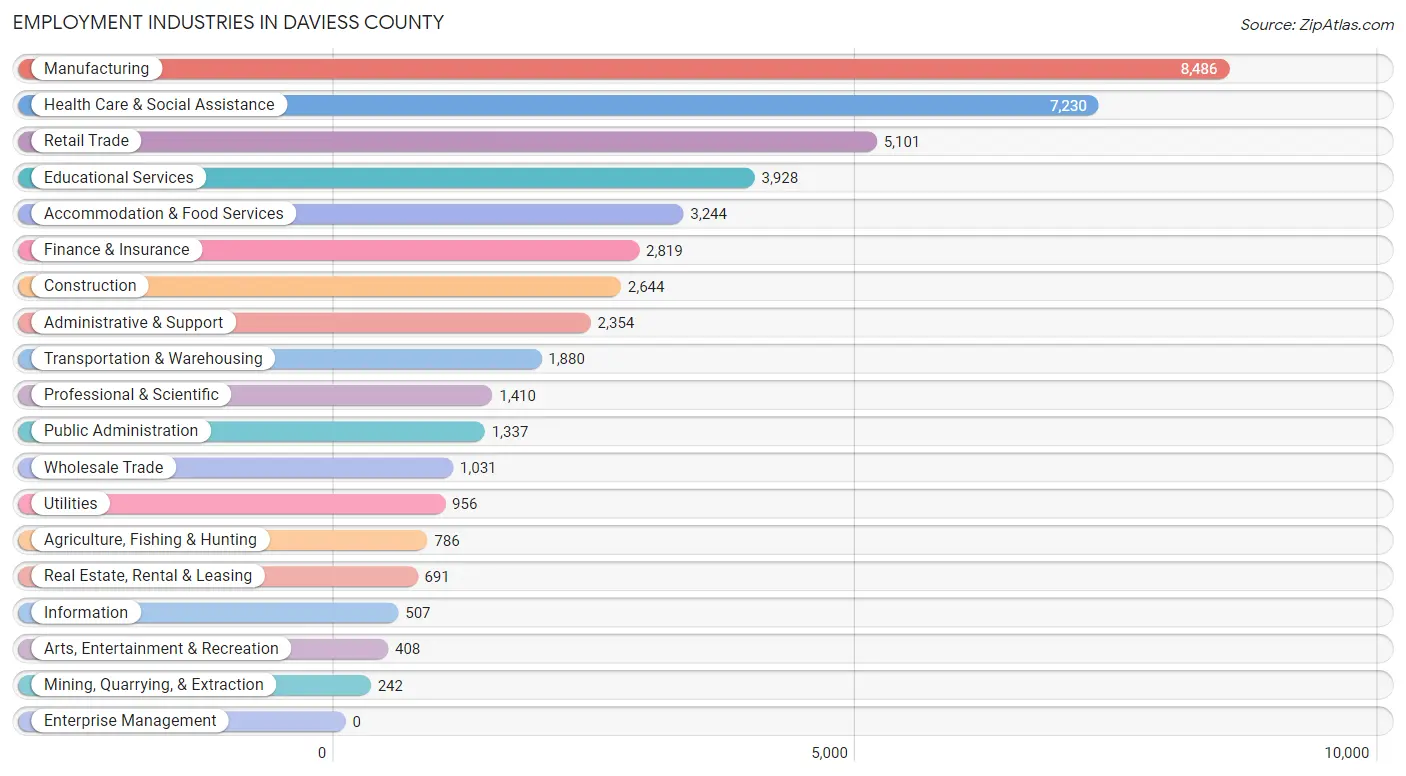
Employment Industries in Daviess County
The major employment industries in Daviess County include Manufacturing (8,486 | 17.9%), Health Care & Social Assistance (7,230 | 15.2%), Retail Trade (5,101 | 10.7%), Educational Services (3,928 | 8.3%), and Accommodation & Food Services (3,244 | 6.8%).
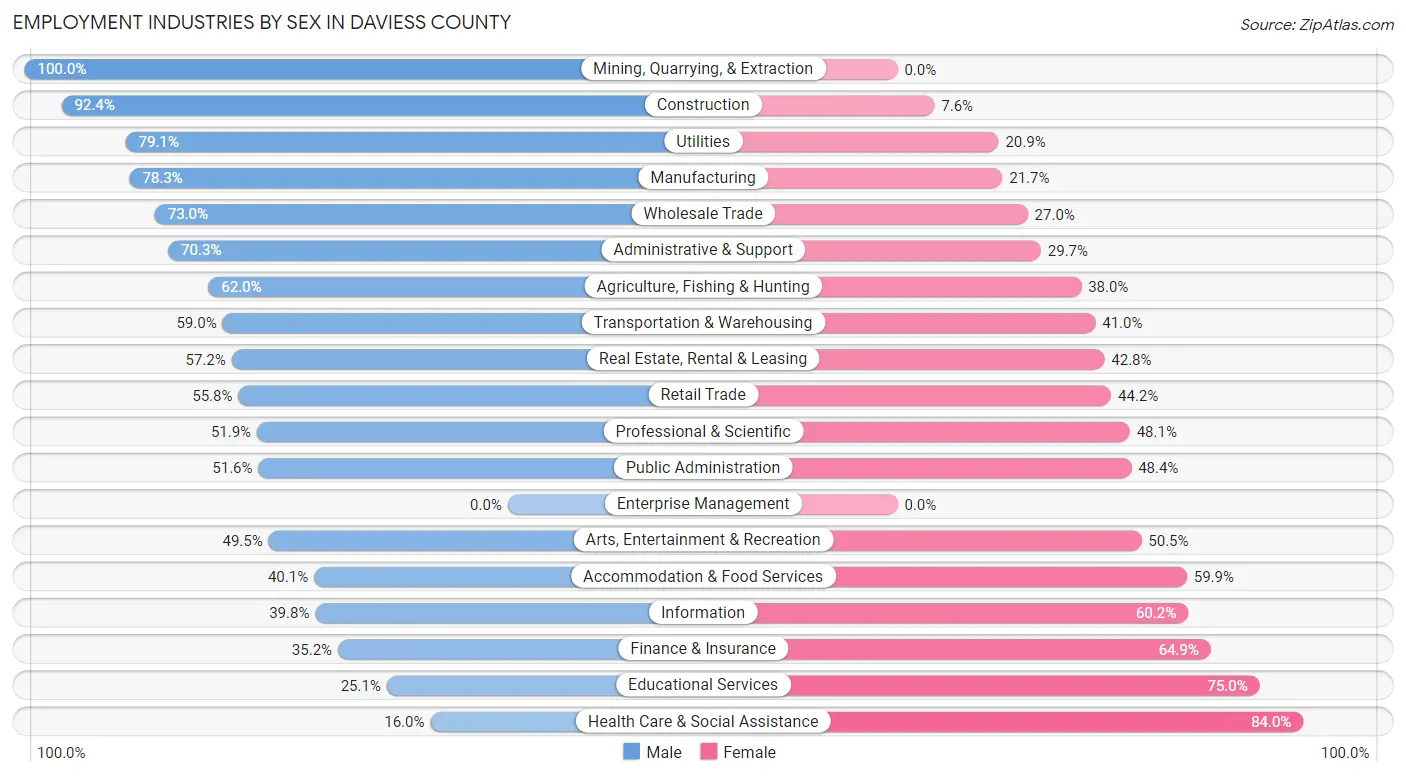
Employment Industries by Sex in Daviess County
The Daviess County industries that see more men than women are Mining, Quarrying, & Extraction (100.0%), Construction (92.4%), and Utilities (79.1%), whereas the industries that tend to have a higher number of women are Health Care & Social Assistance (84.0%), Educational Services (75.0%), and Finance & Insurance (64.8%).
| Industry | Male | Female |
| Agriculture, Fishing & Hunting | 487 (62.0%) | 299 (38.0%) |
| Mining, Quarrying, & Extraction | 242 (100.0%) | 0 (0.0%) |
| Construction | 2,442 (92.4%) | 202 (7.6%) |
| Manufacturing | 6,644 (78.3%) | 1,842 (21.7%) |
| Wholesale Trade | 753 (73.0%) | 278 (27.0%) |
| Retail Trade | 2,845 (55.8%) | 2,256 (44.2%) |
| Transportation & Warehousing | 1,110 (59.0%) | 770 (41.0%) |
| Utilities | 756 (79.1%) | 200 (20.9%) |
| Information | 202 (39.8%) | 305 (60.2%) |
| Finance & Insurance | 991 (35.1%) | 1,828 (64.8%) |
| Real Estate, Rental & Leasing | 395 (57.2%) | 296 (42.8%) |
| Professional & Scientific | 732 (51.9%) | 678 (48.1%) |
| Enterprise Management | 0 (0.0%) | 0 (0.0%) |
| Administrative & Support | 1,655 (70.3%) | 699 (29.7%) |
| Educational Services | 984 (25.1%) | 2,944 (75.0%) |
| Health Care & Social Assistance | 1,158 (16.0%) | 6,072 (84.0%) |
| Arts, Entertainment & Recreation | 202 (49.5%) | 206 (50.5%) |
| Accommodation & Food Services | 1,301 (40.1%) | 1,943 (59.9%) |
| Public Administration | 690 (51.6%) | 647 (48.4%) |
| Total | 24,912 (52.5%) | 22,558 (47.5%) |
Education in Daviess County
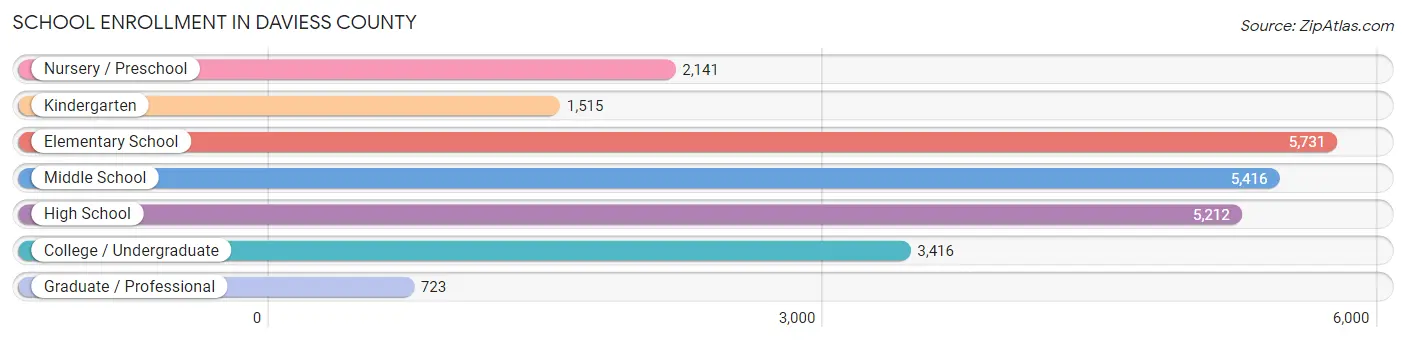
School Enrollment in Daviess County
The most common levels of schooling among the 24,154 students in Daviess County are elementary school (5,731 | 23.7%), middle school (5,416 | 22.4%), and high school (5,212 | 21.6%).
| School Level | # Students | % Students |
| Nursery / Preschool | 2,141 | 8.9% |
| Kindergarten | 1,515 | 6.3% |
| Elementary School | 5,731 | 23.7% |
| Middle School | 5,416 | 22.4% |
| High School | 5,212 | 21.6% |
| College / Undergraduate | 3,416 | 14.1% |
| Graduate / Professional | 723 | 3.0% |
| Total | 24,154 | 100.0% |
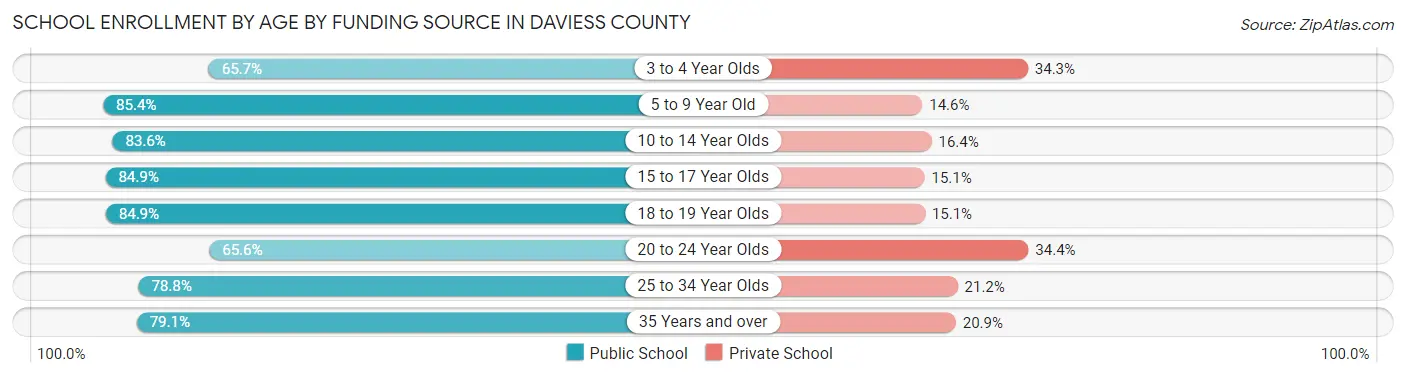
School Enrollment by Age by Funding Source in Daviess County
Out of a total of 24,154 students who are enrolled in schools in Daviess County, 4,372 (18.1%) attend a private institution, while the remaining 19,782 (81.9%) are enrolled in public schools. The age group of 20 to 24 year olds has the highest likelihood of being enrolled in private schools, with 499 (34.4% in the age bracket) enrolled. Conversely, the age group of 5 to 9 year old has the lowest likelihood of being enrolled in a private school, with 5,966 (85.4% in the age bracket) attending a public institution.
| Age Bracket | Public School | Private School |
| 3 to 4 Year Olds | 944 (65.7%) | 493 (34.3%) |
| 5 to 9 Year Old | 5,966 (85.4%) | 1,023 (14.6%) |
| 10 to 14 Year Olds | 5,553 (83.6%) | 1,087 (16.4%) |
| 15 to 17 Year Olds | 3,518 (84.9%) | 624 (15.1%) |
| 18 to 19 Year Olds | 1,424 (84.9%) | 254 (15.1%) |
| 20 to 24 Year Olds | 951 (65.6%) | 499 (34.4%) |
| 25 to 34 Year Olds | 776 (78.8%) | 209 (21.2%) |
| 35 Years and over | 659 (79.1%) | 174 (20.9%) |
| Total | 19,782 (81.9%) | 4,372 (18.1%) |
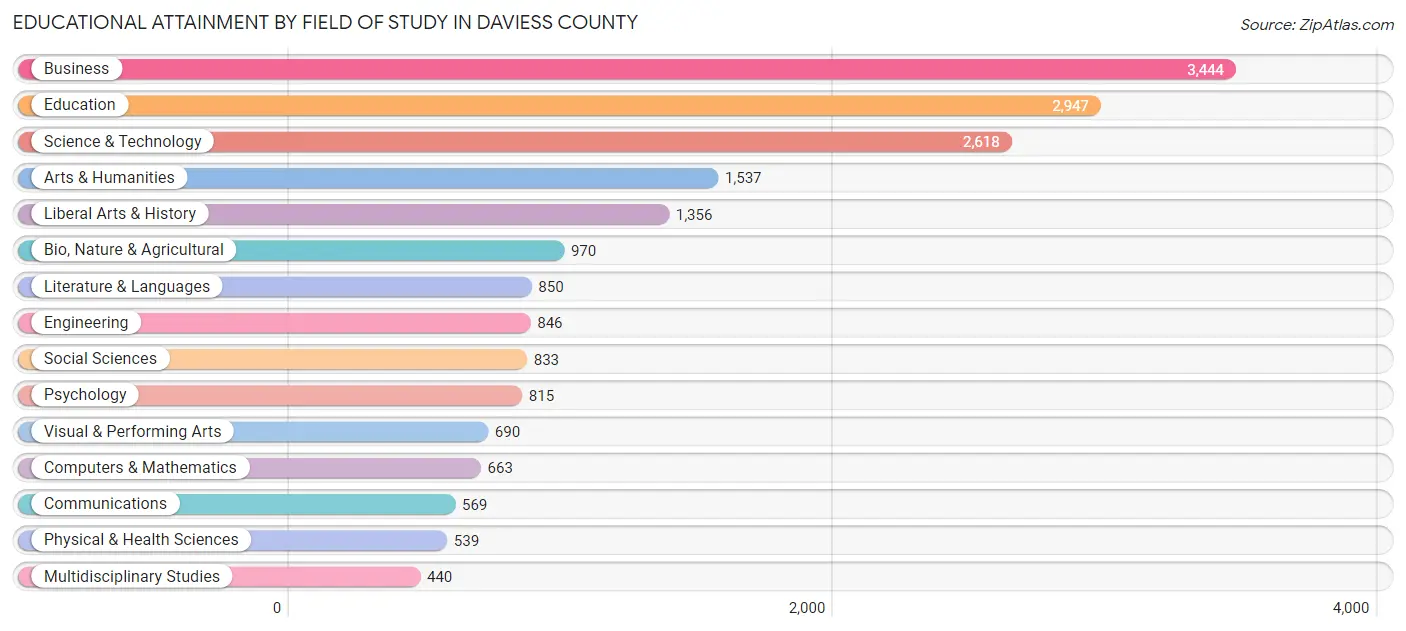
Educational Attainment by Field of Study in Daviess County
Business (3,444 | 18.0%), education (2,947 | 15.4%), science & technology (2,618 | 13.7%), arts & humanities (1,537 | 8.0%), and liberal arts & history (1,356 | 7.1%) are the most common fields of study among 19,117 individuals in Daviess County who have obtained a bachelor's degree or higher.
| Field of Study | # Graduates | % Graduates |
| Computers & Mathematics | 663 | 3.5% |
| Bio, Nature & Agricultural | 970 | 5.1% |
| Physical & Health Sciences | 539 | 2.8% |
| Psychology | 815 | 4.3% |
| Social Sciences | 833 | 4.4% |
| Engineering | 846 | 4.4% |
| Multidisciplinary Studies | 440 | 2.3% |
| Science & Technology | 2,618 | 13.7% |
| Business | 3,444 | 18.0% |
| Education | 2,947 | 15.4% |
| Literature & Languages | 850 | 4.4% |
| Liberal Arts & History | 1,356 | 7.1% |
| Visual & Performing Arts | 690 | 3.6% |
| Communications | 569 | 3.0% |
| Arts & Humanities | 1,537 | 8.0% |
| Total | 19,117 | 100.0% |
Transportation & Commute in Daviess County
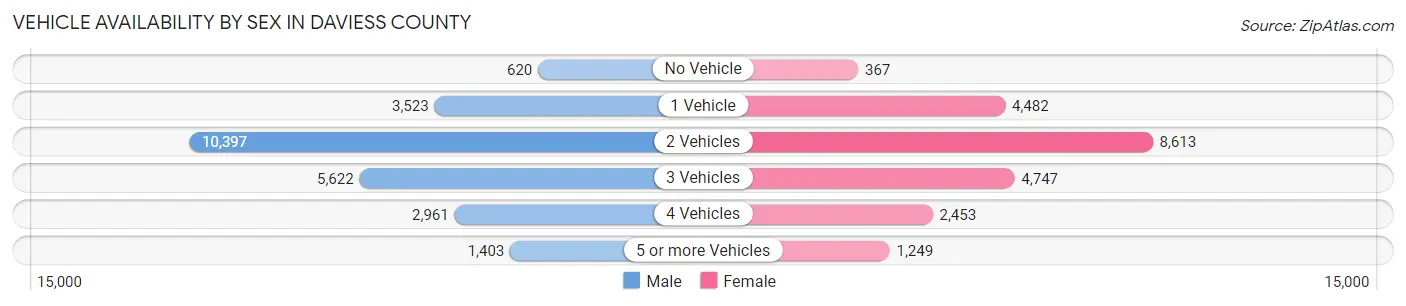
Vehicle Availability by Sex in Daviess County
The most prevalent vehicle ownership categories in Daviess County are males with 2 vehicles (10,397, accounting for 42.4%) and females with 2 vehicles (8,613, making up 47.4%).
| Vehicles Available | Male | Female |
| No Vehicle | 620 (2.5%) | 367 (1.7%) |
| 1 Vehicle | 3,523 (14.4%) | 4,482 (20.5%) |
| 2 Vehicles | 10,397 (42.4%) | 8,613 (39.3%) |
| 3 Vehicles | 5,622 (22.9%) | 4,747 (21.7%) |
| 4 Vehicles | 2,961 (12.1%) | 2,453 (11.2%) |
| 5 or more Vehicles | 1,403 (5.7%) | 1,249 (5.7%) |
| Total | 24,526 (100.0%) | 21,911 (100.0%) |
Commute Time in Daviess County
The most frequently occuring commute durations in Daviess County are 10 to 14 minutes (10,857 commuters, 24.4%), 15 to 19 minutes (8,688 commuters, 19.6%), and 5 to 9 minutes (7,314 commuters, 16.5%).
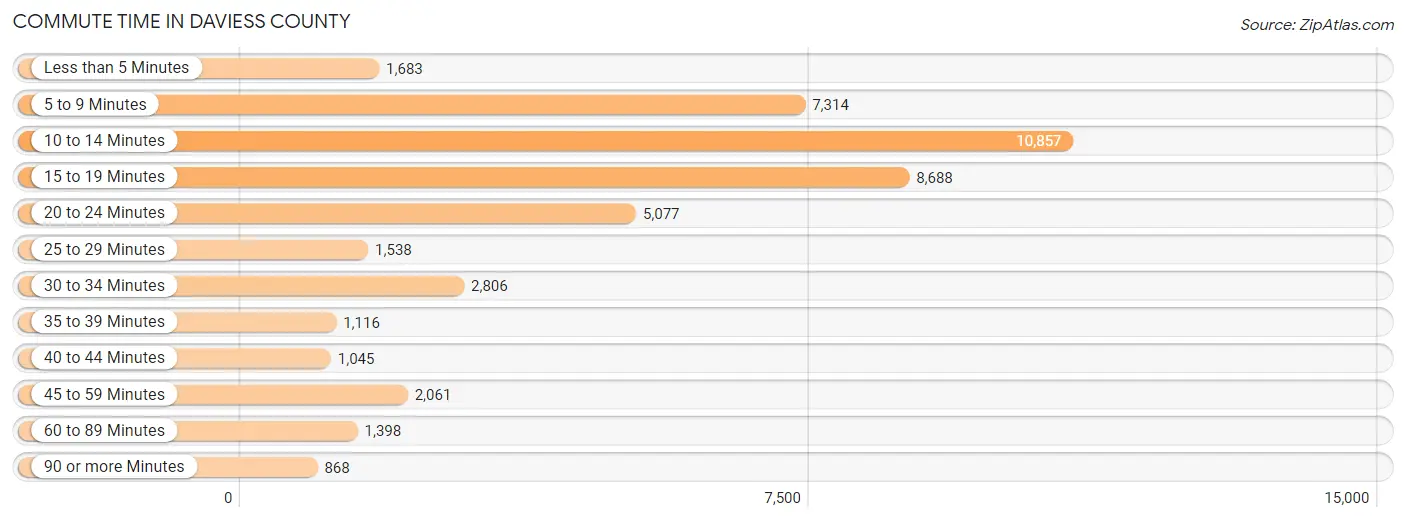
| Commute Time | # Commuters | % Commuters |
| Less than 5 Minutes | 1,683 | 3.8% |
| 5 to 9 Minutes | 7,314 | 16.5% |
| 10 to 14 Minutes | 10,857 | 24.4% |
| 15 to 19 Minutes | 8,688 | 19.6% |
| 20 to 24 Minutes | 5,077 | 11.4% |
| 25 to 29 Minutes | 1,538 | 3.5% |
| 30 to 34 Minutes | 2,806 | 6.3% |
| 35 to 39 Minutes | 1,116 | 2.5% |
| 40 to 44 Minutes | 1,045 | 2.4% |
| 45 to 59 Minutes | 2,061 | 4.6% |
| 60 to 89 Minutes | 1,398 | 3.2% |
| 90 or more Minutes | 868 | 1.9% |
Commute Time by Sex in Daviess County
The most common commute times in Daviess County are 10 to 14 minutes (5,288 commuters, 22.3%) for males and 10 to 14 minutes (5,569 commuters, 26.8%) for females.
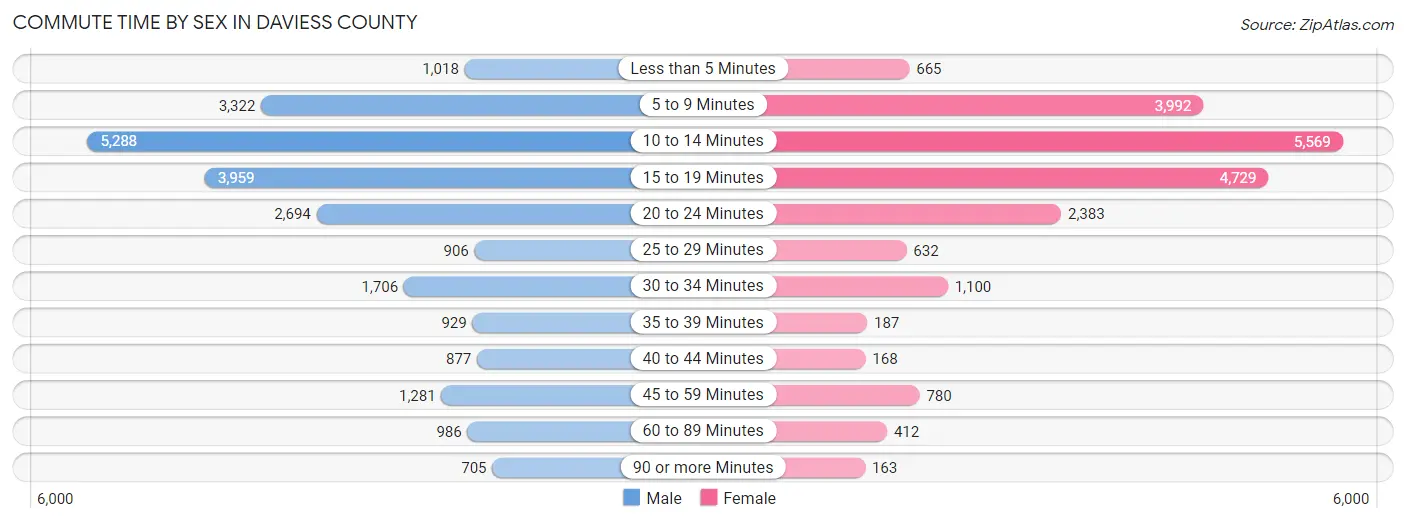
| Commute Time | Male | Female |
| Less than 5 Minutes | 1,018 (4.3%) | 665 (3.2%) |
| 5 to 9 Minutes | 3,322 (14.0%) | 3,992 (19.2%) |
| 10 to 14 Minutes | 5,288 (22.3%) | 5,569 (26.8%) |
| 15 to 19 Minutes | 3,959 (16.7%) | 4,729 (22.8%) |
| 20 to 24 Minutes | 2,694 (11.4%) | 2,383 (11.5%) |
| 25 to 29 Minutes | 906 (3.8%) | 632 (3.0%) |
| 30 to 34 Minutes | 1,706 (7.2%) | 1,100 (5.3%) |
| 35 to 39 Minutes | 929 (3.9%) | 187 (0.9%) |
| 40 to 44 Minutes | 877 (3.7%) | 168 (0.8%) |
| 45 to 59 Minutes | 1,281 (5.4%) | 780 (3.7%) |
| 60 to 89 Minutes | 986 (4.2%) | 412 (2.0%) |
| 90 or more Minutes | 705 (3.0%) | 163 (0.8%) |
Time of Departure to Work by Sex in Daviess County
The most frequent times of departure to work in Daviess County are 7:00 AM to 7:29 AM (2,921, 12.3%) for males and 7:30 AM to 7:59 AM (3,897, 18.8%) for females.
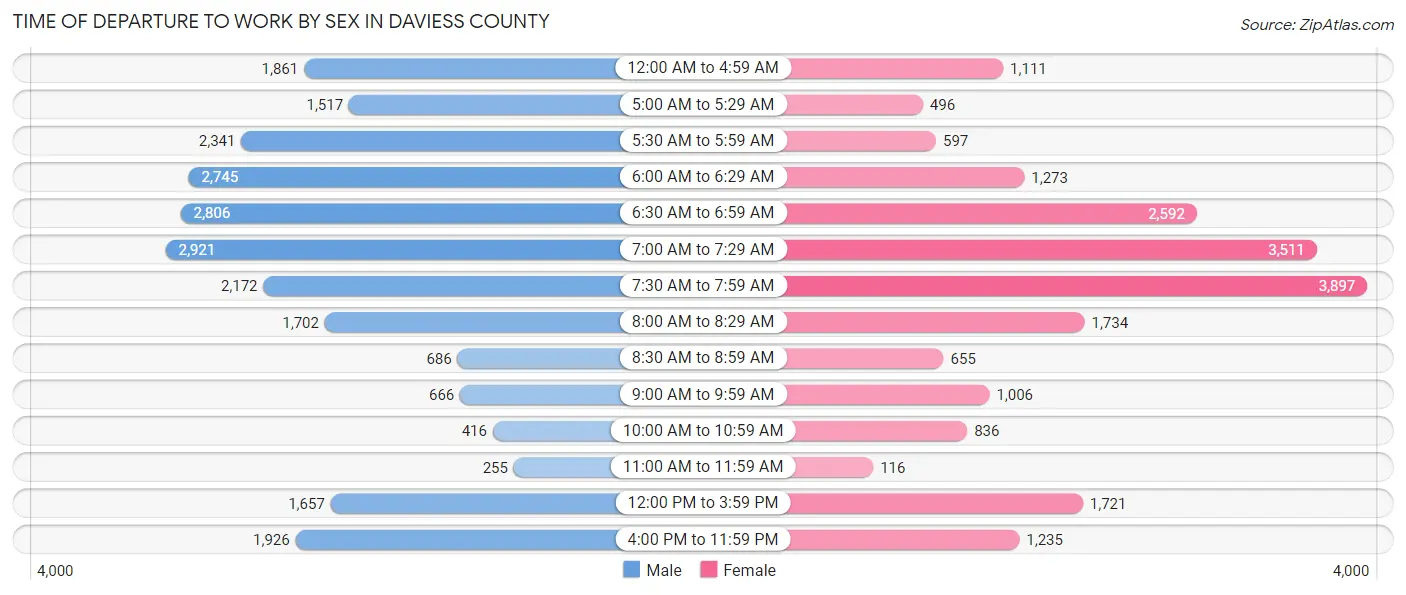
| Time of Departure | Male | Female |
| 12:00 AM to 4:59 AM | 1,861 (7.9%) | 1,111 (5.3%) |
| 5:00 AM to 5:29 AM | 1,517 (6.4%) | 496 (2.4%) |
| 5:30 AM to 5:59 AM | 2,341 (9.9%) | 597 (2.9%) |
| 6:00 AM to 6:29 AM | 2,745 (11.6%) | 1,273 (6.1%) |
| 6:30 AM to 6:59 AM | 2,806 (11.8%) | 2,592 (12.5%) |
| 7:00 AM to 7:29 AM | 2,921 (12.3%) | 3,511 (16.9%) |
| 7:30 AM to 7:59 AM | 2,172 (9.2%) | 3,897 (18.8%) |
| 8:00 AM to 8:29 AM | 1,702 (7.2%) | 1,734 (8.3%) |
| 8:30 AM to 8:59 AM | 686 (2.9%) | 655 (3.2%) |
| 9:00 AM to 9:59 AM | 666 (2.8%) | 1,006 (4.8%) |
| 10:00 AM to 10:59 AM | 416 (1.8%) | 836 (4.0%) |
| 11:00 AM to 11:59 AM | 255 (1.1%) | 116 (0.6%) |
| 12:00 PM to 3:59 PM | 1,657 (7.0%) | 1,721 (8.3%) |
| 4:00 PM to 11:59 PM | 1,926 (8.1%) | 1,235 (5.9%) |
| Total | 23,671 (100.0%) | 20,780 (100.0%) |
Housing Occupancy in Daviess County
Occupancy by Ownership in Daviess County
Of the total 40,722 dwellings in Daviess County, owner-occupied units account for 27,646 (67.9%), while renter-occupied units make up 13,076 (32.1%).
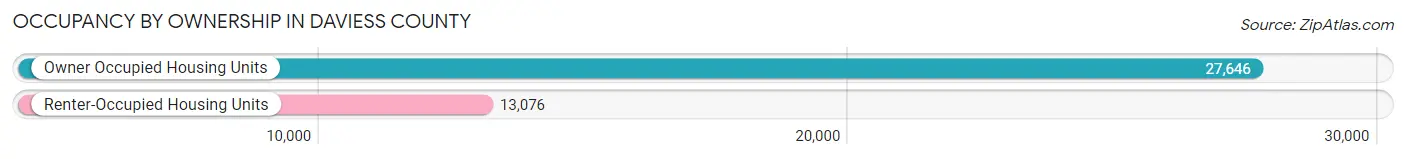
| Occupancy | # Housing Units | % Housing Units |
| Owner Occupied Housing Units | 27,646 | 67.9% |
| Renter-Occupied Housing Units | 13,076 | 32.1% |
| Total Occupied Housing Units | 40,722 | 100.0% |
Occupancy by Household Size in Daviess County
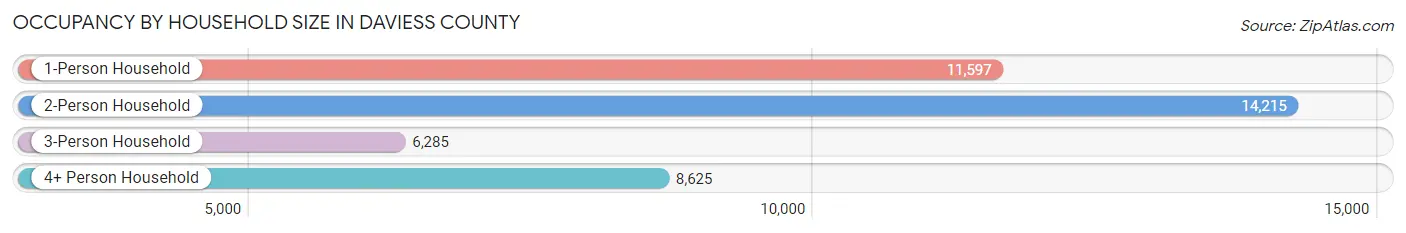
| Household Size | # Housing Units | % Housing Units |
| 1-Person Household | 11,597 | 28.5% |
| 2-Person Household | 14,215 | 34.9% |
| 3-Person Household | 6,285 | 15.4% |
| 4+ Person Household | 8,625 | 21.2% |
| Total Housing Units | 40,722 | 100.0% |
Occupancy by Ownership by Household Size in Daviess County
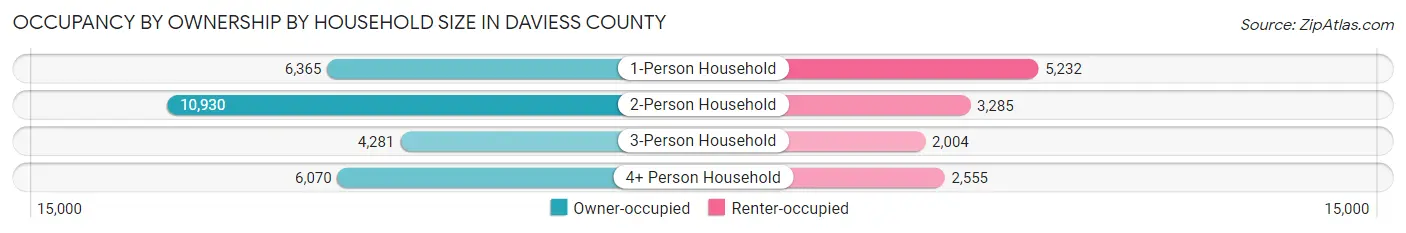
| Household Size | Owner-occupied | Renter-occupied |
| 1-Person Household | 6,365 (54.9%) | 5,232 (45.1%) |
| 2-Person Household | 10,930 (76.9%) | 3,285 (23.1%) |
| 3-Person Household | 4,281 (68.1%) | 2,004 (31.9%) |
| 4+ Person Household | 6,070 (70.4%) | 2,555 (29.6%) |
| Total Housing Units | 27,646 (67.9%) | 13,076 (32.1%) |
Occupancy by Educational Attainment in Daviess County
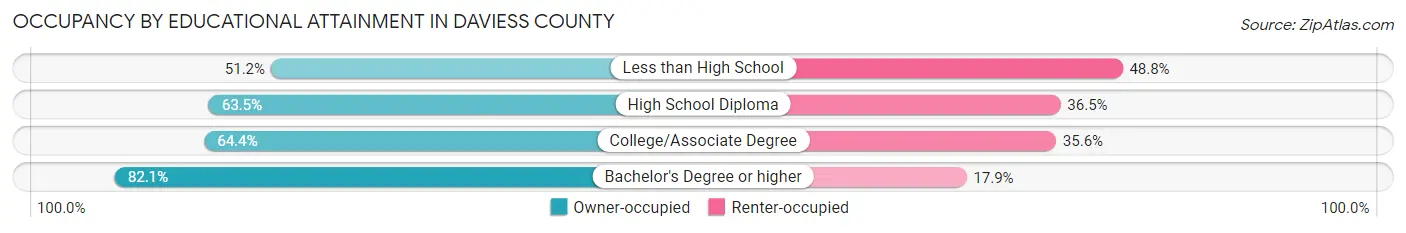
| Household Size | Owner-occupied | Renter-occupied |
| Less than High School | 1,535 (51.2%) | 1,465 (48.8%) |
| High School Diploma | 8,161 (63.5%) | 4,697 (36.5%) |
| College/Associate Degree | 8,941 (64.4%) | 4,950 (35.6%) |
| Bachelor's Degree or higher | 9,009 (82.1%) | 1,964 (17.9%) |
Occupancy by Age of Householder in Daviess County
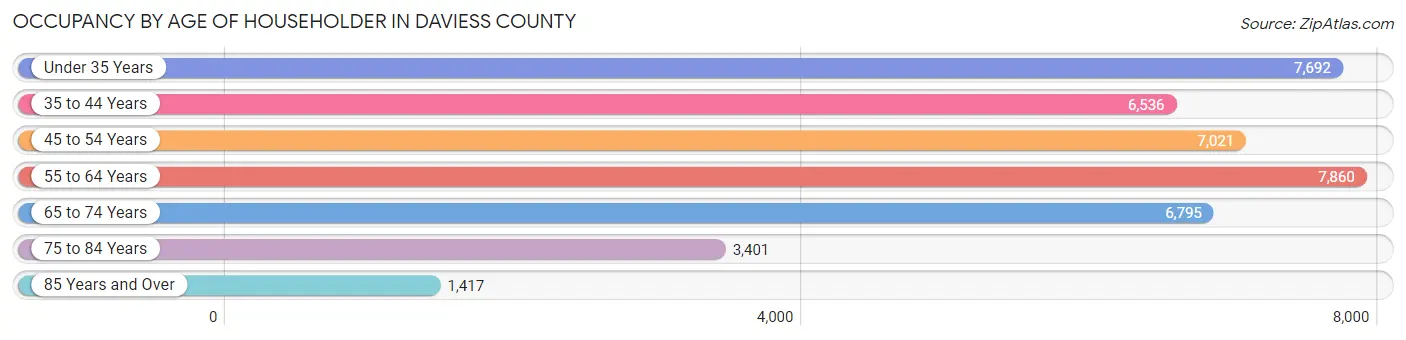
| Age Bracket | # Households | % Households |
| Under 35 Years | 7,692 | 18.9% |
| 35 to 44 Years | 6,536 | 16.1% |
| 45 to 54 Years | 7,021 | 17.2% |
| 55 to 64 Years | 7,860 | 19.3% |
| 65 to 74 Years | 6,795 | 16.7% |
| 75 to 84 Years | 3,401 | 8.4% |
| 85 Years and Over | 1,417 | 3.5% |
| Total | 40,722 | 100.0% |
Housing Finances in Daviess County
Median Income by Occupancy in Daviess County
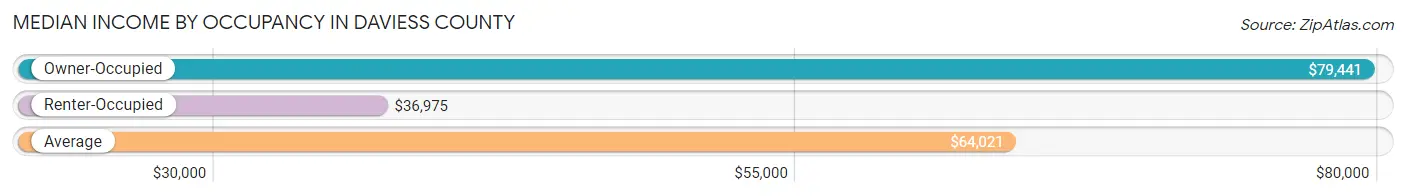
| Occupancy Type | # Households | Median Income |
| Owner-Occupied | 27,646 (67.9%) | $79,441 |
| Renter-Occupied | 13,076 (32.1%) | $36,975 |
| Average | 40,722 (100.0%) | $64,021 |
Occupancy by Householder Income Bracket in Daviess County
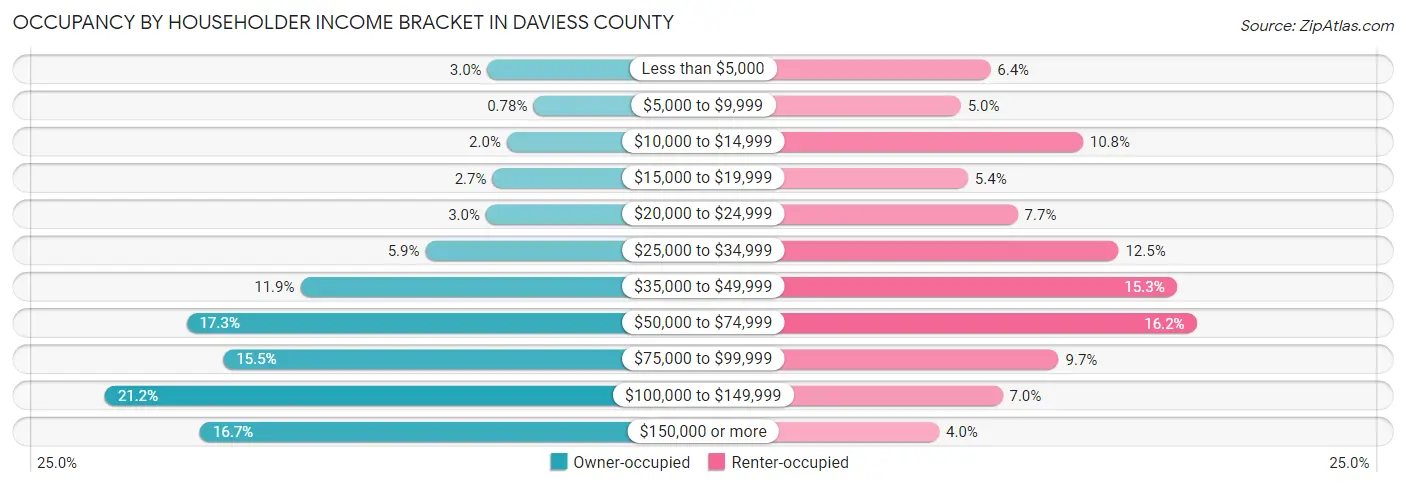
| Income Bracket | Owner-occupied | Renter-occupied |
| Less than $5,000 | 817 (3.0%) | 840 (6.4%) |
| $5,000 to $9,999 | 216 (0.8%) | 655 (5.0%) |
| $10,000 to $14,999 | 565 (2.0%) | 1,415 (10.8%) |
| $15,000 to $19,999 | 756 (2.7%) | 700 (5.3%) |
| $20,000 to $24,999 | 841 (3.0%) | 1,009 (7.7%) |
| $25,000 to $34,999 | 1,636 (5.9%) | 1,637 (12.5%) |
| $35,000 to $49,999 | 3,282 (11.9%) | 1,998 (15.3%) |
| $50,000 to $74,999 | 4,779 (17.3%) | 2,122 (16.2%) |
| $75,000 to $99,999 | 4,296 (15.5%) | 1,265 (9.7%) |
| $100,000 to $149,999 | 5,856 (21.2%) | 915 (7.0%) |
| $150,000 or more | 4,602 (16.7%) | 520 (4.0%) |
| Total | 27,646 (100.0%) | 13,076 (100.0%) |
Monthly Housing Cost Tiers in Daviess County
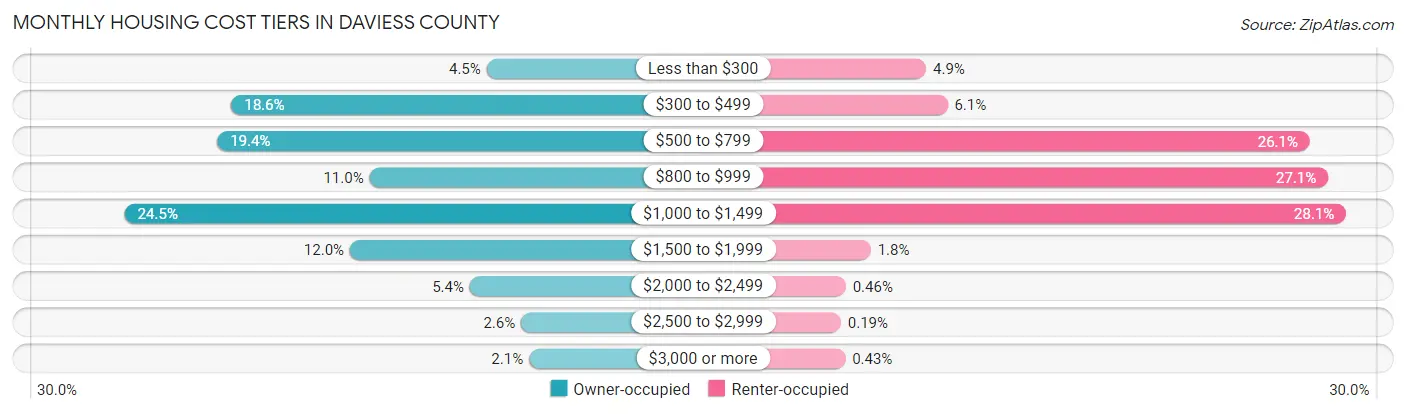
| Monthly Cost | Owner-occupied | Renter-occupied |
| Less than $300 | 1,239 (4.5%) | 641 (4.9%) |
| $300 to $499 | 5,138 (18.6%) | 795 (6.1%) |
| $500 to $799 | 5,352 (19.4%) | 3,412 (26.1%) |
| $800 to $999 | 3,027 (11.0%) | 3,543 (27.1%) |
| $1,000 to $1,499 | 6,767 (24.5%) | 3,675 (28.1%) |
| $1,500 to $1,999 | 3,325 (12.0%) | 240 (1.8%) |
| $2,000 to $2,499 | 1,495 (5.4%) | 60 (0.5%) |
| $2,500 to $2,999 | 712 (2.6%) | 25 (0.2%) |
| $3,000 or more | 591 (2.1%) | 56 (0.4%) |
| Total | 27,646 (100.0%) | 13,076 (100.0%) |
Physical Housing Characteristics in Daviess County
Housing Structures in Daviess County
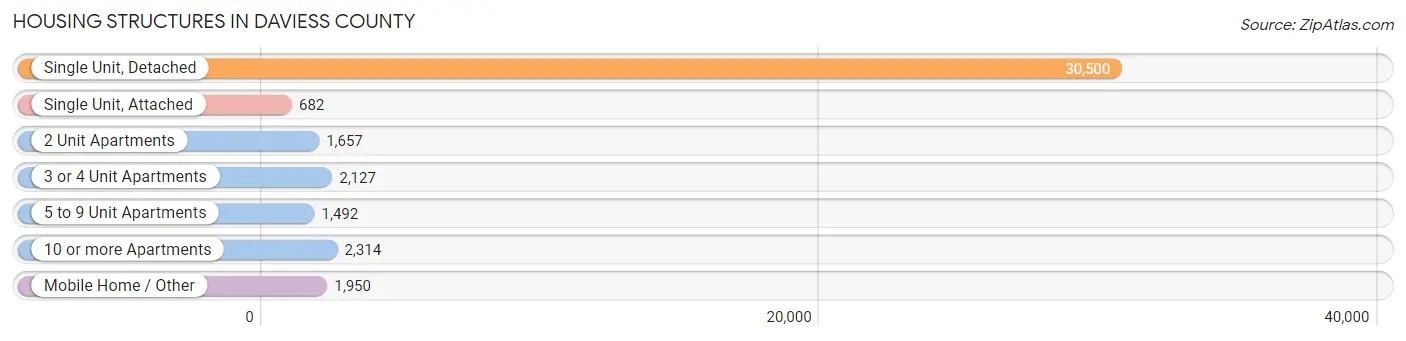
| Structure Type | # Housing Units | % Housing Units |
| Single Unit, Detached | 30,500 | 74.9% |
| Single Unit, Attached | 682 | 1.7% |
| 2 Unit Apartments | 1,657 | 4.1% |
| 3 or 4 Unit Apartments | 2,127 | 5.2% |
| 5 to 9 Unit Apartments | 1,492 | 3.7% |
| 10 or more Apartments | 2,314 | 5.7% |
| Mobile Home / Other | 1,950 | 4.8% |
| Total | 40,722 | 100.0% |
Housing Structures by Occupancy in Daviess County
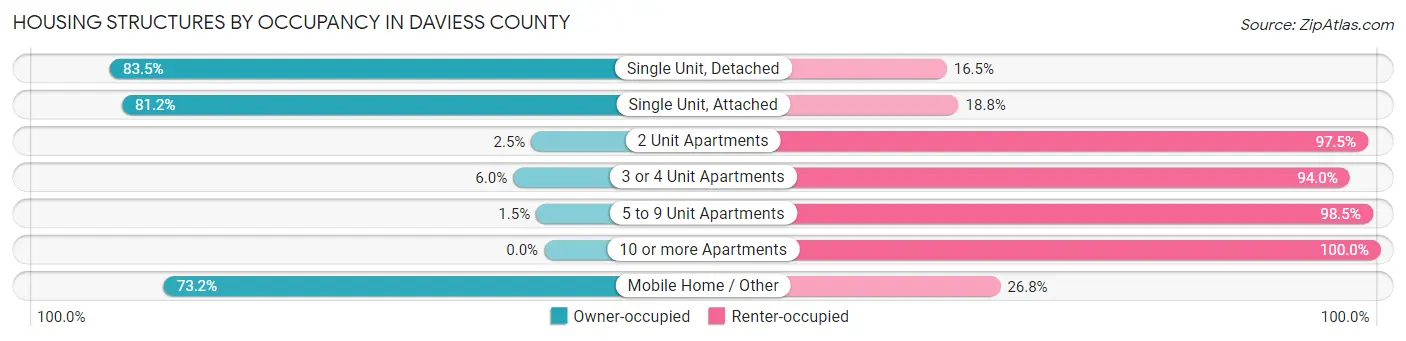
| Structure Type | Owner-occupied | Renter-occupied |
| Single Unit, Detached | 25,474 (83.5%) | 5,026 (16.5%) |
| Single Unit, Attached | 554 (81.2%) | 128 (18.8%) |
| 2 Unit Apartments | 41 (2.5%) | 1,616 (97.5%) |
| 3 or 4 Unit Apartments | 127 (6.0%) | 2,000 (94.0%) |
| 5 to 9 Unit Apartments | 23 (1.5%) | 1,469 (98.5%) |
| 10 or more Apartments | 0 (0.0%) | 2,314 (100.0%) |
| Mobile Home / Other | 1,427 (73.2%) | 523 (26.8%) |
| Total | 27,646 (67.9%) | 13,076 (32.1%) |
Housing Structures by Number of Rooms in Daviess County
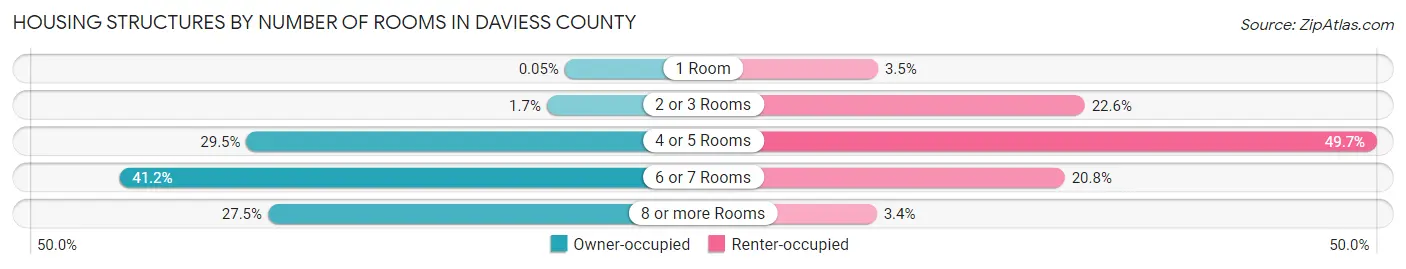
| Number of Rooms | Owner-occupied | Renter-occupied |
| 1 Room | 15 (0.1%) | 460 (3.5%) |
| 2 or 3 Rooms | 472 (1.7%) | 2,960 (22.6%) |
| 4 or 5 Rooms | 8,153 (29.5%) | 6,493 (49.7%) |
| 6 or 7 Rooms | 11,402 (41.2%) | 2,718 (20.8%) |
| 8 or more Rooms | 7,604 (27.5%) | 445 (3.4%) |
| Total | 27,646 (100.0%) | 13,076 (100.0%) |
Housing Structure by Heating Type in Daviess County
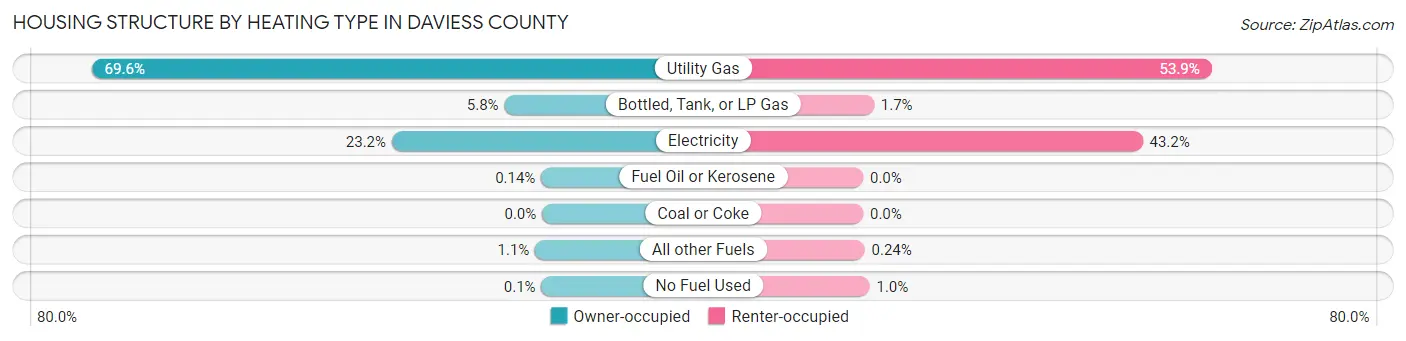
| Heating Type | Owner-occupied | Renter-occupied |
| Utility Gas | 19,249 (69.6%) | 7,046 (53.9%) |
| Bottled, Tank, or LP Gas | 1,613 (5.8%) | 218 (1.7%) |
| Electricity | 6,422 (23.2%) | 5,650 (43.2%) |
| Fuel Oil or Kerosene | 39 (0.1%) | 0 (0.0%) |
| Coal or Coke | 0 (0.0%) | 0 (0.0%) |
| All other Fuels | 295 (1.1%) | 31 (0.2%) |
| No Fuel Used | 28 (0.1%) | 131 (1.0%) |
| Total | 27,646 (100.0%) | 13,076 (100.0%) |
Household Vehicle Usage in Daviess County
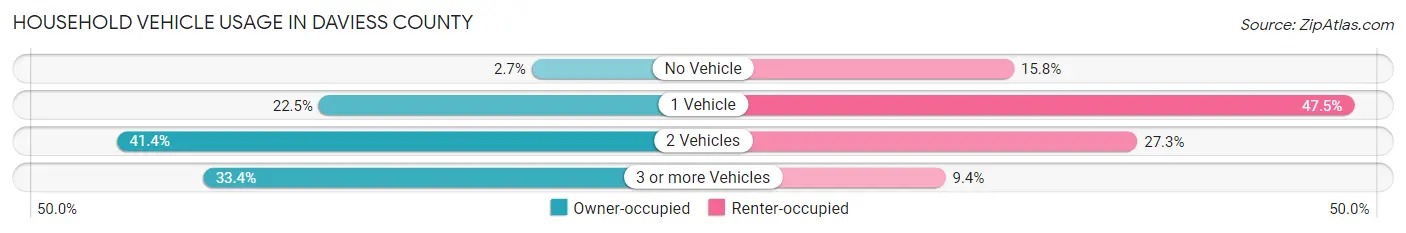
| Vehicles per Household | Owner-occupied | Renter-occupied |
| No Vehicle | 738 (2.7%) | 2,065 (15.8%) |
| 1 Vehicle | 6,231 (22.5%) | 6,215 (47.5%) |
| 2 Vehicles | 11,451 (41.4%) | 3,568 (27.3%) |
| 3 or more Vehicles | 9,226 (33.4%) | 1,228 (9.4%) |
| Total | 27,646 (100.0%) | 13,076 (100.0%) |
Real Estate & Mortgages in Daviess County
Real Estate and Mortgage Overview in Daviess County
| Characteristic | Without Mortgage | With Mortgage |
| Housing Units | 11,234 | 16,412 |
| Median Property Value | $155,500 | $180,100 |
| Median Household Income | $61,565 | $3,232 |
| Monthly Housing Costs | $477 | $580 |
| Real Estate Taxes | $1,317 | $440 |
Property Value by Mortgage Status in Daviess County
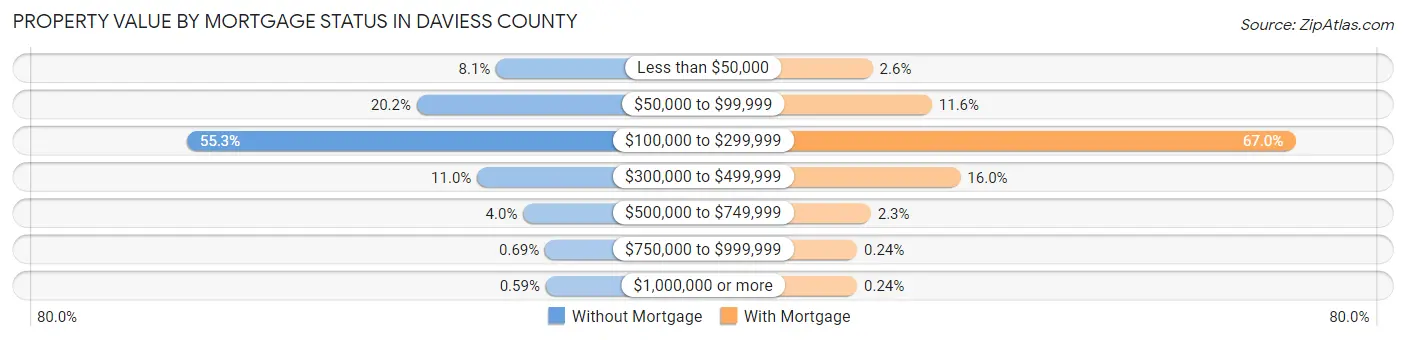
| Property Value | Without Mortgage | With Mortgage |
| Less than $50,000 | 915 (8.1%) | 428 (2.6%) |
| $50,000 to $99,999 | 2,274 (20.2%) | 1,908 (11.6%) |
| $100,000 to $299,999 | 6,209 (55.3%) | 10,993 (67.0%) |
| $300,000 to $499,999 | 1,240 (11.0%) | 2,623 (16.0%) |
| $500,000 to $749,999 | 452 (4.0%) | 380 (2.3%) |
| $750,000 to $999,999 | 78 (0.7%) | 40 (0.2%) |
| $1,000,000 or more | 66 (0.6%) | 40 (0.2%) |
| Total | 11,234 (100.0%) | 16,412 (100.0%) |
Household Income by Mortgage Status in Daviess County
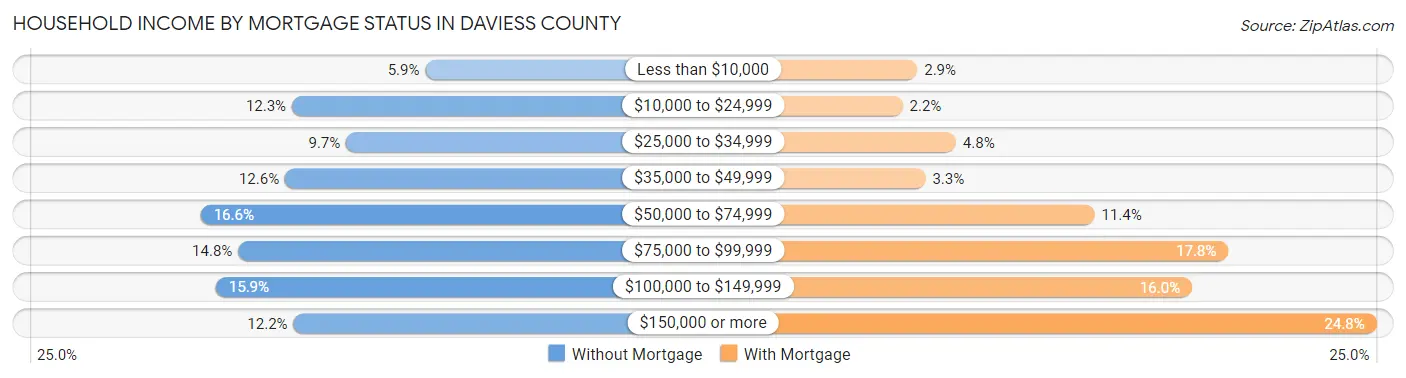
| Household Income | Without Mortgage | With Mortgage |
| Less than $10,000 | 665 (5.9%) | 483 (2.9%) |
| $10,000 to $24,999 | 1,378 (12.3%) | 368 (2.2%) |
| $25,000 to $34,999 | 1,089 (9.7%) | 784 (4.8%) |
| $35,000 to $49,999 | 1,415 (12.6%) | 547 (3.3%) |
| $50,000 to $74,999 | 1,866 (16.6%) | 1,867 (11.4%) |
| $75,000 to $99,999 | 1,666 (14.8%) | 2,913 (17.7%) |
| $100,000 to $149,999 | 1,785 (15.9%) | 2,630 (16.0%) |
| $150,000 or more | 1,370 (12.2%) | 4,071 (24.8%) |
| Total | 11,234 (100.0%) | 16,412 (100.0%) |
Property Value to Household Income Ratio in Daviess County
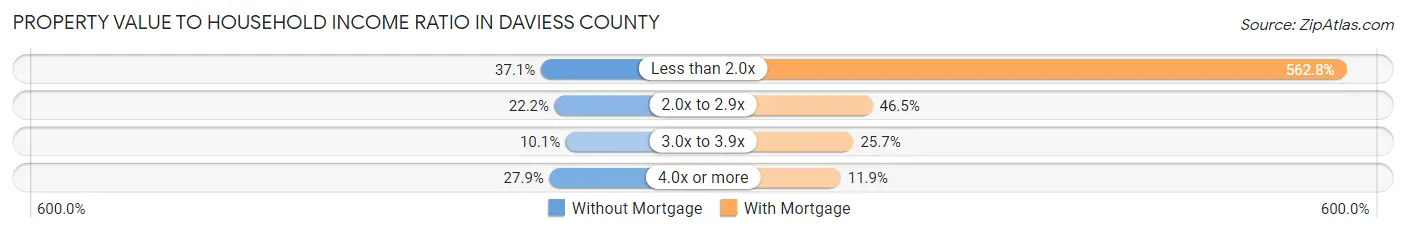
| Value-to-Income Ratio | Without Mortgage | With Mortgage |
| Less than 2.0x | 4,168 (37.1%) | 92,359 (562.8%) |
| 2.0x to 2.9x | 2,493 (22.2%) | 7,624 (46.5%) |
| 3.0x to 3.9x | 1,132 (10.1%) | 4,218 (25.7%) |
| 4.0x or more | 3,132 (27.9%) | 1,949 (11.9%) |
| Total | 11,234 (100.0%) | 16,412 (100.0%) |
Real Estate Taxes by Mortgage Status in Daviess County
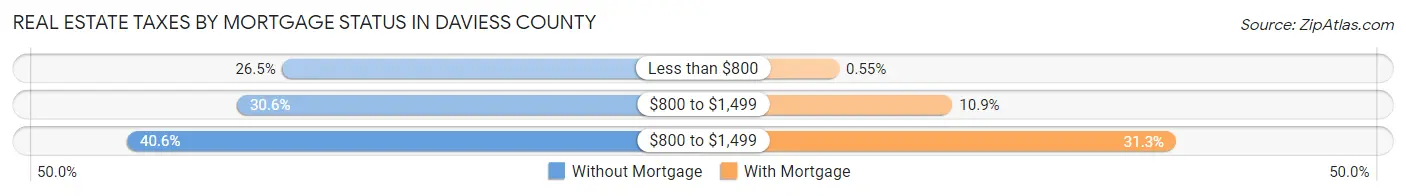
| Property Taxes | Without Mortgage | With Mortgage |
| Less than $800 | 2,981 (26.5%) | 90 (0.5%) |
| $800 to $1,499 | 3,438 (30.6%) | 1,789 (10.9%) |
| $800 to $1,499 | 4,565 (40.6%) | 5,139 (31.3%) |
| Total | 11,234 (100.0%) | 16,412 (100.0%) |
Health & Disability in Daviess County
Health Insurance Coverage by Age in Daviess County
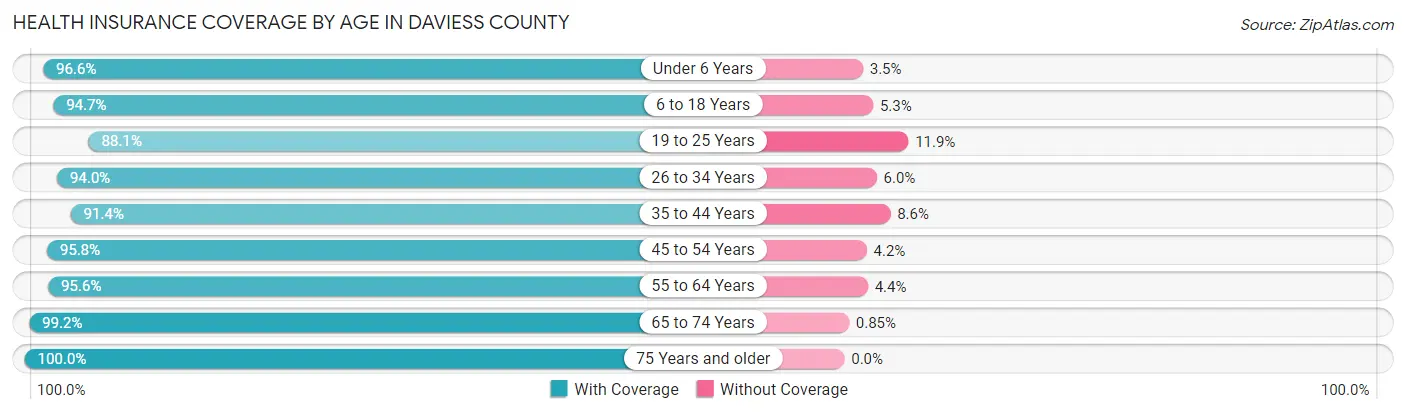
| Age Bracket | With Coverage | Without Coverage |
| Under 6 Years | 8,000 (96.6%) | 286 (3.5%) |
| 6 to 18 Years | 16,884 (94.7%) | 952 (5.3%) |
| 19 to 25 Years | 7,905 (88.1%) | 1,070 (11.9%) |
| 26 to 34 Years | 10,646 (94.0%) | 683 (6.0%) |
| 35 to 44 Years | 11,153 (91.4%) | 1,046 (8.6%) |
| 45 to 54 Years | 11,500 (95.8%) | 499 (4.2%) |
| 55 to 64 Years | 12,923 (95.6%) | 591 (4.4%) |
| 65 to 74 Years | 10,086 (99.2%) | 86 (0.9%) |
| 75 Years and older | 6,927 (100.0%) | 0 (0.0%) |
| Total | 96,024 (94.9%) | 5,213 (5.1%) |
Health Insurance Coverage by Citizenship Status in Daviess County
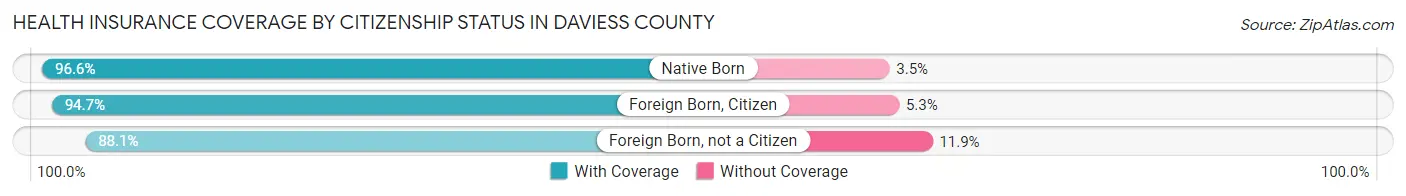
| Citizenship Status | With Coverage | Without Coverage |
| Native Born | 8,000 (96.6%) | 286 (3.5%) |
| Foreign Born, Citizen | 16,884 (94.7%) | 952 (5.3%) |
| Foreign Born, not a Citizen | 7,905 (88.1%) | 1,070 (11.9%) |
Health Insurance Coverage by Household Income in Daviess County
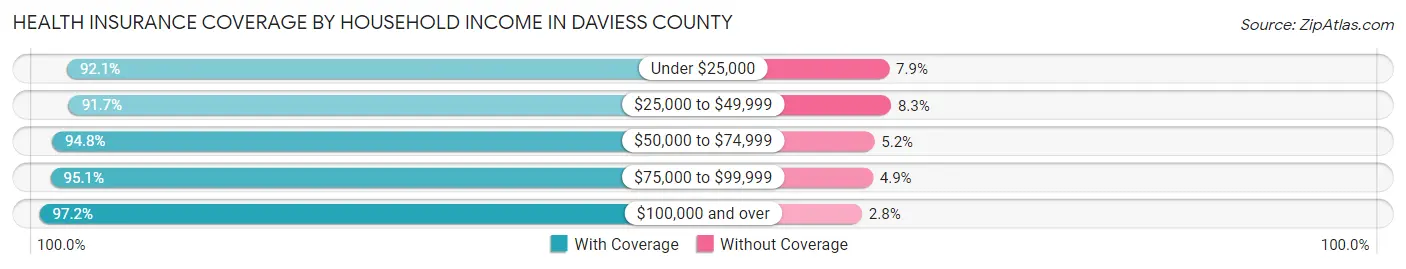
| Household Income | With Coverage | Without Coverage |
| Under $25,000 | 12,166 (92.1%) | 1,050 (7.9%) |
| $25,000 to $49,999 | 16,112 (91.7%) | 1,452 (8.3%) |
| $50,000 to $74,999 | 15,679 (94.8%) | 855 (5.2%) |
| $75,000 to $99,999 | 14,419 (95.1%) | 740 (4.9%) |
| $100,000 and over | 36,400 (97.2%) | 1,062 (2.8%) |
Public vs Private Health Insurance Coverage by Age in Daviess County
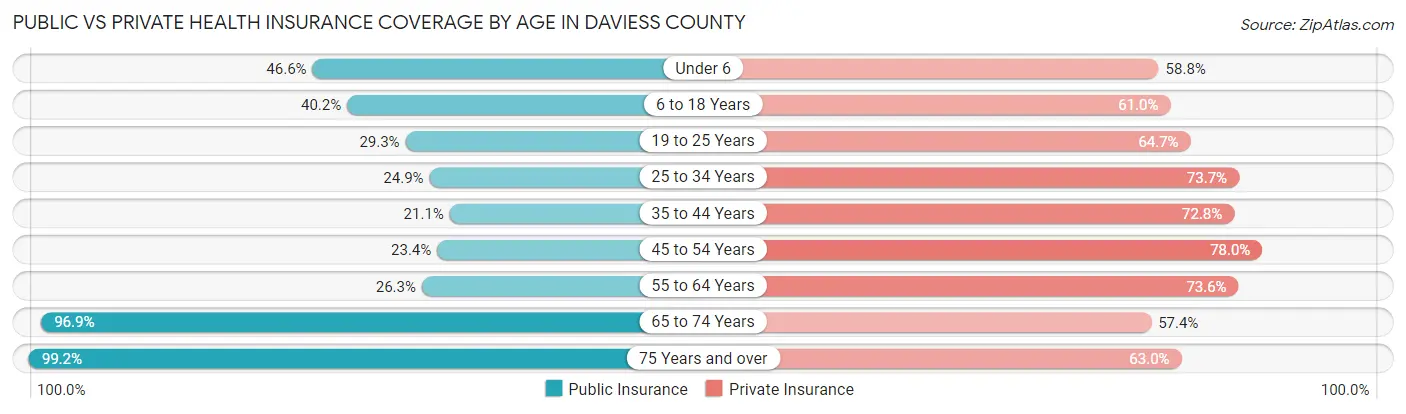
| Age Bracket | Public Insurance | Private Insurance |
| Under 6 | 3,860 (46.6%) | 4,873 (58.8%) |
| 6 to 18 Years | 7,161 (40.2%) | 10,876 (61.0%) |
| 19 to 25 Years | 2,631 (29.3%) | 5,808 (64.7%) |
| 25 to 34 Years | 2,816 (24.9%) | 8,350 (73.7%) |
| 35 to 44 Years | 2,574 (21.1%) | 8,882 (72.8%) |
| 45 to 54 Years | 2,811 (23.4%) | 9,363 (78.0%) |
| 55 to 64 Years | 3,550 (26.3%) | 9,949 (73.6%) |
| 65 to 74 Years | 9,858 (96.9%) | 5,842 (57.4%) |
| 75 Years and over | 6,872 (99.2%) | 4,366 (63.0%) |
| Total | 42,133 (41.6%) | 68,309 (67.5%) |
Disability Status by Sex by Age in Daviess County
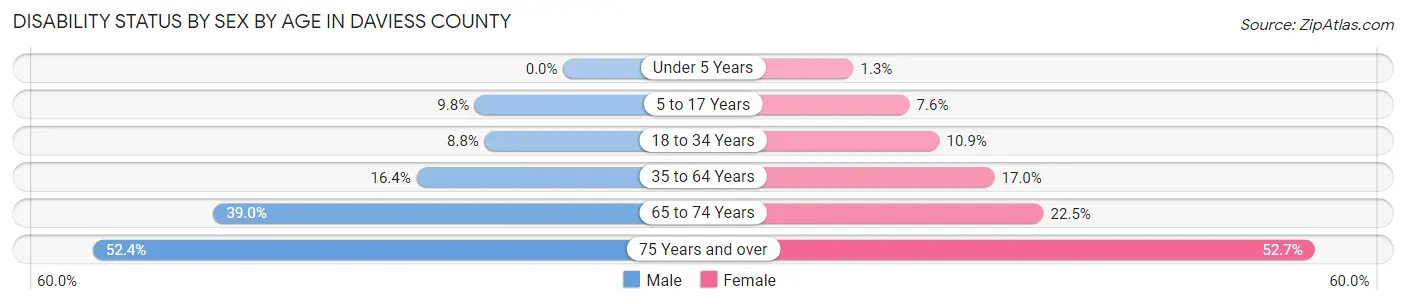
| Age Bracket | Male | Female |
| Under 5 Years | 0 (0.0%) | 42 (1.3%) |
| 5 to 17 Years | 921 (9.8%) | 679 (7.6%) |
| 18 to 34 Years | 939 (8.8%) | 1,170 (10.9%) |
| 35 to 64 Years | 3,039 (16.4%) | 3,255 (17.0%) |
| 65 to 74 Years | 1,847 (39.0%) | 1,221 (22.5%) |
| 75 Years and over | 1,456 (52.4%) | 2,184 (52.6%) |
Disability Class by Sex by Age in Daviess County
Disability Class: Hearing Difficulty
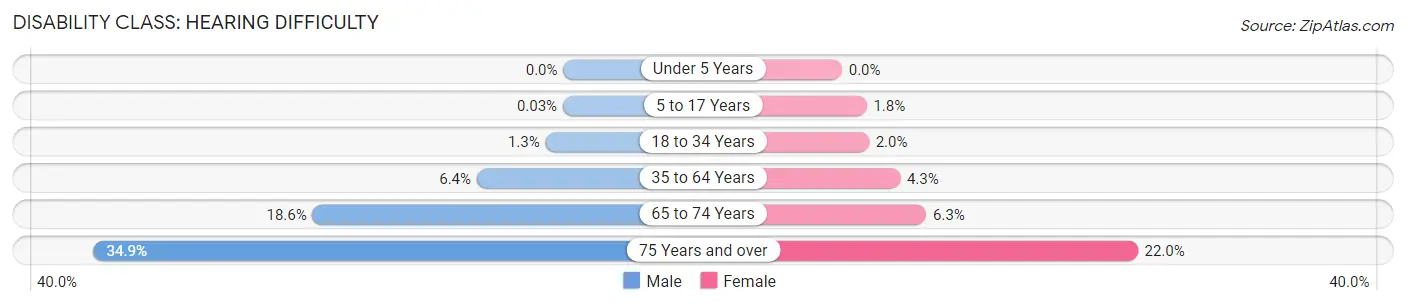
| Age Bracket | Male | Female |
| Under 5 Years | 0 (0.0%) | 0 (0.0%) |
| 5 to 17 Years | 3 (0.0%) | 164 (1.8%) |
| 18 to 34 Years | 141 (1.3%) | 215 (2.0%) |
| 35 to 64 Years | 1,193 (6.4%) | 826 (4.3%) |
| 65 to 74 Years | 883 (18.6%) | 340 (6.3%) |
| 75 Years and over | 969 (34.9%) | 911 (22.0%) |
Disability Class: Vision Difficulty
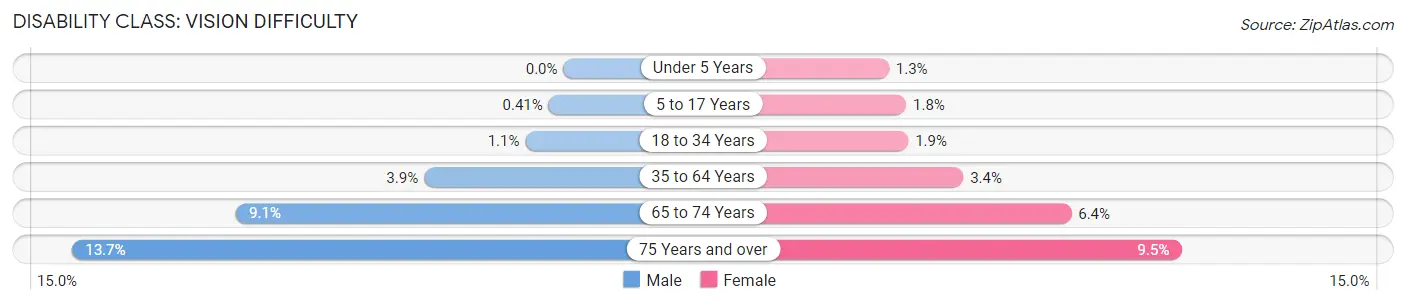
| Age Bracket | Male | Female |
| Under 5 Years | 0 (0.0%) | 42 (1.3%) |
| 5 to 17 Years | 38 (0.4%) | 161 (1.8%) |
| 18 to 34 Years | 114 (1.1%) | 199 (1.8%) |
| 35 to 64 Years | 721 (3.9%) | 646 (3.4%) |
| 65 to 74 Years | 432 (9.1%) | 347 (6.4%) |
| 75 Years and over | 380 (13.7%) | 392 (9.5%) |
Disability Class: Cognitive Difficulty
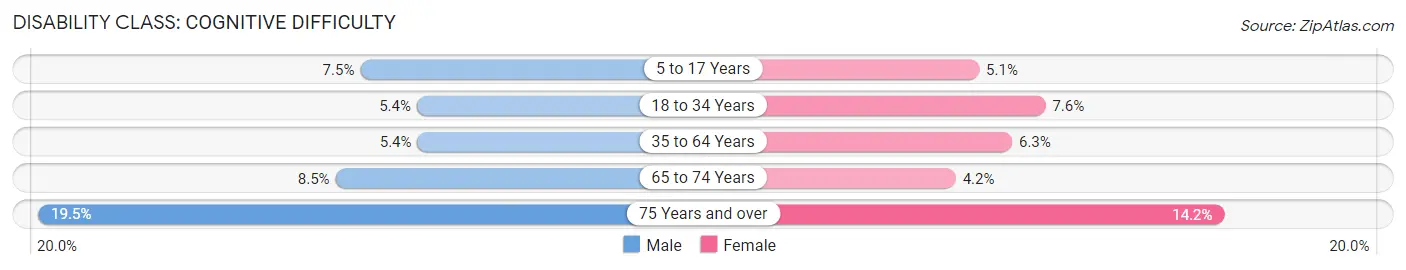
| Age Bracket | Male | Female |
| 5 to 17 Years | 705 (7.5%) | 458 (5.1%) |
| 18 to 34 Years | 583 (5.4%) | 812 (7.6%) |
| 35 to 64 Years | 1,008 (5.4%) | 1,209 (6.3%) |
| 65 to 74 Years | 401 (8.5%) | 230 (4.2%) |
| 75 Years and over | 542 (19.5%) | 589 (14.2%) |
Disability Class: Ambulatory Difficulty
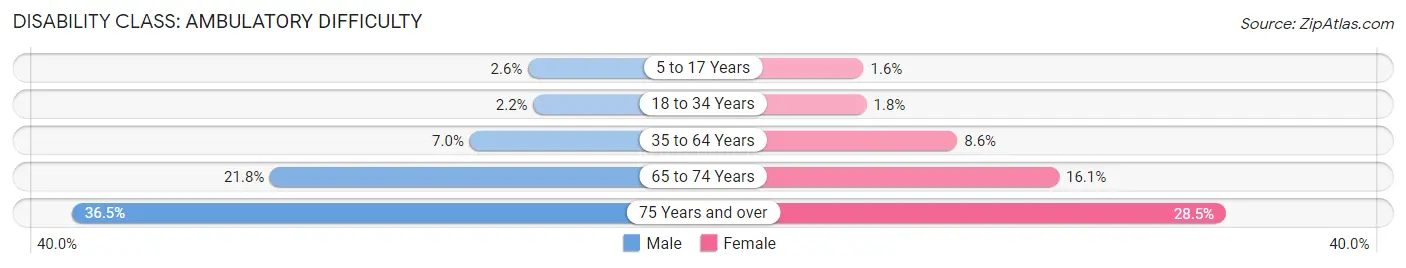
| Age Bracket | Male | Female |
| 5 to 17 Years | 244 (2.6%) | 145 (1.6%) |
| 18 to 34 Years | 238 (2.2%) | 198 (1.8%) |
| 35 to 64 Years | 1,291 (7.0%) | 1,642 (8.6%) |
| 65 to 74 Years | 1,032 (21.8%) | 876 (16.1%) |
| 75 Years and over | 1,014 (36.5%) | 1,183 (28.5%) |
Disability Class: Self-Care Difficulty
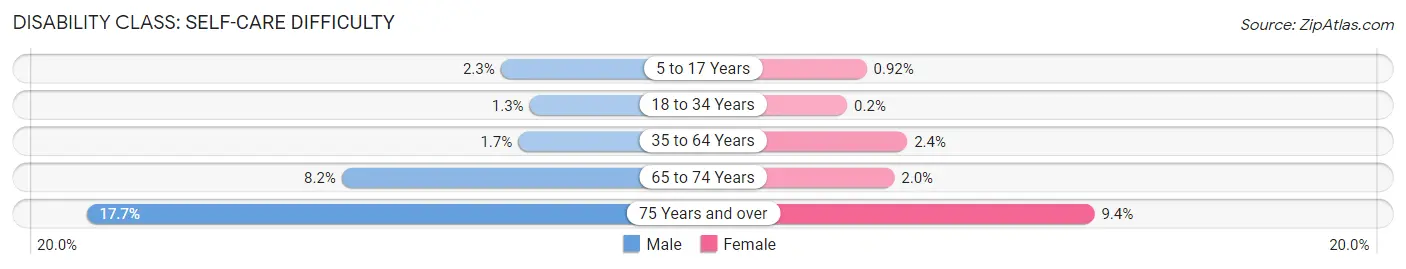
| Age Bracket | Male | Female |
| 5 to 17 Years | 218 (2.3%) | 83 (0.9%) |
| 18 to 34 Years | 135 (1.3%) | 21 (0.2%) |
| 35 to 64 Years | 313 (1.7%) | 464 (2.4%) |
| 65 to 74 Years | 390 (8.2%) | 106 (1.9%) |
| 75 Years and over | 492 (17.7%) | 389 (9.4%) |
Technology Access in Daviess County
Computing Device Access in Daviess County
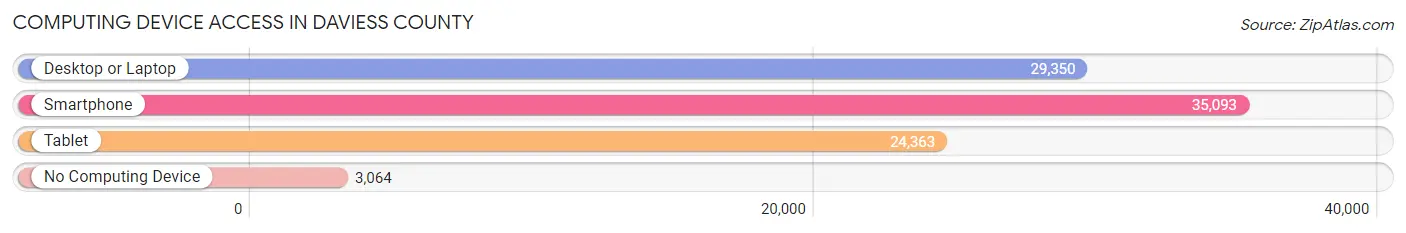
| Device Type | # Households | % Households |
| Desktop or Laptop | 29,350 | 72.1% |
| Smartphone | 35,093 | 86.2% |
| Tablet | 24,363 | 59.8% |
| No Computing Device | 3,064 | 7.5% |
| Total | 40,722 | 100.0% |
Internet Access in Daviess County
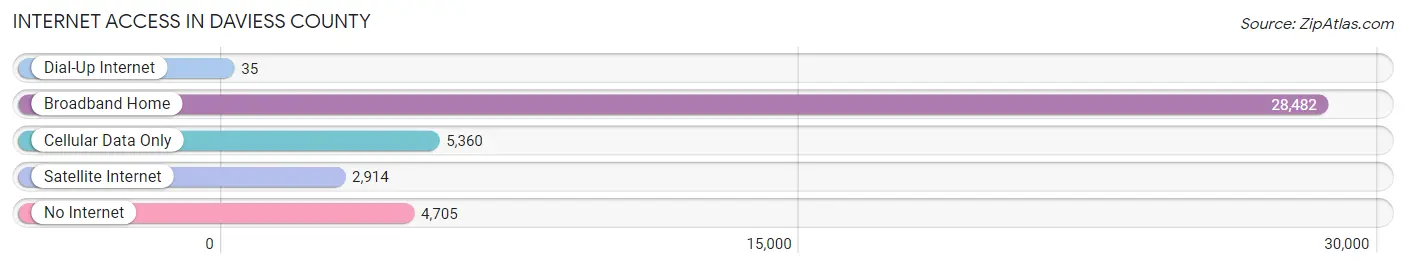
| Internet Type | # Households | % Households |
| Dial-Up Internet | 35 | 0.1% |
| Broadband Home | 28,482 | 69.9% |
| Cellular Data Only | 5,360 | 13.2% |
| Satellite Internet | 2,914 | 7.2% |
| No Internet | 4,705 | 11.6% |
| Total | 40,722 | 100.0% |
Daviess County Summary
Daviess County is located in the western part of the state of Kentucky, in the United States. It is bordered by Ohio County to the north, Hancock County to the east, McLean County to the south, and Henderson County to the west. The county seat is Owensboro, which is also the largest city in the county. The county was established in 1815 and named after Major Joseph Hamilton Daveiss, a Kentucky soldier who was killed in the Battle of Tippecanoe in 1811.
Geography
Daviess County is located in the Western Coal Fields region of Kentucky. The county has a total area of 517 square miles, of which 514 square miles is land and 3 square miles is water. The county is drained by the Green River, which flows through the county from north to south. The highest point in the county is located in the northern part of the county, near the Ohio County line, and has an elevation of 890 feet.
The county is mostly rural, with the majority of the population living in the county seat of Owensboro. Other towns in the county include Whitesville, Maceo, Knottsville, and Utica.
Demographics
As of the 2010 United States Census, there were 96,656 people, 37,945 households, and 25,945 families residing in the county. The population density was 188.2 people per square mile. The racial makeup of the county was 93.2% White, 4.2% Black or African American, 0.3% Native American, 0.7% Asian, 0.2% Pacific Islander, 0.6% from other races, and 0.9% from two or more races. Hispanic or Latino of any race were 1.6% of the population.
The median income for a household in the county was $41,945, and the median income for a family was $50,945. The per capita income for the county was $21,845. About 11.2% of families and 14.2% of the population were below the poverty line, including 19.2% of those under age 18 and 10.2% of those age 65 or over.
Economy
Daviess County is home to a variety of industries, including manufacturing, healthcare, education, and tourism. The county is home to several large employers, including Owensboro Medical Health System, Owensboro Community and Technical College, and Owensboro Public Schools.
The county is also home to several tourist attractions, including the International Bluegrass Music Museum, the Owensboro Museum of Science and History, and the Owensboro Riverfront. The county is also home to several wineries, including the Kentucky Winery and the Kentucky River Winery.
Conclusion
Daviess County is a rural county located in the western part of Kentucky. It is home to a variety of industries, including manufacturing, healthcare, education, and tourism. The county is also home to several tourist attractions, including the International Bluegrass Music Museum, the Owensboro Museum of Science and History, and the Owensboro Riverfront. The county has a population of 96,656, with a median household income of $41,945 and a median family income of $50,945.
Common Questions
What is the Total Population of Daviess County?
Total Population of Daviess County is 102,916.
What is the Total Male Population of Daviess County?
Total Male Population of Daviess County is 50,574.
What is the Total Female Population of Daviess County?
Total Female Population of Daviess County is 52,342.
What is the Ratio of Males per 100 Females in Daviess County?
There are 96.62 Males per 100 Females in Daviess County.
What is the Ratio of Females per 100 Males in Daviess County?
There are 103.50 Females per 100 Males in Daviess County.
What is the Median Population Age in Daviess County?
Median Population Age in Daviess County is 38.7 Years.
What is the Average Family Size in Daviess County
Average Family Size in Daviess County is 3.0 People.
What is the Average Household Size in Daviess County
Average Household Size in Daviess County is 2.5 People.
What is Per Capita Income in Daviess County?
Per Capita income in Daviess County is $33,599.
What is the Median Family Income in Daviess County?
Median Family Income in Daviess County is $79,966.
What is the Median Household income in Daviess County?
Median Household Income in Daviess County is $64,021.
What is Income or Wage Gap in Daviess County?
Income or Wage Gap in Daviess County is 34.0%.
Women in Daviess County earn 66.0 cents for every dollar earned by a man.
What is Family Income Deficit in Daviess County?
Family Income Deficit in Daviess County is $12,037.
Families that are below poverty line in Daviess County earn $12,037 less on average than the poverty threshold level.
What is Inequality or Gini Index in Daviess County?
Inequality or Gini Index in Daviess County is 0.46.
How Large is the Labor Force in Daviess County?
There are 49,513 People in the Labor Forcein in Daviess County.
What is the Percentage of People in the Labor Force in Daviess County?
61.6% of People are in the Labor Force in Daviess County.
What is the Unemployment Rate in Daviess County?
Unemployment Rate in Daviess County is 4.1%.