Cumberland County, KY
Cumberland County Map

Cumberland County Overview
5,974
TOTAL POPULATION
2,925
MALE POPULATION
3,049
FEMALE POPULATION
95.93
MALES / 100 FEMALES
104.24
FEMALES / 100 MALES
45.4
MEDIAN AGE
3.3
AVG FAMILY SIZE
2.3
AVG HOUSEHOLD SIZE
$22,668
PER CAPITA INCOME
$56,489
AVG FAMILY INCOME
$40,515
AVG HOUSEHOLD INCOME
31.5%
WAGE / INCOME GAP [ % ]
68.5¢/ $1
WAGE / INCOME GAP [ $ ]
$8,100
FAMILY INCOME DEFICIT
0.46
INEQUALITY / GINI INDEX
2,454
LABOR FORCE [ PEOPLE ]
51.3%
PERCENT IN LABOR FORCE
3.8%
UNEMPLOYMENT RATE
Cumberland County Area Codes
Race in Cumberland County
The most populous races in Cumberland County are White / Caucasian (5,562 | 93.1%), Black / African American (162 | 2.7%), and Two or more Races (122 | 2.0%).

| Race | # Population | % Population |
| Asian | 49 | 0.8% |
| Black / African American | 162 | 2.7% |
| Hawaiian / Pacific | 0 | 0.0% |
| Hispanic or Latino | 105 | 1.8% |
| Native / Alaskan | 15 | 0.3% |
| White / Caucasian | 5,562 | 93.1% |
| Two or more Races | 122 | 2.0% |
| Some other Race | 64 | 1.1% |
| Total | 5,974 | 100.0% |
Ancestry in Cumberland County
The most populous ancestries reported in Cumberland County are English (1,295 | 21.7%), German (825 | 13.8%), American (782 | 13.1%), Irish (471 | 7.9%), and Scotch-Irish (138 | 2.3%), together accounting for 58.8% of all Cumberland County residents.

| Ancestry | # Population | % Population |
| African | 32 | 0.5% |
| American | 782 | 13.1% |
| Australian | 6 | 0.1% |
| Belgian | 37 | 0.6% |
| Blackfeet | 10 | 0.2% |
| British | 16 | 0.3% |
| Canadian | 9 | 0.2% |
| Central American | 16 | 0.3% |
| Cherokee | 21 | 0.4% |
| Cheyenne | 1 | 0.0% |
| Dominican | 28 | 0.5% |
| Dutch | 25 | 0.4% |
| English | 1,295 | 21.7% |
| European | 110 | 1.8% |
| French | 15 | 0.3% |
| French Canadian | 13 | 0.2% |
| German | 825 | 13.8% |
| Hungarian | 17 | 0.3% |
| Irish | 471 | 7.9% |
| Iroquois | 10 | 0.2% |
| Italian | 19 | 0.3% |
| Korean | 81 | 1.4% |
| Mexican | 54 | 0.9% |
| Northern European | 4 | 0.1% |
| Norwegian | 17 | 0.3% |
| Polish | 33 | 0.5% |
| Puerto Rican | 7 | 0.1% |
| Salvadoran | 16 | 0.3% |
| Scotch-Irish | 138 | 2.3% |
| Scottish | 131 | 2.2% |
| Subsaharan African | 32 | 0.5% |
| Swedish | 23 | 0.4% |
| Swiss | 99 | 1.7% |
| Thai | 20 | 0.3% |
| Welsh | 7 | 0.1% | View All 35 Rows |
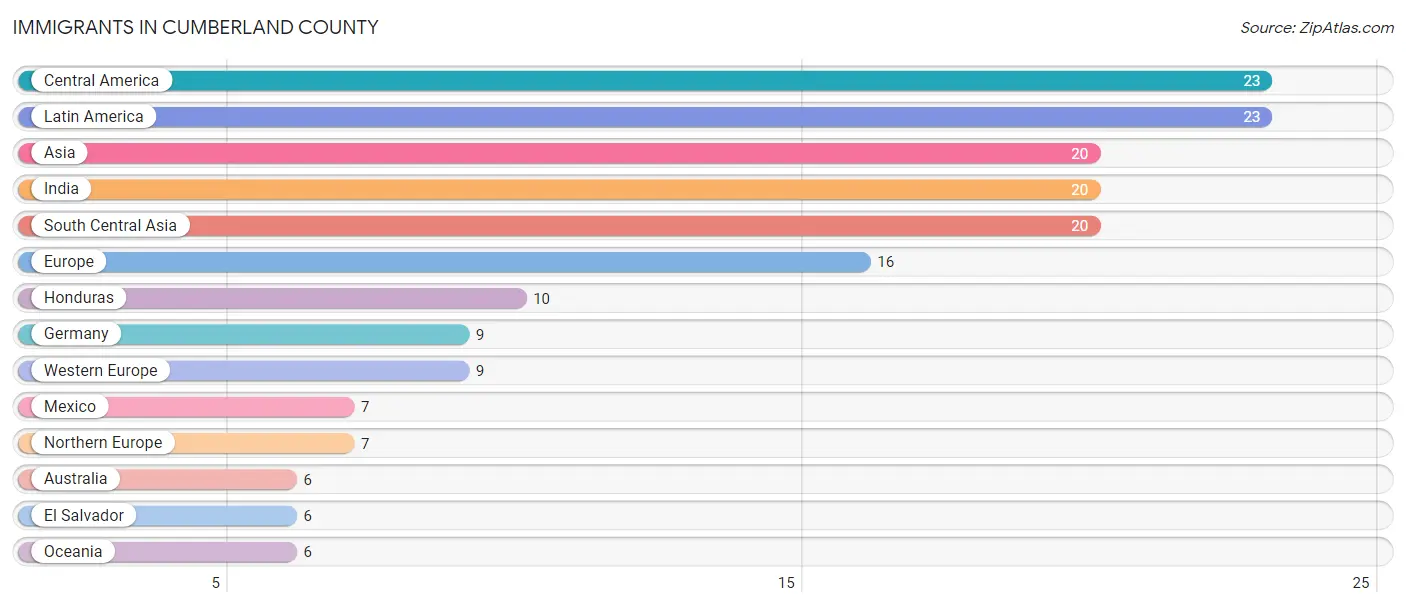
Immigrants in Cumberland County
The most numerous immigrant groups reported in Cumberland County came from Central America (23 | 0.4%), Latin America (23 | 0.4%), Asia (20 | 0.3%), India (20 | 0.3%), and South Central Asia (20 | 0.3%), together accounting for 1.8% of all Cumberland County residents.
| Immigration Origin | # Population | % Population |
| Asia | 20 | 0.3% |
| Australia | 6 | 0.1% |
| Central America | 23 | 0.4% |
| El Salvador | 6 | 0.1% |
| Europe | 16 | 0.3% |
| Germany | 9 | 0.2% |
| Honduras | 10 | 0.2% |
| India | 20 | 0.3% |
| Latin America | 23 | 0.4% |
| Mexico | 7 | 0.1% |
| Northern Europe | 7 | 0.1% |
| Oceania | 6 | 0.1% |
| South Central Asia | 20 | 0.3% |
| Western Europe | 9 | 0.2% | View All 14 Rows |
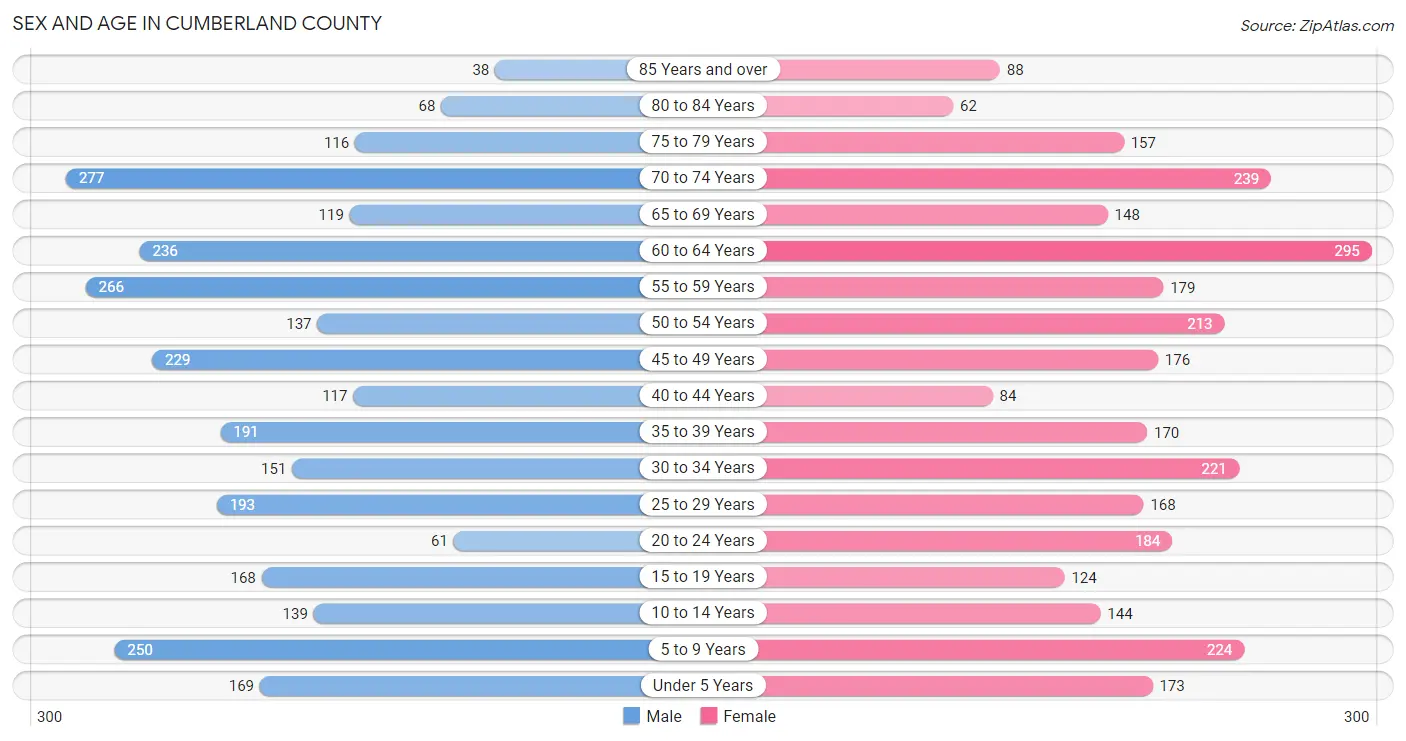
Sex and Age in Cumberland County
Sex and Age in Cumberland County
The most populous age groups in Cumberland County are 70 to 74 Years (277 | 9.5%) for men and 60 to 64 Years (295 | 9.7%) for women.
| Age Bracket | Male | Female |
| Under 5 Years | 169 (5.8%) | 173 (5.7%) |
| 5 to 9 Years | 250 (8.6%) | 224 (7.3%) |
| 10 to 14 Years | 139 (4.8%) | 144 (4.7%) |
| 15 to 19 Years | 168 (5.7%) | 124 (4.1%) |
| 20 to 24 Years | 61 (2.1%) | 184 (6.0%) |
| 25 to 29 Years | 193 (6.6%) | 168 (5.5%) |
| 30 to 34 Years | 151 (5.2%) | 221 (7.2%) |
| 35 to 39 Years | 191 (6.5%) | 170 (5.6%) |
| 40 to 44 Years | 117 (4.0%) | 84 (2.8%) |
| 45 to 49 Years | 229 (7.8%) | 176 (5.8%) |
| 50 to 54 Years | 137 (4.7%) | 213 (7.0%) |
| 55 to 59 Years | 266 (9.1%) | 179 (5.9%) |
| 60 to 64 Years | 236 (8.1%) | 295 (9.7%) |
| 65 to 69 Years | 119 (4.1%) | 148 (4.9%) |
| 70 to 74 Years | 277 (9.5%) | 239 (7.8%) |
| 75 to 79 Years | 116 (4.0%) | 157 (5.1%) |
| 80 to 84 Years | 68 (2.3%) | 62 (2.0%) |
| 85 Years and over | 38 (1.3%) | 88 (2.9%) |
| Total | 2,925 (100.0%) | 3,049 (100.0%) |
Families and Households in Cumberland County
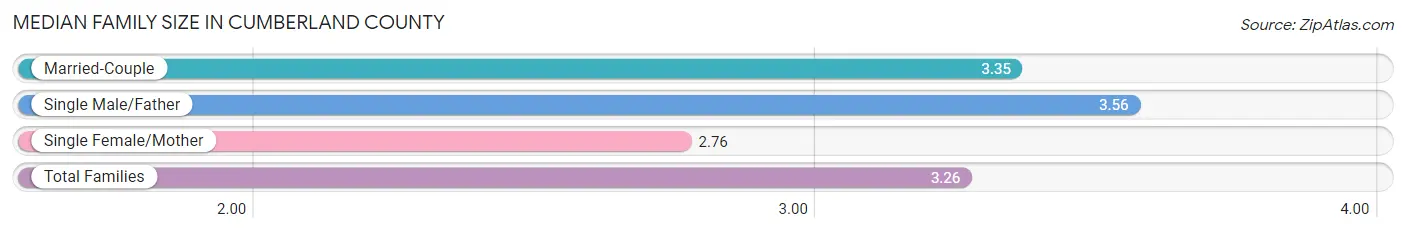
Median Family Size in Cumberland County
The median family size in Cumberland County is 3.26 persons per family, with single male/father families (115 | 8.3%) accounting for the largest median family size of 3.56 persons per family. On the other hand, single female/mother families (254 | 18.4%) represent the smallest median family size with 2.76 persons per family.
| Family Type | # Families | Family Size |
| Married-Couple | 1,011 (73.3%) | 3.35 |
| Single Male/Father | 115 (8.3%) | 3.56 |
| Single Female/Mother | 254 (18.4%) | 2.76 |
| Total Families | 1,380 (100.0%) | 3.26 |
Median Household Size in Cumberland County
The median household size in Cumberland County is 2.34 persons per household, with single male/father households (115 | 4.6%) accounting for the largest median household size of 3.83 persons per household. non-family households (1,139 | 45.2%) represent the smallest median household size with 1.13 persons per household.

| Household Type | # Households | Household Size |
| Married-Couple | 1,011 (40.1%) | 3.40 |
| Single Male/Father | 115 (4.6%) | 3.83 |
| Single Female/Mother | 254 (10.1%) | 2.85 |
| Non-family | 1,139 (45.2%) | 1.13 |
| Total Households | 2,519 (100.0%) | 2.34 |
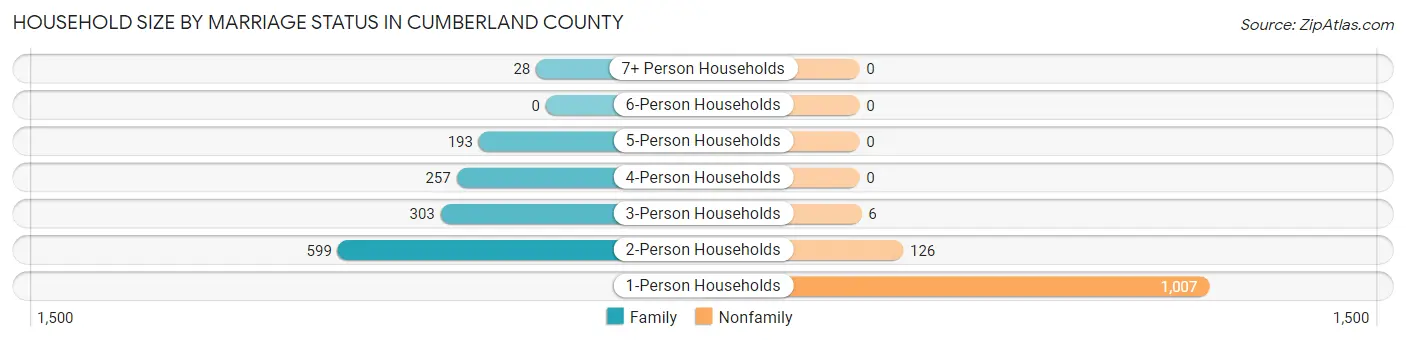
Household Size by Marriage Status in Cumberland County
Out of a total of 2,519 households in Cumberland County, 1,380 (54.8%) are family households, while 1,139 (45.2%) are nonfamily households. The most numerous type of family households are 2-person households, comprising 599, and the most common type of nonfamily households are 1-person households, comprising 1,007.
| Household Size | Family Households | Nonfamily Households |
| 1-Person Households | - | 1,007 (40.0%) |
| 2-Person Households | 599 (23.8%) | 126 (5.0%) |
| 3-Person Households | 303 (12.0%) | 6 (0.2%) |
| 4-Person Households | 257 (10.2%) | 0 (0.0%) |
| 5-Person Households | 193 (7.7%) | 0 (0.0%) |
| 6-Person Households | 0 (0.0%) | 0 (0.0%) |
| 7+ Person Households | 28 (1.1%) | 0 (0.0%) |
| Total | 1,380 (54.8%) | 1,139 (45.2%) |
Female Fertility in Cumberland County
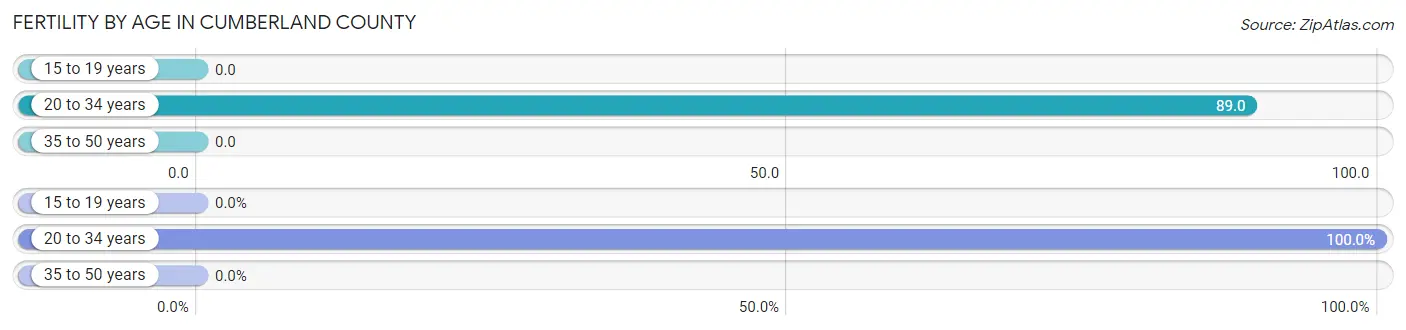
Fertility by Age in Cumberland County
Average fertility rate in Cumberland County is 42.0 births per 1,000 women. Women in the age bracket of 20 to 34 years have the highest fertility rate with 89.0 births per 1,000 women. Women in the age bracket of 20 to 34 years acount for 100.0% of all women with births.
| Age Bracket | Women with Births | Births / 1,000 Women |
| 15 to 19 years | 0 (0.0%) | 0.0 |
| 20 to 34 years | 51 (100.0%) | 89.0 |
| 35 to 50 years | 0 (0.0%) | 0.0 |
| Total | 51 (100.0%) | 42.0 |
Fertility by Age by Marriage Status in Cumberland County

| Age Bracket | Married | Unmarried |
| 15 to 19 years | 0 (0.0%) | 0 (0.0%) |
| 20 to 34 years | 51 (100.0%) | 0 (0.0%) |
| 35 to 50 years | 0 (0.0%) | 0 (0.0%) |
| Total | 51 (100.0%) | 0 (0.0%) |
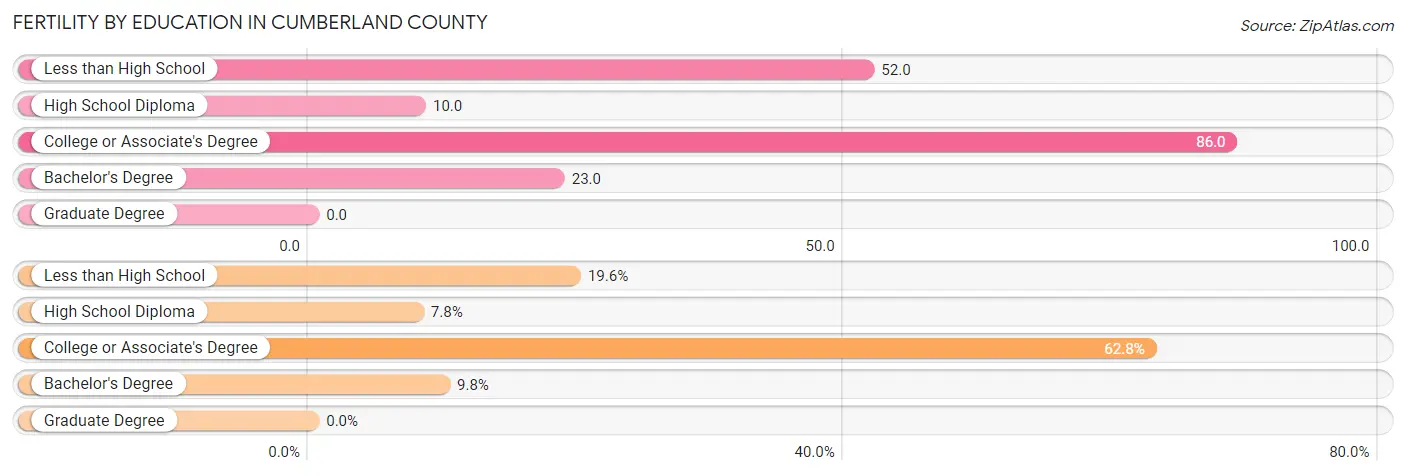
Fertility by Education in Cumberland County
| Educational Attainment | Women with Births | Births / 1,000 Women |
| Less than High School | 10 (19.6%) | 52.0 |
| High School Diploma | 4 (7.8%) | 10.0 |
| College or Associate's Degree | 32 (62.7%) | 86.0 |
| Bachelor's Degree | 5 (9.8%) | 23.0 |
| Graduate Degree | 0 (0.0%) | 0.0 |
| Total | 51 (100.0%) | 42.0 |
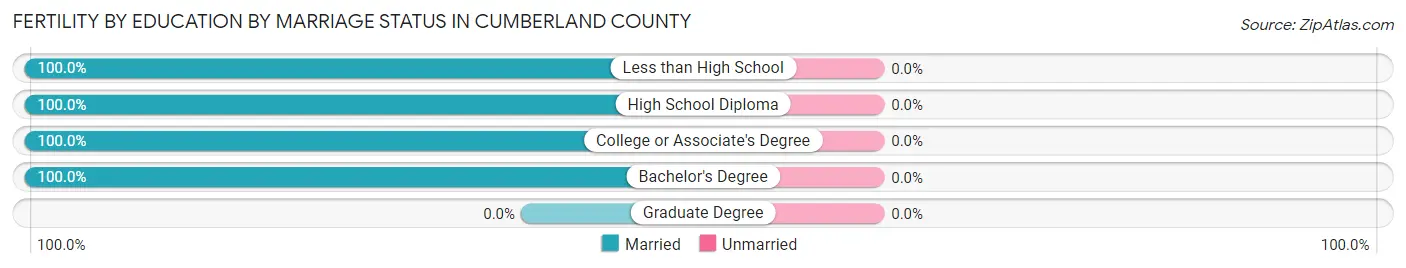
Fertility by Education by Marriage Status in Cumberland County
| Educational Attainment | Married | Unmarried |
| Less than High School | 10 (100.0%) | 0 (0.0%) |
| High School Diploma | 4 (100.0%) | 0 (0.0%) |
| College or Associate's Degree | 32 (100.0%) | 0 (0.0%) |
| Bachelor's Degree | 5 (100.0%) | 0 (0.0%) |
| Graduate Degree | 0 (0.0%) | 0 (0.0%) |
| Total | 51 (100.0%) | 0 (0.0%) |
Income in Cumberland County
Income Overview in Cumberland County
Per Capita Income in Cumberland County is $22,668, while median incomes of families and households are $56,489 and $40,515 respectively.
| Characteristic | Number | Measure |
| Per Capita Income | 5,974 | $22,668 |
| Median Family Income | 1,380 | $56,489 |
| Mean Family Income | 1,380 | $67,487 |
| Median Household Income | 2,519 | $40,515 |
| Mean Household Income | 2,519 | $52,191 |
| Income Deficit | 1,380 | $8,100 |
| Wage / Income Gap (%) | 5,974 | 31.51% |
| Wage / Income Gap ($) | 5,974 | 68.49¢ per $1 |
| Gini / Inequality Index | 5,974 | 0.46 |
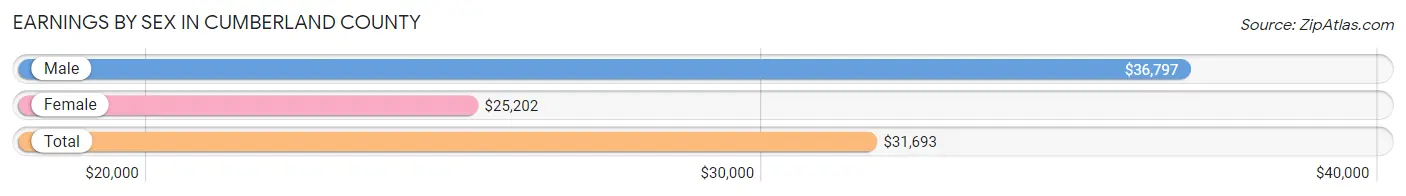
Earnings by Sex in Cumberland County
Average Earnings in Cumberland County are $31,693, $36,797 for men and $25,202 for women, a difference of 31.5%.
| Sex | Number | Average Earnings |
| Male | 1,351 (54.0%) | $36,797 |
| Female | 1,151 (46.0%) | $25,202 |
| Total | 2,502 (100.0%) | $31,693 |
Earnings by Sex by Income Bracket in Cumberland County
The most common earnings brackets in Cumberland County are $40,000 to $44,999 for men (180 | 13.3%) and $30,000 to $34,999 for women (196 | 17.0%).
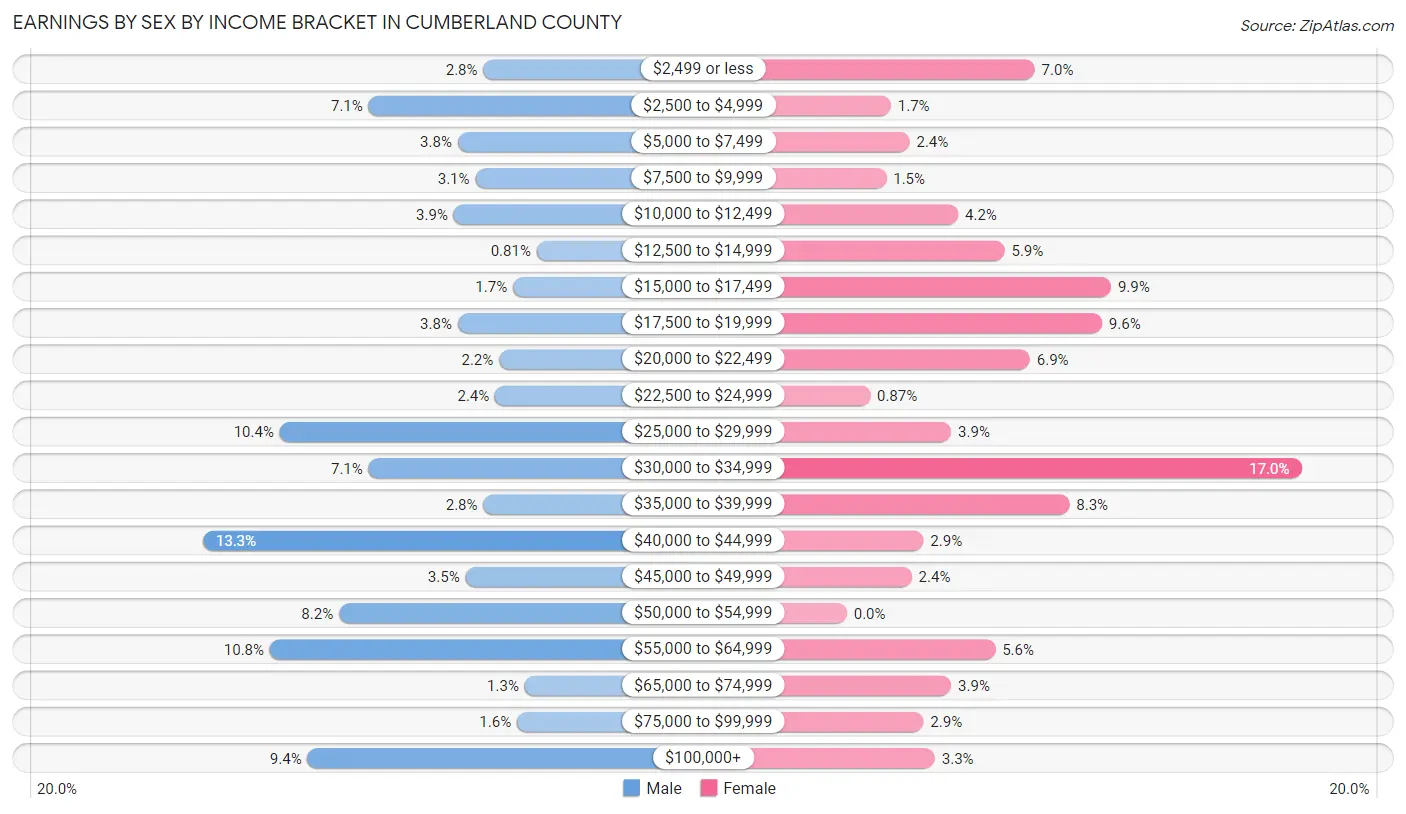
| Income | Male | Female |
| $2,499 or less | 38 (2.8%) | 81 (7.0%) |
| $2,500 to $4,999 | 96 (7.1%) | 19 (1.7%) |
| $5,000 to $7,499 | 51 (3.8%) | 27 (2.4%) |
| $7,500 to $9,999 | 42 (3.1%) | 17 (1.5%) |
| $10,000 to $12,499 | 53 (3.9%) | 48 (4.2%) |
| $12,500 to $14,999 | 11 (0.8%) | 68 (5.9%) |
| $15,000 to $17,499 | 23 (1.7%) | 114 (9.9%) |
| $17,500 to $19,999 | 51 (3.8%) | 110 (9.6%) |
| $20,000 to $22,499 | 30 (2.2%) | 79 (6.9%) |
| $22,500 to $24,999 | 32 (2.4%) | 10 (0.9%) |
| $25,000 to $29,999 | 141 (10.4%) | 45 (3.9%) |
| $30,000 to $34,999 | 96 (7.1%) | 196 (17.0%) |
| $35,000 to $39,999 | 38 (2.8%) | 96 (8.3%) |
| $40,000 to $44,999 | 180 (13.3%) | 33 (2.9%) |
| $45,000 to $49,999 | 47 (3.5%) | 28 (2.4%) |
| $50,000 to $54,999 | 111 (8.2%) | 0 (0.0%) |
| $55,000 to $64,999 | 146 (10.8%) | 64 (5.6%) |
| $65,000 to $74,999 | 17 (1.3%) | 45 (3.9%) |
| $75,000 to $99,999 | 21 (1.5%) | 33 (2.9%) |
| $100,000+ | 127 (9.4%) | 38 (3.3%) |
| Total | 1,351 (100.0%) | 1,151 (100.0%) |
Earnings by Sex by Educational Attainment in Cumberland County
Average earnings in Cumberland County are $40,716 for men and $30,455 for women, a difference of 25.2%. Men with an educational attainment of bachelor's degree enjoy the highest average annual earnings of $105,399, while those with less than high school education earn the least with $30,724. Women with an educational attainment of graduate degree earn the most with the average annual earnings of $48,214, while those with less than high school education have the smallest earnings of $15,161.

| Educational Attainment | Male Income | Female Income |
| Less than High School | $30,724 | $15,161 |
| High School Diploma | $40,495 | $33,496 |
| College or Associate's Degree | $34,053 | $20,085 |
| Bachelor's Degree | $105,399 | $33,088 |
| Graduate Degree | $62,632 | $48,214 |
| Total | $40,716 | $30,455 |
Family Income in Cumberland County
Family Income Brackets in Cumberland County
According to the Cumberland County family income data, there are 317 families falling into the $100,000 to $149,999 income range, which is the most common income bracket and makes up 23.0% of all families. Conversely, the $200,000+ income bracket is the least frequent group with only 7 families (0.5%) belonging to this category.

| Income Bracket | # Families | % Families |
| Less than $10,000 | 92 | 6.7% |
| $10,000 to $14,999 | 48 | 3.5% |
| $15,000 to $24,999 | 168 | 12.2% |
| $25,000 to $34,999 | 123 | 8.9% |
| $35,000 to $49,999 | 155 | 11.2% |
| $50,000 to $74,999 | 308 | 22.3% |
| $75,000 to $99,999 | 127 | 9.2% |
| $100,000 to $149,999 | 317 | 23.0% |
| $150,000 to $199,999 | 36 | 2.6% |
| $200,000+ | 7 | 0.5% |
Family Income by Famaliy Size in Cumberland County
5-person families (135 | 9.8%) account for the highest median family income in Cumberland County with $75,365 per family, while 2-person families (657 | 47.6%) have the highest median income of $27,606 per family member.
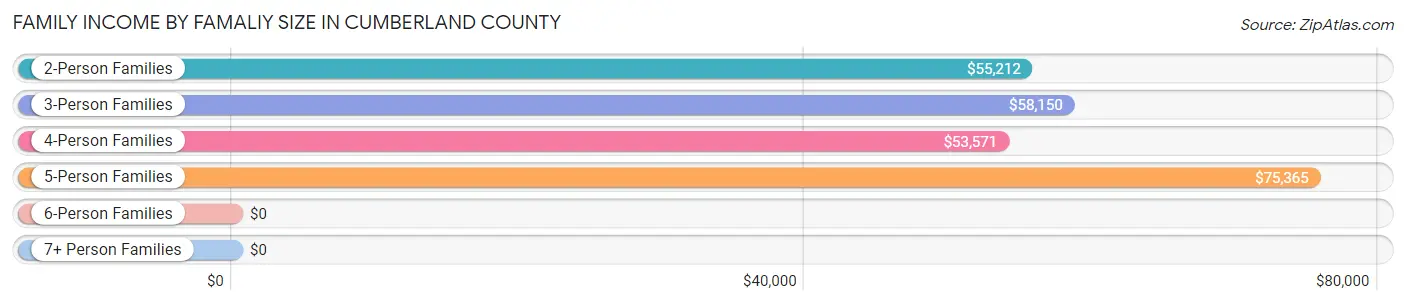
| Income Bracket | # Families | Median Income |
| 2-Person Families | 657 (47.6%) | $55,212 |
| 3-Person Families | 301 (21.8%) | $58,150 |
| 4-Person Families | 266 (19.3%) | $53,571 |
| 5-Person Families | 135 (9.8%) | $75,365 |
| 6-Person Families | 0 (0.0%) | $0 |
| 7+ Person Families | 21 (1.5%) | $0 |
| Total | 1,380 (100.0%) | $56,489 |
Family Income by Number of Earners in Cumberland County
The median family income in Cumberland County is $56,489, with families comprising 3+ earners (116) having the highest median family income of $134,758, while families with no earners (327) have the lowest median family income of $31,458, accounting for 8.4% and 23.7% of families, respectively.
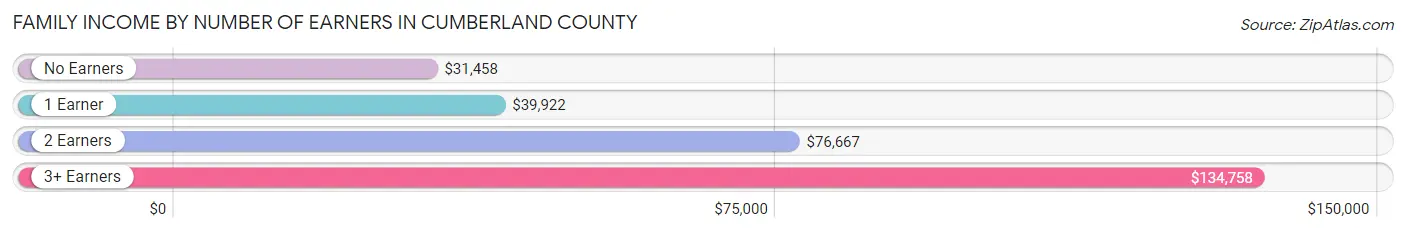
| Number of Earners | # Families | Median Income |
| No Earners | 327 (23.7%) | $31,458 |
| 1 Earner | 443 (32.1%) | $39,922 |
| 2 Earners | 494 (35.8%) | $76,667 |
| 3+ Earners | 116 (8.4%) | $134,758 |
| Total | 1,380 (100.0%) | $56,489 |
Household Income in Cumberland County
Household Income Brackets in Cumberland County
With 504 households falling in the category, the $35,000 to $49,999 income range is the most frequent in Cumberland County, accounting for 20.0% of all households. In contrast, only 18 households (0.7%) fall into the $200,000+ income bracket, making it the least populous group.

| Income Bracket | # Households | % Households |
| Less than $10,000 | 317 | 12.6% |
| $10,000 to $14,999 | 300 | 11.9% |
| $15,000 to $24,999 | 199 | 7.9% |
| $25,000 to $34,999 | 212 | 8.4% |
| $35,000 to $49,999 | 504 | 20.0% |
| $50,000 to $74,999 | 441 | 17.5% |
| $75,000 to $99,999 | 146 | 5.8% |
| $100,000 to $149,999 | 343 | 13.6% |
| $150,000 to $199,999 | 45 | 1.8% |
| $200,000+ | 18 | 0.7% |
Household Income by Householder Age in Cumberland County
The median household income in Cumberland County is $40,515, with the highest median household income of $42,164 found in the 25 to 44 years age bracket for the primary householder. A total of 569 households (22.6%) fall into this category. Meanwhile, the 15 to 24 years age bracket for the primary householder has the lowest median household income of $18,875, with 35 households (1.4%) in this group.
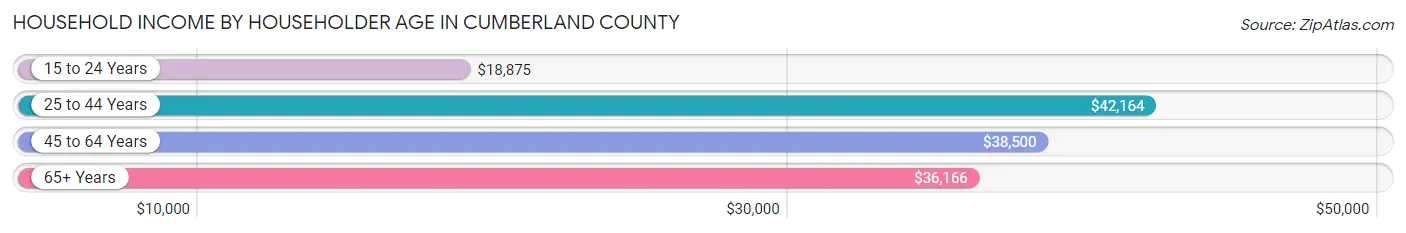
| Income Bracket | # Households | Median Income |
| 15 to 24 Years | 35 (1.4%) | $18,875 |
| 25 to 44 Years | 569 (22.6%) | $42,164 |
| 45 to 64 Years | 1,080 (42.9%) | $38,500 |
| 65+ Years | 835 (33.2%) | $36,166 |
| Total | 2,519 (100.0%) | $40,515 |
Poverty in Cumberland County
Income Below Poverty by Sex and Age in Cumberland County
With 23.6% poverty level for males and 32.8% for females among the residents of Cumberland County, 55 to 64 year old males and 5 year old females are the most vulnerable to poverty, with 189 males (37.7%) and 80 females (74.1%) in their respective age groups living below the poverty level.

| Age Bracket | Male | Female |
| Under 5 Years | 53 (34.0%) | 6 (3.6%) |
| 5 Years | 10 (9.9%) | 80 (74.1%) |
| 6 to 11 Years | 71 (31.8%) | 52 (27.8%) |
| 12 to 14 Years | 22 (36.1%) | 8 (11.0%) |
| 15 Years | 7 (9.9%) | 7 (35.0%) |
| 16 and 17 Years | 4 (21.0%) | 26 (35.6%) |
| 18 to 24 Years | 12 (8.6%) | 81 (37.7%) |
| 25 to 34 Years | 65 (18.9%) | 118 (30.3%) |
| 35 to 44 Years | 48 (15.6%) | 95 (37.4%) |
| 45 to 54 Years | 74 (20.2%) | 106 (27.3%) |
| 55 to 64 Years | 189 (37.7%) | 223 (49.7%) |
| 65 to 74 Years | 86 (21.7%) | 90 (24.2%) |
| 75 Years and over | 45 (20.9%) | 80 (29.3%) |
| Total | 686 (23.6%) | 972 (32.8%) |
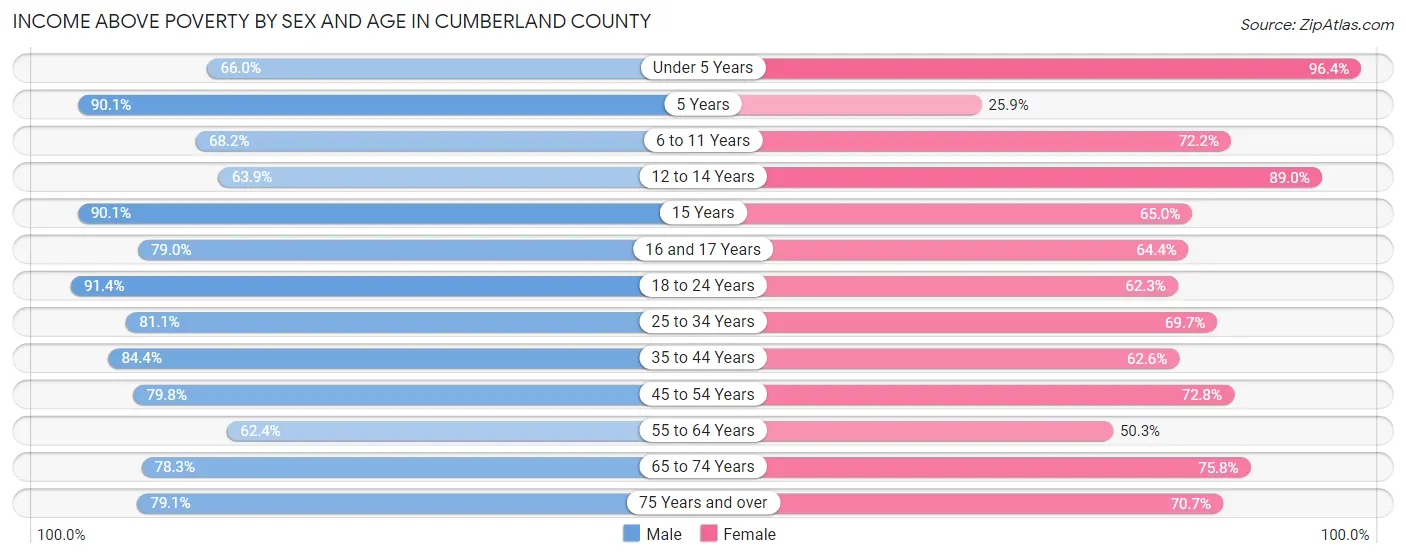
Income Above Poverty by Sex and Age in Cumberland County
According to the poverty statistics in Cumberland County, males aged 18 to 24 years and females aged under 5 years are the age groups that are most secure financially, with 91.4% of males and 96.4% of females in these age groups living above the poverty line.
| Age Bracket | Male | Female |
| Under 5 Years | 103 (66.0%) | 160 (96.4%) |
| 5 Years | 91 (90.1%) | 28 (25.9%) |
| 6 to 11 Years | 152 (68.2%) | 135 (72.2%) |
| 12 to 14 Years | 39 (63.9%) | 65 (89.0%) |
| 15 Years | 64 (90.1%) | 13 (65.0%) |
| 16 and 17 Years | 15 (78.9%) | 47 (64.4%) |
| 18 to 24 Years | 127 (91.4%) | 134 (62.3%) |
| 25 to 34 Years | 279 (81.1%) | 271 (69.7%) |
| 35 to 44 Years | 260 (84.4%) | 159 (62.6%) |
| 45 to 54 Years | 292 (79.8%) | 283 (72.8%) |
| 55 to 64 Years | 313 (62.4%) | 226 (50.3%) |
| 65 to 74 Years | 310 (78.3%) | 282 (75.8%) |
| 75 Years and over | 170 (79.1%) | 193 (70.7%) |
| Total | 2,215 (76.3%) | 1,996 (67.2%) |
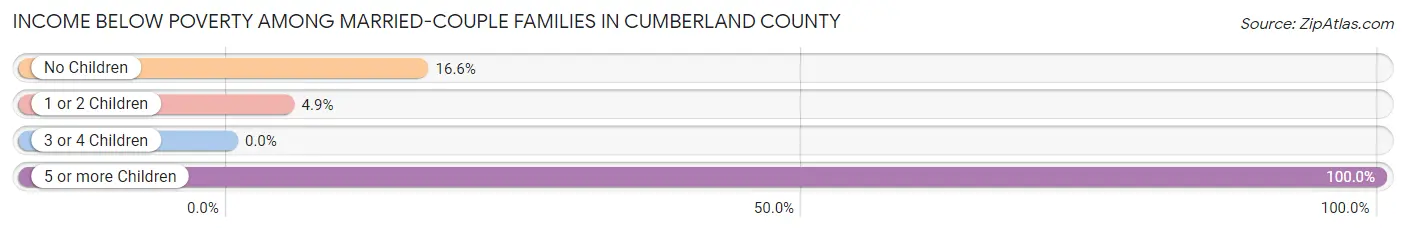
Income Below Poverty Among Married-Couple Families in Cumberland County
The poverty statistics for married-couple families in Cumberland County show that 13.6% or 137 of the total 1,011 families live below the poverty line. Families with 5 or more children have the highest poverty rate of 100.0%, comprising of 16 families. On the other hand, families with 3 or 4 children have the lowest poverty rate of 0.0%, which includes 0 families.
| Children | Above Poverty | Below Poverty |
| No Children | 533 (83.4%) | 106 (16.6%) |
| 1 or 2 Children | 289 (95.1%) | 15 (4.9%) |
| 3 or 4 Children | 52 (100.0%) | 0 (0.0%) |
| 5 or more Children | 0 (0.0%) | 16 (100.0%) |
| Total | 874 (86.5%) | 137 (13.6%) |
Income Below Poverty Among Single-Parent Households in Cumberland County
According to the poverty data in Cumberland County, 20.0% or 23 single-father households and 66.5% or 169 single-mother households are living below the poverty line. Among single-father households, those with 1 or 2 children have the highest poverty rate, with 23 households (38.3%) experiencing poverty. Likewise, among single-mother households, those with 1 or 2 children have the highest poverty rate, with 91 households (87.5%) falling below the poverty line.

| Children | Single Father | Single Mother |
| No Children | 0 (0.0%) | 57 (70.4%) |
| 1 or 2 Children | 23 (38.3%) | 91 (87.5%) |
| 3 or 4 Children | 0 (0.0%) | 21 (30.4%) |
| 5 or more Children | 0 (0.0%) | 0 (0.0%) |
| Total | 23 (20.0%) | 169 (66.5%) |
Income Below Poverty Among Married-Couple vs Single-Parent Households in Cumberland County
The poverty data for Cumberland County shows that 137 of the married-couple family households (13.6%) and 192 of the single-parent households (52.0%) are living below the poverty level. Within the married-couple family households, those with 5 or more children have the highest poverty rate, with 16 households (100.0%) falling below the poverty line. Among the single-parent households, those with 1 or 2 children have the highest poverty rate, with 114 household (69.5%) living below poverty.

| Children | Married-Couple Families | Single-Parent Households |
| No Children | 106 (16.6%) | 57 (46.3%) |
| 1 or 2 Children | 15 (4.9%) | 114 (69.5%) |
| 3 or 4 Children | 0 (0.0%) | 21 (25.6%) |
| 5 or more Children | 16 (100.0%) | 0 (0.0%) |
| Total | 137 (13.6%) | 192 (52.0%) |
Employment Characteristics in Cumberland County
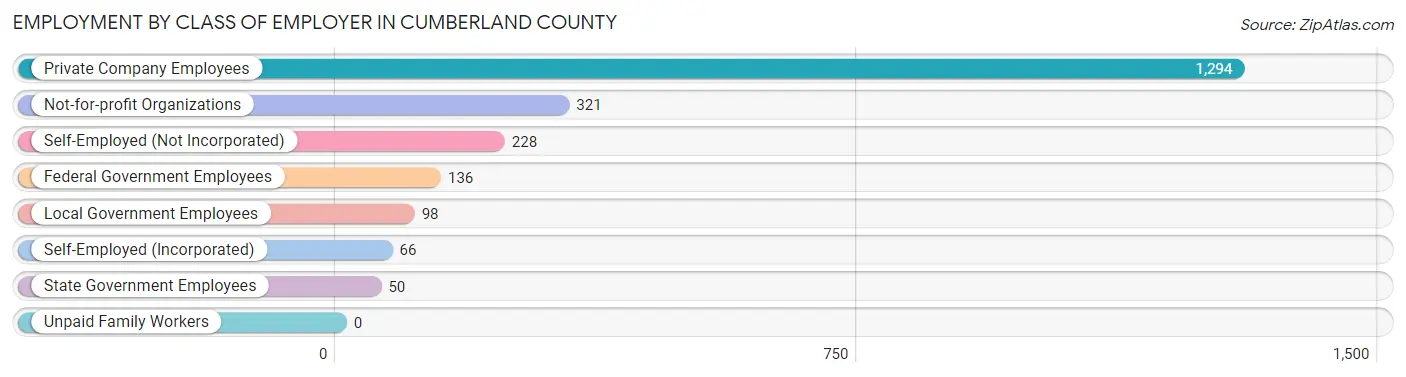
Employment by Class of Employer in Cumberland County
Among the 2,193 employed individuals in Cumberland County, private company employees (1,294 | 59.0%), not-for-profit organizations (321 | 14.6%), and self-employed (not incorporated) (228 | 10.4%) make up the most common classes of employment.
| Employer Class | # Employees | % Employees |
| Private Company Employees | 1,294 | 59.0% |
| Self-Employed (Incorporated) | 66 | 3.0% |
| Self-Employed (Not Incorporated) | 228 | 10.4% |
| Not-for-profit Organizations | 321 | 14.6% |
| Local Government Employees | 98 | 4.5% |
| State Government Employees | 50 | 2.3% |
| Federal Government Employees | 136 | 6.2% |
| Unpaid Family Workers | 0 | 0.0% |
| Total | 2,193 | 100.0% |
Employment Status by Age in Cumberland County
According to the labor force statistics for Cumberland County, out of the total population over 16 years of age (4,784), 51.3% or 2,454 individuals are in the labor force, with 3.8% or 93 of them unemployed. The age group with the highest labor force participation rate is 20 to 24 years, with 94.3% or 231 individuals in the labor force. Within the labor force, the 20 to 24 years age range has the highest percentage of unemployed individuals, with 12.6% or 29 of them being unemployed.

| Age Bracket | In Labor Force | Unemployed |
| 16 to 19 Years | 111 (55.2%) | 5 (4.5%) |
| 20 to 24 Years | 231 (94.3%) | 29 (12.6%) |
| 25 to 29 Years | 305 (84.5%) | 17 (5.6%) |
| 30 to 34 Years | 299 (80.4%) | 0 (0.0%) |
| 35 to 44 Years | 411 (73.1%) | 0 (0.0%) |
| 45 to 54 Years | 513 (67.9%) | 31 (6.0%) |
| 55 to 59 Years | 254 (57.1%) | 11 (4.3%) |
| 60 to 64 Years | 143 (26.9%) | 0 (0.0%) |
| 65 to 74 Years | 183 (23.4%) | 0 (0.0%) |
| 75 Years and over | 4 (0.8%) | 0 (0.0%) |
| Total | 2,454 (51.3%) | 93 (3.8%) |
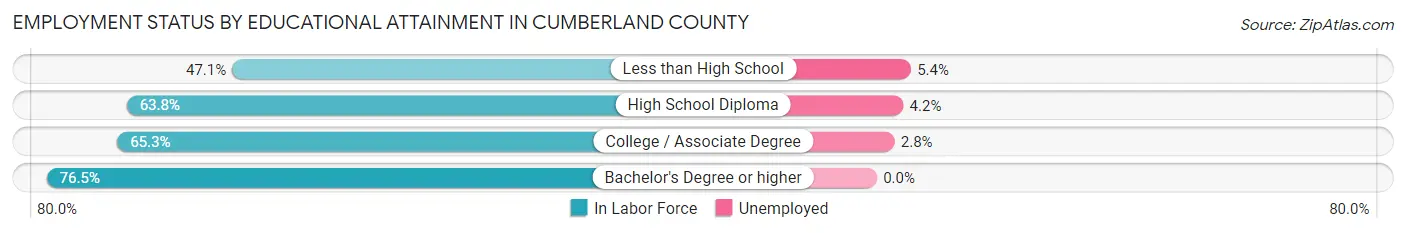
Employment Status by Educational Attainment in Cumberland County
According to labor force statistics for Cumberland County, 63.6% of individuals (1,925) out of the total population between 25 and 64 years of age (3,026) are in the labor force, with 3.1% or 60 of them being unemployed. The group with the highest labor force participation rate are those with the educational attainment of bachelor's degree or higher, with 76.5% or 463 individuals in the labor force. Within the labor force, individuals with less than high school education have the highest percentage of unemployment, with 5.4% or 14 of them being unemployed.
| Educational Attainment | In Labor Force | Unemployed |
| Less than High School | 258 (47.1%) | 30 (5.4%) |
| High School Diploma | 815 (63.8%) | 54 (4.2%) |
| College / Associate Degree | 389 (65.3%) | 17 (2.8%) |
| Bachelor's Degree or higher | 463 (76.5%) | 0 (0.0%) |
| Total | 1,925 (63.6%) | 94 (3.1%) |
Employment Occupations by Sex in Cumberland County
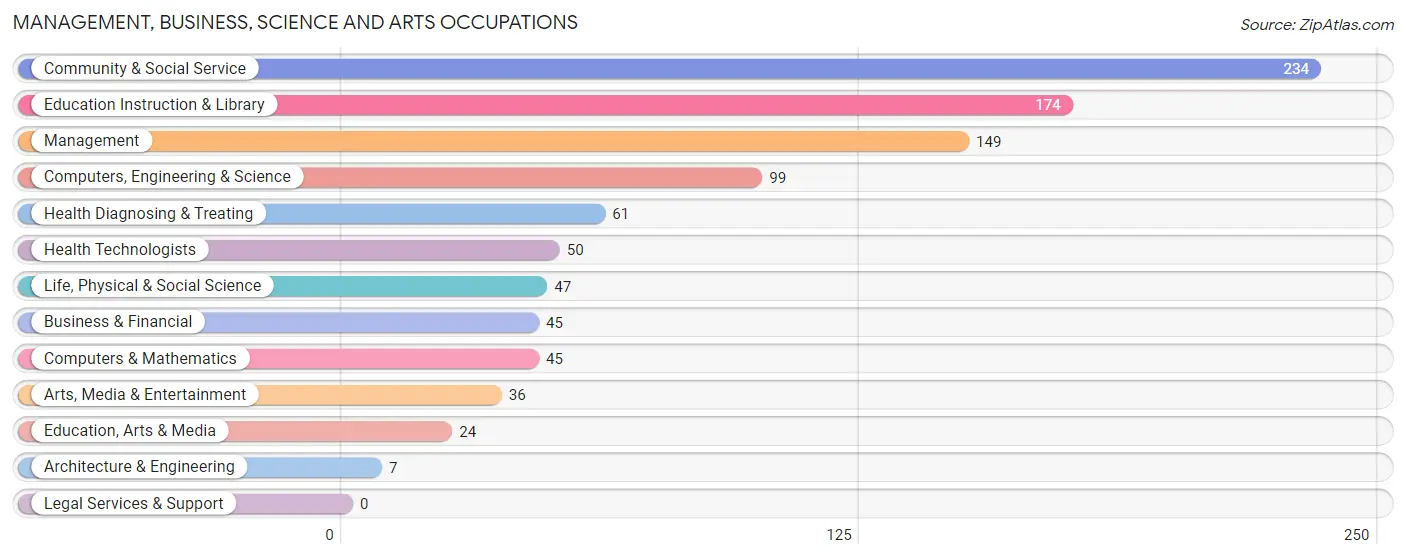
Management, Business, Science and Arts Occupations
The most common Management, Business, Science and Arts occupations in Cumberland County are Community & Social Service (234 | 9.9%), Education Instruction & Library (174 | 7.4%), Management (149 | 6.3%), Computers, Engineering & Science (99 | 4.2%), and Health Diagnosing & Treating (61 | 2.6%).
Management, Business, Science and Arts Occupations by Sex
Within the Management, Business, Science and Arts occupations in Cumberland County, the most male-oriented occupations are Arts, Media & Entertainment (100.0%), Life, Physical & Social Science (68.1%), and Management (63.1%), while the most female-oriented occupations are Business & Financial (100.0%), Computers & Mathematics (100.0%), and Architecture & Engineering (100.0%).

| Occupation | Male | Female |
| Management | 94 (63.1%) | 55 (36.9%) |
| Business & Financial | 0 (0.0%) | 45 (100.0%) |
| Computers, Engineering & Science | 32 (32.3%) | 67 (67.7%) |
| Computers & Mathematics | 0 (0.0%) | 45 (100.0%) |
| Architecture & Engineering | 0 (0.0%) | 7 (100.0%) |
| Life, Physical & Social Science | 32 (68.1%) | 15 (31.9%) |
| Community & Social Service | 63 (26.9%) | 171 (73.1%) |
| Education, Arts & Media | 4 (16.7%) | 20 (83.3%) |
| Legal Services & Support | 0 (0.0%) | 0 (0.0%) |
| Education Instruction & Library | 23 (13.2%) | 151 (86.8%) |
| Arts, Media & Entertainment | 36 (100.0%) | 0 (0.0%) |
| Health Diagnosing & Treating | 5 (8.2%) | 56 (91.8%) |
| Health Technologists | 0 (0.0%) | 50 (100.0%) |
| Total (Category) | 194 (33.0%) | 394 (67.0%) |
| Total (Overall) | 1,264 (53.5%) | 1,097 (46.5%) |
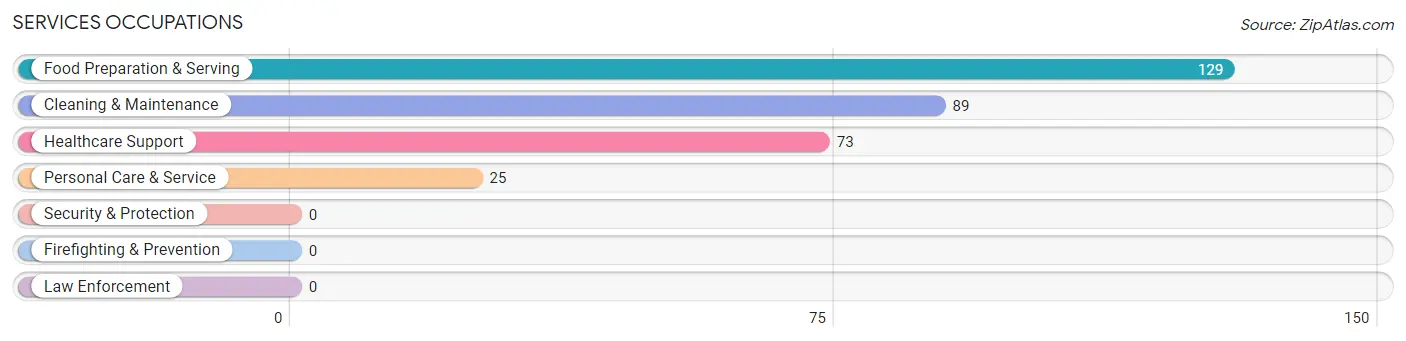
Services Occupations
The most common Services occupations in Cumberland County are Food Preparation & Serving (129 | 5.5%), Cleaning & Maintenance (89 | 3.8%), Healthcare Support (73 | 3.1%), and Personal Care & Service (25 | 1.1%).
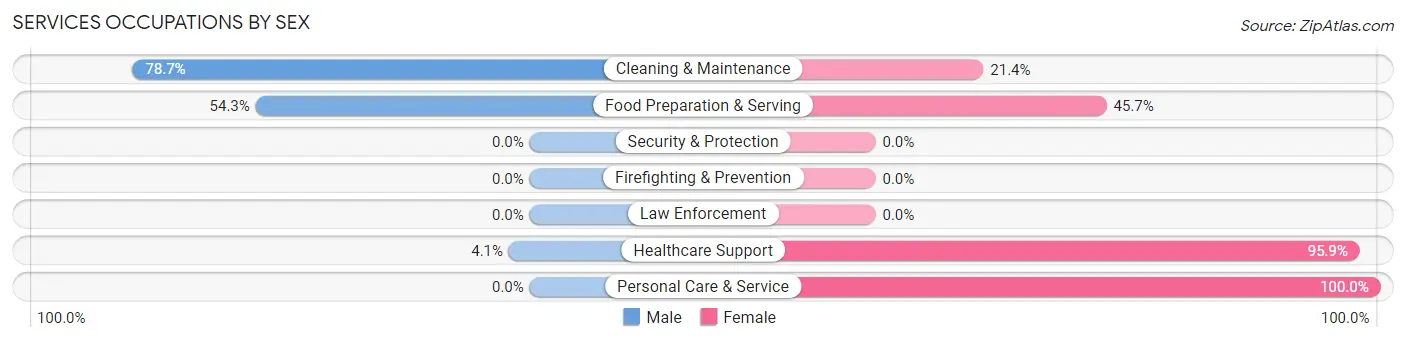
Services Occupations by Sex
Within the Services occupations in Cumberland County, the most male-oriented occupations are Cleaning & Maintenance (78.6%), Food Preparation & Serving (54.3%), and Healthcare Support (4.1%), while the most female-oriented occupations are Personal Care & Service (100.0%), Healthcare Support (95.9%), and Food Preparation & Serving (45.7%).
| Occupation | Male | Female |
| Healthcare Support | 3 (4.1%) | 70 (95.9%) |
| Security & Protection | 0 (0.0%) | 0 (0.0%) |
| Firefighting & Prevention | 0 (0.0%) | 0 (0.0%) |
| Law Enforcement | 0 (0.0%) | 0 (0.0%) |
| Food Preparation & Serving | 70 (54.3%) | 59 (45.7%) |
| Cleaning & Maintenance | 70 (78.6%) | 19 (21.3%) |
| Personal Care & Service | 0 (0.0%) | 25 (100.0%) |
| Total (Category) | 143 (45.3%) | 173 (54.7%) |
| Total (Overall) | 1,264 (53.5%) | 1,097 (46.5%) |
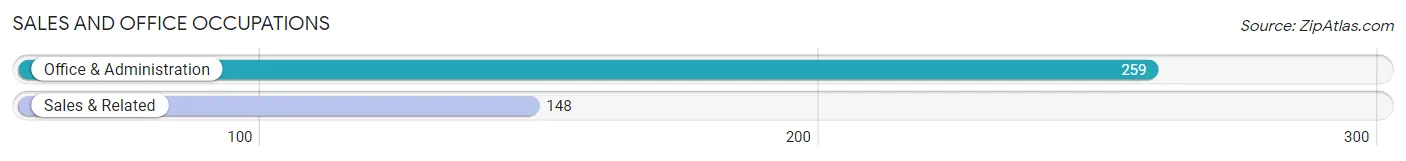
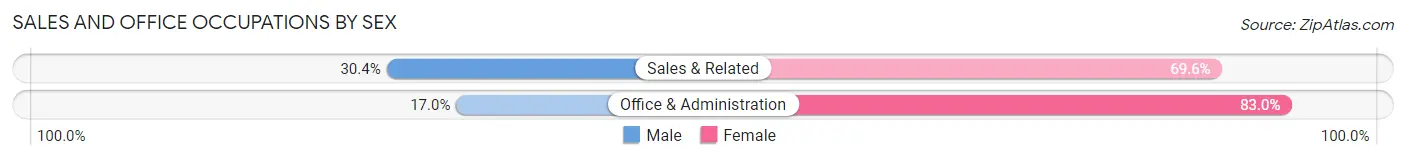
Sales and Office Occupations
The most common Sales and Office occupations in Cumberland County are Office & Administration (259 | 11.0%), and Sales & Related (148 | 6.3%).
Sales and Office Occupations by Sex
| Occupation | Male | Female |
| Sales & Related | 45 (30.4%) | 103 (69.6%) |
| Office & Administration | 44 (17.0%) | 215 (83.0%) |
| Total (Category) | 89 (21.9%) | 318 (78.1%) |
| Total (Overall) | 1,264 (53.5%) | 1,097 (46.5%) |
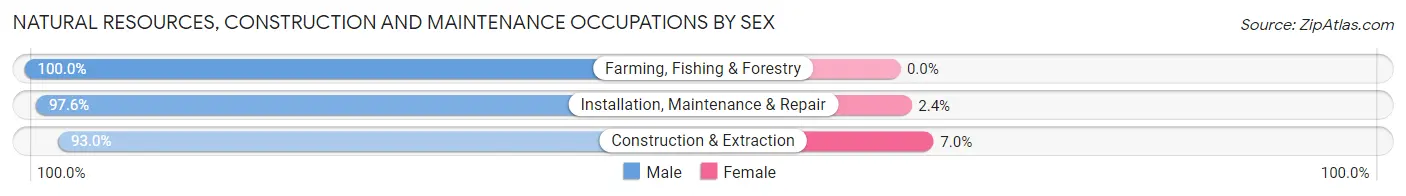
Natural Resources, Construction and Maintenance Occupations
The most common Natural Resources, Construction and Maintenance occupations in Cumberland County are Construction & Extraction (201 | 8.5%), Installation, Maintenance & Repair (169 | 7.2%), and Farming, Fishing & Forestry (70 | 3.0%).

Natural Resources, Construction and Maintenance Occupations by Sex
| Occupation | Male | Female |
| Farming, Fishing & Forestry | 70 (100.0%) | 0 (0.0%) |
| Construction & Extraction | 187 (93.0%) | 14 (7.0%) |
| Installation, Maintenance & Repair | 165 (97.6%) | 4 (2.4%) |
| Total (Category) | 422 (95.9%) | 18 (4.1%) |
| Total (Overall) | 1,264 (53.5%) | 1,097 (46.5%) |
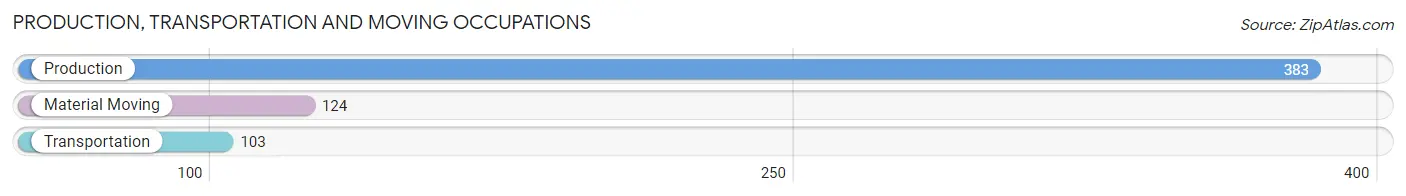
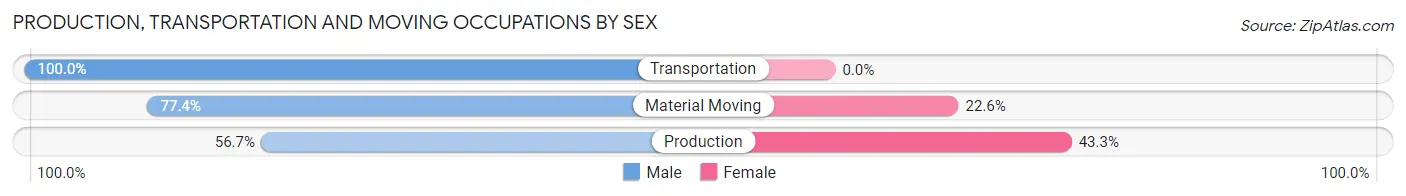
Production, Transportation and Moving Occupations
The most common Production, Transportation and Moving occupations in Cumberland County are Production (383 | 16.2%), Material Moving (124 | 5.2%), and Transportation (103 | 4.4%).
Production, Transportation and Moving Occupations by Sex
| Occupation | Male | Female |
| Production | 217 (56.7%) | 166 (43.3%) |
| Transportation | 103 (100.0%) | 0 (0.0%) |
| Material Moving | 96 (77.4%) | 28 (22.6%) |
| Total (Category) | 416 (68.2%) | 194 (31.8%) |
| Total (Overall) | 1,264 (53.5%) | 1,097 (46.5%) |
Employment Industries by Sex in Cumberland County
Employment Industries in Cumberland County
The major employment industries in Cumberland County include Manufacturing (464 | 19.7%), Retail Trade (414 | 17.5%), Health Care & Social Assistance (195 | 8.3%), Construction (187 | 7.9%), and Finance & Insurance (181 | 7.7%).

Employment Industries by Sex in Cumberland County
The Cumberland County industries that see more men than women are Agriculture, Fishing & Hunting (100.0%), Arts, Entertainment & Recreation (100.0%), and Construction (96.8%), whereas the industries that tend to have a higher number of women are Real Estate, Rental & Leasing (100.0%), Professional & Scientific (100.0%), and Health Care & Social Assistance (95.4%).

| Industry | Male | Female |
| Agriculture, Fishing & Hunting | 58 (100.0%) | 0 (0.0%) |
| Mining, Quarrying, & Extraction | 14 (73.7%) | 5 (26.3%) |
| Construction | 181 (96.8%) | 6 (3.2%) |
| Manufacturing | 288 (62.1%) | 176 (37.9%) |
| Wholesale Trade | 0 (0.0%) | 0 (0.0%) |
| Retail Trade | 283 (68.4%) | 131 (31.6%) |
| Transportation & Warehousing | 81 (58.7%) | 57 (41.3%) |
| Utilities | 99 (93.4%) | 7 (6.6%) |
| Information | 3 (15.8%) | 16 (84.2%) |
| Finance & Insurance | 13 (7.2%) | 168 (92.8%) |
| Real Estate, Rental & Leasing | 0 (0.0%) | 2 (100.0%) |
| Professional & Scientific | 0 (0.0%) | 12 (100.0%) |
| Enterprise Management | 0 (0.0%) | 0 (0.0%) |
| Administrative & Support | 72 (46.8%) | 82 (53.2%) |
| Educational Services | 21 (11.9%) | 156 (88.1%) |
| Health Care & Social Assistance | 9 (4.6%) | 186 (95.4%) |
| Arts, Entertainment & Recreation | 14 (100.0%) | 0 (0.0%) |
| Accommodation & Food Services | 44 (53.0%) | 39 (47.0%) |
| Public Administration | 48 (63.2%) | 28 (36.8%) |
| Total | 1,264 (53.5%) | 1,097 (46.5%) |
Education in Cumberland County
School Enrollment in Cumberland County
The most common levels of schooling among the 1,096 students in Cumberland County are elementary school (270 | 24.6%), high school (241 | 22.0%), and middle school (189 | 17.2%).
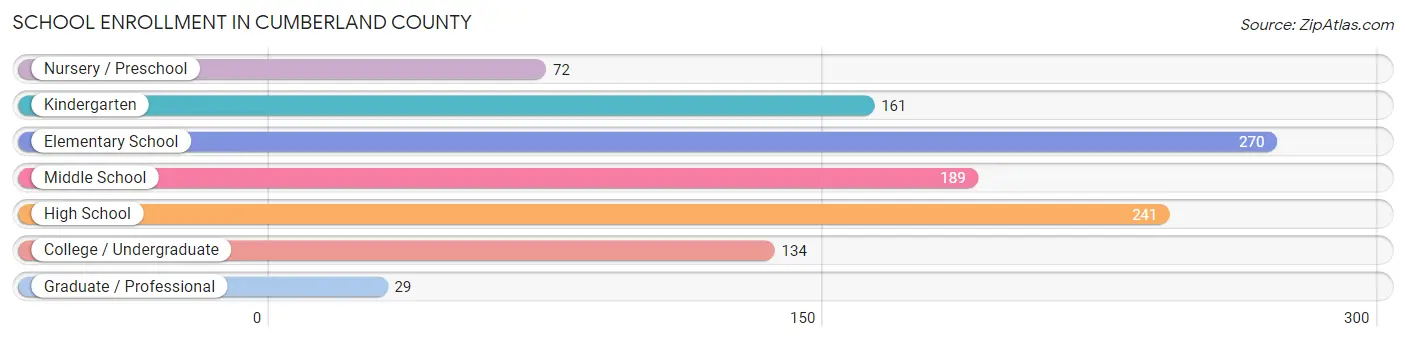
| School Level | # Students | % Students |
| Nursery / Preschool | 72 | 6.6% |
| Kindergarten | 161 | 14.7% |
| Elementary School | 270 | 24.6% |
| Middle School | 189 | 17.2% |
| High School | 241 | 22.0% |
| College / Undergraduate | 134 | 12.2% |
| Graduate / Professional | 29 | 2.6% |
| Total | 1,096 | 100.0% |
School Enrollment by Age by Funding Source in Cumberland County
Out of a total of 1,096 students who are enrolled in schools in Cumberland County, 139 (12.7%) attend a private institution, while the remaining 957 (87.3%) are enrolled in public schools. The age group of 25 to 34 year olds has the highest likelihood of being enrolled in private schools, with 57 (95.0% in the age bracket) enrolled. Conversely, the age group of 3 to 4 year olds has the lowest likelihood of being enrolled in a private school, with 36 (100.0% in the age bracket) attending a public institution.
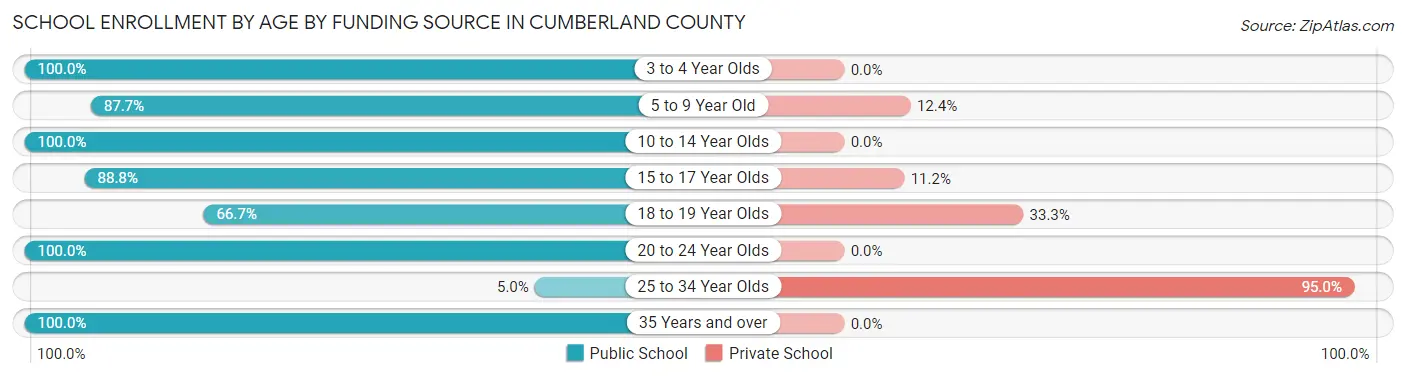
| Age Bracket | Public School | Private School |
| 3 to 4 Year Olds | 36 (100.0%) | 0 (0.0%) |
| 5 to 9 Year Old | 369 (87.6%) | 52 (12.3%) |
| 10 to 14 Year Olds | 274 (100.0%) | 0 (0.0%) |
| 15 to 17 Year Olds | 127 (88.8%) | 16 (11.2%) |
| 18 to 19 Year Olds | 28 (66.7%) | 14 (33.3%) |
| 20 to 24 Year Olds | 42 (100.0%) | 0 (0.0%) |
| 25 to 34 Year Olds | 3 (5.0%) | 57 (95.0%) |
| 35 Years and over | 78 (100.0%) | 0 (0.0%) |
| Total | 957 (87.3%) | 139 (12.7%) |
Educational Attainment by Field of Study in Cumberland County
Science & technology (184 | 21.8%), education (165 | 19.6%), bio, nature & agricultural (139 | 16.5%), arts & humanities (88 | 10.4%), and psychology (63 | 7.5%) are the most common fields of study among 843 individuals in Cumberland County who have obtained a bachelor's degree or higher.
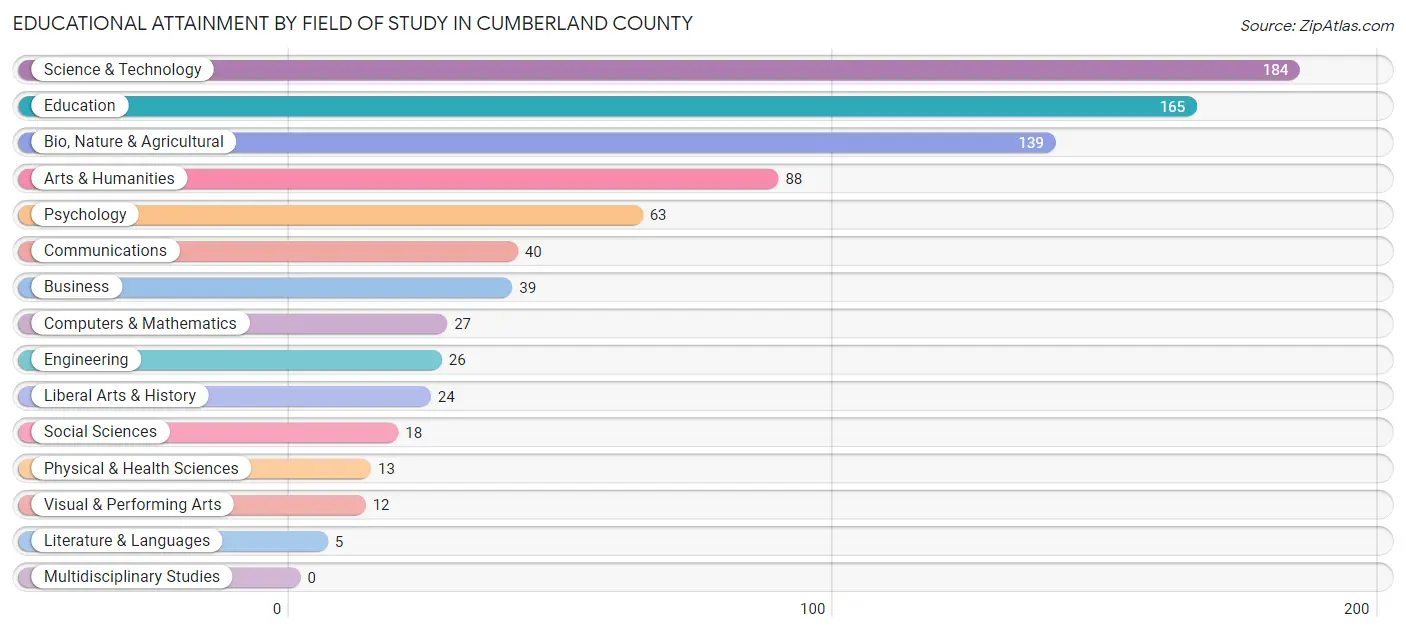
| Field of Study | # Graduates | % Graduates |
| Computers & Mathematics | 27 | 3.2% |
| Bio, Nature & Agricultural | 139 | 16.5% |
| Physical & Health Sciences | 13 | 1.5% |
| Psychology | 63 | 7.5% |
| Social Sciences | 18 | 2.1% |
| Engineering | 26 | 3.1% |
| Multidisciplinary Studies | 0 | 0.0% |
| Science & Technology | 184 | 21.8% |
| Business | 39 | 4.6% |
| Education | 165 | 19.6% |
| Literature & Languages | 5 | 0.6% |
| Liberal Arts & History | 24 | 2.9% |
| Visual & Performing Arts | 12 | 1.4% |
| Communications | 40 | 4.7% |
| Arts & Humanities | 88 | 10.4% |
| Total | 843 | 100.0% |
Transportation & Commute in Cumberland County
Vehicle Availability by Sex in Cumberland County
The most prevalent vehicle ownership categories in Cumberland County are males with 2 vehicles (460, accounting for 39.1%) and females with 2 vehicles (331, making up 45.3%).

| Vehicles Available | Male | Female |
| No Vehicle | 34 (2.9%) | 17 (1.7%) |
| 1 Vehicle | 99 (8.4%) | 142 (14.0%) |
| 2 Vehicles | 460 (39.1%) | 331 (32.6%) |
| 3 Vehicles | 430 (36.5%) | 370 (36.4%) |
| 4 Vehicles | 107 (9.1%) | 127 (12.5%) |
| 5 or more Vehicles | 47 (4.0%) | 28 (2.8%) |
| Total | 1,177 (100.0%) | 1,015 (100.0%) |
Commute Time in Cumberland County
The most frequently occuring commute durations in Cumberland County are 15 to 19 minutes (452 commuters, 21.4%), 5 to 9 minutes (356 commuters, 16.8%), and 30 to 34 minutes (264 commuters, 12.5%).
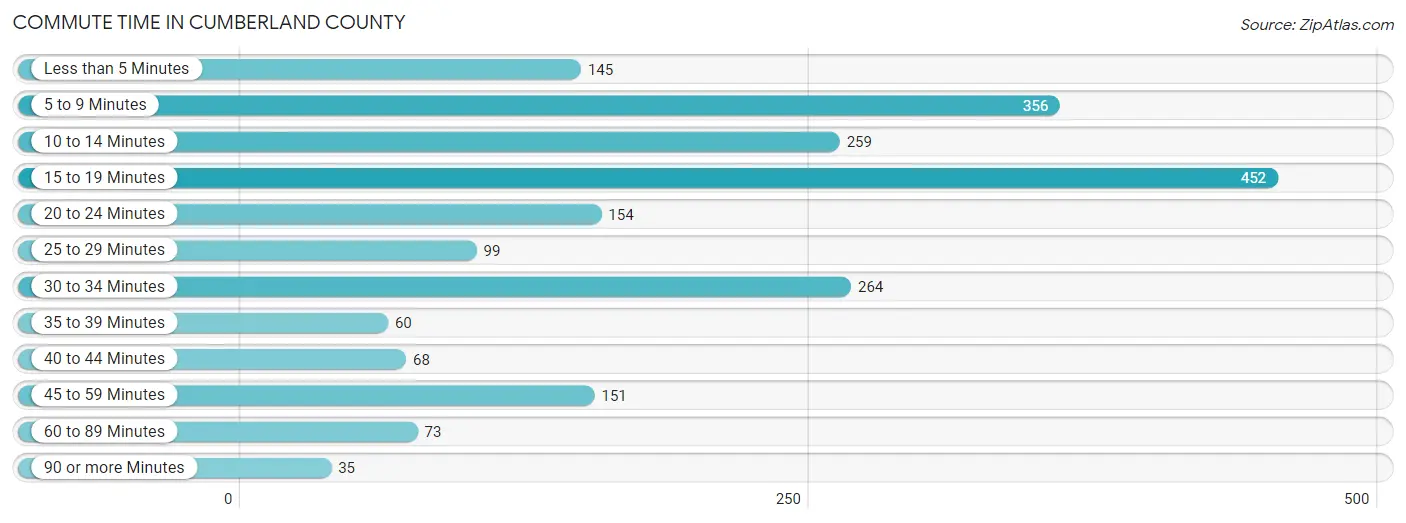
| Commute Time | # Commuters | % Commuters |
| Less than 5 Minutes | 145 | 6.9% |
| 5 to 9 Minutes | 356 | 16.8% |
| 10 to 14 Minutes | 259 | 12.2% |
| 15 to 19 Minutes | 452 | 21.4% |
| 20 to 24 Minutes | 154 | 7.3% |
| 25 to 29 Minutes | 99 | 4.7% |
| 30 to 34 Minutes | 264 | 12.5% |
| 35 to 39 Minutes | 60 | 2.8% |
| 40 to 44 Minutes | 68 | 3.2% |
| 45 to 59 Minutes | 151 | 7.1% |
| 60 to 89 Minutes | 73 | 3.5% |
| 90 or more Minutes | 35 | 1.7% |
Commute Time by Sex in Cumberland County
The most common commute times in Cumberland County are 15 to 19 minutes (254 commuters, 21.8%) for males and 5 to 9 minutes (268 commuters, 28.2%) for females.

| Commute Time | Male | Female |
| Less than 5 Minutes | 88 (7.5%) | 57 (6.0%) |
| 5 to 9 Minutes | 88 (7.5%) | 268 (28.2%) |
| 10 to 14 Minutes | 153 (13.1%) | 106 (11.2%) |
| 15 to 19 Minutes | 254 (21.8%) | 198 (20.9%) |
| 20 to 24 Minutes | 87 (7.5%) | 67 (7.1%) |
| 25 to 29 Minutes | 80 (6.9%) | 19 (2.0%) |
| 30 to 34 Minutes | 191 (16.4%) | 73 (7.7%) |
| 35 to 39 Minutes | 32 (2.7%) | 28 (2.9%) |
| 40 to 44 Minutes | 18 (1.5%) | 50 (5.3%) |
| 45 to 59 Minutes | 68 (5.8%) | 83 (8.7%) |
| 60 to 89 Minutes | 73 (6.3%) | 0 (0.0%) |
| 90 or more Minutes | 35 (3.0%) | 0 (0.0%) |
Time of Departure to Work by Sex in Cumberland County
The most frequent times of departure to work in Cumberland County are 5:00 AM to 5:29 AM (167, 14.3%) for males and 7:00 AM to 7:29 AM (179, 18.9%) for females.

| Time of Departure | Male | Female |
| 12:00 AM to 4:59 AM | 119 (10.2%) | 83 (8.7%) |
| 5:00 AM to 5:29 AM | 167 (14.3%) | 45 (4.7%) |
| 5:30 AM to 5:59 AM | 127 (10.9%) | 73 (7.7%) |
| 6:00 AM to 6:29 AM | 160 (13.7%) | 46 (4.9%) |
| 6:30 AM to 6:59 AM | 136 (11.7%) | 98 (10.3%) |
| 7:00 AM to 7:29 AM | 152 (13.0%) | 179 (18.9%) |
| 7:30 AM to 7:59 AM | 31 (2.7%) | 140 (14.7%) |
| 8:00 AM to 8:29 AM | 149 (12.8%) | 47 (5.0%) |
| 8:30 AM to 8:59 AM | 0 (0.0%) | 102 (10.7%) |
| 9:00 AM to 9:59 AM | 31 (2.7%) | 56 (5.9%) |
| 10:00 AM to 10:59 AM | 57 (4.9%) | 28 (2.9%) |
| 11:00 AM to 11:59 AM | 16 (1.4%) | 0 (0.0%) |
| 12:00 PM to 3:59 PM | 19 (1.6%) | 37 (3.9%) |
| 4:00 PM to 11:59 PM | 3 (0.3%) | 15 (1.6%) |
| Total | 1,167 (100.0%) | 949 (100.0%) |
Housing Occupancy in Cumberland County
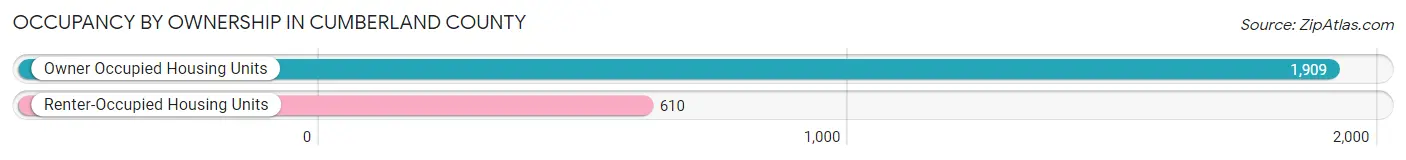
Occupancy by Ownership in Cumberland County
Of the total 2,519 dwellings in Cumberland County, owner-occupied units account for 1,909 (75.8%), while renter-occupied units make up 610 (24.2%).
| Occupancy | # Housing Units | % Housing Units |
| Owner Occupied Housing Units | 1,909 | 75.8% |
| Renter-Occupied Housing Units | 610 | 24.2% |
| Total Occupied Housing Units | 2,519 | 100.0% |
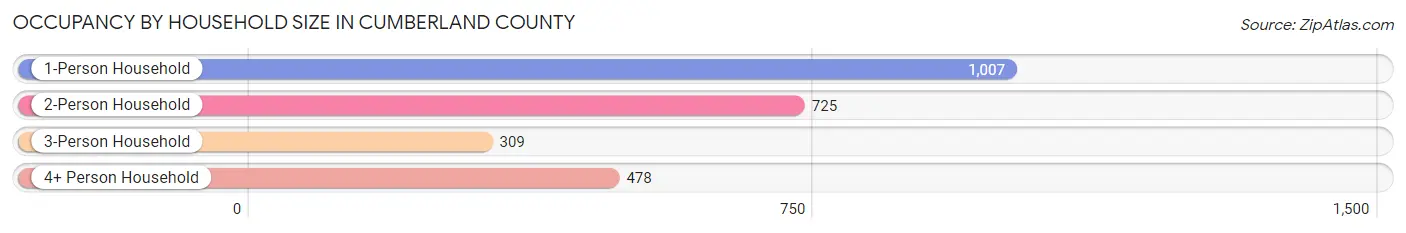
Occupancy by Household Size in Cumberland County
| Household Size | # Housing Units | % Housing Units |
| 1-Person Household | 1,007 | 40.0% |
| 2-Person Household | 725 | 28.8% |
| 3-Person Household | 309 | 12.3% |
| 4+ Person Household | 478 | 19.0% |
| Total Housing Units | 2,519 | 100.0% |
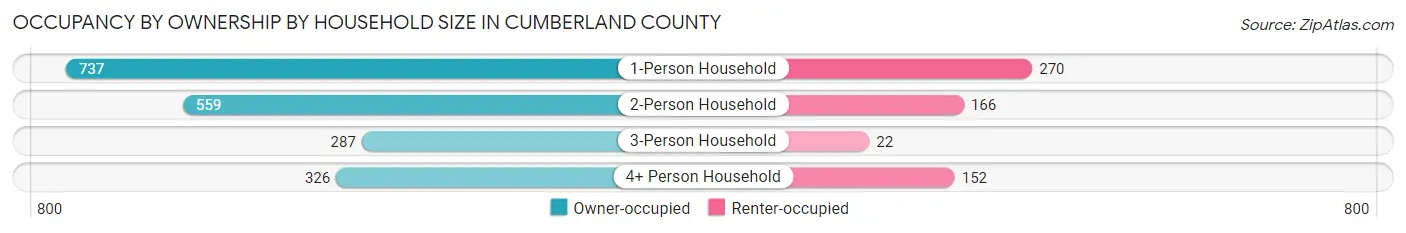
Occupancy by Ownership by Household Size in Cumberland County
| Household Size | Owner-occupied | Renter-occupied |
| 1-Person Household | 737 (73.2%) | 270 (26.8%) |
| 2-Person Household | 559 (77.1%) | 166 (22.9%) |
| 3-Person Household | 287 (92.9%) | 22 (7.1%) |
| 4+ Person Household | 326 (68.2%) | 152 (31.8%) |
| Total Housing Units | 1,909 (75.8%) | 610 (24.2%) |
Occupancy by Educational Attainment in Cumberland County

| Household Size | Owner-occupied | Renter-occupied |
| Less than High School | 312 (74.8%) | 105 (25.2%) |
| High School Diploma | 767 (73.3%) | 280 (26.7%) |
| College/Associate Degree | 389 (66.6%) | 195 (33.4%) |
| Bachelor's Degree or higher | 441 (93.6%) | 30 (6.4%) |
Occupancy by Age of Householder in Cumberland County

| Age Bracket | # Households | % Households |
| Under 35 Years | 280 | 11.1% |
| 35 to 44 Years | 324 | 12.9% |
| 45 to 54 Years | 440 | 17.5% |
| 55 to 64 Years | 640 | 25.4% |
| 65 to 74 Years | 444 | 17.6% |
| 75 to 84 Years | 310 | 12.3% |
| 85 Years and Over | 81 | 3.2% |
| Total | 2,519 | 100.0% |
Housing Finances in Cumberland County
Median Income by Occupancy in Cumberland County

| Occupancy Type | # Households | Median Income |
| Owner-Occupied | 1,909 (75.8%) | $47,973 |
| Renter-Occupied | 610 (24.2%) | $19,012 |
| Average | 2,519 (100.0%) | $40,515 |
Occupancy by Householder Income Bracket in Cumberland County

| Income Bracket | Owner-occupied | Renter-occupied |
| Less than $5,000 | 141 (7.4%) | 43 (7.0%) |
| $5,000 to $9,999 | 105 (5.5%) | 28 (4.6%) |
| $10,000 to $14,999 | 148 (7.7%) | 151 (24.7%) |
| $15,000 to $19,999 | 18 (0.9%) | 117 (19.2%) |
| $20,000 to $24,999 | 38 (2.0%) | 26 (4.3%) |
| $25,000 to $34,999 | 178 (9.3%) | 33 (5.4%) |
| $35,000 to $49,999 | 380 (19.9%) | 123 (20.2%) |
| $50,000 to $74,999 | 376 (19.7%) | 64 (10.5%) |
| $75,000 to $99,999 | 128 (6.7%) | 17 (2.8%) |
| $100,000 to $149,999 | 342 (17.9%) | 0 (0.0%) |
| $150,000 or more | 55 (2.9%) | 8 (1.3%) |
| Total | 1,909 (100.0%) | 610 (100.0%) |
Monthly Housing Cost Tiers in Cumberland County

| Monthly Cost | Owner-occupied | Renter-occupied |
| Less than $300 | 440 (23.1%) | 118 (19.3%) |
| $300 to $499 | 593 (31.1%) | 98 (16.1%) |
| $500 to $799 | 223 (11.7%) | 211 (34.6%) |
| $800 to $999 | 106 (5.6%) | 37 (6.1%) |
| $1,000 to $1,499 | 390 (20.4%) | 18 (2.9%) |
| $1,500 to $1,999 | 88 (4.6%) | 3 (0.5%) |
| $2,000 to $2,499 | 50 (2.6%) | 0 (0.0%) |
| $2,500 to $2,999 | 12 (0.6%) | 0 (0.0%) |
| $3,000 or more | 7 (0.4%) | 0 (0.0%) |
| Total | 1,909 (100.0%) | 610 (100.0%) |
Physical Housing Characteristics in Cumberland County
Housing Structures in Cumberland County

| Structure Type | # Housing Units | % Housing Units |
| Single Unit, Detached | 1,785 | 70.9% |
| Single Unit, Attached | 69 | 2.7% |
| 2 Unit Apartments | 61 | 2.4% |
| 3 or 4 Unit Apartments | 42 | 1.7% |
| 5 to 9 Unit Apartments | 37 | 1.5% |
| 10 or more Apartments | 60 | 2.4% |
| Mobile Home / Other | 465 | 18.5% |
| Total | 2,519 | 100.0% |
Housing Structures by Occupancy in Cumberland County

| Structure Type | Owner-occupied | Renter-occupied |
| Single Unit, Detached | 1,522 (85.3%) | 263 (14.7%) |
| Single Unit, Attached | 52 (75.4%) | 17 (24.6%) |
| 2 Unit Apartments | 5 (8.2%) | 56 (91.8%) |
| 3 or 4 Unit Apartments | 2 (4.8%) | 40 (95.2%) |
| 5 to 9 Unit Apartments | 0 (0.0%) | 37 (100.0%) |
| 10 or more Apartments | 0 (0.0%) | 60 (100.0%) |
| Mobile Home / Other | 328 (70.5%) | 137 (29.5%) |
| Total | 1,909 (75.8%) | 610 (24.2%) |
Housing Structures by Number of Rooms in Cumberland County

| Number of Rooms | Owner-occupied | Renter-occupied |
| 1 Room | 0 (0.0%) | 18 (2.9%) |
| 2 or 3 Rooms | 130 (6.8%) | 142 (23.3%) |
| 4 or 5 Rooms | 764 (40.0%) | 193 (31.6%) |
| 6 or 7 Rooms | 656 (34.4%) | 240 (39.3%) |
| 8 or more Rooms | 359 (18.8%) | 17 (2.8%) |
| Total | 1,909 (100.0%) | 610 (100.0%) |
Housing Structure by Heating Type in Cumberland County

| Heating Type | Owner-occupied | Renter-occupied |
| Utility Gas | 151 (7.9%) | 63 (10.3%) |
| Bottled, Tank, or LP Gas | 250 (13.1%) | 13 (2.1%) |
| Electricity | 1,279 (67.0%) | 446 (73.1%) |
| Fuel Oil or Kerosene | 0 (0.0%) | 0 (0.0%) |
| Coal or Coke | 0 (0.0%) | 0 (0.0%) |
| All other Fuels | 221 (11.6%) | 86 (14.1%) |
| No Fuel Used | 8 (0.4%) | 2 (0.3%) |
| Total | 1,909 (100.0%) | 610 (100.0%) |
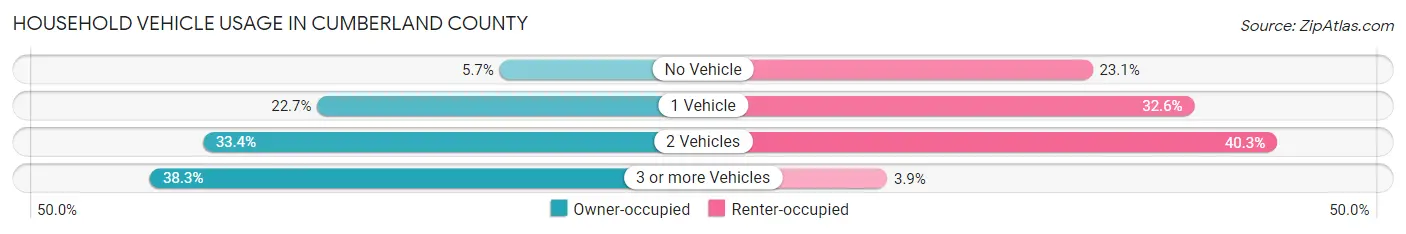
Household Vehicle Usage in Cumberland County
| Vehicles per Household | Owner-occupied | Renter-occupied |
| No Vehicle | 108 (5.7%) | 141 (23.1%) |
| 1 Vehicle | 433 (22.7%) | 199 (32.6%) |
| 2 Vehicles | 637 (33.4%) | 246 (40.3%) |
| 3 or more Vehicles | 731 (38.3%) | 24 (3.9%) |
| Total | 1,909 (100.0%) | 610 (100.0%) |
Real Estate & Mortgages in Cumberland County
Real Estate and Mortgage Overview in Cumberland County
| Characteristic | Without Mortgage | With Mortgage |
| Housing Units | 1,103 | 806 |
| Median Property Value | $114,800 | $179,600 |
| Median Household Income | $37,361 | $16 |
| Monthly Housing Costs | $347 | $7 |
| Real Estate Taxes | $693 | $40 |
Property Value by Mortgage Status in Cumberland County

| Property Value | Without Mortgage | With Mortgage |
| Less than $50,000 | 231 (20.9%) | 39 (4.8%) |
| $50,000 to $99,999 | 262 (23.7%) | 186 (23.1%) |
| $100,000 to $299,999 | 552 (50.0%) | 496 (61.5%) |
| $300,000 to $499,999 | 49 (4.4%) | 64 (7.9%) |
| $500,000 to $749,999 | 0 (0.0%) | 12 (1.5%) |
| $750,000 to $999,999 | 0 (0.0%) | 0 (0.0%) |
| $1,000,000 or more | 9 (0.8%) | 9 (1.1%) |
| Total | 1,103 (100.0%) | 806 (100.0%) |
Household Income by Mortgage Status in Cumberland County

| Household Income | Without Mortgage | With Mortgage |
| Less than $10,000 | 192 (17.4%) | 5 (0.6%) |
| $10,000 to $24,999 | 128 (11.6%) | 54 (6.7%) |
| $25,000 to $34,999 | 138 (12.5%) | 76 (9.4%) |
| $35,000 to $49,999 | 212 (19.2%) | 40 (5.0%) |
| $50,000 to $74,999 | 162 (14.7%) | 168 (20.8%) |
| $75,000 to $99,999 | 53 (4.8%) | 214 (26.6%) |
| $100,000 to $149,999 | 179 (16.2%) | 75 (9.3%) |
| $150,000 or more | 39 (3.5%) | 163 (20.2%) |
| Total | 1,103 (100.0%) | 806 (100.0%) |
Property Value to Household Income Ratio in Cumberland County
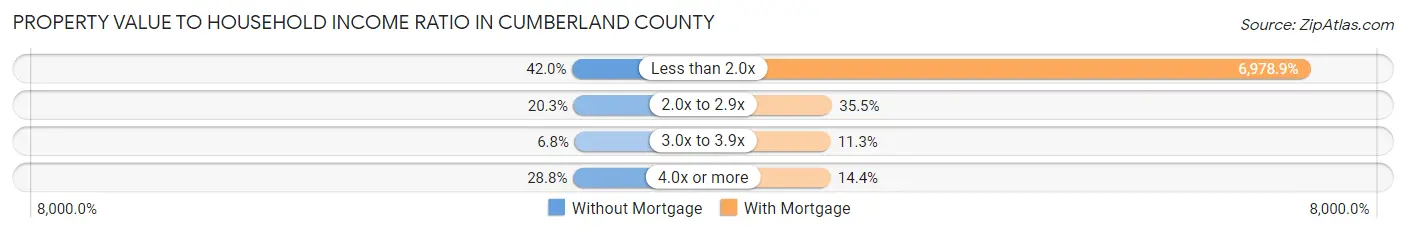
| Value-to-Income Ratio | Without Mortgage | With Mortgage |
| Less than 2.0x | 463 (42.0%) | 56,250 (6,978.9%) |
| 2.0x to 2.9x | 224 (20.3%) | 286 (35.5%) |
| 3.0x to 3.9x | 75 (6.8%) | 91 (11.3%) |
| 4.0x or more | 318 (28.8%) | 116 (14.4%) |
| Total | 1,103 (100.0%) | 806 (100.0%) |
Real Estate Taxes by Mortgage Status in Cumberland County
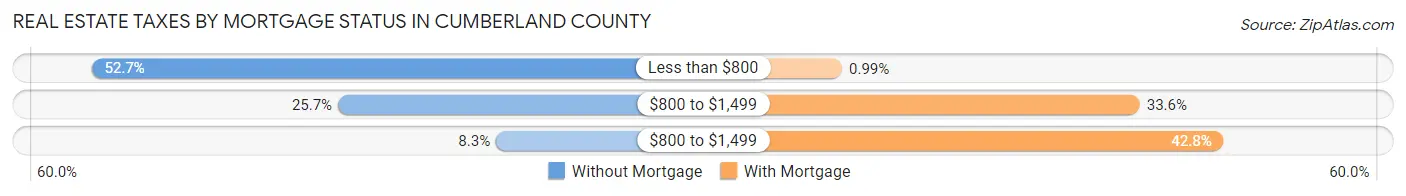
| Property Taxes | Without Mortgage | With Mortgage |
| Less than $800 | 581 (52.7%) | 8 (1.0%) |
| $800 to $1,499 | 283 (25.7%) | 271 (33.6%) |
| $800 to $1,499 | 92 (8.3%) | 345 (42.8%) |
| Total | 1,103 (100.0%) | 806 (100.0%) |
Health & Disability in Cumberland County
Health Insurance Coverage by Age in Cumberland County
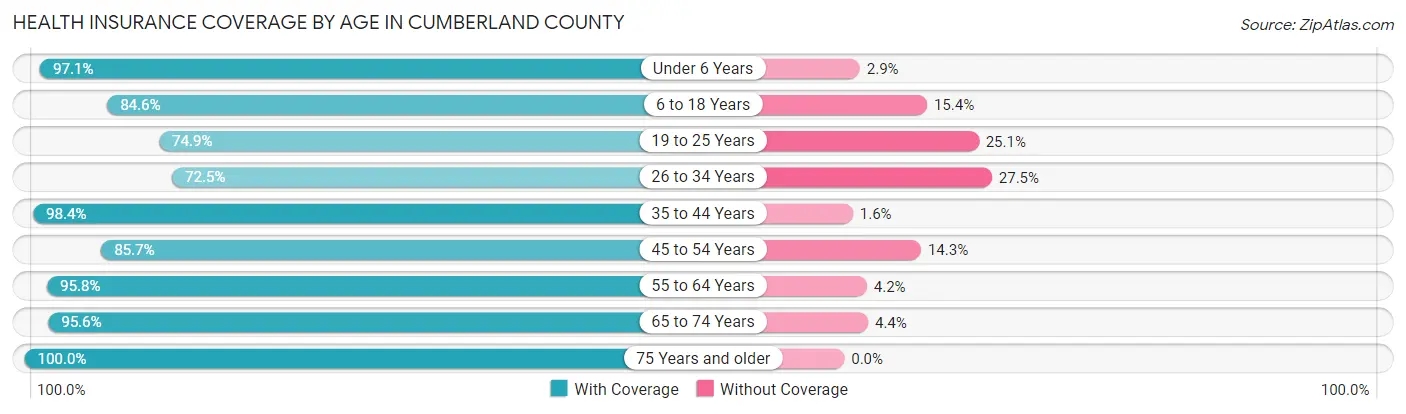
| Age Bracket | With Coverage | Without Coverage |
| Under 6 Years | 535 (97.1%) | 16 (2.9%) |
| 6 to 18 Years | 647 (84.6%) | 118 (15.4%) |
| 19 to 25 Years | 269 (74.9%) | 90 (25.1%) |
| 26 to 34 Years | 503 (72.5%) | 191 (27.5%) |
| 35 to 44 Years | 553 (98.4%) | 9 (1.6%) |
| 45 to 54 Years | 647 (85.7%) | 108 (14.3%) |
| 55 to 64 Years | 911 (95.8%) | 40 (4.2%) |
| 65 to 74 Years | 734 (95.6%) | 34 (4.4%) |
| 75 Years and older | 488 (100.0%) | 0 (0.0%) |
| Total | 5,287 (89.7%) | 606 (10.3%) |
Health Insurance Coverage by Citizenship Status in Cumberland County

| Citizenship Status | With Coverage | Without Coverage |
| Native Born | 535 (97.1%) | 16 (2.9%) |
| Foreign Born, Citizen | 647 (84.6%) | 118 (15.4%) |
| Foreign Born, not a Citizen | 269 (74.9%) | 90 (25.1%) |
Health Insurance Coverage by Household Income in Cumberland County
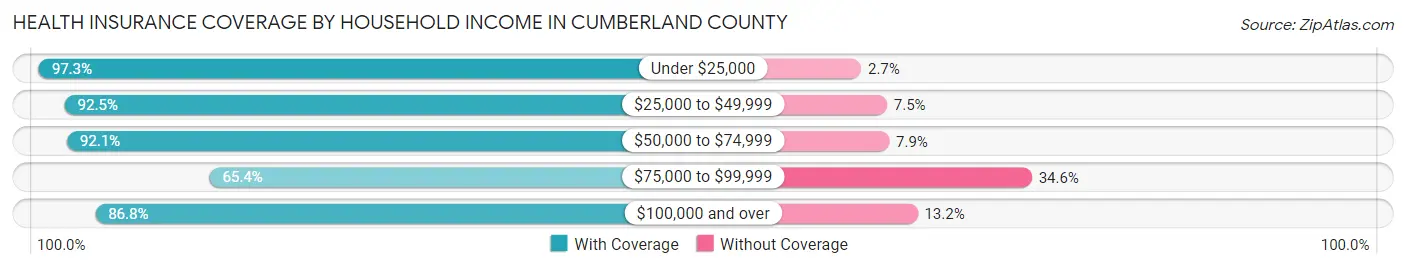
| Household Income | With Coverage | Without Coverage |
| Under $25,000 | 1,201 (97.3%) | 33 (2.7%) |
| $25,000 to $49,999 | 1,578 (92.5%) | 128 (7.5%) |
| $50,000 to $74,999 | 1,138 (92.1%) | 98 (7.9%) |
| $75,000 to $99,999 | 368 (65.4%) | 195 (34.6%) |
| $100,000 and over | 996 (86.8%) | 152 (13.2%) |
Public vs Private Health Insurance Coverage by Age in Cumberland County
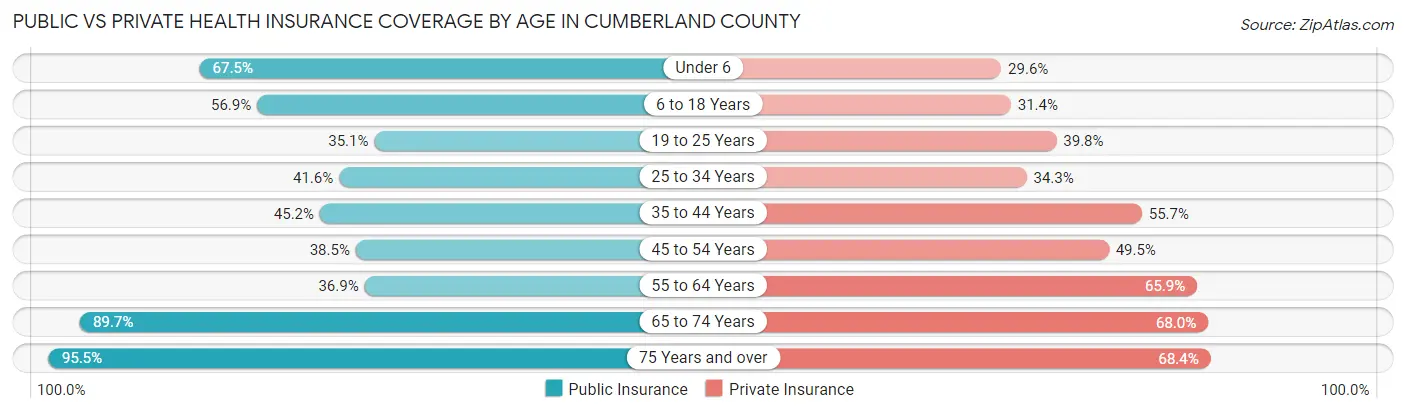
| Age Bracket | Public Insurance | Private Insurance |
| Under 6 | 372 (67.5%) | 163 (29.6%) |
| 6 to 18 Years | 435 (56.9%) | 240 (31.4%) |
| 19 to 25 Years | 126 (35.1%) | 143 (39.8%) |
| 25 to 34 Years | 289 (41.6%) | 238 (34.3%) |
| 35 to 44 Years | 254 (45.2%) | 313 (55.7%) |
| 45 to 54 Years | 291 (38.5%) | 374 (49.5%) |
| 55 to 64 Years | 351 (36.9%) | 627 (65.9%) |
| 65 to 74 Years | 689 (89.7%) | 522 (68.0%) |
| 75 Years and over | 466 (95.5%) | 334 (68.4%) |
| Total | 3,273 (55.5%) | 2,954 (50.1%) |
Disability Status by Sex by Age in Cumberland County
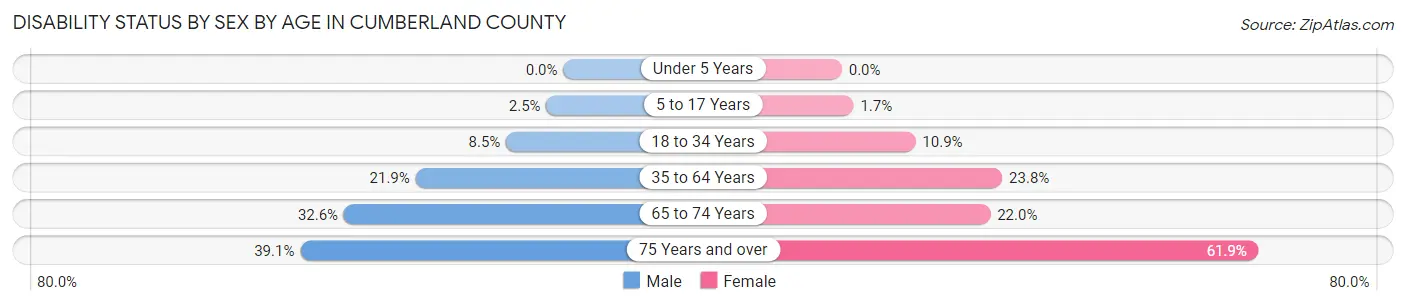
| Age Bracket | Male | Female |
| Under 5 Years | 0 (0.0%) | 0 (0.0%) |
| 5 to 17 Years | 12 (2.5%) | 8 (1.7%) |
| 18 to 34 Years | 41 (8.5%) | 66 (10.9%) |
| 35 to 64 Years | 258 (21.9%) | 260 (23.8%) |
| 65 to 74 Years | 129 (32.6%) | 82 (22.0%) |
| 75 Years and over | 84 (39.1%) | 169 (61.9%) |
Disability Class by Sex by Age in Cumberland County
Disability Class: Hearing Difficulty
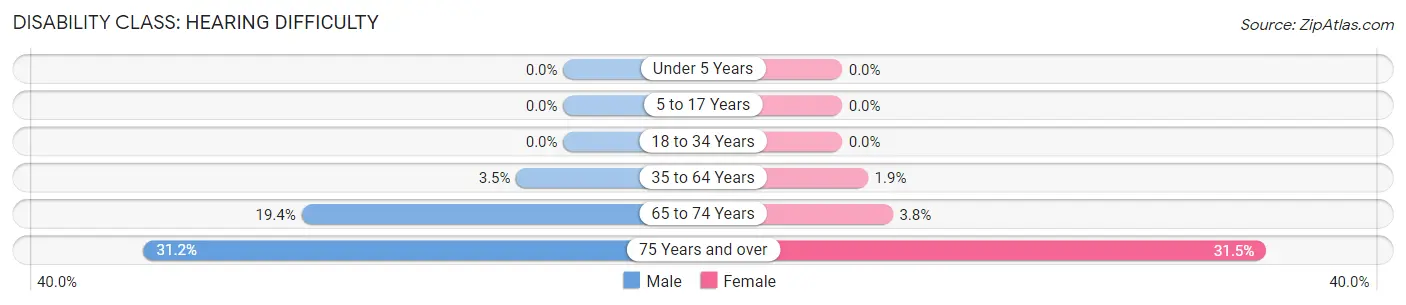
| Age Bracket | Male | Female |
| Under 5 Years | 0 (0.0%) | 0 (0.0%) |
| 5 to 17 Years | 0 (0.0%) | 0 (0.0%) |
| 18 to 34 Years | 0 (0.0%) | 0 (0.0%) |
| 35 to 64 Years | 41 (3.5%) | 21 (1.9%) |
| 65 to 74 Years | 77 (19.4%) | 14 (3.8%) |
| 75 Years and over | 67 (31.2%) | 86 (31.5%) |
Disability Class: Vision Difficulty
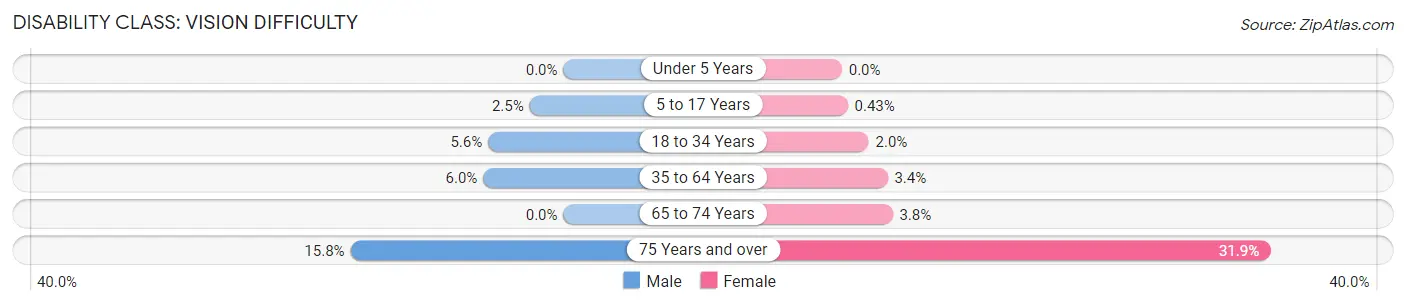
| Age Bracket | Male | Female |
| Under 5 Years | 0 (0.0%) | 0 (0.0%) |
| 5 to 17 Years | 12 (2.5%) | 2 (0.4%) |
| 18 to 34 Years | 27 (5.6%) | 12 (2.0%) |
| 35 to 64 Years | 70 (5.9%) | 37 (3.4%) |
| 65 to 74 Years | 0 (0.0%) | 14 (3.8%) |
| 75 Years and over | 34 (15.8%) | 87 (31.9%) |
Disability Class: Cognitive Difficulty
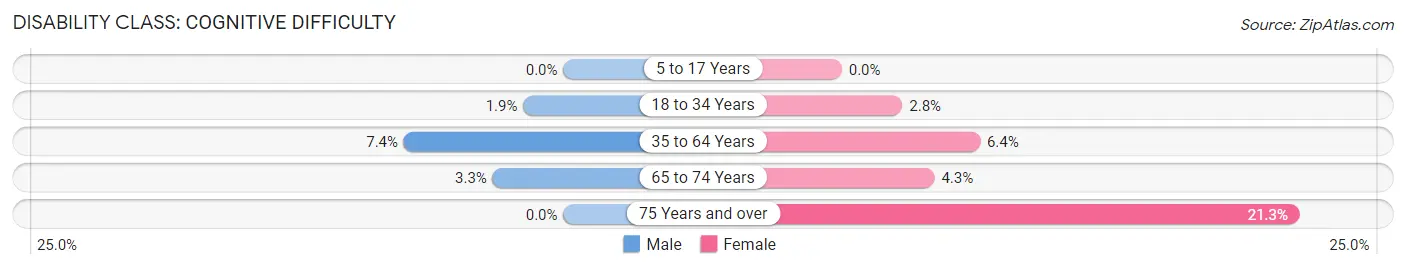
| Age Bracket | Male | Female |
| 5 to 17 Years | 0 (0.0%) | 0 (0.0%) |
| 18 to 34 Years | 9 (1.9%) | 17 (2.8%) |
| 35 to 64 Years | 87 (7.4%) | 70 (6.4%) |
| 65 to 74 Years | 13 (3.3%) | 16 (4.3%) |
| 75 Years and over | 0 (0.0%) | 58 (21.2%) |
Disability Class: Ambulatory Difficulty

| Age Bracket | Male | Female |
| 5 to 17 Years | 0 (0.0%) | 0 (0.0%) |
| 18 to 34 Years | 11 (2.3%) | 0 (0.0%) |
| 35 to 64 Years | 170 (14.5%) | 204 (18.7%) |
| 65 to 74 Years | 86 (21.7%) | 66 (17.7%) |
| 75 Years and over | 66 (30.7%) | 129 (47.2%) |
Disability Class: Self-Care Difficulty
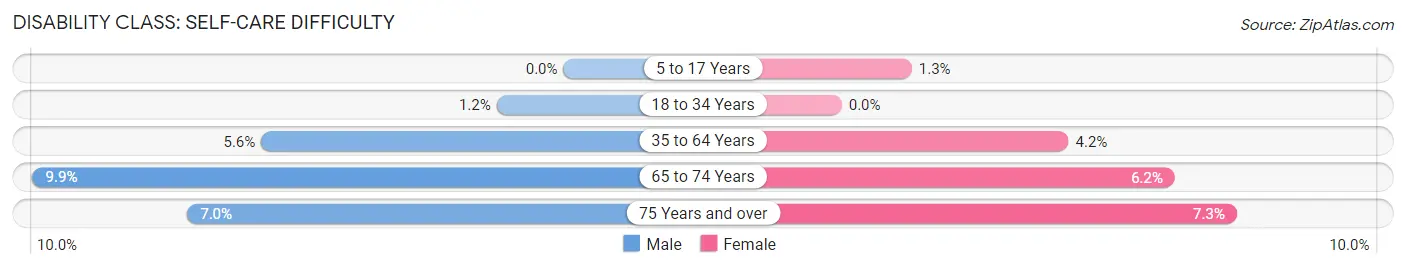
| Age Bracket | Male | Female |
| 5 to 17 Years | 0 (0.0%) | 6 (1.3%) |
| 18 to 34 Years | 6 (1.2%) | 0 (0.0%) |
| 35 to 64 Years | 66 (5.6%) | 46 (4.2%) |
| 65 to 74 Years | 39 (9.9%) | 23 (6.2%) |
| 75 Years and over | 15 (7.0%) | 20 (7.3%) |
Technology Access in Cumberland County
Computing Device Access in Cumberland County
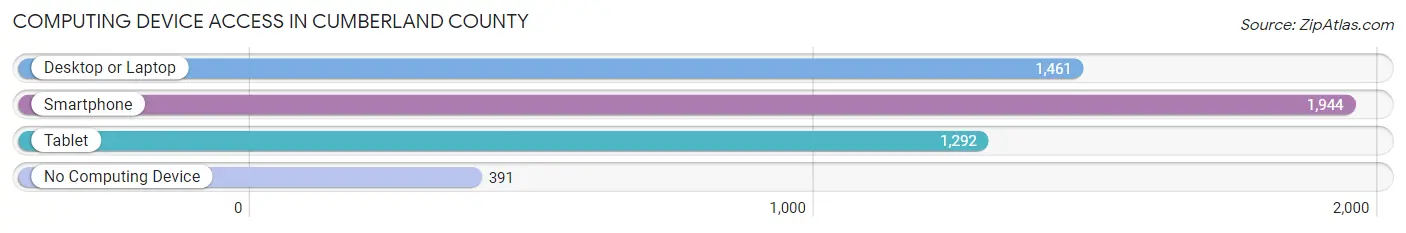
| Device Type | # Households | % Households |
| Desktop or Laptop | 1,461 | 58.0% |
| Smartphone | 1,944 | 77.2% |
| Tablet | 1,292 | 51.3% |
| No Computing Device | 391 | 15.5% |
| Total | 2,519 | 100.0% |
Internet Access in Cumberland County
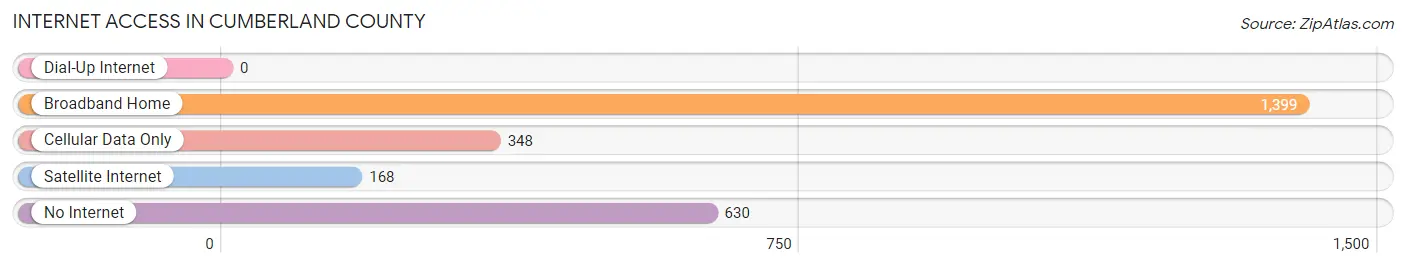
| Internet Type | # Households | % Households |
| Dial-Up Internet | 0 | 0.0% |
| Broadband Home | 1,399 | 55.5% |
| Cellular Data Only | 348 | 13.8% |
| Satellite Internet | 168 | 6.7% |
| No Internet | 630 | 25.0% |
| Total | 2,519 | 100.0% |
Cumberland County Summary
Cumberland County, Kentucky is located in the south-central part of the state, and is bordered by Clinton, Russell, Adair, and Casey counties. It is part of the Lake Cumberland region, and is home to the cities of Burkesville and Marrowbone. The county was established in 1798 and named for the Duke of Cumberland.
Geography
Cumberland County is located in the Pennyrile region of Kentucky, and is part of the Lake Cumberland area. The county is mostly rural, with rolling hills and valleys. The Cumberland River runs through the county, and there are several creeks and streams. The highest point in the county is at the intersection of KY 90 and KY 61, at an elevation of 890 feet. The county has a total area of 441 square miles, of which 439 square miles is land and 2 square miles is water.
Demographics
As of the 2010 census, Cumberland County had a population of 21,052. The racial makeup of the county was 95.3% White, 2.7% Black or African American, 0.3% Native American, 0.2% Asian, 0.1% Pacific Islander, 0.5% from other races, and 0.9% from two or more races. 1.7% of the population were Hispanic or Latino of any race.
The median income for a household in the county was $30,945, and the median income for a family was $37,945. The per capita income for the county was $16,845. About 17.2% of the population were below the poverty line.
Economy
Cumberland County’s economy is largely based on agriculture, with corn, soybeans, and tobacco being the main crops. The county also has a strong timber industry, and is home to several sawmills. The county is also home to several manufacturing companies, including a furniture factory and a plastics plant.
The county is home to several tourist attractions, including the Cumberland Falls State Resort Park, the Dale Hollow Lake State Resort Park, and the Big South Fork National River and Recreation Area. These attractions bring in tourists from all over the country, and help to boost the local economy.
History
Cumberland County was established in 1798 and named for the Duke of Cumberland. The county was originally part of Green County, and was later divided into Cumberland and Clinton counties. The county seat is Burkesville, which was established in 1810.
The county was home to several Native American tribes, including the Cherokee, Chickasaw, and Shawnee. The first European settlers arrived in the area in the late 1700s, and the county was officially established in 1798.
During the Civil War, Cumberland County was a Confederate stronghold. The county was the site of several battles, including the Battle of Burkesville in 1862. After the war, the county was largely agricultural, and the timber industry began to grow in the late 1800s.
Today, Cumberland County is a rural county with a strong agricultural and timber industry. The county is home to several tourist attractions, and is a popular destination for outdoor recreation.
Common Questions
What is the Total Population of Cumberland County?
Total Population of Cumberland County is 5,974.
What is the Total Male Population of Cumberland County?
Total Male Population of Cumberland County is 2,925.
What is the Total Female Population of Cumberland County?
Total Female Population of Cumberland County is 3,049.
What is the Ratio of Males per 100 Females in Cumberland County?
There are 95.93 Males per 100 Females in Cumberland County.
What is the Ratio of Females per 100 Males in Cumberland County?
There are 104.24 Females per 100 Males in Cumberland County.
What is the Median Population Age in Cumberland County?
Median Population Age in Cumberland County is 45.4 Years.
What is the Average Family Size in Cumberland County
Average Family Size in Cumberland County is 3.3 People.
What is the Average Household Size in Cumberland County
Average Household Size in Cumberland County is 2.3 People.
What is Per Capita Income in Cumberland County?
Per Capita income in Cumberland County is $22,668.
What is the Median Family Income in Cumberland County?
Median Family Income in Cumberland County is $56,489.
What is the Median Household income in Cumberland County?
Median Household Income in Cumberland County is $40,515.
What is Income or Wage Gap in Cumberland County?
Income or Wage Gap in Cumberland County is 31.5%.
Women in Cumberland County earn 68.5 cents for every dollar earned by a man.
What is Family Income Deficit in Cumberland County?
Family Income Deficit in Cumberland County is $8,100.
Families that are below poverty line in Cumberland County earn $8,100 less on average than the poverty threshold level.
What is Inequality or Gini Index in Cumberland County?
Inequality or Gini Index in Cumberland County is 0.46.
How Large is the Labor Force in Cumberland County?
There are 2,454 People in the Labor Forcein in Cumberland County.
What is the Percentage of People in the Labor Force in Cumberland County?
51.3% of People are in the Labor Force in Cumberland County.
What is the Unemployment Rate in Cumberland County?
Unemployment Rate in Cumberland County is 3.8%.