Christian County, KY
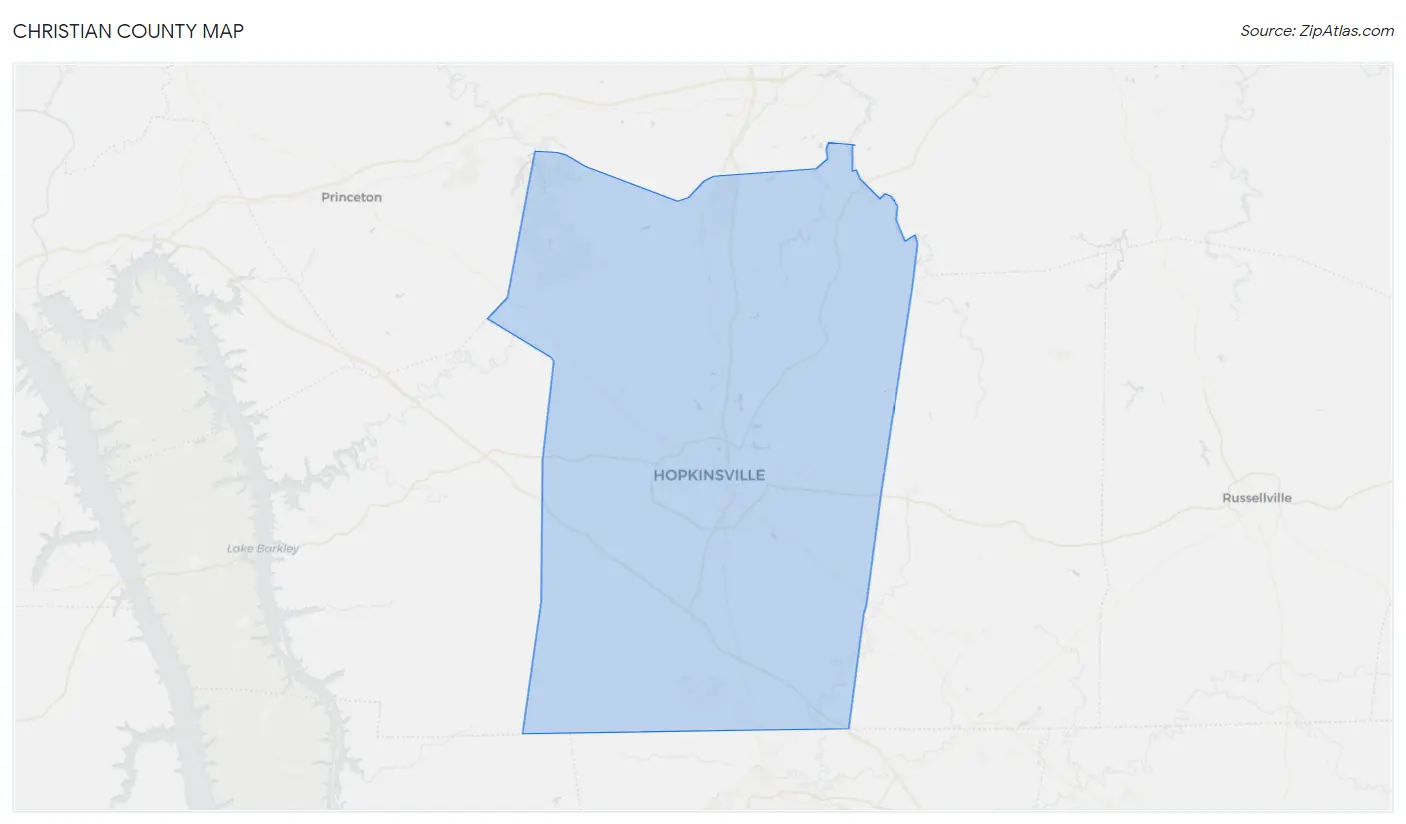
Christian County Map
Christian County Overview
72,766
TOTAL POPULATION
38,239
MALE POPULATION
34,527
FEMALE POPULATION
110.75
MALES / 100 FEMALES
90.29
FEMALES / 100 MALES
28.4
MEDIAN AGE
3.3
AVG FAMILY SIZE
2.6
AVG HOUSEHOLD SIZE
$25,973
PER CAPITA INCOME
$59,110
AVG FAMILY INCOME
$48,920
AVG HOUSEHOLD INCOME
22.2%
WAGE / INCOME GAP [ % ]
77.8¢/ $1
WAGE / INCOME GAP [ $ ]
$11,158
FAMILY INCOME DEFICIT
0.47
INEQUALITY / GINI INDEX
32,594
LABOR FORCE [ PEOPLE ]
59.9%
PERCENT IN LABOR FORCE
7.6%
UNEMPLOYMENT RATE
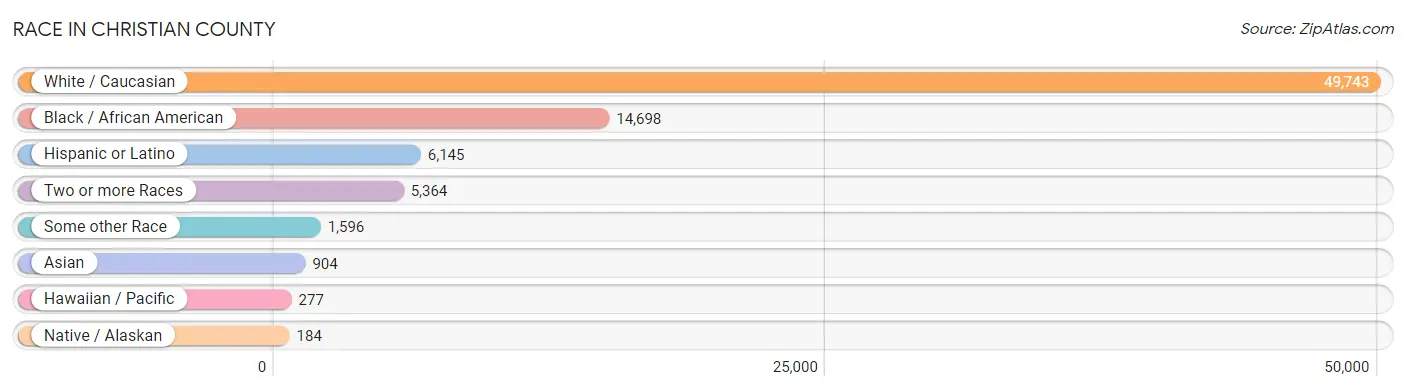
Race in Christian County
The most populous races in Christian County are White / Caucasian (49,743 | 68.4%), Black / African American (14,698 | 20.2%), and Hispanic or Latino (6,145 | 8.4%).
| Race | # Population | % Population |
| Asian | 904 | 1.2% |
| Black / African American | 14,698 | 20.2% |
| Hawaiian / Pacific | 277 | 0.4% |
| Hispanic or Latino | 6,145 | 8.4% |
| Native / Alaskan | 184 | 0.3% |
| White / Caucasian | 49,743 | 68.4% |
| Two or more Races | 5,364 | 7.4% |
| Some other Race | 1,596 | 2.2% |
| Total | 72,766 | 100.0% |
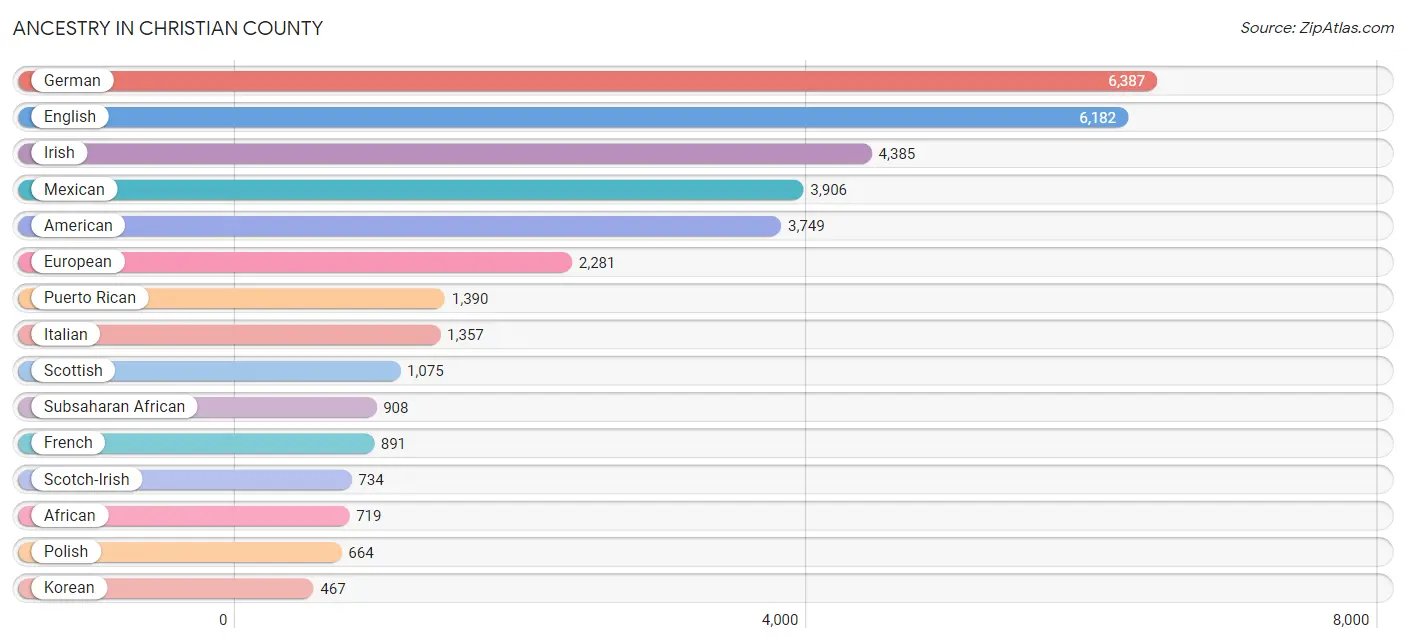
Ancestry in Christian County
The most populous ancestries reported in Christian County are German (6,387 | 8.8%), English (6,182 | 8.5%), Irish (4,385 | 6.0%), Mexican (3,906 | 5.4%), and American (3,749 | 5.1%), together accounting for 33.8% of all Christian County residents.
| Ancestry | # Population | % Population |
| African | 719 | 1.0% |
| Alaska Native | 5 | 0.0% |
| Albanian | 10 | 0.0% |
| American | 3,749 | 5.1% |
| Arab | 145 | 0.2% |
| Armenian | 7 | 0.0% |
| Austrian | 25 | 0.0% |
| Bahamian | 75 | 0.1% |
| Barbadian | 7 | 0.0% |
| Belgian | 58 | 0.1% |
| Bhutanese | 348 | 0.5% |
| Blackfeet | 5 | 0.0% |
| Bolivian | 14 | 0.0% |
| Brazilian | 294 | 0.4% |
| British | 212 | 0.3% |
| British West Indian | 33 | 0.1% |
| Burmese | 167 | 0.2% |
| Cajun | 47 | 0.1% |
| Canadian | 54 | 0.1% |
| Central American | 446 | 0.6% |
| Central American Indian | 36 | 0.1% |
| Cherokee | 295 | 0.4% |
| Chippewa | 5 | 0.0% |
| Choctaw | 22 | 0.0% |
| Colombian | 8 | 0.0% |
| Creek | 18 | 0.0% |
| Cuban | 26 | 0.0% |
| Czech | 91 | 0.1% |
| Czechoslovakian | 39 | 0.1% |
| Danish | 27 | 0.0% |
| Dominican | 112 | 0.2% |
| Dutch | 400 | 0.5% |
| Eastern European | 55 | 0.1% |
| Egyptian | 133 | 0.2% |
| English | 6,182 | 8.5% |
| European | 2,281 | 3.1% |
| Fijian | 2 | 0.0% |
| Finnish | 31 | 0.0% |
| French | 891 | 1.2% |
| French Canadian | 204 | 0.3% |
| German | 6,387 | 8.8% |
| Ghanaian | 57 | 0.1% |
| Greek | 180 | 0.3% |
| Guamanian / Chamorro | 122 | 0.2% |
| Guatemalan | 8 | 0.0% |
| Haitian | 107 | 0.2% |
| Honduran | 57 | 0.1% |
| Hungarian | 38 | 0.1% |
| Indian (Asian) | 73 | 0.1% |
| Indonesian | 61 | 0.1% |
| Iranian | 39 | 0.1% |
| Irish | 4,385 | 6.0% |
| Israeli | 84 | 0.1% |
| Italian | 1,357 | 1.9% |
| Jamaican | 83 | 0.1% |
| Kenyan | 39 | 0.1% |
| Korean | 467 | 0.6% |
| Liberian | 19 | 0.0% |
| Lithuanian | 61 | 0.1% |
| Mexican | 3,906 | 5.4% |
| Mexican American Indian | 62 | 0.1% |
| Native Hawaiian | 45 | 0.1% |
| Navajo | 13 | 0.0% |
| Nicaraguan | 210 | 0.3% |
| Nigerian | 39 | 0.1% |
| Northern European | 224 | 0.3% |
| Norwegian | 314 | 0.4% |
| Pakistani | 38 | 0.1% |
| Panamanian | 3 | 0.0% |
| Pennsylvania German | 220 | 0.3% |
| Peruvian | 1 | 0.0% |
| Polish | 664 | 0.9% |
| Portuguese | 12 | 0.0% |
| Potawatomi | 8 | 0.0% |
| Pueblo | 2 | 0.0% |
| Puerto Rican | 1,390 | 1.9% |
| Romanian | 31 | 0.0% |
| Russian | 217 | 0.3% |
| Salvadoran | 168 | 0.2% |
| Samoan | 45 | 0.1% |
| Scandinavian | 103 | 0.1% |
| Scotch-Irish | 734 | 1.0% |
| Scottish | 1,075 | 1.5% |
| Senegalese | 21 | 0.0% |
| Sioux | 8 | 0.0% |
| Slavic | 6 | 0.0% |
| Slovene | 20 | 0.0% |
| South American | 33 | 0.1% |
| Spaniard | 33 | 0.1% |
| Spanish | 59 | 0.1% |
| Sri Lankan | 162 | 0.2% |
| Subsaharan African | 908 | 1.3% |
| Swedish | 208 | 0.3% |
| Swiss | 185 | 0.3% |
| Thai | 262 | 0.4% |
| Tohono O'Odham | 1 | 0.0% |
| Welsh | 237 | 0.3% |
| West Indian | 27 | 0.0% | View All 98 Rows |
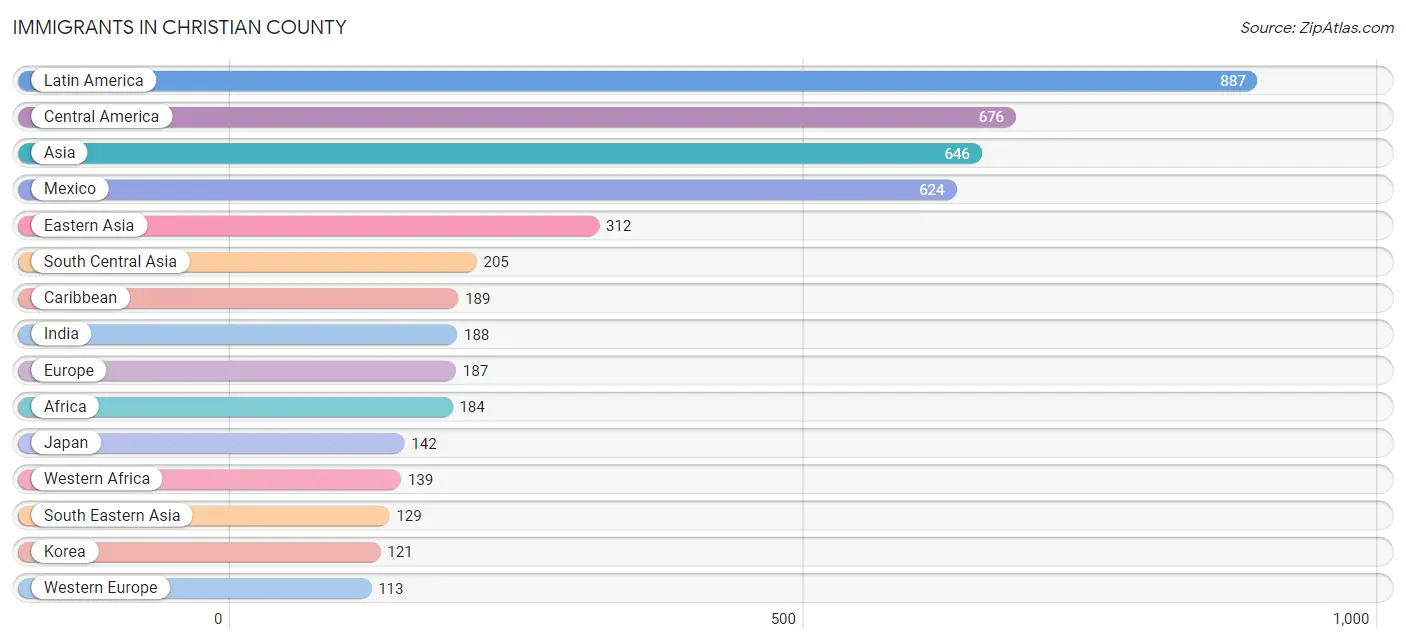
Immigrants in Christian County
The most numerous immigrant groups reported in Christian County came from Latin America (887 | 1.2%), Central America (676 | 0.9%), Asia (646 | 0.9%), Mexico (624 | 0.9%), and Eastern Asia (312 | 0.4%), together accounting for 4.3% of all Christian County residents.
| Immigration Origin | # Population | % Population |
| Africa | 184 | 0.3% |
| Asia | 646 | 0.9% |
| Austria | 6 | 0.0% |
| Bahamas | 67 | 0.1% |
| Barbados | 35 | 0.1% |
| Brazil | 10 | 0.0% |
| Canada | 34 | 0.1% |
| Caribbean | 189 | 0.3% |
| Central America | 676 | 0.9% |
| China | 49 | 0.1% |
| Colombia | 11 | 0.0% |
| Denmark | 2 | 0.0% |
| Eastern Africa | 45 | 0.1% |
| Eastern Asia | 312 | 0.4% |
| Eastern Europe | 63 | 0.1% |
| El Salvador | 9 | 0.0% |
| England | 8 | 0.0% |
| Eritrea | 10 | 0.0% |
| Europe | 187 | 0.3% |
| France | 9 | 0.0% |
| Germany | 98 | 0.1% |
| Ghana | 70 | 0.1% |
| Haiti | 32 | 0.0% |
| Honduras | 17 | 0.0% |
| India | 188 | 0.3% |
| Iran | 17 | 0.0% |
| Ireland | 1 | 0.0% |
| Jamaica | 29 | 0.0% |
| Japan | 142 | 0.2% |
| Kenya | 17 | 0.0% |
| Korea | 121 | 0.2% |
| Latin America | 887 | 1.2% |
| Liberia | 19 | 0.0% |
| Mexico | 624 | 0.9% |
| Micronesia | 49 | 0.1% |
| Nicaragua | 26 | 0.0% |
| Northern Europe | 11 | 0.0% |
| Oceania | 52 | 0.1% |
| Peru | 1 | 0.0% |
| Philippines | 70 | 0.1% |
| Poland | 19 | 0.0% |
| Russia | 36 | 0.1% |
| South America | 22 | 0.0% |
| South Central Asia | 205 | 0.3% |
| South Eastern Asia | 129 | 0.2% |
| St. Vincent and the Grenadines | 5 | 0.0% |
| Thailand | 20 | 0.0% |
| Ukraine | 8 | 0.0% |
| Western Africa | 139 | 0.2% |
| Western Europe | 113 | 0.2% | View All 50 Rows |
Sex and Age in Christian County
Sex and Age in Christian County
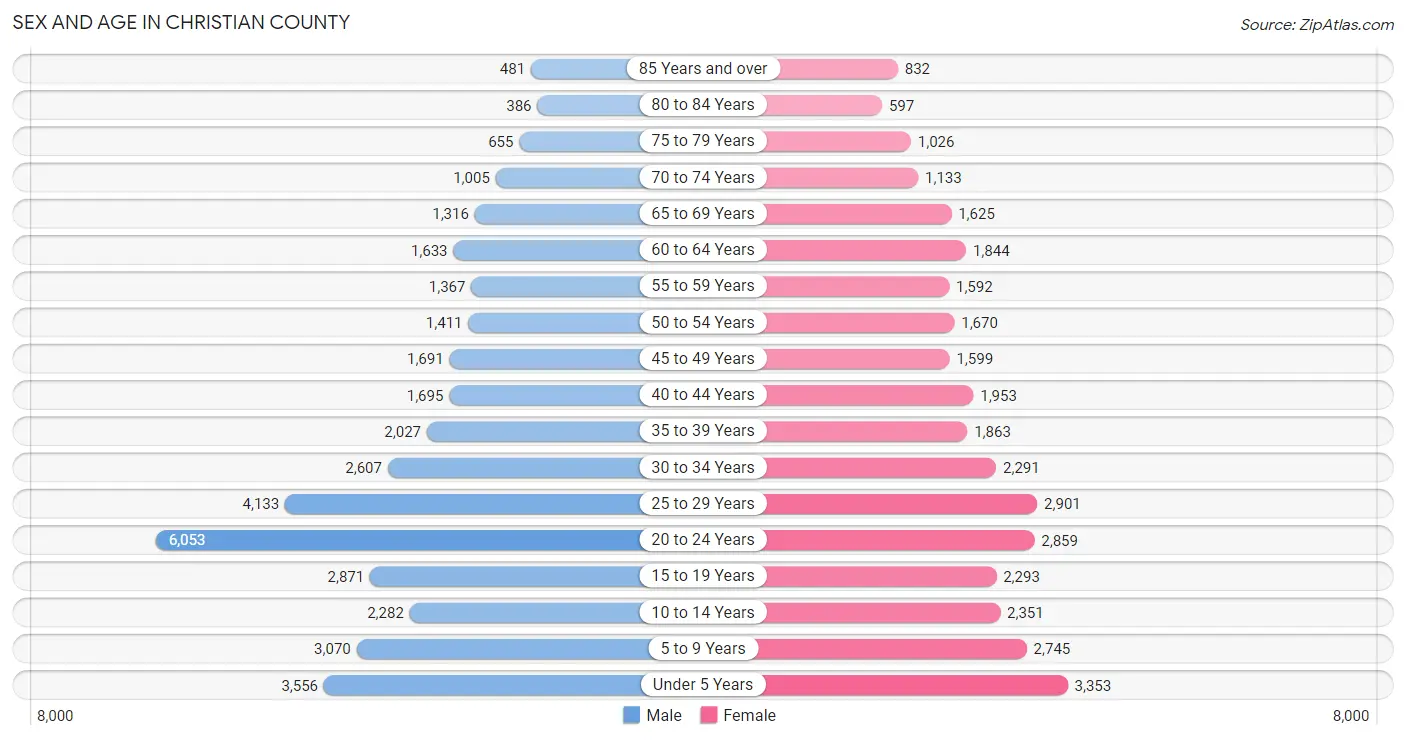
The most populous age groups in Christian County are 20 to 24 Years (6,053 | 15.8%) for men and Under 5 Years (3,353 | 9.7%) for women.
| Age Bracket | Male | Female |
| Under 5 Years | 3,556 (9.3%) | 3,353 (9.7%) |
| 5 to 9 Years | 3,070 (8.0%) | 2,745 (8.0%) |
| 10 to 14 Years | 2,282 (6.0%) | 2,351 (6.8%) |
| 15 to 19 Years | 2,871 (7.5%) | 2,293 (6.6%) |
| 20 to 24 Years | 6,053 (15.8%) | 2,859 (8.3%) |
| 25 to 29 Years | 4,133 (10.8%) | 2,901 (8.4%) |
| 30 to 34 Years | 2,607 (6.8%) | 2,291 (6.6%) |
| 35 to 39 Years | 2,027 (5.3%) | 1,863 (5.4%) |
| 40 to 44 Years | 1,695 (4.4%) | 1,953 (5.7%) |
| 45 to 49 Years | 1,691 (4.4%) | 1,599 (4.6%) |
| 50 to 54 Years | 1,411 (3.7%) | 1,670 (4.8%) |
| 55 to 59 Years | 1,367 (3.6%) | 1,592 (4.6%) |
| 60 to 64 Years | 1,633 (4.3%) | 1,844 (5.3%) |
| 65 to 69 Years | 1,316 (3.4%) | 1,625 (4.7%) |
| 70 to 74 Years | 1,005 (2.6%) | 1,133 (3.3%) |
| 75 to 79 Years | 655 (1.7%) | 1,026 (3.0%) |
| 80 to 84 Years | 386 (1.0%) | 597 (1.7%) |
| 85 Years and over | 481 (1.3%) | 832 (2.4%) |
| Total | 38,239 (100.0%) | 34,527 (100.0%) |
Families and Households in Christian County
Median Family Size in Christian County
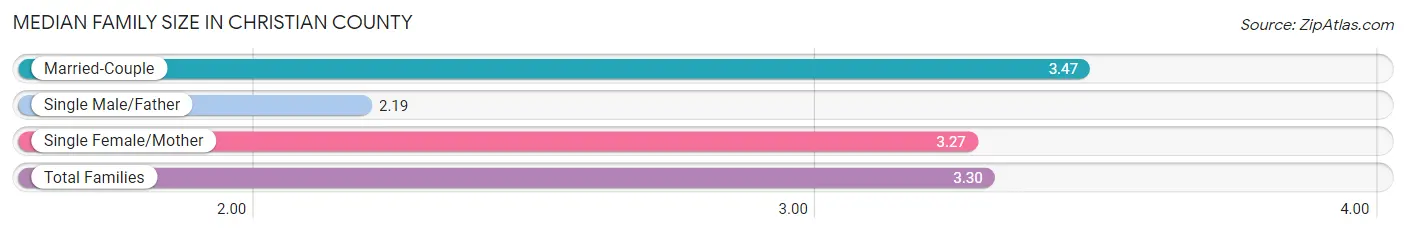
The median family size in Christian County is 3.30 persons per family, with married-couple families (11,062 | 66.3%) accounting for the largest median family size of 3.47 persons per family. On the other hand, single male/father families (1,529 | 9.2%) represent the smallest median family size with 2.19 persons per family.
| Family Type | # Families | Family Size |
| Married-Couple | 11,062 (66.3%) | 3.47 |
| Single Male/Father | 1,529 (9.2%) | 2.19 |
| Single Female/Mother | 4,105 (24.6%) | 3.27 |
| Total Families | 16,696 (100.0%) | 3.30 |
Median Household Size in Christian County
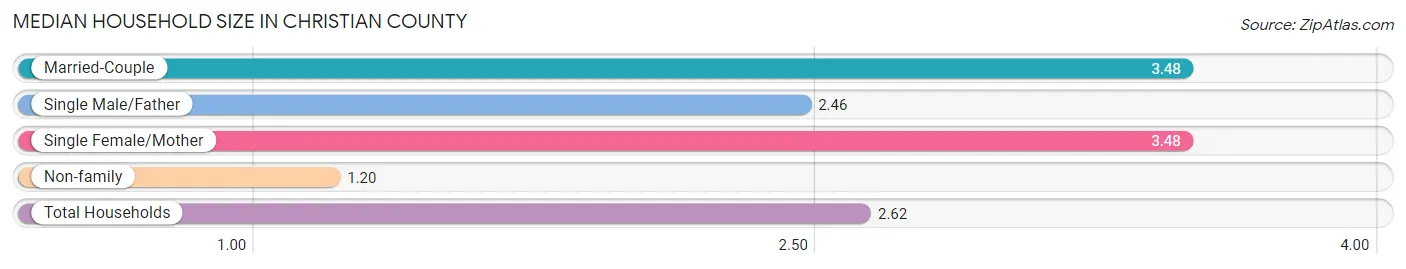
The median household size in Christian County is 2.62 persons per household, with married-couple households (11,062 | 43.2%) accounting for the largest median household size of 3.48 persons per household. non-family households (8,906 | 34.8%) represent the smallest median household size with 1.20 persons per household.
| Household Type | # Households | Household Size |
| Married-Couple | 11,062 (43.2%) | 3.48 |
| Single Male/Father | 1,529 (6.0%) | 2.46 |
| Single Female/Mother | 4,105 (16.0%) | 3.48 |
| Non-family | 8,906 (34.8%) | 1.20 |
| Total Households | 25,602 (100.0%) | 2.62 |
Household Size by Marriage Status in Christian County
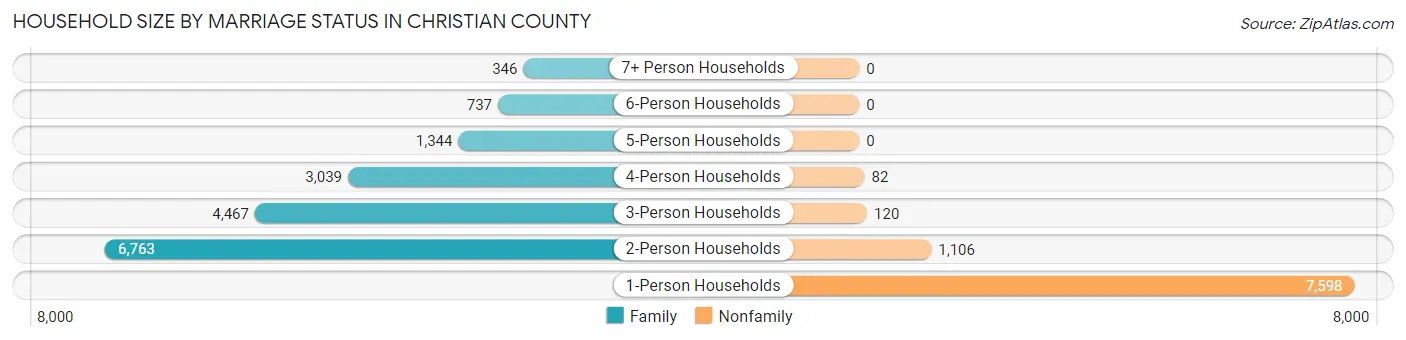
Out of a total of 25,602 households in Christian County, 16,696 (65.2%) are family households, while 8,906 (34.8%) are nonfamily households. The most numerous type of family households are 2-person households, comprising 6,763, and the most common type of nonfamily households are 1-person households, comprising 7,598.
| Household Size | Family Households | Nonfamily Households |
| 1-Person Households | - | 7,598 (29.7%) |
| 2-Person Households | 6,763 (26.4%) | 1,106 (4.3%) |
| 3-Person Households | 4,467 (17.4%) | 120 (0.5%) |
| 4-Person Households | 3,039 (11.9%) | 82 (0.3%) |
| 5-Person Households | 1,344 (5.2%) | 0 (0.0%) |
| 6-Person Households | 737 (2.9%) | 0 (0.0%) |
| 7+ Person Households | 346 (1.3%) | 0 (0.0%) |
| Total | 16,696 (65.2%) | 8,906 (34.8%) |
Female Fertility in Christian County
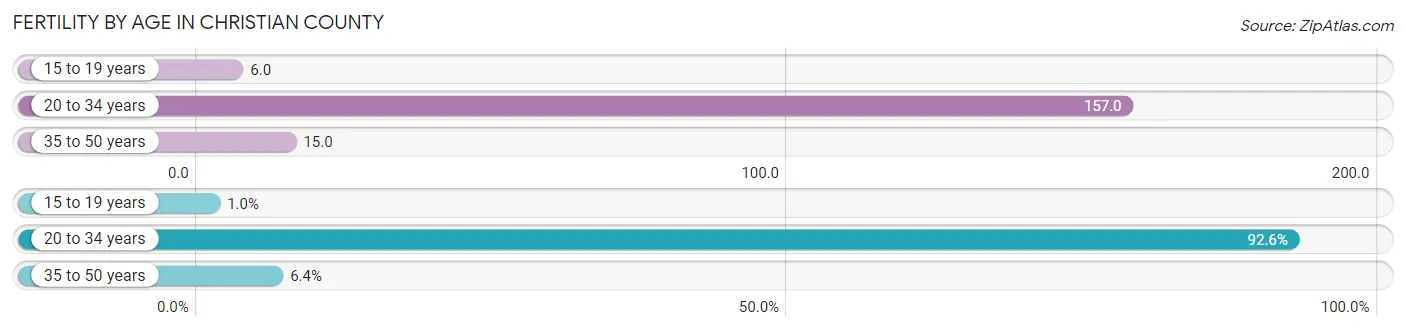
Fertility by Age in Christian County
Average fertility rate in Christian County is 84.0 births per 1,000 women. Women in the age bracket of 20 to 34 years have the highest fertility rate with 157.0 births per 1,000 women. Women in the age bracket of 20 to 34 years acount for 92.6% of all women with births.
| Age Bracket | Women with Births | Births / 1,000 Women |
| 15 to 19 years | 14 (1.0%) | 6.0 |
| 20 to 34 years | 1,263 (92.6%) | 157.0 |
| 35 to 50 years | 87 (6.4%) | 15.0 |
| Total | 1,364 (100.0%) | 84.0 |
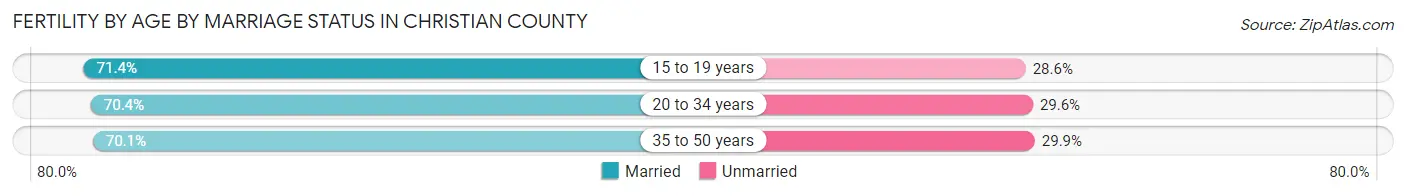
Fertility by Age by Marriage Status in Christian County
70.4% of women with births (1,364) in Christian County are married. The highest percentage of unmarried women with births falls into 35 to 50 years age bracket with 29.9% of them unmarried at the time of birth, while the lowest percentage of unmarried women with births belong to 15 to 19 years age bracket with 28.6% of them unmarried.
| Age Bracket | Married | Unmarried |
| 15 to 19 years | 10 (71.4%) | 4 (28.6%) |
| 20 to 34 years | 889 (70.4%) | 374 (29.6%) |
| 35 to 50 years | 61 (70.1%) | 26 (29.9%) |
| Total | 960 (70.4%) | 404 (29.6%) |
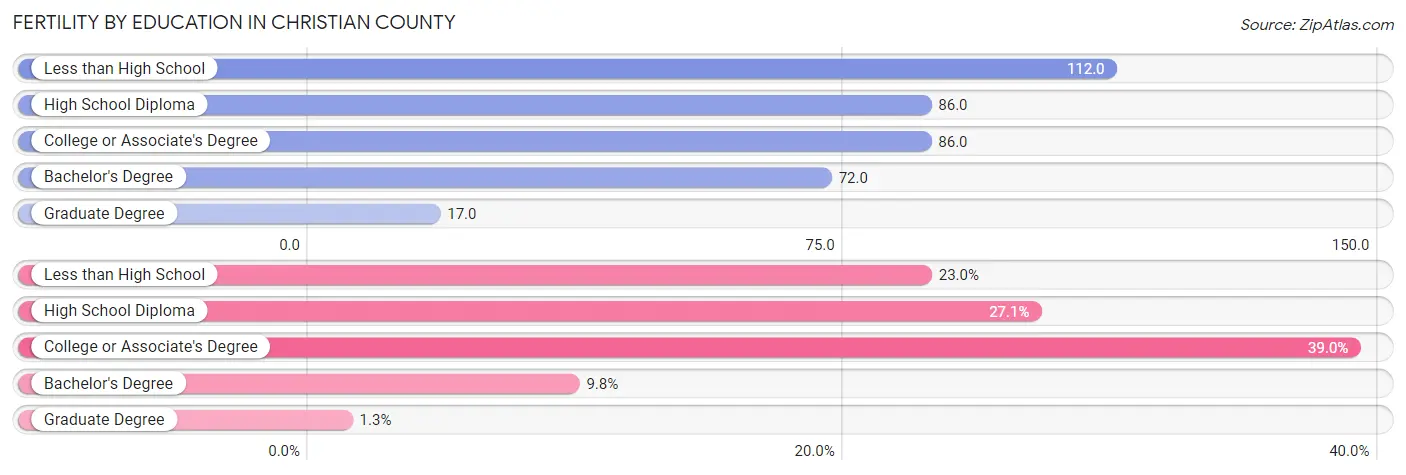
Fertility by Education in Christian County
Average fertility rate in Christian County is 84.0 births per 1,000 women. Women with the education attainment of less than high school have the highest fertility rate of 112.0 births per 1,000 women, while women with the education attainment of graduate degree have the lowest fertility at 17.0 births per 1,000 women. Women with the education attainment of college or associate's degree represent 39.0% of all women with births.
| Educational Attainment | Women with Births | Births / 1,000 Women |
| Less than High School | 313 (23.0%) | 112.0 |
| High School Diploma | 369 (27.1%) | 86.0 |
| College or Associate's Degree | 532 (39.0%) | 86.0 |
| Bachelor's Degree | 133 (9.8%) | 72.0 |
| Graduate Degree | 17 (1.3%) | 17.0 |
| Total | 1,364 (100.0%) | 84.0 |
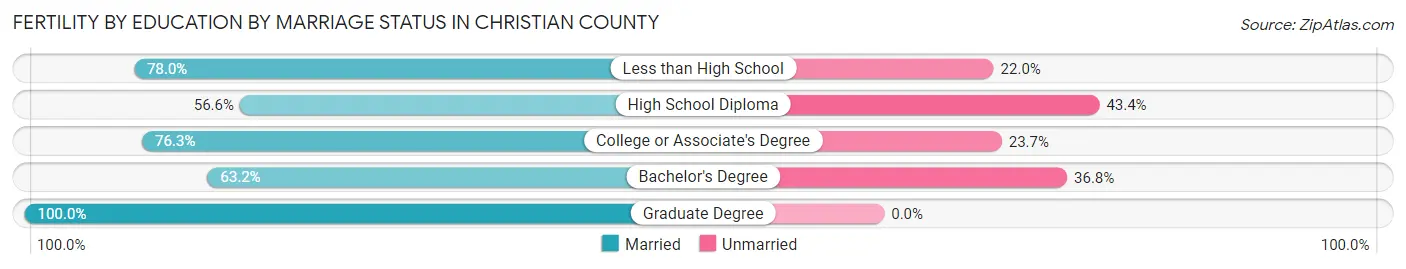
Fertility by Education by Marriage Status in Christian County
29.6% of women with births in Christian County are unmarried. Women with the educational attainment of graduate degree are most likely to be married with 100.0% of them married at childbirth, while women with the educational attainment of high school diploma are least likely to be married with 43.4% of them unmarried at childbirth.
| Educational Attainment | Married | Unmarried |
| Less than High School | 244 (78.0%) | 69 (22.0%) |
| High School Diploma | 209 (56.6%) | 160 (43.4%) |
| College or Associate's Degree | 406 (76.3%) | 126 (23.7%) |
| Bachelor's Degree | 84 (63.2%) | 49 (36.8%) |
| Graduate Degree | 17 (100.0%) | 0 (0.0%) |
| Total | 960 (70.4%) | 404 (29.6%) |
Income in Christian County
Income Overview in Christian County
Per Capita Income in Christian County is $25,973, while median incomes of families and households are $59,110 and $48,920 respectively.
| Characteristic | Number | Measure |
| Per Capita Income | 72,766 | $25,973 |
| Median Family Income | 16,696 | $59,110 |
| Mean Family Income | 16,696 | $78,115 |
| Median Household Income | 25,602 | $48,920 |
| Mean Household Income | 25,602 | $65,876 |
| Income Deficit | 16,696 | $11,158 |
| Wage / Income Gap (%) | 72,766 | 22.19% |
| Wage / Income Gap ($) | 72,766 | 77.81¢ per $1 |
| Gini / Inequality Index | 72,766 | 0.47 |
Earnings by Sex in Christian County
Average Earnings in Christian County are $33,858, $37,219 for men and $28,961 for women, a difference of 22.2%.
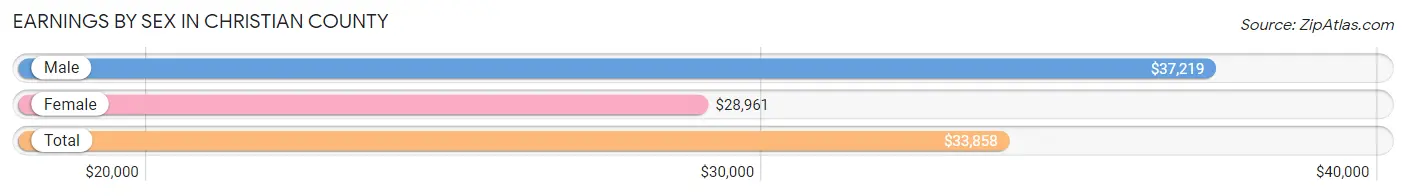
| Sex | Number | Average Earnings |
| Male | 20,436 (60.9%) | $37,219 |
| Female | 13,103 (39.1%) | $28,961 |
| Total | 33,539 (100.0%) | $33,858 |
Earnings by Sex by Income Bracket in Christian County
The most common earnings brackets in Christian County are $25,000 to $29,999 for men (3,098 | 15.2%) and $30,000 to $34,999 for women (1,202 | 9.2%).
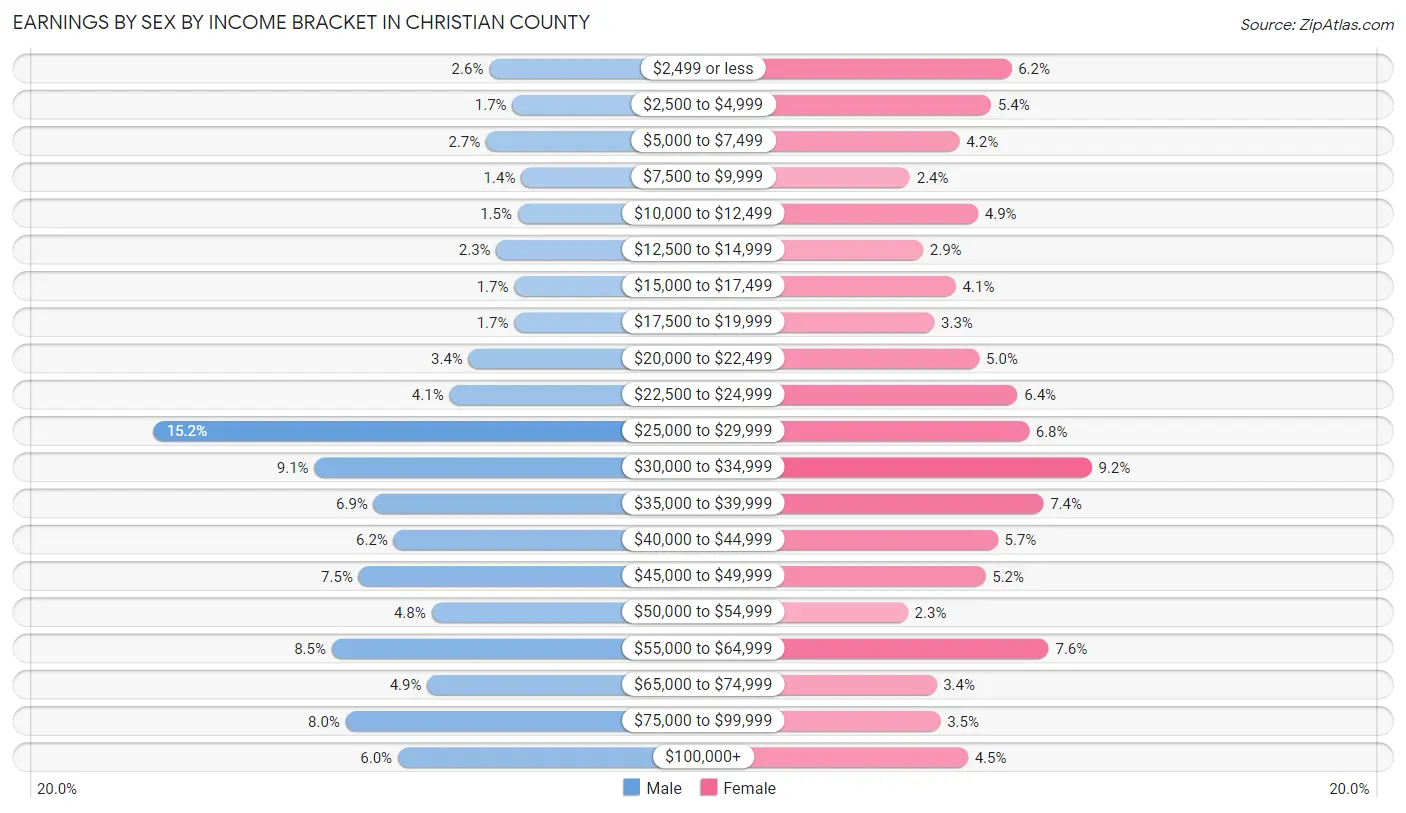
| Income | Male | Female |
| $2,499 or less | 530 (2.6%) | 807 (6.2%) |
| $2,500 to $4,999 | 351 (1.7%) | 708 (5.4%) |
| $5,000 to $7,499 | 553 (2.7%) | 553 (4.2%) |
| $7,500 to $9,999 | 285 (1.4%) | 309 (2.4%) |
| $10,000 to $12,499 | 311 (1.5%) | 643 (4.9%) |
| $12,500 to $14,999 | 475 (2.3%) | 373 (2.9%) |
| $15,000 to $17,499 | 338 (1.7%) | 535 (4.1%) |
| $17,500 to $19,999 | 337 (1.7%) | 428 (3.3%) |
| $20,000 to $22,499 | 686 (3.4%) | 650 (5.0%) |
| $22,500 to $24,999 | 834 (4.1%) | 837 (6.4%) |
| $25,000 to $29,999 | 3,098 (15.2%) | 893 (6.8%) |
| $30,000 to $34,999 | 1,868 (9.1%) | 1,202 (9.2%) |
| $35,000 to $39,999 | 1,415 (6.9%) | 964 (7.4%) |
| $40,000 to $44,999 | 1,260 (6.2%) | 740 (5.7%) |
| $45,000 to $49,999 | 1,529 (7.5%) | 680 (5.2%) |
| $50,000 to $54,999 | 970 (4.8%) | 299 (2.3%) |
| $55,000 to $64,999 | 1,736 (8.5%) | 990 (7.6%) |
| $65,000 to $74,999 | 1,003 (4.9%) | 439 (3.4%) |
| $75,000 to $99,999 | 1,629 (8.0%) | 459 (3.5%) |
| $100,000+ | 1,228 (6.0%) | 594 (4.5%) |
| Total | 20,436 (100.0%) | 13,103 (100.0%) |
Earnings by Sex by Educational Attainment in Christian County
Average earnings in Christian County are $45,634 for men and $33,599 for women, a difference of 26.4%. Men with an educational attainment of graduate degree enjoy the highest average annual earnings of $67,625, while those with less than high school education earn the least with $33,656. Women with an educational attainment of graduate degree earn the most with the average annual earnings of $55,766, while those with less than high school education have the smallest earnings of $20,694.
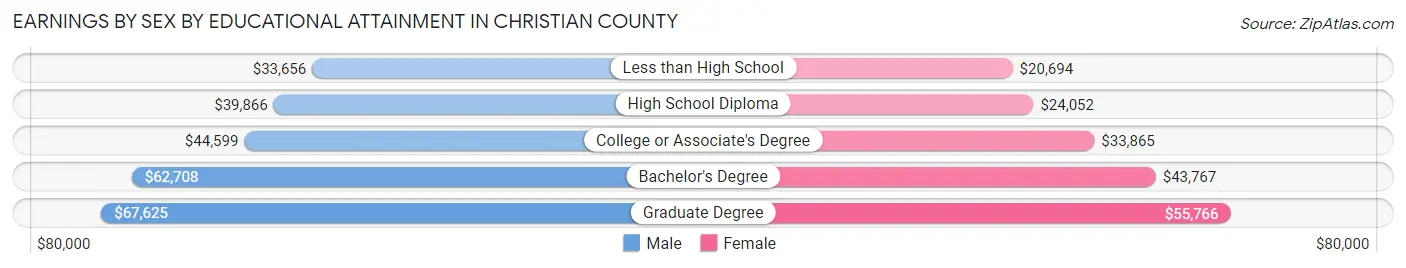
| Educational Attainment | Male Income | Female Income |
| Less than High School | $33,656 | $20,694 |
| High School Diploma | $39,866 | $24,052 |
| College or Associate's Degree | $44,599 | $33,865 |
| Bachelor's Degree | $62,708 | $43,767 |
| Graduate Degree | $67,625 | $55,766 |
| Total | $45,634 | $33,599 |
Family Income in Christian County
Family Income Brackets in Christian County
According to the Christian County family income data, there are 3,573 families falling into the $50,000 to $74,999 income range, which is the most common income bracket and makes up 21.4% of all families. Conversely, the $10,000 to $14,999 income bracket is the least frequent group with only 417 families (2.5%) belonging to this category.
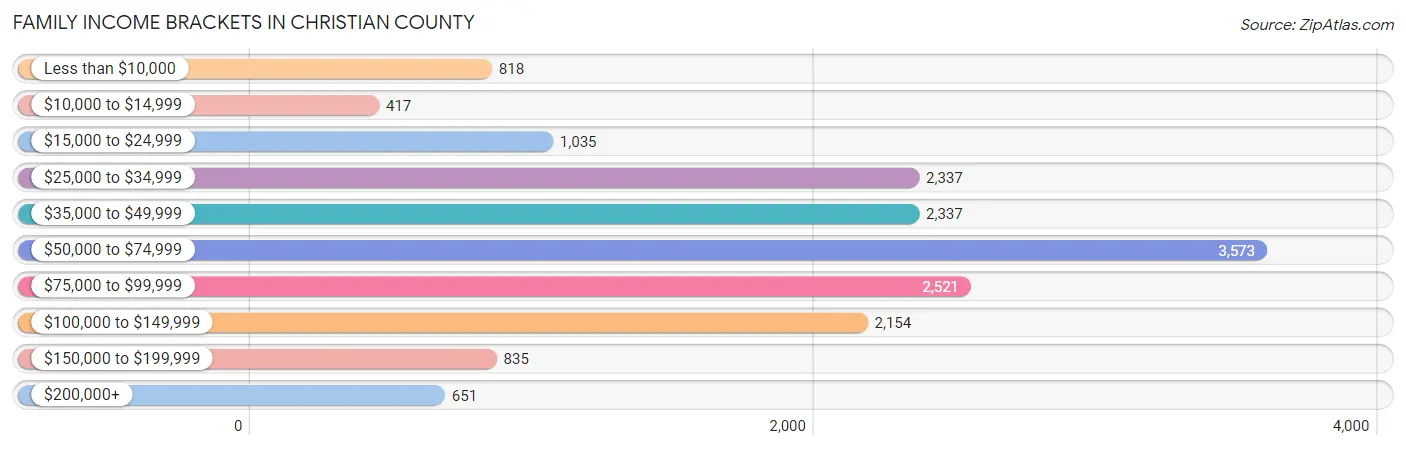
| Income Bracket | # Families | % Families |
| Less than $10,000 | 818 | 4.9% |
| $10,000 to $14,999 | 417 | 2.5% |
| $15,000 to $24,999 | 1,035 | 6.2% |
| $25,000 to $34,999 | 2,337 | 14.0% |
| $35,000 to $49,999 | 2,337 | 14.0% |
| $50,000 to $74,999 | 3,573 | 21.4% |
| $75,000 to $99,999 | 2,521 | 15.1% |
| $100,000 to $149,999 | 2,154 | 12.9% |
| $150,000 to $199,999 | 835 | 5.0% |
| $200,000+ | 651 | 3.9% |
Family Income by Famaliy Size in Christian County
7+ person families (335 | 2.0%) account for the highest median family income in Christian County with $78,250 per family, while 2-person families (7,714 | 46.2%) have the highest median income of $27,828 per family member.
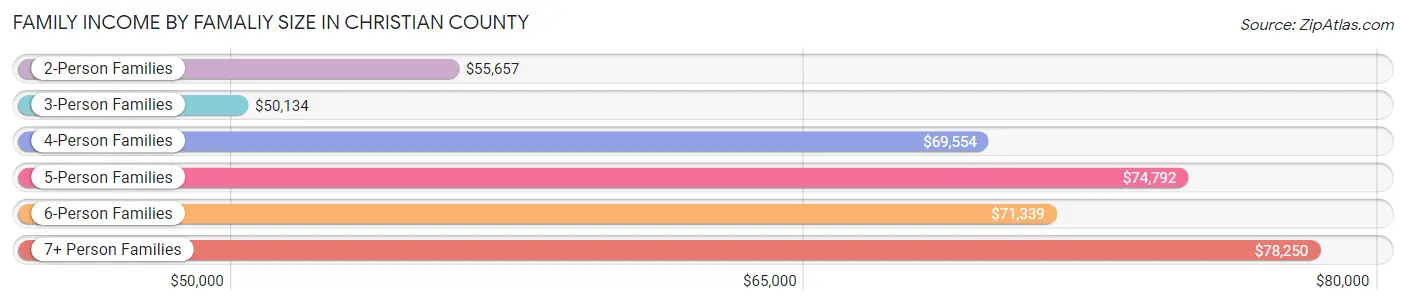
| Income Bracket | # Families | Median Income |
| 2-Person Families | 7,714 (46.2%) | $55,657 |
| 3-Person Families | 3,878 (23.2%) | $50,134 |
| 4-Person Families | 2,812 (16.8%) | $69,554 |
| 5-Person Families | 1,275 (7.6%) | $74,792 |
| 6-Person Families | 682 (4.1%) | $71,339 |
| 7+ Person Families | 335 (2.0%) | $78,250 |
| Total | 16,696 (100.0%) | $59,110 |
Family Income by Number of Earners in Christian County
The median family income in Christian County is $59,110, with families comprising 3+ earners (633) having the highest median family income of $118,438, while families with no earners (2,579) have the lowest median family income of $35,122, accounting for 3.8% and 15.4% of families, respectively.
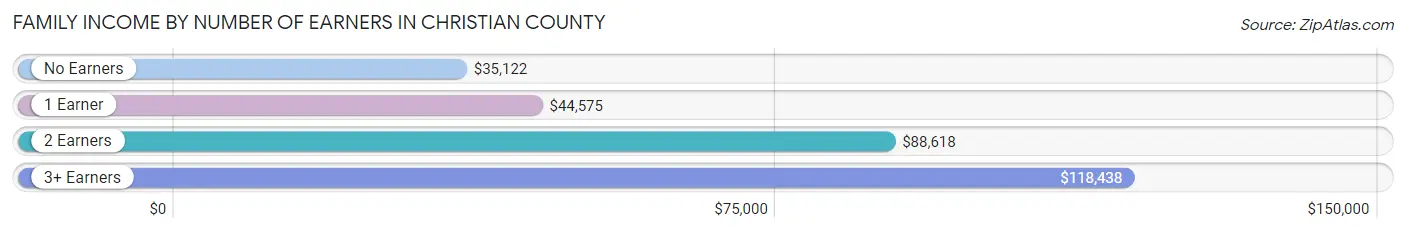
| Number of Earners | # Families | Median Income |
| No Earners | 2,579 (15.4%) | $35,122 |
| 1 Earner | 8,061 (48.3%) | $44,575 |
| 2 Earners | 5,423 (32.5%) | $88,618 |
| 3+ Earners | 633 (3.8%) | $118,438 |
| Total | 16,696 (100.0%) | $59,110 |
Household Income in Christian County
Household Income Brackets in Christian County
With 5,069 households falling in the category, the $50,000 to $74,999 income range is the most frequent in Christian County, accounting for 19.8% of all households. In contrast, only 794 households (3.1%) fall into the $200,000+ income bracket, making it the least populous group.
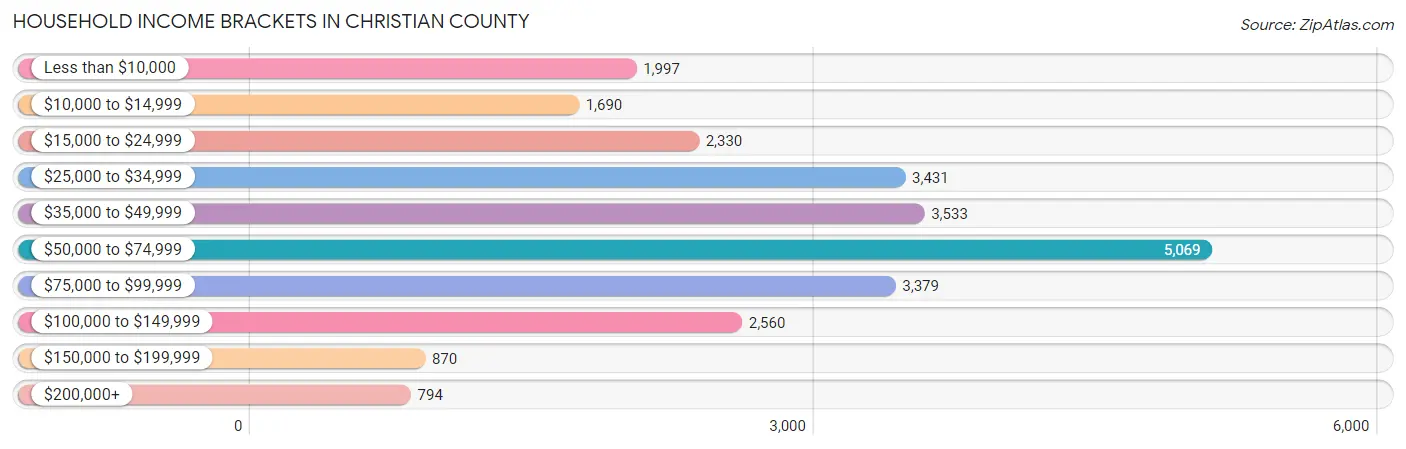
| Income Bracket | # Households | % Households |
| Less than $10,000 | 1,997 | 7.8% |
| $10,000 to $14,999 | 1,690 | 6.6% |
| $15,000 to $24,999 | 2,330 | 9.1% |
| $25,000 to $34,999 | 3,431 | 13.4% |
| $35,000 to $49,999 | 3,533 | 13.8% |
| $50,000 to $74,999 | 5,069 | 19.8% |
| $75,000 to $99,999 | 3,379 | 13.2% |
| $100,000 to $149,999 | 2,560 | 10.0% |
| $150,000 to $199,999 | 870 | 3.4% |
| $200,000+ | 794 | 3.1% |
Household Income by Householder Age in Christian County
The median household income in Christian County is $48,920, with the highest median household income of $58,182 found in the 25 to 44 years age bracket for the primary householder. A total of 9,557 households (37.3%) fall into this category. Meanwhile, the 15 to 24 years age bracket for the primary householder has the lowest median household income of $32,984, with 3,061 households (12.0%) in this group.
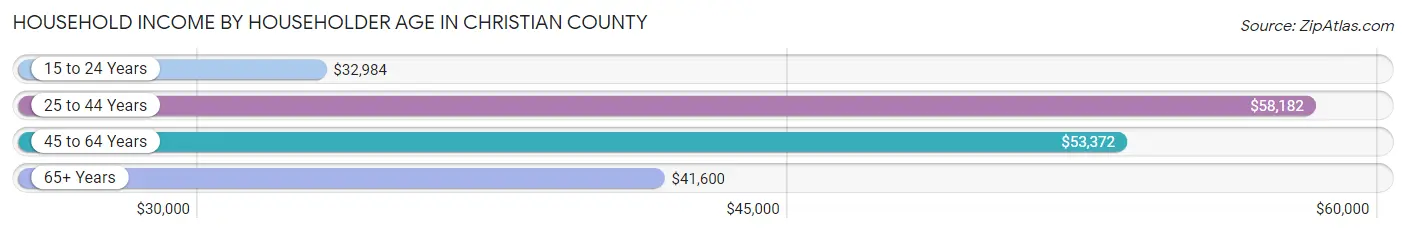
| Income Bracket | # Households | Median Income |
| 15 to 24 Years | 3,061 (12.0%) | $32,984 |
| 25 to 44 Years | 9,557 (37.3%) | $58,182 |
| 45 to 64 Years | 7,535 (29.4%) | $53,372 |
| 65+ Years | 5,449 (21.3%) | $41,600 |
| Total | 25,602 (100.0%) | $48,920 |
Poverty in Christian County
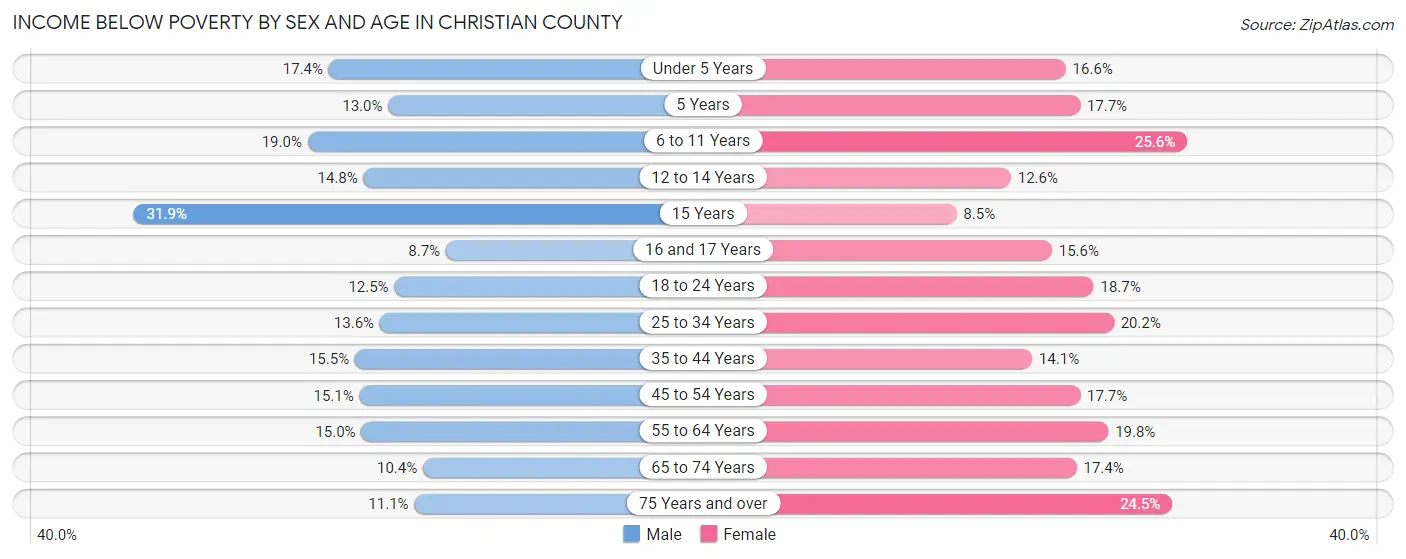
Income Below Poverty by Sex and Age in Christian County
With 14.7% poverty level for males and 18.7% for females among the residents of Christian County, 15 year old males and 6 to 11 year old females are the most vulnerable to poverty, with 163 males (31.9%) and 872 females (25.6%) in their respective age groups living below the poverty level.
| Age Bracket | Male | Female |
| Under 5 Years | 600 (17.4%) | 546 (16.6%) |
| 5 Years | 71 (13.0%) | 67 (17.7%) |
| 6 to 11 Years | 654 (19.0%) | 872 (25.6%) |
| 12 to 14 Years | 186 (14.8%) | 164 (12.6%) |
| 15 Years | 163 (31.9%) | 41 (8.5%) |
| 16 and 17 Years | 65 (8.7%) | 142 (15.6%) |
| 18 to 24 Years | 602 (12.5%) | 665 (18.7%) |
| 25 to 34 Years | 764 (13.6%) | 1,033 (20.2%) |
| 35 to 44 Years | 510 (15.5%) | 535 (14.1%) |
| 45 to 54 Years | 454 (15.1%) | 572 (17.7%) |
| 55 to 64 Years | 441 (15.0%) | 673 (19.8%) |
| 65 to 74 Years | 237 (10.4%) | 477 (17.4%) |
| 75 Years and over | 156 (11.1%) | 537 (24.5%) |
| Total | 4,903 (14.7%) | 6,324 (18.7%) |
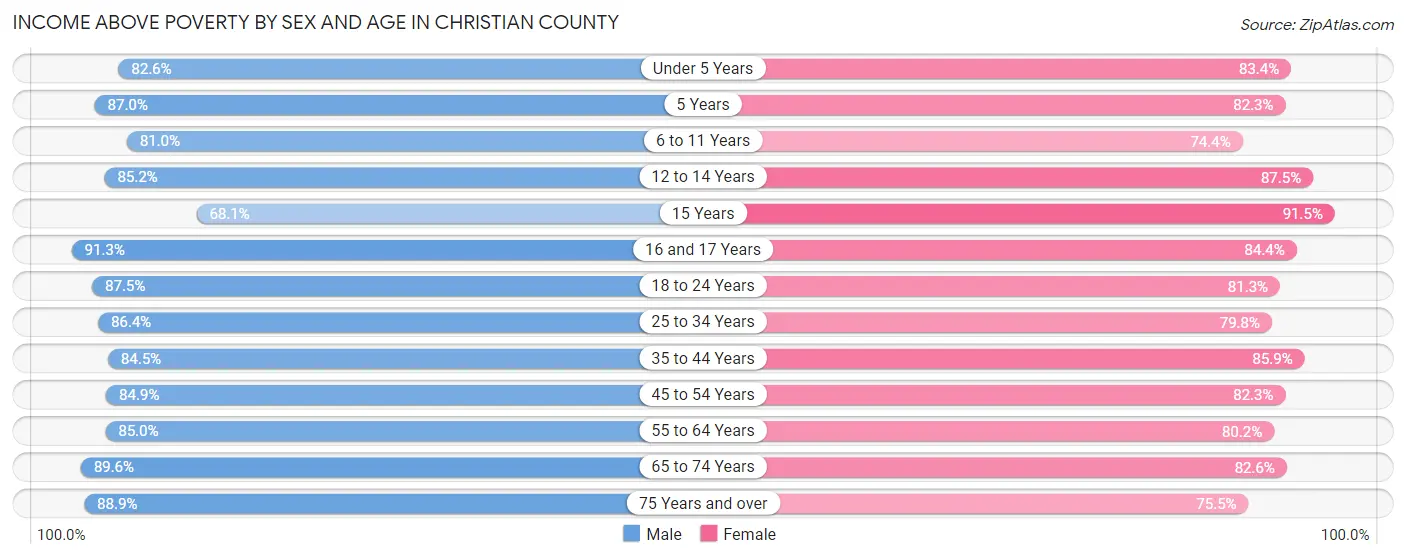
Income Above Poverty by Sex and Age in Christian County
According to the poverty statistics in Christian County, males aged 16 and 17 years and females aged 15 years are the age groups that are most secure financially, with 91.3% of males and 91.5% of females in these age groups living above the poverty line.
| Age Bracket | Male | Female |
| Under 5 Years | 2,847 (82.6%) | 2,740 (83.4%) |
| 5 Years | 475 (87.0%) | 312 (82.3%) |
| 6 to 11 Years | 2,792 (81.0%) | 2,530 (74.4%) |
| 12 to 14 Years | 1,068 (85.2%) | 1,143 (87.5%) |
| 15 Years | 348 (68.1%) | 441 (91.5%) |
| 16 and 17 Years | 680 (91.3%) | 769 (84.4%) |
| 18 to 24 Years | 4,198 (87.5%) | 2,894 (81.3%) |
| 25 to 34 Years | 4,846 (86.4%) | 4,083 (79.8%) |
| 35 to 44 Years | 2,787 (84.5%) | 3,254 (85.9%) |
| 45 to 54 Years | 2,547 (84.9%) | 2,662 (82.3%) |
| 55 to 64 Years | 2,500 (85.0%) | 2,730 (80.2%) |
| 65 to 74 Years | 2,037 (89.6%) | 2,259 (82.6%) |
| 75 Years and over | 1,255 (88.9%) | 1,652 (75.5%) |
| Total | 28,380 (85.3%) | 27,469 (81.3%) |
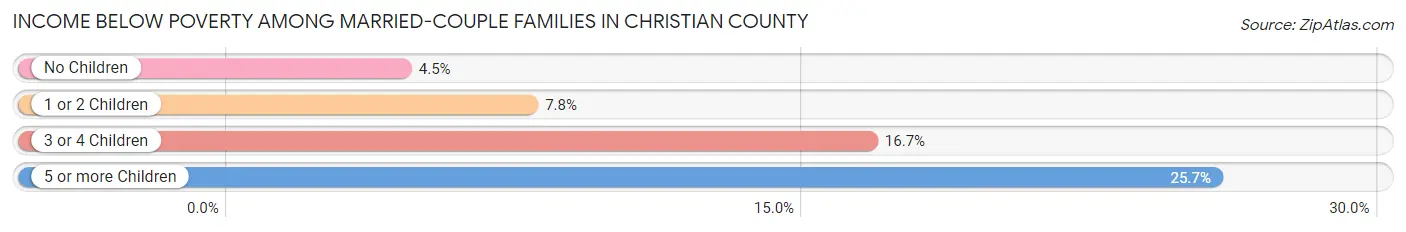
Income Below Poverty Among Married-Couple Families in Christian County
The poverty statistics for married-couple families in Christian County show that 7.6% or 845 of the total 11,062 families live below the poverty line. Families with 5 or more children have the highest poverty rate of 25.7%, comprising of 63 families. On the other hand, families with no children have the lowest poverty rate of 4.5%, which includes 246 families.
| Children | Above Poverty | Below Poverty |
| No Children | 5,174 (95.5%) | 246 (4.5%) |
| 1 or 2 Children | 3,799 (92.2%) | 323 (7.8%) |
| 3 or 4 Children | 1,062 (83.3%) | 213 (16.7%) |
| 5 or more Children | 182 (74.3%) | 63 (25.7%) |
| Total | 10,217 (92.4%) | 845 (7.6%) |
Income Below Poverty Among Single-Parent Households in Christian County
According to the poverty data in Christian County, 8.6% or 131 single-father households and 27.7% or 1,135 single-mother households are living below the poverty line. Among single-father households, those with 1 or 2 children have the highest poverty rate, with 121 households (11.2%) experiencing poverty. Likewise, among single-mother households, those with 3 or 4 children have the highest poverty rate, with 187 households (38.6%) falling below the poverty line.

| Children | Single Father | Single Mother |
| No Children | 10 (2.2%) | 223 (17.0%) |
| 1 or 2 Children | 121 (11.2%) | 713 (32.0%) |
| 3 or 4 Children | 0 (0.0%) | 187 (38.6%) |
| 5 or more Children | 0 (0.0%) | 12 (14.5%) |
| Total | 131 (8.6%) | 1,135 (27.7%) |
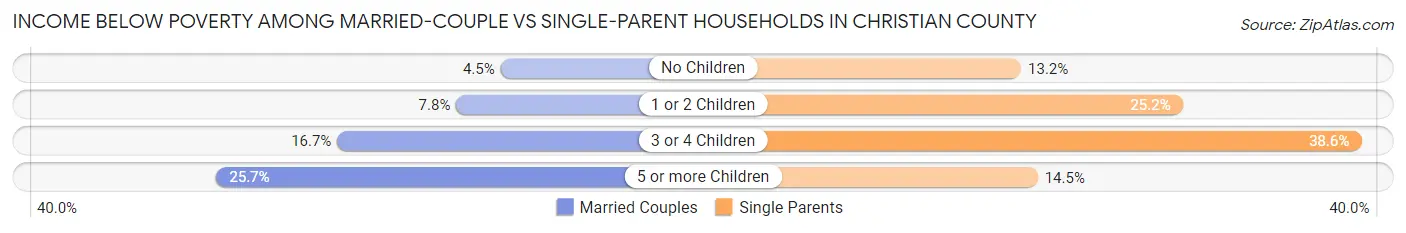
Income Below Poverty Among Married-Couple vs Single-Parent Households in Christian County
The poverty data for Christian County shows that 845 of the married-couple family households (7.6%) and 1,266 of the single-parent households (22.5%) are living below the poverty level. Within the married-couple family households, those with 5 or more children have the highest poverty rate, with 63 households (25.7%) falling below the poverty line. Among the single-parent households, those with 3 or 4 children have the highest poverty rate, with 187 household (38.6%) living below poverty.
| Children | Married-Couple Families | Single-Parent Households |
| No Children | 246 (4.5%) | 233 (13.2%) |
| 1 or 2 Children | 323 (7.8%) | 834 (25.2%) |
| 3 or 4 Children | 213 (16.7%) | 187 (38.6%) |
| 5 or more Children | 63 (25.7%) | 12 (14.5%) |
| Total | 845 (7.6%) | 1,266 (22.5%) |
Employment Characteristics in Christian County
Employment by Class of Employer in Christian County
Among the 30,102 employed individuals in Christian County, private company employees (16,055 | 53.3%), federal government employees (7,648 | 25.4%), and self-employed (not incorporated) (1,845 | 6.1%) make up the most common classes of employment.
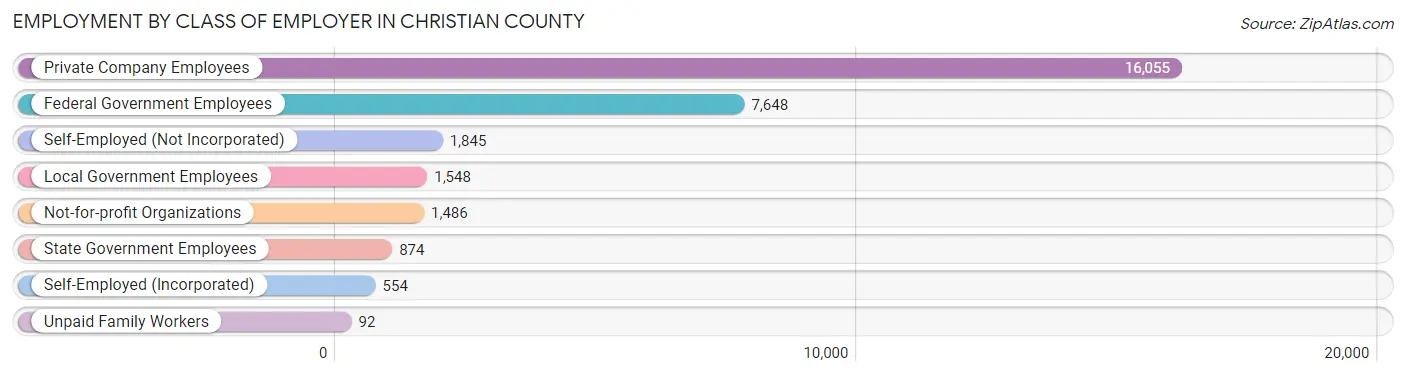
| Employer Class | # Employees | % Employees |
| Private Company Employees | 16,055 | 53.3% |
| Self-Employed (Incorporated) | 554 | 1.8% |
| Self-Employed (Not Incorporated) | 1,845 | 6.1% |
| Not-for-profit Organizations | 1,486 | 4.9% |
| Local Government Employees | 1,548 | 5.1% |
| State Government Employees | 874 | 2.9% |
| Federal Government Employees | 7,648 | 25.4% |
| Unpaid Family Workers | 92 | 0.3% |
| Total | 30,102 | 100.0% |
Employment Status by Age in Christian County
According to the labor force statistics for Christian County, out of the total population over 16 years of age (54,414), 59.9% or 32,594 individuals are in the labor force, with 7.6% or 2,477 of them unemployed. The age group with the highest labor force participation rate is 20 to 24 years, with 79.0% or 7,040 individuals in the labor force. Within the labor force, the 16 to 19 years age range has the highest percentage of unemployed individuals, with 15.0% or 352 of them being unemployed.
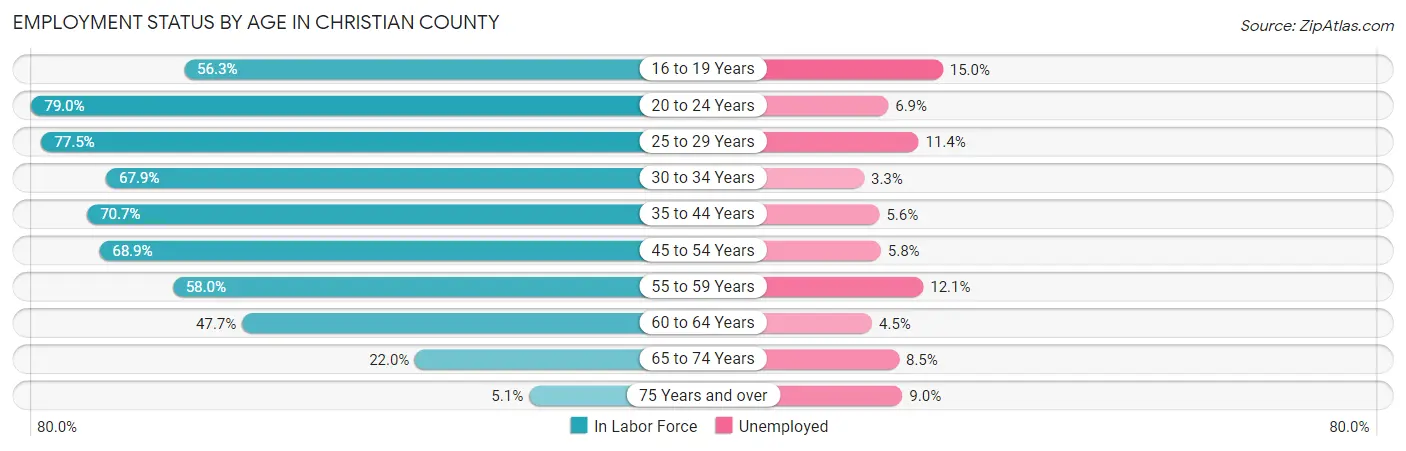
| Age Bracket | In Labor Force | Unemployed |
| 16 to 19 Years | 2,347 (56.3%) | 352 (15.0%) |
| 20 to 24 Years | 7,040 (79.0%) | 486 (6.9%) |
| 25 to 29 Years | 5,451 (77.5%) | 621 (11.4%) |
| 30 to 34 Years | 3,326 (67.9%) | 110 (3.3%) |
| 35 to 44 Years | 5,329 (70.7%) | 298 (5.6%) |
| 45 to 54 Years | 4,390 (68.9%) | 255 (5.8%) |
| 55 to 59 Years | 1,716 (58.0%) | 208 (12.1%) |
| 60 to 64 Years | 1,659 (47.7%) | 75 (4.5%) |
| 65 to 74 Years | 1,117 (22.0%) | 95 (8.5%) |
| 75 Years and over | 203 (5.1%) | 18 (9.0%) |
| Total | 32,594 (59.9%) | 2,477 (7.6%) |
Employment Status by Educational Attainment in Christian County
According to labor force statistics for Christian County, 67.8% of individuals (21,884) out of the total population between 25 and 64 years of age (32,277) are in the labor force, with 7.0% or 1,532 of them being unemployed. The group with the highest labor force participation rate are those with the educational attainment of bachelor's degree or higher, with 85.9% or 5,229 individuals in the labor force. Within the labor force, individuals with less than high school education have the highest percentage of unemployment, with 13.0% or 236 of them being unemployed.
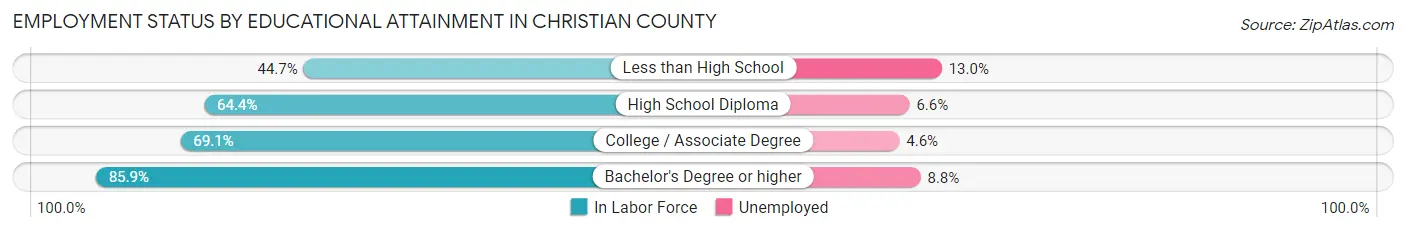
| Educational Attainment | In Labor Force | Unemployed |
| Less than High School | 1,813 (44.7%) | 527 (13.0%) |
| High School Diploma | 6,448 (64.4%) | 661 (6.6%) |
| College / Associate Degree | 8,376 (69.1%) | 558 (4.6%) |
| Bachelor's Degree or higher | 5,229 (85.9%) | 536 (8.8%) |
| Total | 21,884 (67.8%) | 2,259 (7.0%) |
Employment Occupations by Sex in Christian County
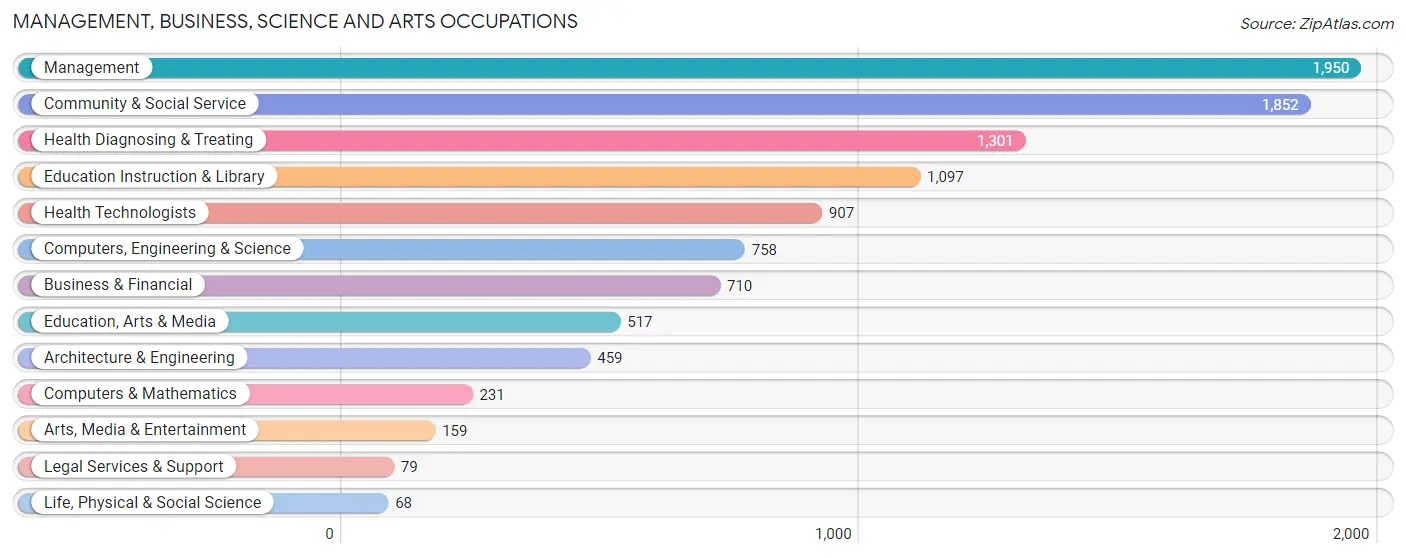
Management, Business, Science and Arts Occupations
The most common Management, Business, Science and Arts occupations in Christian County are Management (1,950 | 8.1%), Community & Social Service (1,852 | 7.7%), Health Diagnosing & Treating (1,301 | 5.4%), Education Instruction & Library (1,097 | 4.6%), and Health Technologists (907 | 3.8%).
Management, Business, Science and Arts Occupations by Sex
Within the Management, Business, Science and Arts occupations in Christian County, the most male-oriented occupations are Architecture & Engineering (85.0%), Computers, Engineering & Science (74.8%), and Computers & Mathematics (65.4%), while the most female-oriented occupations are Education Instruction & Library (88.3%), Health Diagnosing & Treating (78.9%), and Community & Social Service (77.2%).

| Occupation | Male | Female |
| Management | 946 (48.5%) | 1,004 (51.5%) |
| Business & Financial | 296 (41.7%) | 414 (58.3%) |
| Computers, Engineering & Science | 567 (74.8%) | 191 (25.2%) |
| Computers & Mathematics | 151 (65.4%) | 80 (34.6%) |
| Architecture & Engineering | 390 (85.0%) | 69 (15.0%) |
| Life, Physical & Social Science | 26 (38.2%) | 42 (61.8%) |
| Community & Social Service | 423 (22.8%) | 1,429 (77.2%) |
| Education, Arts & Media | 185 (35.8%) | 332 (64.2%) |
| Legal Services & Support | 32 (40.5%) | 47 (59.5%) |
| Education Instruction & Library | 128 (11.7%) | 969 (88.3%) |
| Arts, Media & Entertainment | 78 (49.1%) | 81 (50.9%) |
| Health Diagnosing & Treating | 274 (21.1%) | 1,027 (78.9%) |
| Health Technologists | 212 (23.4%) | 695 (76.6%) |
| Total (Category) | 2,506 (38.1%) | 4,065 (61.9%) |
| Total (Overall) | 12,791 (53.2%) | 11,262 (46.8%) |
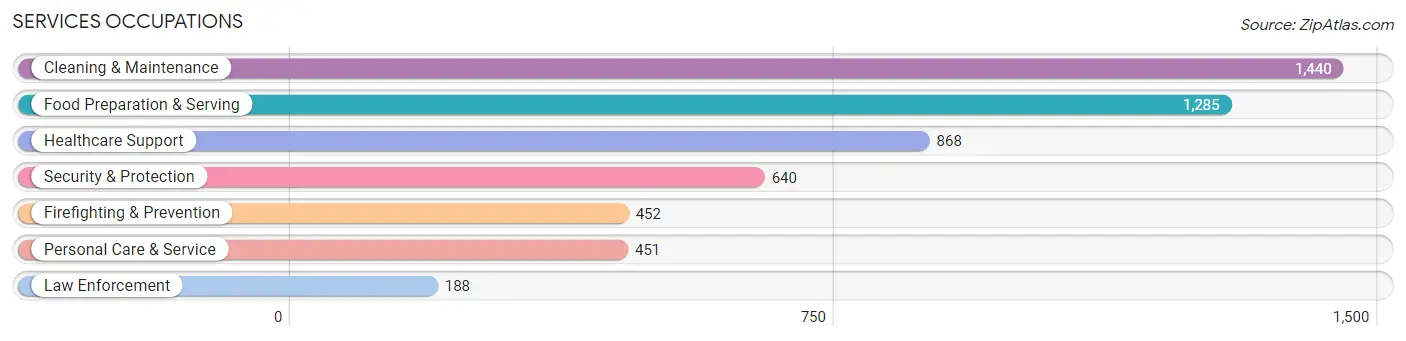
Services Occupations
The most common Services occupations in Christian County are Cleaning & Maintenance (1,440 | 6.0%), Food Preparation & Serving (1,285 | 5.3%), Healthcare Support (868 | 3.6%), Security & Protection (640 | 2.7%), and Firefighting & Prevention (452 | 1.9%).
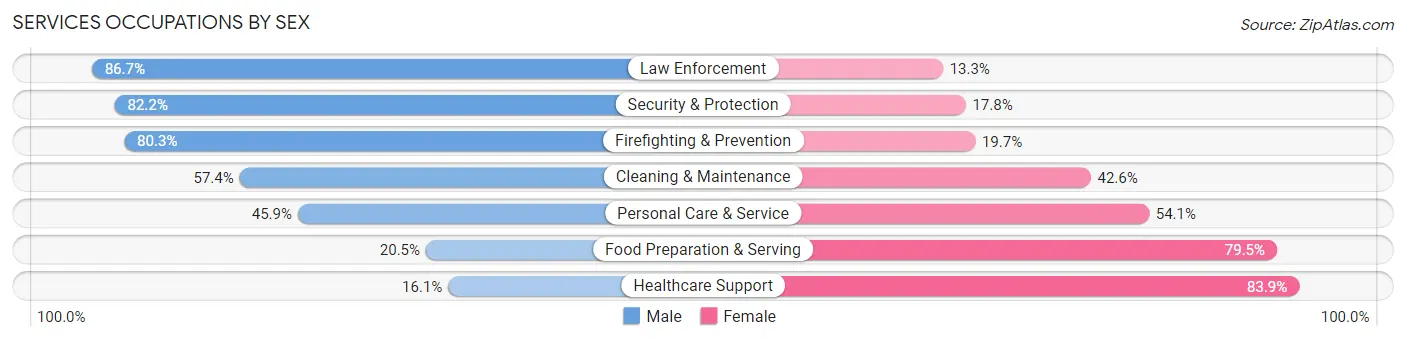
Services Occupations by Sex
Within the Services occupations in Christian County, the most male-oriented occupations are Law Enforcement (86.7%), Security & Protection (82.2%), and Firefighting & Prevention (80.3%), while the most female-oriented occupations are Healthcare Support (83.9%), Food Preparation & Serving (79.5%), and Personal Care & Service (54.1%).
| Occupation | Male | Female |
| Healthcare Support | 140 (16.1%) | 728 (83.9%) |
| Security & Protection | 526 (82.2%) | 114 (17.8%) |
| Firefighting & Prevention | 363 (80.3%) | 89 (19.7%) |
| Law Enforcement | 163 (86.7%) | 25 (13.3%) |
| Food Preparation & Serving | 264 (20.5%) | 1,021 (79.5%) |
| Cleaning & Maintenance | 827 (57.4%) | 613 (42.6%) |
| Personal Care & Service | 207 (45.9%) | 244 (54.1%) |
| Total (Category) | 1,964 (41.9%) | 2,720 (58.1%) |
| Total (Overall) | 12,791 (53.2%) | 11,262 (46.8%) |
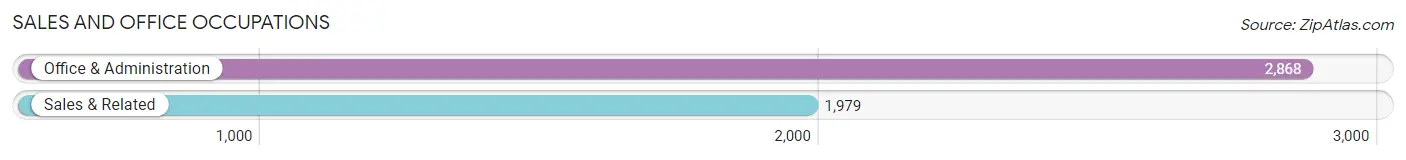
Sales and Office Occupations
The most common Sales and Office occupations in Christian County are Office & Administration (2,868 | 11.9%), and Sales & Related (1,979 | 8.2%).
Sales and Office Occupations by Sex
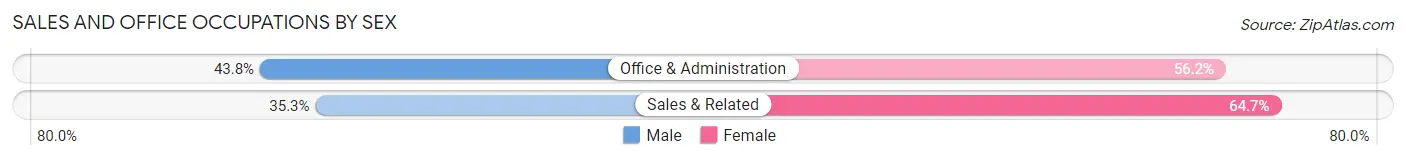
| Occupation | Male | Female |
| Sales & Related | 698 (35.3%) | 1,281 (64.7%) |
| Office & Administration | 1,256 (43.8%) | 1,612 (56.2%) |
| Total (Category) | 1,954 (40.3%) | 2,893 (59.7%) |
| Total (Overall) | 12,791 (53.2%) | 11,262 (46.8%) |
Natural Resources, Construction and Maintenance Occupations
The most common Natural Resources, Construction and Maintenance occupations in Christian County are Construction & Extraction (1,255 | 5.2%), Installation, Maintenance & Repair (1,183 | 4.9%), and Farming, Fishing & Forestry (285 | 1.2%).

Natural Resources, Construction and Maintenance Occupations by Sex
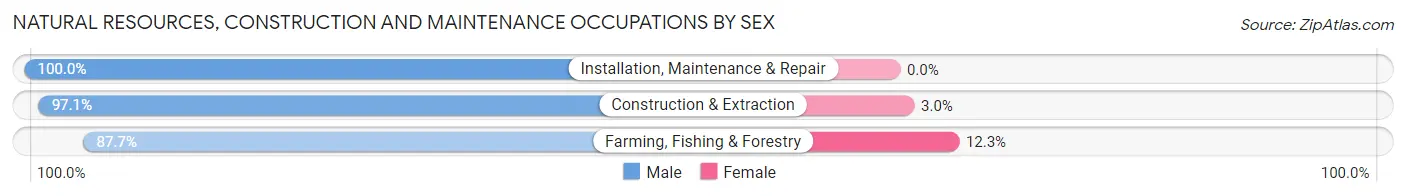
| Occupation | Male | Female |
| Farming, Fishing & Forestry | 250 (87.7%) | 35 (12.3%) |
| Construction & Extraction | 1,218 (97.1%) | 37 (2.9%) |
| Installation, Maintenance & Repair | 1,183 (100.0%) | 0 (0.0%) |
| Total (Category) | 2,651 (97.4%) | 72 (2.6%) |
| Total (Overall) | 12,791 (53.2%) | 11,262 (46.8%) |
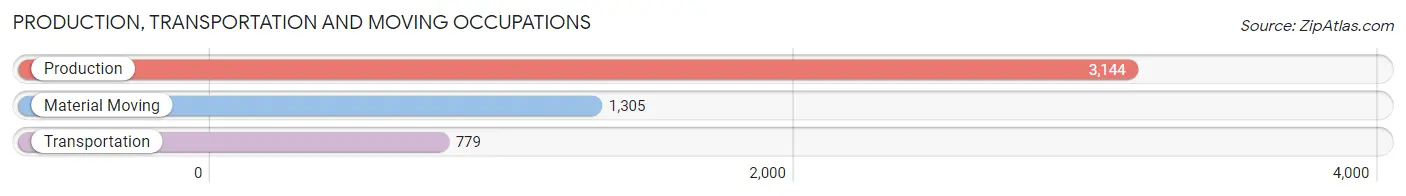
Production, Transportation and Moving Occupations
The most common Production, Transportation and Moving occupations in Christian County are Production (3,144 | 13.1%), Material Moving (1,305 | 5.4%), and Transportation (779 | 3.2%).
Production, Transportation and Moving Occupations by Sex
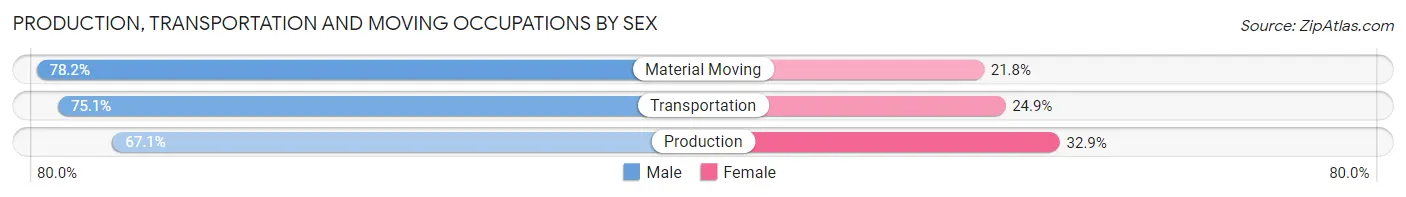
| Occupation | Male | Female |
| Production | 2,110 (67.1%) | 1,034 (32.9%) |
| Transportation | 585 (75.1%) | 194 (24.9%) |
| Material Moving | 1,021 (78.2%) | 284 (21.8%) |
| Total (Category) | 3,716 (71.1%) | 1,512 (28.9%) |
| Total (Overall) | 12,791 (53.2%) | 11,262 (46.8%) |
Employment Industries by Sex in Christian County
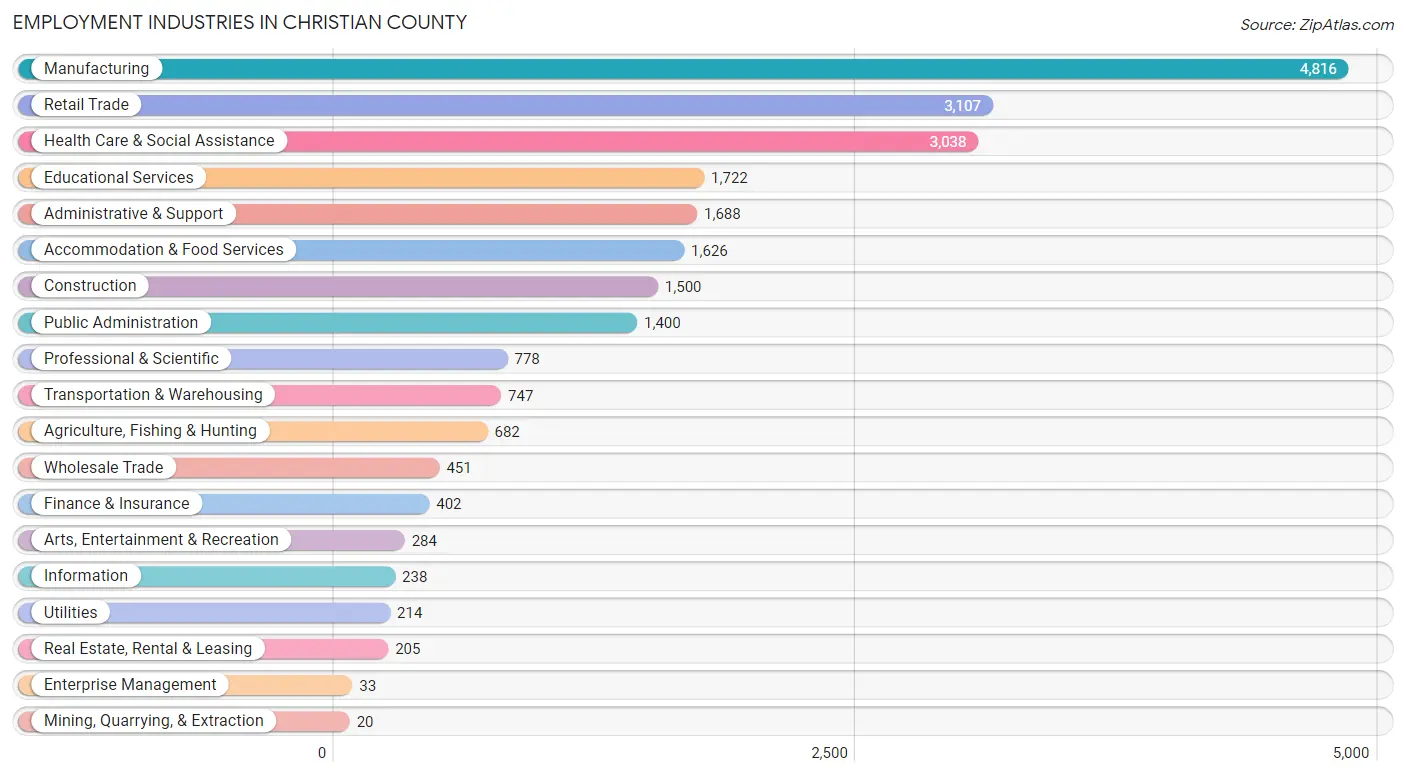
Employment Industries in Christian County
The major employment industries in Christian County include Manufacturing (4,816 | 20.0%), Retail Trade (3,107 | 12.9%), Health Care & Social Assistance (3,038 | 12.6%), Educational Services (1,722 | 7.2%), and Administrative & Support (1,688 | 7.0%).
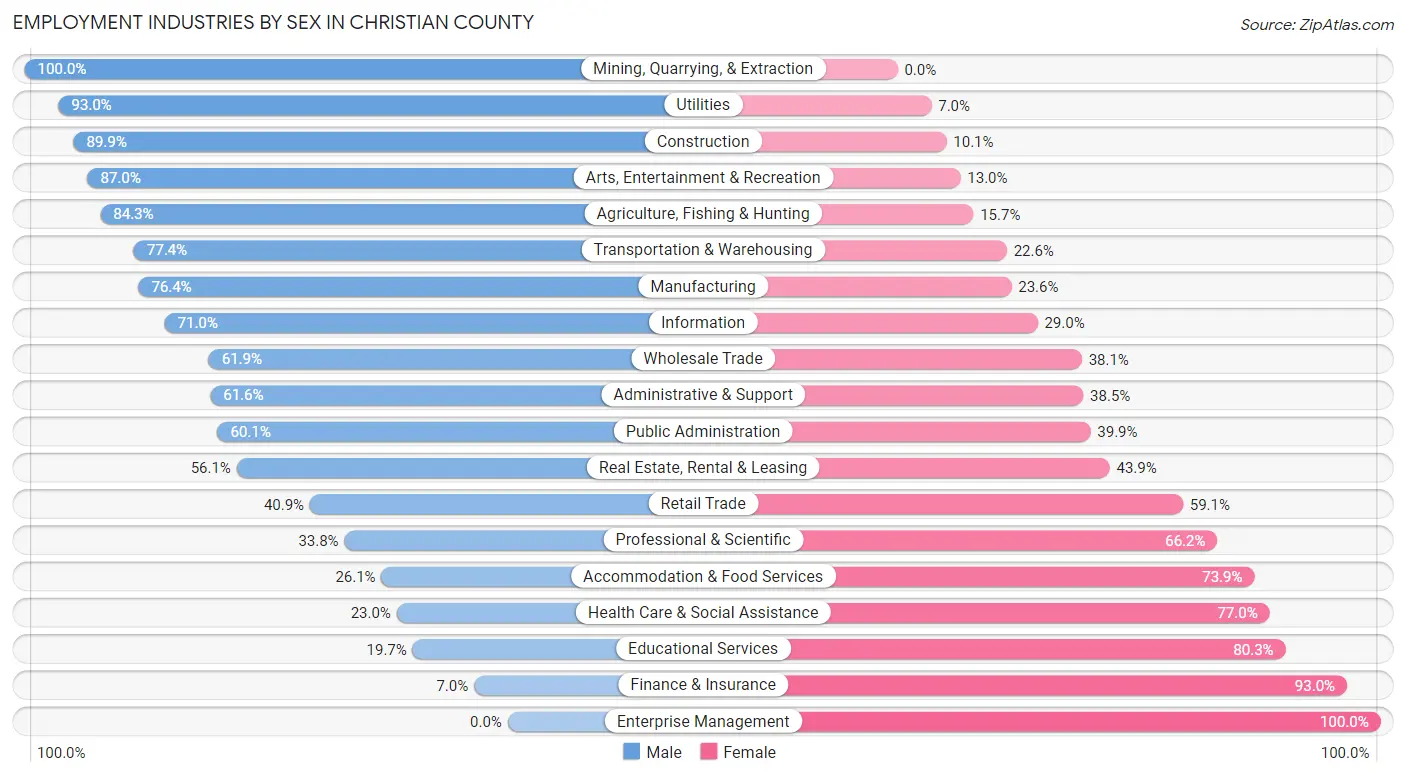
Employment Industries by Sex in Christian County
The Christian County industries that see more men than women are Mining, Quarrying, & Extraction (100.0%), Utilities (93.0%), and Construction (89.9%), whereas the industries that tend to have a higher number of women are Enterprise Management (100.0%), Finance & Insurance (93.0%), and Educational Services (80.3%).
| Industry | Male | Female |
| Agriculture, Fishing & Hunting | 575 (84.3%) | 107 (15.7%) |
| Mining, Quarrying, & Extraction | 20 (100.0%) | 0 (0.0%) |
| Construction | 1,348 (89.9%) | 152 (10.1%) |
| Manufacturing | 3,681 (76.4%) | 1,135 (23.6%) |
| Wholesale Trade | 279 (61.9%) | 172 (38.1%) |
| Retail Trade | 1,272 (40.9%) | 1,835 (59.1%) |
| Transportation & Warehousing | 578 (77.4%) | 169 (22.6%) |
| Utilities | 199 (93.0%) | 15 (7.0%) |
| Information | 169 (71.0%) | 69 (29.0%) |
| Finance & Insurance | 28 (7.0%) | 374 (93.0%) |
| Real Estate, Rental & Leasing | 115 (56.1%) | 90 (43.9%) |
| Professional & Scientific | 263 (33.8%) | 515 (66.2%) |
| Enterprise Management | 0 (0.0%) | 33 (100.0%) |
| Administrative & Support | 1,039 (61.6%) | 649 (38.5%) |
| Educational Services | 339 (19.7%) | 1,383 (80.3%) |
| Health Care & Social Assistance | 698 (23.0%) | 2,340 (77.0%) |
| Arts, Entertainment & Recreation | 247 (87.0%) | 37 (13.0%) |
| Accommodation & Food Services | 425 (26.1%) | 1,201 (73.9%) |
| Public Administration | 841 (60.1%) | 559 (39.9%) |
| Total | 12,791 (53.2%) | 11,262 (46.8%) |
Education in Christian County
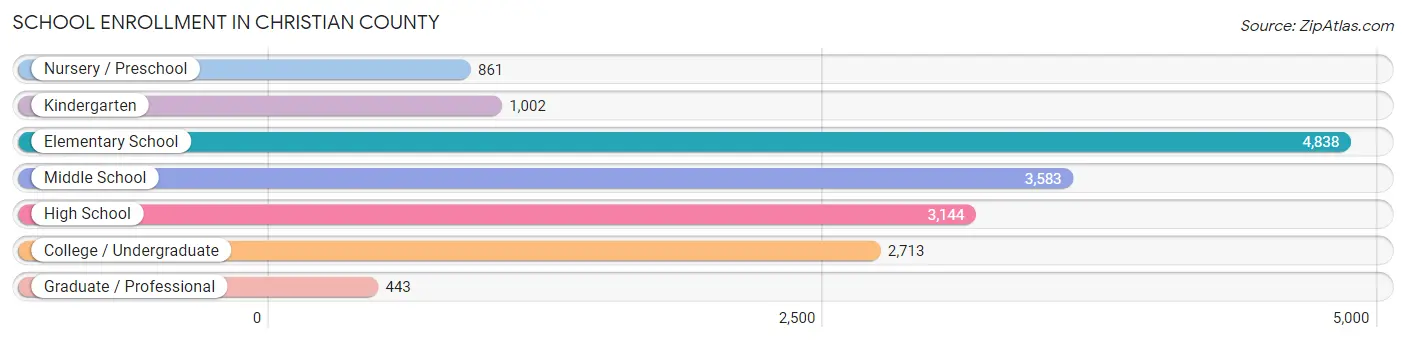
School Enrollment in Christian County
The most common levels of schooling among the 16,584 students in Christian County are elementary school (4,838 | 29.2%), middle school (3,583 | 21.6%), and high school (3,144 | 19.0%).
| School Level | # Students | % Students |
| Nursery / Preschool | 861 | 5.2% |
| Kindergarten | 1,002 | 6.0% |
| Elementary School | 4,838 | 29.2% |
| Middle School | 3,583 | 21.6% |
| High School | 3,144 | 19.0% |
| College / Undergraduate | 2,713 | 16.4% |
| Graduate / Professional | 443 | 2.7% |
| Total | 16,584 | 100.0% |
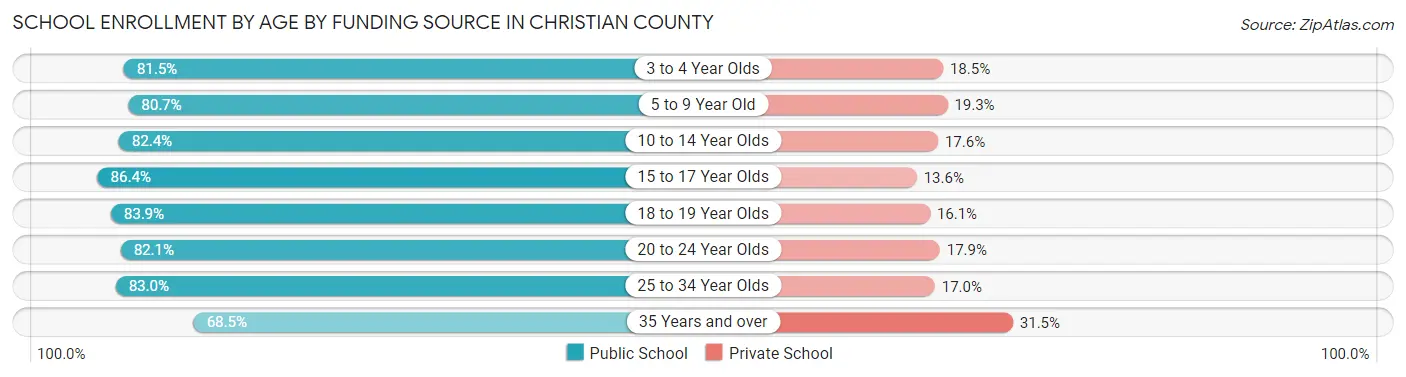
School Enrollment by Age by Funding Source in Christian County
Out of a total of 16,584 students who are enrolled in schools in Christian County, 2,985 (18.0%) attend a private institution, while the remaining 13,599 (82.0%) are enrolled in public schools. The age group of 35 years and over has the highest likelihood of being enrolled in private schools, with 167 (31.5% in the age bracket) enrolled. Conversely, the age group of 15 to 17 year olds has the lowest likelihood of being enrolled in a private school, with 2,005 (86.4% in the age bracket) attending a public institution.
| Age Bracket | Public School | Private School |
| 3 to 4 Year Olds | 533 (81.5%) | 121 (18.5%) |
| 5 to 9 Year Old | 4,336 (80.7%) | 1,039 (19.3%) |
| 10 to 14 Year Olds | 3,752 (82.4%) | 800 (17.6%) |
| 15 to 17 Year Olds | 2,005 (86.4%) | 316 (13.6%) |
| 18 to 19 Year Olds | 898 (83.9%) | 172 (16.1%) |
| 20 to 24 Year Olds | 839 (82.1%) | 183 (17.9%) |
| 25 to 34 Year Olds | 880 (83.0%) | 180 (17.0%) |
| 35 Years and over | 363 (68.5%) | 167 (31.5%) |
| Total | 13,599 (82.0%) | 2,985 (18.0%) |
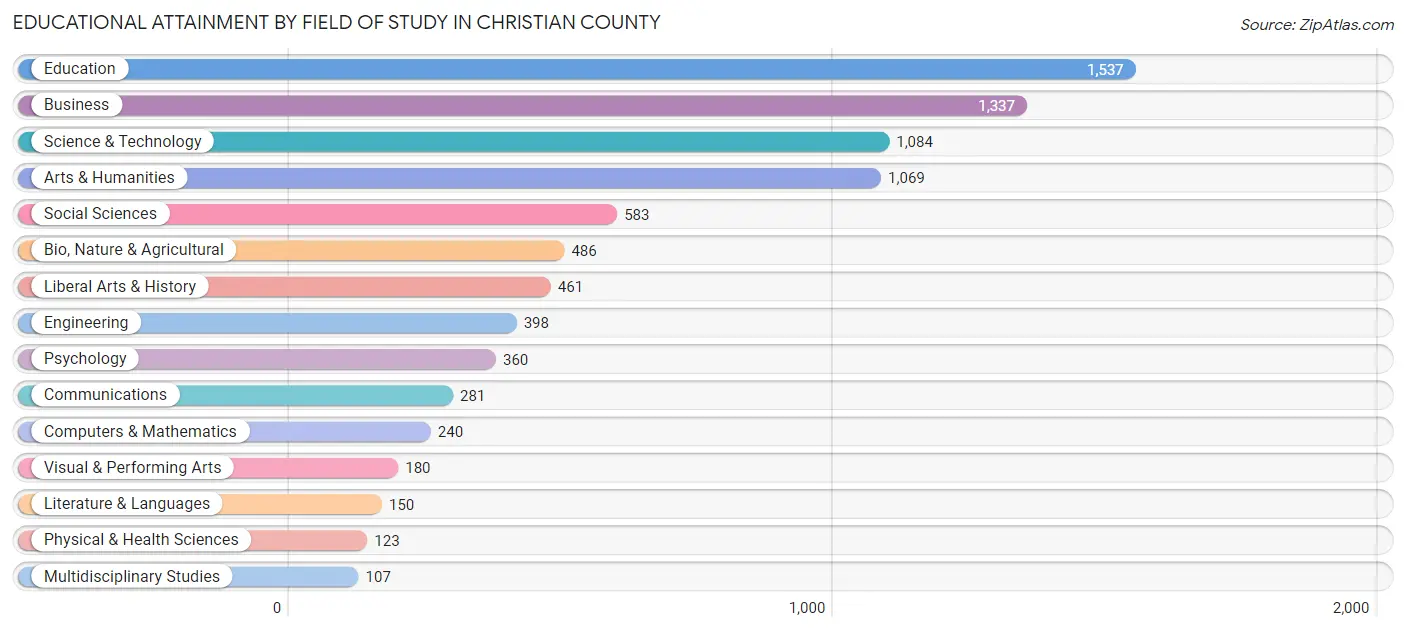
Educational Attainment by Field of Study in Christian County
Education (1,537 | 18.3%), business (1,337 | 15.9%), science & technology (1,084 | 12.9%), arts & humanities (1,069 | 12.7%), and social sciences (583 | 6.9%) are the most common fields of study among 8,396 individuals in Christian County who have obtained a bachelor's degree or higher.
| Field of Study | # Graduates | % Graduates |
| Computers & Mathematics | 240 | 2.9% |
| Bio, Nature & Agricultural | 486 | 5.8% |
| Physical & Health Sciences | 123 | 1.5% |
| Psychology | 360 | 4.3% |
| Social Sciences | 583 | 6.9% |
| Engineering | 398 | 4.7% |
| Multidisciplinary Studies | 107 | 1.3% |
| Science & Technology | 1,084 | 12.9% |
| Business | 1,337 | 15.9% |
| Education | 1,537 | 18.3% |
| Literature & Languages | 150 | 1.8% |
| Liberal Arts & History | 461 | 5.5% |
| Visual & Performing Arts | 180 | 2.1% |
| Communications | 281 | 3.4% |
| Arts & Humanities | 1,069 | 12.7% |
| Total | 8,396 | 100.0% |
Transportation & Commute in Christian County
Vehicle Availability by Sex in Christian County
The most prevalent vehicle ownership categories in Christian County are males with 2 vehicles (7,347, accounting for 48.0%) and females with 2 vehicles (4,197, making up 66.5%).
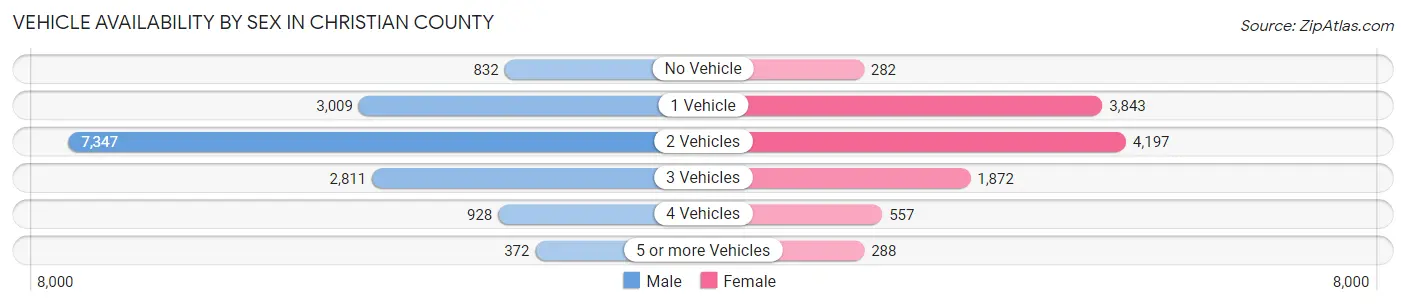
| Vehicles Available | Male | Female |
| No Vehicle | 832 (5.4%) | 282 (2.5%) |
| 1 Vehicle | 3,009 (19.7%) | 3,843 (34.8%) |
| 2 Vehicles | 7,347 (48.0%) | 4,197 (38.0%) |
| 3 Vehicles | 2,811 (18.4%) | 1,872 (17.0%) |
| 4 Vehicles | 928 (6.1%) | 557 (5.1%) |
| 5 or more Vehicles | 372 (2.4%) | 288 (2.6%) |
| Total | 15,299 (100.0%) | 11,039 (100.0%) |
Commute Time in Christian County
The most frequently occuring commute durations in Christian County are 5 to 9 minutes (5,536 commuters, 19.1%), 10 to 14 minutes (5,481 commuters, 18.9%), and 15 to 19 minutes (4,680 commuters, 16.1%).
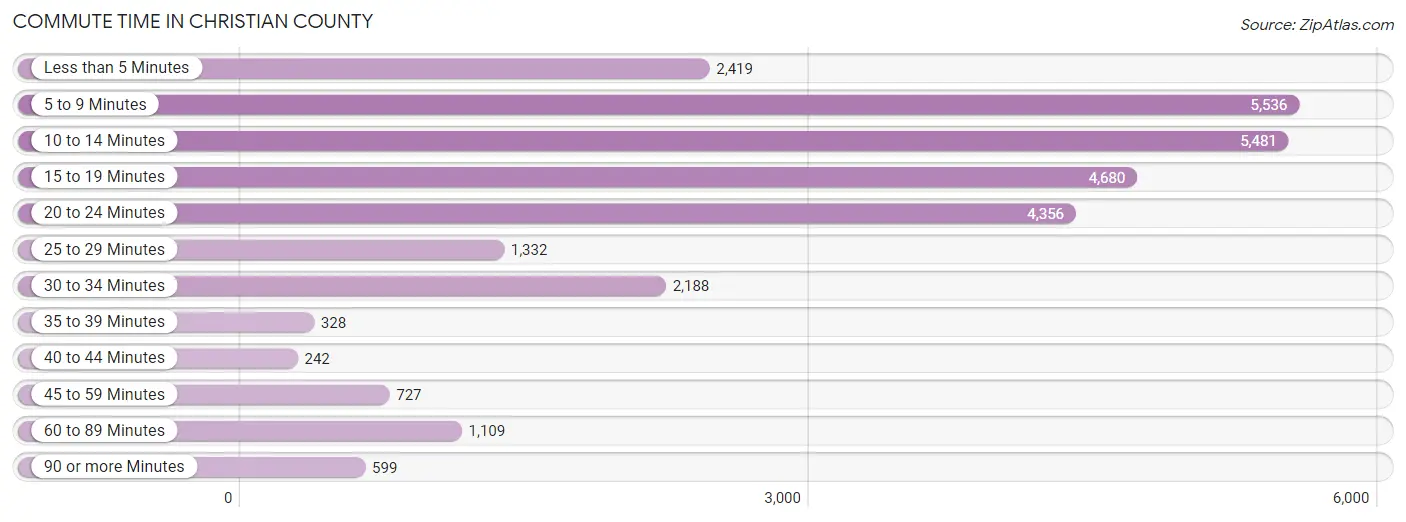
| Commute Time | # Commuters | % Commuters |
| Less than 5 Minutes | 2,419 | 8.3% |
| 5 to 9 Minutes | 5,536 | 19.1% |
| 10 to 14 Minutes | 5,481 | 18.9% |
| 15 to 19 Minutes | 4,680 | 16.1% |
| 20 to 24 Minutes | 4,356 | 15.0% |
| 25 to 29 Minutes | 1,332 | 4.6% |
| 30 to 34 Minutes | 2,188 | 7.5% |
| 35 to 39 Minutes | 328 | 1.1% |
| 40 to 44 Minutes | 242 | 0.8% |
| 45 to 59 Minutes | 727 | 2.5% |
| 60 to 89 Minutes | 1,109 | 3.8% |
| 90 or more Minutes | 599 | 2.1% |
Commute Time by Sex in Christian County
The most common commute times in Christian County are 5 to 9 minutes (3,826 commuters, 20.9%) for males and 10 to 14 minutes (2,220 commuters, 20.8%) for females.
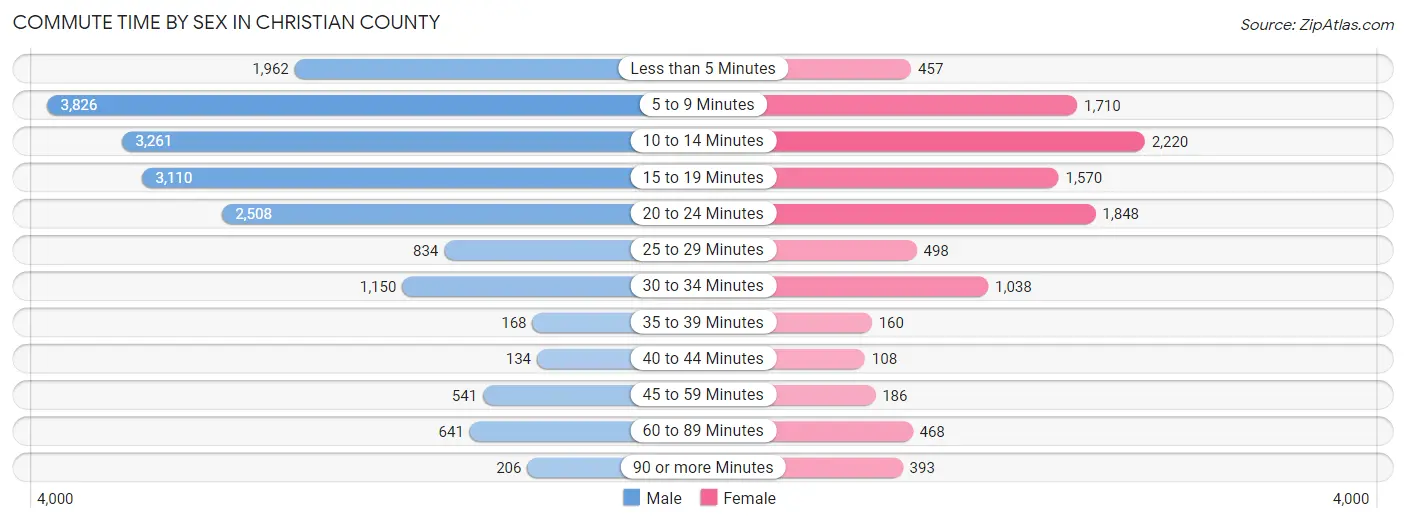
| Commute Time | Male | Female |
| Less than 5 Minutes | 1,962 (10.7%) | 457 (4.3%) |
| 5 to 9 Minutes | 3,826 (20.9%) | 1,710 (16.1%) |
| 10 to 14 Minutes | 3,261 (17.8%) | 2,220 (20.8%) |
| 15 to 19 Minutes | 3,110 (17.0%) | 1,570 (14.7%) |
| 20 to 24 Minutes | 2,508 (13.7%) | 1,848 (17.3%) |
| 25 to 29 Minutes | 834 (4.5%) | 498 (4.7%) |
| 30 to 34 Minutes | 1,150 (6.3%) | 1,038 (9.7%) |
| 35 to 39 Minutes | 168 (0.9%) | 160 (1.5%) |
| 40 to 44 Minutes | 134 (0.7%) | 108 (1.0%) |
| 45 to 59 Minutes | 541 (2.9%) | 186 (1.8%) |
| 60 to 89 Minutes | 641 (3.5%) | 468 (4.4%) |
| 90 or more Minutes | 206 (1.1%) | 393 (3.7%) |
Time of Departure to Work by Sex in Christian County
The most frequent times of departure to work in Christian County are 5:30 AM to 5:59 AM (3,486, 19.0%) for males and 6:00 AM to 6:29 AM (1,481, 13.9%) for females.
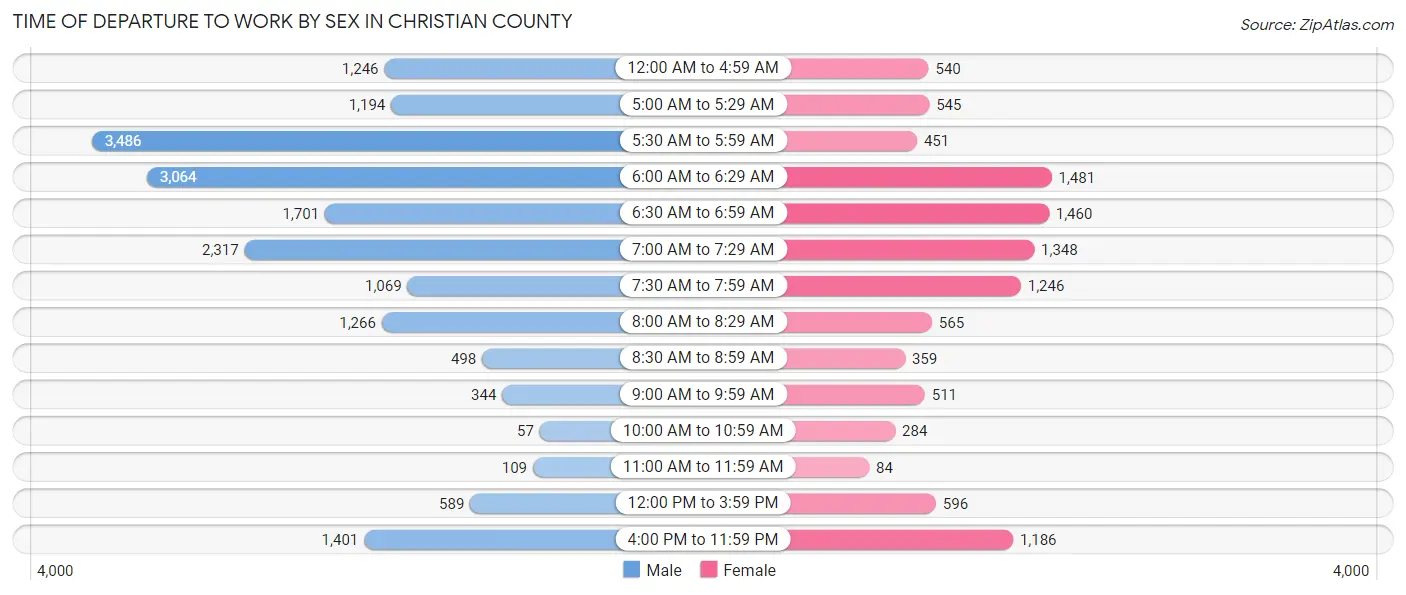
| Time of Departure | Male | Female |
| 12:00 AM to 4:59 AM | 1,246 (6.8%) | 540 (5.1%) |
| 5:00 AM to 5:29 AM | 1,194 (6.5%) | 545 (5.1%) |
| 5:30 AM to 5:59 AM | 3,486 (19.0%) | 451 (4.2%) |
| 6:00 AM to 6:29 AM | 3,064 (16.7%) | 1,481 (13.9%) |
| 6:30 AM to 6:59 AM | 1,701 (9.3%) | 1,460 (13.7%) |
| 7:00 AM to 7:29 AM | 2,317 (12.6%) | 1,348 (12.7%) |
| 7:30 AM to 7:59 AM | 1,069 (5.8%) | 1,246 (11.7%) |
| 8:00 AM to 8:29 AM | 1,266 (6.9%) | 565 (5.3%) |
| 8:30 AM to 8:59 AM | 498 (2.7%) | 359 (3.4%) |
| 9:00 AM to 9:59 AM | 344 (1.9%) | 511 (4.8%) |
| 10:00 AM to 10:59 AM | 57 (0.3%) | 284 (2.7%) |
| 11:00 AM to 11:59 AM | 109 (0.6%) | 84 (0.8%) |
| 12:00 PM to 3:59 PM | 589 (3.2%) | 596 (5.6%) |
| 4:00 PM to 11:59 PM | 1,401 (7.6%) | 1,186 (11.1%) |
| Total | 18,341 (100.0%) | 10,656 (100.0%) |
Housing Occupancy in Christian County
Occupancy by Ownership in Christian County
Of the total 25,602 dwellings in Christian County, owner-occupied units account for 12,771 (49.9%), while renter-occupied units make up 12,831 (50.1%).
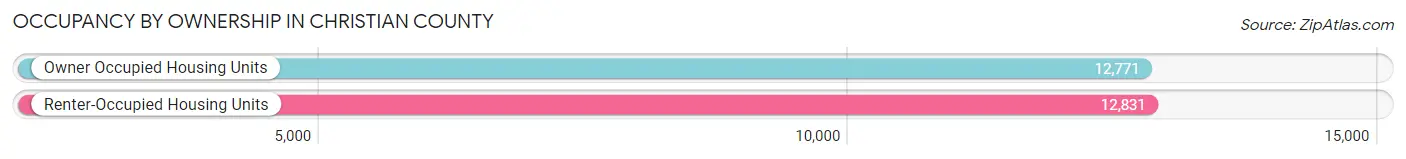
| Occupancy | # Housing Units | % Housing Units |
| Owner Occupied Housing Units | 12,771 | 49.9% |
| Renter-Occupied Housing Units | 12,831 | 50.1% |
| Total Occupied Housing Units | 25,602 | 100.0% |
Occupancy by Household Size in Christian County

| Household Size | # Housing Units | % Housing Units |
| 1-Person Household | 7,598 | 29.7% |
| 2-Person Household | 7,869 | 30.7% |
| 3-Person Household | 4,587 | 17.9% |
| 4+ Person Household | 5,548 | 21.7% |
| Total Housing Units | 25,602 | 100.0% |
Occupancy by Ownership by Household Size in Christian County
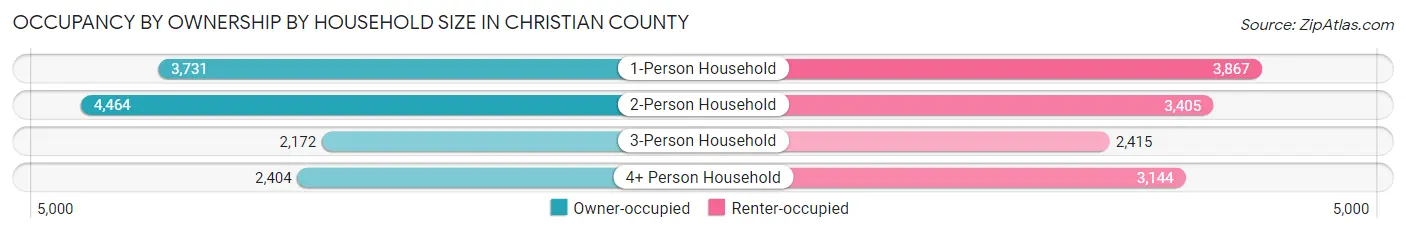
| Household Size | Owner-occupied | Renter-occupied |
| 1-Person Household | 3,731 (49.1%) | 3,867 (50.9%) |
| 2-Person Household | 4,464 (56.7%) | 3,405 (43.3%) |
| 3-Person Household | 2,172 (47.3%) | 2,415 (52.6%) |
| 4+ Person Household | 2,404 (43.3%) | 3,144 (56.7%) |
| Total Housing Units | 12,771 (49.9%) | 12,831 (50.1%) |
Occupancy by Educational Attainment in Christian County
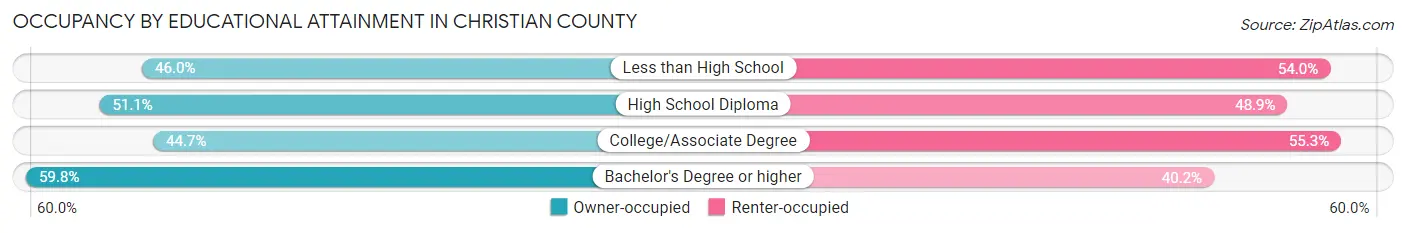
| Household Size | Owner-occupied | Renter-occupied |
| Less than High School | 1,228 (46.0%) | 1,441 (54.0%) |
| High School Diploma | 4,143 (51.1%) | 3,967 (48.9%) |
| College/Associate Degree | 4,344 (44.7%) | 5,371 (55.3%) |
| Bachelor's Degree or higher | 3,056 (59.8%) | 2,052 (40.2%) |
Occupancy by Age of Householder in Christian County
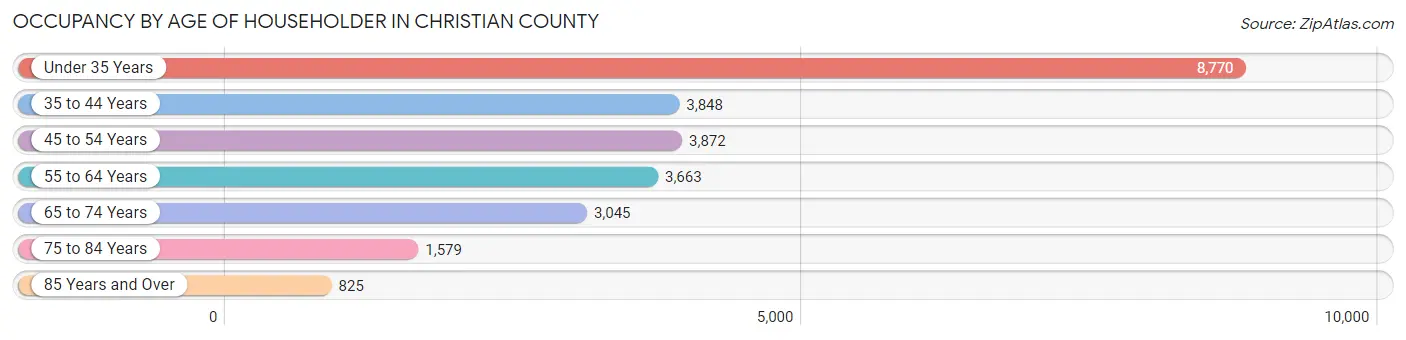
| Age Bracket | # Households | % Households |
| Under 35 Years | 8,770 | 34.3% |
| 35 to 44 Years | 3,848 | 15.0% |
| 45 to 54 Years | 3,872 | 15.1% |
| 55 to 64 Years | 3,663 | 14.3% |
| 65 to 74 Years | 3,045 | 11.9% |
| 75 to 84 Years | 1,579 | 6.2% |
| 85 Years and Over | 825 | 3.2% |
| Total | 25,602 | 100.0% |
Housing Finances in Christian County
Median Income by Occupancy in Christian County
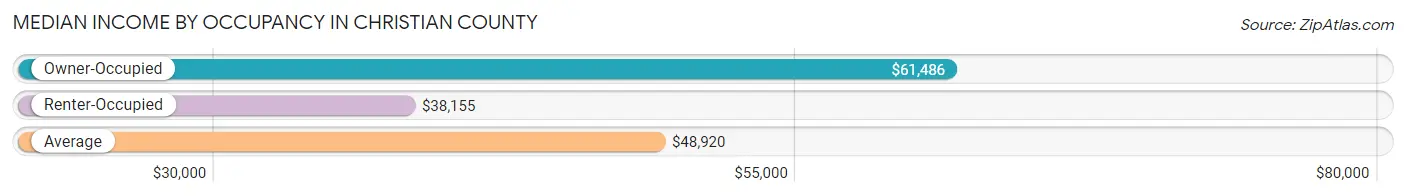
| Occupancy Type | # Households | Median Income |
| Owner-Occupied | 12,771 (49.9%) | $61,486 |
| Renter-Occupied | 12,831 (50.1%) | $38,155 |
| Average | 25,602 (100.0%) | $48,920 |
Occupancy by Householder Income Bracket in Christian County
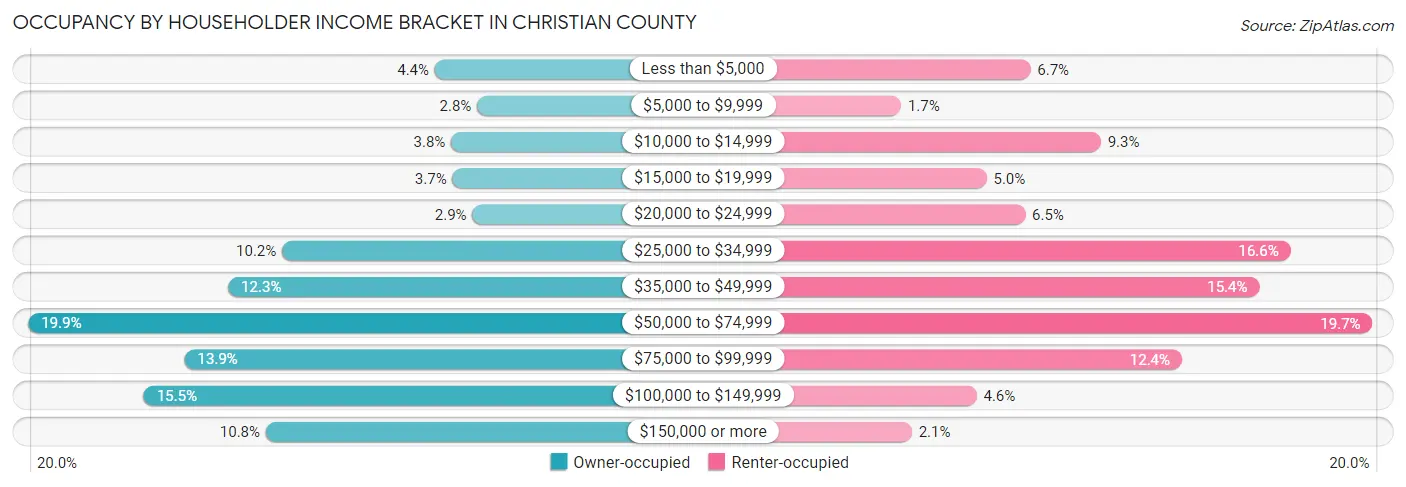
| Income Bracket | Owner-occupied | Renter-occupied |
| Less than $5,000 | 558 (4.4%) | 855 (6.7%) |
| $5,000 to $9,999 | 352 (2.8%) | 222 (1.7%) |
| $10,000 to $14,999 | 479 (3.7%) | 1,198 (9.3%) |
| $15,000 to $19,999 | 472 (3.7%) | 640 (5.0%) |
| $20,000 to $24,999 | 376 (2.9%) | 829 (6.5%) |
| $25,000 to $34,999 | 1,302 (10.2%) | 2,126 (16.6%) |
| $35,000 to $49,999 | 1,565 (12.2%) | 1,973 (15.4%) |
| $50,000 to $74,999 | 2,536 (19.9%) | 2,527 (19.7%) |
| $75,000 to $99,999 | 1,776 (13.9%) | 1,595 (12.4%) |
| $100,000 to $149,999 | 1,975 (15.5%) | 591 (4.6%) |
| $150,000 or more | 1,380 (10.8%) | 275 (2.1%) |
| Total | 12,771 (100.0%) | 12,831 (100.0%) |
Monthly Housing Cost Tiers in Christian County
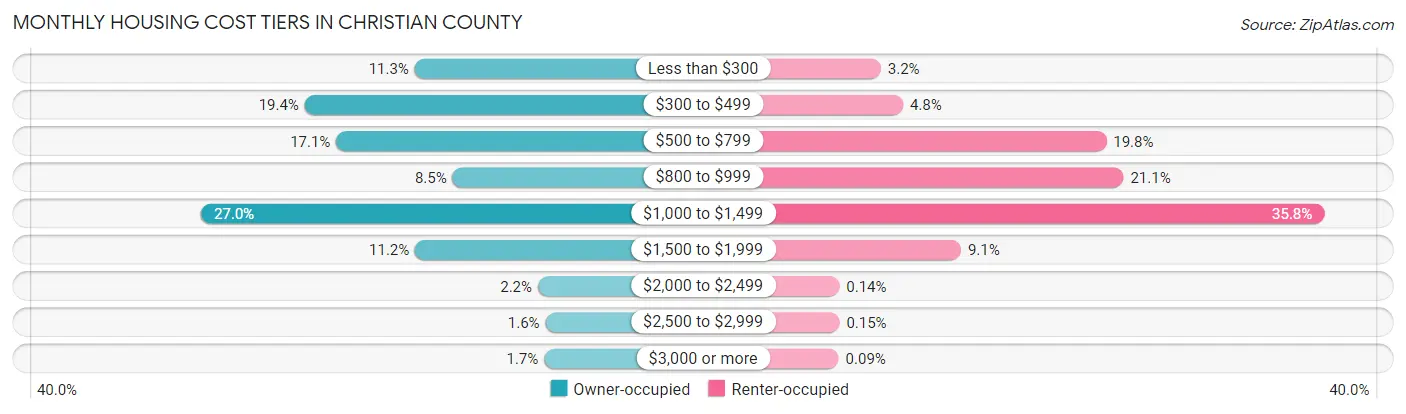
| Monthly Cost | Owner-occupied | Renter-occupied |
| Less than $300 | 1,439 (11.3%) | 411 (3.2%) |
| $300 to $499 | 2,474 (19.4%) | 620 (4.8%) |
| $500 to $799 | 2,177 (17.1%) | 2,540 (19.8%) |
| $800 to $999 | 1,083 (8.5%) | 2,704 (21.1%) |
| $1,000 to $1,499 | 3,450 (27.0%) | 4,599 (35.8%) |
| $1,500 to $1,999 | 1,435 (11.2%) | 1,168 (9.1%) |
| $2,000 to $2,499 | 281 (2.2%) | 18 (0.1%) |
| $2,500 to $2,999 | 210 (1.6%) | 19 (0.2%) |
| $3,000 or more | 222 (1.7%) | 12 (0.1%) |
| Total | 12,771 (100.0%) | 12,831 (100.0%) |
Physical Housing Characteristics in Christian County
Housing Structures in Christian County
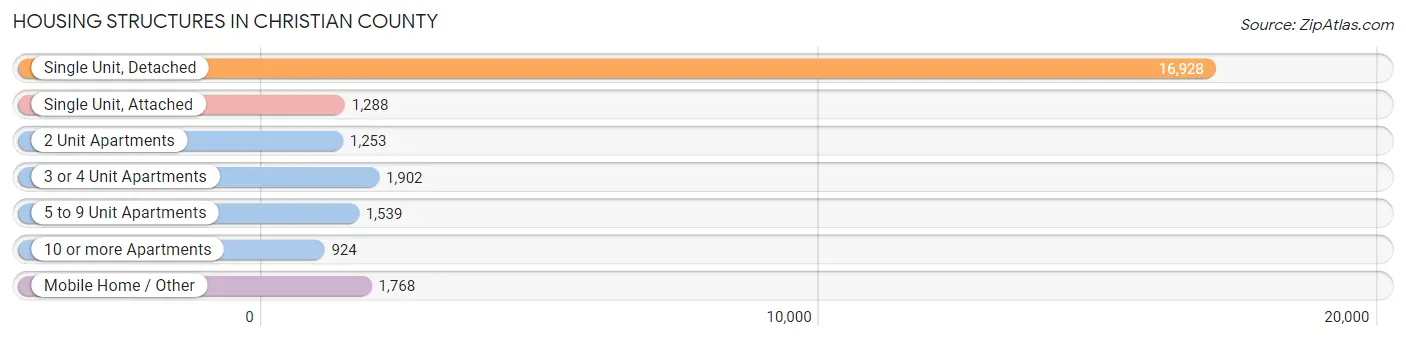
| Structure Type | # Housing Units | % Housing Units |
| Single Unit, Detached | 16,928 | 66.1% |
| Single Unit, Attached | 1,288 | 5.0% |
| 2 Unit Apartments | 1,253 | 4.9% |
| 3 or 4 Unit Apartments | 1,902 | 7.4% |
| 5 to 9 Unit Apartments | 1,539 | 6.0% |
| 10 or more Apartments | 924 | 3.6% |
| Mobile Home / Other | 1,768 | 6.9% |
| Total | 25,602 | 100.0% |
Housing Structures by Occupancy in Christian County
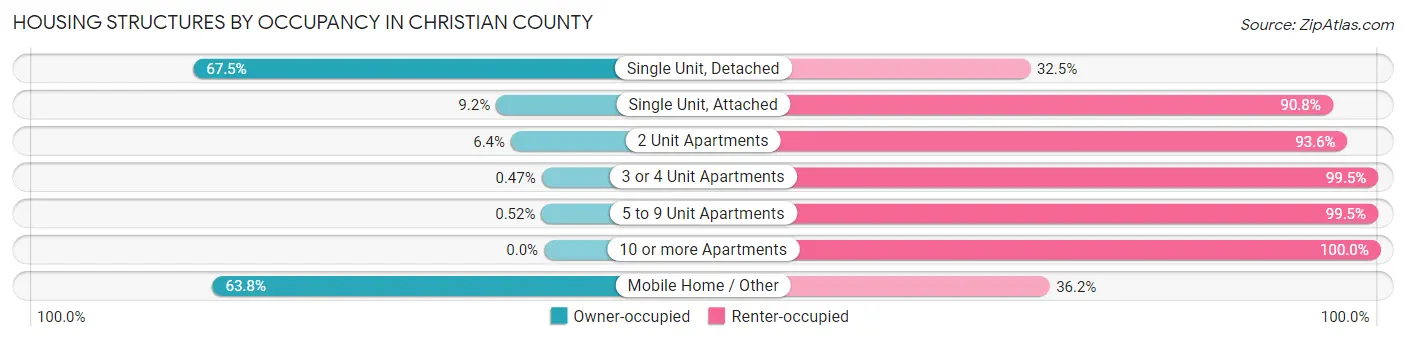
| Structure Type | Owner-occupied | Renter-occupied |
| Single Unit, Detached | 11,427 (67.5%) | 5,501 (32.5%) |
| Single Unit, Attached | 119 (9.2%) | 1,169 (90.8%) |
| 2 Unit Apartments | 80 (6.4%) | 1,173 (93.6%) |
| 3 or 4 Unit Apartments | 9 (0.5%) | 1,893 (99.5%) |
| 5 to 9 Unit Apartments | 8 (0.5%) | 1,531 (99.5%) |
| 10 or more Apartments | 0 (0.0%) | 924 (100.0%) |
| Mobile Home / Other | 1,128 (63.8%) | 640 (36.2%) |
| Total | 12,771 (49.9%) | 12,831 (50.1%) |
Housing Structures by Number of Rooms in Christian County
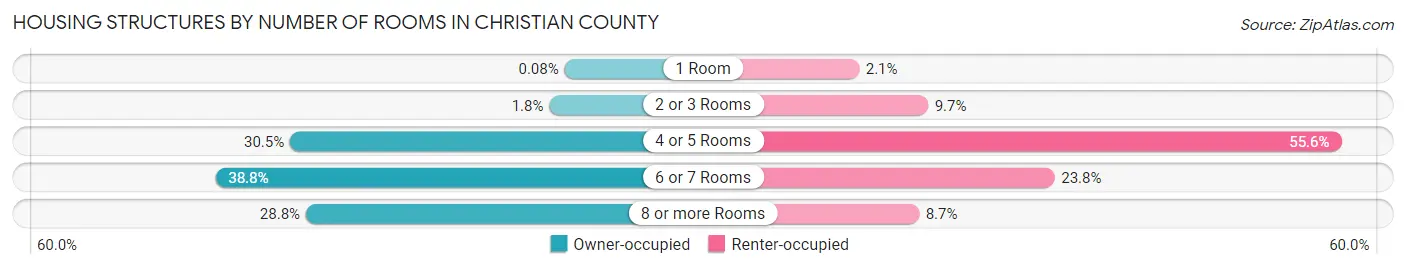
| Number of Rooms | Owner-occupied | Renter-occupied |
| 1 Room | 10 (0.1%) | 268 (2.1%) |
| 2 or 3 Rooms | 226 (1.8%) | 1,250 (9.7%) |
| 4 or 5 Rooms | 3,900 (30.5%) | 7,139 (55.6%) |
| 6 or 7 Rooms | 4,959 (38.8%) | 3,053 (23.8%) |
| 8 or more Rooms | 3,676 (28.8%) | 1,121 (8.7%) |
| Total | 12,771 (100.0%) | 12,831 (100.0%) |
Housing Structure by Heating Type in Christian County
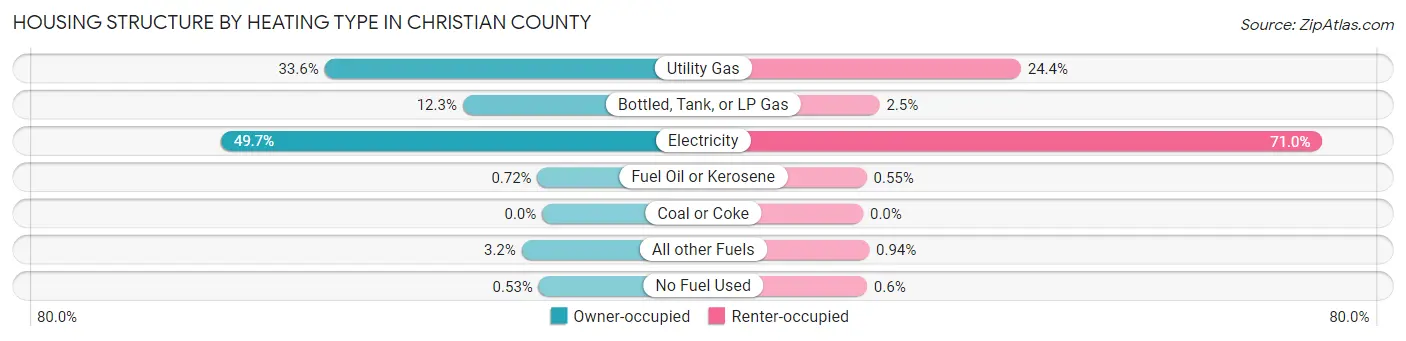
| Heating Type | Owner-occupied | Renter-occupied |
| Utility Gas | 4,296 (33.6%) | 3,129 (24.4%) |
| Bottled, Tank, or LP Gas | 1,567 (12.3%) | 326 (2.5%) |
| Electricity | 6,343 (49.7%) | 9,109 (71.0%) |
| Fuel Oil or Kerosene | 92 (0.7%) | 70 (0.5%) |
| Coal or Coke | 0 (0.0%) | 0 (0.0%) |
| All other Fuels | 405 (3.2%) | 120 (0.9%) |
| No Fuel Used | 68 (0.5%) | 77 (0.6%) |
| Total | 12,771 (100.0%) | 12,831 (100.0%) |
Household Vehicle Usage in Christian County
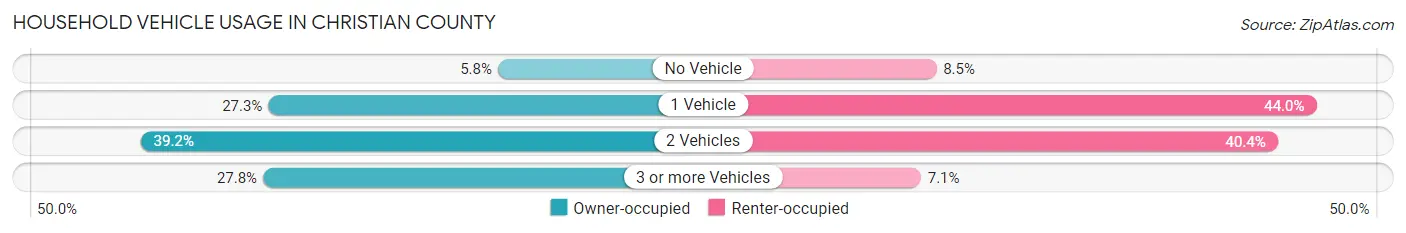
| Vehicles per Household | Owner-occupied | Renter-occupied |
| No Vehicle | 744 (5.8%) | 1,093 (8.5%) |
| 1 Vehicle | 3,481 (27.3%) | 5,646 (44.0%) |
| 2 Vehicles | 5,002 (39.2%) | 5,183 (40.4%) |
| 3 or more Vehicles | 3,544 (27.8%) | 909 (7.1%) |
| Total | 12,771 (100.0%) | 12,831 (100.0%) |
Real Estate & Mortgages in Christian County
Real Estate and Mortgage Overview in Christian County
| Characteristic | Without Mortgage | With Mortgage |
| Housing Units | 5,487 | 7,284 |
| Median Property Value | $117,100 | $161,300 |
| Median Household Income | $50,170 | $792 |
| Monthly Housing Costs | $416 | $222 |
| Real Estate Taxes | $819 | $300 |
Property Value by Mortgage Status in Christian County
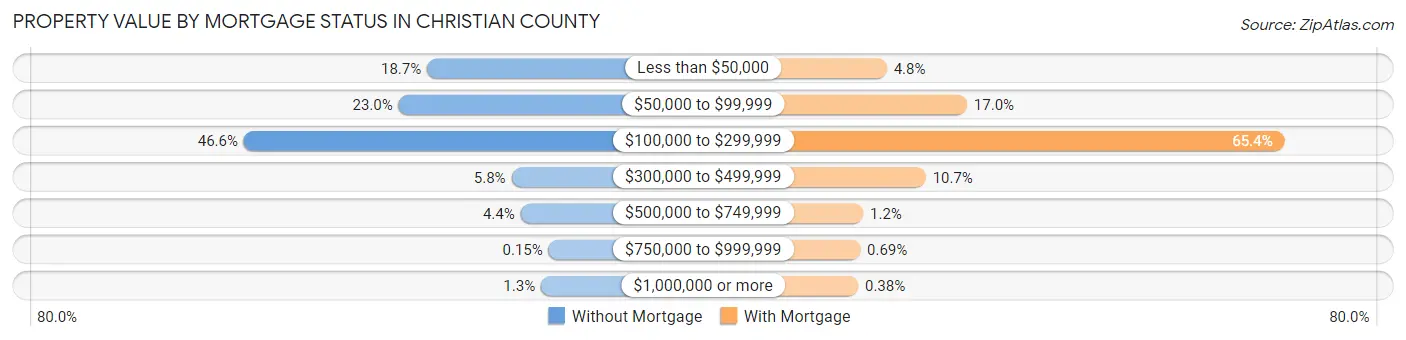
| Property Value | Without Mortgage | With Mortgage |
| Less than $50,000 | 1,025 (18.7%) | 346 (4.8%) |
| $50,000 to $99,999 | 1,263 (23.0%) | 1,236 (17.0%) |
| $100,000 to $299,999 | 2,557 (46.6%) | 4,761 (65.4%) |
| $300,000 to $499,999 | 319 (5.8%) | 779 (10.7%) |
| $500,000 to $749,999 | 243 (4.4%) | 84 (1.1%) |
| $750,000 to $999,999 | 8 (0.2%) | 50 (0.7%) |
| $1,000,000 or more | 72 (1.3%) | 28 (0.4%) |
| Total | 5,487 (100.0%) | 7,284 (100.0%) |
Household Income by Mortgage Status in Christian County
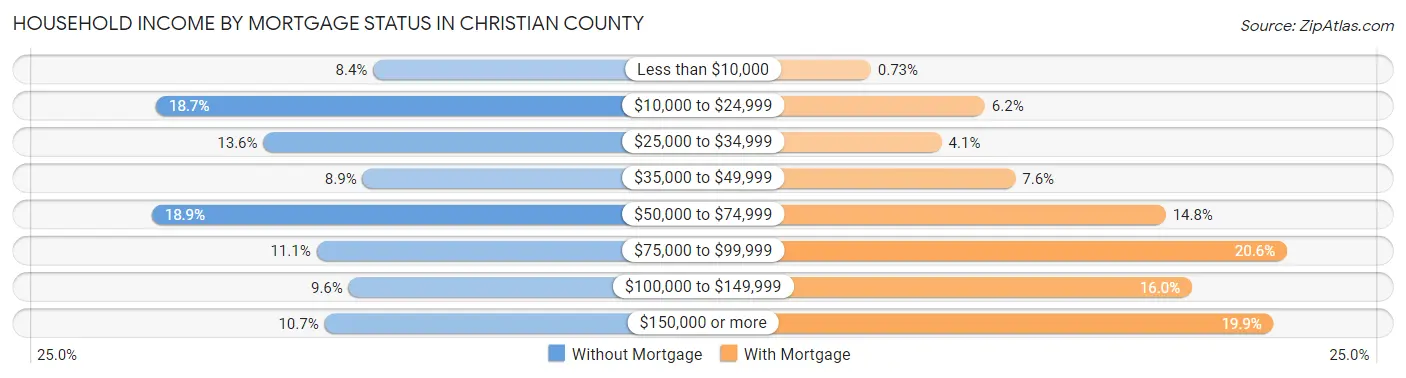
| Household Income | Without Mortgage | With Mortgage |
| Less than $10,000 | 461 (8.4%) | 53 (0.7%) |
| $10,000 to $24,999 | 1,028 (18.7%) | 449 (6.2%) |
| $25,000 to $34,999 | 748 (13.6%) | 299 (4.1%) |
| $35,000 to $49,999 | 489 (8.9%) | 554 (7.6%) |
| $50,000 to $74,999 | 1,039 (18.9%) | 1,076 (14.8%) |
| $75,000 to $99,999 | 609 (11.1%) | 1,497 (20.5%) |
| $100,000 to $149,999 | 525 (9.6%) | 1,167 (16.0%) |
| $150,000 or more | 588 (10.7%) | 1,450 (19.9%) |
| Total | 5,487 (100.0%) | 7,284 (100.0%) |
Property Value to Household Income Ratio in Christian County
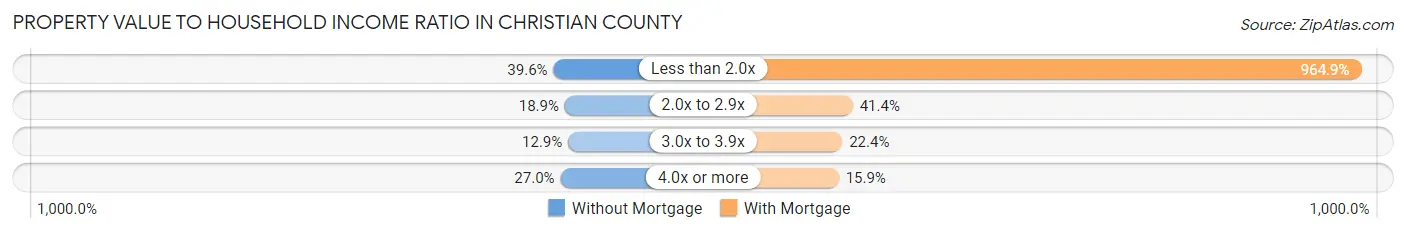
| Value-to-Income Ratio | Without Mortgage | With Mortgage |
| Less than 2.0x | 2,173 (39.6%) | 70,283 (964.9%) |
| 2.0x to 2.9x | 1,038 (18.9%) | 3,017 (41.4%) |
| 3.0x to 3.9x | 707 (12.9%) | 1,631 (22.4%) |
| 4.0x or more | 1,479 (27.0%) | 1,158 (15.9%) |
| Total | 5,487 (100.0%) | 7,284 (100.0%) |
Real Estate Taxes by Mortgage Status in Christian County
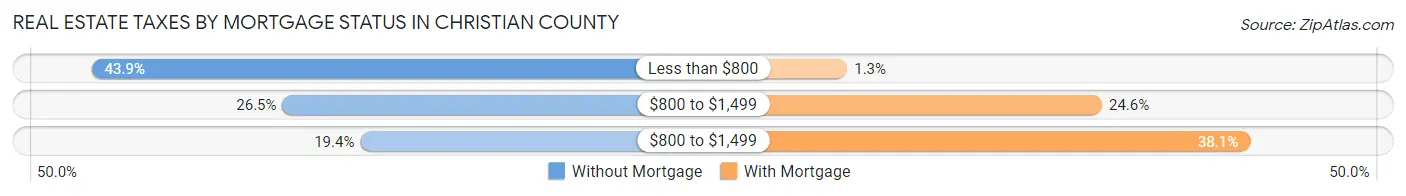
| Property Taxes | Without Mortgage | With Mortgage |
| Less than $800 | 2,408 (43.9%) | 95 (1.3%) |
| $800 to $1,499 | 1,452 (26.5%) | 1,790 (24.6%) |
| $800 to $1,499 | 1,062 (19.4%) | 2,774 (38.1%) |
| Total | 5,487 (100.0%) | 7,284 (100.0%) |
Health & Disability in Christian County
Health Insurance Coverage by Age in Christian County
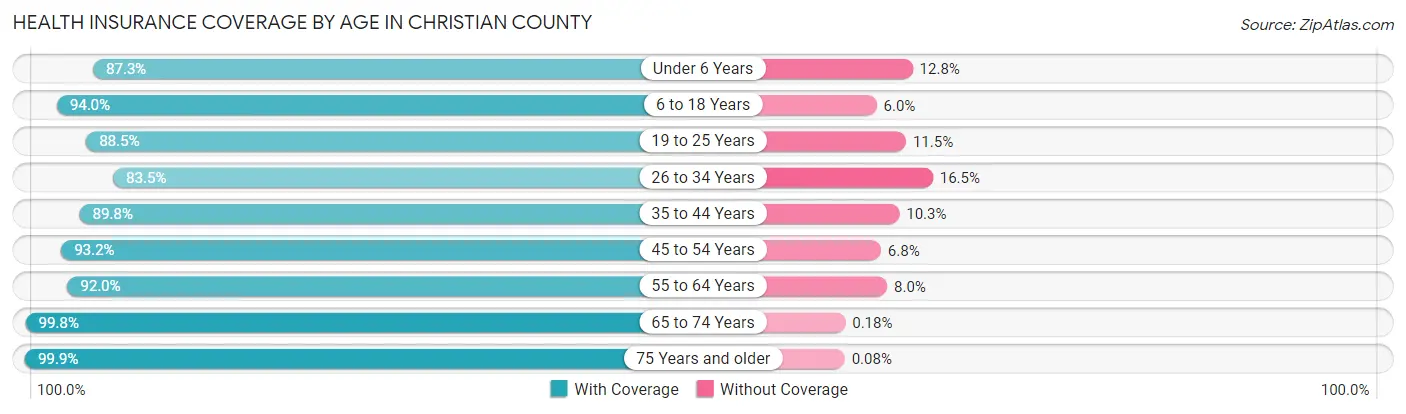
| Age Bracket | With Coverage | Without Coverage |
| Under 6 Years | 6,835 (87.3%) | 999 (12.8%) |
| 6 to 18 Years | 12,327 (94.0%) | 789 (6.0%) |
| 19 to 25 Years | 6,783 (88.5%) | 881 (11.5%) |
| 26 to 34 Years | 6,693 (83.5%) | 1,323 (16.5%) |
| 35 to 44 Years | 6,120 (89.7%) | 699 (10.2%) |
| 45 to 54 Years | 5,731 (93.2%) | 420 (6.8%) |
| 55 to 64 Years | 5,838 (92.0%) | 506 (8.0%) |
| 65 to 74 Years | 5,001 (99.8%) | 9 (0.2%) |
| 75 Years and older | 3,597 (99.9%) | 3 (0.1%) |
| Total | 58,925 (91.3%) | 5,629 (8.7%) |
Health Insurance Coverage by Citizenship Status in Christian County
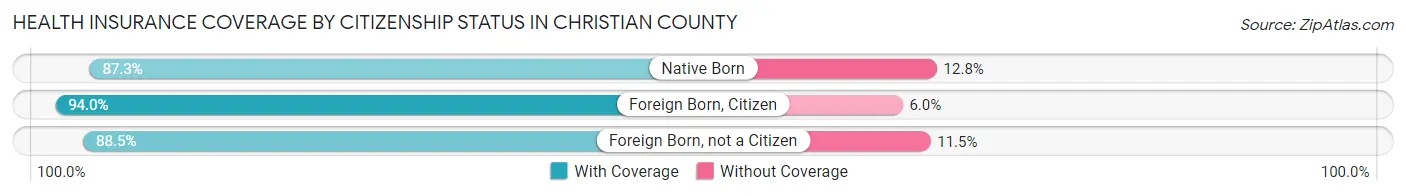
| Citizenship Status | With Coverage | Without Coverage |
| Native Born | 6,835 (87.3%) | 999 (12.8%) |
| Foreign Born, Citizen | 12,327 (94.0%) | 789 (6.0%) |
| Foreign Born, not a Citizen | 6,783 (88.5%) | 881 (11.5%) |
Health Insurance Coverage by Household Income in Christian County
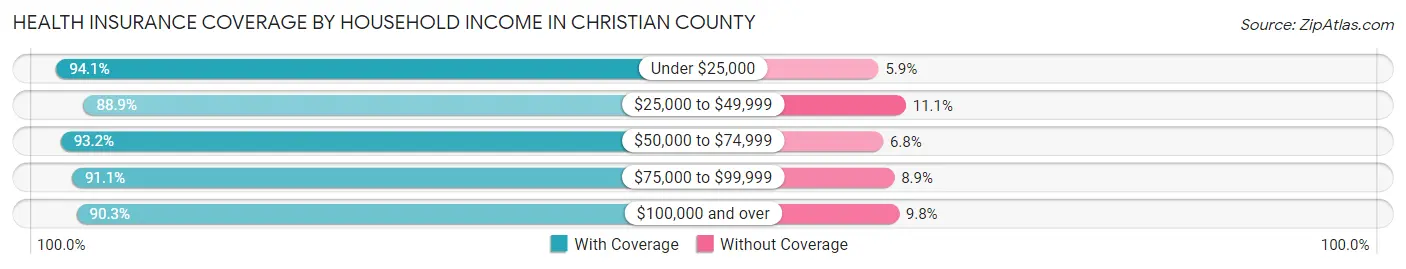
| Household Income | With Coverage | Without Coverage |
| Under $25,000 | 9,379 (94.1%) | 592 (5.9%) |
| $25,000 to $49,999 | 14,602 (88.9%) | 1,816 (11.1%) |
| $50,000 to $74,999 | 12,399 (93.2%) | 901 (6.8%) |
| $75,000 to $99,999 | 9,394 (91.1%) | 916 (8.9%) |
| $100,000 and over | 12,956 (90.2%) | 1,400 (9.8%) |
Public vs Private Health Insurance Coverage by Age in Christian County
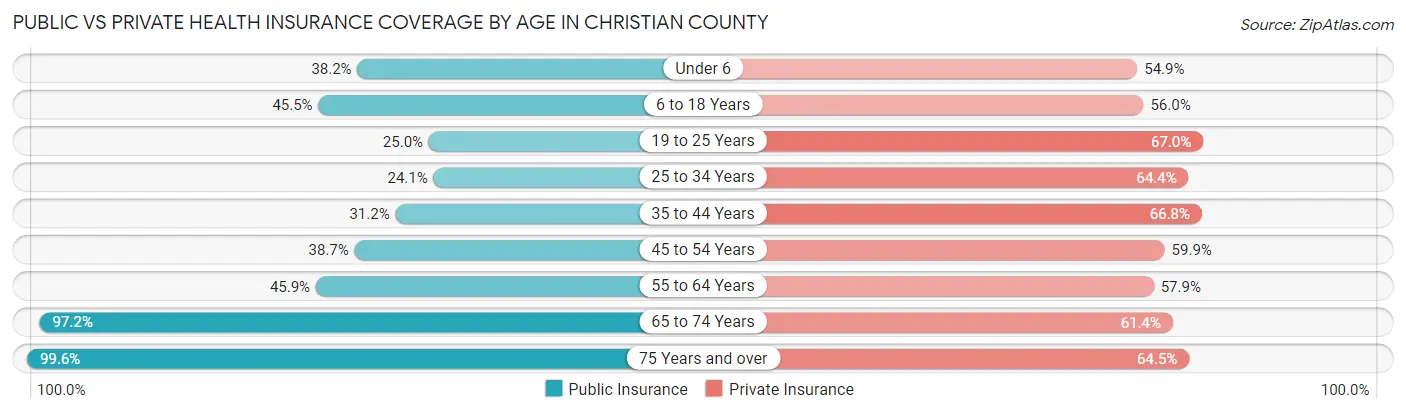
| Age Bracket | Public Insurance | Private Insurance |
| Under 6 | 2,994 (38.2%) | 4,297 (54.8%) |
| 6 to 18 Years | 5,962 (45.5%) | 7,345 (56.0%) |
| 19 to 25 Years | 1,913 (25.0%) | 5,138 (67.0%) |
| 25 to 34 Years | 1,931 (24.1%) | 5,159 (64.4%) |
| 35 to 44 Years | 2,125 (31.2%) | 4,557 (66.8%) |
| 45 to 54 Years | 2,383 (38.7%) | 3,686 (59.9%) |
| 55 to 64 Years | 2,913 (45.9%) | 3,673 (57.9%) |
| 65 to 74 Years | 4,871 (97.2%) | 3,078 (61.4%) |
| 75 Years and over | 3,584 (99.6%) | 2,321 (64.5%) |
| Total | 28,676 (44.4%) | 39,254 (60.8%) |
Disability Status by Sex by Age in Christian County
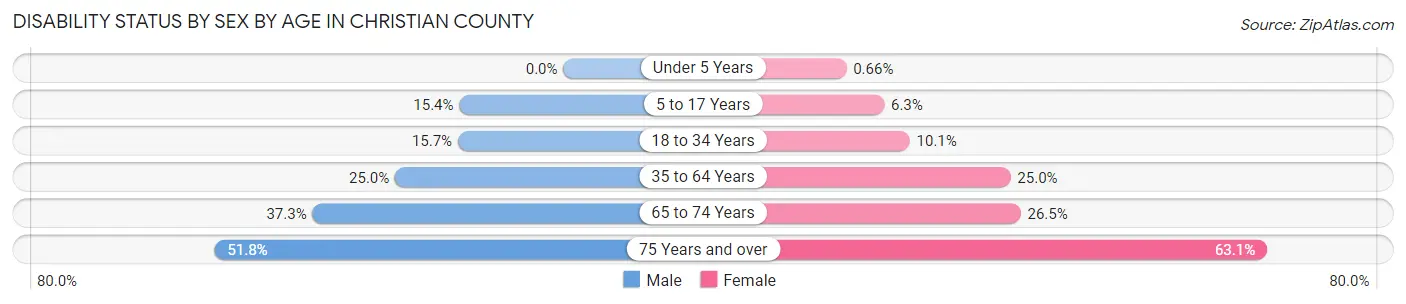
| Age Bracket | Male | Female |
| Under 5 Years | 0 (0.0%) | 22 (0.7%) |
| 5 to 17 Years | 1,020 (15.4%) | 407 (6.3%) |
| 18 to 34 Years | 1,270 (15.7%) | 857 (10.1%) |
| 35 to 64 Years | 2,234 (25.0%) | 2,597 (25.0%) |
| 65 to 74 Years | 847 (37.2%) | 726 (26.5%) |
| 75 Years and over | 731 (51.8%) | 1,382 (63.1%) |
Disability Class by Sex by Age in Christian County
Disability Class: Hearing Difficulty
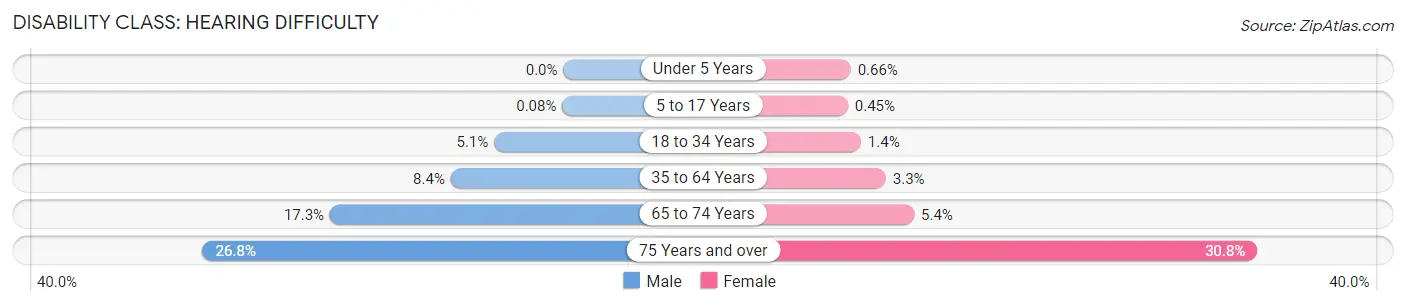
| Age Bracket | Male | Female |
| Under 5 Years | 0 (0.0%) | 22 (0.7%) |
| 5 to 17 Years | 5 (0.1%) | 29 (0.4%) |
| 18 to 34 Years | 417 (5.1%) | 121 (1.4%) |
| 35 to 64 Years | 748 (8.4%) | 339 (3.3%) |
| 65 to 74 Years | 394 (17.3%) | 147 (5.4%) |
| 75 Years and over | 378 (26.8%) | 675 (30.8%) |
Disability Class: Vision Difficulty
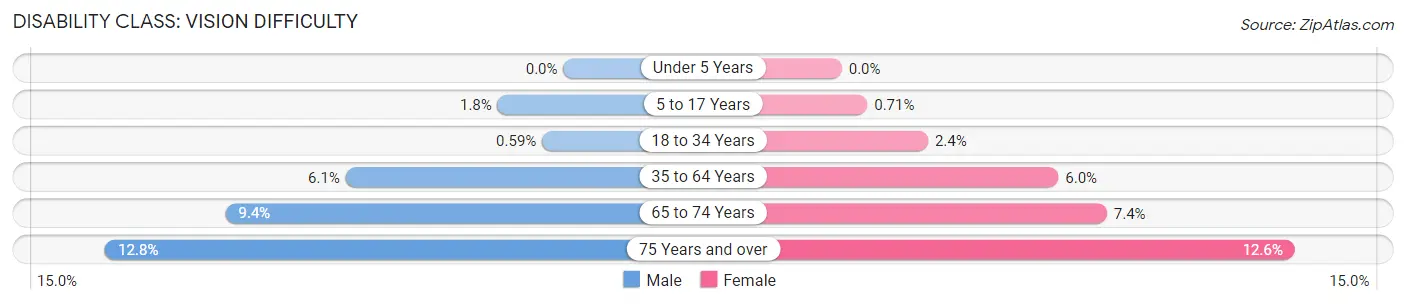
| Age Bracket | Male | Female |
| Under 5 Years | 0 (0.0%) | 0 (0.0%) |
| 5 to 17 Years | 121 (1.8%) | 46 (0.7%) |
| 18 to 34 Years | 48 (0.6%) | 204 (2.4%) |
| 35 to 64 Years | 542 (6.1%) | 625 (6.0%) |
| 65 to 74 Years | 214 (9.4%) | 202 (7.4%) |
| 75 Years and over | 180 (12.8%) | 276 (12.6%) |
Disability Class: Cognitive Difficulty
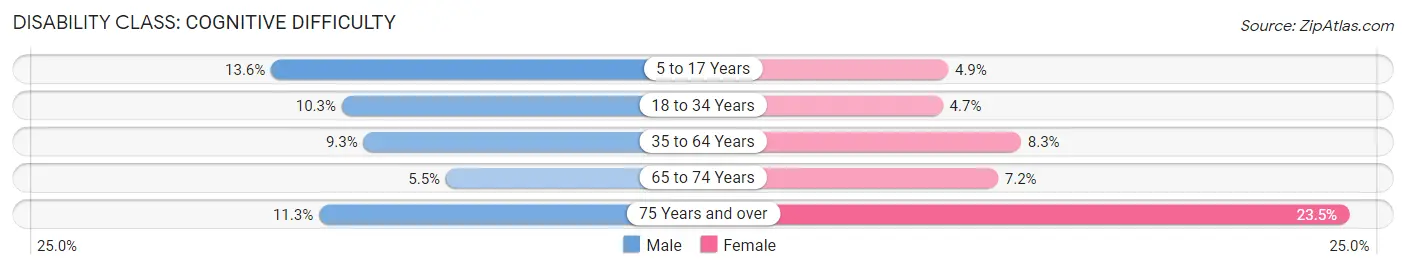
| Age Bracket | Male | Female |
| 5 to 17 Years | 896 (13.6%) | 320 (4.9%) |
| 18 to 34 Years | 834 (10.3%) | 398 (4.7%) |
| 35 to 64 Years | 829 (9.3%) | 862 (8.3%) |
| 65 to 74 Years | 124 (5.4%) | 198 (7.2%) |
| 75 Years and over | 160 (11.3%) | 515 (23.5%) |
Disability Class: Ambulatory Difficulty
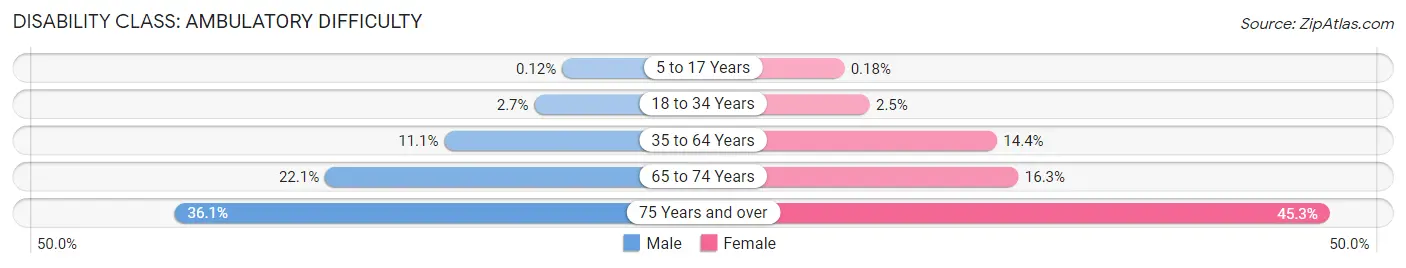
| Age Bracket | Male | Female |
| 5 to 17 Years | 8 (0.1%) | 12 (0.2%) |
| 18 to 34 Years | 218 (2.7%) | 215 (2.5%) |
| 35 to 64 Years | 988 (11.1%) | 1,488 (14.3%) |
| 65 to 74 Years | 503 (22.1%) | 447 (16.3%) |
| 75 Years and over | 509 (36.1%) | 991 (45.3%) |
Disability Class: Self-Care Difficulty
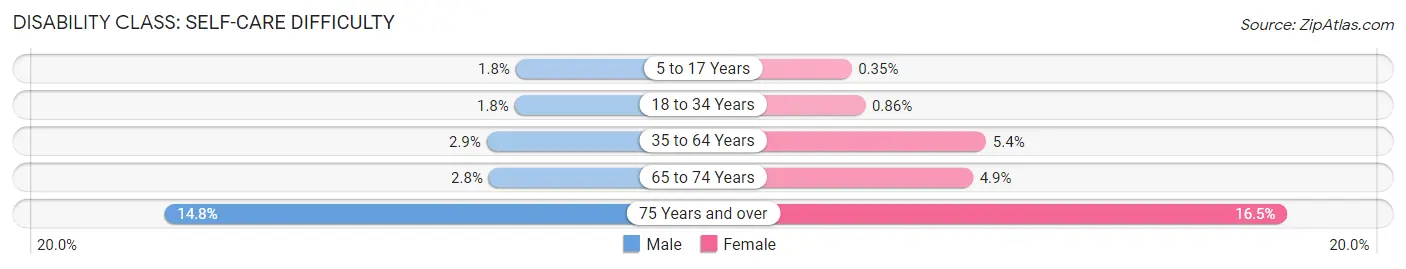
| Age Bracket | Male | Female |
| 5 to 17 Years | 117 (1.8%) | 23 (0.4%) |
| 18 to 34 Years | 147 (1.8%) | 73 (0.9%) |
| 35 to 64 Years | 255 (2.9%) | 555 (5.3%) |
| 65 to 74 Years | 63 (2.8%) | 133 (4.9%) |
| 75 Years and over | 209 (14.8%) | 362 (16.5%) |
Technology Access in Christian County
Computing Device Access in Christian County
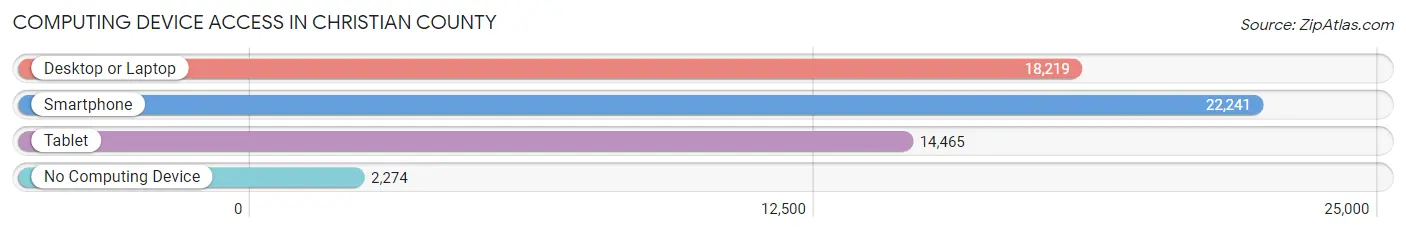
| Device Type | # Households | % Households |
| Desktop or Laptop | 18,219 | 71.2% |
| Smartphone | 22,241 | 86.9% |
| Tablet | 14,465 | 56.5% |
| No Computing Device | 2,274 | 8.9% |
| Total | 25,602 | 100.0% |
Internet Access in Christian County
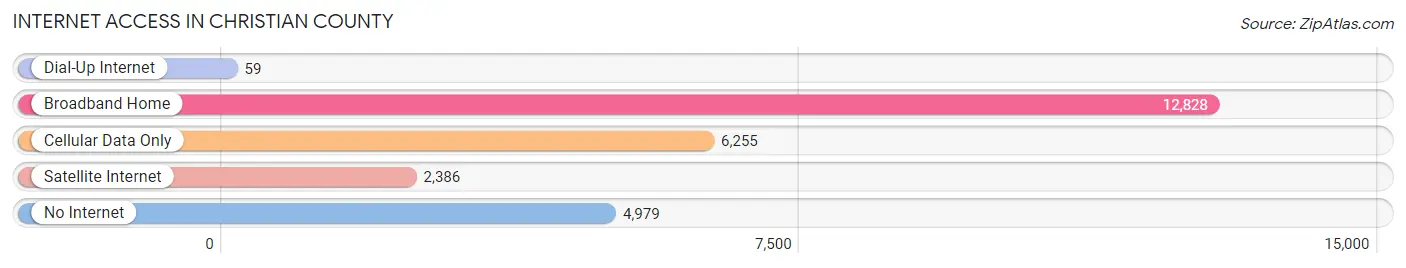
| Internet Type | # Households | % Households |
| Dial-Up Internet | 59 | 0.2% |
| Broadband Home | 12,828 | 50.1% |
| Cellular Data Only | 6,255 | 24.4% |
| Satellite Internet | 2,386 | 9.3% |
| No Internet | 4,979 | 19.5% |
| Total | 25,602 | 100.0% |
Christian County Summary
Christian County is located in the western part of Kentucky, and is part of the Jackson Purchase region. It is bordered by the counties of Trigg, Todd, Logan, Muhlenberg, Hopkins, and Caldwell. The county seat is Hopkinsville, and the county was formed in 1797 from a portion of Logan County. The county was named for Colonel William Christian, a Revolutionary War soldier and early settler of the area.
Geography
Christian County covers an area of 545 square miles, and is located in the Pennyroyal Plateau region of Kentucky. The terrain is mostly rolling hills, with some flat areas in the northern part of the county. The highest point in the county is located in the northwest corner, at an elevation of 645 feet. The county is drained by the Little River, which flows through the center of the county.
The county is home to several state parks, including Pennyrile Forest State Resort Park, which is located in the northern part of the county. The park offers camping, fishing, hiking, and other outdoor activities. Other parks in the county include the Land Between the Lakes National Recreation Area, which is located in the western part of the county, and the Kentucky Dam Village State Resort Park, which is located in the eastern part of the county.
Economy
Christian County has a diverse economy, with a mix of manufacturing, agriculture, and services. The county is home to several large employers, including the Hopkinsville-Christian County Airport, which is the largest employer in the county. Other major employers include the Christian County Board of Education, the Christian County Public Library, and the Christian County Health Department.
Agriculture is an important part of the county's economy, with corn, soybeans, and wheat being the primary crops. Livestock production is also important, with cattle, hogs, and poultry being the primary animals raised.
Manufacturing is also an important part of the county's economy, with several large companies located in the county. These include the Hopkinsville Milling Company, which produces flour and other grain products, and the Hopkinsville Foundry, which produces cast iron products.
Demographics
As of the 2010 census, Christian County had a population of 73,955. The population was spread out, with 24.3% under the age of 18, 8.7% from 18 to 24, 28.2% from 25 to 44, 24.3% from 45 to 64, and 14.5% who were 65 years of age or older. The median age was 37.3 years.
The median income for a household in the county was $41,945, and the median income for a family was $50,945. The per capita income for the county was $20,945. About 11.2% of families and 14.3% of the population were below the poverty line, including 19.2% of those under age 18 and 10.2% of those age 65 or over.
Christian County is a predominantly rural county, with most of the population living in small towns and rural areas. The largest city in the county is Hopkinsville, which is the county seat. Other cities in the county include Pembroke, Crofton, and Gracey.
Common Questions
What is the Total Population of Christian County?
Total Population of Christian County is 72,766.
What is the Total Male Population of Christian County?
Total Male Population of Christian County is 38,239.
What is the Total Female Population of Christian County?
Total Female Population of Christian County is 34,527.
What is the Ratio of Males per 100 Females in Christian County?
There are 110.75 Males per 100 Females in Christian County.
What is the Ratio of Females per 100 Males in Christian County?
There are 90.29 Females per 100 Males in Christian County.
What is the Median Population Age in Christian County?
Median Population Age in Christian County is 28.4 Years.
What is the Average Family Size in Christian County
Average Family Size in Christian County is 3.3 People.
What is the Average Household Size in Christian County
Average Household Size in Christian County is 2.6 People.
What is Per Capita Income in Christian County?
Per Capita income in Christian County is $25,973.
What is the Median Family Income in Christian County?
Median Family Income in Christian County is $59,110.
What is the Median Household income in Christian County?
Median Household Income in Christian County is $48,920.
What is Income or Wage Gap in Christian County?
Income or Wage Gap in Christian County is 22.2%.
Women in Christian County earn 77.8 cents for every dollar earned by a man.
What is Family Income Deficit in Christian County?
Family Income Deficit in Christian County is $11,158.
Families that are below poverty line in Christian County earn $11,158 less on average than the poverty threshold level.
What is Inequality or Gini Index in Christian County?
Inequality or Gini Index in Christian County is 0.47.
How Large is the Labor Force in Christian County?
There are 32,594 People in the Labor Forcein in Christian County.
What is the Percentage of People in the Labor Force in Christian County?
59.9% of People are in the Labor Force in Christian County.
What is the Unemployment Rate in Christian County?
Unemployment Rate in Christian County is 7.6%.