Calloway County, KY
Calloway County Map
Calloway County Overview
37,345
TOTAL POPULATION
18,201
MALE POPULATION
19,144
FEMALE POPULATION
95.07
MALES / 100 FEMALES
105.18
FEMALES / 100 MALES
35.6
MEDIAN AGE
2.9
AVG FAMILY SIZE
2.3
AVG HOUSEHOLD SIZE
$27,850
PER CAPITA INCOME
$74,371
AVG FAMILY INCOME
$48,276
AVG HOUSEHOLD INCOME
35.9%
WAGE / INCOME GAP [ % ]
64.1¢/ $1
WAGE / INCOME GAP [ $ ]
$9,904
FAMILY INCOME DEFICIT
0.48
INEQUALITY / GINI INDEX
18,256
LABOR FORCE [ PEOPLE ]
58.1%
PERCENT IN LABOR FORCE
4.7%
UNEMPLOYMENT RATE
Calloway County Area Codes
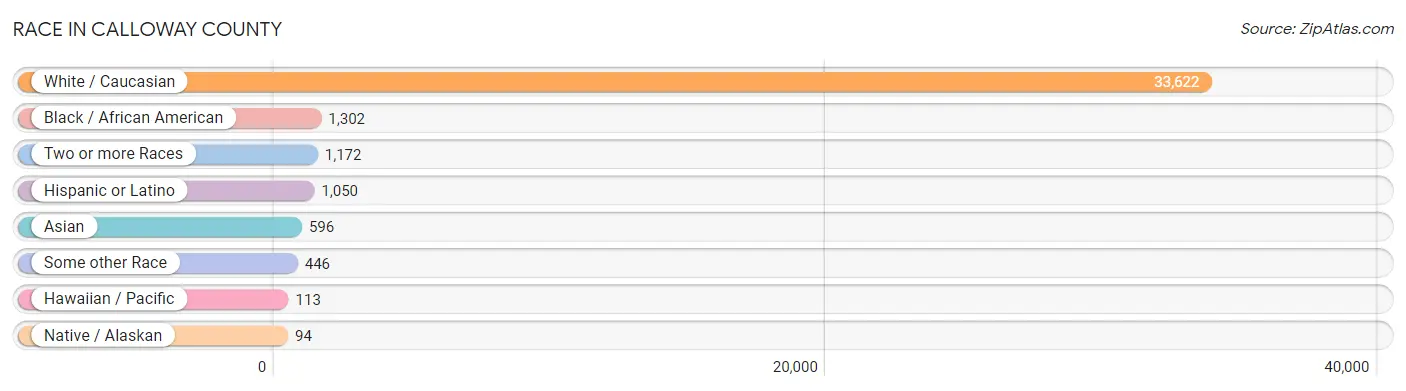
Race in Calloway County
The most populous races in Calloway County are White / Caucasian (33,622 | 90.0%), Black / African American (1,302 | 3.5%), and Two or more Races (1,172 | 3.1%).
| Race | # Population | % Population |
| Asian | 596 | 1.6% |
| Black / African American | 1,302 | 3.5% |
| Hawaiian / Pacific | 113 | 0.3% |
| Hispanic or Latino | 1,050 | 2.8% |
| Native / Alaskan | 94 | 0.3% |
| White / Caucasian | 33,622 | 90.0% |
| Two or more Races | 1,172 | 3.1% |
| Some other Race | 446 | 1.2% |
| Total | 37,345 | 100.0% |
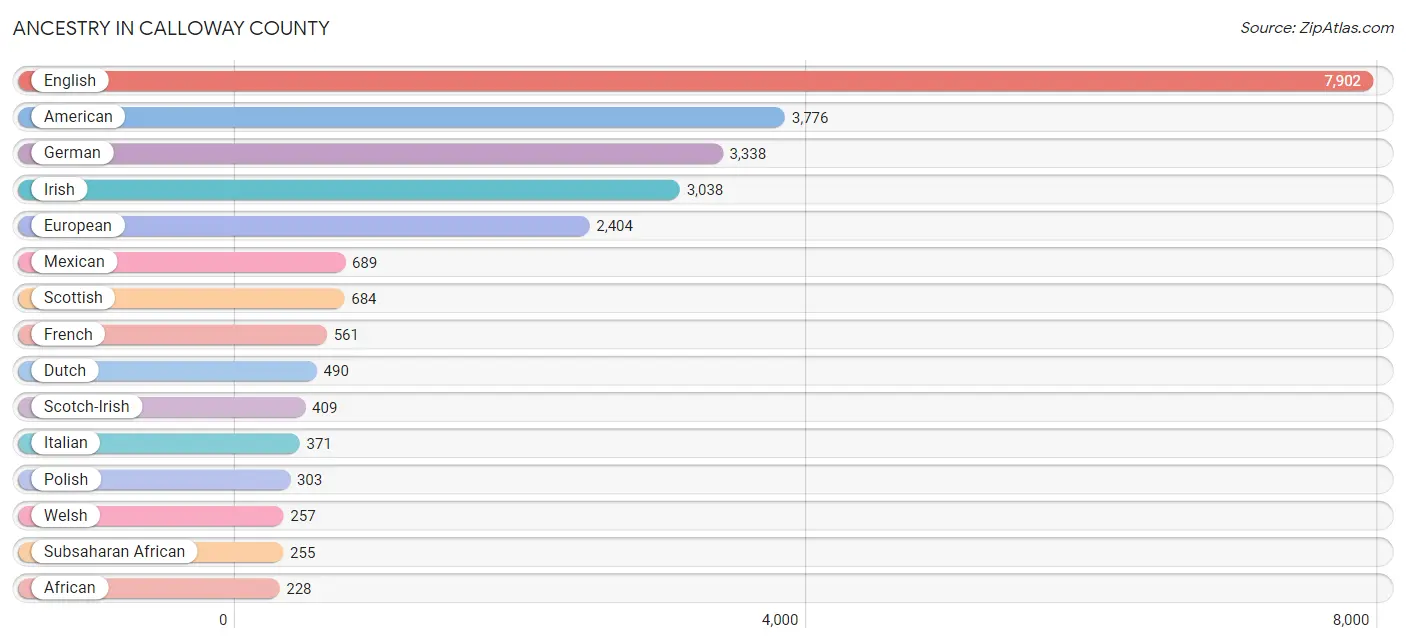
Ancestry in Calloway County
The most populous ancestries reported in Calloway County are English (7,902 | 21.2%), American (3,776 | 10.1%), German (3,338 | 8.9%), Irish (3,038 | 8.1%), and European (2,404 | 6.4%), together accounting for 54.8% of all Calloway County residents.
| Ancestry | # Population | % Population |
| African | 228 | 0.6% |
| Alaska Native | 5 | 0.0% |
| American | 3,776 | 10.1% |
| Apache | 19 | 0.1% |
| Arab | 58 | 0.2% |
| Austrian | 16 | 0.0% |
| Bahamian | 41 | 0.1% |
| Belizean | 40 | 0.1% |
| Bhutanese | 52 | 0.1% |
| Blackfeet | 24 | 0.1% |
| Bolivian | 6 | 0.0% |
| British | 223 | 0.6% |
| Burmese | 78 | 0.2% |
| Canadian | 6 | 0.0% |
| Central American | 54 | 0.1% |
| Central American Indian | 5 | 0.0% |
| Cherokee | 132 | 0.4% |
| Choctaw | 25 | 0.1% |
| Colombian | 11 | 0.0% |
| Creek | 4 | 0.0% |
| Croatian | 4 | 0.0% |
| Cuban | 22 | 0.1% |
| Czech | 59 | 0.2% |
| Danish | 20 | 0.1% |
| Dominican | 16 | 0.0% |
| Dutch | 490 | 1.3% |
| Eastern European | 11 | 0.0% |
| Egyptian | 20 | 0.1% |
| English | 7,902 | 21.2% |
| European | 2,404 | 6.4% |
| Fijian | 3 | 0.0% |
| French | 561 | 1.5% |
| French American Indian | 4 | 0.0% |
| French Canadian | 46 | 0.1% |
| German | 3,338 | 8.9% |
| Greek | 79 | 0.2% |
| Guatemalan | 49 | 0.1% |
| Honduran | 5 | 0.0% |
| Indian (Asian) | 92 | 0.3% |
| Irish | 3,038 | 8.1% |
| Israeli | 20 | 0.1% |
| Italian | 371 | 1.0% |
| Jamaican | 7 | 0.0% |
| Japanese | 119 | 0.3% |
| Korean | 180 | 0.5% |
| Laotian | 160 | 0.4% |
| Lithuanian | 55 | 0.2% |
| Mexican | 689 | 1.8% |
| Mexican American Indian | 5 | 0.0% |
| Native Hawaiian | 110 | 0.3% |
| New Zealander | 12 | 0.0% |
| Nigerian | 27 | 0.1% |
| Northern European | 60 | 0.2% |
| Norwegian | 160 | 0.4% |
| Polish | 303 | 0.8% |
| Pueblo | 1 | 0.0% |
| Puerto Rican | 173 | 0.5% |
| Romanian | 13 | 0.0% |
| Russian | 117 | 0.3% |
| Samoan | 10 | 0.0% |
| Scandinavian | 58 | 0.2% |
| Scotch-Irish | 409 | 1.1% |
| Scottish | 684 | 1.8% |
| Sioux | 34 | 0.1% |
| Slovene | 9 | 0.0% |
| South American | 17 | 0.1% |
| Spaniard | 15 | 0.0% |
| Spanish | 21 | 0.1% |
| Sri Lankan | 12 | 0.0% |
| Subsaharan African | 255 | 0.7% |
| Swedish | 221 | 0.6% |
| Swiss | 22 | 0.1% |
| Thai | 106 | 0.3% |
| Trinidadian and Tobagonian | 11 | 0.0% |
| Turkish | 8 | 0.0% |
| Welsh | 257 | 0.7% | View All 76 Rows |
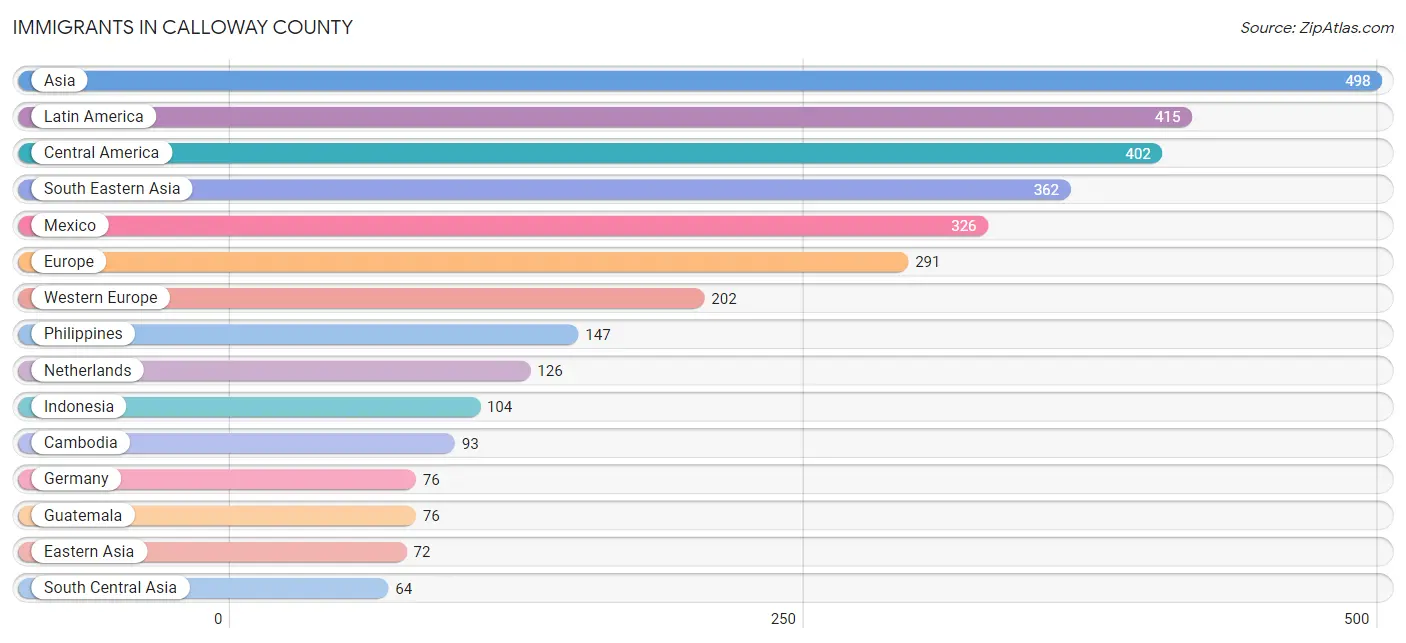
Immigrants in Calloway County
The most numerous immigrant groups reported in Calloway County came from Asia (498 | 1.3%), Latin America (415 | 1.1%), Central America (402 | 1.1%), South Eastern Asia (362 | 1.0%), and Mexico (326 | 0.9%), together accounting for 5.4% of all Calloway County residents.
| Immigration Origin | # Population | % Population |
| Africa | 27 | 0.1% |
| Asia | 498 | 1.3% |
| Australia | 32 | 0.1% |
| Cambodia | 93 | 0.3% |
| Canada | 14 | 0.0% |
| Caribbean | 13 | 0.0% |
| Central America | 402 | 1.1% |
| China | 26 | 0.1% |
| Cuba | 2 | 0.0% |
| Eastern Asia | 72 | 0.2% |
| Eastern Europe | 57 | 0.2% |
| Europe | 291 | 0.8% |
| Germany | 76 | 0.2% |
| Guatemala | 76 | 0.2% |
| India | 57 | 0.2% |
| Indonesia | 104 | 0.3% |
| Italy | 24 | 0.1% |
| Korea | 46 | 0.1% |
| Latin America | 415 | 1.1% |
| Mexico | 326 | 0.9% |
| Netherlands | 126 | 0.3% |
| Nigeria | 27 | 0.1% |
| Oceania | 44 | 0.1% |
| Philippines | 147 | 0.4% |
| Romania | 13 | 0.0% |
| Russia | 35 | 0.1% |
| South Central Asia | 64 | 0.2% |
| South Eastern Asia | 362 | 1.0% |
| Southern Europe | 32 | 0.1% |
| Spain | 8 | 0.0% |
| Trinidad and Tobago | 11 | 0.0% |
| Uzbekistan | 7 | 0.0% |
| Vietnam | 11 | 0.0% |
| Western Africa | 27 | 0.1% |
| Western Europe | 202 | 0.5% | View All 35 Rows |
Sex and Age in Calloway County
Sex and Age in Calloway County
The most populous age groups in Calloway County are 20 to 24 Years (2,501 | 13.7%) for men and 20 to 24 Years (2,220 | 11.6%) for women.
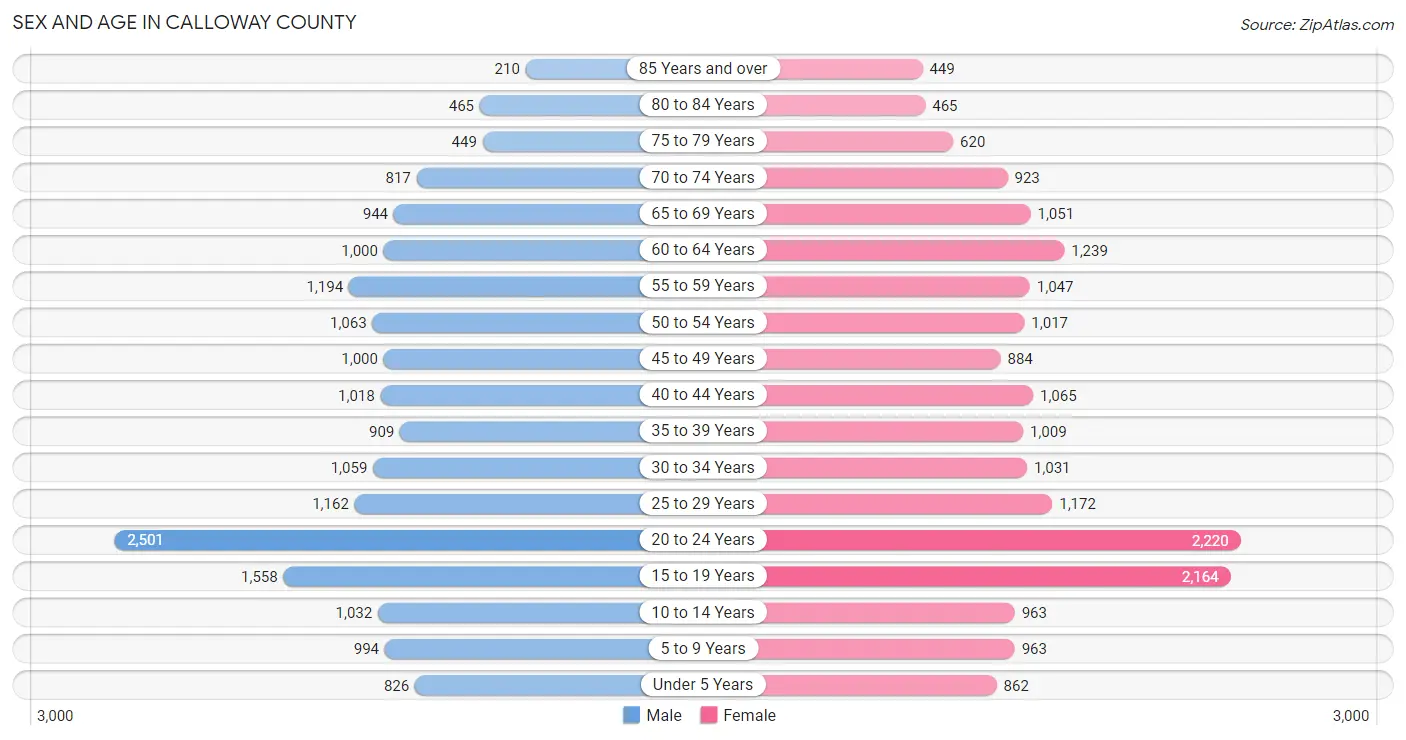
| Age Bracket | Male | Female |
| Under 5 Years | 826 (4.5%) | 862 (4.5%) |
| 5 to 9 Years | 994 (5.5%) | 963 (5.0%) |
| 10 to 14 Years | 1,032 (5.7%) | 963 (5.0%) |
| 15 to 19 Years | 1,558 (8.6%) | 2,164 (11.3%) |
| 20 to 24 Years | 2,501 (13.7%) | 2,220 (11.6%) |
| 25 to 29 Years | 1,162 (6.4%) | 1,172 (6.1%) |
| 30 to 34 Years | 1,059 (5.8%) | 1,031 (5.4%) |
| 35 to 39 Years | 909 (5.0%) | 1,009 (5.3%) |
| 40 to 44 Years | 1,018 (5.6%) | 1,065 (5.6%) |
| 45 to 49 Years | 1,000 (5.5%) | 884 (4.6%) |
| 50 to 54 Years | 1,063 (5.8%) | 1,017 (5.3%) |
| 55 to 59 Years | 1,194 (6.6%) | 1,047 (5.5%) |
| 60 to 64 Years | 1,000 (5.5%) | 1,239 (6.5%) |
| 65 to 69 Years | 944 (5.2%) | 1,051 (5.5%) |
| 70 to 74 Years | 817 (4.5%) | 923 (4.8%) |
| 75 to 79 Years | 449 (2.5%) | 620 (3.2%) |
| 80 to 84 Years | 465 (2.5%) | 465 (2.4%) |
| 85 Years and over | 210 (1.1%) | 449 (2.4%) |
| Total | 18,201 (100.0%) | 19,144 (100.0%) |
Families and Households in Calloway County
Median Family Size in Calloway County
The median family size in Calloway County is 2.93 persons per family, with single female/mother families (1,579 | 18.0%) accounting for the largest median family size of 3.17 persons per family. On the other hand, single male/father families (648 | 7.4%) represent the smallest median family size with 2.12 persons per family.
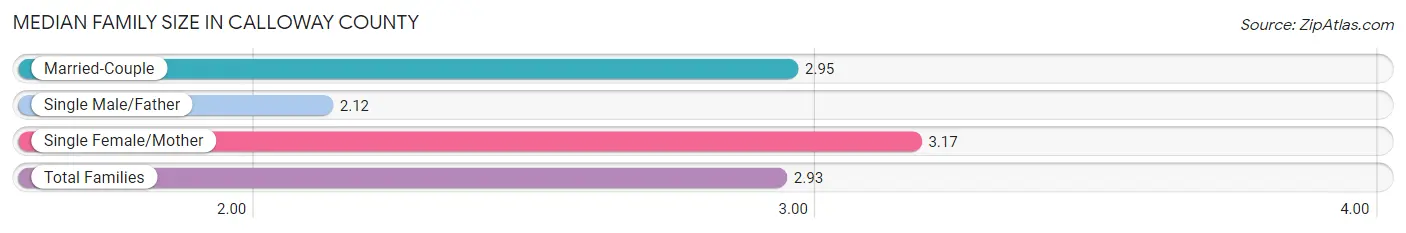
| Family Type | # Families | Family Size |
| Married-Couple | 6,535 (74.6%) | 2.95 |
| Single Male/Father | 648 (7.4%) | 2.12 |
| Single Female/Mother | 1,579 (18.0%) | 3.17 |
| Total Families | 8,762 (100.0%) | 2.93 |
Median Household Size in Calloway County
The median household size in Calloway County is 2.31 persons per household, with single female/mother households (1,579 | 10.7%) accounting for the largest median household size of 3.33 persons per household. non-family households (6,043 | 40.8%) represent the smallest median household size with 1.32 persons per household.
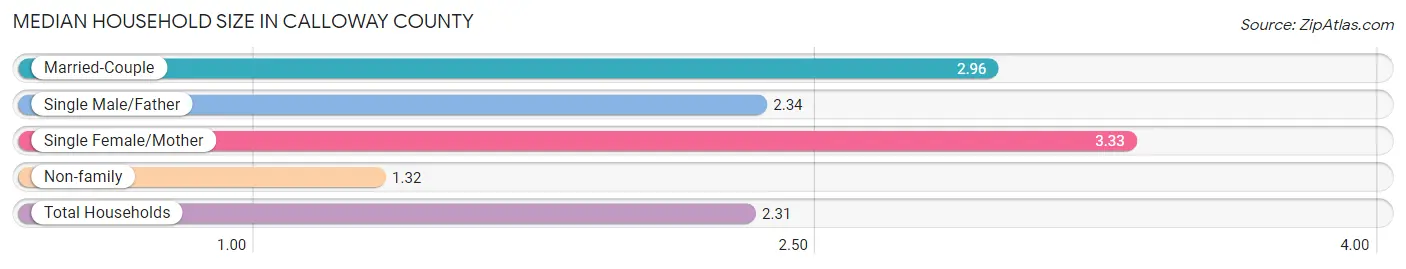
| Household Type | # Households | Household Size |
| Married-Couple | 6,535 (44.1%) | 2.96 |
| Single Male/Father | 648 (4.4%) | 2.34 |
| Single Female/Mother | 1,579 (10.7%) | 3.33 |
| Non-family | 6,043 (40.8%) | 1.32 |
| Total Households | 14,805 (100.0%) | 2.31 |
Household Size by Marriage Status in Calloway County
Out of a total of 14,805 households in Calloway County, 8,762 (59.2%) are family households, while 6,043 (40.8%) are nonfamily households. The most numerous type of family households are 2-person households, comprising 4,447, and the most common type of nonfamily households are 1-person households, comprising 4,671.
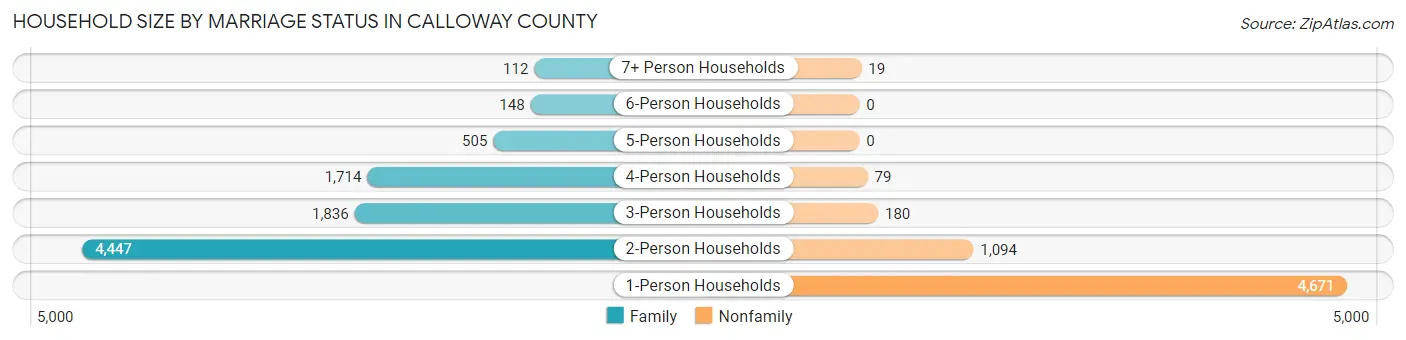
| Household Size | Family Households | Nonfamily Households |
| 1-Person Households | - | 4,671 (31.6%) |
| 2-Person Households | 4,447 (30.0%) | 1,094 (7.4%) |
| 3-Person Households | 1,836 (12.4%) | 180 (1.2%) |
| 4-Person Households | 1,714 (11.6%) | 79 (0.5%) |
| 5-Person Households | 505 (3.4%) | 0 (0.0%) |
| 6-Person Households | 148 (1.0%) | 0 (0.0%) |
| 7+ Person Households | 112 (0.8%) | 19 (0.1%) |
| Total | 8,762 (59.2%) | 6,043 (40.8%) |
Female Fertility in Calloway County
Fertility by Age in Calloway County
Average fertility rate in Calloway County is 45.0 births per 1,000 women. Women in the age bracket of 20 to 34 years have the highest fertility rate with 84.0 births per 1,000 women. Women in the age bracket of 20 to 34 years acount for 83.6% of all women with births.
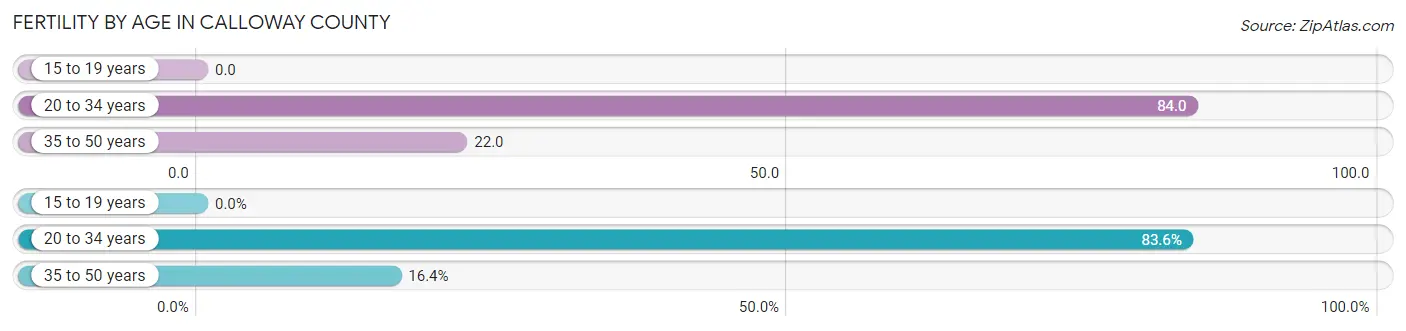
| Age Bracket | Women with Births | Births / 1,000 Women |
| 15 to 19 years | 0 (0.0%) | 0.0 |
| 20 to 34 years | 372 (83.6%) | 84.0 |
| 35 to 50 years | 73 (16.4%) | 22.0 |
| Total | 445 (100.0%) | 45.0 |
Fertility by Age by Marriage Status in Calloway County
67.6% of women with births (445) in Calloway County are married. The highest percentage of unmarried women with births falls into 20 to 34 years age bracket with 38.2% of them unmarried at the time of birth, while the lowest percentage of unmarried women with births belong to 35 to 50 years age bracket with 2.7% of them unmarried.
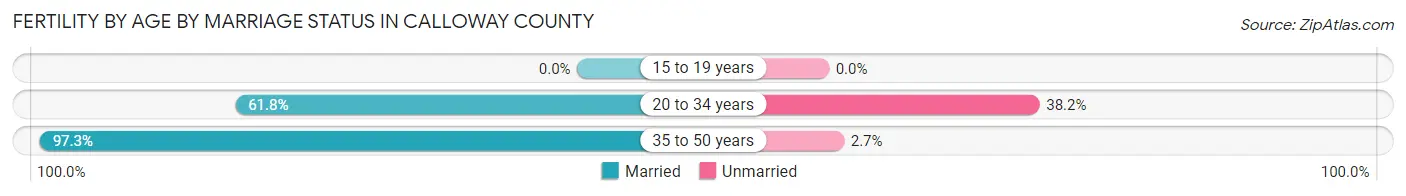
| Age Bracket | Married | Unmarried |
| 15 to 19 years | 0 (0.0%) | 0 (0.0%) |
| 20 to 34 years | 230 (61.8%) | 142 (38.2%) |
| 35 to 50 years | 71 (97.3%) | 2 (2.7%) |
| Total | 301 (67.6%) | 144 (32.4%) |
Fertility by Education in Calloway County
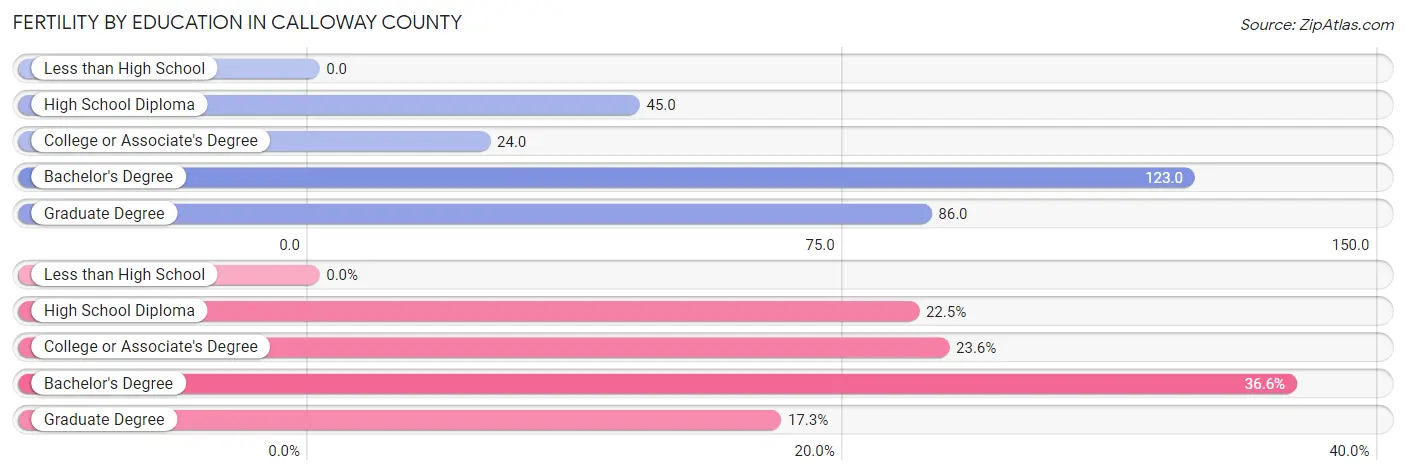
| Educational Attainment | Women with Births | Births / 1,000 Women |
| Less than High School | 0 (0.0%) | 0.0 |
| High School Diploma | 100 (22.5%) | 45.0 |
| College or Associate's Degree | 105 (23.6%) | 24.0 |
| Bachelor's Degree | 163 (36.6%) | 123.0 |
| Graduate Degree | 77 (17.3%) | 86.0 |
| Total | 445 (100.0%) | 45.0 |
Fertility by Education by Marriage Status in Calloway County
32.4% of women with births in Calloway County are unmarried. Women with the educational attainment of graduate degree are most likely to be married with 100.0% of them married at childbirth, while women with the educational attainment of college or associate's degree are least likely to be married with 72.4% of them unmarried at childbirth.
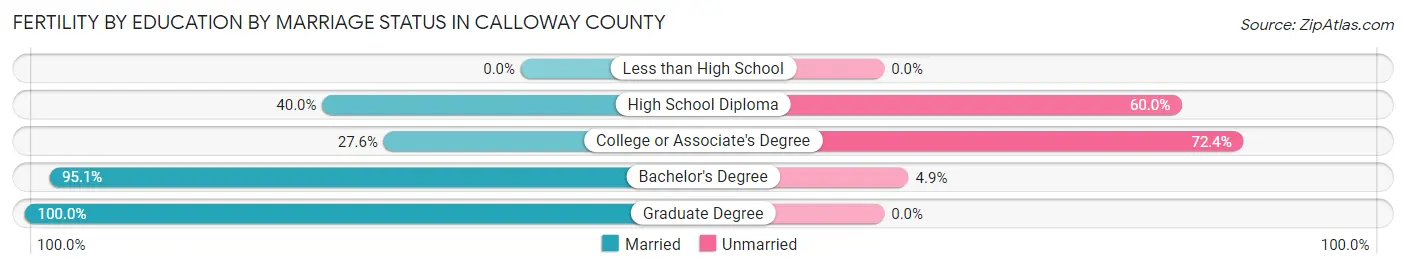
| Educational Attainment | Married | Unmarried |
| Less than High School | 0 (0.0%) | 0 (0.0%) |
| High School Diploma | 40 (40.0%) | 60 (60.0%) |
| College or Associate's Degree | 29 (27.6%) | 76 (72.4%) |
| Bachelor's Degree | 155 (95.1%) | 8 (4.9%) |
| Graduate Degree | 77 (100.0%) | 0 (0.0%) |
| Total | 301 (67.6%) | 144 (32.4%) |
Income in Calloway County
Income Overview in Calloway County
Per Capita Income in Calloway County is $27,850, while median incomes of families and households are $74,371 and $48,276 respectively.
| Characteristic | Number | Measure |
| Per Capita Income | 37,345 | $27,850 |
| Median Family Income | 8,762 | $74,371 |
| Mean Family Income | 8,762 | $88,395 |
| Median Household Income | 14,805 | $48,276 |
| Mean Household Income | 14,805 | $68,254 |
| Income Deficit | 8,762 | $9,904 |
| Wage / Income Gap (%) | 37,345 | 35.89% |
| Wage / Income Gap ($) | 37,345 | 64.11¢ per $1 |
| Gini / Inequality Index | 37,345 | 0.48 |
Earnings by Sex in Calloway County
Average Earnings in Calloway County are $29,054, $34,593 for men and $22,178 for women, a difference of 35.9%.
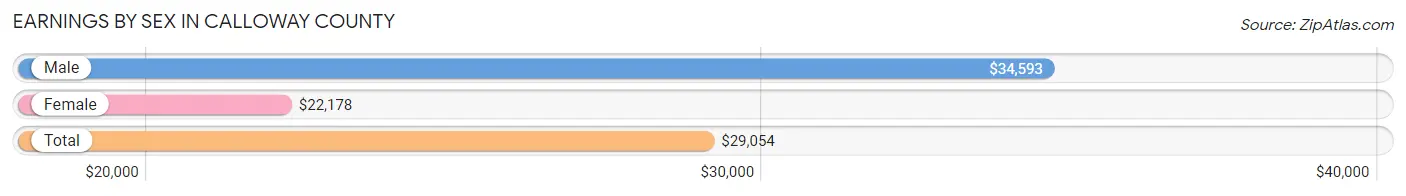
| Sex | Number | Average Earnings |
| Male | 9,695 (49.6%) | $34,593 |
| Female | 9,869 (50.4%) | $22,178 |
| Total | 19,564 (100.0%) | $29,054 |
Earnings by Sex by Income Bracket in Calloway County
The most common earnings brackets in Calloway County are $30,000 to $34,999 for men (894 | 9.2%) and $2,499 or less for women (896 | 9.1%).
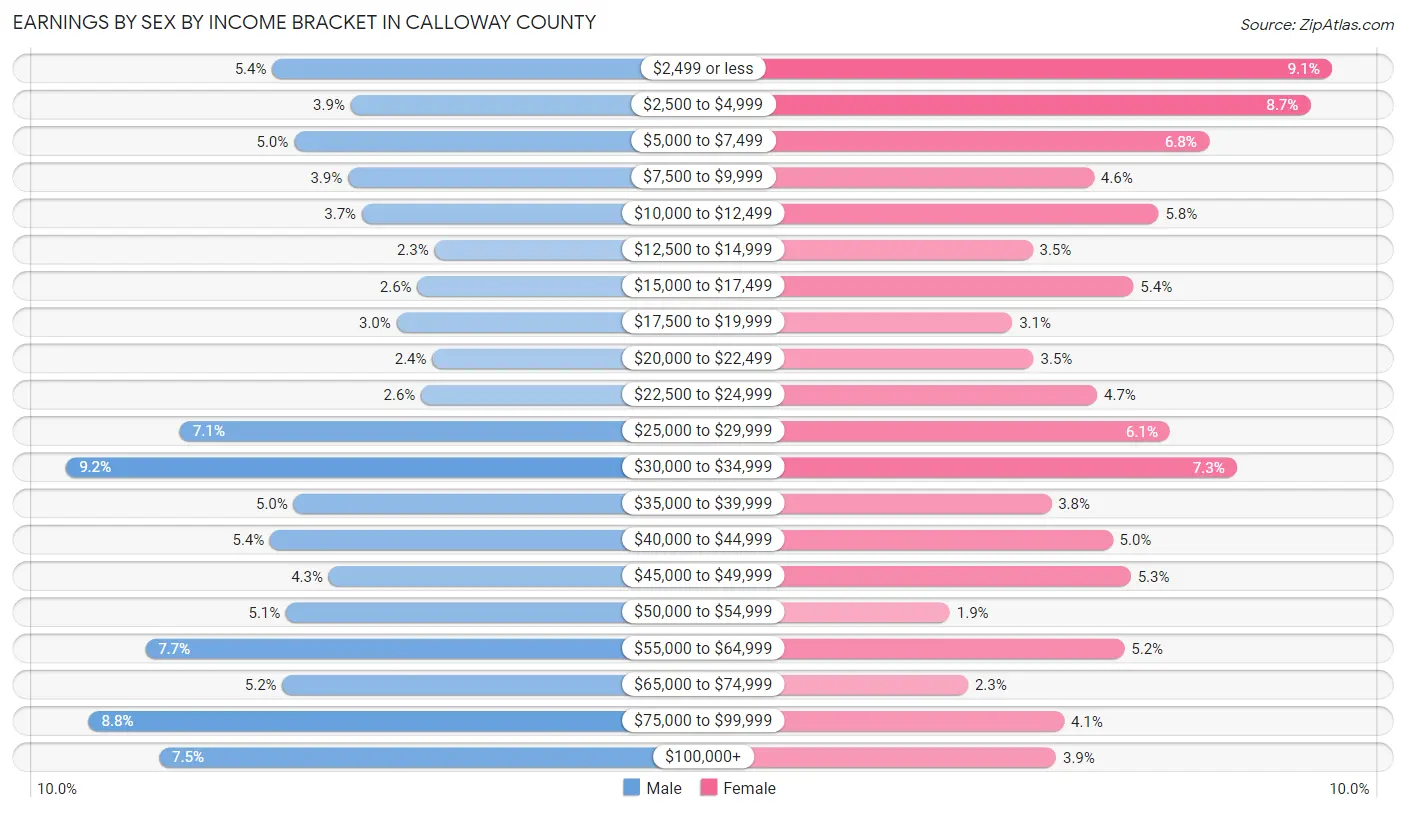
| Income | Male | Female |
| $2,499 or less | 520 (5.4%) | 896 (9.1%) |
| $2,500 to $4,999 | 377 (3.9%) | 857 (8.7%) |
| $5,000 to $7,499 | 480 (5.0%) | 669 (6.8%) |
| $7,500 to $9,999 | 382 (3.9%) | 457 (4.6%) |
| $10,000 to $12,499 | 357 (3.7%) | 576 (5.8%) |
| $12,500 to $14,999 | 225 (2.3%) | 343 (3.5%) |
| $15,000 to $17,499 | 256 (2.6%) | 530 (5.4%) |
| $17,500 to $19,999 | 294 (3.0%) | 306 (3.1%) |
| $20,000 to $22,499 | 229 (2.4%) | 345 (3.5%) |
| $22,500 to $24,999 | 249 (2.6%) | 463 (4.7%) |
| $25,000 to $29,999 | 687 (7.1%) | 597 (6.0%) |
| $30,000 to $34,999 | 894 (9.2%) | 720 (7.3%) |
| $35,000 to $39,999 | 481 (5.0%) | 378 (3.8%) |
| $40,000 to $44,999 | 524 (5.4%) | 491 (5.0%) |
| $45,000 to $49,999 | 417 (4.3%) | 525 (5.3%) |
| $50,000 to $54,999 | 494 (5.1%) | 190 (1.9%) |
| $55,000 to $64,999 | 750 (7.7%) | 513 (5.2%) |
| $65,000 to $74,999 | 501 (5.2%) | 224 (2.3%) |
| $75,000 to $99,999 | 853 (8.8%) | 402 (4.1%) |
| $100,000+ | 725 (7.5%) | 387 (3.9%) |
| Total | 9,695 (100.0%) | 9,869 (100.0%) |
Earnings by Sex by Educational Attainment in Calloway County
Average earnings in Calloway County are $43,998 for men and $31,696 for women, a difference of 28.0%. Men with an educational attainment of graduate degree enjoy the highest average annual earnings of $67,037, while those with less than high school education earn the least with $33,333. Women with an educational attainment of graduate degree earn the most with the average annual earnings of $56,296, while those with high school diploma education have the smallest earnings of $22,509.
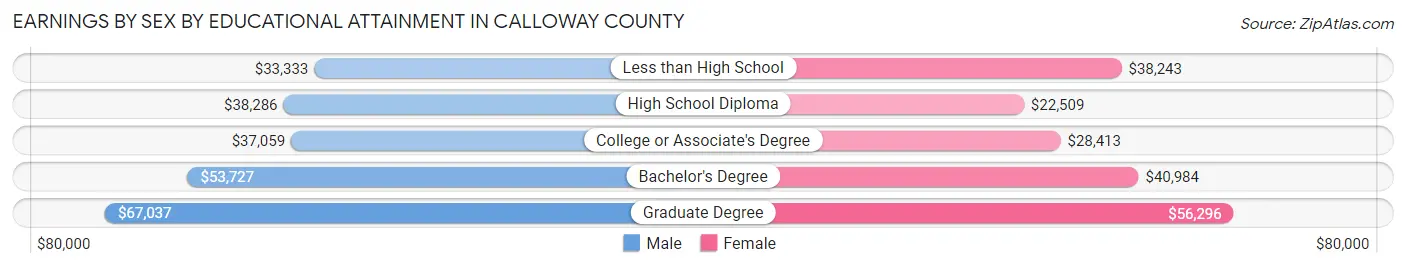
| Educational Attainment | Male Income | Female Income |
| Less than High School | $33,333 | $38,243 |
| High School Diploma | $38,286 | $22,509 |
| College or Associate's Degree | $37,059 | $28,413 |
| Bachelor's Degree | $53,727 | $40,984 |
| Graduate Degree | $67,037 | $56,296 |
| Total | $43,998 | $31,696 |
Family Income in Calloway County
Family Income Brackets in Calloway County
According to the Calloway County family income data, there are 1,779 families falling into the $100,000 to $149,999 income range, which is the most common income bracket and makes up 20.3% of all families. Conversely, the less than $10,000 income bracket is the least frequent group with only 263 families (3.0%) belonging to this category.
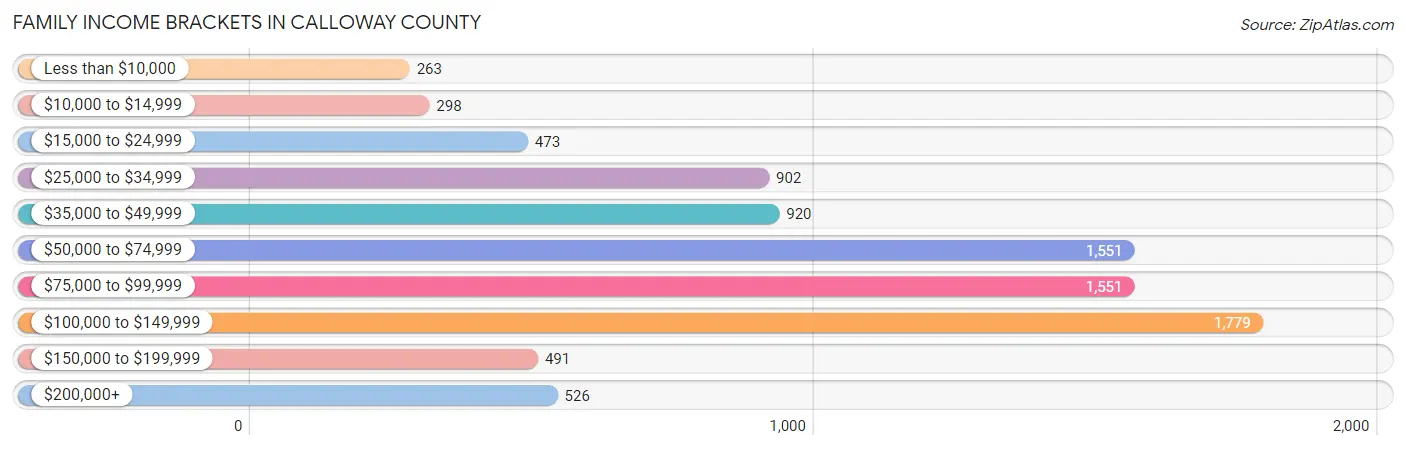
| Income Bracket | # Families | % Families |
| Less than $10,000 | 263 | 3.0% |
| $10,000 to $14,999 | 298 | 3.4% |
| $15,000 to $24,999 | 473 | 5.4% |
| $25,000 to $34,999 | 902 | 10.3% |
| $35,000 to $49,999 | 920 | 10.5% |
| $50,000 to $74,999 | 1,551 | 17.7% |
| $75,000 to $99,999 | 1,551 | 17.7% |
| $100,000 to $149,999 | 1,779 | 20.3% |
| $150,000 to $199,999 | 491 | 5.6% |
| $200,000+ | 526 | 6.0% |
Family Income by Famaliy Size in Calloway County
3-person families (1,650 | 18.8%) account for the highest median family income in Calloway County with $92,917 per family, while 2-person families (4,710 | 53.7%) have the highest median income of $32,784 per family member.
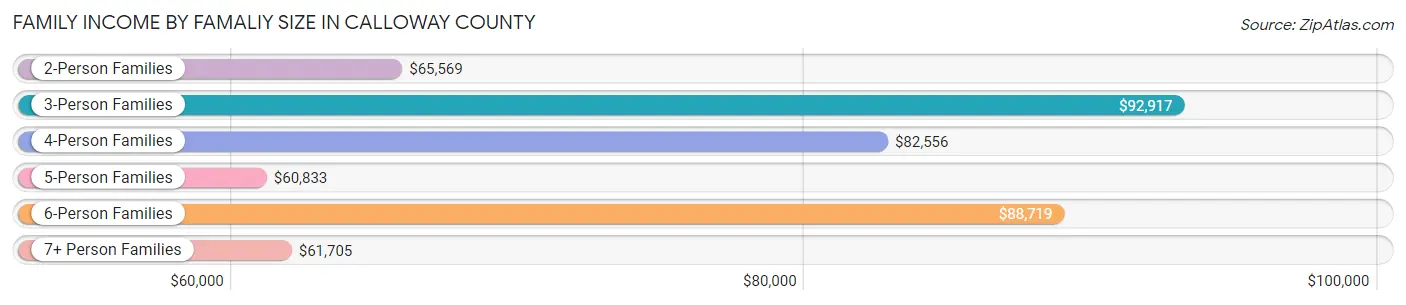
| Income Bracket | # Families | Median Income |
| 2-Person Families | 4,710 (53.7%) | $65,569 |
| 3-Person Families | 1,650 (18.8%) | $92,917 |
| 4-Person Families | 1,669 (19.1%) | $82,556 |
| 5-Person Families | 502 (5.7%) | $60,833 |
| 6-Person Families | 119 (1.4%) | $88,719 |
| 7+ Person Families | 112 (1.3%) | $61,705 |
| Total | 8,762 (100.0%) | $74,371 |
Family Income by Number of Earners in Calloway County
The median family income in Calloway County is $74,371, with families comprising 3+ earners (684) having the highest median family income of $107,373, while families with no earners (1,570) have the lowest median family income of $42,344, accounting for 7.8% and 17.9% of families, respectively.
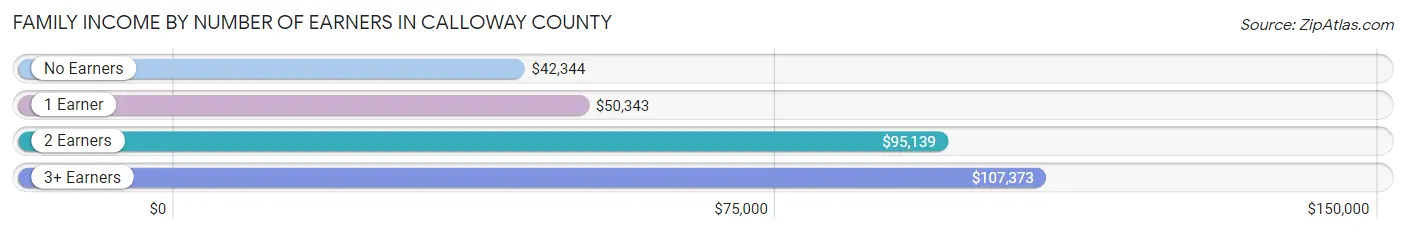
| Number of Earners | # Families | Median Income |
| No Earners | 1,570 (17.9%) | $42,344 |
| 1 Earner | 2,672 (30.5%) | $50,343 |
| 2 Earners | 3,836 (43.8%) | $95,139 |
| 3+ Earners | 684 (7.8%) | $107,373 |
| Total | 8,762 (100.0%) | $74,371 |
Household Income in Calloway County
Household Income Brackets in Calloway County
With 2,339 households falling in the category, the $50,000 to $74,999 income range is the most frequent in Calloway County, accounting for 15.8% of all households. In contrast, only 563 households (3.8%) fall into the $150,000 to $199,999 income bracket, making it the least populous group.
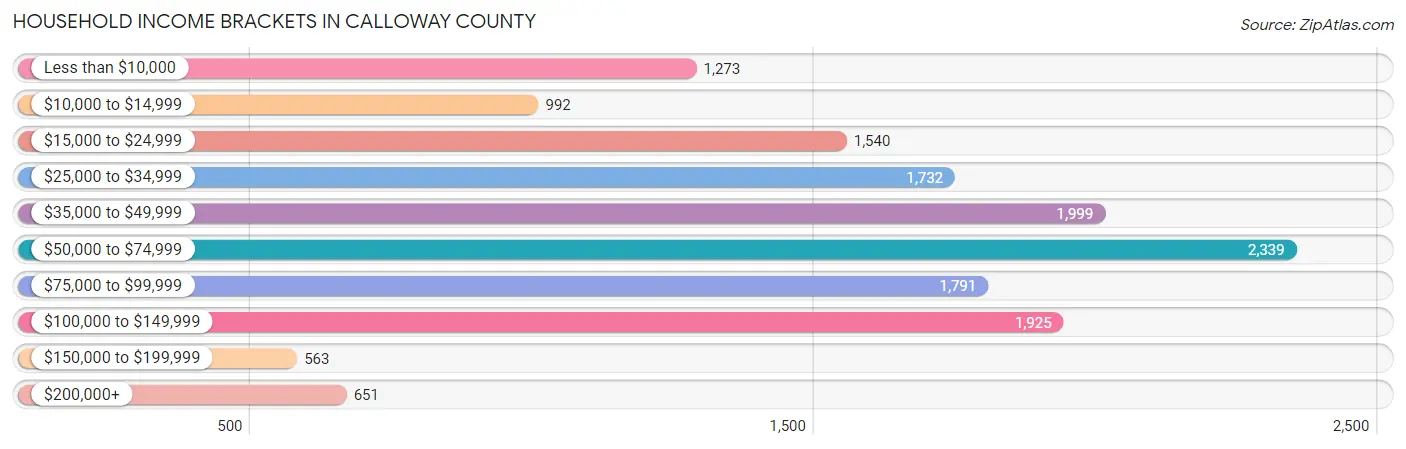
| Income Bracket | # Households | % Households |
| Less than $10,000 | 1,273 | 8.6% |
| $10,000 to $14,999 | 992 | 6.7% |
| $15,000 to $24,999 | 1,540 | 10.4% |
| $25,000 to $34,999 | 1,732 | 11.7% |
| $35,000 to $49,999 | 1,999 | 13.5% |
| $50,000 to $74,999 | 2,339 | 15.8% |
| $75,000 to $99,999 | 1,791 | 12.1% |
| $100,000 to $149,999 | 1,925 | 13.0% |
| $150,000 to $199,999 | 563 | 3.8% |
| $200,000+ | 651 | 4.4% |
Household Income by Householder Age in Calloway County
The median household income in Calloway County is $48,276, with the highest median household income of $61,691 found in the 45 to 64 years age bracket for the primary householder. A total of 4,833 households (32.6%) fall into this category. Meanwhile, the 15 to 24 years age bracket for the primary householder has the lowest median household income of $22,891, with 1,403 households (9.5%) in this group.
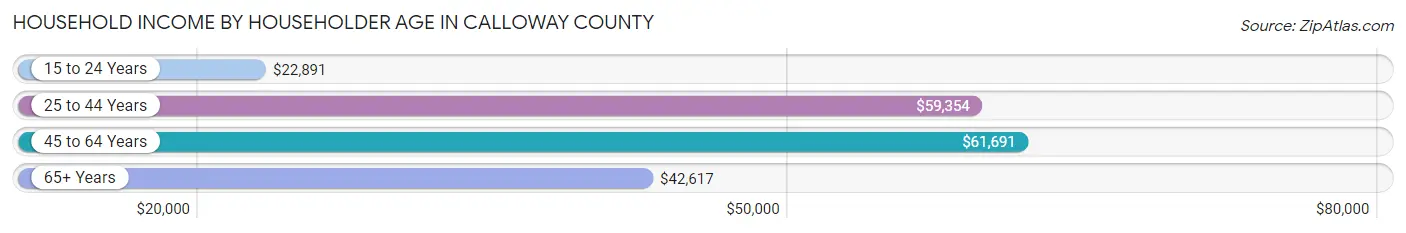
| Income Bracket | # Households | Median Income |
| 15 to 24 Years | 1,403 (9.5%) | $22,891 |
| 25 to 44 Years | 4,435 (30.0%) | $59,354 |
| 45 to 64 Years | 4,833 (32.6%) | $61,691 |
| 65+ Years | 4,134 (27.9%) | $42,617 |
| Total | 14,805 (100.0%) | $48,276 |
Poverty in Calloway County
Income Below Poverty by Sex and Age in Calloway County
With 16.4% poverty level for males and 21.0% for females among the residents of Calloway County, 18 to 24 year old males and 18 to 24 year old females are the most vulnerable to poverty, with 808 males (33.2%) and 872 females (40.6%) in their respective age groups living below the poverty level.
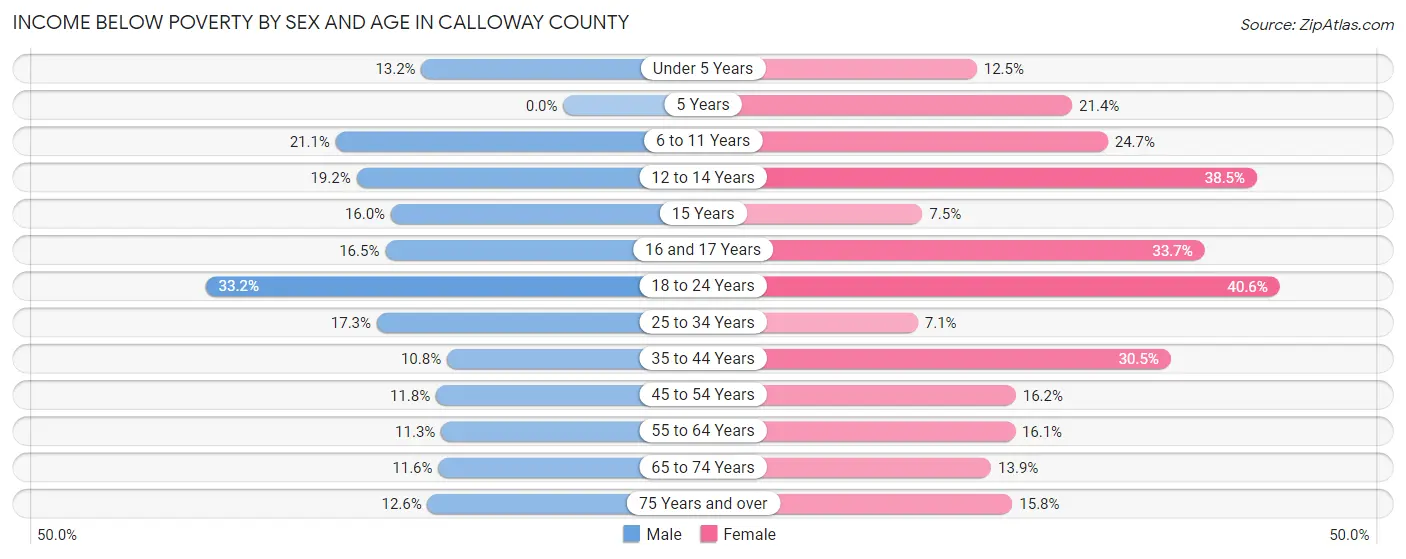
| Age Bracket | Male | Female |
| Under 5 Years | 103 (13.2%) | 108 (12.5%) |
| 5 Years | 0 (0.0%) | 34 (21.4%) |
| 6 to 11 Years | 251 (21.1%) | 300 (24.7%) |
| 12 to 14 Years | 120 (19.2%) | 208 (38.5%) |
| 15 Years | 28 (16.0%) | 8 (7.5%) |
| 16 and 17 Years | 62 (16.5%) | 137 (33.7%) |
| 18 to 24 Years | 808 (33.2%) | 872 (40.6%) |
| 25 to 34 Years | 375 (17.3%) | 155 (7.1%) |
| 35 to 44 Years | 205 (10.8%) | 629 (30.5%) |
| 45 to 54 Years | 239 (11.8%) | 304 (16.2%) |
| 55 to 64 Years | 248 (11.3%) | 366 (16.1%) |
| 65 to 74 Years | 202 (11.6%) | 271 (13.9%) |
| 75 Years and over | 138 (12.6%) | 234 (15.8%) |
| Total | 2,779 (16.4%) | 3,626 (21.0%) |
Income Above Poverty by Sex and Age in Calloway County
According to the poverty statistics in Calloway County, males aged 5 years and females aged 25 to 34 years are the age groups that are most secure financially, with 100.0% of males and 92.9% of females in these age groups living above the poverty line.
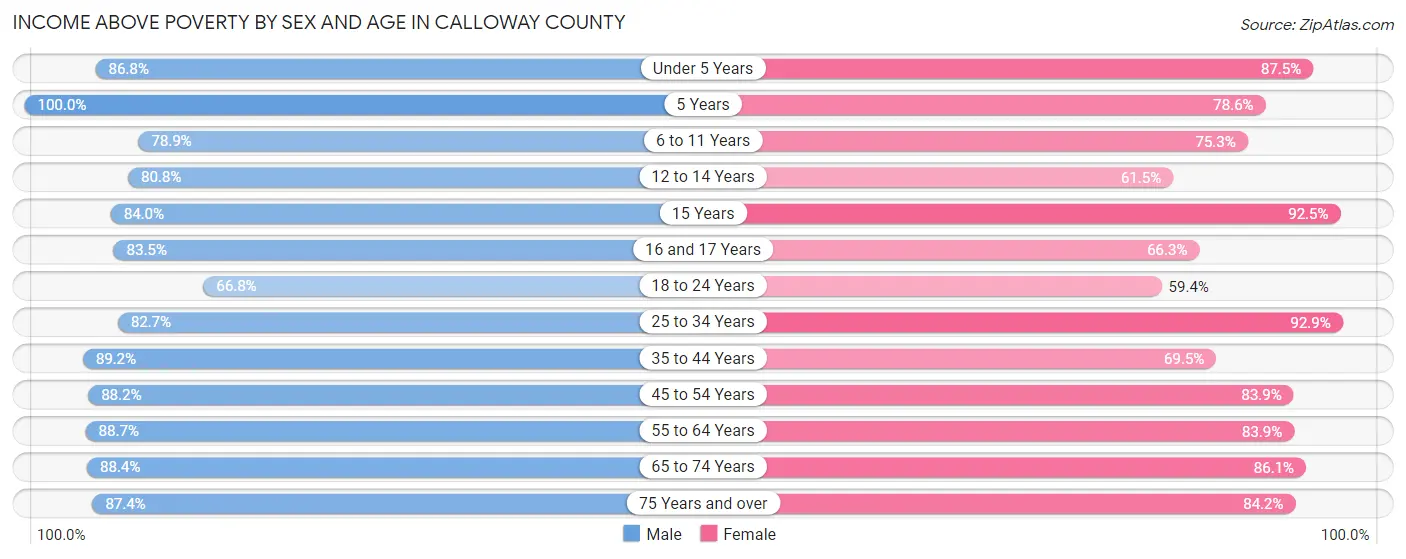
| Age Bracket | Male | Female |
| Under 5 Years | 679 (86.8%) | 754 (87.5%) |
| 5 Years | 209 (100.0%) | 125 (78.6%) |
| 6 to 11 Years | 937 (78.9%) | 915 (75.3%) |
| 12 to 14 Years | 505 (80.8%) | 332 (61.5%) |
| 15 Years | 147 (84.0%) | 99 (92.5%) |
| 16 and 17 Years | 313 (83.5%) | 270 (66.3%) |
| 18 to 24 Years | 1,626 (66.8%) | 1,274 (59.4%) |
| 25 to 34 Years | 1,791 (82.7%) | 2,040 (92.9%) |
| 35 to 44 Years | 1,694 (89.2%) | 1,432 (69.5%) |
| 45 to 54 Years | 1,783 (88.2%) | 1,578 (83.9%) |
| 55 to 64 Years | 1,939 (88.7%) | 1,911 (83.9%) |
| 65 to 74 Years | 1,540 (88.4%) | 1,684 (86.1%) |
| 75 Years and over | 957 (87.4%) | 1,244 (84.2%) |
| Total | 14,120 (83.6%) | 13,658 (79.0%) |
Income Below Poverty Among Married-Couple Families in Calloway County
The poverty statistics for married-couple families in Calloway County show that 5.6% or 363 of the total 6,535 families live below the poverty line. Families with 5 or more children have the highest poverty rate of 42.9%, comprising of 12 families. On the other hand, families with 1 or 2 children have the lowest poverty rate of 2.7%, which includes 55 families.
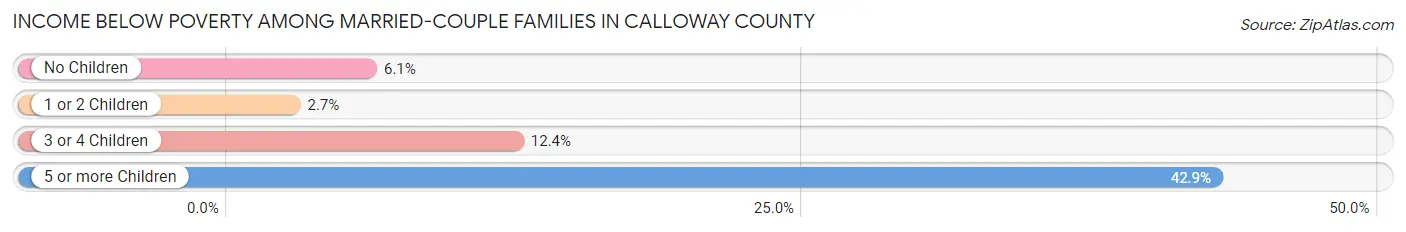
| Children | Above Poverty | Below Poverty |
| No Children | 3,849 (94.0%) | 248 (6.0%) |
| 1 or 2 Children | 1,969 (97.3%) | 55 (2.7%) |
| 3 or 4 Children | 338 (87.6%) | 48 (12.4%) |
| 5 or more Children | 16 (57.1%) | 12 (42.9%) |
| Total | 6,172 (94.5%) | 363 (5.6%) |
Income Below Poverty Among Single-Parent Households in Calloway County
According to the poverty data in Calloway County, 12.0% or 78 single-father households and 35.7% or 563 single-mother households are living below the poverty line. Among single-father households, those with 1 or 2 children have the highest poverty rate, with 64 households (20.7%) experiencing poverty. Likewise, among single-mother households, those with 3 or 4 children have the highest poverty rate, with 54 households (71.1%) falling below the poverty line.
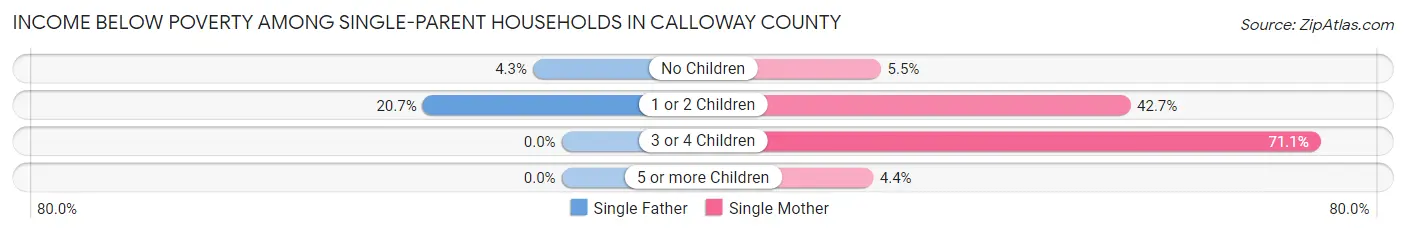
| Children | Single Father | Single Mother |
| No Children | 14 (4.3%) | 17 (5.5%) |
| 1 or 2 Children | 64 (20.7%) | 490 (42.7%) |
| 3 or 4 Children | 0 (0.0%) | 54 (71.1%) |
| 5 or more Children | 0 (0.0%) | 2 (4.3%) |
| Total | 78 (12.0%) | 563 (35.7%) |
Income Below Poverty Among Married-Couple vs Single-Parent Households in Calloway County
The poverty data for Calloway County shows that 363 of the married-couple family households (5.6%) and 641 of the single-parent households (28.8%) are living below the poverty level. Within the married-couple family households, those with 5 or more children have the highest poverty rate, with 12 households (42.9%) falling below the poverty line. Among the single-parent households, those with 3 or 4 children have the highest poverty rate, with 54 household (62.1%) living below poverty.
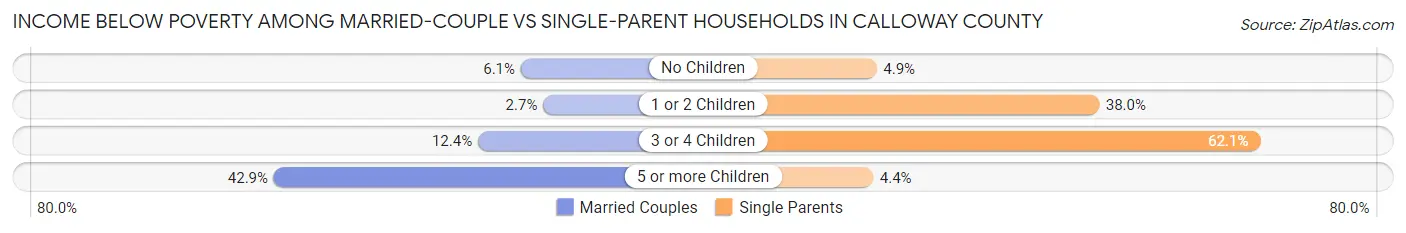
| Children | Married-Couple Families | Single-Parent Households |
| No Children | 248 (6.0%) | 31 (4.9%) |
| 1 or 2 Children | 55 (2.7%) | 554 (38.0%) |
| 3 or 4 Children | 48 (12.4%) | 54 (62.1%) |
| 5 or more Children | 12 (42.9%) | 2 (4.3%) |
| Total | 363 (5.6%) | 641 (28.8%) |
Employment Characteristics in Calloway County
Employment by Class of Employer in Calloway County
Among the 17,096 employed individuals in Calloway County, private company employees (11,459 | 67.0%), state government employees (1,913 | 11.2%), and local government employees (1,089 | 6.4%) make up the most common classes of employment.
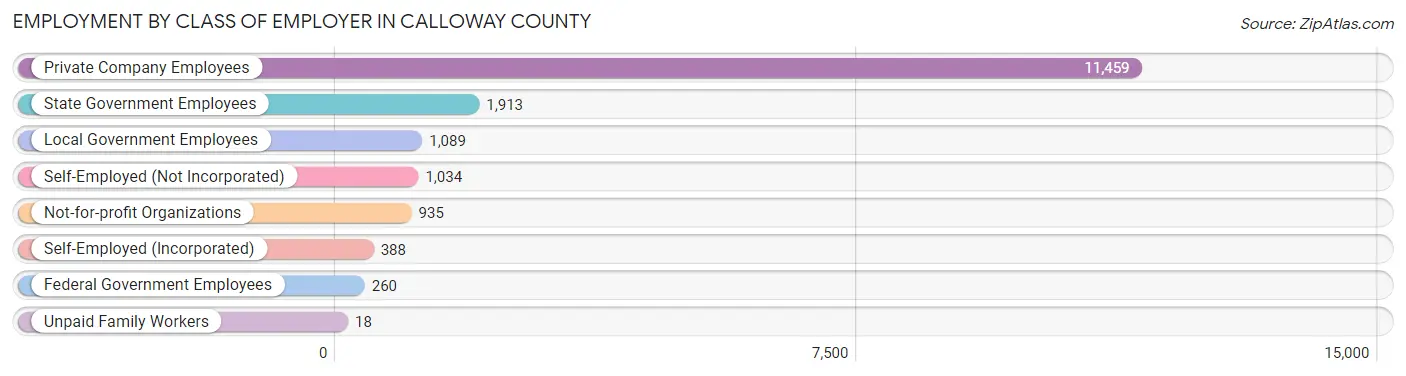
| Employer Class | # Employees | % Employees |
| Private Company Employees | 11,459 | 67.0% |
| Self-Employed (Incorporated) | 388 | 2.3% |
| Self-Employed (Not Incorporated) | 1,034 | 6.0% |
| Not-for-profit Organizations | 935 | 5.5% |
| Local Government Employees | 1,089 | 6.4% |
| State Government Employees | 1,913 | 11.2% |
| Federal Government Employees | 260 | 1.5% |
| Unpaid Family Workers | 18 | 0.1% |
| Total | 17,096 | 100.0% |
Employment Status by Age in Calloway County
According to the labor force statistics for Calloway County, out of the total population over 16 years of age (31,421), 58.1% or 18,256 individuals are in the labor force, with 4.7% or 858 of them unemployed. The age group with the highest labor force participation rate is 25 to 29 years, with 85.7% or 2,000 individuals in the labor force. Within the labor force, the 20 to 24 years age range has the highest percentage of unemployed individuals, with 8.0% or 273 of them being unemployed.
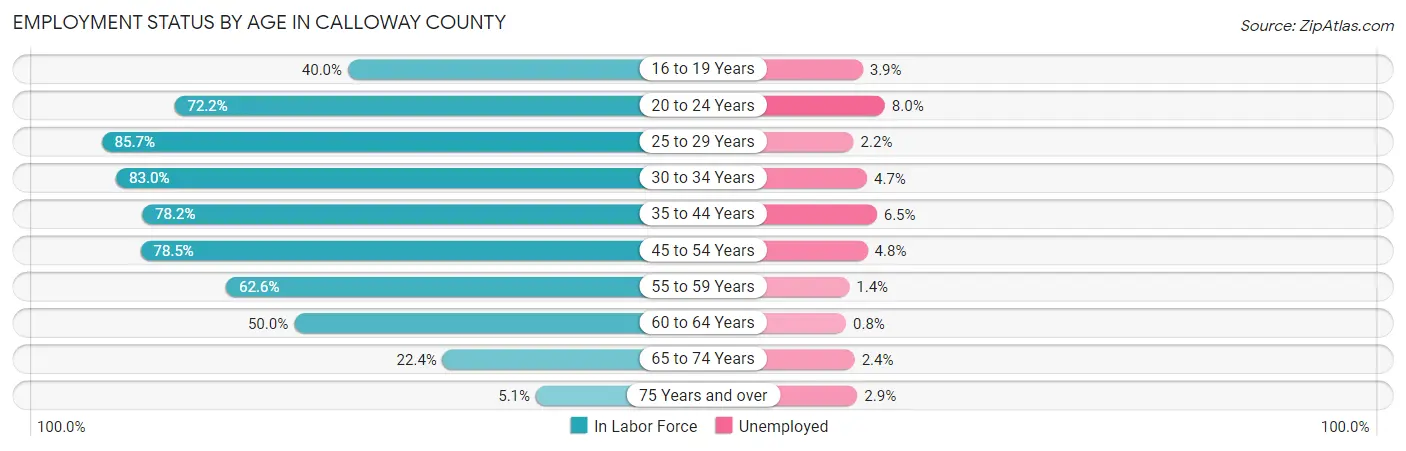
| Age Bracket | In Labor Force | Unemployed |
| 16 to 19 Years | 1,375 (40.0%) | 54 (3.9%) |
| 20 to 24 Years | 3,409 (72.2%) | 273 (8.0%) |
| 25 to 29 Years | 2,000 (85.7%) | 44 (2.2%) |
| 30 to 34 Years | 1,735 (83.0%) | 82 (4.7%) |
| 35 to 44 Years | 3,129 (78.2%) | 203 (6.5%) |
| 45 to 54 Years | 3,112 (78.5%) | 149 (4.8%) |
| 55 to 59 Years | 1,403 (62.6%) | 20 (1.4%) |
| 60 to 64 Years | 1,120 (50.0%) | 9 (0.8%) |
| 65 to 74 Years | 837 (22.4%) | 20 (2.4%) |
| 75 Years and over | 136 (5.1%) | 4 (2.9%) |
| Total | 18,256 (58.1%) | 858 (4.7%) |
Employment Status by Educational Attainment in Calloway County
According to labor force statistics for Calloway County, 74.1% of individuals (12,500) out of the total population between 25 and 64 years of age (16,869) are in the labor force, with 4.1% or 512 of them being unemployed. The group with the highest labor force participation rate are those with the educational attainment of bachelor's degree or higher, with 86.1% or 4,697 individuals in the labor force. Within the labor force, individuals with less than high school education have the highest percentage of unemployment, with 7.8% or 66 of them being unemployed.
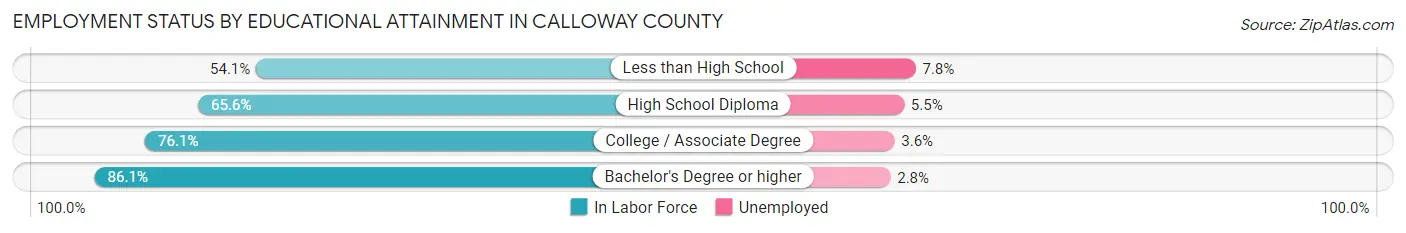
| Educational Attainment | In Labor Force | Unemployed |
| Less than High School | 841 (54.1%) | 121 (7.8%) |
| High School Diploma | 3,443 (65.6%) | 289 (5.5%) |
| College / Associate Degree | 3,509 (76.1%) | 166 (3.6%) |
| Bachelor's Degree or higher | 4,697 (86.1%) | 153 (2.8%) |
| Total | 12,500 (74.1%) | 692 (4.1%) |
Employment Occupations by Sex in Calloway County
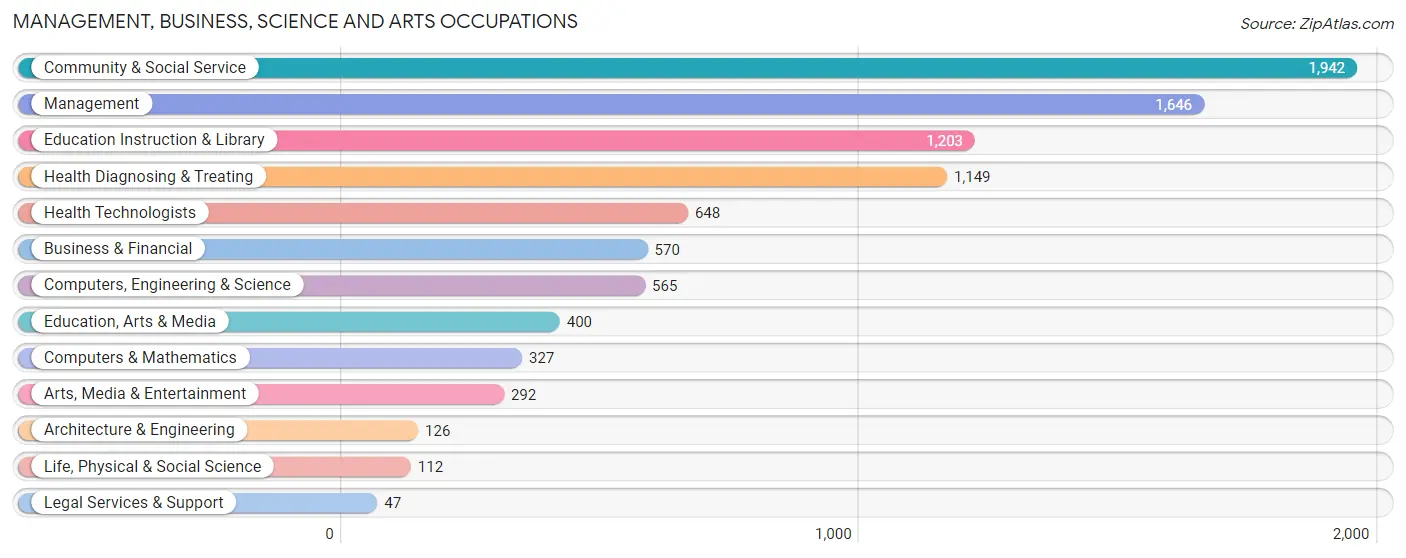
Management, Business, Science and Arts Occupations
The most common Management, Business, Science and Arts occupations in Calloway County are Community & Social Service (1,942 | 11.2%), Management (1,646 | 9.5%), Education Instruction & Library (1,203 | 6.9%), Health Diagnosing & Treating (1,149 | 6.6%), and Health Technologists (648 | 3.7%).
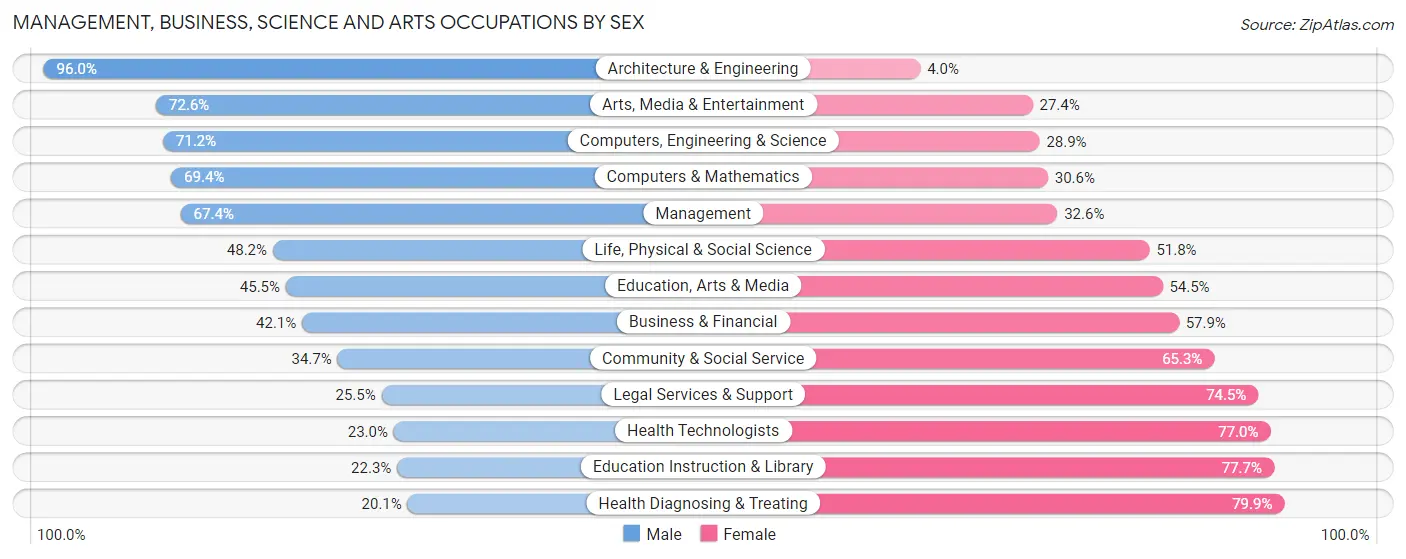
Management, Business, Science and Arts Occupations by Sex
Within the Management, Business, Science and Arts occupations in Calloway County, the most male-oriented occupations are Architecture & Engineering (96.0%), Arts, Media & Entertainment (72.6%), and Computers, Engineering & Science (71.2%), while the most female-oriented occupations are Health Diagnosing & Treating (79.9%), Education Instruction & Library (77.7%), and Health Technologists (77.0%).
| Occupation | Male | Female |
| Management | 1,110 (67.4%) | 536 (32.6%) |
| Business & Financial | 240 (42.1%) | 330 (57.9%) |
| Computers, Engineering & Science | 402 (71.2%) | 163 (28.8%) |
| Computers & Mathematics | 227 (69.4%) | 100 (30.6%) |
| Architecture & Engineering | 121 (96.0%) | 5 (4.0%) |
| Life, Physical & Social Science | 54 (48.2%) | 58 (51.8%) |
| Community & Social Service | 674 (34.7%) | 1,268 (65.3%) |
| Education, Arts & Media | 182 (45.5%) | 218 (54.5%) |
| Legal Services & Support | 12 (25.5%) | 35 (74.5%) |
| Education Instruction & Library | 268 (22.3%) | 935 (77.7%) |
| Arts, Media & Entertainment | 212 (72.6%) | 80 (27.4%) |
| Health Diagnosing & Treating | 231 (20.1%) | 918 (79.9%) |
| Health Technologists | 149 (23.0%) | 499 (77.0%) |
| Total (Category) | 2,657 (45.3%) | 3,215 (54.7%) |
| Total (Overall) | 8,705 (50.1%) | 8,683 (49.9%) |
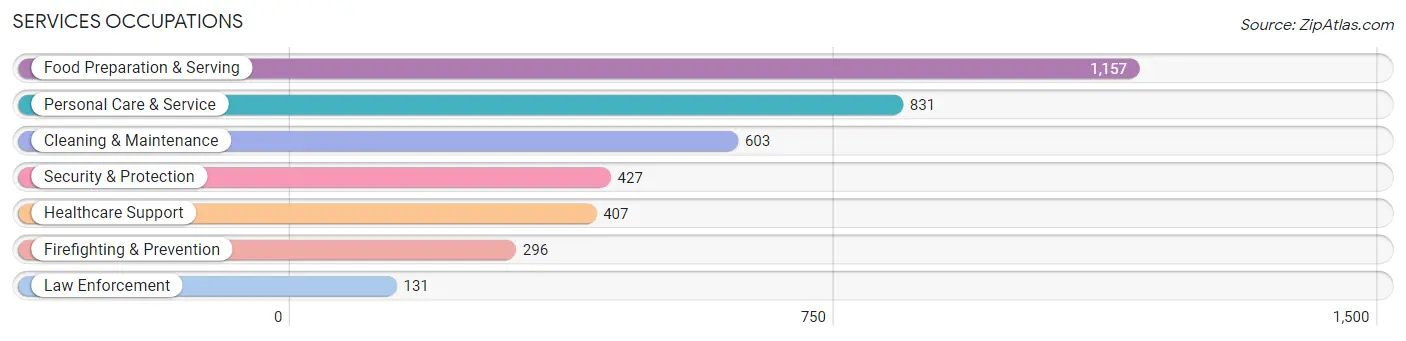
Services Occupations
The most common Services occupations in Calloway County are Food Preparation & Serving (1,157 | 6.7%), Personal Care & Service (831 | 4.8%), Cleaning & Maintenance (603 | 3.5%), Security & Protection (427 | 2.5%), and Healthcare Support (407 | 2.3%).
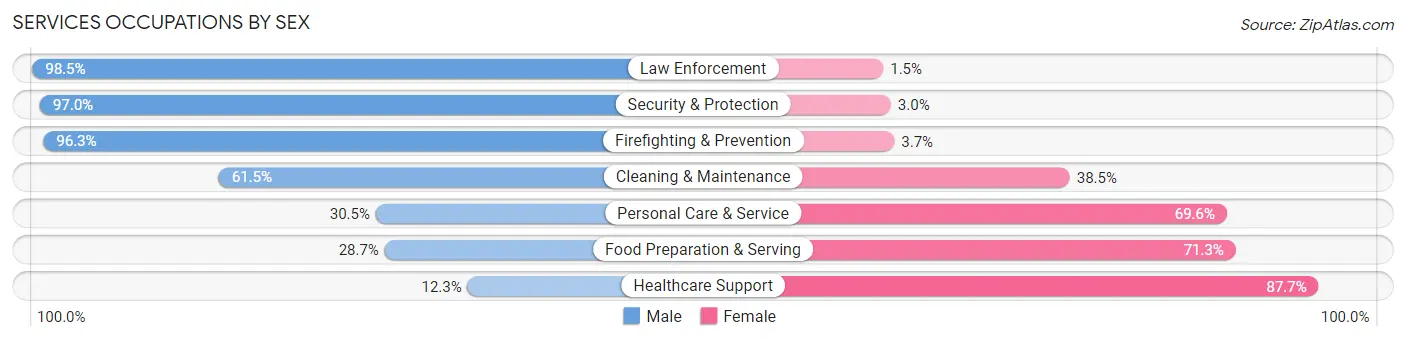
Services Occupations by Sex
Within the Services occupations in Calloway County, the most male-oriented occupations are Law Enforcement (98.5%), Security & Protection (97.0%), and Firefighting & Prevention (96.3%), while the most female-oriented occupations are Healthcare Support (87.7%), Food Preparation & Serving (71.3%), and Personal Care & Service (69.6%).
| Occupation | Male | Female |
| Healthcare Support | 50 (12.3%) | 357 (87.7%) |
| Security & Protection | 414 (97.0%) | 13 (3.0%) |
| Firefighting & Prevention | 285 (96.3%) | 11 (3.7%) |
| Law Enforcement | 129 (98.5%) | 2 (1.5%) |
| Food Preparation & Serving | 332 (28.7%) | 825 (71.3%) |
| Cleaning & Maintenance | 371 (61.5%) | 232 (38.5%) |
| Personal Care & Service | 253 (30.4%) | 578 (69.6%) |
| Total (Category) | 1,420 (41.5%) | 2,005 (58.5%) |
| Total (Overall) | 8,705 (50.1%) | 8,683 (49.9%) |
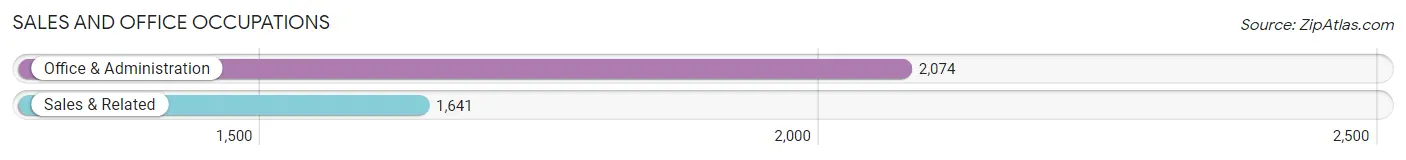
Sales and Office Occupations
The most common Sales and Office occupations in Calloway County are Office & Administration (2,074 | 11.9%), and Sales & Related (1,641 | 9.4%).
Sales and Office Occupations by Sex
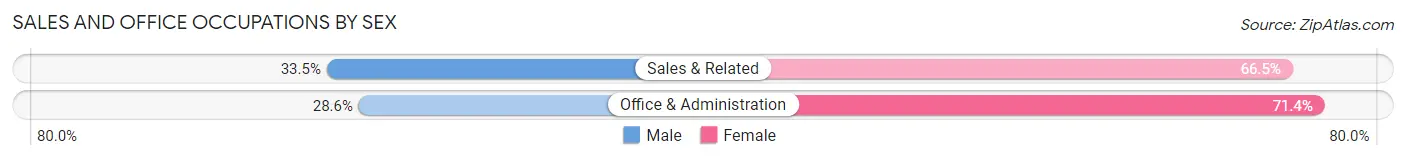
| Occupation | Male | Female |
| Sales & Related | 550 (33.5%) | 1,091 (66.5%) |
| Office & Administration | 593 (28.6%) | 1,481 (71.4%) |
| Total (Category) | 1,143 (30.8%) | 2,572 (69.2%) |
| Total (Overall) | 8,705 (50.1%) | 8,683 (49.9%) |
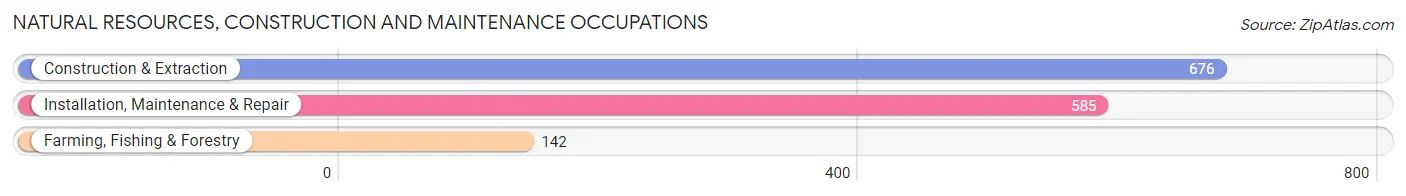
Natural Resources, Construction and Maintenance Occupations
The most common Natural Resources, Construction and Maintenance occupations in Calloway County are Construction & Extraction (676 | 3.9%), Installation, Maintenance & Repair (585 | 3.4%), and Farming, Fishing & Forestry (142 | 0.8%).
Natural Resources, Construction and Maintenance Occupations by Sex
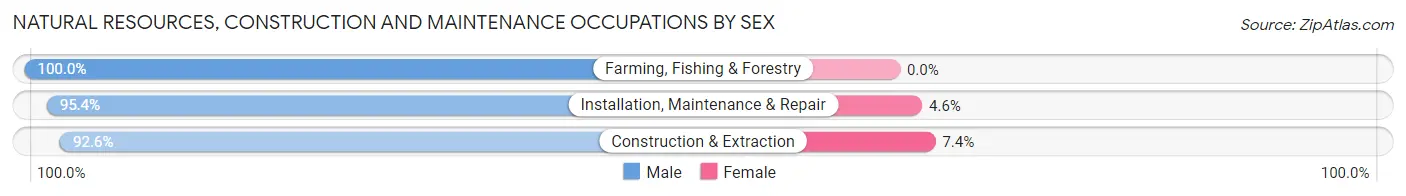
| Occupation | Male | Female |
| Farming, Fishing & Forestry | 142 (100.0%) | 0 (0.0%) |
| Construction & Extraction | 626 (92.6%) | 50 (7.4%) |
| Installation, Maintenance & Repair | 558 (95.4%) | 27 (4.6%) |
| Total (Category) | 1,326 (94.5%) | 77 (5.5%) |
| Total (Overall) | 8,705 (50.1%) | 8,683 (49.9%) |
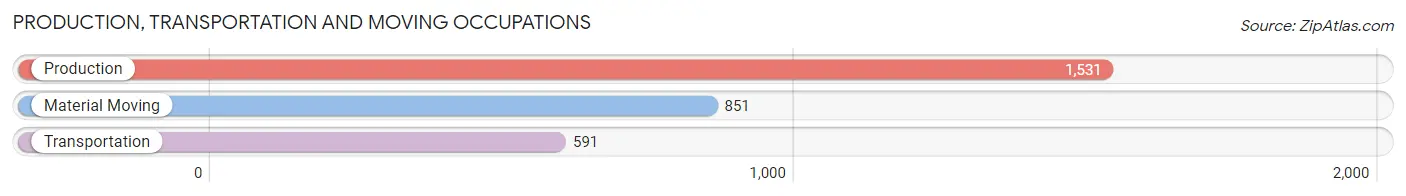
Production, Transportation and Moving Occupations
The most common Production, Transportation and Moving occupations in Calloway County are Production (1,531 | 8.8%), Material Moving (851 | 4.9%), and Transportation (591 | 3.4%).
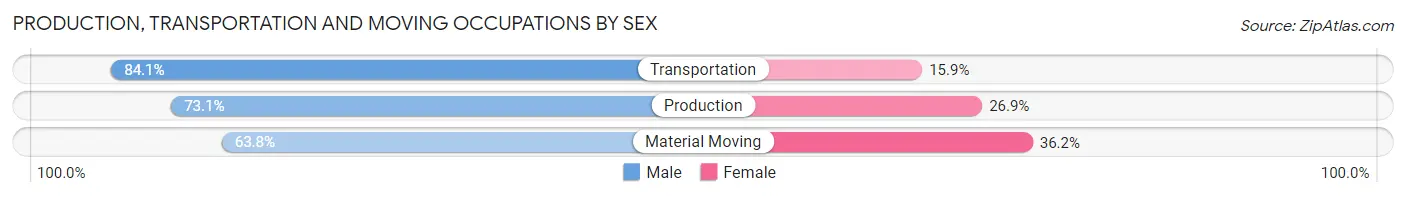
Production, Transportation and Moving Occupations by Sex
| Occupation | Male | Female |
| Production | 1,119 (73.1%) | 412 (26.9%) |
| Transportation | 497 (84.1%) | 94 (15.9%) |
| Material Moving | 543 (63.8%) | 308 (36.2%) |
| Total (Category) | 2,159 (72.6%) | 814 (27.4%) |
| Total (Overall) | 8,705 (50.1%) | 8,683 (49.9%) |
Employment Industries by Sex in Calloway County
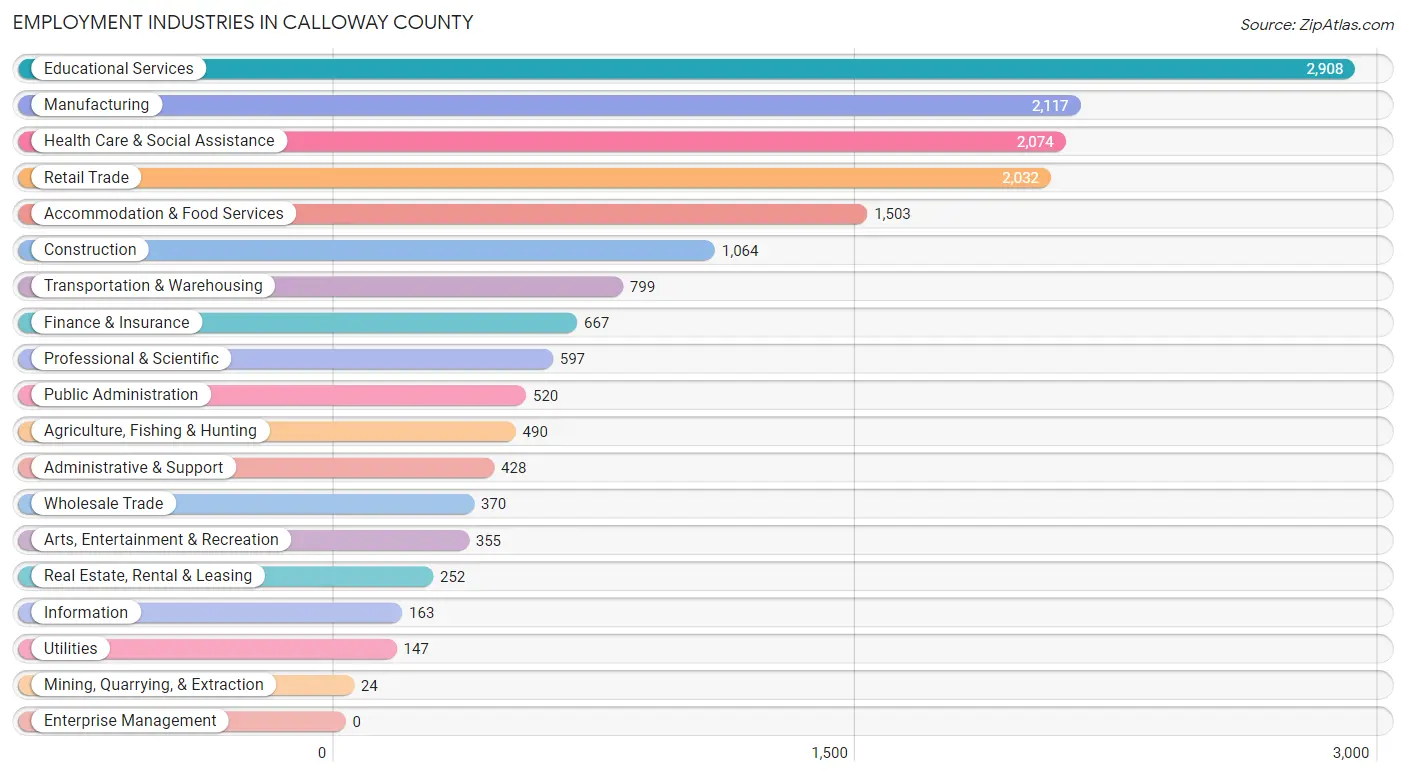
Employment Industries in Calloway County
The major employment industries in Calloway County include Educational Services (2,908 | 16.7%), Manufacturing (2,117 | 12.2%), Health Care & Social Assistance (2,074 | 11.9%), Retail Trade (2,032 | 11.7%), and Accommodation & Food Services (1,503 | 8.6%).
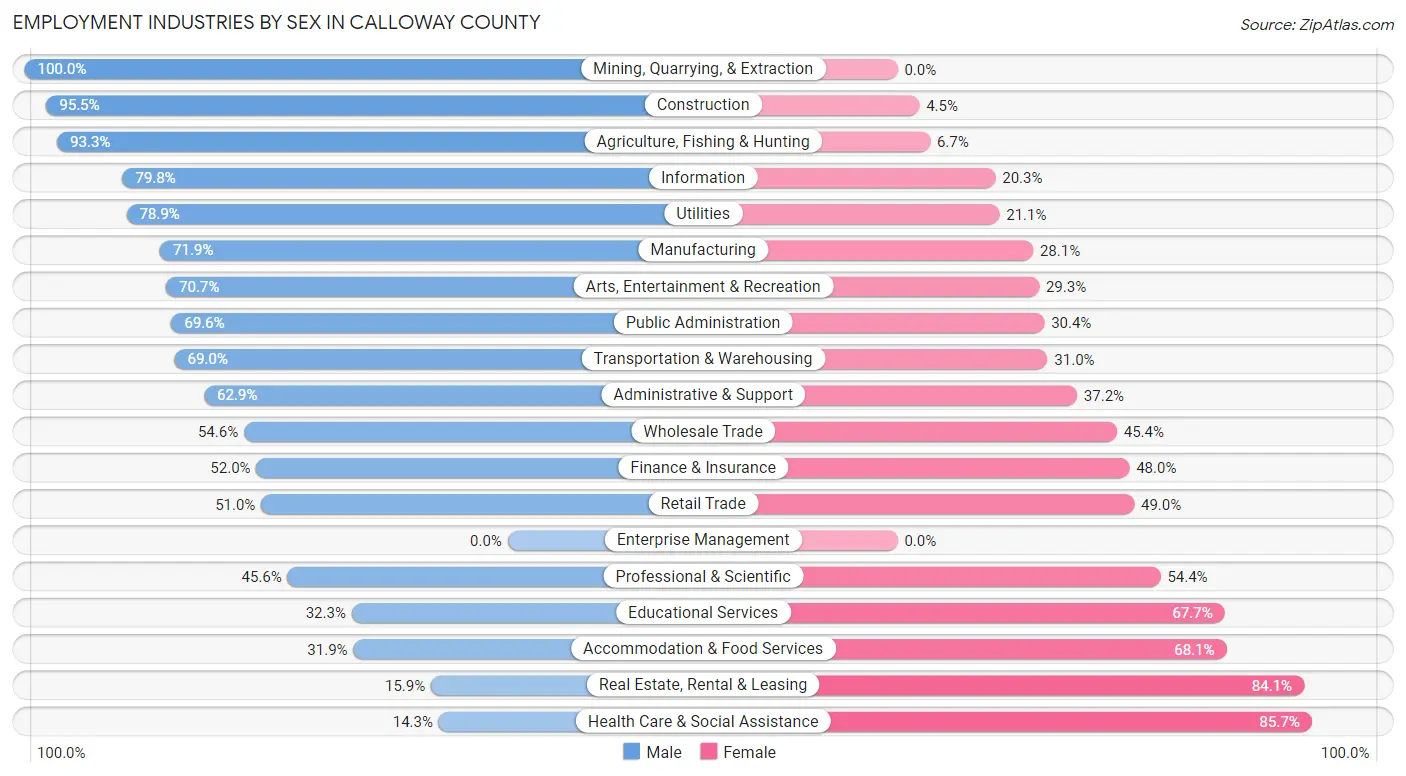
Employment Industries by Sex in Calloway County
The Calloway County industries that see more men than women are Mining, Quarrying, & Extraction (100.0%), Construction (95.5%), and Agriculture, Fishing & Hunting (93.3%), whereas the industries that tend to have a higher number of women are Health Care & Social Assistance (85.7%), Real Estate, Rental & Leasing (84.1%), and Accommodation & Food Services (68.1%).
| Industry | Male | Female |
| Agriculture, Fishing & Hunting | 457 (93.3%) | 33 (6.7%) |
| Mining, Quarrying, & Extraction | 24 (100.0%) | 0 (0.0%) |
| Construction | 1,016 (95.5%) | 48 (4.5%) |
| Manufacturing | 1,523 (71.9%) | 594 (28.1%) |
| Wholesale Trade | 202 (54.6%) | 168 (45.4%) |
| Retail Trade | 1,037 (51.0%) | 995 (49.0%) |
| Transportation & Warehousing | 551 (69.0%) | 248 (31.0%) |
| Utilities | 116 (78.9%) | 31 (21.1%) |
| Information | 130 (79.7%) | 33 (20.3%) |
| Finance & Insurance | 347 (52.0%) | 320 (48.0%) |
| Real Estate, Rental & Leasing | 40 (15.9%) | 212 (84.1%) |
| Professional & Scientific | 272 (45.6%) | 325 (54.4%) |
| Enterprise Management | 0 (0.0%) | 0 (0.0%) |
| Administrative & Support | 269 (62.8%) | 159 (37.1%) |
| Educational Services | 939 (32.3%) | 1,969 (67.7%) |
| Health Care & Social Assistance | 296 (14.3%) | 1,778 (85.7%) |
| Arts, Entertainment & Recreation | 251 (70.7%) | 104 (29.3%) |
| Accommodation & Food Services | 480 (31.9%) | 1,023 (68.1%) |
| Public Administration | 362 (69.6%) | 158 (30.4%) |
| Total | 8,705 (50.1%) | 8,683 (49.9%) |
Education in Calloway County
School Enrollment in Calloway County
The most common levels of schooling among the 10,930 students in Calloway County are college / undergraduate (5,339 | 48.8%), elementary school (1,571 | 14.4%), and middle school (1,435 | 13.1%).
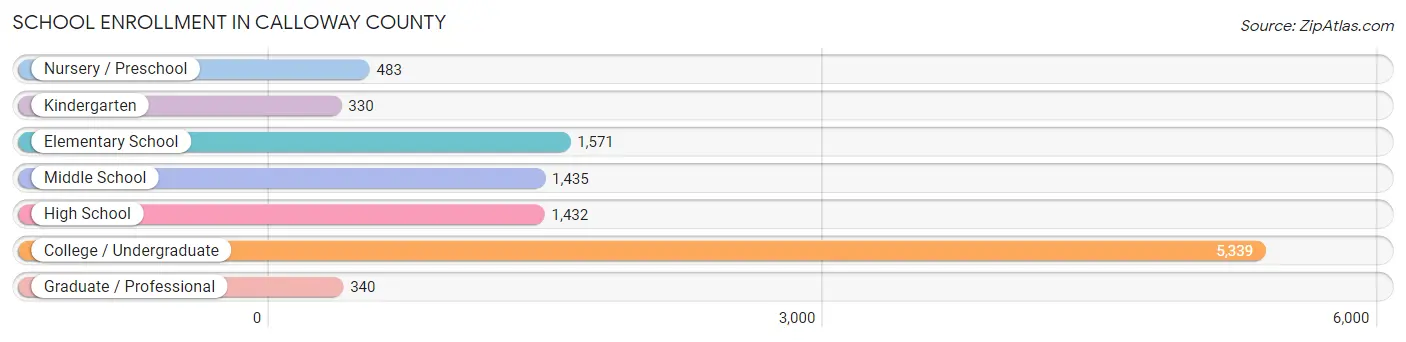
| School Level | # Students | % Students |
| Nursery / Preschool | 483 | 4.4% |
| Kindergarten | 330 | 3.0% |
| Elementary School | 1,571 | 14.4% |
| Middle School | 1,435 | 13.1% |
| High School | 1,432 | 13.1% |
| College / Undergraduate | 5,339 | 48.8% |
| Graduate / Professional | 340 | 3.1% |
| Total | 10,930 | 100.0% |
School Enrollment by Age by Funding Source in Calloway County
Out of a total of 10,930 students who are enrolled in schools in Calloway County, 1,235 (11.3%) attend a private institution, while the remaining 9,695 (88.7%) are enrolled in public schools. The age group of 25 to 34 year olds has the highest likelihood of being enrolled in private schools, with 162 (31.6% in the age bracket) enrolled. Conversely, the age group of 18 to 19 year olds has the lowest likelihood of being enrolled in a private school, with 2,223 (99.0% in the age bracket) attending a public institution.
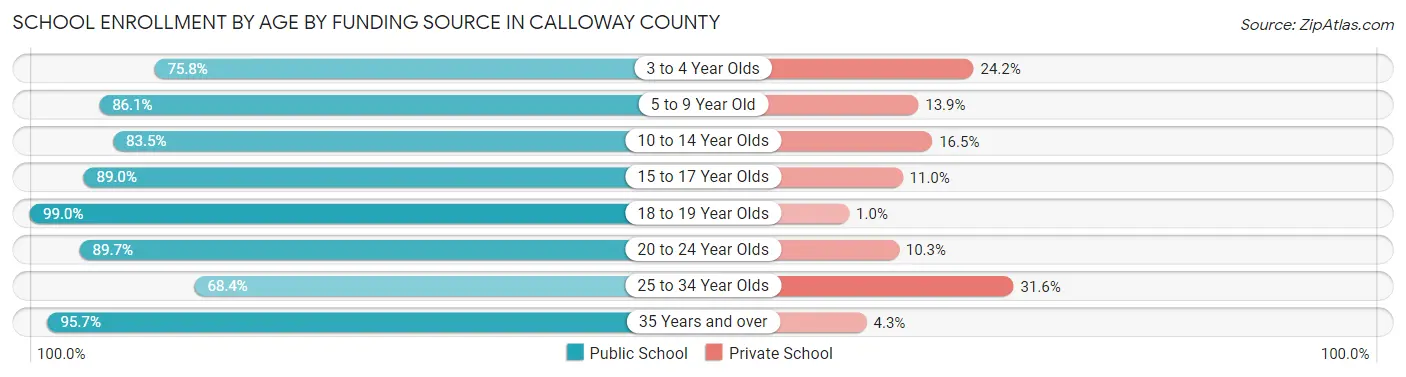
| Age Bracket | Public School | Private School |
| 3 to 4 Year Olds | 257 (75.8%) | 82 (24.2%) |
| 5 to 9 Year Old | 1,536 (86.1%) | 248 (13.9%) |
| 10 to 14 Year Olds | 1,518 (83.5%) | 300 (16.5%) |
| 15 to 17 Year Olds | 908 (89.0%) | 112 (11.0%) |
| 18 to 19 Year Olds | 2,223 (99.0%) | 23 (1.0%) |
| 20 to 24 Year Olds | 2,545 (89.7%) | 291 (10.3%) |
| 25 to 34 Year Olds | 350 (68.4%) | 162 (31.6%) |
| 35 Years and over | 359 (95.7%) | 16 (4.3%) |
| Total | 9,695 (88.7%) | 1,235 (11.3%) |
Educational Attainment by Field of Study in Calloway County
Education (1,654 | 21.1%), business (1,261 | 16.1%), science & technology (1,053 | 13.5%), bio, nature & agricultural (901 | 11.5%), and arts & humanities (682 | 8.7%) are the most common fields of study among 7,830 individuals in Calloway County who have obtained a bachelor's degree or higher.
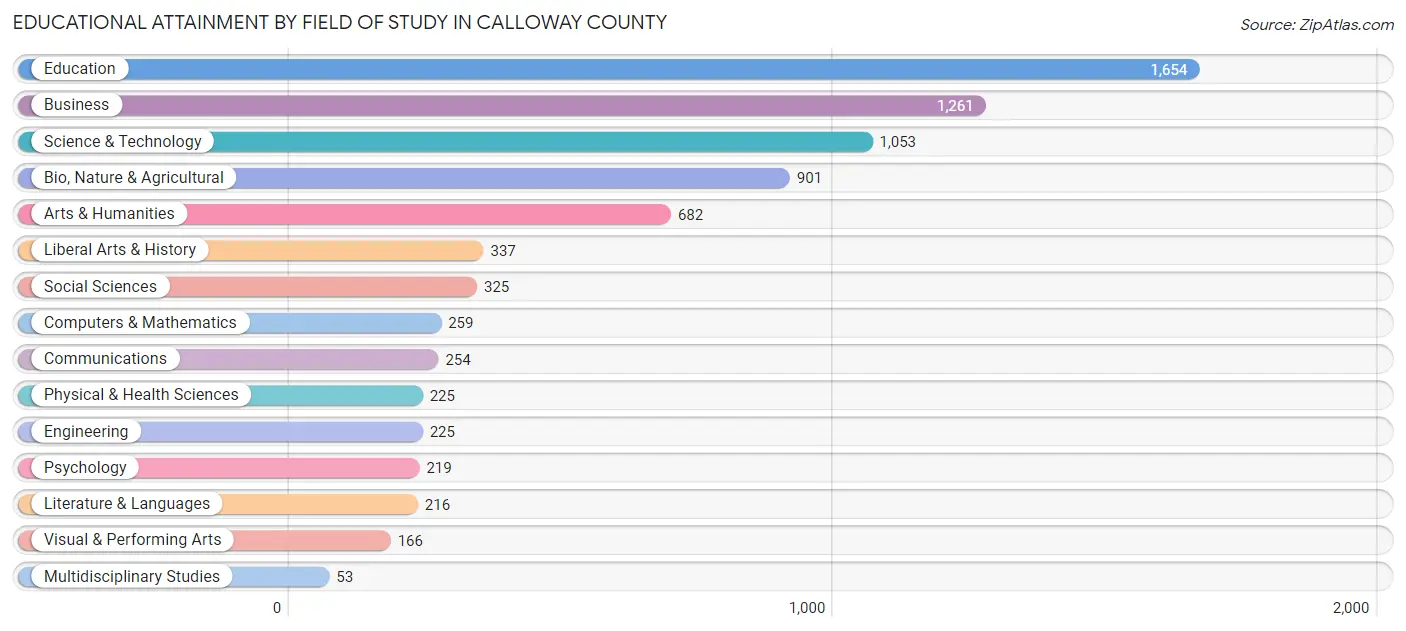
| Field of Study | # Graduates | % Graduates |
| Computers & Mathematics | 259 | 3.3% |
| Bio, Nature & Agricultural | 901 | 11.5% |
| Physical & Health Sciences | 225 | 2.9% |
| Psychology | 219 | 2.8% |
| Social Sciences | 325 | 4.2% |
| Engineering | 225 | 2.9% |
| Multidisciplinary Studies | 53 | 0.7% |
| Science & Technology | 1,053 | 13.5% |
| Business | 1,261 | 16.1% |
| Education | 1,654 | 21.1% |
| Literature & Languages | 216 | 2.8% |
| Liberal Arts & History | 337 | 4.3% |
| Visual & Performing Arts | 166 | 2.1% |
| Communications | 254 | 3.2% |
| Arts & Humanities | 682 | 8.7% |
| Total | 7,830 | 100.0% |
Transportation & Commute in Calloway County
Vehicle Availability by Sex in Calloway County
The most prevalent vehicle ownership categories in Calloway County are males with 2 vehicles (3,655, accounting for 45.3%) and females with 2 vehicles (2,972, making up 48.2%).
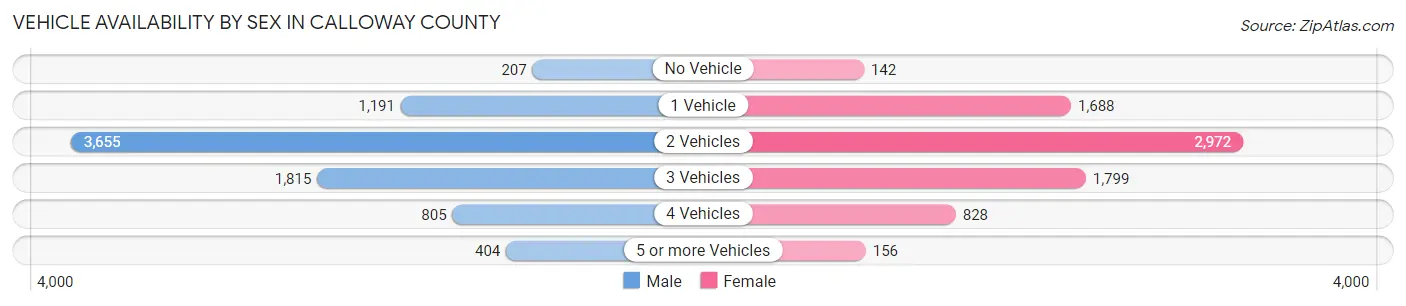
| Vehicles Available | Male | Female |
| No Vehicle | 207 (2.6%) | 142 (1.9%) |
| 1 Vehicle | 1,191 (14.7%) | 1,688 (22.3%) |
| 2 Vehicles | 3,655 (45.3%) | 2,972 (39.2%) |
| 3 Vehicles | 1,815 (22.5%) | 1,799 (23.7%) |
| 4 Vehicles | 805 (10.0%) | 828 (10.9%) |
| 5 or more Vehicles | 404 (5.0%) | 156 (2.1%) |
| Total | 8,077 (100.0%) | 7,585 (100.0%) |
Commute Time in Calloway County
The most frequently occuring commute durations in Calloway County are 5 to 9 minutes (4,685 commuters, 28.6%), 10 to 14 minutes (3,028 commuters, 18.5%), and 15 to 19 minutes (2,765 commuters, 16.9%).
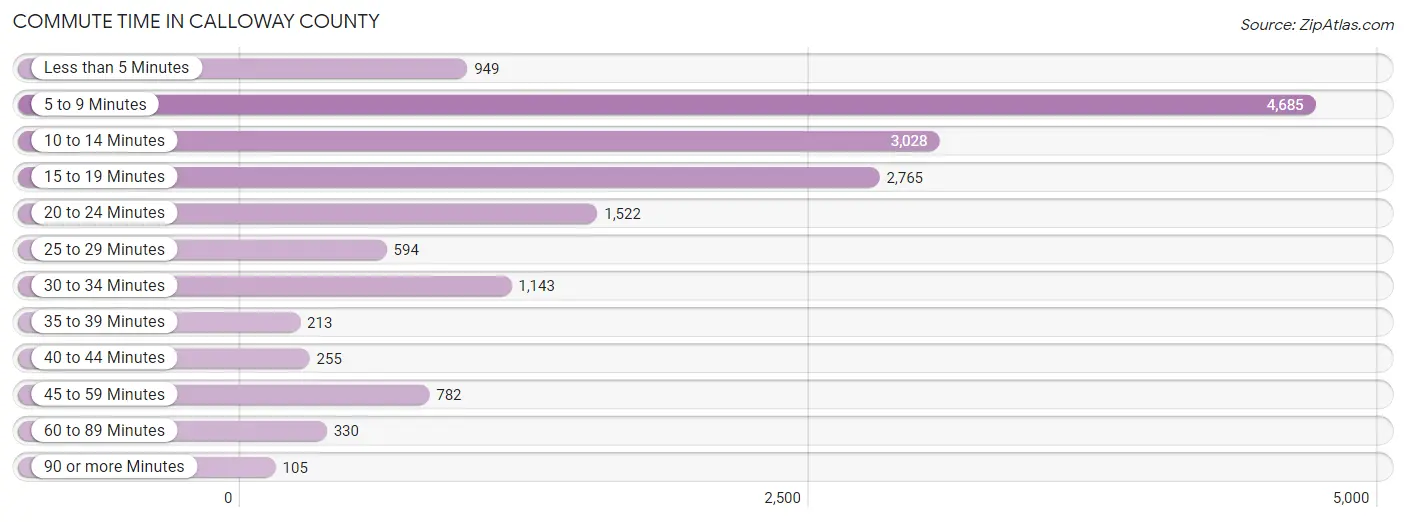
| Commute Time | # Commuters | % Commuters |
| Less than 5 Minutes | 949 | 5.8% |
| 5 to 9 Minutes | 4,685 | 28.6% |
| 10 to 14 Minutes | 3,028 | 18.5% |
| 15 to 19 Minutes | 2,765 | 16.9% |
| 20 to 24 Minutes | 1,522 | 9.3% |
| 25 to 29 Minutes | 594 | 3.6% |
| 30 to 34 Minutes | 1,143 | 7.0% |
| 35 to 39 Minutes | 213 | 1.3% |
| 40 to 44 Minutes | 255 | 1.6% |
| 45 to 59 Minutes | 782 | 4.8% |
| 60 to 89 Minutes | 330 | 2.0% |
| 90 or more Minutes | 105 | 0.6% |
Commute Time by Sex in Calloway County
The most common commute times in Calloway County are 5 to 9 minutes (2,034 commuters, 24.8%) for males and 5 to 9 minutes (2,651 commuters, 32.4%) for females.
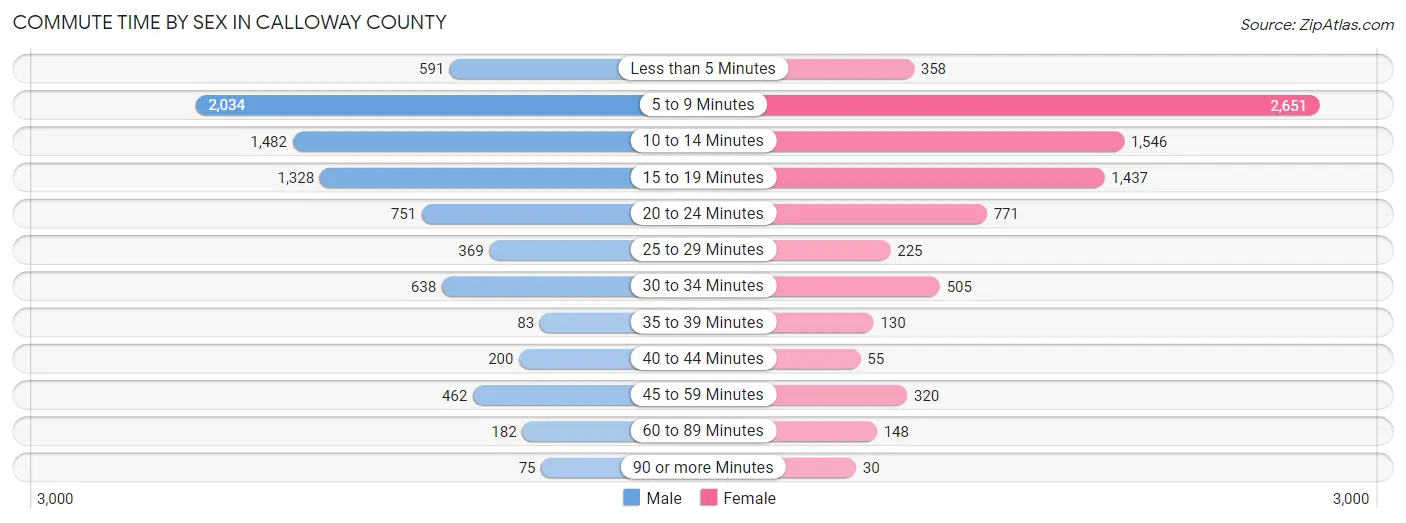
| Commute Time | Male | Female |
| Less than 5 Minutes | 591 (7.2%) | 358 (4.4%) |
| 5 to 9 Minutes | 2,034 (24.8%) | 2,651 (32.4%) |
| 10 to 14 Minutes | 1,482 (18.1%) | 1,546 (18.9%) |
| 15 to 19 Minutes | 1,328 (16.2%) | 1,437 (17.6%) |
| 20 to 24 Minutes | 751 (9.2%) | 771 (9.4%) |
| 25 to 29 Minutes | 369 (4.5%) | 225 (2.8%) |
| 30 to 34 Minutes | 638 (7.8%) | 505 (6.2%) |
| 35 to 39 Minutes | 83 (1.0%) | 130 (1.6%) |
| 40 to 44 Minutes | 200 (2.4%) | 55 (0.7%) |
| 45 to 59 Minutes | 462 (5.6%) | 320 (3.9%) |
| 60 to 89 Minutes | 182 (2.2%) | 148 (1.8%) |
| 90 or more Minutes | 75 (0.9%) | 30 (0.4%) |
Time of Departure to Work by Sex in Calloway County
The most frequent times of departure to work in Calloway County are 7:00 AM to 7:29 AM (1,308, 16.0%) for males and 7:30 AM to 7:59 AM (1,568, 19.2%) for females.
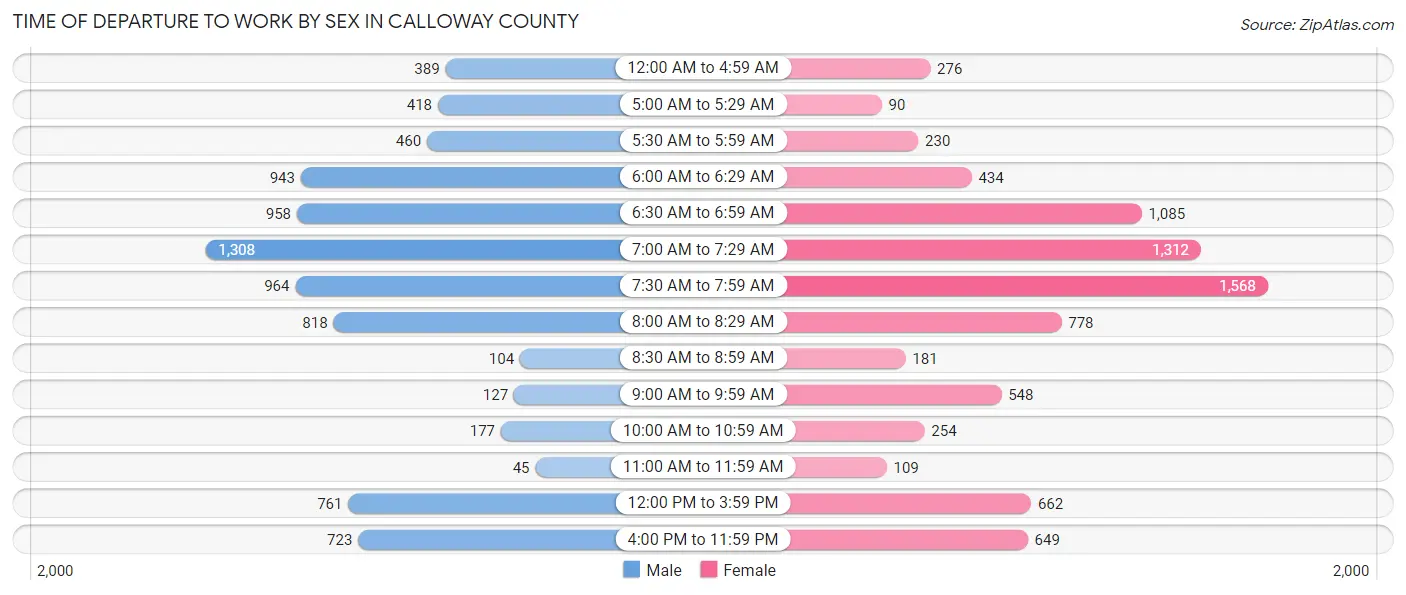
| Time of Departure | Male | Female |
| 12:00 AM to 4:59 AM | 389 (4.8%) | 276 (3.4%) |
| 5:00 AM to 5:29 AM | 418 (5.1%) | 90 (1.1%) |
| 5:30 AM to 5:59 AM | 460 (5.6%) | 230 (2.8%) |
| 6:00 AM to 6:29 AM | 943 (11.5%) | 434 (5.3%) |
| 6:30 AM to 6:59 AM | 958 (11.7%) | 1,085 (13.3%) |
| 7:00 AM to 7:29 AM | 1,308 (16.0%) | 1,312 (16.1%) |
| 7:30 AM to 7:59 AM | 964 (11.8%) | 1,568 (19.2%) |
| 8:00 AM to 8:29 AM | 818 (10.0%) | 778 (9.5%) |
| 8:30 AM to 8:59 AM | 104 (1.3%) | 181 (2.2%) |
| 9:00 AM to 9:59 AM | 127 (1.5%) | 548 (6.7%) |
| 10:00 AM to 10:59 AM | 177 (2.2%) | 254 (3.1%) |
| 11:00 AM to 11:59 AM | 45 (0.5%) | 109 (1.3%) |
| 12:00 PM to 3:59 PM | 761 (9.3%) | 662 (8.1%) |
| 4:00 PM to 11:59 PM | 723 (8.8%) | 649 (7.9%) |
| Total | 8,195 (100.0%) | 8,176 (100.0%) |
Housing Occupancy in Calloway County
Occupancy by Ownership in Calloway County
Of the total 14,805 dwellings in Calloway County, owner-occupied units account for 9,539 (64.4%), while renter-occupied units make up 5,266 (35.6%).
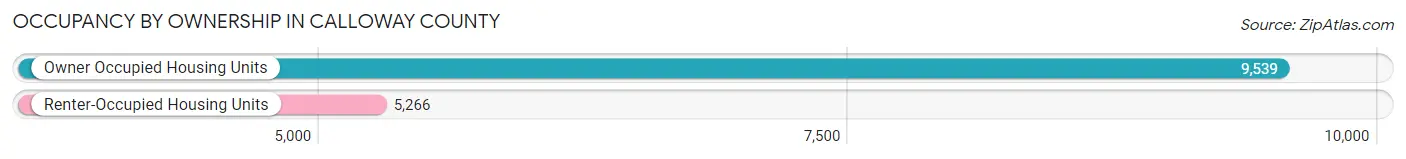
| Occupancy | # Housing Units | % Housing Units |
| Owner Occupied Housing Units | 9,539 | 64.4% |
| Renter-Occupied Housing Units | 5,266 | 35.6% |
| Total Occupied Housing Units | 14,805 | 100.0% |
Occupancy by Household Size in Calloway County
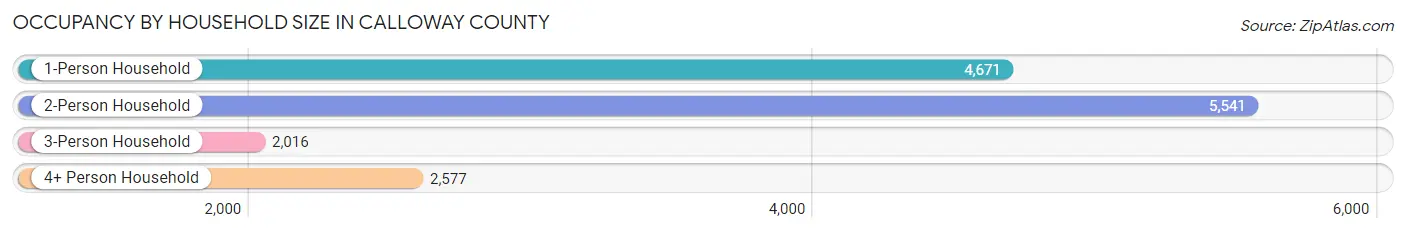
| Household Size | # Housing Units | % Housing Units |
| 1-Person Household | 4,671 | 31.6% |
| 2-Person Household | 5,541 | 37.4% |
| 3-Person Household | 2,016 | 13.6% |
| 4+ Person Household | 2,577 | 17.4% |
| Total Housing Units | 14,805 | 100.0% |
Occupancy by Ownership by Household Size in Calloway County
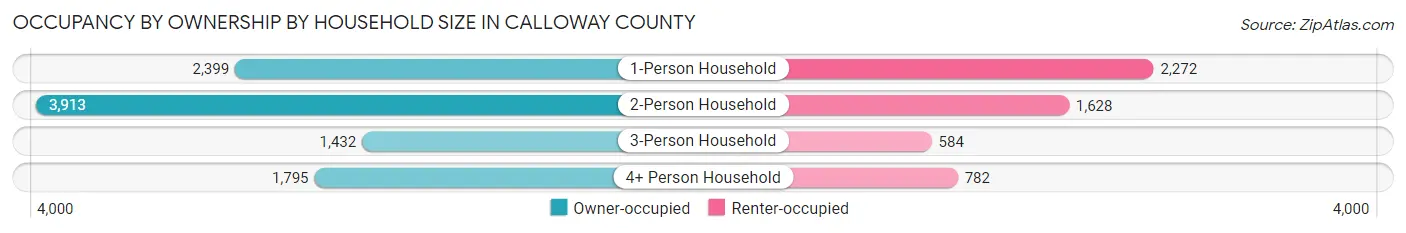
| Household Size | Owner-occupied | Renter-occupied |
| 1-Person Household | 2,399 (51.4%) | 2,272 (48.6%) |
| 2-Person Household | 3,913 (70.6%) | 1,628 (29.4%) |
| 3-Person Household | 1,432 (71.0%) | 584 (29.0%) |
| 4+ Person Household | 1,795 (69.7%) | 782 (30.3%) |
| Total Housing Units | 9,539 (64.4%) | 5,266 (35.6%) |
Occupancy by Educational Attainment in Calloway County
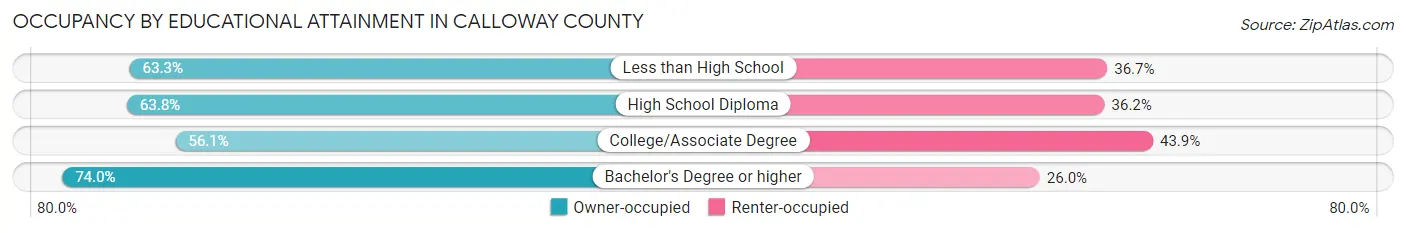
| Household Size | Owner-occupied | Renter-occupied |
| Less than High School | 826 (63.3%) | 478 (36.7%) |
| High School Diploma | 2,595 (63.8%) | 1,474 (36.2%) |
| College/Associate Degree | 2,701 (56.1%) | 2,115 (43.9%) |
| Bachelor's Degree or higher | 3,417 (74.0%) | 1,199 (26.0%) |
Occupancy by Age of Householder in Calloway County
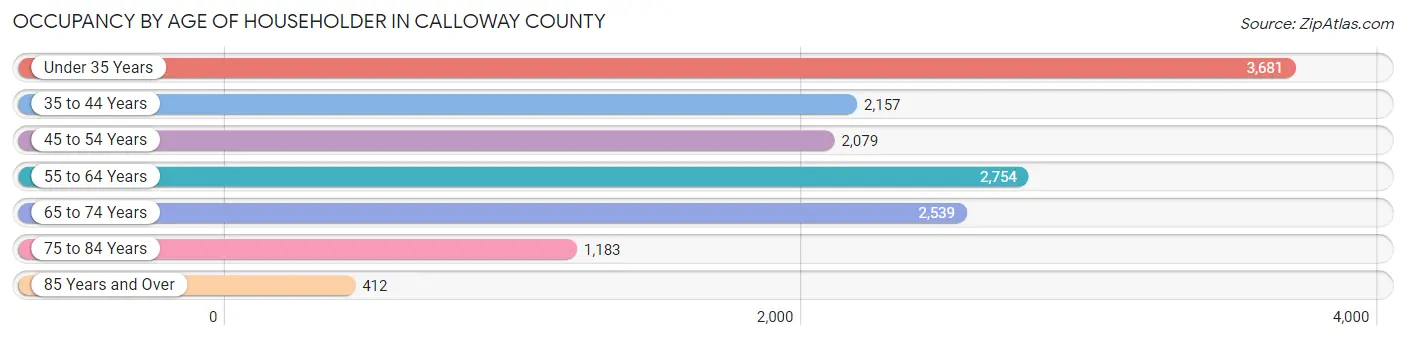
| Age Bracket | # Households | % Households |
| Under 35 Years | 3,681 | 24.9% |
| 35 to 44 Years | 2,157 | 14.6% |
| 45 to 54 Years | 2,079 | 14.0% |
| 55 to 64 Years | 2,754 | 18.6% |
| 65 to 74 Years | 2,539 | 17.2% |
| 75 to 84 Years | 1,183 | 8.0% |
| 85 Years and Over | 412 | 2.8% |
| Total | 14,805 | 100.0% |
Housing Finances in Calloway County
Median Income by Occupancy in Calloway County
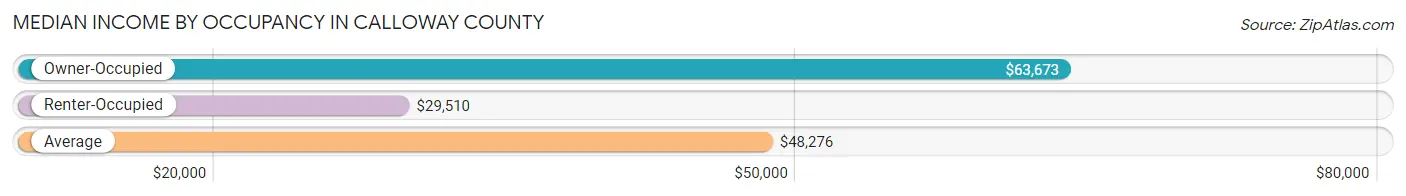
| Occupancy Type | # Households | Median Income |
| Owner-Occupied | 9,539 (64.4%) | $63,673 |
| Renter-Occupied | 5,266 (35.6%) | $29,510 |
| Average | 14,805 (100.0%) | $48,276 |
Occupancy by Householder Income Bracket in Calloway County
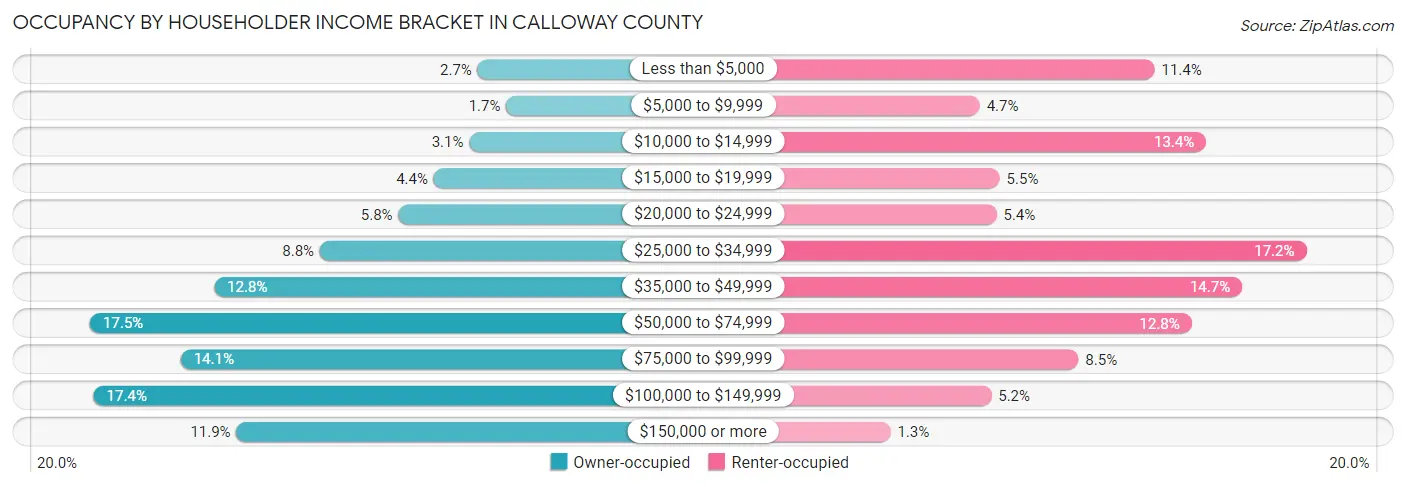
| Income Bracket | Owner-occupied | Renter-occupied |
| Less than $5,000 | 261 (2.7%) | 600 (11.4%) |
| $5,000 to $9,999 | 157 (1.7%) | 249 (4.7%) |
| $10,000 to $14,999 | 292 (3.1%) | 703 (13.4%) |
| $15,000 to $19,999 | 421 (4.4%) | 289 (5.5%) |
| $20,000 to $24,999 | 549 (5.8%) | 283 (5.4%) |
| $25,000 to $34,999 | 835 (8.7%) | 904 (17.2%) |
| $35,000 to $49,999 | 1,219 (12.8%) | 775 (14.7%) |
| $50,000 to $74,999 | 1,670 (17.5%) | 674 (12.8%) |
| $75,000 to $99,999 | 1,340 (14.1%) | 447 (8.5%) |
| $100,000 to $149,999 | 1,657 (17.4%) | 272 (5.2%) |
| $150,000 or more | 1,138 (11.9%) | 70 (1.3%) |
| Total | 9,539 (100.0%) | 5,266 (100.0%) |
Monthly Housing Cost Tiers in Calloway County
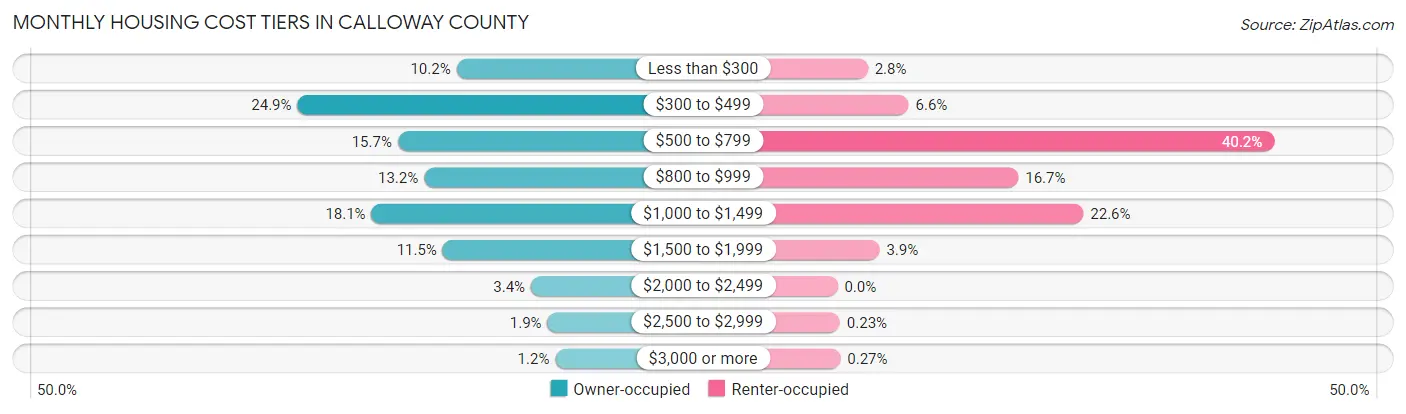
| Monthly Cost | Owner-occupied | Renter-occupied |
| Less than $300 | 977 (10.2%) | 147 (2.8%) |
| $300 to $499 | 2,374 (24.9%) | 345 (6.6%) |
| $500 to $799 | 1,493 (15.7%) | 2,117 (40.2%) |
| $800 to $999 | 1,262 (13.2%) | 877 (16.7%) |
| $1,000 to $1,499 | 1,724 (18.1%) | 1,192 (22.6%) |
| $1,500 to $1,999 | 1,098 (11.5%) | 204 (3.9%) |
| $2,000 to $2,499 | 323 (3.4%) | 0 (0.0%) |
| $2,500 to $2,999 | 178 (1.9%) | 12 (0.2%) |
| $3,000 or more | 110 (1.1%) | 14 (0.3%) |
| Total | 9,539 (100.0%) | 5,266 (100.0%) |
Physical Housing Characteristics in Calloway County
Housing Structures in Calloway County
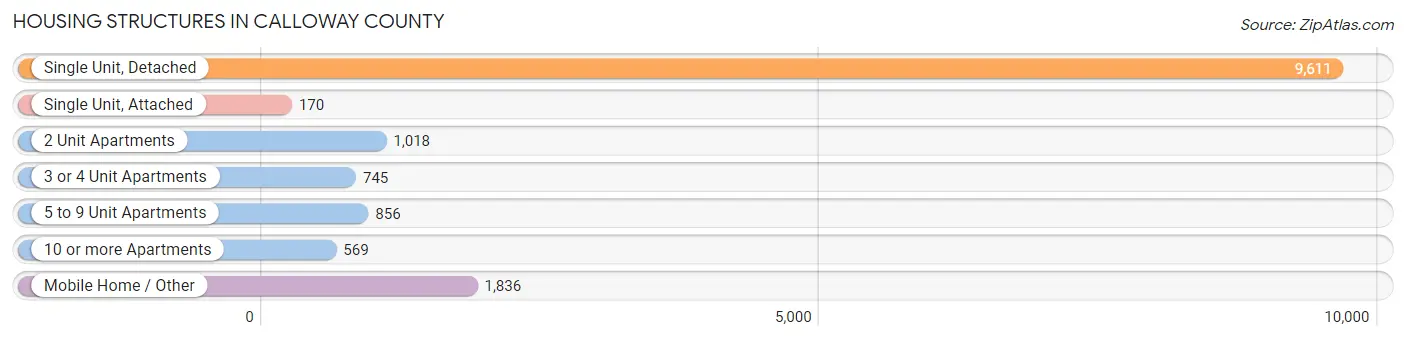
| Structure Type | # Housing Units | % Housing Units |
| Single Unit, Detached | 9,611 | 64.9% |
| Single Unit, Attached | 170 | 1.1% |
| 2 Unit Apartments | 1,018 | 6.9% |
| 3 or 4 Unit Apartments | 745 | 5.0% |
| 5 to 9 Unit Apartments | 856 | 5.8% |
| 10 or more Apartments | 569 | 3.8% |
| Mobile Home / Other | 1,836 | 12.4% |
| Total | 14,805 | 100.0% |
Housing Structures by Occupancy in Calloway County
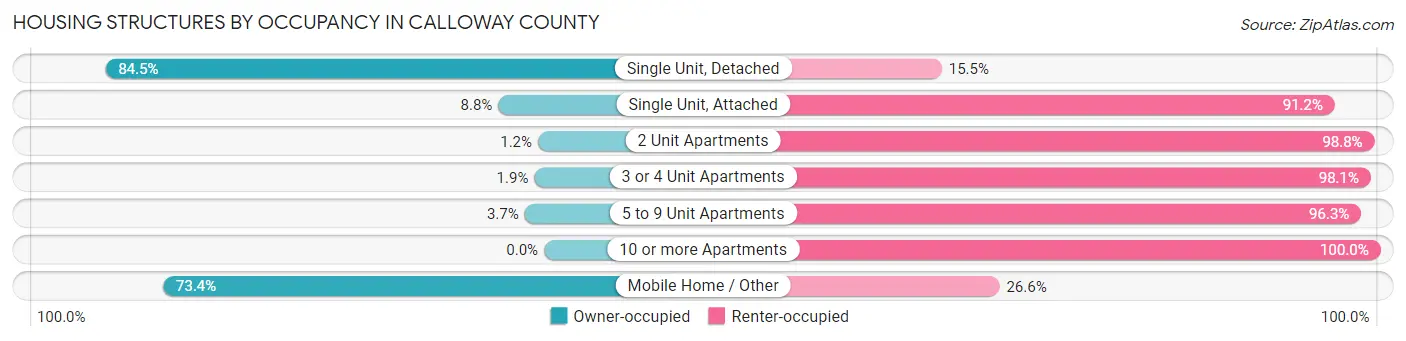
| Structure Type | Owner-occupied | Renter-occupied |
| Single Unit, Detached | 8,119 (84.5%) | 1,492 (15.5%) |
| Single Unit, Attached | 15 (8.8%) | 155 (91.2%) |
| 2 Unit Apartments | 12 (1.2%) | 1,006 (98.8%) |
| 3 or 4 Unit Apartments | 14 (1.9%) | 731 (98.1%) |
| 5 to 9 Unit Apartments | 32 (3.7%) | 824 (96.3%) |
| 10 or more Apartments | 0 (0.0%) | 569 (100.0%) |
| Mobile Home / Other | 1,347 (73.4%) | 489 (26.6%) |
| Total | 9,539 (64.4%) | 5,266 (35.6%) |
Housing Structures by Number of Rooms in Calloway County
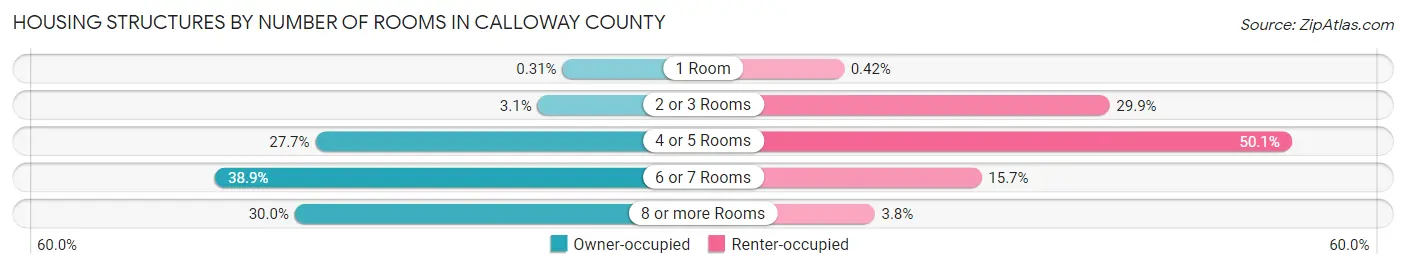
| Number of Rooms | Owner-occupied | Renter-occupied |
| 1 Room | 30 (0.3%) | 22 (0.4%) |
| 2 or 3 Rooms | 294 (3.1%) | 1,575 (29.9%) |
| 4 or 5 Rooms | 2,645 (27.7%) | 2,640 (50.1%) |
| 6 or 7 Rooms | 3,706 (38.9%) | 827 (15.7%) |
| 8 or more Rooms | 2,864 (30.0%) | 202 (3.8%) |
| Total | 9,539 (100.0%) | 5,266 (100.0%) |
Housing Structure by Heating Type in Calloway County
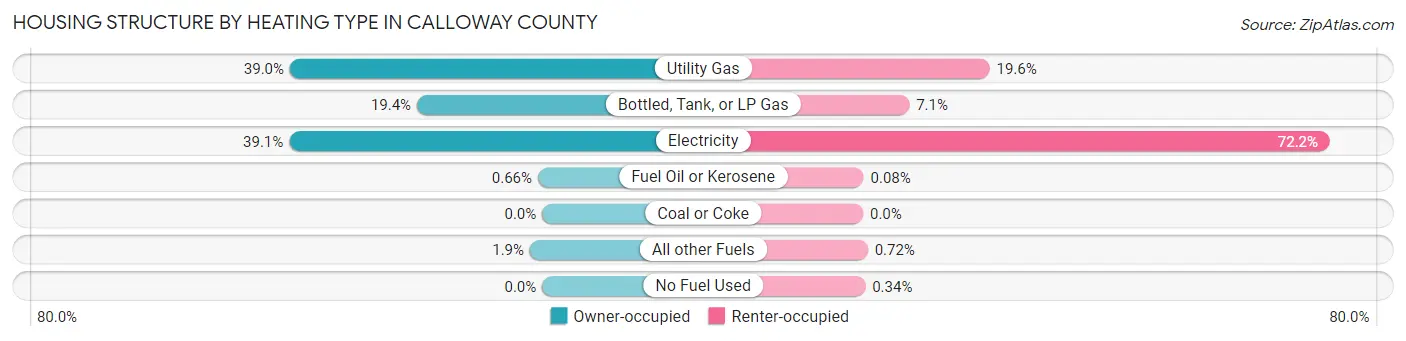
| Heating Type | Owner-occupied | Renter-occupied |
| Utility Gas | 3,719 (39.0%) | 1,030 (19.6%) |
| Bottled, Tank, or LP Gas | 1,846 (19.4%) | 376 (7.1%) |
| Electricity | 3,731 (39.1%) | 3,800 (72.2%) |
| Fuel Oil or Kerosene | 63 (0.7%) | 4 (0.1%) |
| Coal or Coke | 0 (0.0%) | 0 (0.0%) |
| All other Fuels | 180 (1.9%) | 38 (0.7%) |
| No Fuel Used | 0 (0.0%) | 18 (0.3%) |
| Total | 9,539 (100.0%) | 5,266 (100.0%) |
Household Vehicle Usage in Calloway County
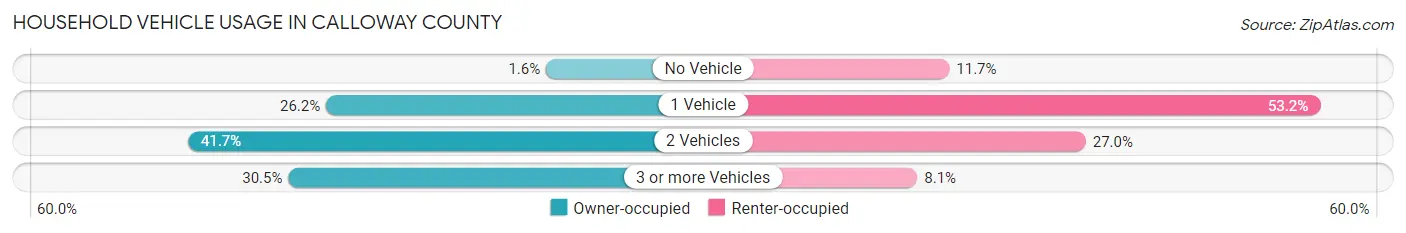
| Vehicles per Household | Owner-occupied | Renter-occupied |
| No Vehicle | 152 (1.6%) | 616 (11.7%) |
| 1 Vehicle | 2,502 (26.2%) | 2,802 (53.2%) |
| 2 Vehicles | 3,979 (41.7%) | 1,421 (27.0%) |
| 3 or more Vehicles | 2,906 (30.5%) | 427 (8.1%) |
| Total | 9,539 (100.0%) | 5,266 (100.0%) |
Real Estate & Mortgages in Calloway County
Real Estate and Mortgage Overview in Calloway County
| Characteristic | Without Mortgage | With Mortgage |
| Housing Units | 4,731 | 4,808 |
| Median Property Value | $150,900 | $178,100 |
| Median Household Income | $48,419 | $745 |
| Monthly Housing Costs | $410 | $110 |
| Real Estate Taxes | $897 | $173 |
Property Value by Mortgage Status in Calloway County
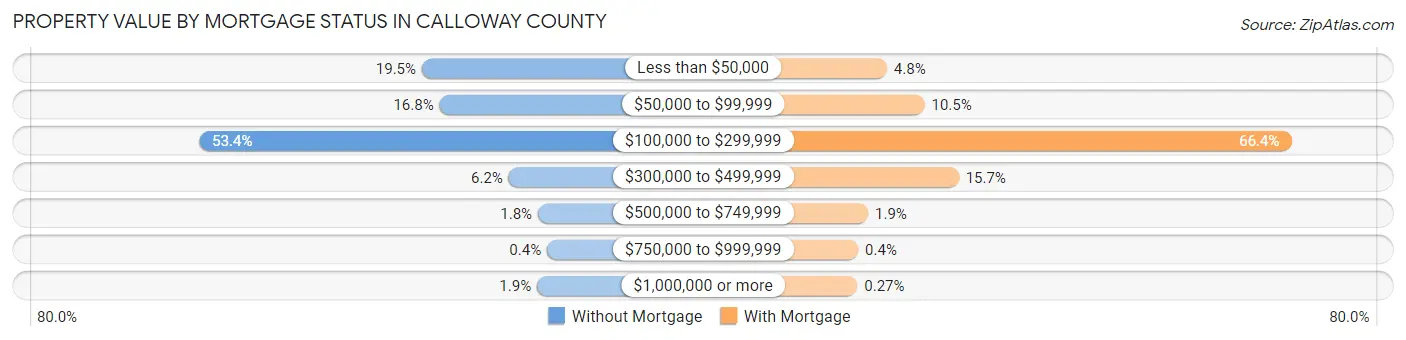
| Property Value | Without Mortgage | With Mortgage |
| Less than $50,000 | 921 (19.5%) | 230 (4.8%) |
| $50,000 to $99,999 | 794 (16.8%) | 506 (10.5%) |
| $100,000 to $299,999 | 2,527 (53.4%) | 3,192 (66.4%) |
| $300,000 to $499,999 | 295 (6.2%) | 756 (15.7%) |
| $500,000 to $749,999 | 84 (1.8%) | 92 (1.9%) |
| $750,000 to $999,999 | 19 (0.4%) | 19 (0.4%) |
| $1,000,000 or more | 91 (1.9%) | 13 (0.3%) |
| Total | 4,731 (100.0%) | 4,808 (100.0%) |
Household Income by Mortgage Status in Calloway County
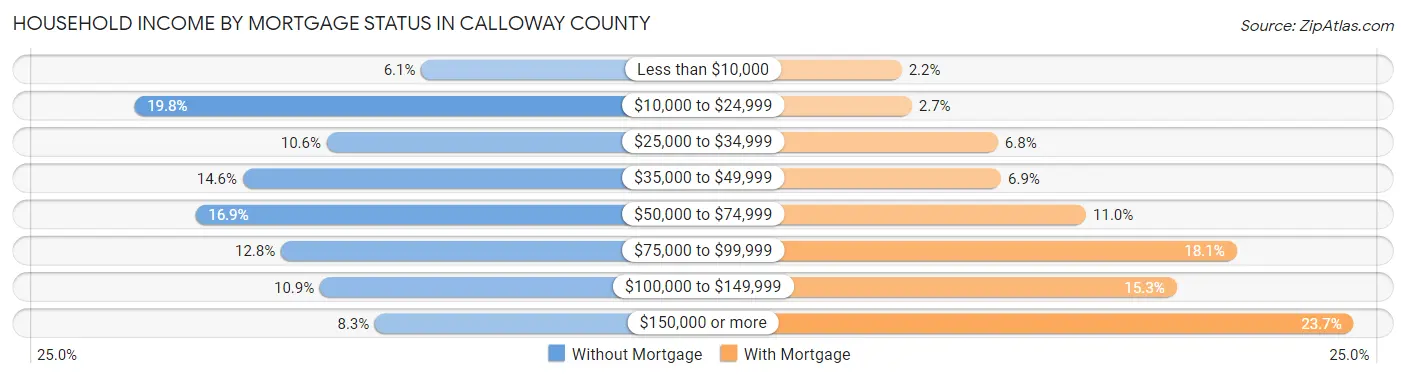
| Household Income | Without Mortgage | With Mortgage |
| Less than $10,000 | 289 (6.1%) | 106 (2.2%) |
| $10,000 to $24,999 | 936 (19.8%) | 129 (2.7%) |
| $25,000 to $34,999 | 502 (10.6%) | 326 (6.8%) |
| $35,000 to $49,999 | 691 (14.6%) | 333 (6.9%) |
| $50,000 to $74,999 | 798 (16.9%) | 528 (11.0%) |
| $75,000 to $99,999 | 605 (12.8%) | 872 (18.1%) |
| $100,000 to $149,999 | 517 (10.9%) | 735 (15.3%) |
| $150,000 or more | 393 (8.3%) | 1,140 (23.7%) |
| Total | 4,731 (100.0%) | 4,808 (100.0%) |
Property Value to Household Income Ratio in Calloway County
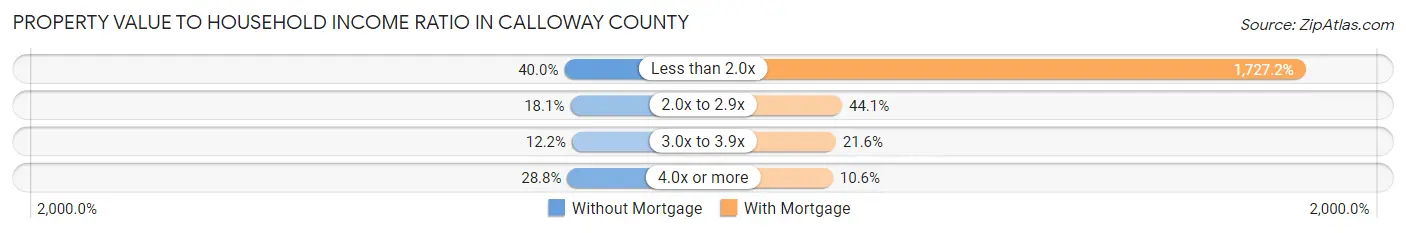
| Value-to-Income Ratio | Without Mortgage | With Mortgage |
| Less than 2.0x | 1,892 (40.0%) | 83,043 (1,727.2%) |
| 2.0x to 2.9x | 855 (18.1%) | 2,122 (44.1%) |
| 3.0x to 3.9x | 575 (12.1%) | 1,038 (21.6%) |
| 4.0x or more | 1,360 (28.7%) | 510 (10.6%) |
| Total | 4,731 (100.0%) | 4,808 (100.0%) |
Real Estate Taxes by Mortgage Status in Calloway County
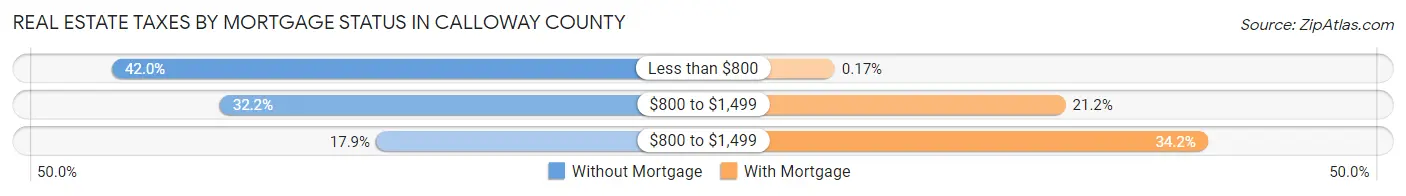
| Property Taxes | Without Mortgage | With Mortgage |
| Less than $800 | 1,988 (42.0%) | 8 (0.2%) |
| $800 to $1,499 | 1,522 (32.2%) | 1,021 (21.2%) |
| $800 to $1,499 | 848 (17.9%) | 1,645 (34.2%) |
| Total | 4,731 (100.0%) | 4,808 (100.0%) |
Health & Disability in Calloway County
Health Insurance Coverage by Age in Calloway County
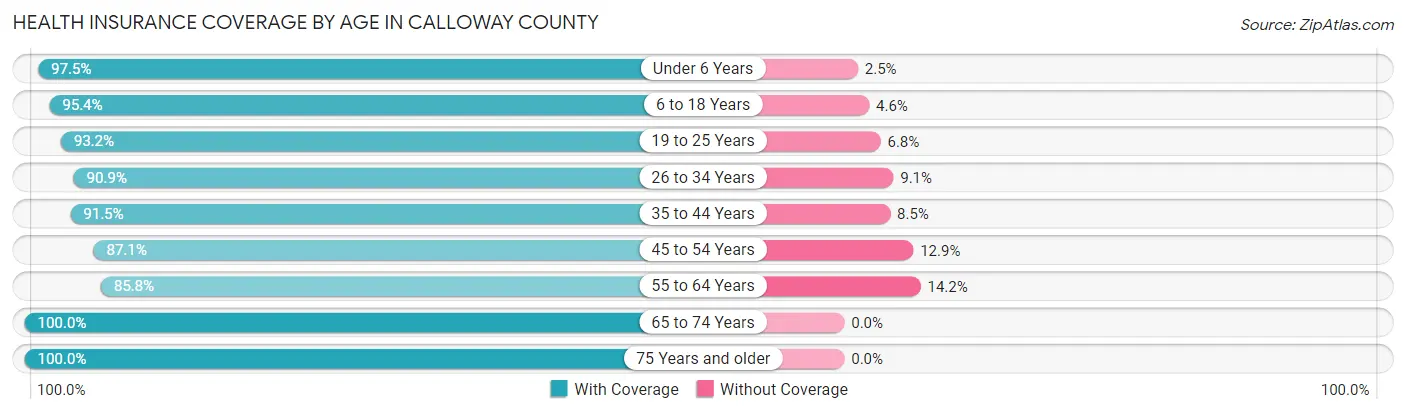
| Age Bracket | With Coverage | Without Coverage |
| Under 6 Years | 2,004 (97.5%) | 52 (2.5%) |
| 6 to 18 Years | 5,491 (95.4%) | 266 (4.6%) |
| 19 to 25 Years | 6,329 (93.2%) | 459 (6.8%) |
| 26 to 34 Years | 3,479 (90.9%) | 350 (9.1%) |
| 35 to 44 Years | 3,622 (91.5%) | 338 (8.5%) |
| 45 to 54 Years | 3,402 (87.1%) | 502 (12.9%) |
| 55 to 64 Years | 3,829 (85.8%) | 635 (14.2%) |
| 65 to 74 Years | 3,697 (100.0%) | 0 (0.0%) |
| 75 Years and older | 2,573 (100.0%) | 0 (0.0%) |
| Total | 34,426 (93.0%) | 2,602 (7.0%) |
Health Insurance Coverage by Citizenship Status in Calloway County
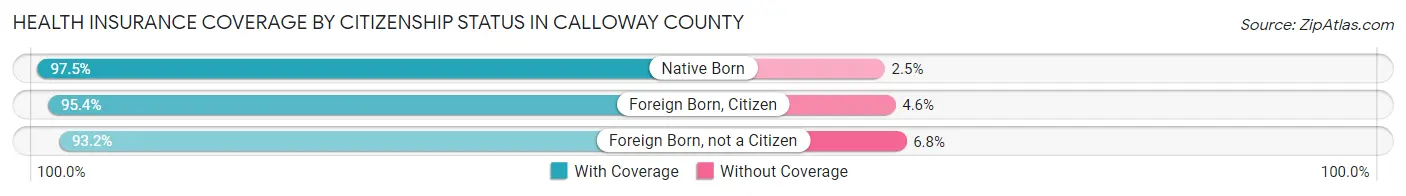
| Citizenship Status | With Coverage | Without Coverage |
| Native Born | 2,004 (97.5%) | 52 (2.5%) |
| Foreign Born, Citizen | 5,491 (95.4%) | 266 (4.6%) |
| Foreign Born, not a Citizen | 6,329 (93.2%) | 459 (6.8%) |
Health Insurance Coverage by Household Income in Calloway County
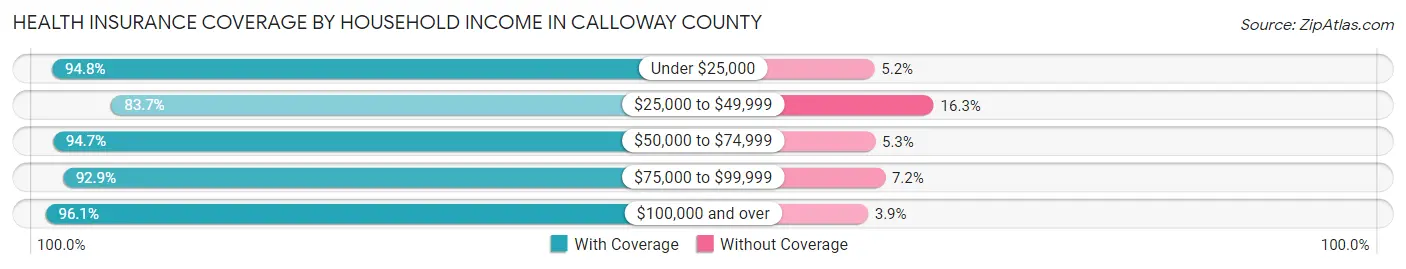
| Household Income | With Coverage | Without Coverage |
| Under $25,000 | 5,865 (94.8%) | 320 (5.2%) |
| $25,000 to $49,999 | 6,275 (83.7%) | 1,219 (16.3%) |
| $50,000 to $74,999 | 6,233 (94.7%) | 348 (5.3%) |
| $75,000 to $99,999 | 4,218 (92.8%) | 325 (7.1%) |
| $100,000 and over | 8,963 (96.1%) | 367 (3.9%) |
Public vs Private Health Insurance Coverage by Age in Calloway County
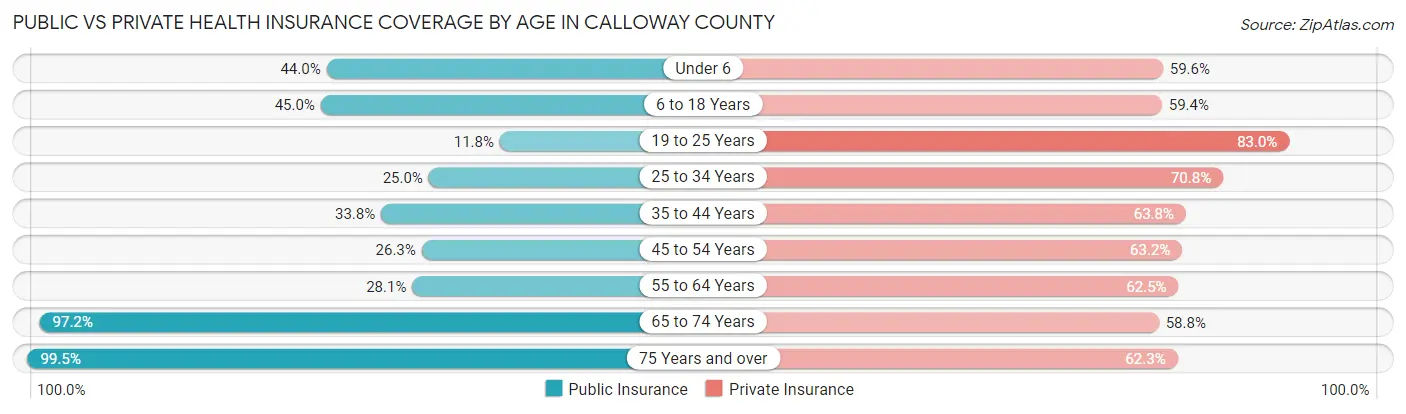
| Age Bracket | Public Insurance | Private Insurance |
| Under 6 | 904 (44.0%) | 1,225 (59.6%) |
| 6 to 18 Years | 2,593 (45.0%) | 3,419 (59.4%) |
| 19 to 25 Years | 800 (11.8%) | 5,637 (83.0%) |
| 25 to 34 Years | 957 (25.0%) | 2,709 (70.8%) |
| 35 to 44 Years | 1,340 (33.8%) | 2,528 (63.8%) |
| 45 to 54 Years | 1,027 (26.3%) | 2,466 (63.2%) |
| 55 to 64 Years | 1,252 (28.1%) | 2,789 (62.5%) |
| 65 to 74 Years | 3,594 (97.2%) | 2,175 (58.8%) |
| 75 Years and over | 2,559 (99.5%) | 1,603 (62.3%) |
| Total | 15,026 (40.6%) | 24,551 (66.3%) |
Disability Status by Sex by Age in Calloway County
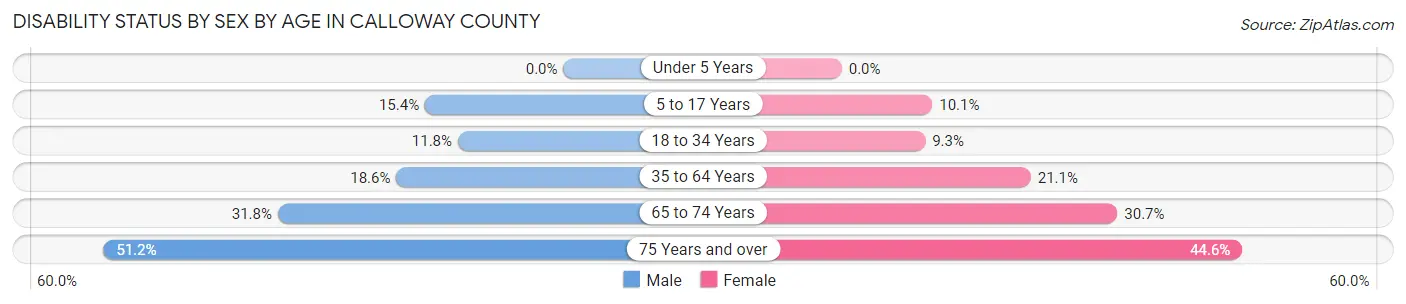
| Age Bracket | Male | Female |
| Under 5 Years | 0 (0.0%) | 0 (0.0%) |
| 5 to 17 Years | 398 (15.4%) | 247 (10.1%) |
| 18 to 34 Years | 665 (11.7%) | 562 (9.3%) |
| 35 to 64 Years | 1,136 (18.6%) | 1,309 (21.0%) |
| 65 to 74 Years | 554 (31.8%) | 600 (30.7%) |
| 75 Years and over | 561 (51.2%) | 659 (44.6%) |
Disability Class by Sex by Age in Calloway County
Disability Class: Hearing Difficulty
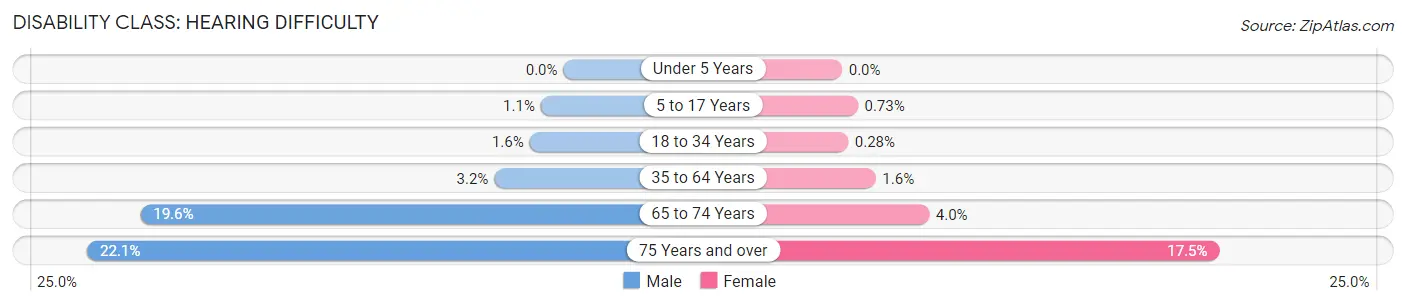
| Age Bracket | Male | Female |
| Under 5 Years | 0 (0.0%) | 0 (0.0%) |
| 5 to 17 Years | 27 (1.1%) | 18 (0.7%) |
| 18 to 34 Years | 89 (1.6%) | 17 (0.3%) |
| 35 to 64 Years | 196 (3.2%) | 97 (1.6%) |
| 65 to 74 Years | 342 (19.6%) | 79 (4.0%) |
| 75 Years and over | 242 (22.1%) | 259 (17.5%) |
Disability Class: Vision Difficulty
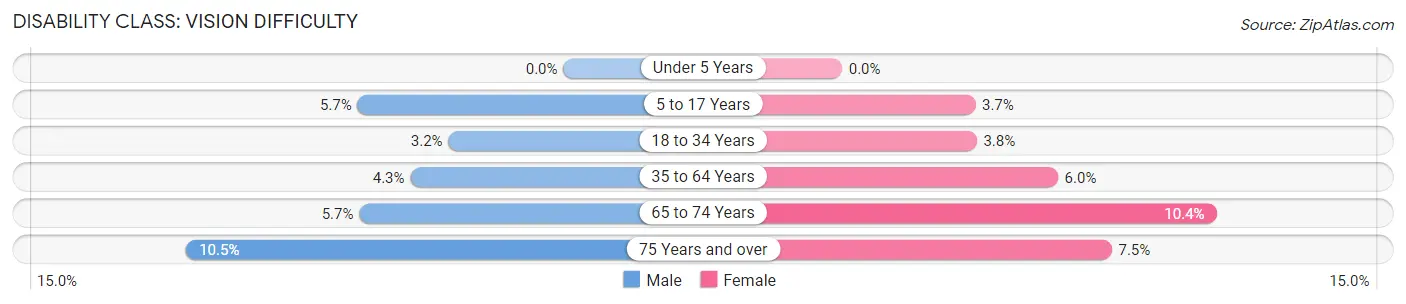
| Age Bracket | Male | Female |
| Under 5 Years | 0 (0.0%) | 0 (0.0%) |
| 5 to 17 Years | 148 (5.7%) | 91 (3.7%) |
| 18 to 34 Years | 181 (3.2%) | 227 (3.7%) |
| 35 to 64 Years | 260 (4.3%) | 374 (6.0%) |
| 65 to 74 Years | 99 (5.7%) | 204 (10.4%) |
| 75 Years and over | 115 (10.5%) | 111 (7.5%) |
Disability Class: Cognitive Difficulty
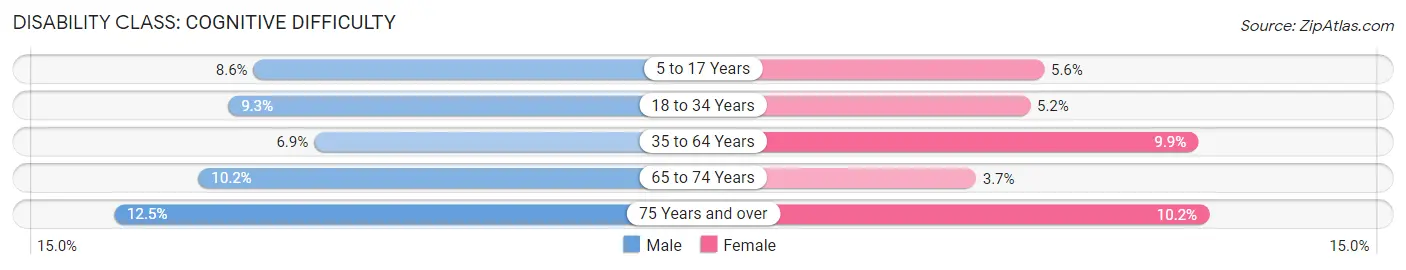
| Age Bracket | Male | Female |
| 5 to 17 Years | 223 (8.6%) | 138 (5.6%) |
| 18 to 34 Years | 528 (9.3%) | 317 (5.2%) |
| 35 to 64 Years | 424 (6.9%) | 617 (9.9%) |
| 65 to 74 Years | 177 (10.2%) | 73 (3.7%) |
| 75 Years and over | 137 (12.5%) | 151 (10.2%) |
Disability Class: Ambulatory Difficulty
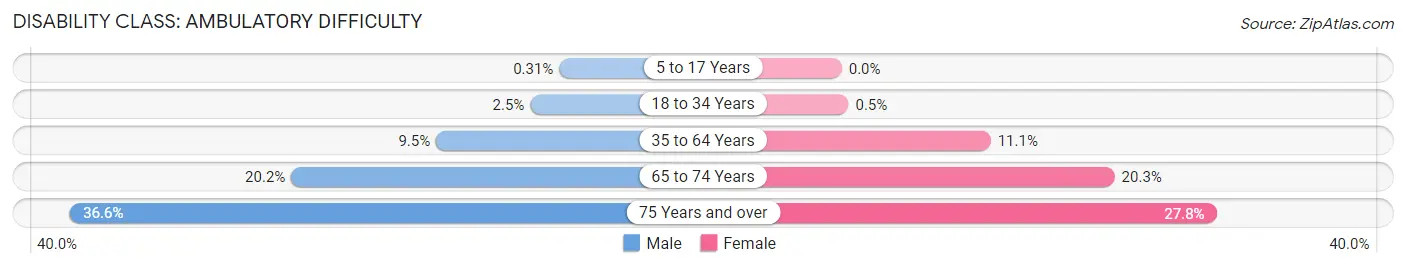
| Age Bracket | Male | Female |
| 5 to 17 Years | 8 (0.3%) | 0 (0.0%) |
| 18 to 34 Years | 139 (2.5%) | 30 (0.5%) |
| 35 to 64 Years | 577 (9.5%) | 688 (11.1%) |
| 65 to 74 Years | 352 (20.2%) | 396 (20.3%) |
| 75 Years and over | 401 (36.6%) | 411 (27.8%) |
Disability Class: Self-Care Difficulty
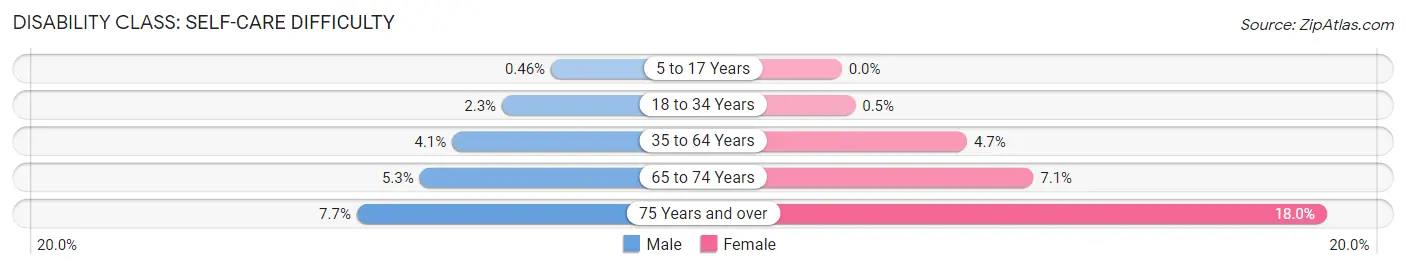
| Age Bracket | Male | Female |
| 5 to 17 Years | 12 (0.5%) | 0 (0.0%) |
| 18 to 34 Years | 129 (2.3%) | 30 (0.5%) |
| 35 to 64 Years | 252 (4.1%) | 289 (4.6%) |
| 65 to 74 Years | 93 (5.3%) | 139 (7.1%) |
| 75 Years and over | 84 (7.7%) | 266 (18.0%) |
Technology Access in Calloway County
Computing Device Access in Calloway County
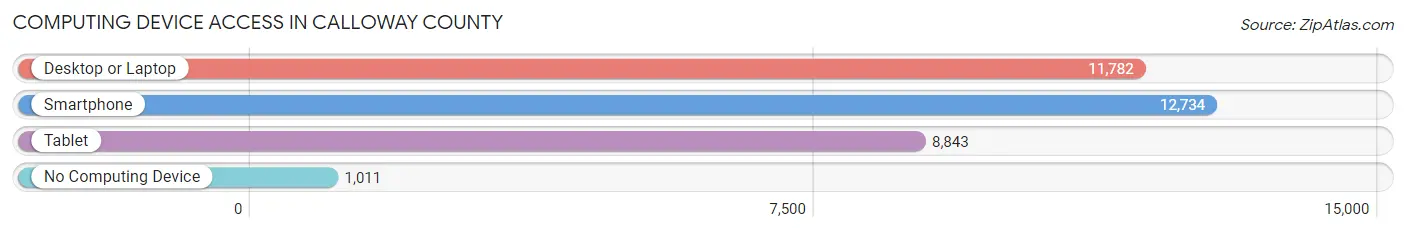
| Device Type | # Households | % Households |
| Desktop or Laptop | 11,782 | 79.6% |
| Smartphone | 12,734 | 86.0% |
| Tablet | 8,843 | 59.7% |
| No Computing Device | 1,011 | 6.8% |
| Total | 14,805 | 100.0% |
Internet Access in Calloway County
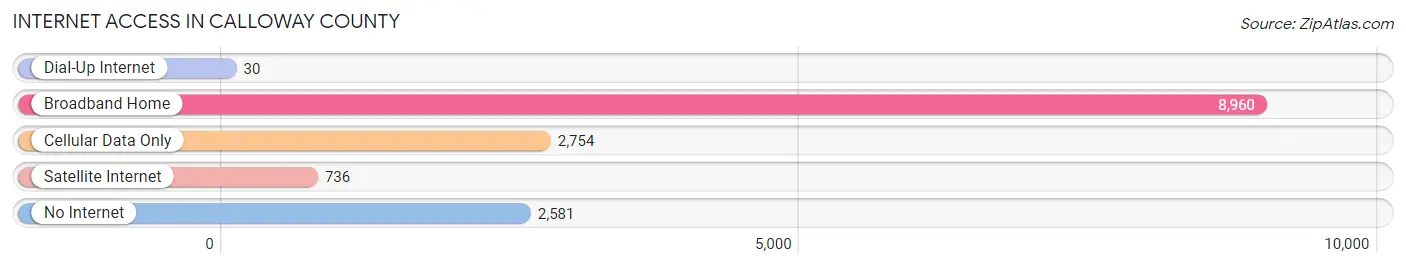
| Internet Type | # Households | % Households |
| Dial-Up Internet | 30 | 0.2% |
| Broadband Home | 8,960 | 60.5% |
| Cellular Data Only | 2,754 | 18.6% |
| Satellite Internet | 736 | 5.0% |
| No Internet | 2,581 | 17.4% |
| Total | 14,805 | 100.0% |
Calloway County Summary
Calloway County is located in the southwestern corner of Kentucky, and is part of the Jackson Purchase region. It is bordered by the counties of Marshall, Graves, McCracken, and Trigg. The county seat is Murray, and the county was formed in 1821 from parts of Hickman and Christian counties. The county was named for Colonel Richard Callaway, a Revolutionary War veteran.
Geography
Calloway County has an area of 437 square miles, of which 434 square miles is land and 3 square miles is water. The county is located in the Pennyrile region of Kentucky, and is characterized by rolling hills and fertile soil. The county is drained by the Little River, which flows through the county from north to south. The county is also home to several small lakes, including Lake Barkley, Lake Beshear, and Lake Malone.
The county is home to several state parks, including Kentucky Dam Village State Resort Park, Lake Barkley State Resort Park, and Kenlake State Resort Park. The county is also home to the Land Between the Lakes National Recreation Area, which is managed by the U.S. Forest Service.
Demographics
As of the 2010 census, the population of Calloway County was 37,191. The population density was 85.3 people per square mile. The racial makeup of the county was 87.3% White, 9.3% African American, 0.4% Native American, 0.7% Asian, 0.1% Pacific Islander, 0.9% from other races, and 1.3% from two or more races. Hispanic or Latino of any race were 2.2% of the population.
The median income for a household in the county was $37,945, and the median income for a family was $45,945. The per capita income for the county was $19,945. About 11.3% of families and 14.7% of the population were below the poverty line, including 19.2% of those under age 18 and 11.2% of those age 65 or over.
Economy
Calloway County is home to several industries, including manufacturing, agriculture, and tourism. The county is home to several manufacturing plants, including Murray Biscuit Company, Murray State University Printing Services, and Murray State University Printing Services. The county is also home to several agricultural operations, including dairy farms, poultry farms, and beef cattle farms.
The county is also home to several tourist attractions, including the Land Between the Lakes National Recreation Area, Kentucky Dam Village State Resort Park, Lake Barkley State Resort Park, and Kenlake State Resort Park. The county is also home to several golf courses, including the Murray Country Club and the Lake Barkley Golf Course.
Conclusion
Calloway County is a rural county located in the southwestern corner of Kentucky. The county is characterized by rolling hills and fertile soil, and is home to several state parks and tourist attractions. The county has a population of 37,191, and is home to several industries, including manufacturing, agriculture, and tourism. The county is also home to several golf courses, and is a popular destination for outdoor recreation.
Common Questions
What is the Total Population of Calloway County?
Total Population of Calloway County is 37,345.
What is the Total Male Population of Calloway County?
Total Male Population of Calloway County is 18,201.
What is the Total Female Population of Calloway County?
Total Female Population of Calloway County is 19,144.
What is the Ratio of Males per 100 Females in Calloway County?
There are 95.07 Males per 100 Females in Calloway County.
What is the Ratio of Females per 100 Males in Calloway County?
There are 105.18 Females per 100 Males in Calloway County.
What is the Median Population Age in Calloway County?
Median Population Age in Calloway County is 35.6 Years.
What is the Average Family Size in Calloway County
Average Family Size in Calloway County is 2.9 People.
What is the Average Household Size in Calloway County
Average Household Size in Calloway County is 2.3 People.
What is Per Capita Income in Calloway County?
Per Capita income in Calloway County is $27,850.
What is the Median Family Income in Calloway County?
Median Family Income in Calloway County is $74,371.
What is the Median Household income in Calloway County?
Median Household Income in Calloway County is $48,276.
What is Income or Wage Gap in Calloway County?
Income or Wage Gap in Calloway County is 35.9%.
Women in Calloway County earn 64.1 cents for every dollar earned by a man.
What is Family Income Deficit in Calloway County?
Family Income Deficit in Calloway County is $9,904.
Families that are below poverty line in Calloway County earn $9,904 less on average than the poverty threshold level.
What is Inequality or Gini Index in Calloway County?
Inequality or Gini Index in Calloway County is 0.48.
How Large is the Labor Force in Calloway County?
There are 18,256 People in the Labor Forcein in Calloway County.
What is the Percentage of People in the Labor Force in Calloway County?
58.1% of People are in the Labor Force in Calloway County.
What is the Unemployment Rate in Calloway County?
Unemployment Rate in Calloway County is 4.7%.