Bullitt County, KY
Bullitt County Map
Bullitt County Overview
82,482
TOTAL POPULATION
41,383
MALE POPULATION
41,099
FEMALE POPULATION
100.69
MALES / 100 FEMALES
99.31
FEMALES / 100 MALES
41.1
MEDIAN AGE
3.0
AVG FAMILY SIZE
2.6
AVG HOUSEHOLD SIZE
$34,362
PER CAPITA INCOME
$85,180
AVG FAMILY INCOME
$73,900
AVG HOUSEHOLD INCOME
28.7%
WAGE / INCOME GAP [ % ]
71.3¢/ $1
WAGE / INCOME GAP [ $ ]
$9,130
FAMILY INCOME DEFICIT
0.39
INEQUALITY / GINI INDEX
43,157
LABOR FORCE [ PEOPLE ]
64.0%
PERCENT IN LABOR FORCE
4.6%
UNEMPLOYMENT RATE
Bullitt County Area Codes
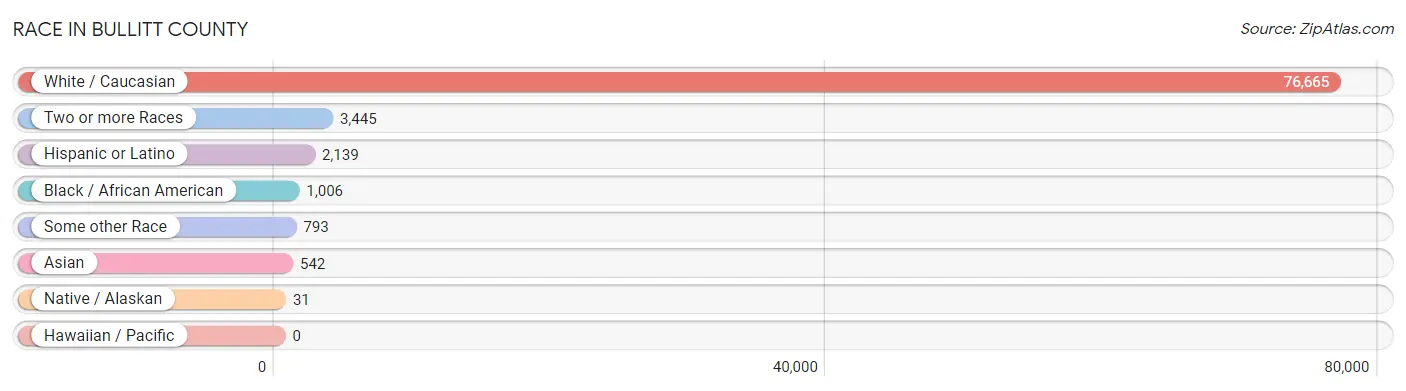
Race in Bullitt County
The most populous races in Bullitt County are White / Caucasian (76,665 | 92.9%), Two or more Races (3,445 | 4.2%), and Hispanic or Latino (2,139 | 2.6%).
| Race | # Population | % Population |
| Asian | 542 | 0.7% |
| Black / African American | 1,006 | 1.2% |
| Hawaiian / Pacific | 0 | 0.0% |
| Hispanic or Latino | 2,139 | 2.6% |
| Native / Alaskan | 31 | 0.0% |
| White / Caucasian | 76,665 | 92.9% |
| Two or more Races | 3,445 | 4.2% |
| Some other Race | 793 | 1.0% |
| Total | 82,482 | 100.0% |
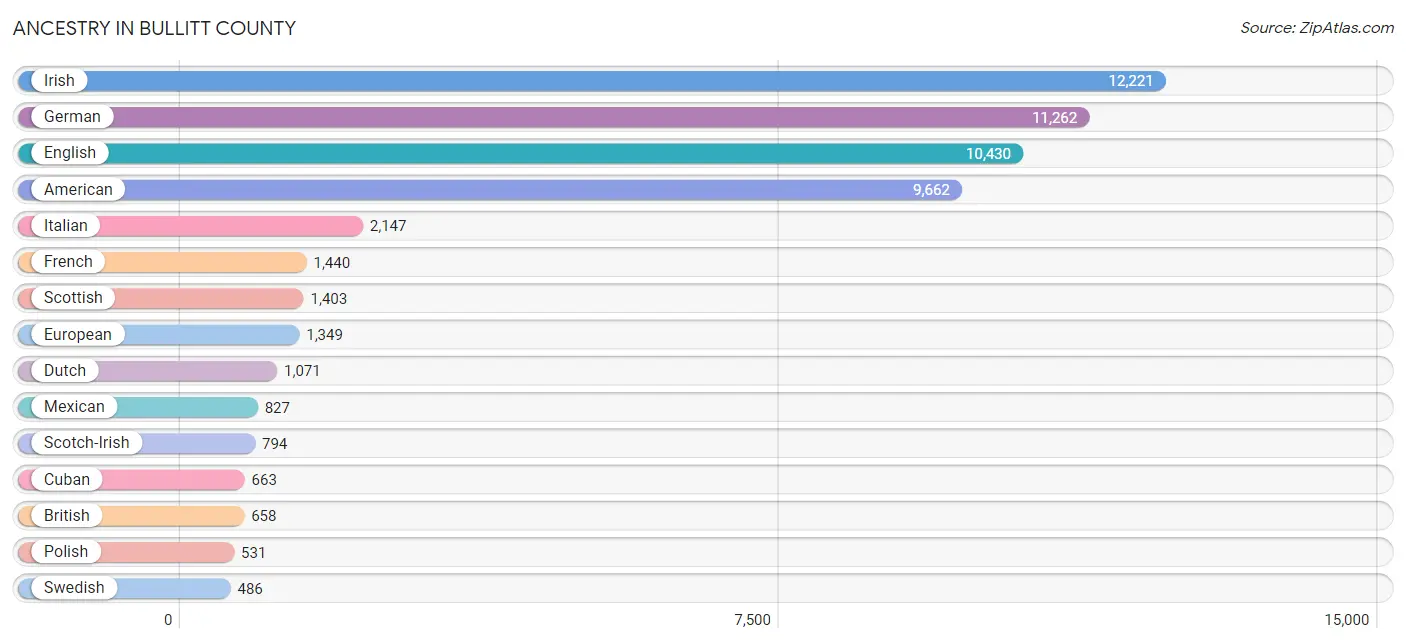
Ancestry in Bullitt County
The most populous ancestries reported in Bullitt County are Irish (12,221 | 14.8%), German (11,262 | 13.7%), English (10,430 | 12.7%), American (9,662 | 11.7%), and Italian (2,147 | 2.6%), together accounting for 55.4% of all Bullitt County residents.
| Ancestry | # Population | % Population |
| Albanian | 9 | 0.0% |
| American | 9,662 | 11.7% |
| Apache | 2 | 0.0% |
| Arab | 81 | 0.1% |
| Armenian | 10 | 0.0% |
| Australian | 100 | 0.1% |
| Austrian | 54 | 0.1% |
| Belgian | 10 | 0.0% |
| Belizean | 15 | 0.0% |
| Bhutanese | 165 | 0.2% |
| Blackfeet | 12 | 0.0% |
| British | 658 | 0.8% |
| Burmese | 153 | 0.2% |
| Canadian | 9 | 0.0% |
| Central American | 89 | 0.1% |
| Central American Indian | 11 | 0.0% |
| Cherokee | 227 | 0.3% |
| Chickasaw | 6 | 0.0% |
| Colombian | 36 | 0.0% |
| Comanche | 22 | 0.0% |
| Cuban | 663 | 0.8% |
| Czech | 24 | 0.0% |
| Czechoslovakian | 32 | 0.0% |
| Danish | 40 | 0.1% |
| Dutch | 1,071 | 1.3% |
| Eastern European | 198 | 0.2% |
| Ecuadorian | 2 | 0.0% |
| Egyptian | 8 | 0.0% |
| English | 10,430 | 12.7% |
| European | 1,349 | 1.6% |
| Finnish | 15 | 0.0% |
| French | 1,440 | 1.8% |
| French Canadian | 343 | 0.4% |
| German | 11,262 | 13.7% |
| Ghanaian | 17 | 0.0% |
| Greek | 25 | 0.0% |
| Guatemalan | 70 | 0.1% |
| Honduran | 10 | 0.0% |
| Hungarian | 27 | 0.0% |
| Icelander | 13 | 0.0% |
| Indonesian | 63 | 0.1% |
| Irish | 12,221 | 14.8% |
| Israeli | 42 | 0.1% |
| Italian | 2,147 | 2.6% |
| Korean | 35 | 0.0% |
| Laotian | 45 | 0.1% |
| Lebanese | 41 | 0.1% |
| Mexican | 827 | 1.0% |
| Native Hawaiian | 48 | 0.1% |
| Nigerian | 6 | 0.0% |
| Northern European | 51 | 0.1% |
| Norwegian | 444 | 0.5% |
| Pakistani | 3 | 0.0% |
| Panamanian | 9 | 0.0% |
| Paraguayan | 43 | 0.1% |
| Pennsylvania German | 10 | 0.0% |
| Polish | 531 | 0.6% |
| Portuguese | 103 | 0.1% |
| Puerto Rican | 291 | 0.4% |
| Russian | 24 | 0.0% |
| Scandinavian | 212 | 0.3% |
| Scotch-Irish | 794 | 1.0% |
| Scottish | 1,403 | 1.7% |
| Serbian | 31 | 0.0% |
| Sioux | 4 | 0.0% |
| Slavic | 19 | 0.0% |
| Slovak | 14 | 0.0% |
| South American | 176 | 0.2% |
| Spaniard | 23 | 0.0% |
| Spanish | 42 | 0.1% |
| Sri Lankan | 11 | 0.0% |
| Subsaharan African | 328 | 0.4% |
| Swedish | 486 | 0.6% |
| Swiss | 106 | 0.1% |
| Syrian | 32 | 0.0% |
| Thai | 357 | 0.4% |
| Tohono O'Odham | 29 | 0.0% |
| Trinidadian and Tobagonian | 31 | 0.0% |
| Ukrainian | 56 | 0.1% |
| Venezuelan | 6 | 0.0% |
| Welsh | 397 | 0.5% |
| West Indian | 3 | 0.0% |
| Yugoslavian | 5 | 0.0% | View All 83 Rows |
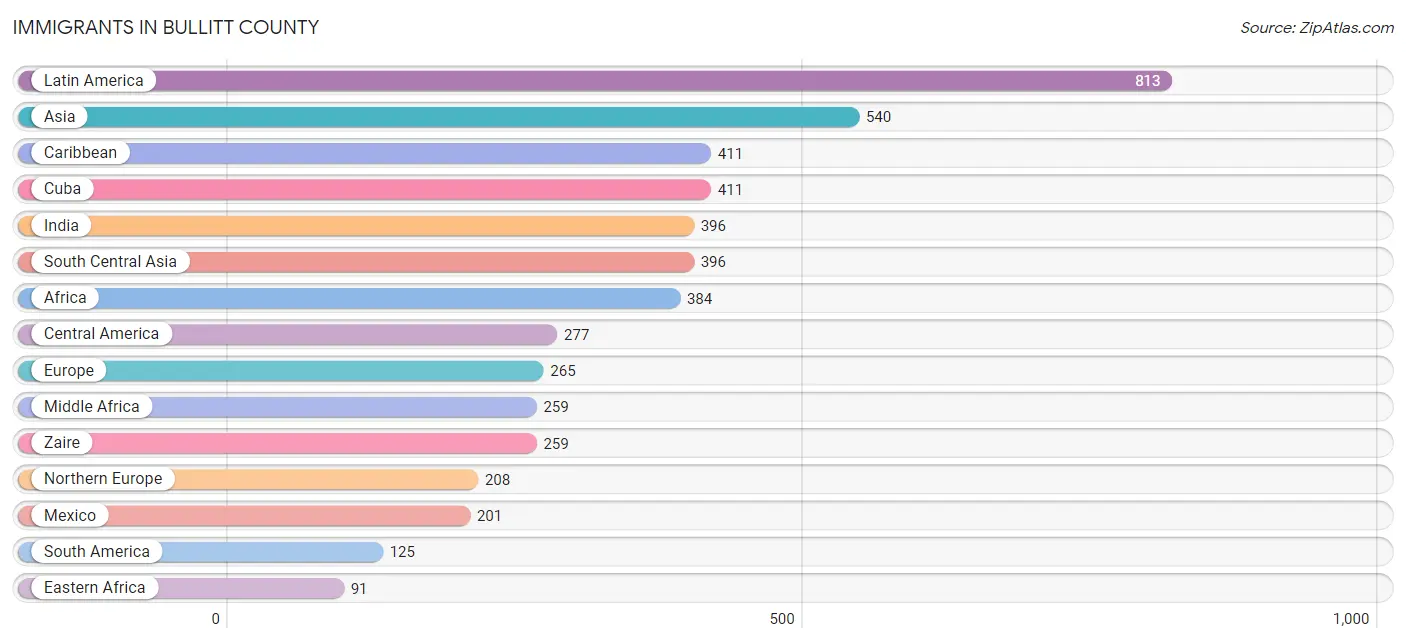
Immigrants in Bullitt County
The most numerous immigrant groups reported in Bullitt County came from Latin America (813 | 1.0%), Asia (540 | 0.6%), Caribbean (411 | 0.5%), Cuba (411 | 0.5%), and India (396 | 0.5%), together accounting for 3.1% of all Bullitt County residents.
| Immigration Origin | # Population | % Population |
| Africa | 384 | 0.5% |
| Asia | 540 | 0.6% |
| Belize | 15 | 0.0% |
| Bolivia | 16 | 0.0% |
| Bosnia and Herzegovina | 5 | 0.0% |
| Canada | 24 | 0.0% |
| Caribbean | 411 | 0.5% |
| Central America | 277 | 0.3% |
| Colombia | 36 | 0.0% |
| Cuba | 411 | 0.5% |
| Eastern Africa | 91 | 0.1% |
| Eastern Asia | 73 | 0.1% |
| Eastern Europe | 5 | 0.0% |
| Egypt | 8 | 0.0% |
| England | 51 | 0.1% |
| Europe | 265 | 0.3% |
| Germany | 52 | 0.1% |
| Ghana | 17 | 0.0% |
| Guatemala | 51 | 0.1% |
| Honduras | 10 | 0.0% |
| India | 396 | 0.5% |
| Iraq | 9 | 0.0% |
| Jordan | 12 | 0.0% |
| Korea | 73 | 0.1% |
| Latin America | 813 | 1.0% |
| Malaysia | 1 | 0.0% |
| Mexico | 201 | 0.2% |
| Middle Africa | 259 | 0.3% |
| Northern Africa | 8 | 0.0% |
| Northern Europe | 208 | 0.3% |
| Peru | 37 | 0.0% |
| Philippines | 46 | 0.1% |
| South America | 125 | 0.2% |
| South Central Asia | 396 | 0.5% |
| South Eastern Asia | 50 | 0.1% |
| Sweden | 27 | 0.0% |
| Thailand | 3 | 0.0% |
| Venezuela | 6 | 0.0% |
| Western Africa | 26 | 0.0% |
| Western Asia | 21 | 0.0% |
| Western Europe | 52 | 0.1% |
| Zaire | 259 | 0.3% | View All 42 Rows |
Sex and Age in Bullitt County
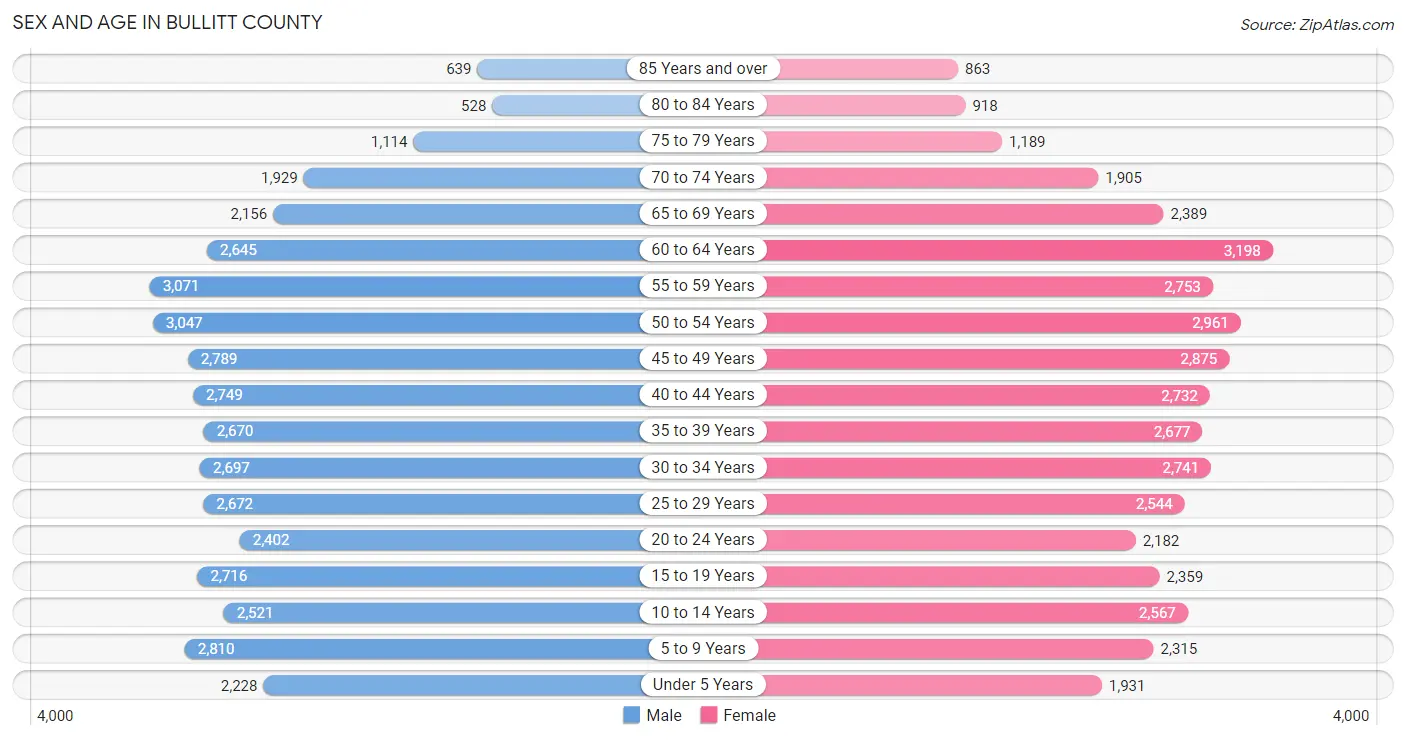
Sex and Age in Bullitt County
The most populous age groups in Bullitt County are 55 to 59 Years (3,071 | 7.4%) for men and 60 to 64 Years (3,198 | 7.8%) for women.
| Age Bracket | Male | Female |
| Under 5 Years | 2,228 (5.4%) | 1,931 (4.7%) |
| 5 to 9 Years | 2,810 (6.8%) | 2,315 (5.6%) |
| 10 to 14 Years | 2,521 (6.1%) | 2,567 (6.2%) |
| 15 to 19 Years | 2,716 (6.6%) | 2,359 (5.7%) |
| 20 to 24 Years | 2,402 (5.8%) | 2,182 (5.3%) |
| 25 to 29 Years | 2,672 (6.5%) | 2,544 (6.2%) |
| 30 to 34 Years | 2,697 (6.5%) | 2,741 (6.7%) |
| 35 to 39 Years | 2,670 (6.5%) | 2,677 (6.5%) |
| 40 to 44 Years | 2,749 (6.6%) | 2,732 (6.7%) |
| 45 to 49 Years | 2,789 (6.7%) | 2,875 (7.0%) |
| 50 to 54 Years | 3,047 (7.4%) | 2,961 (7.2%) |
| 55 to 59 Years | 3,071 (7.4%) | 2,753 (6.7%) |
| 60 to 64 Years | 2,645 (6.4%) | 3,198 (7.8%) |
| 65 to 69 Years | 2,156 (5.2%) | 2,389 (5.8%) |
| 70 to 74 Years | 1,929 (4.7%) | 1,905 (4.6%) |
| 75 to 79 Years | 1,114 (2.7%) | 1,189 (2.9%) |
| 80 to 84 Years | 528 (1.3%) | 918 (2.2%) |
| 85 Years and over | 639 (1.5%) | 863 (2.1%) |
| Total | 41,383 (100.0%) | 41,099 (100.0%) |
Families and Households in Bullitt County
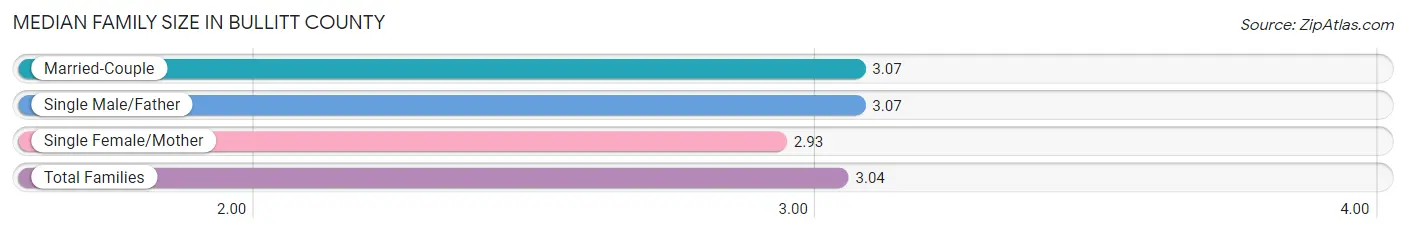
Median Family Size in Bullitt County
The median family size in Bullitt County is 3.04 persons per family, with married-couple families (17,536 | 76.2%) accounting for the largest median family size of 3.07 persons per family. On the other hand, single female/mother families (3,646 | 15.8%) represent the smallest median family size with 2.93 persons per family.
| Family Type | # Families | Family Size |
| Married-Couple | 17,536 (76.2%) | 3.07 |
| Single Male/Father | 1,831 (8.0%) | 3.07 |
| Single Female/Mother | 3,646 (15.8%) | 2.93 |
| Total Families | 23,013 (100.0%) | 3.04 |
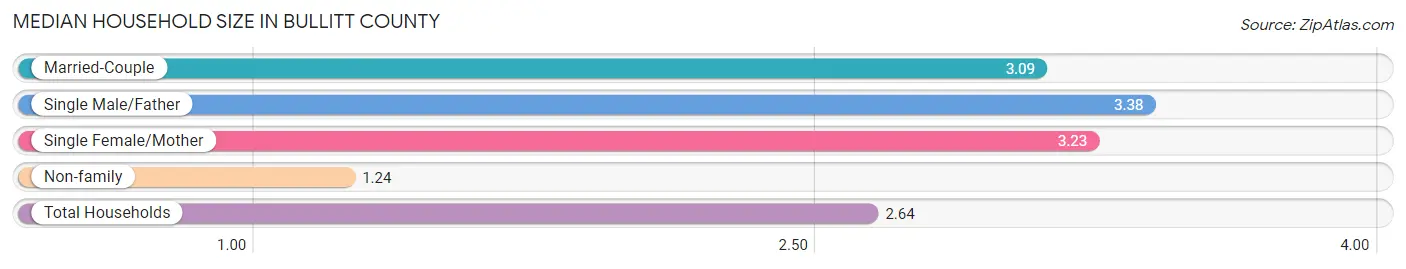
Median Household Size in Bullitt County
The median household size in Bullitt County is 2.64 persons per household, with single male/father households (1,831 | 5.9%) accounting for the largest median household size of 3.38 persons per household. non-family households (8,055 | 25.9%) represent the smallest median household size with 1.24 persons per household.
| Household Type | # Households | Household Size |
| Married-Couple | 17,536 (56.4%) | 3.09 |
| Single Male/Father | 1,831 (5.9%) | 3.38 |
| Single Female/Mother | 3,646 (11.7%) | 3.23 |
| Non-family | 8,055 (25.9%) | 1.24 |
| Total Households | 31,068 (100.0%) | 2.64 |
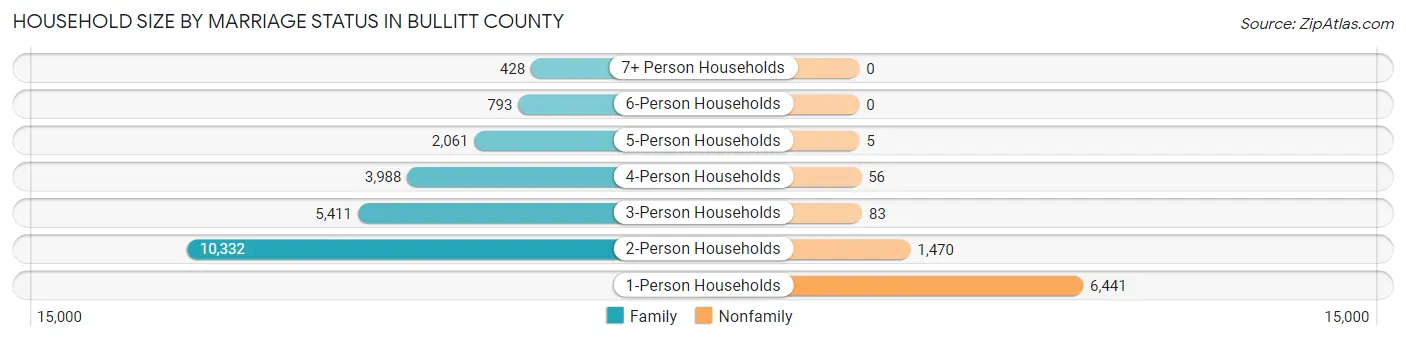
Household Size by Marriage Status in Bullitt County
Out of a total of 31,068 households in Bullitt County, 23,013 (74.1%) are family households, while 8,055 (25.9%) are nonfamily households. The most numerous type of family households are 2-person households, comprising 10,332, and the most common type of nonfamily households are 1-person households, comprising 6,441.
| Household Size | Family Households | Nonfamily Households |
| 1-Person Households | - | 6,441 (20.7%) |
| 2-Person Households | 10,332 (33.3%) | 1,470 (4.7%) |
| 3-Person Households | 5,411 (17.4%) | 83 (0.3%) |
| 4-Person Households | 3,988 (12.8%) | 56 (0.2%) |
| 5-Person Households | 2,061 (6.6%) | 5 (0.0%) |
| 6-Person Households | 793 (2.5%) | 0 (0.0%) |
| 7+ Person Households | 428 (1.4%) | 0 (0.0%) |
| Total | 23,013 (74.1%) | 8,055 (25.9%) |
Female Fertility in Bullitt County
Fertility by Age in Bullitt County
Average fertility rate in Bullitt County is 47.0 births per 1,000 women. Women in the age bracket of 20 to 34 years have the highest fertility rate with 93.0 births per 1,000 women. Women in the age bracket of 20 to 34 years acount for 80.6% of all women with births.
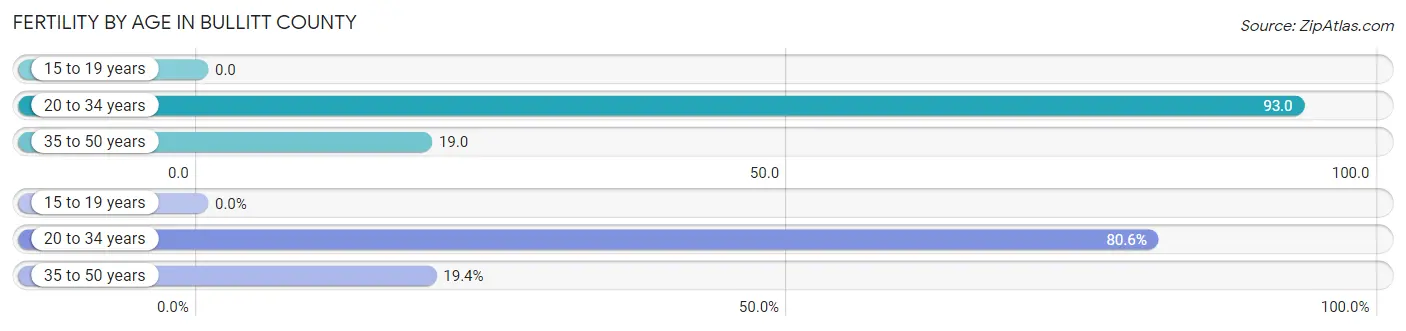
| Age Bracket | Women with Births | Births / 1,000 Women |
| 15 to 19 years | 0 (0.0%) | 0.0 |
| 20 to 34 years | 695 (80.6%) | 93.0 |
| 35 to 50 years | 167 (19.4%) | 19.0 |
| Total | 862 (100.0%) | 47.0 |
Fertility by Age by Marriage Status in Bullitt County
68.2% of women with births (862) in Bullitt County are married. The highest percentage of unmarried women with births falls into 35 to 50 years age bracket with 40.1% of them unmarried at the time of birth, while the lowest percentage of unmarried women with births belong to 20 to 34 years age bracket with 29.8% of them unmarried.
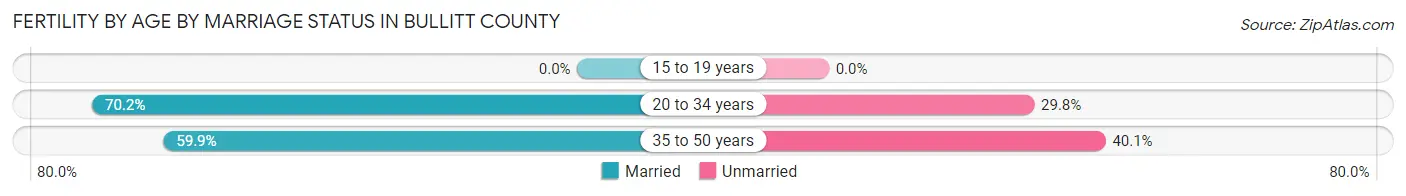
| Age Bracket | Married | Unmarried |
| 15 to 19 years | 0 (0.0%) | 0 (0.0%) |
| 20 to 34 years | 488 (70.2%) | 207 (29.8%) |
| 35 to 50 years | 100 (59.9%) | 67 (40.1%) |
| Total | 588 (68.2%) | 274 (31.8%) |
Fertility by Education in Bullitt County
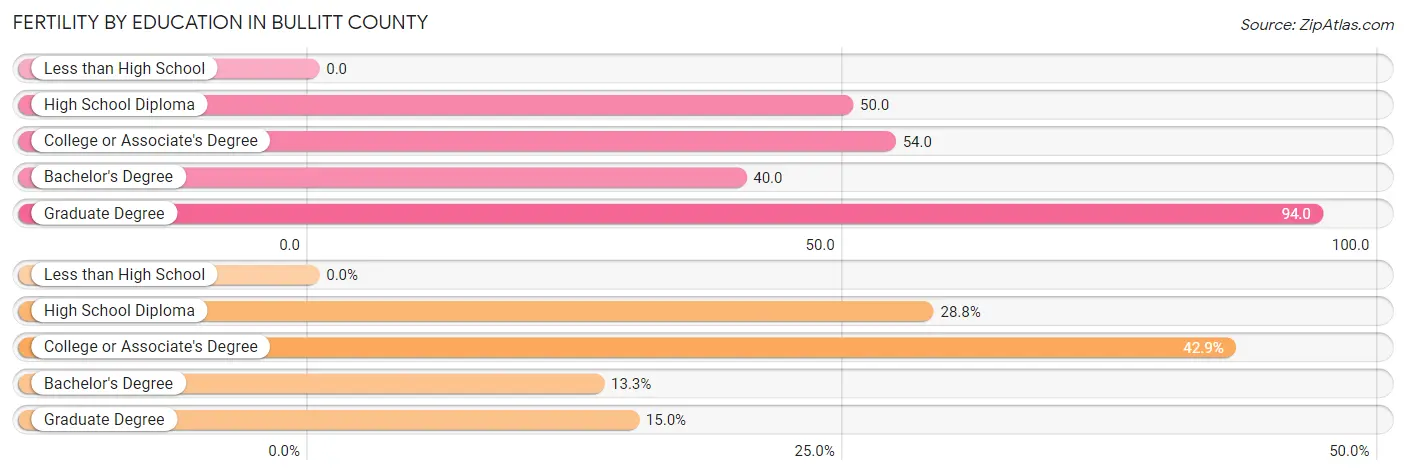
| Educational Attainment | Women with Births | Births / 1,000 Women |
| Less than High School | 0 (0.0%) | 0.0 |
| High School Diploma | 248 (28.8%) | 50.0 |
| College or Associate's Degree | 370 (42.9%) | 54.0 |
| Bachelor's Degree | 115 (13.3%) | 40.0 |
| Graduate Degree | 129 (15.0%) | 94.0 |
| Total | 862 (100.0%) | 47.0 |
Fertility by Education by Marriage Status in Bullitt County
31.8% of women with births in Bullitt County are unmarried. Women with the educational attainment of graduate degree are most likely to be married with 100.0% of them married at childbirth, while women with the educational attainment of high school diploma are least likely to be married with 46.8% of them unmarried at childbirth.
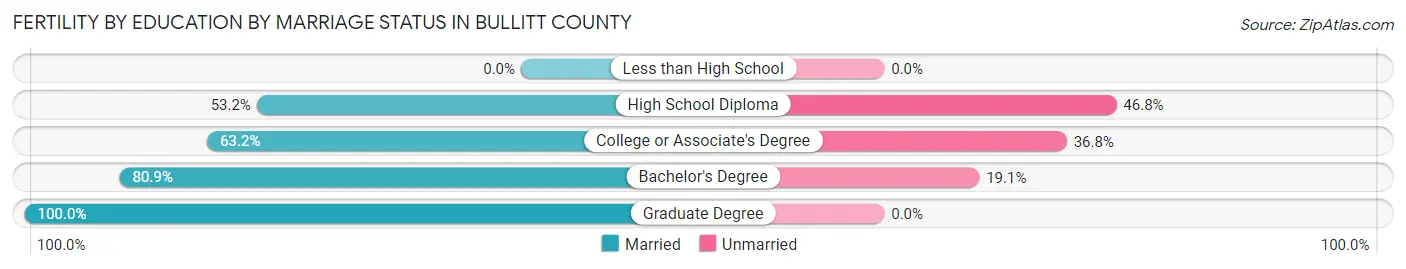
| Educational Attainment | Married | Unmarried |
| Less than High School | 0 (0.0%) | 0 (0.0%) |
| High School Diploma | 132 (53.2%) | 116 (46.8%) |
| College or Associate's Degree | 234 (63.2%) | 136 (36.8%) |
| Bachelor's Degree | 93 (80.9%) | 22 (19.1%) |
| Graduate Degree | 129 (100.0%) | 0 (0.0%) |
| Total | 588 (68.2%) | 274 (31.8%) |
Income in Bullitt County
Income Overview in Bullitt County
Per Capita Income in Bullitt County is $34,362, while median incomes of families and households are $85,180 and $73,900 respectively.
| Characteristic | Number | Measure |
| Per Capita Income | 82,482 | $34,362 |
| Median Family Income | 23,013 | $85,180 |
| Mean Family Income | 23,013 | $98,288 |
| Median Household Income | 31,068 | $73,900 |
| Mean Household Income | 31,068 | $88,496 |
| Income Deficit | 23,013 | $9,130 |
| Wage / Income Gap (%) | 82,482 | 28.74% |
| Wage / Income Gap ($) | 82,482 | 71.26¢ per $1 |
| Gini / Inequality Index | 82,482 | 0.39 |
Earnings by Sex in Bullitt County
Average Earnings in Bullitt County are $41,023, $49,101 for men and $34,990 for women, a difference of 28.7%.
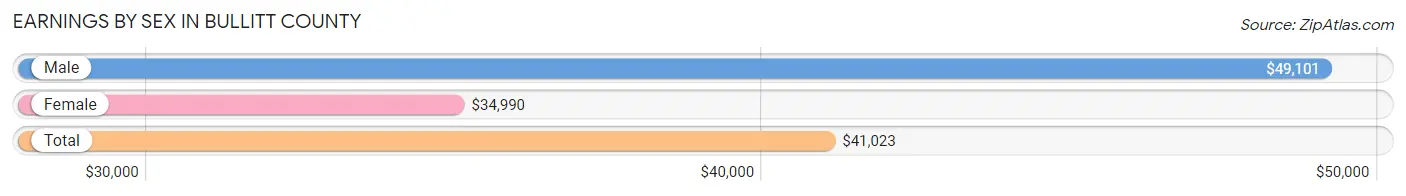
| Sex | Number | Average Earnings |
| Male | 23,845 (52.9%) | $49,101 |
| Female | 21,217 (47.1%) | $34,990 |
| Total | 45,062 (100.0%) | $41,023 |
Earnings by Sex by Income Bracket in Bullitt County
The most common earnings brackets in Bullitt County are $75,000 to $99,999 for men (3,054 | 12.8%) and $30,000 to $34,999 for women (2,107 | 9.9%).
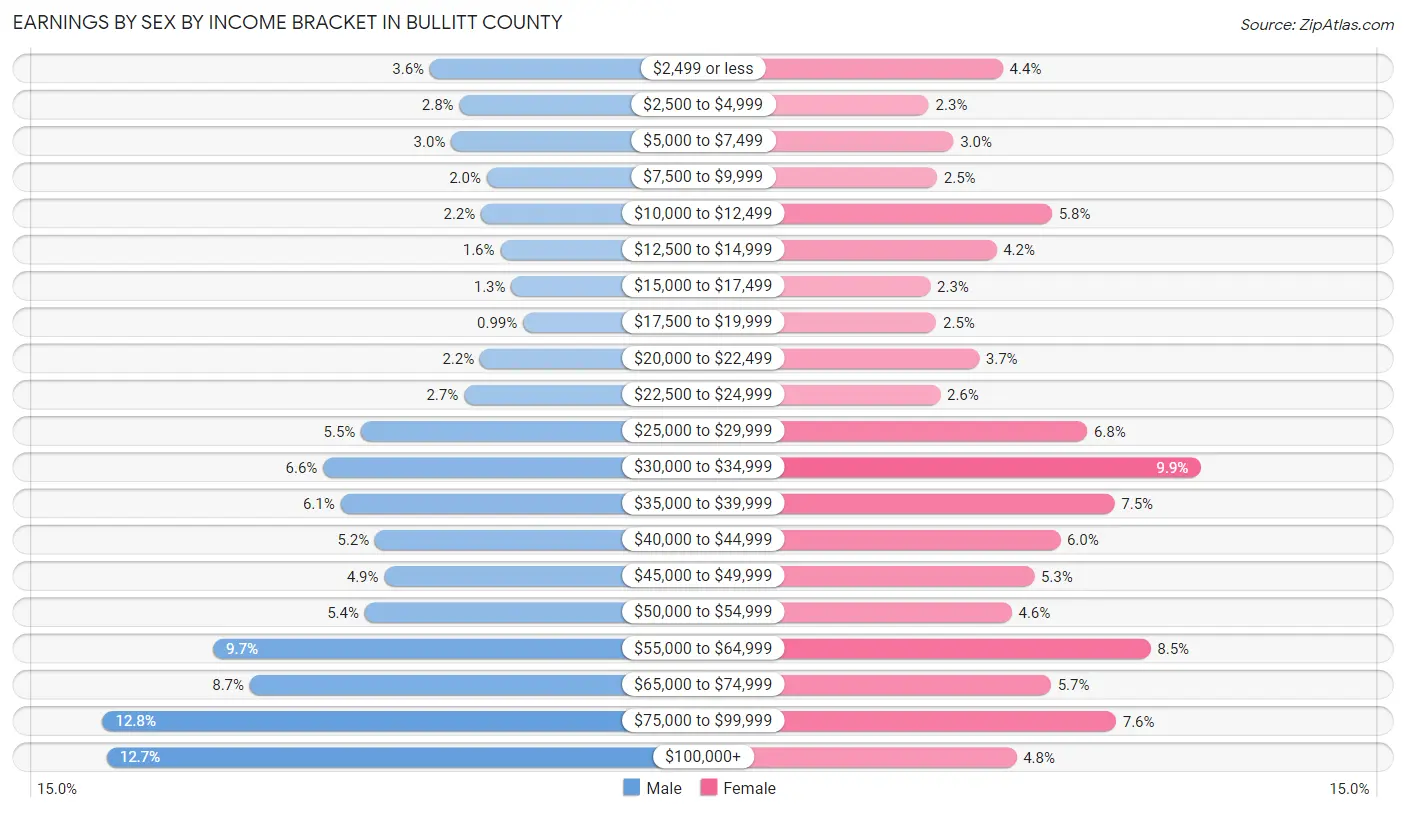
| Income | Male | Female |
| $2,499 or less | 861 (3.6%) | 930 (4.4%) |
| $2,500 to $4,999 | 664 (2.8%) | 487 (2.3%) |
| $5,000 to $7,499 | 717 (3.0%) | 635 (3.0%) |
| $7,500 to $9,999 | 480 (2.0%) | 536 (2.5%) |
| $10,000 to $12,499 | 518 (2.2%) | 1,223 (5.8%) |
| $12,500 to $14,999 | 389 (1.6%) | 891 (4.2%) |
| $15,000 to $17,499 | 315 (1.3%) | 497 (2.3%) |
| $17,500 to $19,999 | 235 (1.0%) | 533 (2.5%) |
| $20,000 to $22,499 | 524 (2.2%) | 787 (3.7%) |
| $22,500 to $24,999 | 633 (2.6%) | 556 (2.6%) |
| $25,000 to $29,999 | 1,321 (5.5%) | 1,432 (6.8%) |
| $30,000 to $34,999 | 1,576 (6.6%) | 2,107 (9.9%) |
| $35,000 to $39,999 | 1,460 (6.1%) | 1,596 (7.5%) |
| $40,000 to $44,999 | 1,228 (5.1%) | 1,270 (6.0%) |
| $45,000 to $49,999 | 1,167 (4.9%) | 1,115 (5.3%) |
| $50,000 to $54,999 | 1,298 (5.4%) | 982 (4.6%) |
| $55,000 to $64,999 | 2,312 (9.7%) | 1,810 (8.5%) |
| $65,000 to $74,999 | 2,068 (8.7%) | 1,216 (5.7%) |
| $75,000 to $99,999 | 3,054 (12.8%) | 1,605 (7.6%) |
| $100,000+ | 3,025 (12.7%) | 1,009 (4.8%) |
| Total | 23,845 (100.0%) | 21,217 (100.0%) |
Earnings by Sex by Educational Attainment in Bullitt County
Average earnings in Bullitt County are $55,019 for men and $39,258 for women, a difference of 28.6%. Men with an educational attainment of graduate degree enjoy the highest average annual earnings of $82,321, while those with less than high school education earn the least with $33,017. Women with an educational attainment of graduate degree earn the most with the average annual earnings of $64,673, while those with less than high school education have the smallest earnings of $31,175.
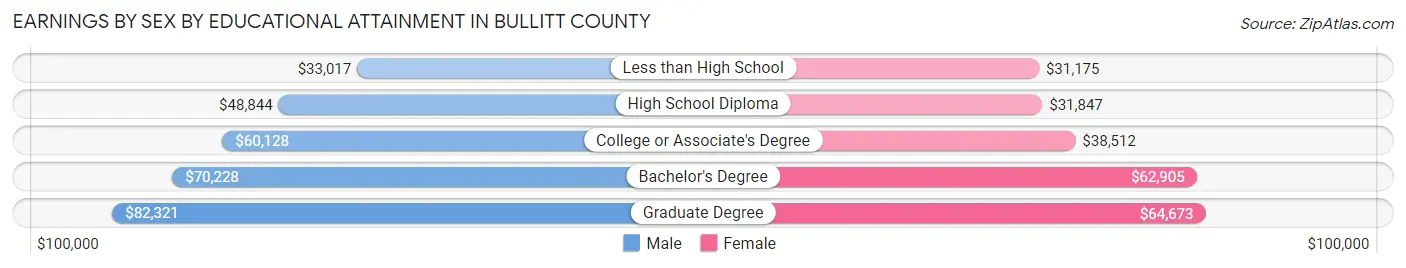
| Educational Attainment | Male Income | Female Income |
| Less than High School | $33,017 | $31,175 |
| High School Diploma | $48,844 | $31,847 |
| College or Associate's Degree | $60,128 | $38,512 |
| Bachelor's Degree | $70,228 | $62,905 |
| Graduate Degree | $82,321 | $64,673 |
| Total | $55,019 | $39,258 |
Family Income in Bullitt County
Family Income Brackets in Bullitt County
According to the Bullitt County family income data, there are 5,408 families falling into the $100,000 to $149,999 income range, which is the most common income bracket and makes up 23.5% of all families. Conversely, the $10,000 to $14,999 income bracket is the least frequent group with only 437 families (1.9%) belonging to this category.
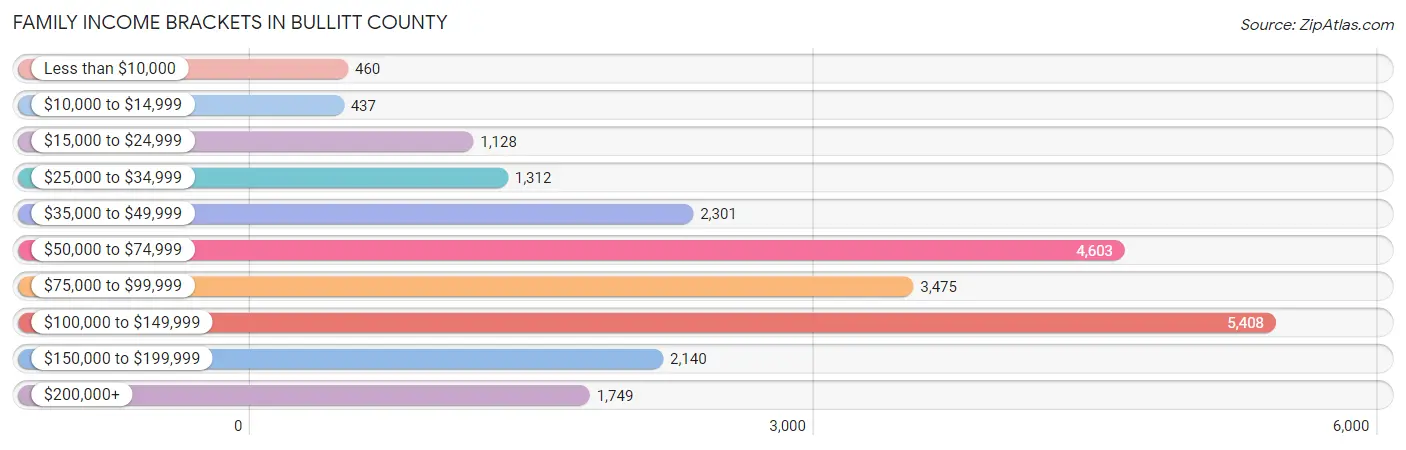
| Income Bracket | # Families | % Families |
| Less than $10,000 | 460 | 2.0% |
| $10,000 to $14,999 | 437 | 1.9% |
| $15,000 to $24,999 | 1,128 | 4.9% |
| $25,000 to $34,999 | 1,312 | 5.7% |
| $35,000 to $49,999 | 2,301 | 10.0% |
| $50,000 to $74,999 | 4,603 | 20.0% |
| $75,000 to $99,999 | 3,475 | 15.1% |
| $100,000 to $149,999 | 5,408 | 23.5% |
| $150,000 to $199,999 | 2,140 | 9.3% |
| $200,000+ | 1,749 | 7.6% |
Family Income by Famaliy Size in Bullitt County
4-person families (3,629 | 15.8%) account for the highest median family income in Bullitt County with $118,732 per family, while 2-person families (10,803 | 46.9%) have the highest median income of $35,287 per family member.
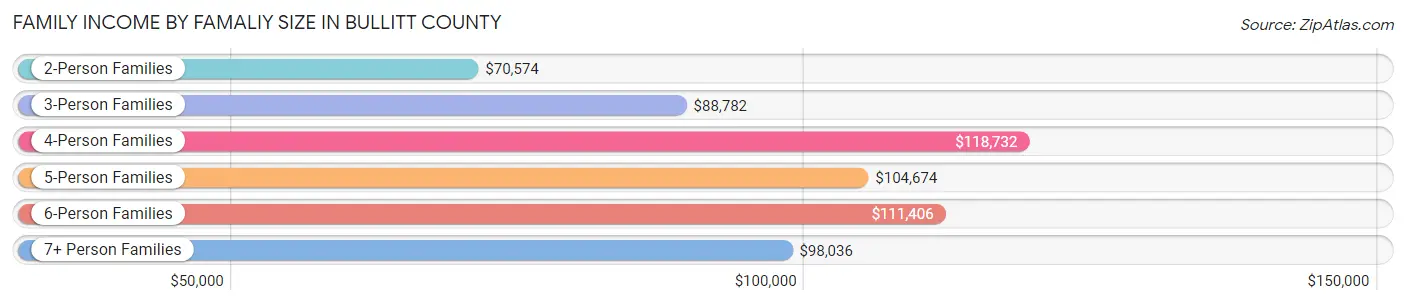
| Income Bracket | # Families | Median Income |
| 2-Person Families | 10,803 (46.9%) | $70,574 |
| 3-Person Families | 5,685 (24.7%) | $88,782 |
| 4-Person Families | 3,629 (15.8%) | $118,732 |
| 5-Person Families | 1,979 (8.6%) | $104,674 |
| 6-Person Families | 547 (2.4%) | $111,406 |
| 7+ Person Families | 370 (1.6%) | $98,036 |
| Total | 23,013 (100.0%) | $85,180 |
Family Income by Number of Earners in Bullitt County
The median family income in Bullitt County is $85,180, with families comprising 3+ earners (2,955) having the highest median family income of $146,197, while families with no earners (3,576) have the lowest median family income of $42,365, accounting for 12.8% and 15.5% of families, respectively.
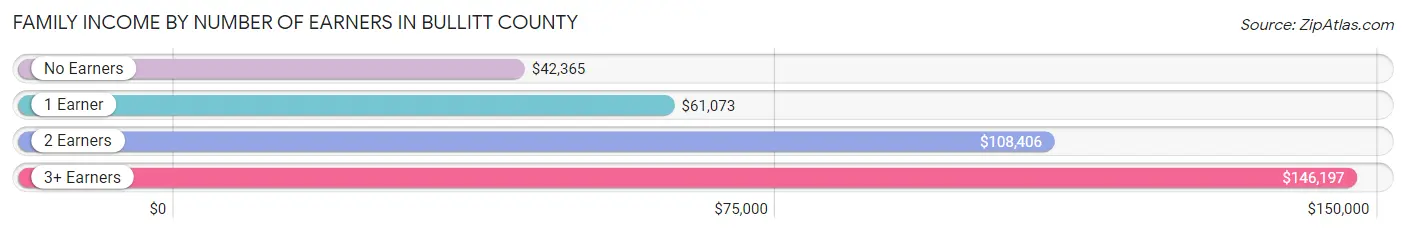
| Number of Earners | # Families | Median Income |
| No Earners | 3,576 (15.5%) | $42,365 |
| 1 Earner | 7,002 (30.4%) | $61,073 |
| 2 Earners | 9,480 (41.2%) | $108,406 |
| 3+ Earners | 2,955 (12.8%) | $146,197 |
| Total | 23,013 (100.0%) | $85,180 |
Household Income in Bullitt County
Household Income Brackets in Bullitt County
With 6,214 households falling in the category, the $100,000 to $149,999 income range is the most frequent in Bullitt County, accounting for 20.0% of all households. In contrast, only 1,025 households (3.3%) fall into the $10,000 to $14,999 income bracket, making it the least populous group.
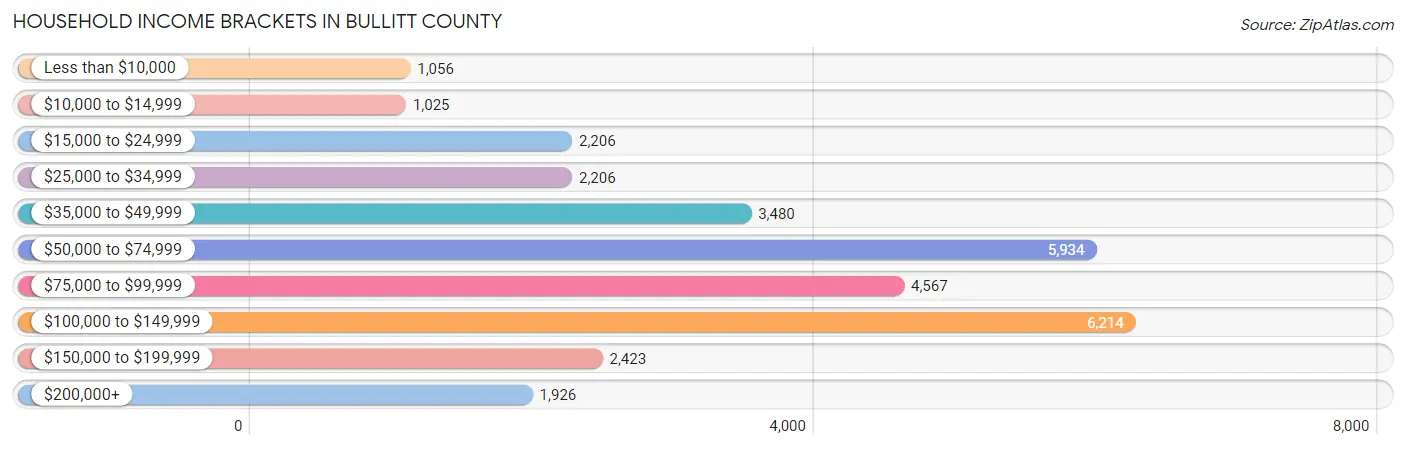
| Income Bracket | # Households | % Households |
| Less than $10,000 | 1,056 | 3.4% |
| $10,000 to $14,999 | 1,025 | 3.3% |
| $15,000 to $24,999 | 2,206 | 7.1% |
| $25,000 to $34,999 | 2,206 | 7.1% |
| $35,000 to $49,999 | 3,480 | 11.2% |
| $50,000 to $74,999 | 5,934 | 19.1% |
| $75,000 to $99,999 | 4,567 | 14.7% |
| $100,000 to $149,999 | 6,214 | 20.0% |
| $150,000 to $199,999 | 2,423 | 7.8% |
| $200,000+ | 1,926 | 6.2% |
Household Income by Householder Age in Bullitt County
The median household income in Bullitt County is $73,900, with the highest median household income of $86,656 found in the 45 to 64 years age bracket for the primary householder. A total of 12,350 households (39.8%) fall into this category. Meanwhile, the 65+ years age bracket for the primary householder has the lowest median household income of $51,175, with 8,200 households (26.4%) in this group.
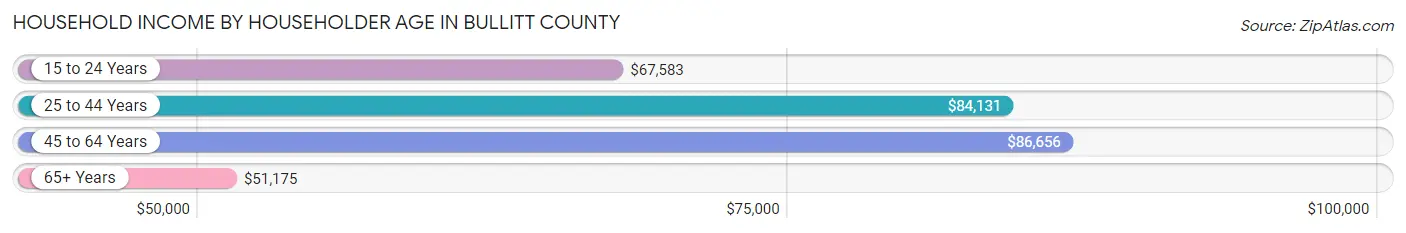
| Income Bracket | # Households | Median Income |
| 15 to 24 Years | 667 (2.1%) | $67,583 |
| 25 to 44 Years | 9,851 (31.7%) | $84,131 |
| 45 to 64 Years | 12,350 (39.8%) | $86,656 |
| 65+ Years | 8,200 (26.4%) | $51,175 |
| Total | 31,068 (100.0%) | $73,900 |
Poverty in Bullitt County
Income Below Poverty by Sex and Age in Bullitt County
With 8.1% poverty level for males and 13.1% for females among the residents of Bullitt County, under 5 year old males and 6 to 11 year old females are the most vulnerable to poverty, with 452 males (20.3%) and 758 females (27.4%) in their respective age groups living below the poverty level.
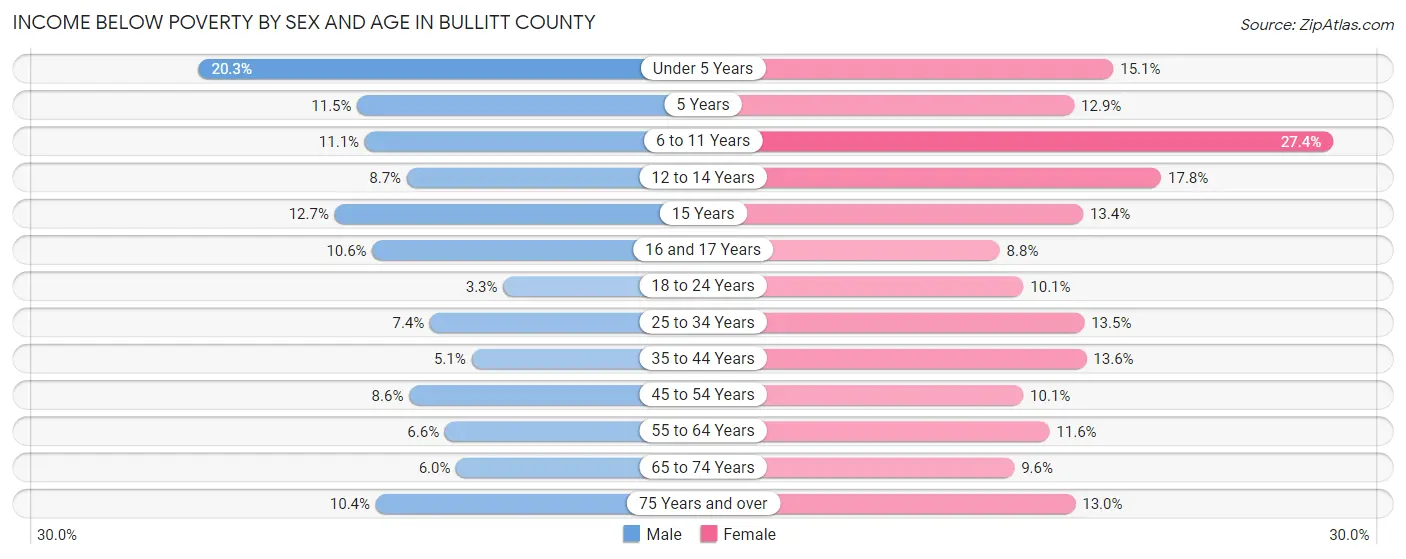
| Age Bracket | Male | Female |
| Under 5 Years | 452 (20.3%) | 292 (15.1%) |
| 5 Years | 43 (11.5%) | 55 (12.9%) |
| 6 to 11 Years | 359 (11.1%) | 758 (27.4%) |
| 12 to 14 Years | 139 (8.7%) | 277 (17.8%) |
| 15 Years | 35 (12.7%) | 54 (13.4%) |
| 16 and 17 Years | 156 (10.6%) | 103 (8.8%) |
| 18 to 24 Years | 112 (3.3%) | 300 (10.1%) |
| 25 to 34 Years | 395 (7.4%) | 711 (13.5%) |
| 35 to 44 Years | 273 (5.1%) | 732 (13.6%) |
| 45 to 54 Years | 499 (8.6%) | 589 (10.1%) |
| 55 to 64 Years | 376 (6.6%) | 688 (11.6%) |
| 65 to 74 Years | 243 (6.0%) | 411 (9.6%) |
| 75 Years and over | 235 (10.4%) | 380 (13.0%) |
| Total | 3,317 (8.1%) | 5,350 (13.1%) |
Income Above Poverty by Sex and Age in Bullitt County
According to the poverty statistics in Bullitt County, males aged 18 to 24 years and females aged 16 and 17 years are the age groups that are most secure financially, with 96.7% of males and 91.2% of females in these age groups living above the poverty line.
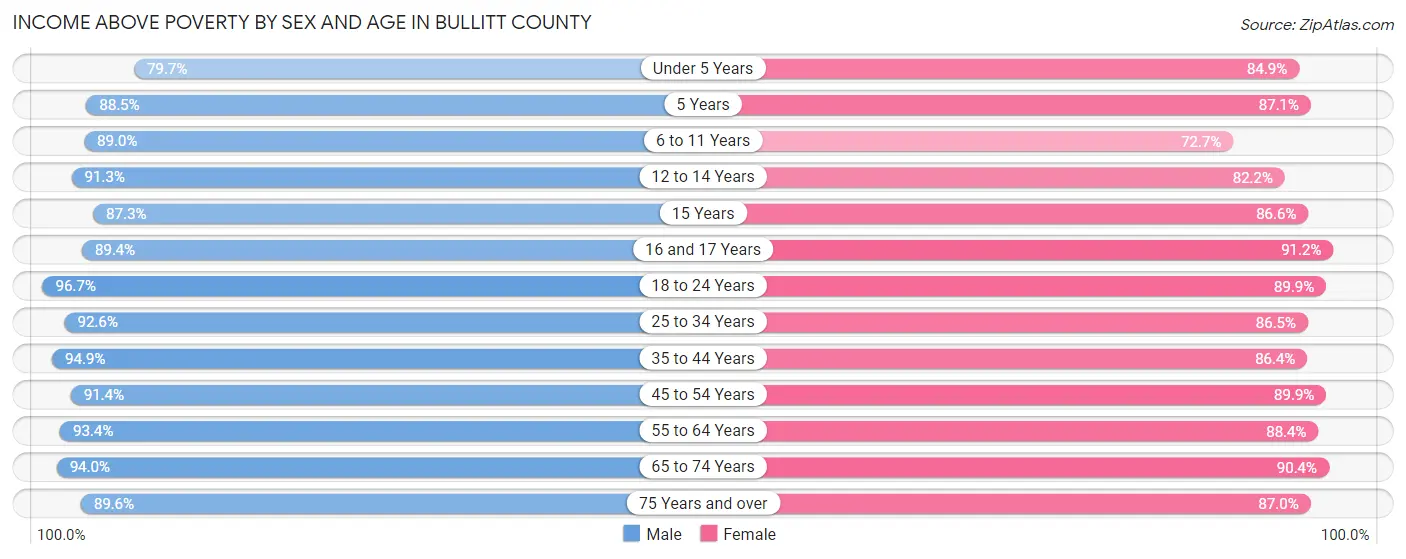
| Age Bracket | Male | Female |
| Under 5 Years | 1,773 (79.7%) | 1,639 (84.9%) |
| 5 Years | 332 (88.5%) | 370 (87.1%) |
| 6 to 11 Years | 2,891 (88.9%) | 2,013 (72.7%) |
| 12 to 14 Years | 1,456 (91.3%) | 1,281 (82.2%) |
| 15 Years | 240 (87.3%) | 348 (86.6%) |
| 16 and 17 Years | 1,312 (89.4%) | 1,069 (91.2%) |
| 18 to 24 Years | 3,242 (96.7%) | 2,667 (89.9%) |
| 25 to 34 Years | 4,927 (92.6%) | 4,554 (86.5%) |
| 35 to 44 Years | 5,068 (94.9%) | 4,642 (86.4%) |
| 45 to 54 Years | 5,317 (91.4%) | 5,243 (89.9%) |
| 55 to 64 Years | 5,329 (93.4%) | 5,263 (88.4%) |
| 65 to 74 Years | 3,832 (94.0%) | 3,872 (90.4%) |
| 75 Years and over | 2,015 (89.6%) | 2,543 (87.0%) |
| Total | 37,734 (91.9%) | 35,504 (86.9%) |
Income Below Poverty Among Married-Couple Families in Bullitt County
The poverty statistics for married-couple families in Bullitt County show that 5.4% or 956 of the total 17,536 families live below the poverty line. Families with 5 or more children have the highest poverty rate of 40.2%, comprising of 111 families. On the other hand, families with no children have the lowest poverty rate of 4.4%, which includes 481 families.
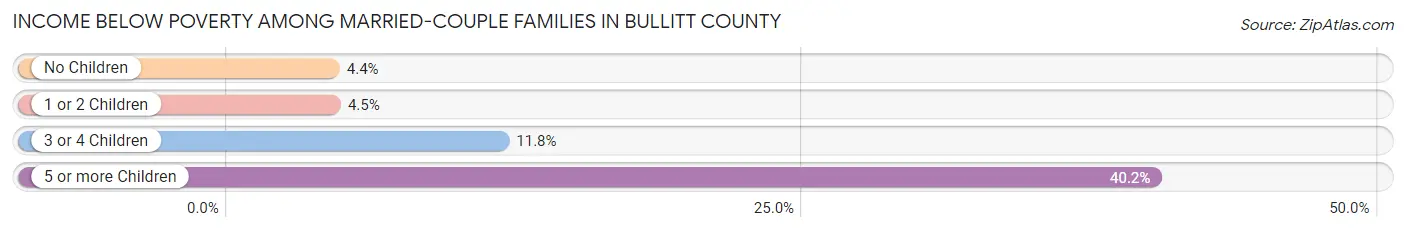
| Children | Above Poverty | Below Poverty |
| No Children | 10,367 (95.6%) | 481 (4.4%) |
| 1 or 2 Children | 5,122 (95.5%) | 240 (4.5%) |
| 3 or 4 Children | 926 (88.2%) | 124 (11.8%) |
| 5 or more Children | 165 (59.8%) | 111 (40.2%) |
| Total | 16,580 (94.6%) | 956 (5.4%) |
Income Below Poverty Among Single-Parent Households in Bullitt County
According to the poverty data in Bullitt County, 7.5% or 137 single-father households and 22.5% or 819 single-mother households are living below the poverty line. Among single-father households, those with 3 or 4 children have the highest poverty rate, with 32 households (14.5%) experiencing poverty. Likewise, among single-mother households, those with 3 or 4 children have the highest poverty rate, with 188 households (51.9%) falling below the poverty line.
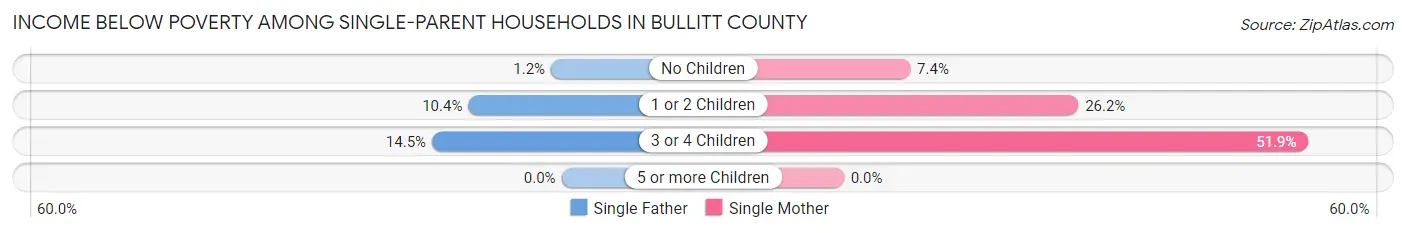
| Children | Single Father | Single Mother |
| No Children | 8 (1.2%) | 91 (7.4%) |
| 1 or 2 Children | 97 (10.4%) | 540 (26.2%) |
| 3 or 4 Children | 32 (14.5%) | 188 (51.9%) |
| 5 or more Children | 0 (0.0%) | 0 (0.0%) |
| Total | 137 (7.5%) | 819 (22.5%) |
Income Below Poverty Among Married-Couple vs Single-Parent Households in Bullitt County
The poverty data for Bullitt County shows that 956 of the married-couple family households (5.4%) and 956 of the single-parent households (17.4%) are living below the poverty level. Within the married-couple family households, those with 5 or more children have the highest poverty rate, with 111 households (40.2%) falling below the poverty line. Among the single-parent households, those with 3 or 4 children have the highest poverty rate, with 220 household (37.7%) living below poverty.
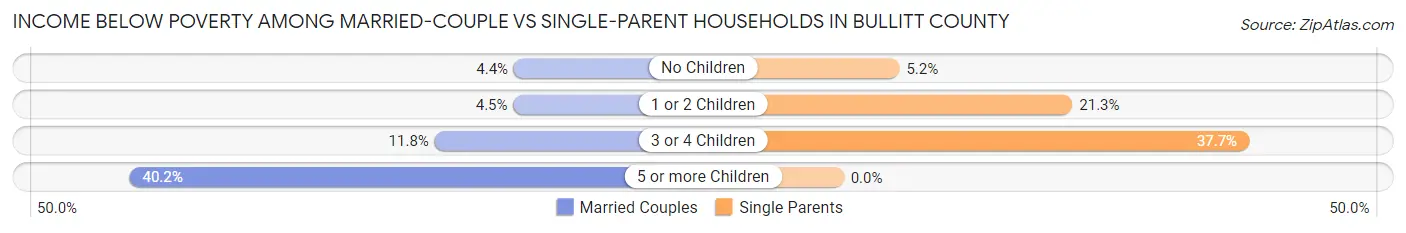
| Children | Married-Couple Families | Single-Parent Households |
| No Children | 481 (4.4%) | 99 (5.2%) |
| 1 or 2 Children | 240 (4.5%) | 637 (21.3%) |
| 3 or 4 Children | 124 (11.8%) | 220 (37.7%) |
| 5 or more Children | 111 (40.2%) | 0 (0.0%) |
| Total | 956 (5.4%) | 956 (17.4%) |
Employment Characteristics in Bullitt County
Employment by Class of Employer in Bullitt County
Among the 40,309 employed individuals in Bullitt County, private company employees (30,723 | 76.2%), local government employees (3,108 | 7.7%), and not-for-profit organizations (1,797 | 4.5%) make up the most common classes of employment.
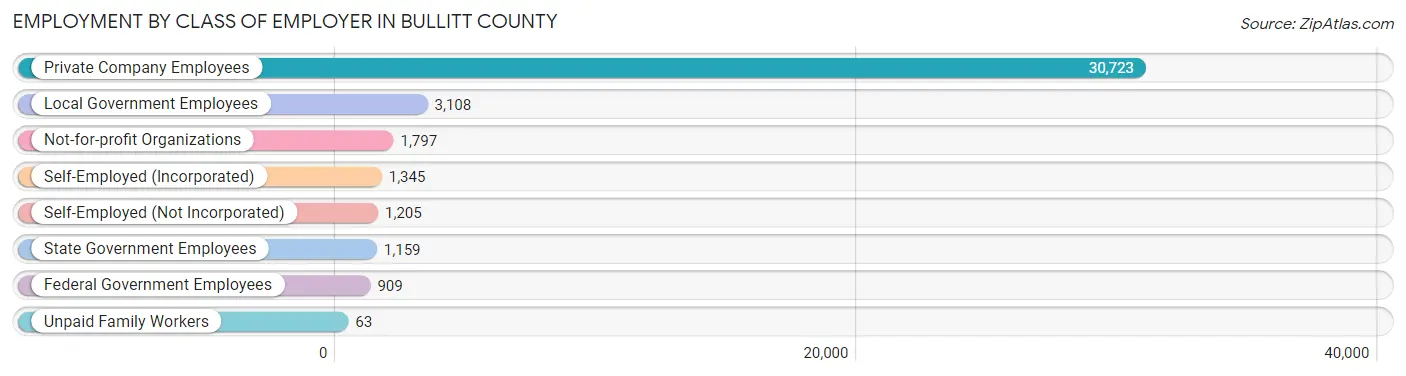
| Employer Class | # Employees | % Employees |
| Private Company Employees | 30,723 | 76.2% |
| Self-Employed (Incorporated) | 1,345 | 3.3% |
| Self-Employed (Not Incorporated) | 1,205 | 3.0% |
| Not-for-profit Organizations | 1,797 | 4.5% |
| Local Government Employees | 3,108 | 7.7% |
| State Government Employees | 1,159 | 2.9% |
| Federal Government Employees | 909 | 2.3% |
| Unpaid Family Workers | 63 | 0.2% |
| Total | 40,309 | 100.0% |
Employment Status by Age in Bullitt County
According to the labor force statistics for Bullitt County, out of the total population over 16 years of age (67,433), 64.0% or 43,157 individuals are in the labor force, with 4.6% or 1,985 of them unemployed. The age group with the highest labor force participation rate is 35 to 44 years, with 86.1% or 9,323 individuals in the labor force. Within the labor force, the 16 to 19 years age range has the highest percentage of unemployed individuals, with 16.4% or 323 of them being unemployed.
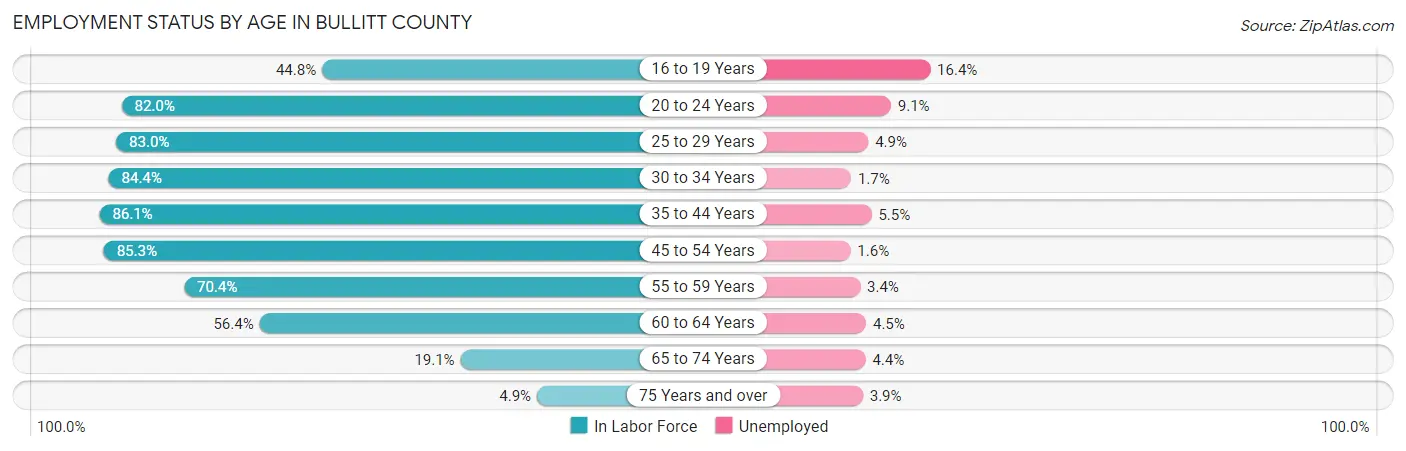
| Age Bracket | In Labor Force | Unemployed |
| 16 to 19 Years | 1,970 (44.8%) | 323 (16.4%) |
| 20 to 24 Years | 3,759 (82.0%) | 342 (9.1%) |
| 25 to 29 Years | 4,329 (83.0%) | 212 (4.9%) |
| 30 to 34 Years | 4,590 (84.4%) | 78 (1.7%) |
| 35 to 44 Years | 9,323 (86.1%) | 513 (5.5%) |
| 45 to 54 Years | 9,956 (85.3%) | 159 (1.6%) |
| 55 to 59 Years | 4,100 (70.4%) | 139 (3.4%) |
| 60 to 64 Years | 3,295 (56.4%) | 148 (4.5%) |
| 65 to 74 Years | 1,600 (19.1%) | 70 (4.4%) |
| 75 Years and over | 257 (4.9%) | 10 (3.9%) |
| Total | 43,157 (64.0%) | 1,985 (4.6%) |
Employment Status by Educational Attainment in Bullitt County
According to labor force statistics for Bullitt County, 79.4% of individuals (35,588) out of the total population between 25 and 64 years of age (44,821) are in the labor force, with 3.5% or 1,246 of them being unemployed. The group with the highest labor force participation rate are those with the educational attainment of bachelor's degree or higher, with 87.7% or 7,746 individuals in the labor force. Within the labor force, individuals with less than high school education have the highest percentage of unemployment, with 9.0% or 186 of them being unemployed.
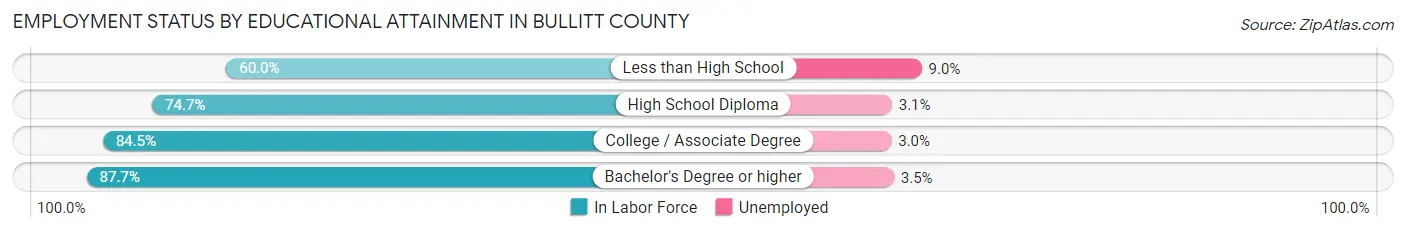
| Educational Attainment | In Labor Force | Unemployed |
| Less than High School | 2,063 (60.0%) | 310 (9.0%) |
| High School Diploma | 13,003 (74.7%) | 540 (3.1%) |
| College / Associate Degree | 12,796 (84.5%) | 454 (3.0%) |
| Bachelor's Degree or higher | 7,746 (87.7%) | 309 (3.5%) |
| Total | 35,588 (79.4%) | 1,569 (3.5%) |
Employment Occupations by Sex in Bullitt County
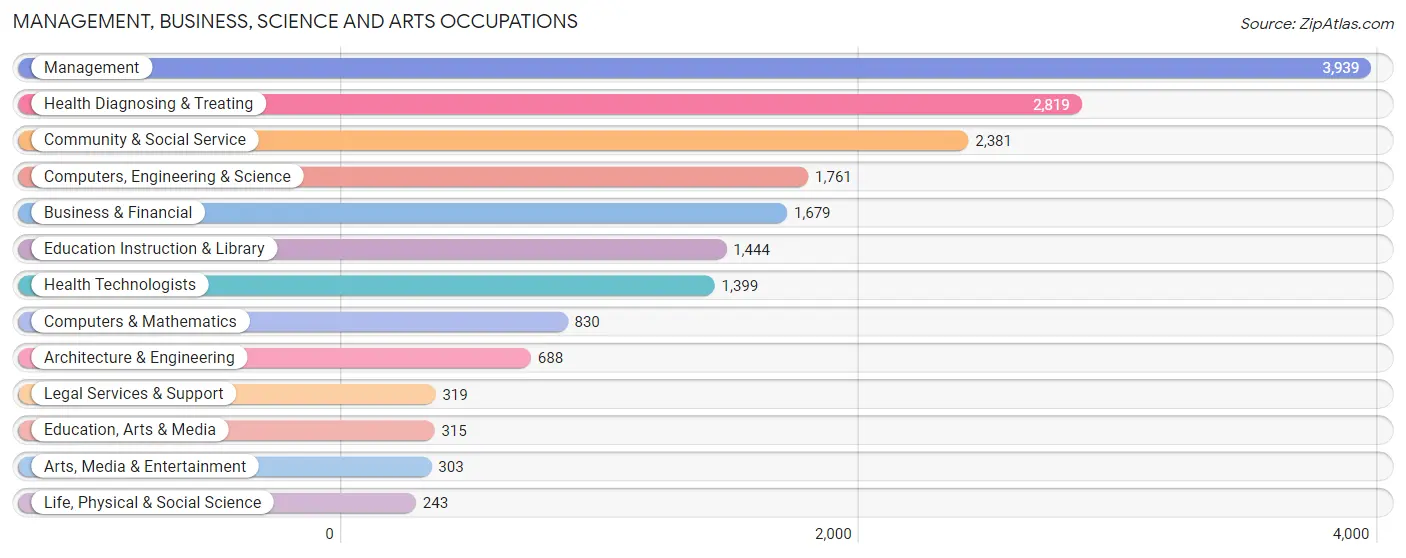
Management, Business, Science and Arts Occupations
The most common Management, Business, Science and Arts occupations in Bullitt County are Management (3,939 | 9.6%), Health Diagnosing & Treating (2,819 | 6.9%), Community & Social Service (2,381 | 5.8%), Computers, Engineering & Science (1,761 | 4.3%), and Business & Financial (1,679 | 4.1%).
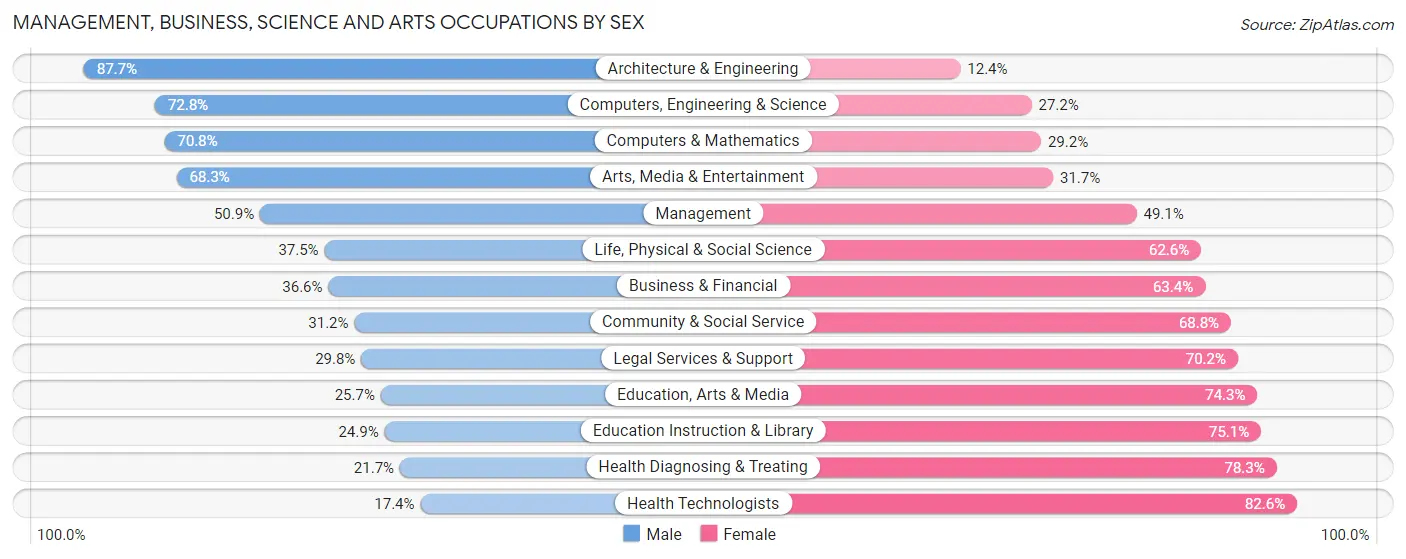
Management, Business, Science and Arts Occupations by Sex
Within the Management, Business, Science and Arts occupations in Bullitt County, the most male-oriented occupations are Architecture & Engineering (87.6%), Computers, Engineering & Science (72.8%), and Computers & Mathematics (70.8%), while the most female-oriented occupations are Health Technologists (82.6%), Health Diagnosing & Treating (78.3%), and Education Instruction & Library (75.1%).
| Occupation | Male | Female |
| Management | 2,005 (50.9%) | 1,934 (49.1%) |
| Business & Financial | 615 (36.6%) | 1,064 (63.4%) |
| Computers, Engineering & Science | 1,282 (72.8%) | 479 (27.2%) |
| Computers & Mathematics | 588 (70.8%) | 242 (29.2%) |
| Architecture & Engineering | 603 (87.6%) | 85 (12.3%) |
| Life, Physical & Social Science | 91 (37.4%) | 152 (62.5%) |
| Community & Social Service | 743 (31.2%) | 1,638 (68.8%) |
| Education, Arts & Media | 81 (25.7%) | 234 (74.3%) |
| Legal Services & Support | 95 (29.8%) | 224 (70.2%) |
| Education Instruction & Library | 360 (24.9%) | 1,084 (75.1%) |
| Arts, Media & Entertainment | 207 (68.3%) | 96 (31.7%) |
| Health Diagnosing & Treating | 612 (21.7%) | 2,207 (78.3%) |
| Health Technologists | 244 (17.4%) | 1,155 (82.6%) |
| Total (Category) | 5,257 (41.8%) | 7,322 (58.2%) |
| Total (Overall) | 21,933 (53.4%) | 19,167 (46.6%) |
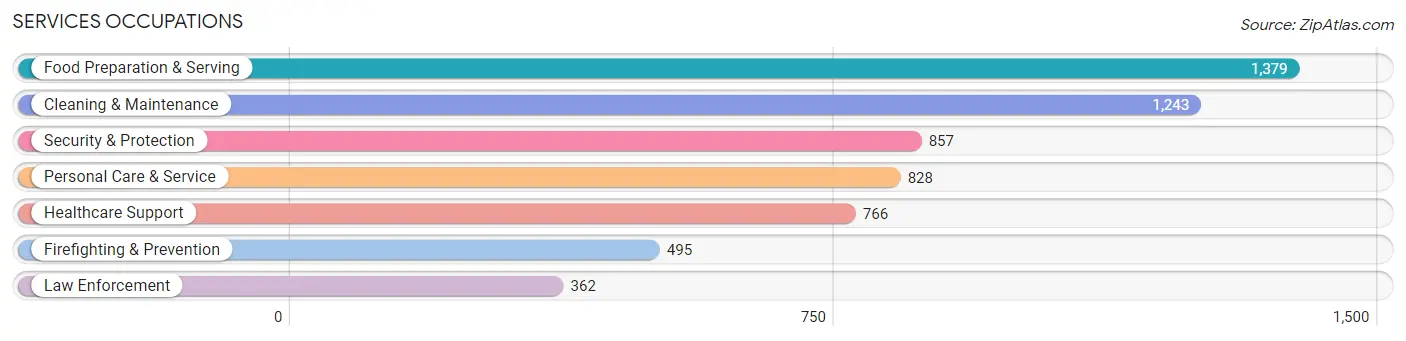
Services Occupations
The most common Services occupations in Bullitt County are Food Preparation & Serving (1,379 | 3.4%), Cleaning & Maintenance (1,243 | 3.0%), Security & Protection (857 | 2.1%), Personal Care & Service (828 | 2.0%), and Healthcare Support (766 | 1.9%).
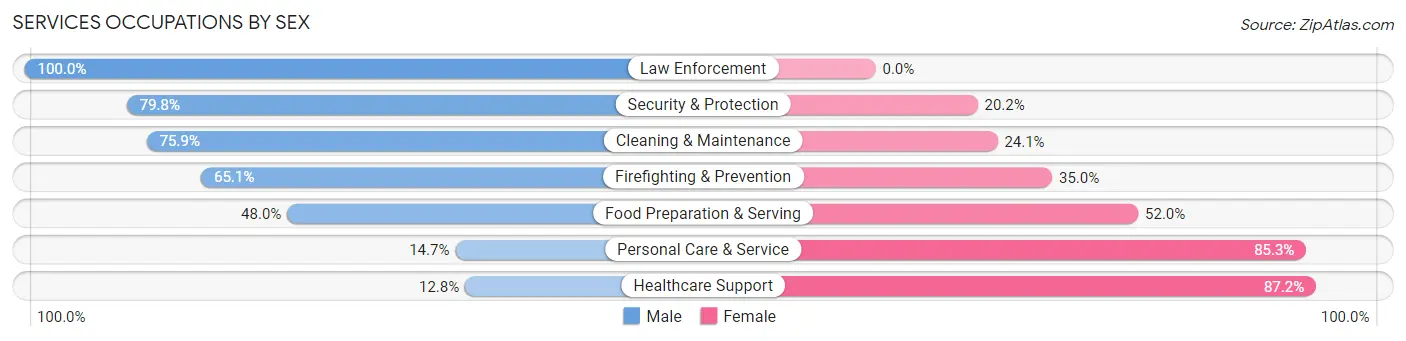
Services Occupations by Sex
Within the Services occupations in Bullitt County, the most male-oriented occupations are Law Enforcement (100.0%), Security & Protection (79.8%), and Cleaning & Maintenance (75.9%), while the most female-oriented occupations are Healthcare Support (87.2%), Personal Care & Service (85.3%), and Food Preparation & Serving (52.0%).
| Occupation | Male | Female |
| Healthcare Support | 98 (12.8%) | 668 (87.2%) |
| Security & Protection | 684 (79.8%) | 173 (20.2%) |
| Firefighting & Prevention | 322 (65.0%) | 173 (34.9%) |
| Law Enforcement | 362 (100.0%) | 0 (0.0%) |
| Food Preparation & Serving | 662 (48.0%) | 717 (52.0%) |
| Cleaning & Maintenance | 943 (75.9%) | 300 (24.1%) |
| Personal Care & Service | 122 (14.7%) | 706 (85.3%) |
| Total (Category) | 2,509 (49.5%) | 2,564 (50.5%) |
| Total (Overall) | 21,933 (53.4%) | 19,167 (46.6%) |
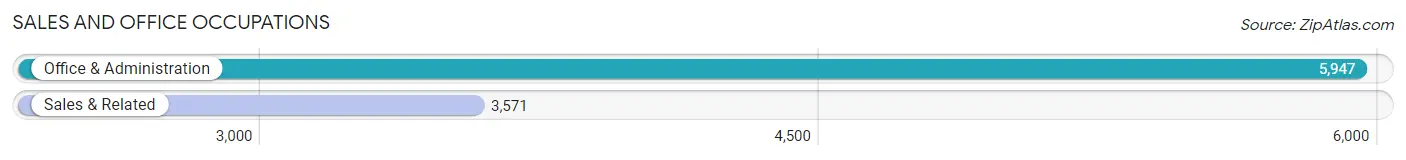
Sales and Office Occupations
The most common Sales and Office occupations in Bullitt County are Office & Administration (5,947 | 14.5%), and Sales & Related (3,571 | 8.7%).
Sales and Office Occupations by Sex
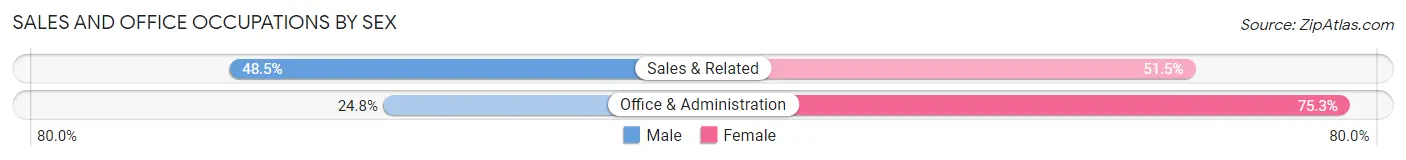
| Occupation | Male | Female |
| Sales & Related | 1,732 (48.5%) | 1,839 (51.5%) |
| Office & Administration | 1,472 (24.7%) | 4,475 (75.2%) |
| Total (Category) | 3,204 (33.7%) | 6,314 (66.3%) |
| Total (Overall) | 21,933 (53.4%) | 19,167 (46.6%) |
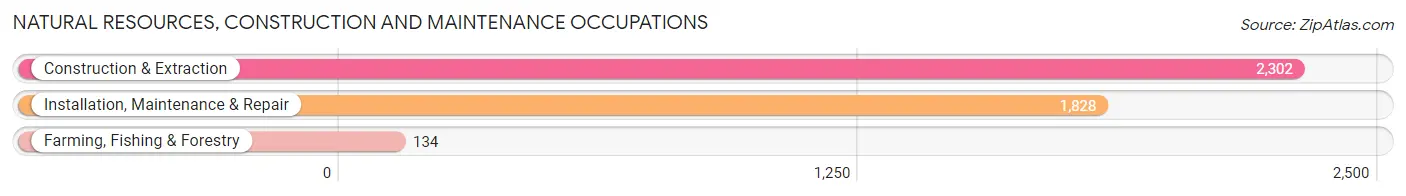
Natural Resources, Construction and Maintenance Occupations
The most common Natural Resources, Construction and Maintenance occupations in Bullitt County are Construction & Extraction (2,302 | 5.6%), Installation, Maintenance & Repair (1,828 | 4.4%), and Farming, Fishing & Forestry (134 | 0.3%).
Natural Resources, Construction and Maintenance Occupations by Sex
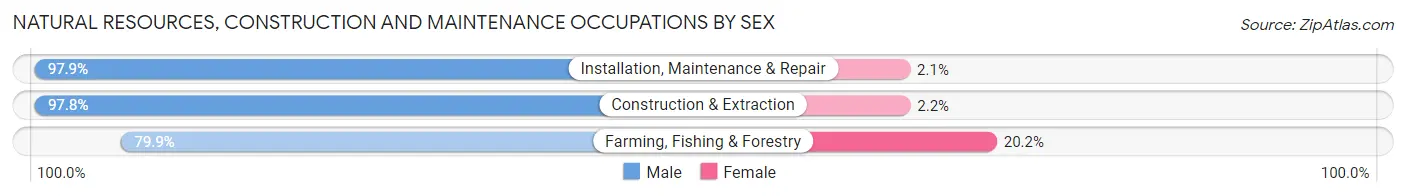
| Occupation | Male | Female |
| Farming, Fishing & Forestry | 107 (79.8%) | 27 (20.2%) |
| Construction & Extraction | 2,252 (97.8%) | 50 (2.2%) |
| Installation, Maintenance & Repair | 1,789 (97.9%) | 39 (2.1%) |
| Total (Category) | 4,148 (97.3%) | 116 (2.7%) |
| Total (Overall) | 21,933 (53.4%) | 19,167 (46.6%) |
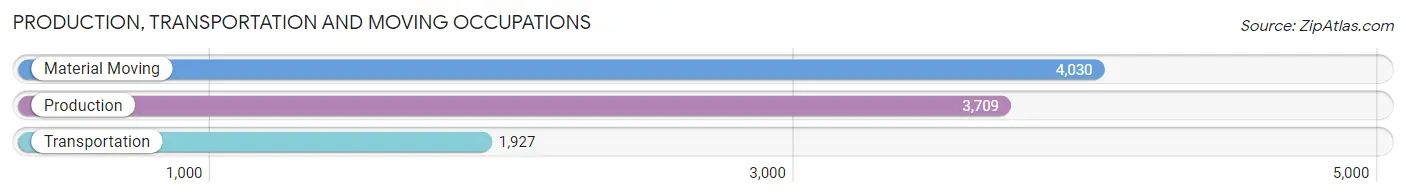
Production, Transportation and Moving Occupations
The most common Production, Transportation and Moving occupations in Bullitt County are Material Moving (4,030 | 9.8%), Production (3,709 | 9.0%), and Transportation (1,927 | 4.7%).
Production, Transportation and Moving Occupations by Sex
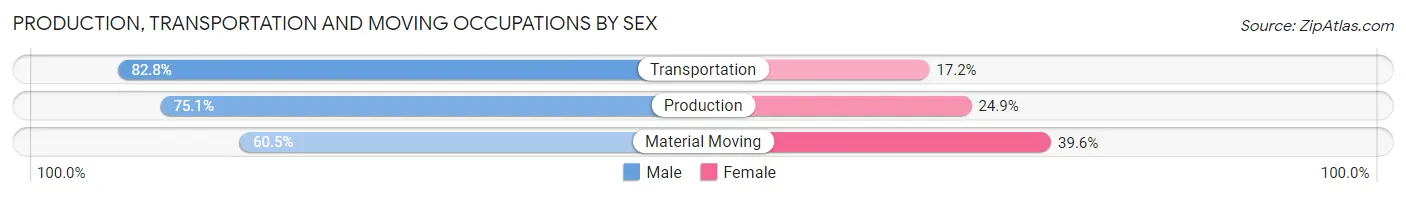
| Occupation | Male | Female |
| Production | 2,784 (75.1%) | 925 (24.9%) |
| Transportation | 1,595 (82.8%) | 332 (17.2%) |
| Material Moving | 2,436 (60.5%) | 1,594 (39.6%) |
| Total (Category) | 6,815 (70.5%) | 2,851 (29.5%) |
| Total (Overall) | 21,933 (53.4%) | 19,167 (46.6%) |
Employment Industries by Sex in Bullitt County
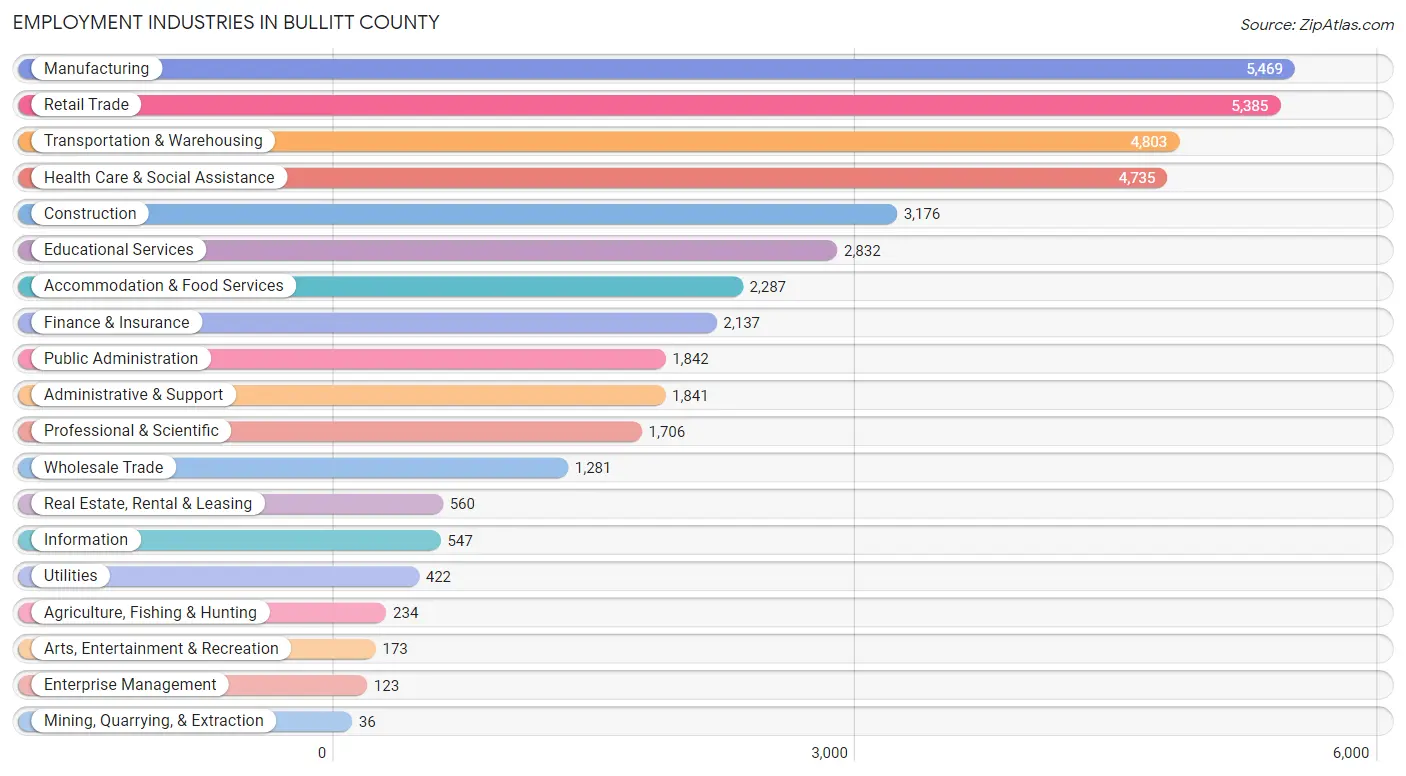
Employment Industries in Bullitt County
The major employment industries in Bullitt County include Manufacturing (5,469 | 13.3%), Retail Trade (5,385 | 13.1%), Transportation & Warehousing (4,803 | 11.7%), Health Care & Social Assistance (4,735 | 11.5%), and Construction (3,176 | 7.7%).
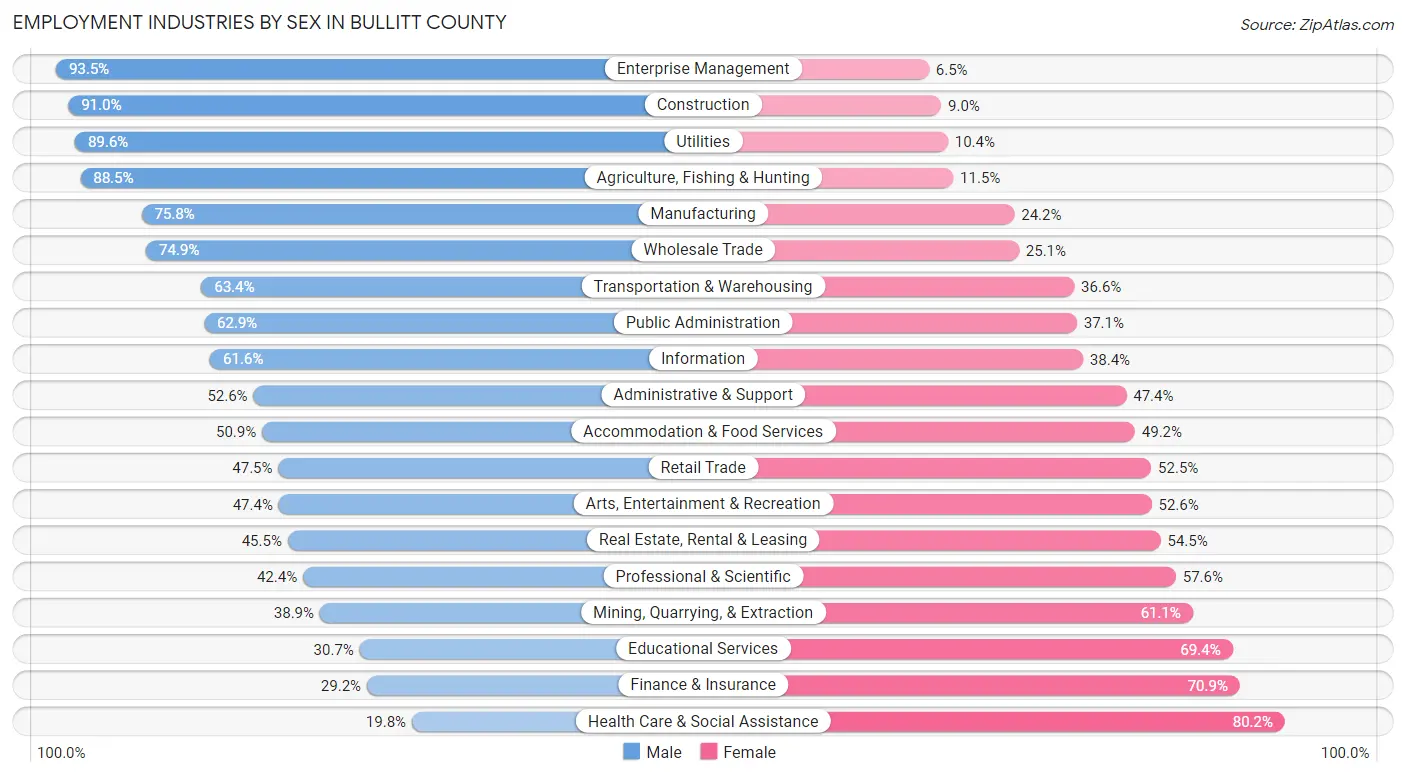
Employment Industries by Sex in Bullitt County
The Bullitt County industries that see more men than women are Enterprise Management (93.5%), Construction (91.0%), and Utilities (89.6%), whereas the industries that tend to have a higher number of women are Health Care & Social Assistance (80.2%), Finance & Insurance (70.9%), and Educational Services (69.4%).
| Industry | Male | Female |
| Agriculture, Fishing & Hunting | 207 (88.5%) | 27 (11.5%) |
| Mining, Quarrying, & Extraction | 14 (38.9%) | 22 (61.1%) |
| Construction | 2,889 (91.0%) | 287 (9.0%) |
| Manufacturing | 4,146 (75.8%) | 1,323 (24.2%) |
| Wholesale Trade | 959 (74.9%) | 322 (25.1%) |
| Retail Trade | 2,557 (47.5%) | 2,828 (52.5%) |
| Transportation & Warehousing | 3,046 (63.4%) | 1,757 (36.6%) |
| Utilities | 378 (89.6%) | 44 (10.4%) |
| Information | 337 (61.6%) | 210 (38.4%) |
| Finance & Insurance | 623 (29.1%) | 1,514 (70.9%) |
| Real Estate, Rental & Leasing | 255 (45.5%) | 305 (54.5%) |
| Professional & Scientific | 723 (42.4%) | 983 (57.6%) |
| Enterprise Management | 115 (93.5%) | 8 (6.5%) |
| Administrative & Support | 969 (52.6%) | 872 (47.4%) |
| Educational Services | 868 (30.6%) | 1,964 (69.4%) |
| Health Care & Social Assistance | 939 (19.8%) | 3,796 (80.2%) |
| Arts, Entertainment & Recreation | 82 (47.4%) | 91 (52.6%) |
| Accommodation & Food Services | 1,163 (50.8%) | 1,124 (49.1%) |
| Public Administration | 1,158 (62.9%) | 684 (37.1%) |
| Total | 21,933 (53.4%) | 19,167 (46.6%) |
Education in Bullitt County
School Enrollment in Bullitt County
The most common levels of schooling among the 17,470 students in Bullitt County are high school (4,357 | 24.9%), elementary school (4,231 | 24.2%), and middle school (3,846 | 22.0%).
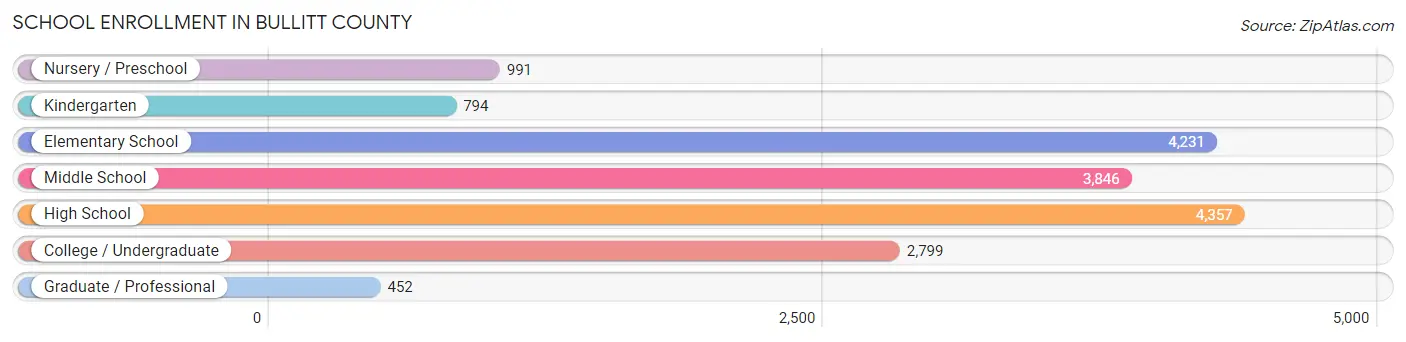
| School Level | # Students | % Students |
| Nursery / Preschool | 991 | 5.7% |
| Kindergarten | 794 | 4.5% |
| Elementary School | 4,231 | 24.2% |
| Middle School | 3,846 | 22.0% |
| High School | 4,357 | 24.9% |
| College / Undergraduate | 2,799 | 16.0% |
| Graduate / Professional | 452 | 2.6% |
| Total | 17,470 | 100.0% |
School Enrollment by Age by Funding Source in Bullitt County
Out of a total of 17,470 students who are enrolled in schools in Bullitt County, 2,987 (17.1%) attend a private institution, while the remaining 14,483 (82.9%) are enrolled in public schools. The age group of 35 years and over has the highest likelihood of being enrolled in private schools, with 175 (25.5% in the age bracket) enrolled. Conversely, the age group of 10 to 14 year olds has the lowest likelihood of being enrolled in a private school, with 4,228 (86.6% in the age bracket) attending a public institution.
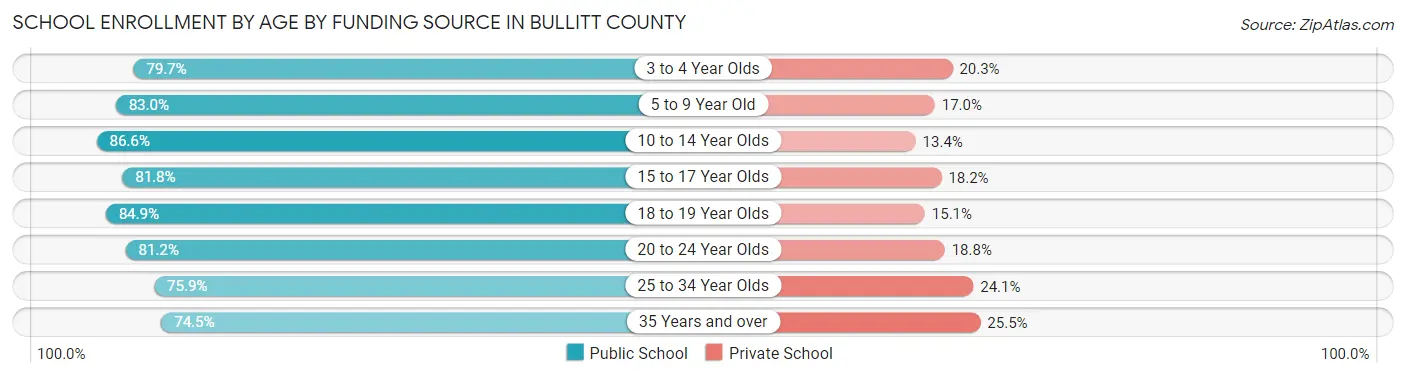
| Age Bracket | Public School | Private School |
| 3 to 4 Year Olds | 610 (79.7%) | 155 (20.3%) |
| 5 to 9 Year Old | 3,991 (83.0%) | 816 (17.0%) |
| 10 to 14 Year Olds | 4,228 (86.6%) | 655 (13.4%) |
| 15 to 17 Year Olds | 2,703 (81.8%) | 602 (18.2%) |
| 18 to 19 Year Olds | 769 (84.9%) | 137 (15.1%) |
| 20 to 24 Year Olds | 1,083 (81.2%) | 251 (18.8%) |
| 25 to 34 Year Olds | 594 (75.9%) | 189 (24.1%) |
| 35 Years and over | 512 (74.5%) | 175 (25.5%) |
| Total | 14,483 (82.9%) | 2,987 (17.1%) |
Educational Attainment by Field of Study in Bullitt County
Business (2,577 | 23.6%), science & technology (1,671 | 15.3%), education (1,414 | 12.9%), social sciences (815 | 7.4%), and arts & humanities (658 | 6.0%) are the most common fields of study among 10,939 individuals in Bullitt County who have obtained a bachelor's degree or higher.
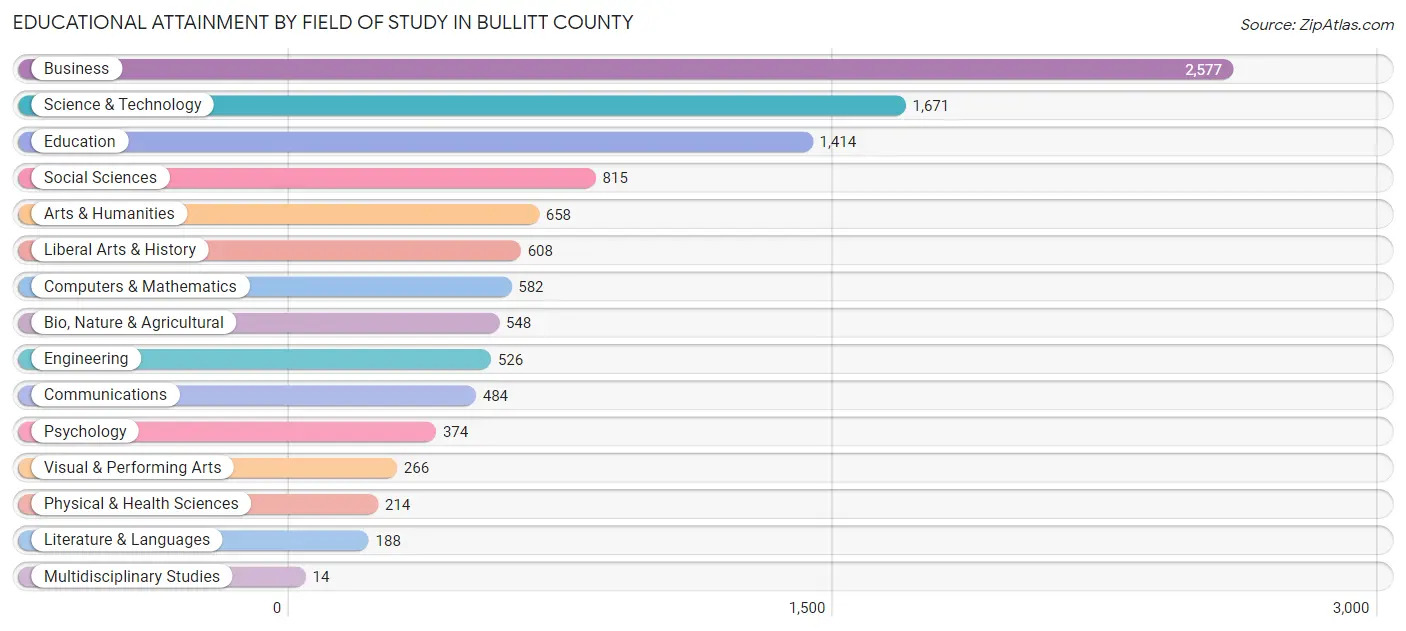
| Field of Study | # Graduates | % Graduates |
| Computers & Mathematics | 582 | 5.3% |
| Bio, Nature & Agricultural | 548 | 5.0% |
| Physical & Health Sciences | 214 | 2.0% |
| Psychology | 374 | 3.4% |
| Social Sciences | 815 | 7.4% |
| Engineering | 526 | 4.8% |
| Multidisciplinary Studies | 14 | 0.1% |
| Science & Technology | 1,671 | 15.3% |
| Business | 2,577 | 23.6% |
| Education | 1,414 | 12.9% |
| Literature & Languages | 188 | 1.7% |
| Liberal Arts & History | 608 | 5.6% |
| Visual & Performing Arts | 266 | 2.4% |
| Communications | 484 | 4.4% |
| Arts & Humanities | 658 | 6.0% |
| Total | 10,939 | 100.0% |
Transportation & Commute in Bullitt County
Vehicle Availability by Sex in Bullitt County
The most prevalent vehicle ownership categories in Bullitt County are males with 2 vehicles (8,382, accounting for 39.2%) and females with 2 vehicles (7,528, making up 44.2%).
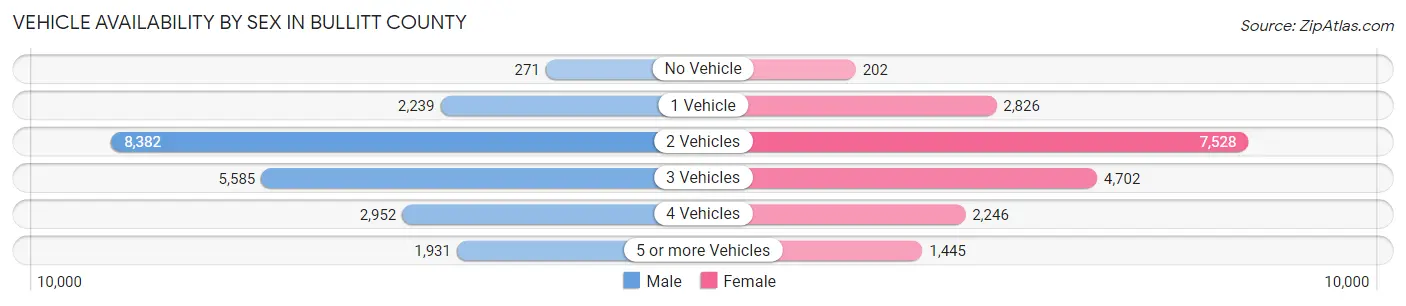
| Vehicles Available | Male | Female |
| No Vehicle | 271 (1.3%) | 202 (1.1%) |
| 1 Vehicle | 2,239 (10.5%) | 2,826 (14.9%) |
| 2 Vehicles | 8,382 (39.2%) | 7,528 (39.7%) |
| 3 Vehicles | 5,585 (26.2%) | 4,702 (24.8%) |
| 4 Vehicles | 2,952 (13.8%) | 2,246 (11.8%) |
| 5 or more Vehicles | 1,931 (9.0%) | 1,445 (7.6%) |
| Total | 21,360 (100.0%) | 18,949 (100.0%) |
Commute Time in Bullitt County
The most frequently occuring commute durations in Bullitt County are 30 to 34 minutes (8,020 commuters, 21.4%), 20 to 24 minutes (5,714 commuters, 15.2%), and 15 to 19 minutes (4,238 commuters, 11.3%).
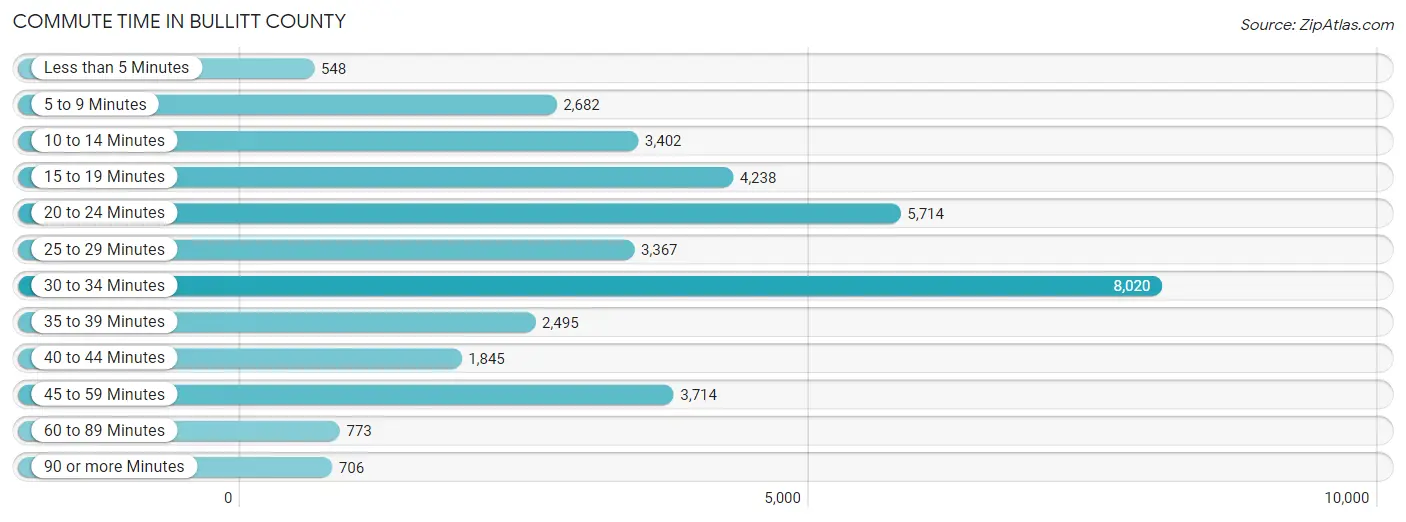
| Commute Time | # Commuters | % Commuters |
| Less than 5 Minutes | 548 | 1.5% |
| 5 to 9 Minutes | 2,682 | 7.1% |
| 10 to 14 Minutes | 3,402 | 9.1% |
| 15 to 19 Minutes | 4,238 | 11.3% |
| 20 to 24 Minutes | 5,714 | 15.2% |
| 25 to 29 Minutes | 3,367 | 9.0% |
| 30 to 34 Minutes | 8,020 | 21.4% |
| 35 to 39 Minutes | 2,495 | 6.7% |
| 40 to 44 Minutes | 1,845 | 4.9% |
| 45 to 59 Minutes | 3,714 | 9.9% |
| 60 to 89 Minutes | 773 | 2.1% |
| 90 or more Minutes | 706 | 1.9% |
Commute Time by Sex in Bullitt County
The most common commute times in Bullitt County are 30 to 34 minutes (4,762 commuters, 23.5%) for males and 30 to 34 minutes (3,258 commuters, 18.9%) for females.
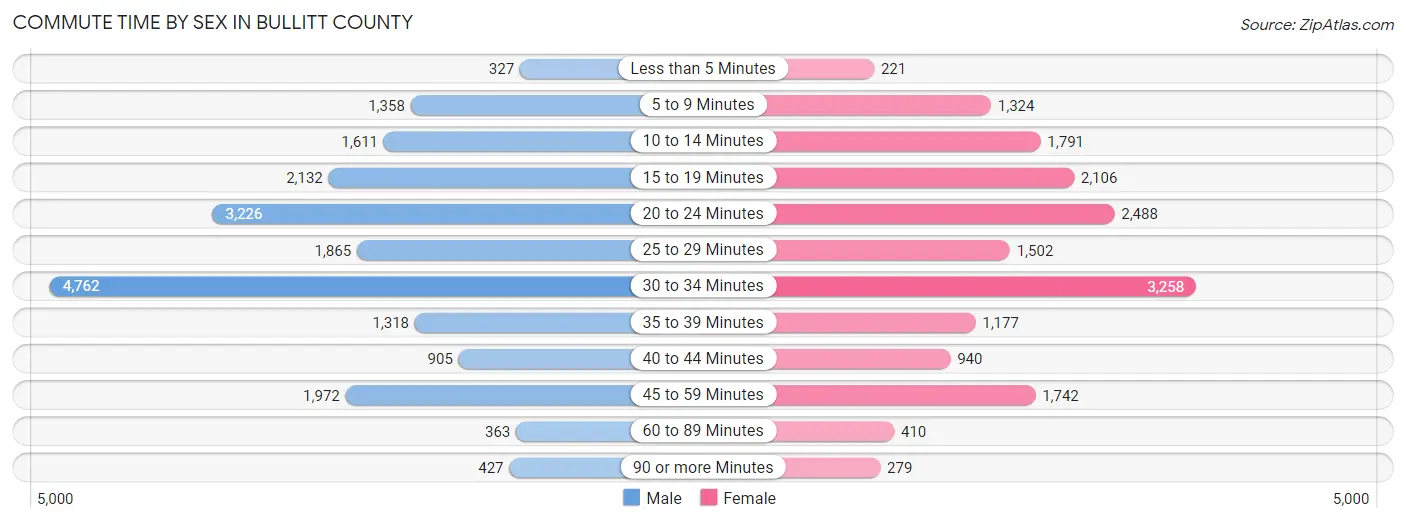
| Commute Time | Male | Female |
| Less than 5 Minutes | 327 (1.6%) | 221 (1.3%) |
| 5 to 9 Minutes | 1,358 (6.7%) | 1,324 (7.7%) |
| 10 to 14 Minutes | 1,611 (8.0%) | 1,791 (10.4%) |
| 15 to 19 Minutes | 2,132 (10.5%) | 2,106 (12.2%) |
| 20 to 24 Minutes | 3,226 (15.9%) | 2,488 (14.4%) |
| 25 to 29 Minutes | 1,865 (9.2%) | 1,502 (8.7%) |
| 30 to 34 Minutes | 4,762 (23.5%) | 3,258 (18.9%) |
| 35 to 39 Minutes | 1,318 (6.5%) | 1,177 (6.8%) |
| 40 to 44 Minutes | 905 (4.5%) | 940 (5.4%) |
| 45 to 59 Minutes | 1,972 (9.7%) | 1,742 (10.1%) |
| 60 to 89 Minutes | 363 (1.8%) | 410 (2.4%) |
| 90 or more Minutes | 427 (2.1%) | 279 (1.6%) |
Time of Departure to Work by Sex in Bullitt County
The most frequent times of departure to work in Bullitt County are 6:00 AM to 6:29 AM (2,889, 14.3%) for males and 7:00 AM to 7:29 AM (2,421, 14.0%) for females.
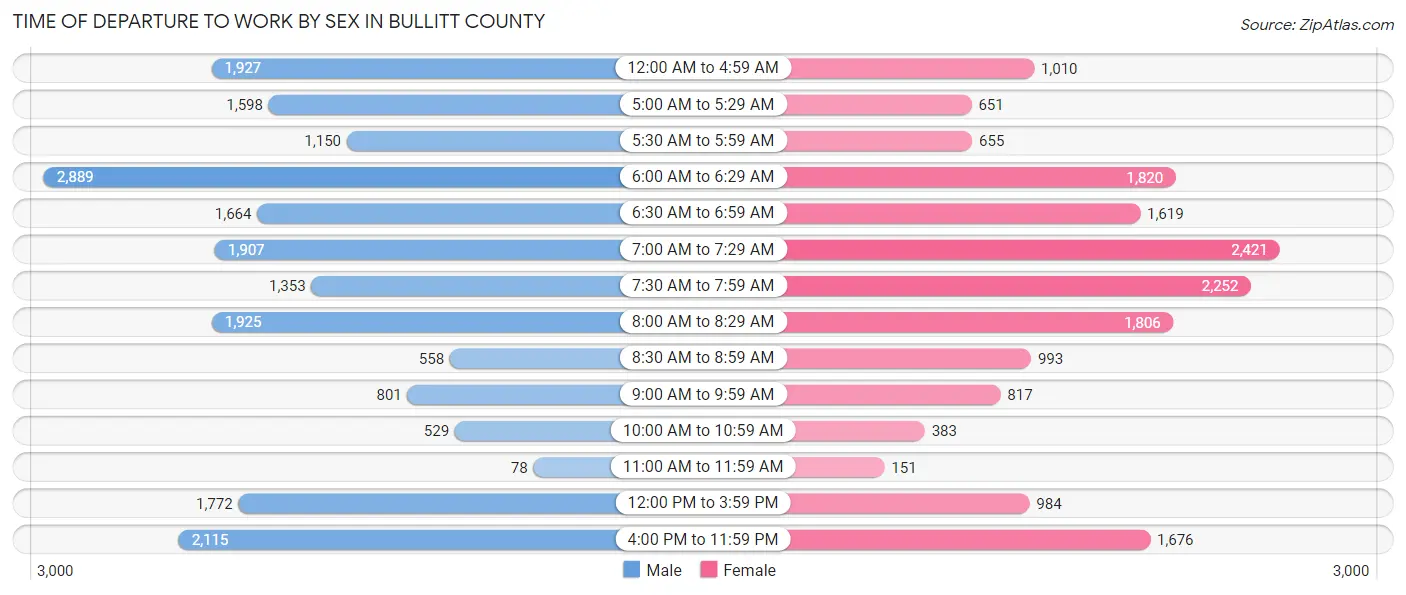
| Time of Departure | Male | Female |
| 12:00 AM to 4:59 AM | 1,927 (9.5%) | 1,010 (5.9%) |
| 5:00 AM to 5:29 AM | 1,598 (7.9%) | 651 (3.8%) |
| 5:30 AM to 5:59 AM | 1,150 (5.7%) | 655 (3.8%) |
| 6:00 AM to 6:29 AM | 2,889 (14.3%) | 1,820 (10.6%) |
| 6:30 AM to 6:59 AM | 1,664 (8.2%) | 1,619 (9.4%) |
| 7:00 AM to 7:29 AM | 1,907 (9.4%) | 2,421 (14.0%) |
| 7:30 AM to 7:59 AM | 1,353 (6.7%) | 2,252 (13.1%) |
| 8:00 AM to 8:29 AM | 1,925 (9.5%) | 1,806 (10.5%) |
| 8:30 AM to 8:59 AM | 558 (2.8%) | 993 (5.8%) |
| 9:00 AM to 9:59 AM | 801 (4.0%) | 817 (4.7%) |
| 10:00 AM to 10:59 AM | 529 (2.6%) | 383 (2.2%) |
| 11:00 AM to 11:59 AM | 78 (0.4%) | 151 (0.9%) |
| 12:00 PM to 3:59 PM | 1,772 (8.7%) | 984 (5.7%) |
| 4:00 PM to 11:59 PM | 2,115 (10.4%) | 1,676 (9.7%) |
| Total | 20,266 (100.0%) | 17,238 (100.0%) |
Housing Occupancy in Bullitt County
Occupancy by Ownership in Bullitt County
Of the total 31,068 dwellings in Bullitt County, owner-occupied units account for 25,665 (82.6%), while renter-occupied units make up 5,403 (17.4%).
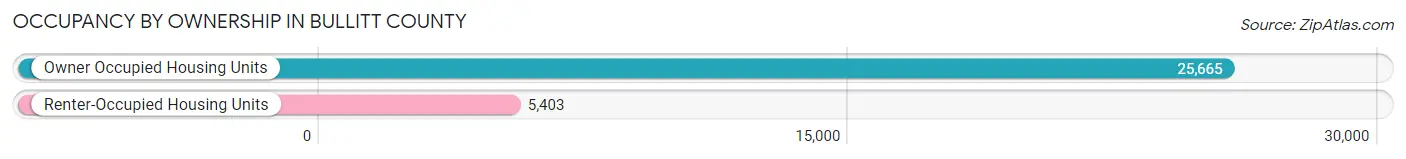
| Occupancy | # Housing Units | % Housing Units |
| Owner Occupied Housing Units | 25,665 | 82.6% |
| Renter-Occupied Housing Units | 5,403 | 17.4% |
| Total Occupied Housing Units | 31,068 | 100.0% |
Occupancy by Household Size in Bullitt County
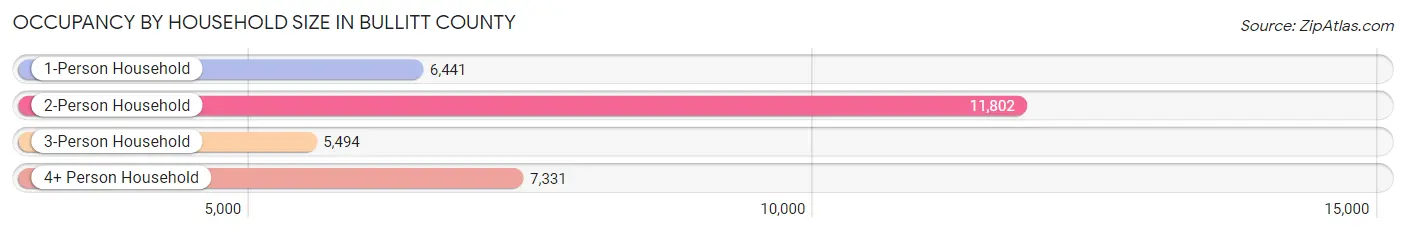
| Household Size | # Housing Units | % Housing Units |
| 1-Person Household | 6,441 | 20.7% |
| 2-Person Household | 11,802 | 38.0% |
| 3-Person Household | 5,494 | 17.7% |
| 4+ Person Household | 7,331 | 23.6% |
| Total Housing Units | 31,068 | 100.0% |
Occupancy by Ownership by Household Size in Bullitt County
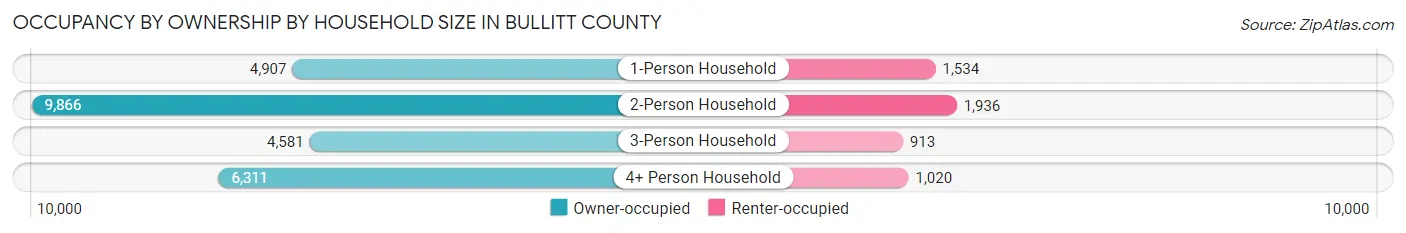
| Household Size | Owner-occupied | Renter-occupied |
| 1-Person Household | 4,907 (76.2%) | 1,534 (23.8%) |
| 2-Person Household | 9,866 (83.6%) | 1,936 (16.4%) |
| 3-Person Household | 4,581 (83.4%) | 913 (16.6%) |
| 4+ Person Household | 6,311 (86.1%) | 1,020 (13.9%) |
| Total Housing Units | 25,665 (82.6%) | 5,403 (17.4%) |
Occupancy by Educational Attainment in Bullitt County
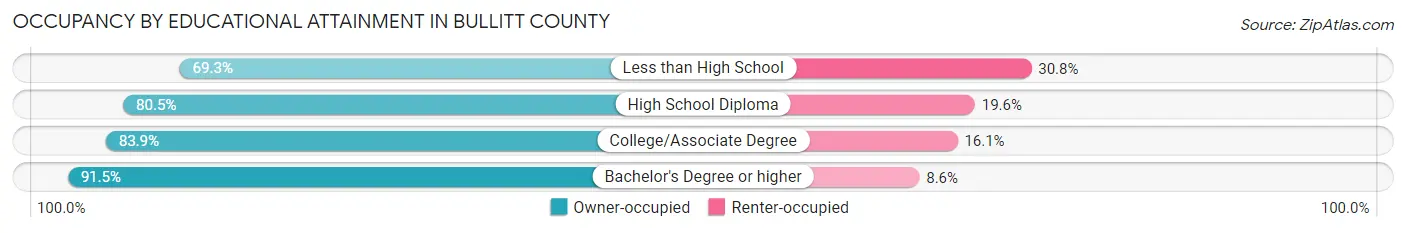
| Household Size | Owner-occupied | Renter-occupied |
| Less than High School | 2,090 (69.3%) | 928 (30.7%) |
| High School Diploma | 9,364 (80.4%) | 2,275 (19.6%) |
| College/Associate Degree | 8,845 (83.9%) | 1,698 (16.1%) |
| Bachelor's Degree or higher | 5,366 (91.4%) | 502 (8.6%) |
Occupancy by Age of Householder in Bullitt County
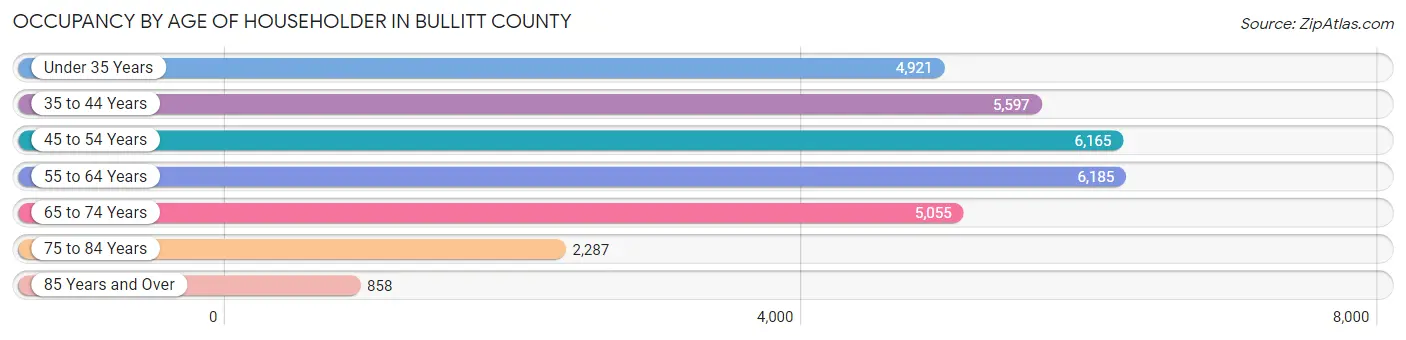
| Age Bracket | # Households | % Households |
| Under 35 Years | 4,921 | 15.8% |
| 35 to 44 Years | 5,597 | 18.0% |
| 45 to 54 Years | 6,165 | 19.8% |
| 55 to 64 Years | 6,185 | 19.9% |
| 65 to 74 Years | 5,055 | 16.3% |
| 75 to 84 Years | 2,287 | 7.4% |
| 85 Years and Over | 858 | 2.8% |
| Total | 31,068 | 100.0% |
Housing Finances in Bullitt County
Median Income by Occupancy in Bullitt County
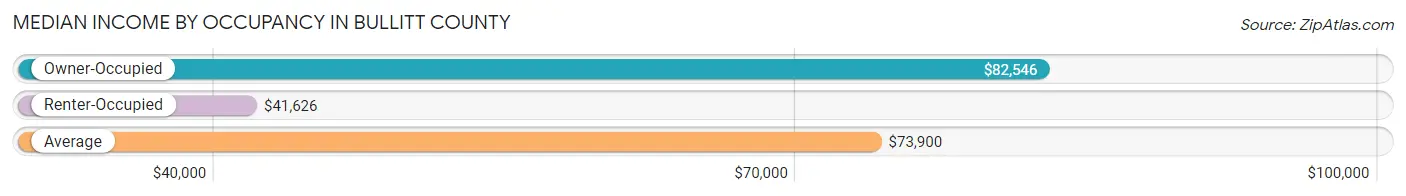
| Occupancy Type | # Households | Median Income |
| Owner-Occupied | 25,665 (82.6%) | $82,546 |
| Renter-Occupied | 5,403 (17.4%) | $41,626 |
| Average | 31,068 (100.0%) | $73,900 |
Occupancy by Householder Income Bracket in Bullitt County
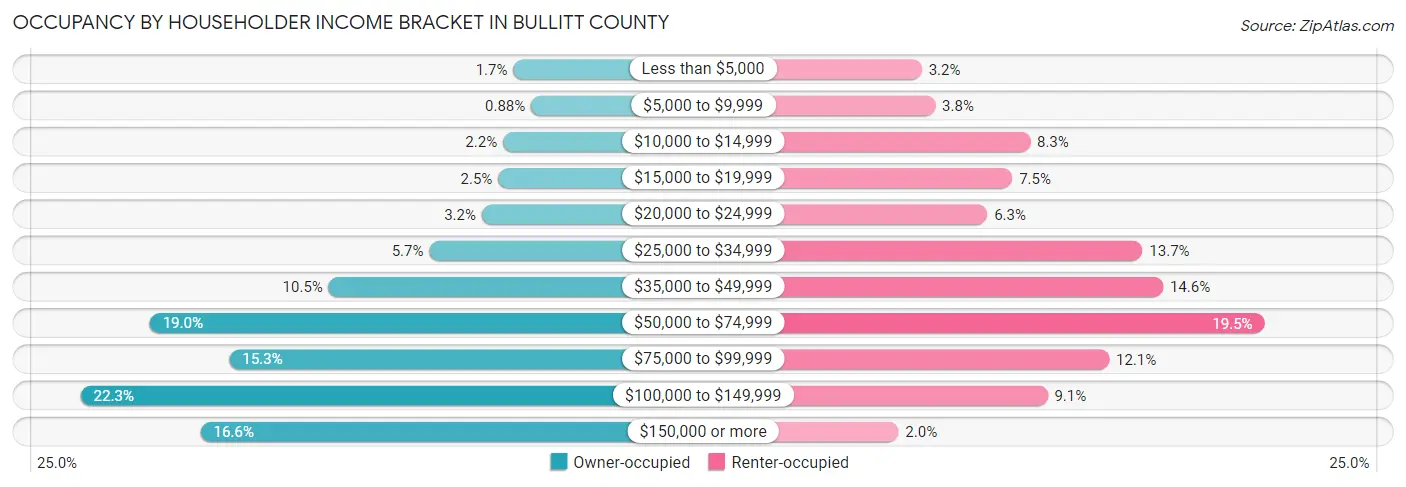
| Income Bracket | Owner-occupied | Renter-occupied |
| Less than $5,000 | 443 (1.7%) | 170 (3.2%) |
| $5,000 to $9,999 | 227 (0.9%) | 205 (3.8%) |
| $10,000 to $14,999 | 569 (2.2%) | 449 (8.3%) |
| $15,000 to $19,999 | 629 (2.5%) | 403 (7.5%) |
| $20,000 to $24,999 | 828 (3.2%) | 339 (6.3%) |
| $25,000 to $34,999 | 1,471 (5.7%) | 738 (13.7%) |
| $35,000 to $49,999 | 2,701 (10.5%) | 791 (14.6%) |
| $50,000 to $74,999 | 4,887 (19.0%) | 1,052 (19.5%) |
| $75,000 to $99,999 | 3,915 (15.2%) | 652 (12.1%) |
| $100,000 to $149,999 | 5,730 (22.3%) | 494 (9.1%) |
| $150,000 or more | 4,265 (16.6%) | 110 (2.0%) |
| Total | 25,665 (100.0%) | 5,403 (100.0%) |
Monthly Housing Cost Tiers in Bullitt County
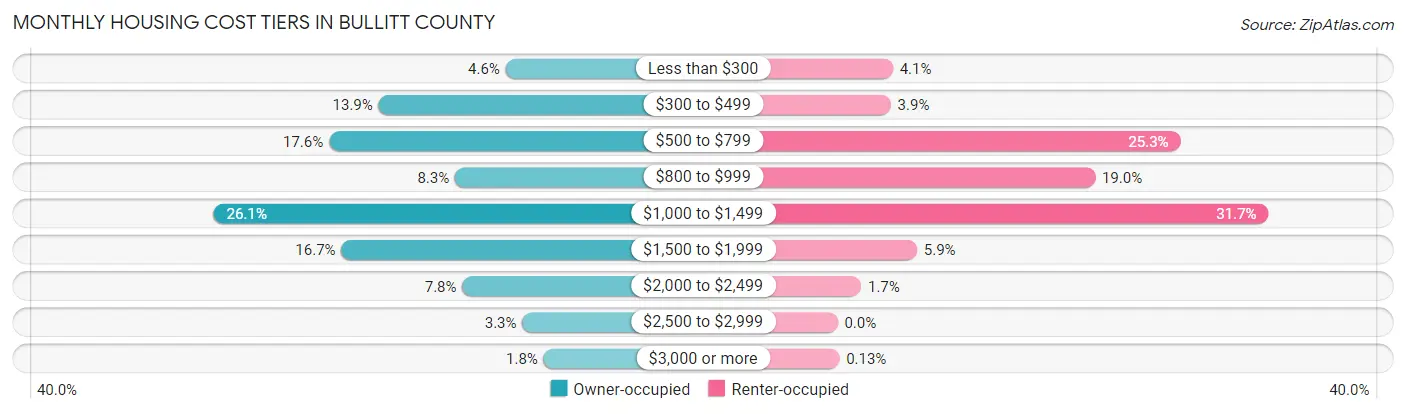
| Monthly Cost | Owner-occupied | Renter-occupied |
| Less than $300 | 1,172 (4.6%) | 220 (4.1%) |
| $300 to $499 | 3,576 (13.9%) | 212 (3.9%) |
| $500 to $799 | 4,512 (17.6%) | 1,365 (25.3%) |
| $800 to $999 | 2,130 (8.3%) | 1,025 (19.0%) |
| $1,000 to $1,499 | 6,694 (26.1%) | 1,715 (31.7%) |
| $1,500 to $1,999 | 4,279 (16.7%) | 316 (5.9%) |
| $2,000 to $2,499 | 1,992 (7.8%) | 94 (1.7%) |
| $2,500 to $2,999 | 857 (3.3%) | 0 (0.0%) |
| $3,000 or more | 453 (1.8%) | 7 (0.1%) |
| Total | 25,665 (100.0%) | 5,403 (100.0%) |
Physical Housing Characteristics in Bullitt County
Housing Structures in Bullitt County
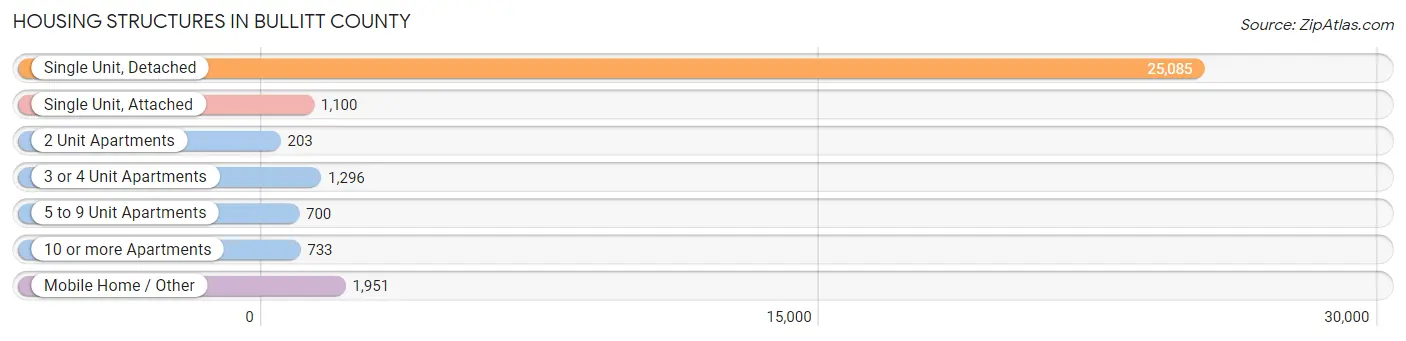
| Structure Type | # Housing Units | % Housing Units |
| Single Unit, Detached | 25,085 | 80.7% |
| Single Unit, Attached | 1,100 | 3.5% |
| 2 Unit Apartments | 203 | 0.6% |
| 3 or 4 Unit Apartments | 1,296 | 4.2% |
| 5 to 9 Unit Apartments | 700 | 2.2% |
| 10 or more Apartments | 733 | 2.4% |
| Mobile Home / Other | 1,951 | 6.3% |
| Total | 31,068 | 100.0% |
Housing Structures by Occupancy in Bullitt County
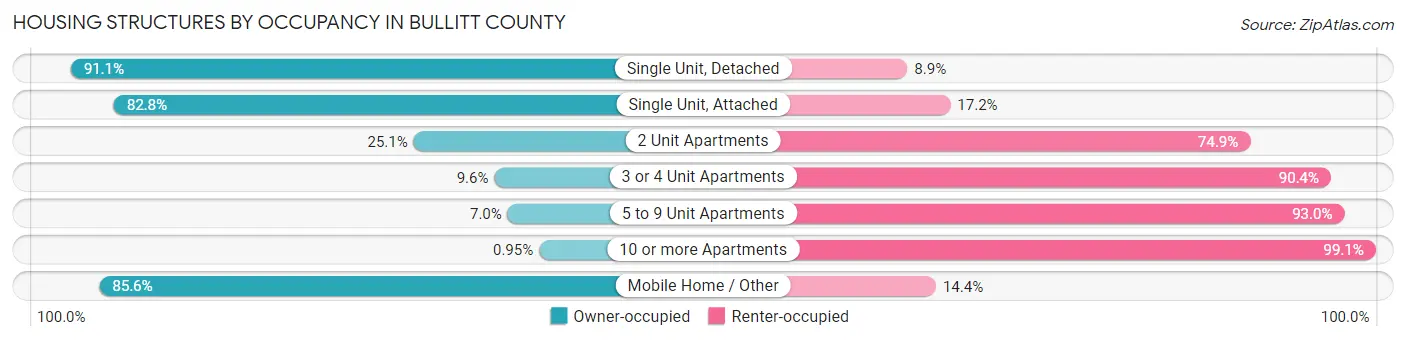
| Structure Type | Owner-occupied | Renter-occupied |
| Single Unit, Detached | 22,853 (91.1%) | 2,232 (8.9%) |
| Single Unit, Attached | 911 (82.8%) | 189 (17.2%) |
| 2 Unit Apartments | 51 (25.1%) | 152 (74.9%) |
| 3 or 4 Unit Apartments | 124 (9.6%) | 1,172 (90.4%) |
| 5 to 9 Unit Apartments | 49 (7.0%) | 651 (93.0%) |
| 10 or more Apartments | 7 (0.9%) | 726 (99.1%) |
| Mobile Home / Other | 1,670 (85.6%) | 281 (14.4%) |
| Total | 25,665 (82.6%) | 5,403 (17.4%) |
Housing Structures by Number of Rooms in Bullitt County
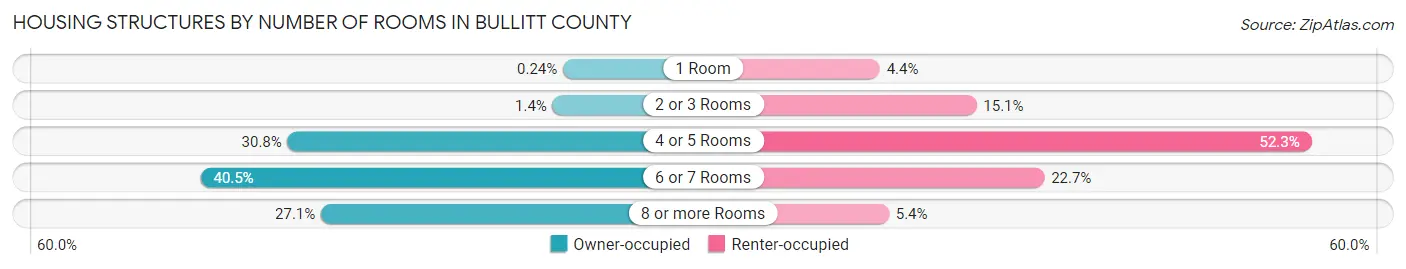
| Number of Rooms | Owner-occupied | Renter-occupied |
| 1 Room | 61 (0.2%) | 239 (4.4%) |
| 2 or 3 Rooms | 356 (1.4%) | 818 (15.1%) |
| 4 or 5 Rooms | 7,907 (30.8%) | 2,828 (52.3%) |
| 6 or 7 Rooms | 10,388 (40.5%) | 1,225 (22.7%) |
| 8 or more Rooms | 6,953 (27.1%) | 293 (5.4%) |
| Total | 25,665 (100.0%) | 5,403 (100.0%) |
Housing Structure by Heating Type in Bullitt County
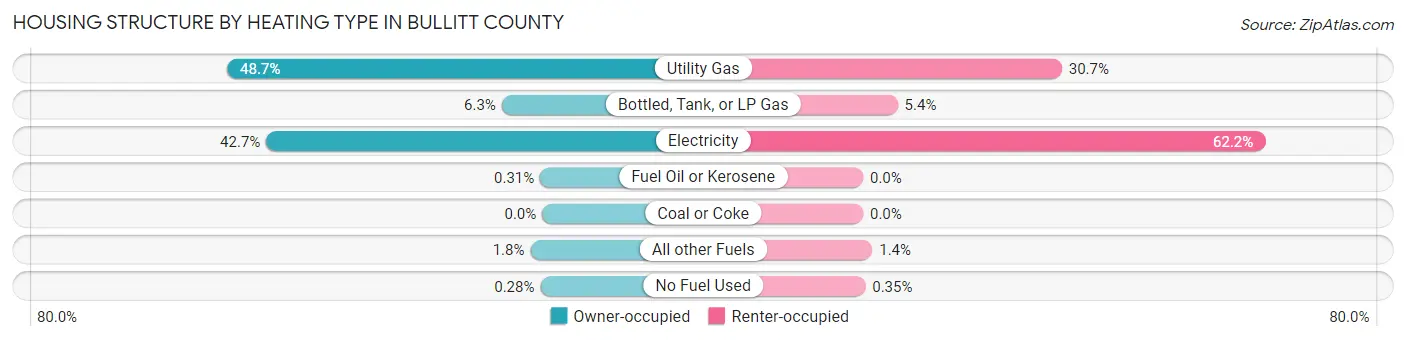
| Heating Type | Owner-occupied | Renter-occupied |
| Utility Gas | 12,496 (48.7%) | 1,660 (30.7%) |
| Bottled, Tank, or LP Gas | 1,603 (6.2%) | 289 (5.3%) |
| Electricity | 10,948 (42.7%) | 3,358 (62.2%) |
| Fuel Oil or Kerosene | 79 (0.3%) | 0 (0.0%) |
| Coal or Coke | 0 (0.0%) | 0 (0.0%) |
| All other Fuels | 466 (1.8%) | 77 (1.4%) |
| No Fuel Used | 73 (0.3%) | 19 (0.4%) |
| Total | 25,665 (100.0%) | 5,403 (100.0%) |
Household Vehicle Usage in Bullitt County
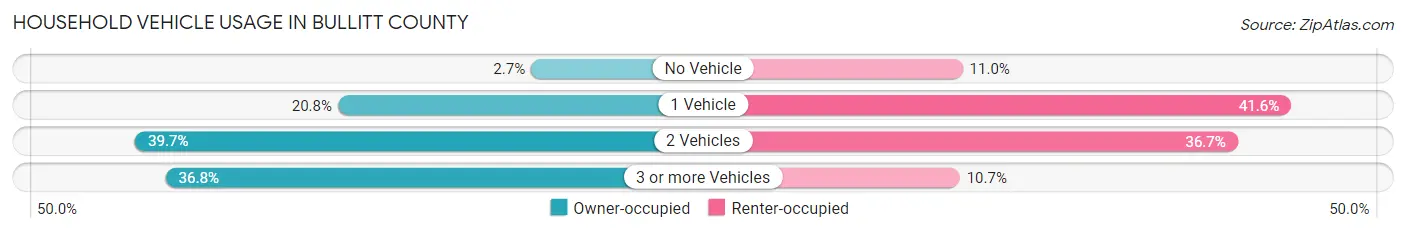
| Vehicles per Household | Owner-occupied | Renter-occupied |
| No Vehicle | 700 (2.7%) | 594 (11.0%) |
| 1 Vehicle | 5,328 (20.8%) | 2,250 (41.6%) |
| 2 Vehicles | 10,185 (39.7%) | 1,980 (36.6%) |
| 3 or more Vehicles | 9,452 (36.8%) | 579 (10.7%) |
| Total | 25,665 (100.0%) | 5,403 (100.0%) |
Real Estate & Mortgages in Bullitt County
Real Estate and Mortgage Overview in Bullitt County
| Characteristic | Without Mortgage | With Mortgage |
| Housing Units | 9,085 | 16,580 |
| Median Property Value | $194,200 | $225,000 |
| Median Household Income | $59,987 | $3,505 |
| Monthly Housing Costs | $496 | $428 |
| Real Estate Taxes | $1,579 | $385 |
Property Value by Mortgage Status in Bullitt County
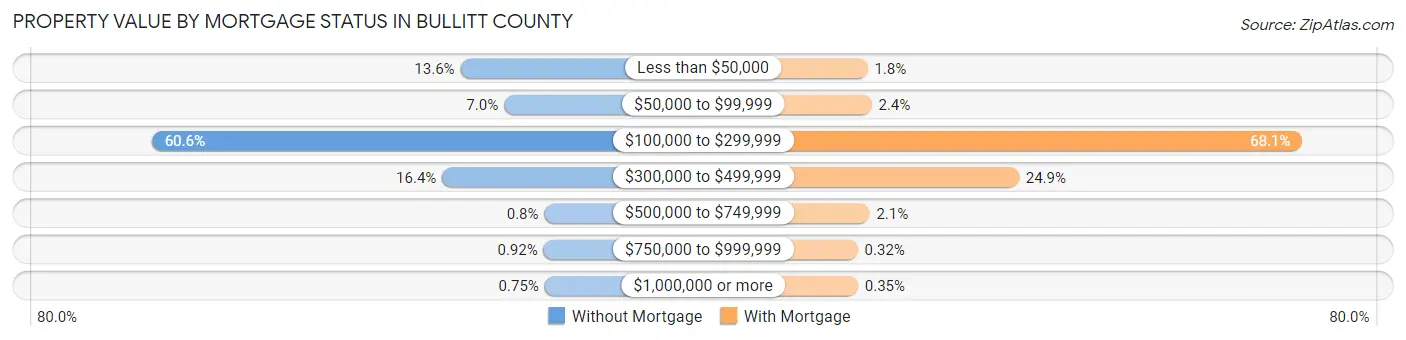
| Property Value | Without Mortgage | With Mortgage |
| Less than $50,000 | 1,235 (13.6%) | 303 (1.8%) |
| $50,000 to $99,999 | 631 (7.0%) | 404 (2.4%) |
| $100,000 to $299,999 | 5,507 (60.6%) | 11,287 (68.1%) |
| $300,000 to $499,999 | 1,487 (16.4%) | 4,123 (24.9%) |
| $500,000 to $749,999 | 73 (0.8%) | 352 (2.1%) |
| $750,000 to $999,999 | 84 (0.9%) | 53 (0.3%) |
| $1,000,000 or more | 68 (0.7%) | 58 (0.4%) |
| Total | 9,085 (100.0%) | 16,580 (100.0%) |
Household Income by Mortgage Status in Bullitt County
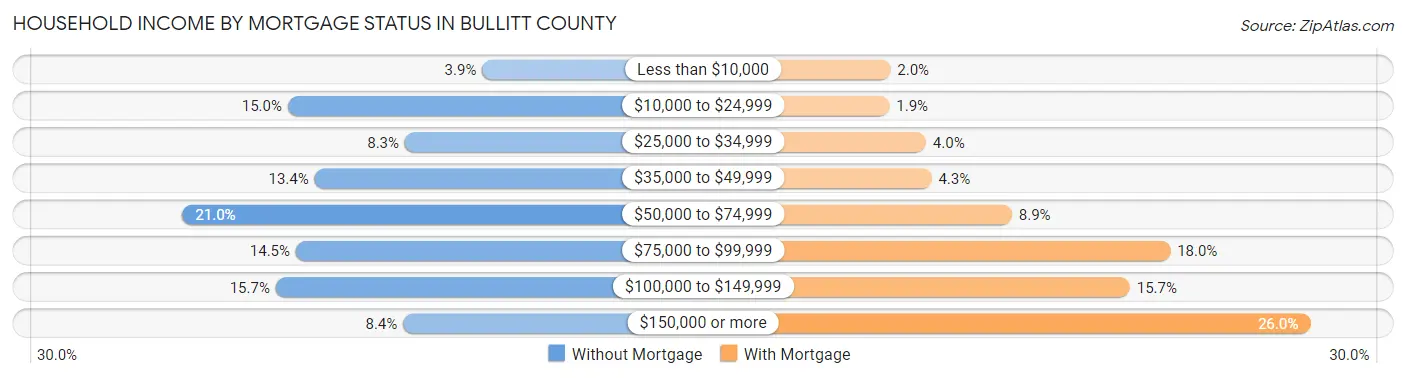
| Household Income | Without Mortgage | With Mortgage |
| Less than $10,000 | 350 (3.8%) | 330 (2.0%) |
| $10,000 to $24,999 | 1,359 (15.0%) | 320 (1.9%) |
| $25,000 to $34,999 | 751 (8.3%) | 667 (4.0%) |
| $35,000 to $49,999 | 1,220 (13.4%) | 720 (4.3%) |
| $50,000 to $74,999 | 1,906 (21.0%) | 1,481 (8.9%) |
| $75,000 to $99,999 | 1,317 (14.5%) | 2,981 (18.0%) |
| $100,000 to $149,999 | 1,422 (15.7%) | 2,598 (15.7%) |
| $150,000 or more | 760 (8.4%) | 4,308 (26.0%) |
| Total | 9,085 (100.0%) | 16,580 (100.0%) |
Property Value to Household Income Ratio in Bullitt County
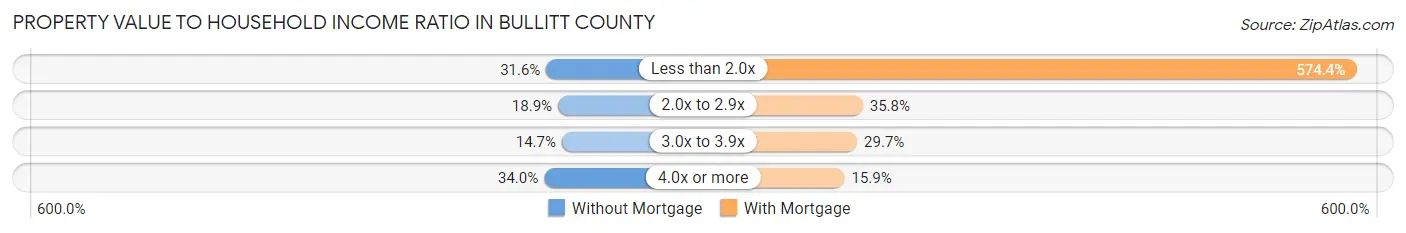
| Value-to-Income Ratio | Without Mortgage | With Mortgage |
| Less than 2.0x | 2,874 (31.6%) | 95,232 (574.4%) |
| 2.0x to 2.9x | 1,713 (18.9%) | 5,941 (35.8%) |
| 3.0x to 3.9x | 1,333 (14.7%) | 4,925 (29.7%) |
| 4.0x or more | 3,085 (34.0%) | 2,639 (15.9%) |
| Total | 9,085 (100.0%) | 16,580 (100.0%) |
Real Estate Taxes by Mortgage Status in Bullitt County
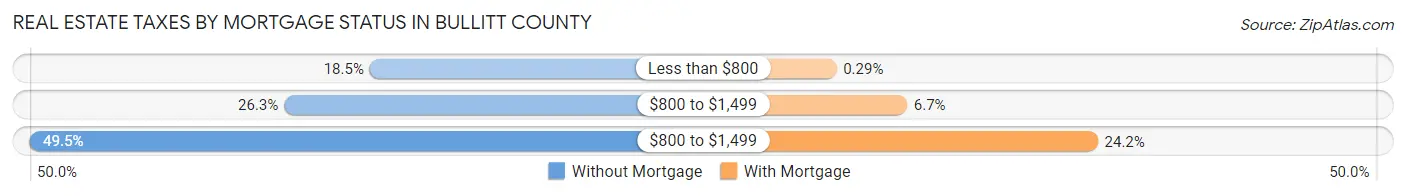
| Property Taxes | Without Mortgage | With Mortgage |
| Less than $800 | 1,679 (18.5%) | 48 (0.3%) |
| $800 to $1,499 | 2,389 (26.3%) | 1,117 (6.7%) |
| $800 to $1,499 | 4,496 (49.5%) | 4,005 (24.2%) |
| Total | 9,085 (100.0%) | 16,580 (100.0%) |
Health & Disability in Bullitt County
Health Insurance Coverage by Age in Bullitt County
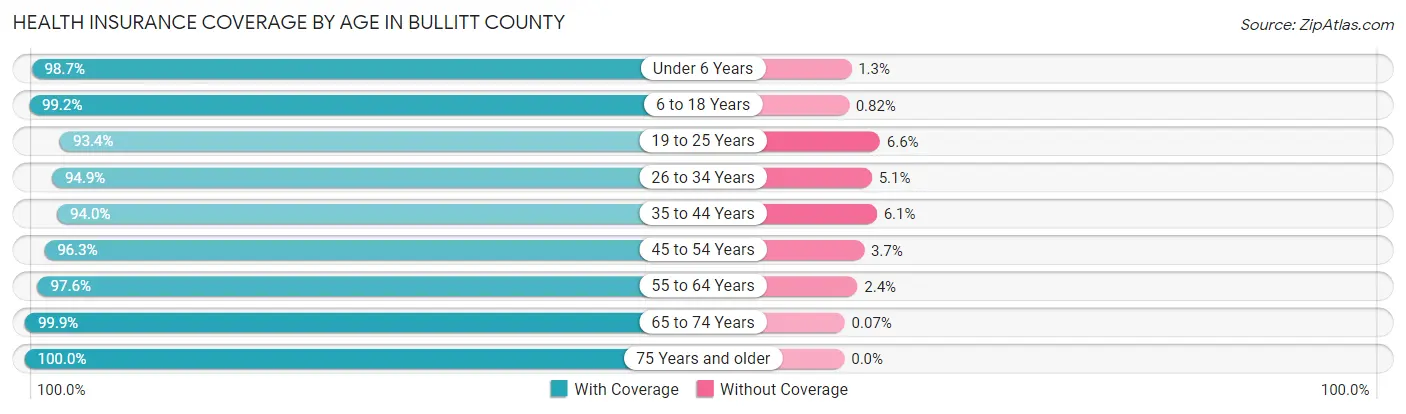
| Age Bracket | With Coverage | Without Coverage |
| Under 6 Years | 4,895 (98.7%) | 64 (1.3%) |
| 6 to 18 Years | 13,506 (99.2%) | 111 (0.8%) |
| 19 to 25 Years | 6,040 (93.4%) | 429 (6.6%) |
| 26 to 34 Years | 9,062 (94.9%) | 488 (5.1%) |
| 35 to 44 Years | 10,057 (94.0%) | 648 (6.0%) |
| 45 to 54 Years | 11,143 (96.3%) | 425 (3.7%) |
| 55 to 64 Years | 11,372 (97.6%) | 284 (2.4%) |
| 65 to 74 Years | 8,352 (99.9%) | 6 (0.1%) |
| 75 Years and older | 5,173 (100.0%) | 0 (0.0%) |
| Total | 79,600 (97.0%) | 2,455 (3.0%) |
Health Insurance Coverage by Citizenship Status in Bullitt County
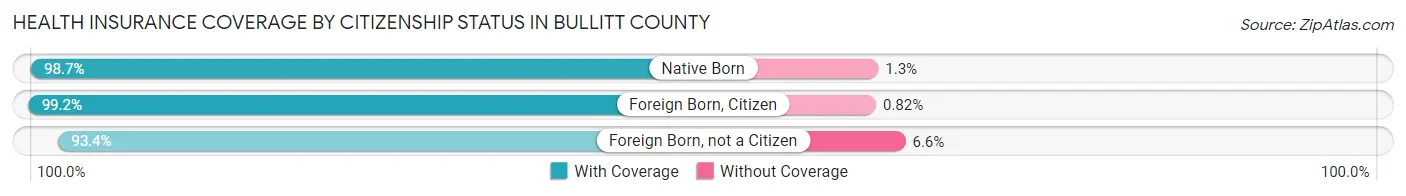
| Citizenship Status | With Coverage | Without Coverage |
| Native Born | 4,895 (98.7%) | 64 (1.3%) |
| Foreign Born, Citizen | 13,506 (99.2%) | 111 (0.8%) |
| Foreign Born, not a Citizen | 6,040 (93.4%) | 429 (6.6%) |
Health Insurance Coverage by Household Income in Bullitt County
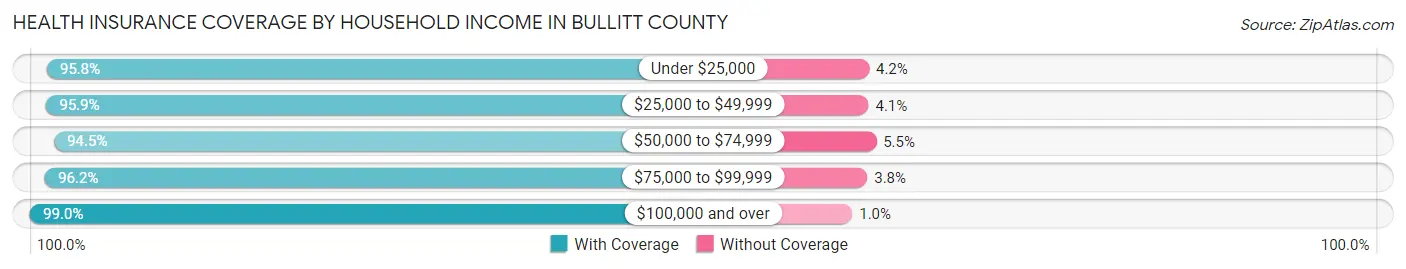
| Household Income | With Coverage | Without Coverage |
| Under $25,000 | 7,338 (95.8%) | 319 (4.2%) |
| $25,000 to $49,999 | 11,413 (95.9%) | 484 (4.1%) |
| $50,000 to $74,999 | 13,694 (94.5%) | 799 (5.5%) |
| $75,000 to $99,999 | 12,304 (96.2%) | 491 (3.8%) |
| $100,000 and over | 34,851 (99.0%) | 362 (1.0%) |
Public vs Private Health Insurance Coverage by Age in Bullitt County
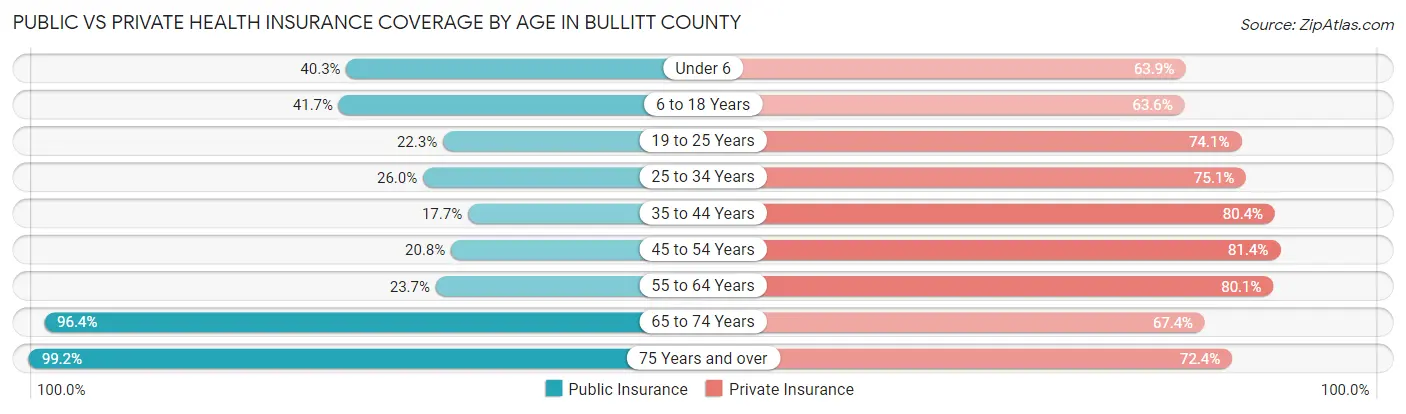
| Age Bracket | Public Insurance | Private Insurance |
| Under 6 | 1,997 (40.3%) | 3,168 (63.9%) |
| 6 to 18 Years | 5,674 (41.7%) | 8,665 (63.6%) |
| 19 to 25 Years | 1,445 (22.3%) | 4,796 (74.1%) |
| 25 to 34 Years | 2,487 (26.0%) | 7,167 (75.0%) |
| 35 to 44 Years | 1,895 (17.7%) | 8,606 (80.4%) |
| 45 to 54 Years | 2,410 (20.8%) | 9,412 (81.4%) |
| 55 to 64 Years | 2,760 (23.7%) | 9,334 (80.1%) |
| 65 to 74 Years | 8,055 (96.4%) | 5,633 (67.4%) |
| 75 Years and over | 5,132 (99.2%) | 3,747 (72.4%) |
| Total | 31,855 (38.8%) | 60,528 (73.8%) |
Disability Status by Sex by Age in Bullitt County
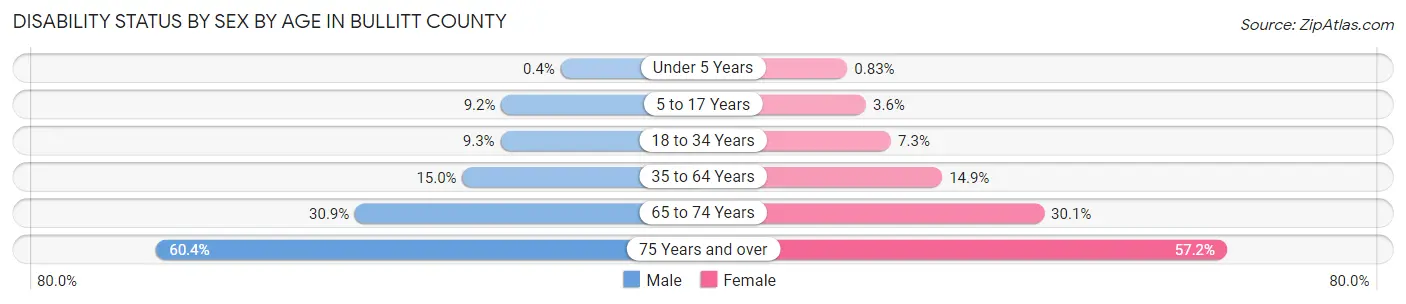
| Age Bracket | Male | Female |
| Under 5 Years | 9 (0.4%) | 16 (0.8%) |
| 5 to 17 Years | 651 (9.2%) | 233 (3.6%) |
| 18 to 34 Years | 810 (9.3%) | 603 (7.3%) |
| 35 to 64 Years | 2,518 (15.0%) | 2,553 (14.9%) |
| 65 to 74 Years | 1,260 (30.9%) | 1,287 (30.0%) |
| 75 Years and over | 1,360 (60.4%) | 1,671 (57.2%) |
Disability Class by Sex by Age in Bullitt County
Disability Class: Hearing Difficulty
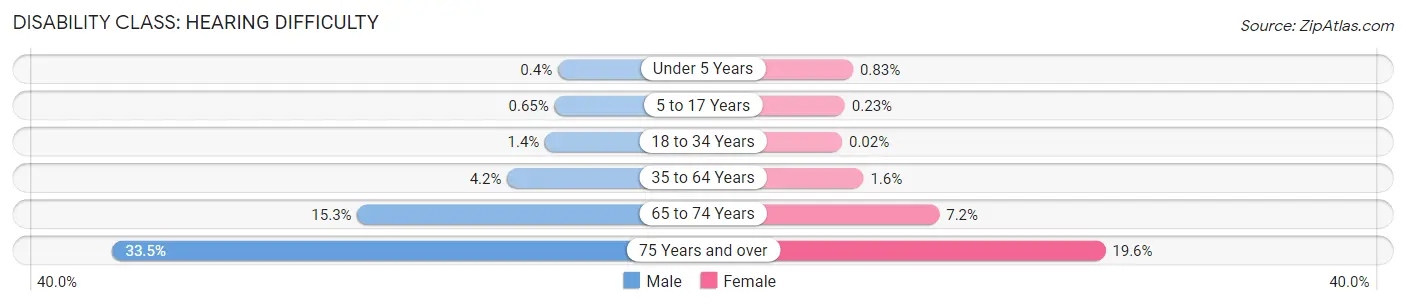
| Age Bracket | Male | Female |
| Under 5 Years | 9 (0.4%) | 16 (0.8%) |
| 5 to 17 Years | 46 (0.6%) | 15 (0.2%) |
| 18 to 34 Years | 117 (1.3%) | 2 (0.0%) |
| 35 to 64 Years | 700 (4.2%) | 275 (1.6%) |
| 65 to 74 Years | 623 (15.3%) | 310 (7.2%) |
| 75 Years and over | 753 (33.5%) | 572 (19.6%) |
Disability Class: Vision Difficulty
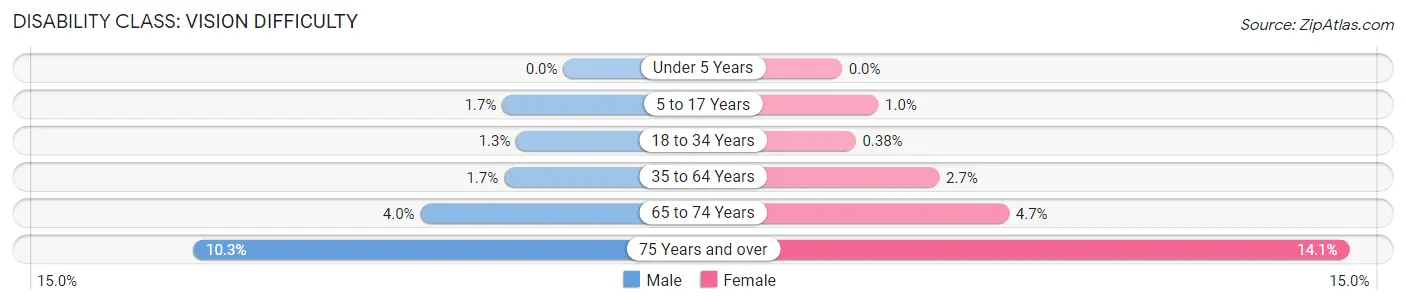
| Age Bracket | Male | Female |
| Under 5 Years | 0 (0.0%) | 0 (0.0%) |
| 5 to 17 Years | 120 (1.7%) | 65 (1.0%) |
| 18 to 34 Years | 114 (1.3%) | 31 (0.4%) |
| 35 to 64 Years | 278 (1.7%) | 464 (2.7%) |
| 65 to 74 Years | 162 (4.0%) | 199 (4.6%) |
| 75 Years and over | 232 (10.3%) | 413 (14.1%) |
Disability Class: Cognitive Difficulty
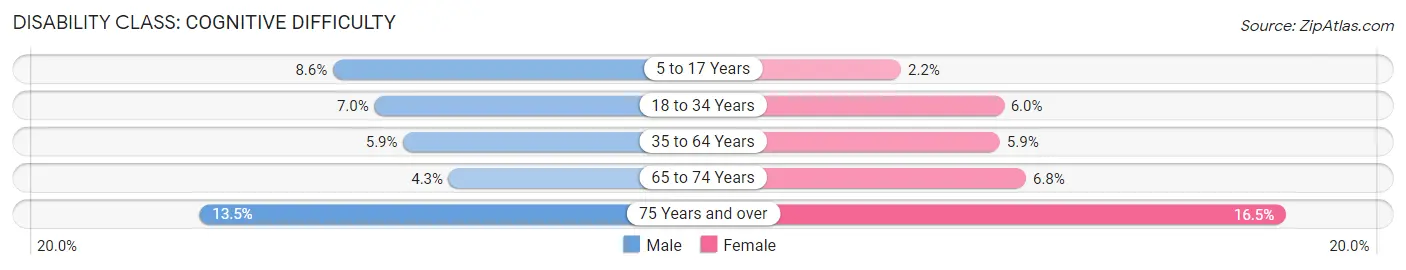
| Age Bracket | Male | Female |
| 5 to 17 Years | 605 (8.6%) | 142 (2.2%) |
| 18 to 34 Years | 608 (7.0%) | 495 (6.0%) |
| 35 to 64 Years | 998 (5.9%) | 1,004 (5.9%) |
| 65 to 74 Years | 173 (4.3%) | 293 (6.8%) |
| 75 Years and over | 304 (13.5%) | 482 (16.5%) |
Disability Class: Ambulatory Difficulty
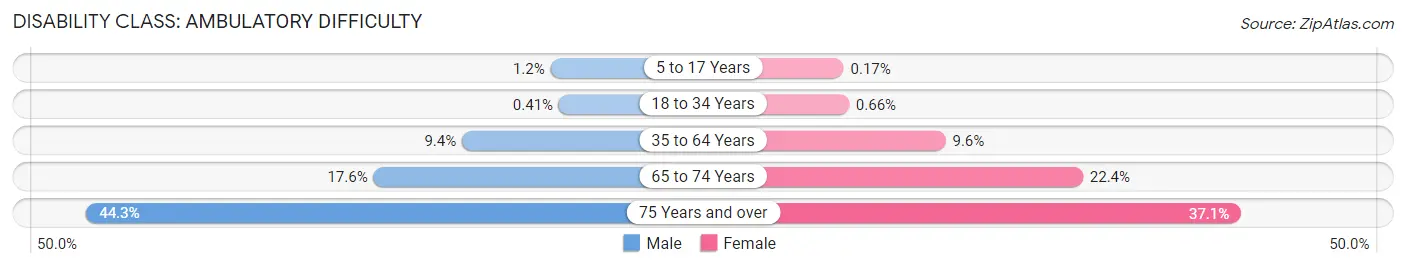
| Age Bracket | Male | Female |
| 5 to 17 Years | 84 (1.2%) | 11 (0.2%) |
| 18 to 34 Years | 36 (0.4%) | 54 (0.7%) |
| 35 to 64 Years | 1,581 (9.4%) | 1,649 (9.6%) |
| 65 to 74 Years | 718 (17.6%) | 958 (22.4%) |
| 75 Years and over | 996 (44.3%) | 1,083 (37.0%) |
Disability Class: Self-Care Difficulty
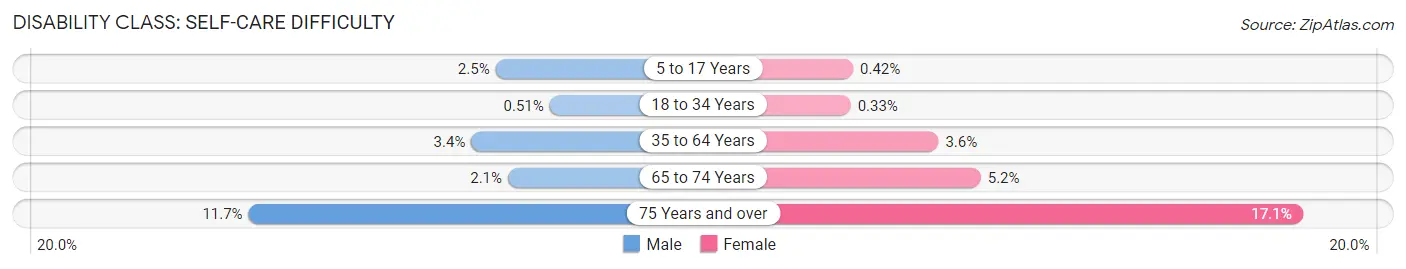
| Age Bracket | Male | Female |
| 5 to 17 Years | 178 (2.5%) | 27 (0.4%) |
| 18 to 34 Years | 44 (0.5%) | 27 (0.3%) |
| 35 to 64 Years | 575 (3.4%) | 615 (3.6%) |
| 65 to 74 Years | 84 (2.1%) | 221 (5.2%) |
| 75 Years and over | 263 (11.7%) | 501 (17.1%) |
Technology Access in Bullitt County
Computing Device Access in Bullitt County
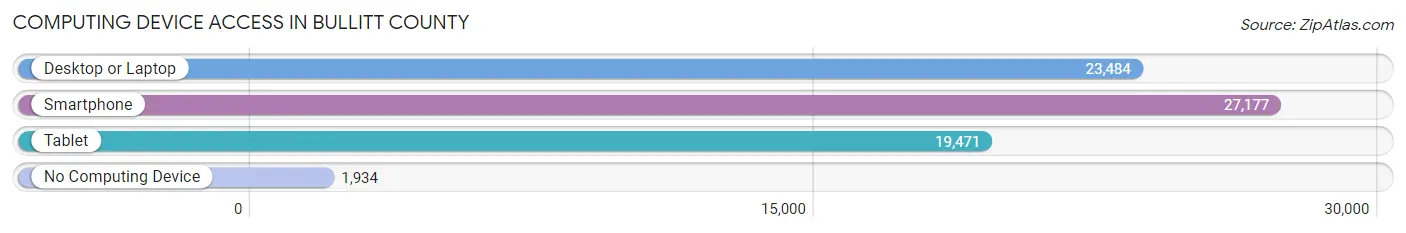
| Device Type | # Households | % Households |
| Desktop or Laptop | 23,484 | 75.6% |
| Smartphone | 27,177 | 87.5% |
| Tablet | 19,471 | 62.7% |
| No Computing Device | 1,934 | 6.2% |
| Total | 31,068 | 100.0% |
Internet Access in Bullitt County
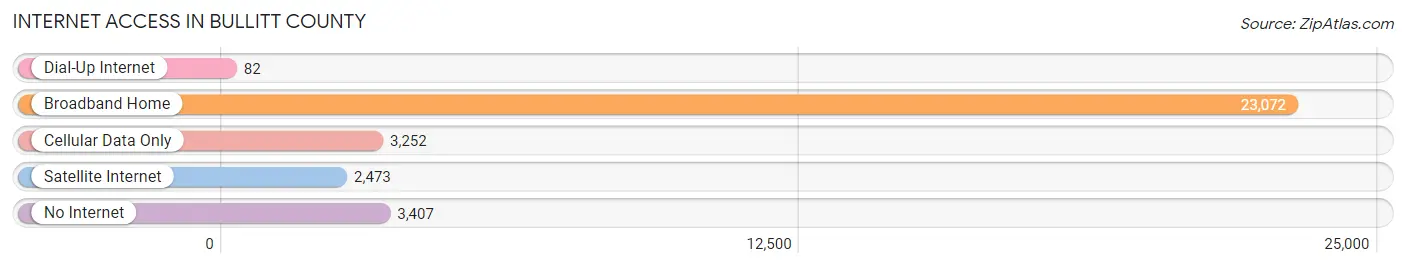
| Internet Type | # Households | % Households |
| Dial-Up Internet | 82 | 0.3% |
| Broadband Home | 23,072 | 74.3% |
| Cellular Data Only | 3,252 | 10.5% |
| Satellite Internet | 2,473 | 8.0% |
| No Internet | 3,407 | 11.0% |
| Total | 31,068 | 100.0% |
Bullitt County Summary
Bullitt County, Kentucky is located in the north-central part of the state, just south of Louisville. It is bordered by Jefferson County to the north, Nelson County to the east, Spencer County to the south, and Hardin County to the west. The county seat is Shepherdsville, and the county is named after Alexander Scott Bullitt, a Revolutionary War veteran and the first lieutenant governor of Kentucky.
Geography
Bullitt County covers an area of 437 square miles, with a population of 75,534 as of the 2010 census. The terrain is mostly rolling hills, with the highest point being the summit of Mount Washington at 1,067 feet. The county is drained by the Salt River and its tributaries, including Floyds Fork, Rolling Fork, and Cedar Creek. The county is home to several state parks, including Bernheim Arboretum and Research Forest, Otter Creek Park, and Taylorsville Lake State Park.
Economy
Bullitt County has a diverse economy, with a mix of manufacturing, agriculture, and services. The county is home to several large employers, including Amazon, UPS, and Ford Motor Company. Agriculture is also an important part of the economy, with corn, soybeans, and hay being the main crops. The county is also home to several wineries and distilleries, as well as a number of small businesses.
Demographics
As of the 2010 census, the population of Bullitt County was 75,534, with a population density of 171 people per square mile. The racial makeup of the county was 94.3% White, 2.7% Black or African American, 0.4% Native American, 0.7% Asian, 0.1% Pacific Islander, 0.9% from other races, and 1.2% from two or more races. Hispanic or Latino of any race were 2.2% of the population.
The median income for a household in the county was $50,945, and the median income for a family was $60,945. The per capita income for the county was $24,945. About 8.3% of families and 10.3% of the population were below the poverty line, including 14.2% of those under age 18 and 8.2% of those age 65 or over.
Conclusion
Bullitt County, Kentucky is a diverse county with a mix of manufacturing, agriculture, and services. It is home to several large employers, as well as a number of small businesses. The population of the county is mostly white, with a small percentage of other races. The median income for a household in the county is above the national average, and the poverty rate is below the national average. Bullitt County is a great place to live and work, with plenty of opportunities for growth and development.
Common Questions
What is the Total Population of Bullitt County?
Total Population of Bullitt County is 82,482.
What is the Total Male Population of Bullitt County?
Total Male Population of Bullitt County is 41,383.
What is the Total Female Population of Bullitt County?
Total Female Population of Bullitt County is 41,099.
What is the Ratio of Males per 100 Females in Bullitt County?
There are 100.69 Males per 100 Females in Bullitt County.
What is the Ratio of Females per 100 Males in Bullitt County?
There are 99.31 Females per 100 Males in Bullitt County.
What is the Median Population Age in Bullitt County?
Median Population Age in Bullitt County is 41.1 Years.
What is the Average Family Size in Bullitt County
Average Family Size in Bullitt County is 3.0 People.
What is the Average Household Size in Bullitt County
Average Household Size in Bullitt County is 2.6 People.
What is Per Capita Income in Bullitt County?
Per Capita income in Bullitt County is $34,362.
What is the Median Family Income in Bullitt County?
Median Family Income in Bullitt County is $85,180.
What is the Median Household income in Bullitt County?
Median Household Income in Bullitt County is $73,900.
What is Income or Wage Gap in Bullitt County?
Income or Wage Gap in Bullitt County is 28.7%.
Women in Bullitt County earn 71.3 cents for every dollar earned by a man.
What is Family Income Deficit in Bullitt County?
Family Income Deficit in Bullitt County is $9,130.
Families that are below poverty line in Bullitt County earn $9,130 less on average than the poverty threshold level.
What is Inequality or Gini Index in Bullitt County?
Inequality or Gini Index in Bullitt County is 0.39.
How Large is the Labor Force in Bullitt County?
There are 43,157 People in the Labor Forcein in Bullitt County.
What is the Percentage of People in the Labor Force in Bullitt County?
64.0% of People are in the Labor Force in Bullitt County.
What is the Unemployment Rate in Bullitt County?
Unemployment Rate in Bullitt County is 4.6%.