Boyd County, KY
Boyd County Overview
48,242
TOTAL POPULATION
24,188
MALE POPULATION
24,054
FEMALE POPULATION
100.56
MALES / 100 FEMALES
99.45
FEMALES / 100 MALES
42.1
MEDIAN AGE
3.1
AVG FAMILY SIZE
2.5
AVG HOUSEHOLD SIZE
$30,993
PER CAPITA INCOME
$72,259
AVG FAMILY INCOME
$58,327
AVG HOUSEHOLD INCOME
24.3%
WAGE / INCOME GAP [ % ]
75.7¢/ $1
WAGE / INCOME GAP [ $ ]
$11,427
FAMILY INCOME DEFICIT
0.46
INEQUALITY / GINI INDEX
20,546
LABOR FORCE [ PEOPLE ]
52.5%
PERCENT IN LABOR FORCE
6.9%
UNEMPLOYMENT RATE
Boyd County Area Codes
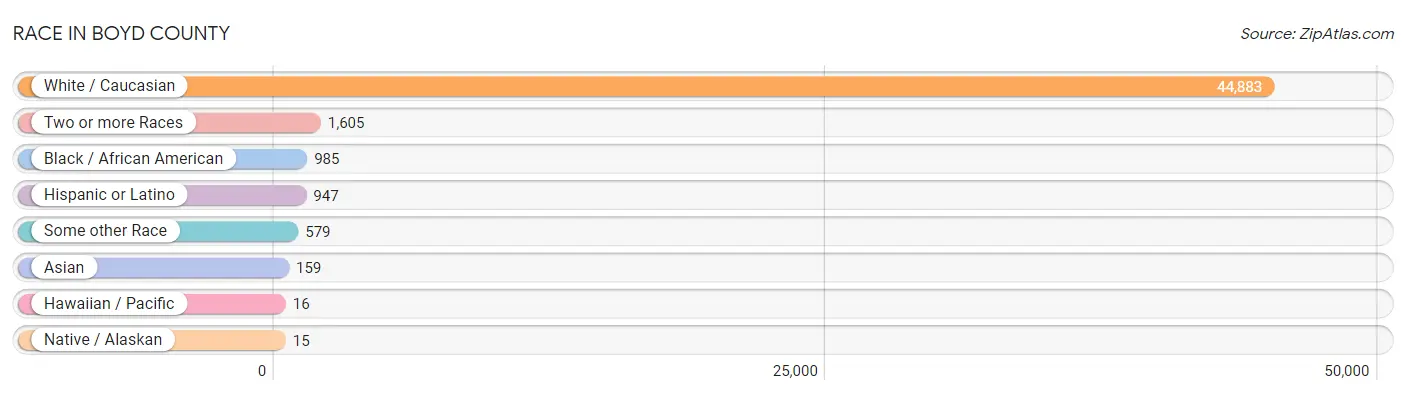
Race in Boyd County
The most populous races in Boyd County are White / Caucasian (44,883 | 93.0%), Two or more Races (1,605 | 3.3%), and Black / African American (985 | 2.0%).
| Race | # Population | % Population |
| Asian | 159 | 0.3% |
| Black / African American | 985 | 2.0% |
| Hawaiian / Pacific | 16 | 0.0% |
| Hispanic or Latino | 947 | 2.0% |
| Native / Alaskan | 15 | 0.0% |
| White / Caucasian | 44,883 | 93.0% |
| Two or more Races | 1,605 | 3.3% |
| Some other Race | 579 | 1.2% |
| Total | 48,242 | 100.0% |
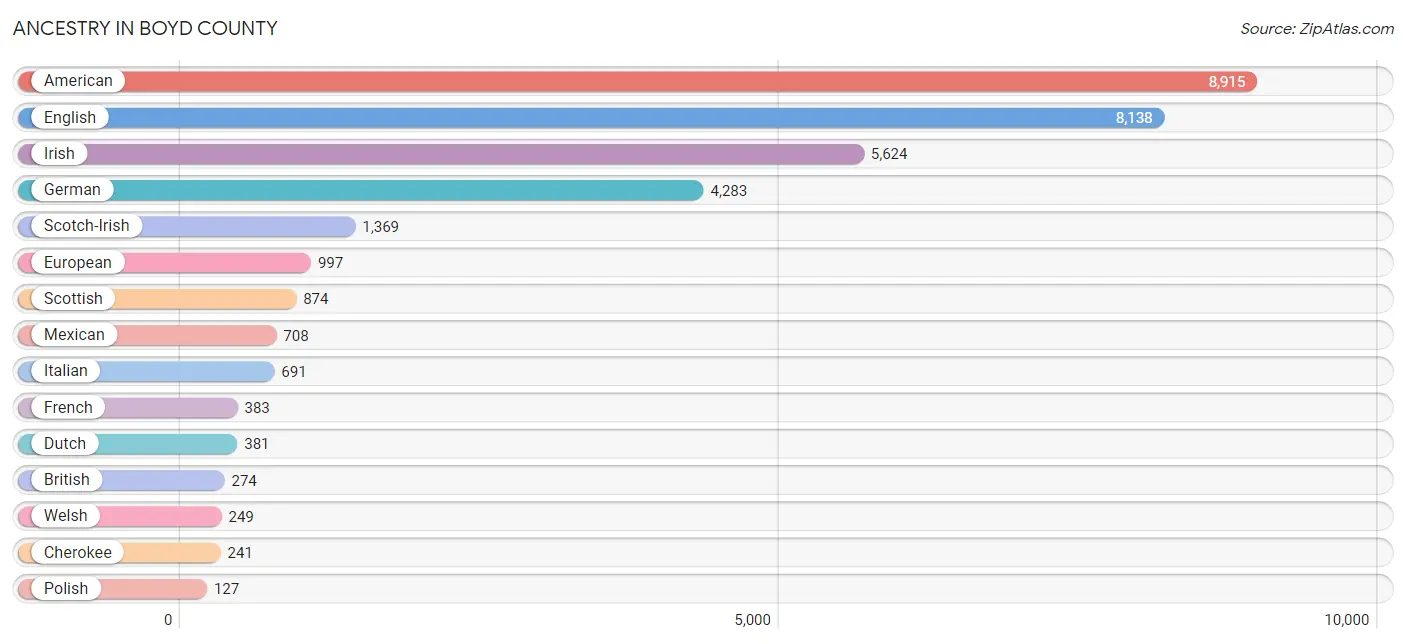
Ancestry in Boyd County
The most populous ancestries reported in Boyd County are American (8,915 | 18.5%), English (8,138 | 16.9%), Irish (5,624 | 11.7%), German (4,283 | 8.9%), and Scotch-Irish (1,369 | 2.8%), together accounting for 58.7% of all Boyd County residents.
| Ancestry | # Population | % Population |
| African | 22 | 0.1% |
| American | 8,915 | 18.5% |
| Apache | 15 | 0.0% |
| Arab | 64 | 0.1% |
| Austrian | 18 | 0.0% |
| Belgian | 34 | 0.1% |
| Bhutanese | 33 | 0.1% |
| Blackfeet | 60 | 0.1% |
| British | 274 | 0.6% |
| Burmese | 7 | 0.0% |
| Canadian | 36 | 0.1% |
| Celtic | 6 | 0.0% |
| Central American | 9 | 0.0% |
| Cherokee | 241 | 0.5% |
| Colombian | 76 | 0.2% |
| Cree | 32 | 0.1% |
| Cuban | 32 | 0.1% |
| Czech | 12 | 0.0% |
| Czechoslovakian | 6 | 0.0% |
| Danish | 13 | 0.0% |
| Dutch | 381 | 0.8% |
| Eastern European | 77 | 0.2% |
| English | 8,138 | 16.9% |
| European | 997 | 2.1% |
| Finnish | 40 | 0.1% |
| French | 383 | 0.8% |
| German | 4,283 | 8.9% |
| Greek | 126 | 0.3% |
| Guamanian / Chamorro | 7 | 0.0% |
| Honduran | 8 | 0.0% |
| Hungarian | 36 | 0.1% |
| Indian (Asian) | 113 | 0.2% |
| Indonesian | 62 | 0.1% |
| Irish | 5,624 | 11.7% |
| Italian | 691 | 1.4% |
| Jamaican | 17 | 0.0% |
| Jordanian | 38 | 0.1% |
| Kenyan | 5 | 0.0% |
| Korean | 19 | 0.0% |
| Malaysian | 65 | 0.1% |
| Maltese | 14 | 0.0% |
| Mexican | 708 | 1.5% |
| Moroccan | 26 | 0.1% |
| Native Hawaiian | 10 | 0.0% |
| Northern European | 69 | 0.1% |
| Norwegian | 16 | 0.0% |
| Pakistani | 33 | 0.1% |
| Pennsylvania German | 70 | 0.2% |
| Polish | 127 | 0.3% |
| Portuguese | 28 | 0.1% |
| Puerto Rican | 37 | 0.1% |
| Romanian | 27 | 0.1% |
| Russian | 43 | 0.1% |
| Salvadoran | 1 | 0.0% |
| Samoan | 18 | 0.0% |
| Scandinavian | 9 | 0.0% |
| Scotch-Irish | 1,369 | 2.8% |
| Scottish | 874 | 1.8% |
| Sioux | 12 | 0.0% |
| Slavic | 23 | 0.1% |
| South American | 76 | 0.2% |
| Spaniard | 6 | 0.0% |
| Sri Lankan | 11 | 0.0% |
| Subsaharan African | 27 | 0.1% |
| Swedish | 10 | 0.0% |
| Swiss | 24 | 0.1% |
| Thai | 7 | 0.0% |
| Ukrainian | 9 | 0.0% |
| Welsh | 249 | 0.5% | View All 69 Rows |
Immigrants in Boyd County
The most numerous immigrant groups reported in Boyd County came from Latin America (173 | 0.4%), Asia (169 | 0.4%), Central America (152 | 0.3%), Mexico (130 | 0.3%), and Europe (96 | 0.2%), together accounting for 1.5% of all Boyd County residents.

| Immigration Origin | # Population | % Population |
| Africa | 5 | 0.0% |
| Asia | 169 | 0.4% |
| Canada | 12 | 0.0% |
| Caribbean | 21 | 0.0% |
| Central America | 152 | 0.3% |
| China | 25 | 0.1% |
| Cuba | 21 | 0.0% |
| Eastern Africa | 5 | 0.0% |
| Eastern Asia | 47 | 0.1% |
| Eastern Europe | 19 | 0.0% |
| El Salvador | 14 | 0.0% |
| England | 21 | 0.0% |
| Europe | 96 | 0.2% |
| Germany | 38 | 0.1% |
| Honduras | 8 | 0.0% |
| Japan | 22 | 0.1% |
| Jordan | 38 | 0.1% |
| Kenya | 5 | 0.0% |
| Laos | 32 | 0.1% |
| Latin America | 173 | 0.4% |
| Lebanon | 3 | 0.0% |
| Mexico | 130 | 0.3% |
| Netherlands | 4 | 0.0% |
| Northern Europe | 29 | 0.1% |
| Russia | 10 | 0.0% |
| South Central Asia | 23 | 0.1% |
| South Eastern Asia | 58 | 0.1% |
| Southern Europe | 6 | 0.0% |
| Spain | 6 | 0.0% |
| Ukraine | 9 | 0.0% |
| Western Asia | 41 | 0.1% |
| Western Europe | 42 | 0.1% | View All 32 Rows |
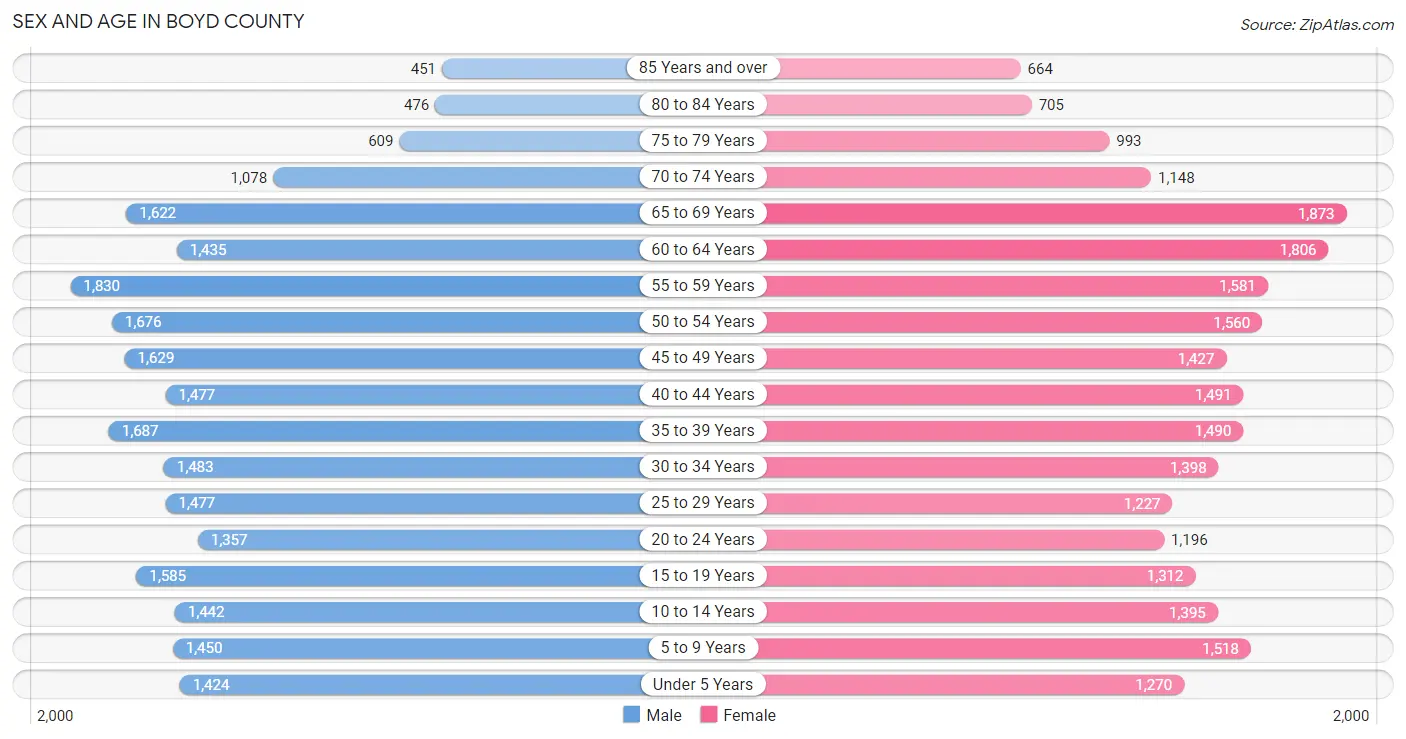
Sex and Age in Boyd County
Sex and Age in Boyd County
The most populous age groups in Boyd County are 55 to 59 Years (1,830 | 7.6%) for men and 65 to 69 Years (1,873 | 7.8%) for women.
| Age Bracket | Male | Female |
| Under 5 Years | 1,424 (5.9%) | 1,270 (5.3%) |
| 5 to 9 Years | 1,450 (6.0%) | 1,518 (6.3%) |
| 10 to 14 Years | 1,442 (6.0%) | 1,395 (5.8%) |
| 15 to 19 Years | 1,585 (6.6%) | 1,312 (5.4%) |
| 20 to 24 Years | 1,357 (5.6%) | 1,196 (5.0%) |
| 25 to 29 Years | 1,477 (6.1%) | 1,227 (5.1%) |
| 30 to 34 Years | 1,483 (6.1%) | 1,398 (5.8%) |
| 35 to 39 Years | 1,687 (7.0%) | 1,490 (6.2%) |
| 40 to 44 Years | 1,477 (6.1%) | 1,491 (6.2%) |
| 45 to 49 Years | 1,629 (6.7%) | 1,427 (5.9%) |
| 50 to 54 Years | 1,676 (6.9%) | 1,560 (6.5%) |
| 55 to 59 Years | 1,830 (7.6%) | 1,581 (6.6%) |
| 60 to 64 Years | 1,435 (5.9%) | 1,806 (7.5%) |
| 65 to 69 Years | 1,622 (6.7%) | 1,873 (7.8%) |
| 70 to 74 Years | 1,078 (4.5%) | 1,148 (4.8%) |
| 75 to 79 Years | 609 (2.5%) | 993 (4.1%) |
| 80 to 84 Years | 476 (2.0%) | 705 (2.9%) |
| 85 Years and over | 451 (1.9%) | 664 (2.8%) |
| Total | 24,188 (100.0%) | 24,054 (100.0%) |
Families and Households in Boyd County
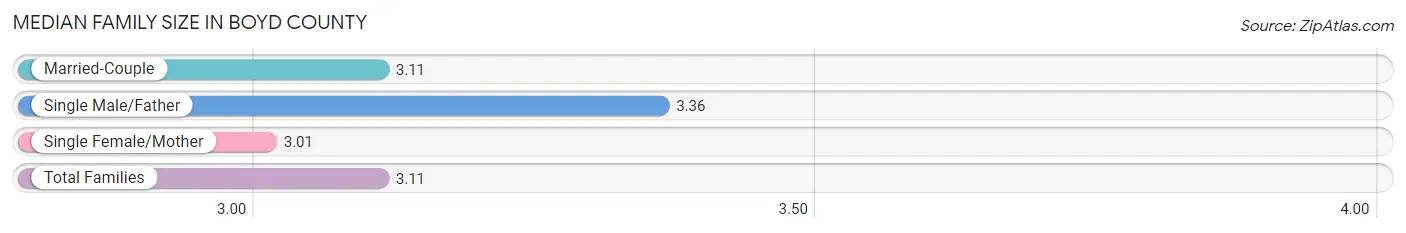
Median Family Size in Boyd County
The median family size in Boyd County is 3.11 persons per family, with single male/father families (1,042 | 8.7%) accounting for the largest median family size of 3.36 persons per family. On the other hand, single female/mother families (2,702 | 22.5%) represent the smallest median family size with 3.01 persons per family.
| Family Type | # Families | Family Size |
| Married-Couple | 8,278 (68.9%) | 3.11 |
| Single Male/Father | 1,042 (8.7%) | 3.36 |
| Single Female/Mother | 2,702 (22.5%) | 3.01 |
| Total Families | 12,022 (100.0%) | 3.11 |
Median Household Size in Boyd County
The median household size in Boyd County is 2.51 persons per household, with single male/father households (1,042 | 5.6%) accounting for the largest median household size of 3.73 persons per household. non-family households (6,511 | 35.1%) represent the smallest median household size with 1.20 persons per household.
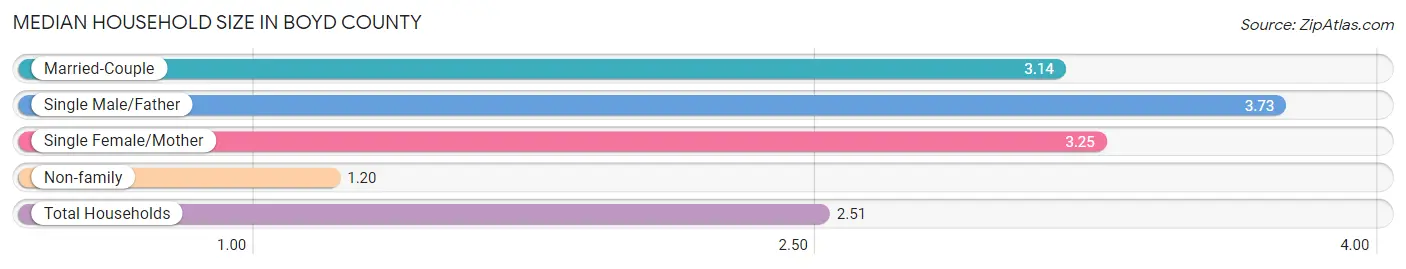
| Household Type | # Households | Household Size |
| Married-Couple | 8,278 (44.7%) | 3.14 |
| Single Male/Father | 1,042 (5.6%) | 3.73 |
| Single Female/Mother | 2,702 (14.6%) | 3.25 |
| Non-family | 6,511 (35.1%) | 1.20 |
| Total Households | 18,533 (100.0%) | 2.51 |
Household Size by Marriage Status in Boyd County
Out of a total of 18,533 households in Boyd County, 12,022 (64.9%) are family households, while 6,511 (35.1%) are nonfamily households. The most numerous type of family households are 2-person households, comprising 5,980, and the most common type of nonfamily households are 1-person households, comprising 5,601.
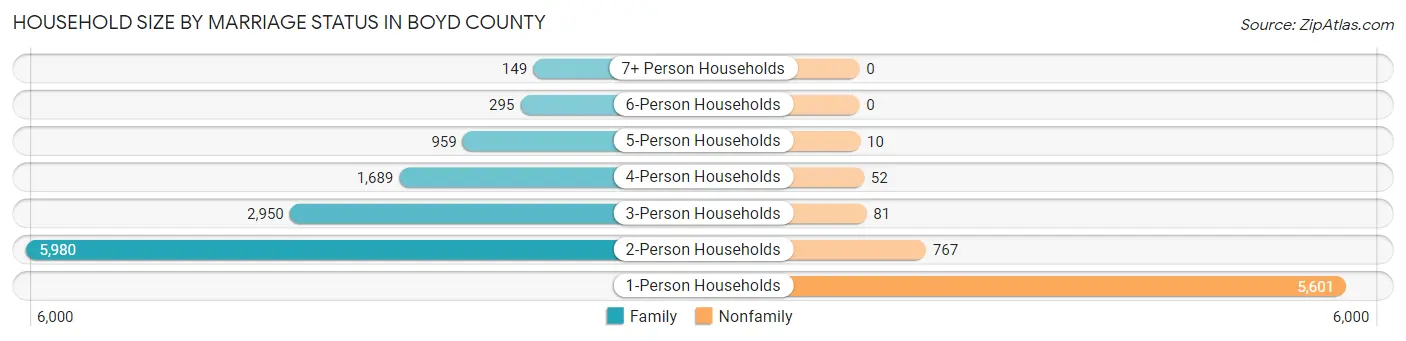
| Household Size | Family Households | Nonfamily Households |
| 1-Person Households | - | 5,601 (30.2%) |
| 2-Person Households | 5,980 (32.3%) | 767 (4.1%) |
| 3-Person Households | 2,950 (15.9%) | 81 (0.4%) |
| 4-Person Households | 1,689 (9.1%) | 52 (0.3%) |
| 5-Person Households | 959 (5.2%) | 10 (0.1%) |
| 6-Person Households | 295 (1.6%) | 0 (0.0%) |
| 7+ Person Households | 149 (0.8%) | 0 (0.0%) |
| Total | 12,022 (64.9%) | 6,511 (35.1%) |
Female Fertility in Boyd County
Fertility by Age in Boyd County
Average fertility rate in Boyd County is 40.0 births per 1,000 women. Women in the age bracket of 20 to 34 years have the highest fertility rate with 83.0 births per 1,000 women. Women in the age bracket of 20 to 34 years acount for 81.4% of all women with births.
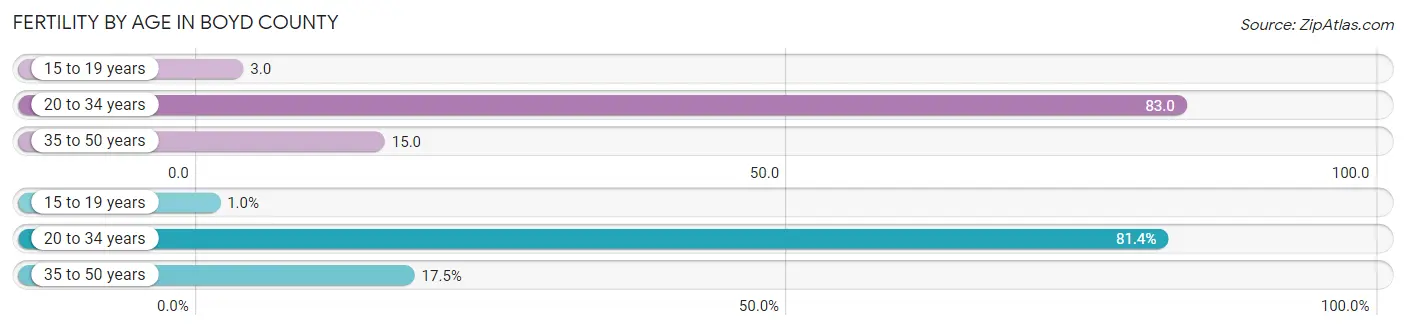
| Age Bracket | Women with Births | Births / 1,000 Women |
| 15 to 19 years | 4 (1.0%) | 3.0 |
| 20 to 34 years | 316 (81.4%) | 83.0 |
| 35 to 50 years | 68 (17.5%) | 15.0 |
| Total | 388 (100.0%) | 40.0 |
Fertility by Age by Marriage Status in Boyd County
59.0% of women with births (388) in Boyd County are married. The highest percentage of unmarried women with births falls into 15 to 19 years age bracket with 100.0% of them unmarried at the time of birth, while the lowest percentage of unmarried women with births belong to 20 to 34 years age bracket with 38.0% of them unmarried.
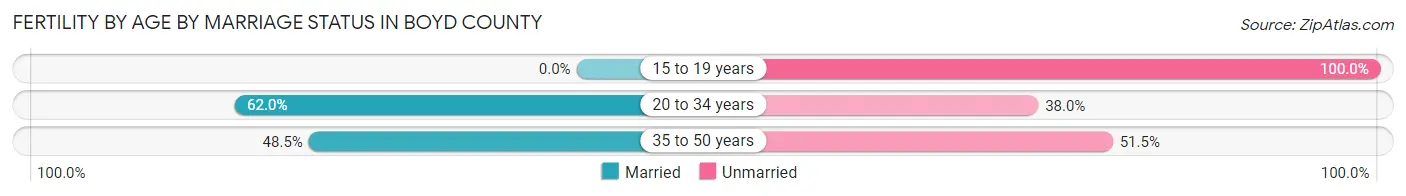
| Age Bracket | Married | Unmarried |
| 15 to 19 years | 0 (0.0%) | 4 (100.0%) |
| 20 to 34 years | 196 (62.0%) | 120 (38.0%) |
| 35 to 50 years | 33 (48.5%) | 35 (51.5%) |
| Total | 229 (59.0%) | 159 (41.0%) |
Fertility by Education in Boyd County
Average fertility rate in Boyd County is 40.0 births per 1,000 women. Women with the education attainment of college or associate's degree have the highest fertility rate of 66.0 births per 1,000 women, while women with the education attainment of bachelor's degree have the lowest fertility at 8.0 births per 1,000 women. Women with the education attainment of college or associate's degree represent 66.0% of all women with births.
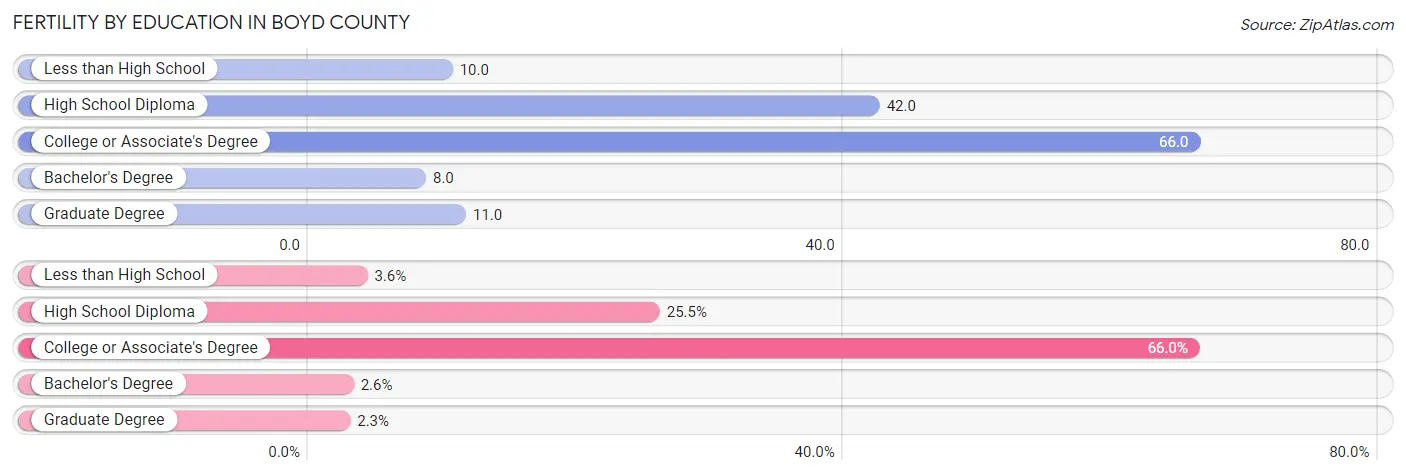
| Educational Attainment | Women with Births | Births / 1,000 Women |
| Less than High School | 14 (3.6%) | 10.0 |
| High School Diploma | 99 (25.5%) | 42.0 |
| College or Associate's Degree | 256 (66.0%) | 66.0 |
| Bachelor's Degree | 10 (2.6%) | 8.0 |
| Graduate Degree | 9 (2.3%) | 11.0 |
| Total | 388 (100.0%) | 40.0 |
Fertility by Education by Marriage Status in Boyd County
41.0% of women with births in Boyd County are unmarried. Women with the educational attainment of less than high school are most likely to be married with 100.0% of them married at childbirth, while women with the educational attainment of high school diploma are least likely to be married with 100.0% of them unmarried at childbirth.
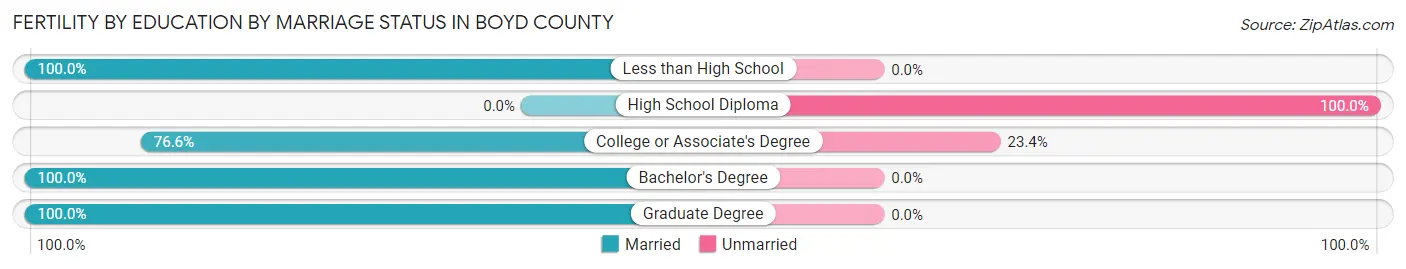
| Educational Attainment | Married | Unmarried |
| Less than High School | 14 (100.0%) | 0 (0.0%) |
| High School Diploma | 0 (0.0%) | 99 (100.0%) |
| College or Associate's Degree | 196 (76.6%) | 60 (23.4%) |
| Bachelor's Degree | 10 (100.0%) | 0 (0.0%) |
| Graduate Degree | 9 (100.0%) | 0 (0.0%) |
| Total | 229 (59.0%) | 159 (41.0%) |
Income in Boyd County
Income Overview in Boyd County
Per Capita Income in Boyd County is $30,993, while median incomes of families and households are $72,259 and $58,327 respectively.
| Characteristic | Number | Measure |
| Per Capita Income | 48,242 | $30,993 |
| Median Family Income | 12,022 | $72,259 |
| Mean Family Income | 12,022 | $90,583 |
| Median Household Income | 18,533 | $58,327 |
| Mean Household Income | 18,533 | $76,156 |
| Income Deficit | 12,022 | $11,427 |
| Wage / Income Gap (%) | 48,242 | 24.30% |
| Wage / Income Gap ($) | 48,242 | 75.70¢ per $1 |
| Gini / Inequality Index | 48,242 | 0.46 |
Earnings by Sex in Boyd County
Average Earnings in Boyd County are $34,889, $40,815 for men and $30,898 for women, a difference of 24.3%.
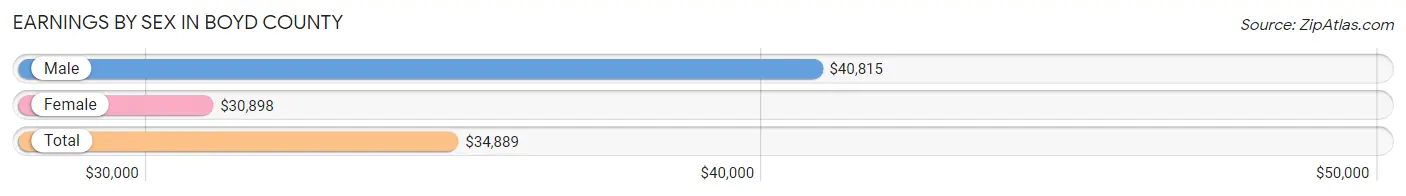
| Sex | Number | Average Earnings |
| Male | 11,221 (52.2%) | $40,815 |
| Female | 10,256 (47.7%) | $30,898 |
| Total | 21,477 (100.0%) | $34,889 |
Earnings by Sex by Income Bracket in Boyd County
The most common earnings brackets in Boyd County are $100,000+ for men (1,775 | 15.8%) and $30,000 to $34,999 for women (1,051 | 10.2%).
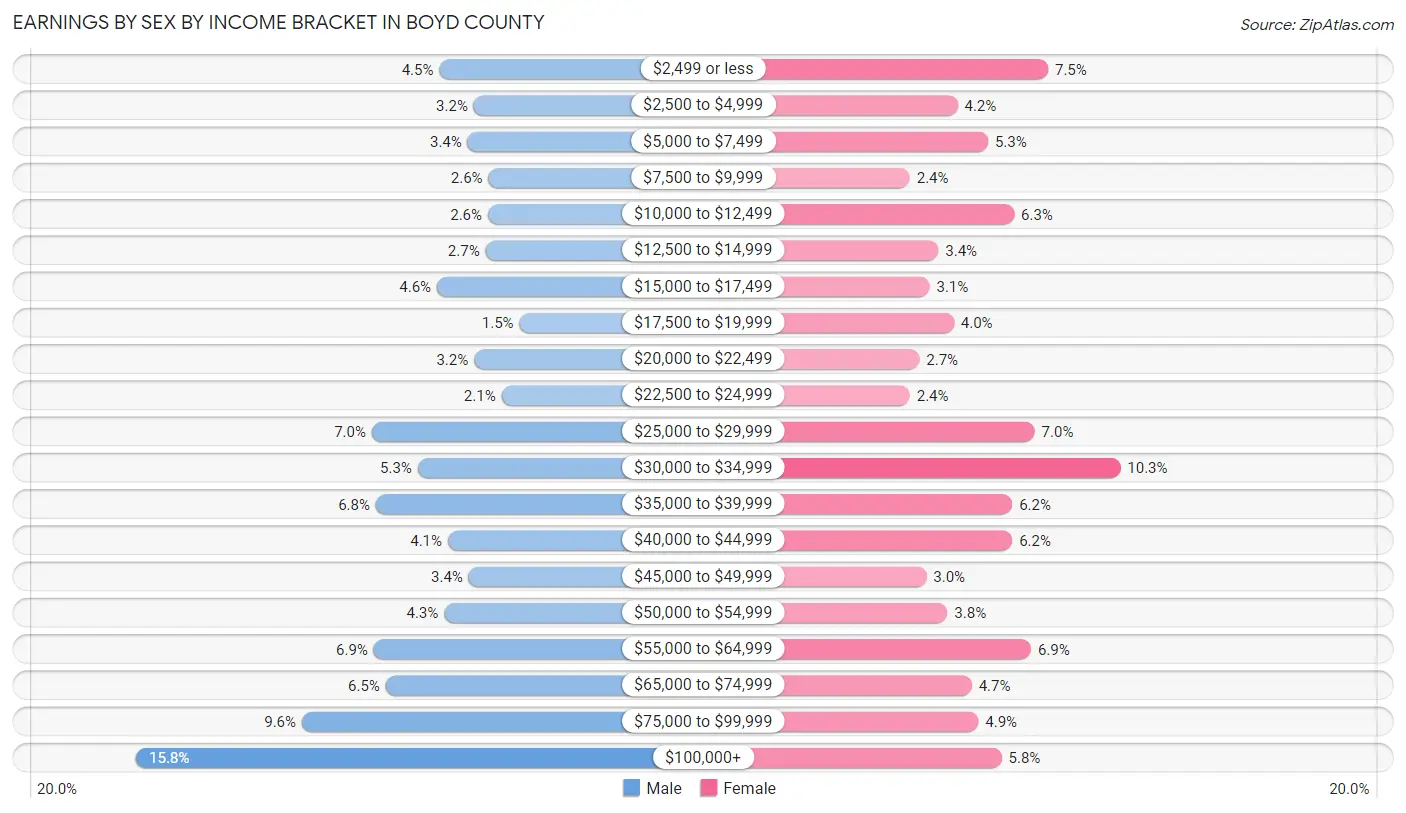
| Income | Male | Female |
| $2,499 or less | 500 (4.5%) | 773 (7.5%) |
| $2,500 to $4,999 | 356 (3.2%) | 426 (4.2%) |
| $5,000 to $7,499 | 382 (3.4%) | 543 (5.3%) |
| $7,500 to $9,999 | 294 (2.6%) | 242 (2.4%) |
| $10,000 to $12,499 | 296 (2.6%) | 643 (6.3%) |
| $12,500 to $14,999 | 306 (2.7%) | 352 (3.4%) |
| $15,000 to $17,499 | 510 (4.5%) | 318 (3.1%) |
| $17,500 to $19,999 | 164 (1.5%) | 411 (4.0%) |
| $20,000 to $22,499 | 355 (3.2%) | 279 (2.7%) |
| $22,500 to $24,999 | 239 (2.1%) | 242 (2.4%) |
| $25,000 to $29,999 | 784 (7.0%) | 722 (7.0%) |
| $30,000 to $34,999 | 591 (5.3%) | 1,051 (10.2%) |
| $35,000 to $39,999 | 768 (6.8%) | 636 (6.2%) |
| $40,000 to $44,999 | 464 (4.1%) | 636 (6.2%) |
| $45,000 to $49,999 | 377 (3.4%) | 306 (3.0%) |
| $50,000 to $54,999 | 480 (4.3%) | 387 (3.8%) |
| $55,000 to $64,999 | 776 (6.9%) | 708 (6.9%) |
| $65,000 to $74,999 | 726 (6.5%) | 480 (4.7%) |
| $75,000 to $99,999 | 1,078 (9.6%) | 506 (4.9%) |
| $100,000+ | 1,775 (15.8%) | 595 (5.8%) |
| Total | 11,221 (100.0%) | 10,256 (100.0%) |
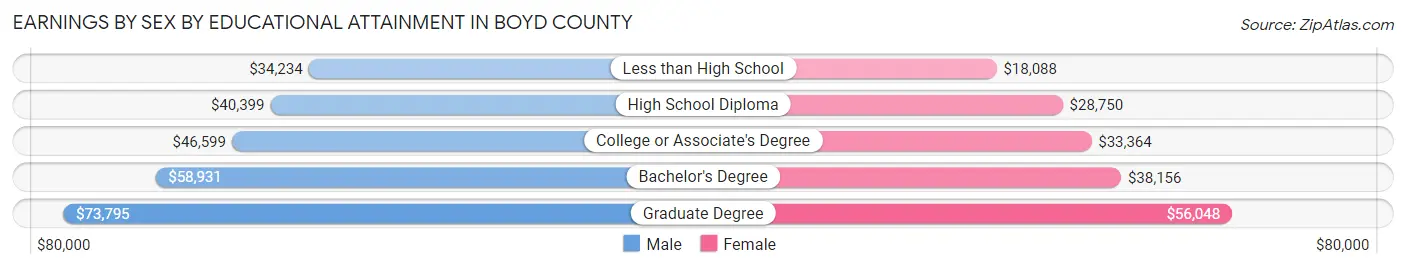
Earnings by Sex by Educational Attainment in Boyd County
Average earnings in Boyd County are $46,009 for men and $33,532 for women, a difference of 27.1%. Men with an educational attainment of graduate degree enjoy the highest average annual earnings of $73,795, while those with less than high school education earn the least with $34,234. Women with an educational attainment of graduate degree earn the most with the average annual earnings of $56,048, while those with less than high school education have the smallest earnings of $18,088.
| Educational Attainment | Male Income | Female Income |
| Less than High School | $34,234 | $18,088 |
| High School Diploma | $40,399 | $28,750 |
| College or Associate's Degree | $46,599 | $33,364 |
| Bachelor's Degree | $58,931 | $38,156 |
| Graduate Degree | $73,795 | $56,048 |
| Total | $46,009 | $33,532 |
Family Income in Boyd County
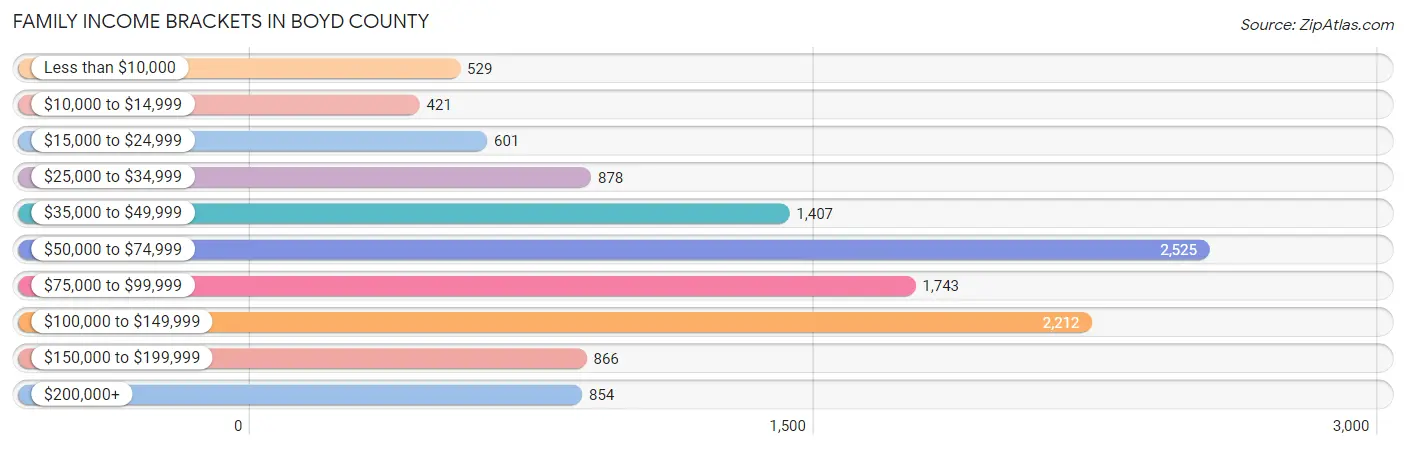
Family Income Brackets in Boyd County
According to the Boyd County family income data, there are 2,525 families falling into the $50,000 to $74,999 income range, which is the most common income bracket and makes up 21.0% of all families. Conversely, the $10,000 to $14,999 income bracket is the least frequent group with only 421 families (3.5%) belonging to this category.
| Income Bracket | # Families | % Families |
| Less than $10,000 | 529 | 4.4% |
| $10,000 to $14,999 | 421 | 3.5% |
| $15,000 to $24,999 | 601 | 5.0% |
| $25,000 to $34,999 | 878 | 7.3% |
| $35,000 to $49,999 | 1,407 | 11.7% |
| $50,000 to $74,999 | 2,525 | 21.0% |
| $75,000 to $99,999 | 1,743 | 14.5% |
| $100,000 to $149,999 | 2,212 | 18.4% |
| $150,000 to $199,999 | 866 | 7.2% |
| $200,000+ | 854 | 7.1% |
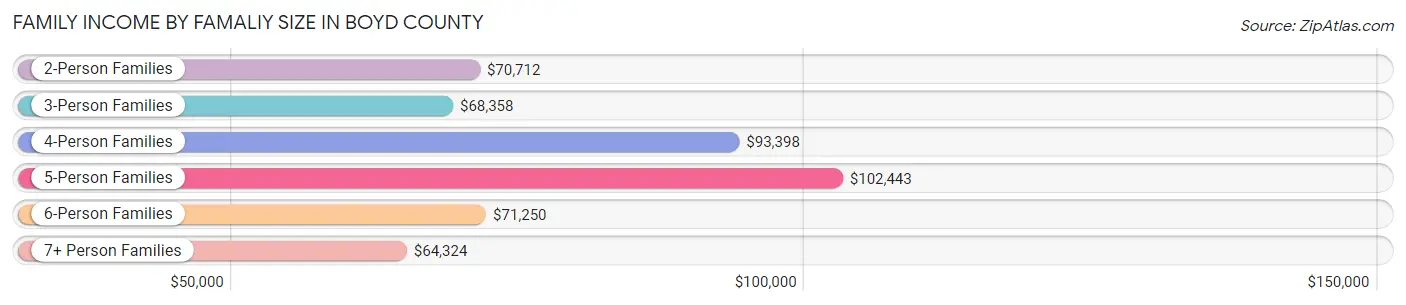
Family Income by Famaliy Size in Boyd County
5-person families (777 | 6.5%) account for the highest median family income in Boyd County with $102,443 per family, while 2-person families (6,340 | 52.7%) have the highest median income of $35,356 per family member.
| Income Bracket | # Families | Median Income |
| 2-Person Families | 6,340 (52.7%) | $70,712 |
| 3-Person Families | 2,963 (24.6%) | $68,358 |
| 4-Person Families | 1,631 (13.6%) | $93,398 |
| 5-Person Families | 777 (6.5%) | $102,443 |
| 6-Person Families | 187 (1.6%) | $71,250 |
| 7+ Person Families | 124 (1.0%) | $64,324 |
| Total | 12,022 (100.0%) | $72,259 |
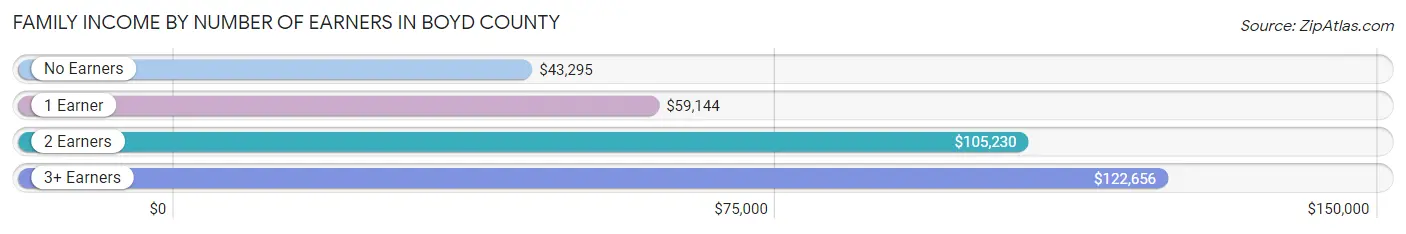
Family Income by Number of Earners in Boyd County
The median family income in Boyd County is $72,259, with families comprising 3+ earners (755) having the highest median family income of $122,656, while families with no earners (2,574) have the lowest median family income of $43,295, accounting for 6.3% and 21.4% of families, respectively.
| Number of Earners | # Families | Median Income |
| No Earners | 2,574 (21.4%) | $43,295 |
| 1 Earner | 4,630 (38.5%) | $59,144 |
| 2 Earners | 4,063 (33.8%) | $105,230 |
| 3+ Earners | 755 (6.3%) | $122,656 |
| Total | 12,022 (100.0%) | $72,259 |
Household Income in Boyd County
Household Income Brackets in Boyd County
With 3,429 households falling in the category, the $50,000 to $74,999 income range is the most frequent in Boyd County, accounting for 18.5% of all households. In contrast, only 908 households (4.9%) fall into the $150,000 to $199,999 income bracket, making it the least populous group.
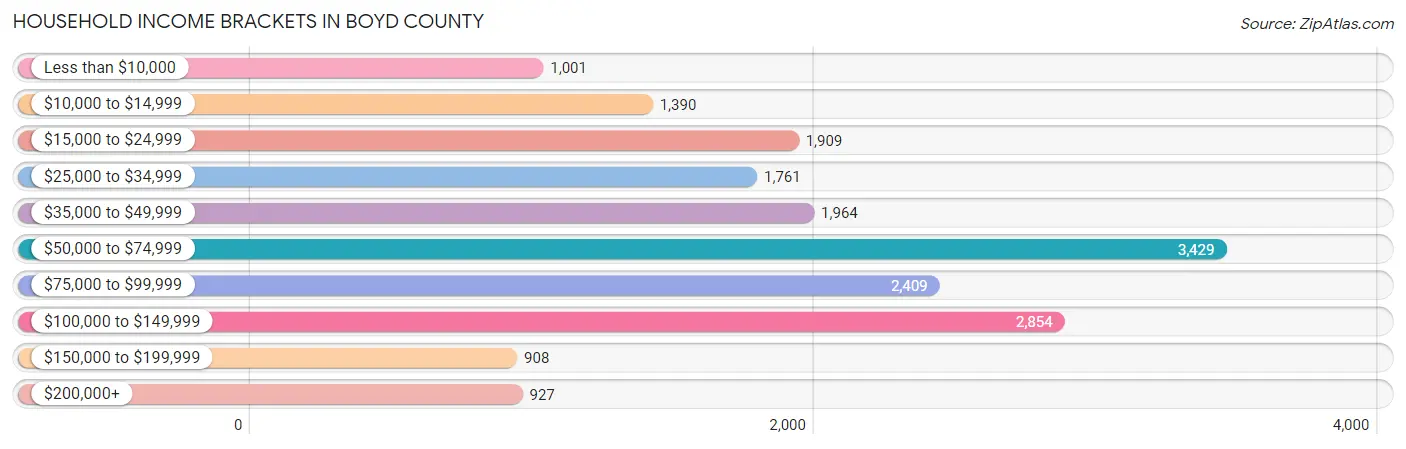
| Income Bracket | # Households | % Households |
| Less than $10,000 | 1,001 | 5.4% |
| $10,000 to $14,999 | 1,390 | 7.5% |
| $15,000 to $24,999 | 1,909 | 10.3% |
| $25,000 to $34,999 | 1,761 | 9.5% |
| $35,000 to $49,999 | 1,964 | 10.6% |
| $50,000 to $74,999 | 3,429 | 18.5% |
| $75,000 to $99,999 | 2,409 | 13.0% |
| $100,000 to $149,999 | 2,854 | 15.4% |
| $150,000 to $199,999 | 908 | 4.9% |
| $200,000+ | 927 | 5.0% |
Household Income by Householder Age in Boyd County
The median household income in Boyd County is $58,327, with the highest median household income of $66,278 found in the 25 to 44 years age bracket for the primary householder. A total of 5,343 households (28.8%) fall into this category. Meanwhile, the 65+ years age bracket for the primary householder has the lowest median household income of $47,454, with 5,837 households (31.5%) in this group.

| Income Bracket | # Households | Median Income |
| 15 to 24 Years | 527 (2.8%) | $51,367 |
| 25 to 44 Years | 5,343 (28.8%) | $66,278 |
| 45 to 64 Years | 6,826 (36.8%) | $64,832 |
| 65+ Years | 5,837 (31.5%) | $47,454 |
| Total | 18,533 (100.0%) | $58,327 |
Poverty in Boyd County
Income Below Poverty by Sex and Age in Boyd County
With 14.3% poverty level for males and 20.4% for females among the residents of Boyd County, 12 to 14 year old males and 15 year old females are the most vulnerable to poverty, with 282 males (31.3%) and 106 females (41.4%) in their respective age groups living below the poverty level.
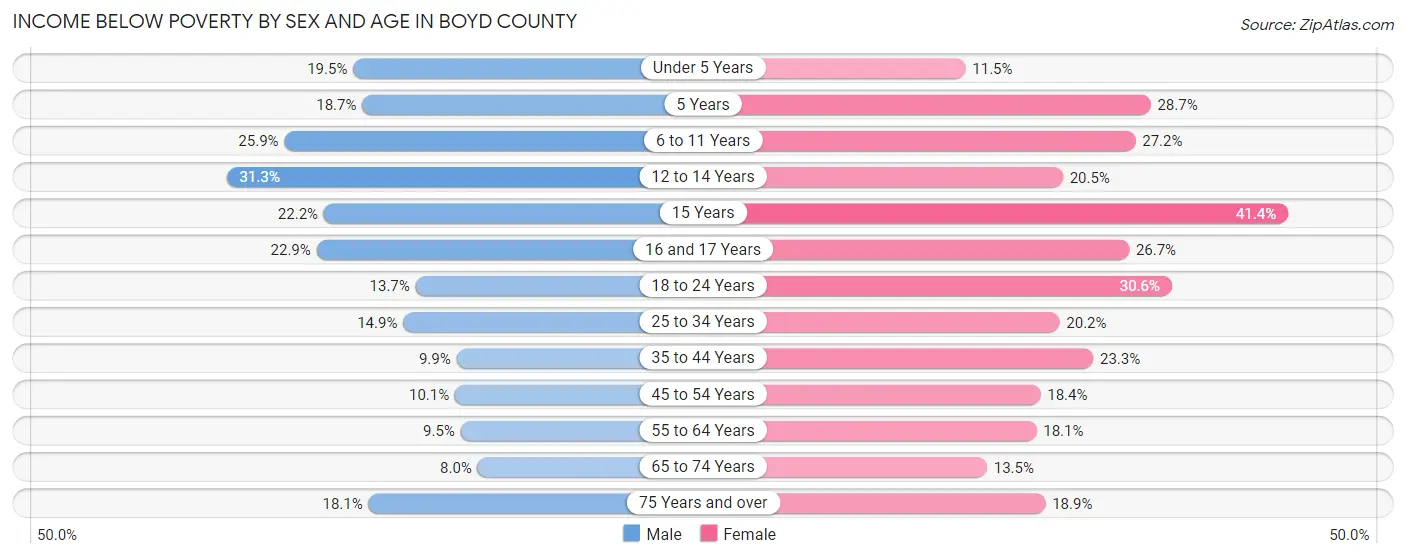
| Age Bracket | Male | Female |
| Under 5 Years | 273 (19.5%) | 143 (11.5%) |
| 5 Years | 39 (18.7%) | 98 (28.6%) |
| 6 to 11 Years | 427 (25.9%) | 441 (27.2%) |
| 12 to 14 Years | 282 (31.3%) | 173 (20.5%) |
| 15 Years | 78 (22.2%) | 106 (41.4%) |
| 16 and 17 Years | 158 (22.9%) | 149 (26.7%) |
| 18 to 24 Years | 253 (13.7%) | 516 (30.6%) |
| 25 to 34 Years | 411 (14.9%) | 530 (20.2%) |
| 35 to 44 Years | 274 (9.9%) | 689 (23.3%) |
| 45 to 54 Years | 298 (10.1%) | 548 (18.4%) |
| 55 to 64 Years | 293 (9.5%) | 609 (18.0%) |
| 65 to 74 Years | 210 (8.0%) | 404 (13.5%) |
| 75 Years and over | 266 (18.1%) | 403 (18.9%) |
| Total | 3,262 (14.3%) | 4,809 (20.4%) |
Income Above Poverty by Sex and Age in Boyd County
According to the poverty statistics in Boyd County, males aged 65 to 74 years and females aged under 5 years are the age groups that are most secure financially, with 92.0% of males and 88.5% of females in these age groups living above the poverty line.
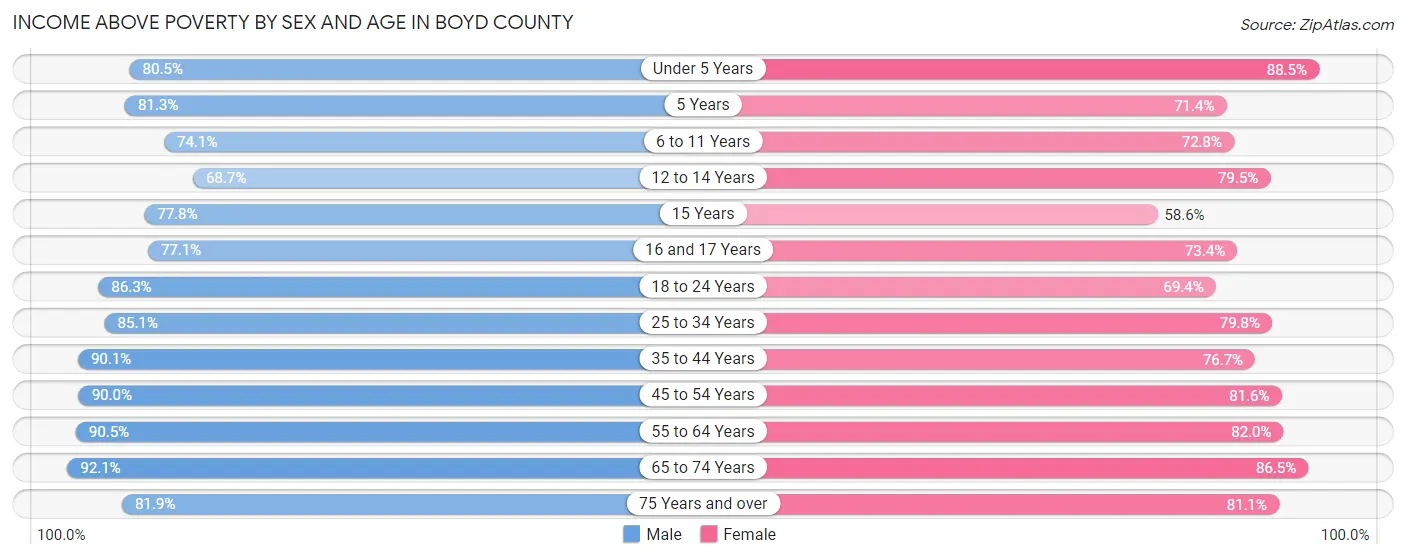
| Age Bracket | Male | Female |
| Under 5 Years | 1,127 (80.5%) | 1,104 (88.5%) |
| 5 Years | 170 (81.3%) | 244 (71.4%) |
| 6 to 11 Years | 1,222 (74.1%) | 1,178 (72.8%) |
| 12 to 14 Years | 620 (68.7%) | 671 (79.5%) |
| 15 Years | 273 (77.8%) | 150 (58.6%) |
| 16 and 17 Years | 532 (77.1%) | 410 (73.4%) |
| 18 to 24 Years | 1,592 (86.3%) | 1,169 (69.4%) |
| 25 to 34 Years | 2,354 (85.1%) | 2,095 (79.8%) |
| 35 to 44 Years | 2,492 (90.1%) | 2,266 (76.7%) |
| 45 to 54 Years | 2,666 (89.9%) | 2,427 (81.6%) |
| 55 to 64 Years | 2,782 (90.5%) | 2,765 (82.0%) |
| 65 to 74 Years | 2,432 (92.0%) | 2,597 (86.5%) |
| 75 Years and over | 1,205 (81.9%) | 1,731 (81.1%) |
| Total | 19,467 (85.7%) | 18,807 (79.6%) |
Income Below Poverty Among Married-Couple Families in Boyd County
The poverty statistics for married-couple families in Boyd County show that 6.5% or 535 of the total 8,278 families live below the poverty line. Families with 3 or 4 children have the highest poverty rate of 19.9%, comprising of 108 families. On the other hand, families with 5 or more children have the lowest poverty rate of 0.0%, which includes 0 families.
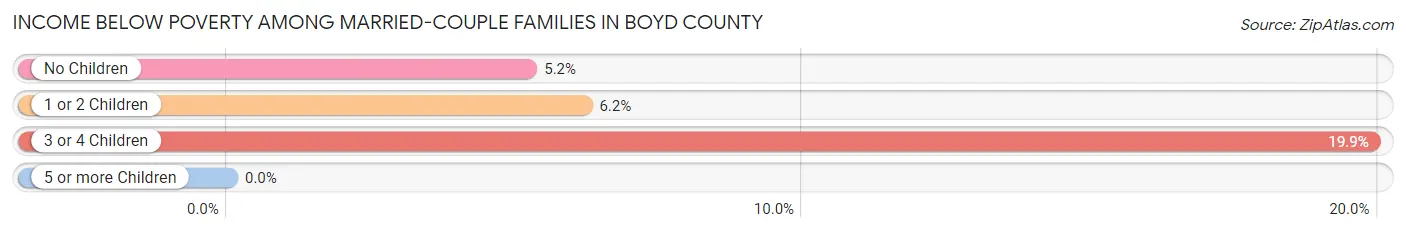
| Children | Above Poverty | Below Poverty |
| No Children | 4,909 (94.8%) | 270 (5.2%) |
| 1 or 2 Children | 2,387 (93.8%) | 157 (6.2%) |
| 3 or 4 Children | 435 (80.1%) | 108 (19.9%) |
| 5 or more Children | 12 (100.0%) | 0 (0.0%) |
| Total | 7,743 (93.5%) | 535 (6.5%) |
Income Below Poverty Among Single-Parent Households in Boyd County
According to the poverty data in Boyd County, 16.2% or 169 single-father households and 28.6% or 772 single-mother households are living below the poverty line. Among single-father households, those with 3 or 4 children have the highest poverty rate, with 64 households (57.7%) experiencing poverty. Likewise, among single-mother households, those with 3 or 4 children have the highest poverty rate, with 144 households (64.0%) falling below the poverty line.
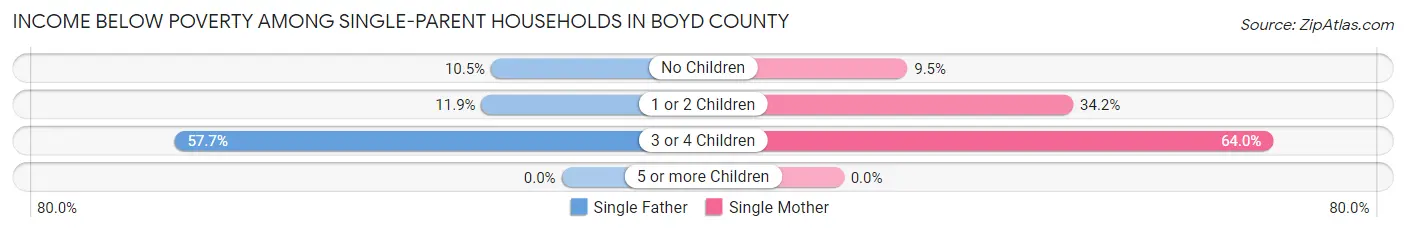
| Children | Single Father | Single Mother |
| No Children | 45 (10.5%) | 84 (9.5%) |
| 1 or 2 Children | 60 (11.9%) | 544 (34.2%) |
| 3 or 4 Children | 64 (57.7%) | 144 (64.0%) |
| 5 or more Children | 0 (0.0%) | 0 (0.0%) |
| Total | 169 (16.2%) | 772 (28.6%) |
Income Below Poverty Among Married-Couple vs Single-Parent Households in Boyd County
The poverty data for Boyd County shows that 535 of the married-couple family households (6.5%) and 941 of the single-parent households (25.1%) are living below the poverty level. Within the married-couple family households, those with 3 or 4 children have the highest poverty rate, with 108 households (19.9%) falling below the poverty line. Among the single-parent households, those with 3 or 4 children have the highest poverty rate, with 208 household (61.9%) living below poverty.
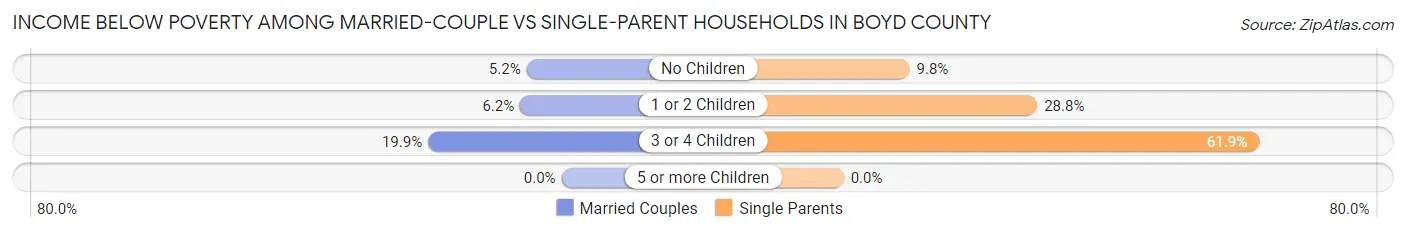
| Children | Married-Couple Families | Single-Parent Households |
| No Children | 270 (5.2%) | 129 (9.8%) |
| 1 or 2 Children | 157 (6.2%) | 604 (28.8%) |
| 3 or 4 Children | 108 (19.9%) | 208 (61.9%) |
| 5 or more Children | 0 (0.0%) | 0 (0.0%) |
| Total | 535 (6.5%) | 941 (25.1%) |
Employment Characteristics in Boyd County
Employment by Class of Employer in Boyd County
Among the 18,840 employed individuals in Boyd County, private company employees (12,190 | 64.7%), not-for-profit organizations (2,614 | 13.9%), and local government employees (1,320 | 7.0%) make up the most common classes of employment.
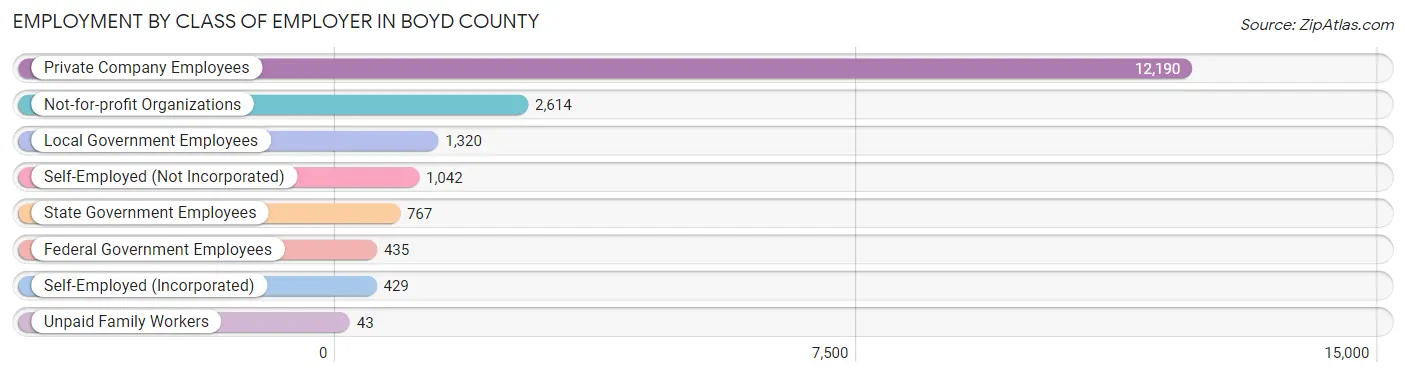
| Employer Class | # Employees | % Employees |
| Private Company Employees | 12,190 | 64.7% |
| Self-Employed (Incorporated) | 429 | 2.3% |
| Self-Employed (Not Incorporated) | 1,042 | 5.5% |
| Not-for-profit Organizations | 2,614 | 13.9% |
| Local Government Employees | 1,320 | 7.0% |
| State Government Employees | 767 | 4.1% |
| Federal Government Employees | 435 | 2.3% |
| Unpaid Family Workers | 43 | 0.2% |
| Total | 18,840 | 100.0% |
Employment Status by Age in Boyd County
According to the labor force statistics for Boyd County, out of the total population over 16 years of age (39,136), 52.5% or 20,546 individuals are in the labor force, with 6.9% or 1,418 of them unemployed. The age group with the highest labor force participation rate is 25 to 29 years, with 82.9% or 2,242 individuals in the labor force. Within the labor force, the 30 to 34 years age range has the highest percentage of unemployed individuals, with 16.1% or 359 of them being unemployed.
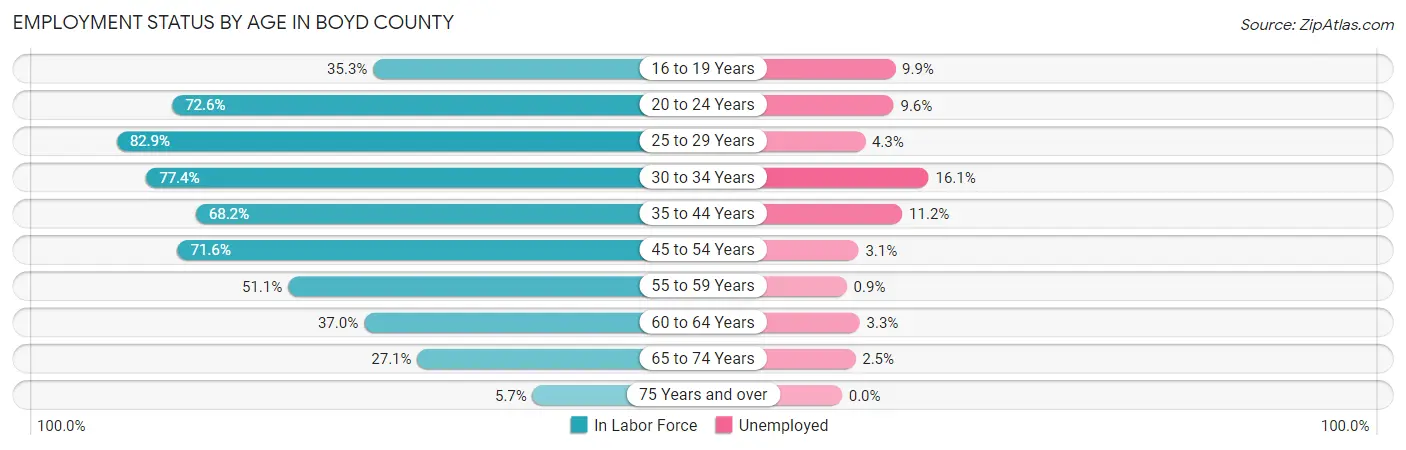
| Age Bracket | In Labor Force | Unemployed |
| 16 to 19 Years | 808 (35.3%) | 80 (9.9%) |
| 20 to 24 Years | 1,853 (72.6%) | 178 (9.6%) |
| 25 to 29 Years | 2,242 (82.9%) | 96 (4.3%) |
| 30 to 34 Years | 2,230 (77.4%) | 359 (16.1%) |
| 35 to 44 Years | 4,191 (68.2%) | 469 (11.2%) |
| 45 to 54 Years | 4,505 (71.6%) | 140 (3.1%) |
| 55 to 59 Years | 1,743 (51.1%) | 16 (0.9%) |
| 60 to 64 Years | 1,199 (37.0%) | 40 (3.3%) |
| 65 to 74 Years | 1,550 (27.1%) | 39 (2.5%) |
| 75 Years and over | 222 (5.7%) | 0 (0.0%) |
| Total | 20,546 (52.5%) | 1,418 (6.9%) |
Employment Status by Educational Attainment in Boyd County
According to labor force statistics for Boyd County, 65.3% of individuals (16,112) out of the total population between 25 and 64 years of age (24,674) are in the labor force, with 6.9% or 1,112 of them being unemployed. The group with the highest labor force participation rate are those with the educational attainment of bachelor's degree or higher, with 81.2% or 4,118 individuals in the labor force. Within the labor force, individuals with less than high school education have the highest percentage of unemployment, with 11.9% or 113 of them being unemployed.
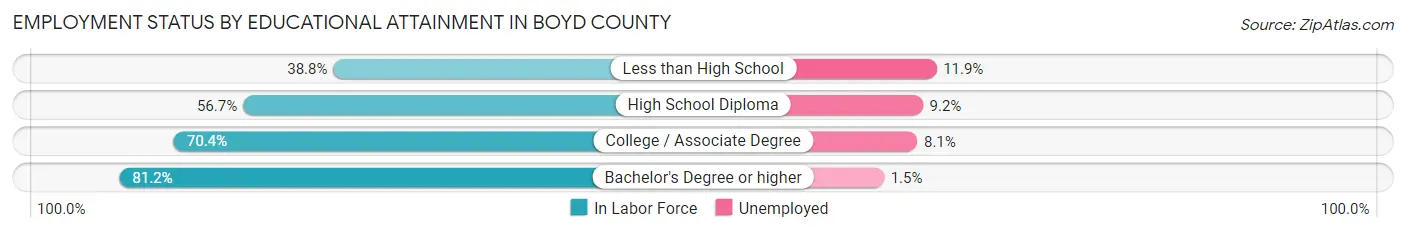
| Educational Attainment | In Labor Force | Unemployed |
| Less than High School | 949 (38.8%) | 291 (11.9%) |
| High School Diploma | 4,278 (56.7%) | 694 (9.2%) |
| College / Associate Degree | 6,768 (70.4%) | 779 (8.1%) |
| Bachelor's Degree or higher | 4,118 (81.2%) | 76 (1.5%) |
| Total | 16,112 (65.3%) | 1,703 (6.9%) |
Employment Occupations by Sex in Boyd County
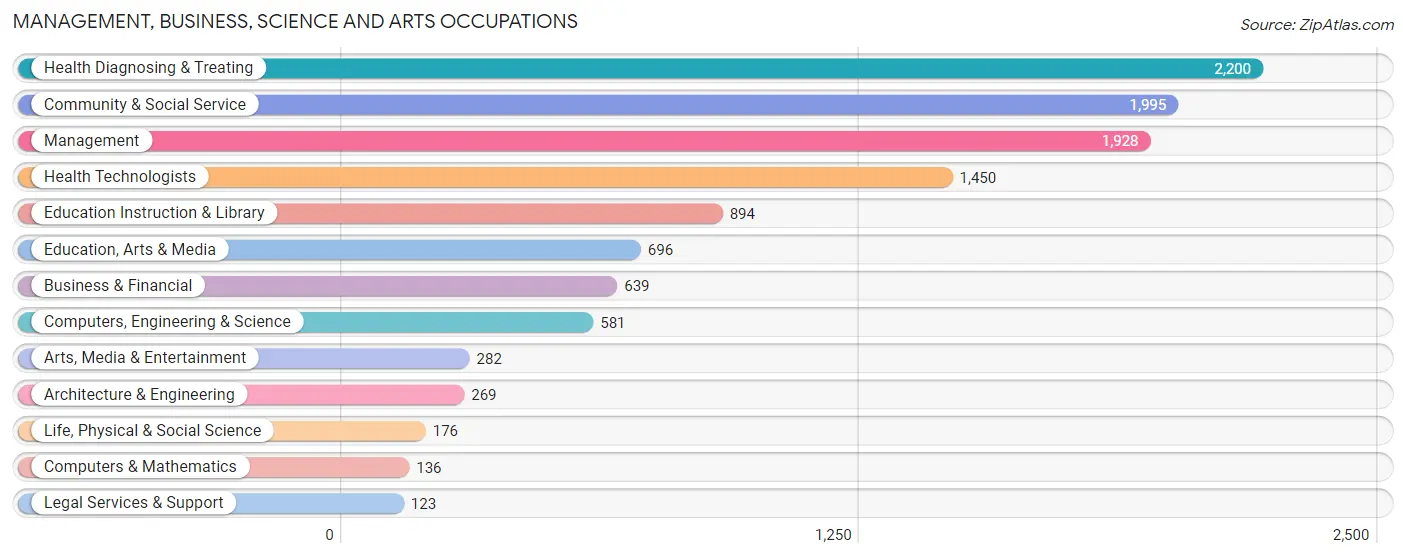
Management, Business, Science and Arts Occupations
The most common Management, Business, Science and Arts occupations in Boyd County are Health Diagnosing & Treating (2,200 | 11.5%), Community & Social Service (1,995 | 10.4%), Management (1,928 | 10.1%), Health Technologists (1,450 | 7.6%), and Education Instruction & Library (894 | 4.7%).
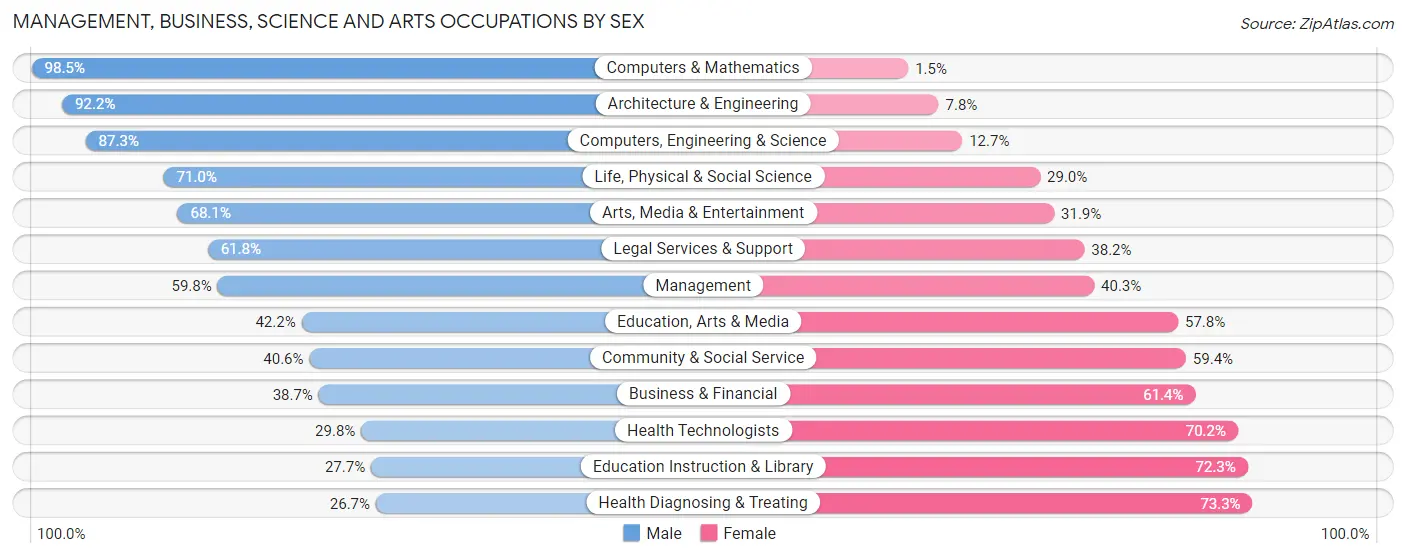
Management, Business, Science and Arts Occupations by Sex
Within the Management, Business, Science and Arts occupations in Boyd County, the most male-oriented occupations are Computers & Mathematics (98.5%), Architecture & Engineering (92.2%), and Computers, Engineering & Science (87.3%), while the most female-oriented occupations are Health Diagnosing & Treating (73.3%), Education Instruction & Library (72.3%), and Health Technologists (70.2%).
| Occupation | Male | Female |
| Management | 1,152 (59.8%) | 776 (40.3%) |
| Business & Financial | 247 (38.7%) | 392 (61.4%) |
| Computers, Engineering & Science | 507 (87.3%) | 74 (12.7%) |
| Computers & Mathematics | 134 (98.5%) | 2 (1.5%) |
| Architecture & Engineering | 248 (92.2%) | 21 (7.8%) |
| Life, Physical & Social Science | 125 (71.0%) | 51 (29.0%) |
| Community & Social Service | 810 (40.6%) | 1,185 (59.4%) |
| Education, Arts & Media | 294 (42.2%) | 402 (57.8%) |
| Legal Services & Support | 76 (61.8%) | 47 (38.2%) |
| Education Instruction & Library | 248 (27.7%) | 646 (72.3%) |
| Arts, Media & Entertainment | 192 (68.1%) | 90 (31.9%) |
| Health Diagnosing & Treating | 588 (26.7%) | 1,612 (73.3%) |
| Health Technologists | 432 (29.8%) | 1,018 (70.2%) |
| Total (Category) | 3,304 (45.0%) | 4,039 (55.0%) |
| Total (Overall) | 9,856 (51.5%) | 9,263 (48.4%) |
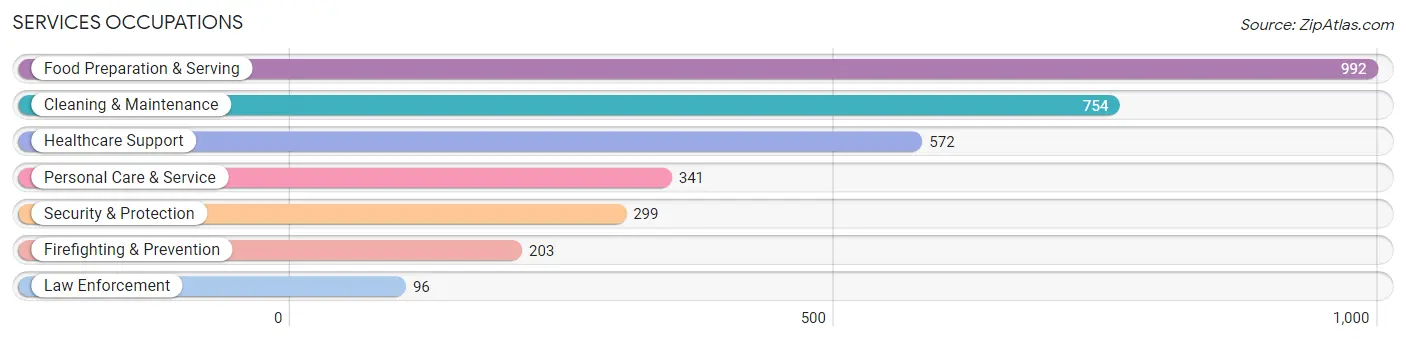
Services Occupations
The most common Services occupations in Boyd County are Food Preparation & Serving (992 | 5.2%), Cleaning & Maintenance (754 | 3.9%), Healthcare Support (572 | 3.0%), Personal Care & Service (341 | 1.8%), and Security & Protection (299 | 1.6%).
Services Occupations by Sex
Within the Services occupations in Boyd County, the most male-oriented occupations are Law Enforcement (86.5%), Security & Protection (75.2%), and Firefighting & Prevention (70.0%), while the most female-oriented occupations are Healthcare Support (77.8%), Personal Care & Service (73.6%), and Food Preparation & Serving (46.2%).
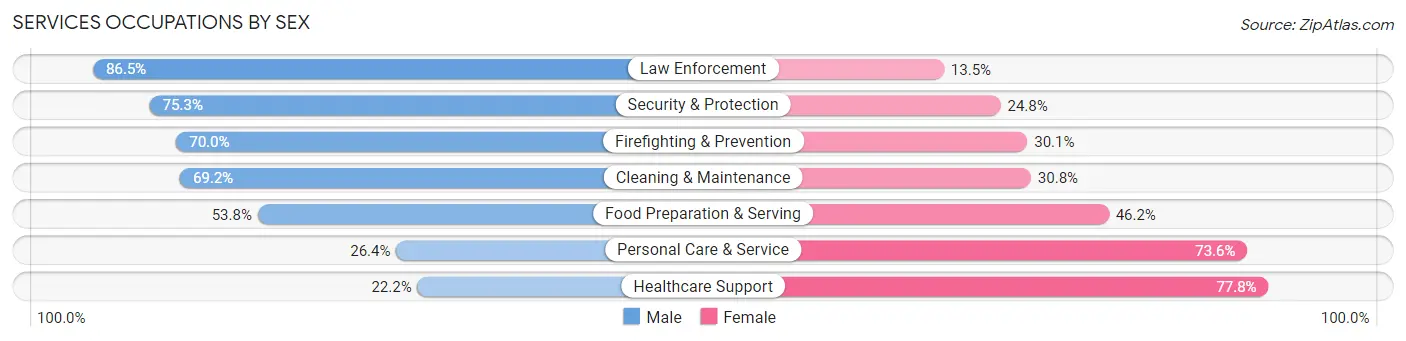
| Occupation | Male | Female |
| Healthcare Support | 127 (22.2%) | 445 (77.8%) |
| Security & Protection | 225 (75.2%) | 74 (24.7%) |
| Firefighting & Prevention | 142 (70.0%) | 61 (30.0%) |
| Law Enforcement | 83 (86.5%) | 13 (13.5%) |
| Food Preparation & Serving | 534 (53.8%) | 458 (46.2%) |
| Cleaning & Maintenance | 522 (69.2%) | 232 (30.8%) |
| Personal Care & Service | 90 (26.4%) | 251 (73.6%) |
| Total (Category) | 1,498 (50.6%) | 1,460 (49.4%) |
| Total (Overall) | 9,856 (51.5%) | 9,263 (48.4%) |
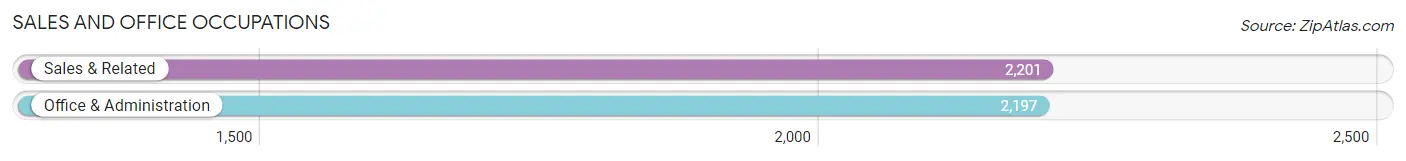
Sales and Office Occupations
The most common Sales and Office occupations in Boyd County are Sales & Related (2,201 | 11.5%), and Office & Administration (2,197 | 11.5%).
Sales and Office Occupations by Sex
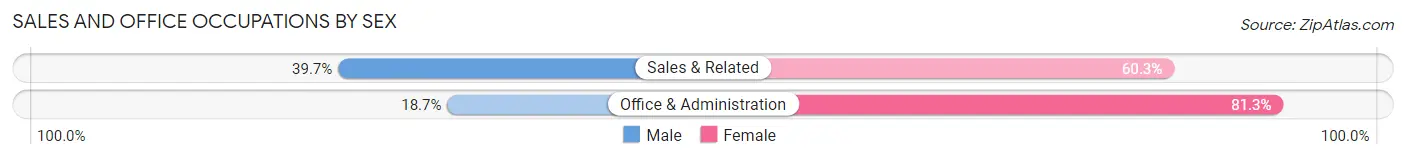
| Occupation | Male | Female |
| Sales & Related | 874 (39.7%) | 1,327 (60.3%) |
| Office & Administration | 411 (18.7%) | 1,786 (81.3%) |
| Total (Category) | 1,285 (29.2%) | 3,113 (70.8%) |
| Total (Overall) | 9,856 (51.5%) | 9,263 (48.4%) |
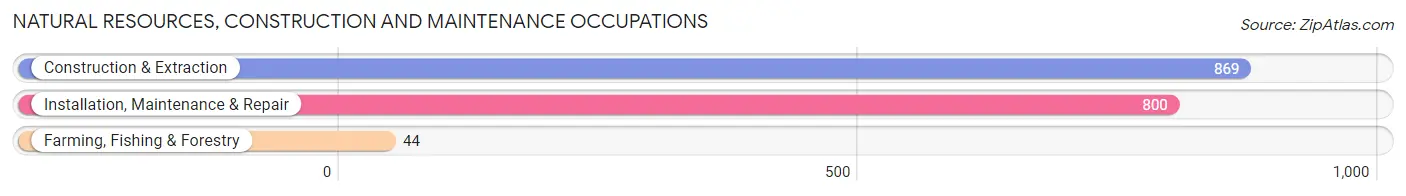
Natural Resources, Construction and Maintenance Occupations
The most common Natural Resources, Construction and Maintenance occupations in Boyd County are Construction & Extraction (869 | 4.5%), Installation, Maintenance & Repair (800 | 4.2%), and Farming, Fishing & Forestry (44 | 0.2%).
Natural Resources, Construction and Maintenance Occupations by Sex
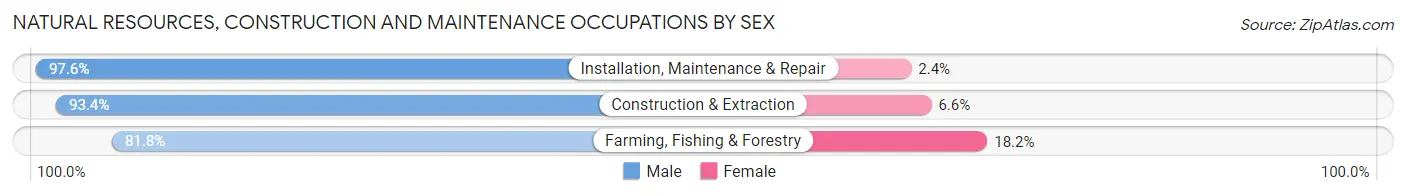
| Occupation | Male | Female |
| Farming, Fishing & Forestry | 36 (81.8%) | 8 (18.2%) |
| Construction & Extraction | 812 (93.4%) | 57 (6.6%) |
| Installation, Maintenance & Repair | 781 (97.6%) | 19 (2.4%) |
| Total (Category) | 1,629 (95.1%) | 84 (4.9%) |
| Total (Overall) | 9,856 (51.5%) | 9,263 (48.4%) |
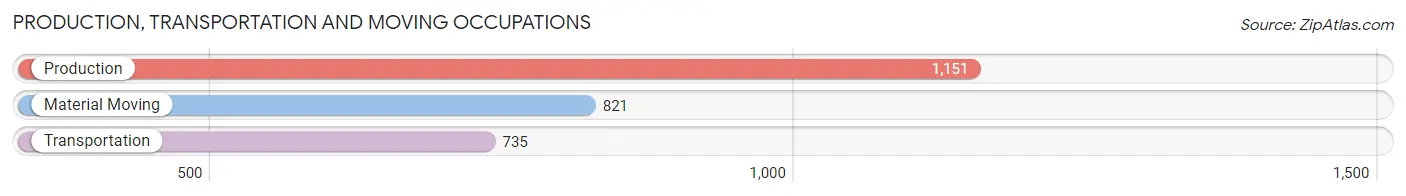
Production, Transportation and Moving Occupations
The most common Production, Transportation and Moving occupations in Boyd County are Production (1,151 | 6.0%), Material Moving (821 | 4.3%), and Transportation (735 | 3.8%).
Production, Transportation and Moving Occupations by Sex
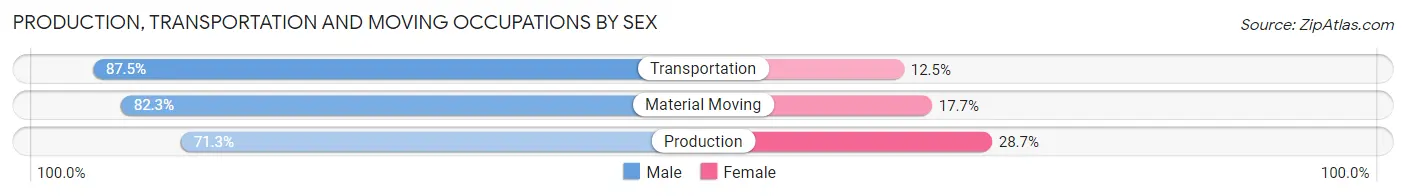
| Occupation | Male | Female |
| Production | 821 (71.3%) | 330 (28.7%) |
| Transportation | 643 (87.5%) | 92 (12.5%) |
| Material Moving | 676 (82.3%) | 145 (17.7%) |
| Total (Category) | 2,140 (79.0%) | 567 (20.9%) |
| Total (Overall) | 9,856 (51.5%) | 9,263 (48.4%) |
Employment Industries by Sex in Boyd County
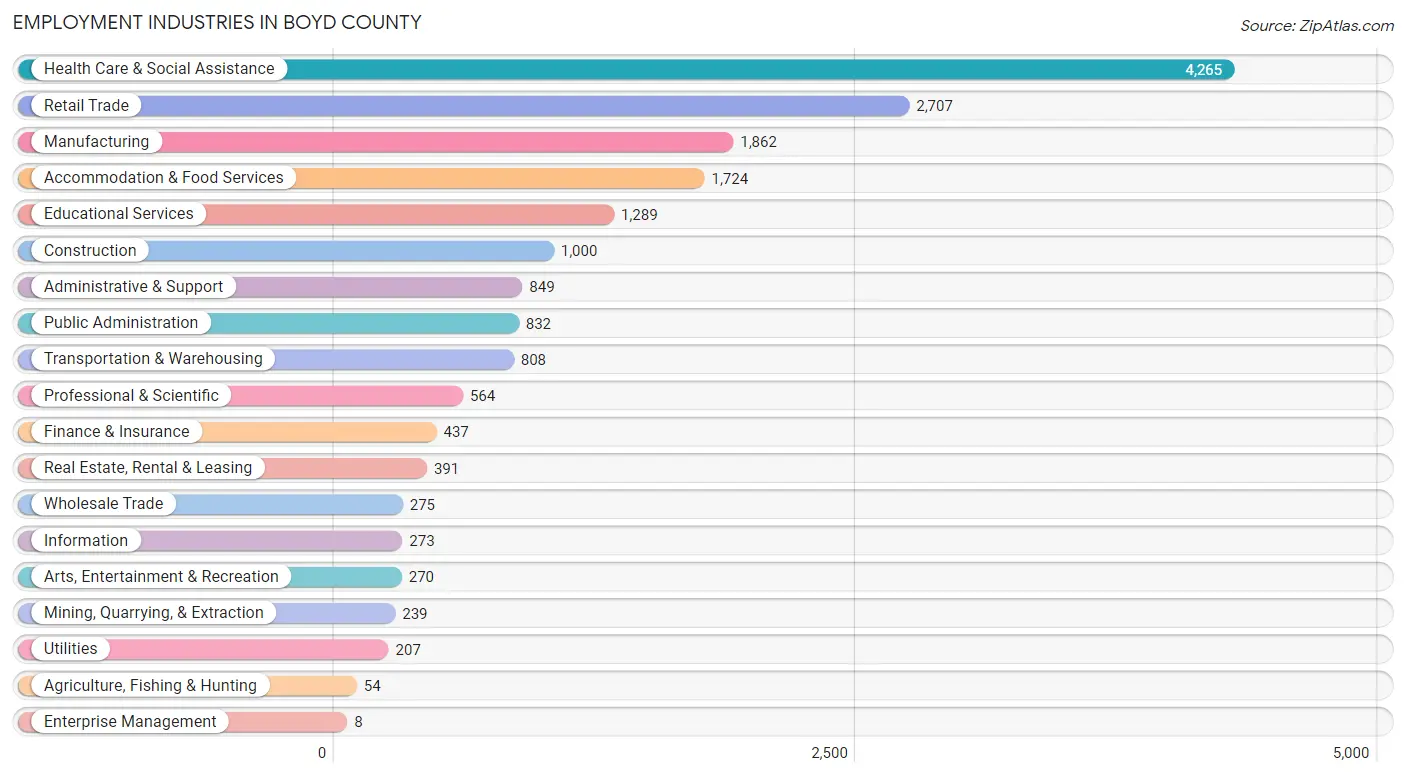
Employment Industries in Boyd County
The major employment industries in Boyd County include Health Care & Social Assistance (4,265 | 22.3%), Retail Trade (2,707 | 14.2%), Manufacturing (1,862 | 9.7%), Accommodation & Food Services (1,724 | 9.0%), and Educational Services (1,289 | 6.7%).
Employment Industries by Sex in Boyd County
The Boyd County industries that see more men than women are Mining, Quarrying, & Extraction (100.0%), Enterprise Management (100.0%), and Utilities (93.2%), whereas the industries that tend to have a higher number of women are Real Estate, Rental & Leasing (77.2%), Health Care & Social Assistance (74.5%), and Finance & Insurance (72.3%).
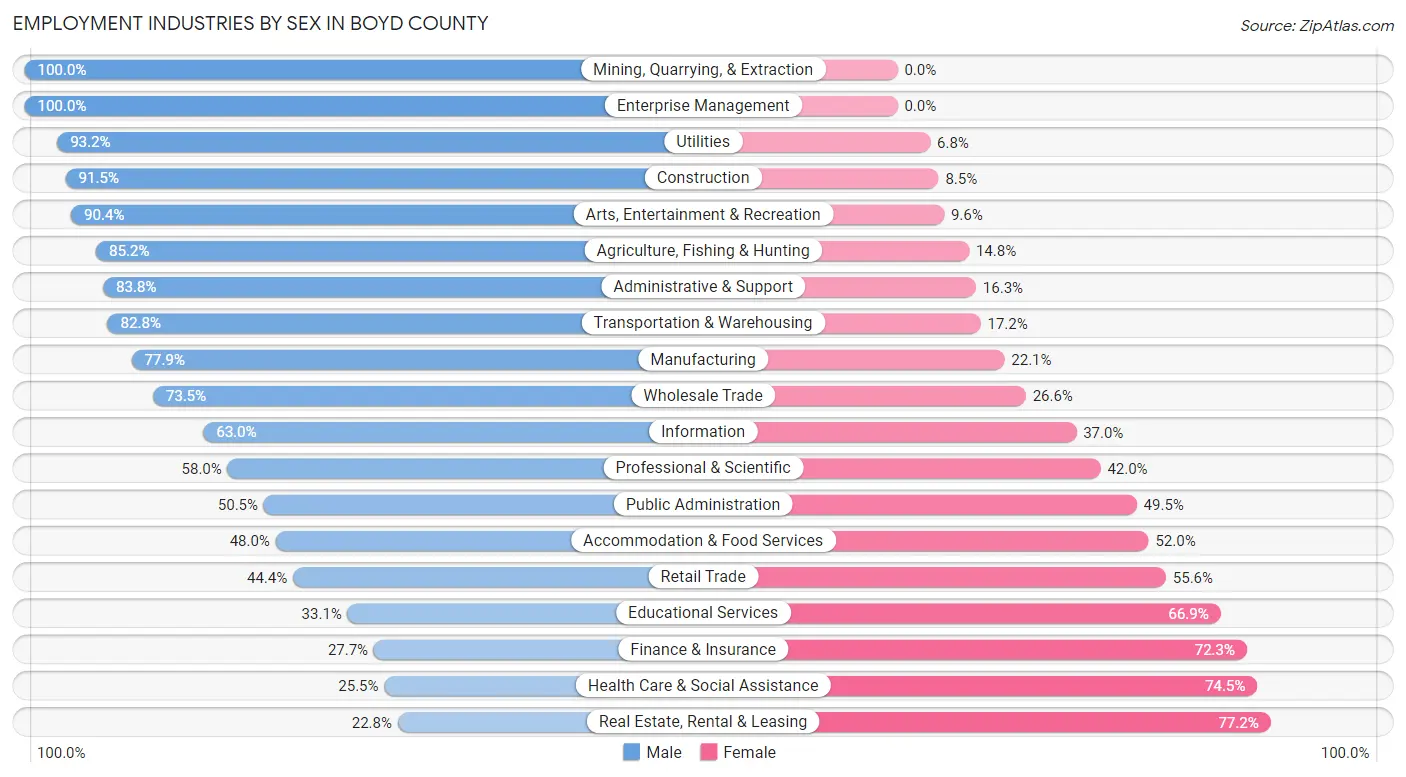
| Industry | Male | Female |
| Agriculture, Fishing & Hunting | 46 (85.2%) | 8 (14.8%) |
| Mining, Quarrying, & Extraction | 239 (100.0%) | 0 (0.0%) |
| Construction | 915 (91.5%) | 85 (8.5%) |
| Manufacturing | 1,450 (77.9%) | 412 (22.1%) |
| Wholesale Trade | 202 (73.5%) | 73 (26.6%) |
| Retail Trade | 1,203 (44.4%) | 1,504 (55.6%) |
| Transportation & Warehousing | 669 (82.8%) | 139 (17.2%) |
| Utilities | 193 (93.2%) | 14 (6.8%) |
| Information | 172 (63.0%) | 101 (37.0%) |
| Finance & Insurance | 121 (27.7%) | 316 (72.3%) |
| Real Estate, Rental & Leasing | 89 (22.8%) | 302 (77.2%) |
| Professional & Scientific | 327 (58.0%) | 237 (42.0%) |
| Enterprise Management | 8 (100.0%) | 0 (0.0%) |
| Administrative & Support | 711 (83.8%) | 138 (16.3%) |
| Educational Services | 427 (33.1%) | 862 (66.9%) |
| Health Care & Social Assistance | 1,089 (25.5%) | 3,176 (74.5%) |
| Arts, Entertainment & Recreation | 244 (90.4%) | 26 (9.6%) |
| Accommodation & Food Services | 828 (48.0%) | 896 (52.0%) |
| Public Administration | 420 (50.5%) | 412 (49.5%) |
| Total | 9,856 (51.5%) | 9,263 (48.4%) |
Education in Boyd County
School Enrollment in Boyd County
The most common levels of schooling among the 10,318 students in Boyd County are elementary school (2,435 | 23.6%), high school (2,345 | 22.7%), and middle school (2,236 | 21.7%).
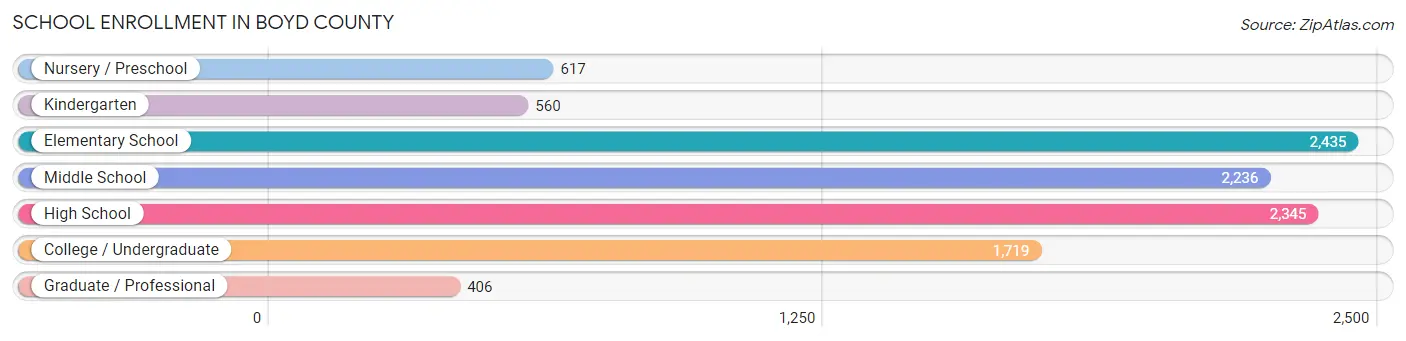
| School Level | # Students | % Students |
| Nursery / Preschool | 617 | 6.0% |
| Kindergarten | 560 | 5.4% |
| Elementary School | 2,435 | 23.6% |
| Middle School | 2,236 | 21.7% |
| High School | 2,345 | 22.7% |
| College / Undergraduate | 1,719 | 16.7% |
| Graduate / Professional | 406 | 3.9% |
| Total | 10,318 | 100.0% |
School Enrollment by Age by Funding Source in Boyd County
Out of a total of 10,318 students who are enrolled in schools in Boyd County, 794 (7.7%) attend a private institution, while the remaining 9,524 (92.3%) are enrolled in public schools. The age group of 3 to 4 year olds has the highest likelihood of being enrolled in private schools, with 86 (19.9% in the age bracket) enrolled. Conversely, the age group of 18 to 19 year olds has the lowest likelihood of being enrolled in a private school, with 746 (95.3% in the age bracket) attending a public institution.
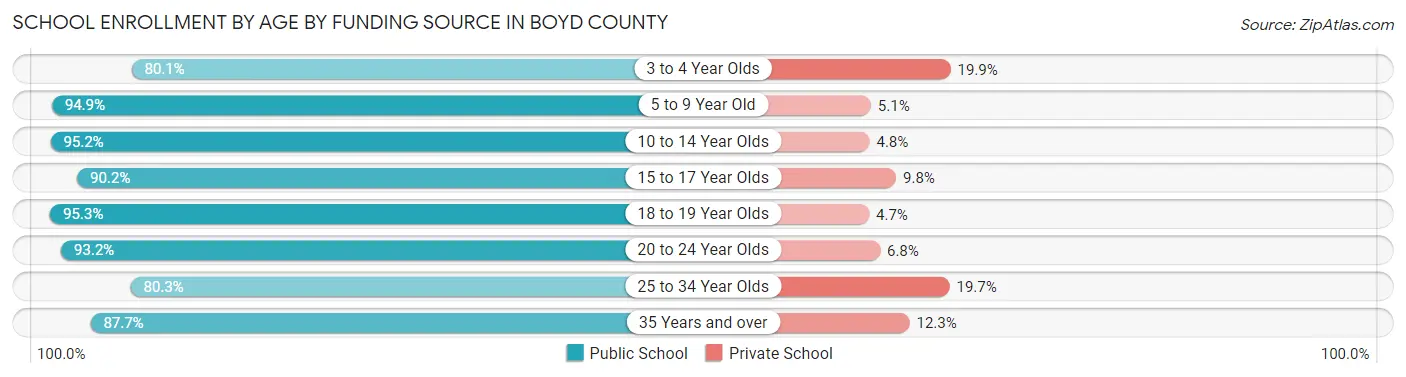
| Age Bracket | Public School | Private School |
| 3 to 4 Year Olds | 346 (80.1%) | 86 (19.9%) |
| 5 to 9 Year Old | 2,694 (94.9%) | 144 (5.1%) |
| 10 to 14 Year Olds | 2,646 (95.2%) | 134 (4.8%) |
| 15 to 17 Year Olds | 1,440 (90.2%) | 156 (9.8%) |
| 18 to 19 Year Olds | 746 (95.3%) | 37 (4.7%) |
| 20 to 24 Year Olds | 647 (93.2%) | 47 (6.8%) |
| 25 to 34 Year Olds | 521 (80.3%) | 128 (19.7%) |
| 35 Years and over | 479 (87.7%) | 67 (12.3%) |
| Total | 9,524 (92.3%) | 794 (7.7%) |
Educational Attainment by Field of Study in Boyd County
Education (1,660 | 21.6%), science & technology (1,136 | 14.8%), business (1,058 | 13.8%), arts & humanities (686 | 8.9%), and bio, nature & agricultural (570 | 7.4%) are the most common fields of study among 7,667 individuals in Boyd County who have obtained a bachelor's degree or higher.
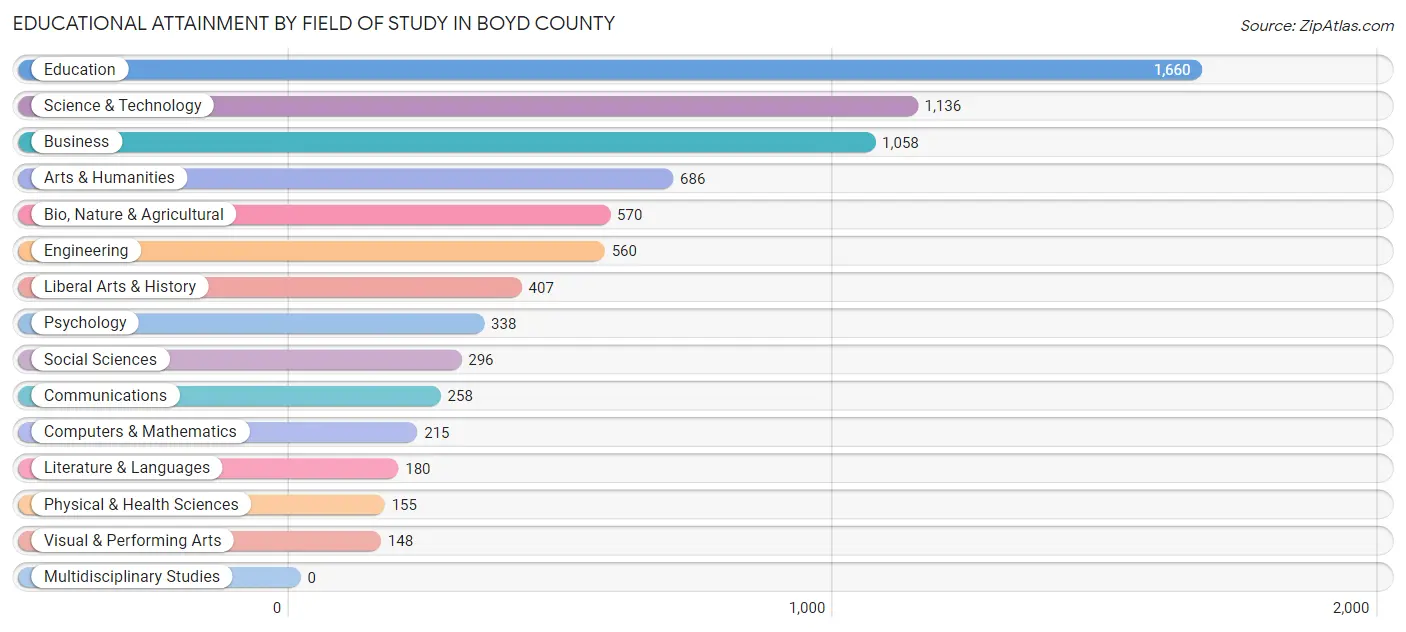
| Field of Study | # Graduates | % Graduates |
| Computers & Mathematics | 215 | 2.8% |
| Bio, Nature & Agricultural | 570 | 7.4% |
| Physical & Health Sciences | 155 | 2.0% |
| Psychology | 338 | 4.4% |
| Social Sciences | 296 | 3.9% |
| Engineering | 560 | 7.3% |
| Multidisciplinary Studies | 0 | 0.0% |
| Science & Technology | 1,136 | 14.8% |
| Business | 1,058 | 13.8% |
| Education | 1,660 | 21.6% |
| Literature & Languages | 180 | 2.4% |
| Liberal Arts & History | 407 | 5.3% |
| Visual & Performing Arts | 148 | 1.9% |
| Communications | 258 | 3.4% |
| Arts & Humanities | 686 | 8.9% |
| Total | 7,667 | 100.0% |
Transportation & Commute in Boyd County
Vehicle Availability by Sex in Boyd County
The most prevalent vehicle ownership categories in Boyd County are males with 2 vehicles (4,522, accounting for 46.4%) and females with 2 vehicles (4,036, making up 49.8%).
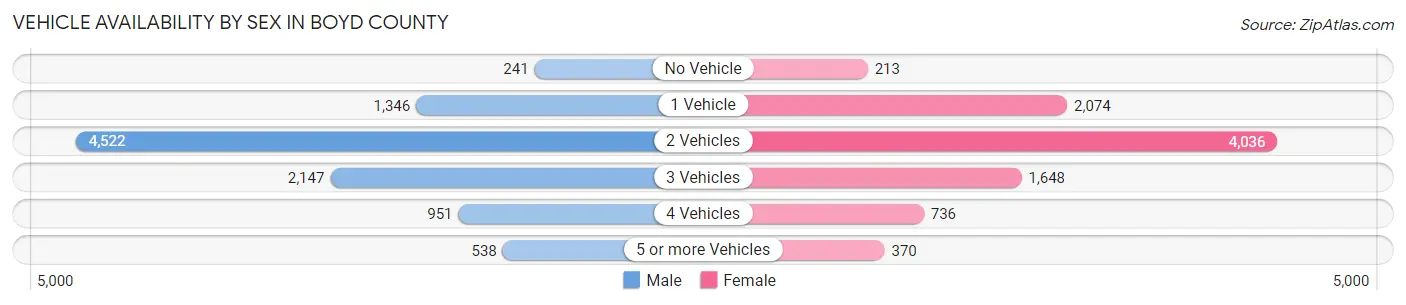
| Vehicles Available | Male | Female |
| No Vehicle | 241 (2.5%) | 213 (2.4%) |
| 1 Vehicle | 1,346 (13.8%) | 2,074 (22.9%) |
| 2 Vehicles | 4,522 (46.4%) | 4,036 (44.5%) |
| 3 Vehicles | 2,147 (22.0%) | 1,648 (18.2%) |
| 4 Vehicles | 951 (9.8%) | 736 (8.1%) |
| 5 or more Vehicles | 538 (5.5%) | 370 (4.1%) |
| Total | 9,745 (100.0%) | 9,077 (100.0%) |
Commute Time in Boyd County
The most frequently occuring commute durations in Boyd County are 15 to 19 minutes (3,670 commuters, 20.5%), 10 to 14 minutes (3,420 commuters, 19.1%), and 20 to 24 minutes (2,586 commuters, 14.4%).
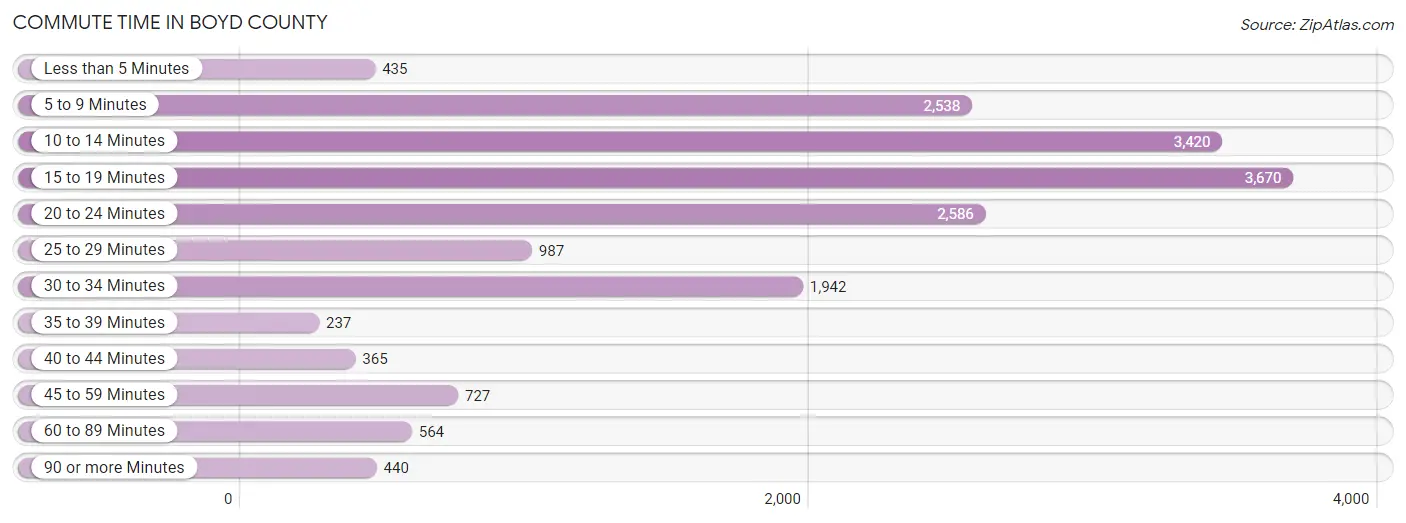
| Commute Time | # Commuters | % Commuters |
| Less than 5 Minutes | 435 | 2.4% |
| 5 to 9 Minutes | 2,538 | 14.2% |
| 10 to 14 Minutes | 3,420 | 19.1% |
| 15 to 19 Minutes | 3,670 | 20.5% |
| 20 to 24 Minutes | 2,586 | 14.4% |
| 25 to 29 Minutes | 987 | 5.5% |
| 30 to 34 Minutes | 1,942 | 10.8% |
| 35 to 39 Minutes | 237 | 1.3% |
| 40 to 44 Minutes | 365 | 2.0% |
| 45 to 59 Minutes | 727 | 4.1% |
| 60 to 89 Minutes | 564 | 3.2% |
| 90 or more Minutes | 440 | 2.5% |
Commute Time by Sex in Boyd County
The most common commute times in Boyd County are 15 to 19 minutes (1,931 commuters, 20.7%) for males and 10 to 14 minutes (1,764 commuters, 20.6%) for females.
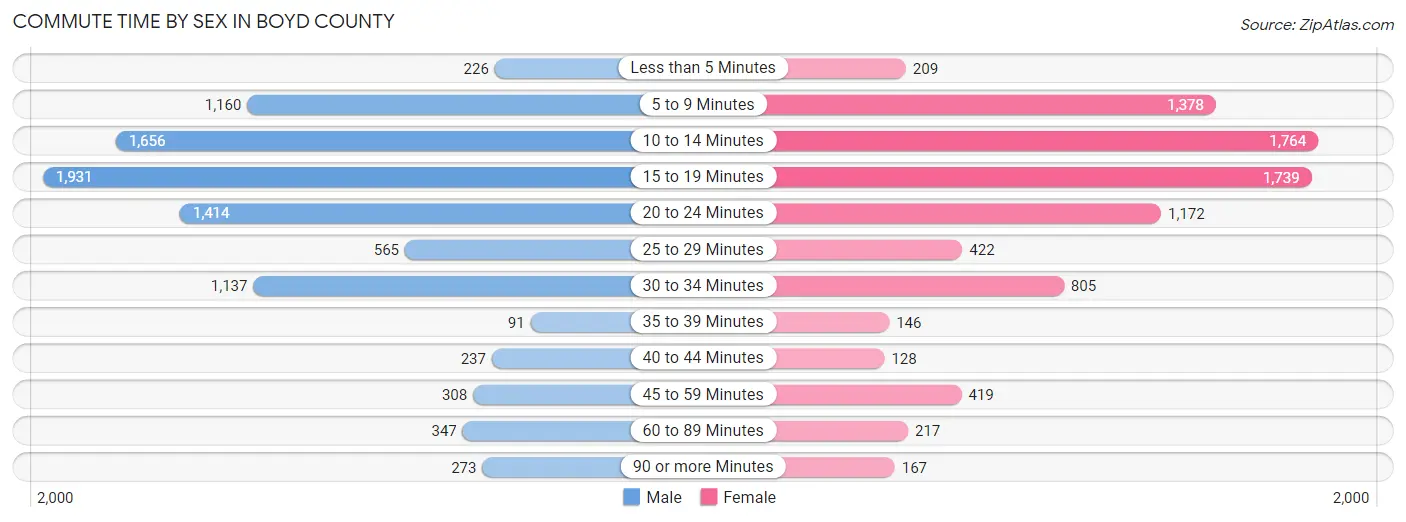
| Commute Time | Male | Female |
| Less than 5 Minutes | 226 (2.4%) | 209 (2.4%) |
| 5 to 9 Minutes | 1,160 (12.4%) | 1,378 (16.1%) |
| 10 to 14 Minutes | 1,656 (17.7%) | 1,764 (20.6%) |
| 15 to 19 Minutes | 1,931 (20.7%) | 1,739 (20.3%) |
| 20 to 24 Minutes | 1,414 (15.1%) | 1,172 (13.7%) |
| 25 to 29 Minutes | 565 (6.0%) | 422 (4.9%) |
| 30 to 34 Minutes | 1,137 (12.2%) | 805 (9.4%) |
| 35 to 39 Minutes | 91 (1.0%) | 146 (1.7%) |
| 40 to 44 Minutes | 237 (2.5%) | 128 (1.5%) |
| 45 to 59 Minutes | 308 (3.3%) | 419 (4.9%) |
| 60 to 89 Minutes | 347 (3.7%) | 217 (2.5%) |
| 90 or more Minutes | 273 (2.9%) | 167 (1.9%) |
Time of Departure to Work by Sex in Boyd County
The most frequent times of departure to work in Boyd County are 6:30 AM to 6:59 AM (1,122, 12.0%) for males and 7:30 AM to 7:59 AM (1,536, 17.9%) for females.
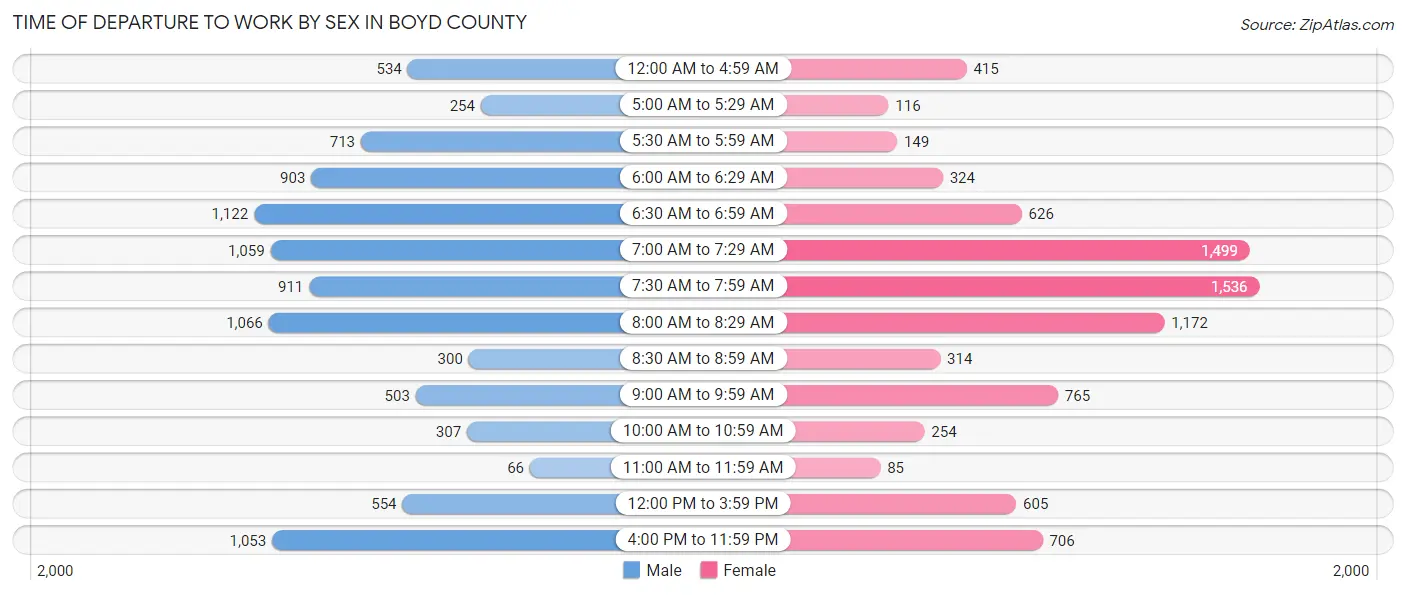
| Time of Departure | Male | Female |
| 12:00 AM to 4:59 AM | 534 (5.7%) | 415 (4.8%) |
| 5:00 AM to 5:29 AM | 254 (2.7%) | 116 (1.3%) |
| 5:30 AM to 5:59 AM | 713 (7.6%) | 149 (1.7%) |
| 6:00 AM to 6:29 AM | 903 (9.7%) | 324 (3.8%) |
| 6:30 AM to 6:59 AM | 1,122 (12.0%) | 626 (7.3%) |
| 7:00 AM to 7:29 AM | 1,059 (11.3%) | 1,499 (17.5%) |
| 7:30 AM to 7:59 AM | 911 (9.8%) | 1,536 (17.9%) |
| 8:00 AM to 8:29 AM | 1,066 (11.4%) | 1,172 (13.7%) |
| 8:30 AM to 8:59 AM | 300 (3.2%) | 314 (3.7%) |
| 9:00 AM to 9:59 AM | 503 (5.4%) | 765 (8.9%) |
| 10:00 AM to 10:59 AM | 307 (3.3%) | 254 (3.0%) |
| 11:00 AM to 11:59 AM | 66 (0.7%) | 85 (1.0%) |
| 12:00 PM to 3:59 PM | 554 (5.9%) | 605 (7.1%) |
| 4:00 PM to 11:59 PM | 1,053 (11.3%) | 706 (8.2%) |
| Total | 9,345 (100.0%) | 8,566 (100.0%) |
Housing Occupancy in Boyd County
Occupancy by Ownership in Boyd County
Of the total 18,533 dwellings in Boyd County, owner-occupied units account for 12,777 (68.9%), while renter-occupied units make up 5,756 (31.1%).
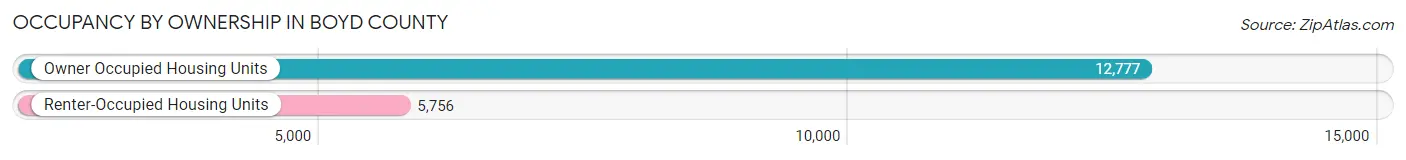
| Occupancy | # Housing Units | % Housing Units |
| Owner Occupied Housing Units | 12,777 | 68.9% |
| Renter-Occupied Housing Units | 5,756 | 31.1% |
| Total Occupied Housing Units | 18,533 | 100.0% |
Occupancy by Household Size in Boyd County
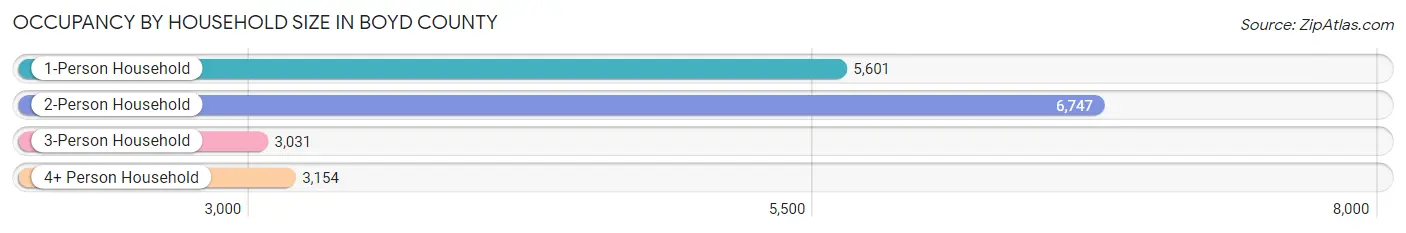
| Household Size | # Housing Units | % Housing Units |
| 1-Person Household | 5,601 | 30.2% |
| 2-Person Household | 6,747 | 36.4% |
| 3-Person Household | 3,031 | 16.4% |
| 4+ Person Household | 3,154 | 17.0% |
| Total Housing Units | 18,533 | 100.0% |
Occupancy by Ownership by Household Size in Boyd County

| Household Size | Owner-occupied | Renter-occupied |
| 1-Person Household | 3,147 (56.2%) | 2,454 (43.8%) |
| 2-Person Household | 5,212 (77.2%) | 1,535 (22.8%) |
| 3-Person Household | 2,220 (73.2%) | 811 (26.8%) |
| 4+ Person Household | 2,198 (69.7%) | 956 (30.3%) |
| Total Housing Units | 12,777 (68.9%) | 5,756 (31.1%) |
Occupancy by Educational Attainment in Boyd County
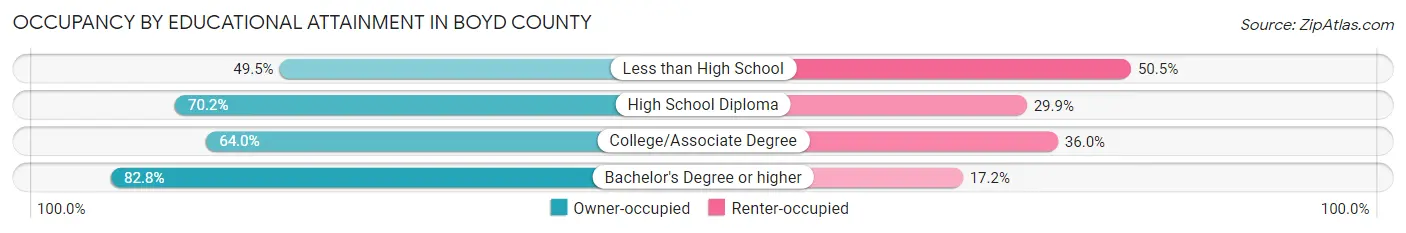
| Household Size | Owner-occupied | Renter-occupied |
| Less than High School | 853 (49.5%) | 871 (50.5%) |
| High School Diploma | 4,115 (70.2%) | 1,751 (29.8%) |
| College/Associate Degree | 4,257 (64.0%) | 2,398 (36.0%) |
| Bachelor's Degree or higher | 3,552 (82.8%) | 736 (17.2%) |
Occupancy by Age of Householder in Boyd County
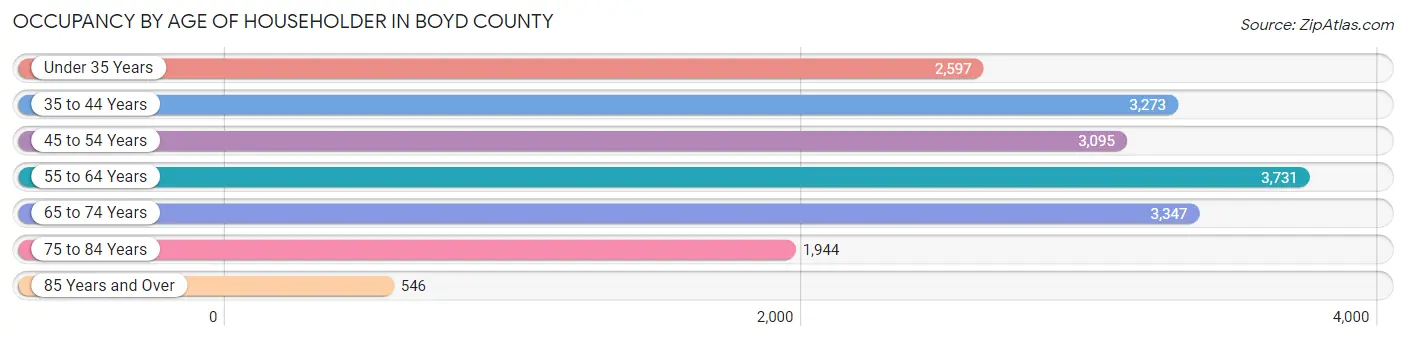
| Age Bracket | # Households | % Households |
| Under 35 Years | 2,597 | 14.0% |
| 35 to 44 Years | 3,273 | 17.7% |
| 45 to 54 Years | 3,095 | 16.7% |
| 55 to 64 Years | 3,731 | 20.1% |
| 65 to 74 Years | 3,347 | 18.1% |
| 75 to 84 Years | 1,944 | 10.5% |
| 85 Years and Over | 546 | 2.9% |
| Total | 18,533 | 100.0% |
Housing Finances in Boyd County
Median Income by Occupancy in Boyd County
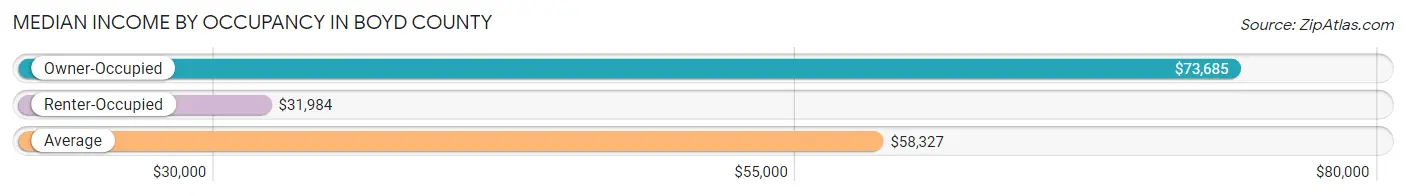
| Occupancy Type | # Households | Median Income |
| Owner-Occupied | 12,777 (68.9%) | $73,685 |
| Renter-Occupied | 5,756 (31.1%) | $31,984 |
| Average | 18,533 (100.0%) | $58,327 |
Occupancy by Householder Income Bracket in Boyd County
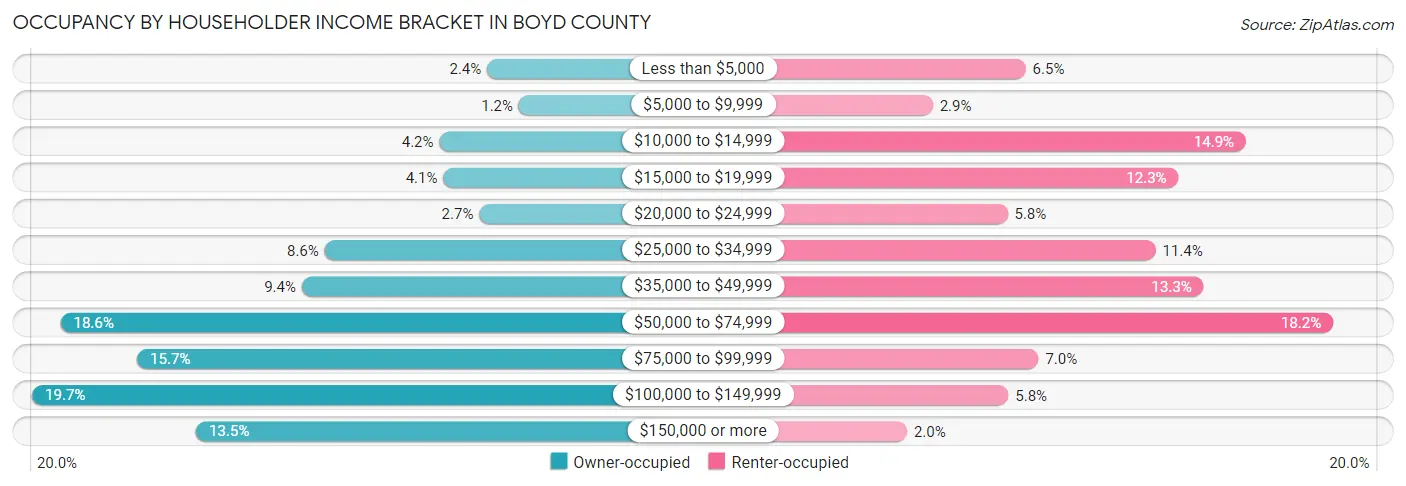
| Income Bracket | Owner-occupied | Renter-occupied |
| Less than $5,000 | 304 (2.4%) | 373 (6.5%) |
| $5,000 to $9,999 | 150 (1.2%) | 169 (2.9%) |
| $10,000 to $14,999 | 536 (4.2%) | 856 (14.9%) |
| $15,000 to $19,999 | 518 (4.1%) | 708 (12.3%) |
| $20,000 to $24,999 | 342 (2.7%) | 333 (5.8%) |
| $25,000 to $34,999 | 1,095 (8.6%) | 658 (11.4%) |
| $35,000 to $49,999 | 1,206 (9.4%) | 763 (13.3%) |
| $50,000 to $74,999 | 2,380 (18.6%) | 1,047 (18.2%) |
| $75,000 to $99,999 | 2,007 (15.7%) | 401 (7.0%) |
| $100,000 to $149,999 | 2,518 (19.7%) | 335 (5.8%) |
| $150,000 or more | 1,721 (13.5%) | 113 (2.0%) |
| Total | 12,777 (100.0%) | 5,756 (100.0%) |
Monthly Housing Cost Tiers in Boyd County
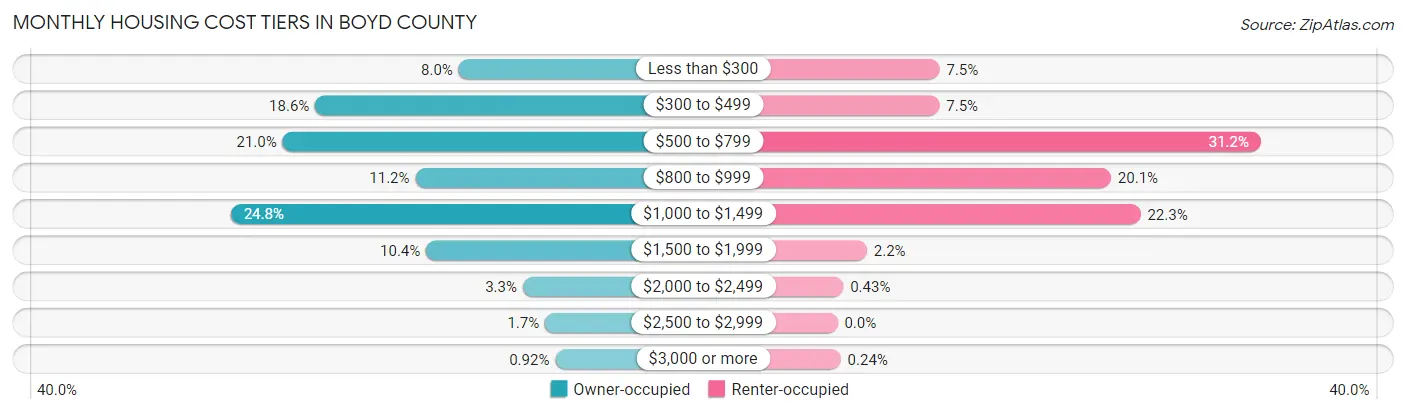
| Monthly Cost | Owner-occupied | Renter-occupied |
| Less than $300 | 1,026 (8.0%) | 433 (7.5%) |
| $300 to $499 | 2,377 (18.6%) | 432 (7.5%) |
| $500 to $799 | 2,683 (21.0%) | 1,795 (31.2%) |
| $800 to $999 | 1,433 (11.2%) | 1,159 (20.1%) |
| $1,000 to $1,499 | 3,171 (24.8%) | 1,285 (22.3%) |
| $1,500 to $1,999 | 1,333 (10.4%) | 125 (2.2%) |
| $2,000 to $2,499 | 423 (3.3%) | 25 (0.4%) |
| $2,500 to $2,999 | 213 (1.7%) | 0 (0.0%) |
| $3,000 or more | 118 (0.9%) | 14 (0.2%) |
| Total | 12,777 (100.0%) | 5,756 (100.0%) |
Physical Housing Characteristics in Boyd County
Housing Structures in Boyd County
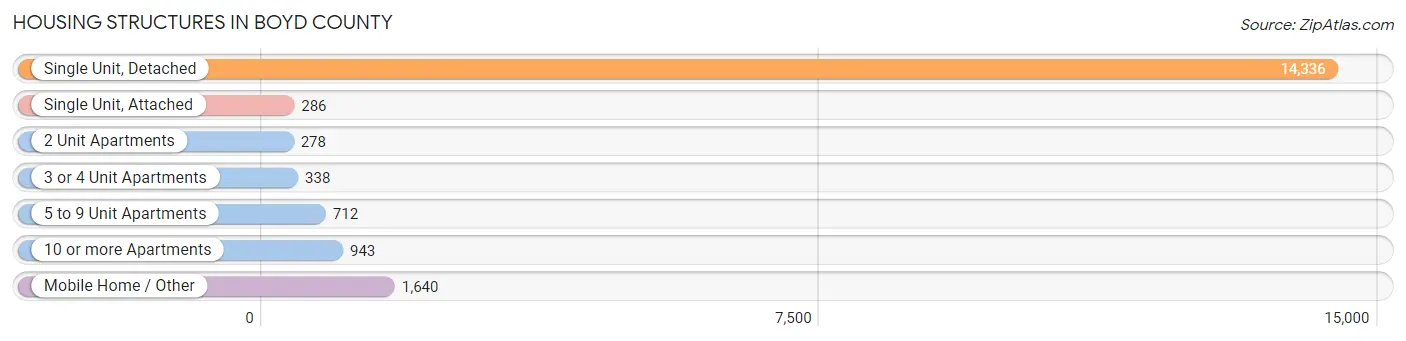
| Structure Type | # Housing Units | % Housing Units |
| Single Unit, Detached | 14,336 | 77.3% |
| Single Unit, Attached | 286 | 1.5% |
| 2 Unit Apartments | 278 | 1.5% |
| 3 or 4 Unit Apartments | 338 | 1.8% |
| 5 to 9 Unit Apartments | 712 | 3.8% |
| 10 or more Apartments | 943 | 5.1% |
| Mobile Home / Other | 1,640 | 8.8% |
| Total | 18,533 | 100.0% |
Housing Structures by Occupancy in Boyd County
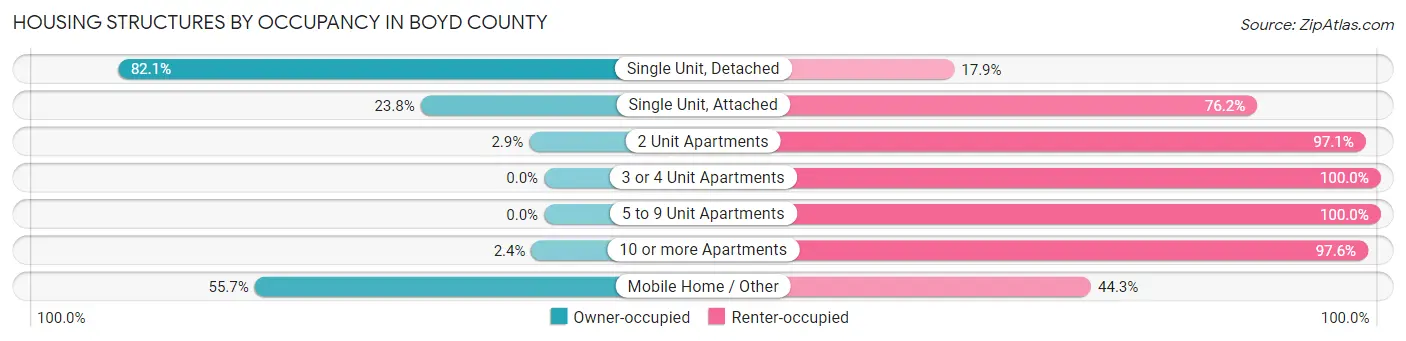
| Structure Type | Owner-occupied | Renter-occupied |
| Single Unit, Detached | 11,764 (82.1%) | 2,572 (17.9%) |
| Single Unit, Attached | 68 (23.8%) | 218 (76.2%) |
| 2 Unit Apartments | 8 (2.9%) | 270 (97.1%) |
| 3 or 4 Unit Apartments | 0 (0.0%) | 338 (100.0%) |
| 5 to 9 Unit Apartments | 0 (0.0%) | 712 (100.0%) |
| 10 or more Apartments | 23 (2.4%) | 920 (97.6%) |
| Mobile Home / Other | 914 (55.7%) | 726 (44.3%) |
| Total | 12,777 (68.9%) | 5,756 (31.1%) |
Housing Structures by Number of Rooms in Boyd County
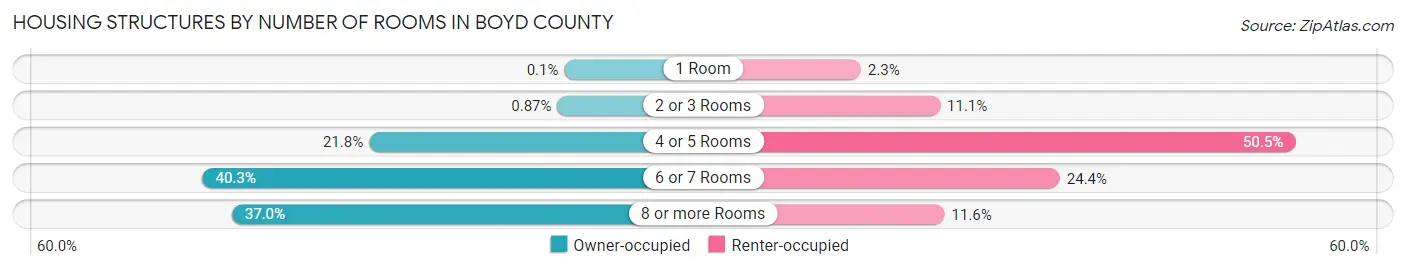
| Number of Rooms | Owner-occupied | Renter-occupied |
| 1 Room | 13 (0.1%) | 134 (2.3%) |
| 2 or 3 Rooms | 111 (0.9%) | 640 (11.1%) |
| 4 or 5 Rooms | 2,783 (21.8%) | 2,908 (50.5%) |
| 6 or 7 Rooms | 5,143 (40.3%) | 1,405 (24.4%) |
| 8 or more Rooms | 4,727 (37.0%) | 669 (11.6%) |
| Total | 12,777 (100.0%) | 5,756 (100.0%) |
Housing Structure by Heating Type in Boyd County
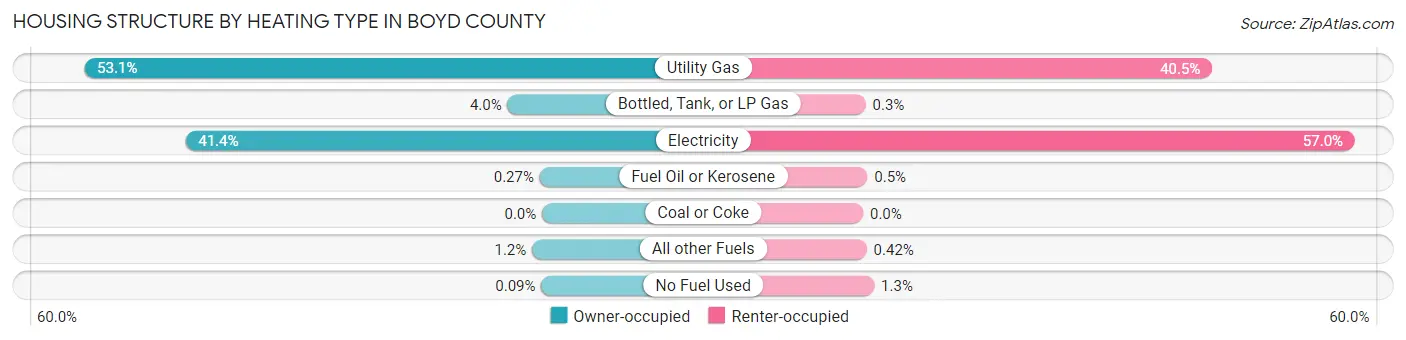
| Heating Type | Owner-occupied | Renter-occupied |
| Utility Gas | 6,784 (53.1%) | 2,330 (40.5%) |
| Bottled, Tank, or LP Gas | 512 (4.0%) | 17 (0.3%) |
| Electricity | 5,286 (41.4%) | 3,282 (57.0%) |
| Fuel Oil or Kerosene | 35 (0.3%) | 29 (0.5%) |
| Coal or Coke | 0 (0.0%) | 0 (0.0%) |
| All other Fuels | 148 (1.2%) | 24 (0.4%) |
| No Fuel Used | 12 (0.1%) | 74 (1.3%) |
| Total | 12,777 (100.0%) | 5,756 (100.0%) |
Household Vehicle Usage in Boyd County
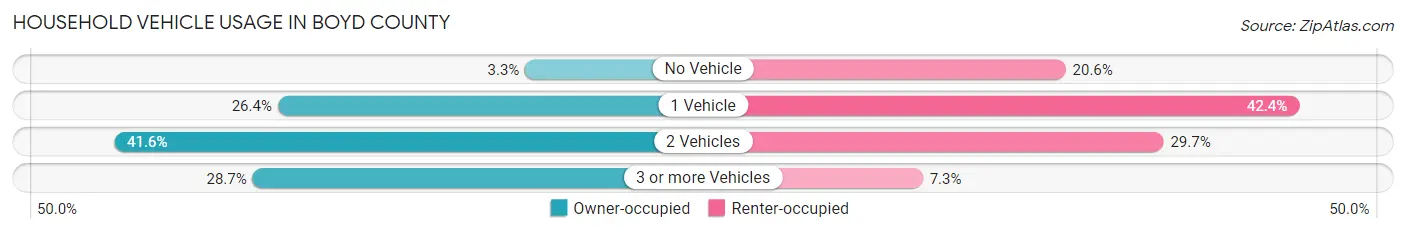
| Vehicles per Household | Owner-occupied | Renter-occupied |
| No Vehicle | 418 (3.3%) | 1,186 (20.6%) |
| 1 Vehicle | 3,369 (26.4%) | 2,440 (42.4%) |
| 2 Vehicles | 5,320 (41.6%) | 1,712 (29.7%) |
| 3 or more Vehicles | 3,670 (28.7%) | 418 (7.3%) |
| Total | 12,777 (100.0%) | 5,756 (100.0%) |
Real Estate & Mortgages in Boyd County
Real Estate and Mortgage Overview in Boyd County
| Characteristic | Without Mortgage | With Mortgage |
| Housing Units | 5,504 | 7,273 |
| Median Property Value | $99,000 | $151,700 |
| Median Household Income | $56,454 | $1,159 |
| Monthly Housing Costs | $449 | $105 |
| Real Estate Taxes | $937 | $375 |
Property Value by Mortgage Status in Boyd County
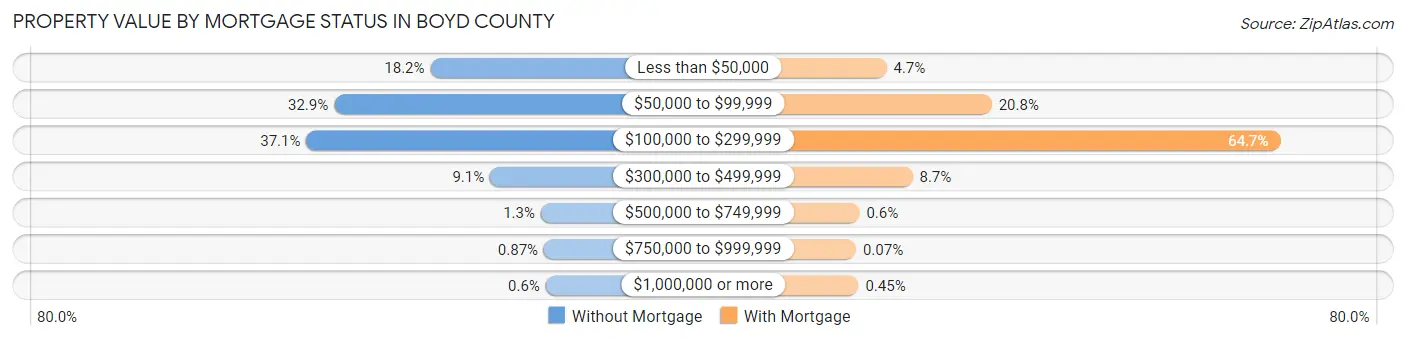
| Property Value | Without Mortgage | With Mortgage |
| Less than $50,000 | 1,000 (18.2%) | 343 (4.7%) |
| $50,000 to $99,999 | 1,808 (32.9%) | 1,509 (20.7%) |
| $100,000 to $299,999 | 2,041 (37.1%) | 4,708 (64.7%) |
| $300,000 to $499,999 | 500 (9.1%) | 631 (8.7%) |
| $500,000 to $749,999 | 74 (1.3%) | 44 (0.6%) |
| $750,000 to $999,999 | 48 (0.9%) | 5 (0.1%) |
| $1,000,000 or more | 33 (0.6%) | 33 (0.4%) |
| Total | 5,504 (100.0%) | 7,273 (100.0%) |
Household Income by Mortgage Status in Boyd County
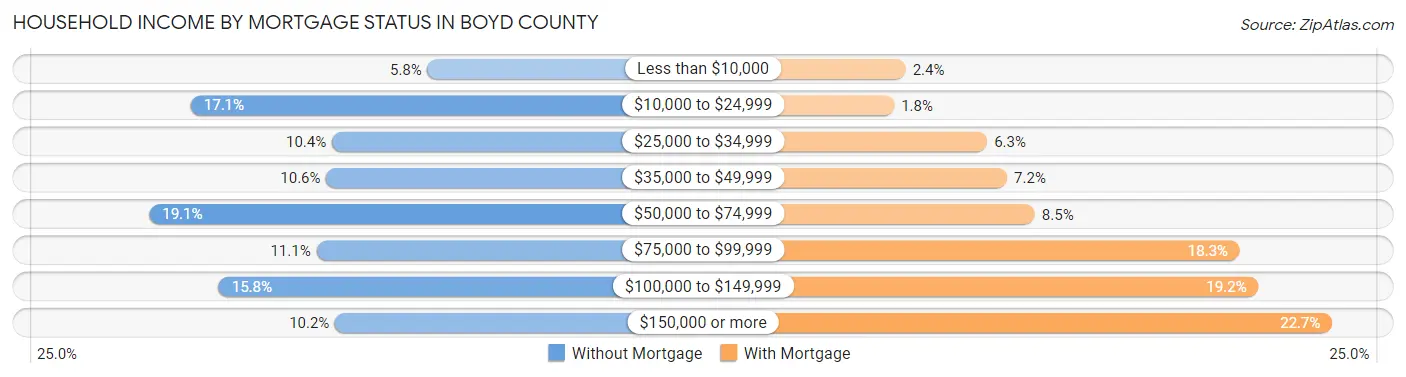
| Household Income | Without Mortgage | With Mortgage |
| Less than $10,000 | 320 (5.8%) | 174 (2.4%) |
| $10,000 to $24,999 | 940 (17.1%) | 134 (1.8%) |
| $25,000 to $34,999 | 570 (10.4%) | 456 (6.3%) |
| $35,000 to $49,999 | 585 (10.6%) | 525 (7.2%) |
| $50,000 to $74,999 | 1,049 (19.1%) | 621 (8.5%) |
| $75,000 to $99,999 | 611 (11.1%) | 1,331 (18.3%) |
| $100,000 to $149,999 | 867 (15.8%) | 1,396 (19.2%) |
| $150,000 or more | 562 (10.2%) | 1,651 (22.7%) |
| Total | 5,504 (100.0%) | 7,273 (100.0%) |
Property Value to Household Income Ratio in Boyd County
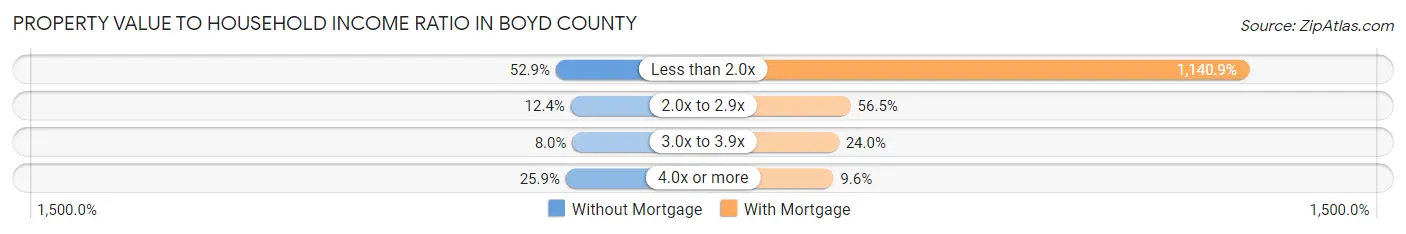
| Value-to-Income Ratio | Without Mortgage | With Mortgage |
| Less than 2.0x | 2,909 (52.8%) | 82,977 (1,140.9%) |
| 2.0x to 2.9x | 684 (12.4%) | 4,108 (56.5%) |
| 3.0x to 3.9x | 439 (8.0%) | 1,743 (24.0%) |
| 4.0x or more | 1,423 (25.9%) | 696 (9.6%) |
| Total | 5,504 (100.0%) | 7,273 (100.0%) |
Real Estate Taxes by Mortgage Status in Boyd County
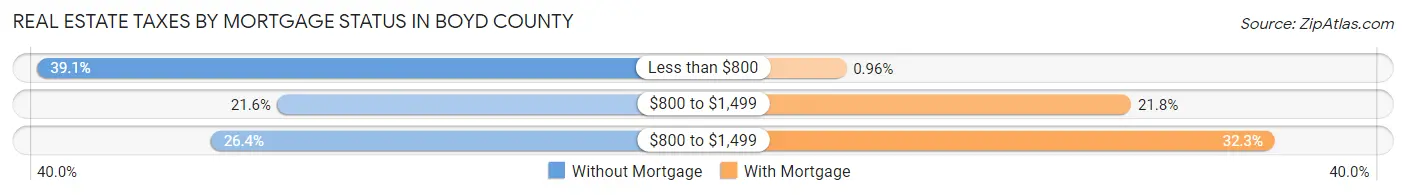
| Property Taxes | Without Mortgage | With Mortgage |
| Less than $800 | 2,150 (39.1%) | 70 (1.0%) |
| $800 to $1,499 | 1,187 (21.6%) | 1,583 (21.8%) |
| $800 to $1,499 | 1,453 (26.4%) | 2,347 (32.3%) |
| Total | 5,504 (100.0%) | 7,273 (100.0%) |
Health & Disability in Boyd County
Health Insurance Coverage by Age in Boyd County
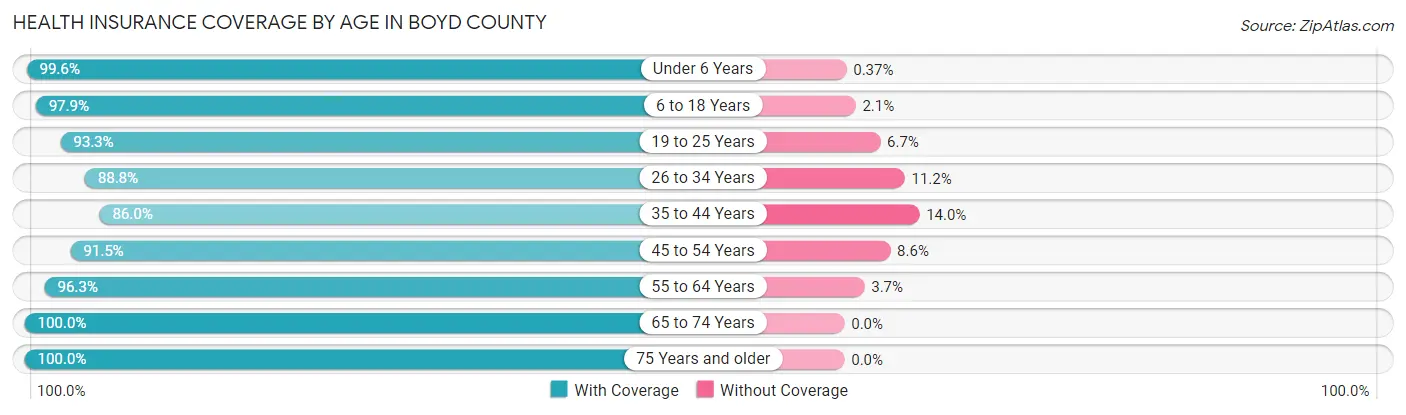
| Age Bracket | With Coverage | Without Coverage |
| Under 6 Years | 3,240 (99.6%) | 12 (0.4%) |
| 6 to 18 Years | 7,530 (97.9%) | 160 (2.1%) |
| 19 to 25 Years | 3,094 (93.3%) | 221 (6.7%) |
| 26 to 34 Years | 4,444 (88.8%) | 563 (11.2%) |
| 35 to 44 Years | 4,922 (86.0%) | 799 (14.0%) |
| 45 to 54 Years | 5,431 (91.4%) | 508 (8.6%) |
| 55 to 64 Years | 6,195 (96.3%) | 240 (3.7%) |
| 65 to 74 Years | 5,643 (100.0%) | 0 (0.0%) |
| 75 Years and older | 3,605 (100.0%) | 0 (0.0%) |
| Total | 44,104 (94.6%) | 2,503 (5.4%) |
Health Insurance Coverage by Citizenship Status in Boyd County
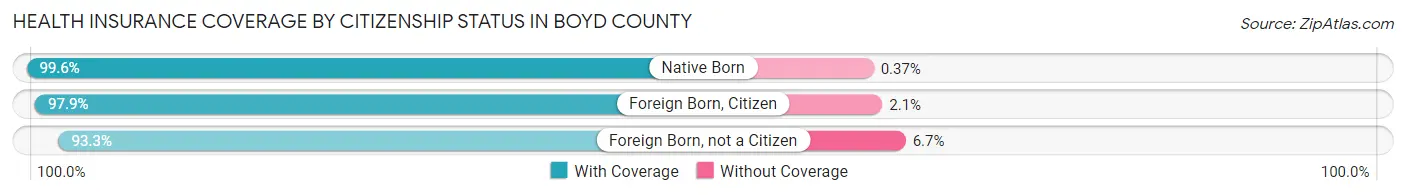
| Citizenship Status | With Coverage | Without Coverage |
| Native Born | 3,240 (99.6%) | 12 (0.4%) |
| Foreign Born, Citizen | 7,530 (97.9%) | 160 (2.1%) |
| Foreign Born, not a Citizen | 3,094 (93.3%) | 221 (6.7%) |
Health Insurance Coverage by Household Income in Boyd County
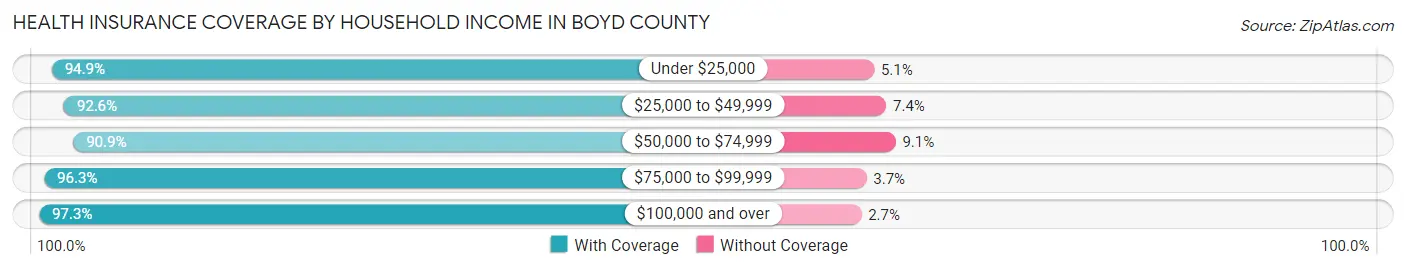
| Household Income | With Coverage | Without Coverage |
| Under $25,000 | 7,297 (94.9%) | 391 (5.1%) |
| $25,000 to $49,999 | 7,492 (92.6%) | 595 (7.4%) |
| $50,000 to $74,999 | 8,605 (90.9%) | 864 (9.1%) |
| $75,000 to $99,999 | 6,422 (96.3%) | 244 (3.7%) |
| $100,000 and over | 14,184 (97.3%) | 393 (2.7%) |
Public vs Private Health Insurance Coverage by Age in Boyd County
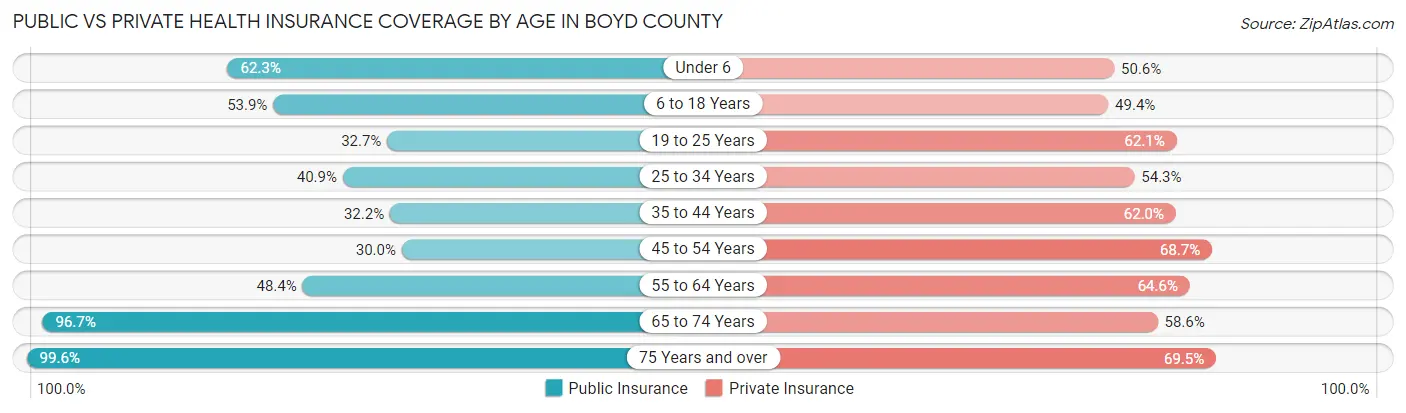
| Age Bracket | Public Insurance | Private Insurance |
| Under 6 | 2,027 (62.3%) | 1,644 (50.5%) |
| 6 to 18 Years | 4,142 (53.9%) | 3,802 (49.4%) |
| 19 to 25 Years | 1,084 (32.7%) | 2,060 (62.1%) |
| 25 to 34 Years | 2,050 (40.9%) | 2,719 (54.3%) |
| 35 to 44 Years | 1,841 (32.2%) | 3,547 (62.0%) |
| 45 to 54 Years | 1,781 (30.0%) | 4,081 (68.7%) |
| 55 to 64 Years | 3,115 (48.4%) | 4,156 (64.6%) |
| 65 to 74 Years | 5,455 (96.7%) | 3,307 (58.6%) |
| 75 Years and over | 3,591 (99.6%) | 2,504 (69.5%) |
| Total | 25,086 (53.8%) | 27,820 (59.7%) |
Disability Status by Sex by Age in Boyd County
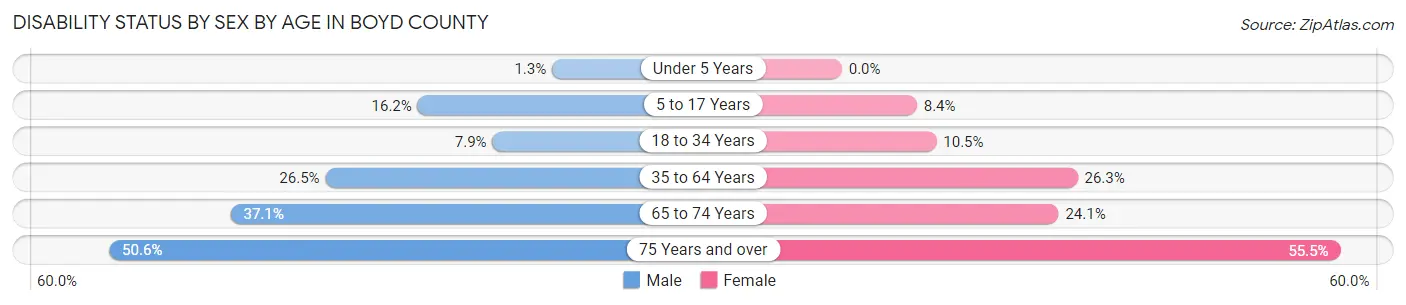
| Age Bracket | Male | Female |
| Under 5 Years | 18 (1.3%) | 0 (0.0%) |
| 5 to 17 Years | 637 (16.2%) | 311 (8.4%) |
| 18 to 34 Years | 364 (7.9%) | 454 (10.5%) |
| 35 to 64 Years | 2,330 (26.5%) | 2,442 (26.3%) |
| 65 to 74 Years | 979 (37.1%) | 724 (24.1%) |
| 75 Years and over | 744 (50.6%) | 1,185 (55.5%) |
Disability Class by Sex by Age in Boyd County
Disability Class: Hearing Difficulty
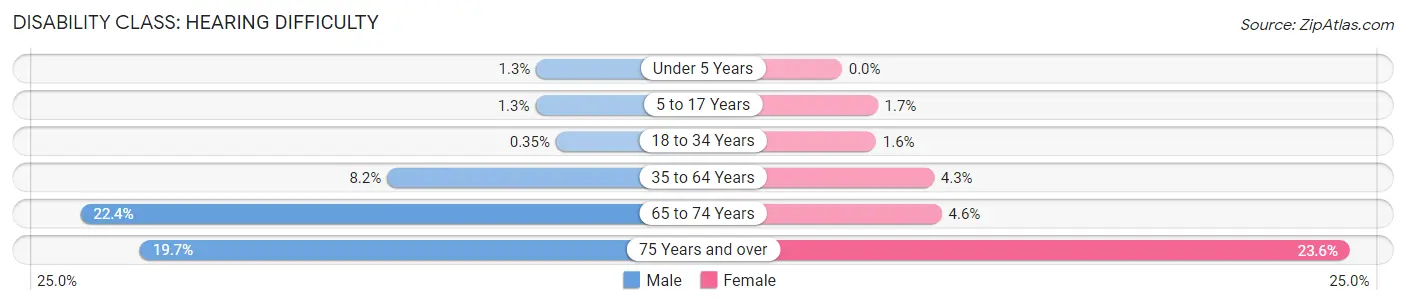
| Age Bracket | Male | Female |
| Under 5 Years | 18 (1.3%) | 0 (0.0%) |
| 5 to 17 Years | 51 (1.3%) | 62 (1.7%) |
| 18 to 34 Years | 16 (0.4%) | 68 (1.6%) |
| 35 to 64 Years | 719 (8.2%) | 397 (4.3%) |
| 65 to 74 Years | 592 (22.4%) | 139 (4.6%) |
| 75 Years and over | 289 (19.7%) | 503 (23.6%) |
Disability Class: Vision Difficulty
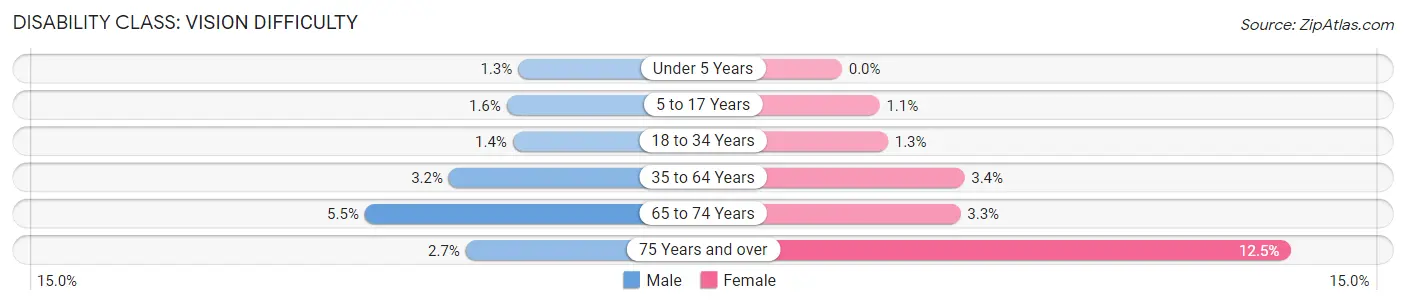
| Age Bracket | Male | Female |
| Under 5 Years | 18 (1.3%) | 0 (0.0%) |
| 5 to 17 Years | 62 (1.6%) | 39 (1.1%) |
| 18 to 34 Years | 65 (1.4%) | 55 (1.3%) |
| 35 to 64 Years | 280 (3.2%) | 317 (3.4%) |
| 65 to 74 Years | 146 (5.5%) | 99 (3.3%) |
| 75 Years and over | 40 (2.7%) | 267 (12.5%) |
Disability Class: Cognitive Difficulty
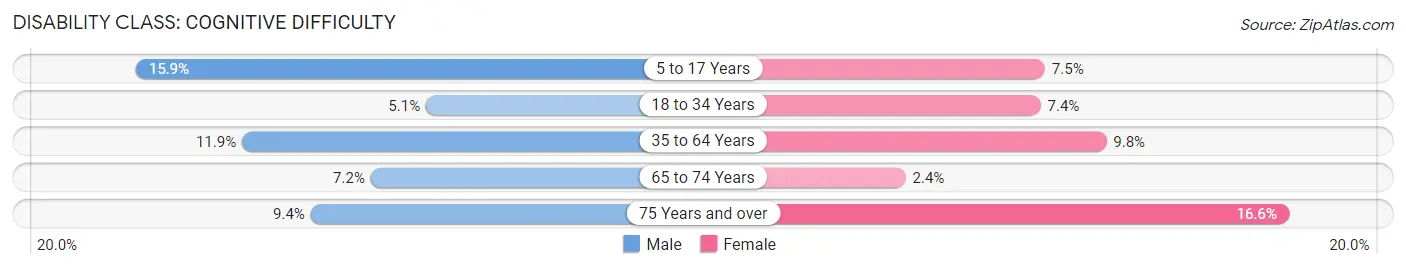
| Age Bracket | Male | Female |
| 5 to 17 Years | 623 (15.9%) | 281 (7.5%) |
| 18 to 34 Years | 235 (5.1%) | 318 (7.4%) |
| 35 to 64 Years | 1,049 (11.9%) | 914 (9.8%) |
| 65 to 74 Years | 189 (7.1%) | 71 (2.4%) |
| 75 Years and over | 138 (9.4%) | 354 (16.6%) |
Disability Class: Ambulatory Difficulty
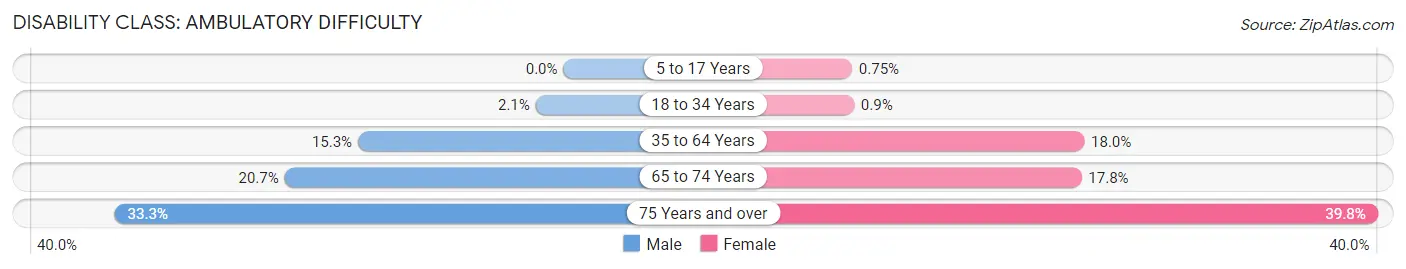
| Age Bracket | Male | Female |
| 5 to 17 Years | 0 (0.0%) | 28 (0.7%) |
| 18 to 34 Years | 95 (2.1%) | 39 (0.9%) |
| 35 to 64 Years | 1,341 (15.2%) | 1,674 (18.0%) |
| 65 to 74 Years | 547 (20.7%) | 534 (17.8%) |
| 75 Years and over | 490 (33.3%) | 849 (39.8%) |
Disability Class: Self-Care Difficulty
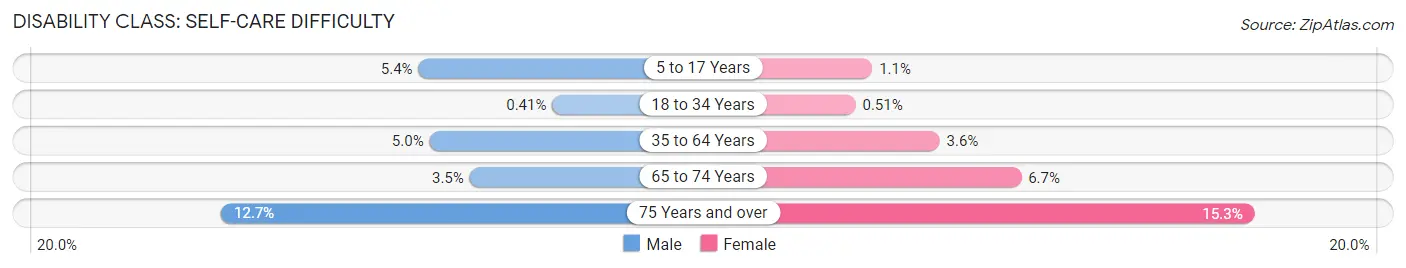
| Age Bracket | Male | Female |
| 5 to 17 Years | 211 (5.4%) | 42 (1.1%) |
| 18 to 34 Years | 19 (0.4%) | 22 (0.5%) |
| 35 to 64 Years | 437 (5.0%) | 338 (3.6%) |
| 65 to 74 Years | 92 (3.5%) | 200 (6.7%) |
| 75 Years and over | 187 (12.7%) | 327 (15.3%) |
Technology Access in Boyd County
Computing Device Access in Boyd County
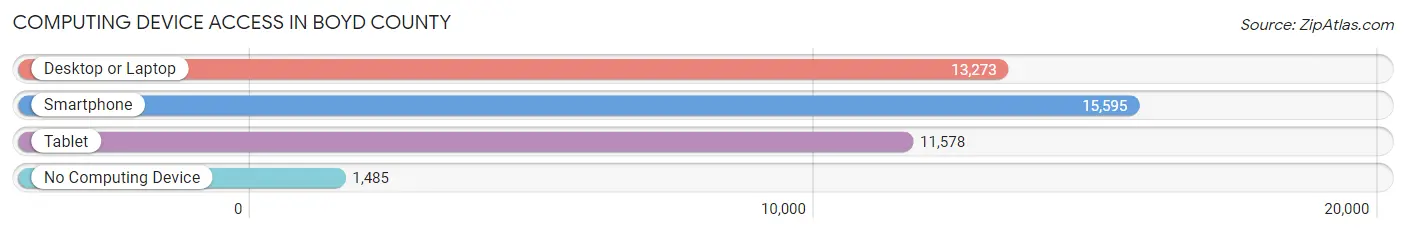
| Device Type | # Households | % Households |
| Desktop or Laptop | 13,273 | 71.6% |
| Smartphone | 15,595 | 84.2% |
| Tablet | 11,578 | 62.5% |
| No Computing Device | 1,485 | 8.0% |
| Total | 18,533 | 100.0% |
Internet Access in Boyd County
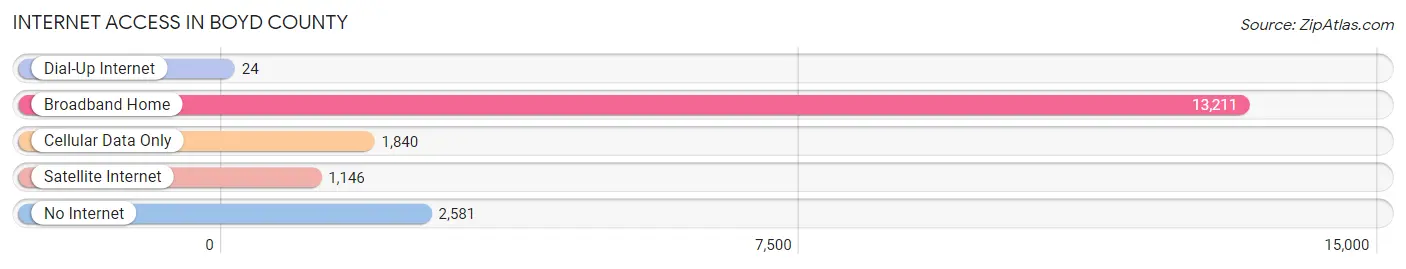
| Internet Type | # Households | % Households |
| Dial-Up Internet | 24 | 0.1% |
| Broadband Home | 13,211 | 71.3% |
| Cellular Data Only | 1,840 | 9.9% |
| Satellite Internet | 1,146 | 6.2% |
| No Internet | 2,581 | 13.9% |
| Total | 18,533 | 100.0% |
Boyd County Summary
Boyd County is located in the northeastern corner of Kentucky, and is part of the Huntington-Ashland Metropolitan Statistical Area. It is bordered by Greenup County to the north, Lawrence County to the east, Carter County to the south, and Elliott County to the west. The county seat is Catlettsburg, and the largest city is Ashland. As of the 2010 census, the population of Boyd County was 49,542.
Geography
Boyd County is located in the Eastern Coal Field region of Kentucky. The county is mostly flat, with some rolling hills in the northern and western parts of the county. The Big Sandy River forms the northern border of the county, and the Little Sandy River forms the western border. The county is drained by the Ohio River, which forms the eastern border. The county has a total area of 437 square miles, of which 431 square miles is land and 6.2 square miles is water.
Economy
Boyd County has a diverse economy, with a mix of manufacturing, retail, and service industries. The county is home to several large employers, including AK Steel, Marathon Petroleum, and Ashland Inc. The county is also home to several smaller businesses, including several restaurants, retail stores, and medical facilities.
The county is also home to several tourist attractions, including the Ashland Town Center, the Boyd County Public Library, and the Boyd County Historical Society.
Demographics
As of the 2010 census, there were 49,542 people, 19,945 households, and 13,845 families residing in the county. The population density was 114 people per square mile. There were 21,845 housing units at an average density of 50 per square mile. The racial makeup of the county was 94.2% White, 3.2% Black or African American, 0.3% Native American, 0.5% Asian, 0.2% Pacific Islander, 0.6% from other races, and 1.1% from two or more races. Hispanic or Latino of any race were 1.4% of the population.
There were 19,945 households, out of which 30.2% had children under the age of 18 living with them, 51.2% were married couples living together, 12.7% had a female householder with no husband present, and 31.7% were non-families. 27.2% of all households were made up of individuals, and 11.2% had someone living alone who was 65 years of age or older. The average household size was 2.44 and the average family size was 2.94.
In the county, the population was spread out, with 23.7% under the age of 18, 8.7% from 18 to 24, 28.2% from 25 to 44, 25.2% from 45 to 64, and 14.2% who were 65 years of age or older. The median age was 38 years. For every 100 females, there were 93.2 males. For every 100 females age 18 and over, there were 90.2 males.
The median income for a household in the county was $35,945, and the median income for a family was $43,945. Males had a median income of $35,945 versus $25,945 for females. The per capita income for the county was $19,945. About 11.2% of families and 14.2% of the population were below the poverty line, including 19.2% of those under age 18 and 10.2% of those age 65 or over.
Common Questions
What is the Total Population of Boyd County?
Total Population of Boyd County is 48,242.
What is the Total Male Population of Boyd County?
Total Male Population of Boyd County is 24,188.
What is the Total Female Population of Boyd County?
Total Female Population of Boyd County is 24,054.
What is the Ratio of Males per 100 Females in Boyd County?
There are 100.56 Males per 100 Females in Boyd County.
What is the Ratio of Females per 100 Males in Boyd County?
There are 99.45 Females per 100 Males in Boyd County.
What is the Median Population Age in Boyd County?
Median Population Age in Boyd County is 42.1 Years.
What is the Average Family Size in Boyd County
Average Family Size in Boyd County is 3.1 People.
What is the Average Household Size in Boyd County
Average Household Size in Boyd County is 2.5 People.
What is Per Capita Income in Boyd County?
Per Capita income in Boyd County is $30,993.
What is the Median Family Income in Boyd County?
Median Family Income in Boyd County is $72,259.
What is the Median Household income in Boyd County?
Median Household Income in Boyd County is $58,327.
What is Income or Wage Gap in Boyd County?
Income or Wage Gap in Boyd County is 24.3%.
Women in Boyd County earn 75.7 cents for every dollar earned by a man.
What is Family Income Deficit in Boyd County?
Family Income Deficit in Boyd County is $11,427.
Families that are below poverty line in Boyd County earn $11,427 less on average than the poverty threshold level.
What is Inequality or Gini Index in Boyd County?
Inequality or Gini Index in Boyd County is 0.46.
How Large is the Labor Force in Boyd County?
There are 20,546 People in the Labor Forcein in Boyd County.
What is the Percentage of People in the Labor Force in Boyd County?
52.5% of People are in the Labor Force in Boyd County.
What is the Unemployment Rate in Boyd County?
Unemployment Rate in Boyd County is 6.9%.