Boone County, KY
Boone County Map
Boone County Overview
136,150
TOTAL POPULATION
67,954
MALE POPULATION
68,196
FEMALE POPULATION
99.65
MALES / 100 FEMALES
100.36
FEMALES / 100 MALES
38.0
MEDIAN AGE
3.2
AVG FAMILY SIZE
2.7
AVG HOUSEHOLD SIZE
$41,281
PER CAPITA INCOME
$109,060
AVG FAMILY INCOME
$91,697
AVG HOUSEHOLD INCOME
31.5%
WAGE / INCOME GAP [ % ]
68.5¢/ $1
WAGE / INCOME GAP [ $ ]
$10,514
FAMILY INCOME DEFICIT
0.39
INEQUALITY / GINI INDEX
72,627
LABOR FORCE [ PEOPLE ]
69.2%
PERCENT IN LABOR FORCE
2.8%
UNEMPLOYMENT RATE
Boone County Area Codes
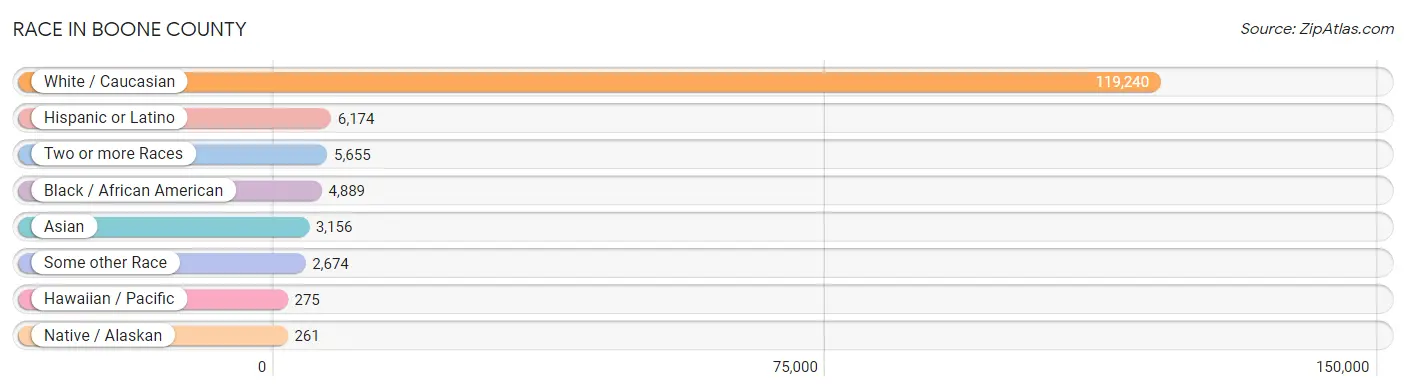
Race in Boone County
The most populous races in Boone County are White / Caucasian (119,240 | 87.6%), Hispanic or Latino (6,174 | 4.5%), and Two or more Races (5,655 | 4.2%).
| Race | # Population | % Population |
| Asian | 3,156 | 2.3% |
| Black / African American | 4,889 | 3.6% |
| Hawaiian / Pacific | 275 | 0.2% |
| Hispanic or Latino | 6,174 | 4.5% |
| Native / Alaskan | 261 | 0.2% |
| White / Caucasian | 119,240 | 87.6% |
| Two or more Races | 5,655 | 4.2% |
| Some other Race | 2,674 | 2.0% |
| Total | 136,150 | 100.0% |
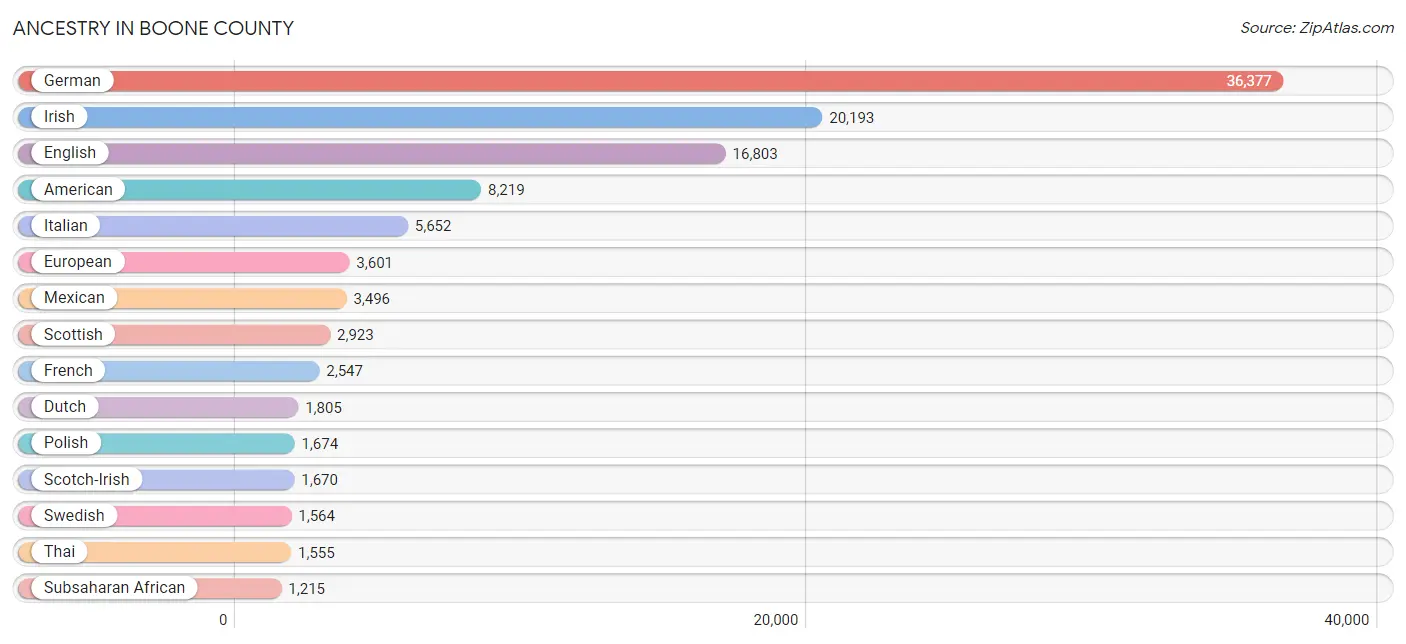
Ancestry in Boone County
The most populous ancestries reported in Boone County are German (36,377 | 26.7%), Irish (20,193 | 14.8%), English (16,803 | 12.3%), American (8,219 | 6.0%), and Italian (5,652 | 4.2%), together accounting for 64.1% of all Boone County residents.
| Ancestry | # Population | % Population |
| Afghan | 21 | 0.0% |
| African | 727 | 0.5% |
| Albanian | 137 | 0.1% |
| American | 8,219 | 6.0% |
| Arab | 603 | 0.4% |
| Australian | 66 | 0.1% |
| Austrian | 206 | 0.2% |
| Bangladeshi | 18 | 0.0% |
| Basque | 29 | 0.0% |
| Belgian | 62 | 0.1% |
| Bhutanese | 473 | 0.4% |
| Blackfeet | 85 | 0.1% |
| Brazilian | 97 | 0.1% |
| British | 532 | 0.4% |
| Bulgarian | 56 | 0.0% |
| Burmese | 395 | 0.3% |
| Canadian | 173 | 0.1% |
| Celtic | 35 | 0.0% |
| Central American | 1,206 | 0.9% |
| Cherokee | 232 | 0.2% |
| Cheyenne | 1 | 0.0% |
| Chickasaw | 3 | 0.0% |
| Chilean | 5 | 0.0% |
| Chippewa | 15 | 0.0% |
| Choctaw | 3 | 0.0% |
| Colombian | 112 | 0.1% |
| Croatian | 103 | 0.1% |
| Cuban | 78 | 0.1% |
| Czech | 171 | 0.1% |
| Czechoslovakian | 30 | 0.0% |
| Danish | 134 | 0.1% |
| Dutch | 1,805 | 1.3% |
| Eastern European | 106 | 0.1% |
| Ecuadorian | 14 | 0.0% |
| Egyptian | 61 | 0.0% |
| English | 16,803 | 12.3% |
| European | 3,601 | 2.6% |
| Filipino | 111 | 0.1% |
| Finnish | 59 | 0.0% |
| French | 2,547 | 1.9% |
| French American Indian | 15 | 0.0% |
| French Canadian | 359 | 0.3% |
| German | 36,377 | 26.7% |
| Ghanaian | 35 | 0.0% |
| Greek | 505 | 0.4% |
| Guatemalan | 670 | 0.5% |
| Haitian | 28 | 0.0% |
| Honduran | 196 | 0.1% |
| Hungarian | 408 | 0.3% |
| Icelander | 10 | 0.0% |
| Indian (Asian) | 356 | 0.3% |
| Indonesian | 7 | 0.0% |
| Inupiat | 4 | 0.0% |
| Iranian | 68 | 0.1% |
| Irish | 20,193 | 14.8% |
| Iroquois | 28 | 0.0% |
| Italian | 5,652 | 4.2% |
| Jamaican | 280 | 0.2% |
| Japanese | 34 | 0.0% |
| Jordanian | 20 | 0.0% |
| Korean | 794 | 0.6% |
| Latvian | 62 | 0.1% |
| Lebanese | 6 | 0.0% |
| Lithuanian | 127 | 0.1% |
| Lumbee | 4 | 0.0% |
| Mexican | 3,496 | 2.6% |
| Mexican American Indian | 193 | 0.1% |
| Mongolian | 21 | 0.0% |
| Moroccan | 200 | 0.2% |
| Native Hawaiian | 235 | 0.2% |
| Nicaraguan | 22 | 0.0% |
| Nigerian | 56 | 0.0% |
| Northern European | 208 | 0.2% |
| Norwegian | 381 | 0.3% |
| Pakistani | 65 | 0.1% |
| Palestinian | 19 | 0.0% |
| Panamanian | 88 | 0.1% |
| Peruvian | 94 | 0.1% |
| Polish | 1,674 | 1.2% |
| Portuguese | 19 | 0.0% |
| Potawatomi | 4 | 0.0% |
| Puerto Rican | 634 | 0.5% |
| Romanian | 12 | 0.0% |
| Russian | 391 | 0.3% |
| Salvadoran | 230 | 0.2% |
| Scandinavian | 620 | 0.5% |
| Scotch-Irish | 1,670 | 1.2% |
| Scottish | 2,923 | 2.1% |
| Serbian | 36 | 0.0% |
| Slovak | 588 | 0.4% |
| Slovene | 45 | 0.0% |
| South American | 388 | 0.3% |
| Spaniard | 78 | 0.1% |
| Spanish | 18 | 0.0% |
| Sri Lankan | 440 | 0.3% |
| Subsaharan African | 1,215 | 0.9% |
| Swedish | 1,564 | 1.1% |
| Swiss | 257 | 0.2% |
| Thai | 1,555 | 1.1% |
| Trinidadian and Tobagonian | 32 | 0.0% |
| Turkish | 57 | 0.0% |
| Ukrainian | 126 | 0.1% |
| Venezuelan | 141 | 0.1% |
| Welsh | 739 | 0.5% |
| Yugoslavian | 162 | 0.1% |
| Zimbabwean | 9 | 0.0% | View All 106 Rows |
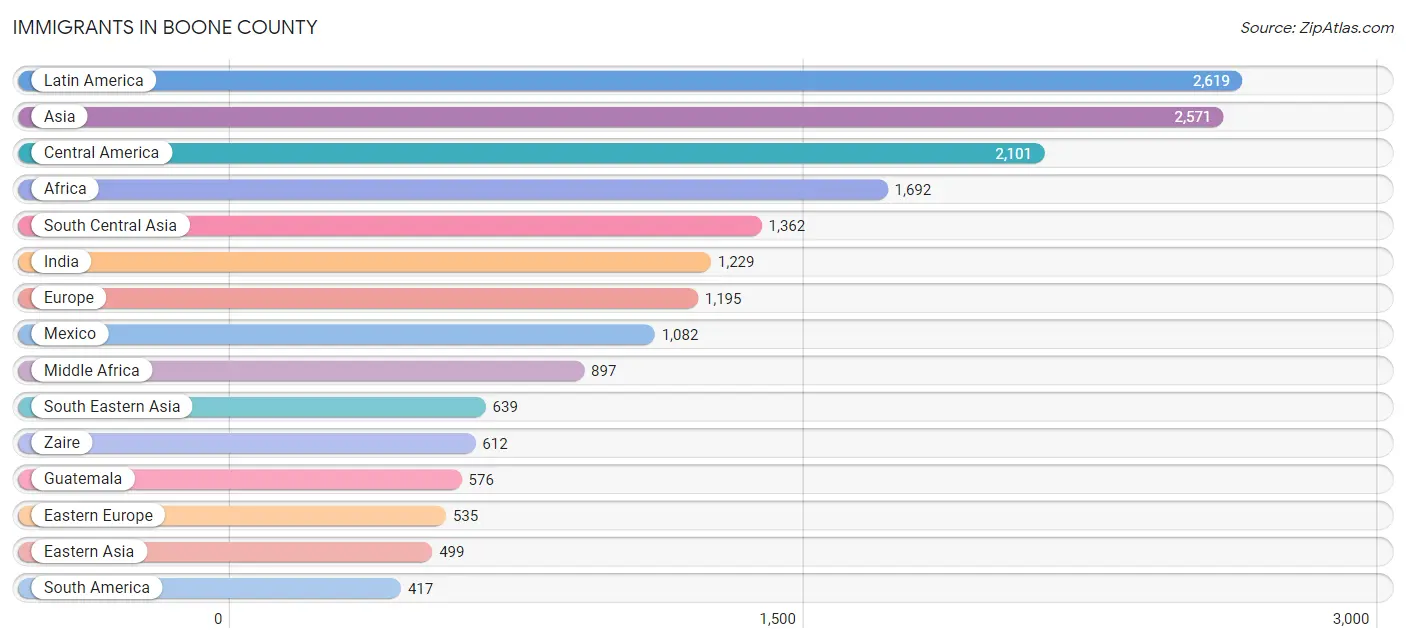
Immigrants in Boone County
The most numerous immigrant groups reported in Boone County came from Latin America (2,619 | 1.9%), Asia (2,571 | 1.9%), Central America (2,101 | 1.5%), Africa (1,692 | 1.2%), and South Central Asia (1,362 | 1.0%), together accounting for 7.6% of all Boone County residents.
| Immigration Origin | # Population | % Population |
| Afghanistan | 21 | 0.0% |
| Africa | 1,692 | 1.2% |
| Albania | 15 | 0.0% |
| Asia | 2,571 | 1.9% |
| Australia | 74 | 0.1% |
| Austria | 22 | 0.0% |
| Belgium | 17 | 0.0% |
| Belize | 13 | 0.0% |
| Bosnia and Herzegovina | 142 | 0.1% |
| Brazil | 157 | 0.1% |
| Bulgaria | 45 | 0.0% |
| Cambodia | 14 | 0.0% |
| Cameroon | 205 | 0.2% |
| Canada | 205 | 0.2% |
| Caribbean | 101 | 0.1% |
| Central America | 2,101 | 1.5% |
| Chile | 5 | 0.0% |
| China | 209 | 0.2% |
| Colombia | 68 | 0.1% |
| Congo | 1 | 0.0% |
| Croatia | 39 | 0.0% |
| Cuba | 34 | 0.0% |
| Eastern Africa | 247 | 0.2% |
| Eastern Asia | 499 | 0.4% |
| Eastern Europe | 535 | 0.4% |
| Ecuador | 14 | 0.0% |
| Egypt | 61 | 0.0% |
| El Salvador | 230 | 0.2% |
| England | 60 | 0.0% |
| Europe | 1,195 | 0.9% |
| Germany | 253 | 0.2% |
| Ghana | 60 | 0.0% |
| Guatemala | 576 | 0.4% |
| Honduras | 91 | 0.1% |
| Hong Kong | 3 | 0.0% |
| India | 1,229 | 0.9% |
| Indonesia | 1 | 0.0% |
| Iran | 16 | 0.0% |
| Iraq | 18 | 0.0% |
| Italy | 33 | 0.0% |
| Jamaica | 56 | 0.0% |
| Japan | 156 | 0.1% |
| Jordan | 20 | 0.0% |
| Korea | 134 | 0.1% |
| Laos | 18 | 0.0% |
| Latin America | 2,619 | 1.9% |
| Latvia | 27 | 0.0% |
| Malaysia | 21 | 0.0% |
| Mexico | 1,082 | 0.8% |
| Micronesia | 207 | 0.2% |
| Middle Africa | 897 | 0.7% |
| Morocco | 127 | 0.1% |
| Netherlands | 29 | 0.0% |
| Nicaragua | 21 | 0.0% |
| Nigeria | 34 | 0.0% |
| Northern Africa | 188 | 0.1% |
| Northern Europe | 247 | 0.2% |
| Norway | 3 | 0.0% |
| Oceania | 281 | 0.2% |
| Pakistan | 96 | 0.1% |
| Panama | 88 | 0.1% |
| Peru | 15 | 0.0% |
| Philippines | 258 | 0.2% |
| Poland | 9 | 0.0% |
| Portugal | 8 | 0.0% |
| Russia | 82 | 0.1% |
| Scotland | 76 | 0.1% |
| Senegal | 84 | 0.1% |
| Singapore | 11 | 0.0% |
| Somalia | 109 | 0.1% |
| South America | 417 | 0.3% |
| South Central Asia | 1,362 | 1.0% |
| South Eastern Asia | 639 | 0.5% |
| Southern Europe | 55 | 0.0% |
| Switzerland | 37 | 0.0% |
| Taiwan | 63 | 0.1% |
| Thailand | 58 | 0.0% |
| Trinidad and Tobago | 11 | 0.0% |
| Ukraine | 29 | 0.0% |
| Venezuela | 150 | 0.1% |
| Vietnam | 258 | 0.2% |
| Western Africa | 309 | 0.2% |
| Western Asia | 71 | 0.1% |
| Western Europe | 358 | 0.3% |
| Zaire | 612 | 0.4% |
| Zimbabwe | 9 | 0.0% | View All 86 Rows |
Sex and Age in Boone County
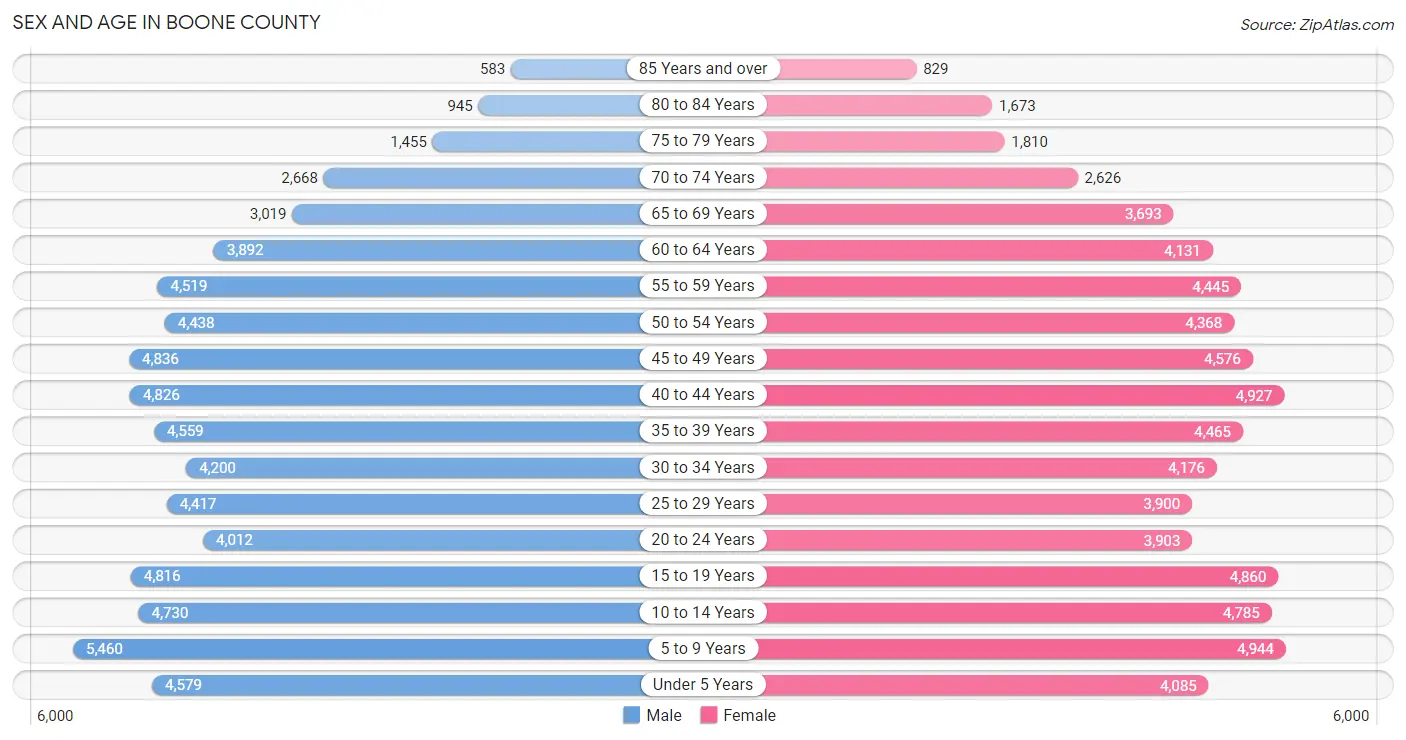
Sex and Age in Boone County
The most populous age groups in Boone County are 5 to 9 Years (5,460 | 8.0%) for men and 5 to 9 Years (4,944 | 7.2%) for women.
| Age Bracket | Male | Female |
| Under 5 Years | 4,579 (6.7%) | 4,085 (6.0%) |
| 5 to 9 Years | 5,460 (8.0%) | 4,944 (7.2%) |
| 10 to 14 Years | 4,730 (7.0%) | 4,785 (7.0%) |
| 15 to 19 Years | 4,816 (7.1%) | 4,860 (7.1%) |
| 20 to 24 Years | 4,012 (5.9%) | 3,903 (5.7%) |
| 25 to 29 Years | 4,417 (6.5%) | 3,900 (5.7%) |
| 30 to 34 Years | 4,200 (6.2%) | 4,176 (6.1%) |
| 35 to 39 Years | 4,559 (6.7%) | 4,465 (6.6%) |
| 40 to 44 Years | 4,826 (7.1%) | 4,927 (7.2%) |
| 45 to 49 Years | 4,836 (7.1%) | 4,576 (6.7%) |
| 50 to 54 Years | 4,438 (6.5%) | 4,368 (6.4%) |
| 55 to 59 Years | 4,519 (6.7%) | 4,445 (6.5%) |
| 60 to 64 Years | 3,892 (5.7%) | 4,131 (6.1%) |
| 65 to 69 Years | 3,019 (4.4%) | 3,693 (5.4%) |
| 70 to 74 Years | 2,668 (3.9%) | 2,626 (3.8%) |
| 75 to 79 Years | 1,455 (2.1%) | 1,810 (2.6%) |
| 80 to 84 Years | 945 (1.4%) | 1,673 (2.5%) |
| 85 Years and over | 583 (0.9%) | 829 (1.2%) |
| Total | 67,954 (100.0%) | 68,196 (100.0%) |
Families and Households in Boone County
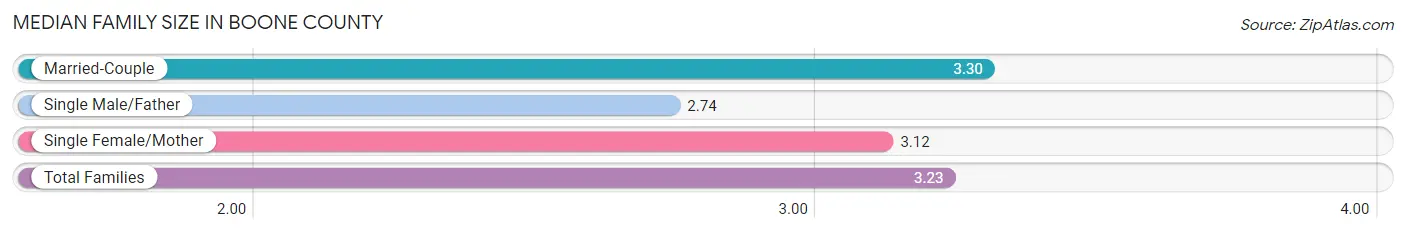
Median Family Size in Boone County
The median family size in Boone County is 3.23 persons per family, with married-couple families (27,376 | 77.9%) accounting for the largest median family size of 3.3 persons per family. On the other hand, single male/father families (2,190 | 6.2%) represent the smallest median family size with 2.74 persons per family.
| Family Type | # Families | Family Size |
| Married-Couple | 27,376 (77.9%) | 3.30 |
| Single Male/Father | 2,190 (6.2%) | 2.74 |
| Single Female/Mother | 5,562 (15.8%) | 3.12 |
| Total Families | 35,128 (100.0%) | 3.23 |
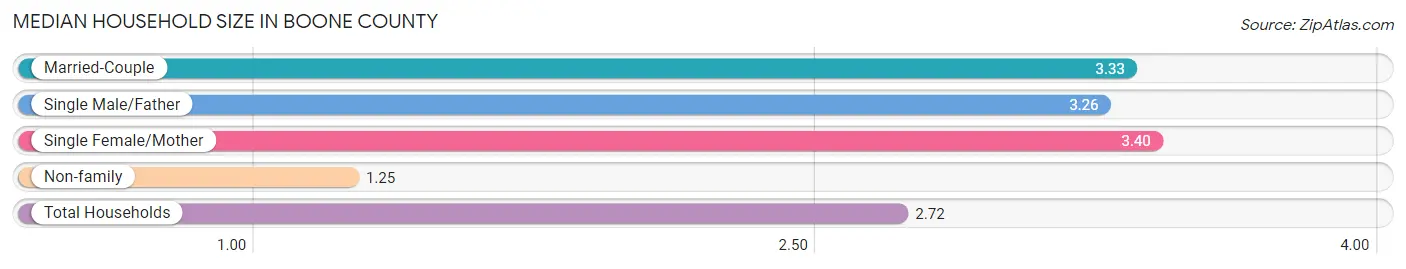
Median Household Size in Boone County
The median household size in Boone County is 2.72 persons per household, with single female/mother households (5,562 | 11.2%) accounting for the largest median household size of 3.4 persons per household. non-family households (14,459 | 29.2%) represent the smallest median household size with 1.25 persons per household.
| Household Type | # Households | Household Size |
| Married-Couple | 27,376 (55.2%) | 3.33 |
| Single Male/Father | 2,190 (4.4%) | 3.26 |
| Single Female/Mother | 5,562 (11.2%) | 3.40 |
| Non-family | 14,459 (29.2%) | 1.25 |
| Total Households | 49,587 (100.0%) | 2.72 |
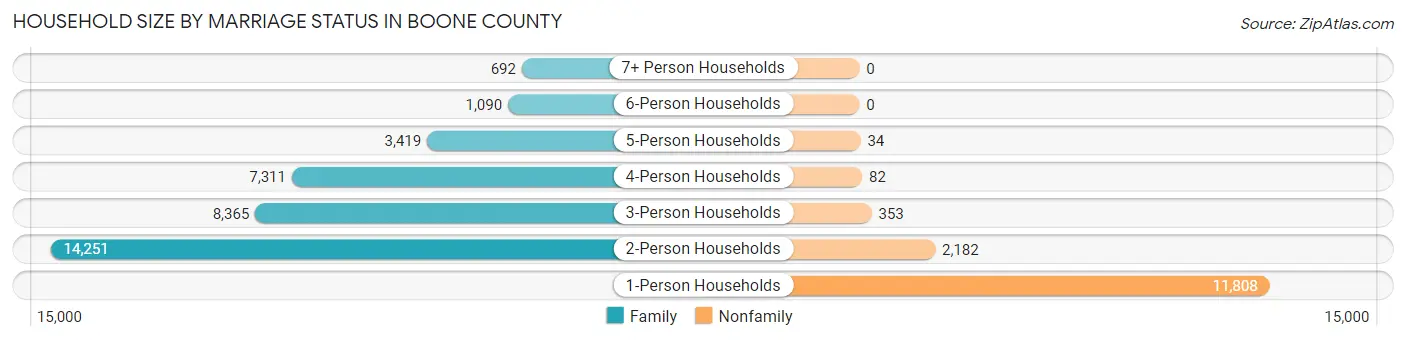
Household Size by Marriage Status in Boone County
Out of a total of 49,587 households in Boone County, 35,128 (70.8%) are family households, while 14,459 (29.2%) are nonfamily households. The most numerous type of family households are 2-person households, comprising 14,251, and the most common type of nonfamily households are 1-person households, comprising 11,808.
| Household Size | Family Households | Nonfamily Households |
| 1-Person Households | - | 11,808 (23.8%) |
| 2-Person Households | 14,251 (28.7%) | 2,182 (4.4%) |
| 3-Person Households | 8,365 (16.9%) | 353 (0.7%) |
| 4-Person Households | 7,311 (14.7%) | 82 (0.2%) |
| 5-Person Households | 3,419 (6.9%) | 34 (0.1%) |
| 6-Person Households | 1,090 (2.2%) | 0 (0.0%) |
| 7+ Person Households | 692 (1.4%) | 0 (0.0%) |
| Total | 35,128 (70.8%) | 14,459 (29.2%) |
Female Fertility in Boone County
Fertility by Age in Boone County
Average fertility rate in Boone County is 50.0 births per 1,000 women. Women in the age bracket of 20 to 34 years have the highest fertility rate with 103.0 births per 1,000 women. Women in the age bracket of 20 to 34 years acount for 77.5% of all women with births.
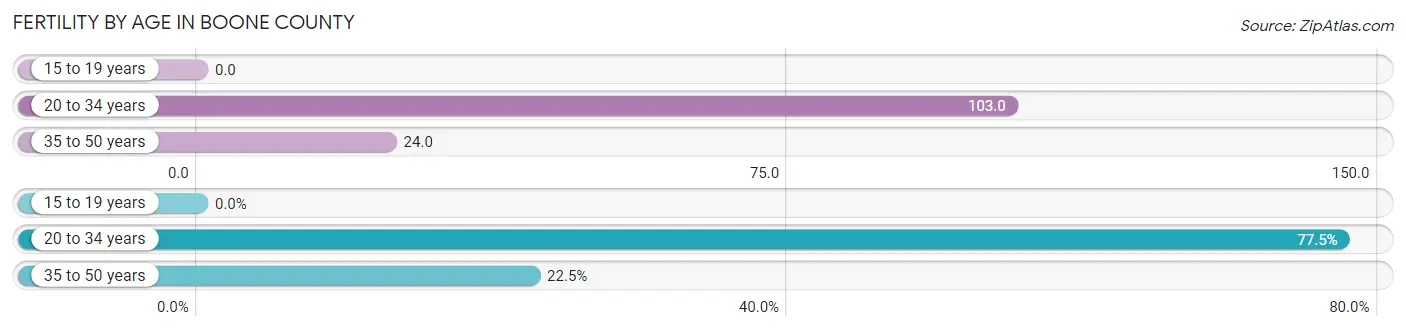
| Age Bracket | Women with Births | Births / 1,000 Women |
| 15 to 19 years | 0 (0.0%) | 0.0 |
| 20 to 34 years | 1,237 (77.5%) | 103.0 |
| 35 to 50 years | 360 (22.5%) | 24.0 |
| Total | 1,597 (100.0%) | 50.0 |
Fertility by Age by Marriage Status in Boone County
74.0% of women with births (1,597) in Boone County are married. The highest percentage of unmarried women with births falls into 20 to 34 years age bracket with 32.3% of them unmarried at the time of birth, while the lowest percentage of unmarried women with births belong to 35 to 50 years age bracket with 4.4% of them unmarried.
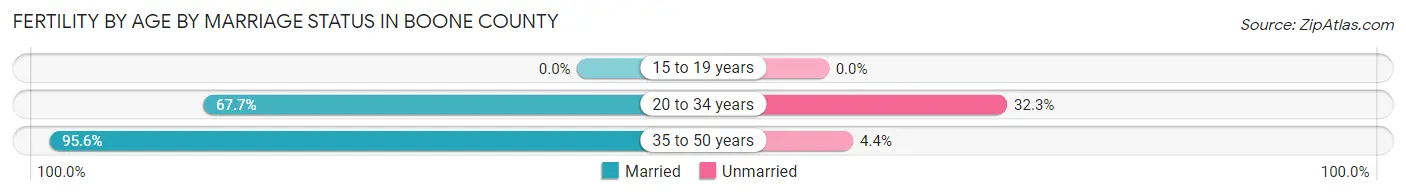
| Age Bracket | Married | Unmarried |
| 15 to 19 years | 0 (0.0%) | 0 (0.0%) |
| 20 to 34 years | 837 (67.7%) | 400 (32.3%) |
| 35 to 50 years | 344 (95.6%) | 16 (4.4%) |
| Total | 1,182 (74.0%) | 415 (26.0%) |
Fertility by Education in Boone County
Average fertility rate in Boone County is 50.0 births per 1,000 women. Women with the education attainment of bachelor's degree have the highest fertility rate of 84.0 births per 1,000 women, while women with the education attainment of less than high school have the lowest fertility at 6.0 births per 1,000 women. Women with the education attainment of bachelor's degree represent 37.3% of all women with births.
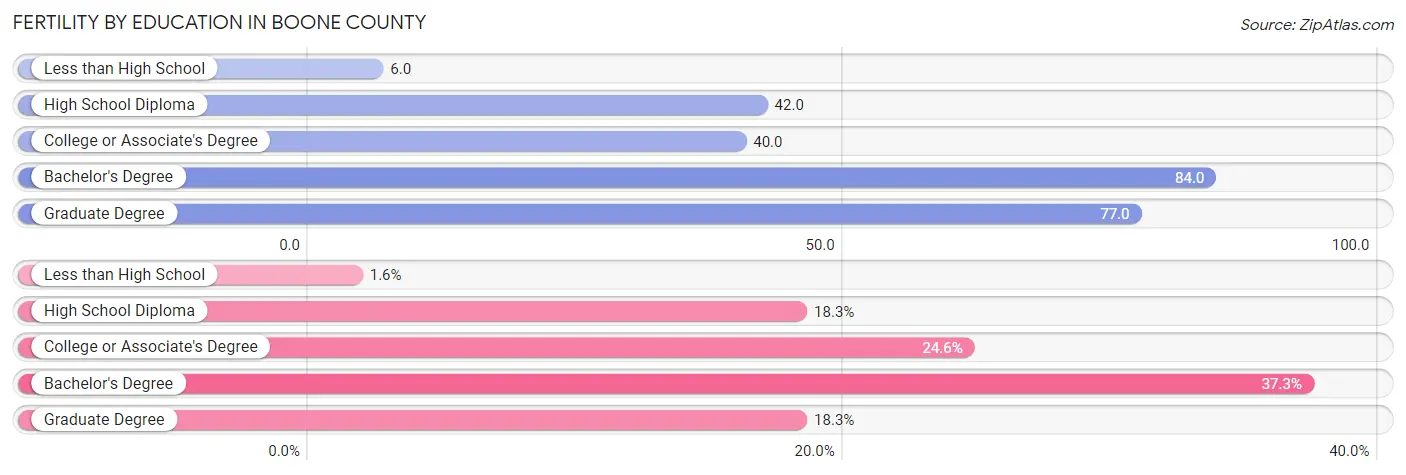
| Educational Attainment | Women with Births | Births / 1,000 Women |
| Less than High School | 26 (1.6%) | 6.0 |
| High School Diploma | 292 (18.3%) | 42.0 |
| College or Associate's Degree | 392 (24.5%) | 40.0 |
| Bachelor's Degree | 595 (37.3%) | 84.0 |
| Graduate Degree | 292 (18.3%) | 77.0 |
| Total | 1,597 (100.0%) | 50.0 |
Fertility by Education by Marriage Status in Boone County
26.0% of women with births in Boone County are unmarried. Women with the educational attainment of less than high school are most likely to be married with 100.0% of them married at childbirth, while women with the educational attainment of high school diploma are least likely to be married with 76.7% of them unmarried at childbirth.
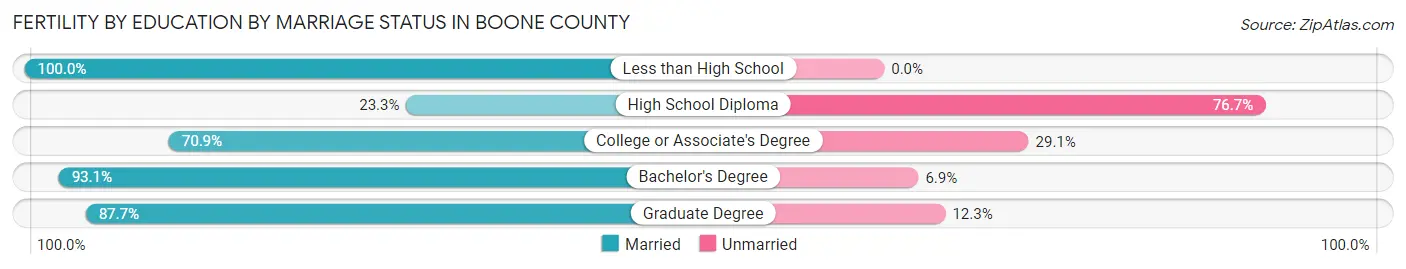
| Educational Attainment | Married | Unmarried |
| Less than High School | 26 (100.0%) | 0 (0.0%) |
| High School Diploma | 68 (23.3%) | 224 (76.7%) |
| College or Associate's Degree | 278 (70.9%) | 114 (29.1%) |
| Bachelor's Degree | 554 (93.1%) | 41 (6.9%) |
| Graduate Degree | 256 (87.7%) | 36 (12.3%) |
| Total | 1,182 (74.0%) | 415 (26.0%) |
Income in Boone County
Income Overview in Boone County
Per Capita Income in Boone County is $41,281, while median incomes of families and households are $109,060 and $91,697 respectively.
| Characteristic | Number | Measure |
| Per Capita Income | 136,150 | $41,281 |
| Median Family Income | 35,128 | $109,060 |
| Mean Family Income | 35,128 | $125,588 |
| Median Household Income | 49,587 | $91,697 |
| Mean Household Income | 49,587 | $110,633 |
| Income Deficit | 35,128 | $10,514 |
| Wage / Income Gap (%) | 136,150 | 31.55% |
| Wage / Income Gap ($) | 136,150 | 68.45¢ per $1 |
| Gini / Inequality Index | 136,150 | 0.39 |
Earnings by Sex in Boone County
Average Earnings in Boone County are $46,692, $56,026 for men and $38,352 for women, a difference of 31.6%.
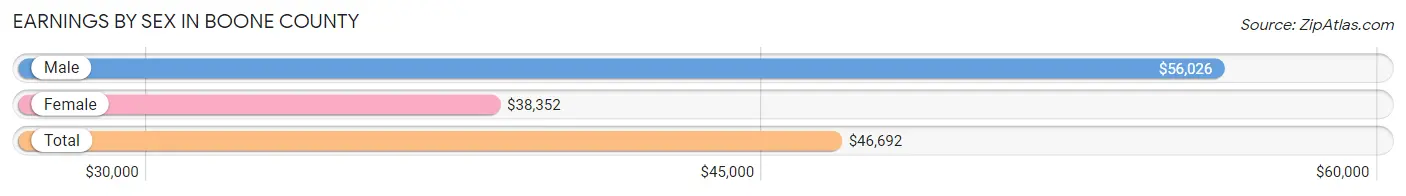
| Sex | Number | Average Earnings |
| Male | 40,630 (53.4%) | $56,026 |
| Female | 35,456 (46.6%) | $38,352 |
| Total | 76,086 (100.0%) | $46,692 |
Earnings by Sex by Income Bracket in Boone County
The most common earnings brackets in Boone County are $100,000+ for men (8,264 | 20.3%) and $100,000+ for women (3,129 | 8.8%).
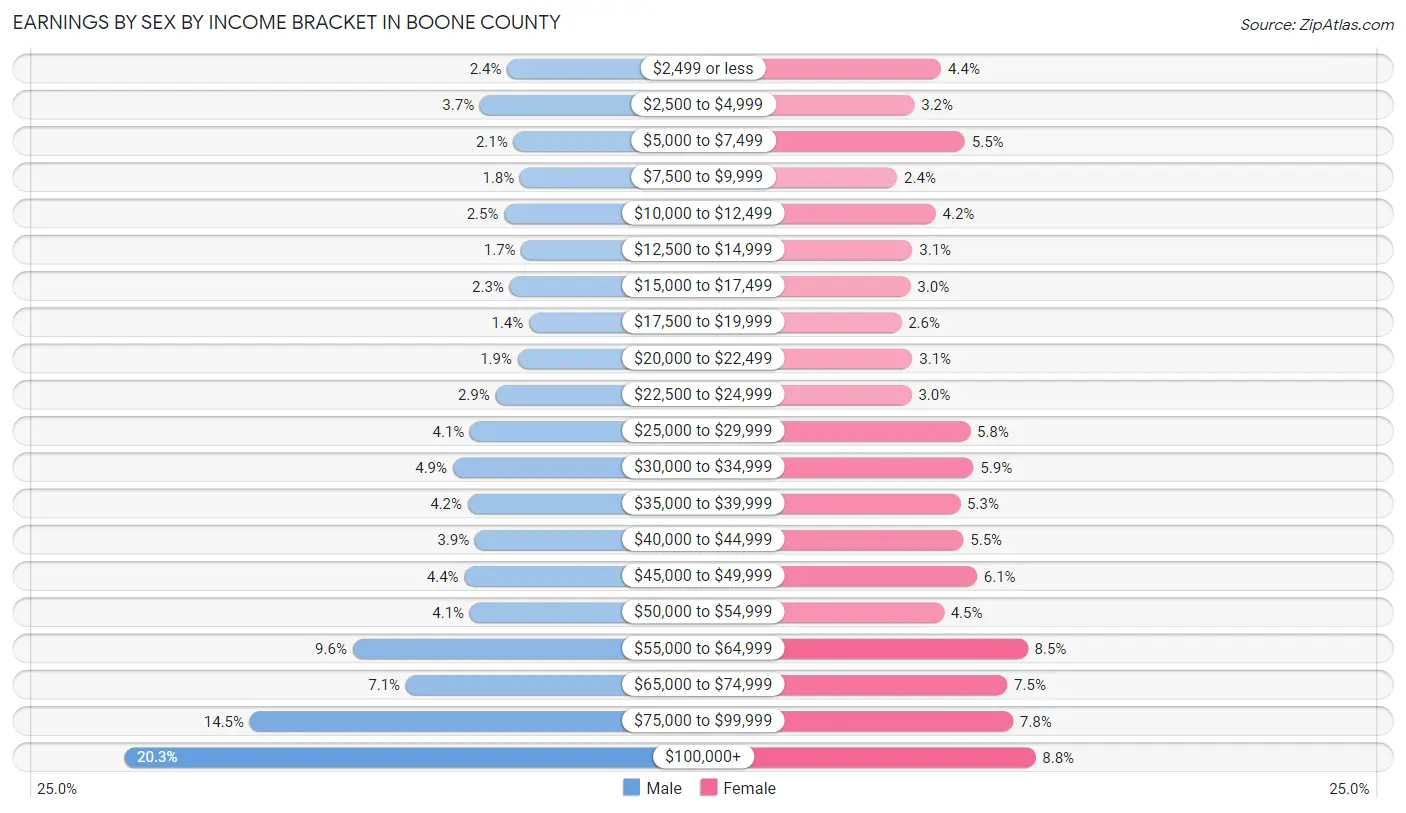
| Income | Male | Female |
| $2,499 or less | 971 (2.4%) | 1,566 (4.4%) |
| $2,500 to $4,999 | 1,491 (3.7%) | 1,122 (3.2%) |
| $5,000 to $7,499 | 854 (2.1%) | 1,960 (5.5%) |
| $7,500 to $9,999 | 728 (1.8%) | 838 (2.4%) |
| $10,000 to $12,499 | 1,027 (2.5%) | 1,474 (4.2%) |
| $12,500 to $14,999 | 702 (1.7%) | 1,089 (3.1%) |
| $15,000 to $17,499 | 925 (2.3%) | 1,055 (3.0%) |
| $17,500 to $19,999 | 558 (1.4%) | 903 (2.5%) |
| $20,000 to $22,499 | 770 (1.9%) | 1,088 (3.1%) |
| $22,500 to $24,999 | 1,195 (2.9%) | 1,074 (3.0%) |
| $25,000 to $29,999 | 1,678 (4.1%) | 2,046 (5.8%) |
| $30,000 to $34,999 | 2,006 (4.9%) | 2,104 (5.9%) |
| $35,000 to $39,999 | 1,723 (4.2%) | 1,881 (5.3%) |
| $40,000 to $44,999 | 1,583 (3.9%) | 1,936 (5.5%) |
| $45,000 to $49,999 | 1,789 (4.4%) | 2,158 (6.1%) |
| $50,000 to $54,999 | 1,682 (4.1%) | 1,611 (4.5%) |
| $55,000 to $64,999 | 3,911 (9.6%) | 3,003 (8.5%) |
| $65,000 to $74,999 | 2,901 (7.1%) | 2,661 (7.5%) |
| $75,000 to $99,999 | 5,872 (14.4%) | 2,758 (7.8%) |
| $100,000+ | 8,264 (20.3%) | 3,129 (8.8%) |
| Total | 40,630 (100.0%) | 35,456 (100.0%) |
Earnings by Sex by Educational Attainment in Boone County
Average earnings in Boone County are $63,307 for men and $45,489 for women, a difference of 28.1%. Men with an educational attainment of graduate degree enjoy the highest average annual earnings of $97,030, while those with less than high school education earn the least with $37,283. Women with an educational attainment of graduate degree earn the most with the average annual earnings of $68,249, while those with less than high school education have the smallest earnings of $32,705.
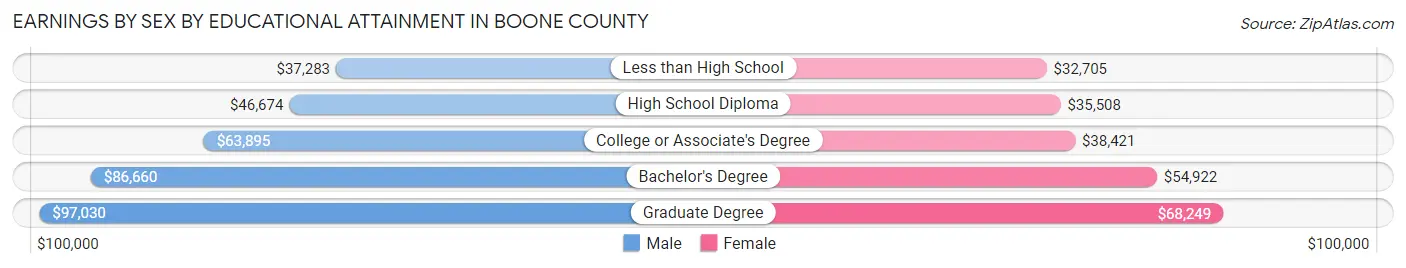
| Educational Attainment | Male Income | Female Income |
| Less than High School | $37,283 | $32,705 |
| High School Diploma | $46,674 | $35,508 |
| College or Associate's Degree | $63,895 | $38,421 |
| Bachelor's Degree | $86,660 | $54,922 |
| Graduate Degree | $97,030 | $68,249 |
| Total | $63,307 | $45,489 |
Family Income in Boone County
Family Income Brackets in Boone County
According to the Boone County family income data, there are 9,941 families falling into the $100,000 to $149,999 income range, which is the most common income bracket and makes up 28.3% of all families. Conversely, the less than $10,000 income bracket is the least frequent group with only 211 families (0.6%) belonging to this category.
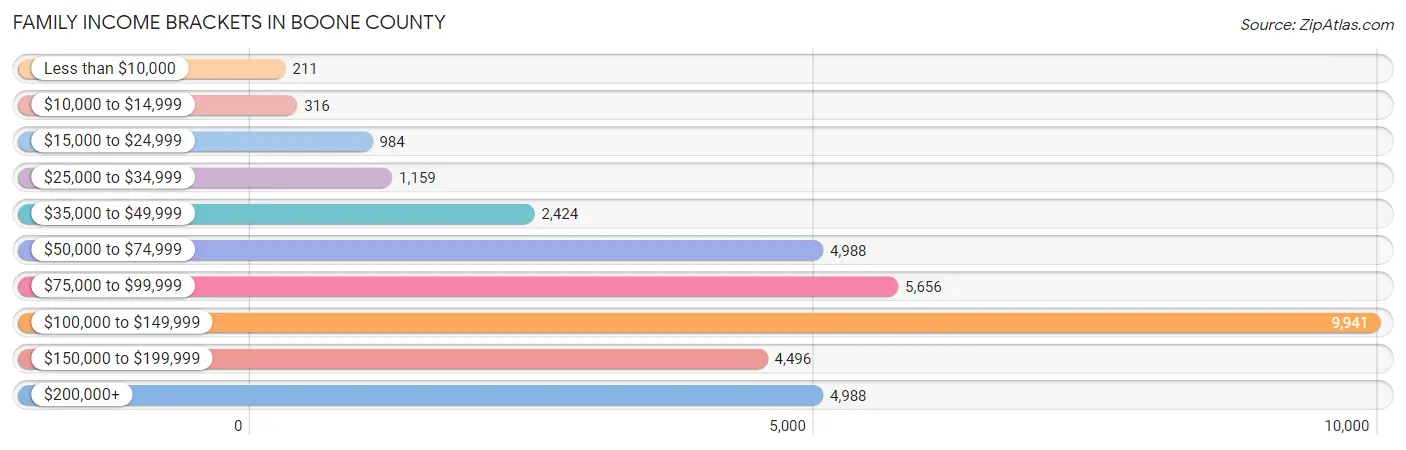
| Income Bracket | # Families | % Families |
| Less than $10,000 | 211 | 0.6% |
| $10,000 to $14,999 | 316 | 0.9% |
| $15,000 to $24,999 | 984 | 2.8% |
| $25,000 to $34,999 | 1,159 | 3.3% |
| $35,000 to $49,999 | 2,424 | 6.9% |
| $50,000 to $74,999 | 4,988 | 14.2% |
| $75,000 to $99,999 | 5,656 | 16.1% |
| $100,000 to $149,999 | 9,941 | 28.3% |
| $150,000 to $199,999 | 4,496 | 12.8% |
| $200,000+ | 4,988 | 14.2% |
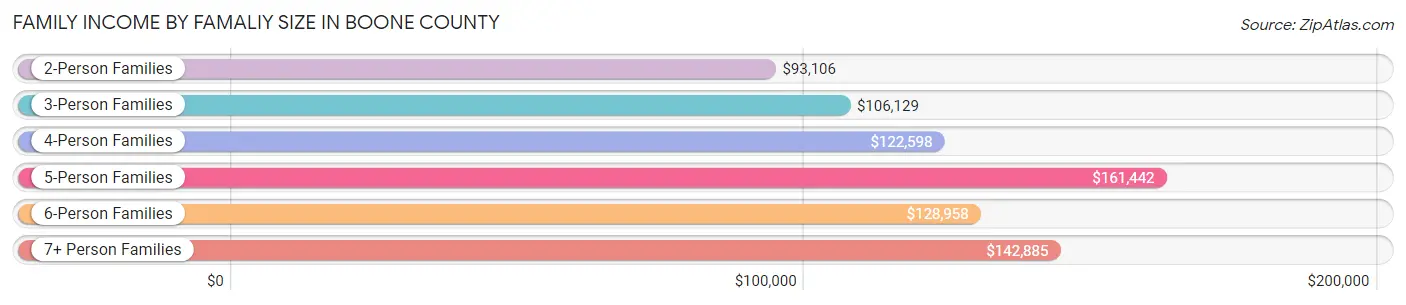
Family Income by Famaliy Size in Boone County
5-person families (2,894 | 8.2%) account for the highest median family income in Boone County with $161,442 per family, while 2-person families (15,512 | 44.2%) have the highest median income of $46,553 per family member.
| Income Bracket | # Families | Median Income |
| 2-Person Families | 15,512 (44.2%) | $93,106 |
| 3-Person Families | 7,885 (22.5%) | $106,129 |
| 4-Person Families | 7,191 (20.5%) | $122,598 |
| 5-Person Families | 2,894 (8.2%) | $161,442 |
| 6-Person Families | 1,124 (3.2%) | $128,958 |
| 7+ Person Families | 522 (1.5%) | $142,885 |
| Total | 35,128 (100.0%) | $109,060 |
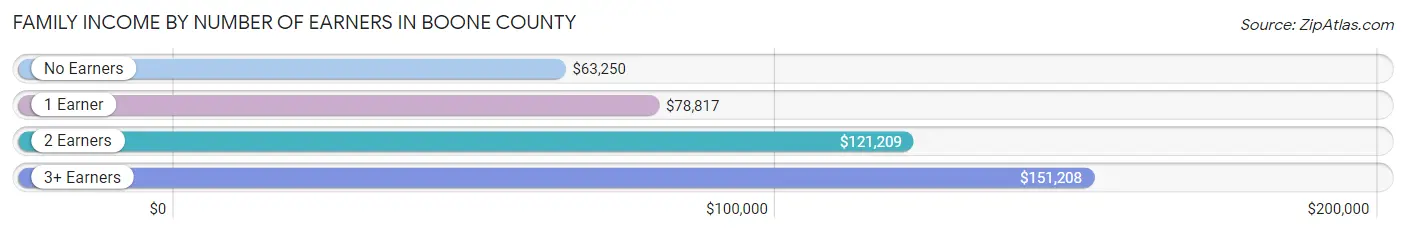
Family Income by Number of Earners in Boone County
The median family income in Boone County is $109,060, with families comprising 3+ earners (5,215) having the highest median family income of $151,208, while families with no earners (3,726) have the lowest median family income of $63,250, accounting for 14.8% and 10.6% of families, respectively.
| Number of Earners | # Families | Median Income |
| No Earners | 3,726 (10.6%) | $63,250 |
| 1 Earner | 10,631 (30.3%) | $78,817 |
| 2 Earners | 15,556 (44.3%) | $121,209 |
| 3+ Earners | 5,215 (14.8%) | $151,208 |
| Total | 35,128 (100.0%) | $109,060 |
Household Income in Boone County
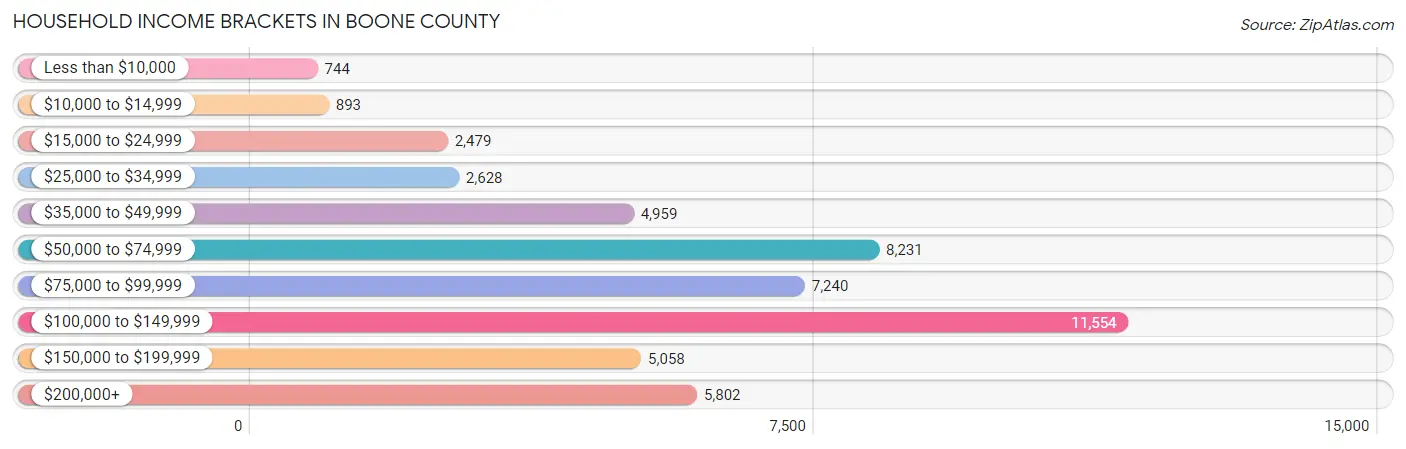
Household Income Brackets in Boone County
With 11,554 households falling in the category, the $100,000 to $149,999 income range is the most frequent in Boone County, accounting for 23.3% of all households. In contrast, only 744 households (1.5%) fall into the less than $10,000 income bracket, making it the least populous group.
| Income Bracket | # Households | % Households |
| Less than $10,000 | 744 | 1.5% |
| $10,000 to $14,999 | 893 | 1.8% |
| $15,000 to $24,999 | 2,479 | 5.0% |
| $25,000 to $34,999 | 2,628 | 5.3% |
| $35,000 to $49,999 | 4,959 | 10.0% |
| $50,000 to $74,999 | 8,231 | 16.6% |
| $75,000 to $99,999 | 7,240 | 14.6% |
| $100,000 to $149,999 | 11,554 | 23.3% |
| $150,000 to $199,999 | 5,058 | 10.2% |
| $200,000+ | 5,802 | 11.7% |
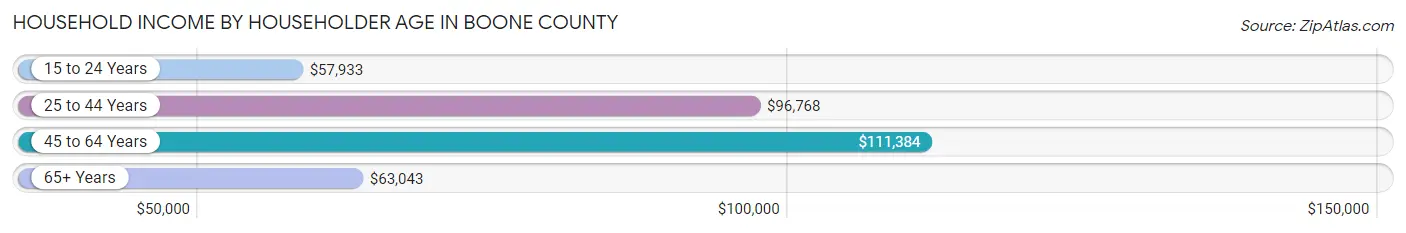
Household Income by Householder Age in Boone County
The median household income in Boone County is $91,697, with the highest median household income of $111,384 found in the 45 to 64 years age bracket for the primary householder. A total of 19,736 households (39.8%) fall into this category. Meanwhile, the 15 to 24 years age bracket for the primary householder has the lowest median household income of $57,933, with 1,070 households (2.2%) in this group.
| Income Bracket | # Households | Median Income |
| 15 to 24 Years | 1,070 (2.2%) | $57,933 |
| 25 to 44 Years | 16,889 (34.1%) | $96,768 |
| 45 to 64 Years | 19,736 (39.8%) | $111,384 |
| 65+ Years | 11,892 (24.0%) | $63,043 |
| Total | 49,587 (100.0%) | $91,697 |
Poverty in Boone County
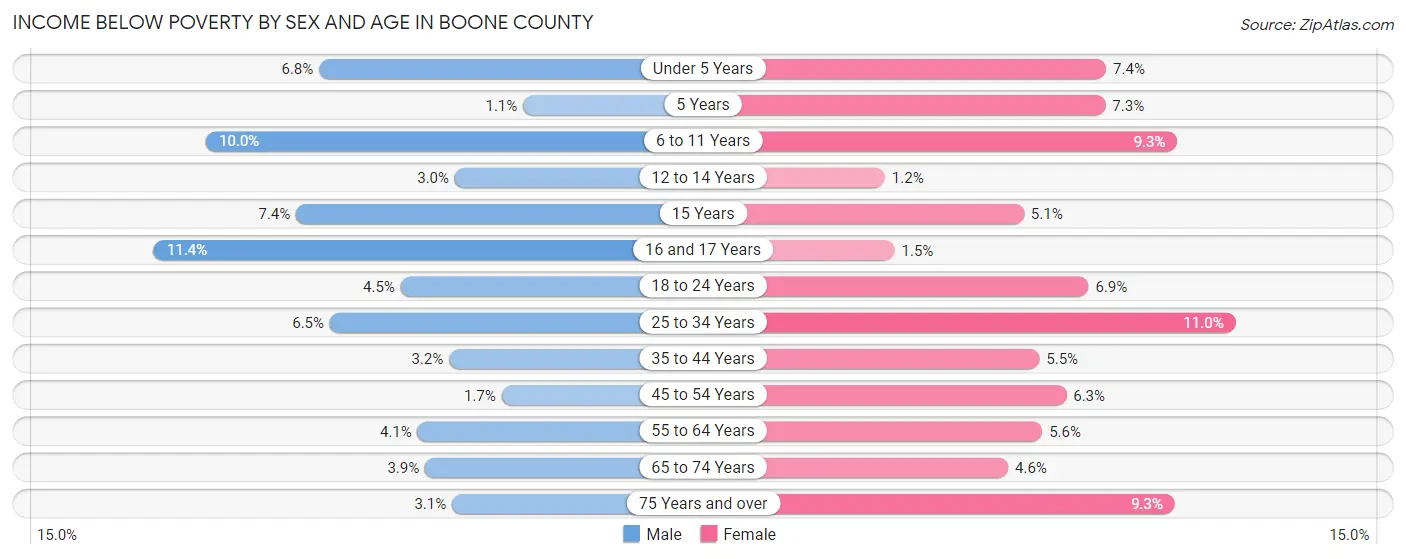
Income Below Poverty by Sex and Age in Boone County
With 4.8% poverty level for males and 6.7% for females among the residents of Boone County, 16 and 17 year old males and 25 to 34 year old females are the most vulnerable to poverty, with 193 males (11.4%) and 880 females (11.0%) in their respective age groups living below the poverty level.
| Age Bracket | Male | Female |
| Under 5 Years | 304 (6.8%) | 289 (7.4%) |
| 5 Years | 11 (1.1%) | 65 (7.3%) |
| 6 to 11 Years | 636 (10.0%) | 517 (9.3%) |
| 12 to 14 Years | 82 (3.0%) | 36 (1.2%) |
| 15 Years | 105 (7.4%) | 61 (5.1%) |
| 16 and 17 Years | 193 (11.4%) | 31 (1.5%) |
| 18 to 24 Years | 257 (4.5%) | 374 (6.9%) |
| 25 to 34 Years | 552 (6.5%) | 880 (11.0%) |
| 35 to 44 Years | 294 (3.2%) | 515 (5.5%) |
| 45 to 54 Years | 159 (1.7%) | 559 (6.2%) |
| 55 to 64 Years | 340 (4.1%) | 476 (5.6%) |
| 65 to 74 Years | 217 (3.8%) | 288 (4.6%) |
| 75 Years and over | 92 (3.1%) | 392 (9.3%) |
| Total | 3,242 (4.8%) | 4,483 (6.7%) |
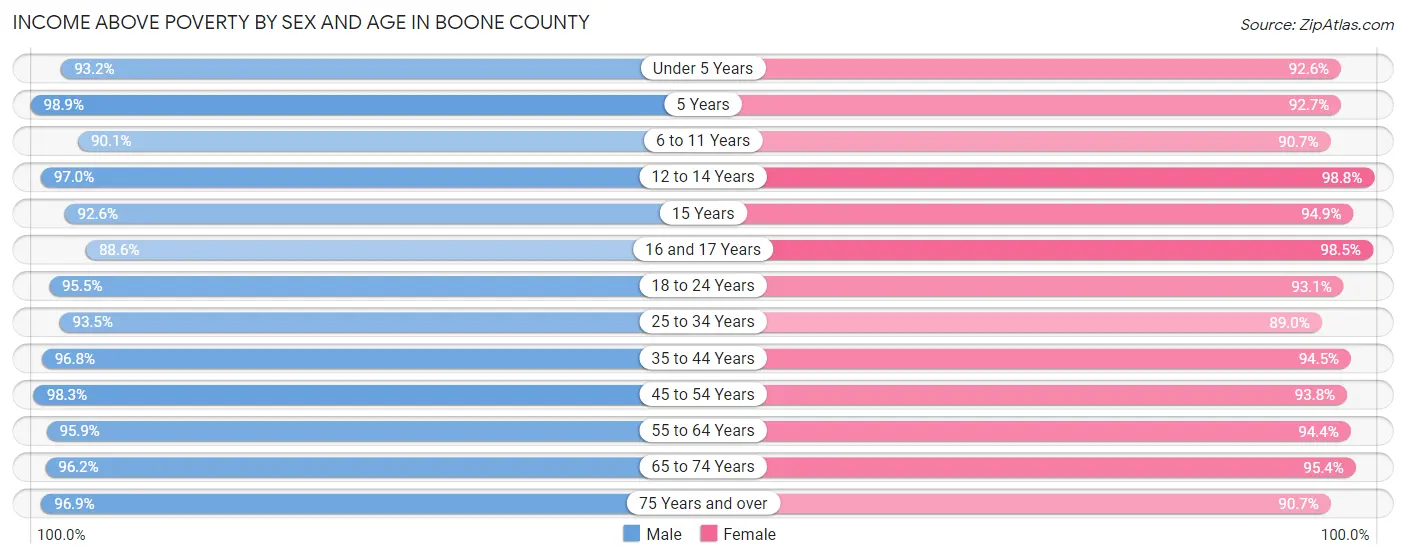
Income Above Poverty by Sex and Age in Boone County
According to the poverty statistics in Boone County, males aged 5 years and females aged 12 to 14 years are the age groups that are most secure financially, with 98.9% of males and 98.8% of females in these age groups living above the poverty line.
| Age Bracket | Male | Female |
| Under 5 Years | 4,166 (93.2%) | 3,635 (92.6%) |
| 5 Years | 968 (98.9%) | 820 (92.7%) |
| 6 to 11 Years | 5,757 (90.0%) | 5,019 (90.7%) |
| 12 to 14 Years | 2,629 (97.0%) | 2,955 (98.8%) |
| 15 Years | 1,307 (92.6%) | 1,142 (94.9%) |
| 16 and 17 Years | 1,500 (88.6%) | 2,078 (98.5%) |
| 18 to 24 Years | 5,411 (95.5%) | 5,070 (93.1%) |
| 25 to 34 Years | 7,934 (93.5%) | 7,151 (89.0%) |
| 35 to 44 Years | 8,942 (96.8%) | 8,845 (94.5%) |
| 45 to 54 Years | 9,082 (98.3%) | 8,378 (93.8%) |
| 55 to 64 Years | 8,041 (95.9%) | 8,053 (94.4%) |
| 65 to 74 Years | 5,420 (96.2%) | 5,935 (95.4%) |
| 75 Years and over | 2,871 (96.9%) | 3,836 (90.7%) |
| Total | 64,028 (95.2%) | 62,917 (93.3%) |
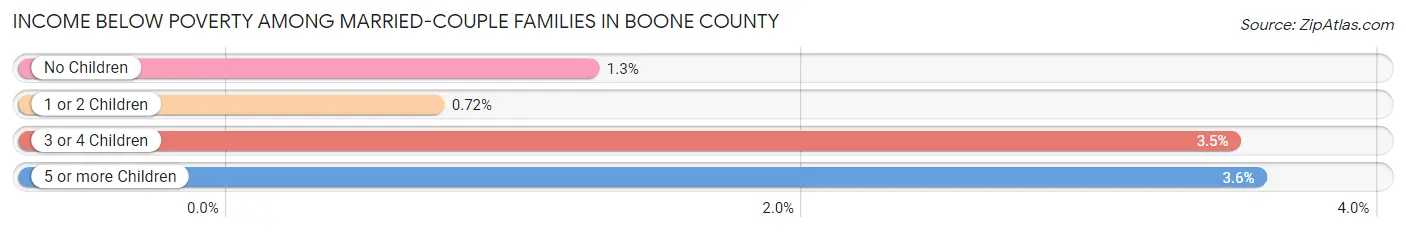
Income Below Poverty Among Married-Couple Families in Boone County
The poverty statistics for married-couple families in Boone County show that 1.3% or 354 of the total 27,376 families live below the poverty line. Families with 5 or more children have the highest poverty rate of 3.6%, comprising of 10 families. On the other hand, families with 1 or 2 children have the lowest poverty rate of 0.7%, which includes 69 families.
| Children | Above Poverty | Below Poverty |
| No Children | 14,879 (98.7%) | 190 (1.3%) |
| 1 or 2 Children | 9,524 (99.3%) | 69 (0.7%) |
| 3 or 4 Children | 2,350 (96.5%) | 85 (3.5%) |
| 5 or more Children | 269 (96.4%) | 10 (3.6%) |
| Total | 27,022 (98.7%) | 354 (1.3%) |
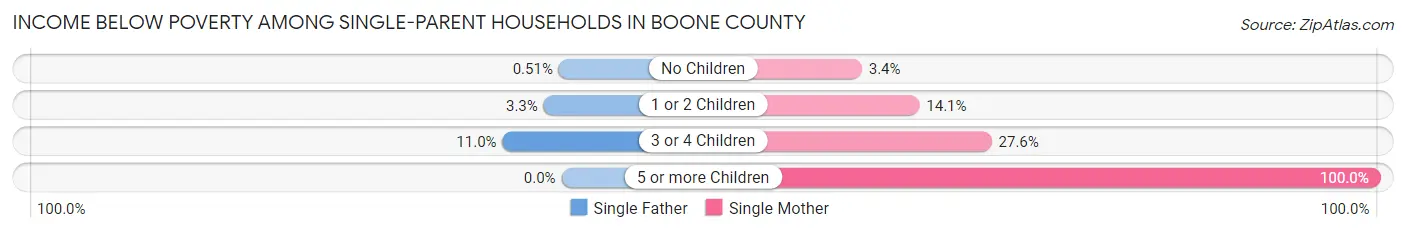
Income Below Poverty Among Single-Parent Households in Boone County
According to the poverty data in Boone County, 3.0% or 66 single-father households and 12.1% or 676 single-mother households are living below the poverty line. Among single-father households, those with 3 or 4 children have the highest poverty rate, with 22 households (11.0%) experiencing poverty. Likewise, among single-mother households, those with 5 or more children have the highest poverty rate, with 4 households (100.0%) falling below the poverty line.
| Children | Single Father | Single Mother |
| No Children | 4 (0.5%) | 69 (3.4%) |
| 1 or 2 Children | 40 (3.3%) | 382 (14.1%) |
| 3 or 4 Children | 22 (11.0%) | 221 (27.6%) |
| 5 or more Children | 0 (0.0%) | 4 (100.0%) |
| Total | 66 (3.0%) | 676 (12.1%) |
Income Below Poverty Among Married-Couple vs Single-Parent Households in Boone County
The poverty data for Boone County shows that 354 of the married-couple family households (1.3%) and 742 of the single-parent households (9.6%) are living below the poverty level. Within the married-couple family households, those with 5 or more children have the highest poverty rate, with 10 households (3.6%) falling below the poverty line. Among the single-parent households, those with 5 or more children have the highest poverty rate, with 4 household (100.0%) living below poverty.
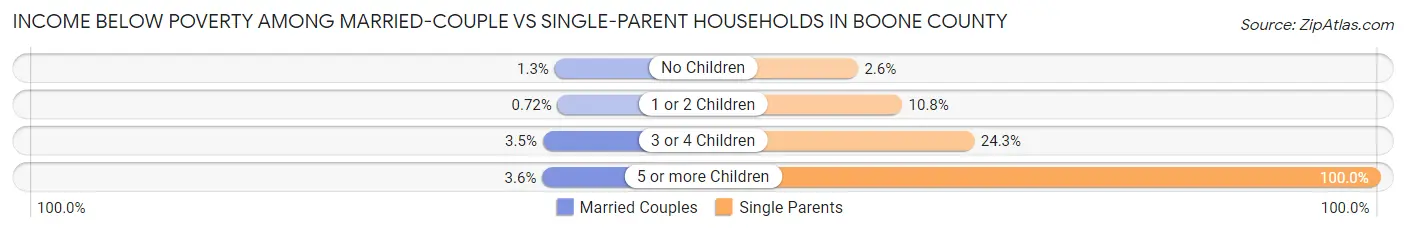
| Children | Married-Couple Families | Single-Parent Households |
| No Children | 190 (1.3%) | 73 (2.6%) |
| 1 or 2 Children | 69 (0.7%) | 422 (10.8%) |
| 3 or 4 Children | 85 (3.5%) | 243 (24.2%) |
| 5 or more Children | 10 (3.6%) | 4 (100.0%) |
| Total | 354 (1.3%) | 742 (9.6%) |
Employment Characteristics in Boone County
Employment by Class of Employer in Boone County
Among the 69,275 employed individuals in Boone County, private company employees (52,012 | 75.1%), not-for-profit organizations (5,453 | 7.9%), and local government employees (3,912 | 5.7%) make up the most common classes of employment.
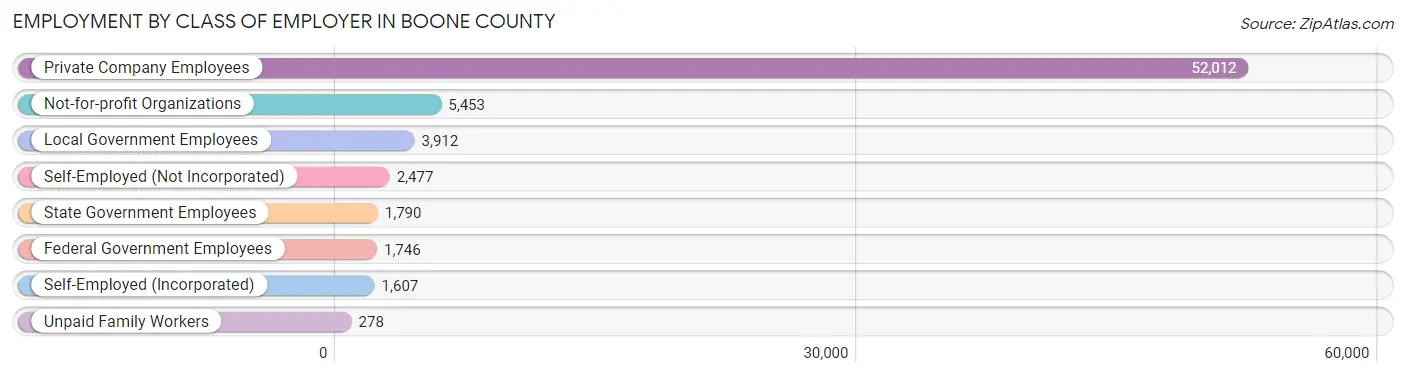
| Employer Class | # Employees | % Employees |
| Private Company Employees | 52,012 | 75.1% |
| Self-Employed (Incorporated) | 1,607 | 2.3% |
| Self-Employed (Not Incorporated) | 2,477 | 3.6% |
| Not-for-profit Organizations | 5,453 | 7.9% |
| Local Government Employees | 3,912 | 5.7% |
| State Government Employees | 1,790 | 2.6% |
| Federal Government Employees | 1,746 | 2.5% |
| Unpaid Family Workers | 278 | 0.4% |
| Total | 69,275 | 100.0% |
Employment Status by Age in Boone County
According to the labor force statistics for Boone County, out of the total population over 16 years of age (104,952), 69.2% or 72,627 individuals are in the labor force, with 2.8% or 2,034 of them unemployed. The age group with the highest labor force participation rate is 35 to 44 years, with 87.6% or 16,449 individuals in the labor force. Within the labor force, the 16 to 19 years age range has the highest percentage of unemployed individuals, with 6.6% or 243 of them being unemployed.
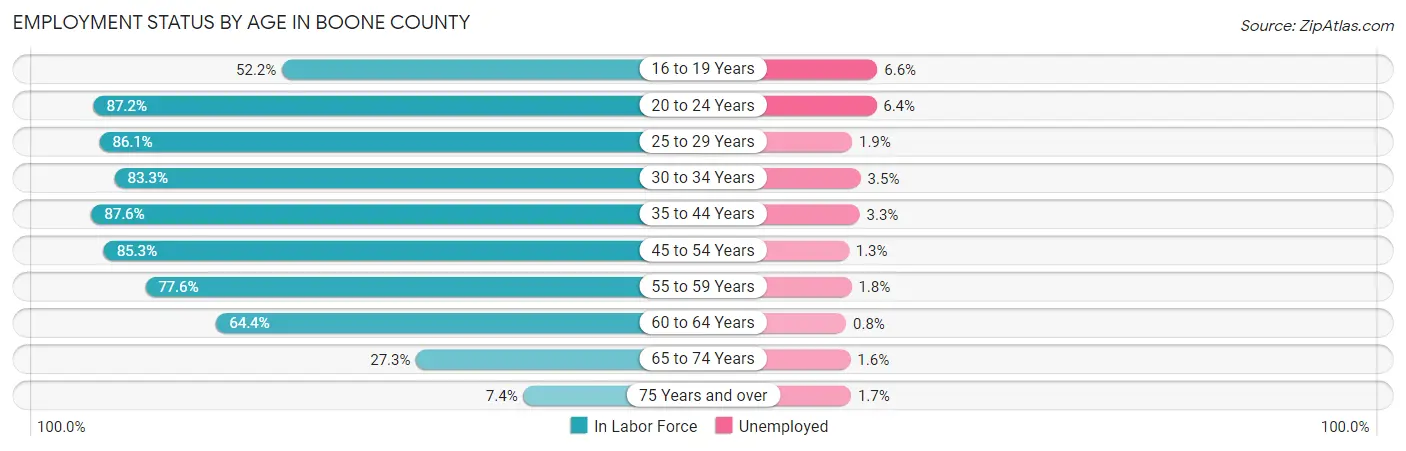
| Age Bracket | In Labor Force | Unemployed |
| 16 to 19 Years | 3,686 (52.2%) | 243 (6.6%) |
| 20 to 24 Years | 6,902 (87.2%) | 442 (6.4%) |
| 25 to 29 Years | 7,161 (86.1%) | 136 (1.9%) |
| 30 to 34 Years | 6,977 (83.3%) | 244 (3.5%) |
| 35 to 44 Years | 16,449 (87.6%) | 543 (3.3%) |
| 45 to 54 Years | 15,540 (85.3%) | 202 (1.3%) |
| 55 to 59 Years | 6,956 (77.6%) | 125 (1.8%) |
| 60 to 64 Years | 5,167 (64.4%) | 41 (0.8%) |
| 65 to 74 Years | 3,278 (27.3%) | 52 (1.6%) |
| 75 Years and over | 540 (7.4%) | 9 (1.7%) |
| Total | 72,627 (69.2%) | 2,034 (2.8%) |
Employment Status by Educational Attainment in Boone County
According to labor force statistics for Boone County, 82.4% of individuals (58,236) out of the total population between 25 and 64 years of age (70,675) are in the labor force, with 2.2% or 1,281 of them being unemployed. The group with the highest labor force participation rate are those with the educational attainment of bachelor's degree or higher, with 88.7% or 23,367 individuals in the labor force. Within the labor force, individuals with less than high school education have the highest percentage of unemployment, with 4.2% or 83 of them being unemployed.
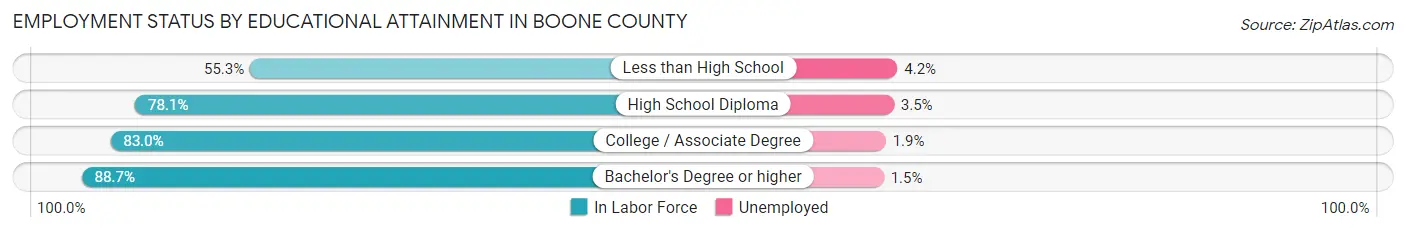
| Educational Attainment | In Labor Force | Unemployed |
| Less than High School | 1,969 (55.3%) | 150 (4.2%) |
| High School Diploma | 14,732 (78.1%) | 660 (3.5%) |
| College / Associate Degree | 18,184 (83.0%) | 416 (1.9%) |
| Bachelor's Degree or higher | 23,367 (88.7%) | 395 (1.5%) |
| Total | 58,236 (82.4%) | 1,555 (2.2%) |
Employment Occupations by Sex in Boone County
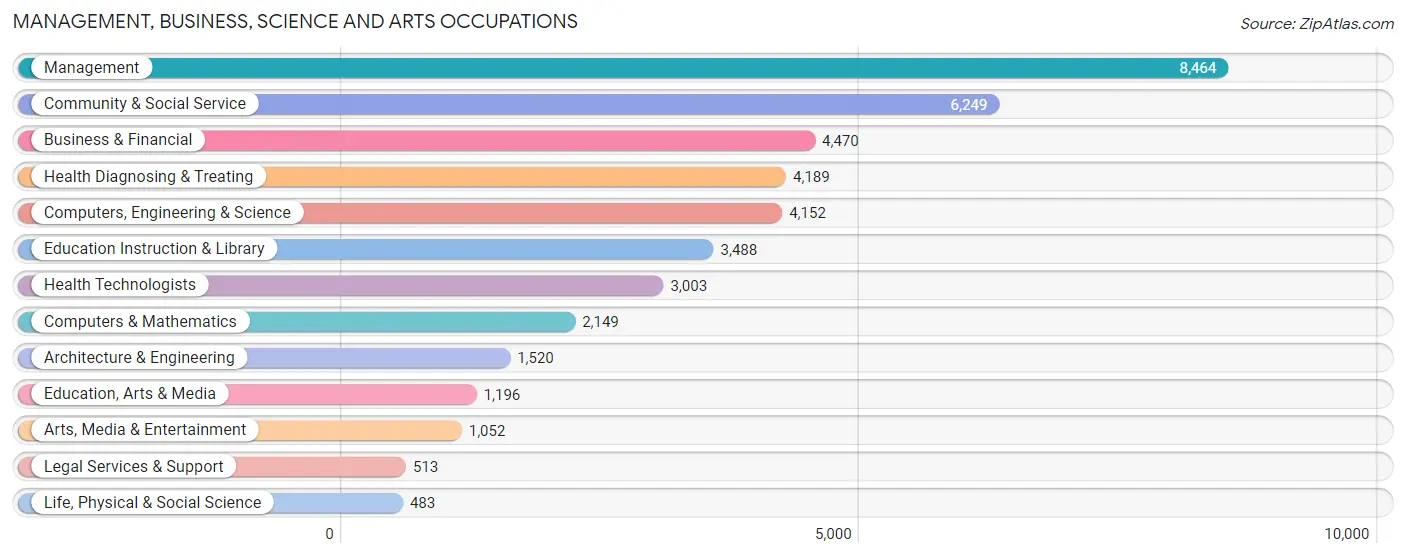
Management, Business, Science and Arts Occupations
The most common Management, Business, Science and Arts occupations in Boone County are Management (8,464 | 12.0%), Community & Social Service (6,249 | 8.9%), Business & Financial (4,470 | 6.3%), Health Diagnosing & Treating (4,189 | 5.9%), and Computers, Engineering & Science (4,152 | 5.9%).
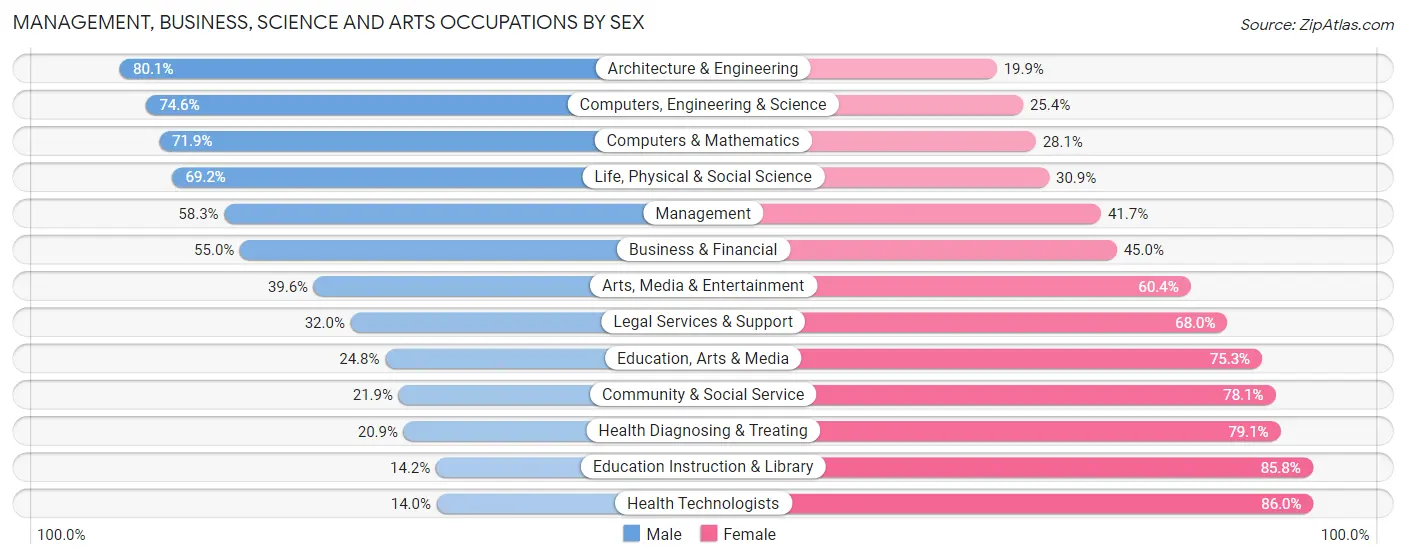
Management, Business, Science and Arts Occupations by Sex
Within the Management, Business, Science and Arts occupations in Boone County, the most male-oriented occupations are Architecture & Engineering (80.1%), Computers, Engineering & Science (74.6%), and Computers & Mathematics (71.9%), while the most female-oriented occupations are Health Technologists (86.0%), Education Instruction & Library (85.8%), and Health Diagnosing & Treating (79.1%).
| Occupation | Male | Female |
| Management | 4,936 (58.3%) | 3,528 (41.7%) |
| Business & Financial | 2,460 (55.0%) | 2,010 (45.0%) |
| Computers, Engineering & Science | 3,097 (74.6%) | 1,055 (25.4%) |
| Computers & Mathematics | 1,546 (71.9%) | 603 (28.1%) |
| Architecture & Engineering | 1,217 (80.1%) | 303 (19.9%) |
| Life, Physical & Social Science | 334 (69.2%) | 149 (30.8%) |
| Community & Social Service | 1,371 (21.9%) | 4,878 (78.1%) |
| Education, Arts & Media | 296 (24.7%) | 900 (75.2%) |
| Legal Services & Support | 164 (32.0%) | 349 (68.0%) |
| Education Instruction & Library | 494 (14.2%) | 2,994 (85.8%) |
| Arts, Media & Entertainment | 417 (39.6%) | 635 (60.4%) |
| Health Diagnosing & Treating | 875 (20.9%) | 3,314 (79.1%) |
| Health Technologists | 421 (14.0%) | 2,582 (86.0%) |
| Total (Category) | 12,739 (46.3%) | 14,785 (53.7%) |
| Total (Overall) | 37,787 (53.6%) | 32,727 (46.4%) |
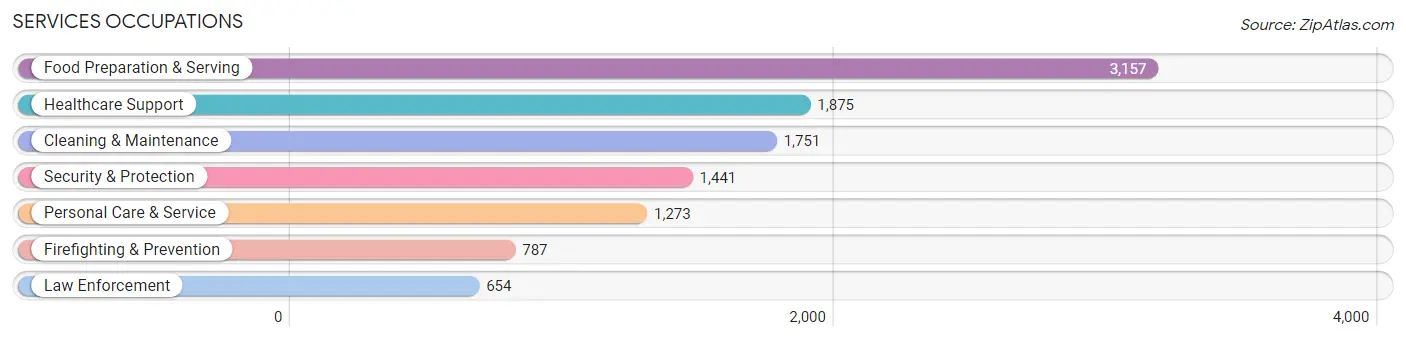
Services Occupations
The most common Services occupations in Boone County are Food Preparation & Serving (3,157 | 4.5%), Healthcare Support (1,875 | 2.7%), Cleaning & Maintenance (1,751 | 2.5%), Security & Protection (1,441 | 2.0%), and Personal Care & Service (1,273 | 1.8%).
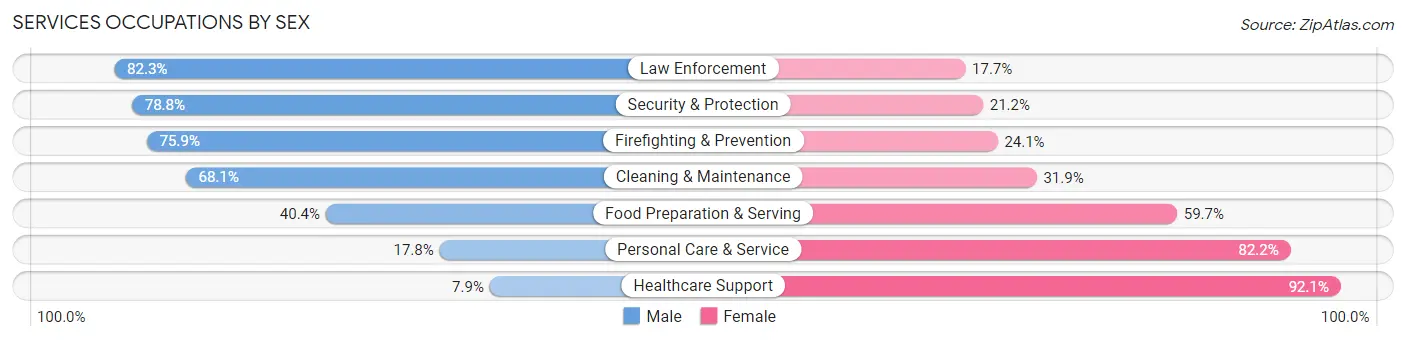
Services Occupations by Sex
Within the Services occupations in Boone County, the most male-oriented occupations are Law Enforcement (82.3%), Security & Protection (78.8%), and Firefighting & Prevention (75.9%), while the most female-oriented occupations are Healthcare Support (92.1%), Personal Care & Service (82.2%), and Food Preparation & Serving (59.7%).
| Occupation | Male | Female |
| Healthcare Support | 148 (7.9%) | 1,727 (92.1%) |
| Security & Protection | 1,135 (78.8%) | 306 (21.2%) |
| Firefighting & Prevention | 597 (75.9%) | 190 (24.1%) |
| Law Enforcement | 538 (82.3%) | 116 (17.7%) |
| Food Preparation & Serving | 1,274 (40.4%) | 1,883 (59.7%) |
| Cleaning & Maintenance | 1,193 (68.1%) | 558 (31.9%) |
| Personal Care & Service | 227 (17.8%) | 1,046 (82.2%) |
| Total (Category) | 3,977 (41.9%) | 5,520 (58.1%) |
| Total (Overall) | 37,787 (53.6%) | 32,727 (46.4%) |
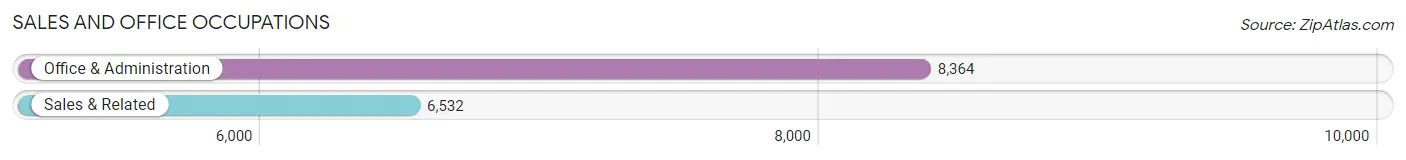
Sales and Office Occupations
The most common Sales and Office occupations in Boone County are Office & Administration (8,364 | 11.9%), and Sales & Related (6,532 | 9.3%).
Sales and Office Occupations by Sex
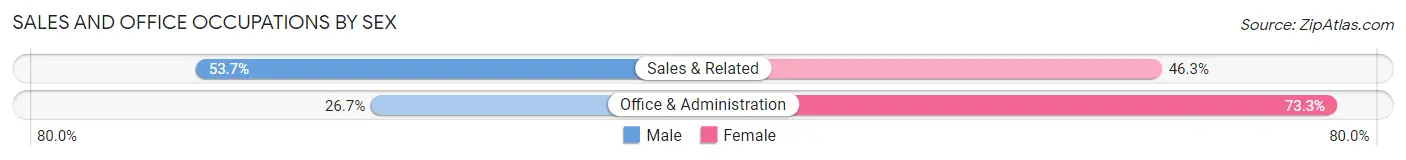
| Occupation | Male | Female |
| Sales & Related | 3,505 (53.7%) | 3,027 (46.3%) |
| Office & Administration | 2,234 (26.7%) | 6,130 (73.3%) |
| Total (Category) | 5,739 (38.5%) | 9,157 (61.5%) |
| Total (Overall) | 37,787 (53.6%) | 32,727 (46.4%) |
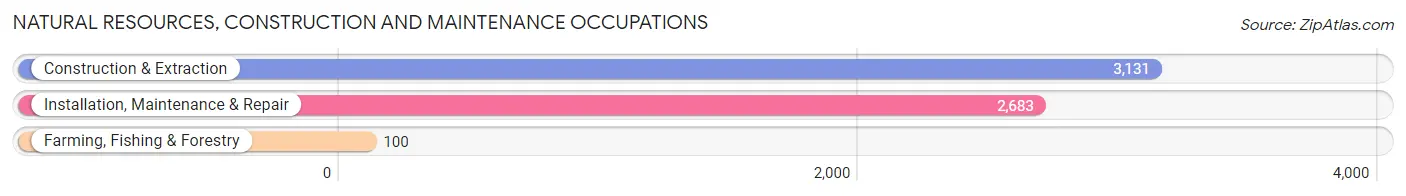
Natural Resources, Construction and Maintenance Occupations
The most common Natural Resources, Construction and Maintenance occupations in Boone County are Construction & Extraction (3,131 | 4.4%), Installation, Maintenance & Repair (2,683 | 3.8%), and Farming, Fishing & Forestry (100 | 0.1%).
Natural Resources, Construction and Maintenance Occupations by Sex
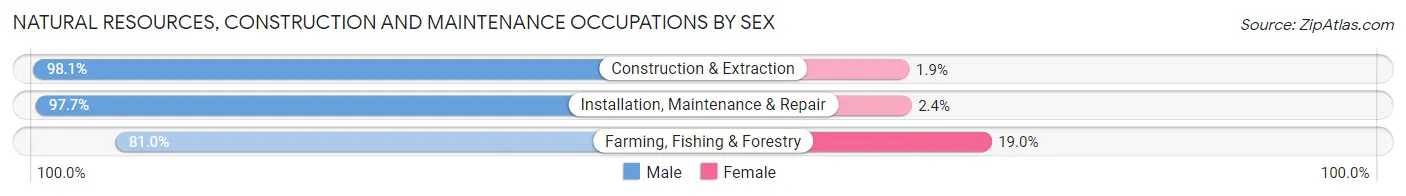
| Occupation | Male | Female |
| Farming, Fishing & Forestry | 81 (81.0%) | 19 (19.0%) |
| Construction & Extraction | 3,071 (98.1%) | 60 (1.9%) |
| Installation, Maintenance & Repair | 2,620 (97.7%) | 63 (2.4%) |
| Total (Category) | 5,772 (97.6%) | 142 (2.4%) |
| Total (Overall) | 37,787 (53.6%) | 32,727 (46.4%) |
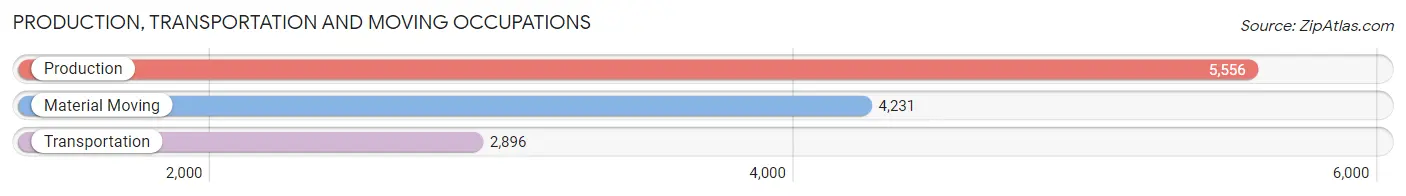
Production, Transportation and Moving Occupations
The most common Production, Transportation and Moving occupations in Boone County are Production (5,556 | 7.9%), Material Moving (4,231 | 6.0%), and Transportation (2,896 | 4.1%).
Production, Transportation and Moving Occupations by Sex
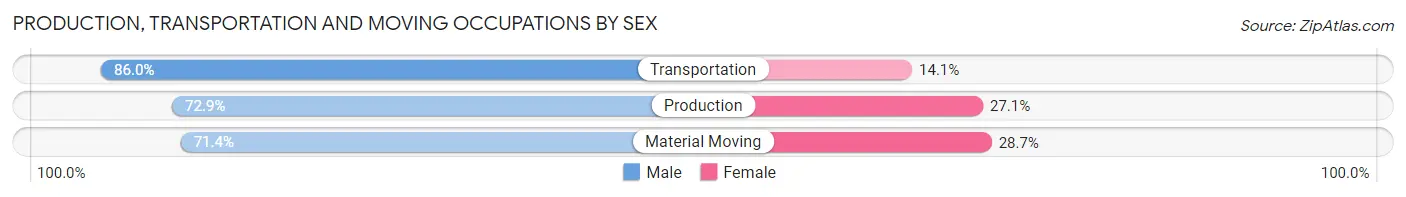
| Occupation | Male | Female |
| Production | 4,052 (72.9%) | 1,504 (27.1%) |
| Transportation | 2,489 (86.0%) | 407 (14.1%) |
| Material Moving | 3,019 (71.4%) | 1,212 (28.6%) |
| Total (Category) | 9,560 (75.4%) | 3,123 (24.6%) |
| Total (Overall) | 37,787 (53.6%) | 32,727 (46.4%) |
Employment Industries by Sex in Boone County
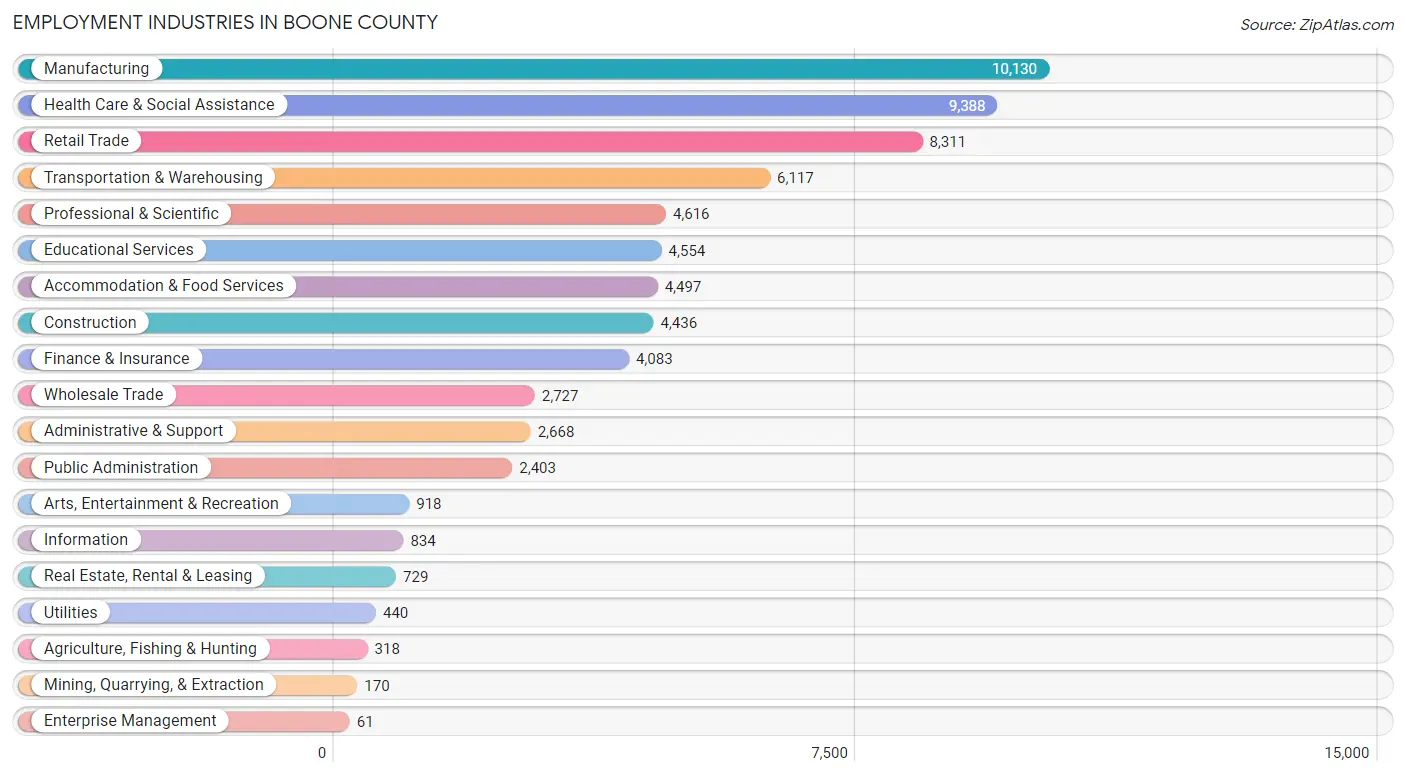
Employment Industries in Boone County
The major employment industries in Boone County include Manufacturing (10,130 | 14.4%), Health Care & Social Assistance (9,388 | 13.3%), Retail Trade (8,311 | 11.8%), Transportation & Warehousing (6,117 | 8.7%), and Professional & Scientific (4,616 | 6.6%).
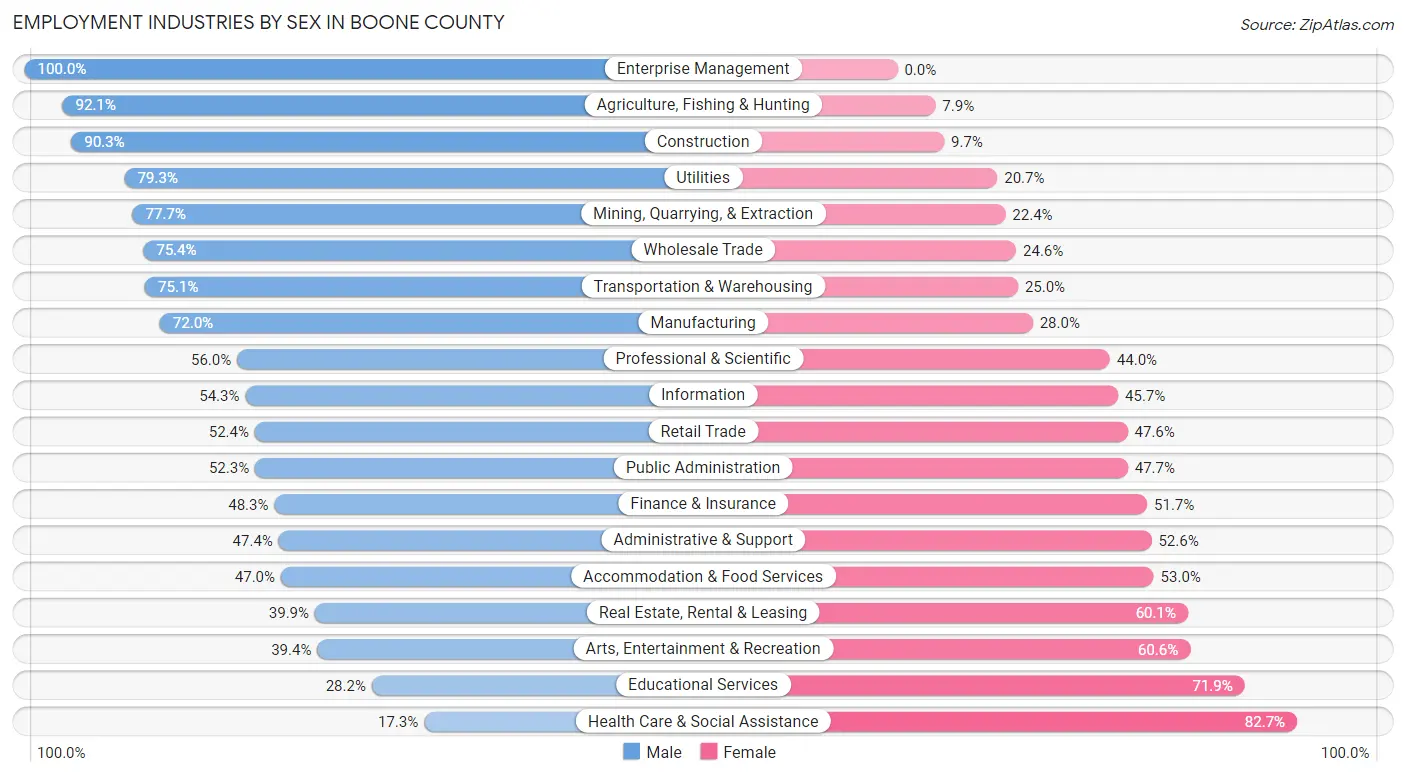
Employment Industries by Sex in Boone County
The Boone County industries that see more men than women are Enterprise Management (100.0%), Agriculture, Fishing & Hunting (92.1%), and Construction (90.3%), whereas the industries that tend to have a higher number of women are Health Care & Social Assistance (82.7%), Educational Services (71.9%), and Arts, Entertainment & Recreation (60.6%).
| Industry | Male | Female |
| Agriculture, Fishing & Hunting | 293 (92.1%) | 25 (7.9%) |
| Mining, Quarrying, & Extraction | 132 (77.6%) | 38 (22.4%) |
| Construction | 4,007 (90.3%) | 429 (9.7%) |
| Manufacturing | 7,293 (72.0%) | 2,837 (28.0%) |
| Wholesale Trade | 2,057 (75.4%) | 670 (24.6%) |
| Retail Trade | 4,352 (52.4%) | 3,959 (47.6%) |
| Transportation & Warehousing | 4,591 (75.0%) | 1,526 (24.9%) |
| Utilities | 349 (79.3%) | 91 (20.7%) |
| Information | 453 (54.3%) | 381 (45.7%) |
| Finance & Insurance | 1,973 (48.3%) | 2,110 (51.7%) |
| Real Estate, Rental & Leasing | 291 (39.9%) | 438 (60.1%) |
| Professional & Scientific | 2,586 (56.0%) | 2,030 (44.0%) |
| Enterprise Management | 61 (100.0%) | 0 (0.0%) |
| Administrative & Support | 1,265 (47.4%) | 1,403 (52.6%) |
| Educational Services | 1,282 (28.1%) | 3,272 (71.9%) |
| Health Care & Social Assistance | 1,626 (17.3%) | 7,762 (82.7%) |
| Arts, Entertainment & Recreation | 362 (39.4%) | 556 (60.6%) |
| Accommodation & Food Services | 2,112 (47.0%) | 2,385 (53.0%) |
| Public Administration | 1,257 (52.3%) | 1,146 (47.7%) |
| Total | 37,787 (53.6%) | 32,727 (46.4%) |
Education in Boone County
School Enrollment in Boone County
The most common levels of schooling among the 35,444 students in Boone County are high school (8,295 | 23.4%), elementary school (8,126 | 22.9%), and middle school (7,579 | 21.4%).
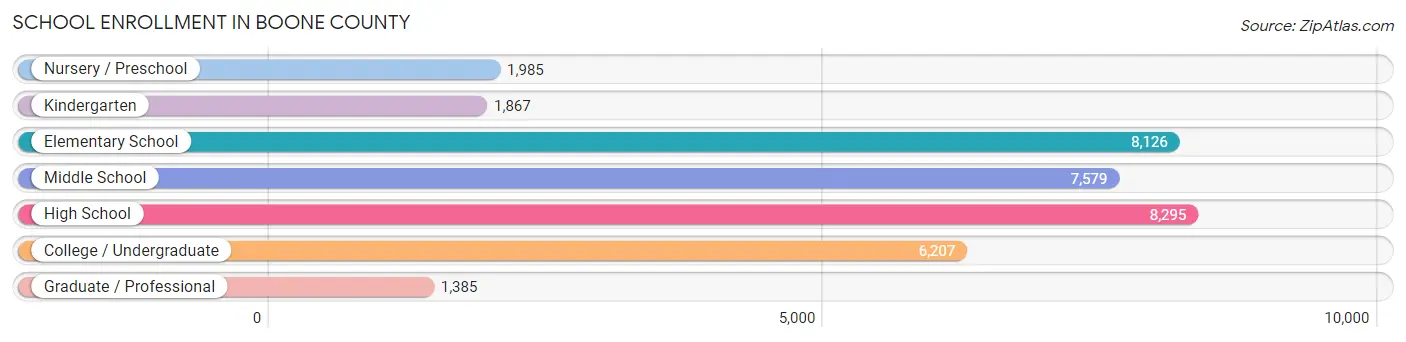
| School Level | # Students | % Students |
| Nursery / Preschool | 1,985 | 5.6% |
| Kindergarten | 1,867 | 5.3% |
| Elementary School | 8,126 | 22.9% |
| Middle School | 7,579 | 21.4% |
| High School | 8,295 | 23.4% |
| College / Undergraduate | 6,207 | 17.5% |
| Graduate / Professional | 1,385 | 3.9% |
| Total | 35,444 | 100.0% |
School Enrollment by Age by Funding Source in Boone County
Out of a total of 35,444 students who are enrolled in schools in Boone County, 5,636 (15.9%) attend a private institution, while the remaining 29,808 (84.1%) are enrolled in public schools. The age group of 3 to 4 year olds has the highest likelihood of being enrolled in private schools, with 693 (54.1% in the age bracket) enrolled. Conversely, the age group of 25 to 34 year olds has the lowest likelihood of being enrolled in a private school, with 1,550 (89.5% in the age bracket) attending a public institution.
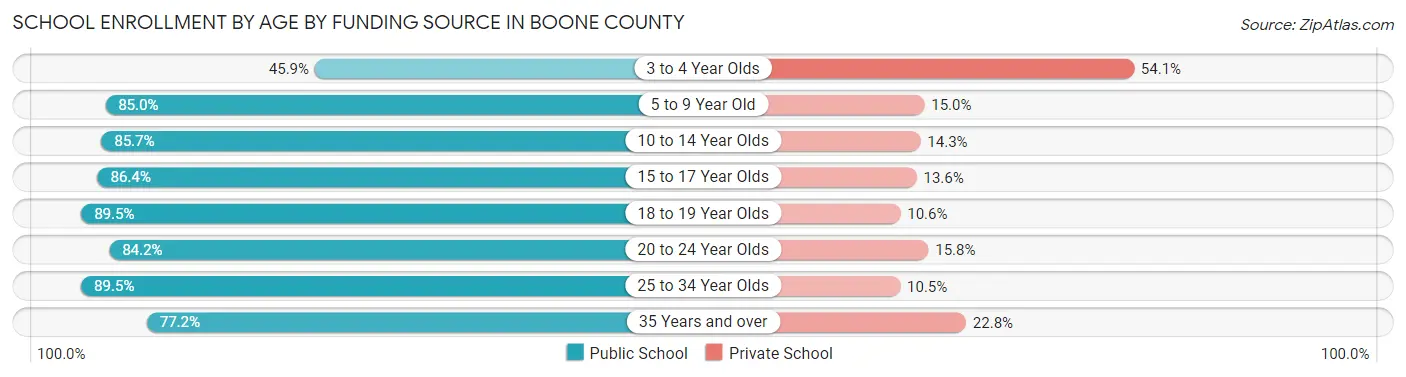
| Age Bracket | Public School | Private School |
| 3 to 4 Year Olds | 589 (45.9%) | 693 (54.1%) |
| 5 to 9 Year Old | 8,365 (85.0%) | 1,479 (15.0%) |
| 10 to 14 Year Olds | 7,944 (85.7%) | 1,325 (14.3%) |
| 15 to 17 Year Olds | 5,454 (86.4%) | 857 (13.6%) |
| 18 to 19 Year Olds | 2,069 (89.4%) | 244 (10.5%) |
| 20 to 24 Year Olds | 2,411 (84.2%) | 451 (15.8%) |
| 25 to 34 Year Olds | 1,550 (89.5%) | 182 (10.5%) |
| 35 Years and over | 1,414 (77.2%) | 417 (22.8%) |
| Total | 29,808 (84.1%) | 5,636 (15.9%) |
Educational Attainment by Field of Study in Boone County
Business (7,573 | 22.7%), education (5,016 | 15.1%), science & technology (3,653 | 11.0%), engineering (2,582 | 7.7%), and arts & humanities (2,562 | 7.7%) are the most common fields of study among 33,315 individuals in Boone County who have obtained a bachelor's degree or higher.
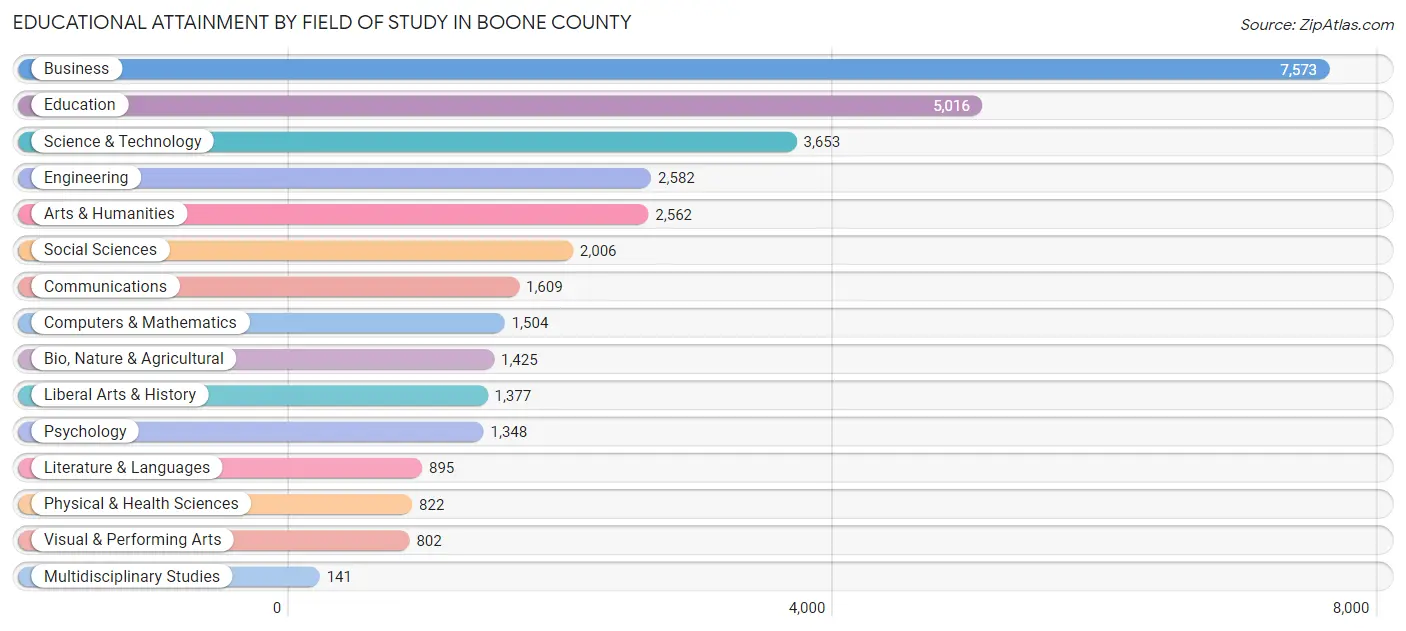
| Field of Study | # Graduates | % Graduates |
| Computers & Mathematics | 1,504 | 4.5% |
| Bio, Nature & Agricultural | 1,425 | 4.3% |
| Physical & Health Sciences | 822 | 2.5% |
| Psychology | 1,348 | 4.1% |
| Social Sciences | 2,006 | 6.0% |
| Engineering | 2,582 | 7.7% |
| Multidisciplinary Studies | 141 | 0.4% |
| Science & Technology | 3,653 | 11.0% |
| Business | 7,573 | 22.7% |
| Education | 5,016 | 15.1% |
| Literature & Languages | 895 | 2.7% |
| Liberal Arts & History | 1,377 | 4.1% |
| Visual & Performing Arts | 802 | 2.4% |
| Communications | 1,609 | 4.8% |
| Arts & Humanities | 2,562 | 7.7% |
| Total | 33,315 | 100.0% |
Transportation & Commute in Boone County
Vehicle Availability by Sex in Boone County
The most prevalent vehicle ownership categories in Boone County are males with 2 vehicles (15,966, accounting for 42.9%) and females with 2 vehicles (12,834, making up 49.8%).
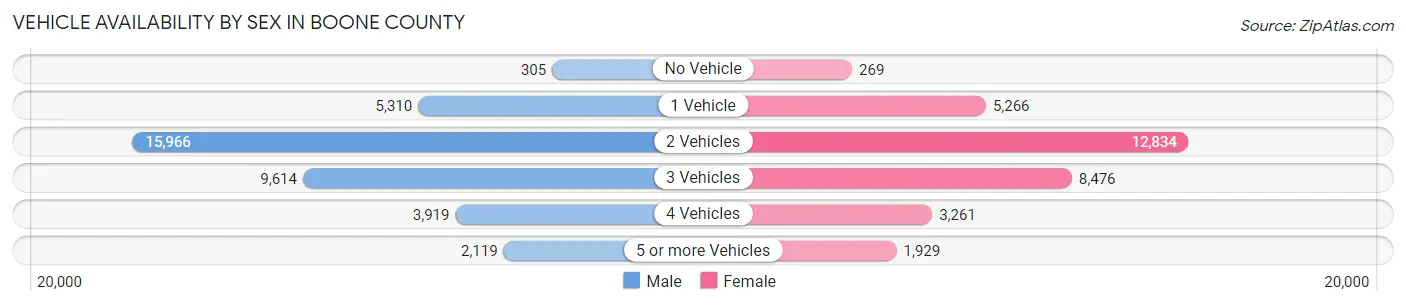
| Vehicles Available | Male | Female |
| No Vehicle | 305 (0.8%) | 269 (0.8%) |
| 1 Vehicle | 5,310 (14.3%) | 5,266 (16.4%) |
| 2 Vehicles | 15,966 (42.9%) | 12,834 (40.1%) |
| 3 Vehicles | 9,614 (25.8%) | 8,476 (26.5%) |
| 4 Vehicles | 3,919 (10.5%) | 3,261 (10.2%) |
| 5 or more Vehicles | 2,119 (5.7%) | 1,929 (6.0%) |
| Total | 37,233 (100.0%) | 32,035 (100.0%) |
Commute Time in Boone County
The most frequently occuring commute durations in Boone County are 15 to 19 minutes (12,315 commuters, 19.9%), 20 to 24 minutes (10,485 commuters, 16.9%), and 10 to 14 minutes (9,459 commuters, 15.3%).
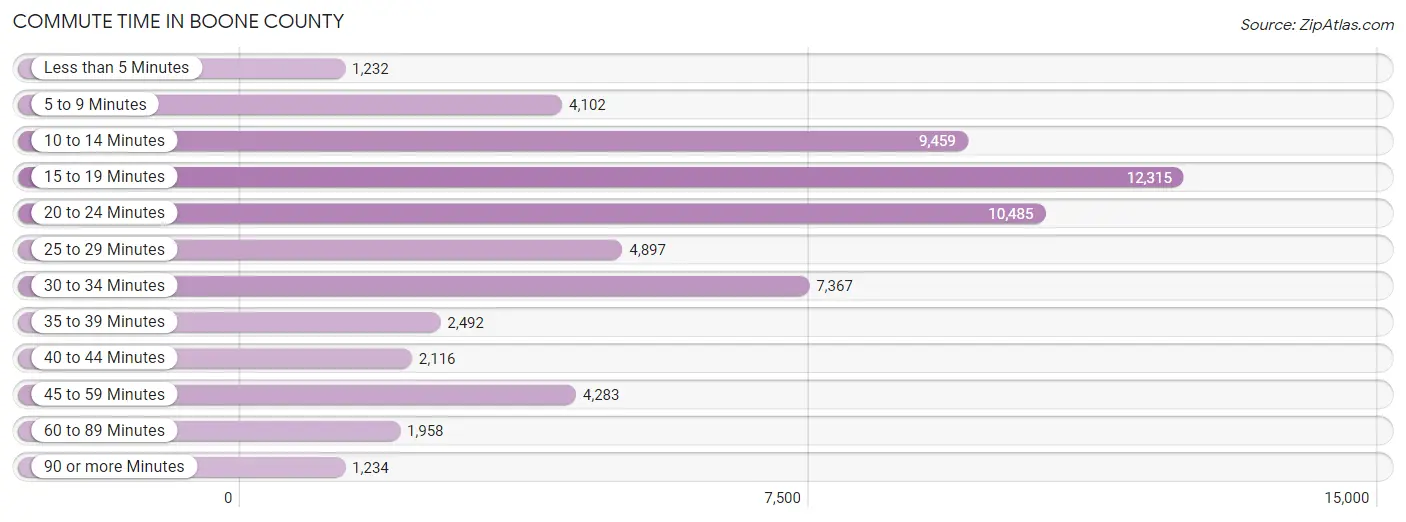
| Commute Time | # Commuters | % Commuters |
| Less than 5 Minutes | 1,232 | 2.0% |
| 5 to 9 Minutes | 4,102 | 6.6% |
| 10 to 14 Minutes | 9,459 | 15.3% |
| 15 to 19 Minutes | 12,315 | 19.9% |
| 20 to 24 Minutes | 10,485 | 16.9% |
| 25 to 29 Minutes | 4,897 | 7.9% |
| 30 to 34 Minutes | 7,367 | 11.9% |
| 35 to 39 Minutes | 2,492 | 4.0% |
| 40 to 44 Minutes | 2,116 | 3.4% |
| 45 to 59 Minutes | 4,283 | 6.9% |
| 60 to 89 Minutes | 1,958 | 3.2% |
| 90 or more Minutes | 1,234 | 2.0% |
Commute Time by Sex in Boone County
The most common commute times in Boone County are 15 to 19 minutes (6,894 commuters, 20.4%) for males and 15 to 19 minutes (5,421 commuters, 19.2%) for females.
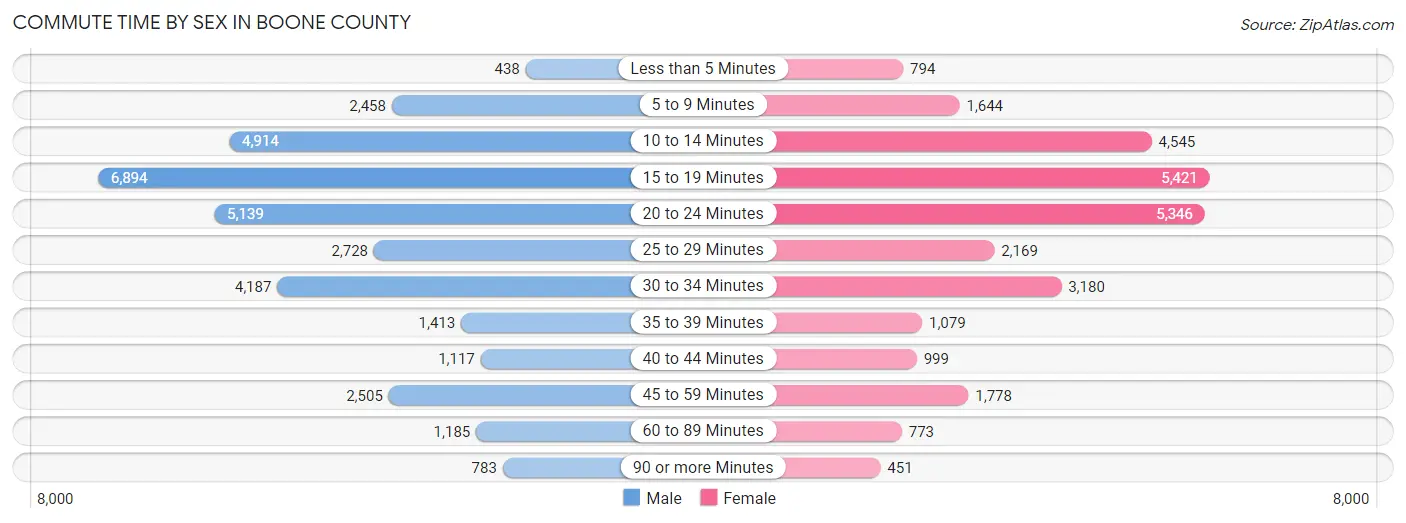
| Commute Time | Male | Female |
| Less than 5 Minutes | 438 (1.3%) | 794 (2.8%) |
| 5 to 9 Minutes | 2,458 (7.3%) | 1,644 (5.8%) |
| 10 to 14 Minutes | 4,914 (14.6%) | 4,545 (16.1%) |
| 15 to 19 Minutes | 6,894 (20.4%) | 5,421 (19.2%) |
| 20 to 24 Minutes | 5,139 (15.2%) | 5,346 (19.0%) |
| 25 to 29 Minutes | 2,728 (8.1%) | 2,169 (7.7%) |
| 30 to 34 Minutes | 4,187 (12.4%) | 3,180 (11.3%) |
| 35 to 39 Minutes | 1,413 (4.2%) | 1,079 (3.8%) |
| 40 to 44 Minutes | 1,117 (3.3%) | 999 (3.5%) |
| 45 to 59 Minutes | 2,505 (7.4%) | 1,778 (6.3%) |
| 60 to 89 Minutes | 1,185 (3.5%) | 773 (2.7%) |
| 90 or more Minutes | 783 (2.3%) | 451 (1.6%) |
Time of Departure to Work by Sex in Boone County
The most frequent times of departure to work in Boone County are 7:00 AM to 7:29 AM (4,505, 13.3%) for males and 7:00 AM to 7:29 AM (4,789, 17.0%) for females.
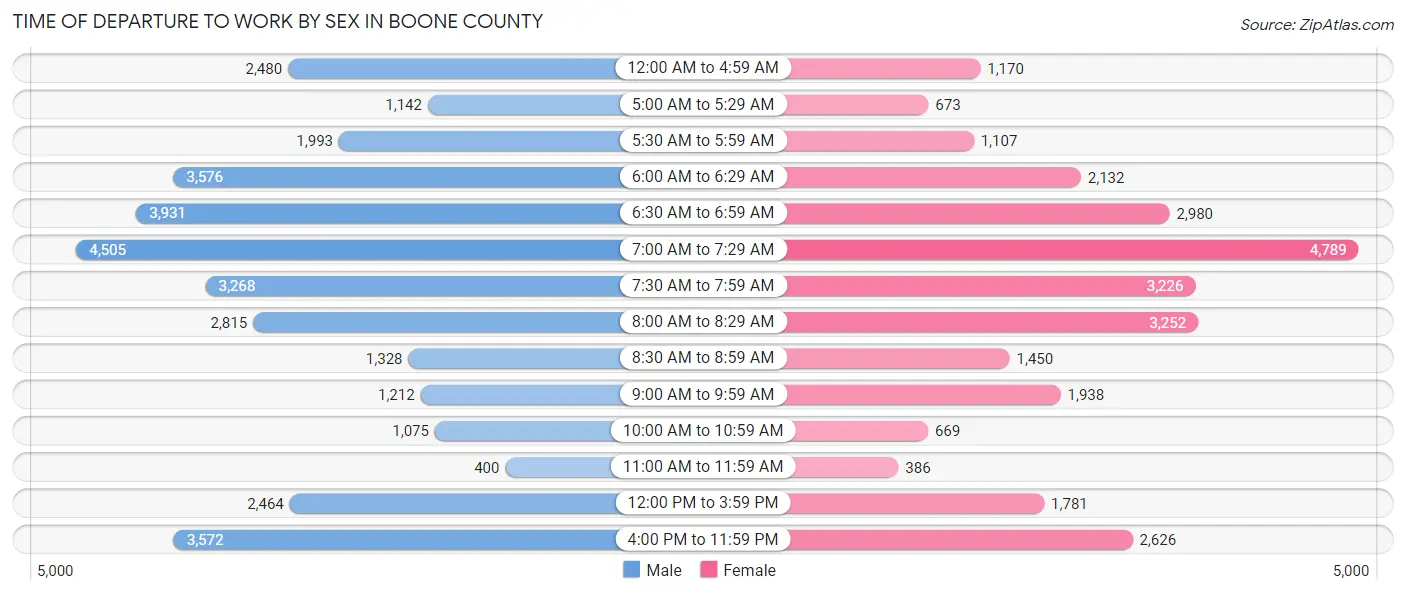
| Time of Departure | Male | Female |
| 12:00 AM to 4:59 AM | 2,480 (7.3%) | 1,170 (4.2%) |
| 5:00 AM to 5:29 AM | 1,142 (3.4%) | 673 (2.4%) |
| 5:30 AM to 5:59 AM | 1,993 (5.9%) | 1,107 (3.9%) |
| 6:00 AM to 6:29 AM | 3,576 (10.6%) | 2,132 (7.6%) |
| 6:30 AM to 6:59 AM | 3,931 (11.6%) | 2,980 (10.6%) |
| 7:00 AM to 7:29 AM | 4,505 (13.3%) | 4,789 (17.0%) |
| 7:30 AM to 7:59 AM | 3,268 (9.7%) | 3,226 (11.5%) |
| 8:00 AM to 8:29 AM | 2,815 (8.3%) | 3,252 (11.5%) |
| 8:30 AM to 8:59 AM | 1,328 (3.9%) | 1,450 (5.1%) |
| 9:00 AM to 9:59 AM | 1,212 (3.6%) | 1,938 (6.9%) |
| 10:00 AM to 10:59 AM | 1,075 (3.2%) | 669 (2.4%) |
| 11:00 AM to 11:59 AM | 400 (1.2%) | 386 (1.4%) |
| 12:00 PM to 3:59 PM | 2,464 (7.3%) | 1,781 (6.3%) |
| 4:00 PM to 11:59 PM | 3,572 (10.6%) | 2,626 (9.3%) |
| Total | 33,761 (100.0%) | 28,179 (100.0%) |
Housing Occupancy in Boone County
Occupancy by Ownership in Boone County
Of the total 49,587 dwellings in Boone County, owner-occupied units account for 37,766 (76.2%), while renter-occupied units make up 11,821 (23.8%).
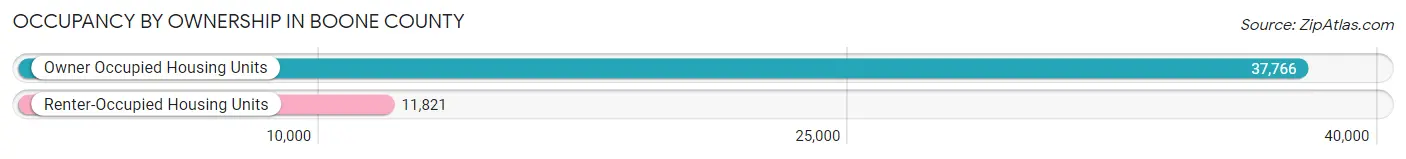
| Occupancy | # Housing Units | % Housing Units |
| Owner Occupied Housing Units | 37,766 | 76.2% |
| Renter-Occupied Housing Units | 11,821 | 23.8% |
| Total Occupied Housing Units | 49,587 | 100.0% |
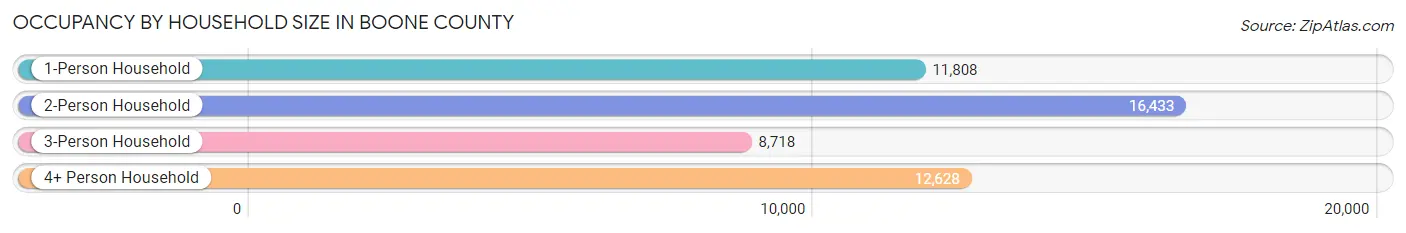
Occupancy by Household Size in Boone County
| Household Size | # Housing Units | % Housing Units |
| 1-Person Household | 11,808 | 23.8% |
| 2-Person Household | 16,433 | 33.1% |
| 3-Person Household | 8,718 | 17.6% |
| 4+ Person Household | 12,628 | 25.5% |
| Total Housing Units | 49,587 | 100.0% |
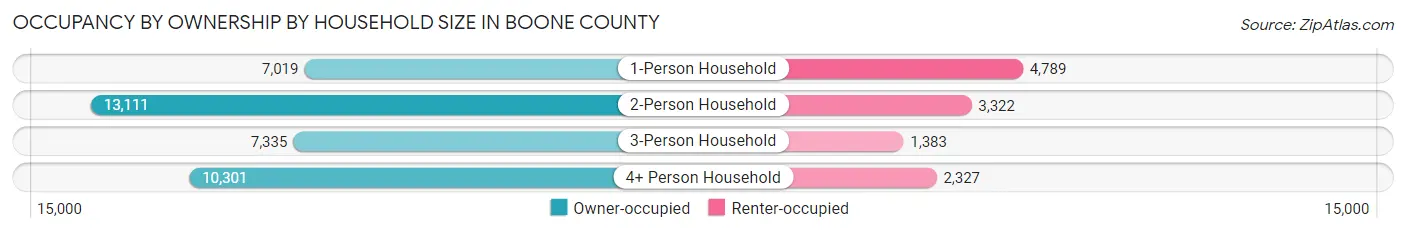
Occupancy by Ownership by Household Size in Boone County
| Household Size | Owner-occupied | Renter-occupied |
| 1-Person Household | 7,019 (59.4%) | 4,789 (40.6%) |
| 2-Person Household | 13,111 (79.8%) | 3,322 (20.2%) |
| 3-Person Household | 7,335 (84.1%) | 1,383 (15.9%) |
| 4+ Person Household | 10,301 (81.6%) | 2,327 (18.4%) |
| Total Housing Units | 37,766 (76.2%) | 11,821 (23.8%) |
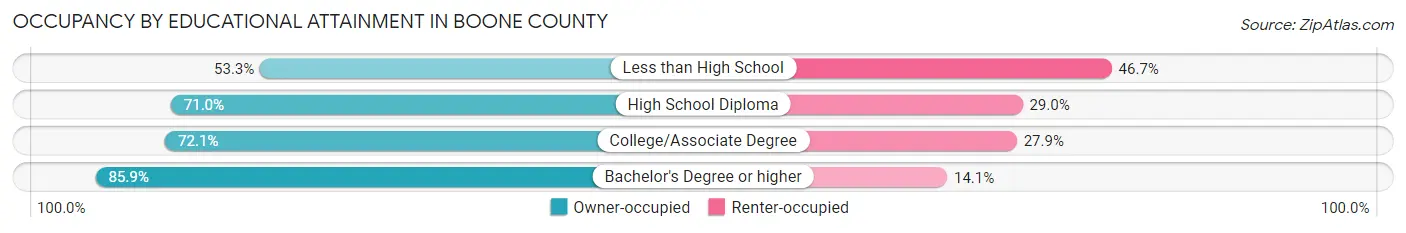
Occupancy by Educational Attainment in Boone County
| Household Size | Owner-occupied | Renter-occupied |
| Less than High School | 1,354 (53.3%) | 1,186 (46.7%) |
| High School Diploma | 8,898 (71.0%) | 3,636 (29.0%) |
| College/Associate Degree | 11,210 (72.1%) | 4,332 (27.9%) |
| Bachelor's Degree or higher | 16,304 (85.9%) | 2,667 (14.1%) |
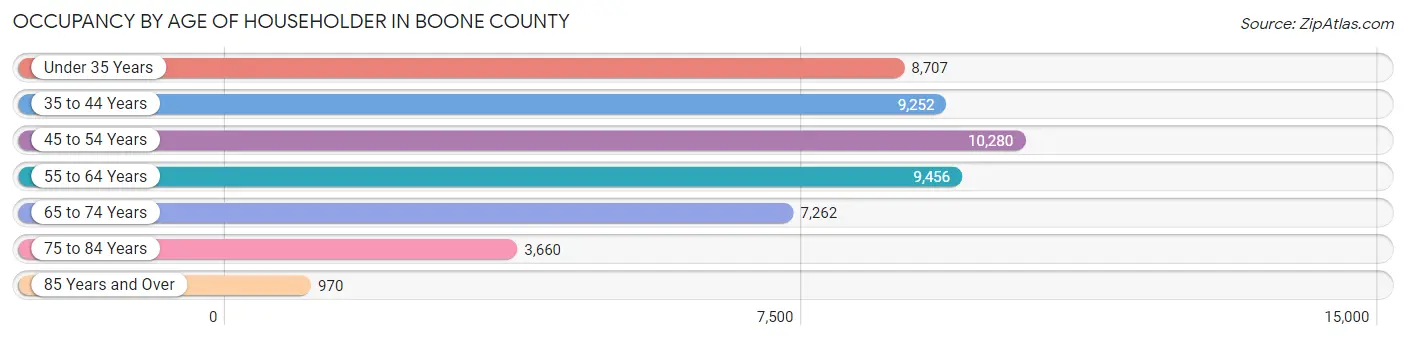
Occupancy by Age of Householder in Boone County
| Age Bracket | # Households | % Households |
| Under 35 Years | 8,707 | 17.6% |
| 35 to 44 Years | 9,252 | 18.7% |
| 45 to 54 Years | 10,280 | 20.7% |
| 55 to 64 Years | 9,456 | 19.1% |
| 65 to 74 Years | 7,262 | 14.6% |
| 75 to 84 Years | 3,660 | 7.4% |
| 85 Years and Over | 970 | 2.0% |
| Total | 49,587 | 100.0% |
Housing Finances in Boone County
Median Income by Occupancy in Boone County
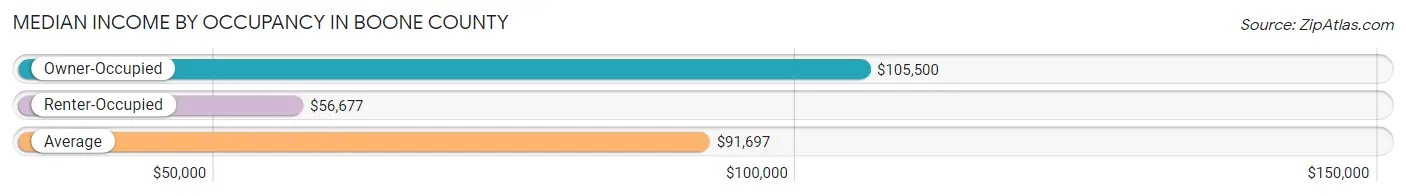
| Occupancy Type | # Households | Median Income |
| Owner-Occupied | 37,766 (76.2%) | $105,500 |
| Renter-Occupied | 11,821 (23.8%) | $56,677 |
| Average | 49,587 (100.0%) | $91,697 |
Occupancy by Householder Income Bracket in Boone County
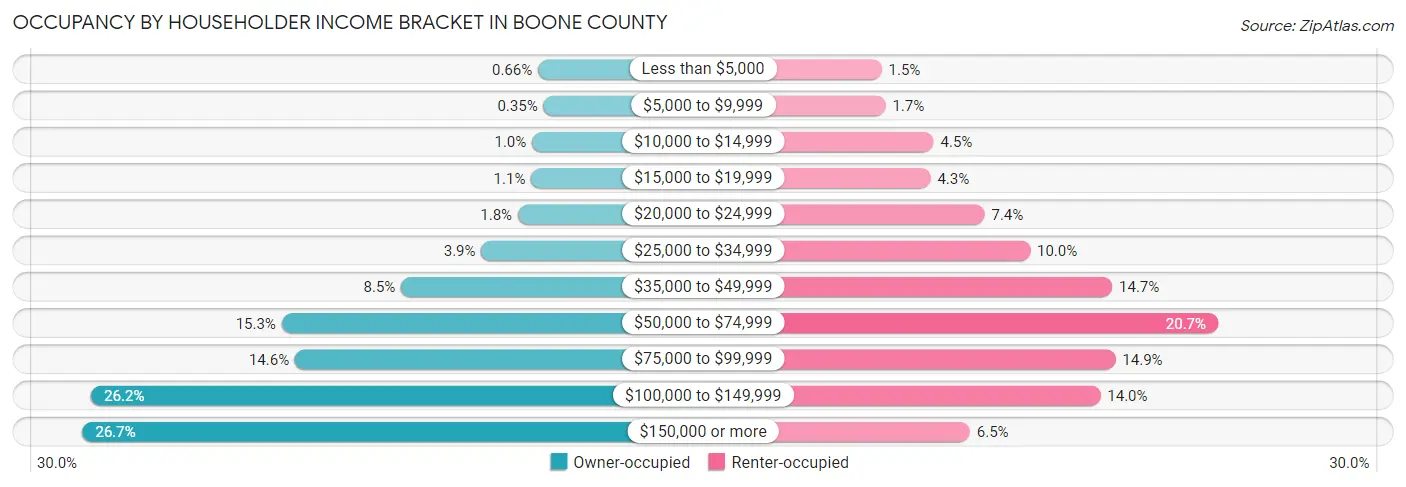
| Income Bracket | Owner-occupied | Renter-occupied |
| Less than $5,000 | 248 (0.7%) | 176 (1.5%) |
| $5,000 to $9,999 | 133 (0.4%) | 202 (1.7%) |
| $10,000 to $14,999 | 376 (1.0%) | 527 (4.5%) |
| $15,000 to $19,999 | 397 (1.1%) | 506 (4.3%) |
| $20,000 to $24,999 | 683 (1.8%) | 871 (7.4%) |
| $25,000 to $34,999 | 1,474 (3.9%) | 1,178 (10.0%) |
| $35,000 to $49,999 | 3,203 (8.5%) | 1,733 (14.7%) |
| $50,000 to $74,999 | 5,781 (15.3%) | 2,447 (20.7%) |
| $75,000 to $99,999 | 5,496 (14.5%) | 1,755 (14.8%) |
| $100,000 to $149,999 | 9,893 (26.2%) | 1,654 (14.0%) |
| $150,000 or more | 10,082 (26.7%) | 772 (6.5%) |
| Total | 37,766 (100.0%) | 11,821 (100.0%) |
Monthly Housing Cost Tiers in Boone County
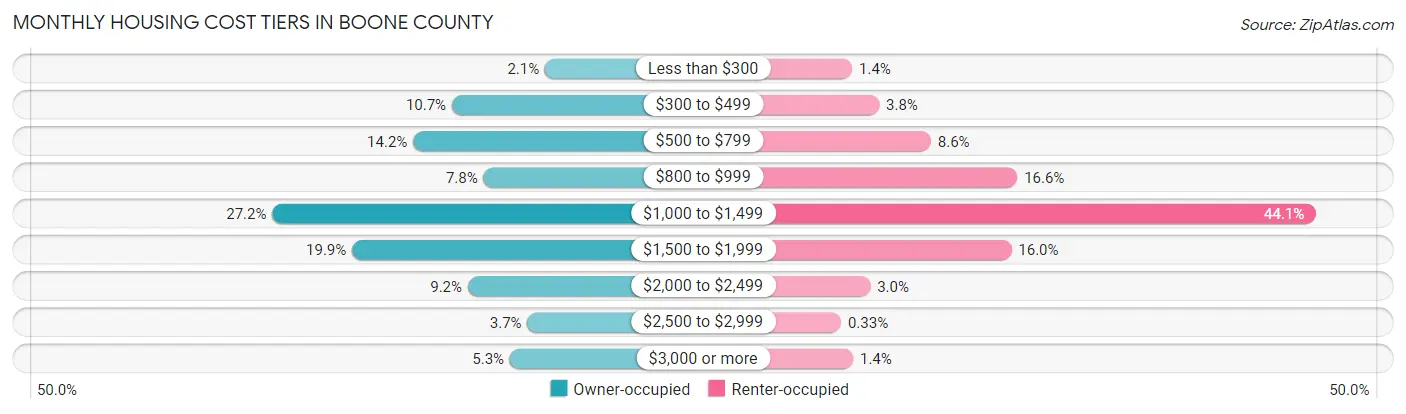
| Monthly Cost | Owner-occupied | Renter-occupied |
| Less than $300 | 790 (2.1%) | 159 (1.3%) |
| $300 to $499 | 4,026 (10.7%) | 454 (3.8%) |
| $500 to $799 | 5,373 (14.2%) | 1,017 (8.6%) |
| $800 to $999 | 2,926 (7.7%) | 1,956 (16.6%) |
| $1,000 to $1,499 | 10,272 (27.2%) | 5,210 (44.1%) |
| $1,500 to $1,999 | 7,496 (19.9%) | 1,892 (16.0%) |
| $2,000 to $2,499 | 3,470 (9.2%) | 357 (3.0%) |
| $2,500 to $2,999 | 1,403 (3.7%) | 39 (0.3%) |
| $3,000 or more | 2,010 (5.3%) | 170 (1.4%) |
| Total | 37,766 (100.0%) | 11,821 (100.0%) |
Physical Housing Characteristics in Boone County
Housing Structures in Boone County
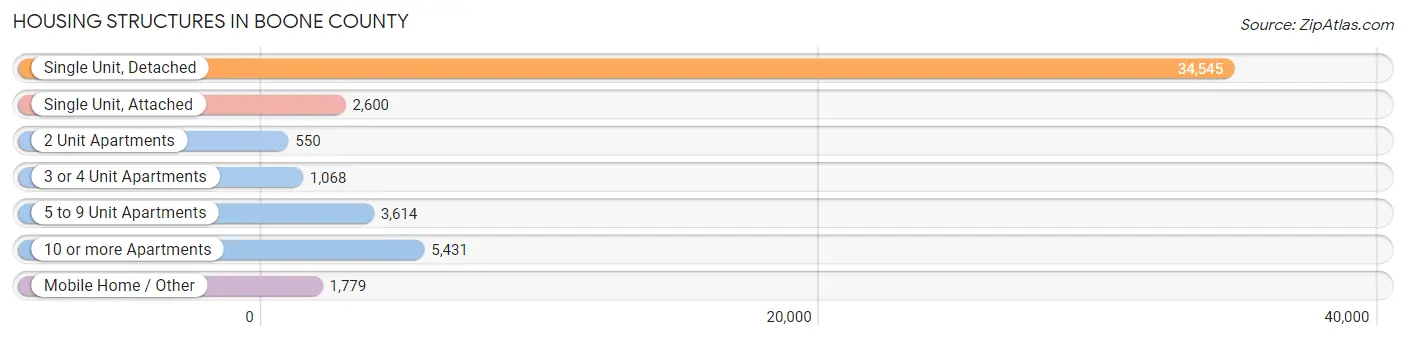
| Structure Type | # Housing Units | % Housing Units |
| Single Unit, Detached | 34,545 | 69.7% |
| Single Unit, Attached | 2,600 | 5.2% |
| 2 Unit Apartments | 550 | 1.1% |
| 3 or 4 Unit Apartments | 1,068 | 2.1% |
| 5 to 9 Unit Apartments | 3,614 | 7.3% |
| 10 or more Apartments | 5,431 | 11.0% |
| Mobile Home / Other | 1,779 | 3.6% |
| Total | 49,587 | 100.0% |
Housing Structures by Occupancy in Boone County
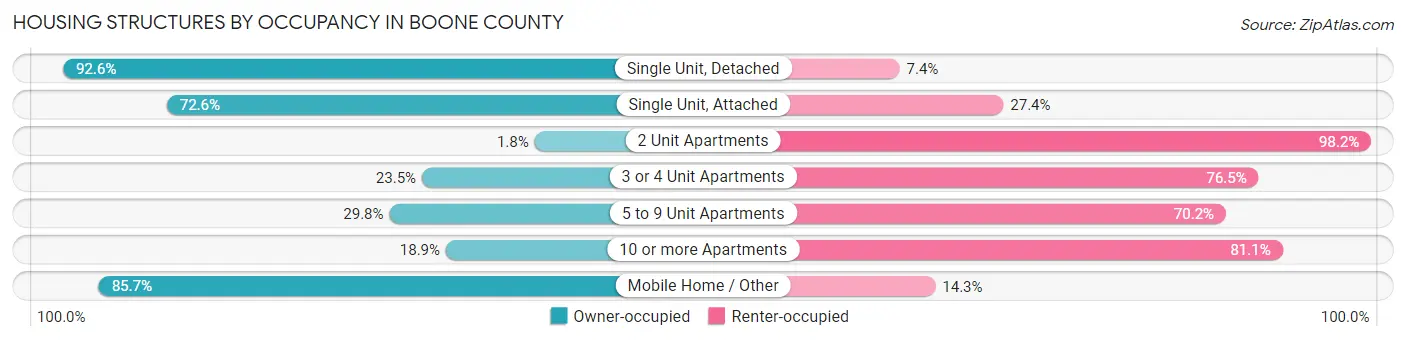
| Structure Type | Owner-occupied | Renter-occupied |
| Single Unit, Detached | 31,990 (92.6%) | 2,555 (7.4%) |
| Single Unit, Attached | 1,888 (72.6%) | 712 (27.4%) |
| 2 Unit Apartments | 10 (1.8%) | 540 (98.2%) |
| 3 or 4 Unit Apartments | 251 (23.5%) | 817 (76.5%) |
| 5 to 9 Unit Apartments | 1,076 (29.8%) | 2,538 (70.2%) |
| 10 or more Apartments | 1,026 (18.9%) | 4,405 (81.1%) |
| Mobile Home / Other | 1,525 (85.7%) | 254 (14.3%) |
| Total | 37,766 (76.2%) | 11,821 (23.8%) |
Housing Structures by Number of Rooms in Boone County
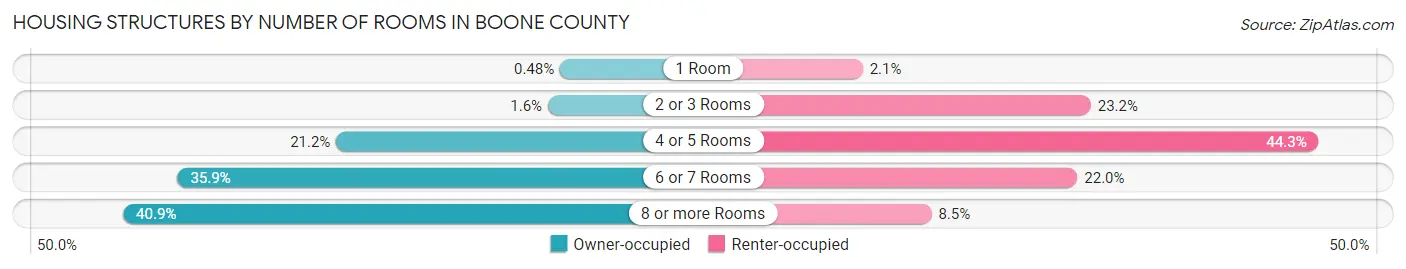
| Number of Rooms | Owner-occupied | Renter-occupied |
| 1 Room | 183 (0.5%) | 250 (2.1%) |
| 2 or 3 Rooms | 606 (1.6%) | 2,742 (23.2%) |
| 4 or 5 Rooms | 7,999 (21.2%) | 5,232 (44.3%) |
| 6 or 7 Rooms | 13,541 (35.9%) | 2,596 (22.0%) |
| 8 or more Rooms | 15,437 (40.9%) | 1,001 (8.5%) |
| Total | 37,766 (100.0%) | 11,821 (100.0%) |
Housing Structure by Heating Type in Boone County
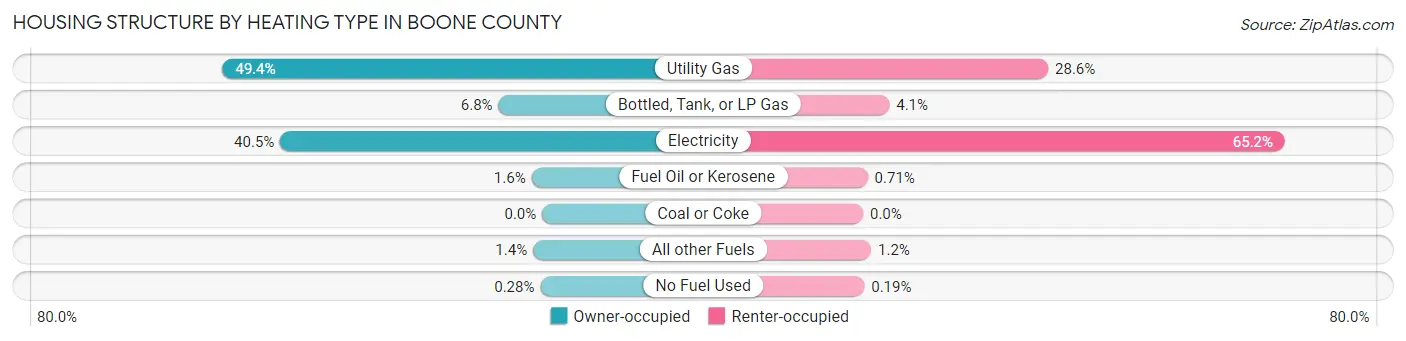
| Heating Type | Owner-occupied | Renter-occupied |
| Utility Gas | 18,667 (49.4%) | 3,382 (28.6%) |
| Bottled, Tank, or LP Gas | 2,549 (6.8%) | 480 (4.1%) |
| Electricity | 15,291 (40.5%) | 7,707 (65.2%) |
| Fuel Oil or Kerosene | 619 (1.6%) | 84 (0.7%) |
| Coal or Coke | 0 (0.0%) | 0 (0.0%) |
| All other Fuels | 533 (1.4%) | 146 (1.2%) |
| No Fuel Used | 107 (0.3%) | 22 (0.2%) |
| Total | 37,766 (100.0%) | 11,821 (100.0%) |
Household Vehicle Usage in Boone County
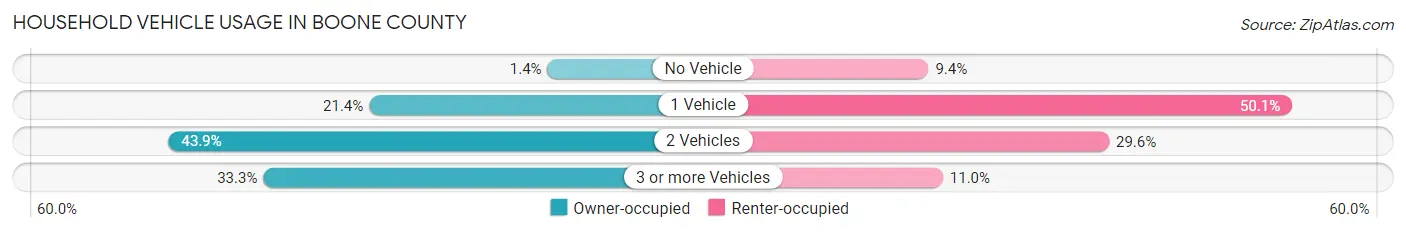
| Vehicles per Household | Owner-occupied | Renter-occupied |
| No Vehicle | 539 (1.4%) | 1,106 (9.4%) |
| 1 Vehicle | 8,086 (21.4%) | 5,920 (50.1%) |
| 2 Vehicles | 16,577 (43.9%) | 3,498 (29.6%) |
| 3 or more Vehicles | 12,564 (33.3%) | 1,297 (11.0%) |
| Total | 37,766 (100.0%) | 11,821 (100.0%) |
Real Estate & Mortgages in Boone County
Real Estate and Mortgage Overview in Boone County
| Characteristic | Without Mortgage | With Mortgage |
| Housing Units | 11,063 | 26,703 |
| Median Property Value | $210,900 | $244,400 |
| Median Household Income | $71,057 | $8,354 |
| Monthly Housing Costs | $546 | $2,010 |
| Real Estate Taxes | $1,829 | $652 |
Property Value by Mortgage Status in Boone County
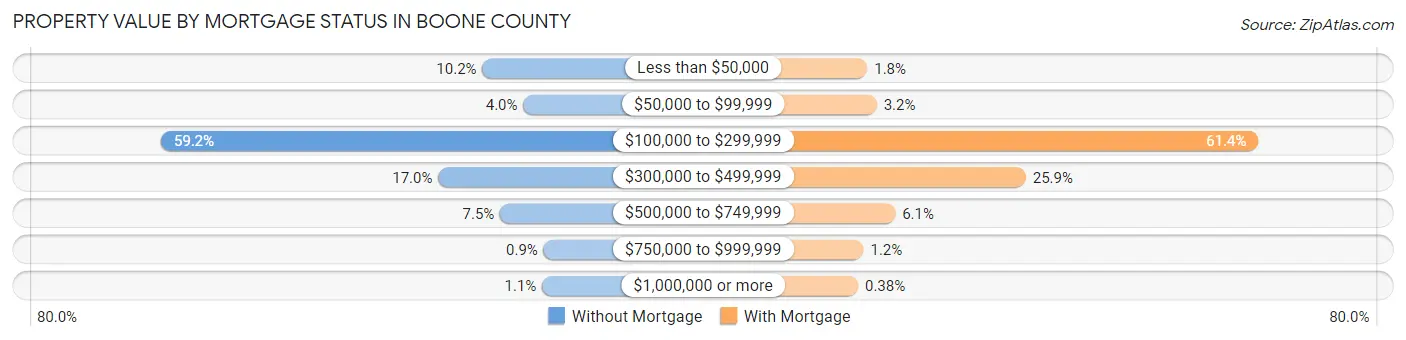
| Property Value | Without Mortgage | With Mortgage |
| Less than $50,000 | 1,133 (10.2%) | 478 (1.8%) |
| $50,000 to $99,999 | 443 (4.0%) | 863 (3.2%) |
| $100,000 to $299,999 | 6,553 (59.2%) | 16,390 (61.4%) |
| $300,000 to $499,999 | 1,876 (17.0%) | 6,928 (25.9%) |
| $500,000 to $749,999 | 833 (7.5%) | 1,616 (6.0%) |
| $750,000 to $999,999 | 100 (0.9%) | 327 (1.2%) |
| $1,000,000 or more | 125 (1.1%) | 101 (0.4%) |
| Total | 11,063 (100.0%) | 26,703 (100.0%) |
Household Income by Mortgage Status in Boone County
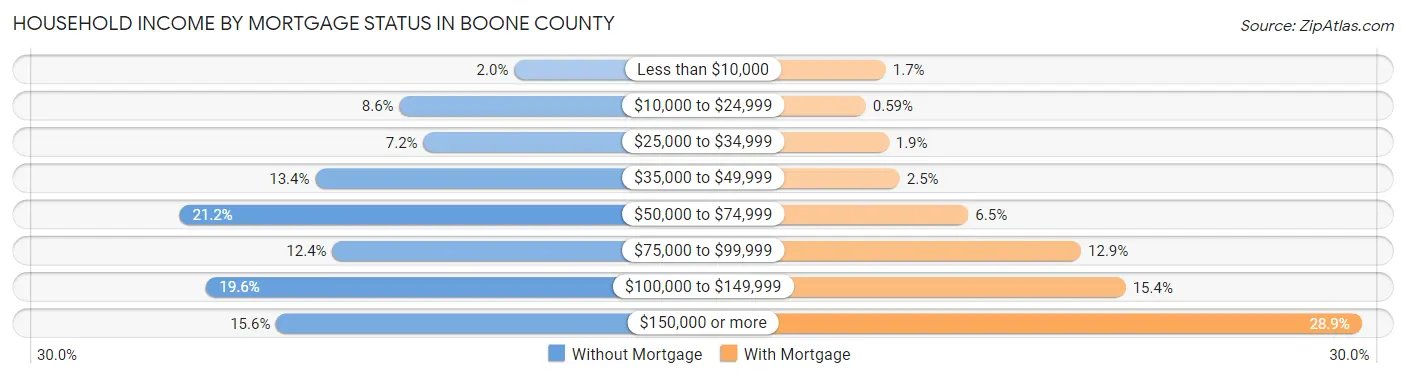
| Household Income | Without Mortgage | With Mortgage |
| Less than $10,000 | 224 (2.0%) | 463 (1.7%) |
| $10,000 to $24,999 | 949 (8.6%) | 157 (0.6%) |
| $25,000 to $34,999 | 798 (7.2%) | 507 (1.9%) |
| $35,000 to $49,999 | 1,481 (13.4%) | 676 (2.5%) |
| $50,000 to $74,999 | 2,340 (21.1%) | 1,722 (6.5%) |
| $75,000 to $99,999 | 1,373 (12.4%) | 3,441 (12.9%) |
| $100,000 to $149,999 | 2,170 (19.6%) | 4,123 (15.4%) |
| $150,000 or more | 1,728 (15.6%) | 7,723 (28.9%) |
| Total | 11,063 (100.0%) | 26,703 (100.0%) |
Property Value to Household Income Ratio in Boone County
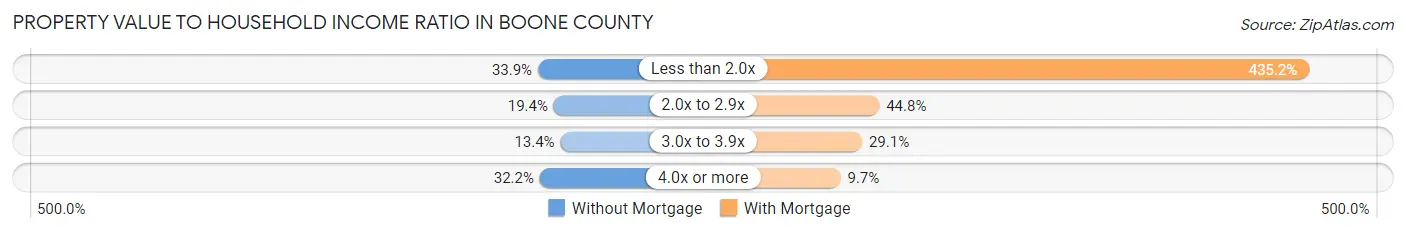
| Value-to-Income Ratio | Without Mortgage | With Mortgage |
| Less than 2.0x | 3,746 (33.9%) | 116,208 (435.2%) |
| 2.0x to 2.9x | 2,149 (19.4%) | 11,956 (44.8%) |
| 3.0x to 3.9x | 1,487 (13.4%) | 7,777 (29.1%) |
| 4.0x or more | 3,562 (32.2%) | 2,578 (9.7%) |
| Total | 11,063 (100.0%) | 26,703 (100.0%) |
Real Estate Taxes by Mortgage Status in Boone County
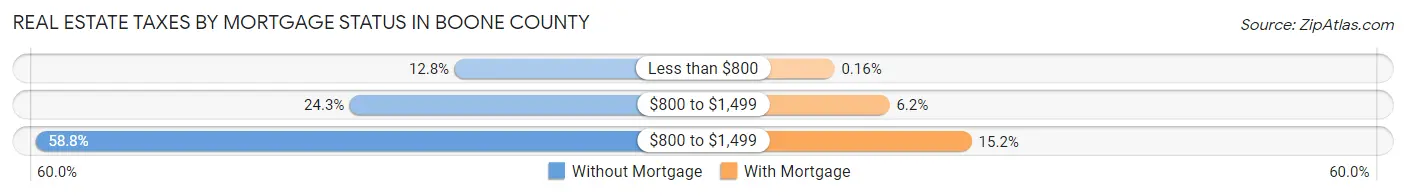
| Property Taxes | Without Mortgage | With Mortgage |
| Less than $800 | 1,420 (12.8%) | 42 (0.2%) |
| $800 to $1,499 | 2,691 (24.3%) | 1,650 (6.2%) |
| $800 to $1,499 | 6,507 (58.8%) | 4,055 (15.2%) |
| Total | 11,063 (100.0%) | 26,703 (100.0%) |
Health & Disability in Boone County
Health Insurance Coverage by Age in Boone County
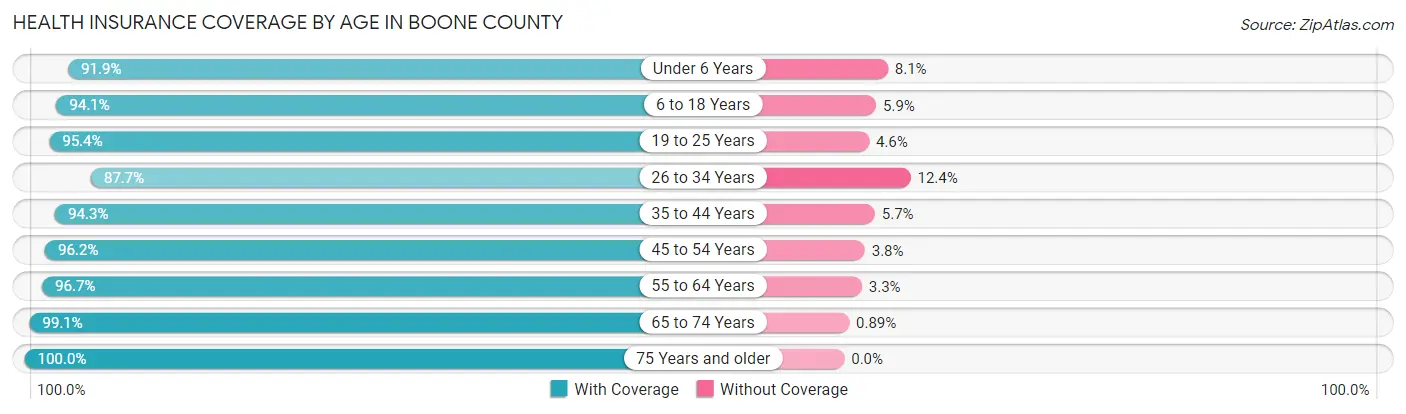
| Age Bracket | With Coverage | Without Coverage |
| Under 6 Years | 9,737 (91.9%) | 861 (8.1%) |
| 6 to 18 Years | 24,373 (94.1%) | 1,536 (5.9%) |
| 19 to 25 Years | 10,337 (95.4%) | 500 (4.6%) |
| 26 to 34 Years | 13,366 (87.6%) | 1,883 (12.3%) |
| 35 to 44 Years | 17,488 (94.3%) | 1,056 (5.7%) |
| 45 to 54 Years | 17,484 (96.2%) | 694 (3.8%) |
| 55 to 64 Years | 16,355 (96.7%) | 555 (3.3%) |
| 65 to 74 Years | 11,754 (99.1%) | 106 (0.9%) |
| 75 Years and older | 7,191 (100.0%) | 0 (0.0%) |
| Total | 128,085 (94.7%) | 7,191 (5.3%) |
Health Insurance Coverage by Citizenship Status in Boone County
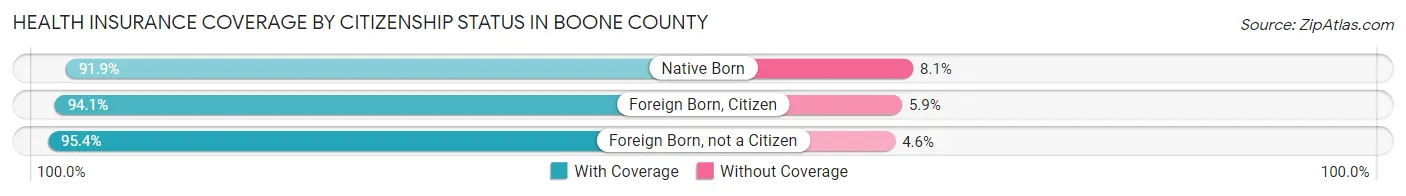
| Citizenship Status | With Coverage | Without Coverage |
| Native Born | 9,737 (91.9%) | 861 (8.1%) |
| Foreign Born, Citizen | 24,373 (94.1%) | 1,536 (5.9%) |
| Foreign Born, not a Citizen | 10,337 (95.4%) | 500 (4.6%) |
Health Insurance Coverage by Household Income in Boone County
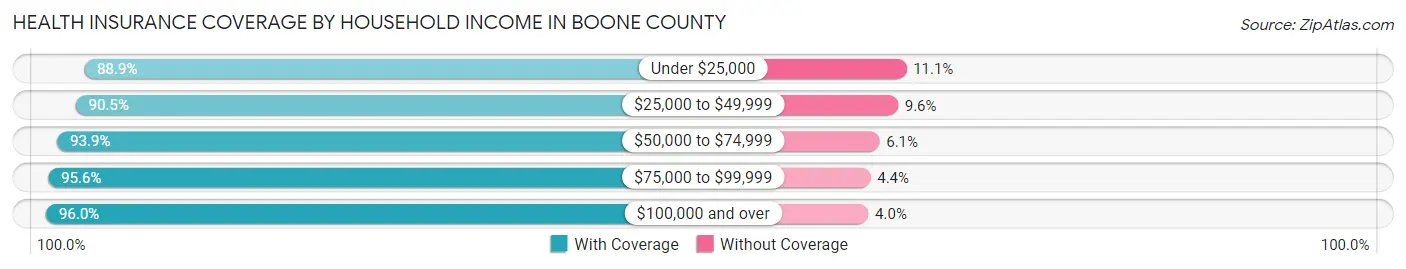
| Household Income | With Coverage | Without Coverage |
| Under $25,000 | 6,123 (88.9%) | 767 (11.1%) |
| $25,000 to $49,999 | 13,350 (90.4%) | 1,410 (9.6%) |
| $50,000 to $74,999 | 18,055 (93.9%) | 1,170 (6.1%) |
| $75,000 to $99,999 | 19,106 (95.6%) | 879 (4.4%) |
| $100,000 and over | 71,180 (96.0%) | 2,964 (4.0%) |
Public vs Private Health Insurance Coverage by Age in Boone County
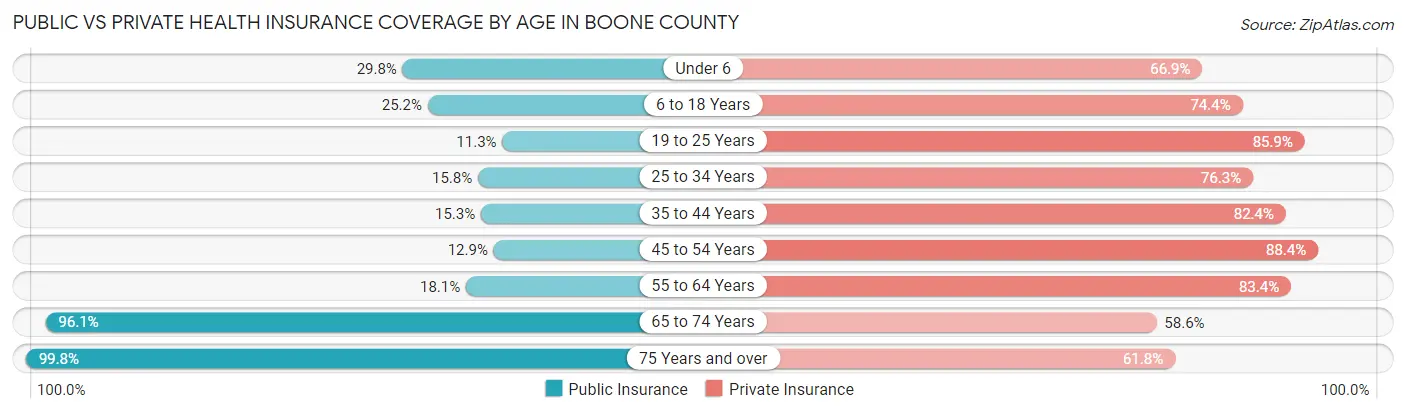
| Age Bracket | Public Insurance | Private Insurance |
| Under 6 | 3,160 (29.8%) | 7,092 (66.9%) |
| 6 to 18 Years | 6,518 (25.2%) | 19,268 (74.4%) |
| 19 to 25 Years | 1,226 (11.3%) | 9,311 (85.9%) |
| 25 to 34 Years | 2,416 (15.8%) | 11,639 (76.3%) |
| 35 to 44 Years | 2,831 (15.3%) | 15,280 (82.4%) |
| 45 to 54 Years | 2,348 (12.9%) | 16,067 (88.4%) |
| 55 to 64 Years | 3,054 (18.1%) | 14,098 (83.4%) |
| 65 to 74 Years | 11,401 (96.1%) | 6,947 (58.6%) |
| 75 Years and over | 7,176 (99.8%) | 4,447 (61.8%) |
| Total | 40,130 (29.7%) | 104,149 (77.0%) |
Disability Status by Sex by Age in Boone County
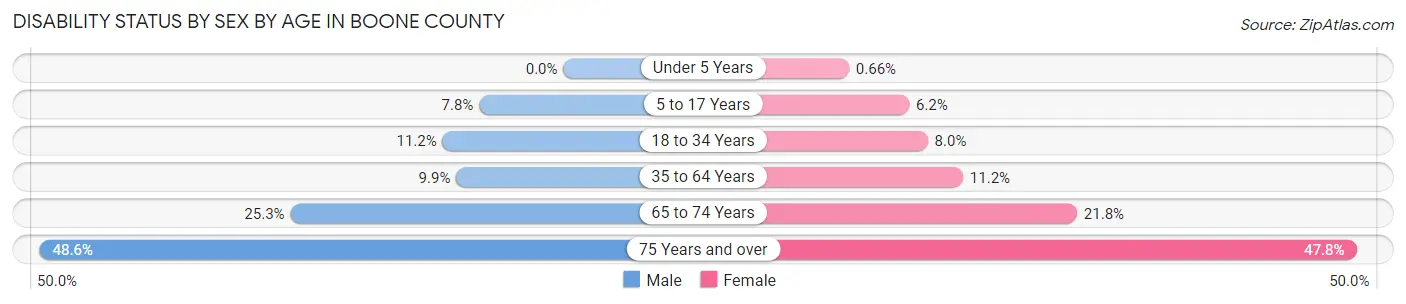
| Age Bracket | Male | Female |
| Under 5 Years | 0 (0.0%) | 27 (0.7%) |
| 5 to 17 Years | 1,038 (7.8%) | 814 (6.2%) |
| 18 to 34 Years | 1,583 (11.2%) | 1,074 (8.0%) |
| 35 to 64 Years | 2,664 (9.9%) | 3,015 (11.2%) |
| 65 to 74 Years | 1,428 (25.3%) | 1,358 (21.8%) |
| 75 Years and over | 1,440 (48.6%) | 2,019 (47.7%) |
Disability Class by Sex by Age in Boone County
Disability Class: Hearing Difficulty
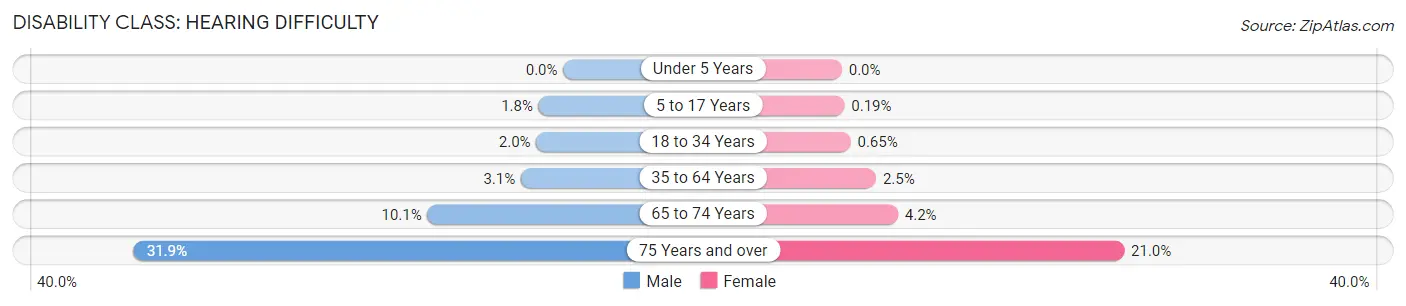
| Age Bracket | Male | Female |
| Under 5 Years | 0 (0.0%) | 0 (0.0%) |
| 5 to 17 Years | 242 (1.8%) | 25 (0.2%) |
| 18 to 34 Years | 282 (2.0%) | 88 (0.6%) |
| 35 to 64 Years | 841 (3.1%) | 681 (2.5%) |
| 65 to 74 Years | 568 (10.1%) | 259 (4.2%) |
| 75 Years and over | 945 (31.9%) | 886 (21.0%) |
Disability Class: Vision Difficulty
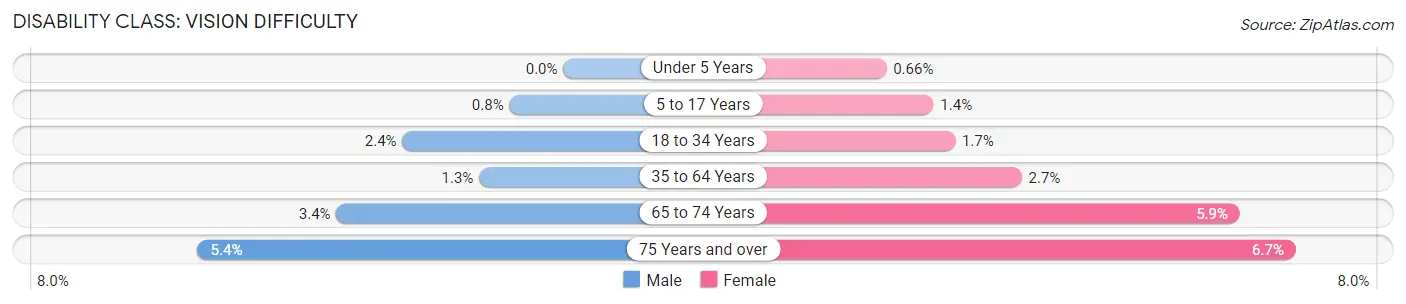
| Age Bracket | Male | Female |
| Under 5 Years | 0 (0.0%) | 27 (0.7%) |
| 5 to 17 Years | 106 (0.8%) | 177 (1.4%) |
| 18 to 34 Years | 338 (2.4%) | 227 (1.7%) |
| 35 to 64 Years | 335 (1.3%) | 715 (2.7%) |
| 65 to 74 Years | 190 (3.4%) | 368 (5.9%) |
| 75 Years and over | 161 (5.4%) | 285 (6.7%) |
Disability Class: Cognitive Difficulty
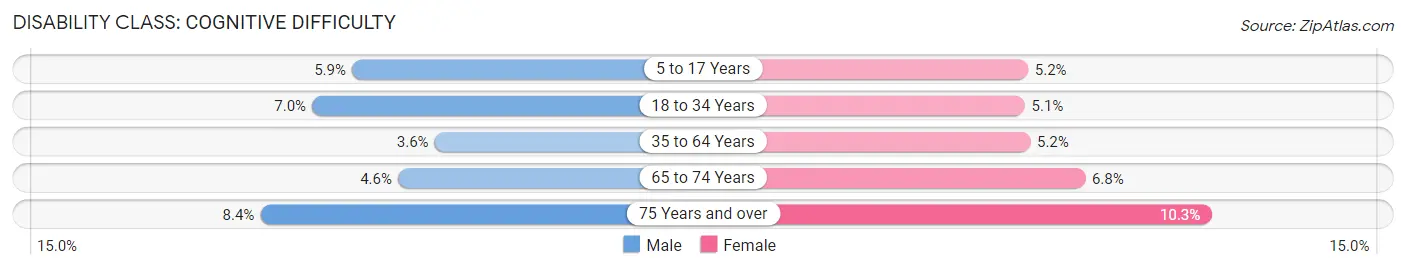
| Age Bracket | Male | Female |
| 5 to 17 Years | 783 (5.9%) | 676 (5.2%) |
| 18 to 34 Years | 988 (7.0%) | 686 (5.1%) |
| 35 to 64 Years | 961 (3.6%) | 1,405 (5.2%) |
| 65 to 74 Years | 260 (4.6%) | 421 (6.8%) |
| 75 Years and over | 250 (8.4%) | 436 (10.3%) |
Disability Class: Ambulatory Difficulty
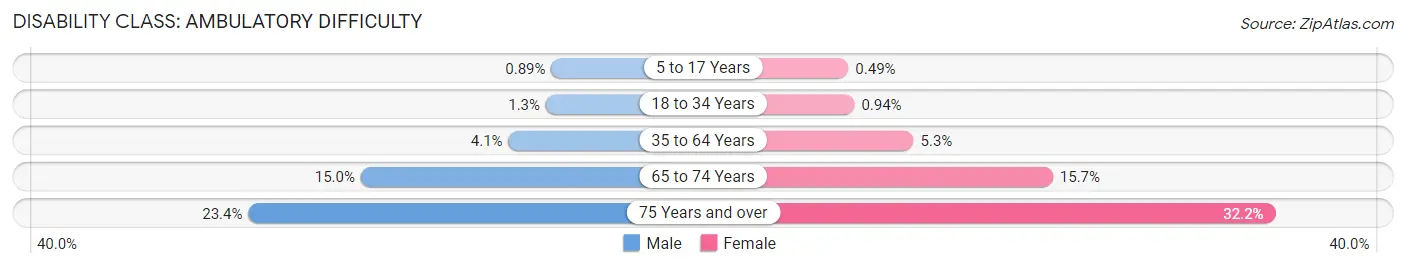
| Age Bracket | Male | Female |
| 5 to 17 Years | 118 (0.9%) | 64 (0.5%) |
| 18 to 34 Years | 183 (1.3%) | 126 (0.9%) |
| 35 to 64 Years | 1,093 (4.1%) | 1,431 (5.3%) |
| 65 to 74 Years | 848 (15.0%) | 975 (15.7%) |
| 75 Years and over | 693 (23.4%) | 1,361 (32.2%) |
Disability Class: Self-Care Difficulty
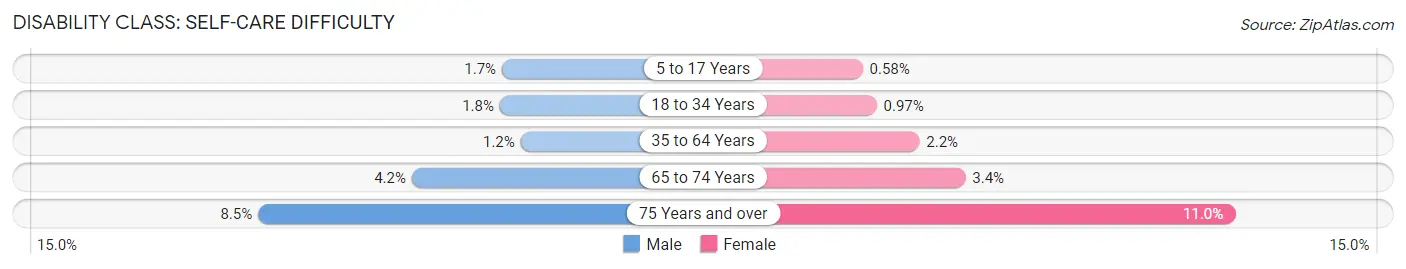
| Age Bracket | Male | Female |
| 5 to 17 Years | 227 (1.7%) | 76 (0.6%) |
| 18 to 34 Years | 250 (1.8%) | 131 (1.0%) |
| 35 to 64 Years | 318 (1.2%) | 579 (2.2%) |
| 65 to 74 Years | 238 (4.2%) | 214 (3.4%) |
| 75 Years and over | 252 (8.5%) | 463 (11.0%) |
Technology Access in Boone County
Computing Device Access in Boone County
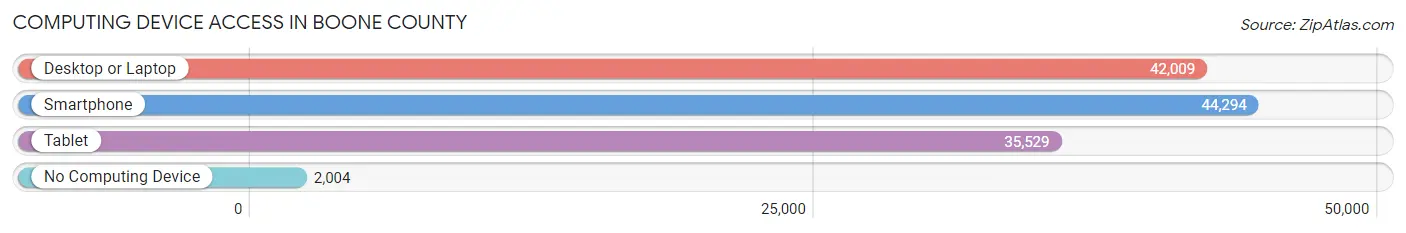
| Device Type | # Households | % Households |
| Desktop or Laptop | 42,009 | 84.7% |
| Smartphone | 44,294 | 89.3% |
| Tablet | 35,529 | 71.7% |
| No Computing Device | 2,004 | 4.0% |
| Total | 49,587 | 100.0% |
Internet Access in Boone County
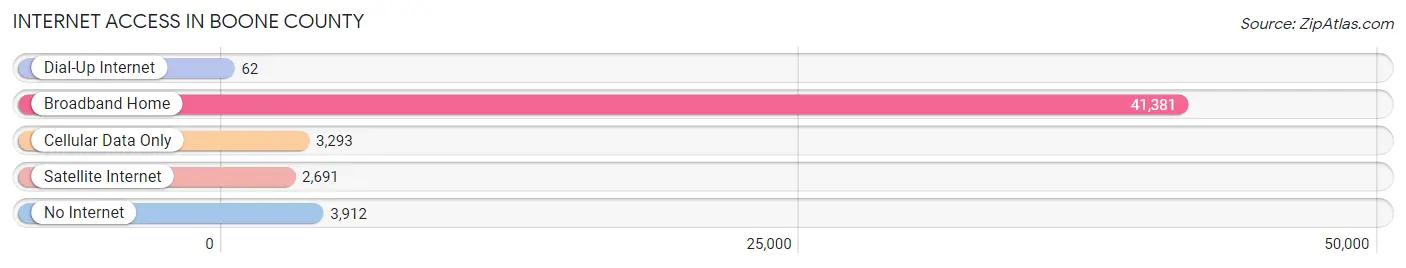
| Internet Type | # Households | % Households |
| Dial-Up Internet | 62 | 0.1% |
| Broadband Home | 41,381 | 83.5% |
| Cellular Data Only | 3,293 | 6.6% |
| Satellite Internet | 2,691 | 5.4% |
| No Internet | 3,912 | 7.9% |
| Total | 49,587 | 100.0% |
Boone County Summary
Boone County, Kentucky is located in the northern part of the state, just south of Cincinnati, Ohio. It is bordered by Kenton County to the north, Campbell County to the east, Grant County to the south, and Hamilton County, Ohio to the west. The county seat is Burlington, and the county was named after frontiersman Daniel Boone.
Geography
Boone County is located in the Bluegrass region of Kentucky, and is part of the Cincinnati metropolitan area. The county is mostly flat, with some rolling hills in the northern part. The county is drained by the Ohio River and its tributaries, including the Licking River, the Little Miami River, and the Great Miami River. The county is home to several state parks, including Big Bone Lick State Park, General Butler State Park, and Williamstown Lake State Park.
Demographics
As of the 2010 census, Boone County had a population of 118,811. The racial makeup of the county was 90.2% White, 5.3% Black or African American, 0.3% Native American, 1.7% Asian, 0.1% Pacific Islander, 0.9% from other races, and 1.5% from two or more races. Hispanic or Latino of any race were 2.7% of the population.
The median income for a household in the county was $60,945, and the median income for a family was $71,945. The per capita income for the county was $27,945. About 4.2% of families and 5.7% of the population were below the poverty line, including 7.2% of those under age 18 and 5.2% of those age 65 or over.
Economy
Boone County is home to several major employers, including Amazon, DHL, and Toyota. The county is also home to several smaller businesses, including manufacturing, retail, and service industries. The county is also home to several educational institutions, including Northern Kentucky University, Thomas More College, and Gateway Community and Technical College.
Boone County is home to several major transportation routes, including Interstate 75, Interstate 71, and the Cincinnati/Northern Kentucky International Airport. The county is also home to several major railroads, including CSX, Norfolk Southern, and the Cincinnati, Hamilton, and Dayton Railroad.
Boone County is home to several major tourist attractions, including the Cincinnati Zoo and Botanical Garden, the Newport Aquarium, and the Cincinnati Museum Center. The county is also home to several major sports teams, including the Cincinnati Reds, the Cincinnati Bengals, and the Cincinnati Cyclones.
Conclusion
Boone County, Kentucky is a vibrant and diverse county located in the northern part of the state. The county is home to several major employers, educational institutions, and tourist attractions, and is served by several major transportation routes. The county has a diverse population, with a median income of $60,945 and a poverty rate of 4.2%. Boone County is an important part of the Cincinnati metropolitan area, and is an important contributor to the state's economy.
Common Questions
What is the Total Population of Boone County?
Total Population of Boone County is 136,150.
What is the Total Male Population of Boone County?
Total Male Population of Boone County is 67,954.
What is the Total Female Population of Boone County?
Total Female Population of Boone County is 68,196.
What is the Ratio of Males per 100 Females in Boone County?
There are 99.65 Males per 100 Females in Boone County.
What is the Ratio of Females per 100 Males in Boone County?
There are 100.36 Females per 100 Males in Boone County.
What is the Median Population Age in Boone County?
Median Population Age in Boone County is 38.0 Years.
What is the Average Family Size in Boone County
Average Family Size in Boone County is 3.2 People.
What is the Average Household Size in Boone County
Average Household Size in Boone County is 2.7 People.
What is Per Capita Income in Boone County?
Per Capita income in Boone County is $41,281.
What is the Median Family Income in Boone County?
Median Family Income in Boone County is $109,060.
What is the Median Household income in Boone County?
Median Household Income in Boone County is $91,697.
What is Income or Wage Gap in Boone County?
Income or Wage Gap in Boone County is 31.5%.
Women in Boone County earn 68.5 cents for every dollar earned by a man.
What is Family Income Deficit in Boone County?
Family Income Deficit in Boone County is $10,514.
Families that are below poverty line in Boone County earn $10,514 less on average than the poverty threshold level.
What is Inequality or Gini Index in Boone County?
Inequality or Gini Index in Boone County is 0.39.
How Large is the Labor Force in Boone County?
There are 72,627 People in the Labor Forcein in Boone County.
What is the Percentage of People in the Labor Force in Boone County?
69.2% of People are in the Labor Force in Boone County.
What is the Unemployment Rate in Boone County?
Unemployment Rate in Boone County is 2.8%.