Barren County, KY
Barren County Map
Barren County Overview
44,511
TOTAL POPULATION
21,654
MALE POPULATION
22,857
FEMALE POPULATION
94.74
MALES / 100 FEMALES
105.56
FEMALES / 100 MALES
40.2
MEDIAN AGE
3.0
AVG FAMILY SIZE
2.5
AVG HOUSEHOLD SIZE
$27,732
PER CAPITA INCOME
$58,262
AVG FAMILY INCOME
$48,141
AVG HOUSEHOLD INCOME
23.6%
WAGE / INCOME GAP [ % ]
76.4¢/ $1
WAGE / INCOME GAP [ $ ]
$11,326
FAMILY INCOME DEFICIT
0.47
INEQUALITY / GINI INDEX
19,679
LABOR FORCE [ PEOPLE ]
55.5%
PERCENT IN LABOR FORCE
4.9%
UNEMPLOYMENT RATE
Barren County Area Codes
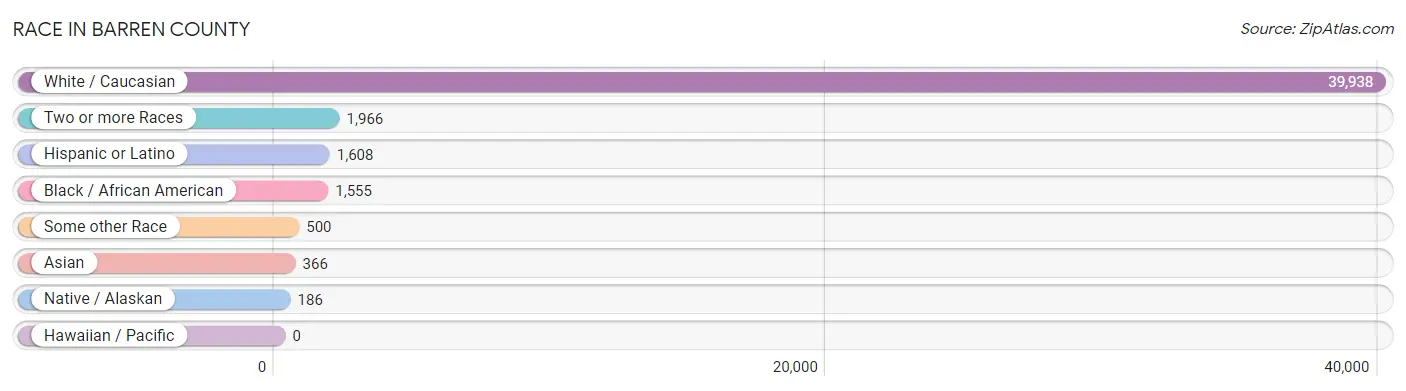
Race in Barren County
The most populous races in Barren County are White / Caucasian (39,938 | 89.7%), Two or more Races (1,966 | 4.4%), and Hispanic or Latino (1,608 | 3.6%).
| Race | # Population | % Population |
| Asian | 366 | 0.8% |
| Black / African American | 1,555 | 3.5% |
| Hawaiian / Pacific | 0 | 0.0% |
| Hispanic or Latino | 1,608 | 3.6% |
| Native / Alaskan | 186 | 0.4% |
| White / Caucasian | 39,938 | 89.7% |
| Two or more Races | 1,966 | 4.4% |
| Some other Race | 500 | 1.1% |
| Total | 44,511 | 100.0% |
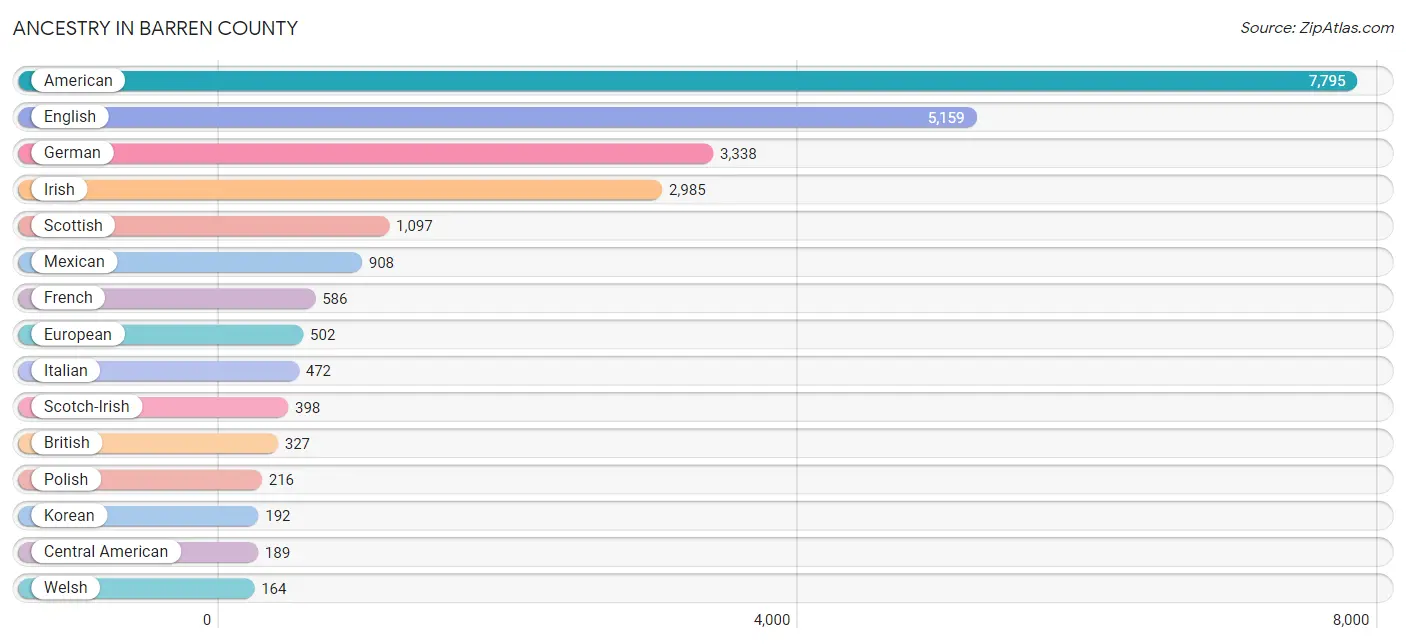
Ancestry in Barren County
The most populous ancestries reported in Barren County are American (7,795 | 17.5%), English (5,159 | 11.6%), German (3,338 | 7.5%), Irish (2,985 | 6.7%), and Scottish (1,097 | 2.5%), together accounting for 45.8% of all Barren County residents.
| Ancestry | # Population | % Population |
| African | 19 | 0.0% |
| American | 7,795 | 17.5% |
| Apache | 7 | 0.0% |
| Arab | 9 | 0.0% |
| Austrian | 15 | 0.0% |
| Bhutanese | 26 | 0.1% |
| Blackfeet | 8 | 0.0% |
| Brazilian | 108 | 0.2% |
| British | 327 | 0.7% |
| Burmese | 94 | 0.2% |
| Canadian | 47 | 0.1% |
| Central American | 189 | 0.4% |
| Central American Indian | 137 | 0.3% |
| Cherokee | 145 | 0.3% |
| Chilean | 40 | 0.1% |
| Chippewa | 13 | 0.0% |
| Colombian | 9 | 0.0% |
| Costa Rican | 23 | 0.1% |
| Creek | 29 | 0.1% |
| Cuban | 141 | 0.3% |
| Czech | 9 | 0.0% |
| Czechoslovakian | 16 | 0.0% |
| Danish | 138 | 0.3% |
| Dominican | 37 | 0.1% |
| Dutch | 112 | 0.3% |
| Eastern European | 118 | 0.3% |
| English | 5,159 | 11.6% |
| European | 502 | 1.1% |
| Finnish | 35 | 0.1% |
| French | 586 | 1.3% |
| French Canadian | 56 | 0.1% |
| German | 3,338 | 7.5% |
| Greek | 30 | 0.1% |
| Guatemalan | 66 | 0.2% |
| Honduran | 100 | 0.2% |
| Indian (Asian) | 99 | 0.2% |
| Irish | 2,985 | 6.7% |
| Iroquois | 46 | 0.1% |
| Italian | 472 | 1.1% |
| Korean | 192 | 0.4% |
| Latvian | 6 | 0.0% |
| Lebanese | 9 | 0.0% |
| Lithuanian | 22 | 0.1% |
| Mexican | 908 | 2.0% |
| Native Hawaiian | 31 | 0.1% |
| Nigerian | 2 | 0.0% |
| Northern European | 18 | 0.0% |
| Norwegian | 14 | 0.0% |
| Pennsylvania German | 154 | 0.4% |
| Peruvian | 13 | 0.0% |
| Polish | 216 | 0.5% |
| Portuguese | 42 | 0.1% |
| Pueblo | 40 | 0.1% |
| Puerto Rican | 134 | 0.3% |
| Romanian | 15 | 0.0% |
| Russian | 80 | 0.2% |
| Samoan | 22 | 0.1% |
| Scandinavian | 13 | 0.0% |
| Scotch-Irish | 398 | 0.9% |
| Scottish | 1,097 | 2.5% |
| Slovak | 4 | 0.0% |
| South American | 62 | 0.1% |
| Spaniard | 137 | 0.3% |
| Subsaharan African | 21 | 0.1% |
| Swedish | 101 | 0.2% |
| Swiss | 123 | 0.3% |
| Thai | 25 | 0.1% |
| Ukrainian | 7 | 0.0% |
| Welsh | 164 | 0.4% |
| Yugoslavian | 101 | 0.2% | View All 70 Rows |
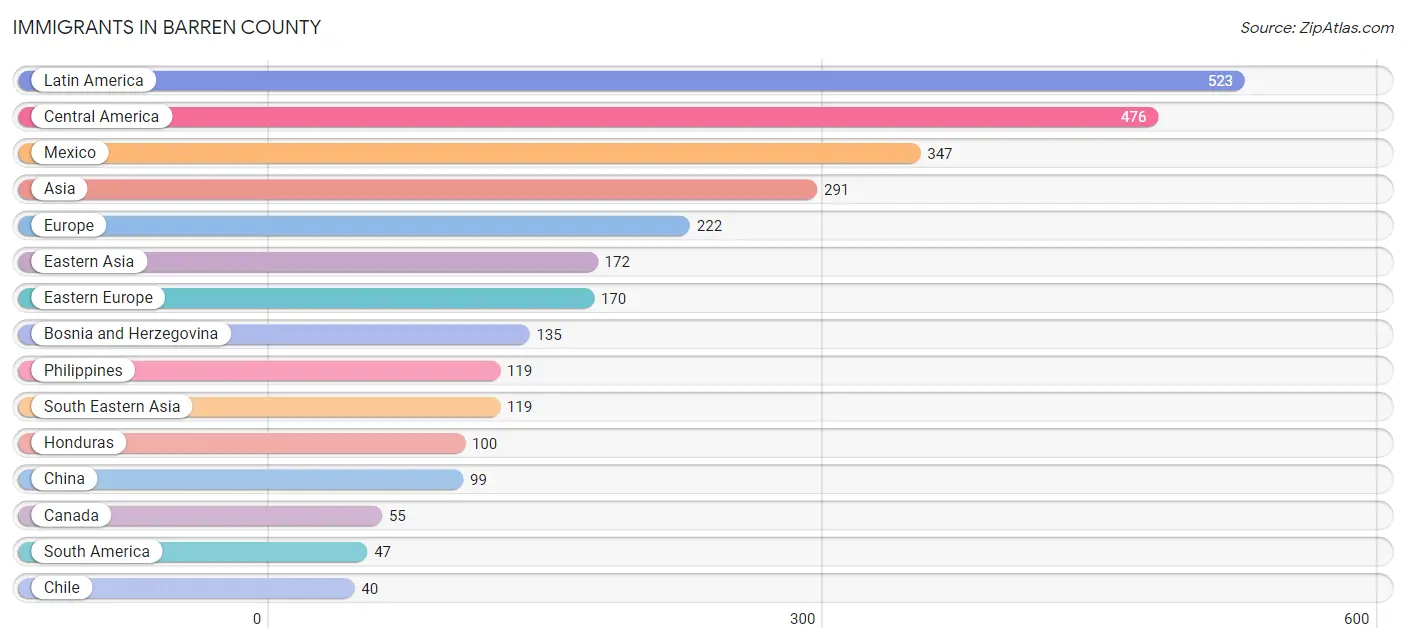
Immigrants in Barren County
The most numerous immigrant groups reported in Barren County came from Latin America (523 | 1.2%), Central America (476 | 1.1%), Mexico (347 | 0.8%), Asia (291 | 0.6%), and Europe (222 | 0.5%), together accounting for 4.2% of all Barren County residents.
| Immigration Origin | # Population | % Population |
| Africa | 27 | 0.1% |
| Asia | 291 | 0.6% |
| Bosnia and Herzegovina | 135 | 0.3% |
| Brazil | 1 | 0.0% |
| Canada | 55 | 0.1% |
| Central America | 476 | 1.1% |
| Chile | 40 | 0.1% |
| China | 99 | 0.2% |
| Colombia | 6 | 0.0% |
| Costa Rica | 9 | 0.0% |
| Eastern Asia | 172 | 0.4% |
| Eastern Europe | 170 | 0.4% |
| England | 25 | 0.1% |
| Europe | 222 | 0.5% |
| Germany | 21 | 0.1% |
| Guatemala | 20 | 0.0% |
| Honduras | 100 | 0.2% |
| Italy | 6 | 0.0% |
| Japan | 37 | 0.1% |
| Korea | 36 | 0.1% |
| Latin America | 523 | 1.2% |
| Latvia | 6 | 0.0% |
| Mexico | 347 | 0.8% |
| Nigeria | 2 | 0.0% |
| Northern Africa | 25 | 0.1% |
| Northern Europe | 25 | 0.1% |
| Philippines | 119 | 0.3% |
| Russia | 29 | 0.1% |
| South America | 47 | 0.1% |
| South Eastern Asia | 119 | 0.3% |
| Southern Europe | 6 | 0.0% |
| Sudan | 25 | 0.1% |
| Western Africa | 2 | 0.0% |
| Western Europe | 21 | 0.1% | View All 34 Rows |
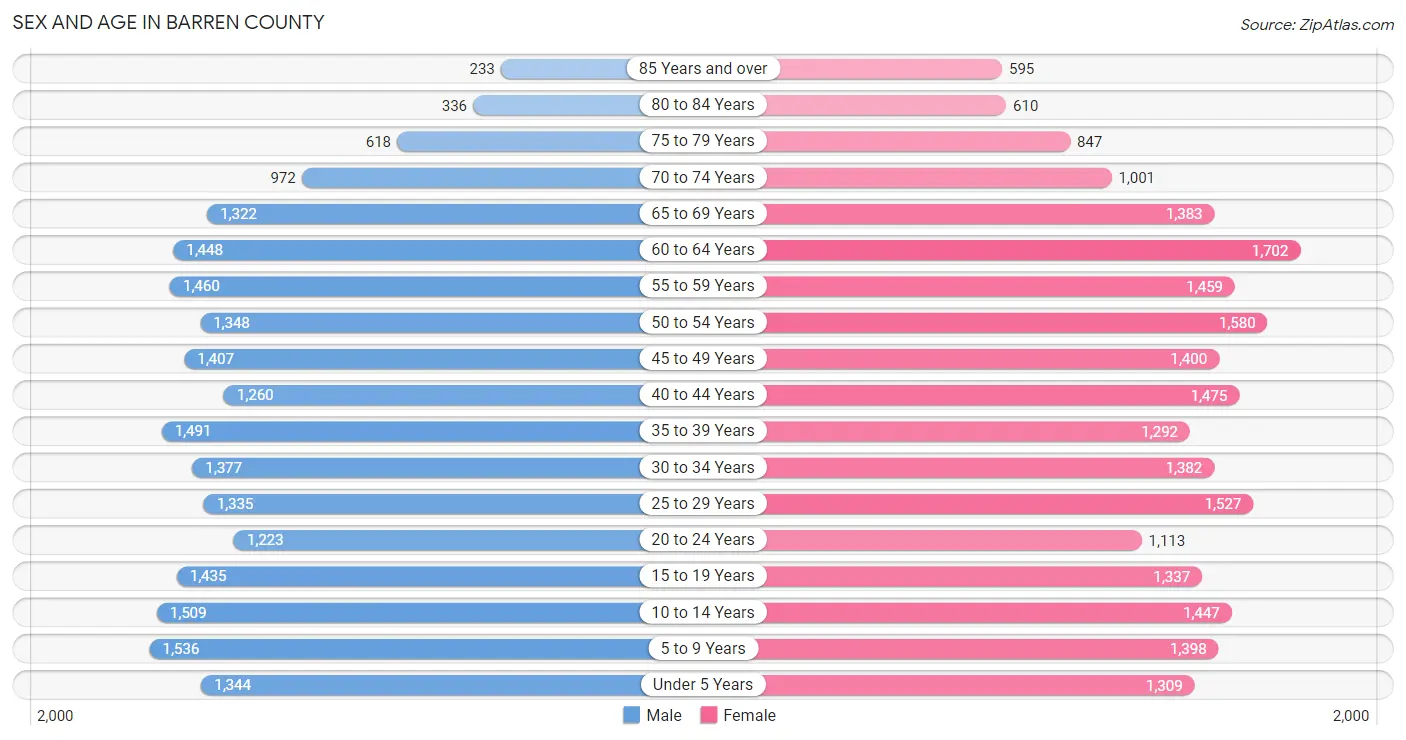
Sex and Age in Barren County
Sex and Age in Barren County
The most populous age groups in Barren County are 5 to 9 Years (1,536 | 7.1%) for men and 60 to 64 Years (1,702 | 7.4%) for women.
| Age Bracket | Male | Female |
| Under 5 Years | 1,344 (6.2%) | 1,309 (5.7%) |
| 5 to 9 Years | 1,536 (7.1%) | 1,398 (6.1%) |
| 10 to 14 Years | 1,509 (7.0%) | 1,447 (6.3%) |
| 15 to 19 Years | 1,435 (6.6%) | 1,337 (5.9%) |
| 20 to 24 Years | 1,223 (5.7%) | 1,113 (4.9%) |
| 25 to 29 Years | 1,335 (6.2%) | 1,527 (6.7%) |
| 30 to 34 Years | 1,377 (6.4%) | 1,382 (6.0%) |
| 35 to 39 Years | 1,491 (6.9%) | 1,292 (5.7%) |
| 40 to 44 Years | 1,260 (5.8%) | 1,475 (6.5%) |
| 45 to 49 Years | 1,407 (6.5%) | 1,400 (6.1%) |
| 50 to 54 Years | 1,348 (6.2%) | 1,580 (6.9%) |
| 55 to 59 Years | 1,460 (6.7%) | 1,459 (6.4%) |
| 60 to 64 Years | 1,448 (6.7%) | 1,702 (7.4%) |
| 65 to 69 Years | 1,322 (6.1%) | 1,383 (6.0%) |
| 70 to 74 Years | 972 (4.5%) | 1,001 (4.4%) |
| 75 to 79 Years | 618 (2.9%) | 847 (3.7%) |
| 80 to 84 Years | 336 (1.5%) | 610 (2.7%) |
| 85 Years and over | 233 (1.1%) | 595 (2.6%) |
| Total | 21,654 (100.0%) | 22,857 (100.0%) |
Families and Households in Barren County
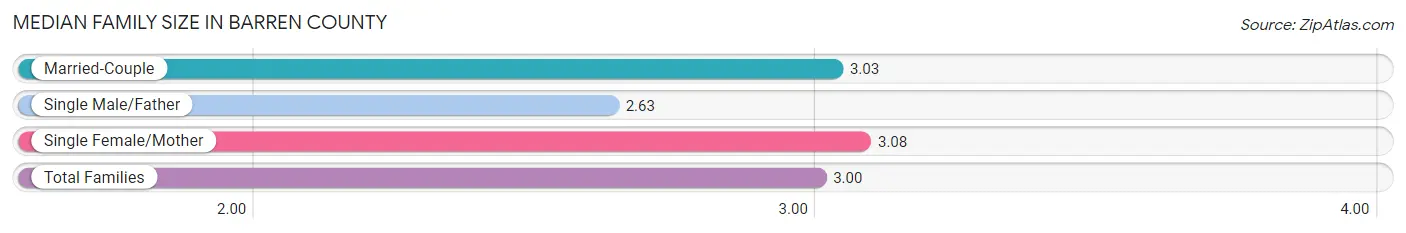
Median Family Size in Barren County
The median family size in Barren County is 3.00 persons per family, with single female/mother families (2,068 | 17.7%) accounting for the largest median family size of 3.08 persons per family. On the other hand, single male/father families (1,221 | 10.4%) represent the smallest median family size with 2.63 persons per family.
| Family Type | # Families | Family Size |
| Married-Couple | 8,391 (71.8%) | 3.03 |
| Single Male/Father | 1,221 (10.4%) | 2.63 |
| Single Female/Mother | 2,068 (17.7%) | 3.08 |
| Total Families | 11,680 (100.0%) | 3.00 |
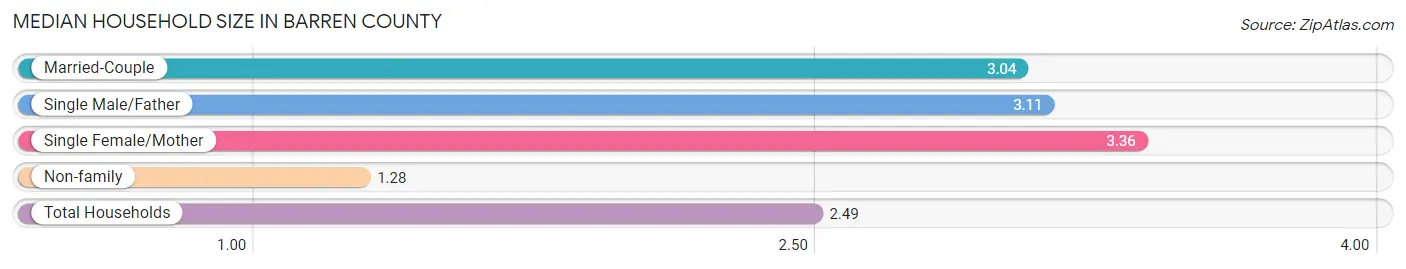
Median Household Size in Barren County
The median household size in Barren County is 2.49 persons per household, with single female/mother households (2,068 | 11.8%) accounting for the largest median household size of 3.36 persons per household. non-family households (5,912 | 33.6%) represent the smallest median household size with 1.28 persons per household.
| Household Type | # Households | Household Size |
| Married-Couple | 8,391 (47.7%) | 3.04 |
| Single Male/Father | 1,221 (6.9%) | 3.11 |
| Single Female/Mother | 2,068 (11.8%) | 3.36 |
| Non-family | 5,912 (33.6%) | 1.28 |
| Total Households | 17,592 (100.0%) | 2.49 |
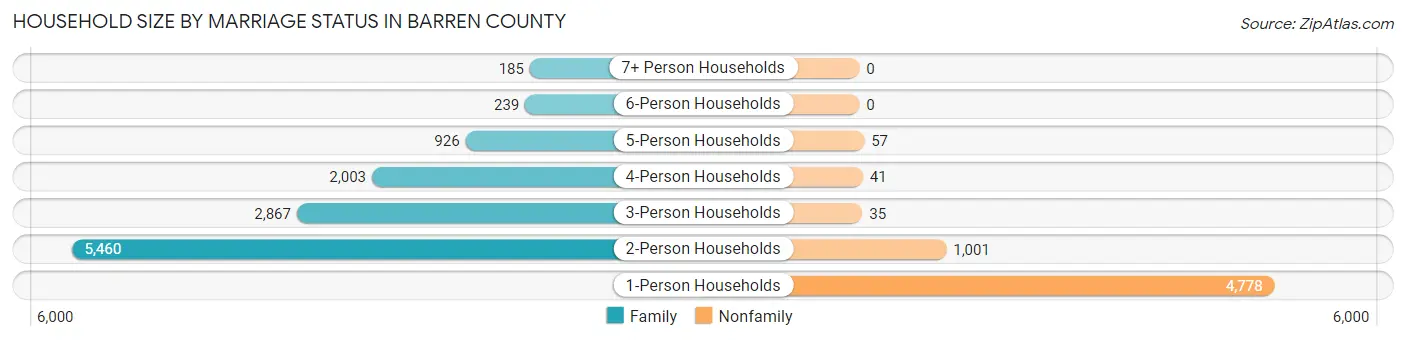
Household Size by Marriage Status in Barren County
Out of a total of 17,592 households in Barren County, 11,680 (66.4%) are family households, while 5,912 (33.6%) are nonfamily households. The most numerous type of family households are 2-person households, comprising 5,460, and the most common type of nonfamily households are 1-person households, comprising 4,778.
| Household Size | Family Households | Nonfamily Households |
| 1-Person Households | - | 4,778 (27.2%) |
| 2-Person Households | 5,460 (31.0%) | 1,001 (5.7%) |
| 3-Person Households | 2,867 (16.3%) | 35 (0.2%) |
| 4-Person Households | 2,003 (11.4%) | 41 (0.2%) |
| 5-Person Households | 926 (5.3%) | 57 (0.3%) |
| 6-Person Households | 239 (1.4%) | 0 (0.0%) |
| 7+ Person Households | 185 (1.1%) | 0 (0.0%) |
| Total | 11,680 (66.4%) | 5,912 (33.6%) |
Female Fertility in Barren County
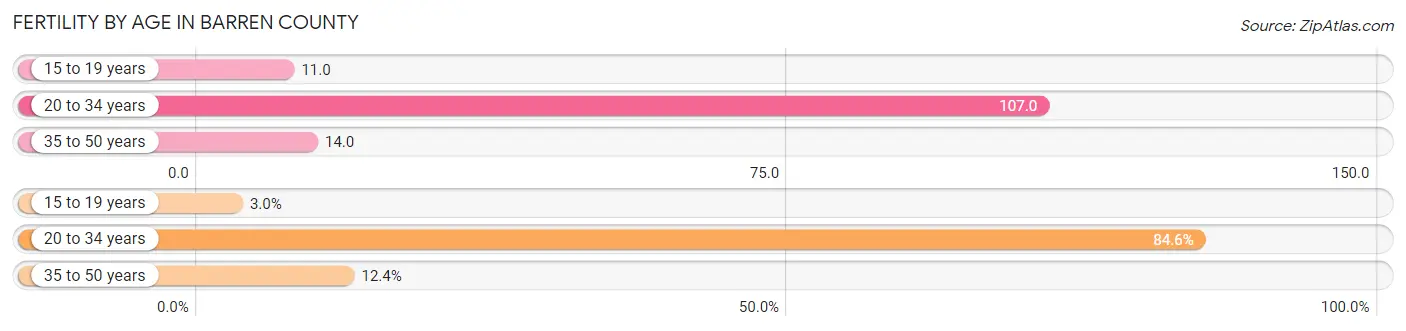
Fertility by Age in Barren County
Average fertility rate in Barren County is 51.0 births per 1,000 women. Women in the age bracket of 20 to 34 years have the highest fertility rate with 107.0 births per 1,000 women. Women in the age bracket of 20 to 34 years acount for 84.6% of all women with births.
| Age Bracket | Women with Births | Births / 1,000 Women |
| 15 to 19 years | 15 (3.0%) | 11.0 |
| 20 to 34 years | 429 (84.6%) | 107.0 |
| 35 to 50 years | 63 (12.4%) | 14.0 |
| Total | 507 (100.0%) | 51.0 |
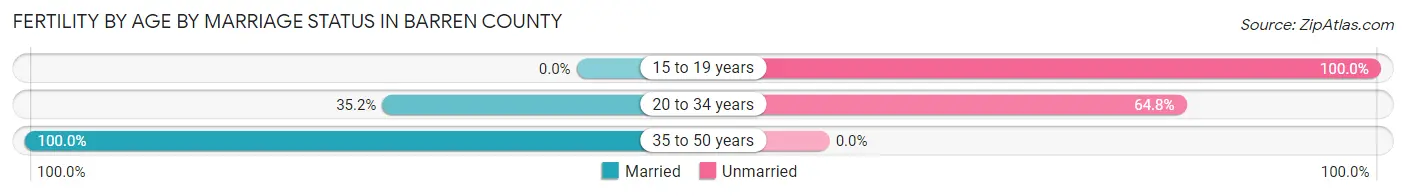
Fertility by Age by Marriage Status in Barren County
42.2% of women with births (507) in Barren County are married. The highest percentage of unmarried women with births falls into 15 to 19 years age bracket with 100.0% of them unmarried at the time of birth, while the lowest percentage of unmarried women with births belong to 35 to 50 years age bracket with 0.0% of them unmarried.
| Age Bracket | Married | Unmarried |
| 15 to 19 years | 0 (0.0%) | 15 (100.0%) |
| 20 to 34 years | 151 (35.2%) | 278 (64.8%) |
| 35 to 50 years | 63 (100.0%) | 0 (0.0%) |
| Total | 214 (42.2%) | 293 (57.8%) |
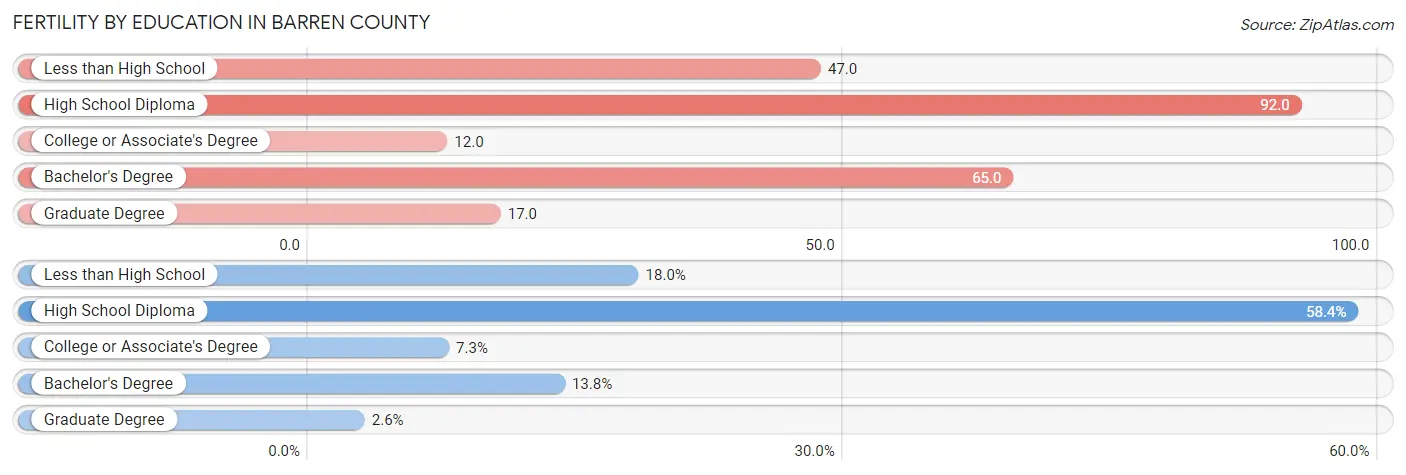
Fertility by Education in Barren County
Average fertility rate in Barren County is 51.0 births per 1,000 women. Women with the education attainment of high school diploma have the highest fertility rate of 92.0 births per 1,000 women, while women with the education attainment of college or associate's degree have the lowest fertility at 12.0 births per 1,000 women. Women with the education attainment of high school diploma represent 58.4% of all women with births.
| Educational Attainment | Women with Births | Births / 1,000 Women |
| Less than High School | 91 (17.9%) | 47.0 |
| High School Diploma | 296 (58.4%) | 92.0 |
| College or Associate's Degree | 37 (7.3%) | 12.0 |
| Bachelor's Degree | 70 (13.8%) | 65.0 |
| Graduate Degree | 13 (2.6%) | 17.0 |
| Total | 507 (100.0%) | 51.0 |
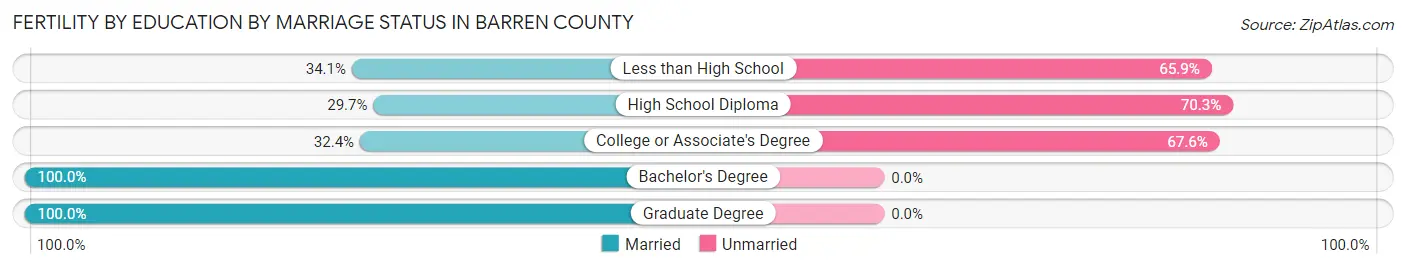
Fertility by Education by Marriage Status in Barren County
57.8% of women with births in Barren County are unmarried. Women with the educational attainment of bachelor's degree are most likely to be married with 100.0% of them married at childbirth, while women with the educational attainment of high school diploma are least likely to be married with 70.3% of them unmarried at childbirth.
| Educational Attainment | Married | Unmarried |
| Less than High School | 31 (34.1%) | 60 (65.9%) |
| High School Diploma | 88 (29.7%) | 208 (70.3%) |
| College or Associate's Degree | 12 (32.4%) | 25 (67.6%) |
| Bachelor's Degree | 70 (100.0%) | 0 (0.0%) |
| Graduate Degree | 13 (100.0%) | 0 (0.0%) |
| Total | 214 (42.2%) | 293 (57.8%) |
Income in Barren County
Income Overview in Barren County
Per Capita Income in Barren County is $27,732, while median incomes of families and households are $58,262 and $48,141 respectively.
| Characteristic | Number | Measure |
| Per Capita Income | 44,511 | $27,732 |
| Median Family Income | 11,680 | $58,262 |
| Mean Family Income | 11,680 | $81,104 |
| Median Household Income | 17,592 | $48,141 |
| Mean Household Income | 17,592 | $67,977 |
| Income Deficit | 11,680 | $11,326 |
| Wage / Income Gap (%) | 44,511 | 23.64% |
| Wage / Income Gap ($) | 44,511 | 76.36¢ per $1 |
| Gini / Inequality Index | 44,511 | 0.47 |
Earnings by Sex in Barren County
Average Earnings in Barren County are $32,498, $38,542 for men and $29,430 for women, a difference of 23.6%.
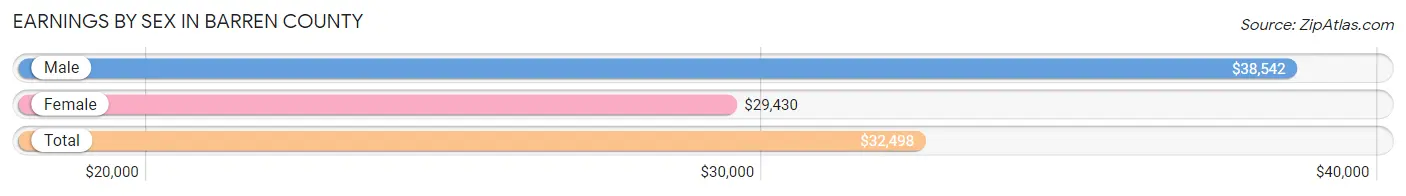
| Sex | Number | Average Earnings |
| Male | 10,991 (52.5%) | $38,542 |
| Female | 9,930 (47.5%) | $29,430 |
| Total | 20,921 (100.0%) | $32,498 |
Earnings by Sex by Income Bracket in Barren County
The most common earnings brackets in Barren County are $75,000 to $99,999 for men (1,113 | 10.1%) and $25,000 to $29,999 for women (1,136 | 11.4%).
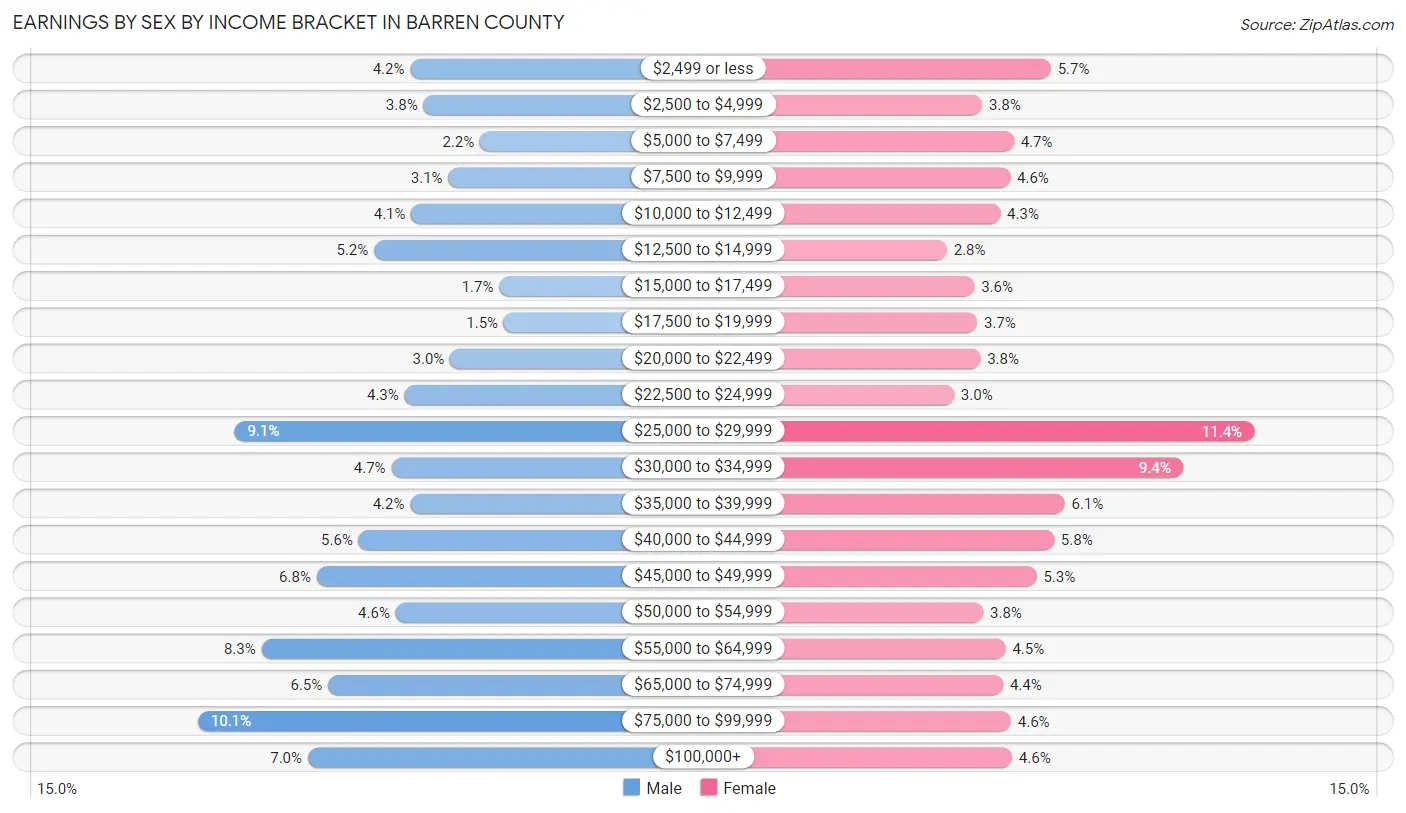
| Income | Male | Female |
| $2,499 or less | 457 (4.2%) | 569 (5.7%) |
| $2,500 to $4,999 | 417 (3.8%) | 377 (3.8%) |
| $5,000 to $7,499 | 242 (2.2%) | 466 (4.7%) |
| $7,500 to $9,999 | 340 (3.1%) | 456 (4.6%) |
| $10,000 to $12,499 | 454 (4.1%) | 428 (4.3%) |
| $12,500 to $14,999 | 569 (5.2%) | 279 (2.8%) |
| $15,000 to $17,499 | 183 (1.7%) | 355 (3.6%) |
| $17,500 to $19,999 | 168 (1.5%) | 363 (3.7%) |
| $20,000 to $22,499 | 334 (3.0%) | 372 (3.7%) |
| $22,500 to $24,999 | 475 (4.3%) | 299 (3.0%) |
| $25,000 to $29,999 | 1,000 (9.1%) | 1,136 (11.4%) |
| $30,000 to $34,999 | 515 (4.7%) | 937 (9.4%) |
| $35,000 to $39,999 | 457 (4.2%) | 608 (6.1%) |
| $40,000 to $44,999 | 617 (5.6%) | 578 (5.8%) |
| $45,000 to $49,999 | 746 (6.8%) | 529 (5.3%) |
| $50,000 to $54,999 | 502 (4.6%) | 380 (3.8%) |
| $55,000 to $64,999 | 917 (8.3%) | 443 (4.5%) |
| $65,000 to $74,999 | 711 (6.5%) | 436 (4.4%) |
| $75,000 to $99,999 | 1,113 (10.1%) | 458 (4.6%) |
| $100,000+ | 774 (7.0%) | 461 (4.6%) |
| Total | 10,991 (100.0%) | 9,930 (100.0%) |
Earnings by Sex by Educational Attainment in Barren County
Average earnings in Barren County are $44,298 for men and $32,245 for women, a difference of 27.2%. Men with an educational attainment of bachelor's degree enjoy the highest average annual earnings of $75,188, while those with high school diploma education earn the least with $36,942. Women with an educational attainment of graduate degree earn the most with the average annual earnings of $59,167, while those with less than high school education have the smallest earnings of $14,857.
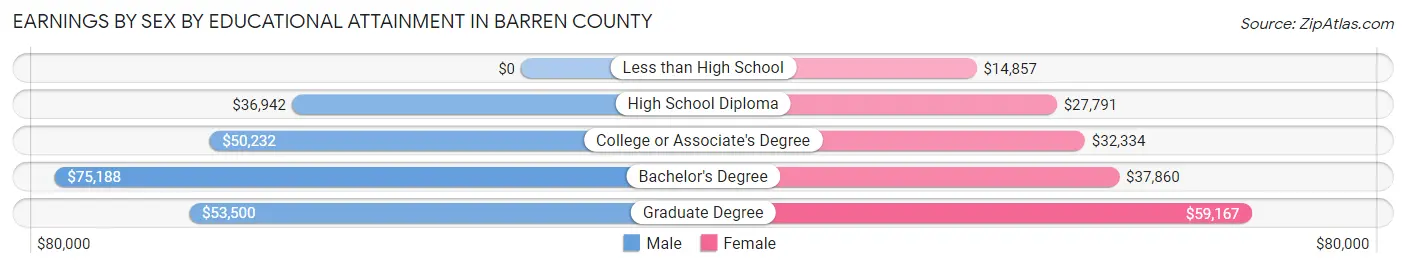
| Educational Attainment | Male Income | Female Income |
| Less than High School | - | - |
| High School Diploma | $36,942 | $27,791 |
| College or Associate's Degree | $50,232 | $32,334 |
| Bachelor's Degree | $75,188 | $37,860 |
| Graduate Degree | $53,500 | $59,167 |
| Total | $44,298 | $32,245 |
Family Income in Barren County
Family Income Brackets in Barren County
According to the Barren County family income data, there are 2,289 families falling into the $50,000 to $74,999 income range, which is the most common income bracket and makes up 19.6% of all families. Conversely, the $150,000 to $199,999 income bracket is the least frequent group with only 561 families (4.8%) belonging to this category.
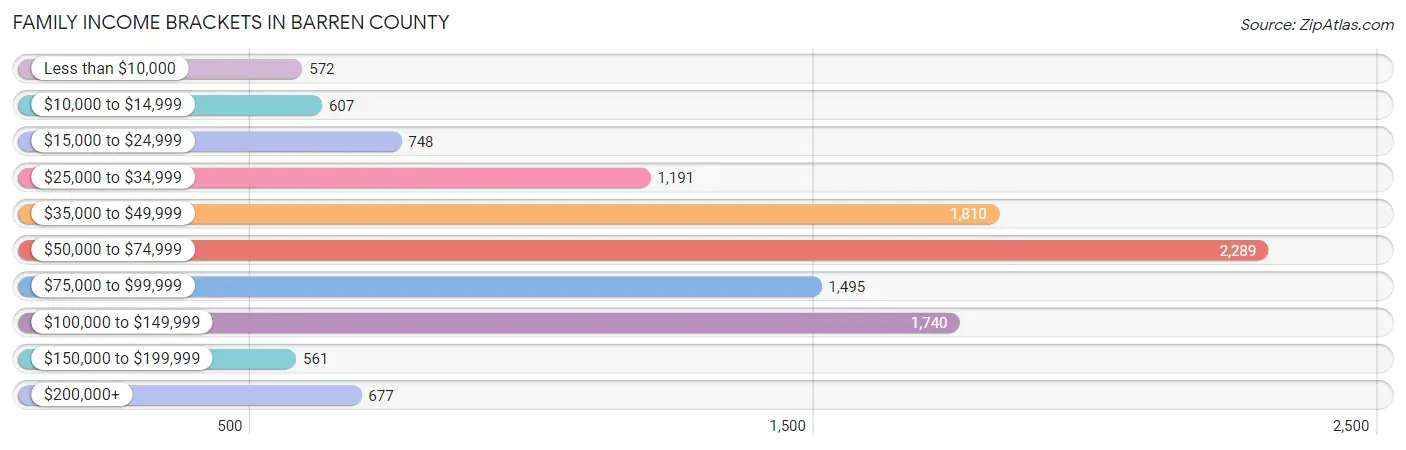
| Income Bracket | # Families | % Families |
| Less than $10,000 | 572 | 4.9% |
| $10,000 to $14,999 | 607 | 5.2% |
| $15,000 to $24,999 | 748 | 6.4% |
| $25,000 to $34,999 | 1,191 | 10.2% |
| $35,000 to $49,999 | 1,810 | 15.5% |
| $50,000 to $74,999 | 2,289 | 19.6% |
| $75,000 to $99,999 | 1,495 | 12.8% |
| $100,000 to $149,999 | 1,740 | 14.9% |
| $150,000 to $199,999 | 561 | 4.8% |
| $200,000+ | 677 | 5.8% |
Family Income by Famaliy Size in Barren County
5-person families (825 | 7.1%) account for the highest median family income in Barren County with $76,458 per family, while 2-person families (6,110 | 52.3%) have the highest median income of $27,092 per family member.
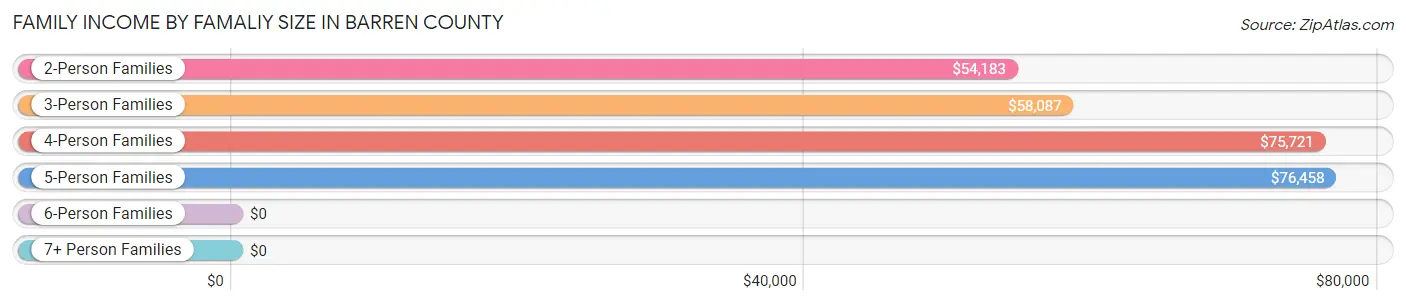
| Income Bracket | # Families | Median Income |
| 2-Person Families | 6,110 (52.3%) | $54,183 |
| 3-Person Families | 2,627 (22.5%) | $58,087 |
| 4-Person Families | 1,791 (15.3%) | $75,721 |
| 5-Person Families | 825 (7.1%) | $76,458 |
| 6-Person Families | 175 (1.5%) | $0 |
| 7+ Person Families | 152 (1.3%) | $0 |
| Total | 11,680 (100.0%) | $58,262 |
Family Income by Number of Earners in Barren County
The median family income in Barren County is $58,262, with families comprising 3+ earners (821) having the highest median family income of $137,375, while families with no earners (2,420) have the lowest median family income of $32,917, accounting for 7.0% and 20.7% of families, respectively.
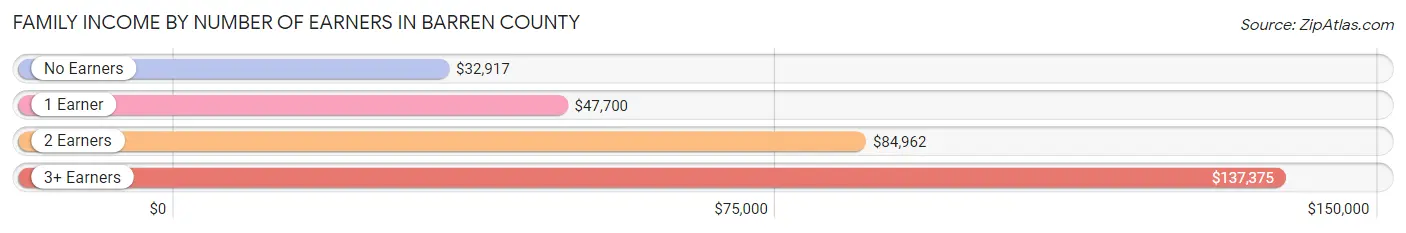
| Number of Earners | # Families | Median Income |
| No Earners | 2,420 (20.7%) | $32,917 |
| 1 Earner | 4,059 (34.7%) | $47,700 |
| 2 Earners | 4,380 (37.5%) | $84,962 |
| 3+ Earners | 821 (7.0%) | $137,375 |
| Total | 11,680 (100.0%) | $58,262 |
Household Income in Barren County
Household Income Brackets in Barren County
With 2,955 households falling in the category, the $50,000 to $74,999 income range is the most frequent in Barren County, accounting for 16.8% of all households. In contrast, only 651 households (3.7%) fall into the $150,000 to $199,999 income bracket, making it the least populous group.
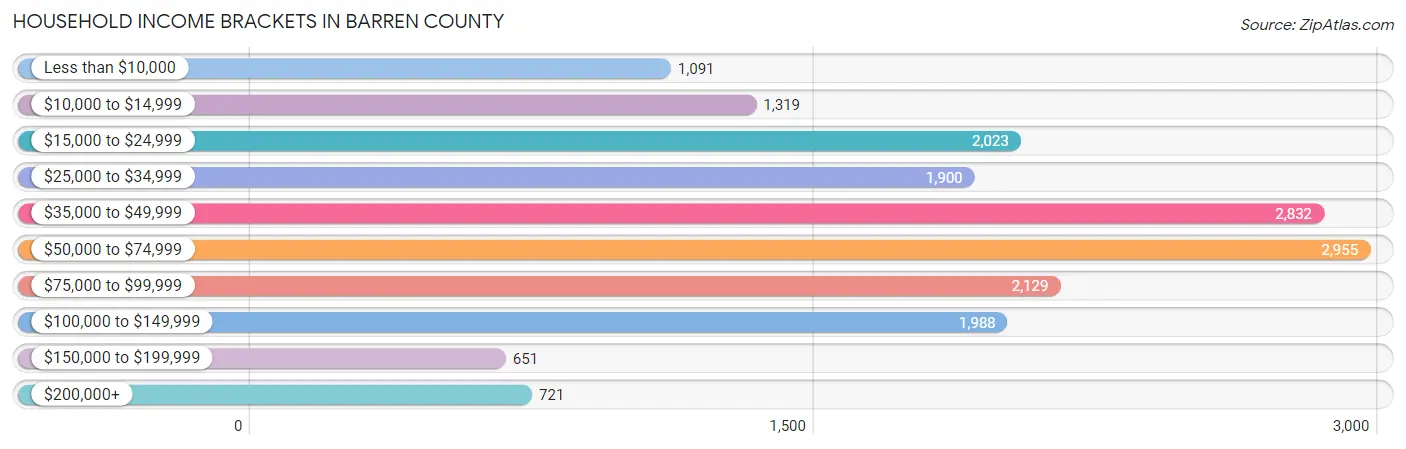
| Income Bracket | # Households | % Households |
| Less than $10,000 | 1,091 | 6.2% |
| $10,000 to $14,999 | 1,319 | 7.5% |
| $15,000 to $24,999 | 2,023 | 11.5% |
| $25,000 to $34,999 | 1,900 | 10.8% |
| $35,000 to $49,999 | 2,832 | 16.1% |
| $50,000 to $74,999 | 2,955 | 16.8% |
| $75,000 to $99,999 | 2,129 | 12.1% |
| $100,000 to $149,999 | 1,988 | 11.3% |
| $150,000 to $199,999 | 651 | 3.7% |
| $200,000+ | 721 | 4.1% |
Household Income by Householder Age in Barren County
The median household income in Barren County is $48,141, with the highest median household income of $56,920 found in the 25 to 44 years age bracket for the primary householder. A total of 5,293 households (30.1%) fall into this category. Meanwhile, the 65+ years age bracket for the primary householder has the lowest median household income of $38,902, with 4,979 households (28.3%) in this group.
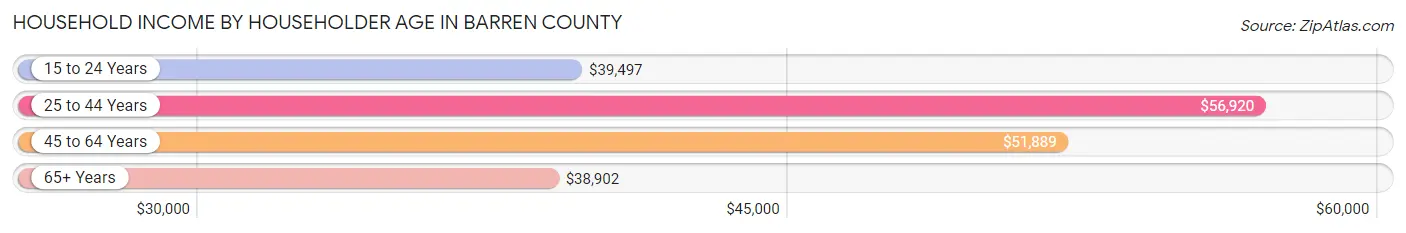
| Income Bracket | # Households | Median Income |
| 15 to 24 Years | 711 (4.0%) | $39,497 |
| 25 to 44 Years | 5,293 (30.1%) | $56,920 |
| 45 to 64 Years | 6,609 (37.6%) | $51,889 |
| 65+ Years | 4,979 (28.3%) | $38,902 |
| Total | 17,592 (100.0%) | $48,141 |
Poverty in Barren County
Income Below Poverty by Sex and Age in Barren County
With 20.0% poverty level for males and 22.2% for females among the residents of Barren County, 5 year old males and under 5 year old females are the most vulnerable to poverty, with 246 males (71.7%) and 415 females (33.4%) in their respective age groups living below the poverty level.
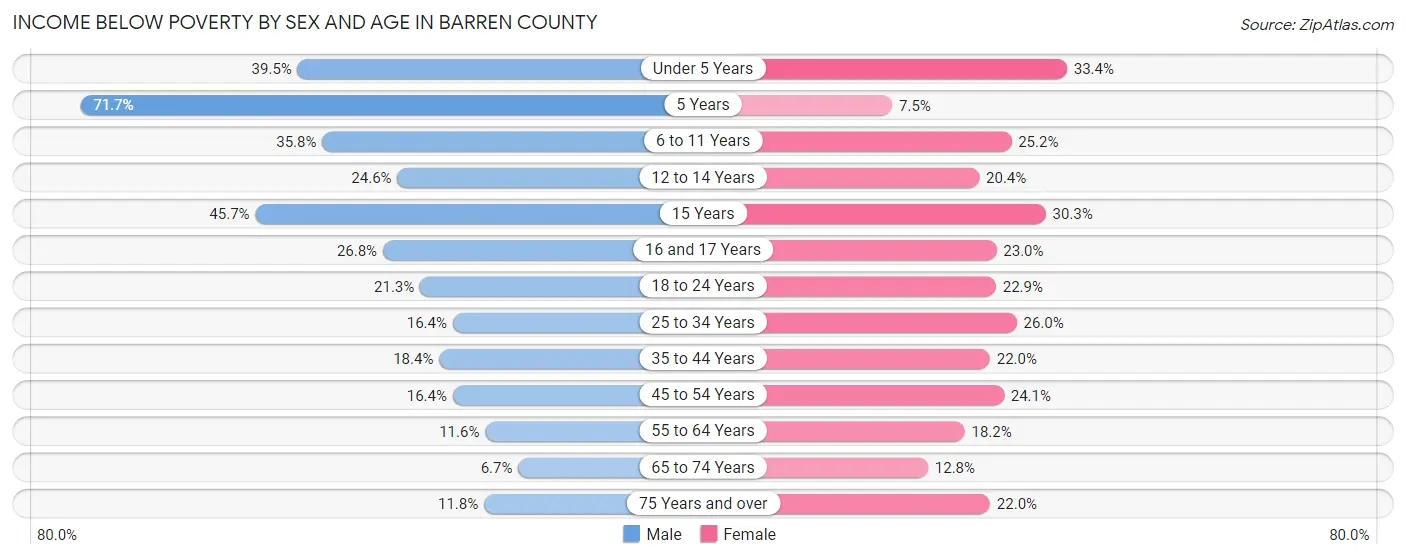
| Age Bracket | Male | Female |
| Under 5 Years | 484 (39.5%) | 415 (33.4%) |
| 5 Years | 246 (71.7%) | 13 (7.5%) |
| 6 to 11 Years | 636 (35.8%) | 384 (25.2%) |
| 12 to 14 Years | 208 (24.6%) | 221 (20.4%) |
| 15 Years | 107 (45.7%) | 82 (30.3%) |
| 16 and 17 Years | 191 (26.8%) | 148 (23.0%) |
| 18 to 24 Years | 364 (21.3%) | 349 (22.9%) |
| 25 to 34 Years | 439 (16.4%) | 751 (26.0%) |
| 35 to 44 Years | 501 (18.4%) | 605 (22.0%) |
| 45 to 54 Years | 447 (16.4%) | 717 (24.1%) |
| 55 to 64 Years | 335 (11.6%) | 573 (18.2%) |
| 65 to 74 Years | 149 (6.7%) | 294 (12.8%) |
| 75 Years and over | 133 (11.8%) | 395 (22.0%) |
| Total | 4,240 (20.0%) | 4,947 (22.2%) |
Income Above Poverty by Sex and Age in Barren County
According to the poverty statistics in Barren County, males aged 65 to 74 years and females aged 5 years are the age groups that are most secure financially, with 93.3% of males and 92.5% of females in these age groups living above the poverty line.
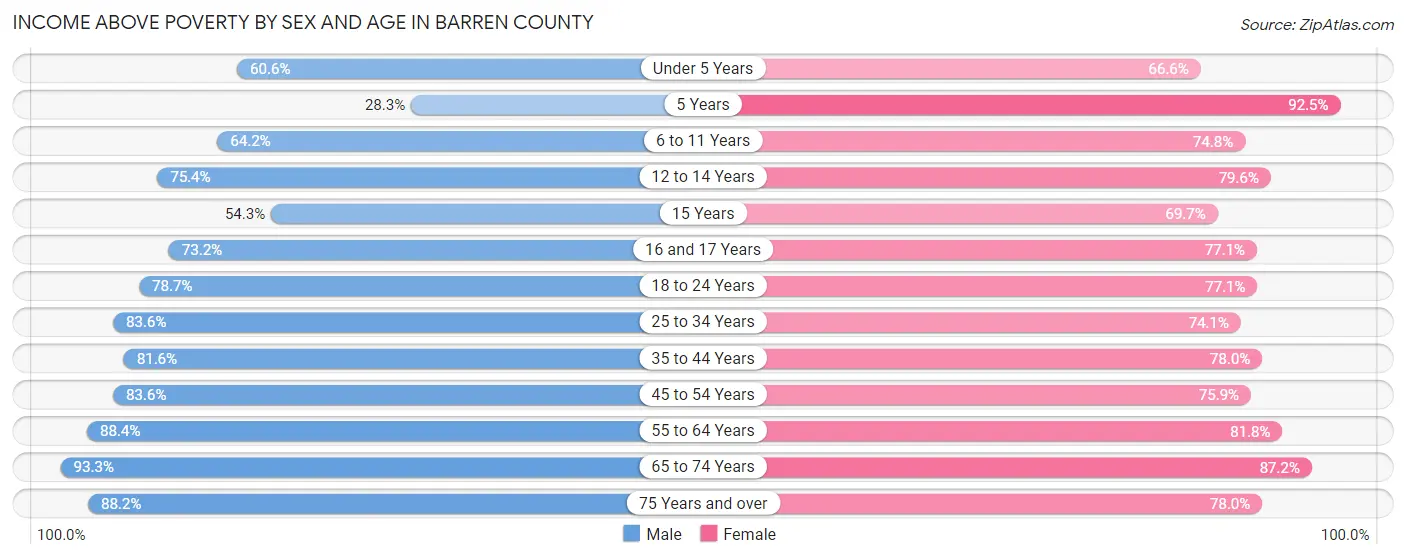
| Age Bracket | Male | Female |
| Under 5 Years | 743 (60.6%) | 827 (66.6%) |
| 5 Years | 97 (28.3%) | 161 (92.5%) |
| 6 to 11 Years | 1,141 (64.2%) | 1,142 (74.8%) |
| 12 to 14 Years | 636 (75.4%) | 863 (79.6%) |
| 15 Years | 127 (54.3%) | 189 (69.7%) |
| 16 and 17 Years | 522 (73.2%) | 497 (77.0%) |
| 18 to 24 Years | 1,347 (78.7%) | 1,177 (77.1%) |
| 25 to 34 Years | 2,236 (83.6%) | 2,143 (74.1%) |
| 35 to 44 Years | 2,217 (81.6%) | 2,148 (78.0%) |
| 45 to 54 Years | 2,277 (83.6%) | 2,263 (75.9%) |
| 55 to 64 Years | 2,554 (88.4%) | 2,571 (81.8%) |
| 65 to 74 Years | 2,078 (93.3%) | 2,006 (87.2%) |
| 75 Years and over | 996 (88.2%) | 1,401 (78.0%) |
| Total | 16,971 (80.0%) | 17,388 (77.8%) |
Income Below Poverty Among Married-Couple Families in Barren County
The poverty statistics for married-couple families in Barren County show that 7.6% or 636 of the total 8,391 families live below the poverty line. Families with 5 or more children have the highest poverty rate of 87.5%, comprising of 49 families. On the other hand, families with no children have the lowest poverty rate of 5.5%, which includes 275 families.
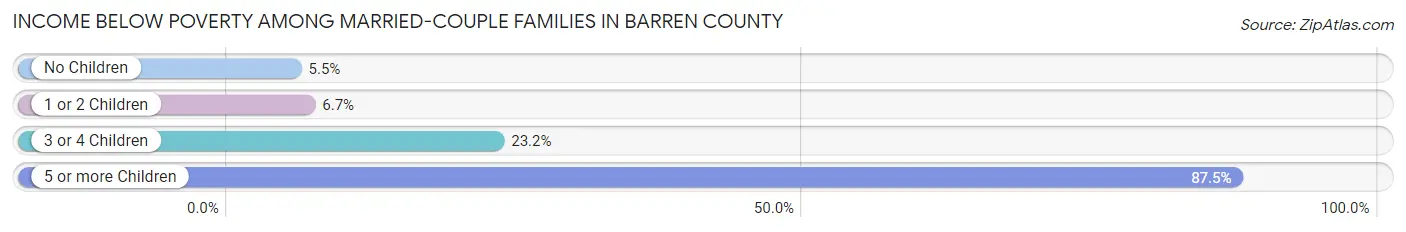
| Children | Above Poverty | Below Poverty |
| No Children | 4,701 (94.5%) | 275 (5.5%) |
| 1 or 2 Children | 2,646 (93.3%) | 191 (6.7%) |
| 3 or 4 Children | 401 (76.8%) | 121 (23.2%) |
| 5 or more Children | 7 (12.5%) | 49 (87.5%) |
| Total | 7,755 (92.4%) | 636 (7.6%) |
Income Below Poverty Among Single-Parent Households in Barren County
According to the poverty data in Barren County, 17.0% or 208 single-father households and 44.9% or 928 single-mother households are living below the poverty line. Among single-father households, those with 3 or 4 children have the highest poverty rate, with 23 households (28.1%) experiencing poverty. Likewise, among single-mother households, those with 3 or 4 children have the highest poverty rate, with 241 households (80.6%) falling below the poverty line.
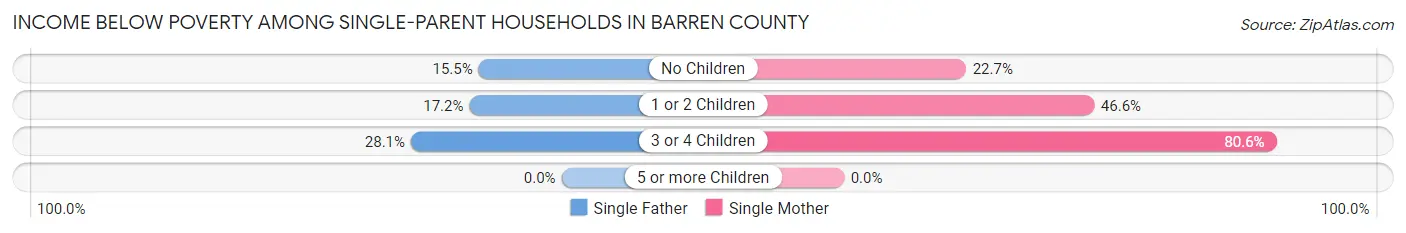
| Children | Single Father | Single Mother |
| No Children | 59 (15.4%) | 131 (22.7%) |
| 1 or 2 Children | 126 (17.2%) | 556 (46.6%) |
| 3 or 4 Children | 23 (28.1%) | 241 (80.6%) |
| 5 or more Children | 0 (0.0%) | 0 (0.0%) |
| Total | 208 (17.0%) | 928 (44.9%) |
Income Below Poverty Among Married-Couple vs Single-Parent Households in Barren County
The poverty data for Barren County shows that 636 of the married-couple family households (7.6%) and 1,136 of the single-parent households (34.5%) are living below the poverty level. Within the married-couple family households, those with 5 or more children have the highest poverty rate, with 49 households (87.5%) falling below the poverty line. Among the single-parent households, those with 3 or 4 children have the highest poverty rate, with 264 household (69.3%) living below poverty.
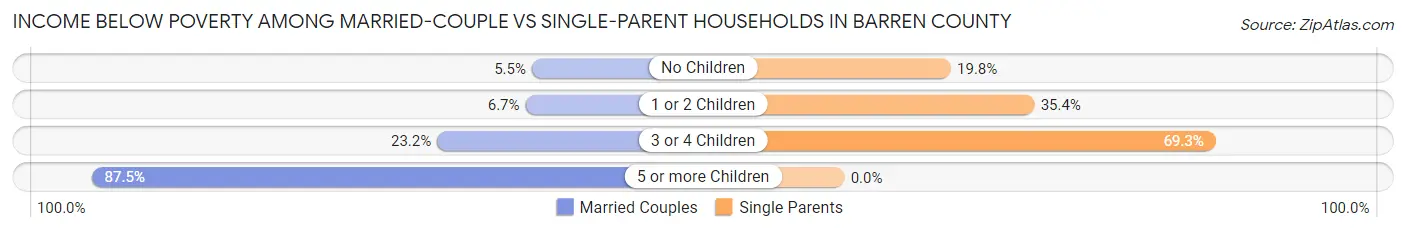
| Children | Married-Couple Families | Single-Parent Households |
| No Children | 275 (5.5%) | 190 (19.8%) |
| 1 or 2 Children | 191 (6.7%) | 682 (35.4%) |
| 3 or 4 Children | 121 (23.2%) | 264 (69.3%) |
| 5 or more Children | 49 (87.5%) | 0 (0.0%) |
| Total | 636 (7.6%) | 1,136 (34.5%) |
Employment Characteristics in Barren County
Employment by Class of Employer in Barren County
Among the 18,337 employed individuals in Barren County, private company employees (12,931 | 70.5%), self-employed (not incorporated) (1,432 | 7.8%), and local government employees (1,200 | 6.5%) make up the most common classes of employment.
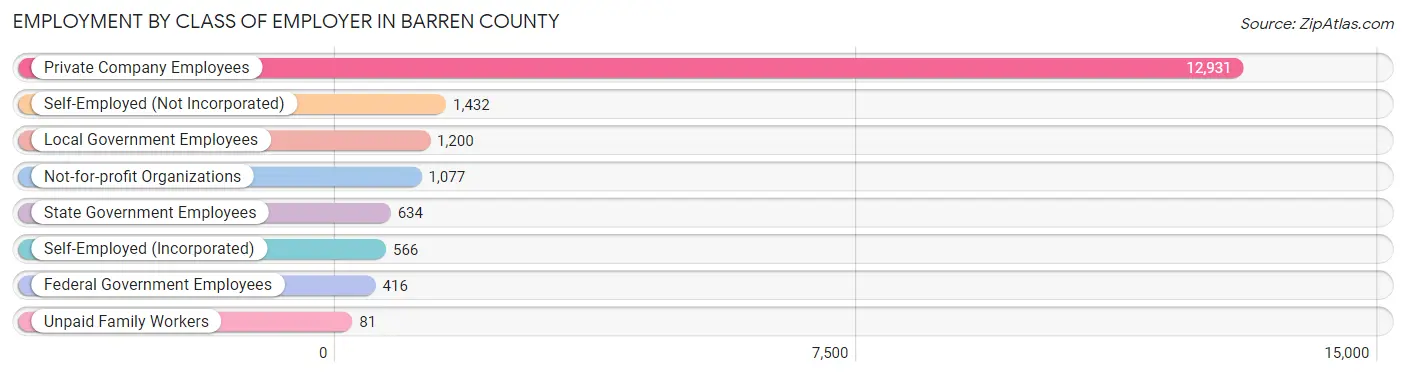
| Employer Class | # Employees | % Employees |
| Private Company Employees | 12,931 | 70.5% |
| Self-Employed (Incorporated) | 566 | 3.1% |
| Self-Employed (Not Incorporated) | 1,432 | 7.8% |
| Not-for-profit Organizations | 1,077 | 5.9% |
| Local Government Employees | 1,200 | 6.5% |
| State Government Employees | 634 | 3.5% |
| Federal Government Employees | 416 | 2.3% |
| Unpaid Family Workers | 81 | 0.4% |
| Total | 18,337 | 100.0% |
Employment Status by Age in Barren County
According to the labor force statistics for Barren County, out of the total population over 16 years of age (35,457), 55.5% or 19,679 individuals are in the labor force, with 4.9% or 964 of them unemployed. The age group with the highest labor force participation rate is 20 to 24 years, with 81.7% or 1,909 individuals in the labor force. Within the labor force, the 16 to 19 years age range has the highest percentage of unemployed individuals, with 10.8% or 98 of them being unemployed.
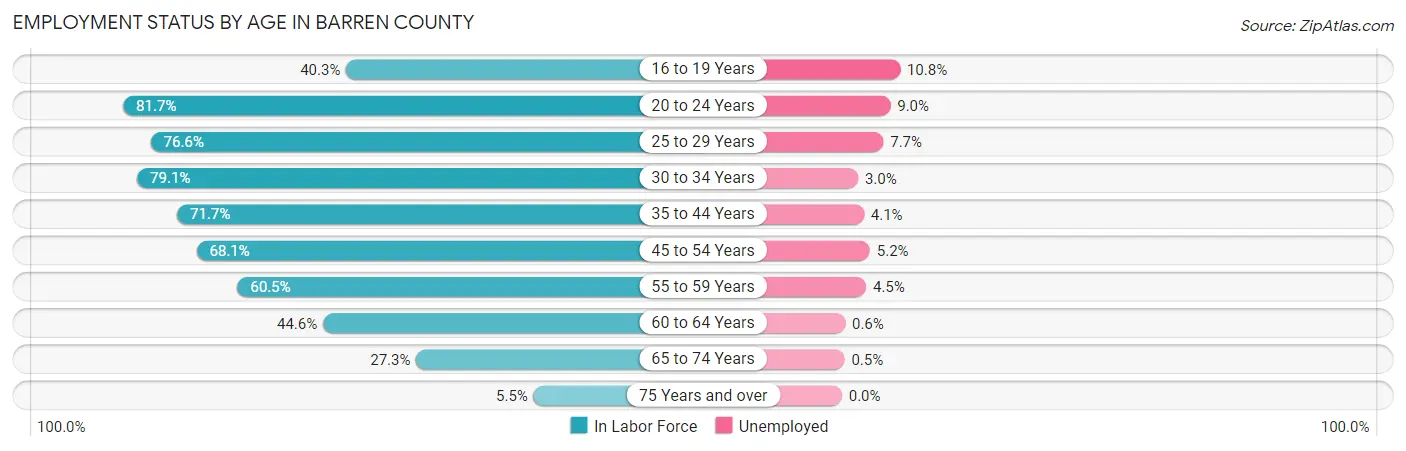
| Age Bracket | In Labor Force | Unemployed |
| 16 to 19 Years | 911 (40.3%) | 98 (10.8%) |
| 20 to 24 Years | 1,909 (81.7%) | 172 (9.0%) |
| 25 to 29 Years | 2,192 (76.6%) | 169 (7.7%) |
| 30 to 34 Years | 2,182 (79.1%) | 65 (3.0%) |
| 35 to 44 Years | 3,956 (71.7%) | 162 (4.1%) |
| 45 to 54 Years | 3,906 (68.1%) | 203 (5.2%) |
| 55 to 59 Years | 1,766 (60.5%) | 79 (4.5%) |
| 60 to 64 Years | 1,405 (44.6%) | 8 (0.6%) |
| 65 to 74 Years | 1,277 (27.3%) | 6 (0.5%) |
| 75 Years and over | 178 (5.5%) | 0 (0.0%) |
| Total | 19,679 (55.5%) | 964 (4.9%) |
Employment Status by Educational Attainment in Barren County
According to labor force statistics for Barren County, 67.2% of individuals (15,418) out of the total population between 25 and 64 years of age (22,943) are in the labor force, with 4.5% or 694 of them being unemployed. The group with the highest labor force participation rate are those with the educational attainment of bachelor's degree or higher, with 78.7% or 3,220 individuals in the labor force. Within the labor force, individuals with less than high school education have the highest percentage of unemployment, with 15.5% or 230 of them being unemployed.
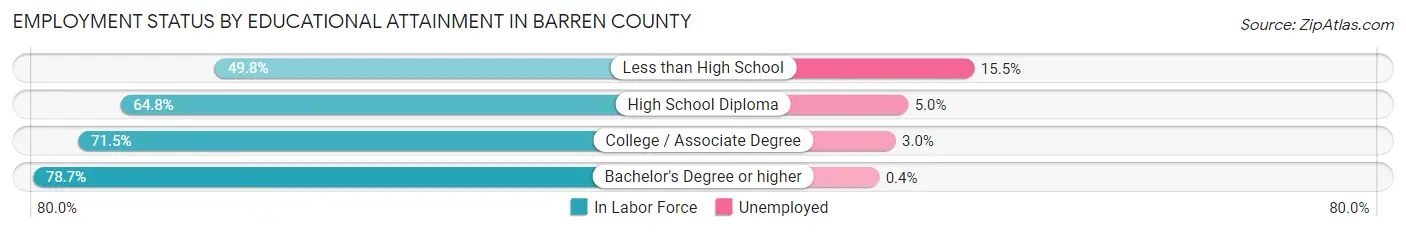
| Educational Attainment | In Labor Force | Unemployed |
| Less than High School | 1,483 (49.8%) | 462 (15.5%) |
| High School Diploma | 6,214 (64.8%) | 479 (5.0%) |
| College / Associate Degree | 4,493 (71.5%) | 189 (3.0%) |
| Bachelor's Degree or higher | 3,220 (78.7%) | 16 (0.4%) |
| Total | 15,418 (67.2%) | 1,032 (4.5%) |
Employment Occupations by Sex in Barren County
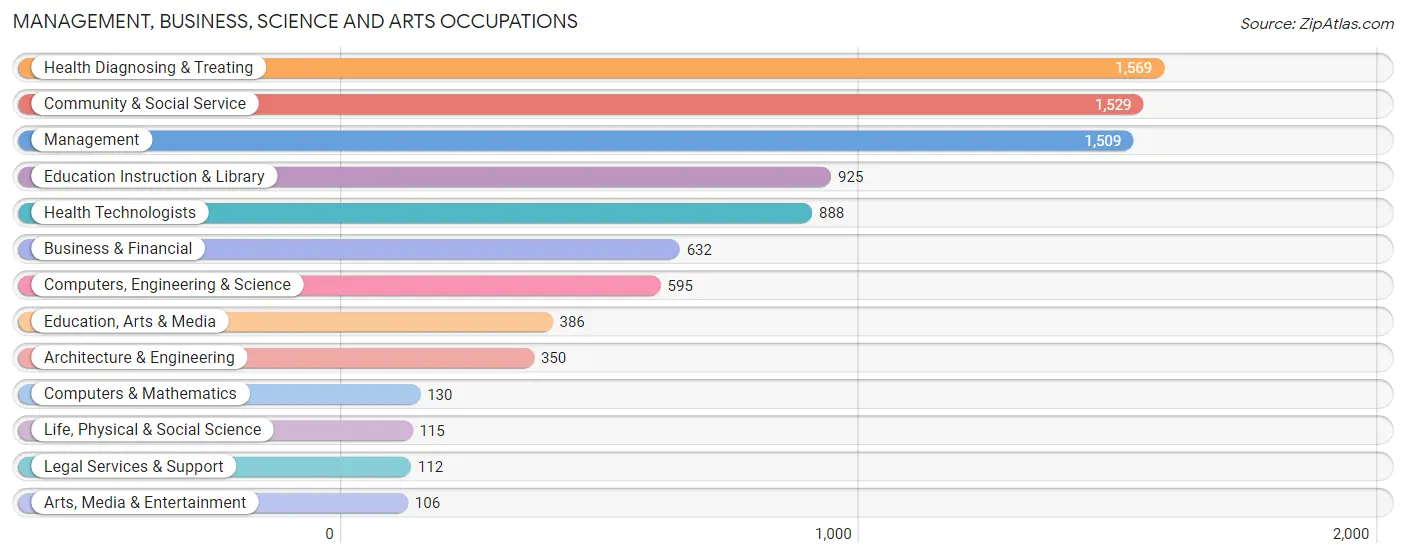
Management, Business, Science and Arts Occupations
The most common Management, Business, Science and Arts occupations in Barren County are Health Diagnosing & Treating (1,569 | 8.4%), Community & Social Service (1,529 | 8.2%), Management (1,509 | 8.1%), Education Instruction & Library (925 | 5.0%), and Health Technologists (888 | 4.8%).
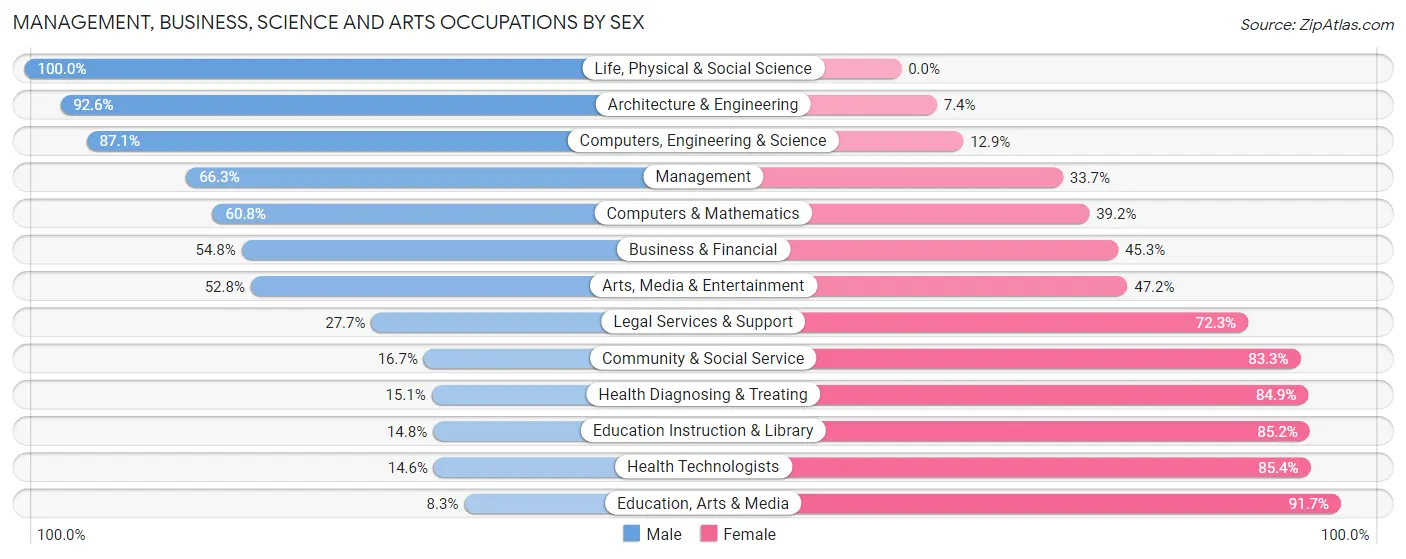
Management, Business, Science and Arts Occupations by Sex
Within the Management, Business, Science and Arts occupations in Barren County, the most male-oriented occupations are Life, Physical & Social Science (100.0%), Architecture & Engineering (92.6%), and Computers, Engineering & Science (87.1%), while the most female-oriented occupations are Education, Arts & Media (91.7%), Health Technologists (85.4%), and Education Instruction & Library (85.2%).
| Occupation | Male | Female |
| Management | 1,000 (66.3%) | 509 (33.7%) |
| Business & Financial | 346 (54.7%) | 286 (45.3%) |
| Computers, Engineering & Science | 518 (87.1%) | 77 (12.9%) |
| Computers & Mathematics | 79 (60.8%) | 51 (39.2%) |
| Architecture & Engineering | 324 (92.6%) | 26 (7.4%) |
| Life, Physical & Social Science | 115 (100.0%) | 0 (0.0%) |
| Community & Social Service | 256 (16.7%) | 1,273 (83.3%) |
| Education, Arts & Media | 32 (8.3%) | 354 (91.7%) |
| Legal Services & Support | 31 (27.7%) | 81 (72.3%) |
| Education Instruction & Library | 137 (14.8%) | 788 (85.2%) |
| Arts, Media & Entertainment | 56 (52.8%) | 50 (47.2%) |
| Health Diagnosing & Treating | 237 (15.1%) | 1,332 (84.9%) |
| Health Technologists | 130 (14.6%) | 758 (85.4%) |
| Total (Category) | 2,357 (40.4%) | 3,477 (59.6%) |
| Total (Overall) | 9,883 (52.8%) | 8,819 (47.2%) |
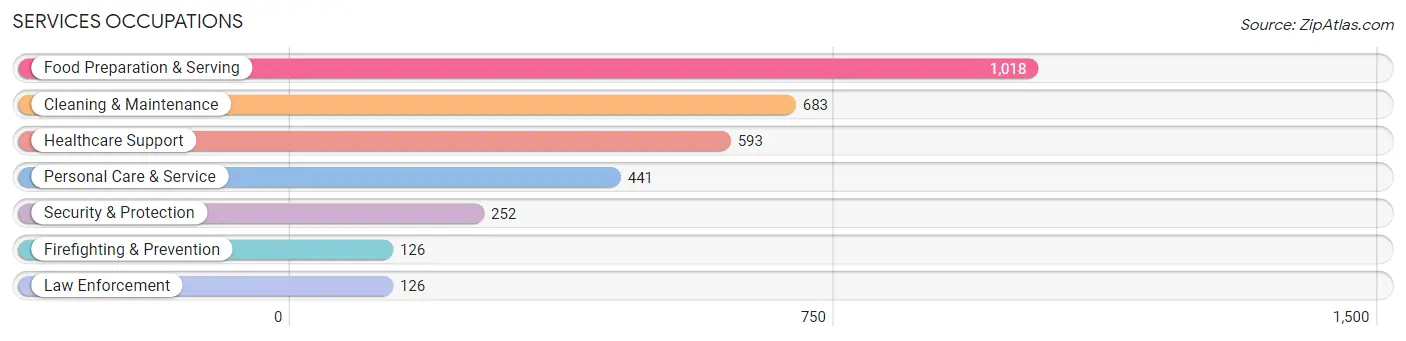
Services Occupations
The most common Services occupations in Barren County are Food Preparation & Serving (1,018 | 5.4%), Cleaning & Maintenance (683 | 3.6%), Healthcare Support (593 | 3.2%), Personal Care & Service (441 | 2.4%), and Security & Protection (252 | 1.3%).
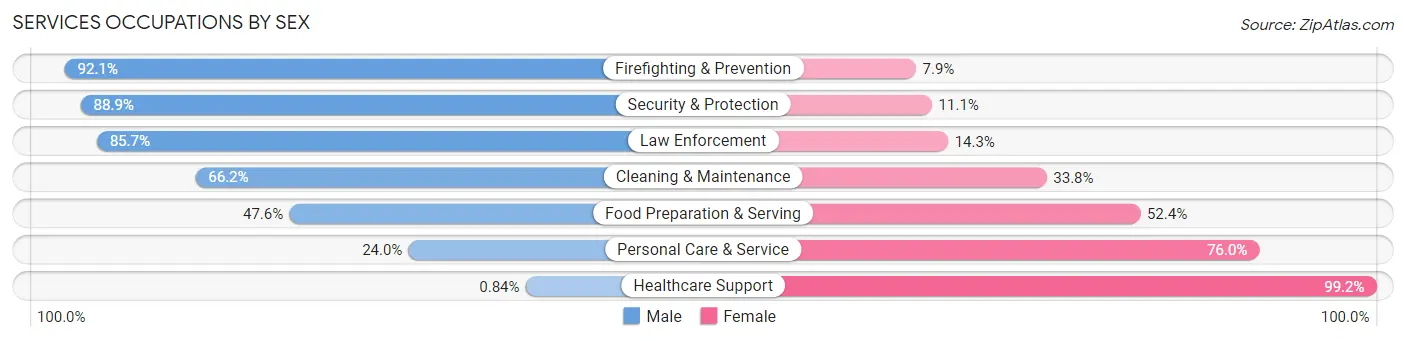
Services Occupations by Sex
Within the Services occupations in Barren County, the most male-oriented occupations are Firefighting & Prevention (92.1%), Security & Protection (88.9%), and Law Enforcement (85.7%), while the most female-oriented occupations are Healthcare Support (99.2%), Personal Care & Service (76.0%), and Food Preparation & Serving (52.4%).
| Occupation | Male | Female |
| Healthcare Support | 5 (0.8%) | 588 (99.2%) |
| Security & Protection | 224 (88.9%) | 28 (11.1%) |
| Firefighting & Prevention | 116 (92.1%) | 10 (7.9%) |
| Law Enforcement | 108 (85.7%) | 18 (14.3%) |
| Food Preparation & Serving | 485 (47.6%) | 533 (52.4%) |
| Cleaning & Maintenance | 452 (66.2%) | 231 (33.8%) |
| Personal Care & Service | 106 (24.0%) | 335 (76.0%) |
| Total (Category) | 1,272 (42.6%) | 1,715 (57.4%) |
| Total (Overall) | 9,883 (52.8%) | 8,819 (47.2%) |
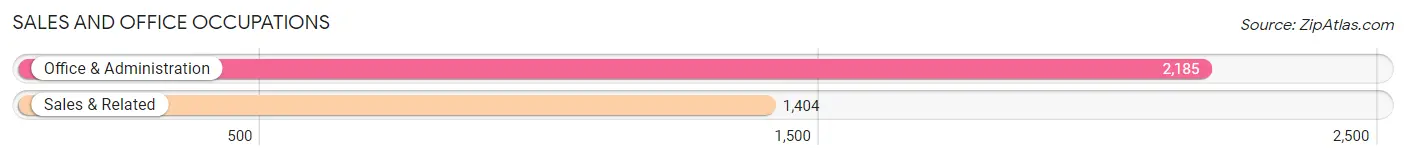
Sales and Office Occupations
The most common Sales and Office occupations in Barren County are Office & Administration (2,185 | 11.7%), and Sales & Related (1,404 | 7.5%).
Sales and Office Occupations by Sex
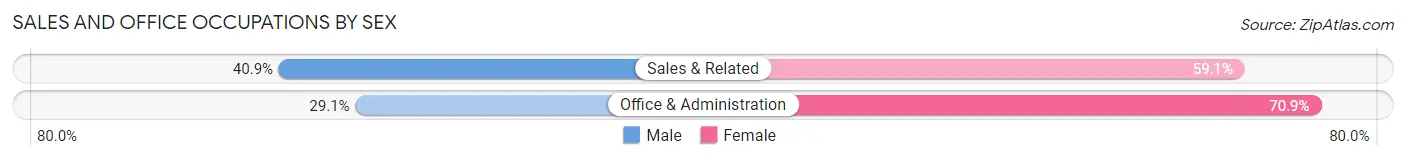
| Occupation | Male | Female |
| Sales & Related | 574 (40.9%) | 830 (59.1%) |
| Office & Administration | 636 (29.1%) | 1,549 (70.9%) |
| Total (Category) | 1,210 (33.7%) | 2,379 (66.3%) |
| Total (Overall) | 9,883 (52.8%) | 8,819 (47.2%) |
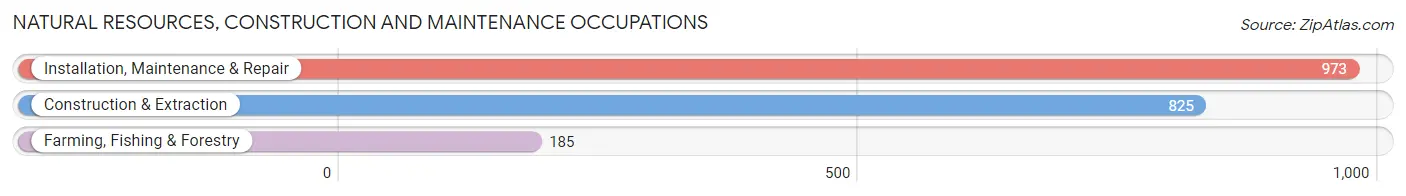
Natural Resources, Construction and Maintenance Occupations
The most common Natural Resources, Construction and Maintenance occupations in Barren County are Installation, Maintenance & Repair (973 | 5.2%), Construction & Extraction (825 | 4.4%), and Farming, Fishing & Forestry (185 | 1.0%).
Natural Resources, Construction and Maintenance Occupations by Sex
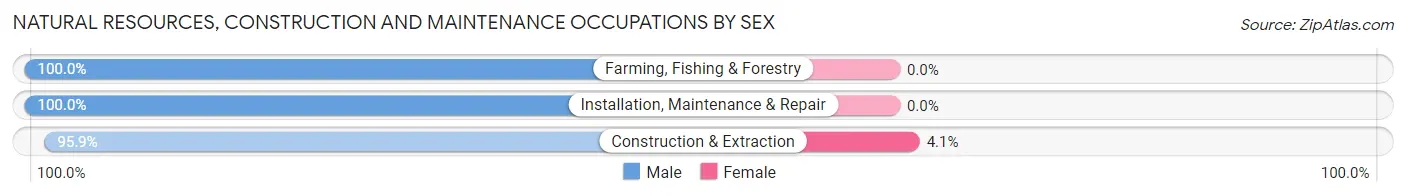
| Occupation | Male | Female |
| Farming, Fishing & Forestry | 185 (100.0%) | 0 (0.0%) |
| Construction & Extraction | 791 (95.9%) | 34 (4.1%) |
| Installation, Maintenance & Repair | 973 (100.0%) | 0 (0.0%) |
| Total (Category) | 1,949 (98.3%) | 34 (1.7%) |
| Total (Overall) | 9,883 (52.8%) | 8,819 (47.2%) |
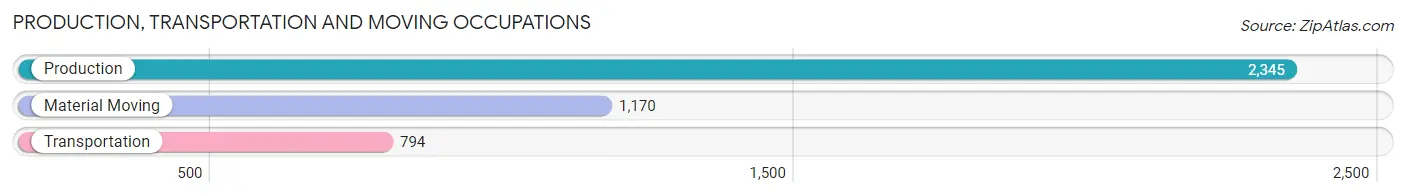
Production, Transportation and Moving Occupations
The most common Production, Transportation and Moving occupations in Barren County are Production (2,345 | 12.5%), Material Moving (1,170 | 6.3%), and Transportation (794 | 4.3%).
Production, Transportation and Moving Occupations by Sex
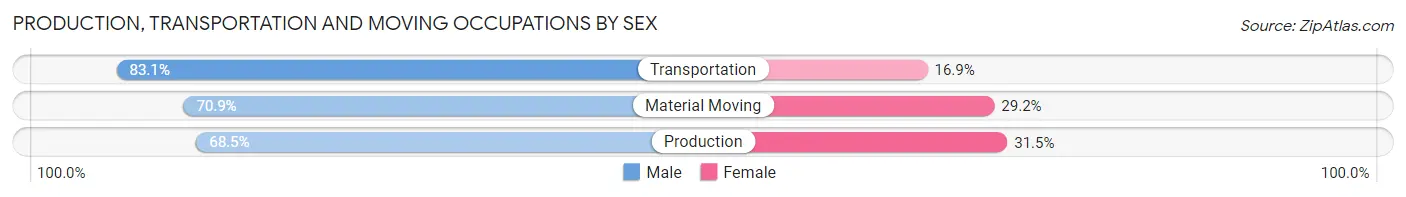
| Occupation | Male | Female |
| Production | 1,606 (68.5%) | 739 (31.5%) |
| Transportation | 660 (83.1%) | 134 (16.9%) |
| Material Moving | 829 (70.9%) | 341 (29.1%) |
| Total (Category) | 3,095 (71.8%) | 1,214 (28.2%) |
| Total (Overall) | 9,883 (52.8%) | 8,819 (47.2%) |
Employment Industries by Sex in Barren County
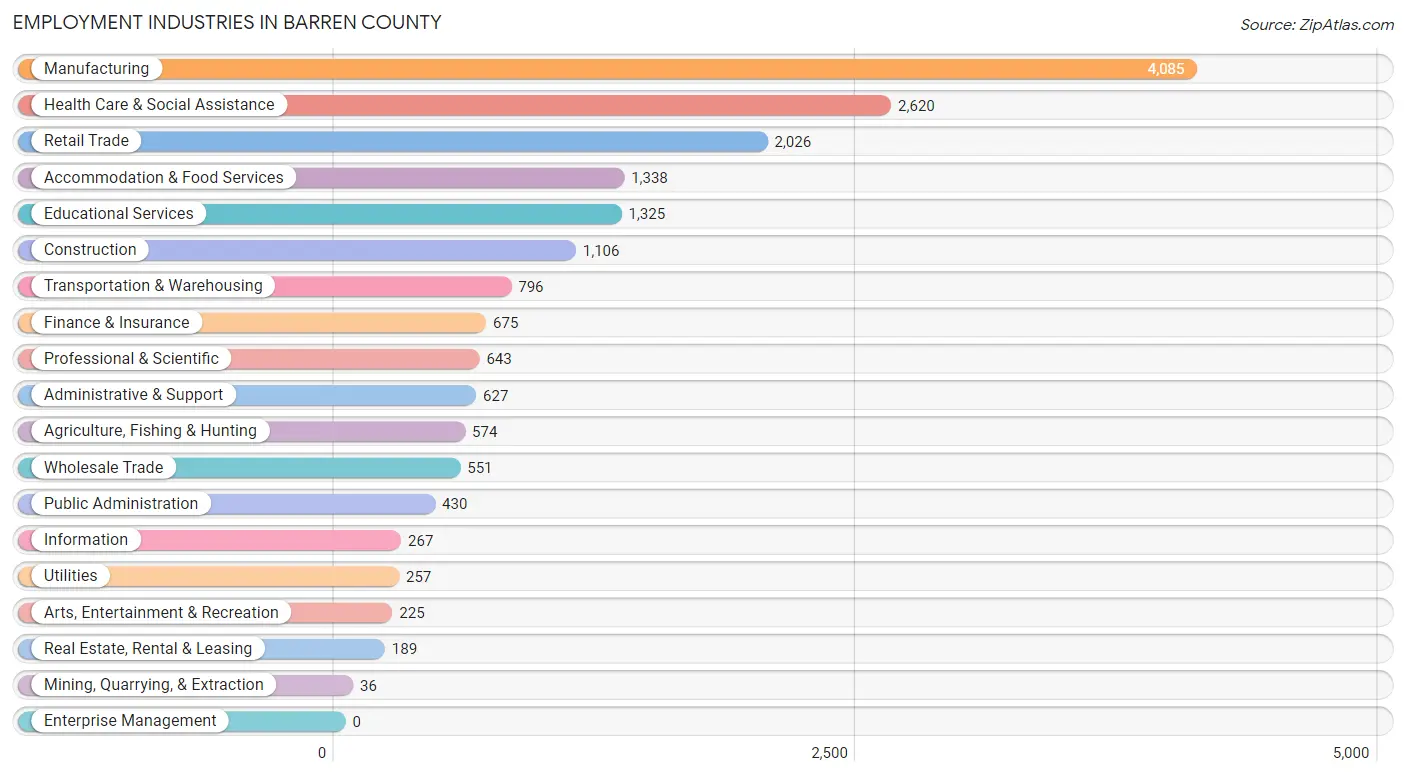
Employment Industries in Barren County
The major employment industries in Barren County include Manufacturing (4,085 | 21.8%), Health Care & Social Assistance (2,620 | 14.0%), Retail Trade (2,026 | 10.8%), Accommodation & Food Services (1,338 | 7.1%), and Educational Services (1,325 | 7.1%).
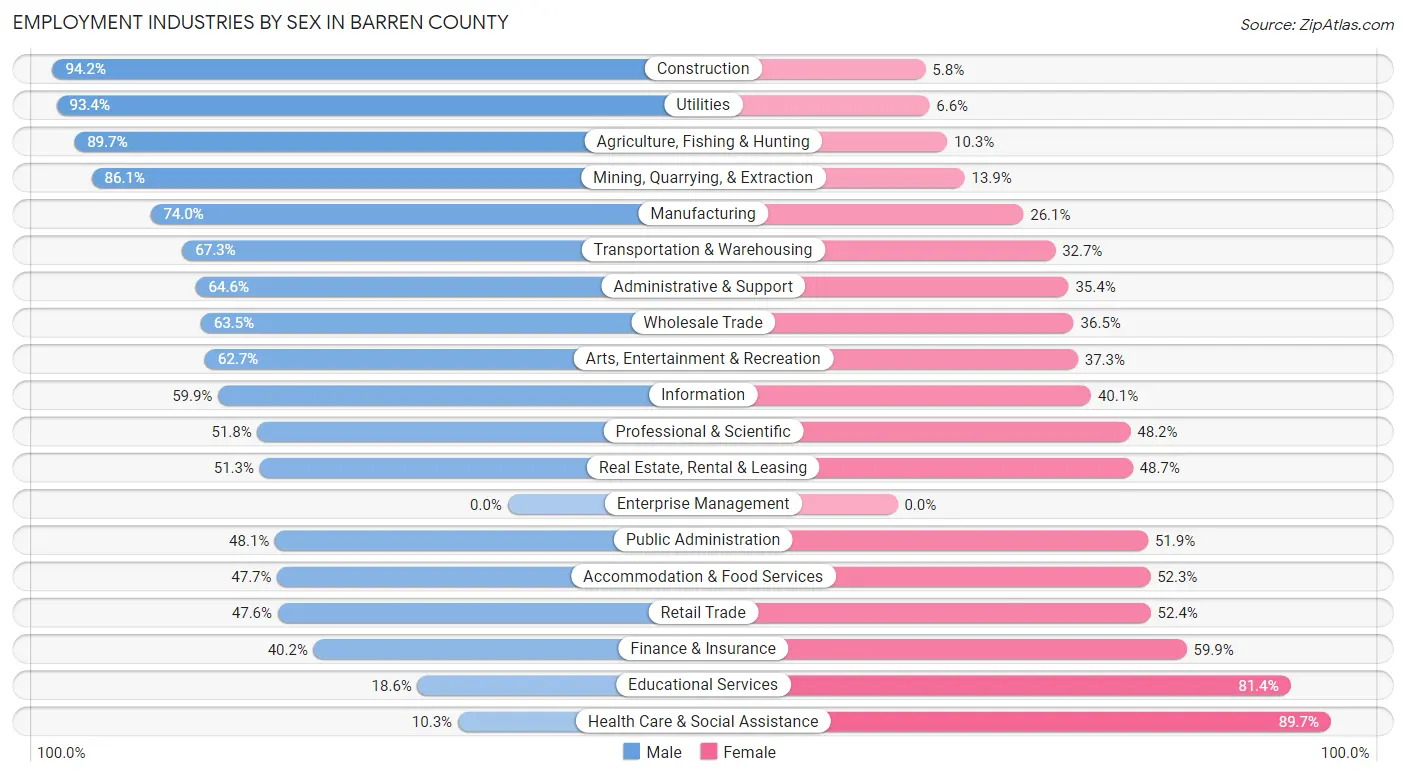
Employment Industries by Sex in Barren County
The Barren County industries that see more men than women are Construction (94.2%), Utilities (93.4%), and Agriculture, Fishing & Hunting (89.7%), whereas the industries that tend to have a higher number of women are Health Care & Social Assistance (89.7%), Educational Services (81.4%), and Finance & Insurance (59.9%).
| Industry | Male | Female |
| Agriculture, Fishing & Hunting | 515 (89.7%) | 59 (10.3%) |
| Mining, Quarrying, & Extraction | 31 (86.1%) | 5 (13.9%) |
| Construction | 1,042 (94.2%) | 64 (5.8%) |
| Manufacturing | 3,021 (74.0%) | 1,064 (26.1%) |
| Wholesale Trade | 350 (63.5%) | 201 (36.5%) |
| Retail Trade | 964 (47.6%) | 1,062 (52.4%) |
| Transportation & Warehousing | 536 (67.3%) | 260 (32.7%) |
| Utilities | 240 (93.4%) | 17 (6.6%) |
| Information | 160 (59.9%) | 107 (40.1%) |
| Finance & Insurance | 271 (40.2%) | 404 (59.9%) |
| Real Estate, Rental & Leasing | 97 (51.3%) | 92 (48.7%) |
| Professional & Scientific | 333 (51.8%) | 310 (48.2%) |
| Enterprise Management | 0 (0.0%) | 0 (0.0%) |
| Administrative & Support | 405 (64.6%) | 222 (35.4%) |
| Educational Services | 247 (18.6%) | 1,078 (81.4%) |
| Health Care & Social Assistance | 270 (10.3%) | 2,350 (89.7%) |
| Arts, Entertainment & Recreation | 141 (62.7%) | 84 (37.3%) |
| Accommodation & Food Services | 638 (47.7%) | 700 (52.3%) |
| Public Administration | 207 (48.1%) | 223 (51.9%) |
| Total | 9,883 (52.8%) | 8,819 (47.2%) |
Education in Barren County
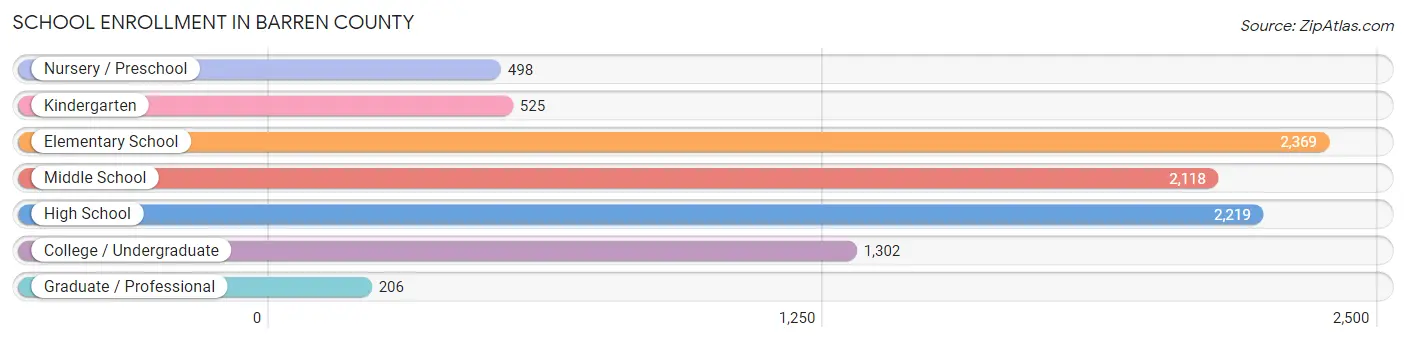
School Enrollment in Barren County
The most common levels of schooling among the 9,237 students in Barren County are elementary school (2,369 | 25.7%), high school (2,219 | 24.0%), and middle school (2,118 | 22.9%).
| School Level | # Students | % Students |
| Nursery / Preschool | 498 | 5.4% |
| Kindergarten | 525 | 5.7% |
| Elementary School | 2,369 | 25.7% |
| Middle School | 2,118 | 22.9% |
| High School | 2,219 | 24.0% |
| College / Undergraduate | 1,302 | 14.1% |
| Graduate / Professional | 206 | 2.2% |
| Total | 9,237 | 100.0% |
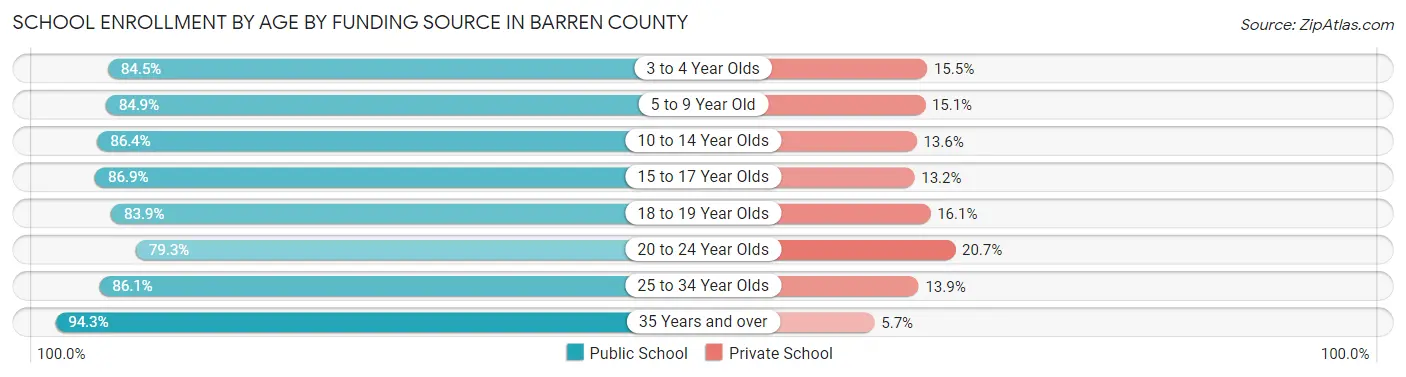
School Enrollment by Age by Funding Source in Barren County
Out of a total of 9,237 students who are enrolled in schools in Barren County, 1,312 (14.2%) attend a private institution, while the remaining 7,925 (85.8%) are enrolled in public schools. The age group of 20 to 24 year olds has the highest likelihood of being enrolled in private schools, with 78 (20.7% in the age bracket) enrolled. Conversely, the age group of 35 years and over has the lowest likelihood of being enrolled in a private school, with 313 (94.3% in the age bracket) attending a public institution.
| Age Bracket | Public School | Private School |
| 3 to 4 Year Olds | 332 (84.5%) | 61 (15.5%) |
| 5 to 9 Year Old | 2,174 (84.9%) | 388 (15.1%) |
| 10 to 14 Year Olds | 2,308 (86.4%) | 362 (13.6%) |
| 15 to 17 Year Olds | 1,506 (86.9%) | 228 (13.2%) |
| 18 to 19 Year Olds | 458 (83.9%) | 88 (16.1%) |
| 20 to 24 Year Olds | 298 (79.3%) | 78 (20.7%) |
| 25 to 34 Year Olds | 537 (86.1%) | 87 (13.9%) |
| 35 Years and over | 313 (94.3%) | 19 (5.7%) |
| Total | 7,925 (85.8%) | 1,312 (14.2%) |
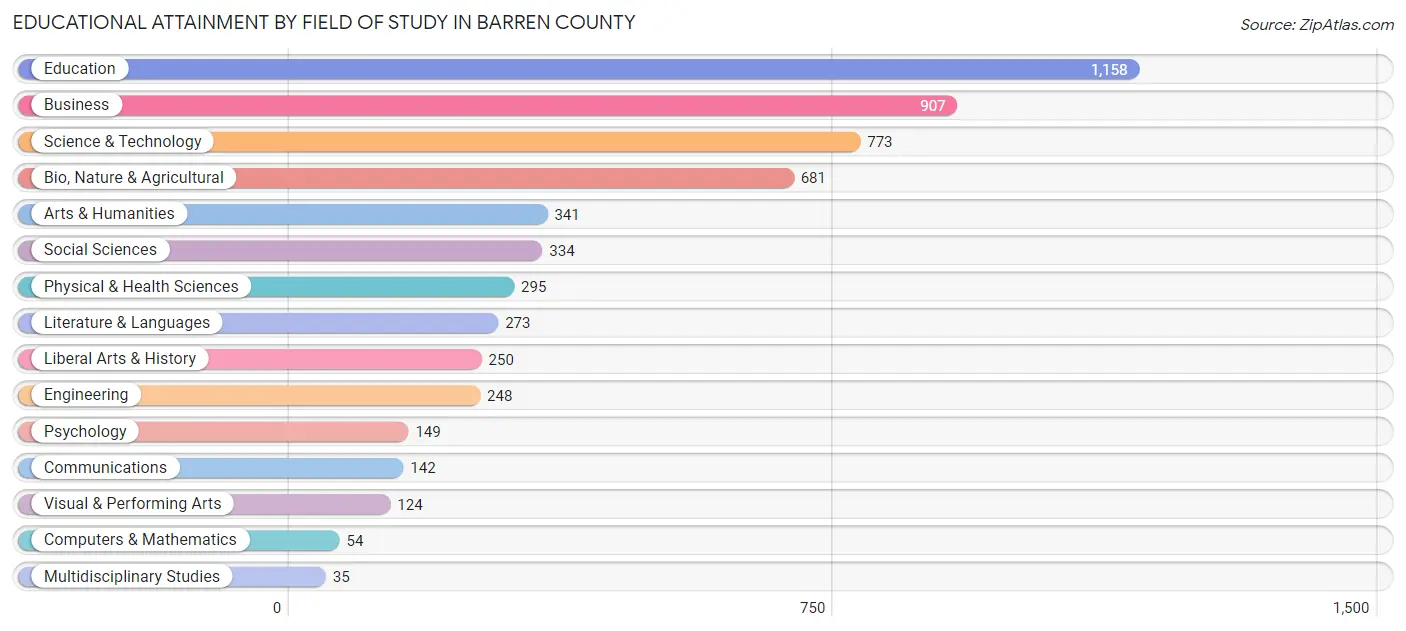
Educational Attainment by Field of Study in Barren County
Education (1,158 | 20.1%), business (907 | 15.7%), science & technology (773 | 13.4%), bio, nature & agricultural (681 | 11.8%), and arts & humanities (341 | 5.9%) are the most common fields of study among 5,764 individuals in Barren County who have obtained a bachelor's degree or higher.
| Field of Study | # Graduates | % Graduates |
| Computers & Mathematics | 54 | 0.9% |
| Bio, Nature & Agricultural | 681 | 11.8% |
| Physical & Health Sciences | 295 | 5.1% |
| Psychology | 149 | 2.6% |
| Social Sciences | 334 | 5.8% |
| Engineering | 248 | 4.3% |
| Multidisciplinary Studies | 35 | 0.6% |
| Science & Technology | 773 | 13.4% |
| Business | 907 | 15.7% |
| Education | 1,158 | 20.1% |
| Literature & Languages | 273 | 4.7% |
| Liberal Arts & History | 250 | 4.3% |
| Visual & Performing Arts | 124 | 2.1% |
| Communications | 142 | 2.5% |
| Arts & Humanities | 341 | 5.9% |
| Total | 5,764 | 100.0% |
Transportation & Commute in Barren County
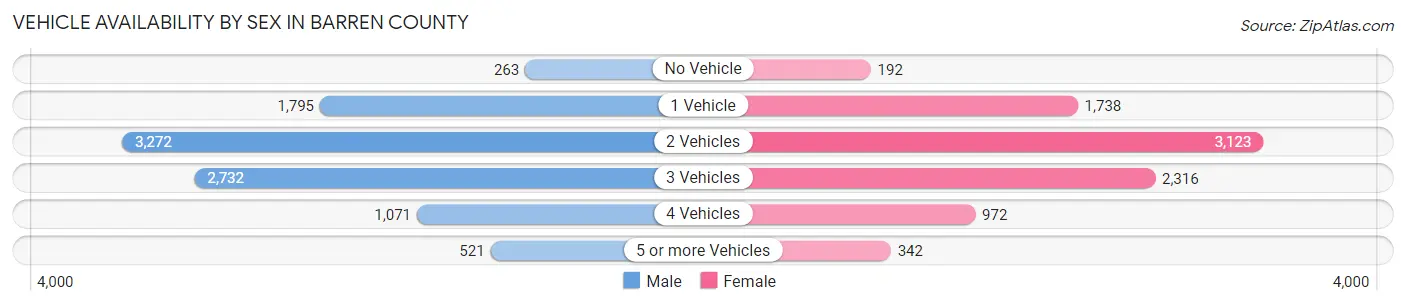
Vehicle Availability by Sex in Barren County
The most prevalent vehicle ownership categories in Barren County are males with 2 vehicles (3,272, accounting for 33.9%) and females with 2 vehicles (3,123, making up 37.7%).
| Vehicles Available | Male | Female |
| No Vehicle | 263 (2.7%) | 192 (2.2%) |
| 1 Vehicle | 1,795 (18.6%) | 1,738 (20.0%) |
| 2 Vehicles | 3,272 (33.9%) | 3,123 (36.0%) |
| 3 Vehicles | 2,732 (28.3%) | 2,316 (26.7%) |
| 4 Vehicles | 1,071 (11.1%) | 972 (11.2%) |
| 5 or more Vehicles | 521 (5.4%) | 342 (3.9%) |
| Total | 9,654 (100.0%) | 8,683 (100.0%) |
Commute Time in Barren County
The most frequently occuring commute durations in Barren County are 10 to 14 minutes (3,453 commuters, 20.1%), 5 to 9 minutes (2,747 commuters, 16.0%), and 15 to 19 minutes (2,566 commuters, 14.9%).
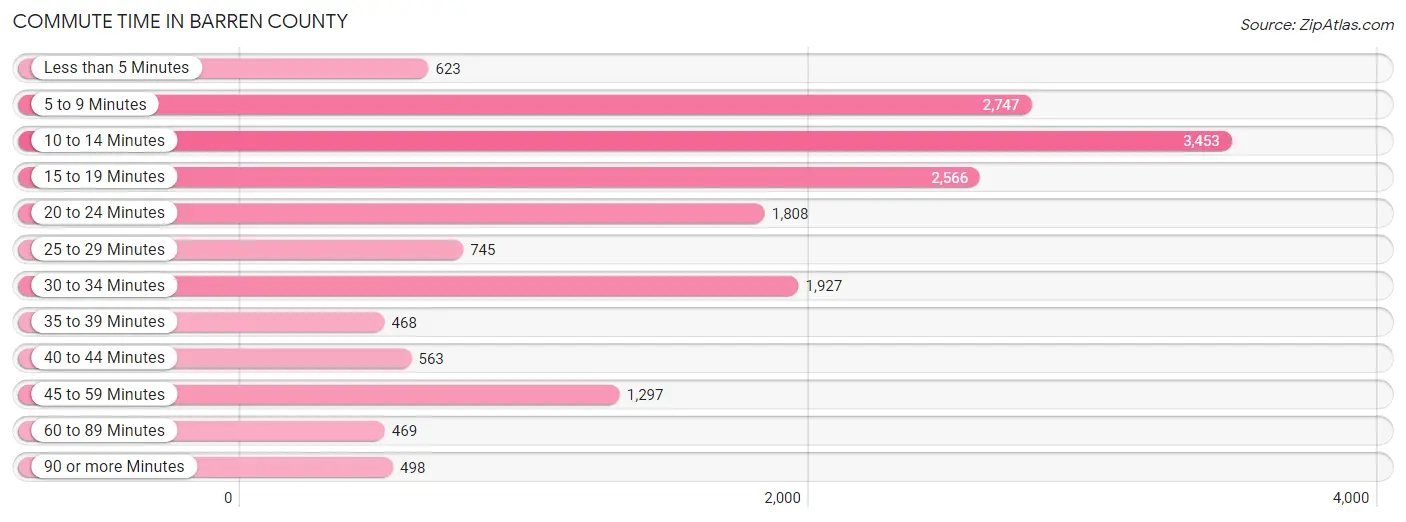
| Commute Time | # Commuters | % Commuters |
| Less than 5 Minutes | 623 | 3.6% |
| 5 to 9 Minutes | 2,747 | 16.0% |
| 10 to 14 Minutes | 3,453 | 20.1% |
| 15 to 19 Minutes | 2,566 | 14.9% |
| 20 to 24 Minutes | 1,808 | 10.5% |
| 25 to 29 Minutes | 745 | 4.3% |
| 30 to 34 Minutes | 1,927 | 11.2% |
| 35 to 39 Minutes | 468 | 2.7% |
| 40 to 44 Minutes | 563 | 3.3% |
| 45 to 59 Minutes | 1,297 | 7.6% |
| 60 to 89 Minutes | 469 | 2.7% |
| 90 or more Minutes | 498 | 2.9% |
Commute Time by Sex in Barren County
The most common commute times in Barren County are 10 to 14 minutes (1,663 commuters, 18.7%) for males and 10 to 14 minutes (1,790 commuters, 21.7%) for females.
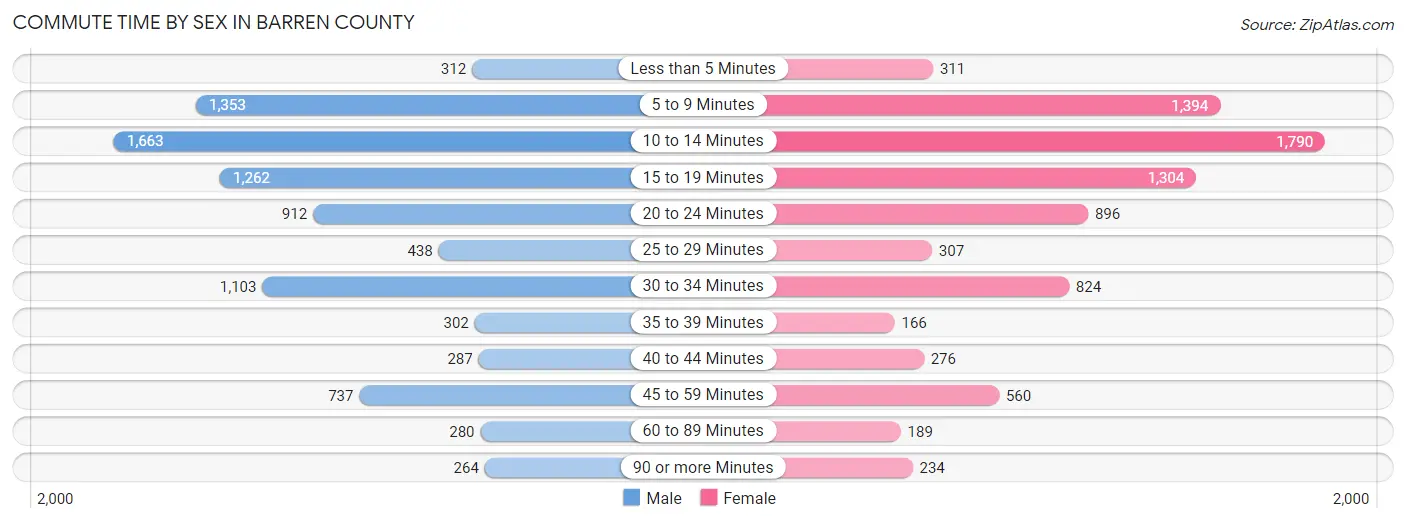
| Commute Time | Male | Female |
| Less than 5 Minutes | 312 (3.5%) | 311 (3.8%) |
| 5 to 9 Minutes | 1,353 (15.2%) | 1,394 (16.9%) |
| 10 to 14 Minutes | 1,663 (18.7%) | 1,790 (21.7%) |
| 15 to 19 Minutes | 1,262 (14.2%) | 1,304 (15.8%) |
| 20 to 24 Minutes | 912 (10.2%) | 896 (10.9%) |
| 25 to 29 Minutes | 438 (4.9%) | 307 (3.7%) |
| 30 to 34 Minutes | 1,103 (12.4%) | 824 (10.0%) |
| 35 to 39 Minutes | 302 (3.4%) | 166 (2.0%) |
| 40 to 44 Minutes | 287 (3.2%) | 276 (3.4%) |
| 45 to 59 Minutes | 737 (8.3%) | 560 (6.8%) |
| 60 to 89 Minutes | 280 (3.1%) | 189 (2.3%) |
| 90 or more Minutes | 264 (3.0%) | 234 (2.8%) |
Time of Departure to Work by Sex in Barren County
The most frequent times of departure to work in Barren County are 7:00 AM to 7:29 AM (1,273, 14.3%) for males and 7:00 AM to 7:29 AM (1,398, 16.9%) for females.
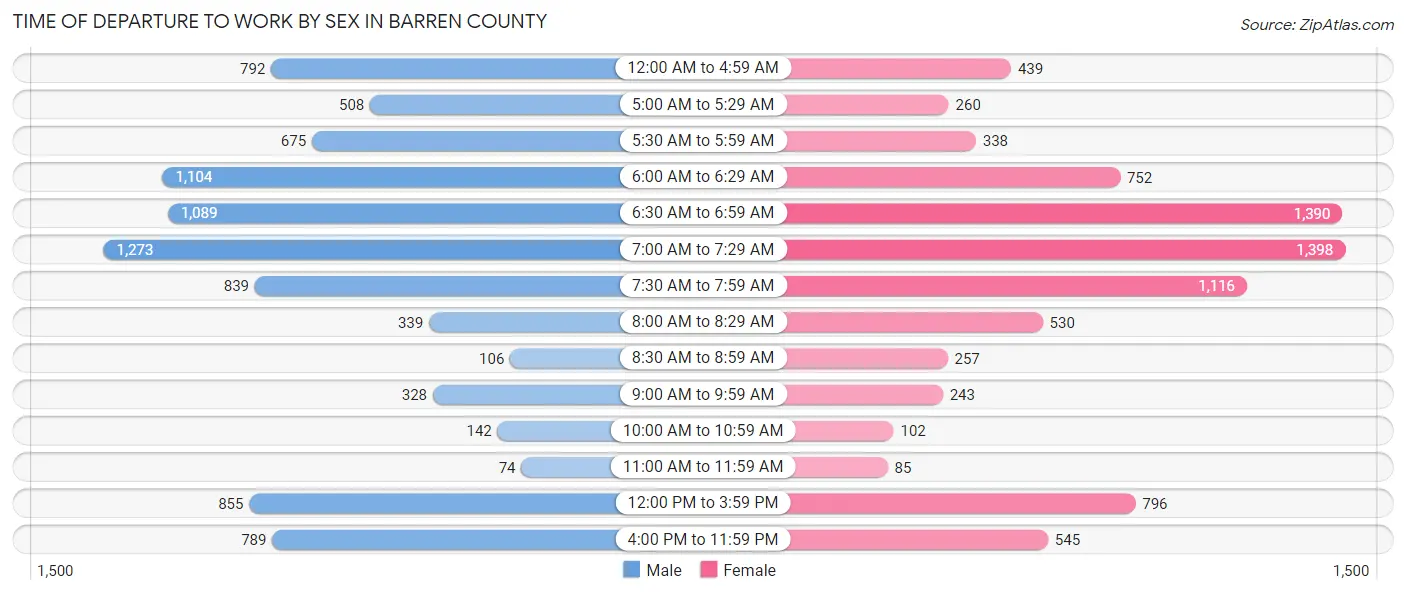
| Time of Departure | Male | Female |
| 12:00 AM to 4:59 AM | 792 (8.9%) | 439 (5.3%) |
| 5:00 AM to 5:29 AM | 508 (5.7%) | 260 (3.2%) |
| 5:30 AM to 5:59 AM | 675 (7.6%) | 338 (4.1%) |
| 6:00 AM to 6:29 AM | 1,104 (12.4%) | 752 (9.1%) |
| 6:30 AM to 6:59 AM | 1,089 (12.2%) | 1,390 (16.9%) |
| 7:00 AM to 7:29 AM | 1,273 (14.3%) | 1,398 (16.9%) |
| 7:30 AM to 7:59 AM | 839 (9.4%) | 1,116 (13.5%) |
| 8:00 AM to 8:29 AM | 339 (3.8%) | 530 (6.4%) |
| 8:30 AM to 8:59 AM | 106 (1.2%) | 257 (3.1%) |
| 9:00 AM to 9:59 AM | 328 (3.7%) | 243 (2.9%) |
| 10:00 AM to 10:59 AM | 142 (1.6%) | 102 (1.2%) |
| 11:00 AM to 11:59 AM | 74 (0.8%) | 85 (1.0%) |
| 12:00 PM to 3:59 PM | 855 (9.6%) | 796 (9.7%) |
| 4:00 PM to 11:59 PM | 789 (8.8%) | 545 (6.6%) |
| Total | 8,913 (100.0%) | 8,251 (100.0%) |
Housing Occupancy in Barren County
Occupancy by Ownership in Barren County
Of the total 17,592 dwellings in Barren County, owner-occupied units account for 11,654 (66.2%), while renter-occupied units make up 5,938 (33.8%).
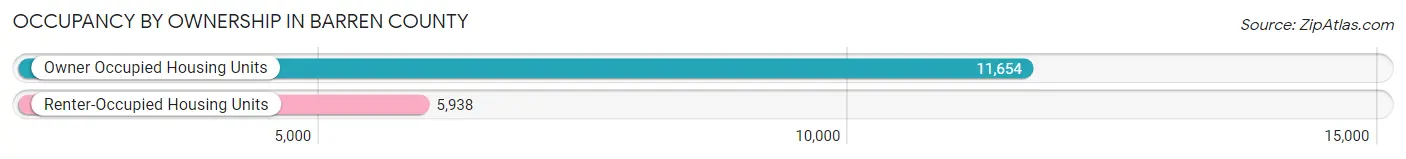
| Occupancy | # Housing Units | % Housing Units |
| Owner Occupied Housing Units | 11,654 | 66.2% |
| Renter-Occupied Housing Units | 5,938 | 33.8% |
| Total Occupied Housing Units | 17,592 | 100.0% |
Occupancy by Household Size in Barren County
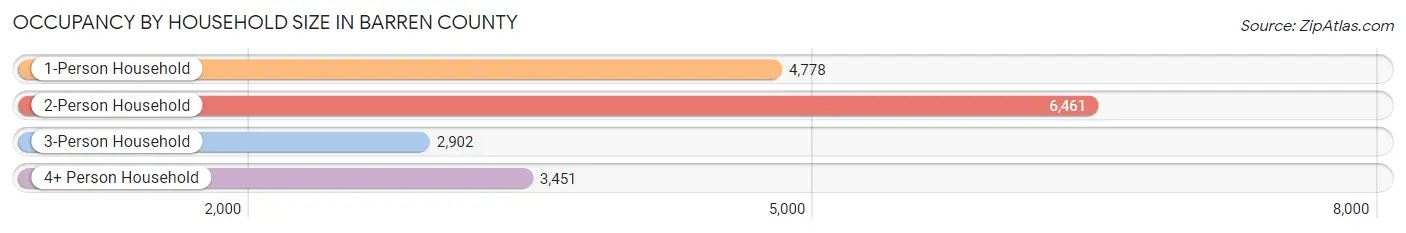
| Household Size | # Housing Units | % Housing Units |
| 1-Person Household | 4,778 | 27.2% |
| 2-Person Household | 6,461 | 36.7% |
| 3-Person Household | 2,902 | 16.5% |
| 4+ Person Household | 3,451 | 19.6% |
| Total Housing Units | 17,592 | 100.0% |
Occupancy by Ownership by Household Size in Barren County
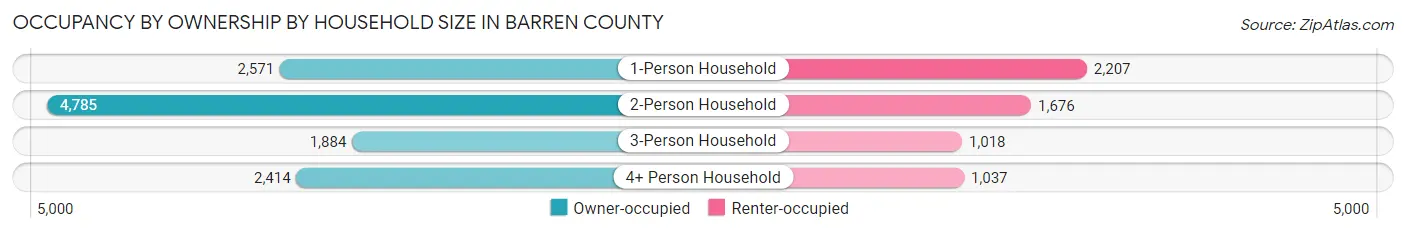
| Household Size | Owner-occupied | Renter-occupied |
| 1-Person Household | 2,571 (53.8%) | 2,207 (46.2%) |
| 2-Person Household | 4,785 (74.1%) | 1,676 (25.9%) |
| 3-Person Household | 1,884 (64.9%) | 1,018 (35.1%) |
| 4+ Person Household | 2,414 (70.0%) | 1,037 (30.0%) |
| Total Housing Units | 11,654 (66.2%) | 5,938 (33.8%) |
Occupancy by Educational Attainment in Barren County
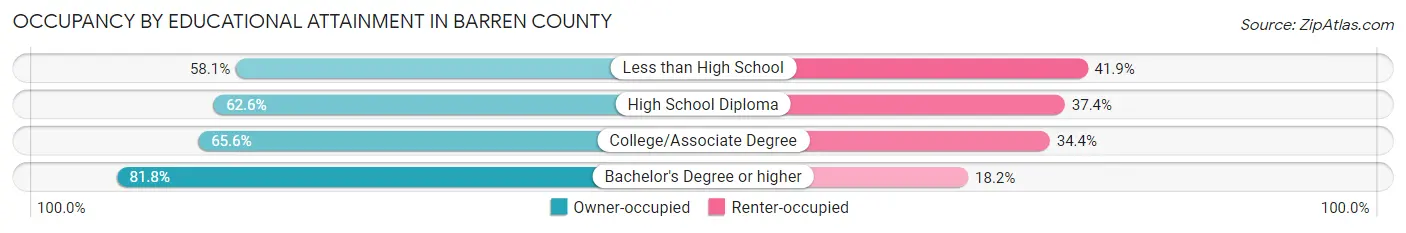
| Household Size | Owner-occupied | Renter-occupied |
| Less than High School | 1,353 (58.1%) | 976 (41.9%) |
| High School Diploma | 4,635 (62.6%) | 2,770 (37.4%) |
| College/Associate Degree | 3,074 (65.6%) | 1,614 (34.4%) |
| Bachelor's Degree or higher | 2,592 (81.8%) | 578 (18.2%) |
Occupancy by Age of Householder in Barren County
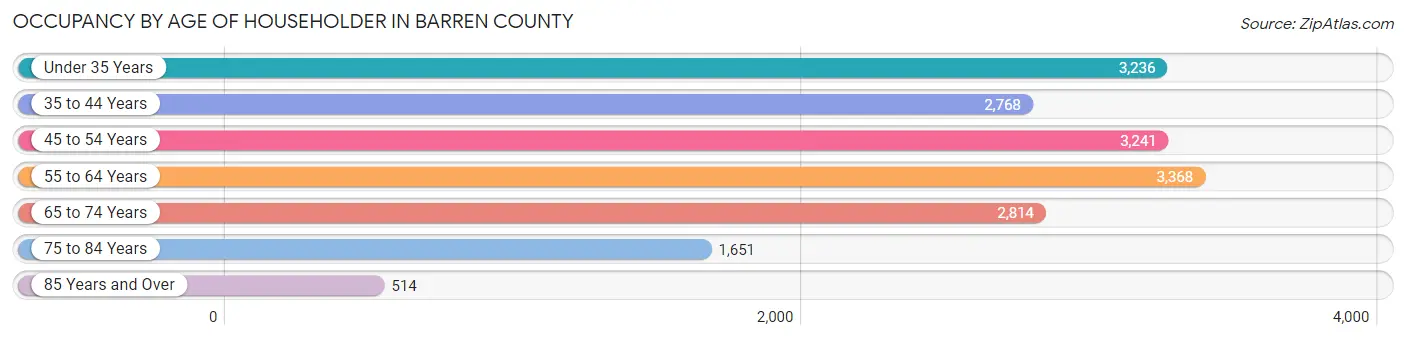
| Age Bracket | # Households | % Households |
| Under 35 Years | 3,236 | 18.4% |
| 35 to 44 Years | 2,768 | 15.7% |
| 45 to 54 Years | 3,241 | 18.4% |
| 55 to 64 Years | 3,368 | 19.2% |
| 65 to 74 Years | 2,814 | 16.0% |
| 75 to 84 Years | 1,651 | 9.4% |
| 85 Years and Over | 514 | 2.9% |
| Total | 17,592 | 100.0% |
Housing Finances in Barren County
Median Income by Occupancy in Barren County
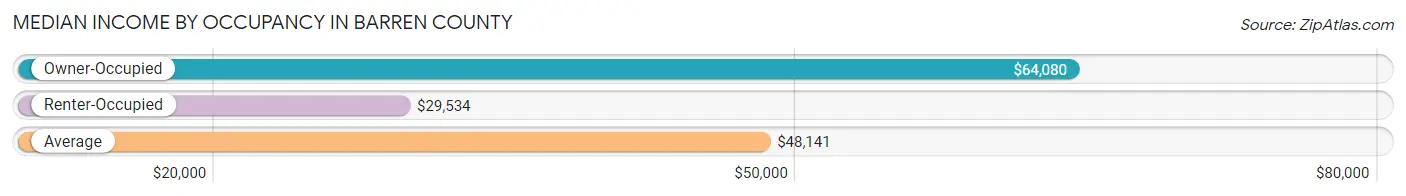
| Occupancy Type | # Households | Median Income |
| Owner-Occupied | 11,654 (66.2%) | $64,080 |
| Renter-Occupied | 5,938 (33.8%) | $29,534 |
| Average | 17,592 (100.0%) | $48,141 |
Occupancy by Householder Income Bracket in Barren County
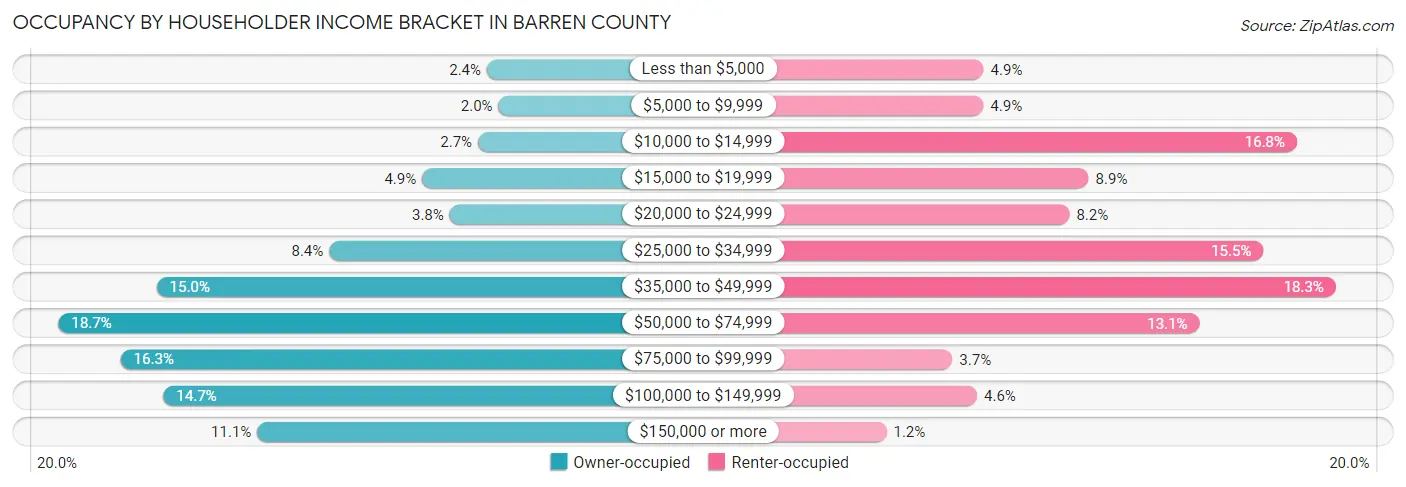
| Income Bracket | Owner-occupied | Renter-occupied |
| Less than $5,000 | 278 (2.4%) | 290 (4.9%) |
| $5,000 to $9,999 | 227 (1.9%) | 289 (4.9%) |
| $10,000 to $14,999 | 318 (2.7%) | 998 (16.8%) |
| $15,000 to $19,999 | 566 (4.9%) | 527 (8.9%) |
| $20,000 to $24,999 | 444 (3.8%) | 484 (8.2%) |
| $25,000 to $34,999 | 979 (8.4%) | 922 (15.5%) |
| $35,000 to $49,999 | 1,745 (15.0%) | 1,086 (18.3%) |
| $50,000 to $74,999 | 2,181 (18.7%) | 778 (13.1%) |
| $75,000 to $99,999 | 1,904 (16.3%) | 219 (3.7%) |
| $100,000 to $149,999 | 1,714 (14.7%) | 275 (4.6%) |
| $150,000 or more | 1,298 (11.1%) | 70 (1.2%) |
| Total | 11,654 (100.0%) | 5,938 (100.0%) |
Monthly Housing Cost Tiers in Barren County
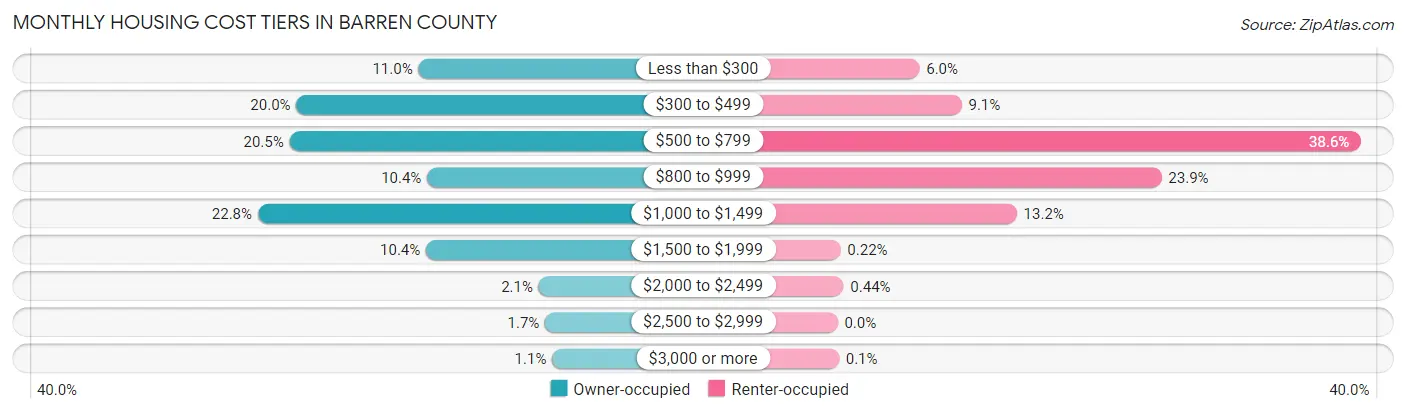
| Monthly Cost | Owner-occupied | Renter-occupied |
| Less than $300 | 1,281 (11.0%) | 358 (6.0%) |
| $300 to $499 | 2,329 (20.0%) | 543 (9.1%) |
| $500 to $799 | 2,388 (20.5%) | 2,290 (38.6%) |
| $800 to $999 | 1,206 (10.3%) | 1,417 (23.9%) |
| $1,000 to $1,499 | 2,659 (22.8%) | 784 (13.2%) |
| $1,500 to $1,999 | 1,216 (10.4%) | 13 (0.2%) |
| $2,000 to $2,499 | 248 (2.1%) | 26 (0.4%) |
| $2,500 to $2,999 | 194 (1.7%) | 0 (0.0%) |
| $3,000 or more | 133 (1.1%) | 6 (0.1%) |
| Total | 11,654 (100.0%) | 5,938 (100.0%) |
Physical Housing Characteristics in Barren County
Housing Structures in Barren County
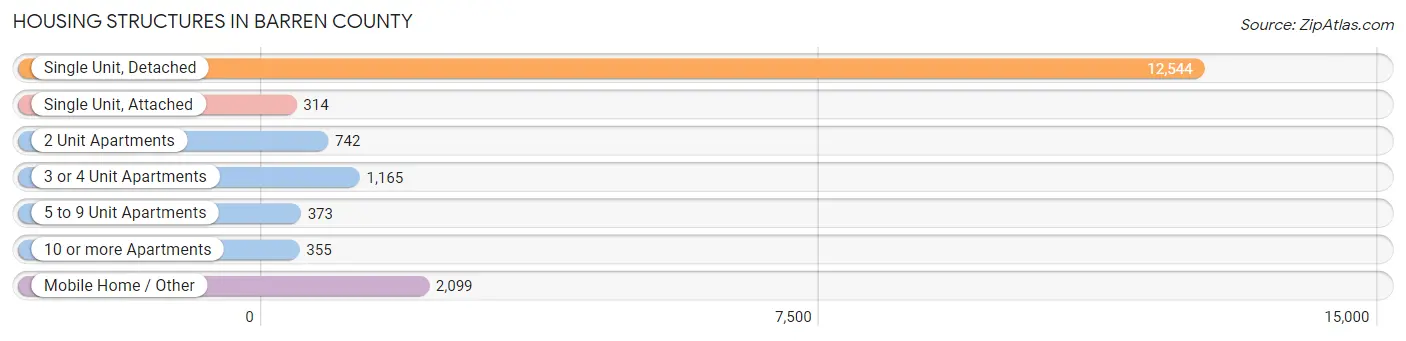
| Structure Type | # Housing Units | % Housing Units |
| Single Unit, Detached | 12,544 | 71.3% |
| Single Unit, Attached | 314 | 1.8% |
| 2 Unit Apartments | 742 | 4.2% |
| 3 or 4 Unit Apartments | 1,165 | 6.6% |
| 5 to 9 Unit Apartments | 373 | 2.1% |
| 10 or more Apartments | 355 | 2.0% |
| Mobile Home / Other | 2,099 | 11.9% |
| Total | 17,592 | 100.0% |
Housing Structures by Occupancy in Barren County
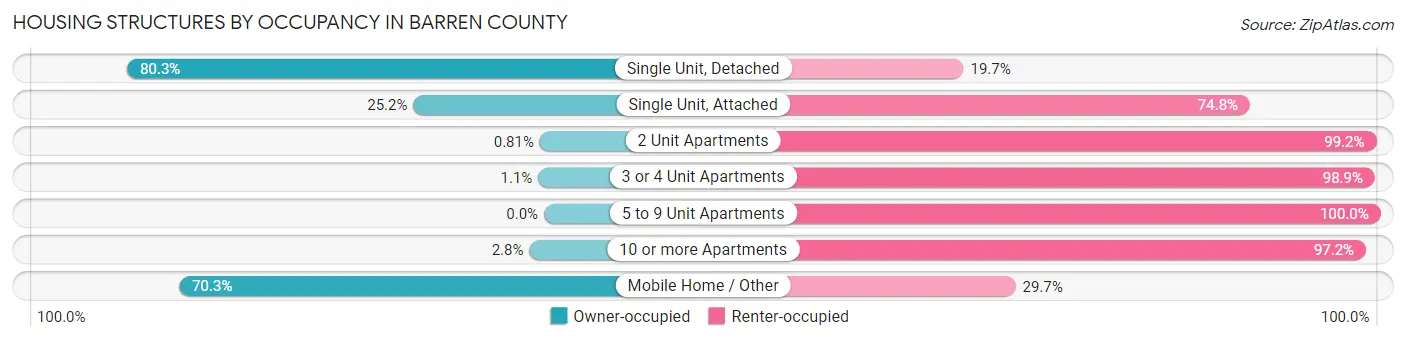
| Structure Type | Owner-occupied | Renter-occupied |
| Single Unit, Detached | 10,071 (80.3%) | 2,473 (19.7%) |
| Single Unit, Attached | 79 (25.2%) | 235 (74.8%) |
| 2 Unit Apartments | 6 (0.8%) | 736 (99.2%) |
| 3 or 4 Unit Apartments | 13 (1.1%) | 1,152 (98.9%) |
| 5 to 9 Unit Apartments | 0 (0.0%) | 373 (100.0%) |
| 10 or more Apartments | 10 (2.8%) | 345 (97.2%) |
| Mobile Home / Other | 1,475 (70.3%) | 624 (29.7%) |
| Total | 11,654 (66.2%) | 5,938 (33.8%) |
Housing Structures by Number of Rooms in Barren County
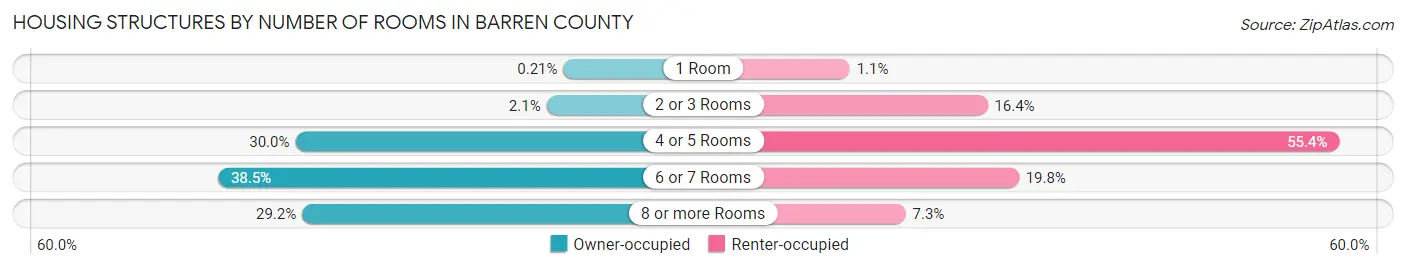
| Number of Rooms | Owner-occupied | Renter-occupied |
| 1 Room | 24 (0.2%) | 65 (1.1%) |
| 2 or 3 Rooms | 242 (2.1%) | 972 (16.4%) |
| 4 or 5 Rooms | 3,492 (30.0%) | 3,290 (55.4%) |
| 6 or 7 Rooms | 4,492 (38.5%) | 1,178 (19.8%) |
| 8 or more Rooms | 3,404 (29.2%) | 433 (7.3%) |
| Total | 11,654 (100.0%) | 5,938 (100.0%) |
Housing Structure by Heating Type in Barren County
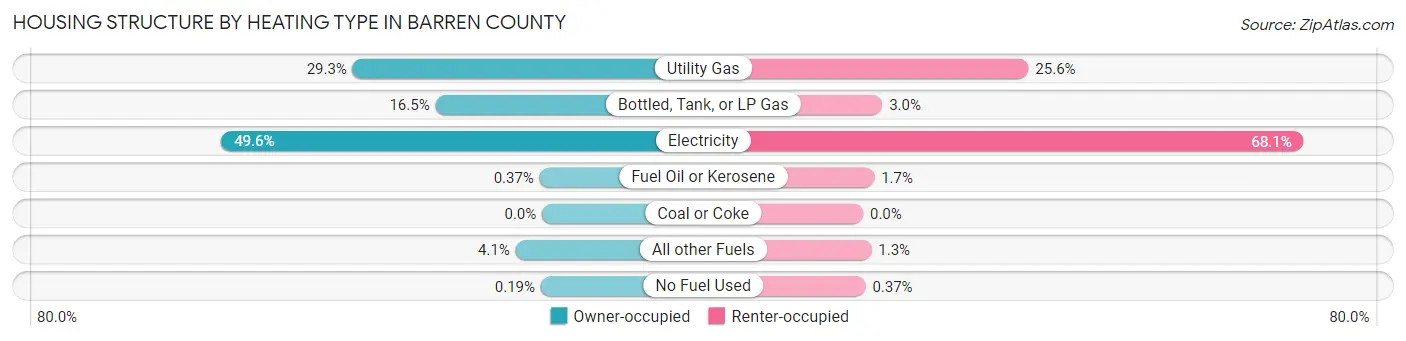
| Heating Type | Owner-occupied | Renter-occupied |
| Utility Gas | 3,412 (29.3%) | 1,518 (25.6%) |
| Bottled, Tank, or LP Gas | 1,921 (16.5%) | 176 (3.0%) |
| Electricity | 5,780 (49.6%) | 4,043 (68.1%) |
| Fuel Oil or Kerosene | 43 (0.4%) | 103 (1.7%) |
| Coal or Coke | 0 (0.0%) | 0 (0.0%) |
| All other Fuels | 476 (4.1%) | 76 (1.3%) |
| No Fuel Used | 22 (0.2%) | 22 (0.4%) |
| Total | 11,654 (100.0%) | 5,938 (100.0%) |
Household Vehicle Usage in Barren County
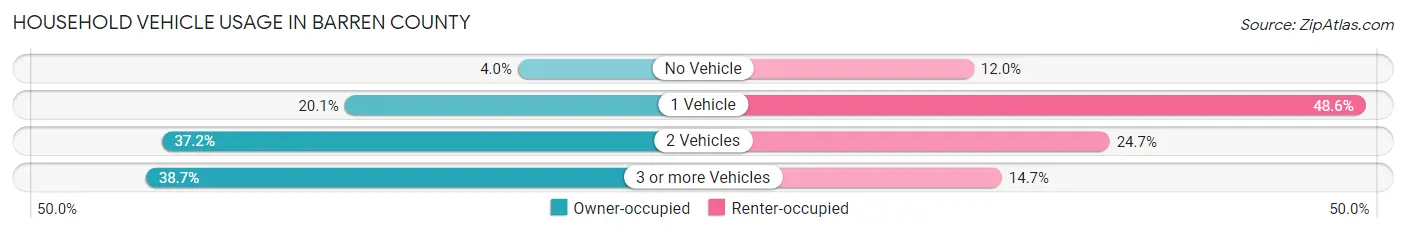
| Vehicles per Household | Owner-occupied | Renter-occupied |
| No Vehicle | 461 (4.0%) | 715 (12.0%) |
| 1 Vehicle | 2,347 (20.1%) | 2,885 (48.6%) |
| 2 Vehicles | 4,338 (37.2%) | 1,468 (24.7%) |
| 3 or more Vehicles | 4,508 (38.7%) | 870 (14.6%) |
| Total | 11,654 (100.0%) | 5,938 (100.0%) |
Real Estate & Mortgages in Barren County
Real Estate and Mortgage Overview in Barren County
| Characteristic | Without Mortgage | With Mortgage |
| Housing Units | 5,261 | 6,393 |
| Median Property Value | $143,400 | $165,400 |
| Median Household Income | $46,383 | $889 |
| Monthly Housing Costs | $407 | $133 |
| Real Estate Taxes | $972 | $72 |
Property Value by Mortgage Status in Barren County
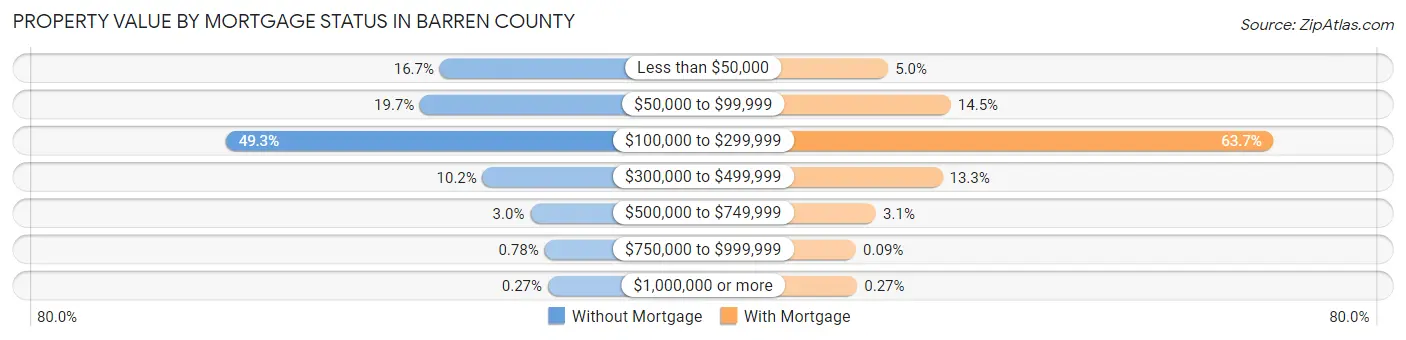
| Property Value | Without Mortgage | With Mortgage |
| Less than $50,000 | 880 (16.7%) | 319 (5.0%) |
| $50,000 to $99,999 | 1,038 (19.7%) | 929 (14.5%) |
| $100,000 to $299,999 | 2,596 (49.3%) | 4,073 (63.7%) |
| $300,000 to $499,999 | 537 (10.2%) | 848 (13.3%) |
| $500,000 to $749,999 | 155 (2.9%) | 201 (3.1%) |
| $750,000 to $999,999 | 41 (0.8%) | 6 (0.1%) |
| $1,000,000 or more | 14 (0.3%) | 17 (0.3%) |
| Total | 5,261 (100.0%) | 6,393 (100.0%) |
Household Income by Mortgage Status in Barren County
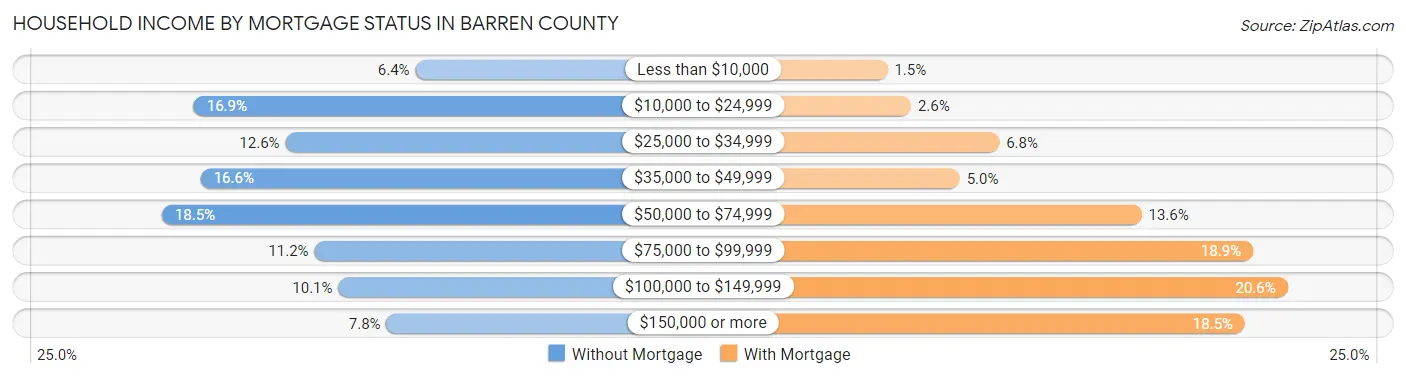
| Household Income | Without Mortgage | With Mortgage |
| Less than $10,000 | 336 (6.4%) | 97 (1.5%) |
| $10,000 to $24,999 | 891 (16.9%) | 169 (2.6%) |
| $25,000 to $34,999 | 662 (12.6%) | 437 (6.8%) |
| $35,000 to $49,999 | 874 (16.6%) | 317 (5.0%) |
| $50,000 to $74,999 | 971 (18.5%) | 871 (13.6%) |
| $75,000 to $99,999 | 589 (11.2%) | 1,210 (18.9%) |
| $100,000 to $149,999 | 529 (10.1%) | 1,315 (20.6%) |
| $150,000 or more | 409 (7.8%) | 1,185 (18.5%) |
| Total | 5,261 (100.0%) | 6,393 (100.0%) |
Property Value to Household Income Ratio in Barren County
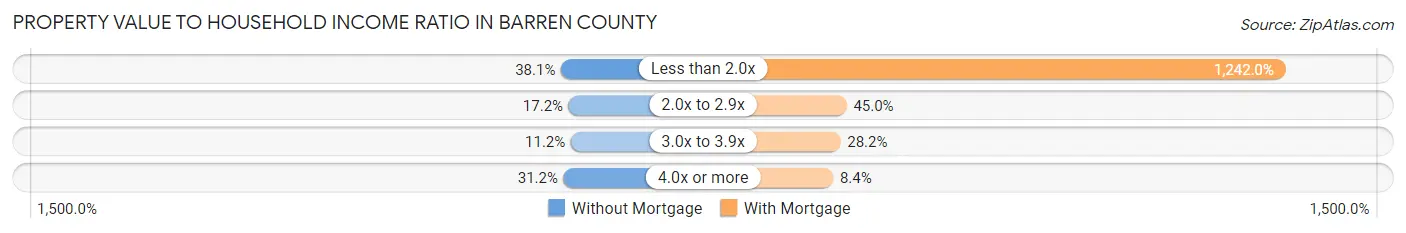
| Value-to-Income Ratio | Without Mortgage | With Mortgage |
| Less than 2.0x | 2,004 (38.1%) | 79,401 (1,242.0%) |
| 2.0x to 2.9x | 907 (17.2%) | 2,875 (45.0%) |
| 3.0x to 3.9x | 587 (11.2%) | 1,801 (28.2%) |
| 4.0x or more | 1,639 (31.1%) | 536 (8.4%) |
| Total | 5,261 (100.0%) | 6,393 (100.0%) |
Real Estate Taxes by Mortgage Status in Barren County
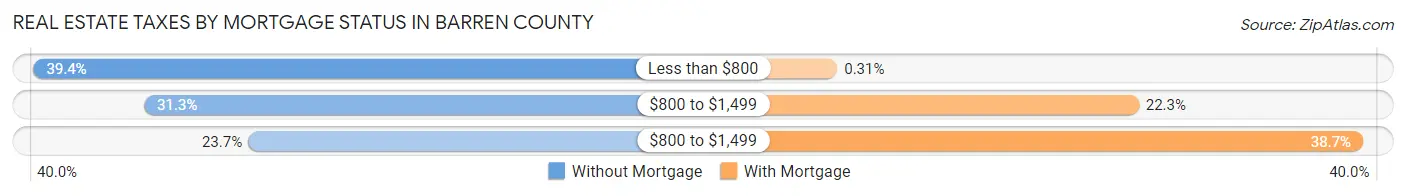
| Property Taxes | Without Mortgage | With Mortgage |
| Less than $800 | 2,070 (39.4%) | 20 (0.3%) |
| $800 to $1,499 | 1,645 (31.3%) | 1,428 (22.3%) |
| $800 to $1,499 | 1,246 (23.7%) | 2,475 (38.7%) |
| Total | 5,261 (100.0%) | 6,393 (100.0%) |
Health & Disability in Barren County
Health Insurance Coverage by Age in Barren County
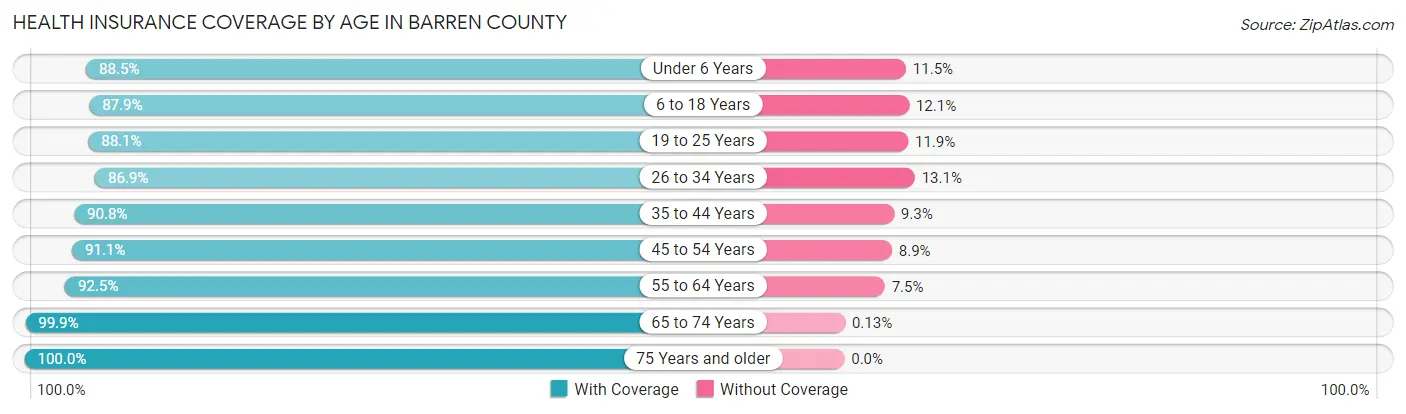
| Age Bracket | With Coverage | Without Coverage |
| Under 6 Years | 2,859 (88.5%) | 371 (11.5%) |
| 6 to 18 Years | 6,689 (87.9%) | 917 (12.1%) |
| 19 to 25 Years | 3,037 (88.1%) | 410 (11.9%) |
| 26 to 34 Years | 4,265 (86.9%) | 645 (13.1%) |
| 35 to 44 Years | 4,965 (90.7%) | 506 (9.2%) |
| 45 to 54 Years | 5,198 (91.1%) | 506 (8.9%) |
| 55 to 64 Years | 5,578 (92.5%) | 455 (7.5%) |
| 65 to 74 Years | 4,521 (99.9%) | 6 (0.1%) |
| 75 Years and older | 2,925 (100.0%) | 0 (0.0%) |
| Total | 40,037 (91.3%) | 3,816 (8.7%) |
Health Insurance Coverage by Citizenship Status in Barren County
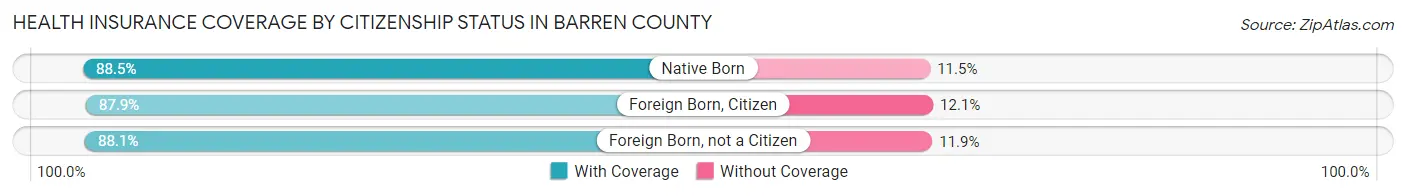
| Citizenship Status | With Coverage | Without Coverage |
| Native Born | 2,859 (88.5%) | 371 (11.5%) |
| Foreign Born, Citizen | 6,689 (87.9%) | 917 (12.1%) |
| Foreign Born, not a Citizen | 3,037 (88.1%) | 410 (11.9%) |
Health Insurance Coverage by Household Income in Barren County
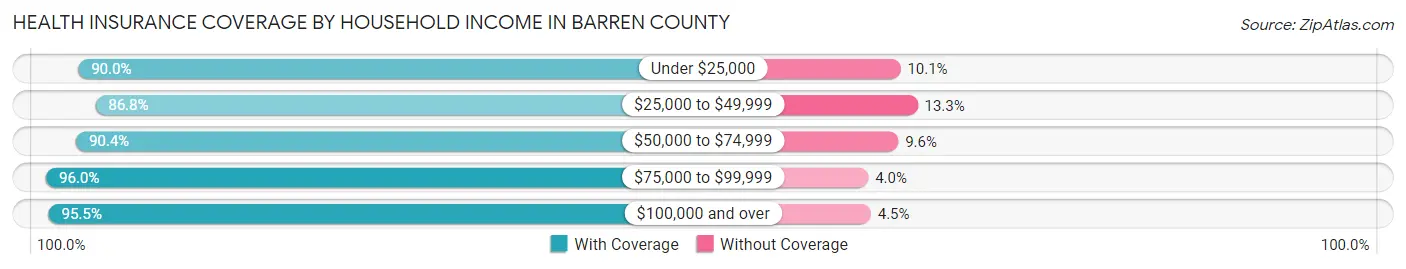
| Household Income | With Coverage | Without Coverage |
| Under $25,000 | 7,651 (89.9%) | 855 (10.1%) |
| $25,000 to $49,999 | 9,791 (86.8%) | 1,496 (13.3%) |
| $50,000 to $74,999 | 6,946 (90.4%) | 740 (9.6%) |
| $75,000 to $99,999 | 5,329 (96.0%) | 223 (4.0%) |
| $100,000 and over | 10,305 (95.5%) | 485 (4.5%) |
Public vs Private Health Insurance Coverage by Age in Barren County
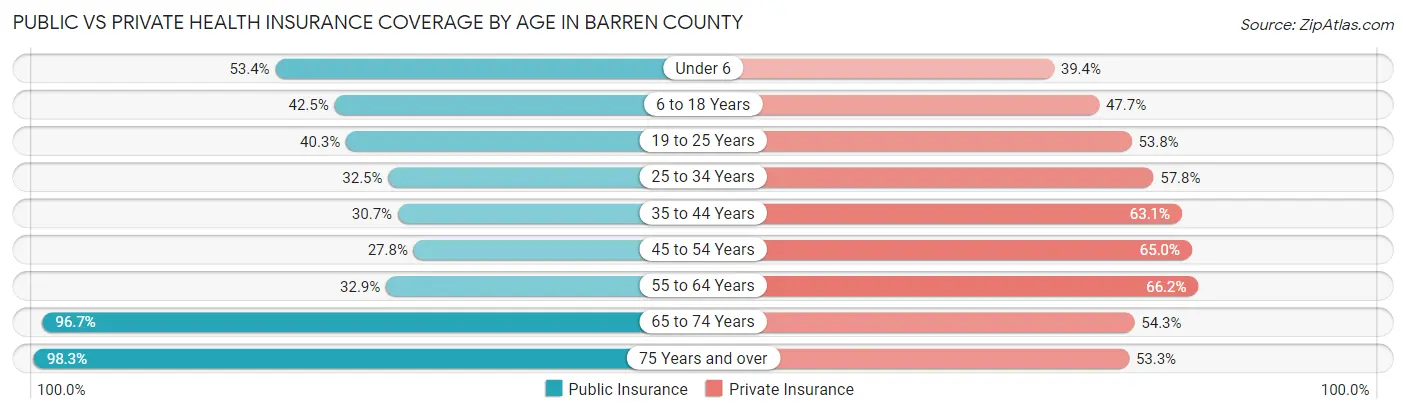
| Age Bracket | Public Insurance | Private Insurance |
| Under 6 | 1,726 (53.4%) | 1,271 (39.4%) |
| 6 to 18 Years | 3,230 (42.5%) | 3,631 (47.7%) |
| 19 to 25 Years | 1,390 (40.3%) | 1,853 (53.8%) |
| 25 to 34 Years | 1,595 (32.5%) | 2,839 (57.8%) |
| 35 to 44 Years | 1,680 (30.7%) | 3,453 (63.1%) |
| 45 to 54 Years | 1,584 (27.8%) | 3,706 (65.0%) |
| 55 to 64 Years | 1,985 (32.9%) | 3,992 (66.2%) |
| 65 to 74 Years | 4,377 (96.7%) | 2,458 (54.3%) |
| 75 Years and over | 2,875 (98.3%) | 1,559 (53.3%) |
| Total | 20,442 (46.6%) | 24,762 (56.5%) |
Disability Status by Sex by Age in Barren County
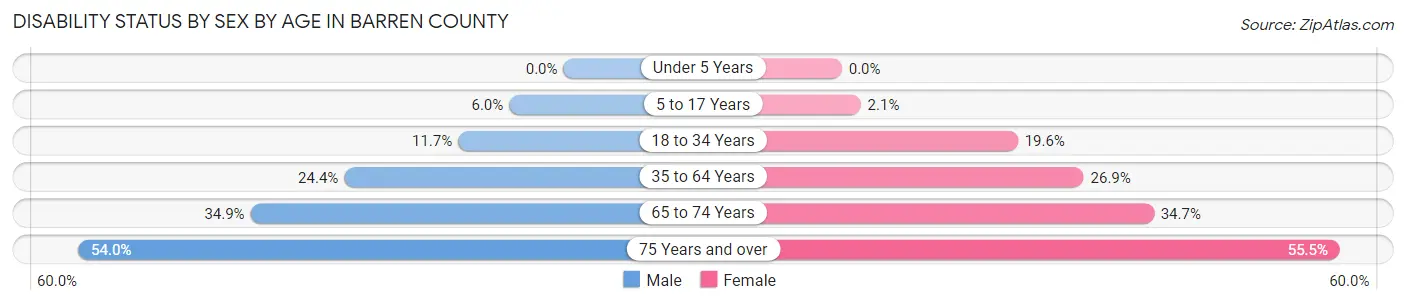
| Age Bracket | Male | Female |
| Under 5 Years | 0 (0.0%) | 0 (0.0%) |
| 5 to 17 Years | 241 (6.0%) | 79 (2.1%) |
| 18 to 34 Years | 513 (11.7%) | 866 (19.6%) |
| 35 to 64 Years | 2,034 (24.4%) | 2,391 (26.9%) |
| 65 to 74 Years | 776 (34.8%) | 799 (34.7%) |
| 75 Years and over | 610 (54.0%) | 996 (55.5%) |
Disability Class by Sex by Age in Barren County
Disability Class: Hearing Difficulty
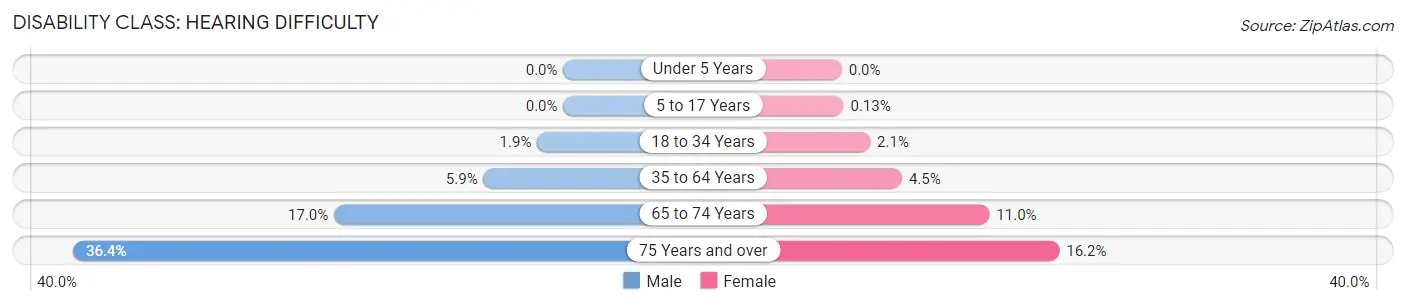
| Age Bracket | Male | Female |
| Under 5 Years | 0 (0.0%) | 0 (0.0%) |
| 5 to 17 Years | 0 (0.0%) | 5 (0.1%) |
| 18 to 34 Years | 85 (1.9%) | 93 (2.1%) |
| 35 to 64 Years | 494 (5.9%) | 397 (4.5%) |
| 65 to 74 Years | 379 (17.0%) | 252 (11.0%) |
| 75 Years and over | 411 (36.4%) | 290 (16.2%) |
Disability Class: Vision Difficulty
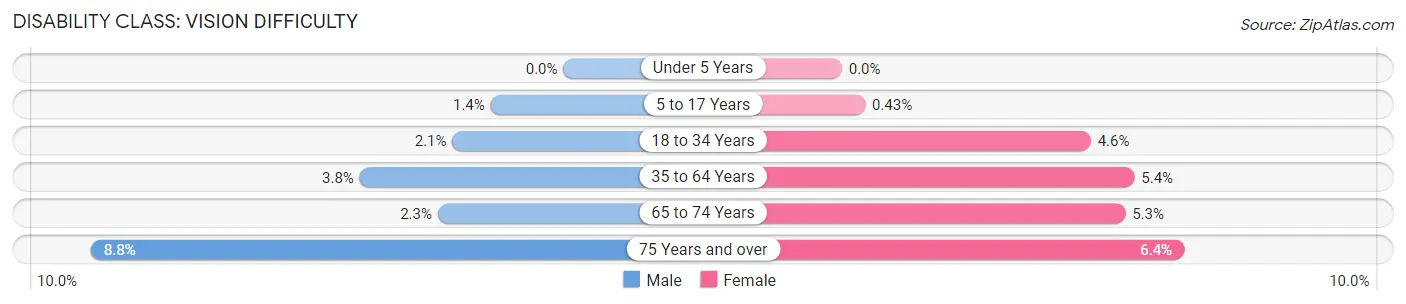
| Age Bracket | Male | Female |
| Under 5 Years | 0 (0.0%) | 0 (0.0%) |
| 5 to 17 Years | 54 (1.3%) | 16 (0.4%) |
| 18 to 34 Years | 90 (2.1%) | 204 (4.6%) |
| 35 to 64 Years | 315 (3.8%) | 482 (5.4%) |
| 65 to 74 Years | 52 (2.3%) | 121 (5.3%) |
| 75 Years and over | 99 (8.8%) | 114 (6.4%) |
Disability Class: Cognitive Difficulty
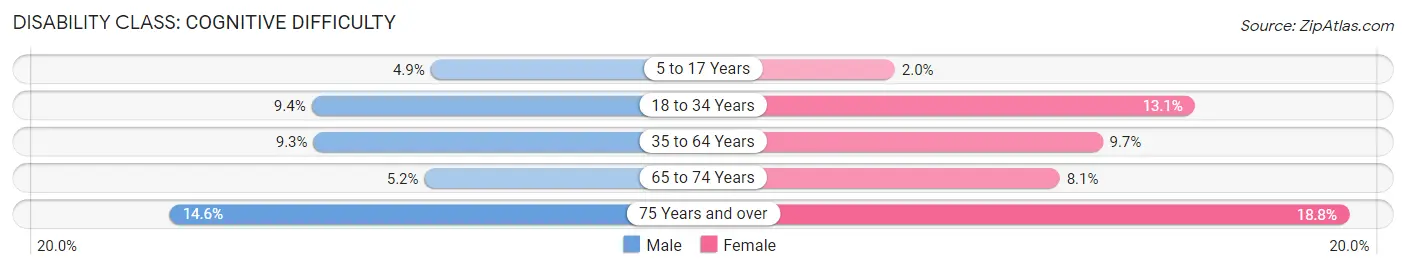
| Age Bracket | Male | Female |
| 5 to 17 Years | 197 (4.9%) | 74 (2.0%) |
| 18 to 34 Years | 409 (9.3%) | 579 (13.1%) |
| 35 to 64 Years | 773 (9.3%) | 859 (9.7%) |
| 65 to 74 Years | 115 (5.2%) | 186 (8.1%) |
| 75 Years and over | 165 (14.6%) | 338 (18.8%) |
Disability Class: Ambulatory Difficulty
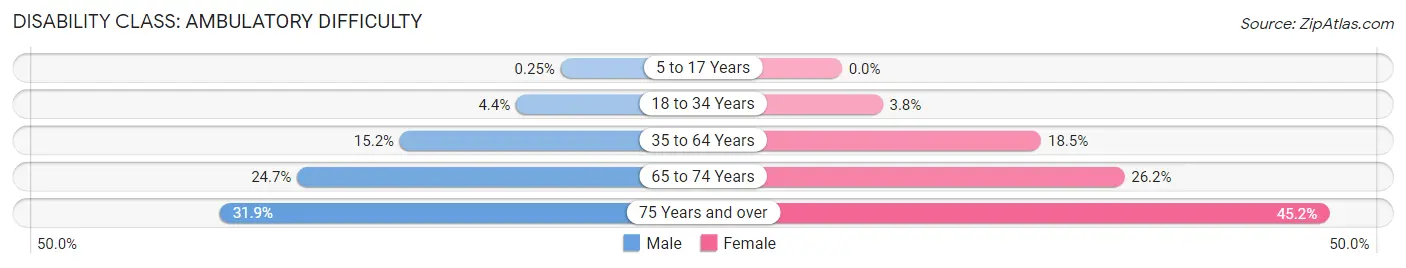
| Age Bracket | Male | Female |
| 5 to 17 Years | 10 (0.3%) | 0 (0.0%) |
| 18 to 34 Years | 192 (4.4%) | 167 (3.8%) |
| 35 to 64 Years | 1,264 (15.2%) | 1,641 (18.5%) |
| 65 to 74 Years | 550 (24.7%) | 603 (26.2%) |
| 75 Years and over | 360 (31.9%) | 812 (45.2%) |
Disability Class: Self-Care Difficulty
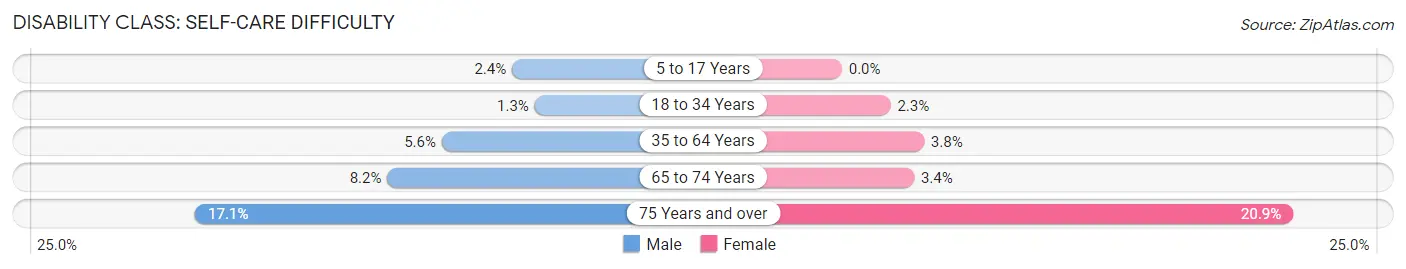
| Age Bracket | Male | Female |
| 5 to 17 Years | 95 (2.4%) | 0 (0.0%) |
| 18 to 34 Years | 58 (1.3%) | 100 (2.3%) |
| 35 to 64 Years | 470 (5.6%) | 338 (3.8%) |
| 65 to 74 Years | 182 (8.2%) | 77 (3.4%) |
| 75 Years and over | 193 (17.1%) | 376 (20.9%) |
Technology Access in Barren County
Computing Device Access in Barren County
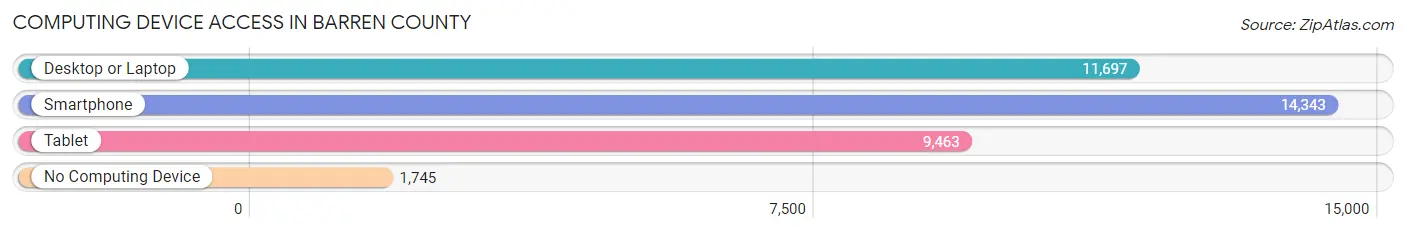
| Device Type | # Households | % Households |
| Desktop or Laptop | 11,697 | 66.5% |
| Smartphone | 14,343 | 81.5% |
| Tablet | 9,463 | 53.8% |
| No Computing Device | 1,745 | 9.9% |
| Total | 17,592 | 100.0% |
Internet Access in Barren County
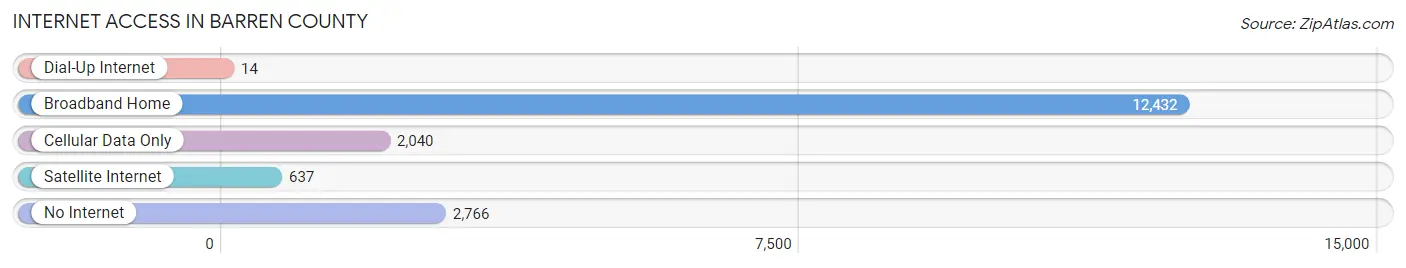
| Internet Type | # Households | % Households |
| Dial-Up Internet | 14 | 0.1% |
| Broadband Home | 12,432 | 70.7% |
| Cellular Data Only | 2,040 | 11.6% |
| Satellite Internet | 637 | 3.6% |
| No Internet | 2,766 | 15.7% |
| Total | 17,592 | 100.0% |
Barren County Summary
Barren County is located in south-central Kentucky, and is part of the Barren River Lake region. It is bordered by Allen, Warren, Metcalfe, Monroe, and Hart counties. The county seat is Glasgow, and the county was formed in 1798 from parts of Warren and Green counties. The county was named for the Barrens, a region of barren land in the area.
Geography
Barren County is located in south-central Kentucky, and is part of the Barren River Lake region. It is bordered by Allen, Warren, Metcalfe, Monroe, and Hart counties. The county has a total area of 517 square miles, of which 514 square miles is land and 3 square miles is water. The terrain is mostly rolling hills, with some flat areas in the north and south. The highest point in the county is located in the northwest corner, at an elevation of 890 feet. The county is drained by the Barren River, which flows through the center of the county.
Demographics
As of the 2010 census, Barren County had a population of 42,173. The racial makeup of the county was 90.2% White, 7.2% Black or African American, 0.3% Native American, 0.5% Asian, 0.2% Pacific Islander, 0.7% from other races, and 0.9% from two or more races. 1.7% of the population were Hispanic or Latino of any race.
The median household income in Barren County was $37,945, and the median family income was $45,945. The per capita income was $19,945. About 17.2% of the population was below the poverty line.
Economy
Barren County’s economy is largely based on agriculture and manufacturing. The county is home to several large farms, as well as several small family farms. The county is also home to several manufacturing plants, including a General Motors plant in Glasgow. The county is also home to several small businesses, including restaurants, retail stores, and service providers.
The county is also home to several tourist attractions, including the Barren River Lake State Park, the Barren River Dam, and the Barren River Wildlife Management Area. The county is also home to several historic sites, including the Glasgow-Barren County Courthouse, the Glasgow-Barren County Museum, and the Glasgow-Barren County Historical Society.
Conclusion
Barren County is a rural county located in south-central Kentucky. It is bordered by Allen, Warren, Metcalfe, Monroe, and Hart counties. The county has a population of 42,173, and is largely based on agriculture and manufacturing. The county is home to several tourist attractions, as well as several historic sites. The county is also home to several small businesses, and is a popular destination for outdoor recreation.
Common Questions
What is the Total Population of Barren County?
Total Population of Barren County is 44,511.
What is the Total Male Population of Barren County?
Total Male Population of Barren County is 21,654.
What is the Total Female Population of Barren County?
Total Female Population of Barren County is 22,857.
What is the Ratio of Males per 100 Females in Barren County?
There are 94.74 Males per 100 Females in Barren County.
What is the Ratio of Females per 100 Males in Barren County?
There are 105.56 Females per 100 Males in Barren County.
What is the Median Population Age in Barren County?
Median Population Age in Barren County is 40.2 Years.
What is the Average Family Size in Barren County
Average Family Size in Barren County is 3.0 People.
What is the Average Household Size in Barren County
Average Household Size in Barren County is 2.5 People.
What is Per Capita Income in Barren County?
Per Capita income in Barren County is $27,732.
What is the Median Family Income in Barren County?
Median Family Income in Barren County is $58,262.
What is the Median Household income in Barren County?
Median Household Income in Barren County is $48,141.
What is Income or Wage Gap in Barren County?
Income or Wage Gap in Barren County is 23.6%.
Women in Barren County earn 76.4 cents for every dollar earned by a man.
What is Family Income Deficit in Barren County?
Family Income Deficit in Barren County is $11,326.
Families that are below poverty line in Barren County earn $11,326 less on average than the poverty threshold level.
What is Inequality or Gini Index in Barren County?
Inequality or Gini Index in Barren County is 0.47.
How Large is the Labor Force in Barren County?
There are 19,679 People in the Labor Forcein in Barren County.
What is the Percentage of People in the Labor Force in Barren County?
55.5% of People are in the Labor Force in Barren County.
What is the Unemployment Rate in Barren County?
Unemployment Rate in Barren County is 4.9%.