Anderson County, KY
Anderson County Map

Anderson County Overview
23,839
TOTAL POPULATION
12,072
MALE POPULATION
11,767
FEMALE POPULATION
102.59
MALES / 100 FEMALES
97.47
FEMALES / 100 MALES
41.9
MEDIAN AGE
3.1
AVG FAMILY SIZE
2.6
AVG HOUSEHOLD SIZE
$33,513
PER CAPITA INCOME
$83,482
AVG FAMILY INCOME
$69,885
AVG HOUSEHOLD INCOME
22.9%
WAGE / INCOME GAP [ % ]
77.1¢/ $1
WAGE / INCOME GAP [ $ ]
$8,813
FAMILY INCOME DEFICIT
0.41
INEQUALITY / GINI INDEX
11,504
LABOR FORCE [ PEOPLE ]
60.5%
PERCENT IN LABOR FORCE
5.4%
UNEMPLOYMENT RATE
Anderson County Area Codes
Race in Anderson County
The most populous races in Anderson County are White / Caucasian (22,366 | 93.8%), Black / African American (728 | 3.0%), and Two or more Races (589 | 2.5%).

| Race | # Population | % Population |
| Asian | 28 | 0.1% |
| Black / African American | 728 | 3.0% |
| Hawaiian / Pacific | 14 | 0.1% |
| Hispanic or Latino | 514 | 2.2% |
| Native / Alaskan | 0 | 0.0% |
| White / Caucasian | 22,366 | 93.8% |
| Two or more Races | 589 | 2.5% |
| Some other Race | 114 | 0.5% |
| Total | 23,839 | 100.0% |
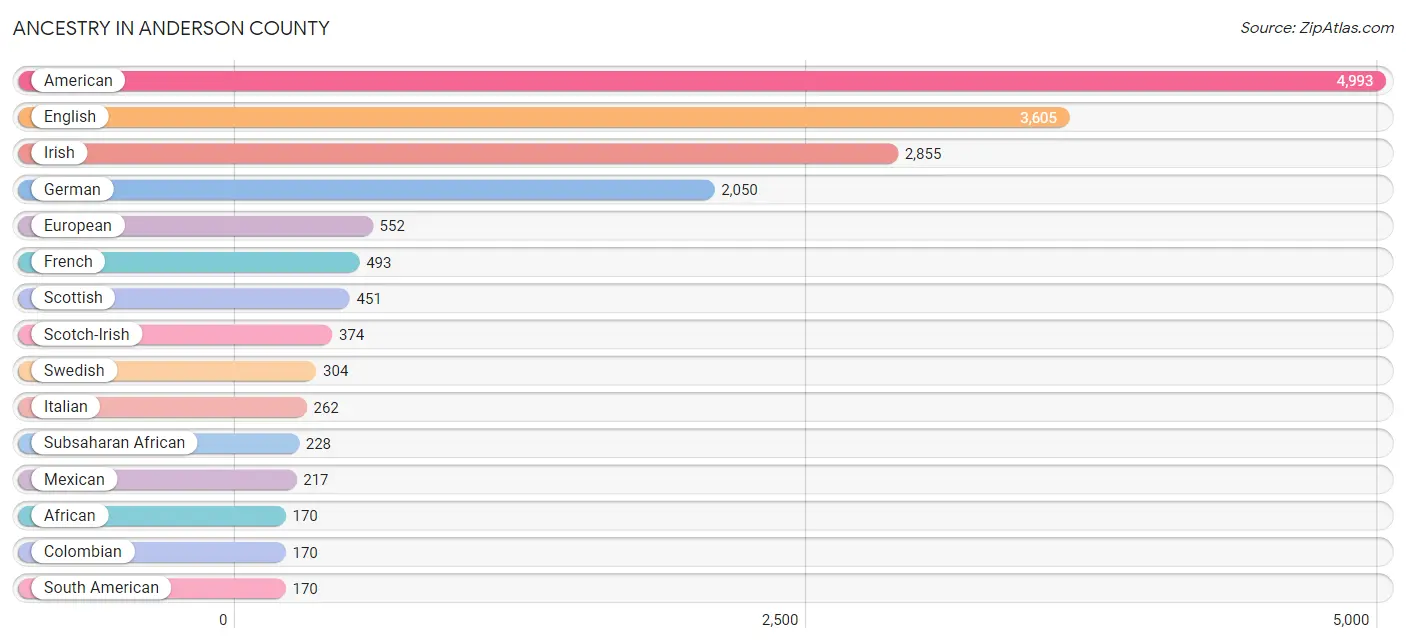
Ancestry in Anderson County
The most populous ancestries reported in Anderson County are American (4,993 | 20.9%), English (3,605 | 15.1%), Irish (2,855 | 12.0%), German (2,050 | 8.6%), and European (552 | 2.3%), together accounting for 59.0% of all Anderson County residents.
| Ancestry | # Population | % Population |
| African | 170 | 0.7% |
| American | 4,993 | 20.9% |
| Austrian | 20 | 0.1% |
| British | 69 | 0.3% |
| Central American | 60 | 0.3% |
| Cherokee | 80 | 0.3% |
| Colombian | 170 | 0.7% |
| Croatian | 8 | 0.0% |
| Cuban | 40 | 0.2% |
| Czech | 23 | 0.1% |
| Czechoslovakian | 10 | 0.0% |
| Danish | 7 | 0.0% |
| Dutch | 141 | 0.6% |
| Eastern European | 53 | 0.2% |
| English | 3,605 | 15.1% |
| Ethiopian | 58 | 0.2% |
| European | 552 | 2.3% |
| Finnish | 15 | 0.1% |
| French | 493 | 2.1% |
| French Canadian | 73 | 0.3% |
| German | 2,050 | 8.6% |
| Greek | 30 | 0.1% |
| Honduran | 60 | 0.3% |
| Indian (Asian) | 28 | 0.1% |
| Irish | 2,855 | 12.0% |
| Iroquois | 8 | 0.0% |
| Italian | 262 | 1.1% |
| Mexican | 217 | 0.9% |
| Navajo | 16 | 0.1% |
| Northern European | 72 | 0.3% |
| Norwegian | 82 | 0.3% |
| Polish | 160 | 0.7% |
| Portuguese | 10 | 0.0% |
| Puerto Rican | 27 | 0.1% |
| Russian | 86 | 0.4% |
| Samoan | 14 | 0.1% |
| Scandinavian | 94 | 0.4% |
| Scotch-Irish | 374 | 1.6% |
| Scottish | 451 | 1.9% |
| Slovak | 9 | 0.0% |
| South American | 170 | 0.7% |
| Subsaharan African | 228 | 1.0% |
| Swedish | 304 | 1.3% |
| Swiss | 41 | 0.2% |
| Welsh | 48 | 0.2% | View All 45 Rows |
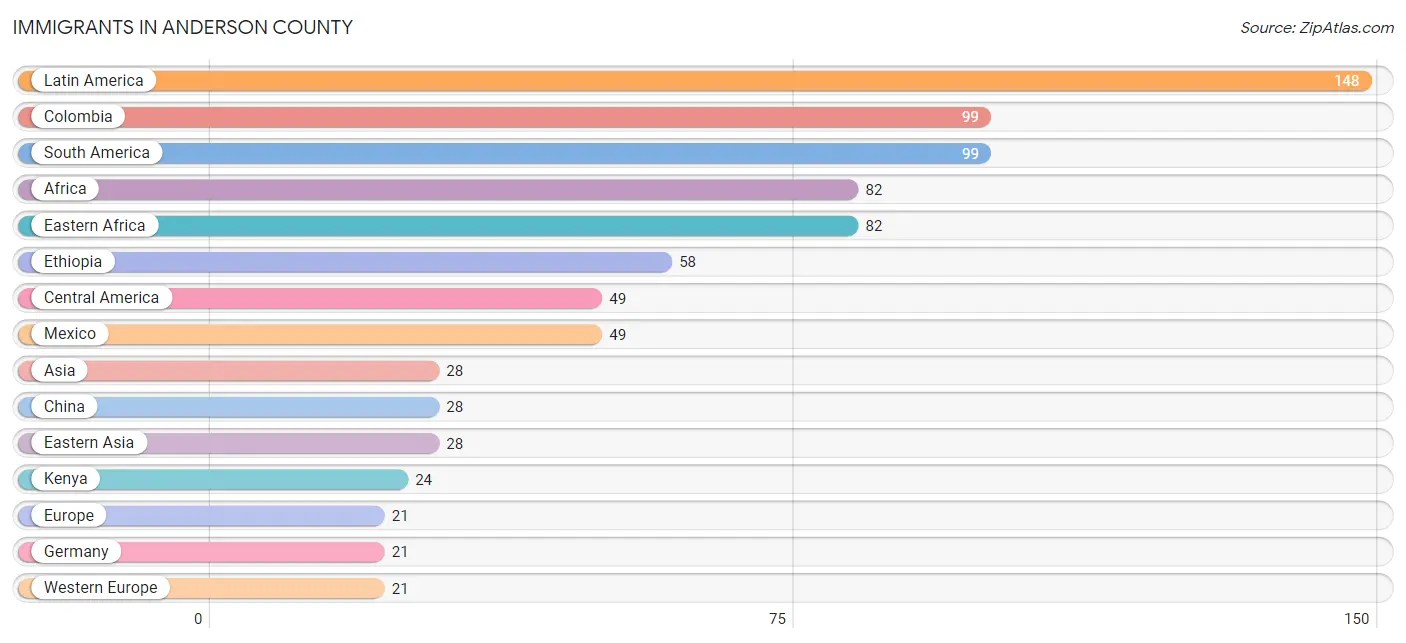
Immigrants in Anderson County
The most numerous immigrant groups reported in Anderson County came from Latin America (148 | 0.6%), Colombia (99 | 0.4%), South America (99 | 0.4%), Africa (82 | 0.3%), and Eastern Africa (82 | 0.3%), together accounting for 2.1% of all Anderson County residents.
| Immigration Origin | # Population | % Population |
| Africa | 82 | 0.3% |
| Asia | 28 | 0.1% |
| Central America | 49 | 0.2% |
| China | 28 | 0.1% |
| Colombia | 99 | 0.4% |
| Eastern Africa | 82 | 0.3% |
| Eastern Asia | 28 | 0.1% |
| Ethiopia | 58 | 0.2% |
| Europe | 21 | 0.1% |
| Germany | 21 | 0.1% |
| Kenya | 24 | 0.1% |
| Latin America | 148 | 0.6% |
| Mexico | 49 | 0.2% |
| South America | 99 | 0.4% |
| Western Europe | 21 | 0.1% | View All 15 Rows |
Sex and Age in Anderson County
Sex and Age in Anderson County
The most populous age groups in Anderson County are 50 to 54 Years (1,036 | 8.6%) for men and 55 to 59 Years (987 | 8.4%) for women.

| Age Bracket | Male | Female |
| Under 5 Years | 728 (6.0%) | 661 (5.6%) |
| 5 to 9 Years | 1,024 (8.5%) | 850 (7.2%) |
| 10 to 14 Years | 634 (5.2%) | 669 (5.7%) |
| 15 to 19 Years | 817 (6.8%) | 572 (4.9%) |
| 20 to 24 Years | 746 (6.2%) | 707 (6.0%) |
| 25 to 29 Years | 681 (5.6%) | 692 (5.9%) |
| 30 to 34 Years | 667 (5.5%) | 685 (5.8%) |
| 35 to 39 Years | 609 (5.0%) | 581 (4.9%) |
| 40 to 44 Years | 896 (7.4%) | 855 (7.3%) |
| 45 to 49 Years | 829 (6.9%) | 854 (7.3%) |
| 50 to 54 Years | 1,036 (8.6%) | 859 (7.3%) |
| 55 to 59 Years | 1,010 (8.4%) | 987 (8.4%) |
| 60 to 64 Years | 675 (5.6%) | 656 (5.6%) |
| 65 to 69 Years | 572 (4.7%) | 553 (4.7%) |
| 70 to 74 Years | 562 (4.7%) | 674 (5.7%) |
| 75 to 79 Years | 313 (2.6%) | 423 (3.6%) |
| 80 to 84 Years | 183 (1.5%) | 276 (2.4%) |
| 85 Years and over | 90 (0.7%) | 213 (1.8%) |
| Total | 12,072 (100.0%) | 11,767 (100.0%) |
Families and Households in Anderson County
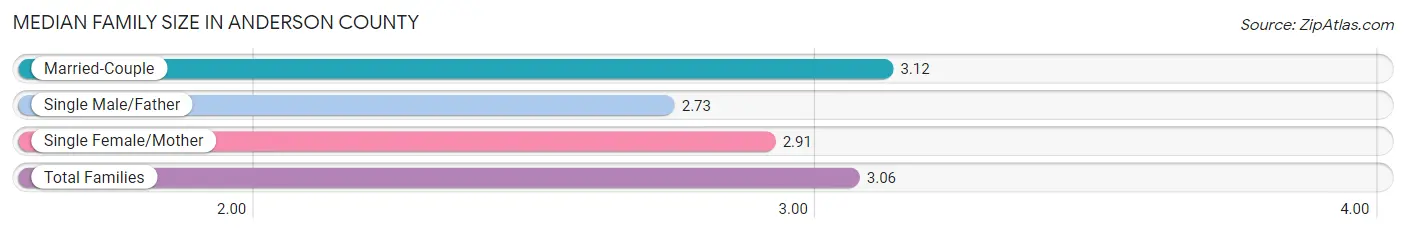
Median Family Size in Anderson County
The median family size in Anderson County is 3.06 persons per family, with married-couple families (4,831 | 75.6%) accounting for the largest median family size of 3.12 persons per family. On the other hand, single male/father families (518 | 8.1%) represent the smallest median family size with 2.73 persons per family.
| Family Type | # Families | Family Size |
| Married-Couple | 4,831 (75.6%) | 3.12 |
| Single Male/Father | 518 (8.1%) | 2.73 |
| Single Female/Mother | 1,042 (16.3%) | 2.91 |
| Total Families | 6,391 (100.0%) | 3.06 |
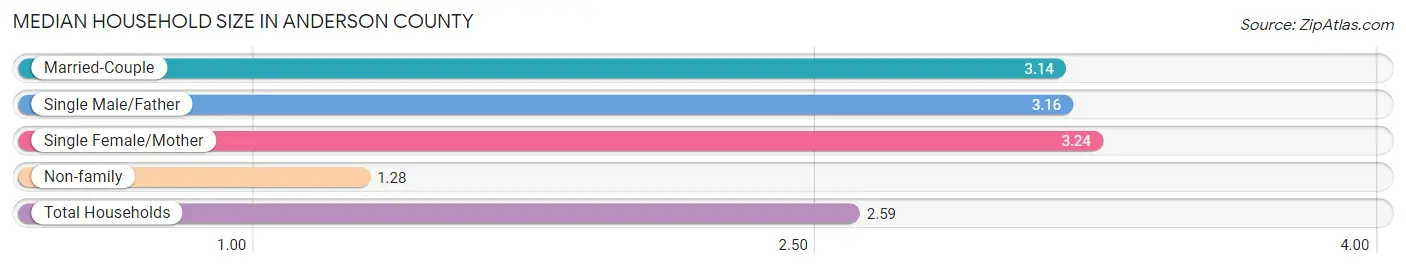
Median Household Size in Anderson County
The median household size in Anderson County is 2.59 persons per household, with single female/mother households (1,042 | 11.4%) accounting for the largest median household size of 3.24 persons per household. non-family households (2,789 | 30.4%) represent the smallest median household size with 1.28 persons per household.
| Household Type | # Households | Household Size |
| Married-Couple | 4,831 (52.6%) | 3.14 |
| Single Male/Father | 518 (5.6%) | 3.16 |
| Single Female/Mother | 1,042 (11.4%) | 3.24 |
| Non-family | 2,789 (30.4%) | 1.28 |
| Total Households | 9,180 (100.0%) | 2.59 |
Household Size by Marriage Status in Anderson County
Out of a total of 9,180 households in Anderson County, 6,391 (69.6%) are family households, while 2,789 (30.4%) are nonfamily households. The most numerous type of family households are 2-person households, comprising 2,913, and the most common type of nonfamily households are 1-person households, comprising 2,243.

| Household Size | Family Households | Nonfamily Households |
| 1-Person Households | - | 2,243 (24.4%) |
| 2-Person Households | 2,913 (31.7%) | 406 (4.4%) |
| 3-Person Households | 1,610 (17.5%) | 77 (0.8%) |
| 4-Person Households | 1,235 (13.5%) | 60 (0.6%) |
| 5-Person Households | 297 (3.2%) | 3 (0.0%) |
| 6-Person Households | 243 (2.6%) | 0 (0.0%) |
| 7+ Person Households | 93 (1.0%) | 0 (0.0%) |
| Total | 6,391 (69.6%) | 2,789 (30.4%) |
Female Fertility in Anderson County
Fertility by Age in Anderson County
Average fertility rate in Anderson County is 41.0 births per 1,000 women. Women in the age bracket of 20 to 34 years have the highest fertility rate with 80.0 births per 1,000 women. Women in the age bracket of 20 to 34 years acount for 77.9% of all women with births.

| Age Bracket | Women with Births | Births / 1,000 Women |
| 15 to 19 years | 13 (6.1%) | 23.0 |
| 20 to 34 years | 166 (77.9%) | 80.0 |
| 35 to 50 years | 34 (16.0%) | 13.0 |
| Total | 213 (100.0%) | 41.0 |
Fertility by Age by Marriage Status in Anderson County
63.8% of women with births (213) in Anderson County are married. The highest percentage of unmarried women with births falls into 20 to 34 years age bracket with 46.4% of them unmarried at the time of birth, while the lowest percentage of unmarried women with births belong to 15 to 19 years age bracket with 0.0% of them unmarried.

| Age Bracket | Married | Unmarried |
| 15 to 19 years | 13 (100.0%) | 0 (0.0%) |
| 20 to 34 years | 89 (53.6%) | 77 (46.4%) |
| 35 to 50 years | 34 (100.0%) | 0 (0.0%) |
| Total | 136 (63.8%) | 77 (36.1%) |
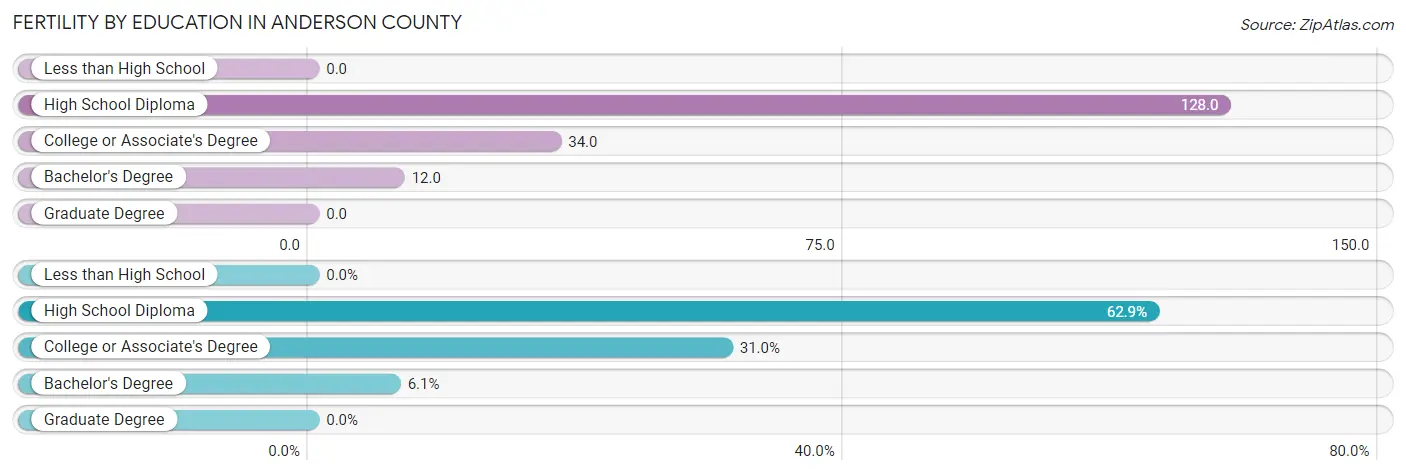
Fertility by Education in Anderson County
| Educational Attainment | Women with Births | Births / 1,000 Women |
| Less than High School | 0 (0.0%) | 0.0 |
| High School Diploma | 134 (62.9%) | 128.0 |
| College or Associate's Degree | 66 (31.0%) | 34.0 |
| Bachelor's Degree | 13 (6.1%) | 12.0 |
| Graduate Degree | 0 (0.0%) | 0.0 |
| Total | 213 (100.0%) | 41.0 |
Fertility by Education by Marriage Status in Anderson County
36.1% of women with births in Anderson County are unmarried. Women with the educational attainment of bachelor's degree are most likely to be married with 100.0% of them married at childbirth, while women with the educational attainment of college or associate's degree are least likely to be married with 87.9% of them unmarried at childbirth.

| Educational Attainment | Married | Unmarried |
| Less than High School | 0 (0.0%) | 0 (0.0%) |
| High School Diploma | 115 (85.8%) | 19 (14.2%) |
| College or Associate's Degree | 8 (12.1%) | 58 (87.9%) |
| Bachelor's Degree | 13 (100.0%) | 0 (0.0%) |
| Graduate Degree | 0 (0.0%) | 0 (0.0%) |
| Total | 136 (63.8%) | 77 (36.1%) |
Income in Anderson County
Income Overview in Anderson County
Per Capita Income in Anderson County is $33,513, while median incomes of families and households are $83,482 and $69,885 respectively.
| Characteristic | Number | Measure |
| Per Capita Income | 23,839 | $33,513 |
| Median Family Income | 6,391 | $83,482 |
| Mean Family Income | 6,391 | $100,628 |
| Median Household Income | 9,180 | $69,885 |
| Mean Household Income | 9,180 | $85,850 |
| Income Deficit | 6,391 | $8,813 |
| Wage / Income Gap (%) | 23,839 | 22.92% |
| Wage / Income Gap ($) | 23,839 | 77.08¢ per $1 |
| Gini / Inequality Index | 23,839 | 0.41 |
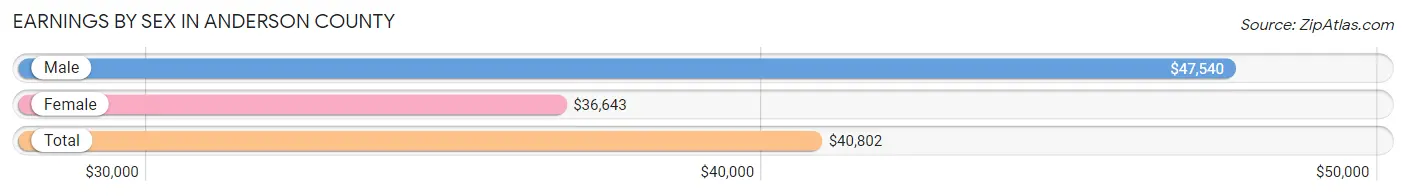
Earnings by Sex in Anderson County
Average Earnings in Anderson County are $40,802, $47,540 for men and $36,643 for women, a difference of 22.9%.
| Sex | Number | Average Earnings |
| Male | 6,189 (51.8%) | $47,540 |
| Female | 5,759 (48.2%) | $36,643 |
| Total | 11,948 (100.0%) | $40,802 |
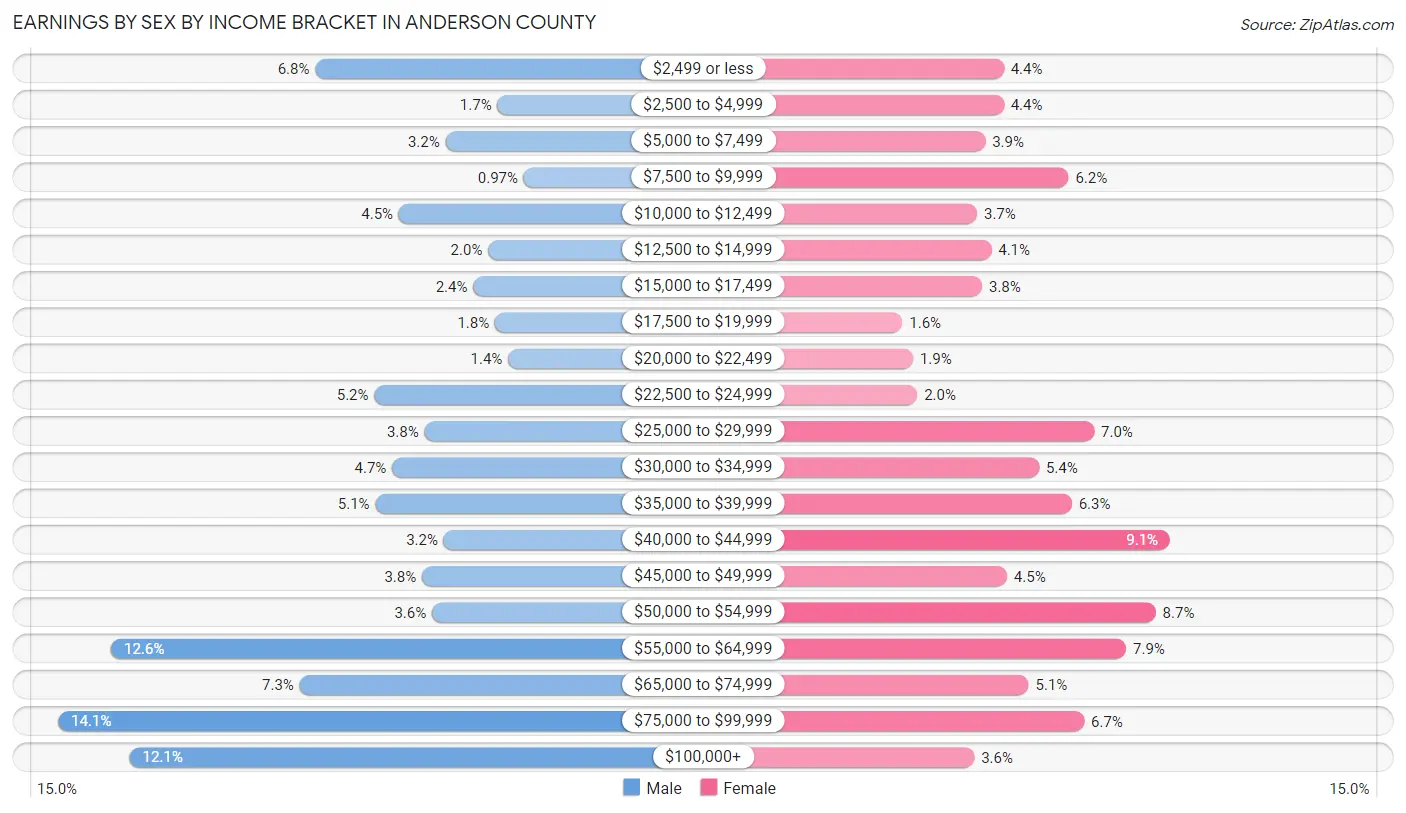
Earnings by Sex by Income Bracket in Anderson County
The most common earnings brackets in Anderson County are $75,000 to $99,999 for men (870 | 14.1%) and $40,000 to $44,999 for women (523 | 9.1%).
| Income | Male | Female |
| $2,499 or less | 423 (6.8%) | 254 (4.4%) |
| $2,500 to $4,999 | 106 (1.7%) | 254 (4.4%) |
| $5,000 to $7,499 | 196 (3.2%) | 224 (3.9%) |
| $7,500 to $9,999 | 60 (1.0%) | 359 (6.2%) |
| $10,000 to $12,499 | 277 (4.5%) | 211 (3.7%) |
| $12,500 to $14,999 | 122 (2.0%) | 234 (4.1%) |
| $15,000 to $17,499 | 148 (2.4%) | 219 (3.8%) |
| $17,500 to $19,999 | 110 (1.8%) | 90 (1.6%) |
| $20,000 to $22,499 | 87 (1.4%) | 107 (1.9%) |
| $22,500 to $24,999 | 320 (5.2%) | 114 (2.0%) |
| $25,000 to $29,999 | 233 (3.8%) | 400 (7.0%) |
| $30,000 to $34,999 | 289 (4.7%) | 311 (5.4%) |
| $35,000 to $39,999 | 318 (5.1%) | 364 (6.3%) |
| $40,000 to $44,999 | 199 (3.2%) | 523 (9.1%) |
| $45,000 to $49,999 | 237 (3.8%) | 259 (4.5%) |
| $50,000 to $54,999 | 220 (3.5%) | 500 (8.7%) |
| $55,000 to $64,999 | 778 (12.6%) | 452 (7.9%) |
| $65,000 to $74,999 | 450 (7.3%) | 294 (5.1%) |
| $75,000 to $99,999 | 870 (14.1%) | 384 (6.7%) |
| $100,000+ | 746 (12.0%) | 206 (3.6%) |
| Total | 6,189 (100.0%) | 5,759 (100.0%) |
Earnings by Sex by Educational Attainment in Anderson County
Average earnings in Anderson County are $55,932 for men and $40,986 for women, a difference of 26.7%. Men with an educational attainment of graduate degree enjoy the highest average annual earnings of $73,605, while those with less than high school education earn the least with $27,279. Women with an educational attainment of graduate degree earn the most with the average annual earnings of $54,500, while those with high school diploma education have the smallest earnings of $30,795.

| Educational Attainment | Male Income | Female Income |
| Less than High School | $27,279 | $34,211 |
| High School Diploma | $54,524 | $30,795 |
| College or Associate's Degree | $54,583 | $39,727 |
| Bachelor's Degree | $63,977 | $51,383 |
| Graduate Degree | $73,605 | $54,500 |
| Total | $55,932 | $40,986 |
Family Income in Anderson County
Family Income Brackets in Anderson County
According to the Anderson County family income data, there are 1,451 families falling into the $100,000 to $149,999 income range, which is the most common income bracket and makes up 22.7% of all families. Conversely, the less than $10,000 income bracket is the least frequent group with only 115 families (1.8%) belonging to this category.

| Income Bracket | # Families | % Families |
| Less than $10,000 | 115 | 1.8% |
| $10,000 to $14,999 | 230 | 3.6% |
| $15,000 to $24,999 | 243 | 3.8% |
| $25,000 to $34,999 | 435 | 6.8% |
| $35,000 to $49,999 | 639 | 10.0% |
| $50,000 to $74,999 | 1,157 | 18.1% |
| $75,000 to $99,999 | 1,074 | 16.8% |
| $100,000 to $149,999 | 1,451 | 22.7% |
| $150,000 to $199,999 | 575 | 9.0% |
| $200,000+ | 479 | 7.5% |
Family Income by Famaliy Size in Anderson County
3-person families (1,678 | 26.3%) account for the highest median family income in Anderson County with $103,000 per family, while 2-person families (3,084 | 48.3%) have the highest median income of $37,964 per family member.

| Income Bracket | # Families | Median Income |
| 2-Person Families | 3,084 (48.3%) | $75,928 |
| 3-Person Families | 1,678 (26.3%) | $103,000 |
| 4-Person Families | 1,082 (16.9%) | $93,654 |
| 5-Person Families | 254 (4.0%) | $0 |
| 6-Person Families | 200 (3.1%) | $59,635 |
| 7+ Person Families | 93 (1.5%) | $0 |
| Total | 6,391 (100.0%) | $83,482 |
Family Income by Number of Earners in Anderson County
The median family income in Anderson County is $83,482, with families comprising 3+ earners (628) having the highest median family income of $135,833, while families with no earners (1,088) have the lowest median family income of $51,042, accounting for 9.8% and 17.0% of families, respectively.

| Number of Earners | # Families | Median Income |
| No Earners | 1,088 (17.0%) | $51,042 |
| 1 Earner | 2,074 (32.5%) | $59,605 |
| 2 Earners | 2,601 (40.7%) | $106,808 |
| 3+ Earners | 628 (9.8%) | $135,833 |
| Total | 6,391 (100.0%) | $83,482 |
Household Income in Anderson County
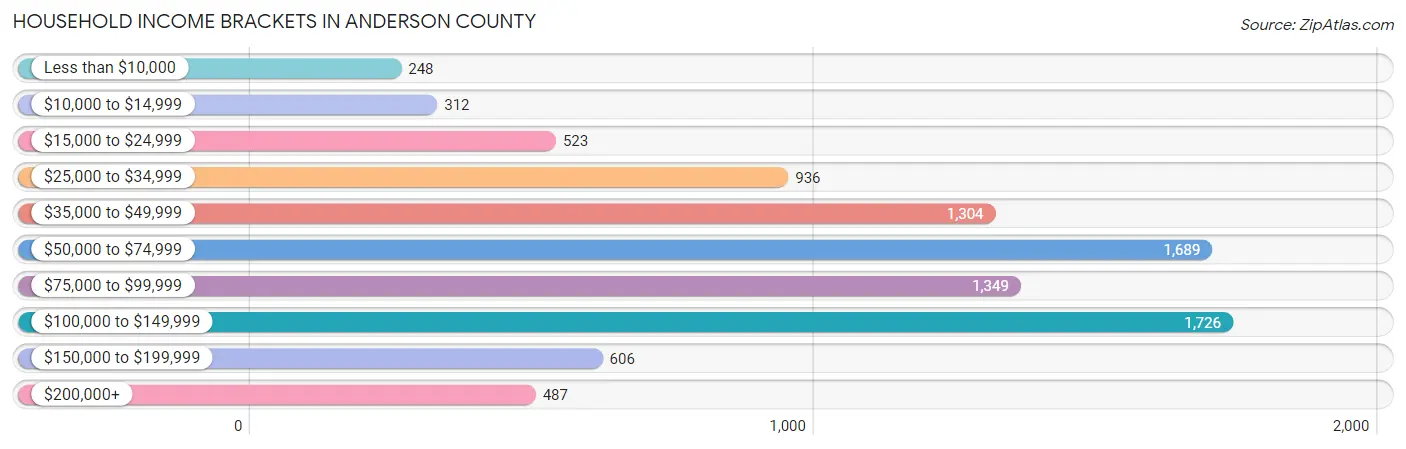
Household Income Brackets in Anderson County
With 1,726 households falling in the category, the $100,000 to $149,999 income range is the most frequent in Anderson County, accounting for 18.8% of all households. In contrast, only 248 households (2.7%) fall into the less than $10,000 income bracket, making it the least populous group.
| Income Bracket | # Households | % Households |
| Less than $10,000 | 248 | 2.7% |
| $10,000 to $14,999 | 312 | 3.4% |
| $15,000 to $24,999 | 523 | 5.7% |
| $25,000 to $34,999 | 936 | 10.2% |
| $35,000 to $49,999 | 1,304 | 14.2% |
| $50,000 to $74,999 | 1,689 | 18.4% |
| $75,000 to $99,999 | 1,349 | 14.7% |
| $100,000 to $149,999 | 1,726 | 18.8% |
| $150,000 to $199,999 | 606 | 6.6% |
| $200,000+ | 487 | 5.3% |
Household Income by Householder Age in Anderson County
The median household income in Anderson County is $69,885, with the highest median household income of $78,797 found in the 45 to 64 years age bracket for the primary householder. A total of 3,665 households (39.9%) fall into this category. Meanwhile, the 15 to 24 years age bracket for the primary householder has the lowest median household income of $46,818, with 330 households (3.6%) in this group.
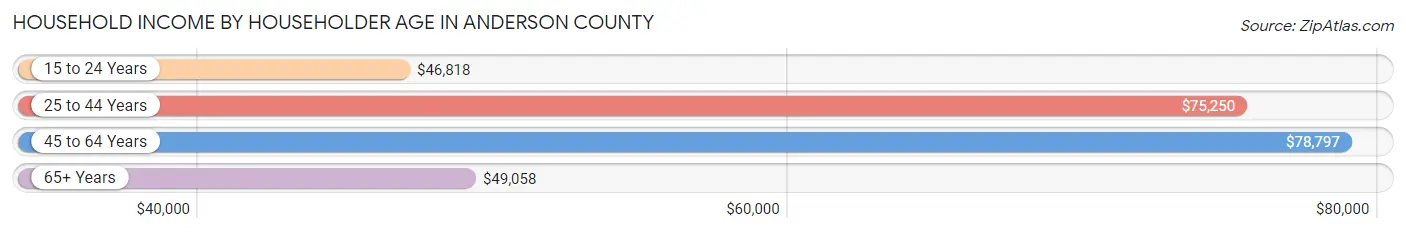
| Income Bracket | # Households | Median Income |
| 15 to 24 Years | 330 (3.6%) | $46,818 |
| 25 to 44 Years | 2,636 (28.7%) | $75,250 |
| 45 to 64 Years | 3,665 (39.9%) | $78,797 |
| 65+ Years | 2,549 (27.8%) | $49,058 |
| Total | 9,180 (100.0%) | $69,885 |
Poverty in Anderson County
Income Below Poverty by Sex and Age in Anderson County
With 12.3% poverty level for males and 14.5% for females among the residents of Anderson County, 15 year old males and 12 to 14 year old females are the most vulnerable to poverty, with 65 males (30.8%) and 95 females (29.5%) in their respective age groups living below the poverty level.
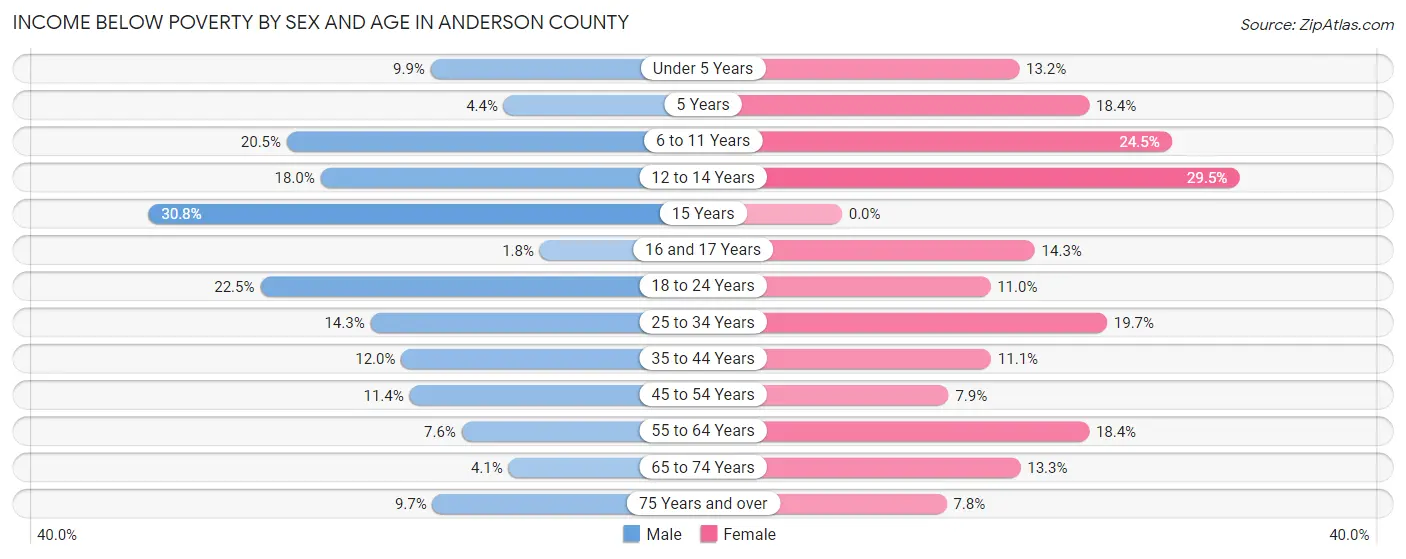
| Age Bracket | Male | Female |
| Under 5 Years | 71 (9.9%) | 87 (13.2%) |
| 5 Years | 8 (4.4%) | 56 (18.4%) |
| 6 to 11 Years | 192 (20.5%) | 210 (24.5%) |
| 12 to 14 Years | 86 (18.0%) | 95 (29.5%) |
| 15 Years | 65 (30.8%) | 0 (0.0%) |
| 16 and 17 Years | 6 (1.8%) | 53 (14.3%) |
| 18 to 24 Years | 227 (22.5%) | 95 (11.0%) |
| 25 to 34 Years | 193 (14.3%) | 271 (19.7%) |
| 35 to 44 Years | 181 (12.0%) | 159 (11.1%) |
| 45 to 54 Years | 213 (11.4%) | 135 (7.9%) |
| 55 to 64 Years | 126 (7.5%) | 300 (18.3%) |
| 65 to 74 Years | 46 (4.1%) | 162 (13.3%) |
| 75 Years and over | 56 (9.7%) | 67 (7.8%) |
| Total | 1,470 (12.3%) | 1,690 (14.5%) |
Income Above Poverty by Sex and Age in Anderson County
According to the poverty statistics in Anderson County, males aged 16 and 17 years and females aged 15 years are the age groups that are most secure financially, with 98.3% of males and 100.0% of females in these age groups living above the poverty line.

| Age Bracket | Male | Female |
| Under 5 Years | 650 (90.1%) | 574 (86.8%) |
| 5 Years | 173 (95.6%) | 249 (81.6%) |
| 6 to 11 Years | 743 (79.5%) | 648 (75.5%) |
| 12 to 14 Years | 391 (82.0%) | 227 (70.5%) |
| 15 Years | 146 (69.2%) | 47 (100.0%) |
| 16 and 17 Years | 337 (98.3%) | 317 (85.7%) |
| 18 to 24 Years | 782 (77.5%) | 767 (89.0%) |
| 25 to 34 Years | 1,155 (85.7%) | 1,106 (80.3%) |
| 35 to 44 Years | 1,324 (88.0%) | 1,277 (88.9%) |
| 45 to 54 Years | 1,652 (88.6%) | 1,570 (92.1%) |
| 55 to 64 Years | 1,543 (92.4%) | 1,335 (81.7%) |
| 65 to 74 Years | 1,084 (95.9%) | 1,061 (86.8%) |
| 75 Years and over | 521 (90.3%) | 795 (92.2%) |
| Total | 10,501 (87.7%) | 9,973 (85.5%) |
Income Below Poverty Among Married-Couple Families in Anderson County
The poverty statistics for married-couple families in Anderson County show that 5.2% or 251 of the total 4,831 families live below the poverty line. Families with 3 or 4 children have the highest poverty rate of 14.8%, comprising of 39 families. On the other hand, families with 5 or more children have the lowest poverty rate of 0.0%, which includes 0 families.

| Children | Above Poverty | Below Poverty |
| No Children | 2,864 (97.0%) | 88 (3.0%) |
| 1 or 2 Children | 1,398 (91.8%) | 124 (8.2%) |
| 3 or 4 Children | 225 (85.2%) | 39 (14.8%) |
| 5 or more Children | 93 (100.0%) | 0 (0.0%) |
| Total | 4,580 (94.8%) | 251 (5.2%) |
Income Below Poverty Among Single-Parent Households in Anderson County
According to the poverty data in Anderson County, 15.2% or 79 single-father households and 27.9% or 291 single-mother households are living below the poverty line. Among single-father households, those with 3 or 4 children have the highest poverty rate, with 14 households (100.0%) experiencing poverty. Likewise, among single-mother households, those with 3 or 4 children have the highest poverty rate, with 30 households (75.0%) falling below the poverty line.
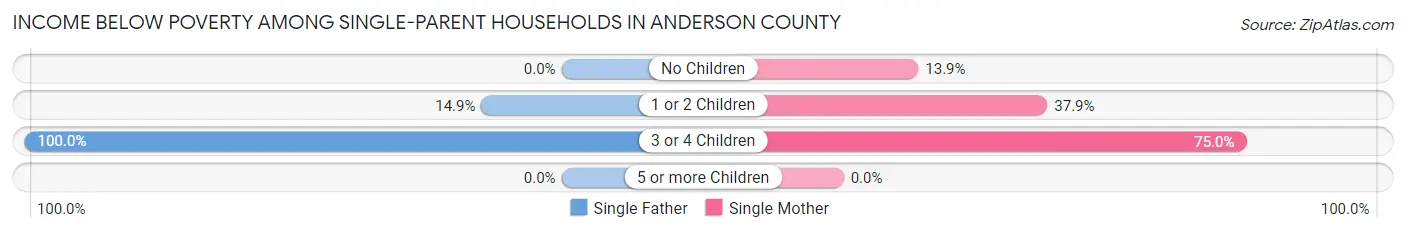
| Children | Single Father | Single Mother |
| No Children | 0 (0.0%) | 69 (13.9%) |
| 1 or 2 Children | 65 (14.9%) | 192 (37.9%) |
| 3 or 4 Children | 14 (100.0%) | 30 (75.0%) |
| 5 or more Children | 0 (0.0%) | 0 (0.0%) |
| Total | 79 (15.2%) | 291 (27.9%) |
Income Below Poverty Among Married-Couple vs Single-Parent Households in Anderson County
The poverty data for Anderson County shows that 251 of the married-couple family households (5.2%) and 370 of the single-parent households (23.7%) are living below the poverty level. Within the married-couple family households, those with 3 or 4 children have the highest poverty rate, with 39 households (14.8%) falling below the poverty line. Among the single-parent households, those with 3 or 4 children have the highest poverty rate, with 44 household (81.5%) living below poverty.

| Children | Married-Couple Families | Single-Parent Households |
| No Children | 88 (3.0%) | 69 (12.2%) |
| 1 or 2 Children | 124 (8.2%) | 257 (27.3%) |
| 3 or 4 Children | 39 (14.8%) | 44 (81.5%) |
| 5 or more Children | 0 (0.0%) | 0 (0.0%) |
| Total | 251 (5.2%) | 370 (23.7%) |
Employment Characteristics in Anderson County
Employment by Class of Employer in Anderson County
Among the 10,865 employed individuals in Anderson County, private company employees (6,675 | 61.4%), state government employees (1,543 | 14.2%), and local government employees (802 | 7.4%) make up the most common classes of employment.

| Employer Class | # Employees | % Employees |
| Private Company Employees | 6,675 | 61.4% |
| Self-Employed (Incorporated) | 277 | 2.5% |
| Self-Employed (Not Incorporated) | 596 | 5.5% |
| Not-for-profit Organizations | 619 | 5.7% |
| Local Government Employees | 802 | 7.4% |
| State Government Employees | 1,543 | 14.2% |
| Federal Government Employees | 321 | 2.9% |
| Unpaid Family Workers | 32 | 0.3% |
| Total | 10,865 | 100.0% |
Employment Status by Age in Anderson County
According to the labor force statistics for Anderson County, out of the total population over 16 years of age (19,015), 60.5% or 11,504 individuals are in the labor force, with 5.4% or 621 of them unemployed. The age group with the highest labor force participation rate is 20 to 24 years, with 83.2% or 1,209 individuals in the labor force. Within the labor force, the 16 to 19 years age range has the highest percentage of unemployed individuals, with 28.9% or 116 of them being unemployed.

| Age Bracket | In Labor Force | Unemployed |
| 16 to 19 Years | 402 (35.5%) | 116 (28.9%) |
| 20 to 24 Years | 1,209 (83.2%) | 36 (3.0%) |
| 25 to 29 Years | 1,070 (77.9%) | 40 (3.7%) |
| 30 to 34 Years | 1,061 (78.5%) | 88 (8.3%) |
| 35 to 44 Years | 2,226 (75.7%) | 151 (6.8%) |
| 45 to 54 Years | 2,773 (77.5%) | 144 (5.2%) |
| 55 to 59 Years | 1,300 (65.1%) | 5 (0.4%) |
| 60 to 64 Years | 791 (59.4%) | 28 (3.5%) |
| 65 to 74 Years | 564 (23.9%) | 10 (1.8%) |
| 75 Years and over | 115 (7.7%) | 0 (0.0%) |
| Total | 11,504 (60.5%) | 621 (5.4%) |
Employment Status by Educational Attainment in Anderson County
According to labor force statistics for Anderson County, 73.4% of individuals (9,228) out of the total population between 25 and 64 years of age (12,572) are in the labor force, with 5.0% or 461 of them being unemployed. The group with the highest labor force participation rate are those with the educational attainment of bachelor's degree or higher, with 85.0% or 2,936 individuals in the labor force. Within the labor force, individuals with less than high school education have the highest percentage of unemployment, with 25.8% or 107 of them being unemployed.

| Educational Attainment | In Labor Force | Unemployed |
| Less than High School | 416 (39.8%) | 269 (25.8%) |
| High School Diploma | 2,710 (68.7%) | 288 (7.3%) |
| College / Associate Degree | 3,163 (76.6%) | 173 (4.2%) |
| Bachelor's Degree or higher | 2,936 (85.0%) | 24 (0.7%) |
| Total | 9,228 (73.4%) | 629 (5.0%) |
Employment Occupations by Sex in Anderson County
Management, Business, Science and Arts Occupations
The most common Management, Business, Science and Arts occupations in Anderson County are Management (1,201 | 11.0%), Community & Social Service (943 | 8.7%), Health Diagnosing & Treating (774 | 7.1%), Business & Financial (631 | 5.8%), and Education Instruction & Library (598 | 5.5%).

Management, Business, Science and Arts Occupations by Sex
Within the Management, Business, Science and Arts occupations in Anderson County, the most male-oriented occupations are Architecture & Engineering (100.0%), Education, Arts & Media (63.8%), and Computers, Engineering & Science (59.1%), while the most female-oriented occupations are Health Technologists (76.7%), Health Diagnosing & Treating (76.6%), and Education Instruction & Library (72.9%).
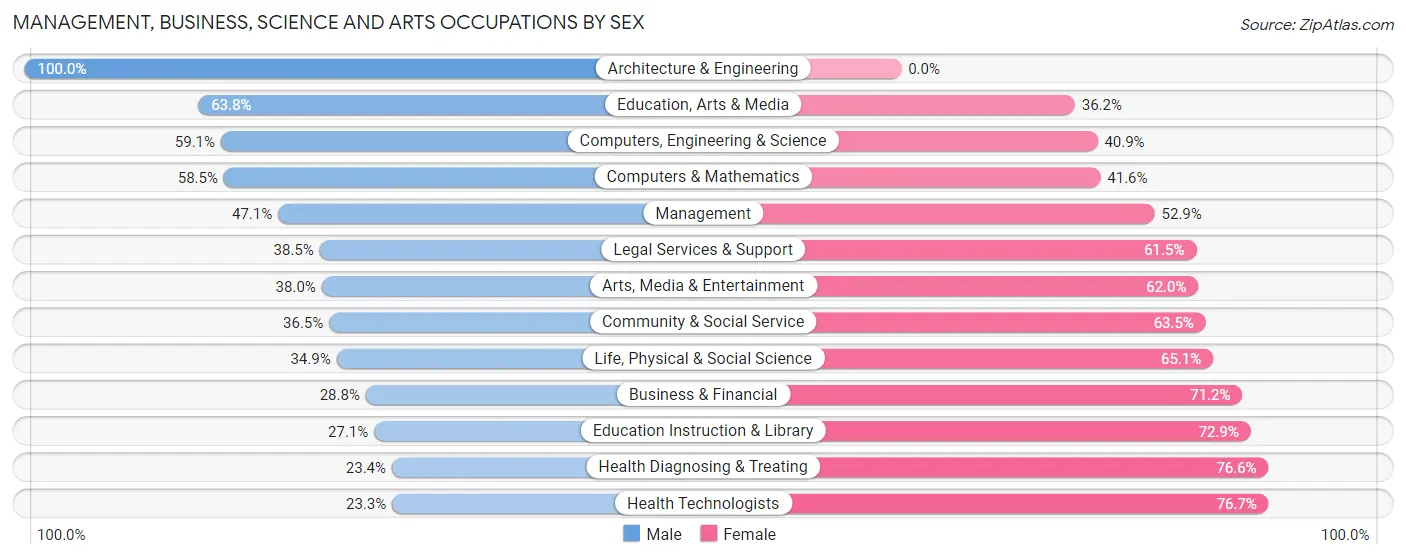
| Occupation | Male | Female |
| Management | 566 (47.1%) | 635 (52.9%) |
| Business & Financial | 182 (28.8%) | 449 (71.2%) |
| Computers, Engineering & Science | 326 (59.1%) | 226 (40.9%) |
| Computers & Mathematics | 166 (58.5%) | 118 (41.5%) |
| Architecture & Engineering | 102 (100.0%) | 0 (0.0%) |
| Life, Physical & Social Science | 58 (34.9%) | 108 (65.1%) |
| Community & Social Service | 344 (36.5%) | 599 (63.5%) |
| Education, Arts & Media | 125 (63.8%) | 71 (36.2%) |
| Legal Services & Support | 30 (38.5%) | 48 (61.5%) |
| Education Instruction & Library | 162 (27.1%) | 436 (72.9%) |
| Arts, Media & Entertainment | 27 (38.0%) | 44 (62.0%) |
| Health Diagnosing & Treating | 181 (23.4%) | 593 (76.6%) |
| Health Technologists | 134 (23.3%) | 440 (76.7%) |
| Total (Category) | 1,599 (39.0%) | 2,502 (61.0%) |
| Total (Overall) | 5,591 (51.3%) | 5,301 (48.7%) |
Services Occupations
The most common Services occupations in Anderson County are Healthcare Support (425 | 3.9%), Food Preparation & Serving (345 | 3.2%), Personal Care & Service (277 | 2.5%), Cleaning & Maintenance (205 | 1.9%), and Security & Protection (166 | 1.5%).

Services Occupations by Sex
Within the Services occupations in Anderson County, the most male-oriented occupations are Law Enforcement (92.9%), Security & Protection (90.4%), and Firefighting & Prevention (88.5%), while the most female-oriented occupations are Healthcare Support (100.0%), Food Preparation & Serving (81.2%), and Personal Care & Service (52.0%).

| Occupation | Male | Female |
| Healthcare Support | 0 (0.0%) | 425 (100.0%) |
| Security & Protection | 150 (90.4%) | 16 (9.6%) |
| Firefighting & Prevention | 85 (88.5%) | 11 (11.5%) |
| Law Enforcement | 65 (92.9%) | 5 (7.1%) |
| Food Preparation & Serving | 65 (18.8%) | 280 (81.2%) |
| Cleaning & Maintenance | 135 (65.8%) | 70 (34.2%) |
| Personal Care & Service | 133 (48.0%) | 144 (52.0%) |
| Total (Category) | 483 (34.1%) | 935 (65.9%) |
| Total (Overall) | 5,591 (51.3%) | 5,301 (48.7%) |
Sales and Office Occupations
The most common Sales and Office occupations in Anderson County are Office & Administration (1,291 | 11.8%), and Sales & Related (864 | 7.9%).

Sales and Office Occupations by Sex

| Occupation | Male | Female |
| Sales & Related | 489 (56.6%) | 375 (43.4%) |
| Office & Administration | 237 (18.4%) | 1,054 (81.6%) |
| Total (Category) | 726 (33.7%) | 1,429 (66.3%) |
| Total (Overall) | 5,591 (51.3%) | 5,301 (48.7%) |
Natural Resources, Construction and Maintenance Occupations
The most common Natural Resources, Construction and Maintenance occupations in Anderson County are Installation, Maintenance & Repair (468 | 4.3%), Construction & Extraction (463 | 4.3%), and Farming, Fishing & Forestry (93 | 0.9%).

Natural Resources, Construction and Maintenance Occupations by Sex

| Occupation | Male | Female |
| Farming, Fishing & Forestry | 42 (45.2%) | 51 (54.8%) |
| Construction & Extraction | 457 (98.7%) | 6 (1.3%) |
| Installation, Maintenance & Repair | 468 (100.0%) | 0 (0.0%) |
| Total (Category) | 967 (94.4%) | 57 (5.6%) |
| Total (Overall) | 5,591 (51.3%) | 5,301 (48.7%) |
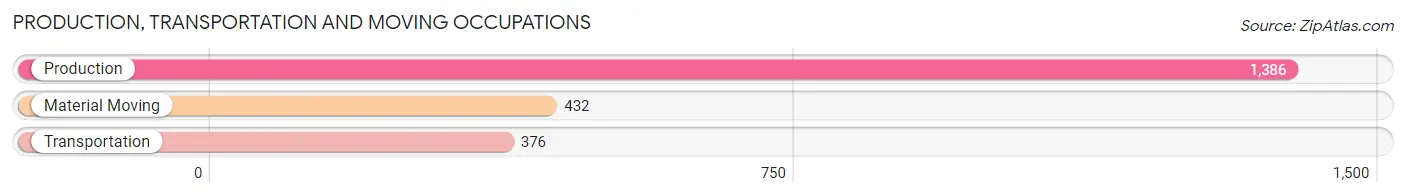
Production, Transportation and Moving Occupations
The most common Production, Transportation and Moving occupations in Anderson County are Production (1,386 | 12.7%), Material Moving (432 | 4.0%), and Transportation (376 | 3.5%).
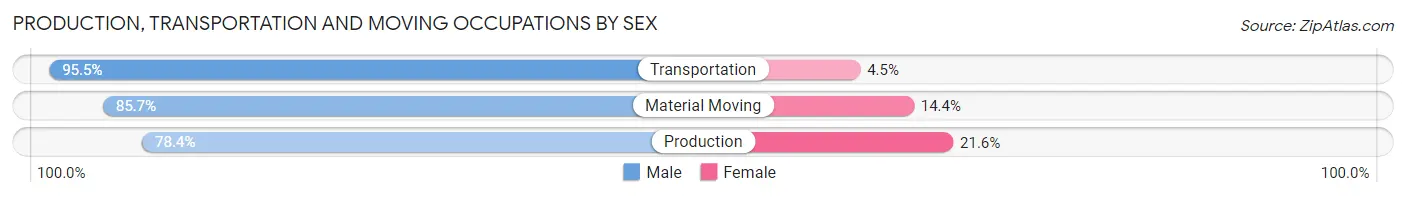
Production, Transportation and Moving Occupations by Sex
| Occupation | Male | Female |
| Production | 1,087 (78.4%) | 299 (21.6%) |
| Transportation | 359 (95.5%) | 17 (4.5%) |
| Material Moving | 370 (85.7%) | 62 (14.3%) |
| Total (Category) | 1,816 (82.8%) | 378 (17.2%) |
| Total (Overall) | 5,591 (51.3%) | 5,301 (48.7%) |
Employment Industries by Sex in Anderson County
Employment Industries in Anderson County
The major employment industries in Anderson County include Manufacturing (1,754 | 16.1%), Health Care & Social Assistance (1,677 | 15.4%), Public Administration (1,143 | 10.5%), Retail Trade (1,098 | 10.1%), and Educational Services (1,025 | 9.4%).

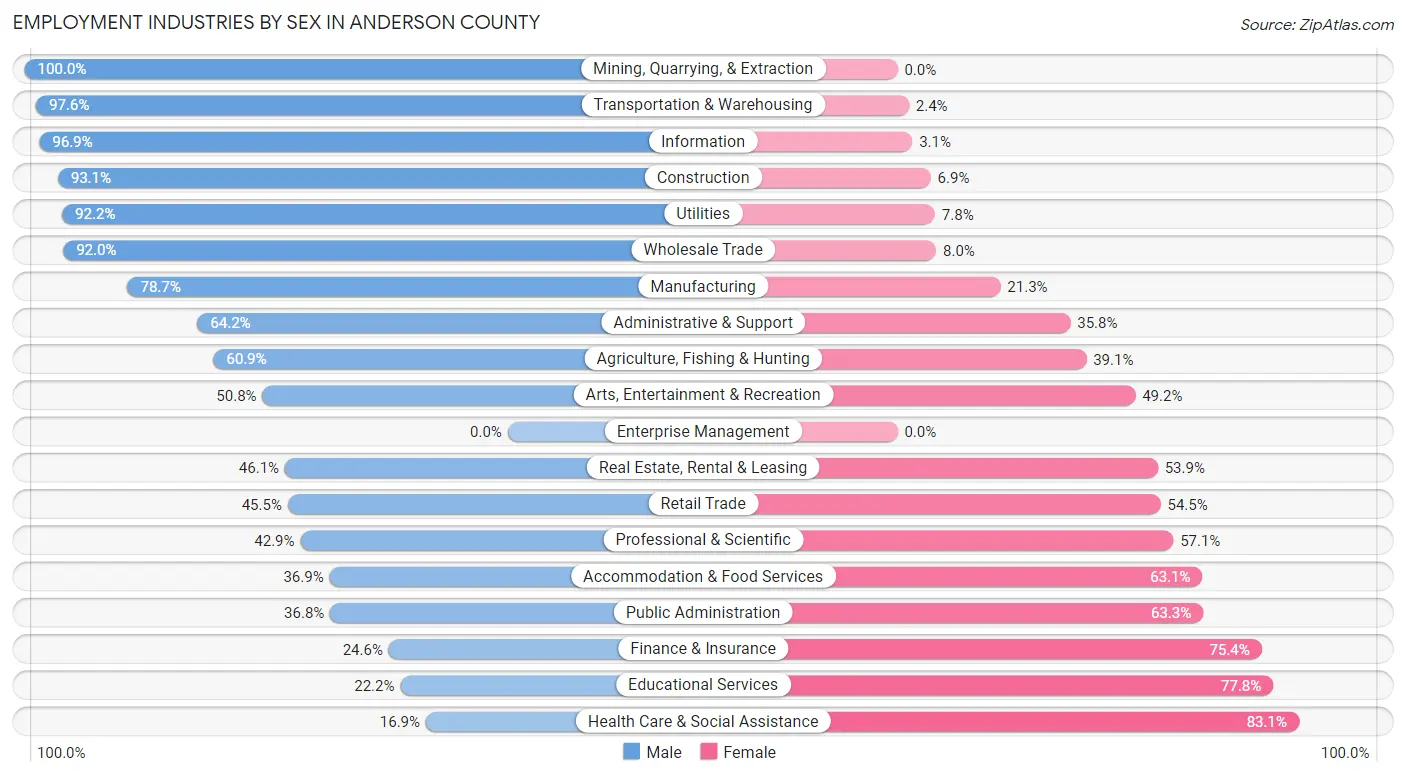
Employment Industries by Sex in Anderson County
The Anderson County industries that see more men than women are Mining, Quarrying, & Extraction (100.0%), Transportation & Warehousing (97.6%), and Information (96.9%), whereas the industries that tend to have a higher number of women are Health Care & Social Assistance (83.1%), Educational Services (77.8%), and Finance & Insurance (75.4%).
| Industry | Male | Female |
| Agriculture, Fishing & Hunting | 106 (60.9%) | 68 (39.1%) |
| Mining, Quarrying, & Extraction | 16 (100.0%) | 0 (0.0%) |
| Construction | 501 (93.1%) | 37 (6.9%) |
| Manufacturing | 1,380 (78.7%) | 374 (21.3%) |
| Wholesale Trade | 69 (92.0%) | 6 (8.0%) |
| Retail Trade | 500 (45.5%) | 598 (54.5%) |
| Transportation & Warehousing | 412 (97.6%) | 10 (2.4%) |
| Utilities | 202 (92.2%) | 17 (7.8%) |
| Information | 190 (96.9%) | 6 (3.1%) |
| Finance & Insurance | 84 (24.6%) | 257 (75.4%) |
| Real Estate, Rental & Leasing | 107 (46.1%) | 125 (53.9%) |
| Professional & Scientific | 197 (42.9%) | 262 (57.1%) |
| Enterprise Management | 0 (0.0%) | 0 (0.0%) |
| Administrative & Support | 149 (64.2%) | 83 (35.8%) |
| Educational Services | 228 (22.2%) | 797 (77.8%) |
| Health Care & Social Assistance | 284 (16.9%) | 1,393 (83.1%) |
| Arts, Entertainment & Recreation | 65 (50.8%) | 63 (49.2%) |
| Accommodation & Food Services | 152 (36.9%) | 260 (63.1%) |
| Public Administration | 420 (36.7%) | 723 (63.2%) |
| Total | 5,591 (51.3%) | 5,301 (48.7%) |
Education in Anderson County
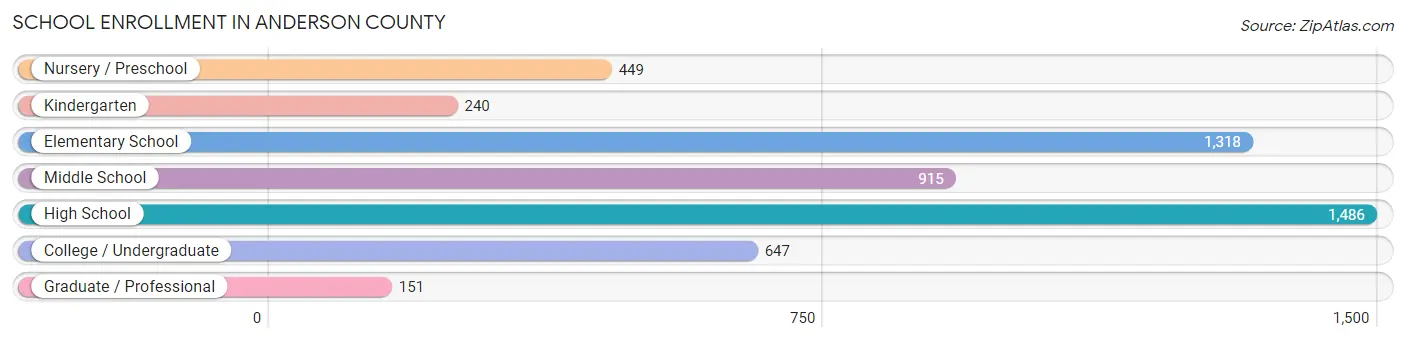
School Enrollment in Anderson County
The most common levels of schooling among the 5,206 students in Anderson County are high school (1,486 | 28.5%), elementary school (1,318 | 25.3%), and middle school (915 | 17.6%).
| School Level | # Students | % Students |
| Nursery / Preschool | 449 | 8.6% |
| Kindergarten | 240 | 4.6% |
| Elementary School | 1,318 | 25.3% |
| Middle School | 915 | 17.6% |
| High School | 1,486 | 28.5% |
| College / Undergraduate | 647 | 12.4% |
| Graduate / Professional | 151 | 2.9% |
| Total | 5,206 | 100.0% |
School Enrollment by Age by Funding Source in Anderson County
Out of a total of 5,206 students who are enrolled in schools in Anderson County, 880 (16.9%) attend a private institution, while the remaining 4,326 (83.1%) are enrolled in public schools. The age group of 10 to 14 year olds has the highest likelihood of being enrolled in private schools, with 356 (27.3% in the age bracket) enrolled. Conversely, the age group of 18 to 19 year olds has the lowest likelihood of being enrolled in a private school, with 329 (96.2% in the age bracket) attending a public institution.

| Age Bracket | Public School | Private School |
| 3 to 4 Year Olds | 150 (74.6%) | 51 (25.4%) |
| 5 to 9 Year Old | 1,360 (81.2%) | 314 (18.8%) |
| 10 to 14 Year Olds | 947 (72.7%) | 356 (27.3%) |
| 15 to 17 Year Olds | 904 (94.2%) | 56 (5.8%) |
| 18 to 19 Year Olds | 329 (96.2%) | 13 (3.8%) |
| 20 to 24 Year Olds | 326 (89.6%) | 38 (10.4%) |
| 25 to 34 Year Olds | 163 (86.7%) | 25 (13.3%) |
| 35 Years and over | 148 (85.1%) | 26 (14.9%) |
| Total | 4,326 (83.1%) | 880 (16.9%) |
Educational Attainment by Field of Study in Anderson County
Business (908 | 19.8%), science & technology (801 | 17.4%), education (543 | 11.8%), arts & humanities (405 | 8.8%), and liberal arts & history (378 | 8.2%) are the most common fields of study among 4,593 individuals in Anderson County who have obtained a bachelor's degree or higher.

| Field of Study | # Graduates | % Graduates |
| Computers & Mathematics | 209 | 4.5% |
| Bio, Nature & Agricultural | 326 | 7.1% |
| Physical & Health Sciences | 74 | 1.6% |
| Psychology | 229 | 5.0% |
| Social Sciences | 262 | 5.7% |
| Engineering | 127 | 2.8% |
| Multidisciplinary Studies | 22 | 0.5% |
| Science & Technology | 801 | 17.4% |
| Business | 908 | 19.8% |
| Education | 543 | 11.8% |
| Literature & Languages | 145 | 3.2% |
| Liberal Arts & History | 378 | 8.2% |
| Visual & Performing Arts | 115 | 2.5% |
| Communications | 49 | 1.1% |
| Arts & Humanities | 405 | 8.8% |
| Total | 4,593 | 100.0% |
Transportation & Commute in Anderson County
Vehicle Availability by Sex in Anderson County
The most prevalent vehicle ownership categories in Anderson County are males with 2 vehicles (1,916, accounting for 34.4%) and females with 2 vehicles (1,961, making up 36.2%).
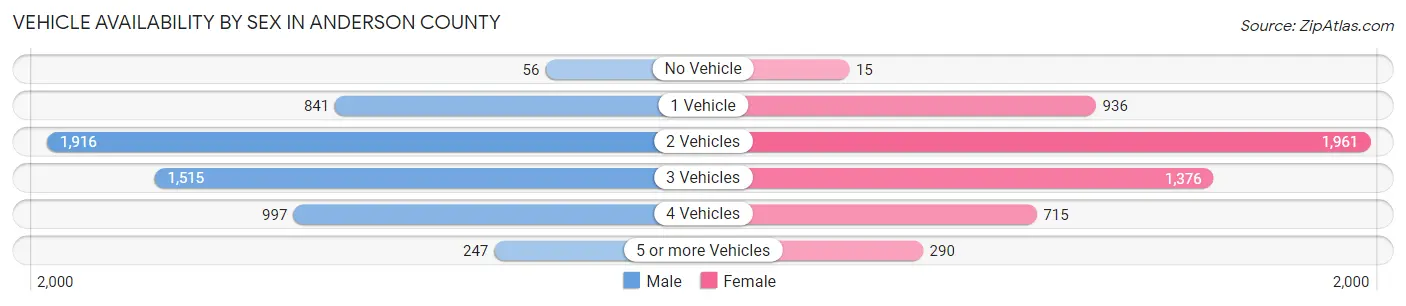
| Vehicles Available | Male | Female |
| No Vehicle | 56 (1.0%) | 15 (0.3%) |
| 1 Vehicle | 841 (15.1%) | 936 (17.7%) |
| 2 Vehicles | 1,916 (34.4%) | 1,961 (37.0%) |
| 3 Vehicles | 1,515 (27.2%) | 1,376 (26.0%) |
| 4 Vehicles | 997 (17.9%) | 715 (13.5%) |
| 5 or more Vehicles | 247 (4.4%) | 290 (5.5%) |
| Total | 5,572 (100.0%) | 5,293 (100.0%) |
Commute Time in Anderson County
The most frequently occuring commute durations in Anderson County are 30 to 34 minutes (1,638 commuters, 16.5%), 45 to 59 minutes (1,544 commuters, 15.5%), and 20 to 24 minutes (1,287 commuters, 13.0%).

| Commute Time | # Commuters | % Commuters |
| Less than 5 Minutes | 272 | 2.7% |
| 5 to 9 Minutes | 900 | 9.1% |
| 10 to 14 Minutes | 931 | 9.4% |
| 15 to 19 Minutes | 983 | 9.9% |
| 20 to 24 Minutes | 1,287 | 13.0% |
| 25 to 29 Minutes | 688 | 6.9% |
| 30 to 34 Minutes | 1,638 | 16.5% |
| 35 to 39 Minutes | 494 | 5.0% |
| 40 to 44 Minutes | 553 | 5.6% |
| 45 to 59 Minutes | 1,544 | 15.5% |
| 60 to 89 Minutes | 479 | 4.8% |
| 90 or more Minutes | 158 | 1.6% |
Commute Time by Sex in Anderson County
The most common commute times in Anderson County are 45 to 59 minutes (802 commuters, 15.8%) for males and 30 to 34 minutes (929 commuters, 19.2%) for females.
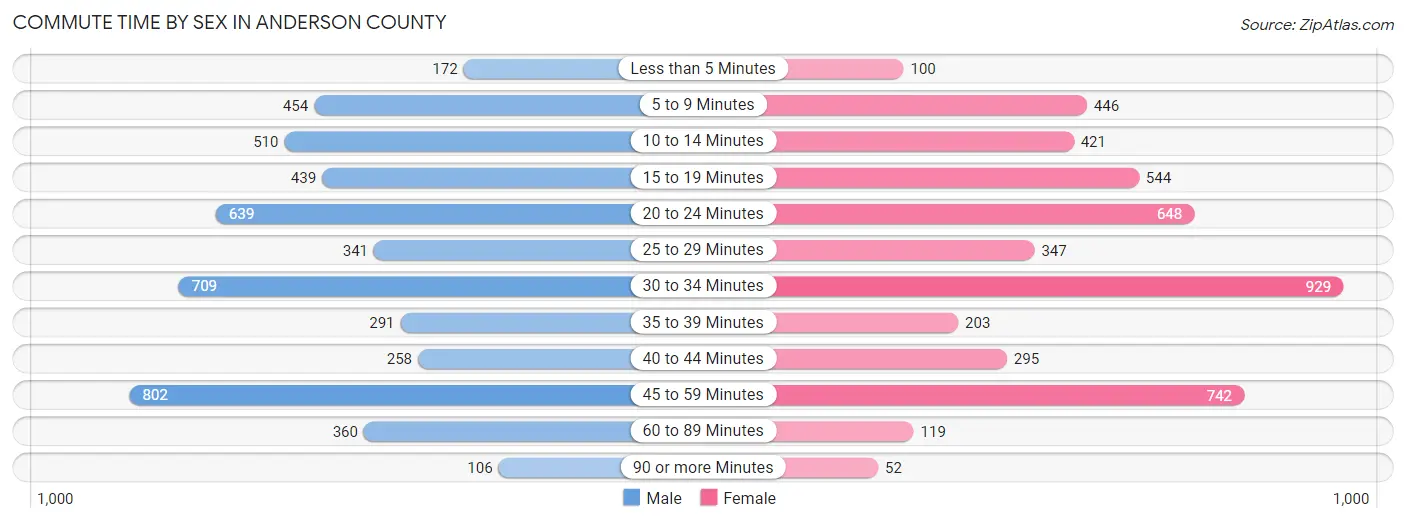
| Commute Time | Male | Female |
| Less than 5 Minutes | 172 (3.4%) | 100 (2.1%) |
| 5 to 9 Minutes | 454 (8.9%) | 446 (9.2%) |
| 10 to 14 Minutes | 510 (10.0%) | 421 (8.7%) |
| 15 to 19 Minutes | 439 (8.6%) | 544 (11.2%) |
| 20 to 24 Minutes | 639 (12.6%) | 648 (13.4%) |
| 25 to 29 Minutes | 341 (6.7%) | 347 (7.2%) |
| 30 to 34 Minutes | 709 (14.0%) | 929 (19.2%) |
| 35 to 39 Minutes | 291 (5.7%) | 203 (4.2%) |
| 40 to 44 Minutes | 258 (5.1%) | 295 (6.1%) |
| 45 to 59 Minutes | 802 (15.8%) | 742 (15.3%) |
| 60 to 89 Minutes | 360 (7.1%) | 119 (2.5%) |
| 90 or more Minutes | 106 (2.1%) | 52 (1.1%) |
Time of Departure to Work by Sex in Anderson County
The most frequent times of departure to work in Anderson County are 7:00 AM to 7:29 AM (898, 17.7%) for males and 7:00 AM to 7:29 AM (1,026, 21.2%) for females.

| Time of Departure | Male | Female |
| 12:00 AM to 4:59 AM | 235 (4.6%) | 196 (4.0%) |
| 5:00 AM to 5:29 AM | 161 (3.2%) | 148 (3.0%) |
| 5:30 AM to 5:59 AM | 227 (4.5%) | 81 (1.7%) |
| 6:00 AM to 6:29 AM | 580 (11.4%) | 525 (10.8%) |
| 6:30 AM to 6:59 AM | 602 (11.8%) | 554 (11.4%) |
| 7:00 AM to 7:29 AM | 898 (17.7%) | 1,026 (21.2%) |
| 7:30 AM to 7:59 AM | 559 (11.0%) | 775 (16.0%) |
| 8:00 AM to 8:29 AM | 620 (12.2%) | 376 (7.8%) |
| 8:30 AM to 8:59 AM | 138 (2.7%) | 248 (5.1%) |
| 9:00 AM to 9:59 AM | 194 (3.8%) | 145 (3.0%) |
| 10:00 AM to 10:59 AM | 30 (0.6%) | 35 (0.7%) |
| 11:00 AM to 11:59 AM | 55 (1.1%) | 71 (1.5%) |
| 12:00 PM to 3:59 PM | 389 (7.7%) | 223 (4.6%) |
| 4:00 PM to 11:59 PM | 393 (7.7%) | 443 (9.1%) |
| Total | 5,081 (100.0%) | 4,846 (100.0%) |
Housing Occupancy in Anderson County
Occupancy by Ownership in Anderson County
Of the total 9,180 dwellings in Anderson County, owner-occupied units account for 7,236 (78.8%), while renter-occupied units make up 1,944 (21.2%).

| Occupancy | # Housing Units | % Housing Units |
| Owner Occupied Housing Units | 7,236 | 78.8% |
| Renter-Occupied Housing Units | 1,944 | 21.2% |
| Total Occupied Housing Units | 9,180 | 100.0% |
Occupancy by Household Size in Anderson County
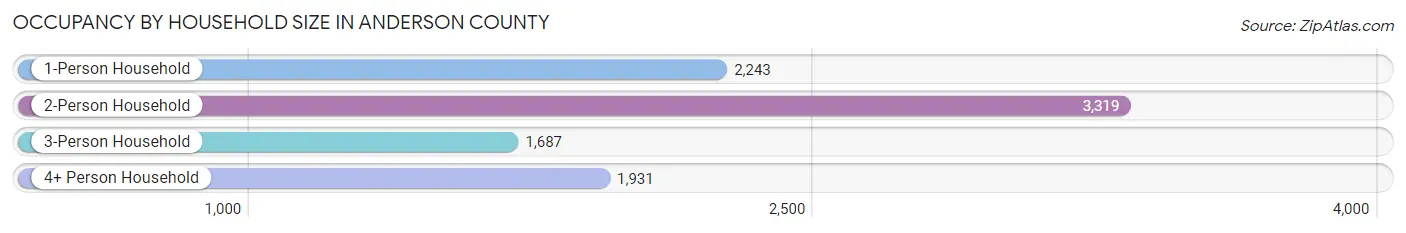
| Household Size | # Housing Units | % Housing Units |
| 1-Person Household | 2,243 | 24.4% |
| 2-Person Household | 3,319 | 36.1% |
| 3-Person Household | 1,687 | 18.4% |
| 4+ Person Household | 1,931 | 21.0% |
| Total Housing Units | 9,180 | 100.0% |
Occupancy by Ownership by Household Size in Anderson County

| Household Size | Owner-occupied | Renter-occupied |
| 1-Person Household | 1,497 (66.7%) | 746 (33.3%) |
| 2-Person Household | 2,815 (84.8%) | 504 (15.2%) |
| 3-Person Household | 1,452 (86.1%) | 235 (13.9%) |
| 4+ Person Household | 1,472 (76.2%) | 459 (23.8%) |
| Total Housing Units | 7,236 (78.8%) | 1,944 (21.2%) |
Occupancy by Educational Attainment in Anderson County
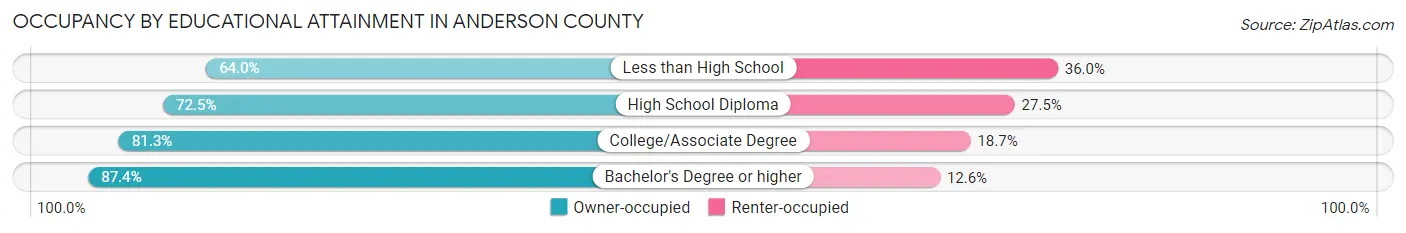
| Household Size | Owner-occupied | Renter-occupied |
| Less than High School | 311 (64.0%) | 175 (36.0%) |
| High School Diploma | 2,349 (72.5%) | 889 (27.5%) |
| College/Associate Degree | 2,557 (81.3%) | 588 (18.7%) |
| Bachelor's Degree or higher | 2,019 (87.4%) | 292 (12.6%) |
Occupancy by Age of Householder in Anderson County
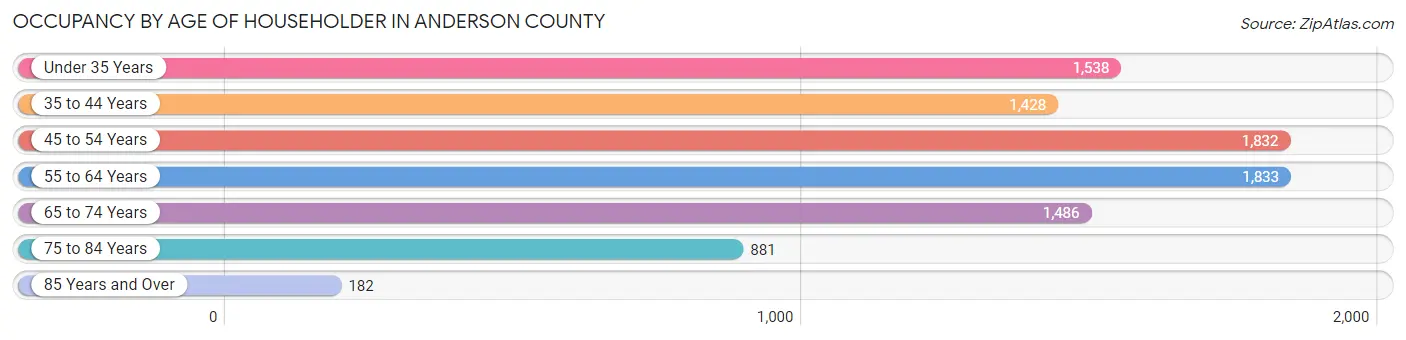
| Age Bracket | # Households | % Households |
| Under 35 Years | 1,538 | 16.8% |
| 35 to 44 Years | 1,428 | 15.6% |
| 45 to 54 Years | 1,832 | 20.0% |
| 55 to 64 Years | 1,833 | 20.0% |
| 65 to 74 Years | 1,486 | 16.2% |
| 75 to 84 Years | 881 | 9.6% |
| 85 Years and Over | 182 | 2.0% |
| Total | 9,180 | 100.0% |
Housing Finances in Anderson County
Median Income by Occupancy in Anderson County
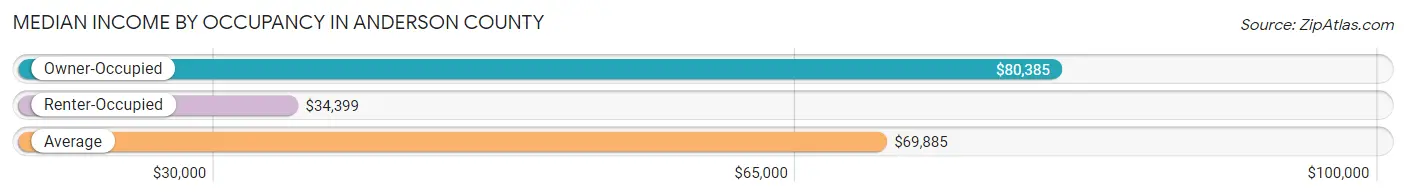
| Occupancy Type | # Households | Median Income |
| Owner-Occupied | 7,236 (78.8%) | $80,385 |
| Renter-Occupied | 1,944 (21.2%) | $34,399 |
| Average | 9,180 (100.0%) | $69,885 |
Occupancy by Householder Income Bracket in Anderson County
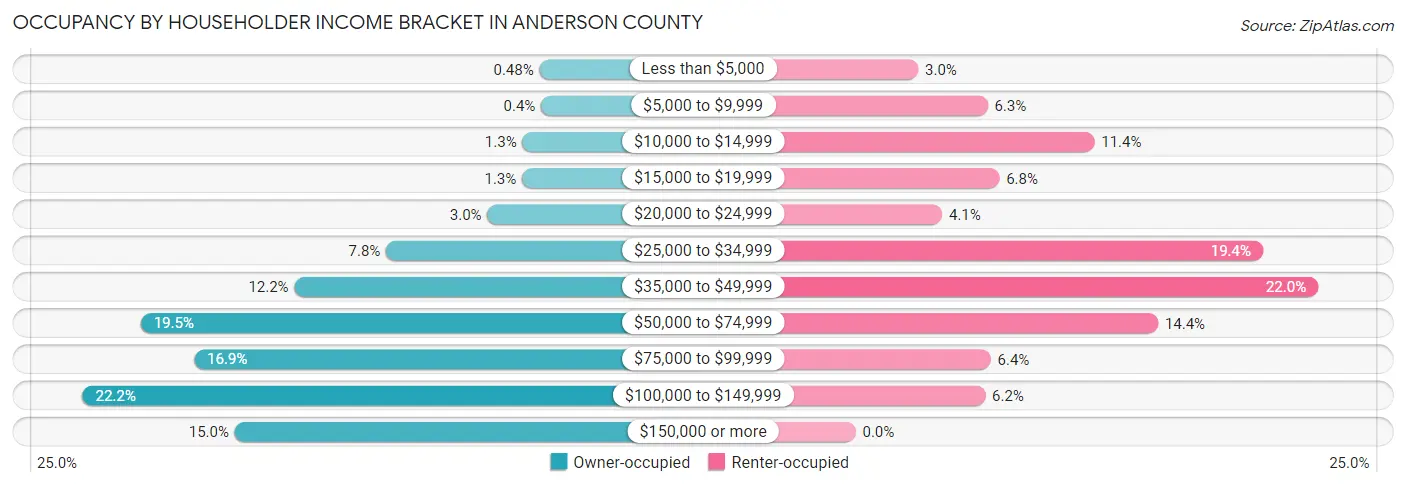
| Income Bracket | Owner-occupied | Renter-occupied |
| Less than $5,000 | 35 (0.5%) | 58 (3.0%) |
| $5,000 to $9,999 | 29 (0.4%) | 122 (6.3%) |
| $10,000 to $14,999 | 93 (1.3%) | 221 (11.4%) |
| $15,000 to $19,999 | 95 (1.3%) | 133 (6.8%) |
| $20,000 to $24,999 | 214 (3.0%) | 80 (4.1%) |
| $25,000 to $34,999 | 563 (7.8%) | 377 (19.4%) |
| $35,000 to $49,999 | 879 (12.1%) | 428 (22.0%) |
| $50,000 to $74,999 | 1,409 (19.5%) | 280 (14.4%) |
| $75,000 to $99,999 | 1,225 (16.9%) | 125 (6.4%) |
| $100,000 to $149,999 | 1,609 (22.2%) | 120 (6.2%) |
| $150,000 or more | 1,085 (15.0%) | 0 (0.0%) |
| Total | 7,236 (100.0%) | 1,944 (100.0%) |
Monthly Housing Cost Tiers in Anderson County
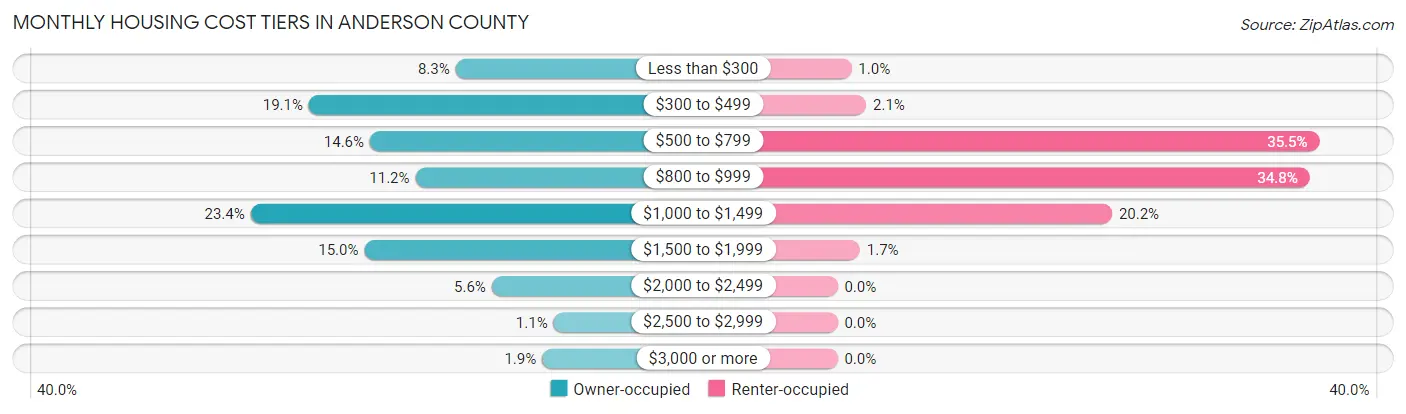
| Monthly Cost | Owner-occupied | Renter-occupied |
| Less than $300 | 598 (8.3%) | 20 (1.0%) |
| $300 to $499 | 1,380 (19.1%) | 41 (2.1%) |
| $500 to $799 | 1,054 (14.6%) | 690 (35.5%) |
| $800 to $999 | 812 (11.2%) | 676 (34.8%) |
| $1,000 to $1,499 | 1,690 (23.4%) | 393 (20.2%) |
| $1,500 to $1,999 | 1,084 (15.0%) | 32 (1.7%) |
| $2,000 to $2,499 | 405 (5.6%) | 0 (0.0%) |
| $2,500 to $2,999 | 76 (1.1%) | 0 (0.0%) |
| $3,000 or more | 137 (1.9%) | 0 (0.0%) |
| Total | 7,236 (100.0%) | 1,944 (100.0%) |
Physical Housing Characteristics in Anderson County
Housing Structures in Anderson County
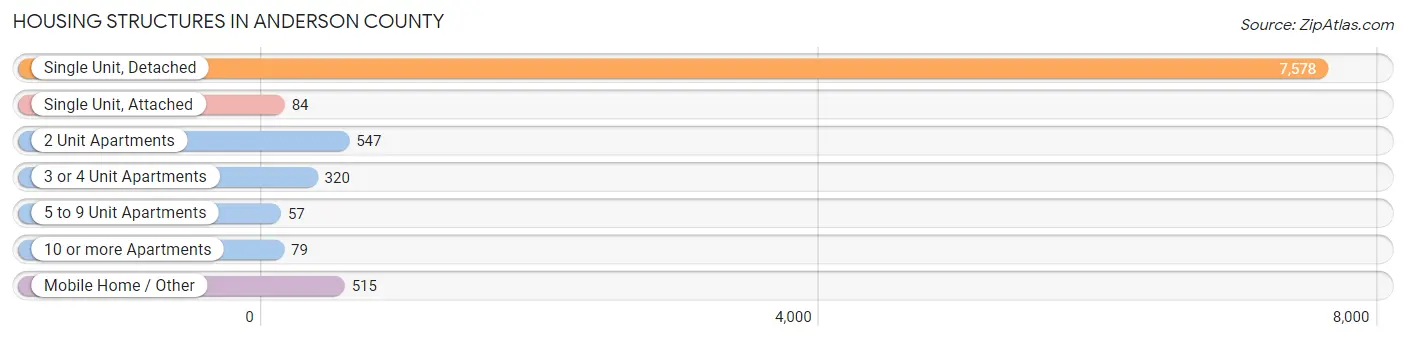
| Structure Type | # Housing Units | % Housing Units |
| Single Unit, Detached | 7,578 | 82.6% |
| Single Unit, Attached | 84 | 0.9% |
| 2 Unit Apartments | 547 | 6.0% |
| 3 or 4 Unit Apartments | 320 | 3.5% |
| 5 to 9 Unit Apartments | 57 | 0.6% |
| 10 or more Apartments | 79 | 0.9% |
| Mobile Home / Other | 515 | 5.6% |
| Total | 9,180 | 100.0% |
Housing Structures by Occupancy in Anderson County
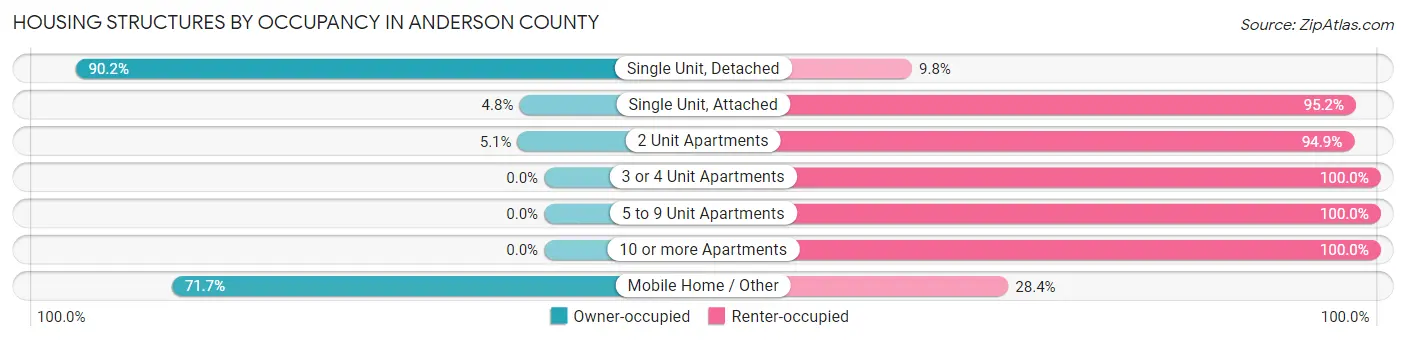
| Structure Type | Owner-occupied | Renter-occupied |
| Single Unit, Detached | 6,835 (90.2%) | 743 (9.8%) |
| Single Unit, Attached | 4 (4.8%) | 80 (95.2%) |
| 2 Unit Apartments | 28 (5.1%) | 519 (94.9%) |
| 3 or 4 Unit Apartments | 0 (0.0%) | 320 (100.0%) |
| 5 to 9 Unit Apartments | 0 (0.0%) | 57 (100.0%) |
| 10 or more Apartments | 0 (0.0%) | 79 (100.0%) |
| Mobile Home / Other | 369 (71.7%) | 146 (28.3%) |
| Total | 7,236 (78.8%) | 1,944 (21.2%) |
Housing Structures by Number of Rooms in Anderson County

| Number of Rooms | Owner-occupied | Renter-occupied |
| 1 Room | 4 (0.1%) | 0 (0.0%) |
| 2 or 3 Rooms | 45 (0.6%) | 217 (11.2%) |
| 4 or 5 Rooms | 1,827 (25.3%) | 1,101 (56.6%) |
| 6 or 7 Rooms | 3,428 (47.4%) | 559 (28.8%) |
| 8 or more Rooms | 1,932 (26.7%) | 67 (3.5%) |
| Total | 7,236 (100.0%) | 1,944 (100.0%) |
Housing Structure by Heating Type in Anderson County

| Heating Type | Owner-occupied | Renter-occupied |
| Utility Gas | 1,545 (21.3%) | 415 (21.3%) |
| Bottled, Tank, or LP Gas | 392 (5.4%) | 83 (4.3%) |
| Electricity | 4,871 (67.3%) | 1,414 (72.7%) |
| Fuel Oil or Kerosene | 13 (0.2%) | 0 (0.0%) |
| Coal or Coke | 0 (0.0%) | 0 (0.0%) |
| All other Fuels | 353 (4.9%) | 24 (1.2%) |
| No Fuel Used | 62 (0.9%) | 8 (0.4%) |
| Total | 7,236 (100.0%) | 1,944 (100.0%) |
Household Vehicle Usage in Anderson County
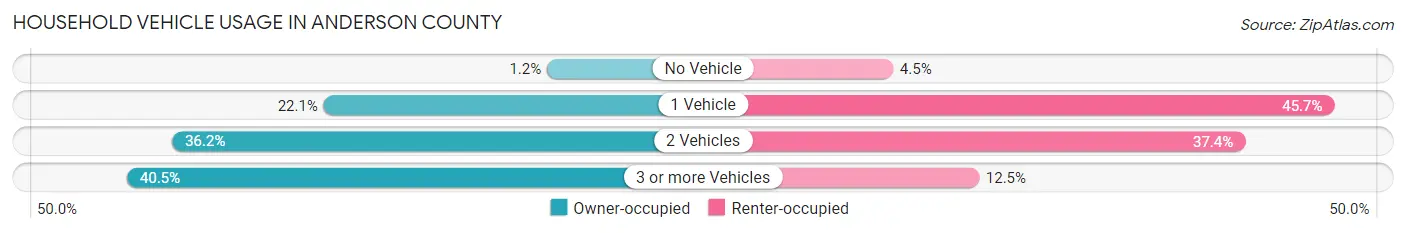
| Vehicles per Household | Owner-occupied | Renter-occupied |
| No Vehicle | 89 (1.2%) | 87 (4.5%) |
| 1 Vehicle | 1,598 (22.1%) | 888 (45.7%) |
| 2 Vehicles | 2,622 (36.2%) | 726 (37.3%) |
| 3 or more Vehicles | 2,927 (40.5%) | 243 (12.5%) |
| Total | 7,236 (100.0%) | 1,944 (100.0%) |
Real Estate & Mortgages in Anderson County
Real Estate and Mortgage Overview in Anderson County
| Characteristic | Without Mortgage | With Mortgage |
| Housing Units | 2,793 | 4,443 |
| Median Property Value | $190,800 | $201,000 |
| Median Household Income | $65,179 | $772 |
| Monthly Housing Costs | $391 | $137 |
| Real Estate Taxes | $1,361 | $94 |
Property Value by Mortgage Status in Anderson County
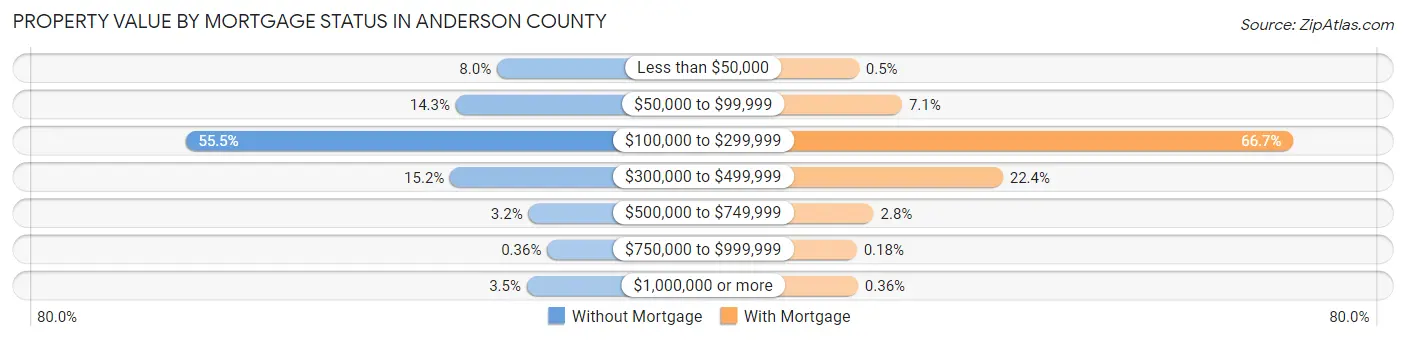
| Property Value | Without Mortgage | With Mortgage |
| Less than $50,000 | 224 (8.0%) | 22 (0.5%) |
| $50,000 to $99,999 | 399 (14.3%) | 314 (7.1%) |
| $100,000 to $299,999 | 1,550 (55.5%) | 2,964 (66.7%) |
| $300,000 to $499,999 | 423 (15.1%) | 997 (22.4%) |
| $500,000 to $749,999 | 90 (3.2%) | 122 (2.8%) |
| $750,000 to $999,999 | 10 (0.4%) | 8 (0.2%) |
| $1,000,000 or more | 97 (3.5%) | 16 (0.4%) |
| Total | 2,793 (100.0%) | 4,443 (100.0%) |
Household Income by Mortgage Status in Anderson County

| Household Income | Without Mortgage | With Mortgage |
| Less than $10,000 | 18 (0.6%) | 108 (2.4%) |
| $10,000 to $24,999 | 332 (11.9%) | 46 (1.0%) |
| $25,000 to $34,999 | 293 (10.5%) | 70 (1.6%) |
| $35,000 to $49,999 | 452 (16.2%) | 270 (6.1%) |
| $50,000 to $74,999 | 403 (14.4%) | 427 (9.6%) |
| $75,000 to $99,999 | 515 (18.4%) | 1,006 (22.6%) |
| $100,000 to $149,999 | 467 (16.7%) | 710 (16.0%) |
| $150,000 or more | 313 (11.2%) | 1,142 (25.7%) |
| Total | 2,793 (100.0%) | 4,443 (100.0%) |
Property Value to Household Income Ratio in Anderson County
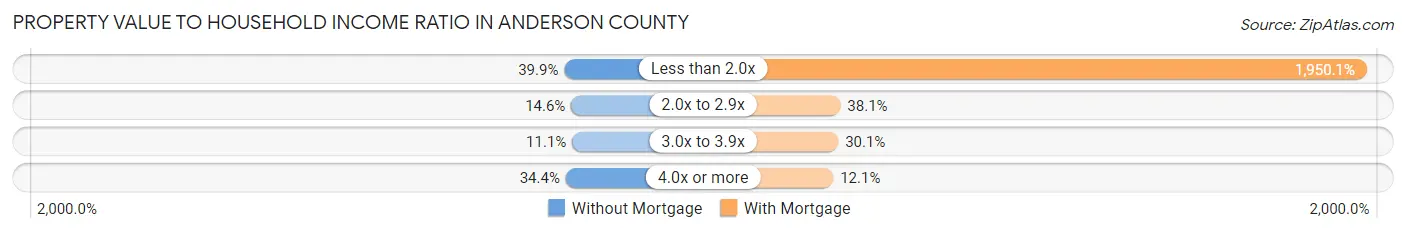
| Value-to-Income Ratio | Without Mortgage | With Mortgage |
| Less than 2.0x | 1,115 (39.9%) | 86,643 (1,950.1%) |
| 2.0x to 2.9x | 407 (14.6%) | 1,693 (38.1%) |
| 3.0x to 3.9x | 310 (11.1%) | 1,336 (30.1%) |
| 4.0x or more | 961 (34.4%) | 539 (12.1%) |
| Total | 2,793 (100.0%) | 4,443 (100.0%) |
Real Estate Taxes by Mortgage Status in Anderson County
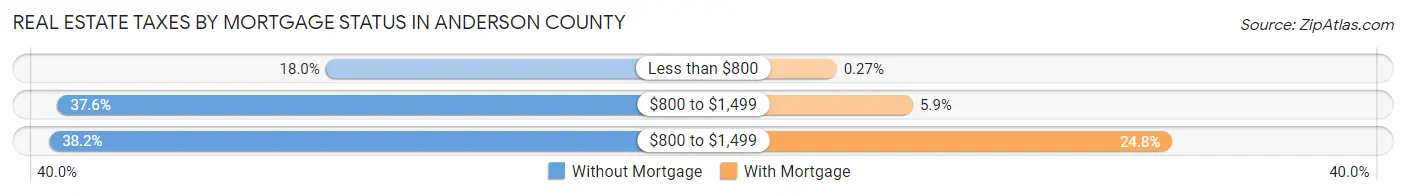
| Property Taxes | Without Mortgage | With Mortgage |
| Less than $800 | 503 (18.0%) | 12 (0.3%) |
| $800 to $1,499 | 1,050 (37.6%) | 260 (5.9%) |
| $800 to $1,499 | 1,067 (38.2%) | 1,101 (24.8%) |
| Total | 2,793 (100.0%) | 4,443 (100.0%) |
Health & Disability in Anderson County
Health Insurance Coverage by Age in Anderson County
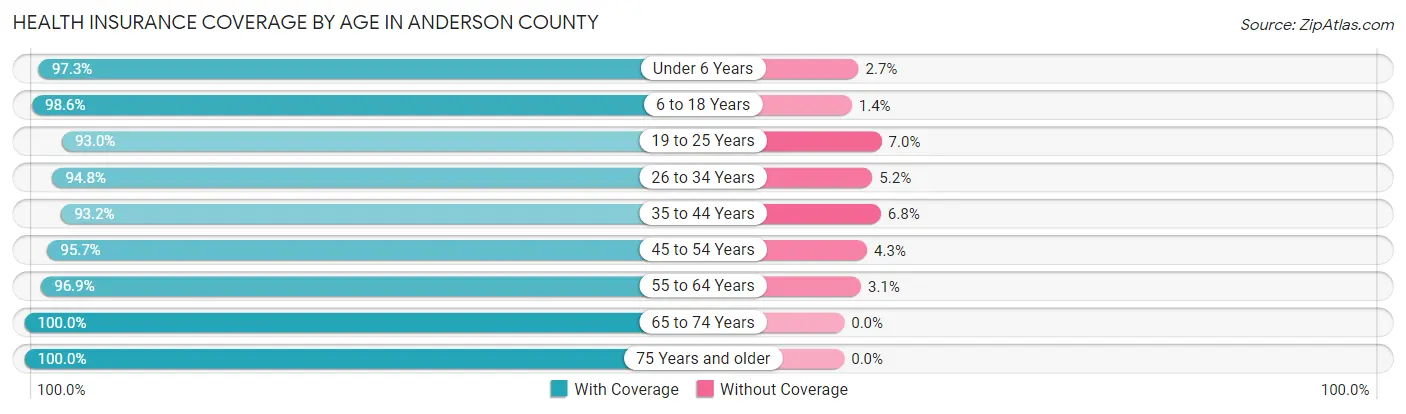
| Age Bracket | With Coverage | Without Coverage |
| Under 6 Years | 1,825 (97.3%) | 50 (2.7%) |
| 6 to 18 Years | 3,836 (98.6%) | 55 (1.4%) |
| 19 to 25 Years | 2,002 (93.0%) | 150 (7.0%) |
| 26 to 34 Years | 2,099 (94.8%) | 116 (5.2%) |
| 35 to 44 Years | 2,740 (93.2%) | 201 (6.8%) |
| 45 to 54 Years | 3,418 (95.7%) | 152 (4.3%) |
| 55 to 64 Years | 3,201 (96.9%) | 103 (3.1%) |
| 65 to 74 Years | 2,353 (100.0%) | 0 (0.0%) |
| 75 Years and older | 1,439 (100.0%) | 0 (0.0%) |
| Total | 22,913 (96.5%) | 827 (3.5%) |
Health Insurance Coverage by Citizenship Status in Anderson County

| Citizenship Status | With Coverage | Without Coverage |
| Native Born | 1,825 (97.3%) | 50 (2.7%) |
| Foreign Born, Citizen | 3,836 (98.6%) | 55 (1.4%) |
| Foreign Born, not a Citizen | 2,002 (93.0%) | 150 (7.0%) |
Health Insurance Coverage by Household Income in Anderson County
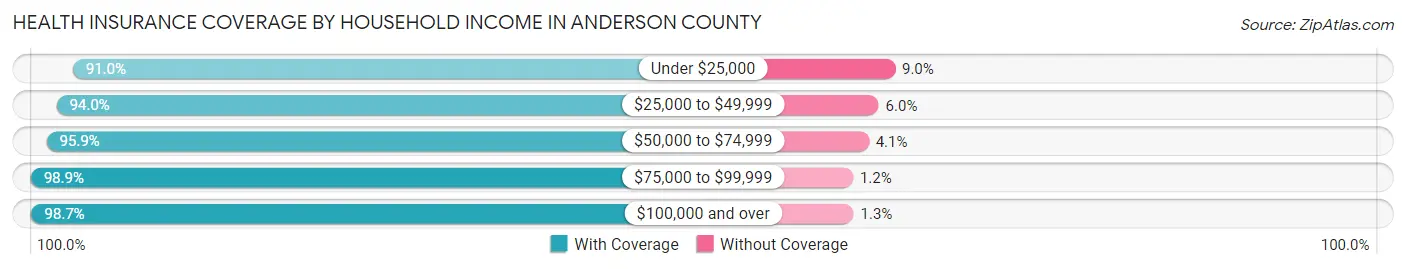
| Household Income | With Coverage | Without Coverage |
| Under $25,000 | 1,822 (91.0%) | 181 (9.0%) |
| $25,000 to $49,999 | 5,022 (94.0%) | 319 (6.0%) |
| $50,000 to $74,999 | 4,167 (95.9%) | 178 (4.1%) |
| $75,000 to $99,999 | 3,854 (98.9%) | 45 (1.1%) |
| $100,000 and over | 8,048 (98.7%) | 104 (1.3%) |
Public vs Private Health Insurance Coverage by Age in Anderson County

| Age Bracket | Public Insurance | Private Insurance |
| Under 6 | 985 (52.5%) | 920 (49.1%) |
| 6 to 18 Years | 1,487 (38.2%) | 2,695 (69.3%) |
| 19 to 25 Years | 655 (30.4%) | 1,396 (64.9%) |
| 25 to 34 Years | 671 (30.3%) | 1,484 (67.0%) |
| 35 to 44 Years | 625 (21.2%) | 2,255 (76.7%) |
| 45 to 54 Years | 857 (24.0%) | 2,784 (78.0%) |
| 55 to 64 Years | 920 (27.9%) | 2,424 (73.4%) |
| 65 to 74 Years | 2,240 (95.2%) | 1,638 (69.6%) |
| 75 Years and over | 1,426 (99.1%) | 856 (59.5%) |
| Total | 9,866 (41.6%) | 16,452 (69.3%) |
Disability Status by Sex by Age in Anderson County

| Age Bracket | Male | Female |
| Under 5 Years | 0 (0.0%) | 0 (0.0%) |
| 5 to 17 Years | 151 (6.8%) | 62 (3.2%) |
| 18 to 34 Years | 296 (12.6%) | 214 (9.6%) |
| 35 to 64 Years | 1,342 (26.6%) | 991 (20.7%) |
| 65 to 74 Years | 322 (28.5%) | 352 (28.8%) |
| 75 Years and over | 277 (48.0%) | 332 (38.5%) |
Disability Class by Sex by Age in Anderson County
Disability Class: Hearing Difficulty

| Age Bracket | Male | Female |
| Under 5 Years | 0 (0.0%) | 0 (0.0%) |
| 5 to 17 Years | 0 (0.0%) | 7 (0.4%) |
| 18 to 34 Years | 30 (1.3%) | 4 (0.2%) |
| 35 to 64 Years | 425 (8.4%) | 197 (4.1%) |
| 65 to 74 Years | 168 (14.9%) | 78 (6.4%) |
| 75 Years and over | 192 (33.3%) | 145 (16.8%) |
Disability Class: Vision Difficulty

| Age Bracket | Male | Female |
| Under 5 Years | 0 (0.0%) | 0 (0.0%) |
| 5 to 17 Years | 0 (0.0%) | 0 (0.0%) |
| 18 to 34 Years | 75 (3.2%) | 0 (0.0%) |
| 35 to 64 Years | 141 (2.8%) | 150 (3.1%) |
| 65 to 74 Years | 75 (6.6%) | 76 (6.2%) |
| 75 Years and over | 5 (0.9%) | 78 (9.0%) |
Disability Class: Cognitive Difficulty

| Age Bracket | Male | Female |
| 5 to 17 Years | 89 (4.0%) | 35 (1.8%) |
| 18 to 34 Years | 132 (5.6%) | 210 (9.4%) |
| 35 to 64 Years | 418 (8.3%) | 269 (5.6%) |
| 65 to 74 Years | 50 (4.4%) | 69 (5.6%) |
| 75 Years and over | 90 (15.6%) | 103 (11.9%) |
Disability Class: Ambulatory Difficulty
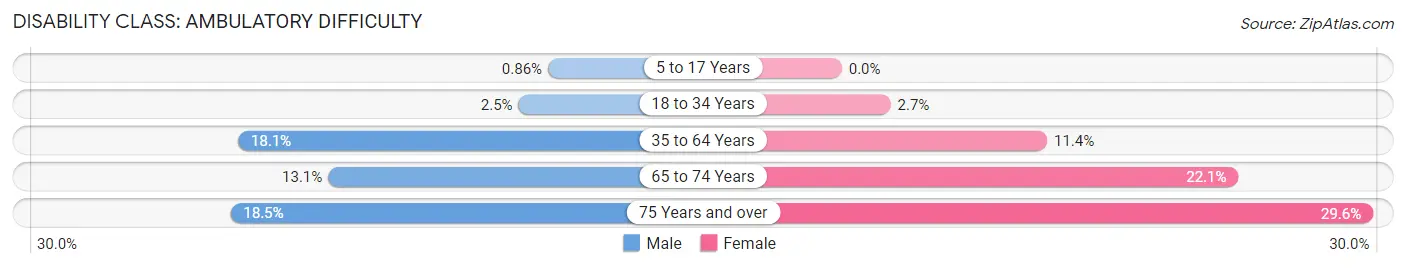
| Age Bracket | Male | Female |
| 5 to 17 Years | 19 (0.9%) | 0 (0.0%) |
| 18 to 34 Years | 59 (2.5%) | 61 (2.7%) |
| 35 to 64 Years | 913 (18.1%) | 546 (11.4%) |
| 65 to 74 Years | 148 (13.1%) | 270 (22.1%) |
| 75 Years and over | 107 (18.5%) | 255 (29.6%) |
Disability Class: Self-Care Difficulty

| Age Bracket | Male | Female |
| 5 to 17 Years | 62 (2.8%) | 20 (1.0%) |
| 18 to 34 Years | 18 (0.8%) | 4 (0.2%) |
| 35 to 64 Years | 409 (8.1%) | 85 (1.8%) |
| 65 to 74 Years | 28 (2.5%) | 43 (3.5%) |
| 75 Years and over | 37 (6.4%) | 73 (8.5%) |
Technology Access in Anderson County
Computing Device Access in Anderson County
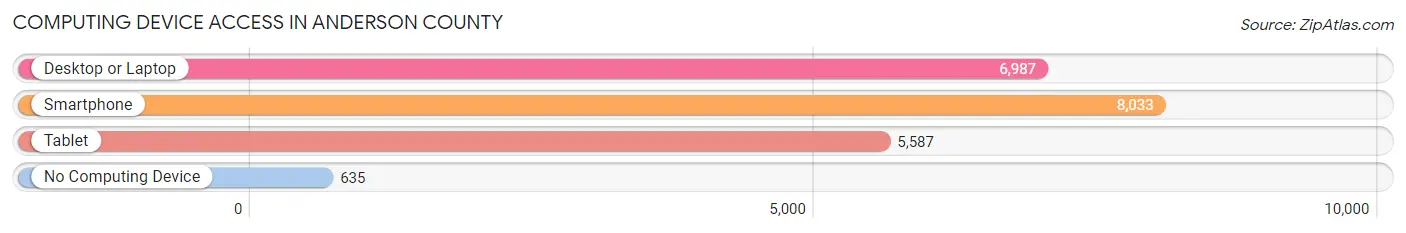
| Device Type | # Households | % Households |
| Desktop or Laptop | 6,987 | 76.1% |
| Smartphone | 8,033 | 87.5% |
| Tablet | 5,587 | 60.9% |
| No Computing Device | 635 | 6.9% |
| Total | 9,180 | 100.0% |
Internet Access in Anderson County

| Internet Type | # Households | % Households |
| Dial-Up Internet | 0 | 0.0% |
| Broadband Home | 5,443 | 59.3% |
| Cellular Data Only | 1,616 | 17.6% |
| Satellite Internet | 1,280 | 13.9% |
| No Internet | 1,165 | 12.7% |
| Total | 9,180 | 100.0% |
Anderson County Summary
Anderson County is located in the Bluegrass region of Kentucky, and is bordered by Franklin, Mercer, Washington, and Boyle counties. It is the home of the city of Lawrenceburg, the county seat, and is part of the Lexington-Fayette Metropolitan Statistical Area. The county was formed in 1827 from parts of Franklin, Mercer, and Washington counties, and was named for Richard Clough Anderson, a Revolutionary War soldier and statesman.
Geography
Anderson County is located in the Bluegrass region of Kentucky, and is bordered by Franklin, Mercer, Washington, and Boyle counties. It is situated in the central part of the state, and is approximately 25 miles south of Lexington. The county has a total area of 246 square miles, of which 245 square miles is land and 1 square mile is water. The terrain is mostly rolling hills, with some flat areas in the northern part of the county. The county is drained by the Kentucky River and its tributaries, including the South Elkhorn Creek, Stoner Creek, and Hinkston Creek.
The county is home to several state parks and recreational areas, including the Anderson County Park, the Anderson County Wildlife Management Area, and the Anderson County Nature Preserve. The county is also home to the Kentucky River Palisades, a series of steep cliffs along the Kentucky River.
Demographics
As of the 2010 census, Anderson County had a population of 21,421. The racial makeup of the county was 95.2% White, 2.7% Black or African American, 0.3% Native American, 0.3% Asian, 0.2% from other races, and 1.5% from two or more races. Hispanic or Latino of any race were 0.9% of the population.
The median household income in Anderson County was $41,945, and the median family income was $50,945. The per capita income was $20,945. About 11.2% of families and 14.2% of the population were below the poverty line, including 19.2% of those under age 18 and 11.2% of those age 65 or over.
Economy
The economy of Anderson County is largely based on agriculture and manufacturing. The county is home to several large farms, and the main crops grown in the area are corn, soybeans, wheat, and hay. The county is also home to several manufacturing companies, including the Anderson County Distillery, which produces bourbon and whiskey, and the Anderson County Brewing Company, which produces craft beer.
The county is also home to several tourist attractions, including the Anderson County Park, the Anderson County Wildlife Management Area, and the Anderson County Nature Preserve. The county is also home to several wineries, including the Anderson County Winery and the Anderson County Vineyards.
Conclusion
Anderson County is a rural county located in the Bluegrass region of Kentucky. It is bordered by Franklin, Mercer, Washington, and Boyle counties, and is home to the city of Lawrenceburg, the county seat. The county has a population of 21,421, and the economy is largely based on agriculture and manufacturing. The county is home to several state parks and recreational areas, as well as several wineries and tourist attractions.
Common Questions
What is the Total Population of Anderson County?
Total Population of Anderson County is 23,839.
What is the Total Male Population of Anderson County?
Total Male Population of Anderson County is 12,072.
What is the Total Female Population of Anderson County?
Total Female Population of Anderson County is 11,767.
What is the Ratio of Males per 100 Females in Anderson County?
There are 102.59 Males per 100 Females in Anderson County.
What is the Ratio of Females per 100 Males in Anderson County?
There are 97.47 Females per 100 Males in Anderson County.
What is the Median Population Age in Anderson County?
Median Population Age in Anderson County is 41.9 Years.
What is the Average Family Size in Anderson County
Average Family Size in Anderson County is 3.1 People.
What is the Average Household Size in Anderson County
Average Household Size in Anderson County is 2.6 People.
What is Per Capita Income in Anderson County?
Per Capita income in Anderson County is $33,513.
What is the Median Family Income in Anderson County?
Median Family Income in Anderson County is $83,482.
What is the Median Household income in Anderson County?
Median Household Income in Anderson County is $69,885.
What is Income or Wage Gap in Anderson County?
Income or Wage Gap in Anderson County is 22.9%.
Women in Anderson County earn 77.1 cents for every dollar earned by a man.
What is Family Income Deficit in Anderson County?
Family Income Deficit in Anderson County is $8,813.
Families that are below poverty line in Anderson County earn $8,813 less on average than the poverty threshold level.
What is Inequality or Gini Index in Anderson County?
Inequality or Gini Index in Anderson County is 0.41.
How Large is the Labor Force in Anderson County?
There are 11,504 People in the Labor Forcein in Anderson County.
What is the Percentage of People in the Labor Force in Anderson County?
60.5% of People are in the Labor Force in Anderson County.
What is the Unemployment Rate in Anderson County?
Unemployment Rate in Anderson County is 5.4%.