Buckeye, IA
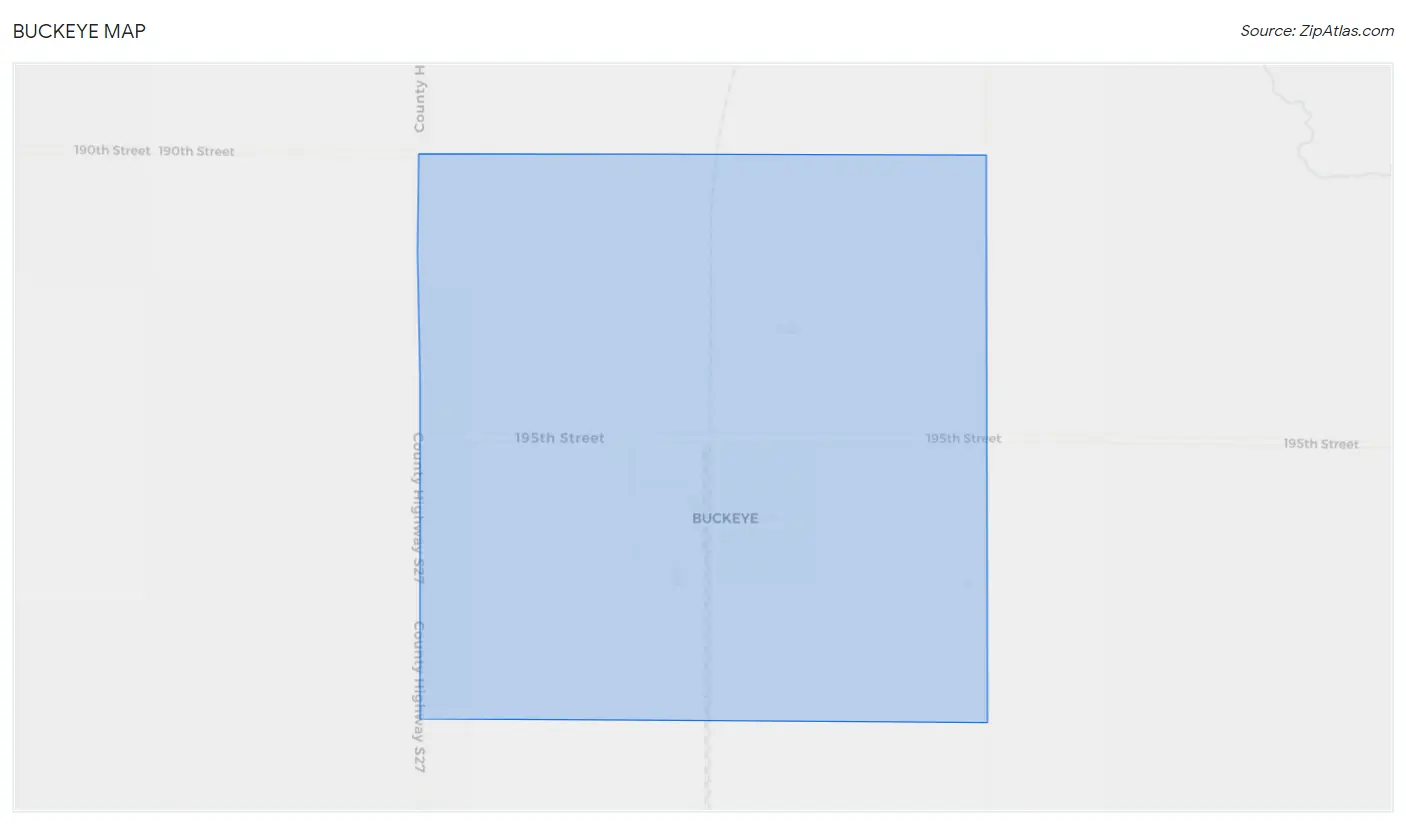
Buckeye Map
Buckeye Overview
84
TOTAL POPULATION
50
MALE POPULATION
34
FEMALE POPULATION
147.06
MALES / 100 FEMALES
68.00
FEMALES / 100 MALES
47.5
MEDIAN AGE
2.8
AVG FAMILY SIZE
2.2
AVG HOUSEHOLD SIZE
$28,748
PER CAPITA INCOME
$54,167
AVG FAMILY INCOME
$54,167
AVG HOUSEHOLD INCOME
37.9%
WAGE / INCOME GAP [ % ]
62.1¢/ $1
WAGE / INCOME GAP [ $ ]
0.33
INEQUALITY / GINI INDEX
42
LABOR FORCE [ PEOPLE ]
62.7%
PERCENT IN LABOR FORCE
2.4%
UNEMPLOYMENT RATE
Buckeye Area Codes
Race in Buckeye
The most populous races in Buckeye are , and White / Caucasian (84 | 100.0%).
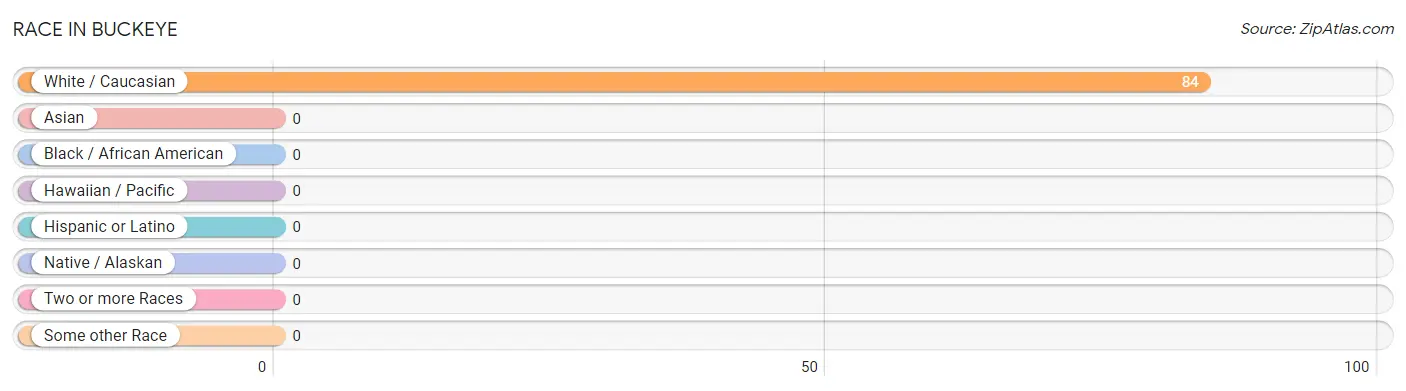
| Race | # Population | % Population |
| Asian | 0 | 0.0% |
| Black / African American | 0 | 0.0% |
| Hawaiian / Pacific | 0 | 0.0% |
| Hispanic or Latino | 0 | 0.0% |
| Native / Alaskan | 0 | 0.0% |
| White / Caucasian | 84 | 100.0% |
| Two or more Races | 0 | 0.0% |
| Some other Race | 0 | 0.0% |
| Total | 84 | 100.0% |
Ancestry in Buckeye
The most populous ancestries reported in Buckeye are German (41 | 48.8%), American (6 | 7.1%), Czech (5 | 5.9%), English (4 | 4.8%), and Irish (3 | 3.6%), together accounting for 70.2% of all Buckeye residents.
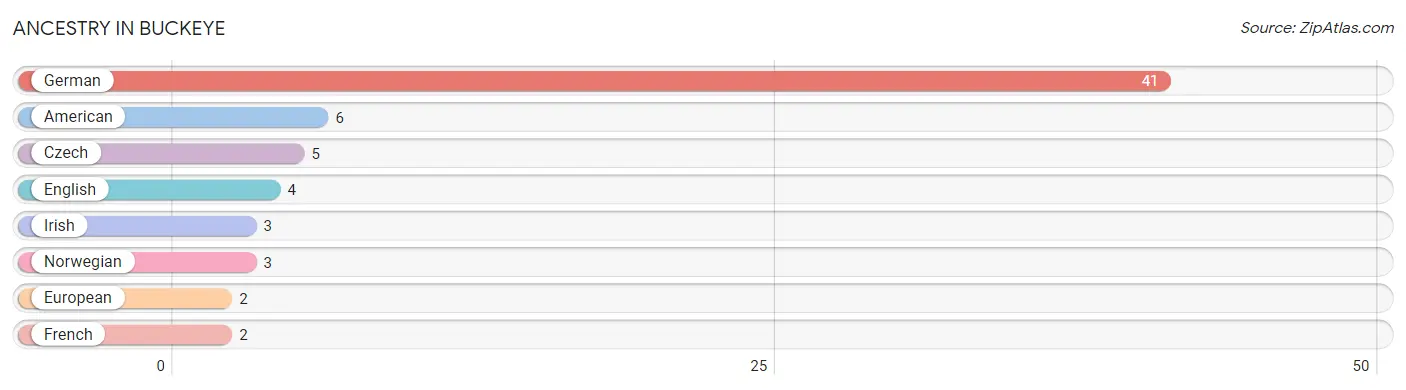
| Ancestry | # Population | % Population |
| American | 6 | 7.1% |
| Czech | 5 | 5.9% |
| English | 4 | 4.8% |
| European | 2 | 2.4% |
| French | 2 | 2.4% |
| German | 41 | 48.8% |
| Irish | 3 | 3.6% |
| Norwegian | 3 | 3.6% | View All 8 Rows |
Immigrants in Buckeye

| Immigration Origin | # Population | % Population | View All 0 Rows |
Sex and Age in Buckeye
Sex and Age in Buckeye
The most populous age groups in Buckeye are 60 to 64 Years (12 | 24.0%) for men and 60 to 64 Years (7 | 20.6%) for women.
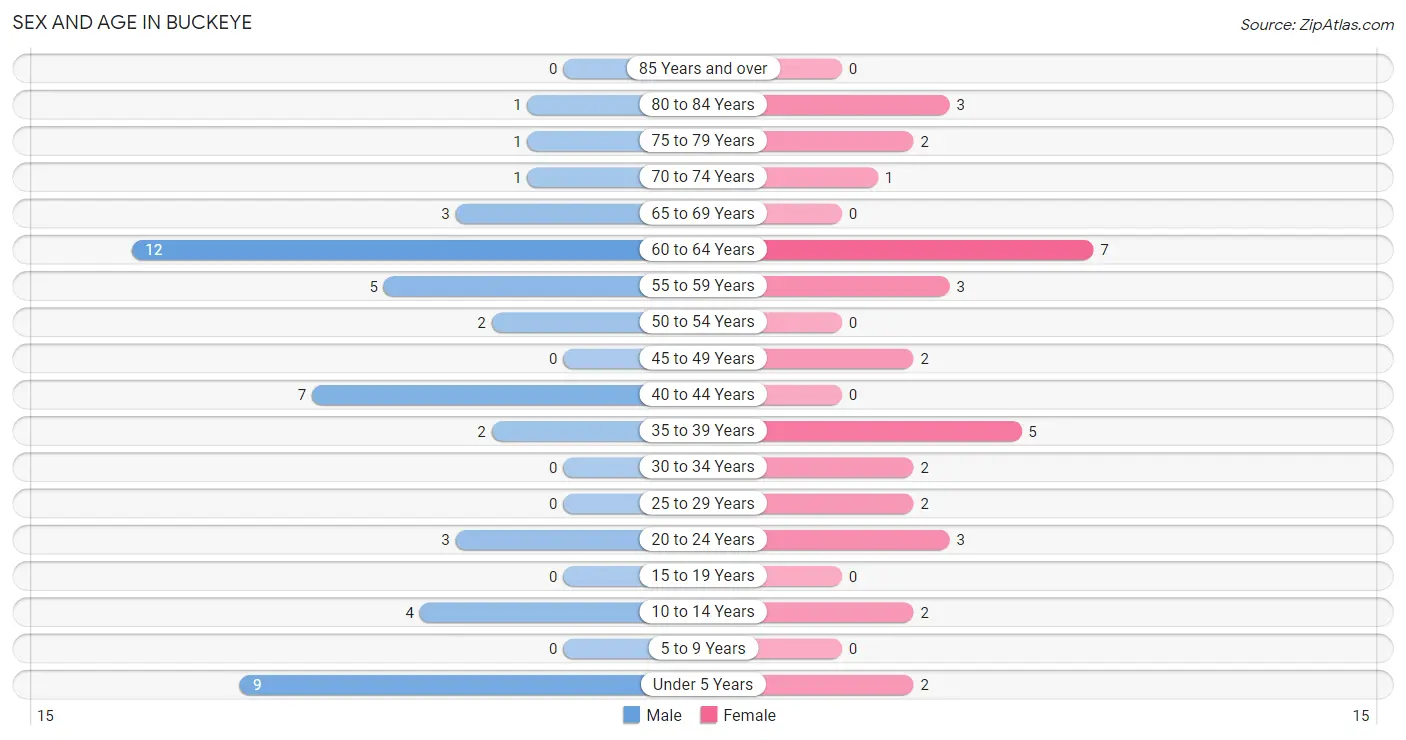
| Age Bracket | Male | Female |
| Under 5 Years | 9 (18.0%) | 2 (5.9%) |
| 5 to 9 Years | 0 (0.0%) | 0 (0.0%) |
| 10 to 14 Years | 4 (8.0%) | 2 (5.9%) |
| 15 to 19 Years | 0 (0.0%) | 0 (0.0%) |
| 20 to 24 Years | 3 (6.0%) | 3 (8.8%) |
| 25 to 29 Years | 0 (0.0%) | 2 (5.9%) |
| 30 to 34 Years | 0 (0.0%) | 2 (5.9%) |
| 35 to 39 Years | 2 (4.0%) | 5 (14.7%) |
| 40 to 44 Years | 7 (14.0%) | 0 (0.0%) |
| 45 to 49 Years | 0 (0.0%) | 2 (5.9%) |
| 50 to 54 Years | 2 (4.0%) | 0 (0.0%) |
| 55 to 59 Years | 5 (10.0%) | 3 (8.8%) |
| 60 to 64 Years | 12 (24.0%) | 7 (20.6%) |
| 65 to 69 Years | 3 (6.0%) | 0 (0.0%) |
| 70 to 74 Years | 1 (2.0%) | 1 (2.9%) |
| 75 to 79 Years | 1 (2.0%) | 2 (5.9%) |
| 80 to 84 Years | 1 (2.0%) | 3 (8.8%) |
| 85 Years and over | 0 (0.0%) | 0 (0.0%) |
| Total | 50 (100.0%) | 34 (100.0%) |
Families and Households in Buckeye
Median Family Size in Buckeye
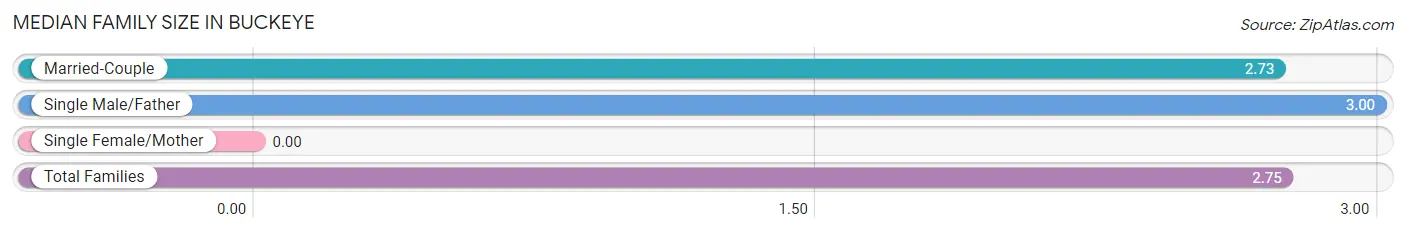
| Family Type | # Families | Family Size |
| Married-Couple | 22 (91.7%) | 2.73 |
| Single Male/Father | 2 (8.3%) | 3.00 |
| Single Female/Mother | 0 (0.0%) | - |
| Total Families | 24 (100.0%) | 2.75 |
Median Household Size in Buckeye
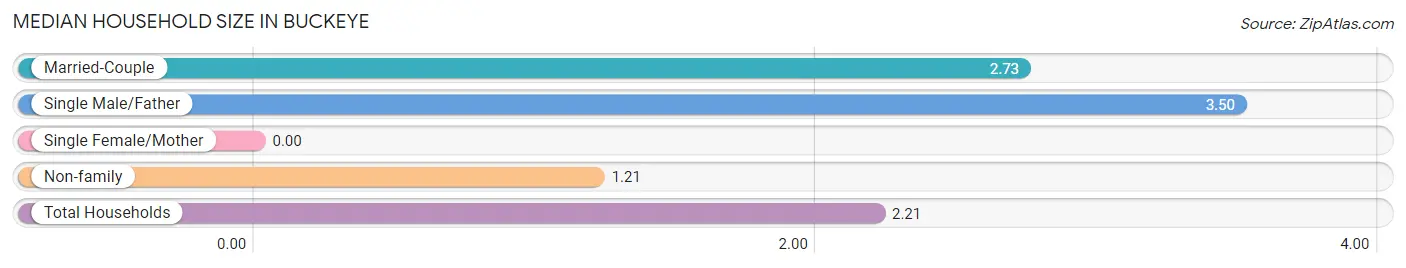
| Household Type | # Households | Household Size |
| Married-Couple | 22 (57.9%) | 2.73 |
| Single Male/Father | 2 (5.3%) | 3.50 |
| Single Female/Mother | 0 (0.0%) | - |
| Non-family | 14 (36.8%) | 1.21 |
| Total Households | 38 (100.0%) | 2.21 |
Household Size by Marriage Status in Buckeye
Out of a total of 38 households in Buckeye, 24 (63.2%) are family households, while 14 (36.8%) are nonfamily households. The most numerous type of family households are 2-person households, comprising 15, and the most common type of nonfamily households are 1-person households, comprising 11.
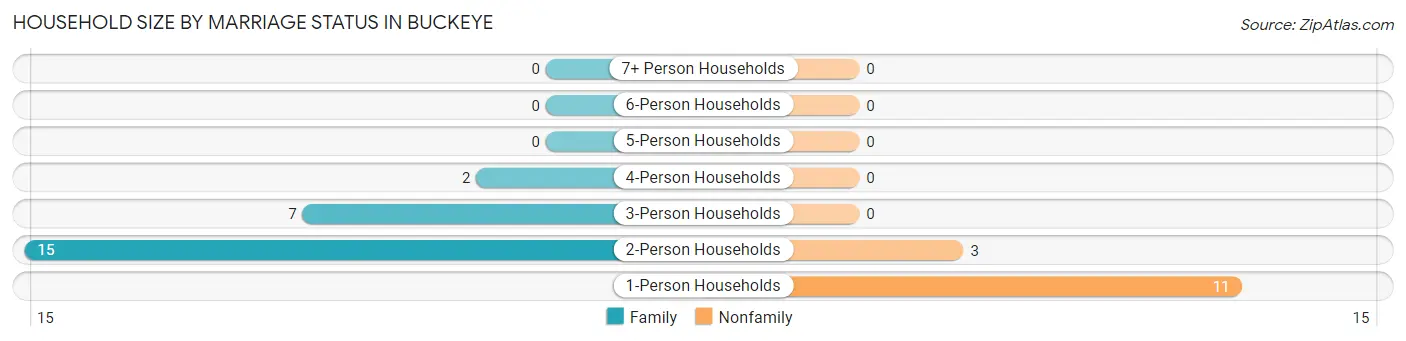
| Household Size | Family Households | Nonfamily Households |
| 1-Person Households | - | 11 (28.9%) |
| 2-Person Households | 15 (39.5%) | 3 (7.9%) |
| 3-Person Households | 7 (18.4%) | 0 (0.0%) |
| 4-Person Households | 2 (5.3%) | 0 (0.0%) |
| 5-Person Households | 0 (0.0%) | 0 (0.0%) |
| 6-Person Households | 0 (0.0%) | 0 (0.0%) |
| 7+ Person Households | 0 (0.0%) | 0 (0.0%) |
| Total | 24 (63.2%) | 14 (36.8%) |
Female Fertility in Buckeye
Fertility by Age in Buckeye
| Age Bracket | Women with Births | Births / 1,000 Women |
| 15 to 19 years | 0 (0.0%) | 0.0 |
| 20 to 34 years | 0 (0.0%) | 0.0 |
| 35 to 50 years | 0 (0.0%) | 0.0 |
| Total | 0 (0.0%) | 0.0 |
Fertility by Age by Marriage Status in Buckeye
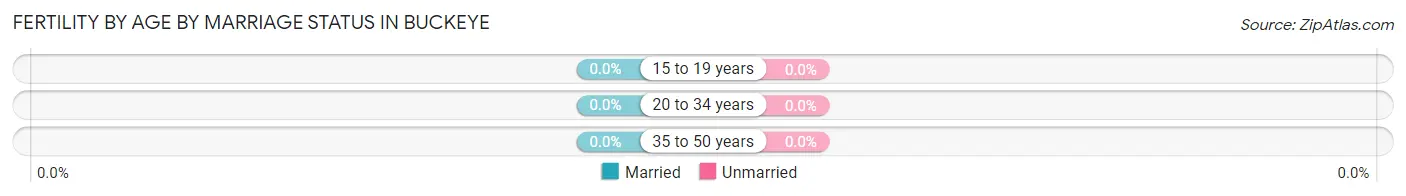
| Age Bracket | Married | Unmarried |
| 15 to 19 years | 0 (0.0%) | 0 (0.0%) |
| 20 to 34 years | 0 (0.0%) | 0 (0.0%) |
| 35 to 50 years | 0 (0.0%) | 0 (0.0%) |
| Total | 0 (0.0%) | 0 (0.0%) |
Fertility by Education in Buckeye
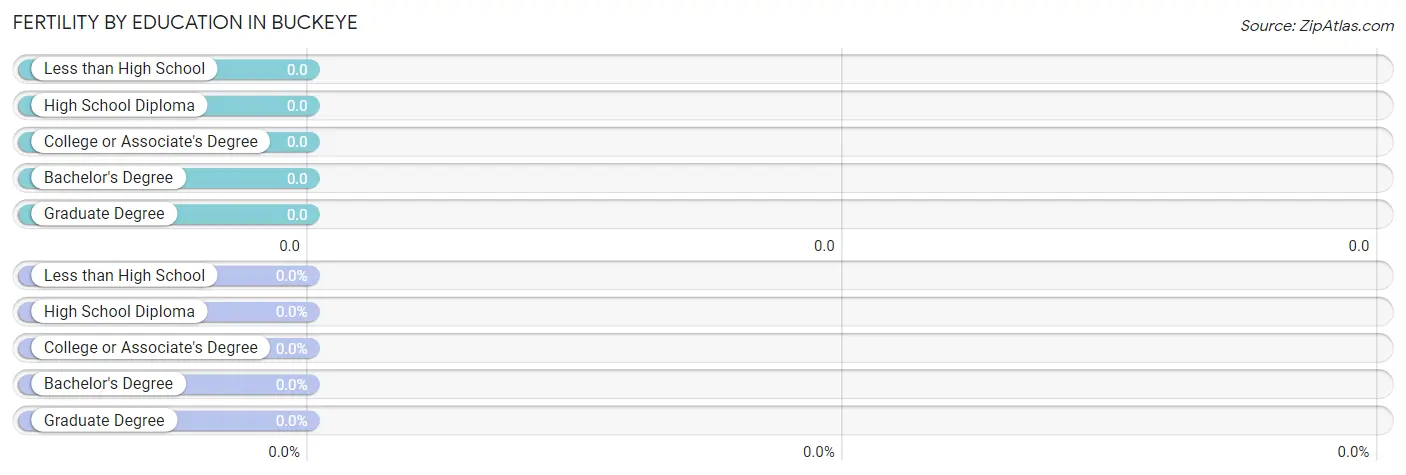
| Educational Attainment | Women with Births | Births / 1,000 Women |
| Less than High School | 0 (0.0%) | 0.0 |
| High School Diploma | 0 (0.0%) | 0.0 |
| College or Associate's Degree | 0 (0.0%) | 0.0 |
| Bachelor's Degree | 0 (0.0%) | 0.0 |
| Graduate Degree | 0 (0.0%) | 0.0 |
| Total | 0 (0.0%) | 0.0 |
Fertility by Education by Marriage Status in Buckeye
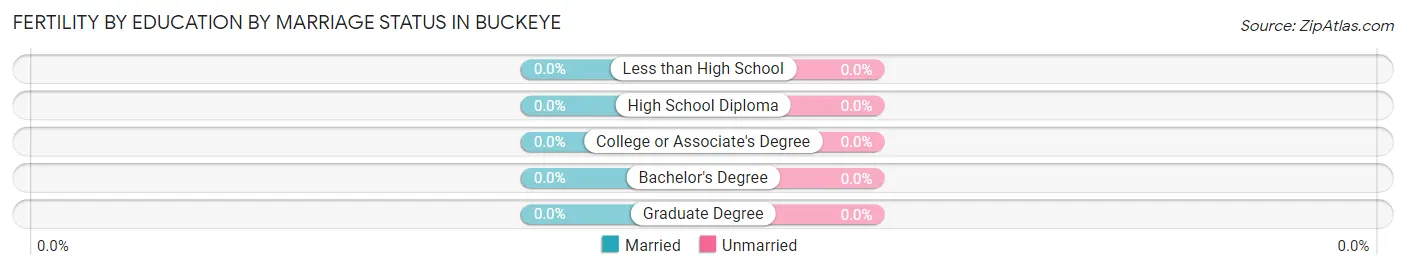
| Educational Attainment | Married | Unmarried |
| Less than High School | 0 (0.0%) | 0 (0.0%) |
| High School Diploma | 0 (0.0%) | 0 (0.0%) |
| College or Associate's Degree | 0 (0.0%) | 0 (0.0%) |
| Bachelor's Degree | 0 (0.0%) | 0 (0.0%) |
| Graduate Degree | 0 (0.0%) | 0 (0.0%) |
| Total | 0 (0.0%) | 0 (0.0%) |
Income in Buckeye
Income Overview in Buckeye
Per Capita Income in Buckeye is $28,748, while median incomes of families and households are $54,167 and $54,167 respectively.
| Characteristic | Number | Measure |
| Per Capita Income | 84 | $28,748 |
| Median Family Income | 24 | $54,167 |
| Mean Family Income | 24 | $60,017 |
| Median Household Income | 38 | $54,167 |
| Mean Household Income | 38 | $61,832 |
| Income Deficit | 24 | $0 |
| Wage / Income Gap (%) | 84 | 37.91% |
| Wage / Income Gap ($) | 84 | 62.09¢ per $1 |
| Gini / Inequality Index | 84 | 0.33 |
Earnings by Sex in Buckeye
Average Earnings in Buckeye are $37,500, $56,875 for men and $35,313 for women, a difference of 37.9%.
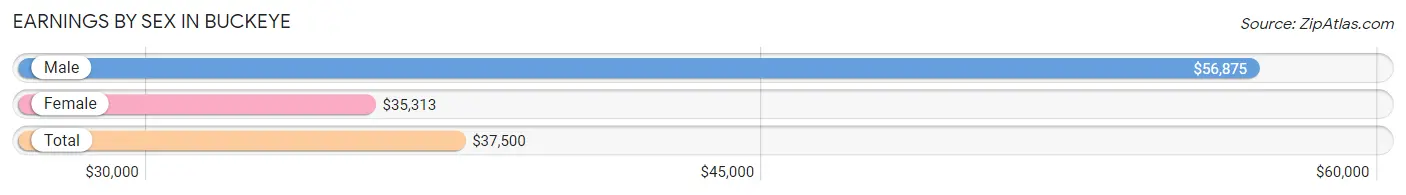
| Sex | Number | Average Earnings |
| Male | 27 (64.3%) | $56,875 |
| Female | 15 (35.7%) | $35,313 |
| Total | 42 (100.0%) | $37,500 |
Earnings by Sex by Income Bracket in Buckeye
The most common earnings brackets in Buckeye are $55,000 to $64,999 for men (9 | 33.3%) and $35,000 to $39,999 for women (6 | 40.0%).
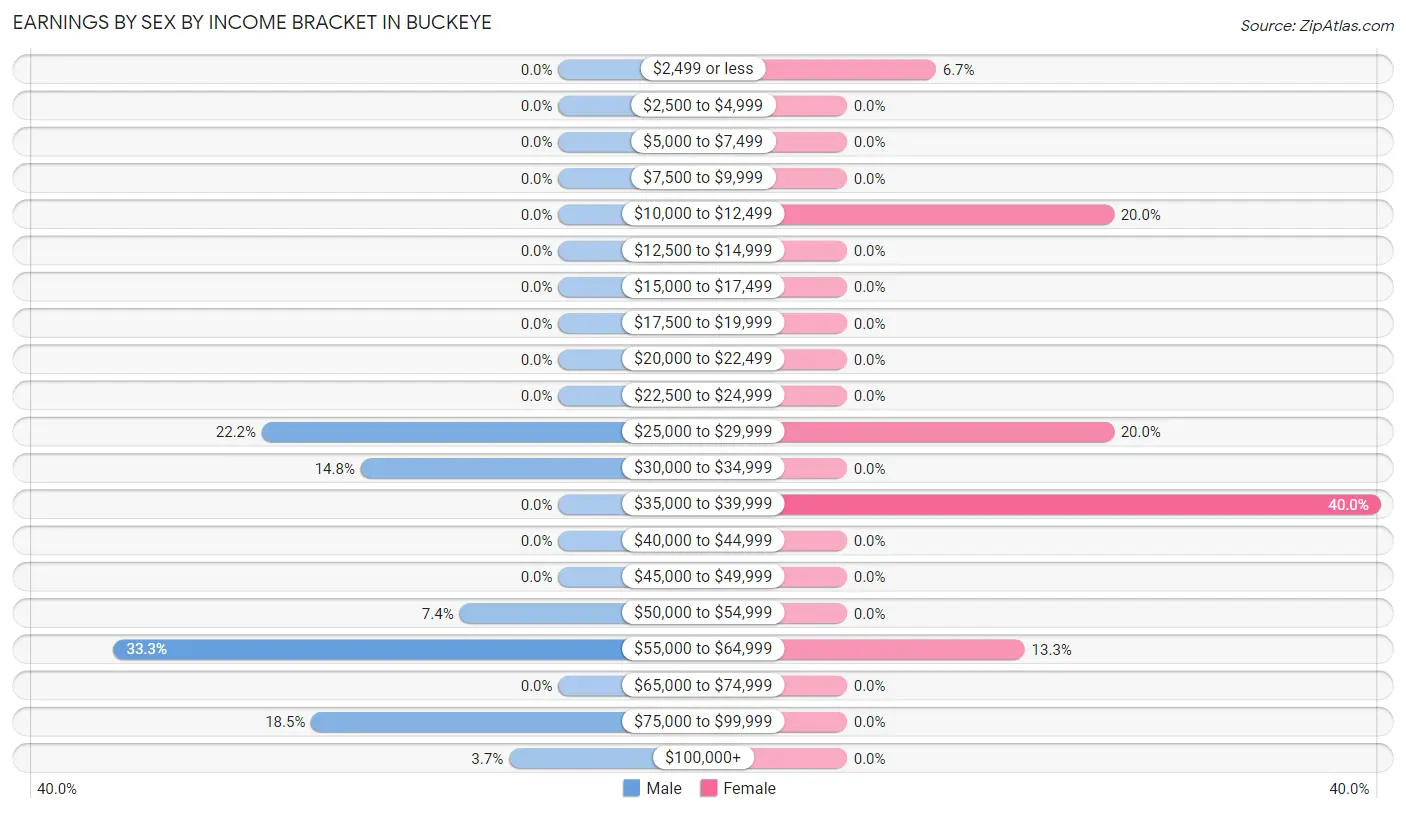
| Income | Male | Female |
| $2,499 or less | 0 (0.0%) | 1 (6.7%) |
| $2,500 to $4,999 | 0 (0.0%) | 0 (0.0%) |
| $5,000 to $7,499 | 0 (0.0%) | 0 (0.0%) |
| $7,500 to $9,999 | 0 (0.0%) | 0 (0.0%) |
| $10,000 to $12,499 | 0 (0.0%) | 3 (20.0%) |
| $12,500 to $14,999 | 0 (0.0%) | 0 (0.0%) |
| $15,000 to $17,499 | 0 (0.0%) | 0 (0.0%) |
| $17,500 to $19,999 | 0 (0.0%) | 0 (0.0%) |
| $20,000 to $22,499 | 0 (0.0%) | 0 (0.0%) |
| $22,500 to $24,999 | 0 (0.0%) | 0 (0.0%) |
| $25,000 to $29,999 | 6 (22.2%) | 3 (20.0%) |
| $30,000 to $34,999 | 4 (14.8%) | 0 (0.0%) |
| $35,000 to $39,999 | 0 (0.0%) | 6 (40.0%) |
| $40,000 to $44,999 | 0 (0.0%) | 0 (0.0%) |
| $45,000 to $49,999 | 0 (0.0%) | 0 (0.0%) |
| $50,000 to $54,999 | 2 (7.4%) | 0 (0.0%) |
| $55,000 to $64,999 | 9 (33.3%) | 2 (13.3%) |
| $65,000 to $74,999 | 0 (0.0%) | 0 (0.0%) |
| $75,000 to $99,999 | 5 (18.5%) | 0 (0.0%) |
| $100,000+ | 1 (3.7%) | 0 (0.0%) |
| Total | 27 (100.0%) | 15 (100.0%) |
Earnings by Sex by Educational Attainment in Buckeye
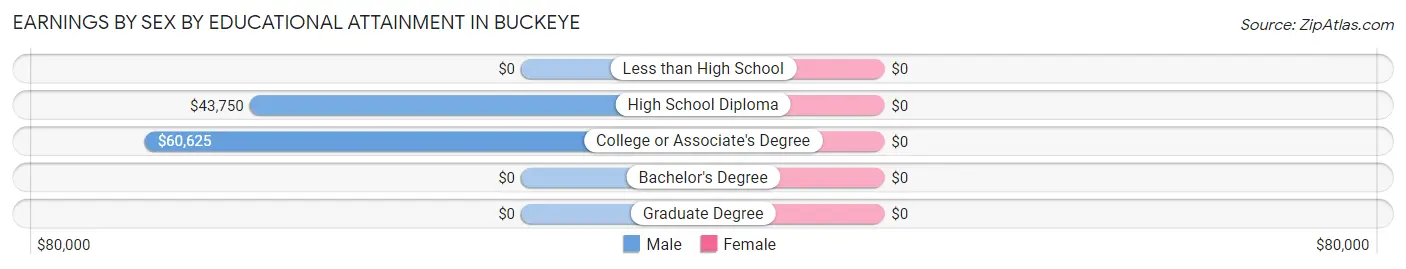
| Educational Attainment | Male Income | Female Income |
| Less than High School | - | - |
| High School Diploma | $43,750 | $0 |
| College or Associate's Degree | $60,625 | $0 |
| Bachelor's Degree | - | - |
| Graduate Degree | - | - |
| Total | $58,333 | $36,250 |
Family Income in Buckeye
Family Income Brackets in Buckeye
According to the Buckeye family income data, there are 6 families falling into the $25,000 to $34,999 income range, which is the most common income bracket and makes up 25.0% of all families.
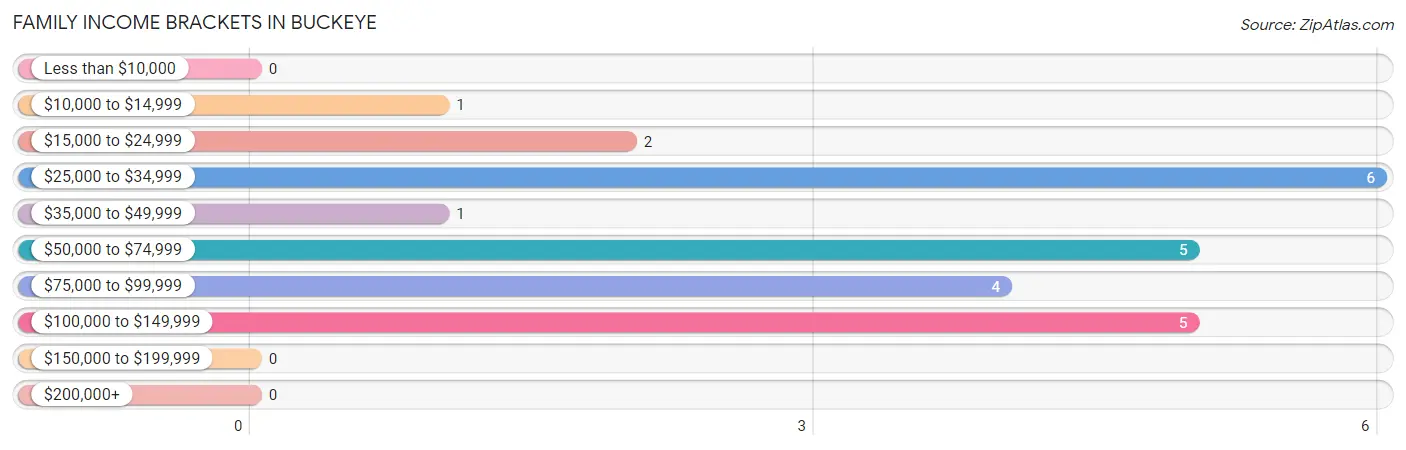
| Income Bracket | # Families | % Families |
| Less than $10,000 | 0 | 0.0% |
| $10,000 to $14,999 | 1 | 4.2% |
| $15,000 to $24,999 | 2 | 8.3% |
| $25,000 to $34,999 | 6 | 25.0% |
| $35,000 to $49,999 | 1 | 4.2% |
| $50,000 to $74,999 | 5 | 20.8% |
| $75,000 to $99,999 | 4 | 16.7% |
| $100,000 to $149,999 | 5 | 20.8% |
| $150,000 to $199,999 | 0 | 0.0% |
| $200,000+ | 0 | 0.0% |
Family Income by Famaliy Size in Buckeye
3-person families (6 | 25.0%) account for the highest median family income in Buckeye with $93,333 per family, while 3-person families (6 | 25.0%) have the highest median income of $31,111 per family member.
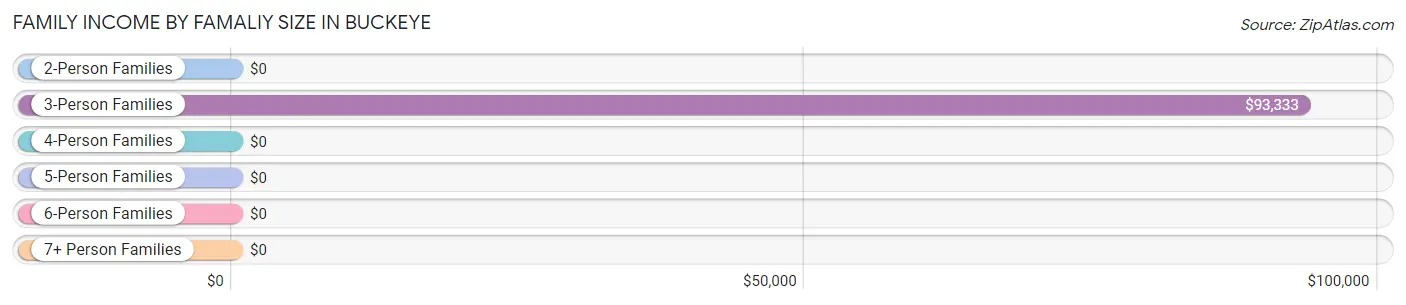
| Income Bracket | # Families | Median Income |
| 2-Person Families | 16 (66.7%) | $0 |
| 3-Person Families | 6 (25.0%) | $93,333 |
| 4-Person Families | 2 (8.3%) | $0 |
| 5-Person Families | 0 (0.0%) | $0 |
| 6-Person Families | 0 (0.0%) | $0 |
| 7+ Person Families | 0 (0.0%) | $0 |
| Total | 24 (100.0%) | $54,167 |
Family Income by Number of Earners in Buckeye
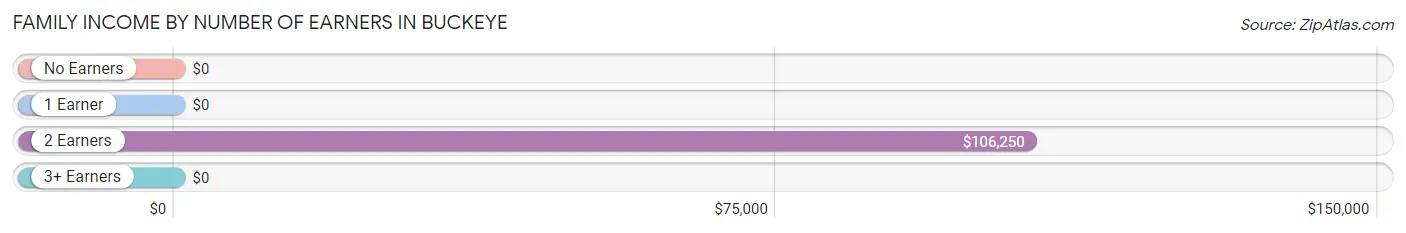
| Number of Earners | # Families | Median Income |
| No Earners | 5 (20.8%) | $0 |
| 1 Earner | 11 (45.8%) | $0 |
| 2 Earners | 8 (33.3%) | $106,250 |
| 3+ Earners | 0 (0.0%) | $0 |
| Total | 24 (100.0%) | $54,167 |
Household Income in Buckeye
Household Income Brackets in Buckeye
With 9 households falling in the category, the $50,000 to $74,999 income range is the most frequent in Buckeye, accounting for 23.7% of all households.
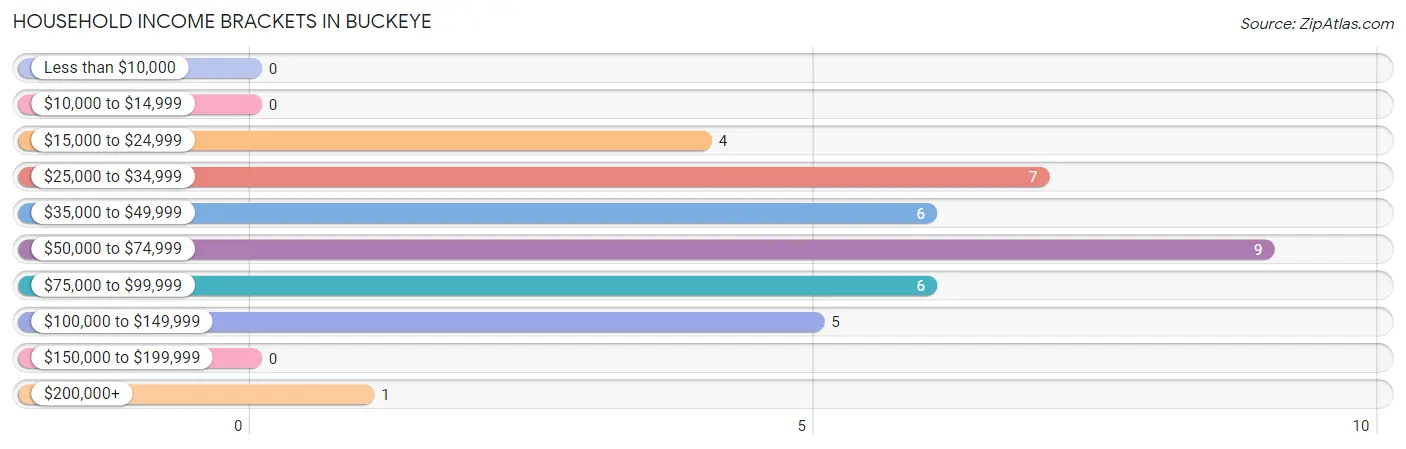
| Income Bracket | # Households | % Households |
| Less than $10,000 | 0 | 0.0% |
| $10,000 to $14,999 | 0 | 0.0% |
| $15,000 to $24,999 | 4 | 10.5% |
| $25,000 to $34,999 | 7 | 18.4% |
| $35,000 to $49,999 | 6 | 15.8% |
| $50,000 to $74,999 | 9 | 23.7% |
| $75,000 to $99,999 | 6 | 15.8% |
| $100,000 to $149,999 | 5 | 13.2% |
| $150,000 to $199,999 | 0 | 0.0% |
| $200,000+ | 1 | 2.6% |
Household Income by Householder Age in Buckeye
The median household income in Buckeye is $54,167, with the highest median household income of $92,917 found in the 25 to 44 years age bracket for the primary householder. A total of 7 households (18.4%) fall into this category. Meanwhile, the 15 to 24 years age bracket for the primary householder has the lowest median household income of $0, with 3 households (7.9%) in this group.
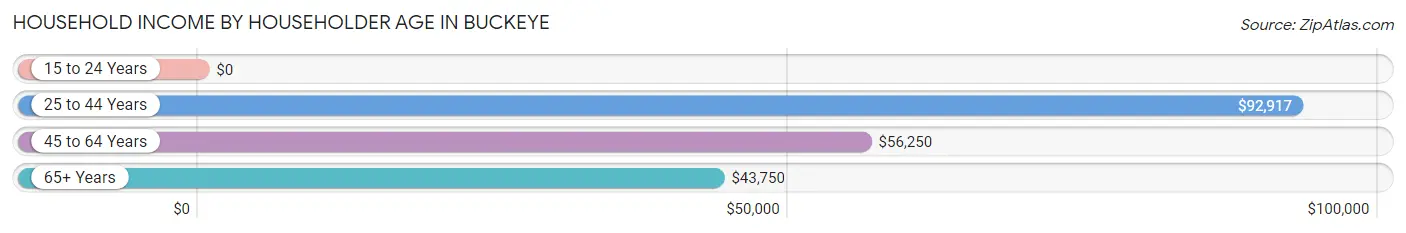
| Income Bracket | # Households | Median Income |
| 15 to 24 Years | 3 (7.9%) | $0 |
| 25 to 44 Years | 7 (18.4%) | $92,917 |
| 45 to 64 Years | 20 (52.6%) | $56,250 |
| 65+ Years | 8 (21.0%) | $43,750 |
| Total | 38 (100.0%) | $54,167 |
Poverty in Buckeye
Income Below Poverty by Sex and Age in Buckeye
With 8.0% poverty level for males and 14.7% for females among the residents of Buckeye, 6 to 11 year old males and 18 to 24 year old females are the most vulnerable to poverty, with 1 males (100.0%) and 3 females (100.0%) in their respective age groups living below the poverty level.
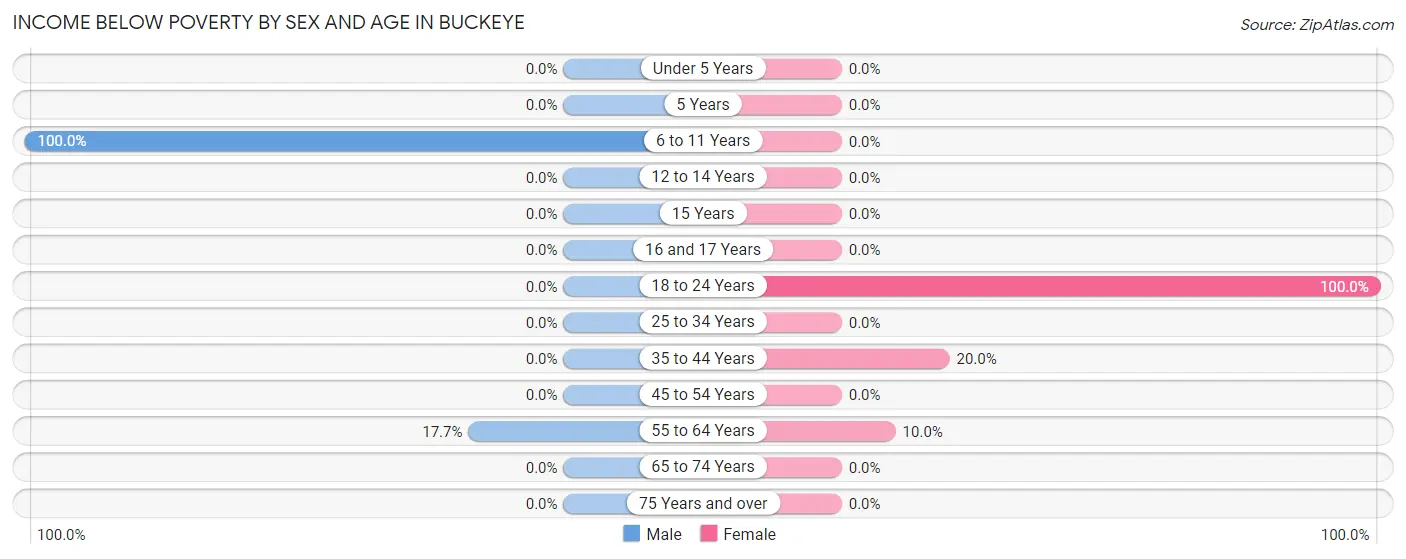
| Age Bracket | Male | Female |
| Under 5 Years | 0 (0.0%) | 0 (0.0%) |
| 5 Years | 0 (0.0%) | 0 (0.0%) |
| 6 to 11 Years | 1 (100.0%) | 0 (0.0%) |
| 12 to 14 Years | 0 (0.0%) | 0 (0.0%) |
| 15 Years | 0 (0.0%) | 0 (0.0%) |
| 16 and 17 Years | 0 (0.0%) | 0 (0.0%) |
| 18 to 24 Years | 0 (0.0%) | 3 (100.0%) |
| 25 to 34 Years | 0 (0.0%) | 0 (0.0%) |
| 35 to 44 Years | 0 (0.0%) | 1 (20.0%) |
| 45 to 54 Years | 0 (0.0%) | 0 (0.0%) |
| 55 to 64 Years | 3 (17.6%) | 1 (10.0%) |
| 65 to 74 Years | 0 (0.0%) | 0 (0.0%) |
| 75 Years and over | 0 (0.0%) | 0 (0.0%) |
| Total | 4 (8.0%) | 5 (14.7%) |
Income Above Poverty by Sex and Age in Buckeye
According to the poverty statistics in Buckeye, males aged under 5 years and females aged under 5 years are the age groups that are most secure financially, with 100.0% of males and 100.0% of females in these age groups living above the poverty line.
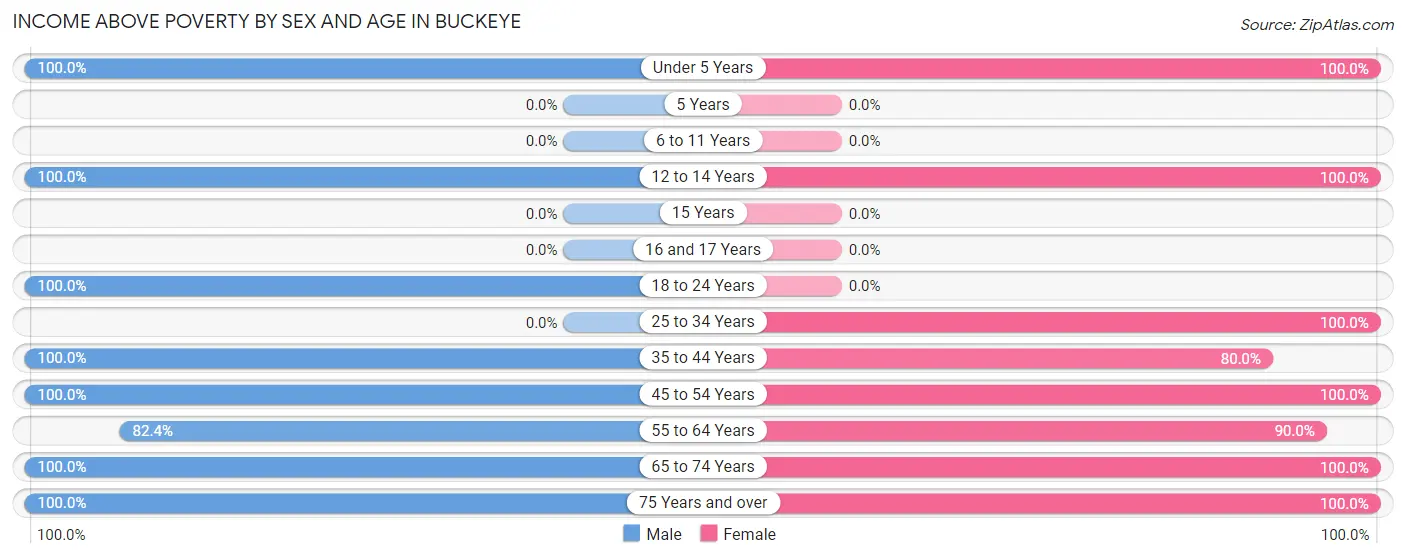
| Age Bracket | Male | Female |
| Under 5 Years | 9 (100.0%) | 2 (100.0%) |
| 5 Years | 0 (0.0%) | 0 (0.0%) |
| 6 to 11 Years | 0 (0.0%) | 0 (0.0%) |
| 12 to 14 Years | 3 (100.0%) | 2 (100.0%) |
| 15 Years | 0 (0.0%) | 0 (0.0%) |
| 16 and 17 Years | 0 (0.0%) | 0 (0.0%) |
| 18 to 24 Years | 3 (100.0%) | 0 (0.0%) |
| 25 to 34 Years | 0 (0.0%) | 4 (100.0%) |
| 35 to 44 Years | 9 (100.0%) | 4 (80.0%) |
| 45 to 54 Years | 2 (100.0%) | 2 (100.0%) |
| 55 to 64 Years | 14 (82.4%) | 9 (90.0%) |
| 65 to 74 Years | 4 (100.0%) | 1 (100.0%) |
| 75 Years and over | 2 (100.0%) | 5 (100.0%) |
| Total | 46 (92.0%) | 29 (85.3%) |
Income Below Poverty Among Married-Couple Families in Buckeye
The poverty statistics for married-couple families in Buckeye show that 4.5% or 1 of the total 22 families live below the poverty line. Families with no children have the highest poverty rate of 7.1%, comprising of 1 families. On the other hand, families with 1 or 2 children have the lowest poverty rate of 0.0%, which includes 0 families.
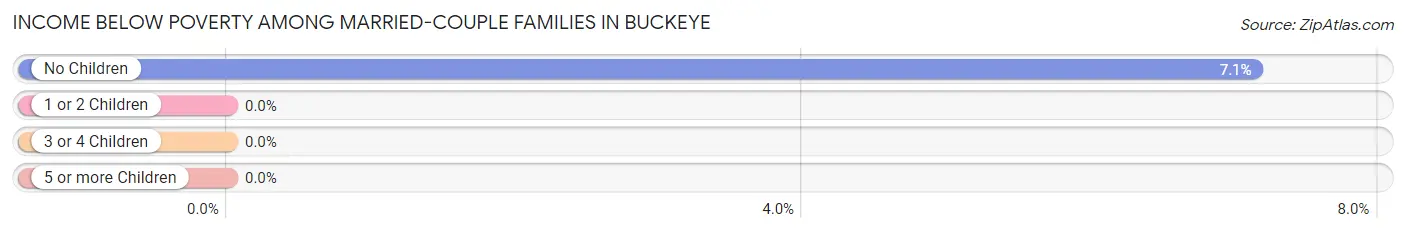
| Children | Above Poverty | Below Poverty |
| No Children | 13 (92.9%) | 1 (7.1%) |
| 1 or 2 Children | 8 (100.0%) | 0 (0.0%) |
| 3 or 4 Children | 0 (0.0%) | 0 (0.0%) |
| 5 or more Children | 0 (0.0%) | 0 (0.0%) |
| Total | 21 (95.5%) | 1 (4.5%) |
Income Below Poverty Among Single-Parent Households in Buckeye
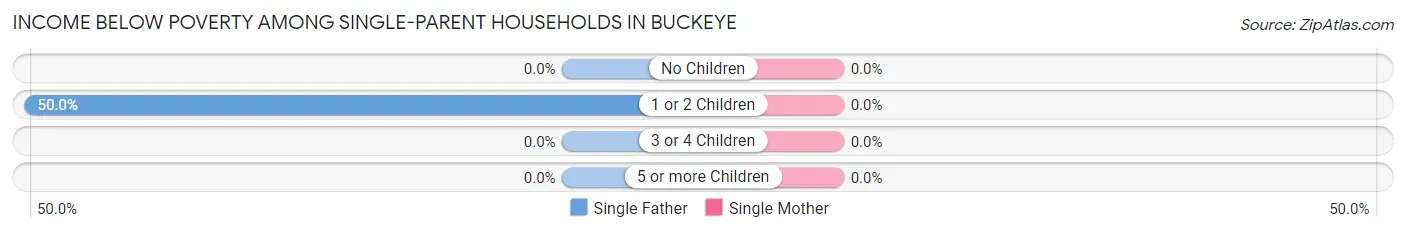
| Children | Single Father | Single Mother |
| No Children | 0 (0.0%) | 0 (0.0%) |
| 1 or 2 Children | 1 (50.0%) | 0 (0.0%) |
| 3 or 4 Children | 0 (0.0%) | 0 (0.0%) |
| 5 or more Children | 0 (0.0%) | 0 (0.0%) |
| Total | 1 (50.0%) | 0 (0.0%) |
Income Below Poverty Among Married-Couple vs Single-Parent Households in Buckeye
The poverty data for Buckeye shows that 1 of the married-couple family households (4.5%) and 1 of the single-parent households (50.0%) are living below the poverty level. Within the married-couple family households, those with no children have the highest poverty rate, with 1 households (7.1%) falling below the poverty line. Among the single-parent households, those with 1 or 2 children have the highest poverty rate, with 1 household (50.0%) living below poverty.
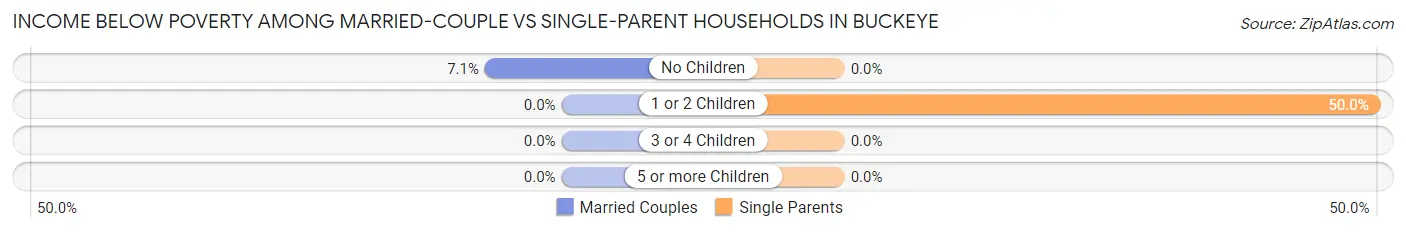
| Children | Married-Couple Families | Single-Parent Households |
| No Children | 1 (7.1%) | 0 (0.0%) |
| 1 or 2 Children | 0 (0.0%) | 1 (50.0%) |
| 3 or 4 Children | 0 (0.0%) | 0 (0.0%) |
| 5 or more Children | 0 (0.0%) | 0 (0.0%) |
| Total | 1 (4.5%) | 1 (50.0%) |
Employment Characteristics in Buckeye
Employment by Class of Employer in Buckeye
Among the 41 employed individuals in Buckeye, private company employees (27 | 65.8%), local government employees (7 | 17.1%), and self-employed (incorporated) (2 | 4.9%) make up the most common classes of employment.
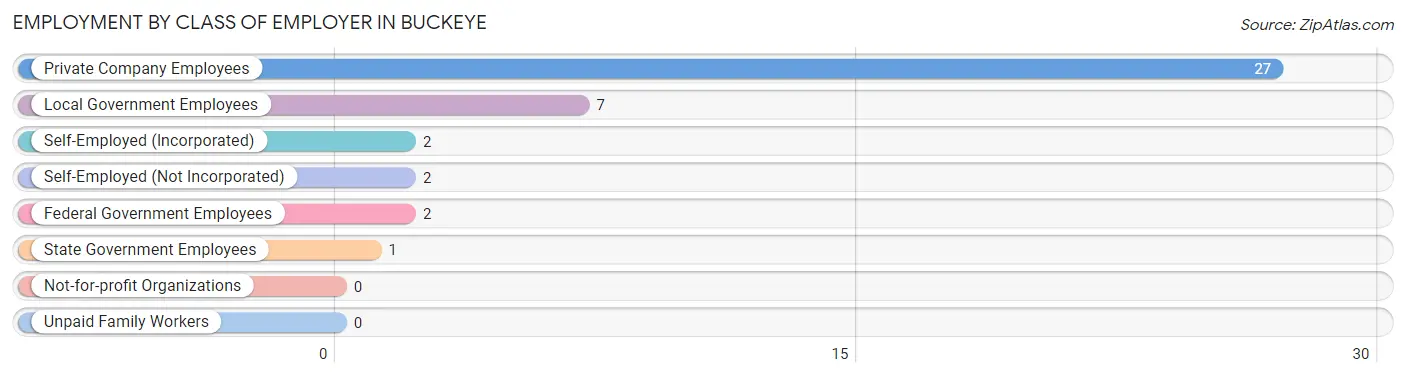
| Employer Class | # Employees | % Employees |
| Private Company Employees | 27 | 65.8% |
| Self-Employed (Incorporated) | 2 | 4.9% |
| Self-Employed (Not Incorporated) | 2 | 4.9% |
| Not-for-profit Organizations | 0 | 0.0% |
| Local Government Employees | 7 | 17.1% |
| State Government Employees | 1 | 2.4% |
| Federal Government Employees | 2 | 4.9% |
| Unpaid Family Workers | 0 | 0.0% |
| Total | 41 | 100.0% |
Employment Status by Age in Buckeye
According to the labor force statistics for Buckeye, out of the total population over 16 years of age (67), 62.7% or 42 individuals are in the labor force, with 2.4% or 1 of them unemployed. The age group with the highest labor force participation rate is 20 to 24 years, with 100.0% or 6 individuals in the labor force. Within the labor force, the 35 to 44 years age range has the highest percentage of unemployed individuals, with 7.7% or 1 of them being unemployed.
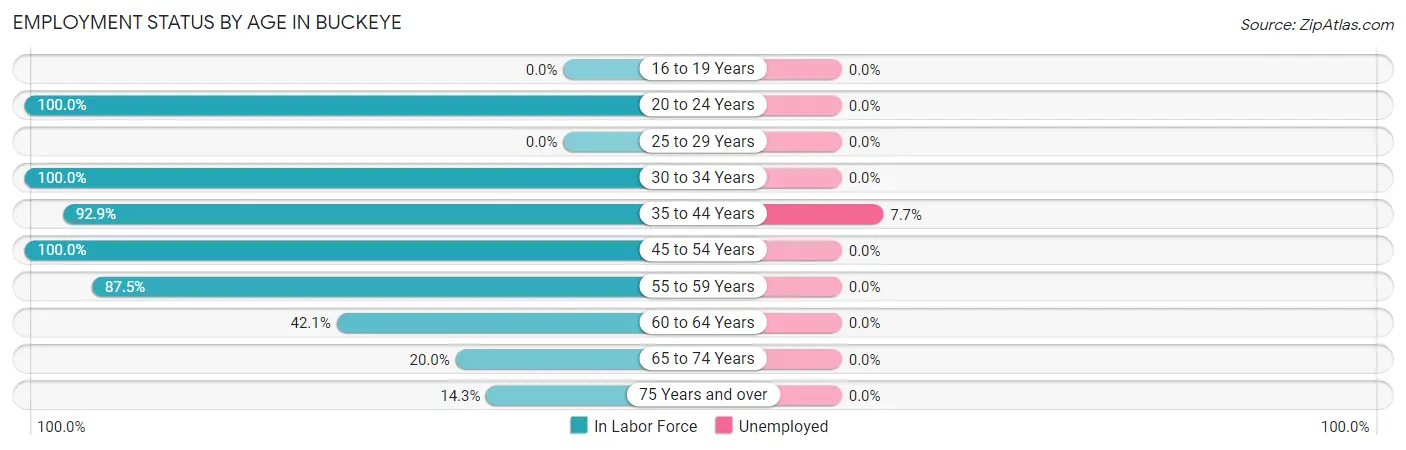
| Age Bracket | In Labor Force | Unemployed |
| 16 to 19 Years | 0 (0.0%) | 0 (0.0%) |
| 20 to 24 Years | 6 (100.0%) | 0 (0.0%) |
| 25 to 29 Years | 0 (0.0%) | 0 (0.0%) |
| 30 to 34 Years | 2 (100.0%) | 0 (0.0%) |
| 35 to 44 Years | 13 (92.9%) | 1 (7.7%) |
| 45 to 54 Years | 4 (100.0%) | 0 (0.0%) |
| 55 to 59 Years | 7 (87.5%) | 0 (0.0%) |
| 60 to 64 Years | 8 (42.1%) | 0 (0.0%) |
| 65 to 74 Years | 1 (20.0%) | 0 (0.0%) |
| 75 Years and over | 1 (14.3%) | 0 (0.0%) |
| Total | 42 (62.7%) | 1 (2.4%) |
Employment Status by Educational Attainment in Buckeye
According to labor force statistics for Buckeye, 69.4% of individuals (34) out of the total population between 25 and 64 years of age (49) are in the labor force, with 2.9% or 1 of them being unemployed. The group with the highest labor force participation rate are those with the educational attainment of bachelor's degree or higher, with 100.0% or 5 individuals in the labor force. Within the labor force, individuals with high school diploma education have the highest percentage of unemployment, with 5.3% or 1 of them being unemployed.
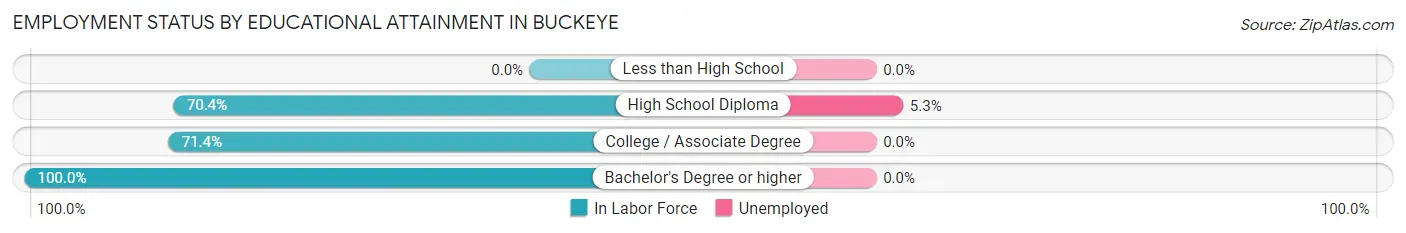
| Educational Attainment | In Labor Force | Unemployed |
| Less than High School | 0 (0.0%) | 0 (0.0%) |
| High School Diploma | 19 (70.4%) | 1 (5.3%) |
| College / Associate Degree | 10 (71.4%) | 0 (0.0%) |
| Bachelor's Degree or higher | 5 (100.0%) | 0 (0.0%) |
| Total | 34 (69.4%) | 1 (2.9%) |
Employment Occupations by Sex in Buckeye
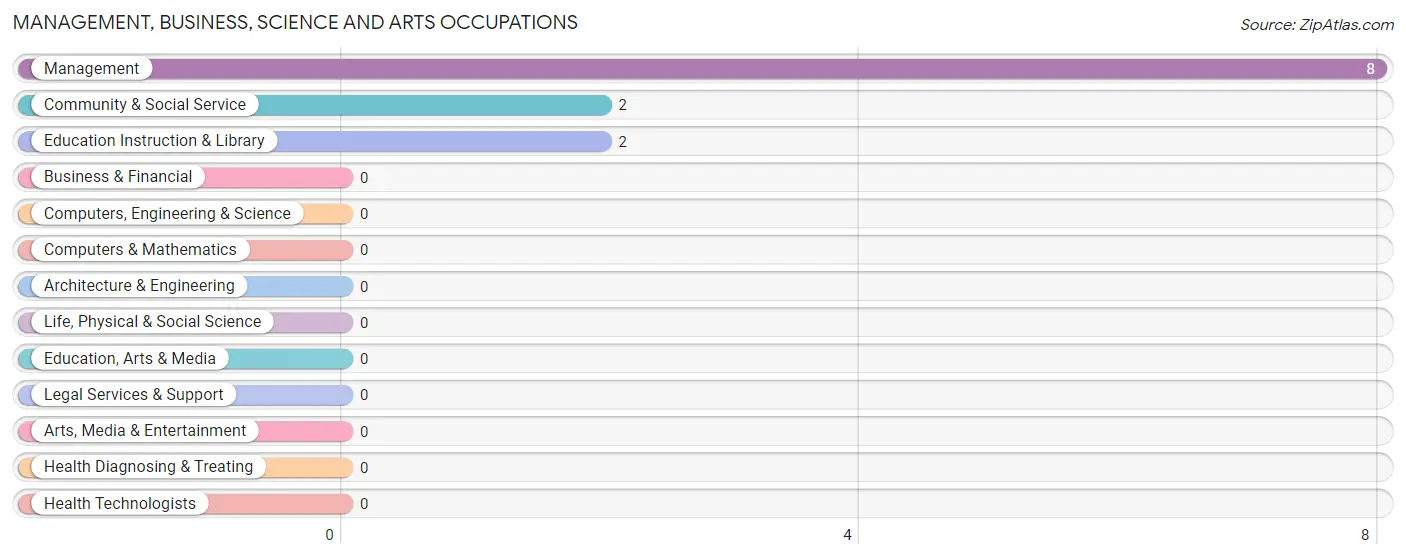
Management, Business, Science and Arts Occupations
The most common Management, Business, Science and Arts occupations in Buckeye are Management (8 | 19.5%), Community & Social Service (2 | 4.9%), and Education Instruction & Library (2 | 4.9%).
Management, Business, Science and Arts Occupations by Sex
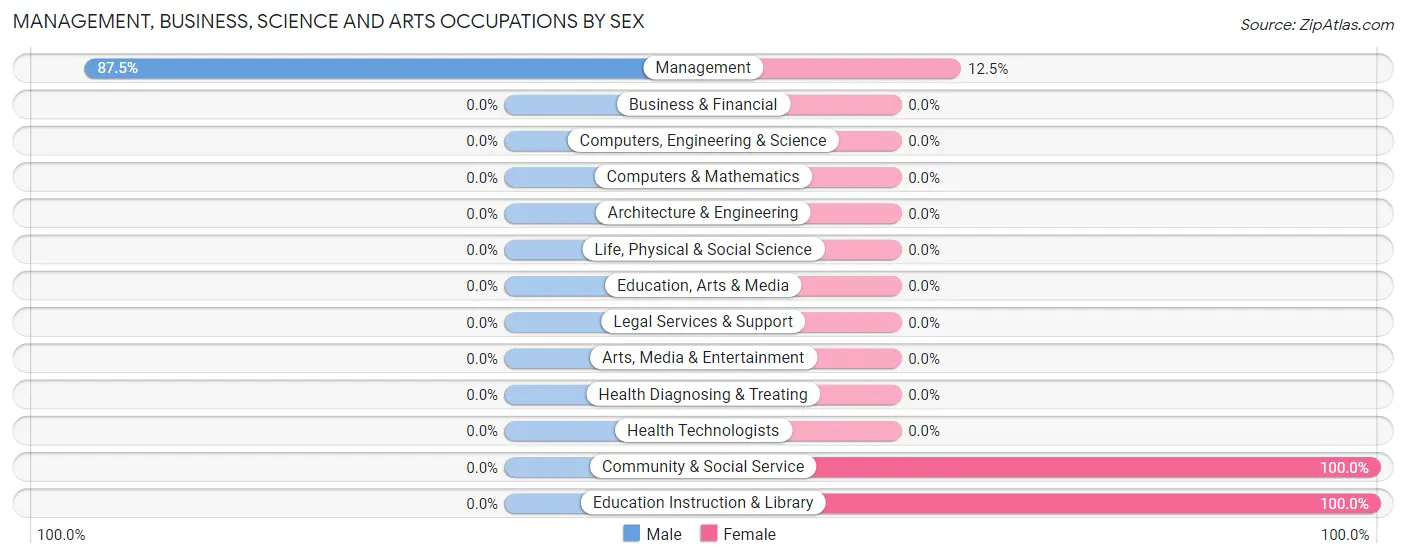
| Occupation | Male | Female |
| Management | 7 (87.5%) | 1 (12.5%) |
| Business & Financial | 0 (0.0%) | 0 (0.0%) |
| Computers, Engineering & Science | 0 (0.0%) | 0 (0.0%) |
| Computers & Mathematics | 0 (0.0%) | 0 (0.0%) |
| Architecture & Engineering | 0 (0.0%) | 0 (0.0%) |
| Life, Physical & Social Science | 0 (0.0%) | 0 (0.0%) |
| Community & Social Service | 0 (0.0%) | 2 (100.0%) |
| Education, Arts & Media | 0 (0.0%) | 0 (0.0%) |
| Legal Services & Support | 0 (0.0%) | 0 (0.0%) |
| Education Instruction & Library | 0 (0.0%) | 2 (100.0%) |
| Arts, Media & Entertainment | 0 (0.0%) | 0 (0.0%) |
| Health Diagnosing & Treating | 0 (0.0%) | 0 (0.0%) |
| Health Technologists | 0 (0.0%) | 0 (0.0%) |
| Total (Category) | 7 (70.0%) | 3 (30.0%) |
| Total (Overall) | 26 (63.4%) | 15 (36.6%) |
Services Occupations
The most common Services occupations in Buckeye are Cleaning & Maintenance (4 | 9.8%), and Food Preparation & Serving (3 | 7.3%).
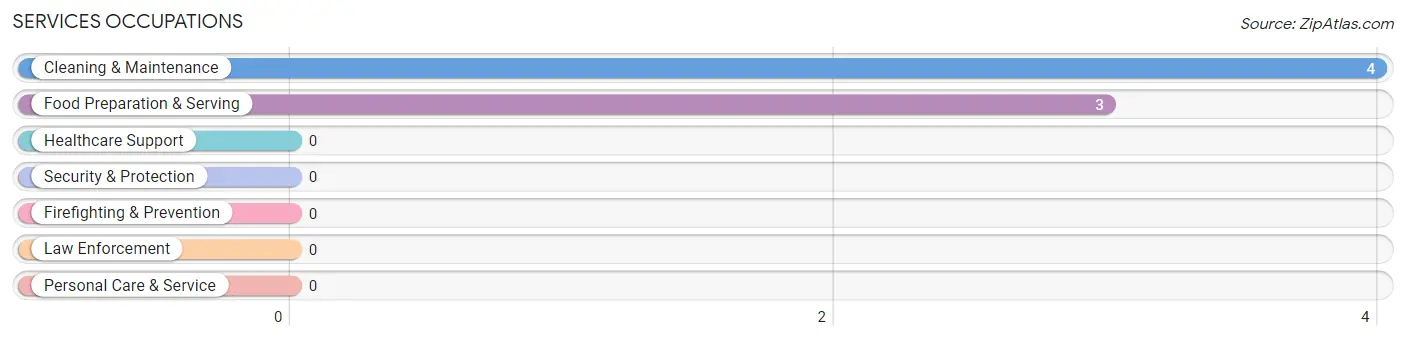
Services Occupations by Sex
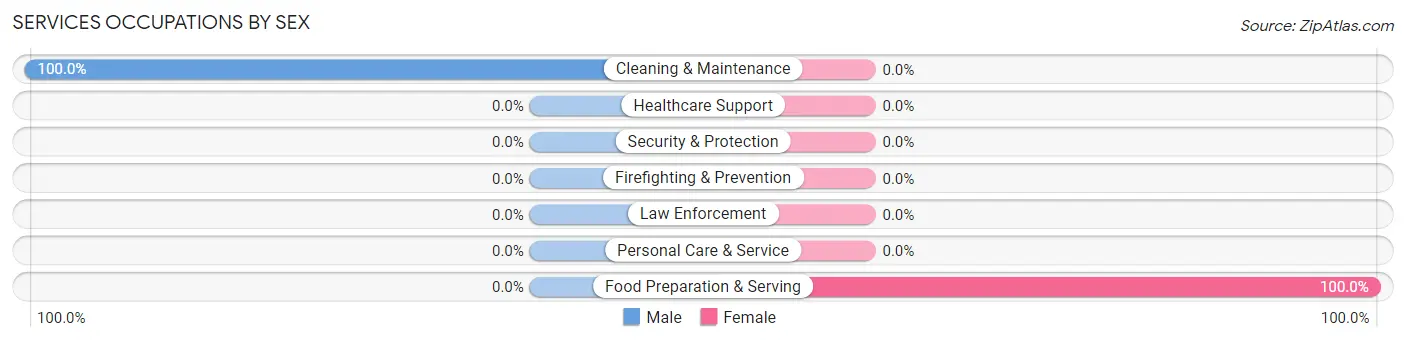
| Occupation | Male | Female |
| Healthcare Support | 0 (0.0%) | 0 (0.0%) |
| Security & Protection | 0 (0.0%) | 0 (0.0%) |
| Firefighting & Prevention | 0 (0.0%) | 0 (0.0%) |
| Law Enforcement | 0 (0.0%) | 0 (0.0%) |
| Food Preparation & Serving | 0 (0.0%) | 3 (100.0%) |
| Cleaning & Maintenance | 4 (100.0%) | 0 (0.0%) |
| Personal Care & Service | 0 (0.0%) | 0 (0.0%) |
| Total (Category) | 4 (57.1%) | 3 (42.9%) |
| Total (Overall) | 26 (63.4%) | 15 (36.6%) |
Sales and Office Occupations
The most common Sales and Office occupations in Buckeye are Sales & Related (4 | 9.8%), and Office & Administration (2 | 4.9%).
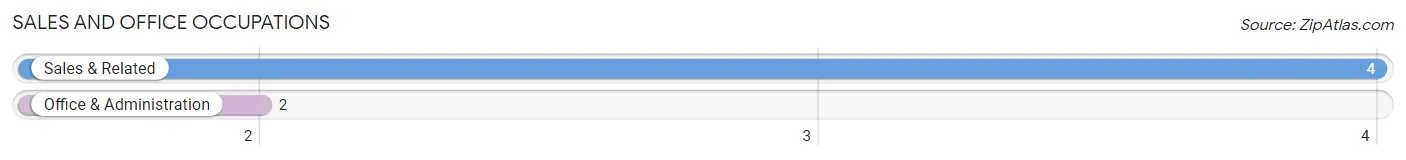
Sales and Office Occupations by Sex
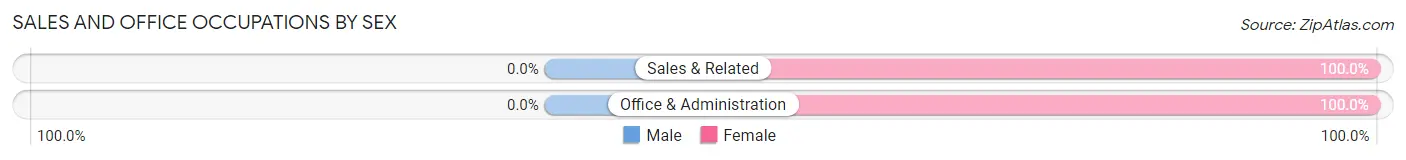
| Occupation | Male | Female |
| Sales & Related | 0 (0.0%) | 4 (100.0%) |
| Office & Administration | 0 (0.0%) | 2 (100.0%) |
| Total (Category) | 0 (0.0%) | 6 (100.0%) |
| Total (Overall) | 26 (63.4%) | 15 (36.6%) |
Natural Resources, Construction and Maintenance Occupations
The most common Natural Resources, Construction and Maintenance occupations in Buckeye are Farming, Fishing & Forestry (3 | 7.3%), and Construction & Extraction (2 | 4.9%).
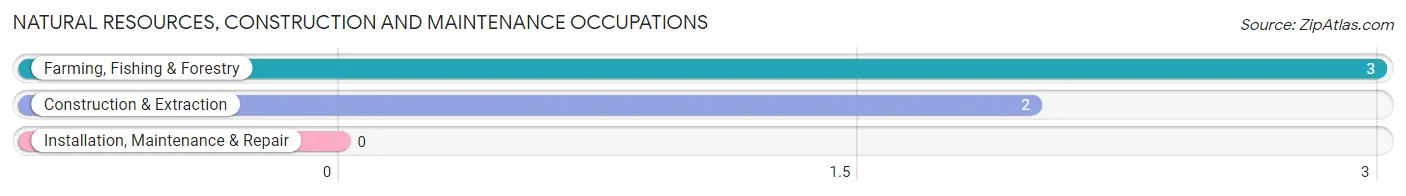
Natural Resources, Construction and Maintenance Occupations by Sex
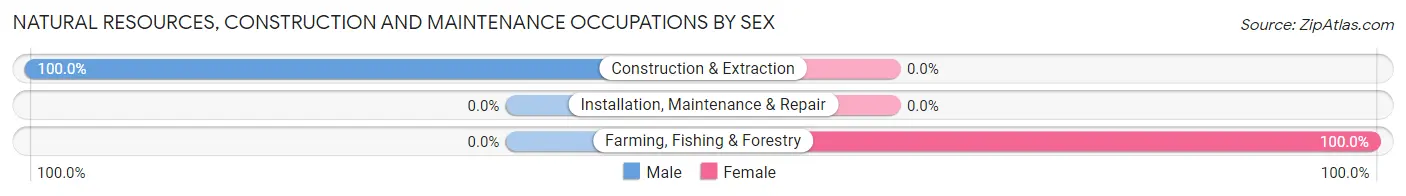
| Occupation | Male | Female |
| Farming, Fishing & Forestry | 0 (0.0%) | 3 (100.0%) |
| Construction & Extraction | 2 (100.0%) | 0 (0.0%) |
| Installation, Maintenance & Repair | 0 (0.0%) | 0 (0.0%) |
| Total (Category) | 2 (40.0%) | 3 (60.0%) |
| Total (Overall) | 26 (63.4%) | 15 (36.6%) |
Production, Transportation and Moving Occupations
The most common Production, Transportation and Moving occupations in Buckeye are Production (7 | 17.1%), and Transportation (6 | 14.6%).
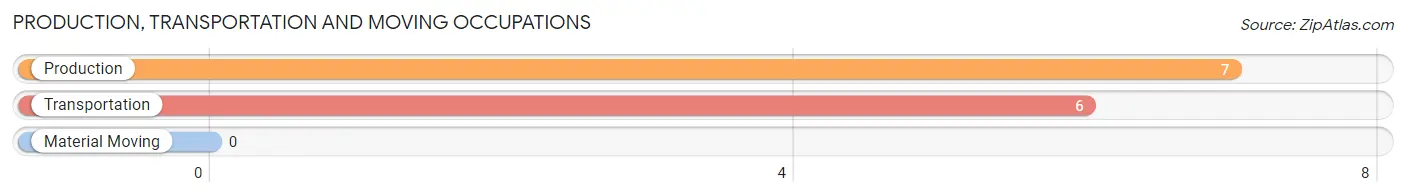
Production, Transportation and Moving Occupations by Sex
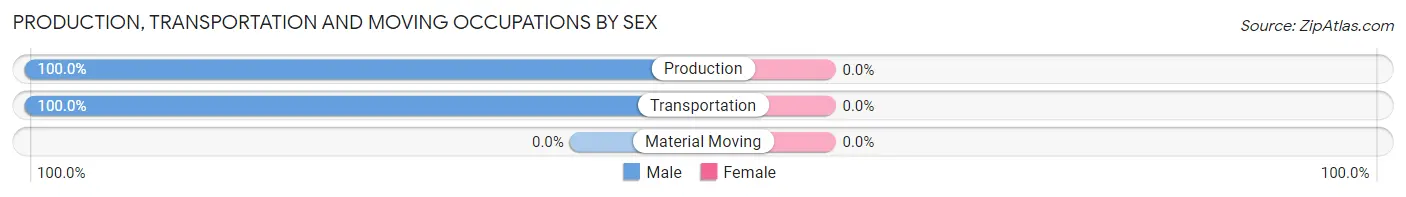
| Occupation | Male | Female |
| Production | 7 (100.0%) | 0 (0.0%) |
| Transportation | 6 (100.0%) | 0 (0.0%) |
| Material Moving | 0 (0.0%) | 0 (0.0%) |
| Total (Category) | 13 (100.0%) | 0 (0.0%) |
| Total (Overall) | 26 (63.4%) | 15 (36.6%) |
Employment Industries by Sex in Buckeye
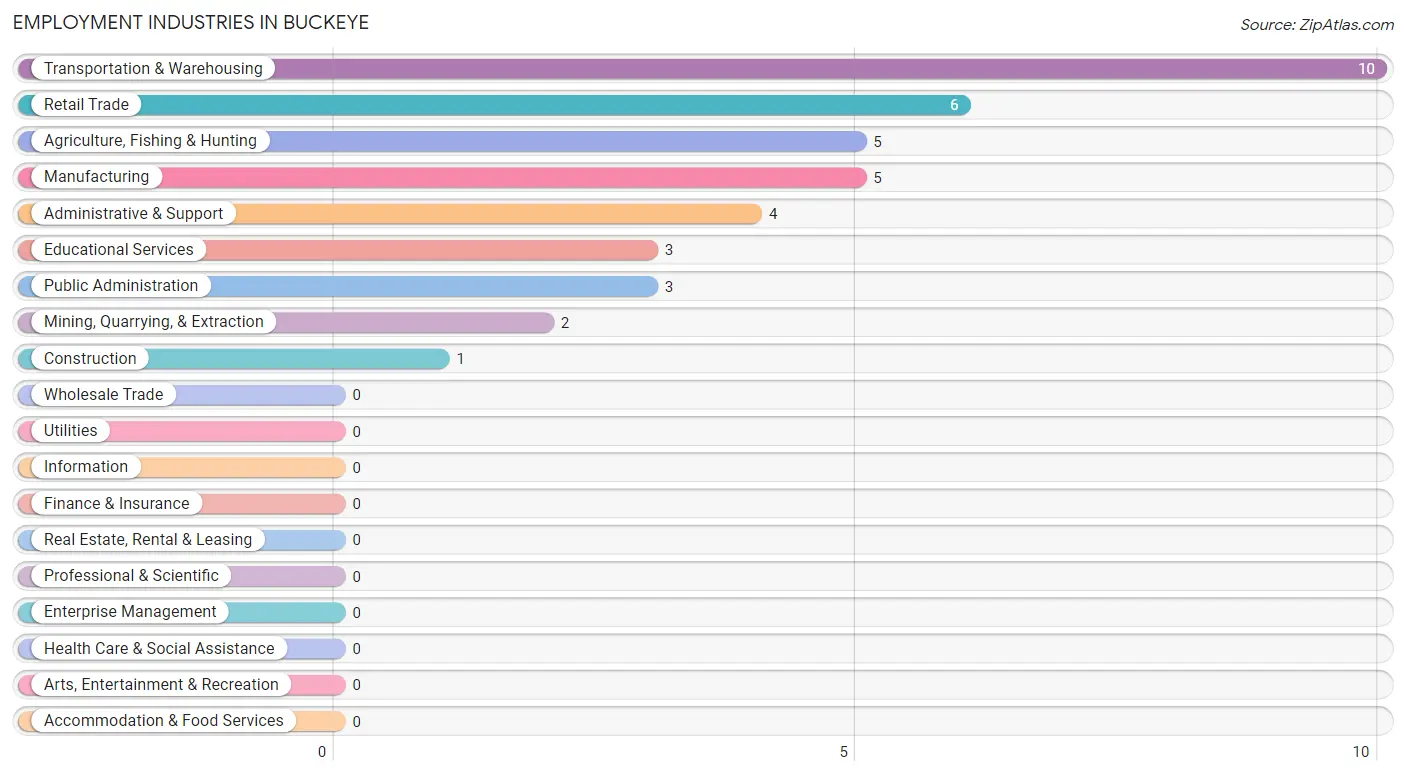
Employment Industries in Buckeye
The major employment industries in Buckeye include Transportation & Warehousing (10 | 24.4%), Retail Trade (6 | 14.6%), Agriculture, Fishing & Hunting (5 | 12.2%), Manufacturing (5 | 12.2%), and Administrative & Support (4 | 9.8%).
Employment Industries by Sex in Buckeye
The Buckeye industries that see more men than women are Mining, Quarrying, & Extraction (100.0%), Construction (100.0%), and Manufacturing (100.0%), whereas the industries that tend to have a higher number of women are Retail Trade (100.0%), Educational Services (100.0%), and Agriculture, Fishing & Hunting (60.0%).
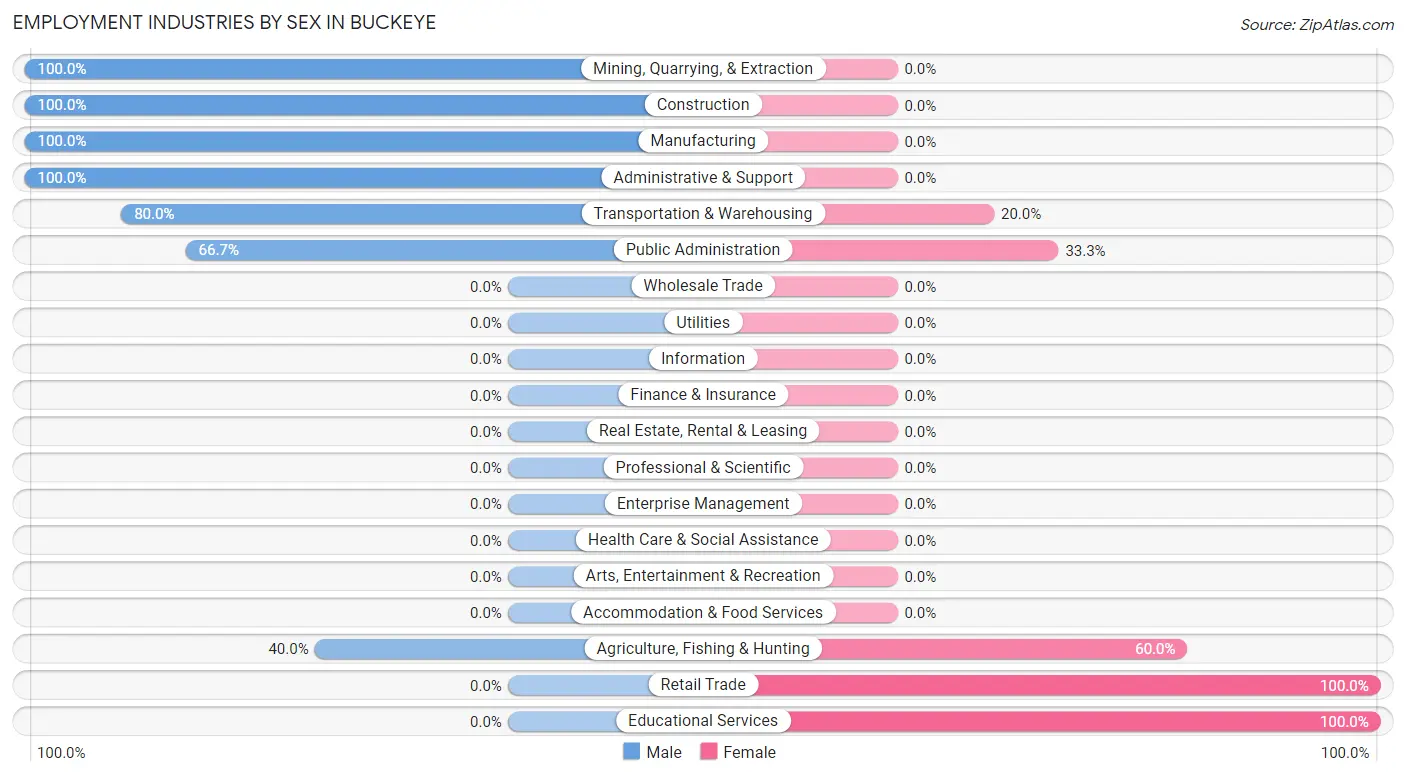
| Industry | Male | Female |
| Agriculture, Fishing & Hunting | 2 (40.0%) | 3 (60.0%) |
| Mining, Quarrying, & Extraction | 2 (100.0%) | 0 (0.0%) |
| Construction | 1 (100.0%) | 0 (0.0%) |
| Manufacturing | 5 (100.0%) | 0 (0.0%) |
| Wholesale Trade | 0 (0.0%) | 0 (0.0%) |
| Retail Trade | 0 (0.0%) | 6 (100.0%) |
| Transportation & Warehousing | 8 (80.0%) | 2 (20.0%) |
| Utilities | 0 (0.0%) | 0 (0.0%) |
| Information | 0 (0.0%) | 0 (0.0%) |
| Finance & Insurance | 0 (0.0%) | 0 (0.0%) |
| Real Estate, Rental & Leasing | 0 (0.0%) | 0 (0.0%) |
| Professional & Scientific | 0 (0.0%) | 0 (0.0%) |
| Enterprise Management | 0 (0.0%) | 0 (0.0%) |
| Administrative & Support | 4 (100.0%) | 0 (0.0%) |
| Educational Services | 0 (0.0%) | 3 (100.0%) |
| Health Care & Social Assistance | 0 (0.0%) | 0 (0.0%) |
| Arts, Entertainment & Recreation | 0 (0.0%) | 0 (0.0%) |
| Accommodation & Food Services | 0 (0.0%) | 0 (0.0%) |
| Public Administration | 2 (66.7%) | 1 (33.3%) |
| Total | 26 (63.4%) | 15 (36.6%) |
Education in Buckeye
School Enrollment in Buckeye
The most common levels of schooling among the 6 students in Buckeye are middle school (5 | 83.3%), and elementary school (1 | 16.7%).
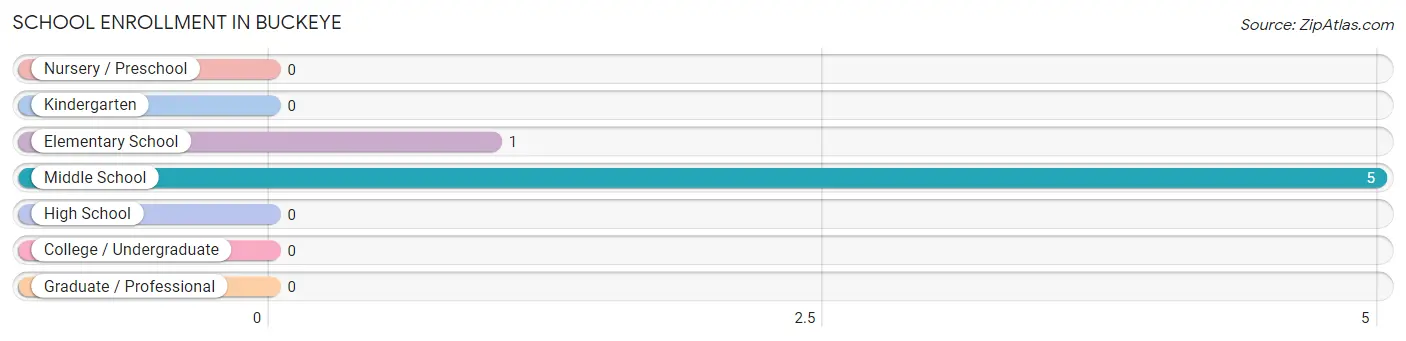
| School Level | # Students | % Students |
| Nursery / Preschool | 0 | 0.0% |
| Kindergarten | 0 | 0.0% |
| Elementary School | 1 | 16.7% |
| Middle School | 5 | 83.3% |
| High School | 0 | 0.0% |
| College / Undergraduate | 0 | 0.0% |
| Graduate / Professional | 0 | 0.0% |
| Total | 6 | 100.0% |
School Enrollment by Age by Funding Source in Buckeye
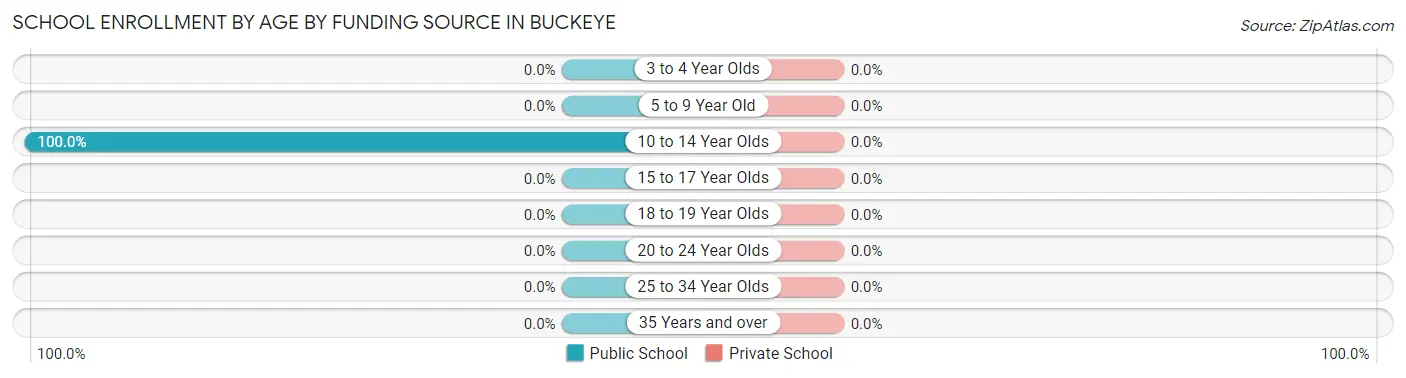
| Age Bracket | Public School | Private School |
| 3 to 4 Year Olds | 0 (0.0%) | 0 (0.0%) |
| 5 to 9 Year Old | 0 (0.0%) | 0 (0.0%) |
| 10 to 14 Year Olds | 6 (100.0%) | 0 (0.0%) |
| 15 to 17 Year Olds | 0 (0.0%) | 0 (0.0%) |
| 18 to 19 Year Olds | 0 (0.0%) | 0 (0.0%) |
| 20 to 24 Year Olds | 0 (0.0%) | 0 (0.0%) |
| 25 to 34 Year Olds | 0 (0.0%) | 0 (0.0%) |
| 35 Years and over | 0 (0.0%) | 0 (0.0%) |
| Total | 6 (100.0%) | 0 (0.0%) |
Educational Attainment by Field of Study in Buckeye
Education (3 | 27.3%), bio, nature & agricultural (2 | 18.2%), science & technology (2 | 18.2%), liberal arts & history (2 | 18.2%), and arts & humanities (2 | 18.2%) are the most common fields of study among 11 individuals in Buckeye who have obtained a bachelor's degree or higher.
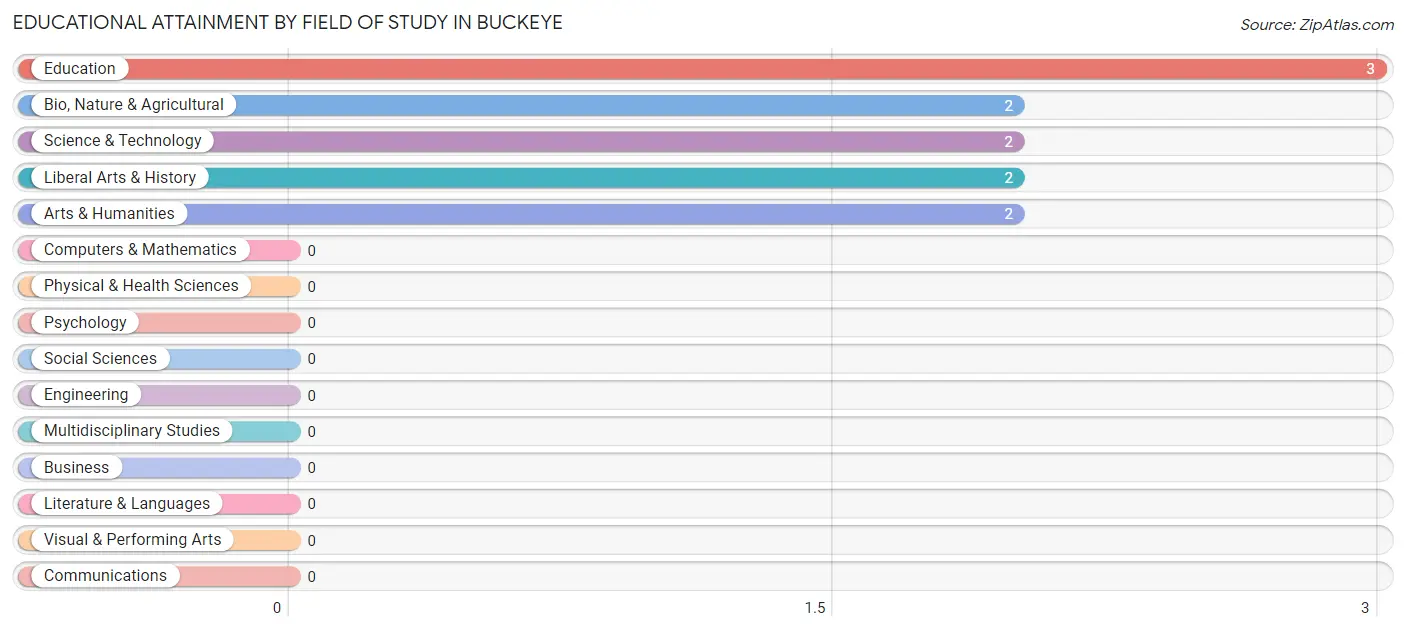
| Field of Study | # Graduates | % Graduates |
| Computers & Mathematics | 0 | 0.0% |
| Bio, Nature & Agricultural | 2 | 18.2% |
| Physical & Health Sciences | 0 | 0.0% |
| Psychology | 0 | 0.0% |
| Social Sciences | 0 | 0.0% |
| Engineering | 0 | 0.0% |
| Multidisciplinary Studies | 0 | 0.0% |
| Science & Technology | 2 | 18.2% |
| Business | 0 | 0.0% |
| Education | 3 | 27.3% |
| Literature & Languages | 0 | 0.0% |
| Liberal Arts & History | 2 | 18.2% |
| Visual & Performing Arts | 0 | 0.0% |
| Communications | 0 | 0.0% |
| Arts & Humanities | 2 | 18.2% |
| Total | 11 | 100.0% |
Transportation & Commute in Buckeye
Vehicle Availability by Sex in Buckeye
The most prevalent vehicle ownership categories in Buckeye are males with 2 vehicles (13, accounting for 50.0%) and females with 2 vehicles (7, making up 86.7%).
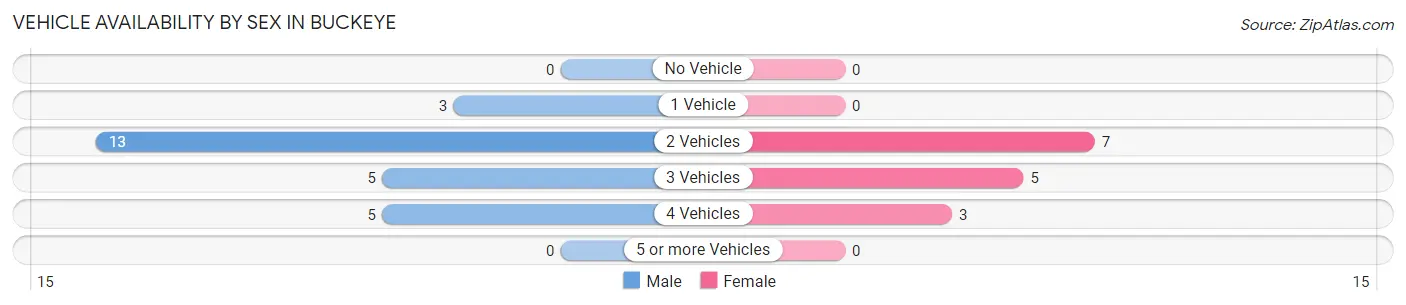
| Vehicles Available | Male | Female |
| No Vehicle | 0 (0.0%) | 0 (0.0%) |
| 1 Vehicle | 3 (11.5%) | 0 (0.0%) |
| 2 Vehicles | 13 (50.0%) | 7 (46.7%) |
| 3 Vehicles | 5 (19.2%) | 5 (33.3%) |
| 4 Vehicles | 5 (19.2%) | 3 (20.0%) |
| 5 or more Vehicles | 0 (0.0%) | 0 (0.0%) |
| Total | 26 (100.0%) | 15 (100.0%) |
Commute Time in Buckeye
The most frequently occuring commute durations in Buckeye are 15 to 19 minutes (14 commuters, 34.2%), 10 to 14 minutes (13 commuters, 31.7%), and less than 5 minutes (6 commuters, 14.6%).
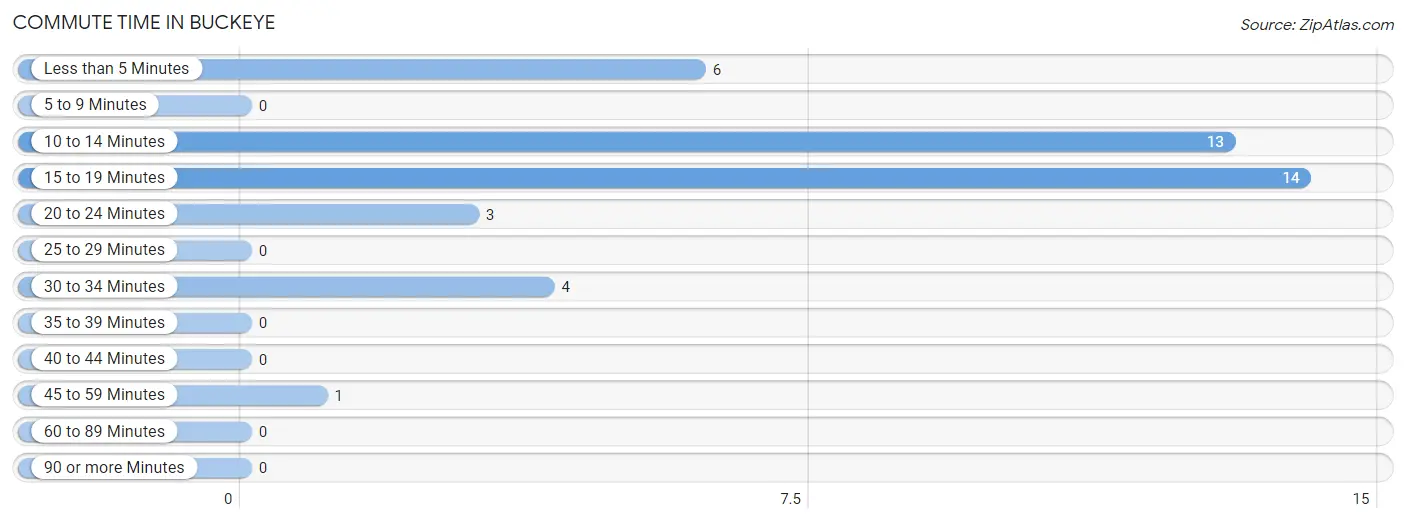
| Commute Time | # Commuters | % Commuters |
| Less than 5 Minutes | 6 | 14.6% |
| 5 to 9 Minutes | 0 | 0.0% |
| 10 to 14 Minutes | 13 | 31.7% |
| 15 to 19 Minutes | 14 | 34.2% |
| 20 to 24 Minutes | 3 | 7.3% |
| 25 to 29 Minutes | 0 | 0.0% |
| 30 to 34 Minutes | 4 | 9.8% |
| 35 to 39 Minutes | 0 | 0.0% |
| 40 to 44 Minutes | 0 | 0.0% |
| 45 to 59 Minutes | 1 | 2.4% |
| 60 to 89 Minutes | 0 | 0.0% |
| 90 or more Minutes | 0 | 0.0% |
Commute Time by Sex in Buckeye
The most common commute times in Buckeye are 15 to 19 minutes (8 commuters, 30.8%) for males and 10 to 14 minutes (6 commuters, 40.0%) for females.
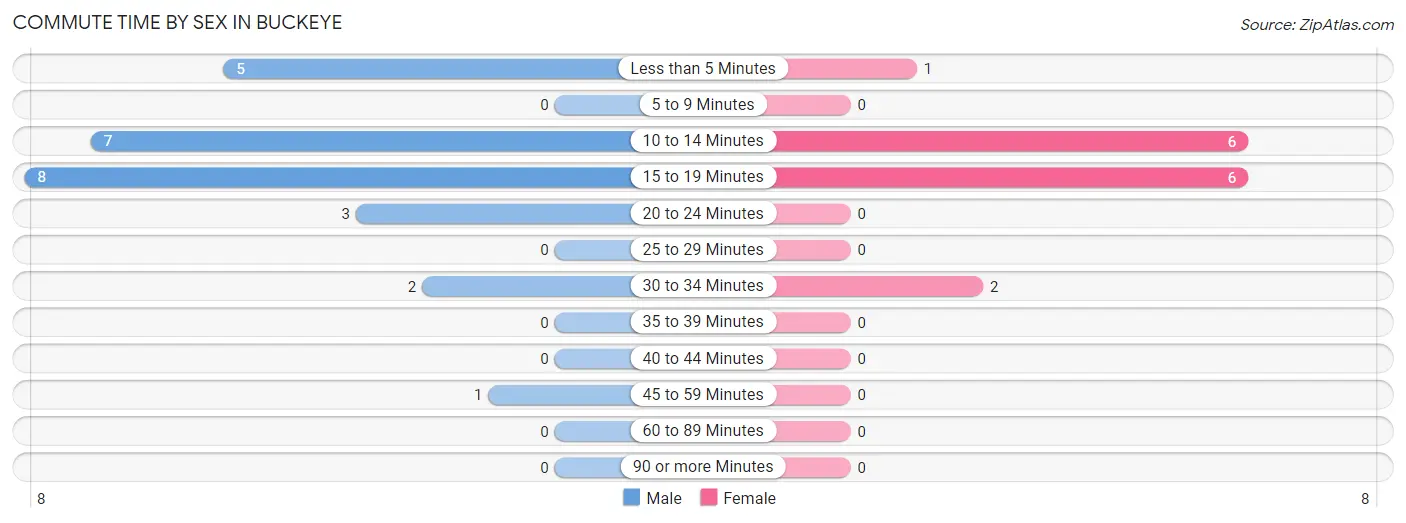
| Commute Time | Male | Female |
| Less than 5 Minutes | 5 (19.2%) | 1 (6.7%) |
| 5 to 9 Minutes | 0 (0.0%) | 0 (0.0%) |
| 10 to 14 Minutes | 7 (26.9%) | 6 (40.0%) |
| 15 to 19 Minutes | 8 (30.8%) | 6 (40.0%) |
| 20 to 24 Minutes | 3 (11.5%) | 0 (0.0%) |
| 25 to 29 Minutes | 0 (0.0%) | 0 (0.0%) |
| 30 to 34 Minutes | 2 (7.7%) | 2 (13.3%) |
| 35 to 39 Minutes | 0 (0.0%) | 0 (0.0%) |
| 40 to 44 Minutes | 0 (0.0%) | 0 (0.0%) |
| 45 to 59 Minutes | 1 (3.8%) | 0 (0.0%) |
| 60 to 89 Minutes | 0 (0.0%) | 0 (0.0%) |
| 90 or more Minutes | 0 (0.0%) | 0 (0.0%) |
Time of Departure to Work by Sex in Buckeye
The most frequent times of departure to work in Buckeye are 6:00 AM to 6:29 AM (9, 34.6%) for males and 12:00 PM to 3:59 PM (5, 33.3%) for females.
| Time of Departure | Male | Female |
| 12:00 AM to 4:59 AM | 1 (3.8%) | 0 (0.0%) |
| 5:00 AM to 5:29 AM | 4 (15.4%) | 0 (0.0%) |
| 5:30 AM to 5:59 AM | 0 (0.0%) | 0 (0.0%) |
| 6:00 AM to 6:29 AM | 9 (34.6%) | 1 (6.7%) |
| 6:30 AM to 6:59 AM | 0 (0.0%) | 0 (0.0%) |
| 7:00 AM to 7:29 AM | 9 (34.6%) | 3 (20.0%) |
| 7:30 AM to 7:59 AM | 0 (0.0%) | 4 (26.7%) |
| 8:00 AM to 8:29 AM | 2 (7.7%) | 0 (0.0%) |
| 8:30 AM to 8:59 AM | 0 (0.0%) | 0 (0.0%) |
| 9:00 AM to 9:59 AM | 0 (0.0%) | 0 (0.0%) |
| 10:00 AM to 10:59 AM | 1 (3.8%) | 2 (13.3%) |
| 11:00 AM to 11:59 AM | 0 (0.0%) | 0 (0.0%) |
| 12:00 PM to 3:59 PM | 0 (0.0%) | 5 (33.3%) |
| 4:00 PM to 11:59 PM | 0 (0.0%) | 0 (0.0%) |
| Total | 26 (100.0%) | 15 (100.0%) |
Housing Occupancy in Buckeye
Occupancy by Ownership in Buckeye
Of the total 38 dwellings in Buckeye, owner-occupied units account for 27 (71.1%), while renter-occupied units make up 11 (28.9%).
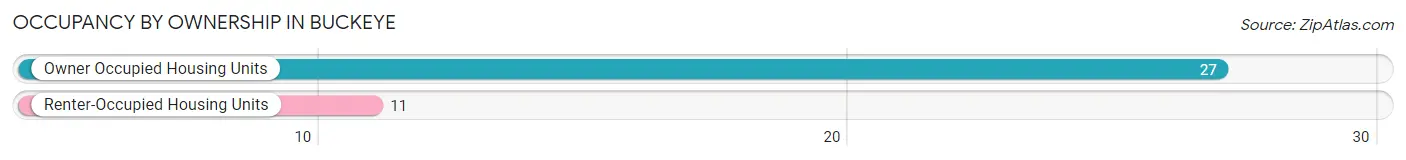
| Occupancy | # Housing Units | % Housing Units |
| Owner Occupied Housing Units | 27 | 71.1% |
| Renter-Occupied Housing Units | 11 | 28.9% |
| Total Occupied Housing Units | 38 | 100.0% |
Occupancy by Household Size in Buckeye
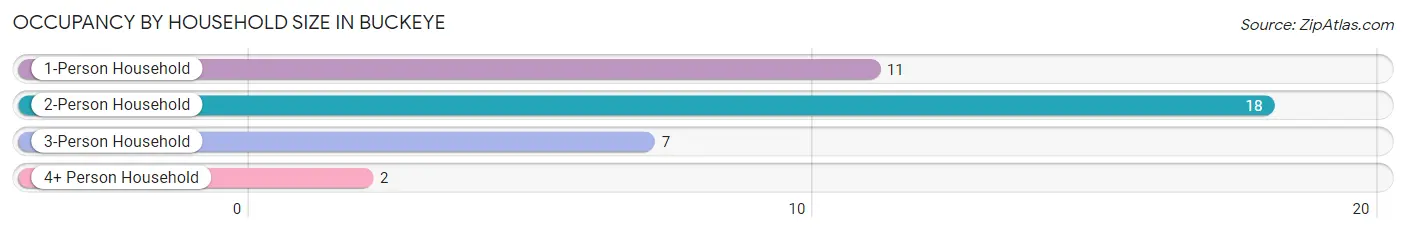
| Household Size | # Housing Units | % Housing Units |
| 1-Person Household | 11 | 28.9% |
| 2-Person Household | 18 | 47.4% |
| 3-Person Household | 7 | 18.4% |
| 4+ Person Household | 2 | 5.3% |
| Total Housing Units | 38 | 100.0% |
Occupancy by Ownership by Household Size in Buckeye
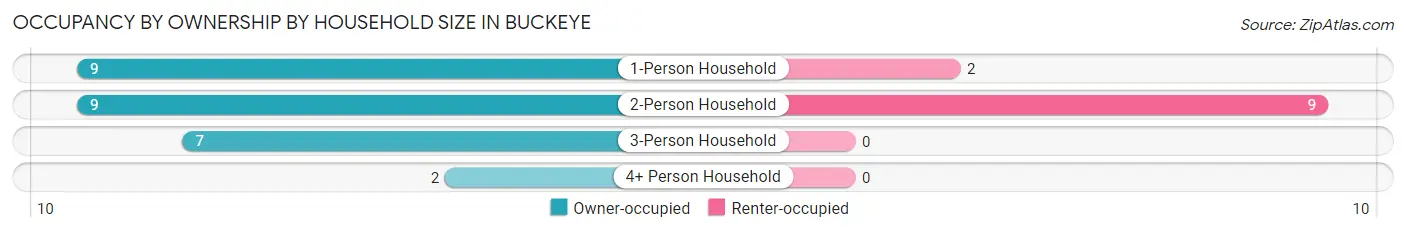
| Household Size | Owner-occupied | Renter-occupied |
| 1-Person Household | 9 (81.8%) | 2 (18.2%) |
| 2-Person Household | 9 (50.0%) | 9 (50.0%) |
| 3-Person Household | 7 (100.0%) | 0 (0.0%) |
| 4+ Person Household | 2 (100.0%) | 0 (0.0%) |
| Total Housing Units | 27 (71.1%) | 11 (28.9%) |
Occupancy by Educational Attainment in Buckeye
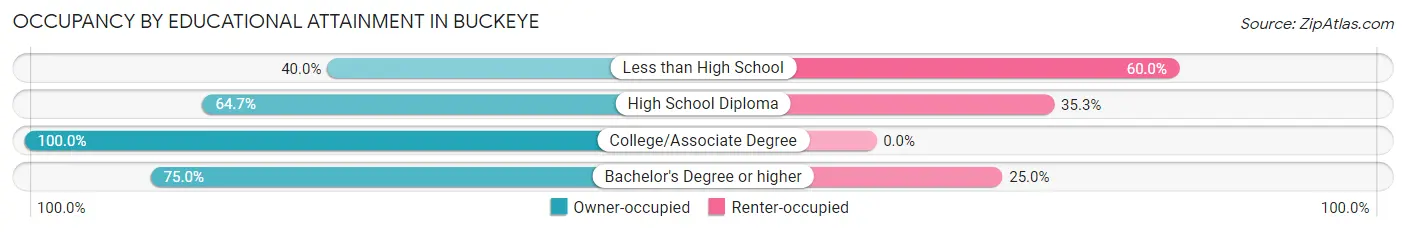
| Household Size | Owner-occupied | Renter-occupied |
| Less than High School | 2 (40.0%) | 3 (60.0%) |
| High School Diploma | 11 (64.7%) | 6 (35.3%) |
| College/Associate Degree | 8 (100.0%) | 0 (0.0%) |
| Bachelor's Degree or higher | 6 (75.0%) | 2 (25.0%) |
Occupancy by Age of Householder in Buckeye
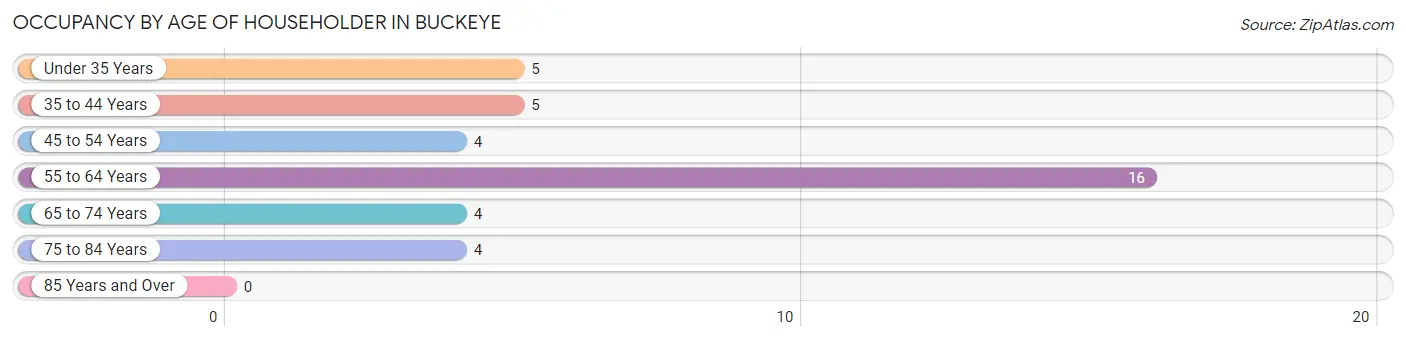
| Age Bracket | # Households | % Households |
| Under 35 Years | 5 | 13.2% |
| 35 to 44 Years | 5 | 13.2% |
| 45 to 54 Years | 4 | 10.5% |
| 55 to 64 Years | 16 | 42.1% |
| 65 to 74 Years | 4 | 10.5% |
| 75 to 84 Years | 4 | 10.5% |
| 85 Years and Over | 0 | 0.0% |
| Total | 38 | 100.0% |
Housing Finances in Buckeye
Median Income by Occupancy in Buckeye
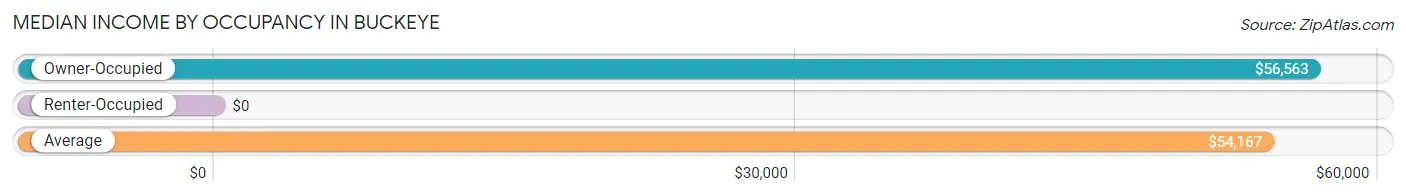
| Occupancy Type | # Households | Median Income |
| Owner-Occupied | 27 (71.1%) | $56,563 |
| Renter-Occupied | 11 (28.9%) | $0 |
| Average | 38 (100.0%) | $54,167 |
Occupancy by Householder Income Bracket in Buckeye
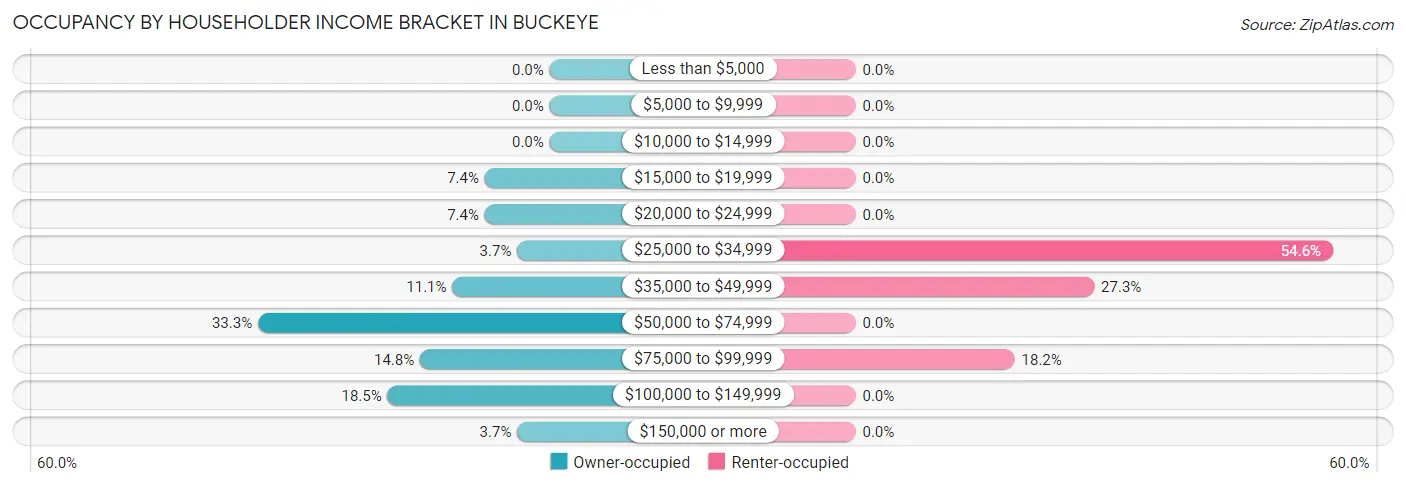
| Income Bracket | Owner-occupied | Renter-occupied |
| Less than $5,000 | 0 (0.0%) | 0 (0.0%) |
| $5,000 to $9,999 | 0 (0.0%) | 0 (0.0%) |
| $10,000 to $14,999 | 0 (0.0%) | 0 (0.0%) |
| $15,000 to $19,999 | 2 (7.4%) | 0 (0.0%) |
| $20,000 to $24,999 | 2 (7.4%) | 0 (0.0%) |
| $25,000 to $34,999 | 1 (3.7%) | 6 (54.5%) |
| $35,000 to $49,999 | 3 (11.1%) | 3 (27.3%) |
| $50,000 to $74,999 | 9 (33.3%) | 0 (0.0%) |
| $75,000 to $99,999 | 4 (14.8%) | 2 (18.2%) |
| $100,000 to $149,999 | 5 (18.5%) | 0 (0.0%) |
| $150,000 or more | 1 (3.7%) | 0 (0.0%) |
| Total | 27 (100.0%) | 11 (100.0%) |
Monthly Housing Cost Tiers in Buckeye
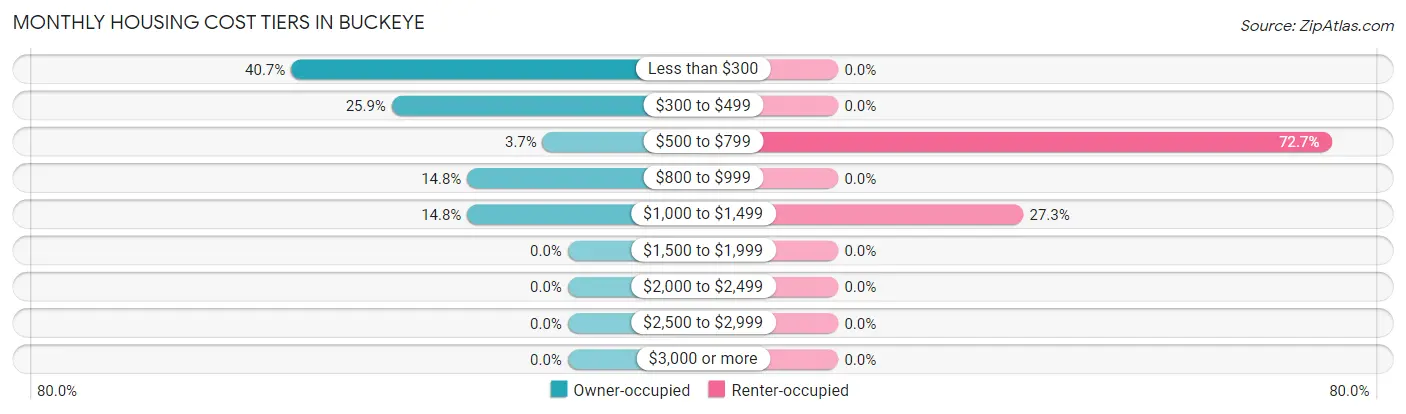
| Monthly Cost | Owner-occupied | Renter-occupied |
| Less than $300 | 11 (40.7%) | 0 (0.0%) |
| $300 to $499 | 7 (25.9%) | 0 (0.0%) |
| $500 to $799 | 1 (3.7%) | 8 (72.7%) |
| $800 to $999 | 4 (14.8%) | 0 (0.0%) |
| $1,000 to $1,499 | 4 (14.8%) | 3 (27.3%) |
| $1,500 to $1,999 | 0 (0.0%) | 0 (0.0%) |
| $2,000 to $2,499 | 0 (0.0%) | 0 (0.0%) |
| $2,500 to $2,999 | 0 (0.0%) | 0 (0.0%) |
| $3,000 or more | 0 (0.0%) | 0 (0.0%) |
| Total | 27 (100.0%) | 11 (100.0%) |
Physical Housing Characteristics in Buckeye
Housing Structures in Buckeye
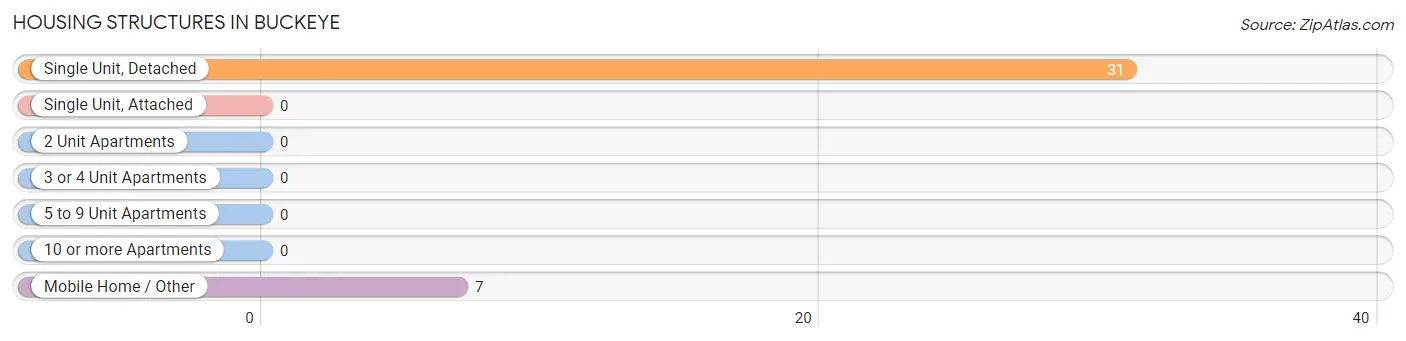
| Structure Type | # Housing Units | % Housing Units |
| Single Unit, Detached | 31 | 81.6% |
| Single Unit, Attached | 0 | 0.0% |
| 2 Unit Apartments | 0 | 0.0% |
| 3 or 4 Unit Apartments | 0 | 0.0% |
| 5 to 9 Unit Apartments | 0 | 0.0% |
| 10 or more Apartments | 0 | 0.0% |
| Mobile Home / Other | 7 | 18.4% |
| Total | 38 | 100.0% |
Housing Structures by Occupancy in Buckeye
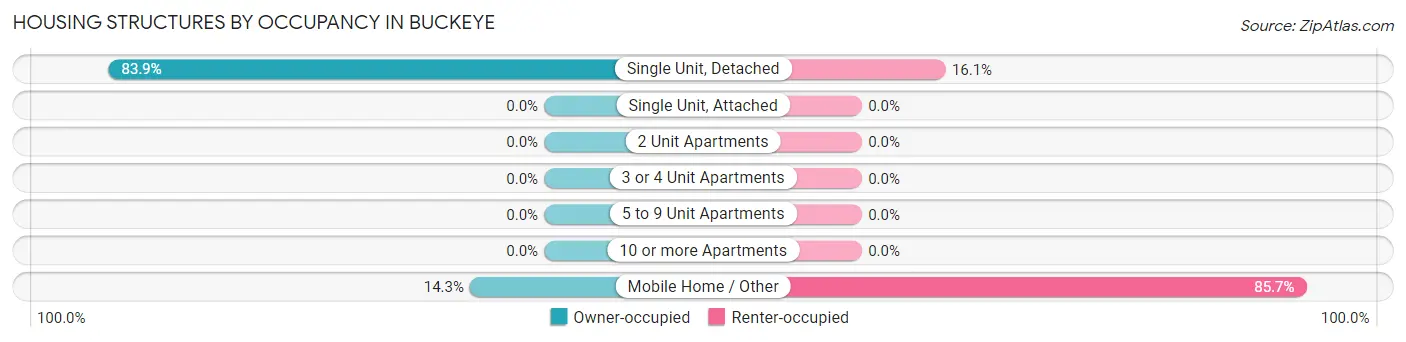
| Structure Type | Owner-occupied | Renter-occupied |
| Single Unit, Detached | 26 (83.9%) | 5 (16.1%) |
| Single Unit, Attached | 0 (0.0%) | 0 (0.0%) |
| 2 Unit Apartments | 0 (0.0%) | 0 (0.0%) |
| 3 or 4 Unit Apartments | 0 (0.0%) | 0 (0.0%) |
| 5 to 9 Unit Apartments | 0 (0.0%) | 0 (0.0%) |
| 10 or more Apartments | 0 (0.0%) | 0 (0.0%) |
| Mobile Home / Other | 1 (14.3%) | 6 (85.7%) |
| Total | 27 (71.1%) | 11 (28.9%) |
Housing Structures by Number of Rooms in Buckeye
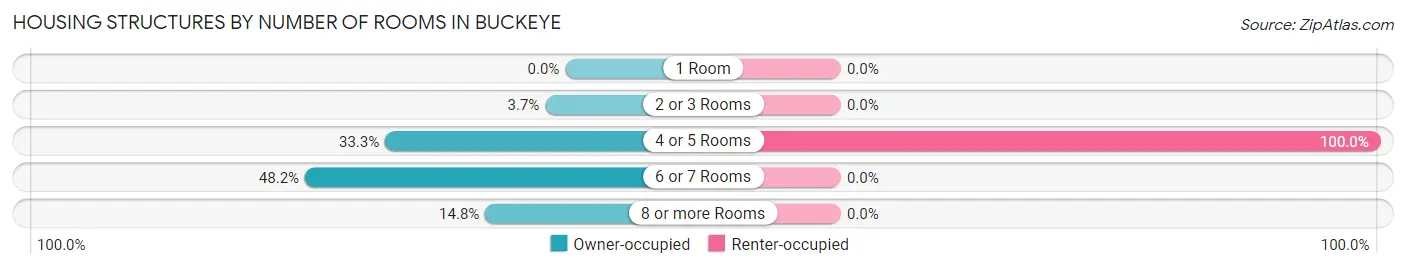
| Number of Rooms | Owner-occupied | Renter-occupied |
| 1 Room | 0 (0.0%) | 0 (0.0%) |
| 2 or 3 Rooms | 1 (3.7%) | 0 (0.0%) |
| 4 or 5 Rooms | 9 (33.3%) | 11 (100.0%) |
| 6 or 7 Rooms | 13 (48.1%) | 0 (0.0%) |
| 8 or more Rooms | 4 (14.8%) | 0 (0.0%) |
| Total | 27 (100.0%) | 11 (100.0%) |
Housing Structure by Heating Type in Buckeye
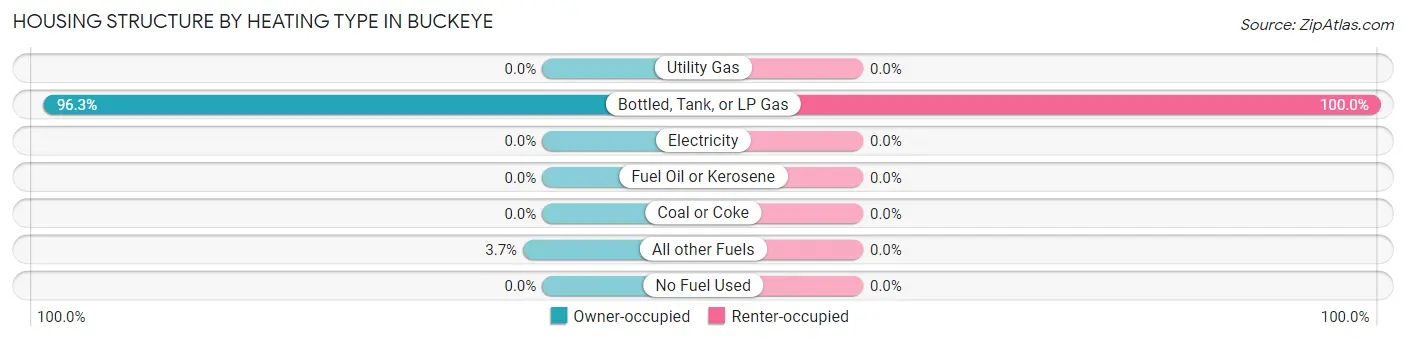
| Heating Type | Owner-occupied | Renter-occupied |
| Utility Gas | 0 (0.0%) | 0 (0.0%) |
| Bottled, Tank, or LP Gas | 26 (96.3%) | 11 (100.0%) |
| Electricity | 0 (0.0%) | 0 (0.0%) |
| Fuel Oil or Kerosene | 0 (0.0%) | 0 (0.0%) |
| Coal or Coke | 0 (0.0%) | 0 (0.0%) |
| All other Fuels | 1 (3.7%) | 0 (0.0%) |
| No Fuel Used | 0 (0.0%) | 0 (0.0%) |
| Total | 27 (100.0%) | 11 (100.0%) |
Household Vehicle Usage in Buckeye
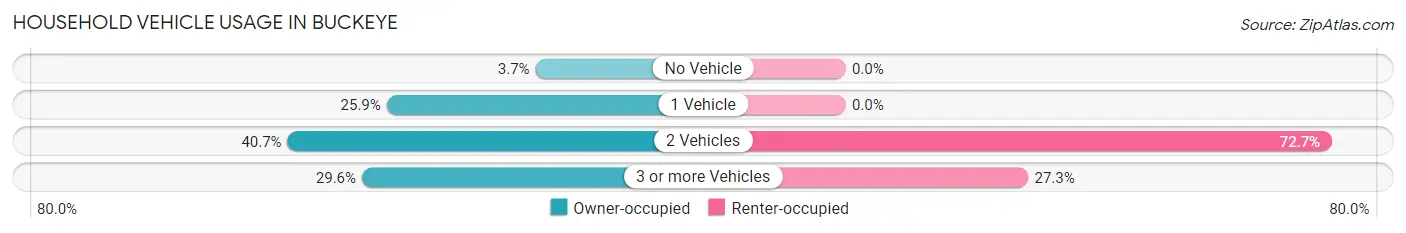
| Vehicles per Household | Owner-occupied | Renter-occupied |
| No Vehicle | 1 (3.7%) | 0 (0.0%) |
| 1 Vehicle | 7 (25.9%) | 0 (0.0%) |
| 2 Vehicles | 11 (40.7%) | 8 (72.7%) |
| 3 or more Vehicles | 8 (29.6%) | 3 (27.3%) |
| Total | 27 (100.0%) | 11 (100.0%) |
Real Estate & Mortgages in Buckeye
Real Estate and Mortgage Overview in Buckeye
| Characteristic | Without Mortgage | With Mortgage |
| Housing Units | 20 | 7 |
| Median Property Value | - | - |
| Median Household Income | $56,250 | $0 |
| Monthly Housing Costs | $283 | $0 |
| Real Estate Taxes | $375 | $0 |
Property Value by Mortgage Status in Buckeye
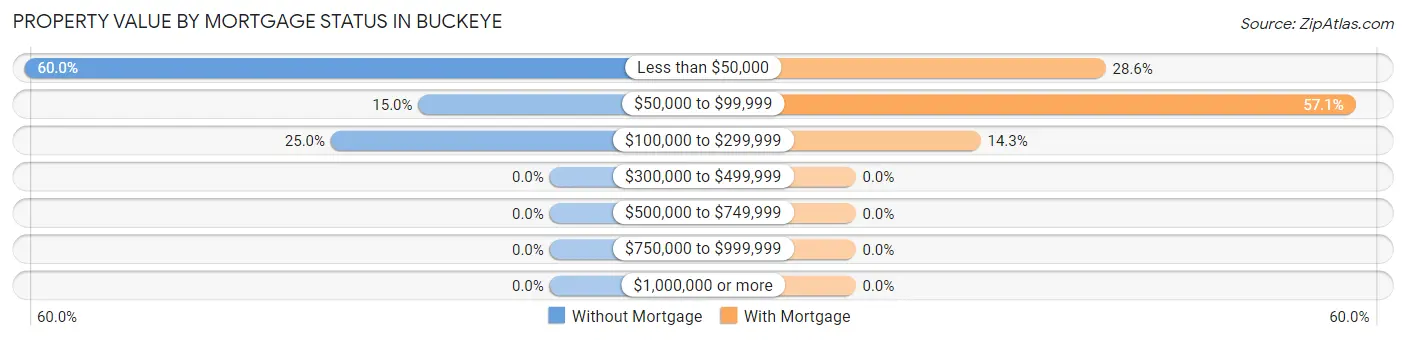
| Property Value | Without Mortgage | With Mortgage |
| Less than $50,000 | 12 (60.0%) | 2 (28.6%) |
| $50,000 to $99,999 | 3 (15.0%) | 4 (57.1%) |
| $100,000 to $299,999 | 5 (25.0%) | 1 (14.3%) |
| $300,000 to $499,999 | 0 (0.0%) | 0 (0.0%) |
| $500,000 to $749,999 | 0 (0.0%) | 0 (0.0%) |
| $750,000 to $999,999 | 0 (0.0%) | 0 (0.0%) |
| $1,000,000 or more | 0 (0.0%) | 0 (0.0%) |
| Total | 20 (100.0%) | 7 (100.0%) |
Household Income by Mortgage Status in Buckeye
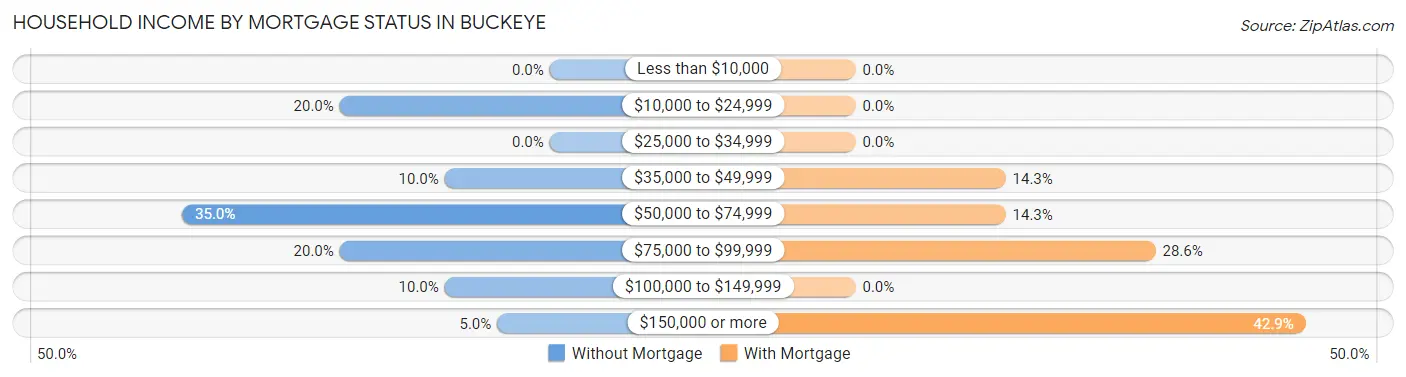
| Household Income | Without Mortgage | With Mortgage |
| Less than $10,000 | 0 (0.0%) | 0 (0.0%) |
| $10,000 to $24,999 | 4 (20.0%) | 0 (0.0%) |
| $25,000 to $34,999 | 0 (0.0%) | 0 (0.0%) |
| $35,000 to $49,999 | 2 (10.0%) | 1 (14.3%) |
| $50,000 to $74,999 | 7 (35.0%) | 1 (14.3%) |
| $75,000 to $99,999 | 4 (20.0%) | 2 (28.6%) |
| $100,000 to $149,999 | 2 (10.0%) | 0 (0.0%) |
| $150,000 or more | 1 (5.0%) | 3 (42.9%) |
| Total | 20 (100.0%) | 7 (100.0%) |
Property Value to Household Income Ratio in Buckeye
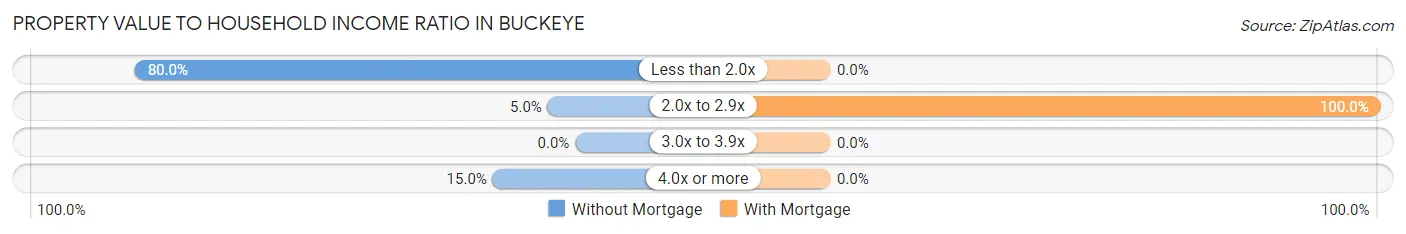
| Value-to-Income Ratio | Without Mortgage | With Mortgage |
| Less than 2.0x | 16 (80.0%) | 0 (0.0%) |
| 2.0x to 2.9x | 1 (5.0%) | 7 (100.0%) |
| 3.0x to 3.9x | 0 (0.0%) | 0 (0.0%) |
| 4.0x or more | 3 (15.0%) | 0 (0.0%) |
| Total | 20 (100.0%) | 7 (100.0%) |
Real Estate Taxes by Mortgage Status in Buckeye
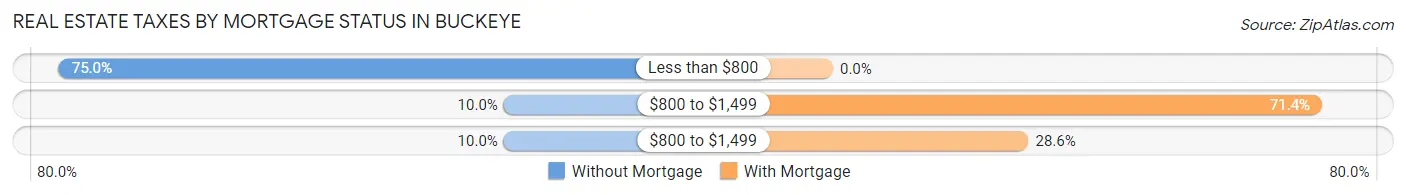
| Property Taxes | Without Mortgage | With Mortgage |
| Less than $800 | 15 (75.0%) | 0 (0.0%) |
| $800 to $1,499 | 2 (10.0%) | 5 (71.4%) |
| $800 to $1,499 | 2 (10.0%) | 2 (28.6%) |
| Total | 20 (100.0%) | 7 (100.0%) |
Health & Disability in Buckeye
Health Insurance Coverage by Age in Buckeye
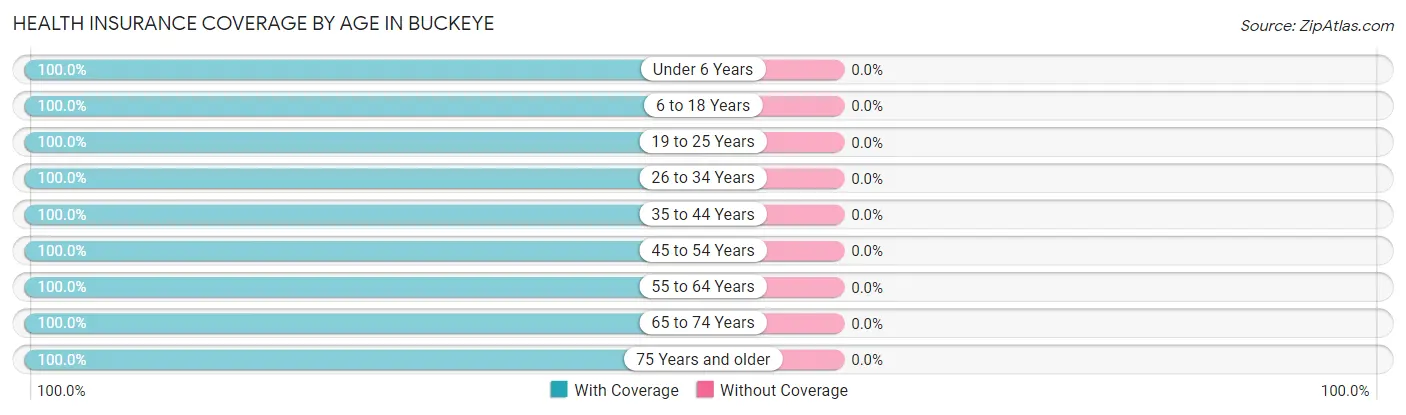
| Age Bracket | With Coverage | Without Coverage |
| Under 6 Years | 11 (100.0%) | 0 (0.0%) |
| 6 to 18 Years | 6 (100.0%) | 0 (0.0%) |
| 19 to 25 Years | 6 (100.0%) | 0 (0.0%) |
| 26 to 34 Years | 4 (100.0%) | 0 (0.0%) |
| 35 to 44 Years | 14 (100.0%) | 0 (0.0%) |
| 45 to 54 Years | 4 (100.0%) | 0 (0.0%) |
| 55 to 64 Years | 27 (100.0%) | 0 (0.0%) |
| 65 to 74 Years | 5 (100.0%) | 0 (0.0%) |
| 75 Years and older | 7 (100.0%) | 0 (0.0%) |
| Total | 84 (100.0%) | 0 (0.0%) |
Health Insurance Coverage by Citizenship Status in Buckeye
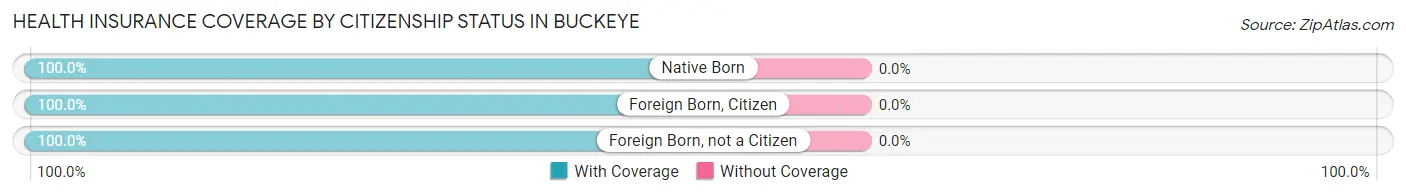
| Citizenship Status | With Coverage | Without Coverage |
| Native Born | 11 (100.0%) | 0 (0.0%) |
| Foreign Born, Citizen | 6 (100.0%) | 0 (0.0%) |
| Foreign Born, not a Citizen | 6 (100.0%) | 0 (0.0%) |
Health Insurance Coverage by Household Income in Buckeye
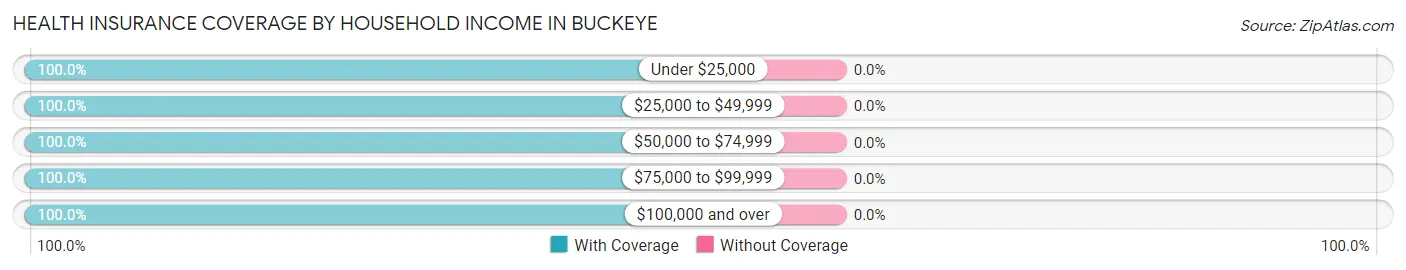
| Household Income | With Coverage | Without Coverage |
| Under $25,000 | 9 (100.0%) | 0 (0.0%) |
| $25,000 to $49,999 | 25 (100.0%) | 0 (0.0%) |
| $50,000 to $74,999 | 17 (100.0%) | 0 (0.0%) |
| $75,000 to $99,999 | 14 (100.0%) | 0 (0.0%) |
| $100,000 and over | 19 (100.0%) | 0 (0.0%) |
Public vs Private Health Insurance Coverage by Age in Buckeye
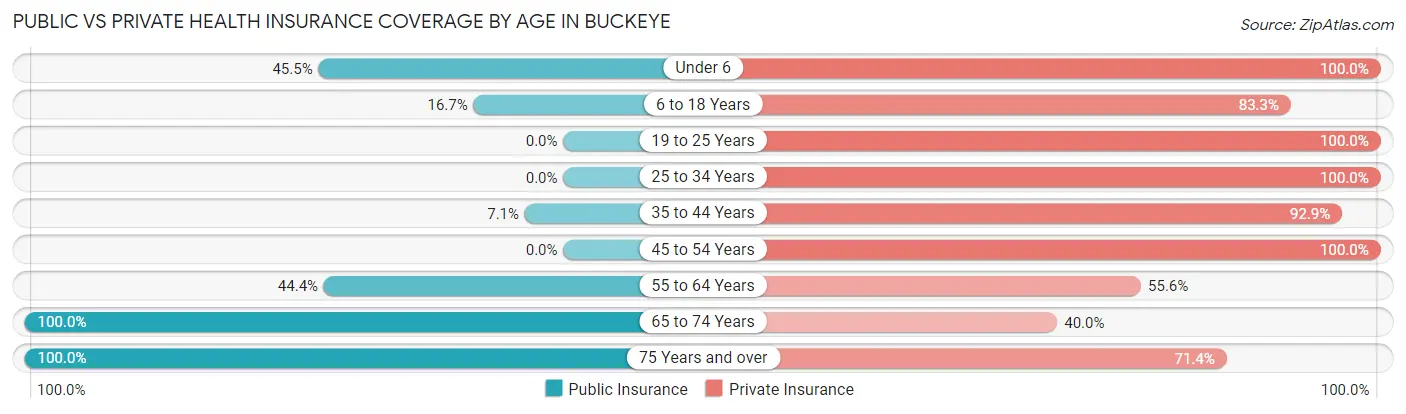
| Age Bracket | Public Insurance | Private Insurance |
| Under 6 | 5 (45.5%) | 11 (100.0%) |
| 6 to 18 Years | 1 (16.7%) | 5 (83.3%) |
| 19 to 25 Years | 0 (0.0%) | 6 (100.0%) |
| 25 to 34 Years | 0 (0.0%) | 4 (100.0%) |
| 35 to 44 Years | 1 (7.1%) | 13 (92.9%) |
| 45 to 54 Years | 0 (0.0%) | 4 (100.0%) |
| 55 to 64 Years | 12 (44.4%) | 15 (55.6%) |
| 65 to 74 Years | 5 (100.0%) | 2 (40.0%) |
| 75 Years and over | 7 (100.0%) | 5 (71.4%) |
| Total | 31 (36.9%) | 65 (77.4%) |
Disability Status by Sex by Age in Buckeye
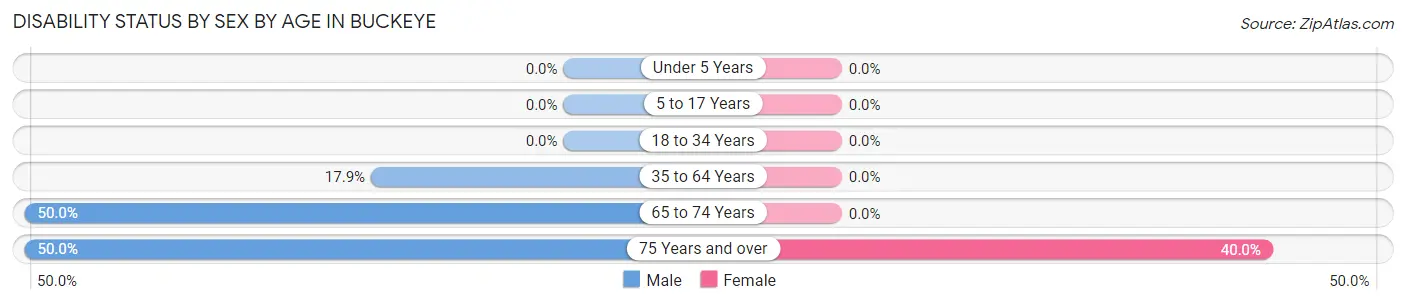
| Age Bracket | Male | Female |
| Under 5 Years | 0 (0.0%) | 0 (0.0%) |
| 5 to 17 Years | 0 (0.0%) | 0 (0.0%) |
| 18 to 34 Years | 0 (0.0%) | 0 (0.0%) |
| 35 to 64 Years | 5 (17.9%) | 0 (0.0%) |
| 65 to 74 Years | 2 (50.0%) | 0 (0.0%) |
| 75 Years and over | 1 (50.0%) | 2 (40.0%) |
Disability Class by Sex by Age in Buckeye
Disability Class: Hearing Difficulty
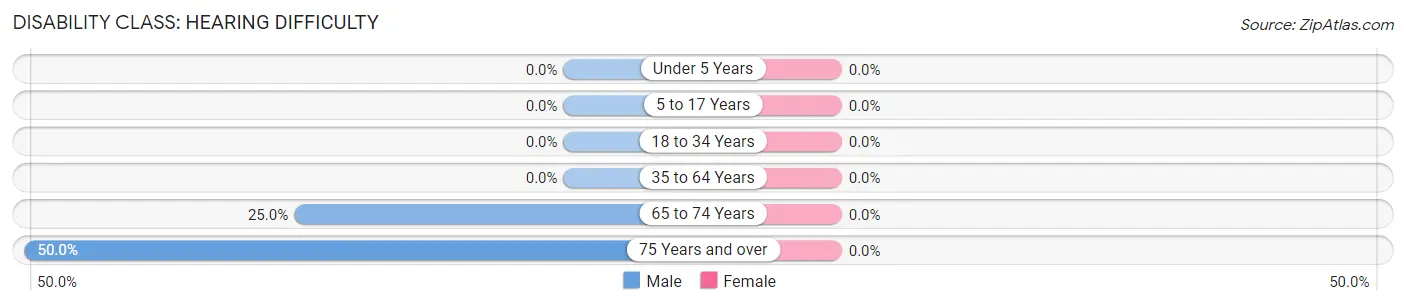
| Age Bracket | Male | Female |
| Under 5 Years | 0 (0.0%) | 0 (0.0%) |
| 5 to 17 Years | 0 (0.0%) | 0 (0.0%) |
| 18 to 34 Years | 0 (0.0%) | 0 (0.0%) |
| 35 to 64 Years | 0 (0.0%) | 0 (0.0%) |
| 65 to 74 Years | 1 (25.0%) | 0 (0.0%) |
| 75 Years and over | 1 (50.0%) | 0 (0.0%) |
Disability Class: Vision Difficulty
| Age Bracket | Male | Female |
| Under 5 Years | 0 (0.0%) | 0 (0.0%) |
| 5 to 17 Years | 0 (0.0%) | 0 (0.0%) |
| 18 to 34 Years | 0 (0.0%) | 0 (0.0%) |
| 35 to 64 Years | 0 (0.0%) | 0 (0.0%) |
| 65 to 74 Years | 0 (0.0%) | 0 (0.0%) |
| 75 Years and over | 0 (0.0%) | 0 (0.0%) |
Disability Class: Cognitive Difficulty
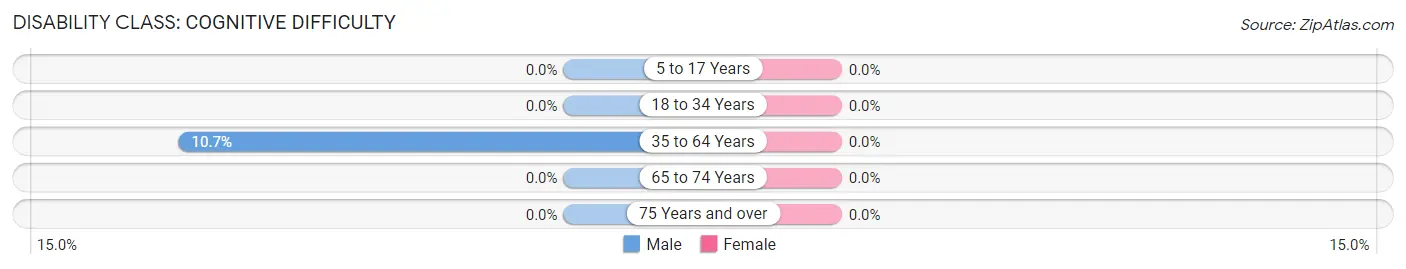
| Age Bracket | Male | Female |
| 5 to 17 Years | 0 (0.0%) | 0 (0.0%) |
| 18 to 34 Years | 0 (0.0%) | 0 (0.0%) |
| 35 to 64 Years | 3 (10.7%) | 0 (0.0%) |
| 65 to 74 Years | 0 (0.0%) | 0 (0.0%) |
| 75 Years and over | 0 (0.0%) | 0 (0.0%) |
Disability Class: Ambulatory Difficulty
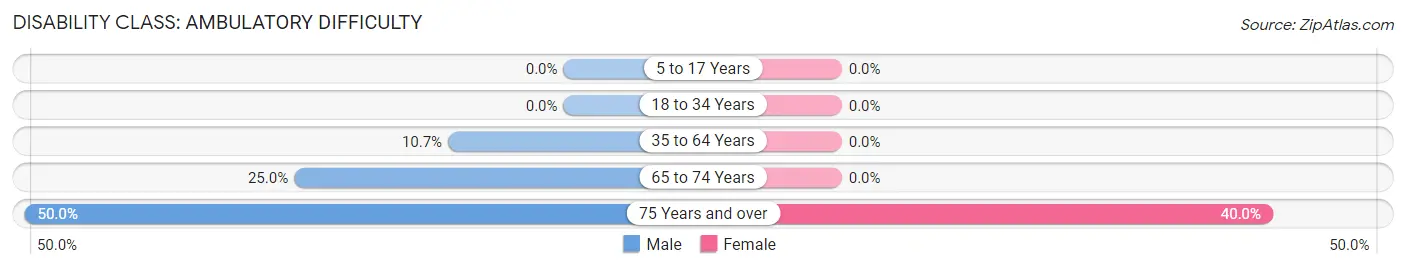
| Age Bracket | Male | Female |
| 5 to 17 Years | 0 (0.0%) | 0 (0.0%) |
| 18 to 34 Years | 0 (0.0%) | 0 (0.0%) |
| 35 to 64 Years | 3 (10.7%) | 0 (0.0%) |
| 65 to 74 Years | 1 (25.0%) | 0 (0.0%) |
| 75 Years and over | 1 (50.0%) | 2 (40.0%) |
Disability Class: Self-Care Difficulty
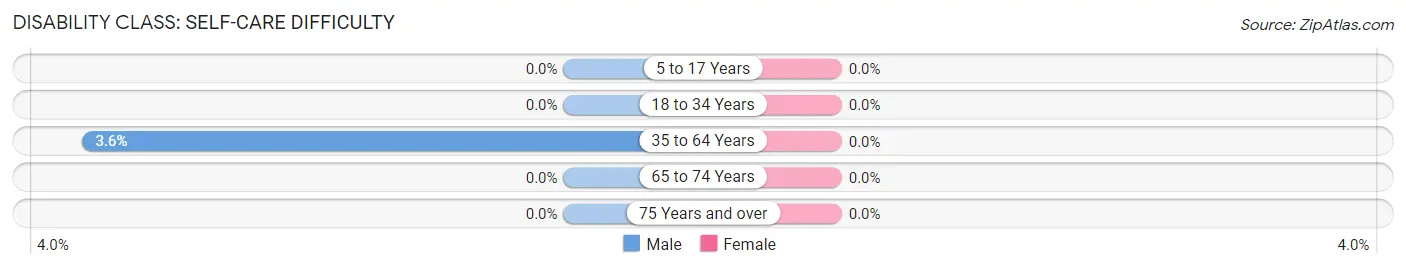
| Age Bracket | Male | Female |
| 5 to 17 Years | 0 (0.0%) | 0 (0.0%) |
| 18 to 34 Years | 0 (0.0%) | 0 (0.0%) |
| 35 to 64 Years | 1 (3.6%) | 0 (0.0%) |
| 65 to 74 Years | 0 (0.0%) | 0 (0.0%) |
| 75 Years and over | 0 (0.0%) | 0 (0.0%) |
Technology Access in Buckeye
Computing Device Access in Buckeye
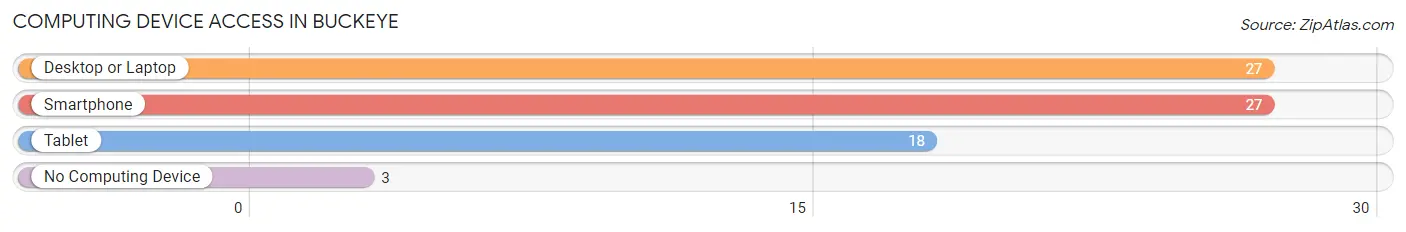
| Device Type | # Households | % Households |
| Desktop or Laptop | 27 | 71.1% |
| Smartphone | 27 | 71.1% |
| Tablet | 18 | 47.4% |
| No Computing Device | 3 | 7.9% |
| Total | 38 | 100.0% |
Internet Access in Buckeye
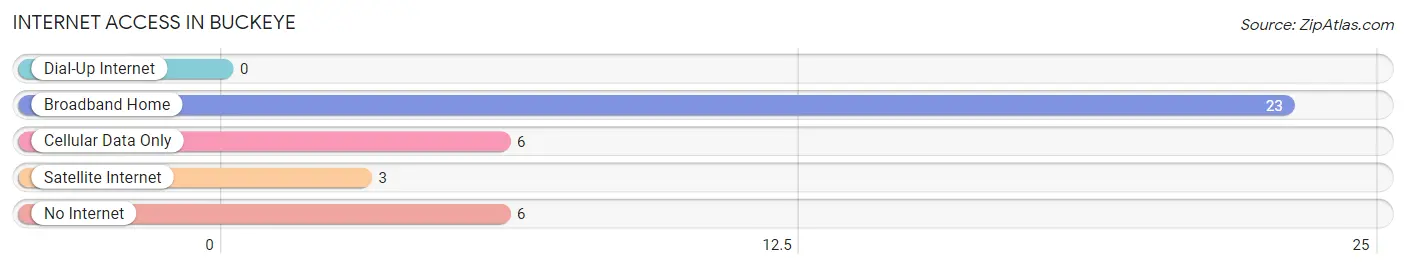
| Internet Type | # Households | % Households |
| Dial-Up Internet | 0 | 0.0% |
| Broadband Home | 23 | 60.5% |
| Cellular Data Only | 6 | 15.8% |
| Satellite Internet | 3 | 7.9% |
| No Internet | 6 | 15.8% |
| Total | 38 | 100.0% |
Buckeye Summary
Buckeye, Iowa is a small town located in the southeastern corner of the state, in Appanoose County. It is situated on the banks of the Chariton River, and is surrounded by rolling hills and farmland. The town was founded in 1854, and was named after the Buckeye tree, which is native to the area. The population of Buckeye was estimated to be around 500 people in 2000.
Geography
Buckeye is located in the southeastern corner of Iowa, in Appanoose County. It is situated on the banks of the Chariton River, and is surrounded by rolling hills and farmland. The town is located about 25 miles from the Missouri border, and is about a two-hour drive from Des Moines. The town is located in the Central Time Zone, and the elevation is 845 feet above sea level.
The climate in Buckeye is typical of the Midwest, with hot summers and cold winters. The average high temperature in July is around 85 degrees Fahrenheit, and the average low temperature in January is around 15 degrees Fahrenheit. The town receives an average of 36 inches of precipitation per year, with most of it falling in the spring and summer months.
Economy
The economy of Buckeye is largely based on agriculture. The town is surrounded by farmland, and many of the residents are employed in the agricultural industry. The town also has a few small businesses, including a grocery store, a hardware store, and a few restaurants.
The town is also home to a few manufacturing companies, including a furniture factory and a plastics factory. These companies provide jobs for many of the town's residents.
Demographics
The population of Buckeye was estimated to be around 500 people in 2000. The town is predominantly white, with about 95% of the population being Caucasian. The median household income in Buckeye is around $35,000, and the median age is around 40 years old.
Education
Buckeye is served by the Appanoose County Community School District. The district operates one elementary school, one middle school, and one high school. The district also operates a vocational-technical school, which provides students with the opportunity to learn a trade.
Conclusion
Buckeye, Iowa is a small town located in the southeastern corner of the state, in Appanoose County. It is situated on the banks of the Chariton River, and is surrounded by rolling hills and farmland. The town was founded in 1854, and was named after the Buckeye tree, which is native to the area. The economy of Buckeye is largely based on agriculture, and the town is also home to a few manufacturing companies. The population of Buckeye was estimated to be around 500 people in 2000, and the town is predominantly white. The town is served by the Appanoose County Community School District, which operates one elementary school, one middle school, and one high school.
Common Questions
What is the Total Population of Buckeye?
Total Population of Buckeye is 84.
What is the Total Male Population of Buckeye?
Total Male Population of Buckeye is 50.
What is the Total Female Population of Buckeye?
Total Female Population of Buckeye is 34.
What is the Ratio of Males per 100 Females in Buckeye?
There are 147.06 Males per 100 Females in Buckeye.
What is the Ratio of Females per 100 Males in Buckeye?
There are 68.00 Females per 100 Males in Buckeye.
What is the Median Population Age in Buckeye?
Median Population Age in Buckeye is 47.5 Years.
What is the Average Family Size in Buckeye
Average Family Size in Buckeye is 2.8 People.
What is the Average Household Size in Buckeye
Average Household Size in Buckeye is 2.2 People.
What is Per Capita Income in Buckeye?
Per Capita income in Buckeye is $28,748.
What is the Median Family Income in Buckeye?
Median Family Income in Buckeye is $54,167.
What is the Median Household income in Buckeye?
Median Household Income in Buckeye is $54,167.
What is Income or Wage Gap in Buckeye?
Income or Wage Gap in Buckeye is 37.9%.
Women in Buckeye earn 62.1 cents for every dollar earned by a man.
What is Inequality or Gini Index in Buckeye?
Inequality or Gini Index in Buckeye is 0.33.
How Large is the Labor Force in Buckeye?
There are 42 People in the Labor Forcein in Buckeye.
What is the Percentage of People in the Labor Force in Buckeye?
62.7% of People are in the Labor Force in Buckeye.
What is the Unemployment Rate in Buckeye?
Unemployment Rate in Buckeye is 2.4%.