Washington, GA
Washington Map
Washington Overview
3,742
TOTAL POPULATION
1,799
MALE POPULATION
1,943
FEMALE POPULATION
92.59
MALES / 100 FEMALES
108.00
FEMALES / 100 MALES
52.8
MEDIAN AGE
2.9
AVG FAMILY SIZE
2.1
AVG HOUSEHOLD SIZE
$35,604
PER CAPITA INCOME
$61,900
AVG FAMILY INCOME
$48,235
AVG HOUSEHOLD INCOME
28.5%
WAGE / INCOME GAP [ % ]
71.5¢/ $1
WAGE / INCOME GAP [ $ ]
0.55
INEQUALITY / GINI INDEX
1,711
LABOR FORCE [ PEOPLE ]
53.0%
PERCENT IN LABOR FORCE
2.2%
UNEMPLOYMENT RATE
Washington Zip Codes
Washington Area Codes
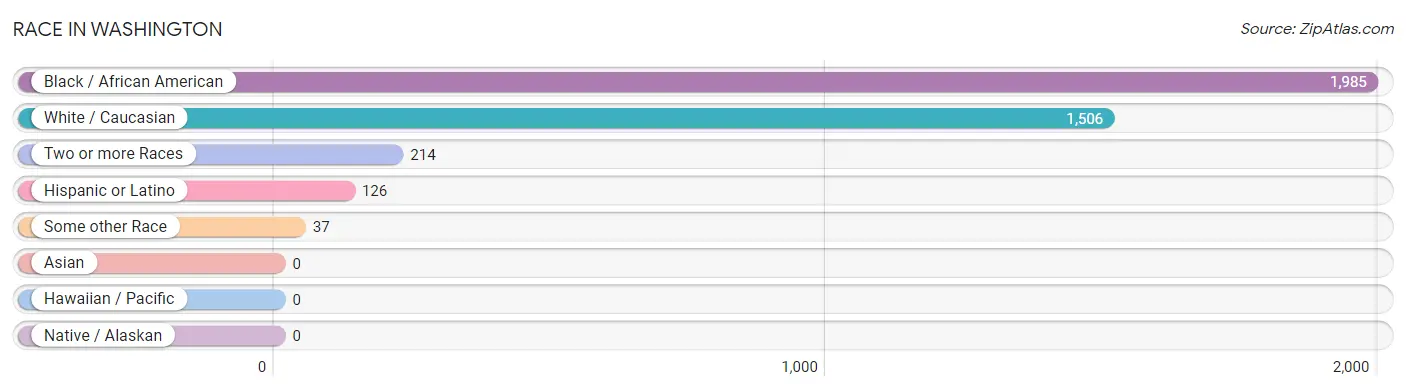
Race in Washington
The most populous races in Washington are Black / African American (1,985 | 53.0%), White / Caucasian (1,506 | 40.3%), and Two or more Races (214 | 5.7%).
| Race | # Population | % Population |
| Asian | 0 | 0.0% |
| Black / African American | 1,985 | 53.0% |
| Hawaiian / Pacific | 0 | 0.0% |
| Hispanic or Latino | 126 | 3.4% |
| Native / Alaskan | 0 | 0.0% |
| White / Caucasian | 1,506 | 40.3% |
| Two or more Races | 214 | 5.7% |
| Some other Race | 37 | 1.0% |
| Total | 3,742 | 100.0% |
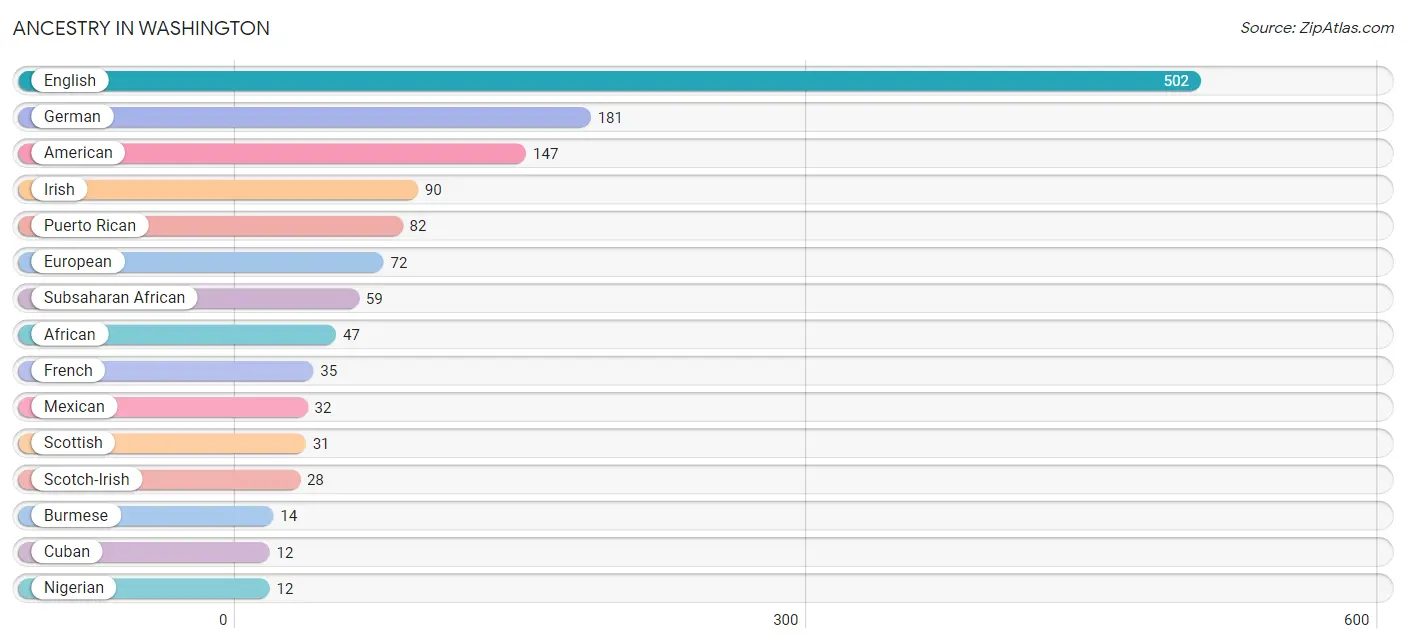
Ancestry in Washington
The most populous ancestries reported in Washington are English (502 | 13.4%), German (181 | 4.8%), American (147 | 3.9%), Irish (90 | 2.4%), and Puerto Rican (82 | 2.2%), together accounting for 26.8% of all Washington residents.
| Ancestry | # Population | % Population |
| African | 47 | 1.3% |
| American | 147 | 3.9% |
| Burmese | 14 | 0.4% |
| Cuban | 12 | 0.3% |
| Dutch | 6 | 0.2% |
| English | 502 | 13.4% |
| European | 72 | 1.9% |
| French | 35 | 0.9% |
| German | 181 | 4.8% |
| Irish | 90 | 2.4% |
| Mexican | 32 | 0.9% |
| Nigerian | 12 | 0.3% |
| Puerto Rican | 82 | 2.2% |
| Scotch-Irish | 28 | 0.7% |
| Scottish | 31 | 0.8% |
| Subsaharan African | 59 | 1.6% |
| Welsh | 10 | 0.3% | View All 17 Rows |
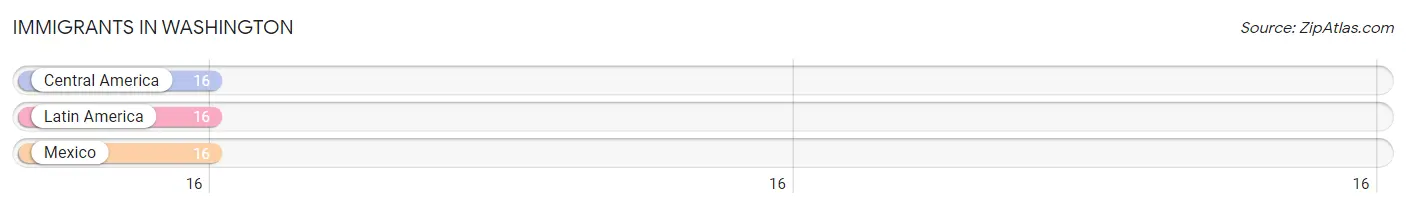
Immigrants in Washington
The most numerous immigrant groups reported in Washington came from Central America (16 | 0.4%), Latin America (16 | 0.4%), and Mexico (16 | 0.4%), together accounting for 1.3% of all Washington residents.
| Immigration Origin | # Population | % Population |
| Central America | 16 | 0.4% |
| Latin America | 16 | 0.4% |
| Mexico | 16 | 0.4% | View All 3 Rows |
Sex and Age in Washington
Sex and Age in Washington
The most populous age groups in Washington are 60 to 64 Years (164 | 9.1%) for men and 60 to 64 Years (203 | 10.4%) for women.
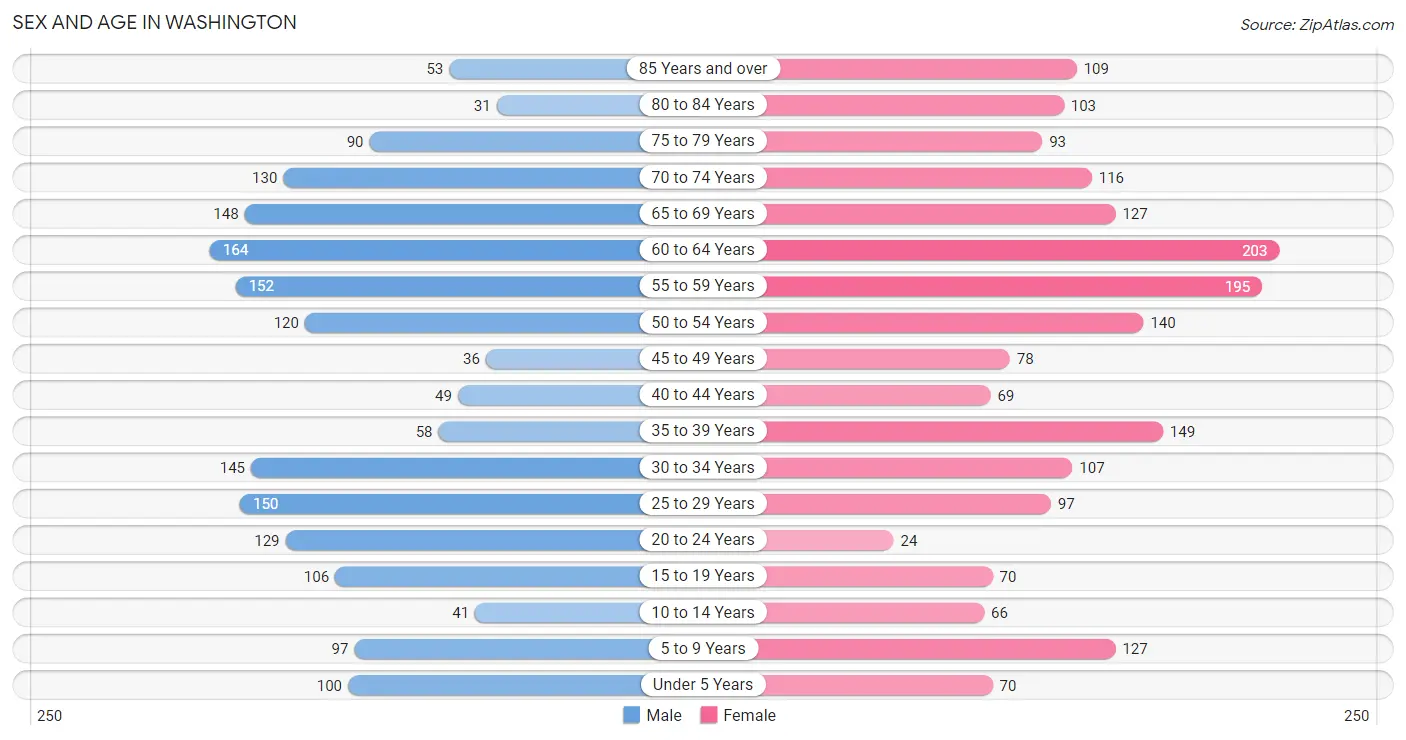
| Age Bracket | Male | Female |
| Under 5 Years | 100 (5.6%) | 70 (3.6%) |
| 5 to 9 Years | 97 (5.4%) | 127 (6.5%) |
| 10 to 14 Years | 41 (2.3%) | 66 (3.4%) |
| 15 to 19 Years | 106 (5.9%) | 70 (3.6%) |
| 20 to 24 Years | 129 (7.2%) | 24 (1.2%) |
| 25 to 29 Years | 150 (8.3%) | 97 (5.0%) |
| 30 to 34 Years | 145 (8.1%) | 107 (5.5%) |
| 35 to 39 Years | 58 (3.2%) | 149 (7.7%) |
| 40 to 44 Years | 49 (2.7%) | 69 (3.5%) |
| 45 to 49 Years | 36 (2.0%) | 78 (4.0%) |
| 50 to 54 Years | 120 (6.7%) | 140 (7.2%) |
| 55 to 59 Years | 152 (8.5%) | 195 (10.0%) |
| 60 to 64 Years | 164 (9.1%) | 203 (10.4%) |
| 65 to 69 Years | 148 (8.2%) | 127 (6.5%) |
| 70 to 74 Years | 130 (7.2%) | 116 (6.0%) |
| 75 to 79 Years | 90 (5.0%) | 93 (4.8%) |
| 80 to 84 Years | 31 (1.7%) | 103 (5.3%) |
| 85 Years and over | 53 (2.9%) | 109 (5.6%) |
| Total | 1,799 (100.0%) | 1,943 (100.0%) |
Families and Households in Washington
Median Family Size in Washington
The median family size in Washington is 2.90 persons per family, with single female/mother families (318 | 33.7%) accounting for the largest median family size of 2.98 persons per family. On the other hand, single male/father families (103 | 10.9%) represent the smallest median family size with 2.58 persons per family.
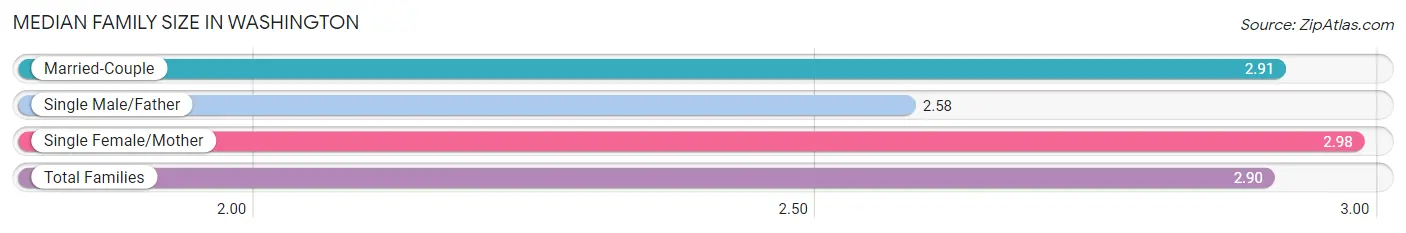
| Family Type | # Families | Family Size |
| Married-Couple | 523 (55.4%) | 2.91 |
| Single Male/Father | 103 (10.9%) | 2.58 |
| Single Female/Mother | 318 (33.7%) | 2.98 |
| Total Families | 944 (100.0%) | 2.90 |
Median Household Size in Washington
The median household size in Washington is 2.11 persons per household, with single female/mother households (318 | 18.5%) accounting for the largest median household size of 3.11 persons per household. non-family households (778 | 45.2%) represent the smallest median household size with 1.10 persons per household.
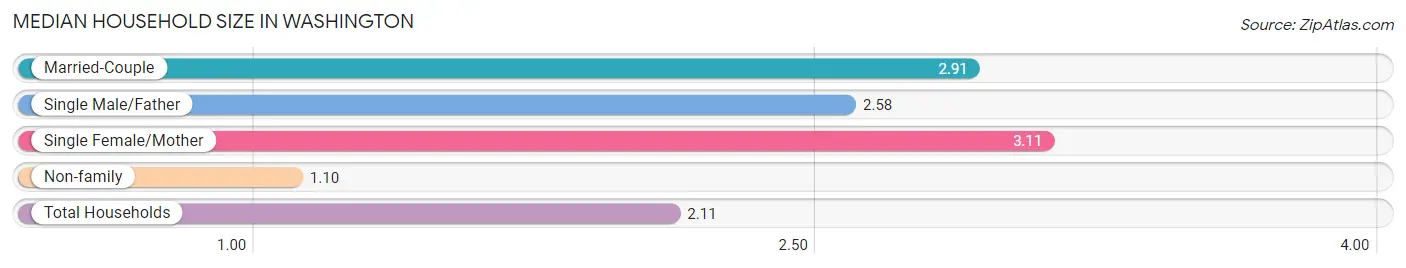
| Household Type | # Households | Household Size |
| Married-Couple | 523 (30.4%) | 2.91 |
| Single Male/Father | 103 (6.0%) | 2.58 |
| Single Female/Mother | 318 (18.5%) | 3.11 |
| Non-family | 778 (45.2%) | 1.10 |
| Total Households | 1,722 (100.0%) | 2.11 |
Household Size by Marriage Status in Washington
Out of a total of 1,722 households in Washington, 944 (54.8%) are family households, while 778 (45.2%) are nonfamily households. The most numerous type of family households are 2-person households, comprising 567, and the most common type of nonfamily households are 1-person households, comprising 705.
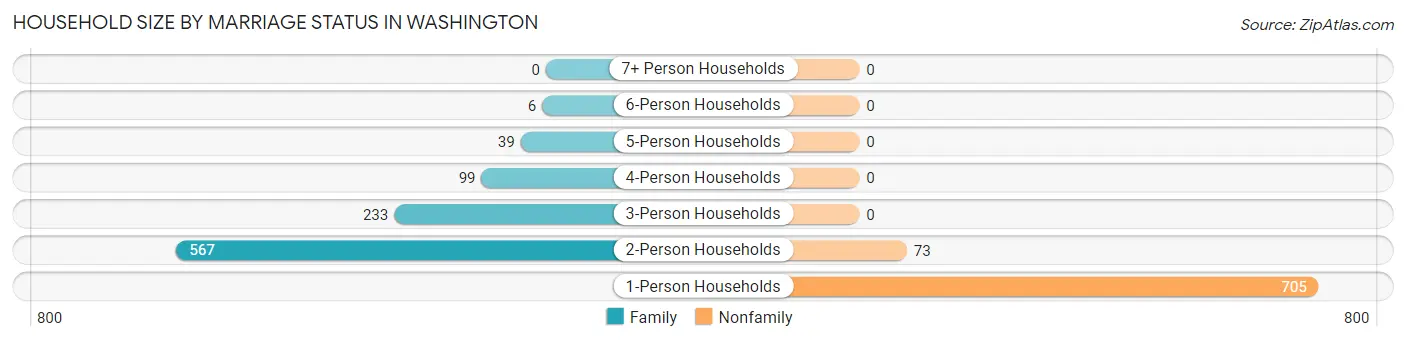
| Household Size | Family Households | Nonfamily Households |
| 1-Person Households | - | 705 (40.9%) |
| 2-Person Households | 567 (32.9%) | 73 (4.2%) |
| 3-Person Households | 233 (13.5%) | 0 (0.0%) |
| 4-Person Households | 99 (5.8%) | 0 (0.0%) |
| 5-Person Households | 39 (2.3%) | 0 (0.0%) |
| 6-Person Households | 6 (0.4%) | 0 (0.0%) |
| 7+ Person Households | 0 (0.0%) | 0 (0.0%) |
| Total | 944 (54.8%) | 778 (45.2%) |
Female Fertility in Washington
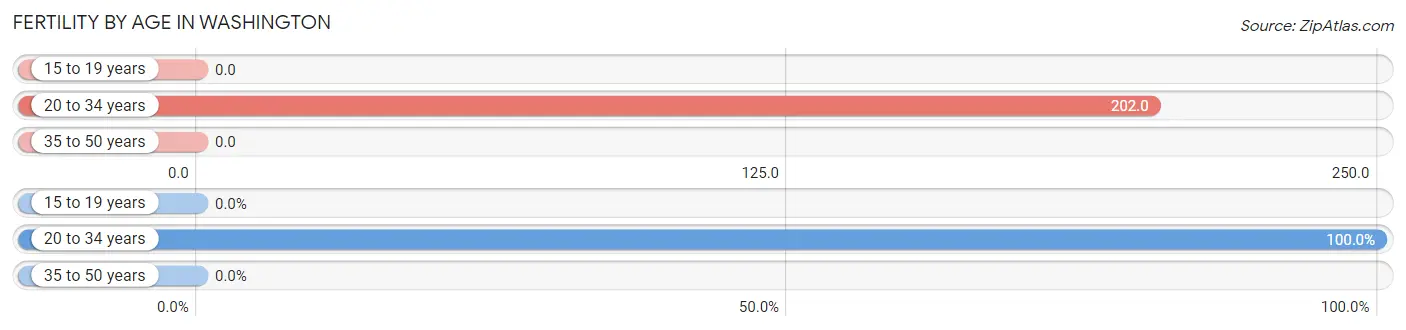
Fertility by Age in Washington
Average fertility rate in Washington is 77.0 births per 1,000 women. Women in the age bracket of 20 to 34 years have the highest fertility rate with 202.0 births per 1,000 women. Women in the age bracket of 20 to 34 years acount for 100.0% of all women with births.
| Age Bracket | Women with Births | Births / 1,000 Women |
| 15 to 19 years | 0 (0.0%) | 0.0 |
| 20 to 34 years | 46 (100.0%) | 202.0 |
| 35 to 50 years | 0 (0.0%) | 0.0 |
| Total | 46 (100.0%) | 77.0 |
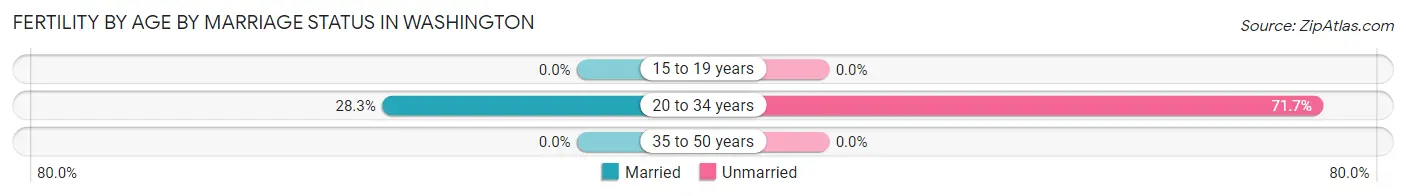
Fertility by Age by Marriage Status in Washington
28.3% of women with births (46) in Washington are married. The highest percentage of unmarried women with births falls into 20 to 34 years age bracket with 71.7% of them unmarried at the time of birth, while the lowest percentage of unmarried women with births belong to 20 to 34 years age bracket with 71.7% of them unmarried.
| Age Bracket | Married | Unmarried |
| 15 to 19 years | 0 (0.0%) | 0 (0.0%) |
| 20 to 34 years | 13 (28.3%) | 33 (71.7%) |
| 35 to 50 years | 0 (0.0%) | 0 (0.0%) |
| Total | 13 (28.3%) | 33 (71.7%) |
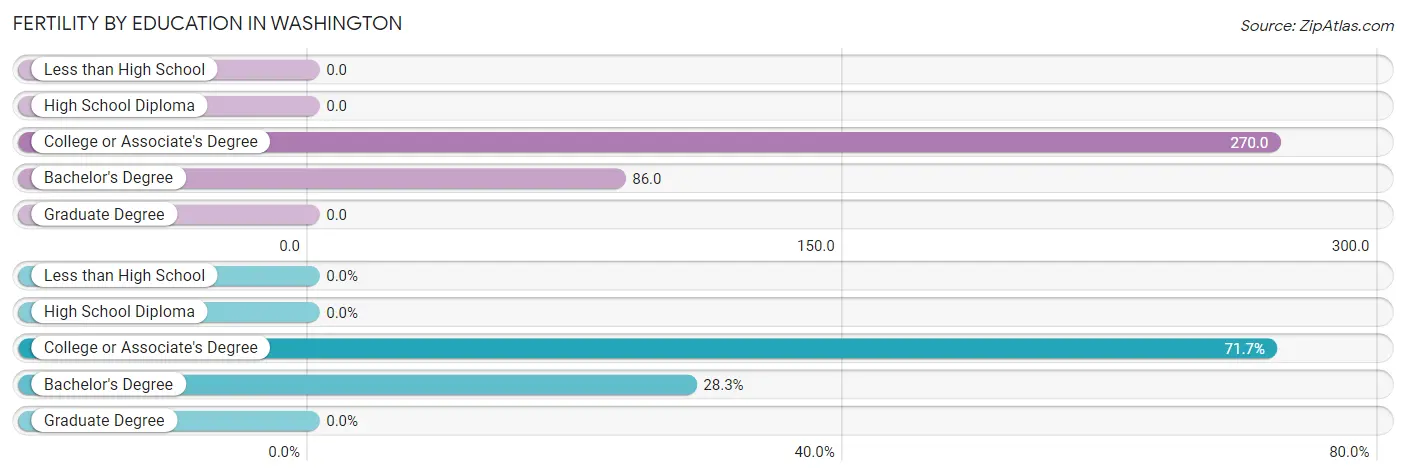
Fertility by Education in Washington
| Educational Attainment | Women with Births | Births / 1,000 Women |
| Less than High School | 0 (0.0%) | 0.0 |
| High School Diploma | 0 (0.0%) | 0.0 |
| College or Associate's Degree | 33 (71.7%) | 270.0 |
| Bachelor's Degree | 13 (28.3%) | 86.0 |
| Graduate Degree | 0 (0.0%) | 0.0 |
| Total | 46 (100.0%) | 77.0 |
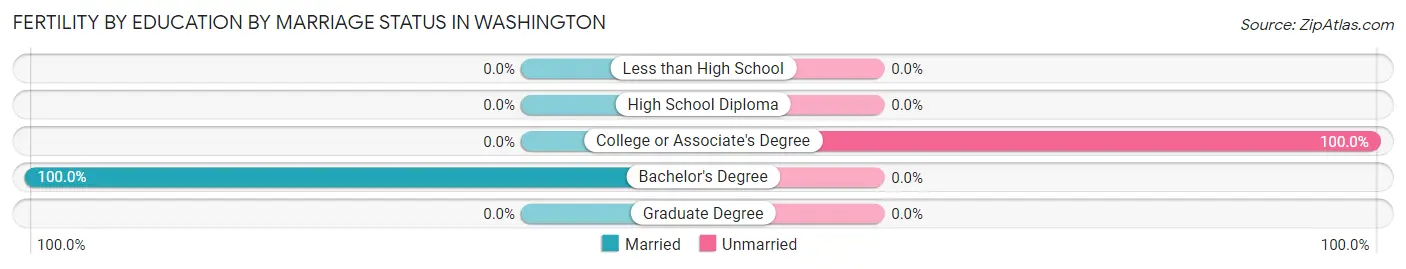
Fertility by Education by Marriage Status in Washington
71.7% of women with births in Washington are unmarried. Women with the educational attainment of bachelor's degree are most likely to be married with 100.0% of them married at childbirth, while women with the educational attainment of college or associate's degree are least likely to be married with 100.0% of them unmarried at childbirth.
| Educational Attainment | Married | Unmarried |
| Less than High School | 0 (0.0%) | 0 (0.0%) |
| High School Diploma | 0 (0.0%) | 0 (0.0%) |
| College or Associate's Degree | 0 (0.0%) | 33 (100.0%) |
| Bachelor's Degree | 13 (100.0%) | 0 (0.0%) |
| Graduate Degree | 0 (0.0%) | 0 (0.0%) |
| Total | 13 (28.3%) | 33 (71.7%) |
Income in Washington
Income Overview in Washington
Per Capita Income in Washington is $35,604, while median incomes of families and households are $61,900 and $48,235 respectively.
| Characteristic | Number | Measure |
| Per Capita Income | 3,742 | $35,604 |
| Median Family Income | 944 | $61,900 |
| Mean Family Income | 944 | $104,888 |
| Median Household Income | 1,722 | $48,235 |
| Mean Household Income | 1,722 | $75,807 |
| Income Deficit | 944 | $0 |
| Wage / Income Gap (%) | 3,742 | 28.46% |
| Wage / Income Gap ($) | 3,742 | 71.54¢ per $1 |
| Gini / Inequality Index | 3,742 | 0.55 |
Earnings by Sex in Washington
Average Earnings in Washington are $32,390, $42,750 for men and $30,585 for women, a difference of 28.5%.
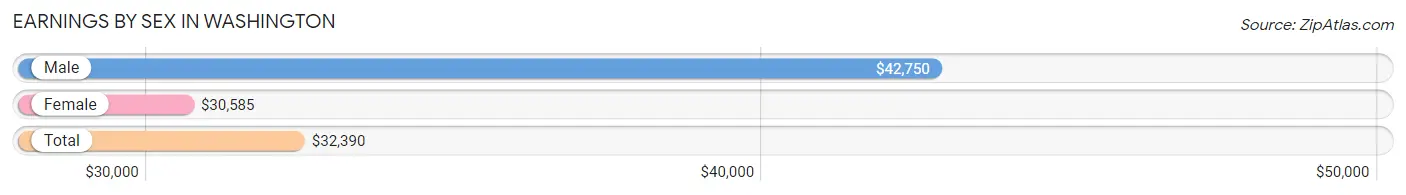
| Sex | Number | Average Earnings |
| Male | 886 (50.1%) | $42,750 |
| Female | 883 (49.9%) | $30,585 |
| Total | 1,769 (100.0%) | $32,390 |
Earnings by Sex by Income Bracket in Washington
The most common earnings brackets in Washington are $75,000 to $99,999 for men (127 | 14.3%) and $30,000 to $34,999 for women (163 | 18.5%).
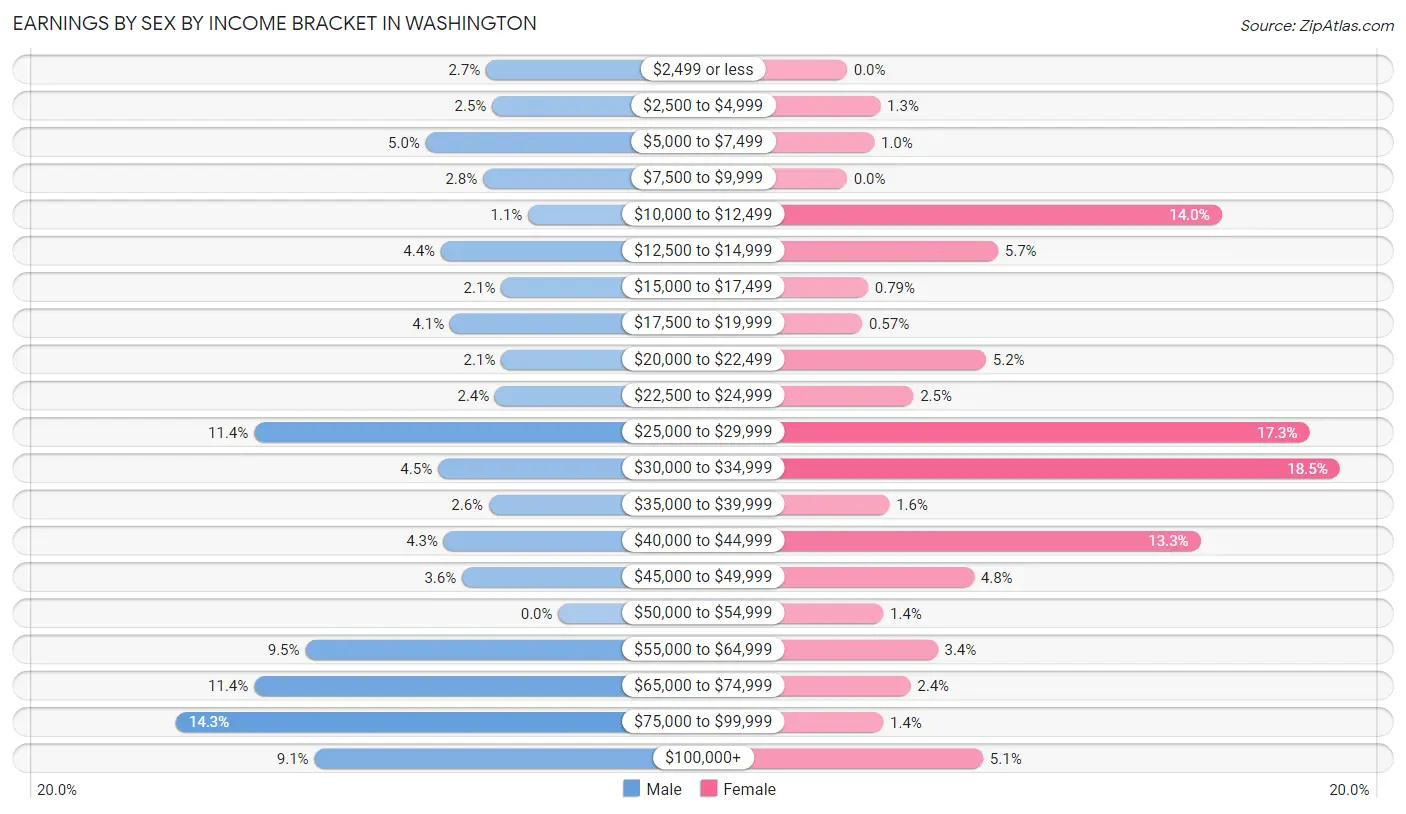
| Income | Male | Female |
| $2,499 or less | 24 (2.7%) | 0 (0.0%) |
| $2,500 to $4,999 | 22 (2.5%) | 11 (1.3%) |
| $5,000 to $7,499 | 44 (5.0%) | 9 (1.0%) |
| $7,500 to $9,999 | 25 (2.8%) | 0 (0.0%) |
| $10,000 to $12,499 | 10 (1.1%) | 124 (14.0%) |
| $12,500 to $14,999 | 39 (4.4%) | 50 (5.7%) |
| $15,000 to $17,499 | 19 (2.1%) | 7 (0.8%) |
| $17,500 to $19,999 | 36 (4.1%) | 5 (0.6%) |
| $20,000 to $22,499 | 19 (2.1%) | 46 (5.2%) |
| $22,500 to $24,999 | 21 (2.4%) | 22 (2.5%) |
| $25,000 to $29,999 | 101 (11.4%) | 153 (17.3%) |
| $30,000 to $34,999 | 40 (4.5%) | 163 (18.5%) |
| $35,000 to $39,999 | 23 (2.6%) | 14 (1.6%) |
| $40,000 to $44,999 | 38 (4.3%) | 117 (13.3%) |
| $45,000 to $49,999 | 32 (3.6%) | 42 (4.8%) |
| $50,000 to $54,999 | 0 (0.0%) | 12 (1.4%) |
| $55,000 to $64,999 | 84 (9.5%) | 30 (3.4%) |
| $65,000 to $74,999 | 101 (11.4%) | 21 (2.4%) |
| $75,000 to $99,999 | 127 (14.3%) | 12 (1.4%) |
| $100,000+ | 81 (9.1%) | 45 (5.1%) |
| Total | 886 (100.0%) | 883 (100.0%) |
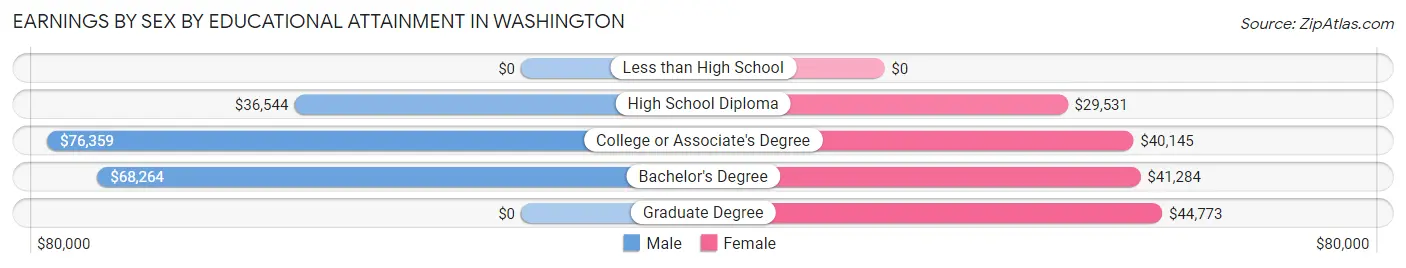
Earnings by Sex by Educational Attainment in Washington
Average earnings in Washington are $49,620 for men and $32,399 for women, a difference of 34.7%. Men with an educational attainment of college or associate's degree enjoy the highest average annual earnings of $76,359, while those with high school diploma education earn the least with $36,544. Women with an educational attainment of graduate degree earn the most with the average annual earnings of $44,773, while those with high school diploma education have the smallest earnings of $29,531.
| Educational Attainment | Male Income | Female Income |
| Less than High School | - | - |
| High School Diploma | $36,544 | $29,531 |
| College or Associate's Degree | $76,359 | $40,145 |
| Bachelor's Degree | $68,264 | $41,284 |
| Graduate Degree | - | - |
| Total | $49,620 | $32,399 |
Family Income in Washington
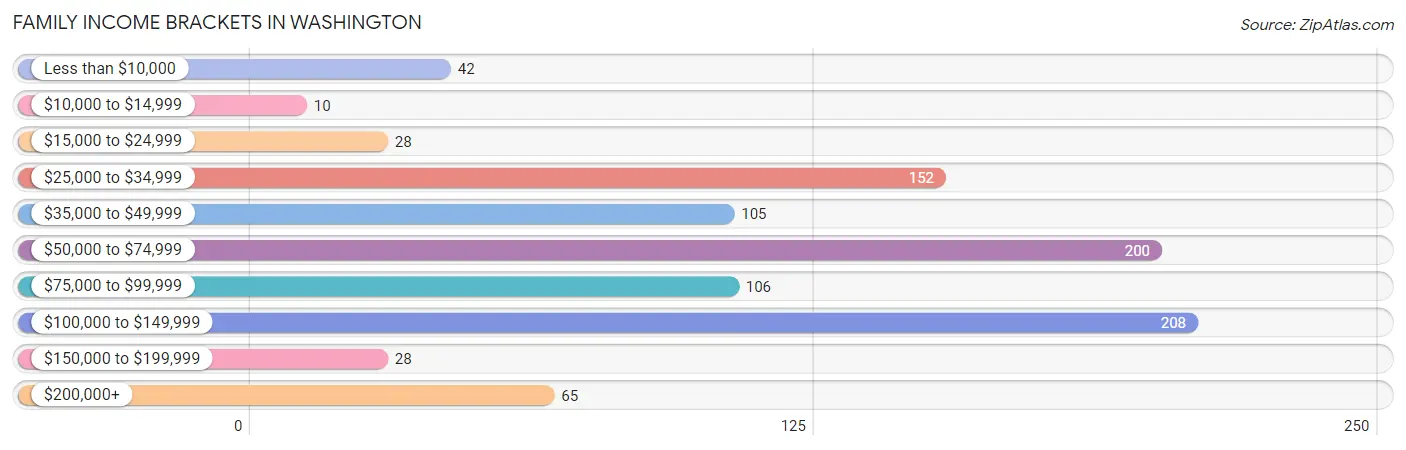
Family Income Brackets in Washington
According to the Washington family income data, there are 208 families falling into the $100,000 to $149,999 income range, which is the most common income bracket and makes up 22.0% of all families. Conversely, the $10,000 to $14,999 income bracket is the least frequent group with only 10 families (1.1%) belonging to this category.
| Income Bracket | # Families | % Families |
| Less than $10,000 | 42 | 4.4% |
| $10,000 to $14,999 | 10 | 1.1% |
| $15,000 to $24,999 | 28 | 3.0% |
| $25,000 to $34,999 | 152 | 16.1% |
| $35,000 to $49,999 | 105 | 11.1% |
| $50,000 to $74,999 | 200 | 21.2% |
| $75,000 to $99,999 | 106 | 11.2% |
| $100,000 to $149,999 | 208 | 22.0% |
| $150,000 to $199,999 | 28 | 3.0% |
| $200,000+ | 65 | 6.9% |
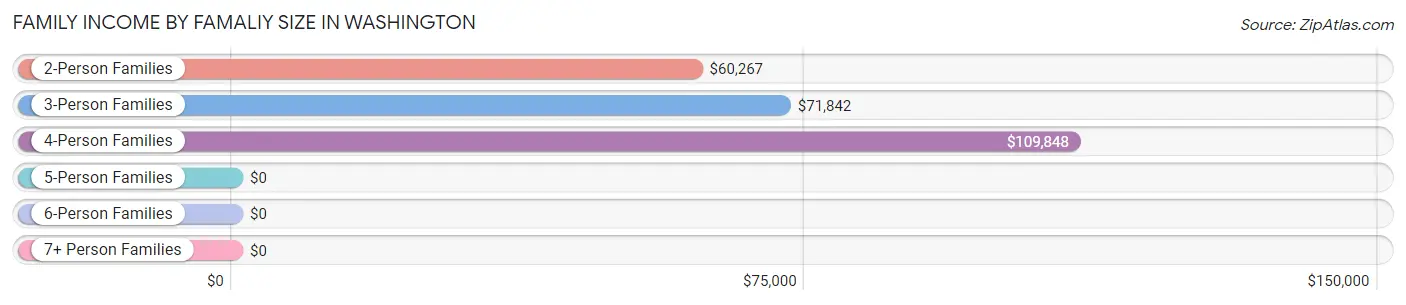
Family Income by Famaliy Size in Washington
4-person families (106 | 11.2%) account for the highest median family income in Washington with $109,848 per family, while 2-person families (600 | 63.6%) have the highest median income of $30,134 per family member.
| Income Bracket | # Families | Median Income |
| 2-Person Families | 600 (63.6%) | $60,267 |
| 3-Person Families | 200 (21.2%) | $71,842 |
| 4-Person Families | 106 (11.2%) | $109,848 |
| 5-Person Families | 32 (3.4%) | $0 |
| 6-Person Families | 6 (0.6%) | $0 |
| 7+ Person Families | 0 (0.0%) | $0 |
| Total | 944 (100.0%) | $61,900 |
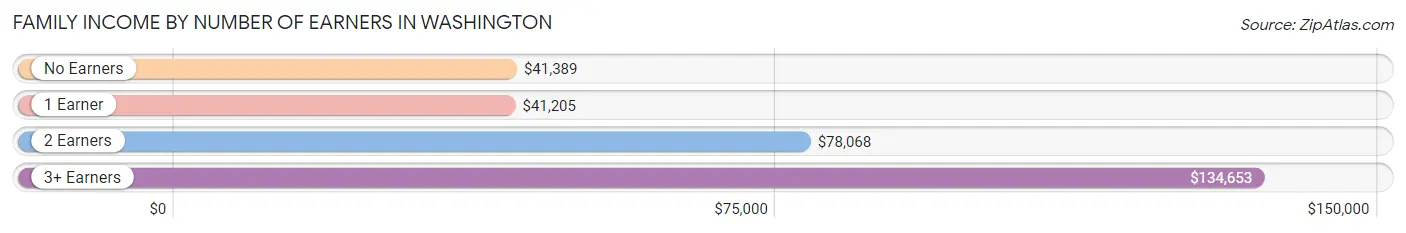
Family Income by Number of Earners in Washington
The median family income in Washington is $61,900, with families comprising 3+ earners (85) having the highest median family income of $134,653, while families with 1 earner (393) have the lowest median family income of $41,205, accounting for 9.0% and 41.6% of families, respectively.
| Number of Earners | # Families | Median Income |
| No Earners | 156 (16.5%) | $41,389 |
| 1 Earner | 393 (41.6%) | $41,205 |
| 2 Earners | 310 (32.8%) | $78,068 |
| 3+ Earners | 85 (9.0%) | $134,653 |
| Total | 944 (100.0%) | $61,900 |
Household Income in Washington
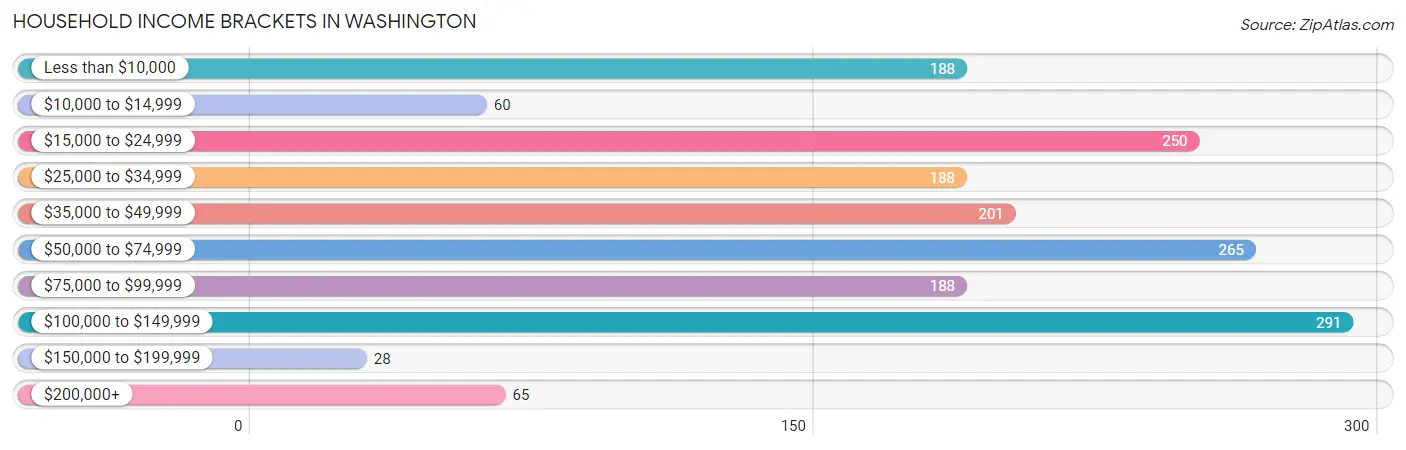
Household Income Brackets in Washington
With 291 households falling in the category, the $100,000 to $149,999 income range is the most frequent in Washington, accounting for 16.9% of all households. In contrast, only 28 households (1.6%) fall into the $150,000 to $199,999 income bracket, making it the least populous group.
| Income Bracket | # Households | % Households |
| Less than $10,000 | 188 | 10.9% |
| $10,000 to $14,999 | 60 | 3.5% |
| $15,000 to $24,999 | 250 | 14.5% |
| $25,000 to $34,999 | 188 | 10.9% |
| $35,000 to $49,999 | 201 | 11.7% |
| $50,000 to $74,999 | 265 | 15.4% |
| $75,000 to $99,999 | 188 | 10.9% |
| $100,000 to $149,999 | 291 | 16.9% |
| $150,000 to $199,999 | 28 | 1.6% |
| $200,000+ | 65 | 3.8% |
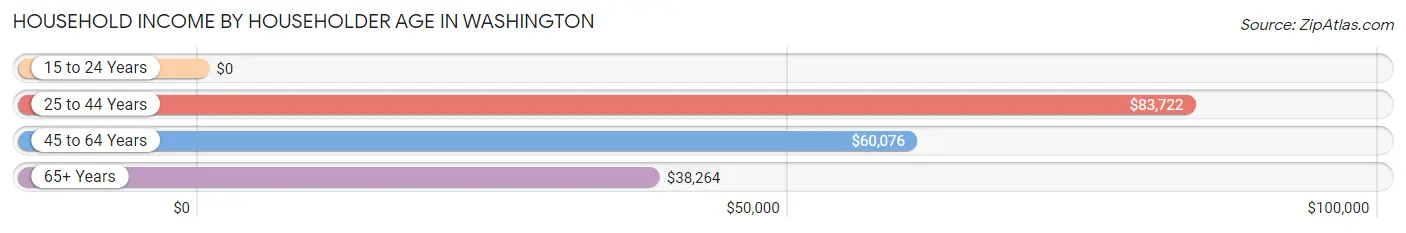
Household Income by Householder Age in Washington
The median household income in Washington is $48,235, with the highest median household income of $83,722 found in the 25 to 44 years age bracket for the primary householder. A total of 301 households (17.5%) fall into this category. Meanwhile, the 15 to 24 years age bracket for the primary householder has the lowest median household income of $0, with 77 households (4.5%) in this group.
| Income Bracket | # Households | Median Income |
| 15 to 24 Years | 77 (4.5%) | $0 |
| 25 to 44 Years | 301 (17.5%) | $83,722 |
| 45 to 64 Years | 667 (38.7%) | $60,076 |
| 65+ Years | 677 (39.3%) | $38,264 |
| Total | 1,722 (100.0%) | $48,235 |
Poverty in Washington
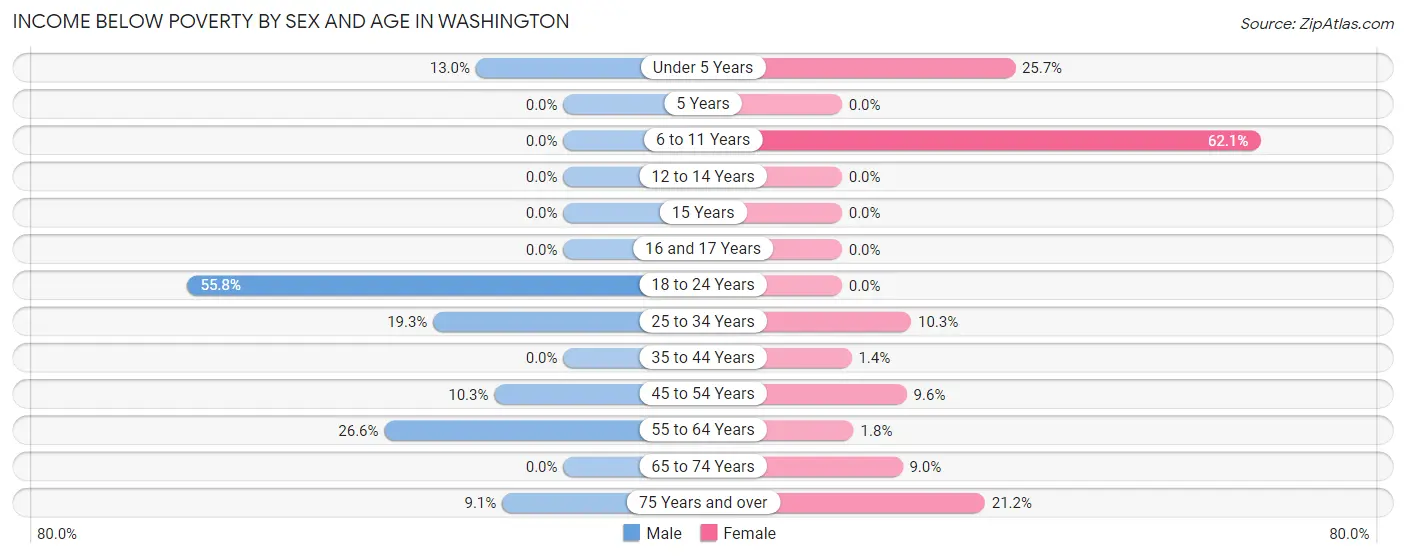
Income Below Poverty by Sex and Age in Washington
With 14.8% poverty level for males and 13.2% for females among the residents of Washington, 18 to 24 year old males and 6 to 11 year old females are the most vulnerable to poverty, with 77 males (55.8%) and 100 females (62.1%) in their respective age groups living below the poverty level.
| Age Bracket | Male | Female |
| Under 5 Years | 13 (13.0%) | 18 (25.7%) |
| 5 Years | 0 (0.0%) | 0 (0.0%) |
| 6 to 11 Years | 0 (0.0%) | 100 (62.1%) |
| 12 to 14 Years | 0 (0.0%) | 0 (0.0%) |
| 15 Years | 0 (0.0%) | 0 (0.0%) |
| 16 and 17 Years | 0 (0.0%) | 0 (0.0%) |
| 18 to 24 Years | 77 (55.8%) | 0 (0.0%) |
| 25 to 34 Years | 52 (19.3%) | 21 (10.3%) |
| 35 to 44 Years | 0 (0.0%) | 3 (1.4%) |
| 45 to 54 Years | 16 (10.3%) | 21 (9.6%) |
| 55 to 64 Years | 84 (26.6%) | 7 (1.8%) |
| 65 to 74 Years | 0 (0.0%) | 21 (9.0%) |
| 75 Years and over | 15 (9.1%) | 62 (21.2%) |
| Total | 257 (14.8%) | 253 (13.2%) |
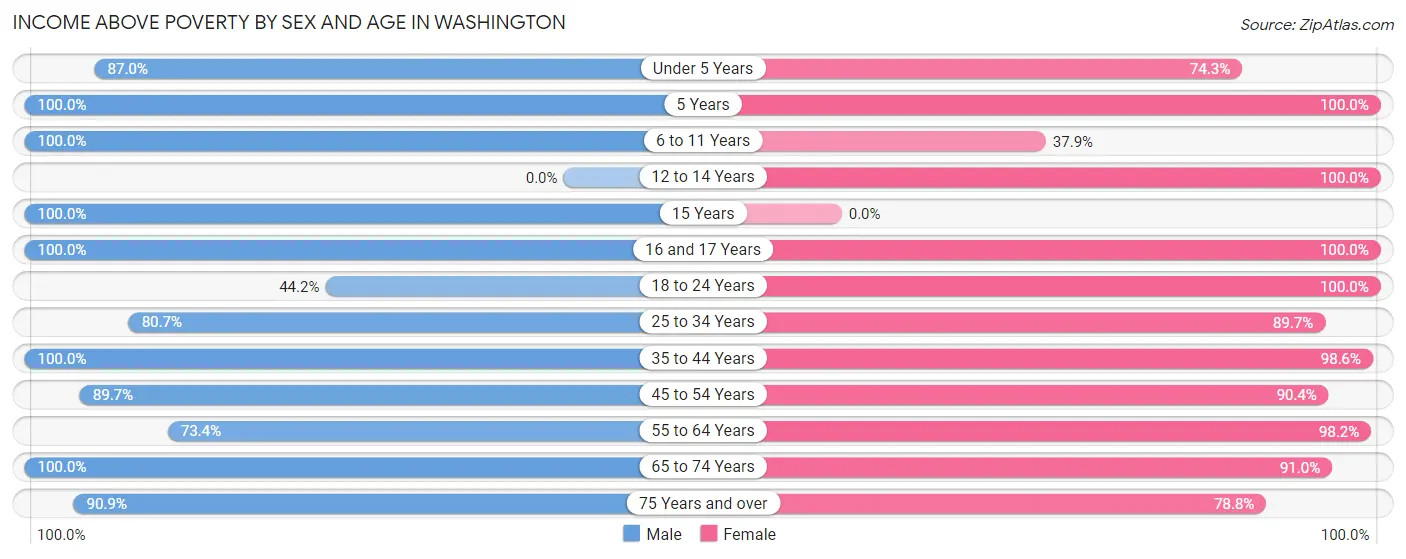
Income Above Poverty by Sex and Age in Washington
According to the poverty statistics in Washington, males aged 5 years and females aged 5 years are the age groups that are most secure financially, with 100.0% of males and 100.0% of females in these age groups living above the poverty line.
| Age Bracket | Male | Female |
| Under 5 Years | 87 (87.0%) | 52 (74.3%) |
| 5 Years | 74 (100.0%) | 11 (100.0%) |
| 6 to 11 Years | 64 (100.0%) | 61 (37.9%) |
| 12 to 14 Years | 0 (0.0%) | 21 (100.0%) |
| 15 Years | 12 (100.0%) | 0 (0.0%) |
| 16 and 17 Years | 69 (100.0%) | 4 (100.0%) |
| 18 to 24 Years | 61 (44.2%) | 90 (100.0%) |
| 25 to 34 Years | 217 (80.7%) | 183 (89.7%) |
| 35 to 44 Years | 107 (100.0%) | 207 (98.6%) |
| 45 to 54 Years | 140 (89.7%) | 197 (90.4%) |
| 55 to 64 Years | 232 (73.4%) | 391 (98.2%) |
| 65 to 74 Years | 268 (100.0%) | 212 (91.0%) |
| 75 Years and over | 150 (90.9%) | 230 (78.8%) |
| Total | 1,481 (85.2%) | 1,659 (86.8%) |
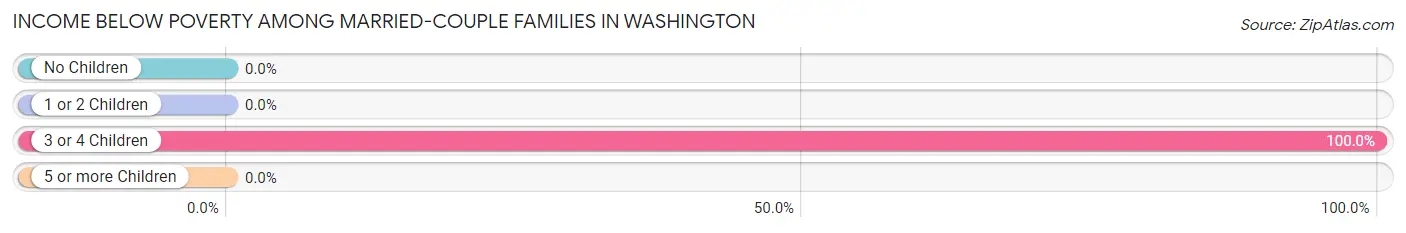
Income Below Poverty Among Married-Couple Families in Washington
The poverty statistics for married-couple families in Washington show that 1.1% or 6 of the total 523 families live below the poverty line. Families with 3 or 4 children have the highest poverty rate of 100.0%, comprising of 6 families. On the other hand, families with no children have the lowest poverty rate of 0.0%, which includes 0 families.
| Children | Above Poverty | Below Poverty |
| No Children | 402 (100.0%) | 0 (0.0%) |
| 1 or 2 Children | 115 (100.0%) | 0 (0.0%) |
| 3 or 4 Children | 0 (0.0%) | 6 (100.0%) |
| 5 or more Children | 0 (0.0%) | 0 (0.0%) |
| Total | 517 (98.9%) | 6 (1.1%) |
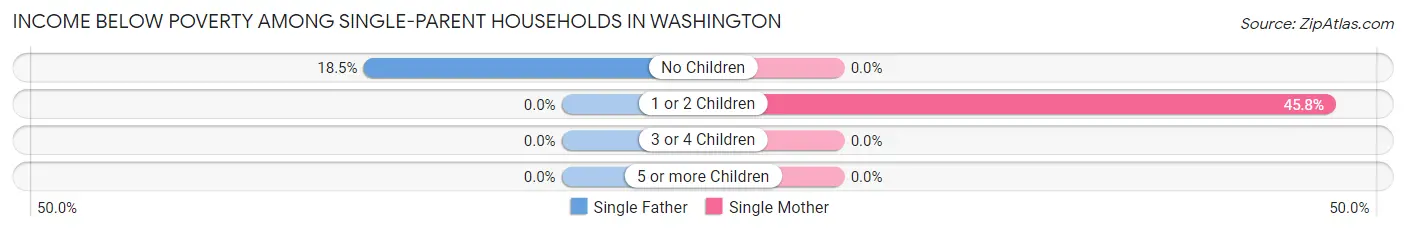
Income Below Poverty Among Single-Parent Households in Washington
According to the poverty data in Washington, 18.4% or 19 single-father households and 10.4% or 33 single-mother households are living below the poverty line. Among single-father households, those with no children have the highest poverty rate, with 19 households (18.4%) experiencing poverty. Likewise, among single-mother households, those with 1 or 2 children have the highest poverty rate, with 33 households (45.8%) falling below the poverty line.
| Children | Single Father | Single Mother |
| No Children | 19 (18.4%) | 0 (0.0%) |
| 1 or 2 Children | 0 (0.0%) | 33 (45.8%) |
| 3 or 4 Children | 0 (0.0%) | 0 (0.0%) |
| 5 or more Children | 0 (0.0%) | 0 (0.0%) |
| Total | 19 (18.4%) | 33 (10.4%) |
Income Below Poverty Among Married-Couple vs Single-Parent Households in Washington
The poverty data for Washington shows that 6 of the married-couple family households (1.1%) and 52 of the single-parent households (12.3%) are living below the poverty level. Within the married-couple family households, those with 3 or 4 children have the highest poverty rate, with 6 households (100.0%) falling below the poverty line. Among the single-parent households, those with 1 or 2 children have the highest poverty rate, with 33 household (45.8%) living below poverty.
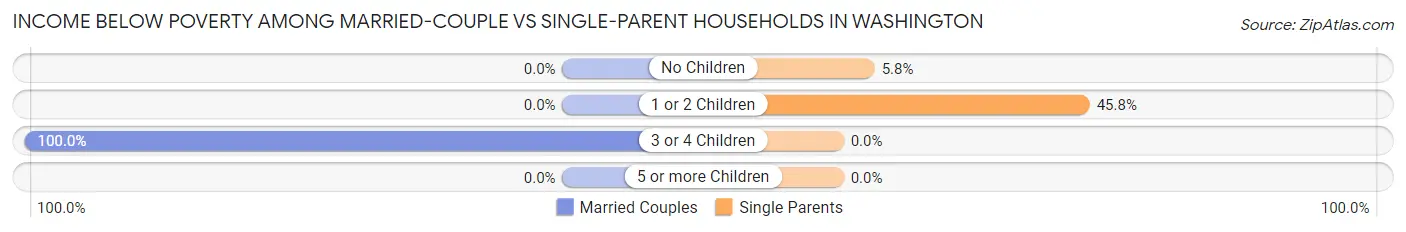
| Children | Married-Couple Families | Single-Parent Households |
| No Children | 0 (0.0%) | 19 (5.8%) |
| 1 or 2 Children | 0 (0.0%) | 33 (45.8%) |
| 3 or 4 Children | 6 (100.0%) | 0 (0.0%) |
| 5 or more Children | 0 (0.0%) | 0 (0.0%) |
| Total | 6 (1.1%) | 52 (12.3%) |
Employment Characteristics in Washington
Employment by Class of Employer in Washington
Among the 1,658 employed individuals in Washington, private company employees (874 | 52.7%), local government employees (281 | 17.0%), and not-for-profit organizations (182 | 11.0%) make up the most common classes of employment.
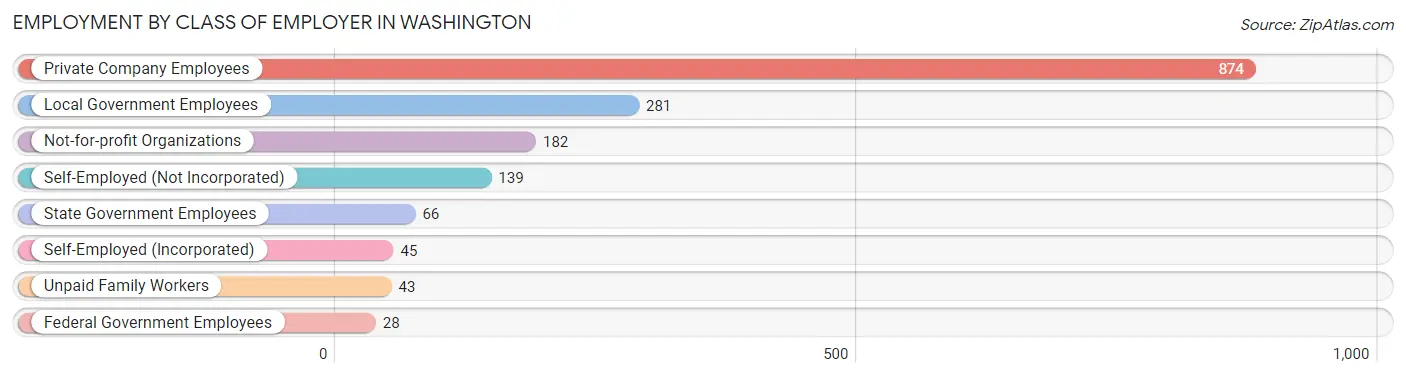
| Employer Class | # Employees | % Employees |
| Private Company Employees | 874 | 52.7% |
| Self-Employed (Incorporated) | 45 | 2.7% |
| Self-Employed (Not Incorporated) | 139 | 8.4% |
| Not-for-profit Organizations | 182 | 11.0% |
| Local Government Employees | 281 | 17.0% |
| State Government Employees | 66 | 4.0% |
| Federal Government Employees | 28 | 1.7% |
| Unpaid Family Workers | 43 | 2.6% |
| Total | 1,658 | 100.0% |
Employment Status by Age in Washington
According to the labor force statistics for Washington, out of the total population over 16 years of age (3,229), 53.0% or 1,711 individuals are in the labor force, with 2.2% or 38 of them unemployed. The age group with the highest labor force participation rate is 35 to 44 years, with 83.7% or 272 individuals in the labor force. Within the labor force, the 16 to 19 years age range has the highest percentage of unemployed individuals, with 14.7% or 15 of them being unemployed.
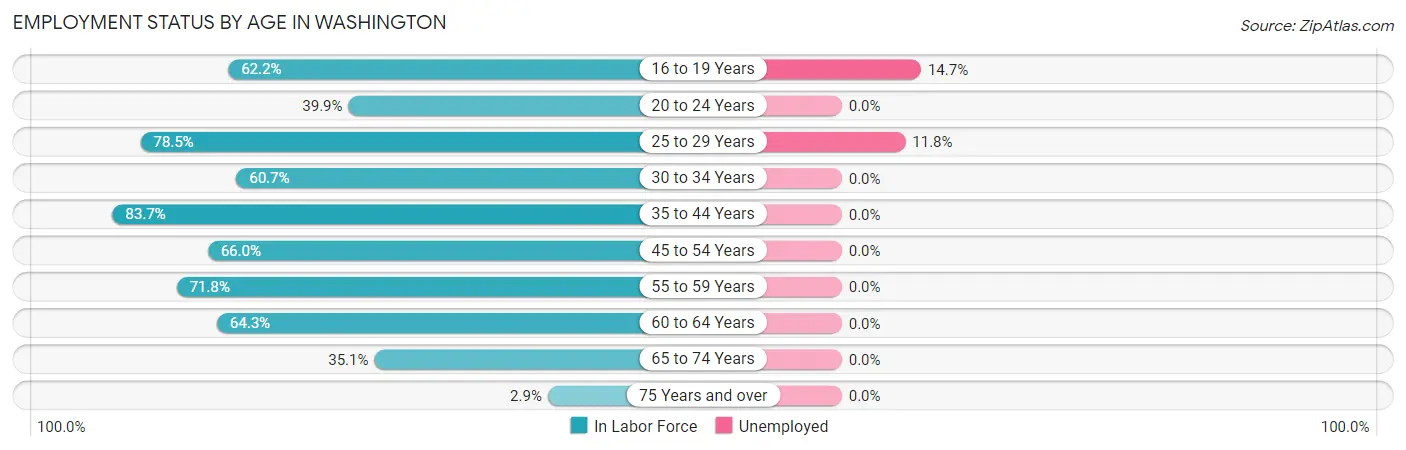
| Age Bracket | In Labor Force | Unemployed |
| 16 to 19 Years | 102 (62.2%) | 15 (14.7%) |
| 20 to 24 Years | 61 (39.9%) | 0 (0.0%) |
| 25 to 29 Years | 194 (78.5%) | 23 (11.8%) |
| 30 to 34 Years | 153 (60.7%) | 0 (0.0%) |
| 35 to 44 Years | 272 (83.7%) | 0 (0.0%) |
| 45 to 54 Years | 247 (66.0%) | 0 (0.0%) |
| 55 to 59 Years | 249 (71.8%) | 0 (0.0%) |
| 60 to 64 Years | 236 (64.3%) | 0 (0.0%) |
| 65 to 74 Years | 183 (35.1%) | 0 (0.0%) |
| 75 Years and over | 14 (2.9%) | 0 (0.0%) |
| Total | 1,711 (53.0%) | 38 (2.2%) |
Employment Status by Educational Attainment in Washington
According to labor force statistics for Washington, 70.7% of individuals (1,352) out of the total population between 25 and 64 years of age (1,912) are in the labor force, with 1.6% or 22 of them being unemployed. The group with the highest labor force participation rate are those with the educational attainment of bachelor's degree or higher, with 82.5% or 321 individuals in the labor force. Within the labor force, individuals with less than high school education have the highest percentage of unemployment, with 27.8% or 22 of them being unemployed.
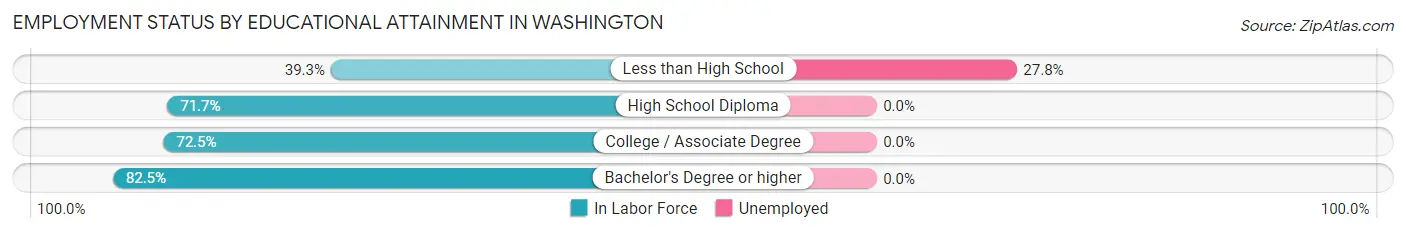
| Educational Attainment | In Labor Force | Unemployed |
| Less than High School | 79 (39.3%) | 56 (27.8%) |
| High School Diploma | 666 (71.7%) | 0 (0.0%) |
| College / Associate Degree | 285 (72.5%) | 0 (0.0%) |
| Bachelor's Degree or higher | 321 (82.5%) | 0 (0.0%) |
| Total | 1,352 (70.7%) | 31 (1.6%) |
Employment Occupations by Sex in Washington
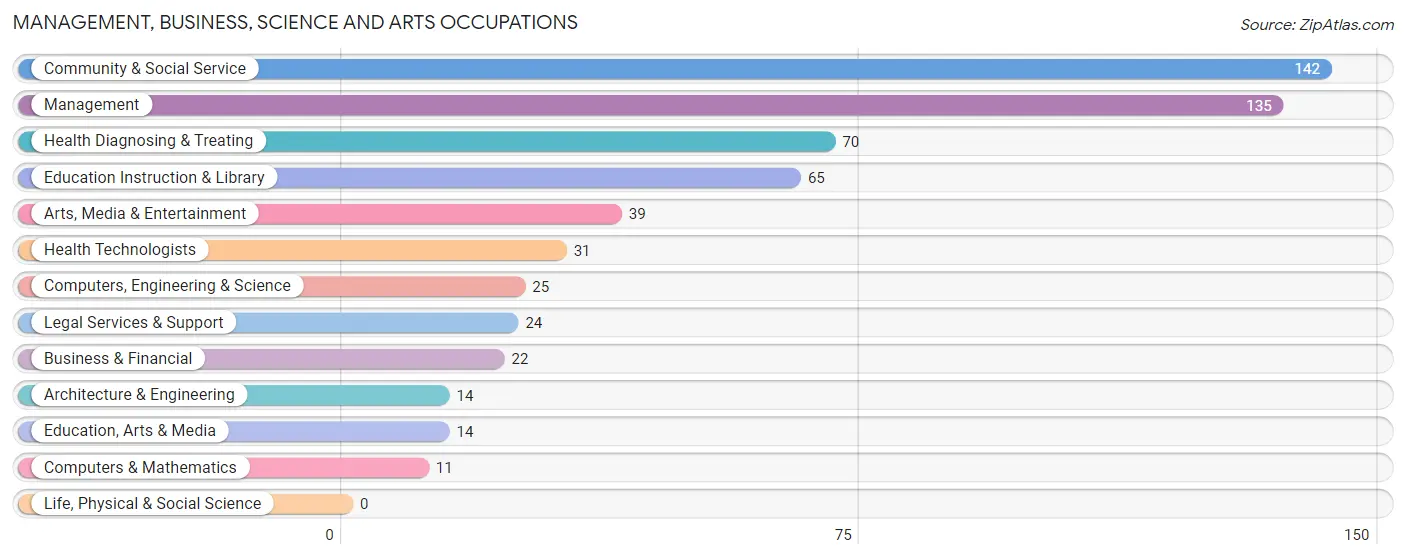
Management, Business, Science and Arts Occupations
The most common Management, Business, Science and Arts occupations in Washington are Community & Social Service (142 | 8.5%), Management (135 | 8.1%), Health Diagnosing & Treating (70 | 4.2%), Education Instruction & Library (65 | 3.9%), and Arts, Media & Entertainment (39 | 2.3%).
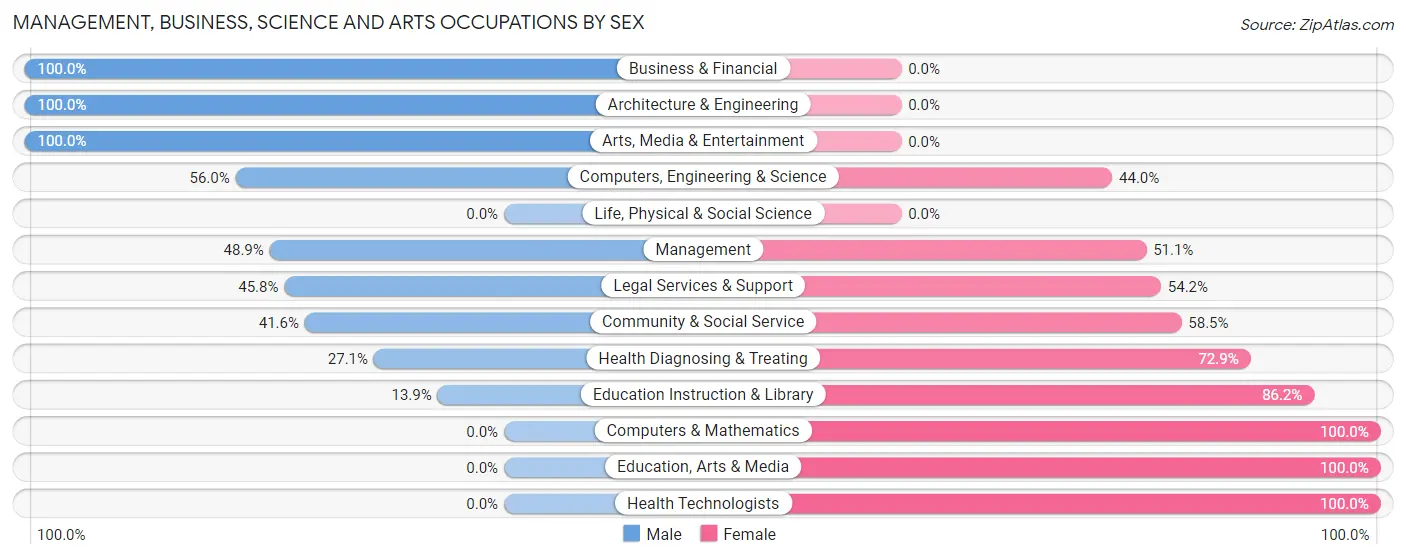
Management, Business, Science and Arts Occupations by Sex
Within the Management, Business, Science and Arts occupations in Washington, the most male-oriented occupations are Business & Financial (100.0%), Architecture & Engineering (100.0%), and Arts, Media & Entertainment (100.0%), while the most female-oriented occupations are Computers & Mathematics (100.0%), Education, Arts & Media (100.0%), and Health Technologists (100.0%).
| Occupation | Male | Female |
| Management | 66 (48.9%) | 69 (51.1%) |
| Business & Financial | 22 (100.0%) | 0 (0.0%) |
| Computers, Engineering & Science | 14 (56.0%) | 11 (44.0%) |
| Computers & Mathematics | 0 (0.0%) | 11 (100.0%) |
| Architecture & Engineering | 14 (100.0%) | 0 (0.0%) |
| Life, Physical & Social Science | 0 (0.0%) | 0 (0.0%) |
| Community & Social Service | 59 (41.5%) | 83 (58.5%) |
| Education, Arts & Media | 0 (0.0%) | 14 (100.0%) |
| Legal Services & Support | 11 (45.8%) | 13 (54.2%) |
| Education Instruction & Library | 9 (13.9%) | 56 (86.2%) |
| Arts, Media & Entertainment | 39 (100.0%) | 0 (0.0%) |
| Health Diagnosing & Treating | 19 (27.1%) | 51 (72.9%) |
| Health Technologists | 0 (0.0%) | 31 (100.0%) |
| Total (Category) | 180 (45.7%) | 214 (54.3%) |
| Total (Overall) | 820 (49.2%) | 847 (50.8%) |
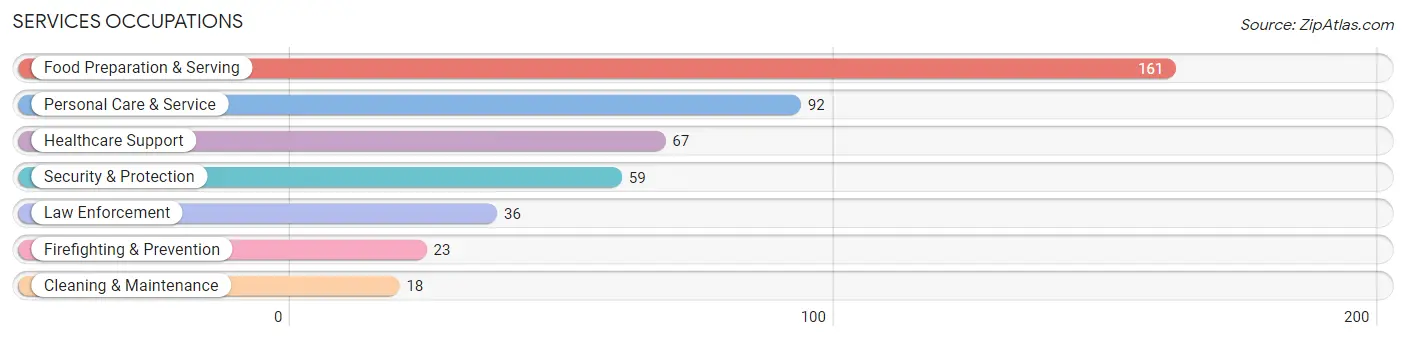
Services Occupations
The most common Services occupations in Washington are Food Preparation & Serving (161 | 9.7%), Personal Care & Service (92 | 5.5%), Healthcare Support (67 | 4.0%), Security & Protection (59 | 3.5%), and Law Enforcement (36 | 2.2%).
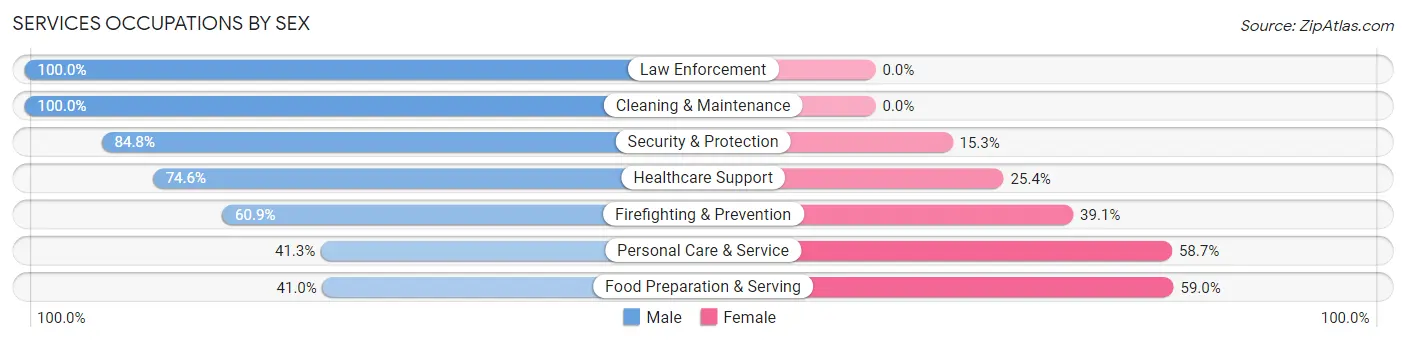
Services Occupations by Sex
Within the Services occupations in Washington, the most male-oriented occupations are Law Enforcement (100.0%), Cleaning & Maintenance (100.0%), and Security & Protection (84.8%), while the most female-oriented occupations are Food Preparation & Serving (59.0%), Personal Care & Service (58.7%), and Firefighting & Prevention (39.1%).
| Occupation | Male | Female |
| Healthcare Support | 50 (74.6%) | 17 (25.4%) |
| Security & Protection | 50 (84.8%) | 9 (15.2%) |
| Firefighting & Prevention | 14 (60.9%) | 9 (39.1%) |
| Law Enforcement | 36 (100.0%) | 0 (0.0%) |
| Food Preparation & Serving | 66 (41.0%) | 95 (59.0%) |
| Cleaning & Maintenance | 18 (100.0%) | 0 (0.0%) |
| Personal Care & Service | 38 (41.3%) | 54 (58.7%) |
| Total (Category) | 222 (55.9%) | 175 (44.1%) |
| Total (Overall) | 820 (49.2%) | 847 (50.8%) |
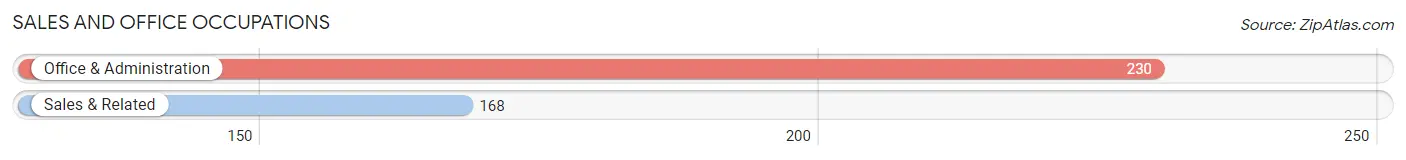
Sales and Office Occupations
The most common Sales and Office occupations in Washington are Office & Administration (230 | 13.8%), and Sales & Related (168 | 10.1%).
Sales and Office Occupations by Sex
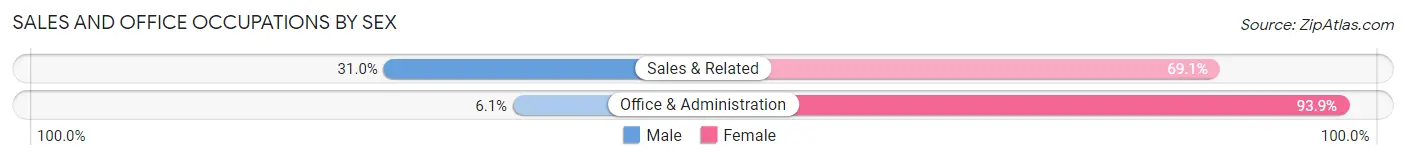
| Occupation | Male | Female |
| Sales & Related | 52 (30.9%) | 116 (69.1%) |
| Office & Administration | 14 (6.1%) | 216 (93.9%) |
| Total (Category) | 66 (16.6%) | 332 (83.4%) |
| Total (Overall) | 820 (49.2%) | 847 (50.8%) |
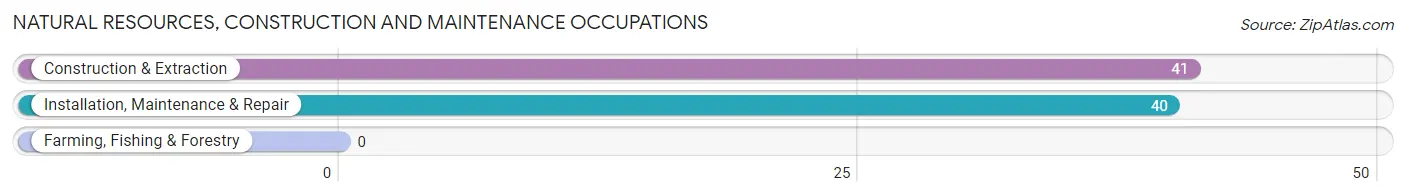
Natural Resources, Construction and Maintenance Occupations
The most common Natural Resources, Construction and Maintenance occupations in Washington are Construction & Extraction (41 | 2.5%), and Installation, Maintenance & Repair (40 | 2.4%).
Natural Resources, Construction and Maintenance Occupations by Sex
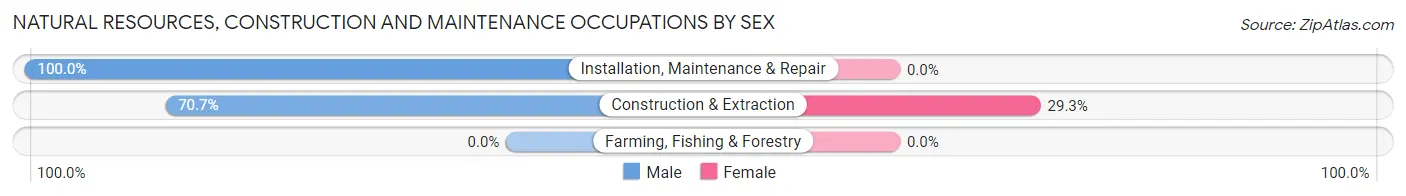
| Occupation | Male | Female |
| Farming, Fishing & Forestry | 0 (0.0%) | 0 (0.0%) |
| Construction & Extraction | 29 (70.7%) | 12 (29.3%) |
| Installation, Maintenance & Repair | 40 (100.0%) | 0 (0.0%) |
| Total (Category) | 69 (85.2%) | 12 (14.8%) |
| Total (Overall) | 820 (49.2%) | 847 (50.8%) |
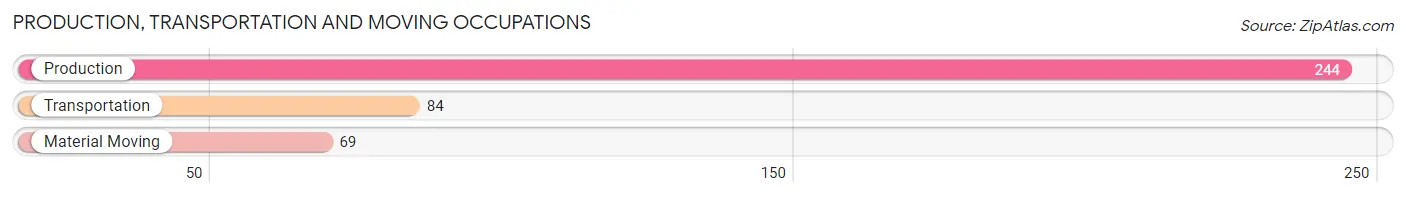
Production, Transportation and Moving Occupations
The most common Production, Transportation and Moving occupations in Washington are Production (244 | 14.6%), Transportation (84 | 5.0%), and Material Moving (69 | 4.1%).
Production, Transportation and Moving Occupations by Sex
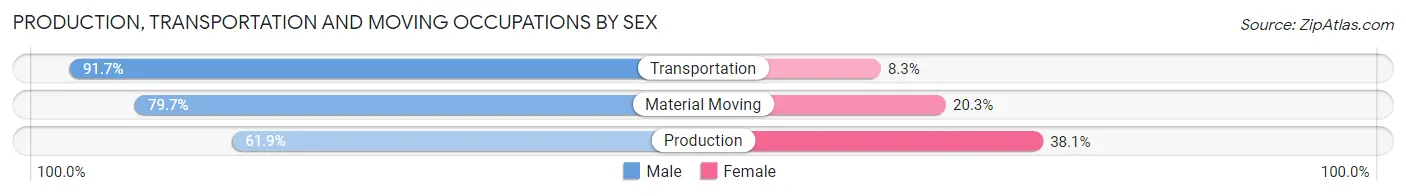
| Occupation | Male | Female |
| Production | 151 (61.9%) | 93 (38.1%) |
| Transportation | 77 (91.7%) | 7 (8.3%) |
| Material Moving | 55 (79.7%) | 14 (20.3%) |
| Total (Category) | 283 (71.3%) | 114 (28.7%) |
| Total (Overall) | 820 (49.2%) | 847 (50.8%) |
Employment Industries by Sex in Washington
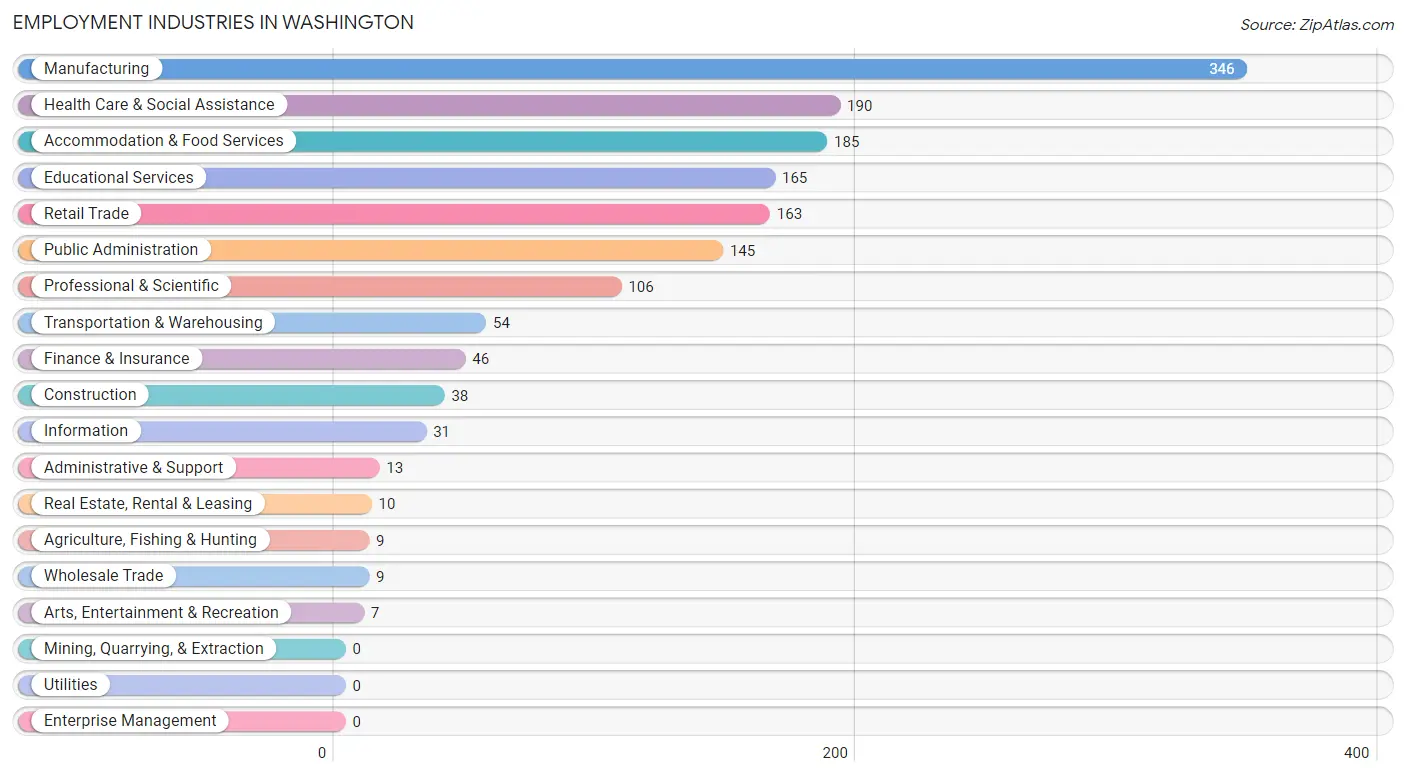
Employment Industries in Washington
The major employment industries in Washington include Manufacturing (346 | 20.8%), Health Care & Social Assistance (190 | 11.4%), Accommodation & Food Services (185 | 11.1%), Educational Services (165 | 9.9%), and Retail Trade (163 | 9.8%).
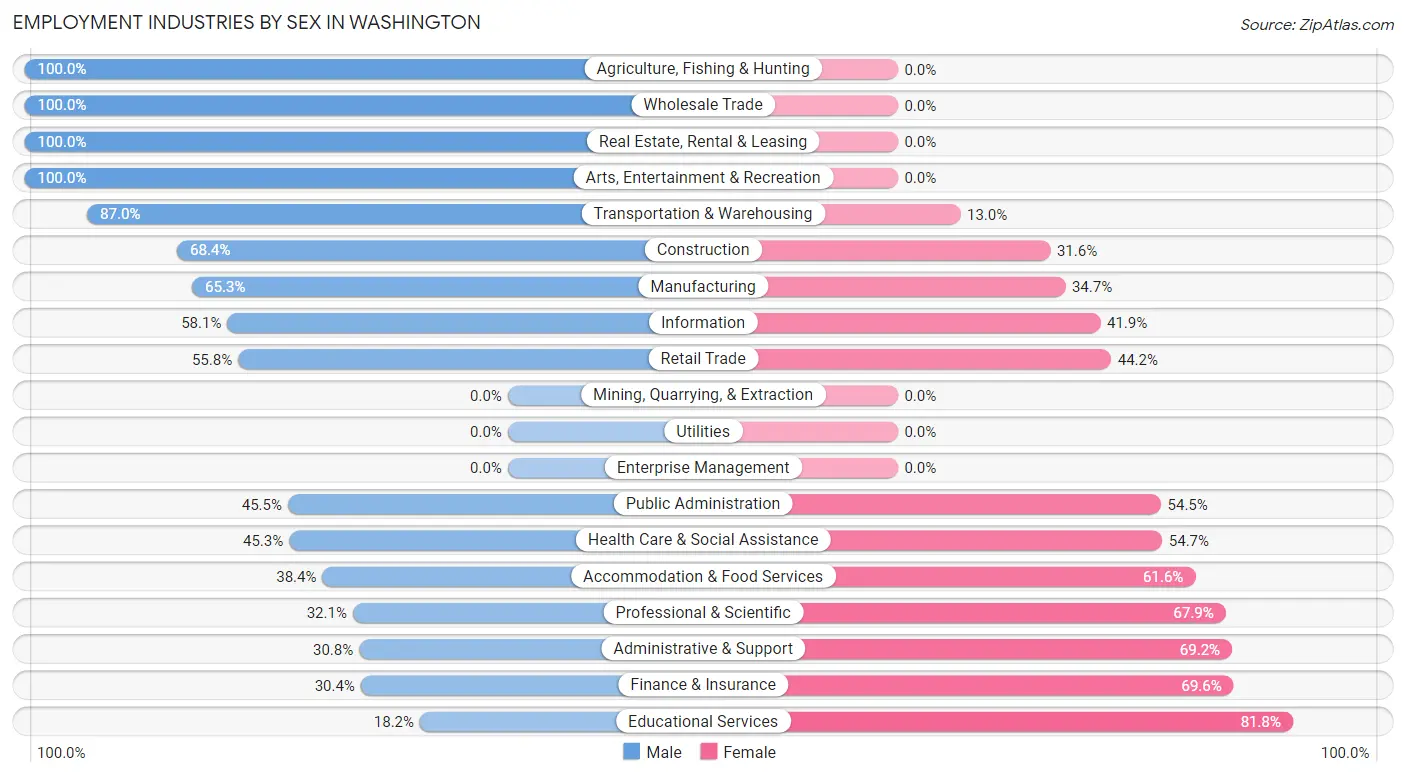
Employment Industries by Sex in Washington
The Washington industries that see more men than women are Agriculture, Fishing & Hunting (100.0%), Wholesale Trade (100.0%), and Real Estate, Rental & Leasing (100.0%), whereas the industries that tend to have a higher number of women are Educational Services (81.8%), Finance & Insurance (69.6%), and Administrative & Support (69.2%).
| Industry | Male | Female |
| Agriculture, Fishing & Hunting | 9 (100.0%) | 0 (0.0%) |
| Mining, Quarrying, & Extraction | 0 (0.0%) | 0 (0.0%) |
| Construction | 26 (68.4%) | 12 (31.6%) |
| Manufacturing | 226 (65.3%) | 120 (34.7%) |
| Wholesale Trade | 9 (100.0%) | 0 (0.0%) |
| Retail Trade | 91 (55.8%) | 72 (44.2%) |
| Transportation & Warehousing | 47 (87.0%) | 7 (13.0%) |
| Utilities | 0 (0.0%) | 0 (0.0%) |
| Information | 18 (58.1%) | 13 (41.9%) |
| Finance & Insurance | 14 (30.4%) | 32 (69.6%) |
| Real Estate, Rental & Leasing | 10 (100.0%) | 0 (0.0%) |
| Professional & Scientific | 34 (32.1%) | 72 (67.9%) |
| Enterprise Management | 0 (0.0%) | 0 (0.0%) |
| Administrative & Support | 4 (30.8%) | 9 (69.2%) |
| Educational Services | 30 (18.2%) | 135 (81.8%) |
| Health Care & Social Assistance | 86 (45.3%) | 104 (54.7%) |
| Arts, Entertainment & Recreation | 7 (100.0%) | 0 (0.0%) |
| Accommodation & Food Services | 71 (38.4%) | 114 (61.6%) |
| Public Administration | 66 (45.5%) | 79 (54.5%) |
| Total | 820 (49.2%) | 847 (50.8%) |
Education in Washington
School Enrollment in Washington
The most common levels of schooling among the 611 students in Washington are elementary school (175 | 28.6%), high school (112 | 18.3%), and kindergarten (110 | 18.0%).
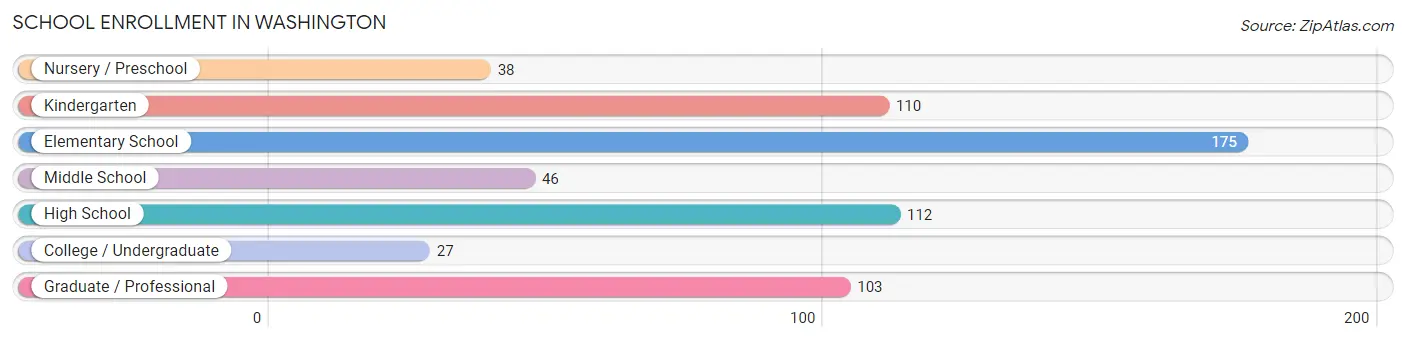
| School Level | # Students | % Students |
| Nursery / Preschool | 38 | 6.2% |
| Kindergarten | 110 | 18.0% |
| Elementary School | 175 | 28.6% |
| Middle School | 46 | 7.5% |
| High School | 112 | 18.3% |
| College / Undergraduate | 27 | 4.4% |
| Graduate / Professional | 103 | 16.9% |
| Total | 611 | 100.0% |
School Enrollment by Age by Funding Source in Washington
Out of a total of 611 students who are enrolled in schools in Washington, 117 (19.1%) attend a private institution, while the remaining 494 (80.9%) are enrolled in public schools. The age group of 25 to 34 year olds has the highest likelihood of being enrolled in private schools, with 68 (80.9% in the age bracket) enrolled. Conversely, the age group of 3 to 4 year olds has the lowest likelihood of being enrolled in a private school, with 38 (100.0% in the age bracket) attending a public institution.
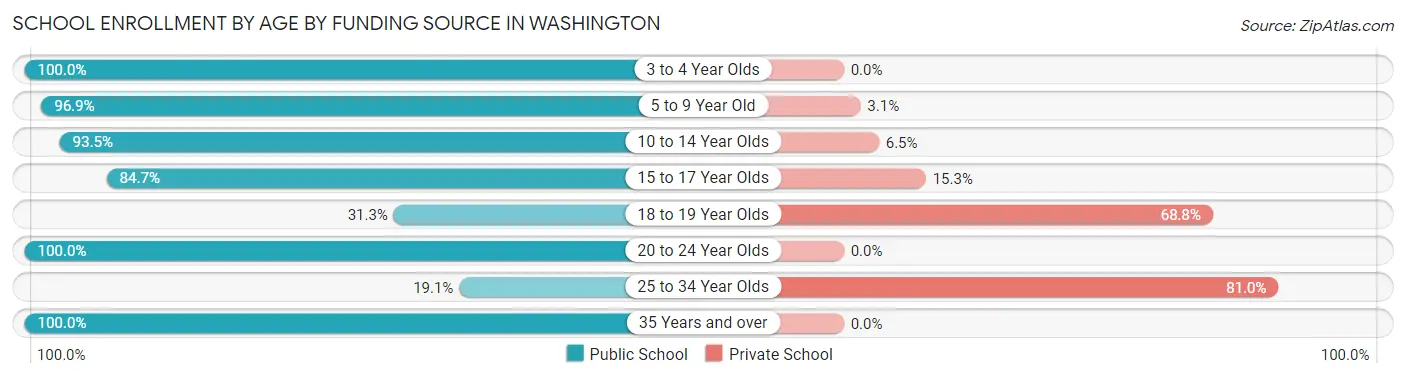
| Age Bracket | Public School | Private School |
| 3 to 4 Year Olds | 38 (100.0%) | 0 (0.0%) |
| 5 to 9 Year Old | 217 (96.9%) | 7 (3.1%) |
| 10 to 14 Year Olds | 100 (93.5%) | 7 (6.5%) |
| 15 to 17 Year Olds | 72 (84.7%) | 13 (15.3%) |
| 18 to 19 Year Olds | 10 (31.2%) | 22 (68.8%) |
| 20 to 24 Year Olds | 15 (100.0%) | 0 (0.0%) |
| 25 to 34 Year Olds | 16 (19.1%) | 68 (80.9%) |
| 35 Years and over | 26 (100.0%) | 0 (0.0%) |
| Total | 494 (80.9%) | 117 (19.1%) |
Educational Attainment by Field of Study in Washington
Business (162 | 30.2%), education (74 | 13.8%), liberal arts & history (68 | 12.7%), arts & humanities (49 | 9.1%), and visual & performing arts (37 | 6.9%) are the most common fields of study among 537 individuals in Washington who have obtained a bachelor's degree or higher.
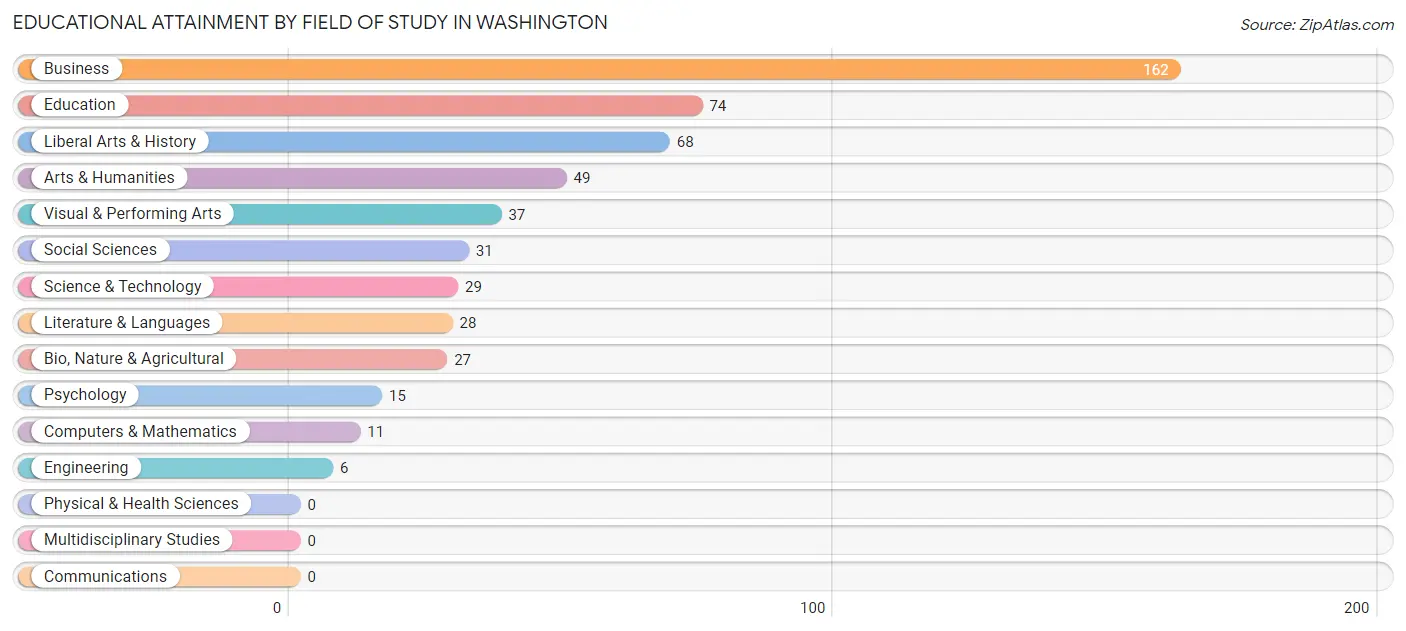
| Field of Study | # Graduates | % Graduates |
| Computers & Mathematics | 11 | 2.1% |
| Bio, Nature & Agricultural | 27 | 5.0% |
| Physical & Health Sciences | 0 | 0.0% |
| Psychology | 15 | 2.8% |
| Social Sciences | 31 | 5.8% |
| Engineering | 6 | 1.1% |
| Multidisciplinary Studies | 0 | 0.0% |
| Science & Technology | 29 | 5.4% |
| Business | 162 | 30.2% |
| Education | 74 | 13.8% |
| Literature & Languages | 28 | 5.2% |
| Liberal Arts & History | 68 | 12.7% |
| Visual & Performing Arts | 37 | 6.9% |
| Communications | 0 | 0.0% |
| Arts & Humanities | 49 | 9.1% |
| Total | 537 | 100.0% |
Transportation & Commute in Washington
Vehicle Availability by Sex in Washington
The most prevalent vehicle ownership categories in Washington are males with 1 vehicle (342, accounting for 42.2%) and females with 1 vehicle (285, making up 40.6%).
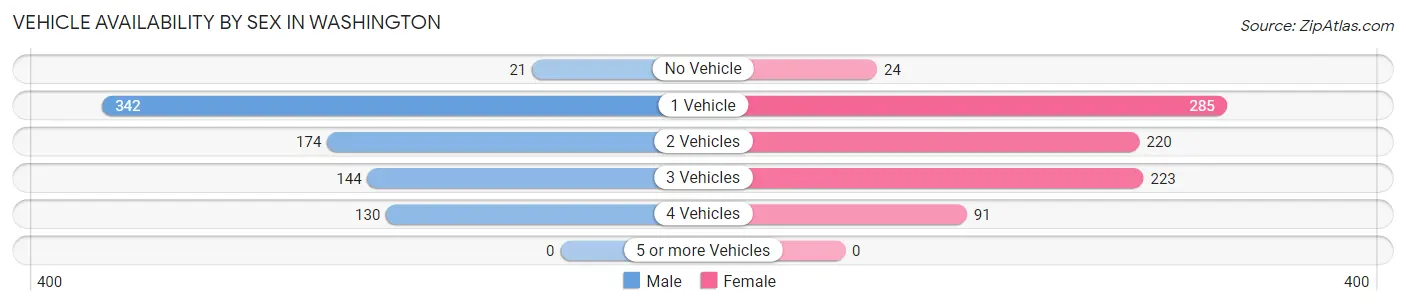
| Vehicles Available | Male | Female |
| No Vehicle | 21 (2.6%) | 24 (2.9%) |
| 1 Vehicle | 342 (42.2%) | 285 (33.8%) |
| 2 Vehicles | 174 (21.4%) | 220 (26.1%) |
| 3 Vehicles | 144 (17.8%) | 223 (26.5%) |
| 4 Vehicles | 130 (16.0%) | 91 (10.8%) |
| 5 or more Vehicles | 0 (0.0%) | 0 (0.0%) |
| Total | 811 (100.0%) | 843 (100.0%) |
Commute Time in Washington
The most frequently occuring commute durations in Washington are 5 to 9 minutes (405 commuters, 25.5%), 10 to 14 minutes (224 commuters, 14.1%), and 60 to 89 minutes (182 commuters, 11.5%).
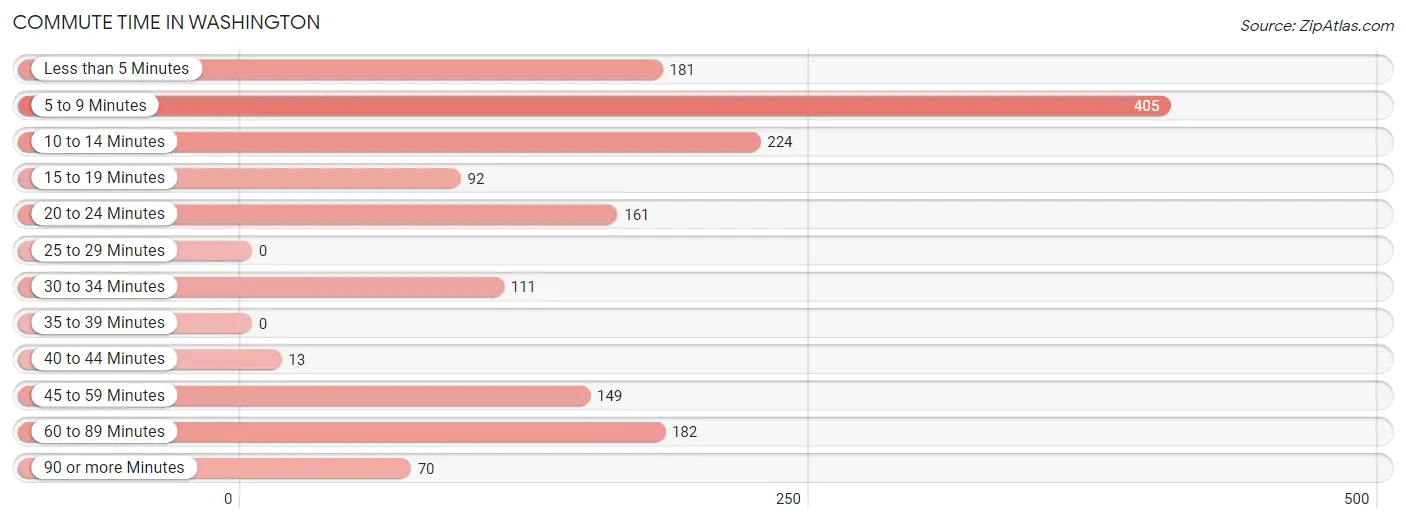
| Commute Time | # Commuters | % Commuters |
| Less than 5 Minutes | 181 | 11.4% |
| 5 to 9 Minutes | 405 | 25.5% |
| 10 to 14 Minutes | 224 | 14.1% |
| 15 to 19 Minutes | 92 | 5.8% |
| 20 to 24 Minutes | 161 | 10.1% |
| 25 to 29 Minutes | 0 | 0.0% |
| 30 to 34 Minutes | 111 | 7.0% |
| 35 to 39 Minutes | 0 | 0.0% |
| 40 to 44 Minutes | 13 | 0.8% |
| 45 to 59 Minutes | 149 | 9.4% |
| 60 to 89 Minutes | 182 | 11.5% |
| 90 or more Minutes | 70 | 4.4% |
Commute Time by Sex in Washington
The most common commute times in Washington are 10 to 14 minutes (195 commuters, 24.0%) for males and 5 to 9 minutes (245 commuters, 31.5%) for females.
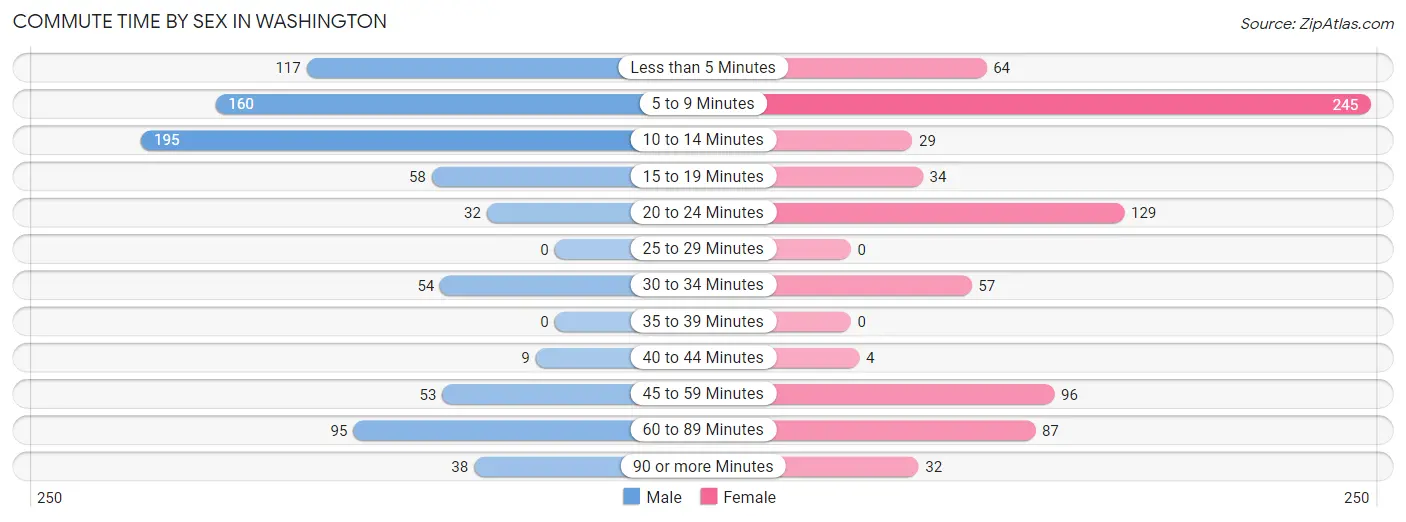
| Commute Time | Male | Female |
| Less than 5 Minutes | 117 (14.4%) | 64 (8.2%) |
| 5 to 9 Minutes | 160 (19.7%) | 245 (31.5%) |
| 10 to 14 Minutes | 195 (24.0%) | 29 (3.7%) |
| 15 to 19 Minutes | 58 (7.1%) | 34 (4.4%) |
| 20 to 24 Minutes | 32 (4.0%) | 129 (16.6%) |
| 25 to 29 Minutes | 0 (0.0%) | 0 (0.0%) |
| 30 to 34 Minutes | 54 (6.7%) | 57 (7.3%) |
| 35 to 39 Minutes | 0 (0.0%) | 0 (0.0%) |
| 40 to 44 Minutes | 9 (1.1%) | 4 (0.5%) |
| 45 to 59 Minutes | 53 (6.5%) | 96 (12.4%) |
| 60 to 89 Minutes | 95 (11.7%) | 87 (11.2%) |
| 90 or more Minutes | 38 (4.7%) | 32 (4.1%) |
Time of Departure to Work by Sex in Washington
The most frequent times of departure to work in Washington are 7:30 AM to 7:59 AM (120, 14.8%) for males and 7:00 AM to 7:29 AM (133, 17.1%) for females.
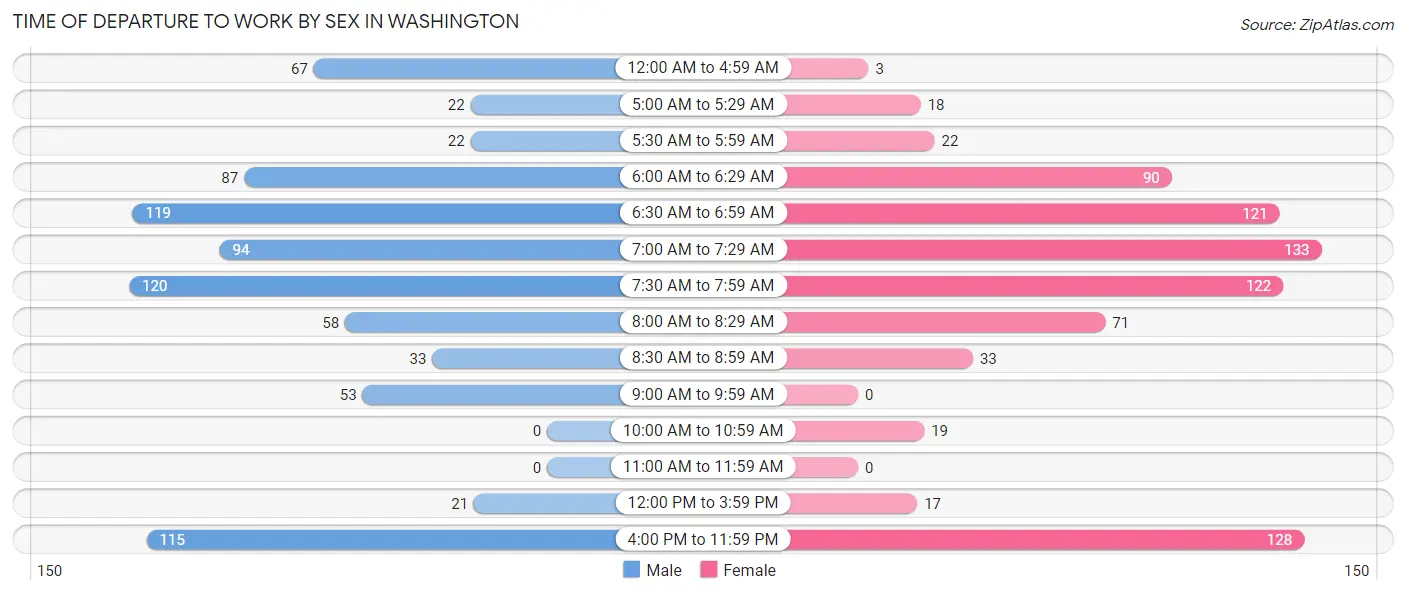
| Time of Departure | Male | Female |
| 12:00 AM to 4:59 AM | 67 (8.3%) | 3 (0.4%) |
| 5:00 AM to 5:29 AM | 22 (2.7%) | 18 (2.3%) |
| 5:30 AM to 5:59 AM | 22 (2.7%) | 22 (2.8%) |
| 6:00 AM to 6:29 AM | 87 (10.7%) | 90 (11.6%) |
| 6:30 AM to 6:59 AM | 119 (14.7%) | 121 (15.6%) |
| 7:00 AM to 7:29 AM | 94 (11.6%) | 133 (17.1%) |
| 7:30 AM to 7:59 AM | 120 (14.8%) | 122 (15.7%) |
| 8:00 AM to 8:29 AM | 58 (7.1%) | 71 (9.1%) |
| 8:30 AM to 8:59 AM | 33 (4.1%) | 33 (4.3%) |
| 9:00 AM to 9:59 AM | 53 (6.5%) | 0 (0.0%) |
| 10:00 AM to 10:59 AM | 0 (0.0%) | 19 (2.5%) |
| 11:00 AM to 11:59 AM | 0 (0.0%) | 0 (0.0%) |
| 12:00 PM to 3:59 PM | 21 (2.6%) | 17 (2.2%) |
| 4:00 PM to 11:59 PM | 115 (14.2%) | 128 (16.5%) |
| Total | 811 (100.0%) | 777 (100.0%) |
Housing Occupancy in Washington
Occupancy by Ownership in Washington
Of the total 1,722 dwellings in Washington, owner-occupied units account for 1,106 (64.2%), while renter-occupied units make up 616 (35.8%).
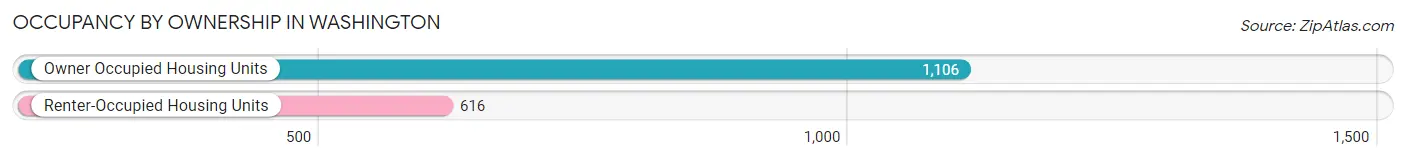
| Occupancy | # Housing Units | % Housing Units |
| Owner Occupied Housing Units | 1,106 | 64.2% |
| Renter-Occupied Housing Units | 616 | 35.8% |
| Total Occupied Housing Units | 1,722 | 100.0% |
Occupancy by Household Size in Washington
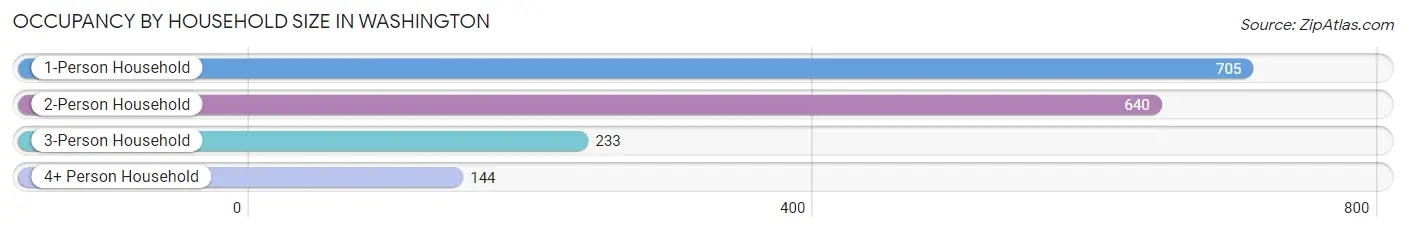
| Household Size | # Housing Units | % Housing Units |
| 1-Person Household | 705 | 40.9% |
| 2-Person Household | 640 | 37.2% |
| 3-Person Household | 233 | 13.5% |
| 4+ Person Household | 144 | 8.4% |
| Total Housing Units | 1,722 | 100.0% |
Occupancy by Ownership by Household Size in Washington
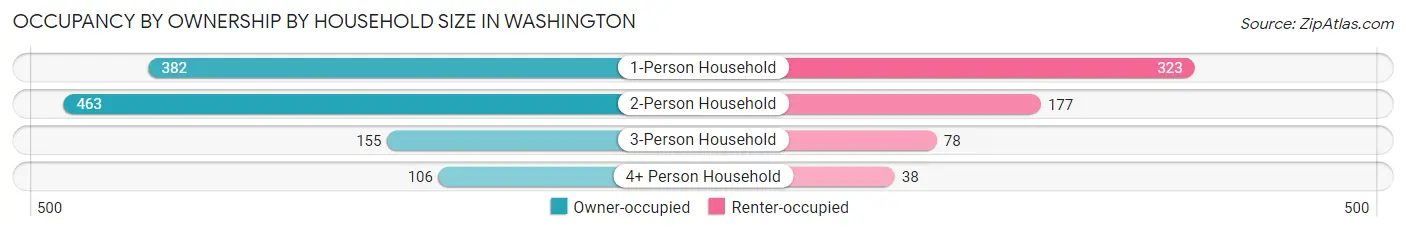
| Household Size | Owner-occupied | Renter-occupied |
| 1-Person Household | 382 (54.2%) | 323 (45.8%) |
| 2-Person Household | 463 (72.3%) | 177 (27.7%) |
| 3-Person Household | 155 (66.5%) | 78 (33.5%) |
| 4+ Person Household | 106 (73.6%) | 38 (26.4%) |
| Total Housing Units | 1,106 (64.2%) | 616 (35.8%) |
Occupancy by Educational Attainment in Washington
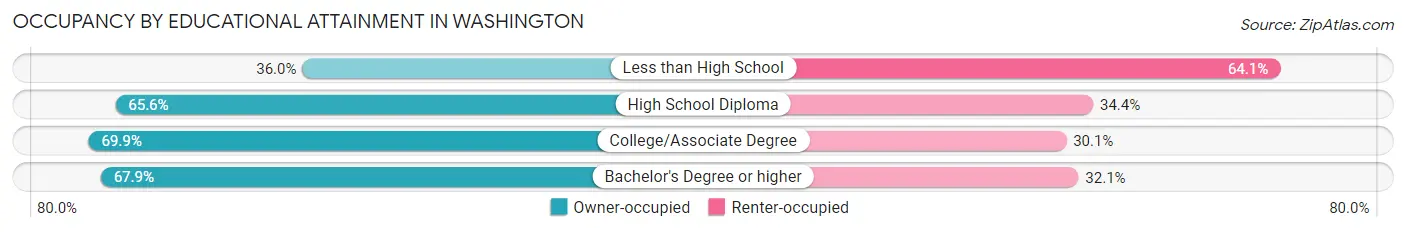
| Household Size | Owner-occupied | Renter-occupied |
| Less than High School | 55 (35.9%) | 98 (64.0%) |
| High School Diploma | 616 (65.6%) | 323 (34.4%) |
| College/Associate Degree | 255 (69.9%) | 110 (30.1%) |
| Bachelor's Degree or higher | 180 (67.9%) | 85 (32.1%) |
Occupancy by Age of Householder in Washington
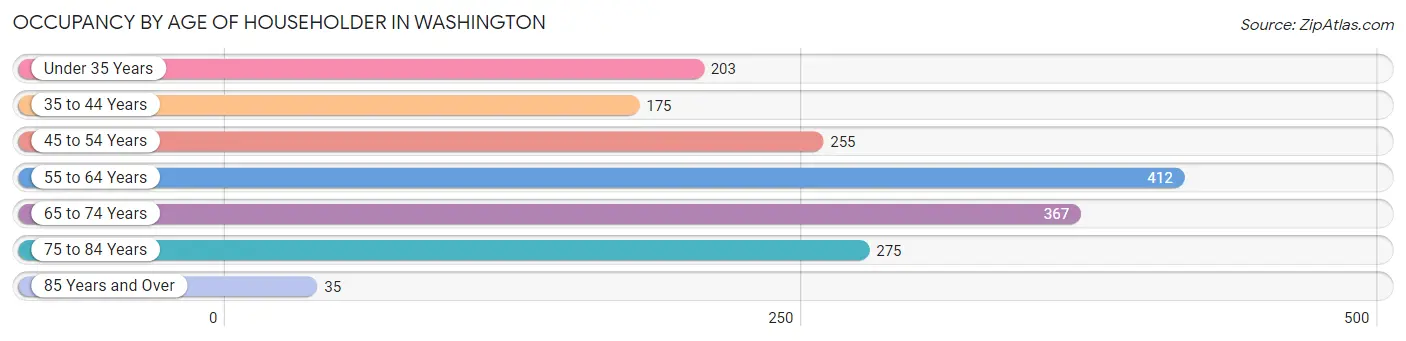
| Age Bracket | # Households | % Households |
| Under 35 Years | 203 | 11.8% |
| 35 to 44 Years | 175 | 10.2% |
| 45 to 54 Years | 255 | 14.8% |
| 55 to 64 Years | 412 | 23.9% |
| 65 to 74 Years | 367 | 21.3% |
| 75 to 84 Years | 275 | 16.0% |
| 85 Years and Over | 35 | 2.0% |
| Total | 1,722 | 100.0% |
Housing Finances in Washington
Median Income by Occupancy in Washington
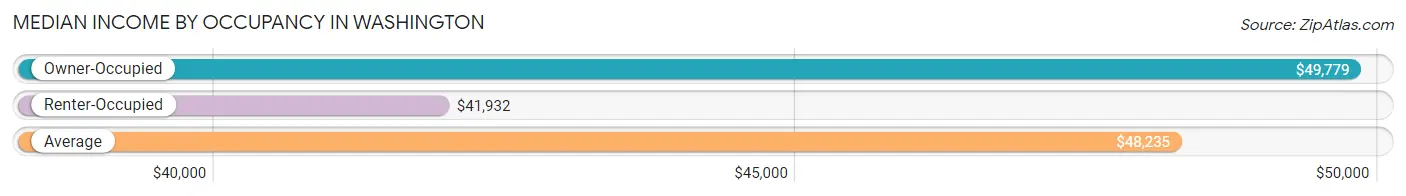
| Occupancy Type | # Households | Median Income |
| Owner-Occupied | 1,106 (64.2%) | $49,779 |
| Renter-Occupied | 616 (35.8%) | $41,932 |
| Average | 1,722 (100.0%) | $48,235 |
Occupancy by Householder Income Bracket in Washington
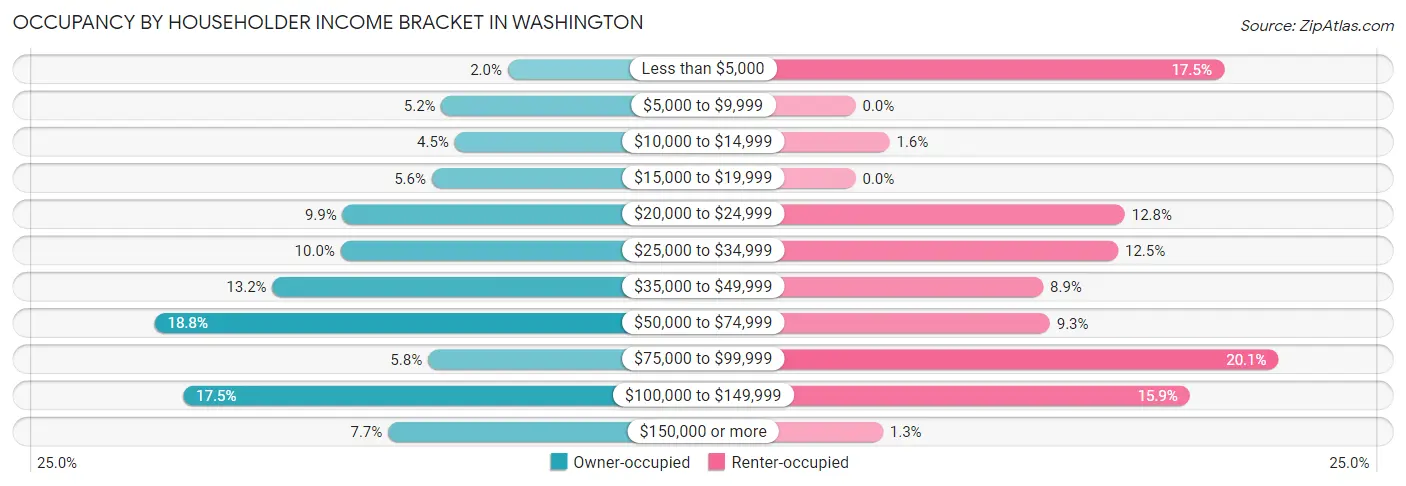
| Income Bracket | Owner-occupied | Renter-occupied |
| Less than $5,000 | 22 (2.0%) | 108 (17.5%) |
| $5,000 to $9,999 | 57 (5.1%) | 0 (0.0%) |
| $10,000 to $14,999 | 50 (4.5%) | 10 (1.6%) |
| $15,000 to $19,999 | 62 (5.6%) | 0 (0.0%) |
| $20,000 to $24,999 | 109 (9.9%) | 79 (12.8%) |
| $25,000 to $34,999 | 110 (10.0%) | 77 (12.5%) |
| $35,000 to $49,999 | 146 (13.2%) | 55 (8.9%) |
| $50,000 to $74,999 | 208 (18.8%) | 57 (9.2%) |
| $75,000 to $99,999 | 64 (5.8%) | 124 (20.1%) |
| $100,000 to $149,999 | 193 (17.4%) | 98 (15.9%) |
| $150,000 or more | 85 (7.7%) | 8 (1.3%) |
| Total | 1,106 (100.0%) | 616 (100.0%) |
Monthly Housing Cost Tiers in Washington
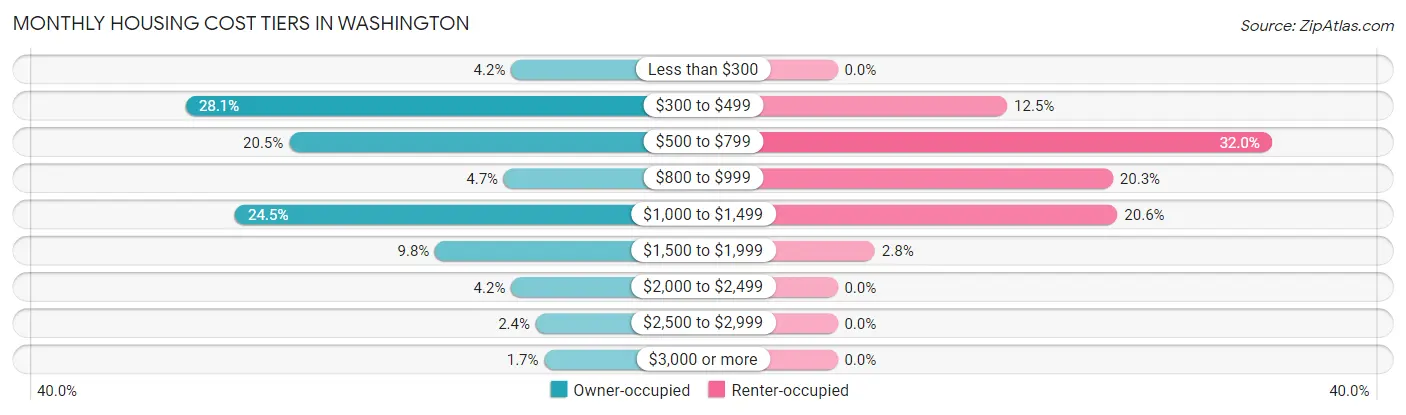
| Monthly Cost | Owner-occupied | Renter-occupied |
| Less than $300 | 46 (4.2%) | 0 (0.0%) |
| $300 to $499 | 311 (28.1%) | 77 (12.5%) |
| $500 to $799 | 227 (20.5%) | 197 (32.0%) |
| $800 to $999 | 52 (4.7%) | 125 (20.3%) |
| $1,000 to $1,499 | 271 (24.5%) | 127 (20.6%) |
| $1,500 to $1,999 | 108 (9.8%) | 17 (2.8%) |
| $2,000 to $2,499 | 46 (4.2%) | 0 (0.0%) |
| $2,500 to $2,999 | 26 (2.4%) | 0 (0.0%) |
| $3,000 or more | 19 (1.7%) | 0 (0.0%) |
| Total | 1,106 (100.0%) | 616 (100.0%) |
Physical Housing Characteristics in Washington
Housing Structures in Washington
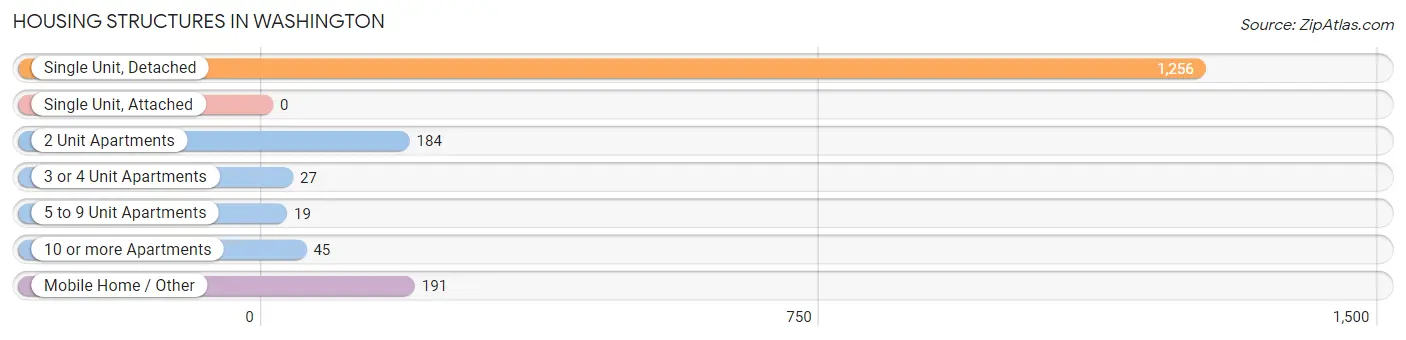
| Structure Type | # Housing Units | % Housing Units |
| Single Unit, Detached | 1,256 | 72.9% |
| Single Unit, Attached | 0 | 0.0% |
| 2 Unit Apartments | 184 | 10.7% |
| 3 or 4 Unit Apartments | 27 | 1.6% |
| 5 to 9 Unit Apartments | 19 | 1.1% |
| 10 or more Apartments | 45 | 2.6% |
| Mobile Home / Other | 191 | 11.1% |
| Total | 1,722 | 100.0% |
Housing Structures by Occupancy in Washington
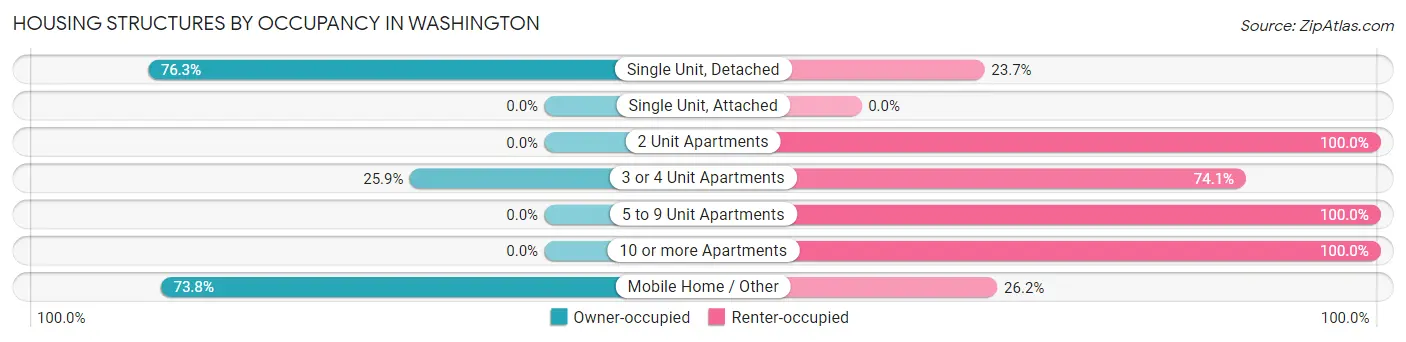
| Structure Type | Owner-occupied | Renter-occupied |
| Single Unit, Detached | 958 (76.3%) | 298 (23.7%) |
| Single Unit, Attached | 0 (0.0%) | 0 (0.0%) |
| 2 Unit Apartments | 0 (0.0%) | 184 (100.0%) |
| 3 or 4 Unit Apartments | 7 (25.9%) | 20 (74.1%) |
| 5 to 9 Unit Apartments | 0 (0.0%) | 19 (100.0%) |
| 10 or more Apartments | 0 (0.0%) | 45 (100.0%) |
| Mobile Home / Other | 141 (73.8%) | 50 (26.2%) |
| Total | 1,106 (64.2%) | 616 (35.8%) |
Housing Structures by Number of Rooms in Washington
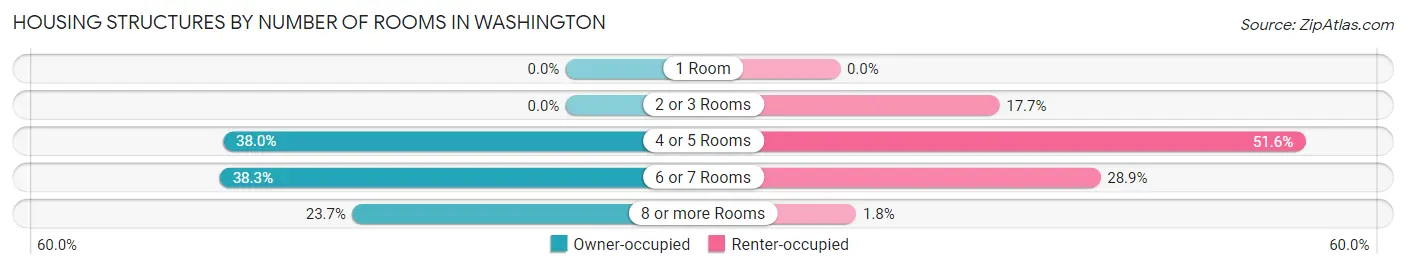
| Number of Rooms | Owner-occupied | Renter-occupied |
| 1 Room | 0 (0.0%) | 0 (0.0%) |
| 2 or 3 Rooms | 0 (0.0%) | 109 (17.7%) |
| 4 or 5 Rooms | 420 (38.0%) | 318 (51.6%) |
| 6 or 7 Rooms | 424 (38.3%) | 178 (28.9%) |
| 8 or more Rooms | 262 (23.7%) | 11 (1.8%) |
| Total | 1,106 (100.0%) | 616 (100.0%) |
Housing Structure by Heating Type in Washington
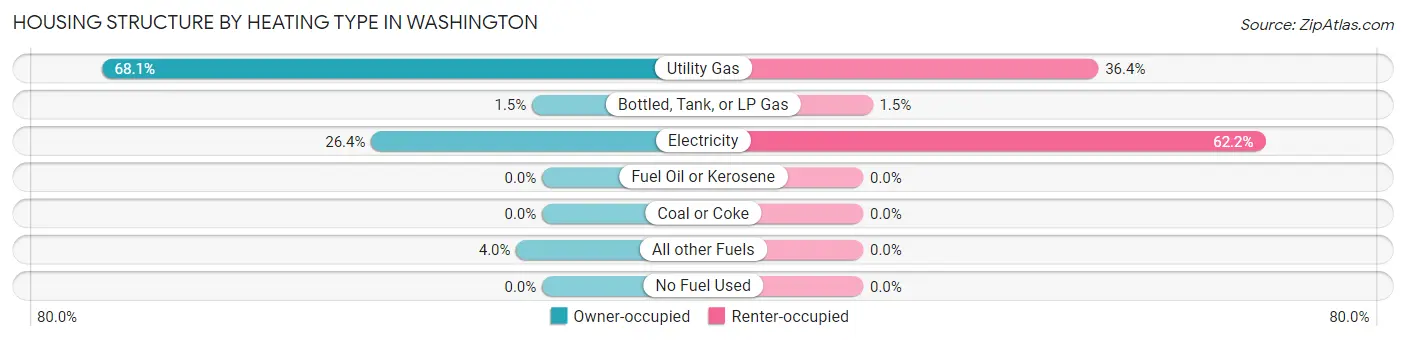
| Heating Type | Owner-occupied | Renter-occupied |
| Utility Gas | 753 (68.1%) | 224 (36.4%) |
| Bottled, Tank, or LP Gas | 17 (1.5%) | 9 (1.5%) |
| Electricity | 292 (26.4%) | 383 (62.2%) |
| Fuel Oil or Kerosene | 0 (0.0%) | 0 (0.0%) |
| Coal or Coke | 0 (0.0%) | 0 (0.0%) |
| All other Fuels | 44 (4.0%) | 0 (0.0%) |
| No Fuel Used | 0 (0.0%) | 0 (0.0%) |
| Total | 1,106 (100.0%) | 616 (100.0%) |
Household Vehicle Usage in Washington
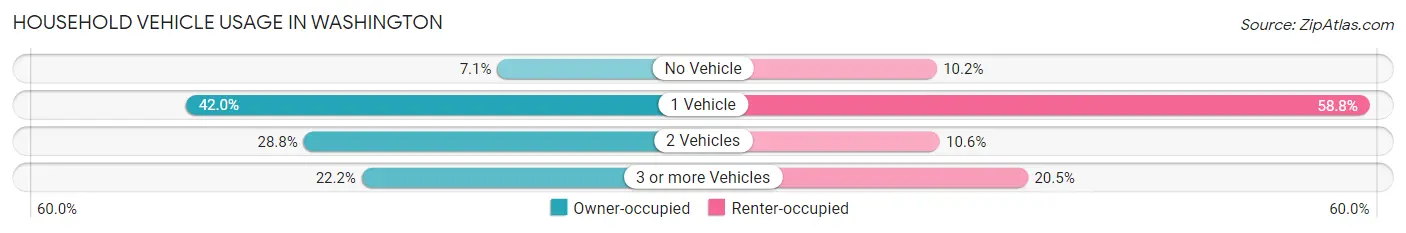
| Vehicles per Household | Owner-occupied | Renter-occupied |
| No Vehicle | 78 (7.0%) | 63 (10.2%) |
| 1 Vehicle | 464 (41.9%) | 362 (58.8%) |
| 2 Vehicles | 318 (28.7%) | 65 (10.5%) |
| 3 or more Vehicles | 246 (22.2%) | 126 (20.4%) |
| Total | 1,106 (100.0%) | 616 (100.0%) |
Real Estate & Mortgages in Washington
Real Estate and Mortgage Overview in Washington
| Characteristic | Without Mortgage | With Mortgage |
| Housing Units | 641 | 465 |
| Median Property Value | $84,400 | $115,100 |
| Median Household Income | $29,484 | $57 |
| Monthly Housing Costs | $478 | $13 |
| Real Estate Taxes | $919 | $8 |
Property Value by Mortgage Status in Washington
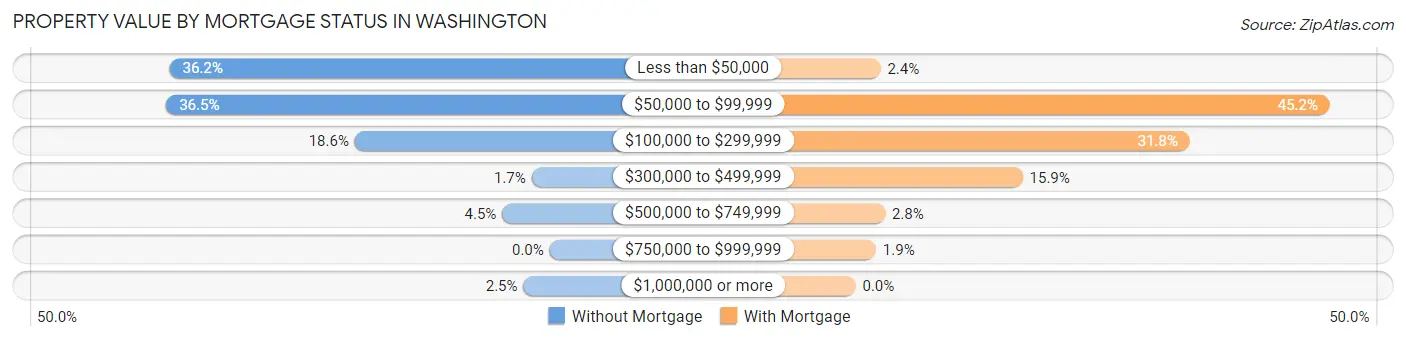
| Property Value | Without Mortgage | With Mortgage |
| Less than $50,000 | 232 (36.2%) | 11 (2.4%) |
| $50,000 to $99,999 | 234 (36.5%) | 210 (45.2%) |
| $100,000 to $299,999 | 119 (18.6%) | 148 (31.8%) |
| $300,000 to $499,999 | 11 (1.7%) | 74 (15.9%) |
| $500,000 to $749,999 | 29 (4.5%) | 13 (2.8%) |
| $750,000 to $999,999 | 0 (0.0%) | 9 (1.9%) |
| $1,000,000 or more | 16 (2.5%) | 0 (0.0%) |
| Total | 641 (100.0%) | 465 (100.0%) |
Household Income by Mortgage Status in Washington
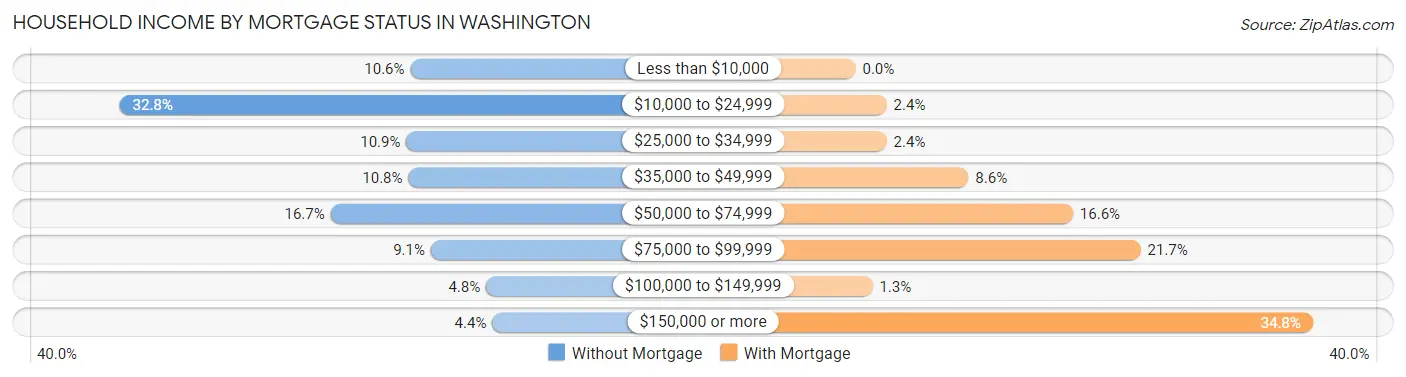
| Household Income | Without Mortgage | With Mortgage |
| Less than $10,000 | 68 (10.6%) | 0 (0.0%) |
| $10,000 to $24,999 | 210 (32.8%) | 11 (2.4%) |
| $25,000 to $34,999 | 70 (10.9%) | 11 (2.4%) |
| $35,000 to $49,999 | 69 (10.8%) | 40 (8.6%) |
| $50,000 to $74,999 | 107 (16.7%) | 77 (16.6%) |
| $75,000 to $99,999 | 58 (9.0%) | 101 (21.7%) |
| $100,000 to $149,999 | 31 (4.8%) | 6 (1.3%) |
| $150,000 or more | 28 (4.4%) | 162 (34.8%) |
| Total | 641 (100.0%) | 465 (100.0%) |
Property Value to Household Income Ratio in Washington
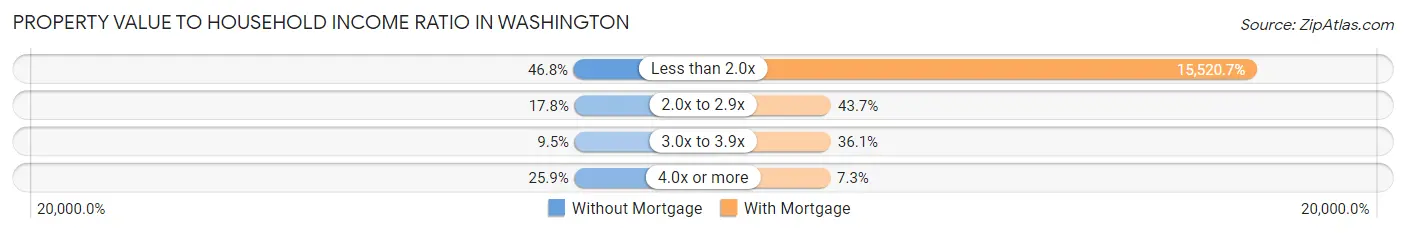
| Value-to-Income Ratio | Without Mortgage | With Mortgage |
| Less than 2.0x | 300 (46.8%) | 72,171 (15,520.7%) |
| 2.0x to 2.9x | 114 (17.8%) | 203 (43.7%) |
| 3.0x to 3.9x | 61 (9.5%) | 168 (36.1%) |
| 4.0x or more | 166 (25.9%) | 34 (7.3%) |
| Total | 641 (100.0%) | 465 (100.0%) |
Real Estate Taxes by Mortgage Status in Washington
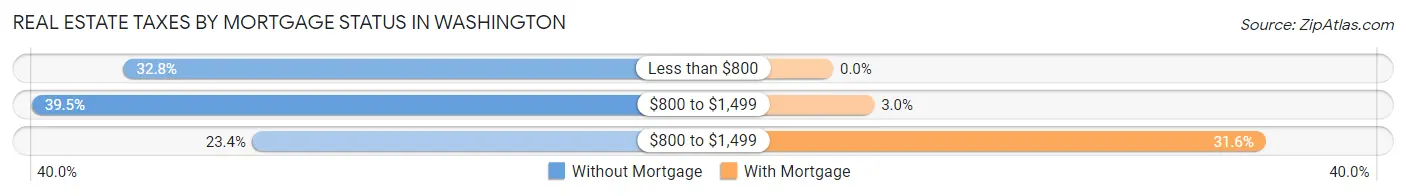
| Property Taxes | Without Mortgage | With Mortgage |
| Less than $800 | 210 (32.8%) | 0 (0.0%) |
| $800 to $1,499 | 253 (39.5%) | 14 (3.0%) |
| $800 to $1,499 | 150 (23.4%) | 147 (31.6%) |
| Total | 641 (100.0%) | 465 (100.0%) |
Health & Disability in Washington
Health Insurance Coverage by Age in Washington
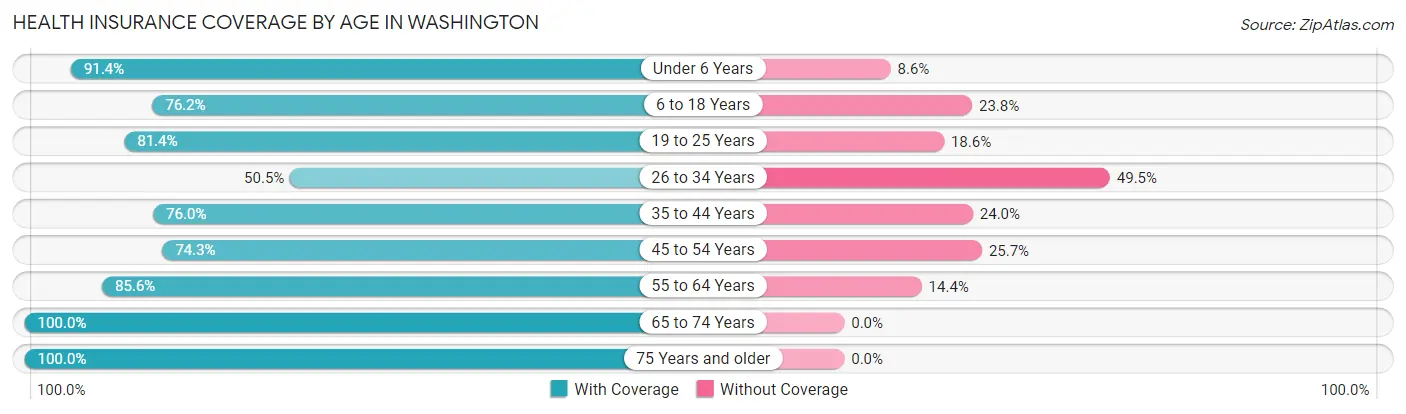
| Age Bracket | With Coverage | Without Coverage |
| Under 6 Years | 233 (91.4%) | 22 (8.6%) |
| 6 to 18 Years | 259 (76.2%) | 81 (23.8%) |
| 19 to 25 Years | 219 (81.4%) | 50 (18.6%) |
| 26 to 34 Years | 210 (50.5%) | 206 (49.5%) |
| 35 to 44 Years | 241 (76.0%) | 76 (24.0%) |
| 45 to 54 Years | 278 (74.3%) | 96 (25.7%) |
| 55 to 64 Years | 611 (85.6%) | 103 (14.4%) |
| 65 to 74 Years | 501 (100.0%) | 0 (0.0%) |
| 75 Years and older | 457 (100.0%) | 0 (0.0%) |
| Total | 3,009 (82.6%) | 634 (17.4%) |
Health Insurance Coverage by Citizenship Status in Washington
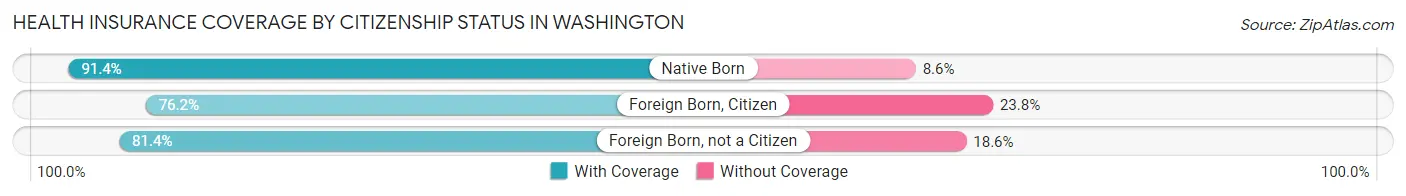
| Citizenship Status | With Coverage | Without Coverage |
| Native Born | 233 (91.4%) | 22 (8.6%) |
| Foreign Born, Citizen | 259 (76.2%) | 81 (23.8%) |
| Foreign Born, not a Citizen | 219 (81.4%) | 50 (18.6%) |
Health Insurance Coverage by Household Income in Washington
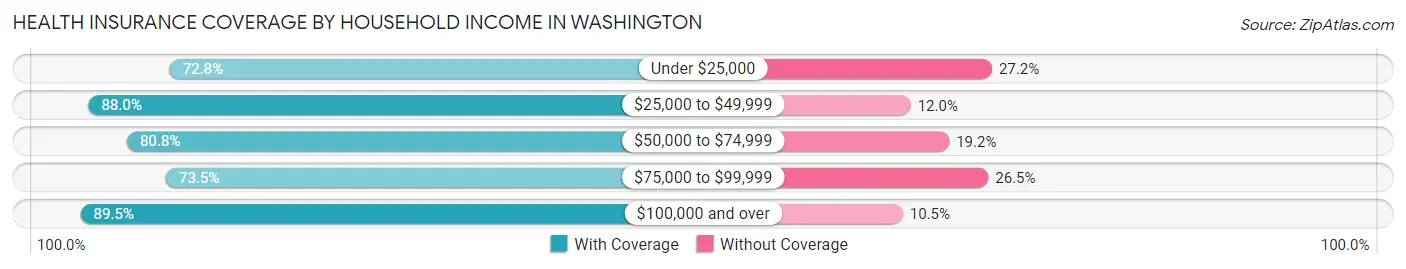
| Household Income | With Coverage | Without Coverage |
| Under $25,000 | 522 (72.8%) | 195 (27.2%) |
| $25,000 to $49,999 | 654 (88.0%) | 89 (12.0%) |
| $50,000 to $74,999 | 480 (80.8%) | 114 (19.2%) |
| $75,000 to $99,999 | 291 (73.5%) | 105 (26.5%) |
| $100,000 and over | 1,048 (89.5%) | 123 (10.5%) |
Public vs Private Health Insurance Coverage by Age in Washington
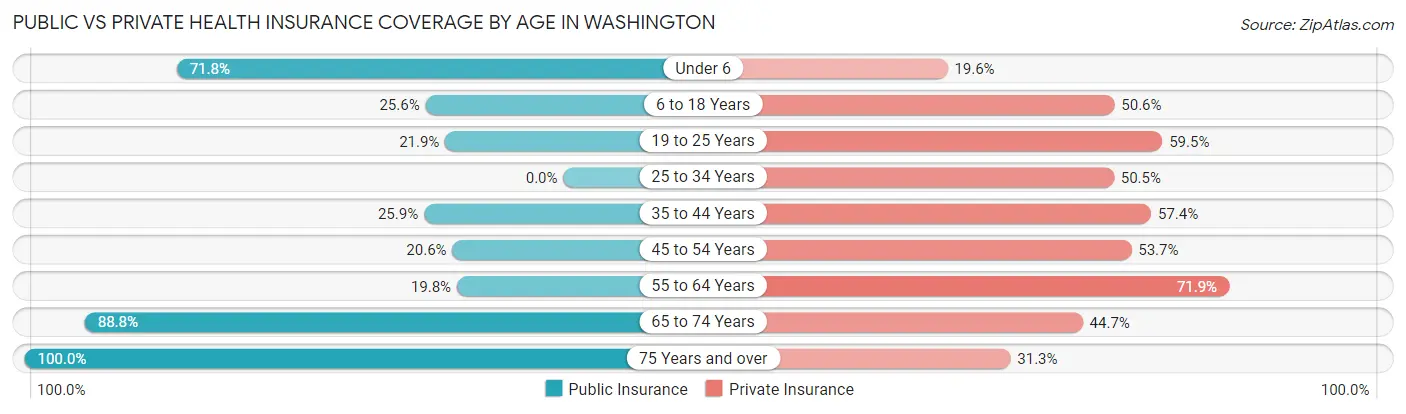
| Age Bracket | Public Insurance | Private Insurance |
| Under 6 | 183 (71.8%) | 50 (19.6%) |
| 6 to 18 Years | 87 (25.6%) | 172 (50.6%) |
| 19 to 25 Years | 59 (21.9%) | 160 (59.5%) |
| 25 to 34 Years | 0 (0.0%) | 210 (50.5%) |
| 35 to 44 Years | 82 (25.9%) | 182 (57.4%) |
| 45 to 54 Years | 77 (20.6%) | 201 (53.7%) |
| 55 to 64 Years | 141 (19.8%) | 513 (71.9%) |
| 65 to 74 Years | 445 (88.8%) | 224 (44.7%) |
| 75 Years and over | 457 (100.0%) | 143 (31.3%) |
| Total | 1,531 (42.0%) | 1,855 (50.9%) |
Disability Status by Sex by Age in Washington
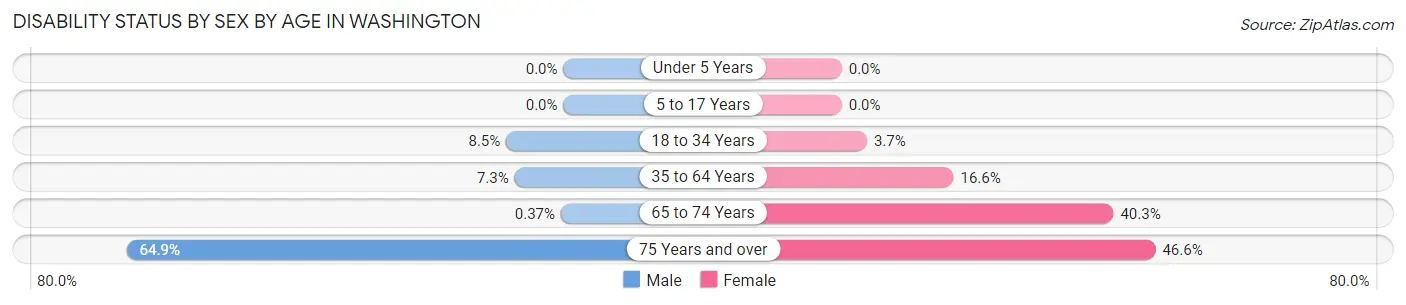
| Age Bracket | Male | Female |
| Under 5 Years | 0 (0.0%) | 0 (0.0%) |
| 5 to 17 Years | 0 (0.0%) | 0 (0.0%) |
| 18 to 34 Years | 34 (8.5%) | 11 (3.7%) |
| 35 to 64 Years | 42 (7.2%) | 137 (16.6%) |
| 65 to 74 Years | 1 (0.4%) | 94 (40.3%) |
| 75 Years and over | 107 (64.8%) | 136 (46.6%) |
Disability Class by Sex by Age in Washington
Disability Class: Hearing Difficulty
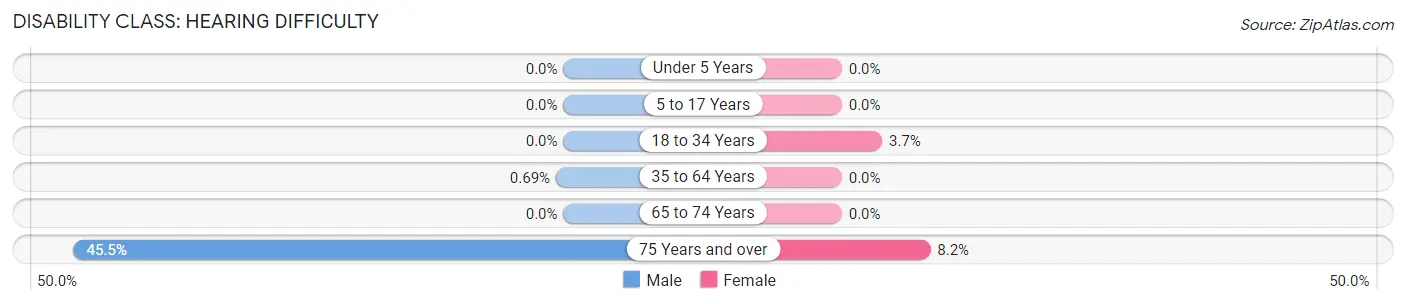
| Age Bracket | Male | Female |
| Under 5 Years | 0 (0.0%) | 0 (0.0%) |
| 5 to 17 Years | 0 (0.0%) | 0 (0.0%) |
| 18 to 34 Years | 0 (0.0%) | 11 (3.7%) |
| 35 to 64 Years | 4 (0.7%) | 0 (0.0%) |
| 65 to 74 Years | 0 (0.0%) | 0 (0.0%) |
| 75 Years and over | 75 (45.5%) | 24 (8.2%) |
Disability Class: Vision Difficulty
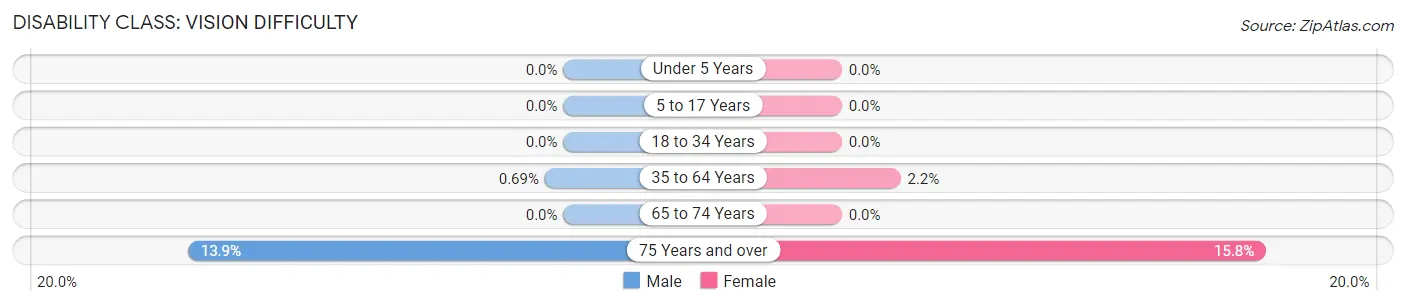
| Age Bracket | Male | Female |
| Under 5 Years | 0 (0.0%) | 0 (0.0%) |
| 5 to 17 Years | 0 (0.0%) | 0 (0.0%) |
| 18 to 34 Years | 0 (0.0%) | 0 (0.0%) |
| 35 to 64 Years | 4 (0.7%) | 18 (2.2%) |
| 65 to 74 Years | 0 (0.0%) | 0 (0.0%) |
| 75 Years and over | 23 (13.9%) | 46 (15.8%) |
Disability Class: Cognitive Difficulty
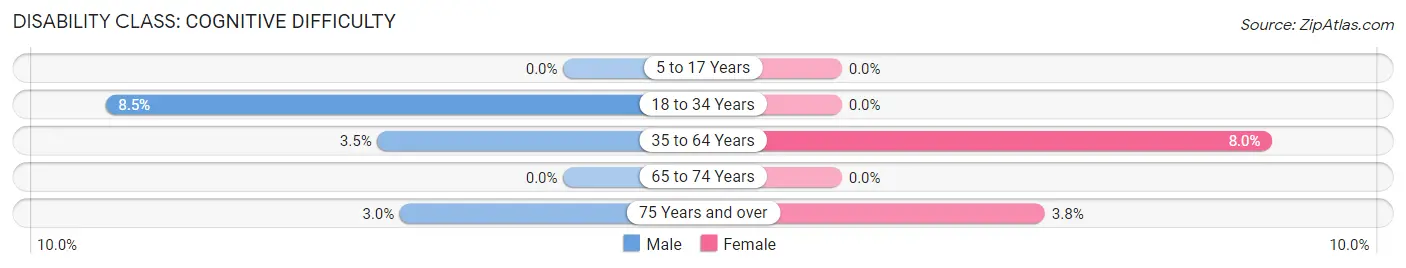
| Age Bracket | Male | Female |
| 5 to 17 Years | 0 (0.0%) | 0 (0.0%) |
| 18 to 34 Years | 34 (8.5%) | 0 (0.0%) |
| 35 to 64 Years | 20 (3.5%) | 66 (8.0%) |
| 65 to 74 Years | 0 (0.0%) | 0 (0.0%) |
| 75 Years and over | 5 (3.0%) | 11 (3.8%) |
Disability Class: Ambulatory Difficulty
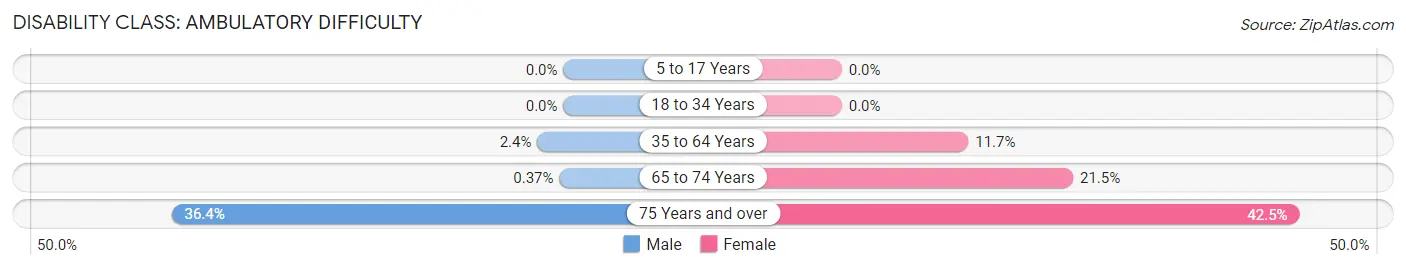
| Age Bracket | Male | Female |
| 5 to 17 Years | 0 (0.0%) | 0 (0.0%) |
| 18 to 34 Years | 0 (0.0%) | 0 (0.0%) |
| 35 to 64 Years | 14 (2.4%) | 97 (11.7%) |
| 65 to 74 Years | 1 (0.4%) | 50 (21.5%) |
| 75 Years and over | 60 (36.4%) | 124 (42.5%) |
Disability Class: Self-Care Difficulty
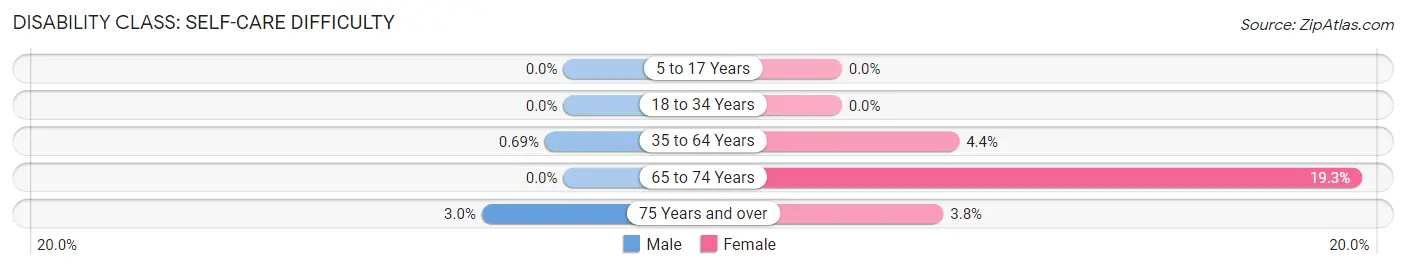
| Age Bracket | Male | Female |
| 5 to 17 Years | 0 (0.0%) | 0 (0.0%) |
| 18 to 34 Years | 0 (0.0%) | 0 (0.0%) |
| 35 to 64 Years | 4 (0.7%) | 36 (4.4%) |
| 65 to 74 Years | 0 (0.0%) | 45 (19.3%) |
| 75 Years and over | 5 (3.0%) | 11 (3.8%) |
Technology Access in Washington
Computing Device Access in Washington
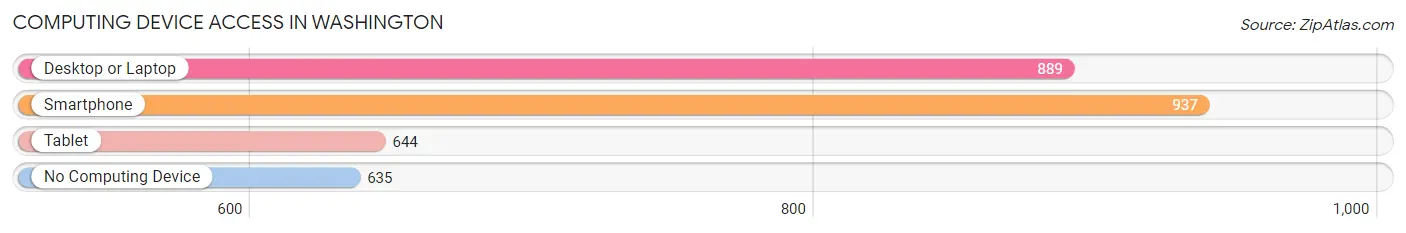
| Device Type | # Households | % Households |
| Desktop or Laptop | 889 | 51.6% |
| Smartphone | 937 | 54.4% |
| Tablet | 644 | 37.4% |
| No Computing Device | 635 | 36.9% |
| Total | 1,722 | 100.0% |
Internet Access in Washington
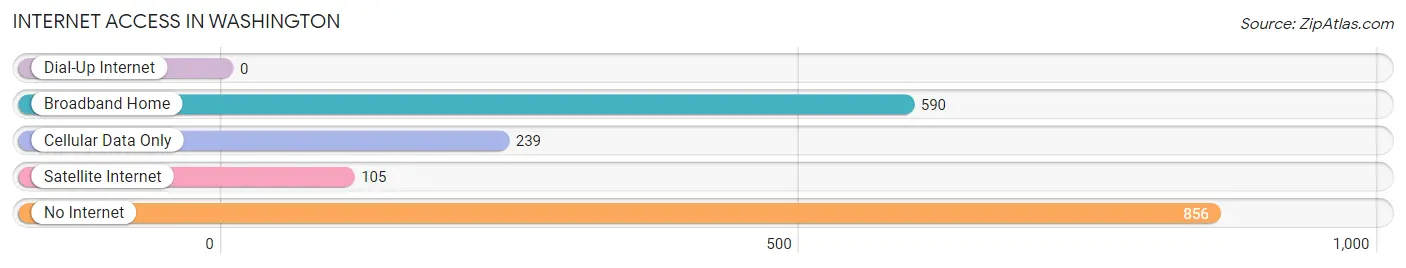
| Internet Type | # Households | % Households |
| Dial-Up Internet | 0 | 0.0% |
| Broadband Home | 590 | 34.3% |
| Cellular Data Only | 239 | 13.9% |
| Satellite Internet | 105 | 6.1% |
| No Internet | 856 | 49.7% |
| Total | 1,722 | 100.0% |
Washington Summary
Washington, Georgia is a small city located in Wilkes County, Georgia, United States. It is the county seat of Wilkes County and is located approximately 70 miles east of Atlanta. The city has a population of 4,295 as of the 2010 census.
History
Washington was founded in 1780 by James Edward Oglethorpe, the founder of the colony of Georgia. The city was named after George Washington, the first president of the United States. The city was originally a trading post and was the site of the first county court in Wilkes County.
In the early 19th century, Washington became a center of cotton production and was home to several large plantations. During the Civil War, the city was the site of several battles, including the Battle of Washington in 1864. After the war, the city experienced a period of economic decline, but in the late 19th century, it began to experience a period of growth and development.
Geography
Washington is located in Wilkes County, Georgia, at the intersection of U.S. Route 78 and Georgia State Route 17. The city is situated at the confluence of the Broad and Little Rivers. The city has a total area of 4.2 square miles, all of which is land.
Economy
Washington’s economy is largely based on agriculture and manufacturing. The city is home to several large manufacturing plants, including a plant owned by the Georgia-Pacific Corporation. The city is also home to several small businesses, including restaurants, retail stores, and professional services.
Demographics
As of the 2010 census, the population of Washington was 4,295. The racial makeup of the city was 73.3% White, 22.2% African American, 0.3% Native American, 0.7% Asian, 0.1% Pacific Islander, 1.7% from other races, and 1.9% from two or more races. Hispanic or Latino of any race were 3.3% of the population.
The median income for a household in the city was $30,938, and the median income for a family was $37,917. The per capita income for the city was $17,845. About 17.2% of families and 20.3% of the population were below the poverty line, including 28.2% of those under age 18 and 16.2% of those age 65 or over.
Conclusion
Washington, Georgia is a small city located in Wilkes County, Georgia, United States. It is the county seat of Wilkes County and is located approximately 70 miles east of Atlanta. The city has a population of 4,295 as of the 2010 census. Washington was founded in 1780 by James Edward Oglethorpe and was named after George Washington, the first president of the United States. The city’s economy is largely based on agriculture and manufacturing, and it is home to several large manufacturing plants. The racial makeup of the city is 73.3% White, 22.2% African American, 0.3% Native American, 0.7% Asian, 0.1% Pacific Islander, 1.7% from other races, and 1.9% from two or more races. The median income for a household in the city was $30,938, and the median income for a family was $37,917. About 17.2% of families and 20.3% of the population were below the poverty line.
Common Questions
What is the Total Population of Washington?
Total Population of Washington is 3,742.
What is the Total Male Population of Washington?
Total Male Population of Washington is 1,799.
What is the Total Female Population of Washington?
Total Female Population of Washington is 1,943.
What is the Ratio of Males per 100 Females in Washington?
There are 92.59 Males per 100 Females in Washington.
What is the Ratio of Females per 100 Males in Washington?
There are 108.00 Females per 100 Males in Washington.
What is the Median Population Age in Washington?
Median Population Age in Washington is 52.8 Years.
What is the Average Family Size in Washington
Average Family Size in Washington is 2.9 People.
What is the Average Household Size in Washington
Average Household Size in Washington is 2.1 People.
What is Per Capita Income in Washington?
Per Capita income in Washington is $35,604.
What is the Median Family Income in Washington?
Median Family Income in Washington is $61,900.
What is the Median Household income in Washington?
Median Household Income in Washington is $48,235.
What is Income or Wage Gap in Washington?
Income or Wage Gap in Washington is 28.5%.
Women in Washington earn 71.5 cents for every dollar earned by a man.
What is Inequality or Gini Index in Washington?
Inequality or Gini Index in Washington is 0.55.
How Large is the Labor Force in Washington?
There are 1,711 People in the Labor Forcein in Washington.
What is the Percentage of People in the Labor Force in Washington?
53.0% of People are in the Labor Force in Washington.
What is the Unemployment Rate in Washington?
Unemployment Rate in Washington is 2.2%.